
Market Update - DB Schenker
10
Market Update September 2021 Region MEA
-
Upload
khangminh22 -
Category
Documents
-
view
0 -
download
0
Transcript of Market Update - DB Schenker
Market Update
September 2021
Region MEA

Air Freight
Capacity
Rates
Carriers
Jet Fuel
Summary
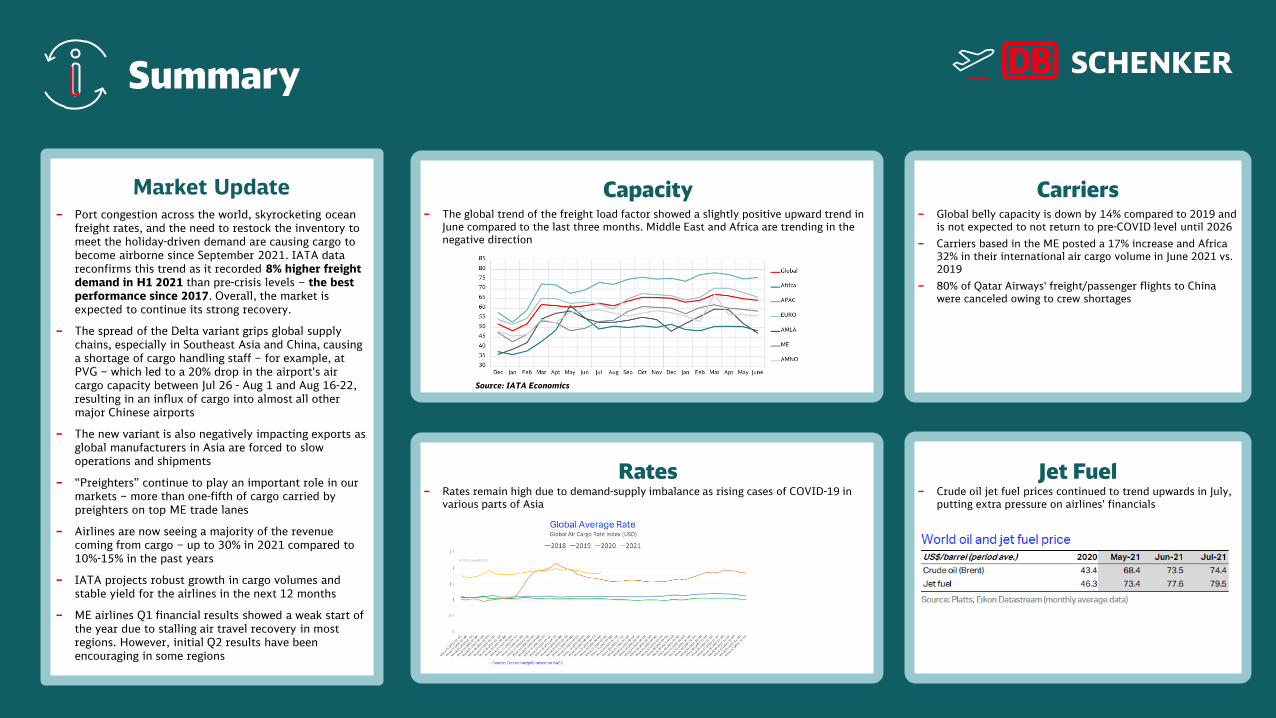
‒ Port congestion across the world, skyrocketing ocean freight rates, and the need to restock the inventory to meet the holiday-driven demand are causing cargo to become airborne since September 2021. IATA data reconfirms this trend as it recorded 8% higher freight demand in H1 2021 than pre-crisis levels – the best performance since 2017. Overall, the market is expected to continue its strong recovery.
‒ The spread of the Delta variant grips global supply chains, especially in Southeast Asia and China, causing a shortage of cargo handling staff – for example, at PVG – which led to a 20% drop in the airport's air cargo capacity between Jul 26 - Aug 1 and Aug 16-22, resulting in an influx of cargo into almost all other major Chinese airports
‒ The new variant is also negatively impacting exports as global manufacturers in Asia are forced to slow operations and shipments
‒ “Preighters” continue to play an important role in our markets – more than one-fifth of cargo carried by preighters on top ME trade lanes
‒ Airlines are now seeing a majority of the revenue coming from cargo – up to 30% in 2021 compared to 10%-15% in the past years
‒ IATA projects robust growth in cargo volumes and stable yield for the airlines in the next 12 months
‒ ME airlines Q1 financial results showed a weak start of the year due to stalling air travel recovery in most regions. However, initial Q2 results have been encouraging in some regions
‒ The global trend of the freight load factor showed a slightly positive upward trend in June compared to the last three months. Middle East and Africa are trending in the negative direction
‒ Global belly capacity is down by 14% compared to 2019 and is not expected to not return to pre-COVID level until 2026
‒ Carriers based in the ME posted a 17% increase and Africa 32% in their international air cargo volume in June 2021 vs. 2019
‒ 80% of Qatar Airways' freight/passenger flights to China were canceled owing to crew shortages
‒ Crude oil jet fuel prices continued to trend upwards in July, putting extra pressure on airlines' financials
‒ Rates remain high due to demand-supply imbalance as rising cases of COVID-19 in various parts of Asia
Source: IATA Economics
Market Update

Economic Outlook Cargo Volume Growth
Capacity Development
Market Developments
‒ The rising COVID cases in Asia pose a risk to further economic development
‒ As per IATA, some of our MEA countries recorded negative GDP growth in Q1 2021
‒ Business conditions sharply deteriorated in South Africa due to public protests
‒ In Saudi Arabia, economic growth remained robust, although the creation of jobs slowed growth as compared to June 2021
‒ In the UAE, the business environment improved on the back of recovering demand
‒ African carriers reported a volume growth of 32% and ME carriers posted an increase of 17% when compared to the same time last year boosted by strong performance on ME-Asia and ME-North America
‒ Industry-wide ACTKs were down by 10.8 % below June 2019 levels, this is a minor improvement from May (-11.2%)
‒ Cargo load factor (CLF) remained exceptionally high in June.
‒ Middle Eastern airlines should get 23% more deliveries in 2021 when compared to 2020
‒ African carriers are forecasted to receive 10% fewer aircrafts in 2021
Source: IATA Economics
Ex MEA
APAC Americas Europe MEA
Into MEA
Market Outlook
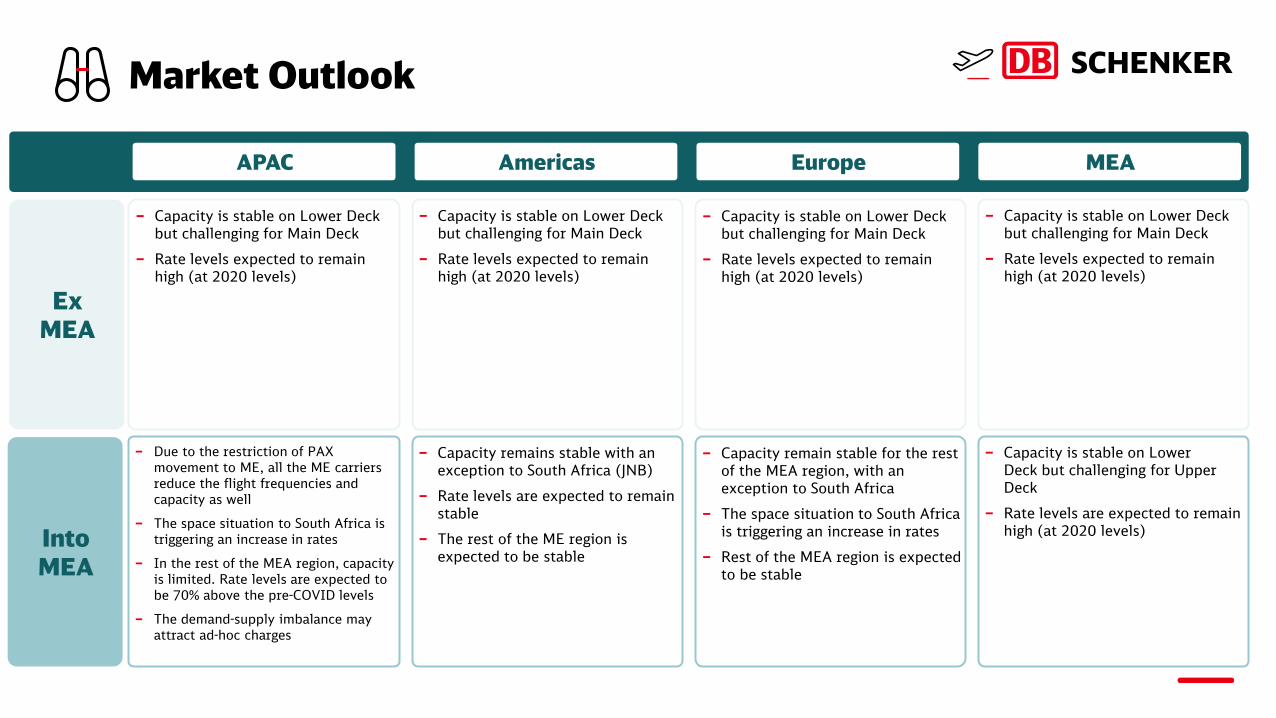
‒ Capacity is stable on Lower Deck but challenging for Main Deck
‒ Rate levels expected to remain high (at 2020 levels)
‒ Capacity is stable on Lower Deck but challenging for Main Deck
‒ Rate levels expected to remain high (at 2020 levels)
‒ Capacity is stable on Lower Deck but challenging for Main Deck
‒ Rate levels expected to remain high (at 2020 levels)
‒ Capacity is stable on Lower Deck but challenging for Main Deck
‒ Rate levels expected to remain high (at 2020 levels)
‒ Due to the restriction of PAX movement to ME, all the ME carriers reduce the flight frequencies and capacity as well
‒ The space situation to South Africa is triggering an increase in rates
‒ In the rest of the MEA region, capacity is limited. Rate levels are expected to be 70% above the pre-COVID levels
‒ The demand-supply imbalance may attract ad-hoc charges
‒ Capacity remains stable with an exception to South Africa (JNB)
‒ Rate levels are expected to remain stable
‒ The rest of the ME region is expected to be stable
‒ Capacity remain stable for the rest of the MEA region, with an exception to South Africa
‒ The space situation to South Africa is triggering an increase in rates
‒ Rest of the MEA region is expected to be stable
‒ Capacity is stable on Lower Deck but challenging for Upper Deck
‒ Rate levels are expected to remain high (at 2020 levels)

Ocean Freight

Summary
Global Market Forecast‒ Worldwide, economic expansion has slowed since May 2021. Further, despite the
decline in the JPMorgan Global Composite Output Index, which was at 55.7 in July 2021, it remains above its historical average of 53.4
‒ Inflation pressures remained intense, even as growth in global output, new orders, and employment moderated. For example, in the EU, as a result of family savings accumulated during the pandemic, retail sales are predicted to remain strong as consumers are likely to continue spending. After a 6.4% decline in 2020, real EU GDP is projected to grow 5.0% in 2021, 4.3% in 2022, and 2.1% in 2023
‒ In contrast, the US economy is expanding steadily, as measured by growth in real GDP of 6.5% Q-o-Q in Q2 2021. While consumer buying and production-related spending by businesses registered gains, declines were seen in investments related to real estate, federal, inventory investment, and net exports. According to the most recent forecast, the real US GDP in 2021 and 2022 will be 6.1% and 4.4%, respectively. Because of supply chain constraints and consumer spending caution as a result of COVID-19, the revisions show a lower growth path through 2021
‒ In Asia-Pacific, the manufacturing hubs are currently facing an increased number of COVID-19 infections. And with the Chinese government’s zero-tolerance policy, production cuts have significantly reduced economic activities, resulting in increased cost pressures and shortages of inputs example, in Southeast Asia. Consequently, due to semiconductor shortages, the global automotive industry suffered further production cuts in August and September 2021
‒ The spread of the Delta variant is causing the increase in infections, compounded, at least outside mainland China, by slower vaccination drives - negatively impacting shopper spending, the traveling and manufacturing industry, and exports
Rates‒ Rates continue to increase, with carriers resorting to applying various surcharges in
order to plan their ships better
‒ One such example is the weight-deviation surcharge of USD 1,250 on certain corridors for booked weight vs. loading weight deviation of +/- 3 tons
‒ Announcements of PSS/GRI continues
‒ Booking cancellation surcharges are becoming common mandatory on many tradelanes
MEA Market Highlights‒ For GCC exports, carriers are open to new volumes. However, in certain markets like KSA,
equipment shortage continues resulting in increased freight rates
‒ In South Africa, space is tight, thus driving rates to a relatively high level for long-term pricing. There is still disruption in ship schedules, causing further long-standing port omissions
‒ Carrier across West Africa are experiencing continuing space issues, resulting in increased rates. They are refraining from providing long-term rates due to market dynamics, even with mid-term pricing on the higher side. Pre-bookings need to be sent a minimum 4-6 weeks in advance of planned shipping
‒ East Africa is also experiencing space restriction and increasing long-term/short-term rates – in addition to high vessel utilization. Moreover, congestions and rolling pools in Middle East transshipment ports have forced partial booking suspensions for the next 4 weeks
‒ In the recent past, carriers have added capacity in Transpacific markets. As per Sea intel, “this added capacity in the Pacific comes with the “price” that capacity is pulled out of other trades around the world, causing shippers elsewhere to experience blank sailings and escalating freight rates”. This move from carriers has deprived capacity into tradelanes such as ME and Africa regions
Others‒ We report 2021 as one of a kind year where the logistics industry is seeing a 12-month peak season given the disruptions, seasonal hikes such as Black
Friday/Christmas, etc., which will constrain the shipper to face higher rates/shortage of equipment and space
‒ What we are witnessing is importers, and cargo owners are preponing their typical peak season orders to earlier slots in an attempt to flatten the demand curve, which is also one of the reasons for the rates to be on a steady increase
‒ Shanghai, Ningbo-Zhoushan, and Yantian are worst affected by congestion. Numerous vessels are waiting for berthing at the anchorage
‒ We also saw port closures in August 2021; for example, Ningbo was closed between 11 – 25 August 2021. Ho Chi Minh City has extended the COVID-19 lockdown with cargo piling up at the factories
‒ America’s Californian gateways of Los Angeles and Long Beach witnessed long queues of container ships waiting at the anchorage
‒ While in Europe, summer holidays coupled with truckers’ strikes overstrained some of the typical gateways creating supply chain havoc
‒ Ad-hoc port closures, temporary lockdowns, and crew-change issues continue disrupting supply chain across the world
Capacity‒ The continuous change in demand has resulted in
shipping lines operating at a 100% vessel utilization throughout 2021. Minor operational problems such as accidents or climatic disruptions causes massive knock-on effects in terms of transit delays
‒ Although over 75 new vessel orders were placed in the first seven months of this year, these new builds will only be expected to be ready in 2023 – giving no respite to the current capacity constraints
‒ Experiencing blank sailing and rate levels are increasing into MEA
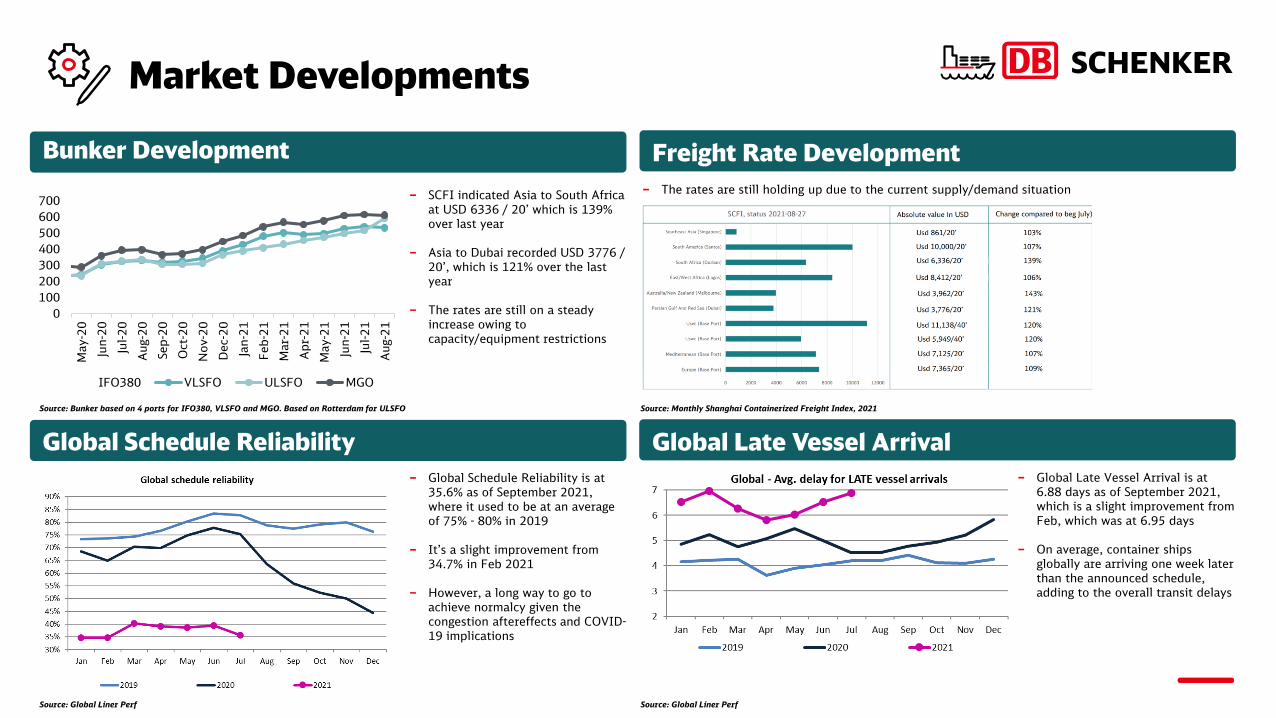
‒ SCFI indicated Asia to South Africa at USD 6336 / 20’ which is 139% over last year
‒ Asia to Dubai recorded USD 3776 / 20’, which is 121% over the last year
‒ The rates are still on a steady increase owing to capacity/equipment restrictions
Bunker Development Freight Rate Development
Global Schedule Reliability
Market Developments
‒ Global Schedule Reliability is at 35.6% as of September 2021, where it used to be at an average of 75% - 80% in 2019
‒ It’s a slight improvement from 34.7% in Feb 2021
‒ However, a long way to go to achieve normalcy given the congestion aftereffects and COVID-19 implications
Global Late Vessel Arrival
‒ Global Late Vessel Arrival is at 6.88 days as of September 2021, which is a slight improvement from Feb, which was at 6.95 days
‒ On average, container ships globally are arriving one week later than the announced schedule, adding to the overall transit delays
0
100
200
300
400
500
600
700
May-2
0
Jun-2
0
Jul-20
Aug-2
0
Sep-2
0
Oct
-20
Nov-2
0
Dec-
20
Jan-2
1
Feb
-21
Mar-
21
Apr-
21
May-2
1
Jun-2
1
Jul-21
Aug-2
1IFO380 VLSFO ULSFO MGO
Source: Bunker based on 4 ports for IFO380, VLSFO and MGO. Based on Rotterdam for ULSFO
‒ The rates are still holding up due to the current supply/demand situation
Source: Monthly Shanghai Containerized Freight Index, 2021
Source: Global Liner Perf Source: Global Liner Perf

Ex MEA
APAC Americas Europe MEA
Into MEA
Market Outlook
Space
‒ Open to most destinations
Rates
‒ Stable
Equipment
‒ Available
Space
‒ Chassis availability is the main issue
Rates
‒ Increased by USD 100 per TEU
Equipment
‒ Available on main ports, but shortage at hinterlands
‒ The congestion at Hinterland is affecting the turnaround time of truck, resulting in longer delays for ex-works shipments
Space
‒ Space remains a challenge due to blank sailings
‒ Carriers are not accepting bulk bookings
‒ Space protection guarantee surcharge in increased from USD 650 up to USD 4,000
‒ We highly recommend a minimum forecast of 2 – 4 weeks
Rates
‒ Carriers have announced multiple GRIs at a rate of USD 1,600 / per container for September 2021
Equipment
‒ Available
Space
‒ Intra-MEA space restricted in certain markets
Rates
‒ PSS/GRI is implemented by carriers to balance the equipment and space shortage in the region
Equipment
‒ Limited availability, forecasting is recommended
Space
‒ Blank sailings continue. Three weeks advance forecast is mandatory to secure space
‒ DB Schenker is happy to offer space guarantee from the Far East to GCC at a premium
Rates
‒ Rate increase of up to USD 250/TEU is expected in August
‒ Further rate increases are anticipated based on market demand
Equipment
‒ 40’HC are deficit, 20’ are surplus
‒ Carriers are interested in light cargo
Space
‒ Space crunch into the West Coast
‒ Certain carriers are accepting hinterland cargo at an additional premium of USD 350
‒ Space crunch is seen into LATAM – carriers have reduced the allocation to accommodate Asia to LATAM
Rates
‒ Rate levels are at the tune of USD 12,000 for immediate sailings
‒ Carriers have announced rate increases up to USD 1,000
‒ PSS is further increases from USD 950 to USD 1,200
‒ For LATAM, carriers have announced a PSS of USD 600
Equipment
‒ Limited availability, forecasting is recommended
Space
‒ Space is a massive constraint
Rates
‒ Given the space constraints and equipment shortage, rates are increasing on a month-on-month basis
‒ UK is experiencing a driver shortage which has resulted in a driver retention surcharge at a rate of GBP 75 per collection or delivery
Equipment
‒ Limited availability

Abbreviations
ACTK Available Cargo-tonne Kilometers
CTK Cargo-tonne Kilometers
ME Middle East
MEA Middle East And Africa
M-O-M Month-on-month
NOR Non Operating Reefers
PMI Purchasing Manager’s Index
PSS Peak Season Surcharge
RPK Revenue Passenger Per Kilometer
SCFI Shanghai Freight Index
USWC U.S. West Coast
VLSFO Very Low-Sulphur Fuel Oil
NAM North America
LATAM Latin America
HC High cube