Pck1 Gene Silencing in the Liver Improves Glycemia Control, Insulin Sensitivity, and Dyslipidemia in...
12
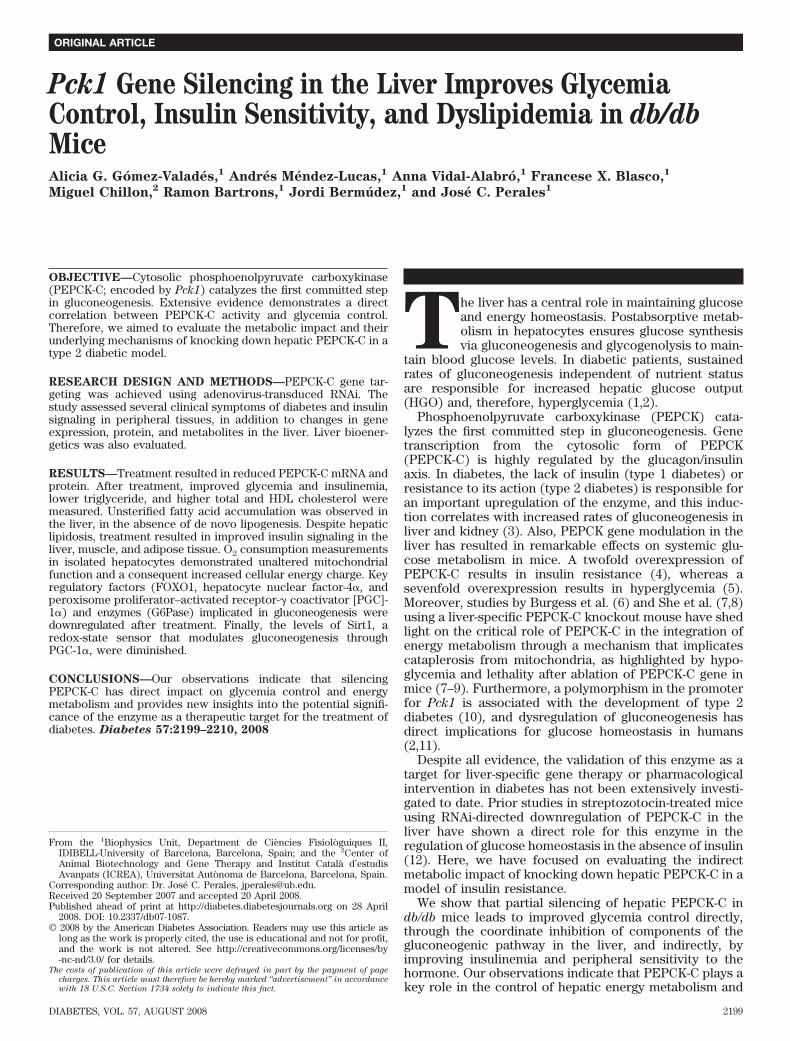
Pck1 Gene Silencing in the Liver Improves Glycemia Control, Insulin Sensitivity, and Dyslipidemia in db/db Mice Alicia G. Go ´ mez-Valade ´s, 1 Andre ´s Me ´ ndez-Lucas, 1 Anna Vidal-Alabro ´, 1 Francese X. Blasco, 1 Miguel Chillon, 2 Ramon Bartrons, 1 Jordi Bermu ´ dez, 1 and Jose ´ C. Perales 1 OBJECTIVE—Cytosolic phosphoenolpyruvate carboxykinase (PEPCK-C; encoded by Pck1) catalyzes the first committed step in gluconeogenesis. Extensive evidence demonstrates a direct correlation between PEPCK-C activity and glycemia control. Therefore, we aimed to evaluate the metabolic impact and their underlying mechanisms of knocking down hepatic PEPCK-C in a type 2 diabetic model. RESEARCH DESIGN AND METHODS—PEPCK-C gene tar- geting was achieved using adenovirus-transduced RNAi. The study assessed several clinical symptoms of diabetes and insulin signaling in peripheral tissues, in addition to changes in gene expression, protein, and metabolites in the liver. Liver bioener- getics was also evaluated. RESULTS—Treatment resulted in reduced PEPCK-C mRNA and protein. After treatment, improved glycemia and insulinemia, lower triglyceride, and higher total and HDL cholesterol were measured. Unsterified fatty acid accumulation was observed in the liver, in the absence of de novo lipogenesis. Despite hepatic lipidosis, treatment resulted in improved insulin signaling in the liver, muscle, and adipose tissue. O 2 consumption measurements in isolated hepatocytes demonstrated unaltered mitochondrial function and a consequent increased cellular energy charge. Key regulatory factors (FOXO1, hepatocyte nuclear factor-4, and peroxisome proliferator–activated receptor- coactivator [PGC]- 1) and enzymes (G6Pase) implicated in gluconeogenesis were downregulated after treatment. Finally, the levels of Sirt1, a redox-state sensor that modulates gluconeogenesis through PGC-1, were diminished. CONCLUSIONS—Our observations indicate that silencing PEPCK-C has direct impact on glycemia control and energy metabolism and provides new insights into the potential signifi- cance of the enzyme as a therapeutic target for the treatment of diabetes. Diabetes 57:2199–2210, 2008 T he liver has a central role in maintaining glucose and energy homeostasis. Postabsorptive metab- olism in hepatocytes ensures glucose synthesis via gluconeogenesis and glycogenolysis to main- tain blood glucose levels. In diabetic patients, sustained rates of gluconeogenesis independent of nutrient status are responsible for increased hepatic glucose output (HGO) and, therefore, hyperglycemia (1,2). Phosphoenolpyruvate carboxykinase (PEPCK) cata- lyzes the first committed step in gluconeogenesis. Gene transcription from the cytosolic form of PEPCK (PEPCK-C) is highly regulated by the glucagon/insulin axis. In diabetes, the lack of insulin (type 1 diabetes) or resistance to its action (type 2 diabetes) is responsible for an important upregulation of the enzyme, and this induc- tion correlates with increased rates of gluconeogenesis in liver and kidney (3). Also, PEPCK gene modulation in the liver has resulted in remarkable effects on systemic glu- cose metabolism in mice. A twofold overexpression of PEPCK-C results in insulin resistance (4), whereas a sevenfold overexpression results in hyperglycemia (5). Moreover, studies by Burgess et al. (6) and She et al. (7,8) using a liver-specific PEPCK-C knockout mouse have shed light on the critical role of PEPCK-C in the integration of energy metabolism through a mechanism that implicates cataplerosis from mitochondria, as highlighted by hypo- glycemia and lethality after ablation of PEPCK-C gene in mice (7–9). Furthermore, a polymorphism in the promoter for Pck1 is associated with the development of type 2 diabetes (10), and dysregulation of gluconeogenesis has direct implications for glucose homeostasis in humans (2,11). Despite all evidence, the validation of this enzyme as a target for liver-specific gene therapy or pharmacological intervention in diabetes has not been extensively investi- gated to date. Prior studies in streptozotocin-treated mice using RNAi-directed downregulation of PEPCK-C in the liver have shown a direct role for this enzyme in the regulation of glucose homeostasis in the absence of insulin (12). Here, we have focused on evaluating the indirect metabolic impact of knocking down hepatic PEPCK-C in a model of insulin resistance. We show that partial silencing of hepatic PEPCK-C in db/db mice leads to improved glycemia control directly, through the coordinate inhibition of components of the gluconeogenic pathway in the liver, and indirectly, by improving insulinemia and peripheral sensitivity to the hormone. Our observations indicate that PEPCK-C plays a key role in the control of hepatic energy metabolism and From the 1 Biophysics Unit, Department de Cie ` ncies Fisiolo ` guiques II, IDIBELL-University of Barcelona, Barcelona, Spain; and the 2 Center of Animal Biotechnology and Gene Therapy and Institut Catala ` d’estudis Avanpats (ICREA), Universitat Auto ` noma de Barcelona, Barcelona, Spain. Corresponding author: Dr. Jose ´ C. Perales, [email protected]. Received 20 September 2007 and accepted 20 April 2008. Published ahead of print at http://diabetes.diabetesjournals.org on 28 April 2008. DOI: 10.2337/db07-1087. © 2008 by the American Diabetes Association. Readers may use this article as long as the work is properly cited, the use is educational and not for profit, and the work is not altered. See http://creativecommons.org/licenses/by -nc-nd/3.0/ for details. The costs of publication of this article were defrayed in part by the payment of page charges. This article must therefore be hereby marked “advertisement” in accordance with 18 U.S.C. Section 1734 solely to indicate this fact. ORIGINAL ARTICLE DIABETES, VOL. 57, AUGUST 2008 2199
Transcript of Pck1 Gene Silencing in the Liver Improves Glycemia Control, Insulin Sensitivity, and Dyslipidemia in...
Pck1 Gene Silencing in the Liver Improves GlycemiaControl, Insulin Sensitivity, and Dyslipidemia in db/dbMiceAlicia G. Gomez-Valades,
1Andres Mendez-Lucas,
1Anna Vidal-Alabro,
1Francese X. Blasco,
1
Miguel Chillon,2
Ramon Bartrons,1
Jordi Bermudez,1
and Jose C. Perales1
OBJECTIVE—Cytosolic phosphoenolpyruvate carboxykinase(PEPCK-C; encoded by Pck1) catalyzes the first committed stepin gluconeogenesis. Extensive evidence demonstrates a directcorrelation between PEPCK-C activity and glycemia control.Therefore, we aimed to evaluate the metabolic impact and theirunderlying mechanisms of knocking down hepatic PEPCK-C in atype 2 diabetic model.
RESEARCH DESIGN AND METHODS—PEPCK-C gene tar-geting was achieved using adenovirus-transduced RNAi. Thestudy assessed several clinical symptoms of diabetes and insulinsignaling in peripheral tissues, in addition to changes in geneexpression, protein, and metabolites in the liver. Liver bioener-getics was also evaluated.
RESULTS—Treatment resulted in reduced PEPCK-C mRNA andprotein. After treatment, improved glycemia and insulinemia,lower triglyceride, and higher total and HDL cholesterol weremeasured. Unsterified fatty acid accumulation was observed inthe liver, in the absence of de novo lipogenesis. Despite hepaticlipidosis, treatment resulted in improved insulin signaling in theliver, muscle, and adipose tissue. O2 consumption measurementsin isolated hepatocytes demonstrated unaltered mitochondrialfunction and a consequent increased cellular energy charge. Keyregulatory factors (FOXO1, hepatocyte nuclear factor-4�, andperoxisome proliferator–activated receptor-� coactivator [PGC]-1�) and enzymes (G6Pase) implicated in gluconeogenesis weredownregulated after treatment. Finally, the levels of Sirt1, aredox-state sensor that modulates gluconeogenesis throughPGC-1�, were diminished.
CONCLUSIONS—Our observations indicate that silencingPEPCK-C has direct impact on glycemia control and energymetabolism and provides new insights into the potential signifi-cance of the enzyme as a therapeutic target for the treatment ofdiabetes. Diabetes 57:2199–2210, 2008
The liver has a central role in maintaining glucoseand energy homeostasis. Postabsorptive metab-olism in hepatocytes ensures glucose synthesisvia gluconeogenesis and glycogenolysis to main-
tain blood glucose levels. In diabetic patients, sustainedrates of gluconeogenesis independent of nutrient statusare responsible for increased hepatic glucose output(HGO) and, therefore, hyperglycemia (1,2).
Phosphoenolpyruvate carboxykinase (PEPCK) cata-lyzes the first committed step in gluconeogenesis. Genetranscription from the cytosolic form of PEPCK(PEPCK-C) is highly regulated by the glucagon/insulinaxis. In diabetes, the lack of insulin (type 1 diabetes) orresistance to its action (type 2 diabetes) is responsible foran important upregulation of the enzyme, and this induc-tion correlates with increased rates of gluconeogenesis inliver and kidney (3). Also, PEPCK gene modulation in theliver has resulted in remarkable effects on systemic glu-cose metabolism in mice. A twofold overexpression ofPEPCK-C results in insulin resistance (4), whereas asevenfold overexpression results in hyperglycemia (5).Moreover, studies by Burgess et al. (6) and She et al. (7,8)using a liver-specific PEPCK-C knockout mouse have shedlight on the critical role of PEPCK-C in the integration ofenergy metabolism through a mechanism that implicatescataplerosis from mitochondria, as highlighted by hypo-glycemia and lethality after ablation of PEPCK-C gene inmice (7–9). Furthermore, a polymorphism in the promoterfor Pck1 is associated with the development of type 2diabetes (10), and dysregulation of gluconeogenesis hasdirect implications for glucose homeostasis in humans(2,11).
Despite all evidence, the validation of this enzyme as atarget for liver-specific gene therapy or pharmacologicalintervention in diabetes has not been extensively investi-gated to date. Prior studies in streptozotocin-treated miceusing RNAi-directed downregulation of PEPCK-C in theliver have shown a direct role for this enzyme in theregulation of glucose homeostasis in the absence of insulin(12). Here, we have focused on evaluating the indirectmetabolic impact of knocking down hepatic PEPCK-C in amodel of insulin resistance.
We show that partial silencing of hepatic PEPCK-C indb/db mice leads to improved glycemia control directly,through the coordinate inhibition of components of thegluconeogenic pathway in the liver, and indirectly, byimproving insulinemia and peripheral sensitivity to thehormone. Our observations indicate that PEPCK-C plays akey role in the control of hepatic energy metabolism and
From the 1Biophysics Unit, Department de Ciencies Fisiologuiques II,IDIBELL-University of Barcelona, Barcelona, Spain; and the 2Center ofAnimal Biotechnology and Gene Therapy and Institut Catala d’estudisAvanpats (ICREA), Universitat Autonoma de Barcelona, Barcelona, Spain.
Corresponding author: Dr. Jose C. Perales, [email protected] 20 September 2007 and accepted 20 April 2008.Published ahead of print at http://diabetes.diabetesjournals.org on 28 April
2008. DOI: 10.2337/db07-1087.© 2008 by the American Diabetes Association. Readers may use this article as
long as the work is properly cited, the use is educational and not for profit,and the work is not altered. See http://creativecommons.org/licenses/by-nc-nd/3.0/ for details.
The costs of publication of this article were defrayed in part by the payment of page
charges. This article must therefore be hereby marked “advertisement” in accordance
with 18 U.S.C. Section 1734 solely to indicate this fact.
ORIGINAL ARTICLE
DIABETES, VOL. 57, AUGUST 2008 2199
provides a novel therapeutic approach for the treatment ofdiabetes.
RESEARCH DESIGN AND METHODS
Experimental animals and adenovirus. Male C57BKS.Cg-�Leprdb/�Leprdb
(db/db) mice were purchased from Harlan Interfarma, maintained in aconstant 12-h light/dark cycle, and fed a standard rodent chow and water adlibitum. At the beginning of the experiment, animals were 6–8 weeks old. Allanimal protocols were approved by the ethics committee at the University ofBarcelona.
Recombinant E1-E3 deficient adenovirus (serotype 5) encoding shRNAagainst PEPCK-C (Ad-shPck1) and Phothinus pyralis luciferase (Ad-shCT)(used as unspecific control sequence) were generated in the Viral Production
Unit of the Center of Animal Biotechnology and Gene Therapy (UPV-CBATEG) (Bellaterra, Spain).
Adenovirus was administered by tail vein injection of 6.67 � 1010 plaque-forming units (pfu)/kg in 200 �l physiological saline. Fed blood glucose andweight were measured at 8:00 A.M. Surgery was performed under isofluoraneanesthesia (Abbot). Tissues were snap-frozen in liquid nitrogen and stored at�80°C until analysis. Blood was collected by inferior cava puncture.Peripheral insulin sensitivity. Overnight fasted mice were anesthetized,and gastrocnemius muscle, epididymal fat, and liver samples were taken attime 0 and 5 min after a 10-IU/kg insulin bolus was injected via tail vein.Glucose and insulin tolerance tests. Glucose tolerance was assayed 7 daysafter treatment in 32-h-fasted mice after a 1-g/kg glucose bolus intraperitonealinjection. Insulin tolerance was determined in mice fed ad libitum, afterintraperitoneal injection of 2 IU/kg bovine insulin (Sigma) at day 8 after
A
DC
PEPCK
γ-tubulinKidney
Ad-shCT Ad-shPck1
PEPCK
γ-tubulinLiver
PEPCK
γ-tubulinWAT
PP PVB
0.00
0.25
0.50
0.75
1.00
1.25
1.50
1.75
p=0.05
Fed Fasting
p=0.06
pc
k-1
mR
NA
(re
lati
ve
un
its
)
Liver Kidney WAT0
20
40
60
80
100
120 **P
EP
CK
-C (
rela
tive
un
its)
Ad
-sh
Pck
1A
d-s
hC
T
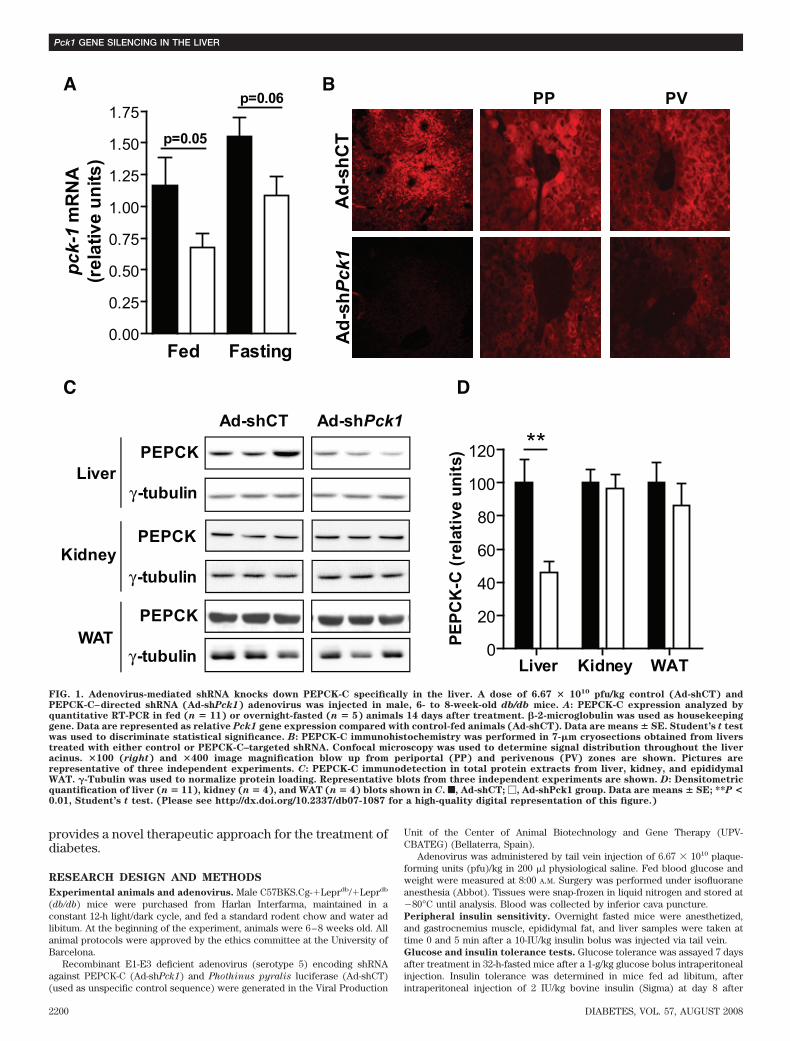
FIG. 1. Adenovirus-mediated shRNA knocks down PEPCK-C specifically in the liver. A dose of 6.67 � 1010 pfu/kg control (Ad-shCT) andPEPCK-C–directed shRNA (Ad-shPck1) adenovirus was injected in male, 6- to 8-week-old db/db mice. A: PEPCK-C expression analyzed byquantitative RT-PCR in fed (n � 11) or overnight-fasted (n � 5) animals 14 days after treatment. �-2-microglobulin was used as housekeepinggene. Data are represented as relative Pck1 gene expression compared with control-fed animals (Ad-shCT). Data are means � SE. Student’s t testwas used to discriminate statistical significance. B: PEPCK-C immunohistochemistry was performed in 7-�m cryosections obtained from liverstreated with either control or PEPCK-C–targeted shRNA. Confocal microscopy was used to determine signal distribution throughout the liveracinus. �100 (right) and �400 image magnification blow up from periportal (PP) and perivenous (PV) zones are shown. Pictures arerepresentative of three independent experiments. C: PEPCK-C immunodetection in total protein extracts from liver, kidney, and epididymalWAT. �-Tubulin was used to normalize protein loading. Representative blots from three independent experiments are shown. D: Densitometricquantification of liver (n � 11), kidney (n � 4), and WAT (n � 4) blots shown in C. f, Ad-shCT; �, Ad-shPck1 group. Data are means � SE; **P <0.01, Student’s t test. (Please see http://dx.doi.org/10.2337/db07-1087 for a high-quality digital representation of this figure.)
Pck1 GENE SILENCING IN THE LIVER
2200 DIABETES, VOL. 57, AUGUST 2008
treatment. Blood glucose was measured at the indicated time points afterchallenge.Glucose production from pyruvate. A 2 g/kg buffered pyruvate (Sigma)bolus was injected intraperitoneally in 32-h-fasted mice on day 7 afteradenoviral infection. Glucose levels were measured at indicated time points.RNA extraction and quantitative RT-PCR. Total RNA was extracted usingRNAeasy mini kit (Qiagen). cDNA synthesis from 2 �g RNA was performedusing Ready-To-Go You-Prime First Strand Beads (Amersham Biosciences)with random hexamers. mRNA levels of selected genes were quantified usinga Low Density Array (Applied Biosystems) in a HT7900 Real-Time RT-PCRsystem (Applied Biosystems). Gene expression was normalized with �-2-microglobulin as a housekeeping gene. Data analysis is based on the ��Ctmethod.Western blot. Tissue was homogenized in radioimmunoprecipitation assaybuffer supplemented with protease and phosphatase inhibitors and centri-fuged at 15,000g for 15 min at 4°C. Western blots were performed with 20–50�g tissue extract. Proteins were separated in 8–12% SDS-PAGE and trans-ferred to an Immobilon membrane (Millipore). Nuclear extracts were ob-tained as described previously (13).
Sheep anti–PEPCK-C antiserum (a gift from Dr. Granner, VanderbiltUniversity, Nashville, TN) was used at a 1:20,000 dilution; antibodies againstacetyl-CoA carboxylase (ACC) and ACC-P (Ser79) (Upstate) were used at1:2,000; and antibodies against AMP-dependent kinase (AMPK), AMPK-P(Thr172), AKT, AKT-P (Thr308), AKT-P (Ser473) (Cell Signaling), Sirt1 (Upstate),and sterol regulatory element–binding protein 1c (SREBP-1c; Santa CruzBiotechnology) were used at 1:1,000. Voltage-dependent anion channel(VDAC) antibody (provided by Dr. Pujol, IDIBELL) was diluted 1:1,000. Fattyacid synthase (FAS) and protein kinase C ε (PKCε) antibodies (Santa CruzBiotechnology) were used at 1:500 dilution. FOXO1 (Santa Cruz Biotechnol-ogy), FOXO1-P (Ser256) (Cell Signaling), and peroxisome proliferator–acti-vated receptor-� coactivator (PGC)-1 (Cell Signaling) were used at 1:250. Allmembranes were normalized using monoclonal anti–�-tubulin (Sigma) at1:10,000. Horseradish peroxidase activity linked to secondary antibody wasdetected with ECL substrate (Pierce) in a Fujifilm LAS 3000 Intelligent DarkBox IV imaging system. Densitometry was performed using Multi Gaugesoftware.
PKCε activity was estimated as the ratio of membrane to cytosol PKCεsignal. To separate membrane and cytosolic fractions, liver homogenates werecentrifuged at 800g for 10 min, and supernatants were further centrifuged at100,000g for 45 min. Enrichment was assessed after blotting the membraneswith antibodies (1:1,000) against cytosolic (pyruvate kinase [L-PK]; gift fromDr. Bartrons, University of Barcelona) and membrane-associated (epithelialgrowth factor receptor [EGFR], gift from Dr. Rosa, University of Barcelona)proteins.Histology and immunofluorescence. A portion of the third hepatic lobulewas fixed for at least 24 h in 4% paraformaldehyde, equilibrated in 30%saccharose, embedded in Tissue-Tek OCT compound (Sakura), and stored at�80°C until 7-�m-thick cryosections were obtained. Oil-red lipid staining andPEPCK-C immunostaining were previously described (12).Blood and liver biochemical analysis. Blood glucose was measured using aGlucocard Memory 2 apparatus (Menarini) by tail clipping. Serum metaboliteswere measured in the Veterinarian Clinical Biochemistry Service, VeterinaryHospital, Universitat Autonoma de Barcelona (Barcelona, Spain). Seruminsulin was determined using Ultrasensitive Mouse Insulin ELISA (Mercodia).HDL cholesterol was quantified using a Reflotron system (Roche Diagnostics).
Hepatic glycogen was measured essentially as previously described (9).Hepatic triglycerides and fatty acid content were quantified using a TAG kit(Sigma) and NEFA kit (Wako), respectively, in 3 mol/l KOH, 65% ethanolextracts, based on the method of Salmon and Flatt for liver saponification.Hepatic short chain acyl-CoAs (acetyl-CoA, malonyl-CoA, propionyl-CoA, andsuccinyl-CoA) were analyzed by high-performance liquid chromatography(HPLC) as described previously (14) in the Research Support Services fromthe University of Barcelona. Nucleotides (ATP/ADP/AMP) were determined inneutralized 10% perchloric acid extracts by HPLC.High-resolution respirometry. O2 consumption was measured using ahigh-resolution Oxygraph respirometer (Oroboros, Innsbrook, Austria) inisolated hepatocytes. Briefly, liver was preperfused with calcium-free Hanks’balanced salt solution (HBSS) buffer (Sigma) at 37°C before perfusion withCa2�-containing HBSS and 3.5 mg/ml Liberase Blendzyme (Roche). Hepato-cytes were cleared by repeated centrifugation at 50g for 5 min, and viability
A
0 2 4 6 8 10 12 14
-250
-200
-150
-100
-50
0
50
**** # #
Time (days)
Glu
cose
ch
ang
e (m
g/d
l)
0 25 50 75 100
0
100
200
300
400
500
600
Time (min)
Glu
cose
(m
g/d
l)
B
C
†‡*
**#####
###
CT
AdU6-Ff
AdU6-66
40
100
200
300
400
500
**
Glu
cose
(m
g/d
l)
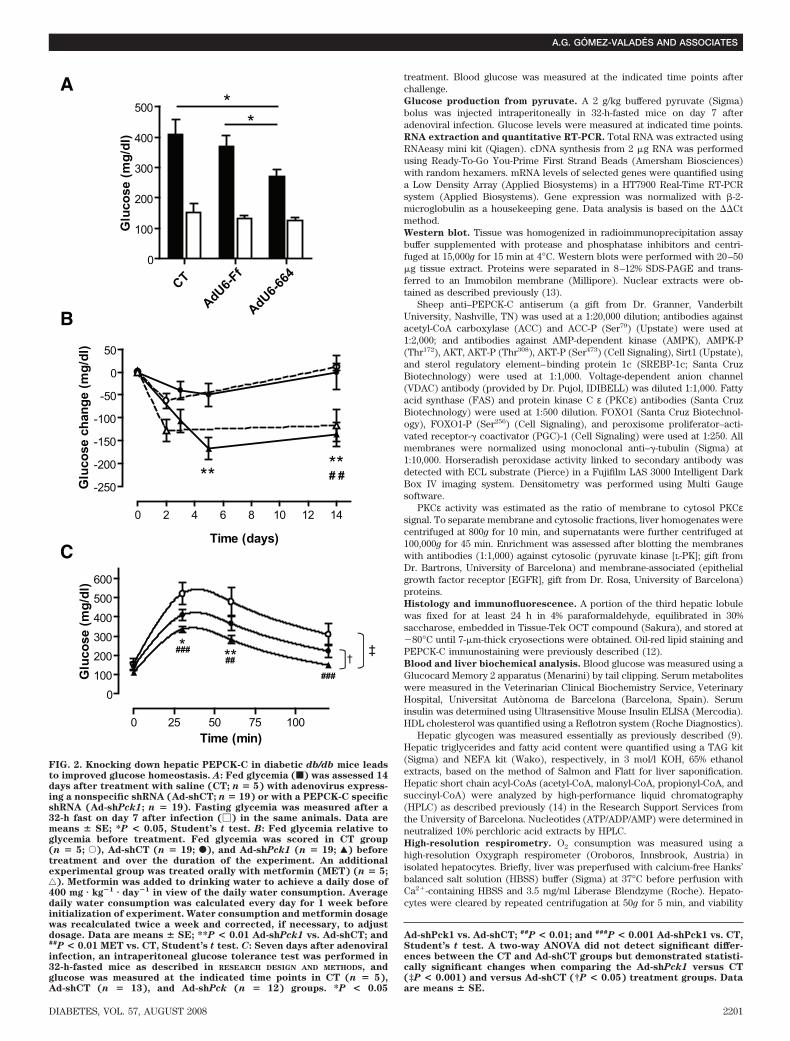
FIG. 2. Knocking down hepatic PEPCK-C in diabetic db/db mice leadsto improved glucose homeostasis. A: Fed glycemia (f) was assessed 14days after treatment with saline (CT; n � 5) with adenovirus express-ing a nonspecific shRNA (Ad-shCT; n � 19) or with a PEPCK-C specificshRNA (Ad-shPck1; n � 19). Fasting glycemia was measured after a32-h fast on day 7 after infection (�) in the same animals. Data aremeans � SE; *P < 0.05, Student’s t test. B: Fed glycemia relative toglycemia before treatment. Fed glycemia was scored in CT group(n � 5; E), Ad-shCT (n � 19; F), and Ad-shPck1 (n � 19; Œ) beforetreatment and over the duration of the experiment. An additionalexperimental group was treated orally with metformin (MET) (n � 5;‚). Metformin was added to drinking water to achieve a daily dose of400 mg � kg�1 � day�1 in view of the daily water consumption. Averagedaily water consumption was calculated every day for 1 week beforeinitialization of experiment. Water consumption and metformin dosagewas recalculated twice a week and corrected, if necessary, to adjustdosage. Data are means � SE; **P < 0.01 Ad-shPck1 vs. Ad-shCT; and##P < 0.01 MET vs. CT, Student’s t test. C: Seven days after adenoviralinfection, an intraperitoneal glucose tolerance test was performed in32-h-fasted mice as described in RESEARCH DESIGN AND METHODS, andglucose was measured at the indicated time points in CT (n � 5),Ad-shCT (n � 13), and Ad-shPck (n � 12) groups. *P < 0.05
Ad-shPck1 vs. Ad-shCT; ##P < 0.01; and ###P < 0.001 Ad-shPck1 vs. CT,Student’s t test. A two-way ANOVA did not detect significant differ-ences between the CT and Ad-shCT groups but demonstrated statisti-cally significant changes when comparing the Ad-shPck1 versus CT(‡P < 0.001) and versus Ad-shCT (†P < 0.05) treatment groups. Dataare means � SE.
A.G. GOMEZ-VALADES AND ASSOCIATES
DIABETES, VOL. 57, AUGUST 2008 2201
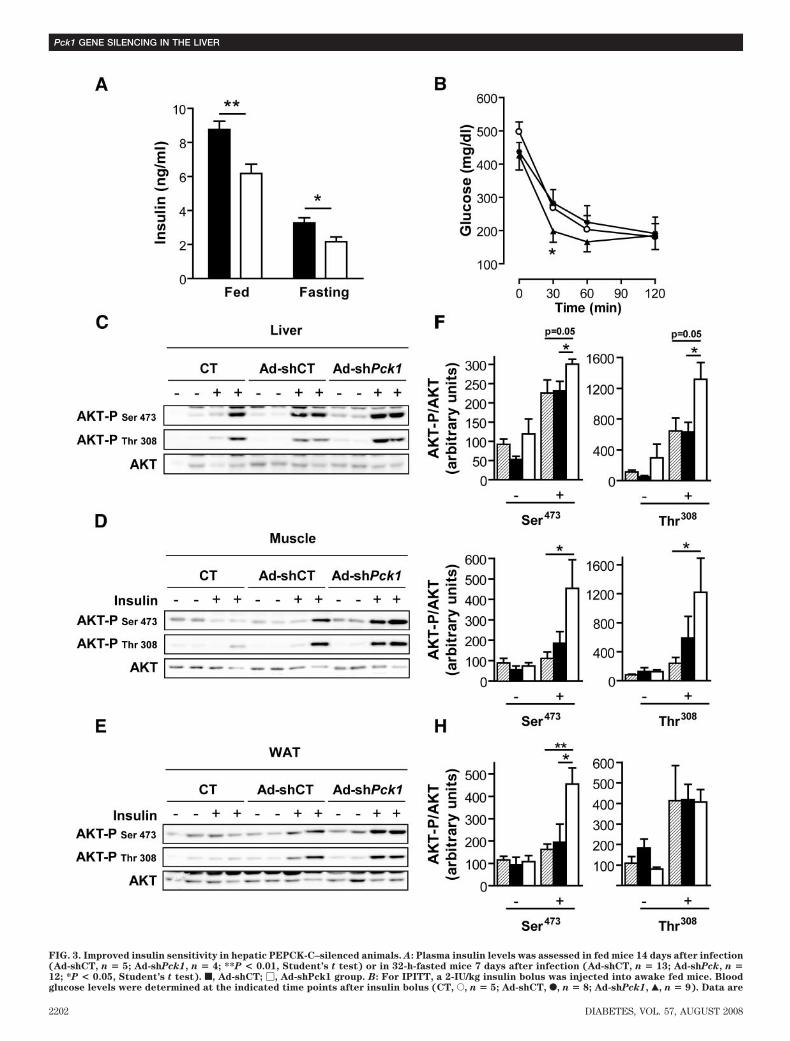
FIG. 3. Improved insulin sensitivity in hepatic PEPCK-C–silenced animals. A: Plasma insulin levels was assessed in fed mice 14 days after infection(Ad-shCT, n � 5; Ad-shPck1, n � 4; **P < 0.01, Student’s t test) or in 32-h-fasted mice 7 days after infection (Ad-shCT, n � 13; Ad-shPck, n �12; *P < 0.05, Student’s t test). f, Ad-shCT; �, Ad-shPck1 group. B: For IPITT, a 2-IU/kg insulin bolus was injected into awake fed mice. Bloodglucose levels were determined at the indicated time points after insulin bolus (CT, E, n � 5; Ad-shCT, F, n � 8; Ad-shPck1, Œ, n � 9). Data are
Pck1 GENE SILENCING IN THE LIVER
2202 DIABETES, VOL. 57, AUGUST 2008
(80%) was assessed by trypan blue exclusion. The respiration mediumconsisted of F-12 Coon’s modification supplemented with 20 mmol/l HEPES,20 mmol/l lactate, 2 mmol/l pyruvate, 2 mmol/l glutamine, and 1 mmol/loctanoate conjugated with 0.5% BSA. Medium was equilibrated with air at37°C and stirred at 750 rpm until a stable signal was obtained for calibrationat air saturation. At least 106 hepatocytes per milliliter were used formeasurements. The titration protocol, which was completed within 50–60min, was recorded at 2-s intervals using a computer-driven data acquisitionsystem (Datlab; Oroboros).Statistical analysis. Results are expressed as the means SE. Statisticalanalysis was always performed by one-way or two-way ANOVA and two-tailedStudent’s t test. A P � 0.05 was considered significant.
RESULTS
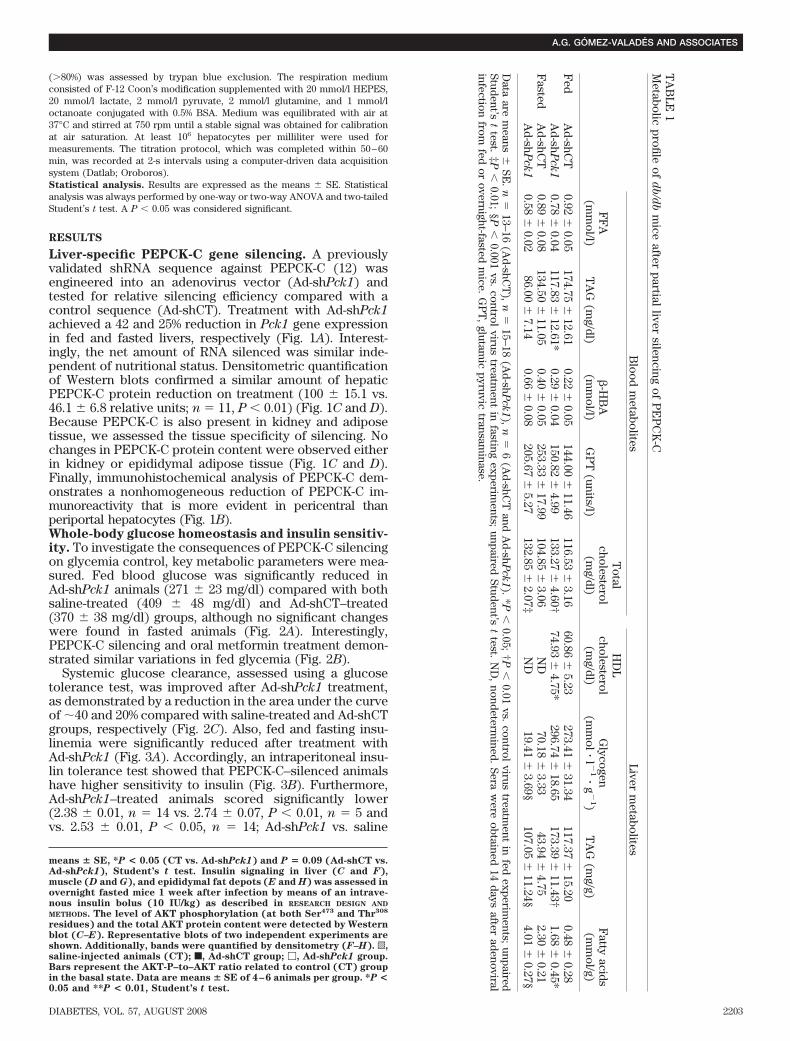
Liver-specific PEPCK-C gene silencing. A previouslyvalidated shRNA sequence against PEPCK-C (12) wasengineered into an adenovirus vector (Ad-shPck1) andtested for relative silencing efficiency compared with acontrol sequence (Ad-shCT). Treatment with Ad-shPck1achieved a 42 and 25% reduction in Pck1 gene expressionin fed and fasted livers, respectively (Fig. 1A). Interest-ingly, the net amount of RNA silenced was similar inde-pendent of nutritional status. Densitometric quantificationof Western blots confirmed a similar amount of hepaticPEPCK-C protein reduction on treatment (100 15.1 vs.46.1 6.8 relative units; n � 11, P � 0.01) (Fig. 1C and D).Because PEPCK-C is also present in kidney and adiposetissue, we assessed the tissue specificity of silencing. Nochanges in PEPCK-C protein content were observed eitherin kidney or epididymal adipose tissue (Fig. 1C and D).Finally, immunohistochemical analysis of PEPCK-C dem-onstrates a nonhomogeneous reduction of PEPCK-C im-munoreactivity that is more evident in pericentral thanperiportal hepatocytes (Fig. 1B).Whole-body glucose homeostasis and insulin sensitiv-ity. To investigate the consequences of PEPCK-C silencingon glycemia control, key metabolic parameters were mea-sured. Fed blood glucose was significantly reduced inAd-shPck1 animals (271 23 mg/dl) compared with bothsaline-treated (409 48 mg/dl) and Ad-shCT–treated(370 38 mg/dl) groups, although no significant changeswere found in fasted animals (Fig. 2A). Interestingly,PEPCK-C silencing and oral metformin treatment demon-strated similar variations in fed glycemia (Fig. 2B).
Systemic glucose clearance, assessed using a glucosetolerance test, was improved after Ad-shPck1 treatment,as demonstrated by a reduction in the area under the curveof 40 and 20% compared with saline-treated and Ad-shCTgroups, respectively (Fig. 2C). Also, fed and fasting insu-linemia were significantly reduced after treatment withAd-shPck1 (Fig. 3A). Accordingly, an intraperitoneal insu-lin tolerance test showed that PEPCK-C–silenced animalshave higher sensitivity to insulin (Fig. 3B). Furthermore,Ad-shPck1–treated animals scored significantly lower(2.38 0.01, n � 14 vs. 2.74 0.07, P � 0.01, n � 5 andvs. 2.53 0.01, P � 0.05, n � 14; Ad-shPck1 vs. saline
TA
BLE
1M
etabolicprofile
ofd
b/d
bm
iceafter
partialliver
silencingof
PE
PC
K-C
Blood
metabolites
Liverm
etabolites
FF
A(m
mol/l)
TA
G(m
g/dl)�
-HB
A(m
mol/l)
GP
T(units/l)
Total
cholesterol(m
g/dl)
HD
Lcholesterol
(mg/dl)
Glycogen
(mm
ol�l �
1�g
�1)
TA
G(m
g/g)F
attyacids
(mm
ol/g)
Fed
Ad-shC
T0.92
0.05
174.75
12.610.22
0.05
144.00
11.46116.53
3.16
60.86
5.23273.41
31.34
117.37
15.200.48
0.28
Ad-sh
Pck1
0.78
0.04117.83
12.61*
0.29
0.04150.82
4.99
133.27
4.60†74.93
4.75*
296.74
18.65173.39
11.43†
1.68
0.45*F
astedA
d-shCT
0.89
0.08134.50
11.05
0.40
0.05253.33
17.99
104.85
3.06N
D70.18
3.33
43.94
4.752.30
0.21
Ad-sh
Pck1
0.58
0.0286.00
7.14
0.66
0.08205.67
5.27
132.85
2.07‡N
D19.41
3.69§
107.05
11.24§4.01
0.27§
Data
arem
eans
SE.
n�
13–16(A
d-shCT
),n
�15–18
(Ad-sh
Pck1),
n�
6(A
d-shCT
andA
d-shP
ck1).
*P
�0.05;
†P
�0.01
vs.control
virustreatm
entin
fedexperim
ents;unpaired
Student’st
test.‡P
�0.01;
§P
�0.001
vs.control
virustreatm
entin
fastingexperim
ents;unpaired
Student’st
test.N
D,
nondetermined.
Seraw
ereobtained
14days
afteradenoviral
infectionfrom
fedor
overnight-fastedm
ice.G
PT
,glutam
icpyruvic
transaminase.
means � SE, *P < 0.05 (CT vs. Ad-shPck1) and P � 0.09 (Ad-shCT vs.Ad-shPck1), Student’s t test. Insulin signaling in liver (C and F),muscle (D and G), and epididymal fat depots (E and H) was assessed inovernight fasted mice 1 week after infection by means of an intrave-nous insulin bolus (10 IU/kg) as described in RESEARCH DESIGN AND
METHODS. The level of AKT phosphorylation (at both Ser473 and Thr308
residues) and the total AKT protein content were detected by Westernblot (C–E). Representative blots of two independent experiments areshown. Additionally, bands were quantified by densitometry (F–H). o,saline-injected animals (CT); f, Ad-shCT group; �, Ad-shPck1 group.Bars represent the AKT-P–to–AKT ratio related to control (CT) groupin the basal state. Data are means � SE of 4–6 animals per group. *P <0.05 and **P < 0.01, Student’s t test.
A.G. GOMEZ-VALADES AND ASSOCIATES
DIABETES, VOL. 57, AUGUST 2008 2203
treated and vs. Ad-shCT, respectively) when their degreeof insulin resistance was assessed from the QUICKI index(15).
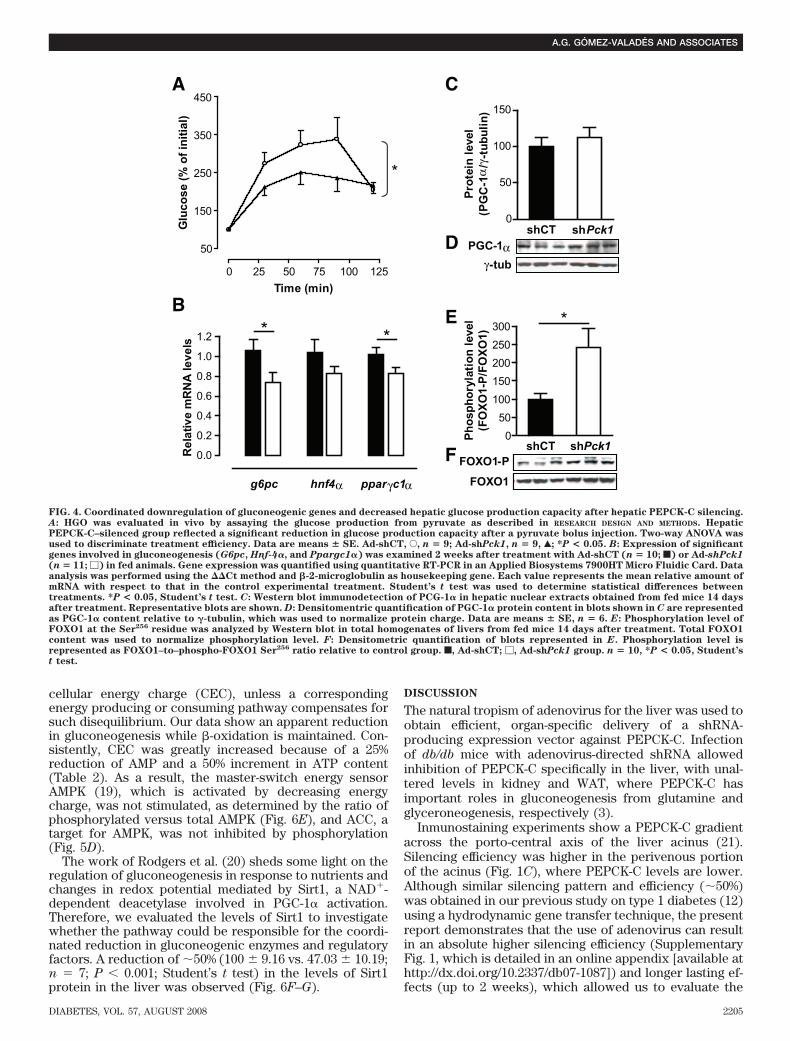
Next, we directly evaluated insulin signaling in vivomeasuring insulin-stimulated AKT phosphorylation inliver, muscle, and epididymal adipose tissue (white adi-pose tissue [WAT]). AKT phosphorylation at Ser473 andThr308 was enhanced in Ad-shPck1–treated animals afterinsulin treatment, in marked contrast to reduced signalingby insulin in saline-treated and Ad-shCT–treated groups(Fig. 3C–H). These data demonstrate improved peripheralinsulin sensitivity after partial hepatic PEPCK-C knock-down in the db/db mouse model.Gluconeogenesis and HGO. HGO, determined by theflux from pyruvate to glucose in vivo, was reduced inAd-shPck1–treated animals (Fig. 4A). Moreover, liver gly-cogen was significantly reduced in Ad-shPck1–treatedanimals on fasting (Table 1), consistent with decreasedhepatic glucose production capacity
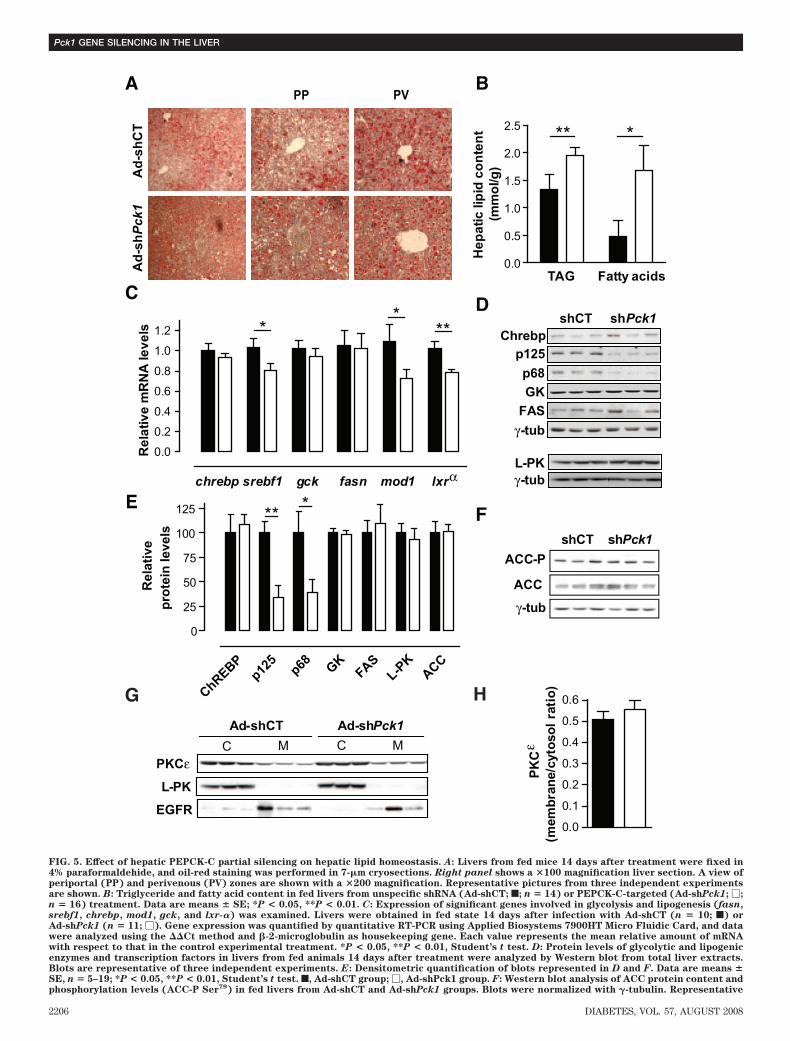
Glucose-6-phosphatase catalyzes the last step in thegluconeogenic and glycogenolysis pathways, and is, there-fore, responsible for regulating HGO. The mRNA of thisenzyme (encoded by G6pc) was significantly reduced atlevels comparable with those observed for PEPCK-C (en-coded by Pck1). Glucose-6-phosphatase and PEPCK-C areregulated by transcription factors like hepatocyte nuclearfactor-4� (HNF-4�) (encoded by Hnf4�) and FOXO1,which are co-activated by PGC-1� (encoded by Ppargc1�).PGC-1� mRNA was slightly reduced in PEPCK-C–silencedanimals (Fig. 4B), although PGC-1� protein in nuclearextracts was constant (Fig. 4C and D). HNF-4� is down-regulated, albeit nonsignificantly, in treated animals. Inaddition, FOXO1 phosphorylation at Ser256 increased inliver of Ad-shPck1–treated animals (Fig. 4E and F). Thesedata suggest that insulin signaling through AKT-dependentFOXO1 phosphorylation contributes to the observed re-duction in steady-state mRNA levels for gluconeogenicgenes such as G6pc and Pck1.Lipid homeostasis. To investigate the effects of liver-specific PEPCK-C knockdown on lipid metabolism, sev-eral blood and liver parameters were analyzed. Serumtriglycerides were pronouncedly reduced both in fed andfasted animals after PEPCK-C silencing in the liver, ac-companied by decreased serum free fatty acids (FFAs)and increased �-hydroxybutyrate. Furthermore, a net in-crease in total serum cholesterol with a concomitantincrease in HDL cholesterol was found (Table 1).
Lipid accumulation in the liver is a characteristic of thediabetes phenotype in db/db mice. Oil-red staining demon-strated both micro- and macrovesicular lipid droplets inAd-shCT–treated livers, which are more profuse in Ad-shPck1 group, especially in periportal compared withperivenous hepatocytes (Fig. 5A). Consistently, we ob-served a moderate increase in hepatic triacylglycerol(TAG) and a 3.5-fold increase in liver fatty acid contentafter PEPCK-C silencing (Fig. 5B). Meanwhile, the level ofFAS mRNA was unaltered, whereas SREBP1-c and liver Xreceptor-� decreased 25% (Fig. 5C). Correspondingly,the precursor (p125) and active form (p68) of SREBP1-cwere reduced, whereas FAS protein content was un-changed (Fig. 5D and E). Moreover, mRNA and proteinlevels from glycolytic and lipogenic enzymes, such asglucokinase (Gck), L-PK, or malic enzyme (Mod1), wereunaltered or significantly reduced (Fig. 5C–E). ChREBP,which plays an important role in regulating glycolytic(L-PK) and lipogenic (ACC and FAS) genes, was unaltered
(Fig. 5C–E), which supports the absence of de novolipogenesis in livers of Ad-shPck1–treated mice.
Malonyl-CoA is an important contributor to the oppos-ing regulation of fatty acid �-oxidation and fatty acidsynthesis through its dual function as allosteric inhibitorof CPT-1 and FAS substrate (16). Although a significantincrease of malonyl-CoA content in liver was found (Table2), ACC, the enzyme responsible for its synthesis, was notstimulated because the ratio of ACC-P to ACC was un-changed in the liver of PEPCK-C–silenced mice (Fig. 5F).These data further support the view that PEPCK-C silenc-ing in the liver of db/db mice does not induce net de novolipogenesis.
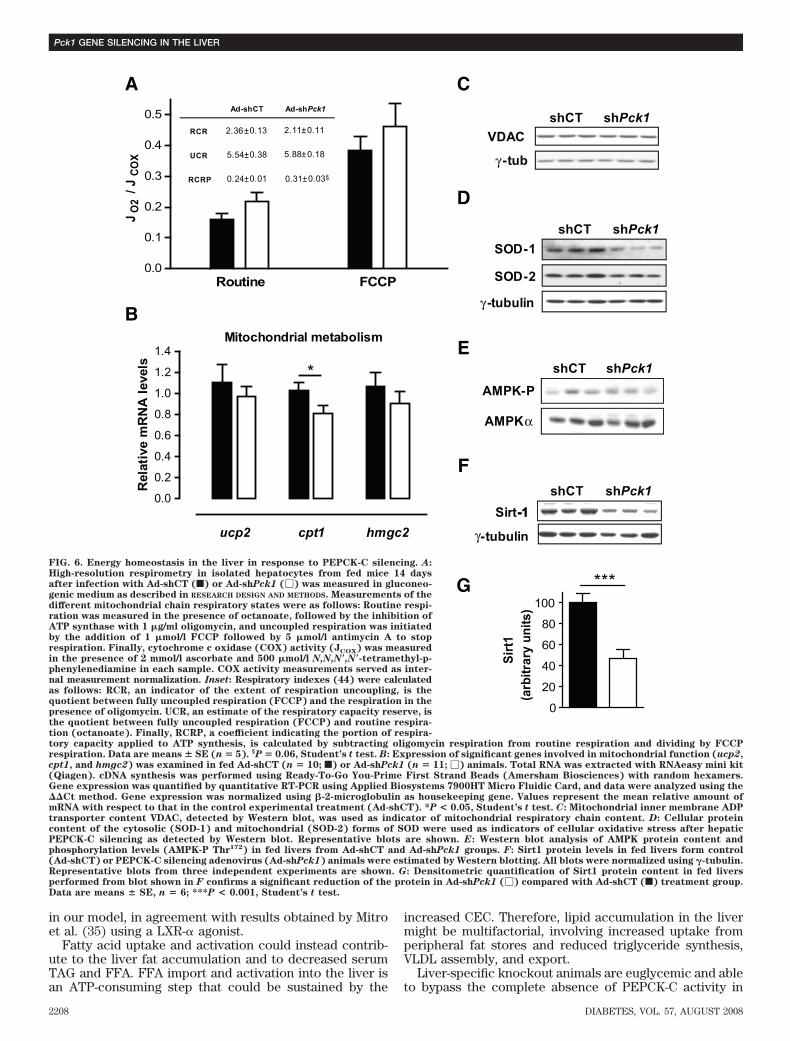
Interestingly, despite liver lipidosis (Fig. 5A and B),hepatic and peripheral insulin signaling was improved inPEPCK-C–silenced animals (Fig. 3). PKCε plays a criticalrole in mediating fat-induced hepatic insulin resistance(17). No activation of PKCε was observed after partialPEPCK-C knockdown in db/db livers (Fig. 5G and H),suggesting that lipid accumulation is dissociated frominsulin resistance induction in our model.Modulation of energy metabolism. Because impairmentof the tricarboxylic acid (TCA) cycle and mitochondrialfunction are hallmarks of liver-specific PEPCK-C knockoutmice (6,8,9), we evaluated several parameters of mito-chondrial function, including �-oxidation. The rate-limit-ing step in �-oxidation is the transport of acyl-CoA into themitochondria catalyzed by the CPT-1 shuttle, whosemRNA content was slightly reduced (Fig. 6B). Consis-tently, the mRNA for PGC-1�, a key player in the regula-tion of both �-oxidation and gluconeogenic pathways, waslowered after treatment (Fig. 4B). In contrast, a slightincrease in serum ketones in both fed and fasted animals(Table 1), together with unchanged levels of HMG-CoAsynthase mRNA (Fig. 6B) and a significant increase inpropionyl-CoA, an odd chain �-oxidation intermediate(Table 2), suggests that �-oxidation was not markedlyaffected.
The mitochondrial respiration rate, determined in freshlyisolated hepatocytes in the presence of octanoate, wasunaffected by treatment with Ad-shPck1. Moreover, themaximum mitochondrial respiration capacity (uncouplercarbonyl cyanide p-trifluoromethoxyphenyl-hydrazone[FCCP]) (Fig. 6A) and the content of the inner mitochon-drial membrane ADP transporter VDAC (Fig. 6C), a markerof the amount of respiratory chains and hence mitochon-drial content, were unchanged, suggesting that partialPEPCK-C knockdown does not impair the TCA cycle anddoes not negatively affect mitochondrial biogenesis orlimit mitochondrial oxidative capacity in excess of medi-um-chain fatty acid substrate. Consistently, no accumula-tion of TCA intermediates, like acetyl-CoA and succinyl-CoA, was observed (Table 2). Additionally, the expressionprofile of cytosolic (decreased) and mitochondrial (unal-tered) superoxide dismutases (SODs) is compatible withincreased peroxisomal oxidation activity (18) (Fig. 6D).The ratios estimated from respirometry data (respiratorycontrol ratio [RCR], uncoupling control ratio [UCR], andphosphorylation RCR [RCRP]) were unaltered after Ad-shPck1 treatment (Fig. 6A). In agreement with UCR index,the level of expression from the gene encoding the uncou-pling protein two (Ucp2) was unchanged, suggesting thatmitochondrial respiration was not uncoupled (Fig. 6B).
It is widely accepted that gluconeogenesis is dependenton fatty acid oxidation as an energy source. An imbalancebetween these two pathways would, theoretically, alter
Pck1 GENE SILENCING IN THE LIVER
2204 DIABETES, VOL. 57, AUGUST 2008
cellular energy charge (CEC), unless a correspondingenergy producing or consuming pathway compensates forsuch disequilibrium. Our data show an apparent reductionin gluconeogenesis while �-oxidation is maintained. Con-sistently, CEC was greatly increased because of a 25%reduction of AMP and a 50% increment in ATP content(Table 2). As a result, the master-switch energy sensorAMPK (19), which is activated by decreasing energycharge, was not stimulated, as determined by the ratio ofphosphorylated versus total AMPK (Fig. 6E), and ACC, atarget for AMPK, was not inhibited by phosphorylation(Fig. 5D).
The work of Rodgers et al. (20) sheds some light on theregulation of gluconeogenesis in response to nutrients andchanges in redox potential mediated by Sirt1, a NAD�-dependent deacetylase involved in PGC-1� activation.Therefore, we evaluated the levels of Sirt1 to investigatewhether the pathway could be responsible for the coordi-nated reduction in gluconeogenic enzymes and regulatoryfactors. A reduction of 50% (100 9.16 vs. 47.03 10.19;n � 7; P � 0.001; Student’s t test) in the levels of Sirt1protein in the liver was observed (Fig. 6F–G).
DISCUSSION
The natural tropism of adenovirus for the liver was used toobtain efficient, organ-specific delivery of a shRNA-producing expression vector against PEPCK-C. Infectionof db/db mice with adenovirus-directed shRNA allowedinhibition of PEPCK-C specifically in the liver, with unal-tered levels in kidney and WAT, where PEPCK-C hasimportant roles in gluconeogenesis from glutamine andglyceroneogenesis, respectively (3).
Inmunostaining experiments show a PEPCK-C gradientacross the porto-central axis of the liver acinus (21).Silencing efficiency was higher in the perivenous portionof the acinus (Fig. 1C), where PEPCK-C levels are lower.Although similar silencing pattern and efficiency ( 50%)was obtained in our previous study on type 1 diabetes (12)using a hydrodynamic gene transfer technique, the presentreport demonstrates that the use of adenovirus can resultin an absolute higher silencing efficiency (SupplementaryFig. 1, which is detailed in an online appendix [available athttp://dx.doi.org/10.2337/db07-1087]) and longer lasting ef-fects (up to 2 weeks), which allowed us to evaluate the
A
B
C
D
E
F
0 25 50 75 100 125
50
150
250
350
450
Time (min)
Glu
co
se (
% o
f in
itia
l)
g6pc hnf4α pparγc1α
0.0
0.2
0.4
0.6
0.8
1.0
1.2 * *
Re
lati
ve
mR
NA
lev
els
*
0
50
100
150
Pro
tein
lev
el(P
GC
-1α
/γ-t
ub
uli
n)
shCT shPck1PGC-1
γ-tub
0
50
100
150
200
250
300 *
Ph
osp
ho
ryla
tio
n l
evel
(FO
XO
1-P
/FO
XO
1)FOXO1
FOXO1-PshCT shPck1
α
FIG. 4. Coordinated downregulation of gluconeogenic genes and decreased hepatic glucose production capacity after hepatic PEPCK-C silencing.A: HGO was evaluated in vivo by assaying the glucose production from pyruvate as described in RESEARCH DESIGN AND METHODS. HepaticPEPCK-C–silenced group reflected a significant reduction in glucose production capacity after a pyruvate bolus injection. Two-way ANOVA wasused to discriminate treatment efficiency. Data are means � SE. Ad-shCT, E, n � 9; Ad-shPck1, n � 9, Œ; *P < 0.05. B: Expression of significantgenes involved in gluconeogenesis (G6pc, Hnf-4�, and Ppargc1�) was examined 2 weeks after treatment with Ad-shCT (n � 10; f) or Ad-shPck1
(n � 11; �) in fed animals. Gene expression was quantified using quantitative RT-PCR in an Applied Biosystems 7900HT Micro Fluidic Card. Dataanalysis was performed using the Ct method and �-2-microglobulin as housekeeping gene. Each value represents the mean relative amount ofmRNA with respect to that in the control experimental treatment. Student’s t test was used to determine statistical differences betweentreatments. *P < 0.05, Student’s t test. C: Western blot immunodetection of PCG-1� in hepatic nuclear extracts obtained from fed mice 14 daysafter treatment. Representative blots are shown. D: Densitomentric quantification of PGC-1� protein content in blots shown in C are representedas PGC-1� content relative to �-tubulin, which was used to normalize protein charge. Data are means � SE, n � 6. E: Phosphorylation level ofFOXO1 at the Ser256 residue was analyzed by Western blot in total homogenates of livers from fed mice 14 days after treatment. Total FOXO1content was used to normalize phosphorylation level. F: Densitometric quantification of blots represented in E. Phosphorylation level isrepresented as FOXO1–to–phospho-FOXO1 Ser256 ratio relative to control group. f, Ad-shCT; �, Ad-shPck1 group. n � 10, *P < 0.05, Student’st test.
A.G. GOMEZ-VALADES AND ASSOCIATES
DIABETES, VOL. 57, AUGUST 2008 2205
A
ACC-P
ACC
shCT shPck1
γ-tub
B
D
PP PV
C
E
0.0
0.1
0.2
0.3
0.4
0.5
0.6
PK
Cε
(mem
bra
ne/
cyto
sol
rati
o)
F
Ad-shCT Ad-shPck1
PKCMC MC
L-PK
EGFR
FAS
Chrebpp125
p68
γ-tub
shCT shPck1
GK
γ-tubL-PK
**
chrebp srebf1 gck fasn mod1 lxrα
0.0
0.2
0.4
0.6
0.8
1.0
1.2 **
Re
lati
ve
mR
NA
lev
els
ChREBPp12
5p68 GK
FASL-P
KACC
0
25
50
75
100
125 ***
Rel
ativ
ep
rote
in le
vels
TAG Fatty acids0.0
0.5
1.0
1.5
2.0
2.5 ***
He
pa
tic
lip
id c
on
ten
t(m
mo
l/g)
Ad
-sh
Pck
1A
d-s
hC
T
ε
G H
FIG. 5. Effect of hepatic PEPCK-C partial silencing on hepatic lipid homeostasis. A: Livers from fed mice 14 days after treatment were fixed in4% paraformaldehide, and oil-red staining was performed in 7-�m cryosections. Right panel shows a �100 magnification liver section. A view ofperiportal (PP) and perivenous (PV) zones are shown with a �200 magnification. Representative pictures from three independent experimentsare shown. B: Triglyceride and fatty acid content in fed livers from unspecific shRNA (Ad-shCT; f; n � 14) or PEPCK-C-targeted (Ad-shPck1; �;n � 16) treatment. Data are means � SE; *P < 0.05, **P < 0.01. C: Expression of significant genes involved in glycolysis and lipogenesis (fasn,srebf1, chrebp, mod1, gck, and lxr-�) was examined. Livers were obtained in fed state 14 days after infection with Ad-shCT (n � 10; f) orAd-shPck1 (n � 11; �). Gene expression was quantified by quantitative RT-PCR using Applied Biosystems 7900HT Micro Fluidic Card, and datawere analyzed using the Ct method and �-2-microglobulin as housekeeping gene. Each value represents the mean relative amount of mRNAwith respect to that in the control experimental treatment. *P < 0.05, **P < 0.01, Student’s t test. D: Protein levels of glycolytic and lipogenicenzymes and transcription factors in livers from fed animals 14 days after treatment were analyzed by Western blot from total liver extracts.Blots are representative of three independent experiments. E: Densitometric quantification of blots represented in D and F. Data are means �SE, n � 5–19; *P < 0.05, **P < 0.01, Student’s t test. f, Ad-shCT group; �, Ad-shPck1 group. F: Western blot analysis of ACC protein content andphosphorylation levels (ACC-P Ser79) in fed livers from Ad-shCT and Ad-shPck1 groups. Blots were normalized with �-tubulin. Representative
Pck1 GENE SILENCING IN THE LIVER
2206 DIABETES, VOL. 57, AUGUST 2008
metabolic impact and underlying mechanisms of knockingdown hepatic PEPCK-C in a type 2 diabetes model.
Mice with reduced PEPCK-C liver content showed aclear improvement in glucose tolerance and fed glycemia,comparable with the results of oral metformin treatment.However, fasting glucose was unchanged, even thoughHGO from pyruvate was clearly reduced. CompensatoryHGO from glycogenolysis, as supported by reduced he-patic glycogen content in fasting and even in fed animalswhen silencing reached 90% (Supplementary Fig. 1), couldbe responsible for unchanged fasting glycemia. Accord-ingly, fasting glycemia was significantly reduced in treatedanimals when PEPCK-C was 90% silenced (SupplementaryFig. 1).
Improved glucose tolerance and insulinemia suggestincreased peripheral insulin sensitivity. Lower insulin lev-els could be secondary to reduced glycemia; however,phloridzin treatment, which inhibits intestinal glucoseuptake and renal reabsorption, has been shown to reduceglycemia with no effects on insulin sensitivity in a type 2diabetes mouse model (22). Moreover, an amelioratedintraperitoneal insulin tolerance test (IPITT) and higherinsulin-stimulated AKT phosphorylation in muscle andadipose tissue strongly support the hypothesis of aninsulin-sensitizing effect. In adipose tissue, AKT phosphor-ylation at Thr 308 was unchanged by either treatment.However, it has been shown that insulin-stimulated glu-cose uptake is independent of signaling through Thr308 andclosely matches Ser473 AKT-P levels (23). The QUICKIindex was also suggestive of an overall reduction in insulinresistance. In addition, hepatic PEPCK-C silencing im-proves clinical symptoms of type 2 diabetes, such aspolydipsia, polyuria, and glycosuria, as revealed by meta-bolic cage studies (data not shown). Cross talking be-tween liver and brain through the vagal nerve (24) couldbe responsible for a coordinated metabolic regulation inperipheral tissues in response to hepatic energy metabo-lism modulation, affecting systemic insulin sensitivity (25).
Interestingly, despite hepatic lipid accumulation, AKTphosphorylation was also evident in the liver of PEPCK-C–silenced mice. Hepatic lipidosis is commonly associatedwith the induction of insulin resistance through incom-pletely understood mechanisms. Recent reports have dem-onstrated that lipid-induced hepatic insulin resistance isnot mediated by fatty acid or TAG accumulation per se(26,27). Instead, diacylglycerol induces insulin resistancevia activation of PKCε translocation to the vicinity ofinsulin receptor substrate-2 (17). In agreement with AKTphosphorylation data, we have observed that PKCε is not
modulated by PEPCK-C silencing, reinforcing the currentview that lipid accumulation is not necessarily linked toinsulin resistance in the liver.
Dislipidemia is associated with obesity and insulin re-sistance in type 2 diabetes (28). PEPCK-C silencing re-sulted in reduced plasma TAG, together with an importantelevation of hepatic lipids, mainly nonsterified fatty acids.An important but not sufficiently appreciated role forPEPCK-C in the liver is glyceroneogenesis: the provisionof glycerol-3-phosphate to sustain fatty acid re-esterifica-tion for triglyceride synthesis (29,30). Therefore, PEPCK-Csilencing could induce a significant reduction in fatty acidre-esterification activity. How to reconcile a concomitantincrease in liver TAG and a reduction of TAG in plasma isnot apparent. However, elevated fatty acids in the livercould be originated from excess import, reduced oxida-tion, and/or increased de novo synthesis. Results pre-sented above support that PEPCK-C–silenced liversmaintain mitochondrial function. Long- and medium-chainfatty acid oxidation are highly regulated through PEPCK-Cimport into the mitochondria at the level of CPT-1. Re-duced CPT-1 mRNA levels in PEPCK-C–silenced animals,together with increased malonyl-CoA content, a potentallosteric inhibitor of CPT-1, provide indirect evidence fora slight inhibition of fatty acid oxidation. However, thisallosteric inhibition can be overridden by fatty acid abun-dance (31,32). Moreover, it is clear from our data that noblockade at the level of mitochondria is responsible for theaccumulation of fatty acids because O2 consumption in thepresence of octanoate, which is imported into mitochon-dria independently of CPT-1, is unaffected in PEPCK-C–silenced hepatocytes. Also, increased plasma ketones andcellular propionyl-CoA is suggestive of maintained mito-chondrial and increased peroxisomal oxidation. Actually,after a low-dose ciprofibrate-mediated peroxisome prolif-eration, SOD expression is modulated with a similarpattern to that observed in our model (18).
The contribution of de novo lipogenesis to the accumu-lation of TAG and fatty acids seen in livers of Ad-shPck1treated mice can also be discarded. Key regulatory factorsinvolved in lipogenesis were either maintained (ChREBP)or reduced (SREBP1c and LXR-�). Lipogenic enzymesregulated by these factors (ACC and FAS) were unaltered,suggesting a main contribution of ChREBP in gene expres-sion regulation of these targets. Whether liver glucokinase(GK) might be a target gene for SREBP1c-mediated induc-tion has remained controversial (33,34). Our data revealedno alteration on GK mRNA or protein levels, suggestingthat the LXR-�/SREBP1c axis is not directly regulating GK
TABLE 2Nucleotide and short-chain acyl-CoA content in fed db/db livers
AMP(�mol/g)
ADP(�mol/g)
ATP(�mol/g) CEC
Acetyl-CoA(nmol/g)
Propionyl-CoA (nmol/g)
Succinyl-CoA(nmol/g)
Malonyl-CoA(nmol/g)
Ad-shCT 1.05 0.06 1.24 0.08 1.02 0.08 0.47 0.01 140.13 1.95 48.12 0.84 31.44 3.12 2.079 0.239Ad-shPck1 0.77 0.11* 1.16 0.07 1.47 0.17† 0.54 0.02† 130.29 2.47 56.68 1.25† 31.31 2.10 4.472 0.932*
Data are means SE. n � 8. *P � 0.05; †P � 0.01 vs. control virus treatment; unpaired Student’s t test. Tissue was obtained 14 days aftertreatment. CEC � (ATP � 1/2 AMP)/(ATP � ADP � AMP).
blots from three independent experiments are shown. G: Liver cytosolic and membrane fraction were isolated as described in RESEARCH DESIGN AND
METHODS. Membrane and cytosol fractions (50 �g) were loaded in a 10% SDS-PAGE. PKC protein content in each fraction was detected byWestern blot. Cellular fraction enrichment was assessed with immunodetection of membrane (EGFR) and cytosolic (L-PK) proteins. Represen-tative blots are shown. H: Densitometric quantification of blots shown in G demonstrates unaltered membrane translocation from cytosol ofPKC after PEPCK-C silencing. Data are means � SE, n � 6. f, Ad-shCT; �, Ad-shPck1 group. (Please see http://dx.doi.org/10.2337/db07-1087 fora high-quality digital representation of this figure.)
A.G. GOMEZ-VALADES AND ASSOCIATES
DIABETES, VOL. 57, AUGUST 2008 2207
in our model, in agreement with results obtained by Mitroet al. (35) using a LXR-� agonist.
Fatty acid uptake and activation could instead contrib-ute to the liver fat accumulation and to decreased serumTAG and FFA. FFA import and activation into the liver isan ATP-consuming step that could be sustained by the
increased CEC. Therefore, lipid accumulation in the livermight be multifactorial, involving increased uptake fromperipheral fat stores and reduced triglyceride synthesis,VLDL assembly, and export.
Liver-specific knockout animals are euglycemic and ableto bypass the complete absence of PEPCK-C activity in
Routine FCCP0.0
0.1
0.2
0.3
0.4
0.5J
O2
/ JC
OX
CA
D
Ad-shCT Ad-shPck1
RCR 2.36 0.13 2.11 0.11
UCR 5.54 0.38 5.88 0.18
RCRP 0.24 0.01 0.31 0.03
B
E
F
γ-tubulin
Sirt-1
shCT shPck1
-1-
AMPK-P
AMPK α
shCT shPck1
VDAC
γ -tub
shCT shPck1
SOD-1
SOD-2
γ -tubulin
shCT shPck1
0
20
40
60
80
100
***
Sir
t1(a
rbit
rary
un
its)
G
Mitochondrial metabolism
ucp2 cpt1 hmgc2
0.0
0.2
0.4
0.6
0.8
1.0
1.2
1.4
*
Rel
ativ
e m
RN
A l
evel
s
FIG. 6. Energy homeostasis in the liver in response to PEPCK-C silencing. A:High-resolution respirometry in isolated hepatocytes from fed mice 14 daysafter infection with Ad-shCT (f) or Ad-shPck1 (�) was measured in gluconeo-genic medium as described in RESEARCH DESIGN AND METHODS. Measurements of thedifferent mitochondrial chain respiratory states were as follows: Routine respi-ration was measured in the presence of octanoate, followed by the inhibition ofATP synthase with 1 �g/ml oligomycin, and uncoupled respiration was initiatedby the addition of 1 �mol/l FCCP followed by 5 �mol/l antimycin A to stoprespiration. Finally, cytochrome c oxidase (COX) activity (JCOX) was measuredin the presence of 2 mmol/l ascorbate and 500 �mol/l N,N,N�,N�-tetramethyl-p-phenylenediamine in each sample. COX activity measurements served as inter-nal measurement normalization. Inset: Respiratory indexes (44) were calculatedas follows: RCR, an indicator of the extent of respiration uncoupling, is thequotient between fully uncoupled respiration (FCCP) and the respiration in thepresence of oligomycin. UCR, an estimate of the respiratory capacity reserve, isthe quotient between fully uncoupled respiration (FCCP) and routine respira-tion (octanoate). Finally, RCRP, a coefficient indicating the portion of respira-tory capacity applied to ATP synthesis, is calculated by subtracting oligomycin respiration from routine respiration and dividing by FCCPrespiration. Data are means � SE (n � 5). §P � 0.06, Student’s t test. B: Expression of significant genes involved in mitochondrial function (ucp2,cpt1, and hmgc2) was examined in fed Ad-shCT (n � 10; f) or Ad-shPck1 (n � 11; �) animals. Total RNA was extracted with RNAeasy mini kit(Qiagen). cDNA synthesis was performed using Ready-To-Go You-Prime First Strand Beads (Amersham Biosciences) with random hexamers.Gene expression was quantified by quantitative RT-PCR using Applied Biosystems 7900HT Micro Fluidic Card, and data were analyzed using theCt method. Gene expression was normalized using �-2-microglobulin as housekeeping gene. Values represent the mean relative amount ofmRNA with respect to that in the control experimental treatment (Ad-shCT). *P < 0.05, Student’s t test. C: Mitochondrial inner membrane ADPtransporter content VDAC, detected by Western blot, was used as indicator of mitochondrial respiratory chain content. D: Cellular proteincontent of the cytosolic (SOD-1) and mitochondrial (SOD-2) forms of SOD were used as indicators of cellular oxidative stress after hepaticPEPCK-C silencing as detected by Western blot. Representative blots are shown. E: Western blot analysis of AMPK protein content andphosphorylation levels (AMPK-P Thr172) in fed livers from Ad-shCT and Ad-shPck1 groups. F: Sirt1 protein levels in fed livers form control(Ad-shCT) or PEPCK-C silencing adenovirus (Ad-shPck1) animals were estimated by Western blotting. All blots were normalized using �-tubulin.Representative blots from three independent experiments are shown. G: Densitometric quantification of Sirt1 protein content in fed liversperformed from blot shown in F confirms a significant reduction of the protein in Ad-shPck1 (�) compared with Ad-shCT (f) treatment group.Data are means � SE, n � 6; ***P < 0.001, Student’s t test.
Pck1 GENE SILENCING IN THE LIVER
2208 DIABETES, VOL. 57, AUGUST 2008
their livers with extrahepatic gluconeogenesis (8). Burgesset al. (36) have presented data demonstrating a weak fluxcontrol coefficient for gluconeogenesis in partial PEPCK-Cknockout mice, suggesting that other factors like TCAcycle flux could contribute to gluconeogenic flux indepen-dent of PEPCK protein content. Because PEPCK-C is notonly required for gluconeogenesis and glyceroneogenesisbut also for cataplerosis (i.e., the removal of citric acidcycle anions), the failure of this process would result in animpairment in the TCA cycle and mitochondrial functionin the liver, leading to decreased �-oxidation and oxygenconsumption, together with a complete derangement inenergy metabolism (6,8,9,36). Data presented in this manu-script, together with our previous study in streptozotocin-induced diabetic animals (12), demonstrate that a 50%reduction of PEPCK expression results in reduced HGOand glycemia. In addition, mitochondrial respiration andCPT-1–independent �-oxidation of fatty acids is not af-fected, suggesting that TCA cycle flux was sustained aslong as intermediates (acetyl-CoA and succinyl-CoA) werenot accumulated and ketones were overproduced. Thediscrepancy among the various studies might be related toone of three factors. First, knockout mice have a completeablation of the PEPCK-C gene in the liver, in contrast tothe partial reduction in the enzyme described in this study.In fact, 90% reduction in PEPCK-C protein levels in theliver, obtained with higher adenoviral dosage (Supplemen-tary Fig. 1), reproduce the blockade on mitochondrialfunction observed in the knockout mice (36). Second,adaptation to a lack of PEPCK-C in knockout animals as aconsequence of deletion of the gene very early duringdevelopment (37) may induce a compensatory increase ingluconeogenesis in tissues other than the liver. In thisregard, a recent study points to a disparity between resultsobtained from a liver Ppar-� knockout mouse and ashort-term knockdown model using chemically modifiedsiRNA against Ppar-� (38). Third, studies on liver-specificknockout mice were directed toward understanding thephysiological role of PEPCK-C in the liver. To our knowl-edge, liver PEPCK-C knockout animals have not beenpreviously studied in relevant models of diabetes, such asthe one presented in this study.
The coordinated regulation of several key players inenergy homeostasis in the livers of Ad-shPck1–treatedanimals is an intriguing observation. We have identifiedSirt1 as a probable mediator in the response of the cell toa partial reduction in PEPCK-C content. A nutrient signal-ing response mediated by pyruvate induces Sirt1 protein inliver during fasting, where it interacts with and deacety-lates PGC-1� in an NAD�-dependent manner, increasingPGC-1� ability to coactivate HNF-4� and, therefore, up-regulate gluconeogenic genes, but not mitochondrialgenes (20). In addition, Sirt1-mediated deacetylation ofFOXO1 has been shown to promote its transcriptionalactivity over gluconeogenic genes (39,40), suggesting anintegrated regulation by insulin and Sirt1 over gluconeo-genesis in treated animals. Moreover, Sirt1 transcription isinhibited by a NADH-mediated mechanism (41). In thiscontext, Sirt1 seems to function as a nutrient sensor bydecoding fluctuations in cellular NADH levels. Therefore,our observation of a substantial reduction of Sirt1 identi-fies this nutrient sensor as a potential mediator of thecoordinated downregulation of gluconeogenesis. Recentdata from Sun et al. (42) have shown that oral administra-tion of resveratrol, an activator of Sirt1, improves glucosehomeostasis and insulin sensitivity mainly though its ac-
tion on muscle. However, the potential for Sirt1 as atherapeutic target for diabetes in the liver is curtailed byits role in gluconeogenesis, as recently suggested byreduced HGO and improved glucose homeostasis andinsulin sensitivity in db/db mice after hepatic Sirt1 silenc-ing (43).
All in all, we present evidence to sustain that partialsilencing of liver PEPCK-C in db/db mice leads to im-proved control of glycemia, insulinemia, and peripheralsensitivity to the hormone through its coordinate inhibi-tion of key players responsible for the activation of livergluconeogenesis, in the absence of a blockade at the levelof mitochondria. In addition, we show that this modelrepresents a departure from the view, recently challenged,that steatosis leads to insulin resistance. Finally, ourobservations join the growing body of evidence thatindicates that PEPCK-C plays a key role in the control ofhepatic energy metabolism in type 2 diabetes animals,validating liver PEPCK-C as a target for pharmaceuticalintervention. Nonetheless, in view of the known discrep-ancy between the large contribution of gluconeogenesis tohepatic glucose production in small rodent models ascompared to large animals (i.e., canine, human) the suit-ability of the approach should be further tested in a largeranimal model.
ACKNOWLEDGMENTS
A.G.G.V. has received a fellowship from IDIBELL. A.V.A.has received a fellowship from DURSI (Generalitat deCatalunya). A.M. has received a fellowship from F.P.I.(Ministerio de Educacion y Ciencia). This study wassupported by a grant from the Ministerio de Educacion yCiencia (BFU2006-02802).
We thank the Research Support Services from theBiology Unit of Bellvitge (University of Barcelona) fortheir technical assistance, Dr. Anna Serafin for her skillfulassistance with histopathology, and Dr. Maria Molas forher invaluable assistance reviewing the manuscript.
REFERENCES
1. DeFronzo RA, Ferrannini E: Insulin resistance: a multifaceted syndromeresponsible for NIDDM, obesity, hypertension, dyslipidemia, and athero-sclerotic cardiovascular disease. Diabetes Care 14:173–194, 1991
2. Consoli A, Nurjhan N, Capani F, Gerich J: Predominant role of gluconeo-genesis in increased hepatic glucose production in NIDDM. Diabetes
38:550–557, 19893. Hanson RW, Reshef L: Regulation of phosphoenolpyruvate carboxykinase
(GTP) gene expression. Annu Rev Biochem 66:581–611, 19974. Sun Y, Liu S, Ferguson S, Wang L, Klepcyk P, Yun JS, Friedman JE:
Phosphoenolpyruvate carboxykinase overexpression selectively attenu-ates insulin signaling and hepatic insulin sensitivity in transgenic mice.J Biol Chem 277:23301–23307, 2002
5. Valera A, Pujol A, Pelegrin M, Bosch F: Transgenic mice overexpressingphosphoenolpyruvate carboxykinase develop non-insulin-dependent dia-betes mellitus. Proc Natl Acad Sci U S A 91:9151–9154, 1994
6. Burgess SC, Hausler N, Merritt M, Jeffrey FM, Storey C, Milde A, Koshy S,Lindner J, Magnuson MA, Malloy CR, Sherry AD: Impaired tricarboxylicacid cycle activity in mouse livers lacking cytosolic phosphoenolpyruvatecarboxykinase. J Biol Chem 279:48941–48949, 2004
7. She P, Shiota M, Shelton KD, Chalkley R, Postic C, Magnuson MA:Phosphoenolpyruvate carboxykinase is necessary for the integration ofhepatic energy metabolism. Mol Cell Biol 20:6508–6517, 2000
8. She P, Burgess SC, Shiota M, Flakoll P, Donahue EP, Malloy CR, SherryAD, Magnuson MA: Mechanisms by which liver-specific PEPCK knockoutmice preserve euglycemia during starvation. Diabetes 52:1649–1654, 2003
9. Hakimi P, Johnson MT, Yang J, Lepage DF, Conlon RA, Kalhan SC, ReshefL, Tilghman SM, Hanson RW: Phosphoenolpyruvate carboxykinase and thecritical role of cataplerosis in the control of hepatic metabolism. Nutr
Metab (Lond) 2:33, 2005
A.G. GOMEZ-VALADES AND ASSOCIATES
DIABETES, VOL. 57, AUGUST 2008 2209
10. Cao H, van der Veer E, Ban MR, Hanley AJ, Zinman B, Harris SB, Young TK,Pickering JG, Hegele RA: Promoter polymorphism in PCK1 (phosphoenol-pyruvate carboxykinase gene) associated with type 2 diabetes mellitus.J Clin Endocrinol Metab 89:898–903, 2004
11. Landau BR, Wahren J, Chandramouli V, Schumann WC, Ekberg K, KalhanSC: Contributions of gluconeogenesis to glucose production in the fastedstate. J Clin Invest 98:378–385, 1996
12. Gomez-Valades AG, Vidal-Alabro A, Molas M, Boada J, Bermudez J,Bartrons R, Perales JC: Overcoming diabetes-induced hyperglycemiathrough inhibition of hepatic phosphoenolpyruvate carboxykinase (GTP)with RNAi. Mol Ther 13:401–410, 2006
13. Zeini M, Hortelano S, Traves PG, Gomez-Valades AG, Pujol A, Perales JC,Bartrons R, Bosca L: Assessment of a dual regulatory role for NO in liverregeneration after partial hepatectomy: protection against apoptosis andretardation of hepatocyte proliferation. FASEB J 19:995–997, 2005
14. Demoz A, Garras A, Asiedu DK, Netteland B, Berge RK: Rapid method forthe separation and detection of tissue short-chain coenzyme A esters byreversed-phase high-performance liquid chromatography. J Chromatogr B
Biomed Appl 667:148–152, 199515. Hrebicek J, Janout V, Malincikova J, Horakova D, Cizek L: Detection of
insulin resistance by simple quantitative insulin sensitivity check indexQUICKI for epidemiological assessment and prevention. J Clin Endocrinol
Metab 87:144–147, 200216. Saha AK, Ruderman NB: Malonyl-CoA and AMP-activated protein kinase:
an expanding partnership. Mol Cell Biochem 253:65–70, 200317. Samuel VT, Liu ZX, Wang A, Beddow SA, Geisler JG, Kahn M, Zhang XM,
Monia BP, Bhanot S, Shulman GI: Inhibition of protein kinase C epsilonprevents hepatic insulin resistance in nonalcoholic fatty liver disease.J Clin Invest 117:739–745, 2007
18. Dhaunsi GS, Singh I, Orak JK, Singh AK: Antioxidant enzymes in ciprofi-brate-induced oxidative stress. Carcinogenesis 15:1923–1930, 1994
19. Hardie DG, Hawley SA, Scott JW: AMP-activated protein kinase: develop-ment of the energy sensor concept. J Physiol 574:7–15, 2006
20. Rodgers JT, Lerin C, Haas W, Gygi SP, Spiegelman BM, Puigserver P:Nutrient control of glucose homeostasis through a complex of PGC-1alphaand SIRT1. Nature 434:113–118, 2005
21. Ruijter JM, Gieling RG, Markman MM, Hagoort J, Lamers WH: Stereologi-cal measurement of porto-central gradients in gene expression in mouseliver. Hepatology 39:343–352, 2004
22. Zhao H, Yakar S, Gavrilova O, Sun H, Zhang Y, Kim H, Setser J, Jou W,LeRoith D: Phloridzin improves hyperglycemia but not hepatic insulinresistance in a transgenic mouse model of type 2 diabetes. Diabetes
53:2901–2909, 200423. Ono H, Katagiri H, Funaki M, Anai M, Inukai K, Fukushima Y, Sakoda H,
Ogihara T, Onishi Y, Fujishiro M, Kikuchi M, Oka Y, Asano T: Regulation ofphosphoinositide metabolism, Akt phosphorylation, and glucose transportby PTEN (phosphatase and tensin homolog deleted on chromosome 10) in3T3–L1 adipocytes. Mol Endocrinol 15:1411–1422, 2001
24. Pocai A, Obici S, Schwartz GJ, Rossetti L: A brain-liver circuit regulatesglucose homeostasis. Cell Metab 1:53–61, 2005
25. Uno K, Katagiri H, Yamada T, Ishigaki Y, Ogihara T, Imai J, Hasegawa Y,Gao J, Kaneko K, Iwasaki H, Ishihara H, Sasano H, Inukai K, Mizuguchi H,Asano T, Shiota M, Nakazato M, Oka Y: Neuronal pathway from the livermodulates energy expenditure and systemic insulin sensitivity. Science
312:1656–1659, 200626. Monetti M, Levin MC, Watt MJ, Sajan MP, Marmor S, Hubbard BK, Stevens
RD, Bain JR, Newgard CB, Farese RV Sr, Hevener AL, Farese RV Jr:Dissociation of hepatic steatosis and insulin resistance in mice overex-pressing DGAT in the liver. Cell Metab 6:69–78, 2007
27. Choi CS, Savage DB, Kulkarni A, Yu XX, Liu ZX, Morino K, Kim S, DistefanoA, Samuel VT, Neschen S, Zhang D, Wang A, Zhang XM, Kahn M, Cline GW,Pandey SK, Geisler JG, Bhanot S, Monia BP, Shulman GI: Suppression of
diacylglycerol acyltransferase-2 (DGAT2), but not DGAT1, with antisenseoligonucleotides reverses diet-induced hepatic steatosis and insulin resis-tance. J Biol Chem 282:22678–22688, 2007
28. Kahn SE, Prigeon RL, Schwartz RS, Fujimoto WY, Knopp RH, Brunzell JD,Porte D Jr: Obesity, body fat distribution, insulin sensitivity and isletbeta-cell function as explanations for metabolic diversity. J Nutr 131:354S–360S, 2001
29. Beale EG, Hammer RE, Antoine B, Forest C: Glyceroneogenesis comes ofage. FASEB J 16:1695–1696, 2002
30. Kalhan SC, Mahajan S, Burkett E, Reshef L, Hanson RW: Glyceroneogen-esis and the source of glycerol for hepatic triacylglycerol synthesis inhumans. J Biol Chem 276:12928–12931, 2001
31. Drynan L, Quant PA, Zammit VA: Flux control exerted by mitochondrialouter membrane carnitine palmitoyltransferase over beta-oxidation, keto-genesis and tricarboxylic acid cycle activity in hepatocytes isolated fromrats in different metabolic states. Biochem J 317:791–795, 1996
32. Drynan L, Quant PA, Zammit VA: The role of changes in the sensitivity ofhepatic mitochondrial overt carnitine palmitoyltransferase in determiningthe onset of the ketosis of starvation in the rat. Biochem J 318:767–770,1996
33. Hansmannel F, Mordier S, Iynedjian PB: Insulin induction of glucokinaseand fatty acid synthase in hepatocytes: analysis of the roles of sterol-regulatory-element-binding protein-1c and liver X receptor. Biochem J
399:275–283, 200634. Gregori C, Guillet-Deniau I, Girard J, Decaux JF, Pichard AL: Insulin
regulation of glucokinase gene expression: evidence against a role forsterol regulatory element binding protein 1 in primary hepatocytes. FEBS
Lett 580:410–414, 200635. Mitro N, Mak PA, Vargas L, Godio C, Hampton E, Molteni V, Kreusch A,
Saez E: The nuclear receptor LXR is a glucose sensor. Nature 445:219–223,2007
36. Burgess SC, He T, Yan Z, Lindner J, Sherry AD, Malloy CR, Browning JD,Magnuson MA: Cytosolic phosphoenolpyruvate carboxykinase does notsolely control the rate of hepatic gluconeogenesis in the intact mouse liver.Cell Metab 5:313–320, 2007
37. Tilghman SM, Belayew A: Transcriptional control of the murine albumin/alpha-fetoprotein locus during development. Proc Natl Acad Sci U S A
79:5254–5257, 198238. De Souza AT, Dai X, Spencer AG, Reppen T, Menzie A, Roesch PL, He Y,
Caguyong MJ, Bloomer S, Herweijer H, Wolff JA, Hagstrom JE, Lewis DL,Linsley PS, Ulrich RG: Transcriptional and phenotypic comparisons ofPpara knockout and siRNA knockdown mice. Nucleic Acid Res 34:4486–4494, 2006
39. Nakae J, Cao Y, Daitoku H, Fukamizu A, Ogawa W, Yano Y, Hayashi Y: TheLXXLL motif of murine forkhead transcription factor FoxO1 mediatesSirt1-dependent transcriptional activity. J Clin Invest 116:2473–2483, 2006
40. Frescas D, Valenti L, Accili D: Nuclear trapping of the forkhead transcrip-tion factor FoxO1 via Sirt-dependent deacetylation promotes expression ofglucogenetic genes. J Biol Chem 280:20589–20595, 2005
41. Zhang Q, Wang SY, Fleuriel C, Leprince D, Rocheleau JV, Piston DW,Goodman RH: Metabolic regulation of SIRT1 transcription via a HIC1:CtBPcorepressor complex. Proc Natl Acad Sci U S A 104:829–833, 2007
42. Sun C, Zhang F, Ge X, Yan T, Chen X, Shi X, Zhai Q: SIRT1 improves insulinsensitivity under insulin-resistant conditions by repressing PTP1B. Cell
Metab 6:307–319, 200743. Rodgers JT, Puigserver P: Fasting-dependent glucose and lipid metabolic
response through hepatic sirtuin 1. Proc Natl Acad Sci U S A 104:12861–12866, 2007
44. Kuznetsov AV, Strobl D, Ruttmann E, Konigsrainer A, Margreiter R,Gnaiger E: Evaluation of mitochondrial respiratory function in smallbiopsies of liver. Anal Biochem 305:186–194, 2002
Pck1 GENE SILENCING IN THE LIVER
2210 DIABETES, VOL. 57, AUGUST 2008