Oracle Berkeley DB Getting Started with Berkeley DB for C ...
Upload
independentCategory
view
1download
0
Europe United Kingdom Oil & Gas Integrated Oils
7 January 2008
Oil & Gas for Beginners
A guide to the oil & gas industry
Lucas Herrmann, ACA Research Analyst (44) 20 754 73636 [email protected]
Jonathan Copus Research Analyst (44) 20 754 51202 [email protected]
James Hubbard, CFA Research Analyst (44) 20 754 57905 [email protected]
Deutsche Bank AG/London
All prices are those current at the end of the previous trading session unless otherwise indicated. Prices are sourced from local exchanges via Reuters, Bloomberg and other vendors. Data is sourced from Deutsche Bank and subject companies.
Deutsche Bank does and seeks to do business with companies covered in its research reports. Thus, investors should be aware that the firm may have a conflict of interest that could affect the objectivity of this report.
Investors should consider this report as only a single factor in making their investment decision.
Independent, third-party research (IR) on certain companies covered by DBSI's research is available to customers of DBSI in the United States at no cost. Customers can access this IR at http://gm.db.com, or call 1-877-208-6300 to request that a copy of the IR be sent to them.
DISCLOSURES AND ANALYST CERTIFICATIONS ARE LOCATED IN APPENDIX 1
Primer
Fill 'er up, please Deutsche Bank's overview of the global oil & gas industry. Structured in three parts, this layperson's guide includes details on the workings of the oil & gas industry, key oil producing countries and a summary of the assets and portfolios of the leading European and US oil & gas companies.
Co
mp
any
Glo
bal
Mar
kets
Res
earc
h
Europe United Kingdom Oil & Gas Integrated Oils
7 January 2008
Oil & Gas for Beginners A guide to the oil & gas industry Lucas Herrmann, ACA Research Analyst (44) 20 754 73636 [email protected]
Jonathan Copus Research Analyst ( 44) 20 754 51202 [email protected]
James Hubbard, CFA Research Analyst (44) 20 754 57905 [email protected]
Fill 'er up, please Deutsche Bank's overview of the global oil & gas industry. Structured in three parts, this layperson's guide includes details on the workings of the oil & gas industry, key oil producing countries and a summary of the assets and portfolios of the leading European and US oil & gas companies.
Deutsche Bank AG/London
All prices are those current at the end of the previous trading session unless otherwise indicated. Prices are sourced from local exchanges via Reuters, Bloomberg and other vendors. Data is sourced from Deutsche Bank and subject companies.
Deutsche Bank does and seeks to do business with companies covered in its research reports. Thus, investors should be aware that the firm may have a conflict of interest that could affect the objectivity of this report.
Investors should consider this report as only a single factor in making their investment decision.
Independent, third-party research (IR) on certain companies covered by DBSI's research is available to customers of DBSI in the United States at no cost. Customers can access this IR at http://gm.db.com, or call 1-877-208-6300 to request that a copy of the IR be sent to them.
DISCLOSURES AND ANALYST CERTIFICATIONS ARE LOCATED IN APPENDIX 1
Primer
European Oil & Gas Research Lucas Herrmann
(44) 20 754 73636
James Hubbard
(44) 20 754 57905
Jonathan Copus
(44) 20 754 51202
Christyan Malek
(44) 20 754 58429
Elaine Dunphy
(44) 20 754 59138
US Oil & Gas Research Paul Sankey
(1) 212 250 6137
Ryan Todd
(1) 212 250 8529
Richard Voliva
(1) 212 250 5696
Shannon Nome
(1) 713 409 4367
Mike Urban
(1) 212 250 3113
Chief Energy Economist Adam Sieminski
(1) 212 250 2928
The strategic commodity As the dominant source of our energy needs for the better part of the last sixty years, crude oil has held influence over the politics and economic strategies of nations more than any other commodity, frequently proving the source of instability, dispute and war. From the birth of Standard Oil through the expropriation of Yukos, the oil industry has similarly found itself the subject of frequent controversy, with the companies involved often achieving profits and wielding power greater than the nations in which they are based. For an industry that, at its most basic involves little more than drilling a hole in the ground in the hope of finding the ‘black stuff’, the modern day oil industry is a remarkable amalgam of politics, economics, science and technology. Huge and diverse, it is also one that can at times prove bewildering, and not just for the uninitiated.
The industry, the countries and the companies – all in one With this in mind, the global oils team at Deutsche Bank has sought to create a product that might prove of use for beginners and old hands alike. Oil & Gas for Beginners is not intended to be read from cover to cover but is meant to be kept on your shelf as an easy to use reference guide. Structured in three parts it contains contributions from Deutsche Bank’s global team of oil & gas analysts, many with backgrounds in the industry as well as drawing on Deutsche Bank’s longstanding relationship with Wood Mackenzie, one of the industry’s leading research houses. In the initial Industry section we look at what shaped today’s industry, the geology of oil, and its applications together with how it’s found, how it’s extracted & refined and how it’s taxed. In the second Countries Section we review the oil & gas production outlook and histories for the leading OPEC and non-OPEC producers including details of the major fields, their tax systems, energy infrastructure and, of course, the status of their reserves. Finally, in the Companies section we review the portfolios of thirteen of the leading international oil companies that comprise the bulk of the oil & gas sector’s stock market capitalisation, providing asset value breakdowns and an overview of their major business activities and growth projects.
For the uninitiated and more learned reader alike Although Oil & Gas for Beginners is intended as a beginners guide we hope that it will also find favour with the more experienced reader. Overall, we trust that our audience will find it a useful document and entrust it with a permanent slot on an already overcrowded desk. So for those of you who want to know more about the life cycle of a basin, the Earth’s geologic clock or any number of industry relevant themes read on. We hope that what you find will prove both interesting and informative.
7 January 2008 Integrated Oils Oil & Gas for Beginners
Page 2 Deutsche Bank AG/London
Table of Contents
A Brief History of Oil ......................................................................... 7 From biblical times…….............................................................................................................7 Setting the scene ......................................................................................................................8 IOCs and NOCs....................................................................................................................... 12 The IOC Sisters – 100 years in the making ............................................................................. 13 The International Oil Companies ............................................................................................. 14
The IOCs Compared ........................................................................ 17 The major NOCs ..................................................................................................................... 20
OPEC................................................................................................. 23 A brief history.......................................................................................................................... 23 How does OPEC work? .......................................................................................................... 24 Why is OPEC able to influence prices?................................................................................... 25 What price does OPEC want?................................................................................................. 26 The OPEC basket .................................................................................................................... 27 What is the western IOCs’ exposure to OPEC?...................................................................... 27
In the beginning ….. ........................................................................ 28 A brief summary ..................................................................................................................... 28 Geologic time and rock record................................................................................................ 29 Basic geology.......................................................................................................................... 30 Hunting for sand….................................................................................................................. 32 Working hydrocarbon system................................................................................................. 34 Source rocks ........................................................................................................................... 36 Migration................................................................................................................................. 38 Reservoir quality ..................................................................................................................... 39 The trap and seal..................................................................................................................... 41 Reservoir volumetrics ............................................................................................................. 43
Getting it out.................................................................................... 44 The Life Cycle of a Basin......................................................................................................... 44 Field Operations...................................................................................................................... 49 Land Seismic........................................................................................................................... 49 Offshore seismic..................................................................................................................... 51 Assessing risk and reward ...................................................................................................... 53 Field Operations - Drilling........................................................................................................ 54 Directional wells...................................................................................................................... 58 Land and offshore rigs ............................................................................................................ 58 Drilling day rates ..................................................................................................................... 60 Field Operations - Evaluation .................................................................................................. 62 Field Operations - Development ............................................................................................. 66 Onshore – oil is usually straight-forward… ............................................................................. 66 Offshore – as usual, deeper is tougher ................................................................................... 67 Extending the field life ............................................................................................................ 69 Recovery factors ..................................................................................................................... 70 Primary recovery ..................................................................................................................... 70 Depositional controls on recovery factor ................................................................................ 71 Secondary recovery… waterflood........................................................................................... 72 Tertiary recovery techniques................................................................................................... 72 Oil Services – What are they and where do they fit? .............................................................. 73
Oil & Gas reserves ........................................................................... 76 A cautionary tale ..................................................................................................................... 76 A company’s lifeblood ............................................................................................................ 76 SEC Reserves – Proven developed and proven undeveloped. ............................................... 77 SPE definitions - Proven, probable and possible..................................................................... 80
7 January 2008 Integrated Oils Oil & Gas for Beginners
Deutsche Bank AG/London Page 3
Reserve revisions.................................................................................................................... 82 Reserves: What do they actually tell us? ................................................................................ 83
Reserves Accounting– FAS 69 ........................................................ 85 Disclosure of proved oil and gas reserves .............................................................................. 85 Disclosure of capitalised cost relating to oil and gas producing activities .............................. 85 Disclosure of costs incurred in oil and gas property acquisition ............................................. 85 Disclosure of operational results............................................................................................. 86 Disclosure of discounted future net cash flows...................................................................... 86 Disclosure of current cost information.................................................................................... 86 So how do analysts use FAS 69 information?......................................................................... 87
Reserves - Where and what? .......................................................... 90 So how much oil has been extracted? .................................................................................... 90 What is Peak Oil? .................................................................................................................... 92 A critical weakness - simple economics ignored .................................................................... 93 So when will a peak occur and does it matter? ...................................................................... 94
Oil & Gas Taxation........................................................................... 95 Concessions & contracts – An overview................................................................................. 95 Tax & Royalty Concessions..................................................................................................... 97 Production Sharing Contracts (PSCs) ...................................................................................... 98 Working through an IRR based PSC ..................................................................................... 104 Buy Backs ............................................................................................................................. 107 Oil & Gas Taxation – Some Key Terms.................................................................................. 109
World Oil Markets ......................................................................... 110 The oil price........................................................................................................................... 110 Oil Demand........................................................................................................................... 111 Oil Supply.............................................................................................................................. 115 Inventories ............................................................................................................................ 116 The forward curve................................................................................................................. 116
World Gas Markets........................................................................ 117 Gas Pricing............................................................................................................................ 117 Gas demand.......................................................................................................................... 118 Gas Supply ............................................................................................................................ 120
Oil & Gas Products ........................................................................ 124 What is crude oil? ................................................................................................................. 124 Definitions............................................................................................................................. 124 Trends in crude oil................................................................................................................. 126 Key Global Blends ................................................................................................................. 127
Refining Overview ......................................................................... 128 The Black Sheep of the family............................................................................................... 128 The curse of the investment cycle ........................................................................................ 131
What is Refining?........................................................................... 132 What do refineries make? ..................................................................................................... 132 The stream of oil products .................................................................................................... 133 How does a refinery work?................................................................................................... 134 Key variables impacting refinery performance ...................................................................... 138 Configuration and complexity ............................................................................................... 138 Choice of Crude – Heavy, sour, sweet and light ................................................................... 141 Location ................................................................................................................................ 143 Other factors......................................................................................................................... 143 Regional balances and market structure ............................................................................... 145 Measuring Refining Profitability ............................................................................................ 147
7 January 2008 Integrated Oils Oil & Gas for Beginners
Page 4 Deutsche Bank AG/London
US margins ($/bbl)................................................................................................................. 148 NWE margins ($/bbl) ............................................................................................................. 148 Asian margins ($/bbl)............................................................................................................. 148 Gasoline/fuel oil crack spreads US/Europe............................................................................ 149 What drives refining margins? .............................................................................................. 149 Refining Industry Structure ................................................................................................... 151 Petroleum Administration for Defence Districts (PADDS) .................................................... 151
Marketing ....................................................................................... 153 Stability in a cyclical world .................................................................................................... 153 The wholesale/retail chain..................................................................................................... 155 Removing capital, containing costs....................................................................................... 156 What’s in a litre of fuel? European Retail Data...................................................................... 157 What’s in a litre of fuel? US Retail Data ................................................................................ 157
Biofuels........................................................................................... 158 What are biofuels? ................................................................................................................ 158 Why use biofuels? ................................................................................................................ 158 Where are biofuels produced and used? .............................................................................. 159 The regulatory framework..................................................................................................... 160 Key legislative measures....................................................................................................... 160 Bioethanol ............................................................................................................................. 162 Biodiesel ............................................................................................................................... 164 Criticisms of biofuels ............................................................................................................ 165 Long-term developments in biofuel ...................................................................................... 166
Petrochemicals .............................................................................. 167 Part of the integrated chain................................................................................................... 167 The olefin plant (cracker) ....................................................................................................... 168 Petrochemical Industry profitability....................................................................................... 170 Olefin and Aromatic Building Blocks and their Chains .......................................................... 172 Ethylene – C2 Olefin.............................................................................................................. 172 Propylene – C3 Olefin ........................................................................................................... 172 Butadiene – C4 Olefin ........................................................................................................... 173 Benzene – C6 Aromatic......................................................................................................... 173 Paraxylene – C8 Aromatic .................................................................................................... 174 The Major Plastics or Polymers ............................................................................................ 175 Polyethylene (PE) .................................................................................................................. 177 Polypropylene ....................................................................................................................... 177 Purified Terephthalic Acid (PTA)............................................................................................ 177
Conventionals & Unconventionals............................................... 179 Conventionals ....................................................................................................................... 179 Unconventionals ................................................................................................................... 179
Liquefied Natural Gas (LNG) ........................................................ 180 Overview............................................................................................................................... 180 LNG - The process and the chain .......................................................................................... 182 LNG – returns across the chain............................................................................................. 183 Pricing of LNG....................................................................................................................... 185 Costs of LNG Production ...................................................................................................... 187 Shipping of LNG.................................................................................................................... 188 Re-gasification of LNG .......................................................................................................... 189
Existing LNG facilities and facilities planned 2006-12................ 191 LNG - The IOCs Portfolios and Positions .............................................................................. 193 The IOC majors compared .................................................................................................... 195
7 January 2008 Integrated Oils Oil & Gas for Beginners
Deutsche Bank AG/London Page 5
Deepwater...................................................................................... 196 Peering into deepwater......................................................................................................... 196
NGLs and condensates ................................................................. 198 A valuable by-product ........................................................................................................... 198
Canada’s Oil Sands........................................................................ 199 A huge unconventional resource........................................................................................... 199 Methods of Extraction – Mining............................................................................................ 201 Methods of Extraction – In-situ ............................................................................................. 201 Upgrading ............................................................................................................................. 203 Costs – The highest marginal cost barrel on the globe ......................................................... 204
Gas to Liquids (GTL)...................................................................... 206 An expensive alternative to LNG........................................................................................... 206 Background........................................................................................................................... 206 Commercial GTL plants are limited ....................................................................................... 207 There are positives................................................................................................................ 209 An uncertain future at this time............................................................................................. 209
Coal Bed Methane ......................................................................... 210 Exactly what it says on the label ........................................................................................... 210
Tight Gas ........................................................................................ 211 Huge potential resource........................................................................................................ 211 Economic at current prices ................................................................................................... 212
Section II: The Countries............................................................... 213
Major non-OPEC producers .......................................................... 214
Norway ........................................................................................... 215
United Kingdom............................................................................. 221
US Deepwater Gulf of Mexico...................................................... 227
US Alaska ....................................................................................... 233
Canada – Oil Sands........................................................................ 239
Azerbaijan ...................................................................................... 245
Kazakhstan ..................................................................................... 251
Russia ............................................................................................. 259
Argentina........................................................................................ 267
Brazil ............................................................................................... 273
Major OPEC Producers.................................................................. 279
Angola............................................................................................. 281
Iran.................................................................................................. 287
Iraq.................................................................................................. 295
Kuwait ............................................................................................ 303

7 January 2008 Integrated Oils Oil & Gas for Beginners
Page 6 Deutsche Bank AG/London
Libya ............................................................................................... 311
Nigeria ............................................................................................ 319
Saudi Arabia................................................................................... 327
United Arab Emirates.................................................................... 335
Venezuela....................................................................................... 341
Section III: The Companies ........................................................... 349 BP ......................................................................................................................................... 351 Royal Dutch Shell plc ............................................................................................................ 355 Total SA................................................................................................................................. 359 ENI ........................................................................................................................................ 363 Repsol................................................................................................................................... 367 StatoilHydro .......................................................................................................................... 371 BG Group .............................................................................................................................. 375 ExxonMobil ........................................................................................................................... 379 Chevron................................................................................................................................. 383 ConocoPhillips ...................................................................................................................... 387 Occidental Petroleum ........................................................................................................... 391 Marathon Oil ......................................................................................................................... 395 Hess Corporation .................................................................................................................. 399
Glossary.......................................................................................... 403
Industry Investment thesis ........................................................... 413
7 January 2008 Integrated Oils Oil & Gas for Beginners
Deutsche Bank AG/London Page 7
A Brief History of Oil From biblical times…….
Crude oil has been known and used since ancient times with reference to it made by most historians since records of world history began. Noah is said to have used it to caulk his Ark; the bible refers to its application as a roofing material in Babylon; the Egyptians used it to help preserve mummies whilst Alexander the Great was known for his use of oil to create flaming torches to frighten his enemies. Beyond its obvious application as a source of fire, the substance was also highly valued by several civilizations for its medicinal properties; for the Chinese it served as a skin balm; for Native Americans a treatment for frostbite.
A small town in Pennsylvania Yet the modern oil era almost certainly commenced in 1859 in Titusville, Pennsylvania, when Colonel Edwin Drake struck oil some 69 feet underground. The commercial objective being pursued was to extract ‘rock’ oil, which, it had been discovered, could be refined to produce kerosene for illumination. At 15 barrels-a-day Drake’s discovery prompted a mad rush to drill for ‘the black stuff’. Within a year Pennsylvania was producing almost 500kb/d; two years later over 3mb/d was oozing out of the Pennsylvanian hills. The modern oil industry had been born.
The mother of today’s industry … This explosion in production, however, brought with it its own problems. Although demand for kerosene also surged as copious supplies made it ever more affordable, the absolute lack of discipline that surrounded both the supply of oil and its refining meant that the newly found kerosene industry was extremely volatile. Into this arena emerged one particular businessman who was intent on bringing structure, order and profit to the kerosene refining industry. Through the Standard Oil Company, John D Rockefeller set about establishing a business that was to have absolute influence over the US refining and oil producing industries. By 1890, using business practices that invariably sought to eliminate competition, Standard Oil controlled almost 90% of the refined oil flows in the United States. It determined the price at which its products would be sold on the open market and it told the producers the price that they would receive for their oil. In effect it was, to all extents and purposes, the US oil industry, a position it largely retained until its dissolution under anti-trust legislation by the US Supreme Court courts in 1911 into 34 independent companies.
… through the daughters that she spawned Yet Standard Oil’s dissolution was as much the beginning of an era as it was the end. For the companies which were born as a result by and large proved those which would go on to shape the industry as we know it today. Exxon, Chevron, Texaco, Conoco and much of BP, amongst others, can all trace their roots back to Standard Oil. And in their desperate pursuit through much of the twentieth century to secure new sources of oil from across the globe, not least the Middle East, they gave birth to the national oil companies that dominate today’s production. Saudi Aramco, the National Iranian Oil Company, the Iraqi National Oil Company, the Kuwait Oil Company, ADNOC and PDVSA were all established in large part by the ‘sisters’ that emerged from the break-up of Standard Oil.
More sustainable than your average state Indeed, it is perhaps an irony that an industry whose sustainability is constantly in question should be comprised of companies that have a history that is longer than that of several modern day countries. Governments may come and go and wars may pass. Yet in pursuit of that life-giving incremental barrel of reserves, the major oil companies have evolved into the industrial behemoths that stand today and will, almost certainly, still stand tomorrow.
Crude oil has been known
and used since ancient
times
Standard Oil’s dissolution
was as much the beginning
of an era
7 January 2008 Integrated Oils Oil & Gas for Beginners
Page 8 Deutsche Bank AG/London
Setting the scene
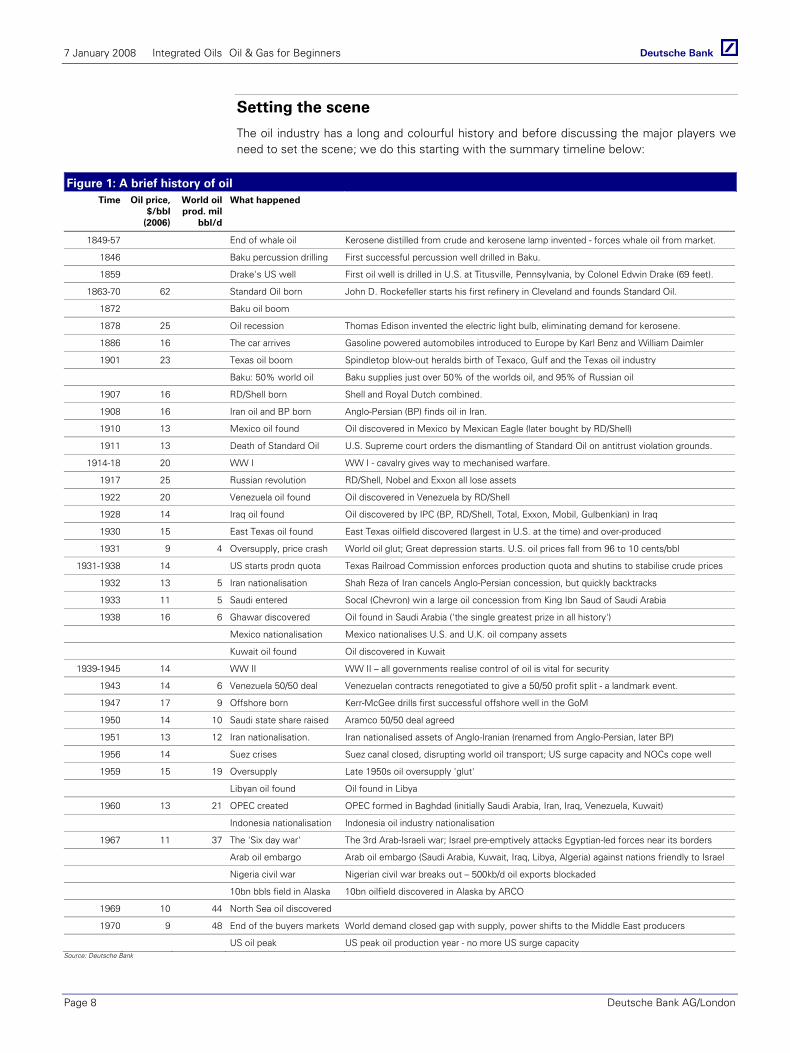
The oil industry has a long and colourful history and before discussing the major players we need to set the scene; we do this starting with the summary timeline below:
Figure 1: A brief history of oil Time Oil price,
$/bbl (2006)
World oil prod. mil
bbl/d
What happened
1849-57 End of whale oil Kerosene distilled from crude and kerosene lamp invented - forces whale oil from market.
1846 Baku percussion drilling First successful percussion well drilled in Baku.
1859 Drake's US well First oil well is drilled in U.S. at Titusville, Pennsylvania, by Colonel Edwin Drake (69 feet).
1863-70 62 Standard Oil born John D. Rockefeller starts his first refinery in Cleveland and founds Standard Oil.
1872 Baku oil boom
1878 25 Oil recession Thomas Edison invented the electric light bulb, eliminating demand for kerosene.
1886 16 The car arrives Gasoline powered automobiles introduced to Europe by Karl Benz and William Daimler
1901 23 Texas oil boom Spindletop blow-out heralds birth of Texaco, Gulf and the Texas oil industry
Baku: 50% world oil Baku supplies just over 50% of the worlds oil, and 95% of Russian oil
1907 16 RD/Shell born Shell and Royal Dutch combined.
1908 16 Iran oil and BP born Anglo-Persian (BP) finds oil in Iran.
1910 13 Mexico oil found Oil discovered in Mexico by Mexican Eagle (later bought by RD/Shell)
1911 13 Death of Standard Oil U.S. Supreme court orders the dismantling of Standard Oil on antitrust violation grounds.
1914-18 20 WW I WW I - cavalry gives way to mechanised warfare.
1917 25 Russian revolution RD/Shell, Nobel and Exxon all lose assets
1922 20 Venezuela oil found Oil discovered in Venezuela by RD/Shell
1928 14 Iraq oil found Oil discovered by IPC (BP, RD/Shell, Total, Exxon, Mobil, Gulbenkian) in Iraq
1930 15 East Texas oil found East Texas oilfield discovered (largest in U.S. at the time) and over-produced
1931 9 4 Oversupply, price crash World oil glut; Great depression starts. U.S. oil prices fall from 96 to 10 cents/bbl
1931-1938 14 US starts prodn quota Texas Railroad Commission enforces production quota and shutins to stabilise crude prices
1932 13 5 Iran nationalisation Shah Reza of Iran cancels Anglo-Persian concession, but quickly backtracks
1933 11 5 Saudi entered Socal (Chevron) win a large oil concession from King Ibn Saud of Saudi Arabia
1938 16 6 Ghawar discovered Oil found in Saudi Arabia ('the single greatest prize in all history')
Mexico nationalisation Mexico nationalises U.S. and U.K. oil company assets
Kuwait oil found Oil discovered in Kuwait
1939-1945 14 WW II WW II – all governments realise control of oil is vital for security
1943 14 6 Venezuela 50/50 deal Venezuelan contracts renegotiated to give a 50/50 profit split - a landmark event.
1947 17 9 Offshore born Kerr-McGee drills first successful offshore well in the GoM
1950 14 10 Saudi state share raised Aramco 50/50 deal agreed
1951 13 12 Iran nationalisation. Iran nationalised assets of Anglo-Iranian (renamed from Anglo-Persian, later BP)
1956 14 Suez crises Suez canal closed, disrupting world oil transport; US surge capacity and NOCs cope well
1959 15 19 Oversupply Late 1950s oil oversupply 'glut'
Libyan oil found Oil found in Libya
1960 13 21 OPEC created OPEC formed in Baghdad (initially Saudi Arabia, Iran, Iraq, Venezuela, Kuwait)
Indonesia nationalisation Indonesia oil industry nationalisation
1967 11 37 The 'Six day war' The 3rd Arab-Israeli war; Israel pre-emptively attacks Egyptian-led forces near its borders
Arab oil embargo Arab oil embargo (Saudi Arabia, Kuwait, Iraq, Libya, Algeria) against nations friendly to Israel
Nigeria civil war Nigerian civil war breaks out – 500kb/d oil exports blockaded
10bn bbls field in Alaska 10bn oilfield discovered in Alaska by ARCO
1969 10 44 North Sea oil discovered
1970 9 48 End of the buyers markets World demand closed gap with supply, power shifts to the Middle East producers
US oil peak US peak oil production year - no more US surge capacity Source: Deutsche Bank
7 January 2008 Integrated Oils Oil & Gas for Beginners
Deutsche Bank AG/London Page 9
Figure 1 contd: A brief history of oil Libya state share raised Libya raises profit share from 50% to 55% and forces through a 30% oil price hike
Iran state share raised Iran forces profit share up to 55% from 50%
Venezuela share raised Venezuela unilaterally raises state profit share to 60%
1973 15 58 Oil embargo Yom Kippur war: Arab oil embargo in response to U.S. support for Israel
Oil prices up c.4x. Prices rise from $2.9 to $11.6/bbl (money of the day)
1974 48 59 Iraq nationalisation Iraq nationalisation (BP, Shell, Exxon lost assets in Iraq Petroleum Co.)
Saudi partial nationalisation Aramco 60% nationalised (Chevron, Texaco, Exxon, Mobil impacted)
1975 43 56 Kuwait nationalisation Kuwait nationalises oil industry
Venezuela nationalisation Venezuela nationalises oil industry
1979 88 66 Iranian revolution Shah deposed in Iranian revolution, oil prices touch $40/bbl despite no shortage of oil
Oil price shock By 1981 oil prices has risen to $34 from $13/bbl, post the Iranian revolution
1980 91 63 Saudi nationalisation Aramco 100% nationalised
1982 69 57 OPEC introduces quotas Quotas used by OPEC for fist time to prevent oversupply
1986 27 60 Oversupply - price collapse OPEC fails to prevent oversupply - oil prices fall from $29/bbl to $10/bbl
1991 30 65 Gulf war I Iraq invades Kuwait and is swiftly defeated by the Americans; Oil briefly touched $40/bbl
1998-2001 Super mergers BP-Amoco-Arco, Exxon-Mobil, Chevron-Texaco, Conoco-Philips, Total-Elf-Fina
1998 Oil price collapse Asian crisis recession drives oil price collapse
2003 32 77 Gulf war II Second Iraq war
2003-08 Oil price shock Iraq on verge of civil war, heightened Iran nuclear tensions, strong oil demand growth from emerging markets, surprisingly inelastic world demand and dwindling capacity cushion help drive prices to almost $100/bbl; Various host nations raise taxes and state share
Source: Deutsche Bank
Key points to note are:
Standard Oil – the mother of all grandmothers, founded by John D. Rockefeller in 1870 was the largest and best run company of its, and perhaps any age. Its pursuit of efficiency included relentless price wars and other methods to destroy competition and in 1911 the Supreme Court decided various antitrust laws had been violated. The ensuing enforced break-up of the company gave birth to 34 new companies, including the ancestors of Exxon, Mobil, Chevron, Texaco, Arco and others.
The key companies have been around a long, long time. ExxonMobil, BP, ConocoPhilips and Shell can all trace their past back over 100 years. Total can look back on 80 years and Eni on over 50 years.
Nationalisation is not new. In fact the first attempt was by the Shah of Iran in 1932, who was unhappy with the terms that Anglo-Persian (from which BP was born) had convinced Iran to sign up to back in 1903. However the Shah rapidly backed down for an insignificant improvement in terms. Mexico nationalised in 1938 but this proved self destructive, as there existed a wealth of alternative supplies.
The Texas Railroad Commission – the forerunner to OPEC. The late 1920s glut caused by the start of the great depression and the over production of the huge East Texas discovery prompted the Texas Railroad Commission (the state regulator for oil production) to impose production quotas. Whilst these were initially resisted, laws were passed that gave the Commission more power and it successfully took the lead in regulating US production until 1970, when excess capacity finally disappeared. In a sense OPEC took over the role that the Commission had previously played, and which was fulfilled by Rockefeller before that.
The Middle East carve up. Until the 1970s the IOCs had a huge influence on Middle East oil development and production. American and British/Dutch companies made all the major discoveries in Iran, Iraq, Kuwait and Saudi Arabia, and controlled everything from wellhead to car gas tank, with little disclosure. The perceived IOC exploitation (for ‘unfair’ returns) is a fundamental factor behind the current characteristics of the Middle East oil industry.
7 January 2008 Integrated Oils Oil & Gas for Beginners
Page 10 Deutsche Bank AG/London
If it doesn’t affect oil supplies, it doesn’t matter to oil prices. Notable by their absence are the Korean War (1950-53), Cuban Missile Crisis (1962) and the Vietnam War (1965-75) all had no meaningful impact on prices because oil supplies were never under threat.
1970 pivotal. Although OPEC was created in 1960 (a global version of the Texas Railroad Commission, upon which it was partially modelled) it wasn’t until 1970 that US oil production peaked. The US hence lost its ‘surge’ capacity cushion for the first time, which had enabled it to weather previous supply disruptions, including two Arab oil embargos.
Prior to 1970 the IOCs held the bulk of industry power, almost uninterrupted. The period from 1970 to 1979 was pivotal in the evolution of power from western oil companies towards resource holding nations, and we have seen another surge in this theme in recent years.
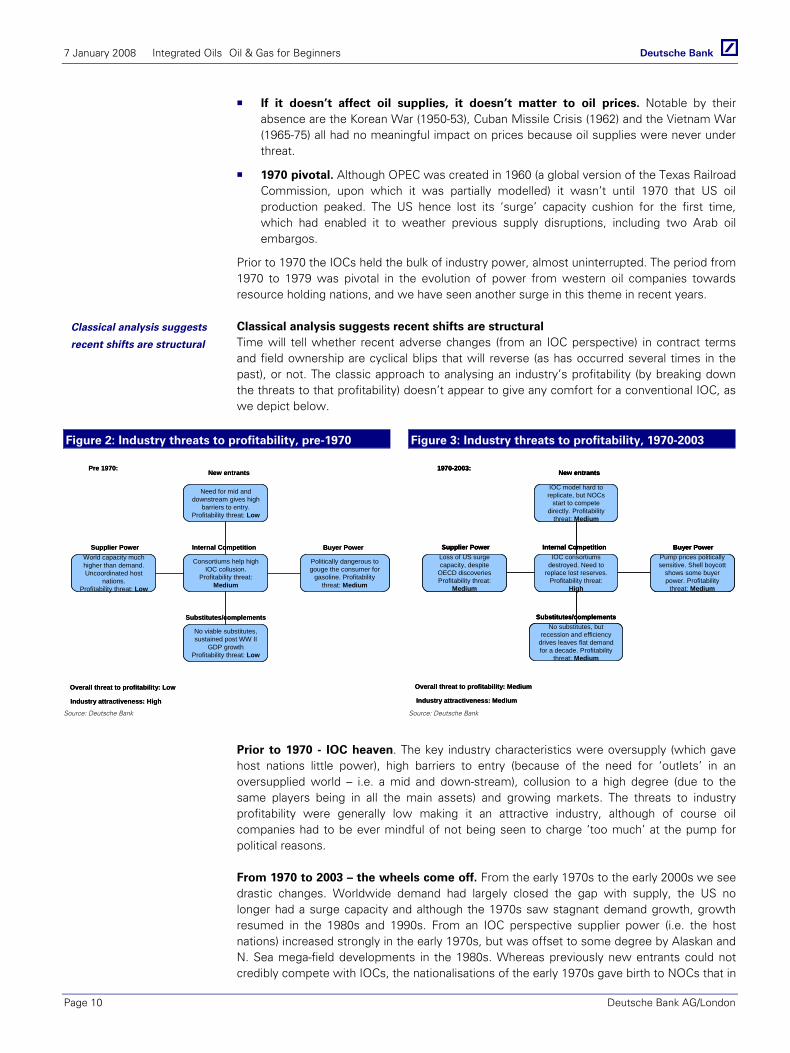
Classical analysis suggests recent shifts are structural Time will tell whether recent adverse changes (from an IOC perspective) in contract terms and field ownership are cyclical blips that will reverse (as has occurred several times in the past), or not. The classic approach to analysing an industry’s profitability (by breaking down the threats to that profitability) doesn’t appear to give any comfort for a conventional IOC, as we depict below.
Figure 2: Industry threats to profitability, pre-1970 Figure 3: Industry threats to profitability, 1970-2003
Consortiums help high IOC collusion.
Profitability threat: Medium
Internal CompetitionWorld capacity much higher than demand. Uncoordinated host
nations.Profitability threat: Low
Supplier Power
Politically dangerous to gouge the consumer for
gasoline. Profitability threat: Medium
Buyer Power
Need for mid and downstream gives high
barriers to entry.Profitability threat: Low
New entrantsPre 1970:
No viable substitutes, sustained post WW II
GDP growthProfitability threat: Low
Substitutes/complements
Overall threat to profitability: Low
Industry attractiveness: High
IOC consortiums destroyed. Need to
replace lost reserves.Profitability threat:
High
Internal CompetitionLoss of US surge capacity, despite
OECD discoveriesProfitability threat:
Medium
Supplier PowerPump prices politically sensitive. Shell boycott
shows some buyer power. Profitability
threat: Medium
Buyer Power
IOC model hard to replicate, but NOCs
start to compete directly. Profitability
threat: Medium
New entrants1970-2003:
No substitutes, but recession and efficiency
drives leaves flat demand for a decade. Profitability
threat: Medium
Substitutes/complements
Overall threat to profitability: Medium
Industry attractiveness: Medium
IOC consortiums destroyed. Need to
replace lost reserves.Profitability threat:
High
Internal CompetitionLoss of US surge capacity, despite
OECD discoveriesProfitability threat:
Medium
Supplier PowerPump prices politically sensitive. Shell boycott
shows some buyer power. Profitability
threat: Medium
Buyer Power
IOC model hard to replicate, but NOCs
start to compete directly. Profitability
threat: Medium
New entrants1970-2003:
No substitutes, but recession and efficiency
drives leaves flat demand for a decade. Profitability
threat: Medium
Substitutes/complements
Overall threat to profitability: Medium
Industry attractiveness: Medium
Source: Deutsche Bank Source: Deutsche Bank
Prior to 1970 - IOC heaven. The key industry characteristics were oversupply (which gave host nations little power), high barriers to entry (because of the need for ‘outlets’ in an oversupplied world – i.e. a mid and down-stream), collusion to a high degree (due to the same players being in all the main assets) and growing markets. The threats to industry profitability were generally low making it an attractive industry, although of course oil companies had to be ever mindful of not being seen to charge ‘too much’ at the pump for political reasons.
From 1970 to 2003 – the wheels come off. From the early 1970s to the early 2000s we see drastic changes. Worldwide demand had largely closed the gap with supply, the US no longer had a surge capacity and although the 1970s saw stagnant demand growth, growth resumed in the 1980s and 1990s. From an IOC perspective supplier power (i.e. the host nations) increased strongly in the early 1970s, but was offset to some degree by Alaskan and N. Sea mega-field developments in the 1980s. Whereas previously new entrants could not credibly compete with IOCs, the nationalisations of the early 1970s gave birth to NOCs that in
Classical analysis suggests
recent shifts are structural

7 January 2008 Integrated Oils Oil & Gas for Beginners
Deutsche Bank AG/London Page 11
time would start to compete directly, at least for conventional oil projects. We therefore characterise this era as having ‘medium’ threats to profitability and hence ‘medium’ profitability attractiveness to IOCs overall.
Figure 4: Industry threats to profitability, post-2003
Mega mergers left less IOC players, but more
competition from NOCs.Profitability threat: High
Internal CompetitionSmall surge cushion,
dwindling OECD reserves shifts power to
host nations. Profitability threat: High
Supplier Power
Soaring pump prices attract undesired
attention. Profitability threat: High
Buyer Power
High barriers for new entrants, host nations already have NOCs.
Profitability threat: Low
New entrantsPost 2003:
Alternative energy tiny but growing. Sustained
EM GDP growth. Profitability threat:
Medium
Substitutes/complements
Overall threat to profitability: High
Industry attractiveness: Low
Mega mergers left less IOC players, but more
competition from NOCs.Profitability threat: High
Internal CompetitionSmall surge cushion,
dwindling OECD reserves shifts power to
host nations. Profitability threat: High
Supplier Power
Soaring pump prices attract undesired
attention. Profitability threat: High
Buyer Power
High barriers for new entrants, host nations already have NOCs.
Profitability threat: Low
New entrantsPost 2003:
Alternative energy tiny but growing. Sustained
EM GDP growth. Profitability threat:
Medium
Substitutes/complements
Overall threat to profitability: High
Industry attractiveness: LowSource: Deutsche Bank
Post 2003 – further tightening. OECD mega-fields have started to decline, and strong emerging market demand growth has handed yet more power to the major resource holders in the Middle East, Russia and Venezuela. Increased terrorism activities have put oil infrastructure at heightened risk, and geopolitical stability in the Middle East has fallen in the aftermath of Gulf War II and with the emergence of Iranian nuclear ambitions. Correspondingly the oil price has risen by almost a factor of five, and resource holders have raised both taxes and NOC stakes at the expense of IOCs. Supplier power is thus high, competition for new acreage or M&A deals from NOCs is also high, the high pump prices raise consumer discontent and even the green movement is gathering momentum. All in all the threats to profitability of IOCs are high relative to previous eras and hence industry attractiveness is low, at least relative to the past.
…but no 1970s-like panic today. This post 2003 analysis is a long term industry view and implicitly assumes that taxes will rise so that the host nations accrue returns commensurate with their apparent industry power. However, for now the industry is in an interim stage where existing IOC fields are generating huge cashflows due to the high oil price. This interim stage could conceivably continue for many years.
The threats to profitability of
IOCs are high relative to
previous eras
7 January 2008 Integrated Oils Oil & Gas for Beginners
Page 12 Deutsche Bank AG/London
IOCs and NOCs
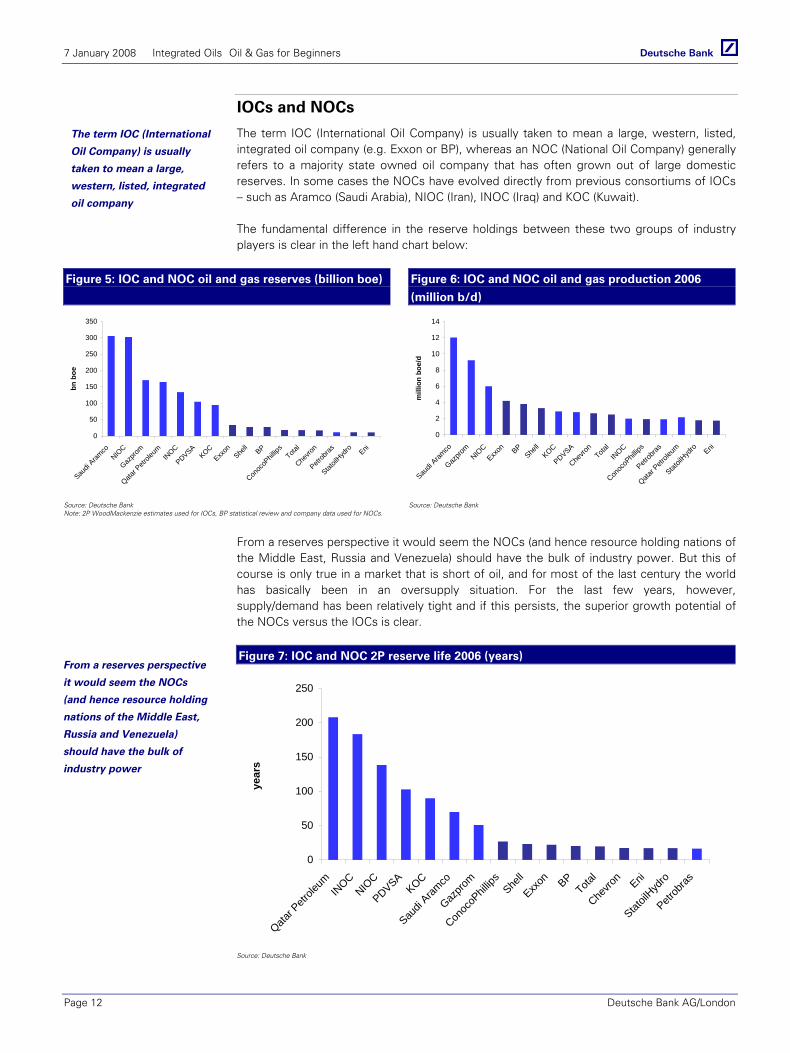
The term IOC (International Oil Company) is usually taken to mean a large, western, listed, integrated oil company (e.g. Exxon or BP), whereas an NOC (National Oil Company) generally refers to a majority state owned oil company that has often grown out of large domestic reserves. In some cases the NOCs have evolved directly from previous consortiums of IOCs – such as Aramco (Saudi Arabia), NIOC (Iran), INOC (Iraq) and KOC (Kuwait).
The fundamental difference in the reserve holdings between these two groups of industry players is clear in the left hand chart below:
Figure 5: IOC and NOC oil and gas reserves (billion boe)
Figure 6: IOC and NOC oil and gas production 2006
(million b/d)
0
50
100
150
200
250
300
350
Saudi
Aramco
NIOC
Gazpro
m
Qatar P
etrole
umIN
OC
PDVSAKOC
Exxon
Shell BP
Conoc
oPhil
lips
Total
Chevro
n
Petrob
ras
Statoil
Hydro Eni
bn b
oe
0
2
4
6
8
10
12
14
Saudi
Aramco
Gazpro
mNIO
C
Exxon BP
Shell
KOC
PDVSA
Chevro
nTota
lIN
OC
Conoc
oPhil
lips
Petrob
ras
Qatar P
etrole
um
Statoil
Hydro Eni
mill
ion
boe/
d
Source: Deutsche Bank Note: 2P WoodMackenzie estimates used for IOCs, BP statistical review and company data used for NOCs. Source: Deutsche Bank
From a reserves perspective it would seem the NOCs (and hence resource holding nations of the Middle East, Russia and Venezuela) should have the bulk of industry power. But this of course is only true in a market that is short of oil, and for most of the last century the world has basically been in an oversupply situation. For the last few years, however, supply/demand has been relatively tight and if this persists, the superior growth potential of the NOCs versus the IOCs is clear.
Figure 7: IOC and NOC 2P reserve life 2006 (years)
0
50
100
150
200
250
Qatar P
etrole
umIN
OCNIO
C
PDVSAKOC
Saudi
Aramco
Gazpro
m
Conoc
oPhil
lips
Shell
Exxon BP
Total
Chevro
n Eni
Statoil
Hydro
Petrob
ras
year
s
Source: Deutsche Bank
The term IOC (International
Oil Company) is usually
taken to mean a large,
western, listed, integrated
oil company
From a reserves perspective
it would seem the NOCs
(and hence resource holding
nations of the Middle East,
Russia and Venezuela)
should have the bulk of
industry power
7 January 2008 Integrated Oils Oil & Gas for Beginners
Deutsche Bank AG/London Page 13
The IOC Sisters – 100 years in the making
The IOCs (Exxon, Shell, BP, Total and Chevron being pre-eminent) have long, colourful histories. It is not too much to say that these companies more than any others played major roles in shaping the world we live in. The last 60 years worldwide GDP growth, business theory and practice, economics and antitrust laws have all been hugely influenced by their activities and decisions, as have the current geopolitical issues in countries such as Saudi Arabia, Iran, Iraq and Venezuela.
1870-1911, the titans are born. Rockefeller’s Standard Oil had over 40 years to build itself into a huge integrated oil company that almost totally dominated the US industry before its break-up in 1911. BP’s forerunner (Anglo-Persian) was created in 1908 to develop Iran and Royal Dutch and Shell merged in 1907 to better develop Indonesian Oil and compete internationally with Standard Oil. The descendents of these companies, along with Gulf and Texaco, were to dominate the world’s oil industry, not to mention the economic fate of several countries, for most of the last century.
Pre WW II - masters of the world. In the 30 years leading up to WW II, worldwide consumption had grown from less than 0.5 million b/d to 6 million b/d, driven mainly by strong growth in US GDP and car usage. The early 1930s oil glut (partly due to the discovery of the huge East Texas field and the great depression) did little to deter the IOCs from ambitious international exploration programs. In some cases the motivation was simply to lock other companies and oil out of an oversupplied market, but by 1940 the end result was that the IOCs were all-powerful. BP dominated Iranian oil while Iraqi oil was controlled by a consortium of BP, RD/Shell, Total, Exxon and Mobil. Kuwait had been shared out between BP and Gulf and Saudi Arabia, containing the greatest field ever found, was controlled by Chevron, Texaco, Exxon and Mobil (Aramco).
Post WW II - the fight back begins. WW II had shown the world’s governments just how strategically important oil supplies were and the Middle East governments unsurprisingly wanted more of the pie. The Saudi government forced Aramco to accept a profit split of 50/50 in 1950 and Iran nationalised Anglo-Persian’s (BP) assets in 1951. Iran’s nationalisation was shortly undone in all but name but BP lost significant share and the warning signs to the IOCs must have been clear. Although the ‘Seven Sisters’ (Exxon, Mobil, Chevron, Texaco, RD/Shell, BP and Gulf) remained immensely powerful, they slowly but surely gave profit share ground over the two decades leading up to 1970. However despite the creation of OPEC in 1960, it was not until 1970, when US oil production peaked and it lost its surge capacity that the theory of Arab oil power finally became a reality.
1970s – the new reality. The implications of the loss of US surge capacity were not lost on the countries where the IOC’s precious reserves lay. The Yom Kippur war of 1973 and associated Arab oil embargo drove up the oil price by c.4x and in a wave of nationalisation the Seven Sisters were forced to sell (if they were lucky) the bulk of their assets in Iraq, Saudi Arabia, Kuwait and Venezuela. The Iranian revolution of 1979 removed any lingering IOC ownership in the Middle East heartland and sent oil prices spiralling upwards once again. The days of IOC supremacy were over.
1980s – a reprieve in the form of Alaska and the North Sea. The events of the 1970’s forced the IOCs to look elsewhere for oil, and the late-1960s discoveries of huge reserves in Alaska and the North Sea were the answer. BP, RD/Shell, Exxon and Mobil were instrumental in exploiting these areas, and the North Sea discoveries gave birth to a new western NOC; Statoil in Norway.
The IOCs (Exxon, Shell, BP,
Total and Chevron being
pre-eminent), have long,
colourful histories.
7 January 2008 Integrated Oils Oil & Gas for Beginners
Page 14 Deutsche Bank AG/London
1990s – profits under threat – mega mergers. By the mid-1990s a flat oil price environment, stricter terms and competition from the Middle East NOCs (that the sisters had unwillingly given birth to) made it clear that the culture of perks and large numbers of expatriates on high salaries could no longer be sustained. Profitability was under pressure; BP caused shock waves when it cut its dividend for the first time in 1992 and several of the other majors were also experiencing financial stress. BP showed the way forward with its acquisition of Amoco announced in 1998 – the largest merger ever at the time. The other majors quickly realised that the synergies that BP-Amoco would benefit from would leave them behind unless they followed suit. Exxon and Mobil announced their merger in 1999 and Chevron and Texaco did the same in 2000. Elsewhere Total acquired Fina in 1998 and then Elf in 1999 and Conoco and Phillips merged in 2001. Of the majors only RD/Shell refrained from major M&A activity.
Of the original seven sisters that so dominated the world’s oil industry for much of the last century, four remain; Mobil went to Exxon, Gulf and then Texaco went to Chevron.
2000s – power moves further towards the resource owners. Since 2003 oil prices have risen from just above $20/bbl to just below $100/bbl. Oil is a finite resource and it appears as though the easy hanging fruit has been burnt; even Saudi Arabia has to use enhanced production techniques on nearly all of its fields. However demand has marched onwards, driven in part by a multi-year surge in emerging economies. In the face of restrained industry investments over the last decade, there is now little effective supply cushion. This worsening supply/demand situation, when coupled with increased geopolitical tensions, and perhaps the influx of speculative money into oil trading, can explain the bulk of the recent oil price rise.
None of these factors appears particularly transitory, and the major resource owning countries that have IOC presences have tightened the tax screws once again. Conventional oilfield development opportunities under reasonable terms are currently hard to find and we appear to be at an inflexion point. But the IOCs are still vital for large, integrated, hostile environment or technically challenging projects and the recent escalation in power towards NOCs is by no means the death knell for the remaining seven sisters or their peers. That said, those that can grow their business from non-conventional production will likely eventually find themselves at an advantage relative to those that persist with the ‘old’ conventional oil IOC model.
The International Oil Companies
Almost one hundred years after his company was broken up, Rockefeller’s legacy is still huge. One of the world’s most valuable companies, Exxon is a direct descendent of Standard’s heart -- Standard Oil New Jersey.
Standard Oil, as mentioned earlier, was founded by John D. Rockefeller in 1870, and rapidly consolidated the refining companies in Eastern US into one organisation. By the 1911 Supreme Court dismantling ruling, this consolidation had extended into almost total control of upstream, downstream and midstream US operations, with significant overseas activities. Its domination was achieved at the expense of using its size to achieve unfairly advantageous terms from railroads for transit fees, by crushing out all competition via price wars and by extensive use of bribes. Rockefeller merely saw his company as bringing order and stability to a market that otherwise would be characterised by boom and bust cycles and correspondingly chaotic pricing. In his eyes, Standard Oil benefited the consumer, despite the lack of price competition.
Exxon – leader of the pack for nearly a century. Today’s Exxon stems directly from four Standard Oil companies. Its 1998 merger with smaller sister Mobil was the largest corporate deal in US history and was remarkable in that it reunited the two largest companies of the Standard Oil Trust – dismantled almost 90 years earlier by the US Supreme Court.
Of the original seven sisters
that so dominated the
world’s oil industry for much
of the last century, four
remain Exxon, Chevron,
Shell and BP
Exxon, is a direct
descendent of Standard’s
heart; Standard Oil New
Jersey
Deutsche B
ank AG
/London P
age 15
7 January 2008 Integrated O
ils O
il & G
as for Beginners
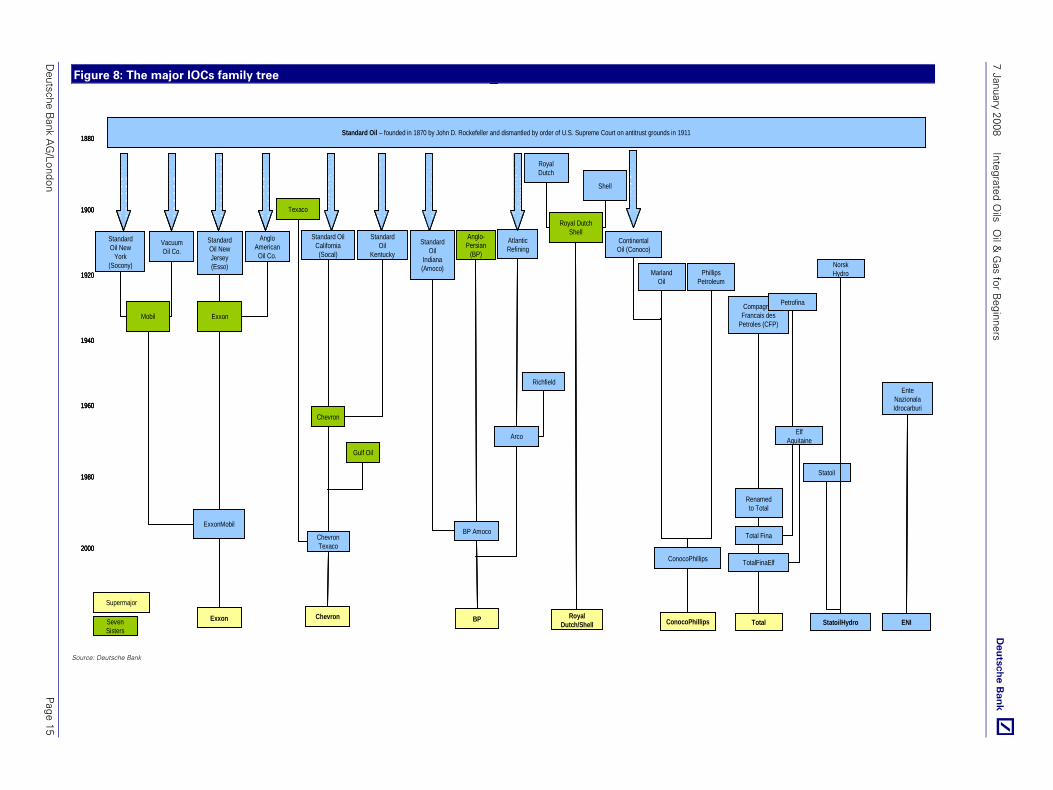
Figure 8: The major IOCs family tree
1900
1920
1940
1960
1980
2000
1880
BP
Anglo-Persian
(BP)
BP Amoco
Standard Oil
Indiana (Amoco)
Arco
Atlantic Refining
Richfield
Chevron
Texaco
Chevron
Chevron Texaco
Standard Oil California (Socal)
Standard Oil
Kentucky
Gulf Oil
Exxon
Standard Oil New
York (Socony)
ExxonMobil
Anglo American Oil Co.
Standard Oil New Jersey (Esso)
Vacuum Oil Co.
Mobil Exxon
Royal Dutch/Shell
Shell
Royal Dutch
Royal Dutch Shell
Standard Oil – founded in 1870 by John D. Rockefeller and dismantled by order of U.S. Supreme Court on antitrust grounds in 1911
Seven Sisters
Supermajor
ConocoPhillips
ConocoPhillips
Continental Oil (Conoco)
MarlandOil
Phillips Petroleum
CompagnieFrancais des
Petroles (CFP)
Renamed to Total
Total
Total Fina
Petrofina
Elf Aquitaine
TotalFinaElf
StatoilHydro
NorskHydro
Statoil
ENI
EnteNazionalaIdrocarburi
1900
1920
1940
1960
1980
2000
1880
BP
Anglo-Persian
(BP)
BP Amoco
Standard Oil
Indiana (Amoco)
Arco
Atlantic Refining
Richfield
Chevron
Texaco
Chevron
Chevron Texaco
Standard Oil California (Socal)
Standard Oil
Kentucky
Gulf Oil
Exxon
Standard Oil New
York (Socony)
ExxonMobil
Anglo American Oil Co.
Standard Oil New Jersey (Esso)
Vacuum Oil Co.
Mobil Exxon
Royal Dutch/Shell
Shell
Royal Dutch
Royal Dutch Shell
Royal Dutch/Shell
Shell
Royal Dutch
Royal Dutch Shell
Standard Oil – founded in 1870 by John D. Rockefeller and dismantled by order of U.S. Supreme Court on antitrust grounds in 1911
Seven Sisters
Supermajor
ConocoPhillips
ConocoPhillips
Continental Oil (Conoco)
MarlandOil
Phillips Petroleum
CompagnieFrancais des
Petroles (CFP)
Renamed to Total
Total
Total Fina
Petrofina
Elf Aquitaine
TotalFinaElf
StatoilHydro
NorskHydro
Statoil
ENI
EnteNazionalaIdrocarburi
ENI
EnteNazionalaIdrocarburi
Source: Deutsche Bank

7 January 2008 Integrated Oils Oil & Gas for Beginners
Page 16 Deutsche Bank AG/London
Chevron – found the greatest prize in history. Standard Oil of California (Socal) was only part of Standard Oil for eleven years before the breakup, and eventually became Chevron. Chevron negotiated the concessions in Saudi Arabia in 1933 and then discovered the ‘single greatest prize in history’ in 1938 – the world’s biggest oilfiled, Ghawar. Its merger with Gulf in 1984 was the biggest ever at the time and was followed up in 2001 by the merger with Texaco (which was born out of the post 1901 Texas oil boom and was never part of Standard Oil).
BP born in Iran. BP’s history dates back to 1901 when William Knox D’Arcy won a large Iranian concession. He found the first commercial oil in the Middle East in 1908 and formed the Anglo-Persian Oil Company (later to become Anglo-Iranian, then BP). After losing the bulk of its Iranian production to nationalisation in 1953 BP’s next major success was in the North Sea in the 1960s. As discussed above it has caused seismic shifts in the industry with its trailblazing M&A over the last ten years; the merger with Amoco in 1998, acquisition of Arco and Castrol in 2000 and then entry into Russia with 50% of TNK-BP in 2003.
Royal Dutch Shell was formed with the merger between the British Shell (created as an oil shipping company in 1878) and Holland’s Dutch Royal Dutch (created in 1890 following an oil discovery in the Dutch East Indies) in 1907. Together they were able to fight on equal terms with the international growth aspirations of Standard Oil. RD/Shell did not get involved with the mega-mergers, although it did buy Enterprise Oil (the UK’s largest E&P at the time) and Pennzoil-Quaker State (a US motor oil business and descendent of Standard Oil) in 2000.
ConocoPhillips can trace its history back to Standard Oil via Continental Oil, but is actually more dominated by its Phillips legacy. Phillips was built on a string of discoveries in Oklahoma starting in 1905 by Frank Phillips. The merger between Conoco and Phillips was agreed in 2001.
Total was founded by the French government in 1924 and gained its first major overseas production via a share in the Iraq Petroleum Consortium (IPC). Its acquisition of Fina in 1998 was seen as motivated by a desire for downstream assets rather than cost synergy potential, and was followed by the acquisition of rival French oil firm Elf, in 1999.
The term ‘supermajors’ usually refers to the six largest IOCs – Exxon, Chevron, RD/Shell, BP, ConocoPhillips and Total.
The other two IOCs in the previous figure are StatoilHydro and Eni:
Statoil and Norsk Hydro announced in 2006 that they would merge their oilfield operations to form StatoilHydro. Norsk Hydro started off as a Norwegian fertilizer company in 1905, whereas Statoil was established as a Norwegian state oil company in 1972 to develop the Norwegian North Sea. The merger was completed late in 2007 and in theory gives the company enough scale to compete for all but the world’s largest projects.
Eni (Ente Nazionale Idrocarburi) was founded by the Italian state in 1953 and was led for many years by the charismatic Enrico Mattei, who in the 1950s was a vocal critic of the Seven Sisters. Eni was also involved in the M&A activity of the late 1990s, and was reported to be in discussions with Elf until Total placed the winning bid. Eni bought the UK E&P companies British Borneo (2000), Lasmo (2001) and most recently, had its bid accepted by the directors of Burren Energy (2007).
The term ‘supermajors’
usually refers to the six
largest IOCs – Exxon,
Chevron, RD/Shell, BP,
ConocoPhillips and Total.
7 January 2008 Integrated Oils Oil & Gas for Beginners
Deutsche Bank AG/London Page 17
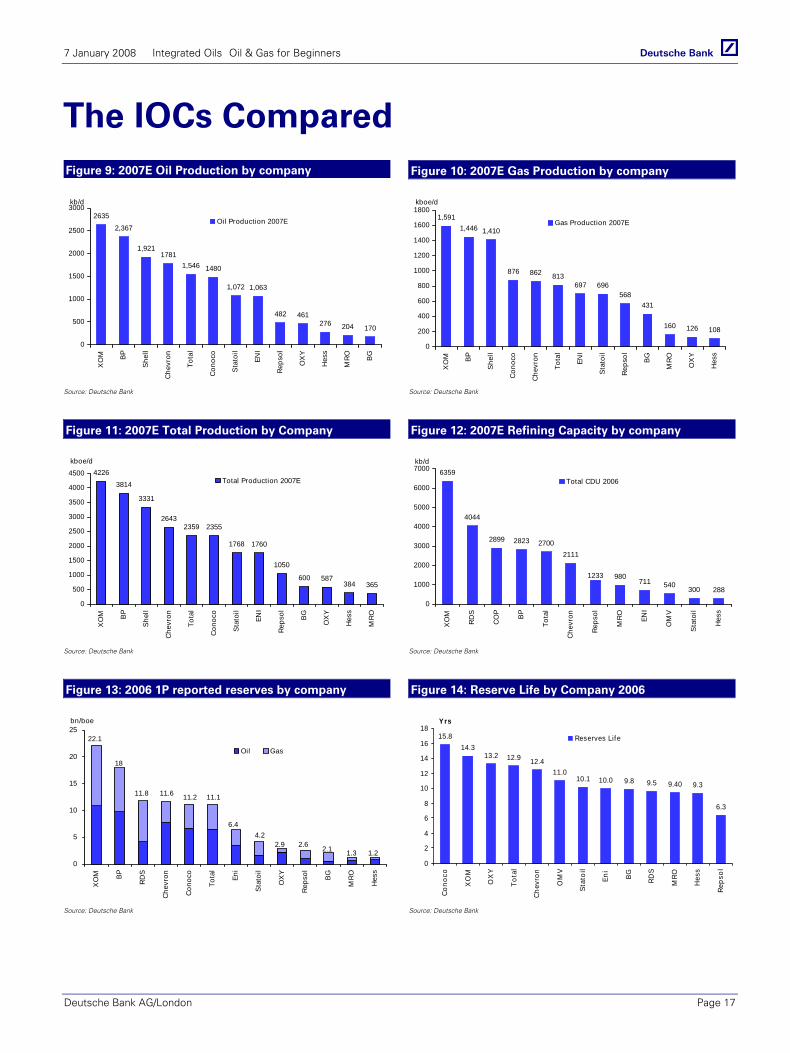
The IOCs Compared Figure 9: 2007E Oil Production by company Figure 10: 2007E Gas Production by company
2635
2,367
1,9211781
1,546 1480
1,072 1,063
482 461276 204 170
0
500
1000
1500
2000
2500
3000
XO
M BP
She
ll
Che
vron
Tota
l
Con
oco
Sta
toil
ENI
Rep
sol
OX
Y
Hes
s
MR
O
BG
kb/d
Oil Production 2007E
1,591
1,446 1,410
876 862 813697 696
568431
160 126 108
0
200
400
600
800
1000
1200
1400
1600
1800
XO
M BP
She
ll
Con
oco
Che
vron
Tota
l
ENI
Sta
toil
Rep
sol
BG
MR
O
OX
Y
Hes
s
kboe/d
Gas Production 2007E
Source: Deutsche Bank Source: Deutsche Bank
Figure 11: 2007E Total Production by Company Figure 12: 2007E Refining Capacity by company
4226
3814
3331
26432359 2355
1768 1760
1050
600 587384 365
0
500
1000
1500
2000
2500
3000
3500
4000
4500
XO
M BP
She
ll
Che
vron
Tota
l
Con
oco
Sta
toil
ENI
Rep
sol
BG
OX
Y
Hes
s
MR
O
kboe/d
Total Production 2007E
6359
4044
2899 2823 27002111
980711 540 300 288
1233
0
1000
2000
3000
4000
5000
6000
7000
XO
M
RD
S
CO
P
BP
Tota
l
Che
vron
Rep
sol
MR
O
ENI
OM
V
Sta
toil
Hes
s
kb/d
Total CDU 2006
Source: Deutsche Bank Source: Deutsche Bank
Figure 13: 2006 1P reported reserves by company Figure 14: Reserve Life by Company 2006
0
5
10
15
20
25
XO
M BP
RD
S
Che
vron
Con
oco
Tota
l
Eni
Sta
toil
OX
Y
Rep
sol
BG
MR
O
Hes
s
bn/boe
Oil Gas
22.1
18
11.8 11.6 11.2 11.1
6.44.2
2.9 2.6 2.1 1.3 1.2
15.8
14.313.2 12.9 12.4
11.010.1 10.0 9.8 9.5 9.40 9.3
6.3
0
2
4
6
8
10
12
14
16
18
Cono
co
XO
M
OX
Y
Tota
l
Chev
ron
OM
V
Stat
oil
Eni
BG RDS
MRO
Hes
s
Reps
olYrs
Reserves Life
Source: Deutsche Bank Source: Deutsche Bank
7 January 2008 Integrated Oils Oil & Gas for Beginners
Page 18 Deutsche Bank AG/London
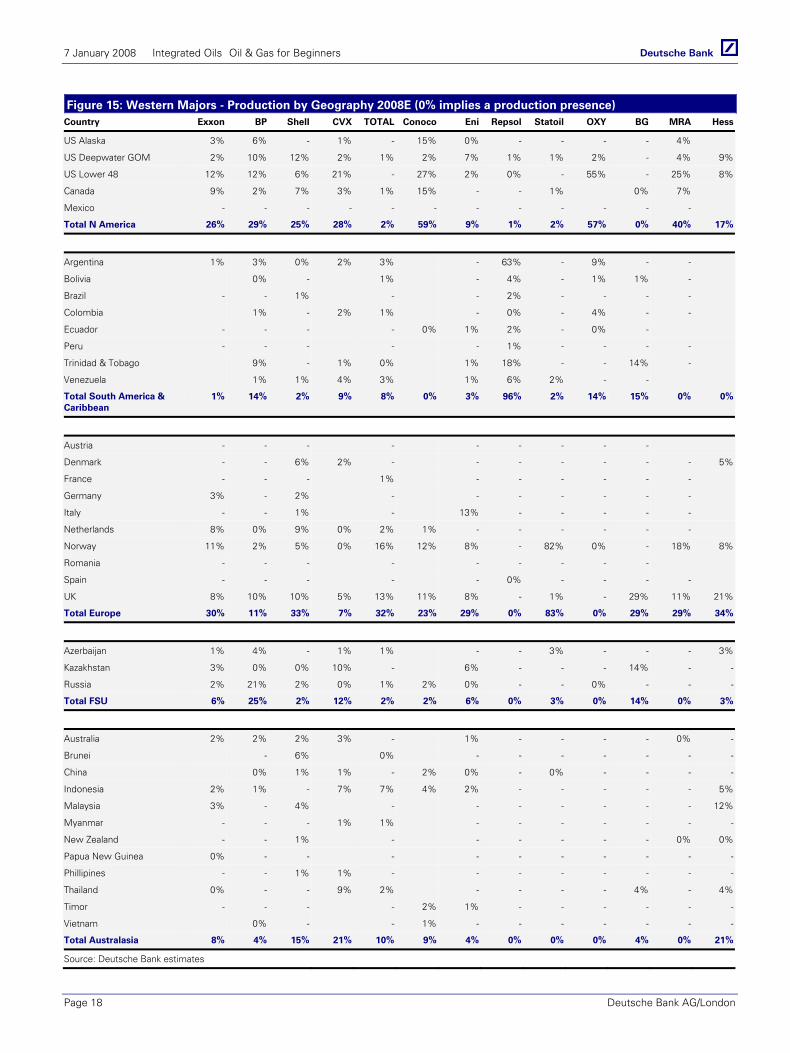
Figure 15: Western Majors - Production by Geography 2008E (0% implies a production presence) Country Exxon BP Shell CVX TOTAL Conoco Eni Repsol Statoil OXY BG MRA Hess
US Alaska 3% 6% - 1% - 15% 0% - - - - 4%
US Deepwater GOM 2% 10% 12% 2% 1% 2% 7% 1% 1% 2% - 4% 9%
US Lower 48 12% 12% 6% 21% - 27% 2% 0% - 55% - 25% 8%
Canada 9% 2% 7% 3% 1% 15% - - 1% 0% 7%
Mexico - - - - - - - - - - - -
Total N America 26% 29% 25% 28% 2% 59% 9% 1% 2% 57% 0% 40% 17%
Argentina 1% 3% 0% 2% 3% - 63% - 9% - -
Bolivia 0% - 1% - 4% - 1% 1% -
Brazil - - 1% - - 2% - - - -
Colombia 1% - 2% 1% - 0% - 4% - -
Ecuador - - - - 0% 1% 2% - 0% -
Peru - - - - - 1% - - - -
Trinidad & Tobago 9% - 1% 0% 1% 18% - - 14% -
Venezuela 1% 1% 4% 3% 1% 6% 2% - -
Total South America & Caribbean
1% 14% 2% 9% 8% 0% 3% 96% 2% 14% 15% 0% 0%
Austria - - - - - - - - -
Denmark - - 6% 2% - - - - - - - 5%
France - - - 1% - - - - - -
Germany 3% - 2% - - - - - - -
Italy - - 1% - 13% - - - - -
Netherlands 8% 0% 9% 0% 2% 1% - - - - - -
Norway 11% 2% 5% 0% 16% 12% 8% - 82% 0% - 18% 8%
Romania - - - - - - - - -
Spain - - - - - 0% - - - -
UK 8% 10% 10% 5% 13% 11% 8% - 1% - 29% 11% 21%
Total Europe 30% 11% 33% 7% 32% 23% 29% 0% 83% 0% 29% 29% 34%
Azerbaijan 1% 4% - 1% 1% - - 3% - - - 3%
Kazakhstan 3% 0% 0% 10% - 6% - - - 14% - -
Russia 2% 21% 2% 0% 1% 2% 0% - - 0% - - -
Total FSU 6% 25% 2% 12% 2% 2% 6% 0% 3% 0% 14% 0% 3%
Australia 2% 2% 2% 3% - 1% - - - - 0% -
Brunei - 6% 0% - - - - - - -
China 0% 1% 1% - 2% 0% - 0% - - - -
Indonesia 2% 1% - 7% 7% 4% 2% - - - - - 5%
Malaysia 3% - 4% - - - - - - - 12%
Myanmar - - - 1% 1% - - - - - - -
New Zealand - - 1% - - - - - - 0% 0%
Papua New Guinea 0% - - - - - - - - - -
Phillipines - - 1% 1% - - - - - - - -
Thailand 0% - - 9% 2% - - - - 4% - 4%
Timor - - - - 2% 1% - - - - - -
Vietnam 0% - - 1% - - - - - - -
Total Australasia 8% 4% 15% 21% 10% 9% 4% 0% 0% 0% 4% 0% 21%
Source: Deutsche Bank estimates
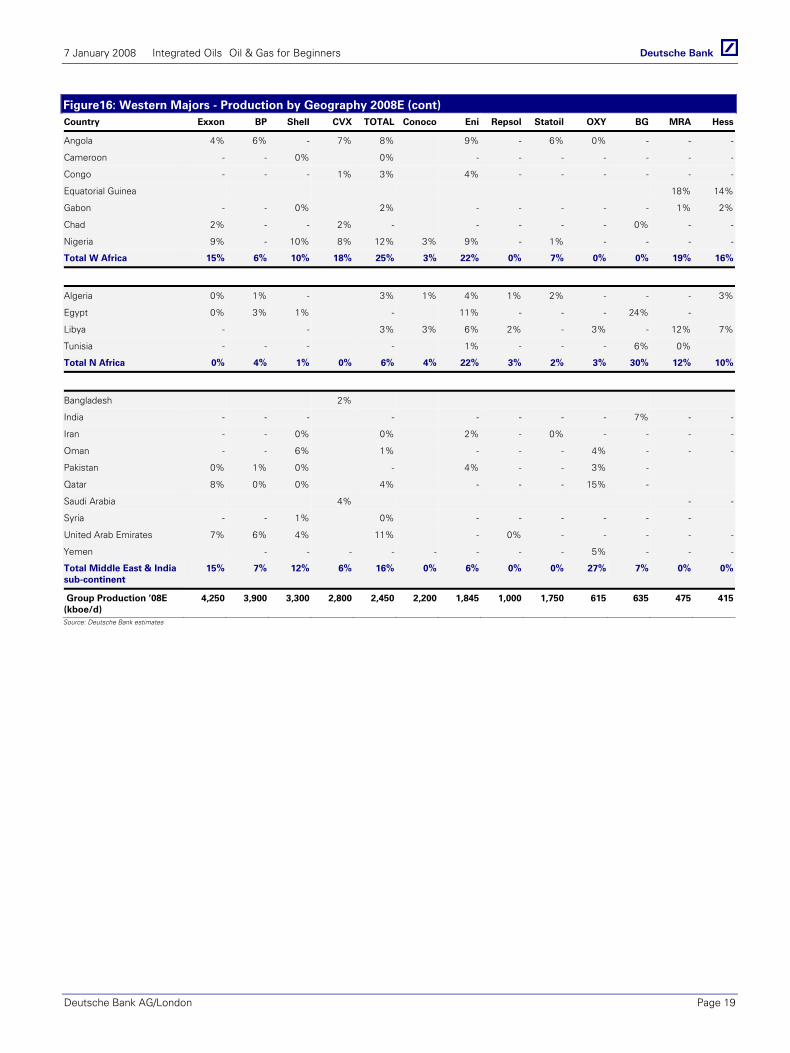
7 January 2008 Integrated Oils Oil & Gas for Beginners
Deutsche Bank AG/London Page 19
Figure16: Western Majors - Production by Geography 2008E (cont) Country Exxon BP Shell CVX TOTAL Conoco Eni Repsol Statoil OXY BG MRA Hess
Angola 4% 6% - 7% 8% 9% - 6% 0% - - -
Cameroon - - 0% 0% - - - - - - -
Congo - - - 1% 3% 4% - - - - - -
Equatorial Guinea 18% 14%
Gabon - - 0% 2% - - - - - 1% 2%
Chad 2% - - 2% - - - - - 0% - -
Nigeria 9% - 10% 8% 12% 3% 9% - 1% - - - -
Total W Africa 15% 6% 10% 18% 25% 3% 22% 0% 7% 0% 0% 19% 16%
Algeria 0% 1% - 3% 1% 4% 1% 2% - - - 3%
Egypt 0% 3% 1% - 11% - - - 24% -
Libya - - 3% 3% 6% 2% - 3% - 12% 7%
Tunisia - - - - 1% - - - 6% 0%
Total N Africa 0% 4% 1% 0% 6% 4% 22% 3% 2% 3% 30% 12% 10%
Bangladesh 2%
India - - - - - - - - 7% - -
Iran - - 0% 0% 2% - 0% - - - -
Oman - - 6% 1% - - - 4% - - -
Pakistan 0% 1% 0% - 4% - - 3% -
Qatar 8% 0% 0% 4% - - - 15% -
Saudi Arabia 4% - -
Syria - - 1% 0% - - - - - -
United Arab Emirates 7% 6% 4% 11% - 0% - - - - -
Yemen - - - - - - - - 5% - - -
Total Middle East & India sub-continent
15% 7% 12% 6% 16% 0% 6% 0% 0% 27% 7% 0% 0%
Group Production ’08E (kboe/d)
4,250 3,900 3,300 2,800 2,450 2,200 1,845 1,000 1,750 615 635 475 415
Source: Deutsche Bank estimates
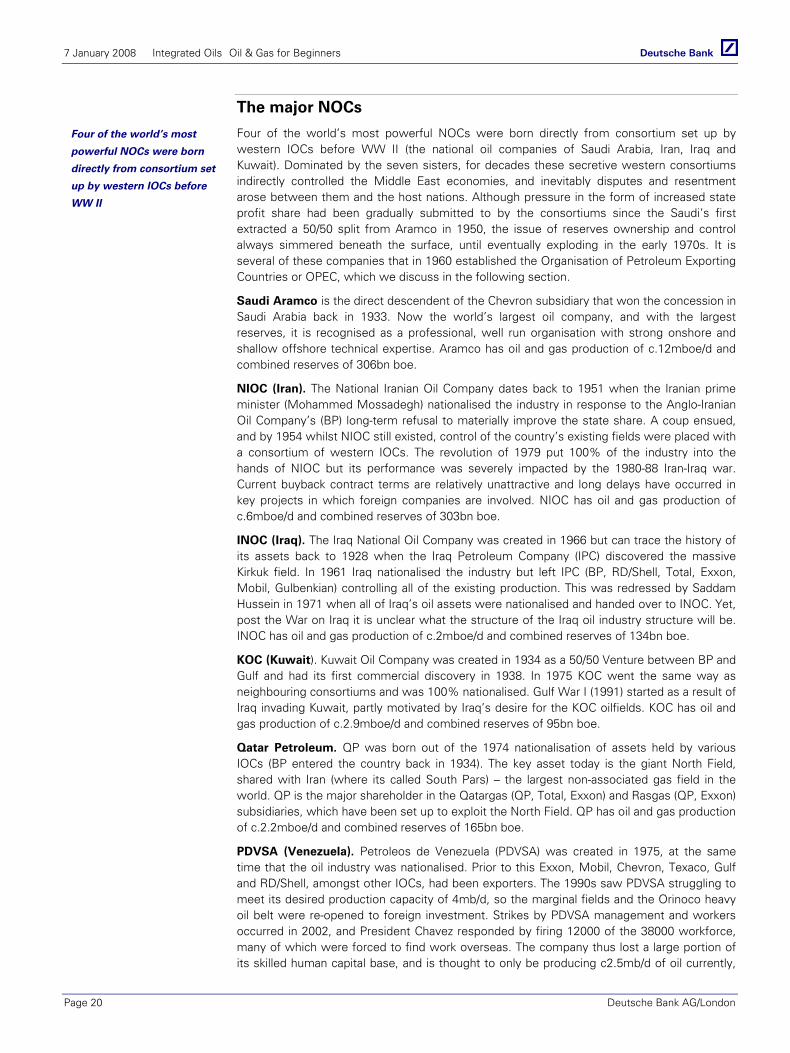
7 January 2008 Integrated Oils Oil & Gas for Beginners
Page 20 Deutsche Bank AG/London
The major NOCs
Four of the world’s most powerful NOCs were born directly from consortium set up by western IOCs before WW II (the national oil companies of Saudi Arabia, Iran, Iraq and Kuwait). Dominated by the seven sisters, for decades these secretive western consortiums indirectly controlled the Middle East economies, and inevitably disputes and resentment arose between them and the host nations. Although pressure in the form of increased state profit share had been gradually submitted to by the consortiums since the Saudi’s first extracted a 50/50 split from Aramco in 1950, the issue of reserves ownership and control always simmered beneath the surface, until eventually exploding in the early 1970s. It is several of these companies that in 1960 established the Organisation of Petroleum Exporting Countries or OPEC, which we discuss in the following section.
Saudi Aramco is the direct descendent of the Chevron subsidiary that won the concession in Saudi Arabia back in 1933. Now the world’s largest oil company, and with the largest reserves, it is recognised as a professional, well run organisation with strong onshore and shallow offshore technical expertise. Aramco has oil and gas production of c.12mboe/d and combined reserves of 306bn boe.
NIOC (Iran). The National Iranian Oil Company dates back to 1951 when the Iranian prime minister (Mohammed Mossadegh) nationalised the industry in response to the Anglo-Iranian Oil Company’s (BP) long-term refusal to materially improve the state share. A coup ensued, and by 1954 whilst NIOC still existed, control of the country’s existing fields were placed with a consortium of western IOCs. The revolution of 1979 put 100% of the industry into the hands of NIOC but its performance was severely impacted by the 1980-88 Iran-Iraq war. Current buyback contract terms are relatively unattractive and long delays have occurred in key projects in which foreign companies are involved. NIOC has oil and gas production of c.6mboe/d and combined reserves of 303bn boe.
INOC (Iraq). The Iraq National Oil Company was created in 1966 but can trace the history of its assets back to 1928 when the Iraq Petroleum Company (IPC) discovered the massive Kirkuk field. In 1961 Iraq nationalised the industry but left IPC (BP, RD/Shell, Total, Exxon, Mobil, Gulbenkian) controlling all of the existing production. This was redressed by Saddam Hussein in 1971 when all of Iraq’s oil assets were nationalised and handed over to INOC. Yet, post the War on Iraq it is unclear what the structure of the Iraq oil industry structure will be. INOC has oil and gas production of c.2mboe/d and combined reserves of 134bn boe.
KOC (Kuwait). Kuwait Oil Company was created in 1934 as a 50/50 Venture between BP and Gulf and had its first commercial discovery in 1938. In 1975 KOC went the same way as neighbouring consortiums and was 100% nationalised. Gulf War I (1991) started as a result of Iraq invading Kuwait, partly motivated by Iraq’s desire for the KOC oilfields. KOC has oil and gas production of c.2.9mboe/d and combined reserves of 95bn boe.
Qatar Petroleum. QP was born out of the 1974 nationalisation of assets held by various IOCs (BP entered the country back in 1934). The key asset today is the giant North Field, shared with Iran (where its called South Pars) – the largest non-associated gas field in the world. QP is the major shareholder in the Qatargas (QP, Total, Exxon) and Rasgas (QP, Exxon) subsidiaries, which have been set up to exploit the North Field. QP has oil and gas production of c.2.2mboe/d and combined reserves of 165bn boe.
PDVSA (Venezuela). Petroleos de Venezuela (PDVSA) was created in 1975, at the same time that the oil industry was nationalised. Prior to this Exxon, Mobil, Chevron, Texaco, Gulf and RD/Shell, amongst other IOCs, had been exporters. The 1990s saw PDVSA struggling to meet its desired production capacity of 4mb/d, so the marginal fields and the Orinoco heavy oil belt were re-opened to foreign investment. Strikes by PDVSA management and workers occurred in 2002, and President Chavez responded by firing 12000 of the 38000 workforce, many of which were forced to find work overseas. The company thus lost a large portion of its skilled human capital base, and is thought to only be producing c2.5mb/d of oil currently,
Four of the world’s most
powerful NOCs were born
directly from consortium set
up by western IOCs before
WW II
7 January 2008 Integrated Oils Oil & Gas for Beginners
Deutsche Bank AG/London Page 21
versus a claimed capacity of 3.2mb/d. PDVSA has oil and gas production of c.2.8mboe/d and combined reserves of 105bn boe, although this figure may rise once re-assessment of the heavy oil reserves is complete.
Gazprom (Russia) can trace its origins back to 1943 when a separate Soviet gas industry was created (i.e. distinct from oil). Russia has the highest gas reserves of any country. Mikhail Gorbachev’s reforms provided the catalyst for the state to list 40% of the company in 1994, but for much of the rest of the 1990s Gazprom was accused of widespread corruption. Under the Putin-appointed Alexei Miller (2001) Gazprom has been successfully reformed; it has a monopoly on Russian gas exports and has emerged as a major world power in the global oil and gas industry. Gazprom has oil and gas production of c.9.2mboe/d and combined reserves of 171bn boe.
Petrobras (Brazil) is a Brazilian integrated oil company founded in 1953, with 56% of its shares owned by the government. It has a reputation for being a professional deepwater field developer and operator, despite a disaster in 2001 when the Petrobras 36 Oil Platform (the world’s largest platform at the time) exploded and sank. Petrobras currently produces c2mb/d and has reserves of 11.5bn boe.
Pemex (Mexico) can trace its history back to the country’s nationalisation of the industry in 1938. It is state owned and has a monopoly over all Mexican upstream and downstream operations. Pemex is hamstrung by the fact that much of its revenues go direct to the government and the technology and skills that are required to both slow down field decline and explore deeper water requires foreign company participation, which is prohibited under Mexican law. Pemex has oil and gas production of c.3mb/d and has combined reserves of 17 bn boe.
Petronas (Malaysia) was created in 1974 by the Malaysian government and remains state owned. It started LNG exports from Sarawak in 1983 (with RD/Shell) and has expanded its LNG production since that date, and also acquired interests overseas. Petronas has oil and gas production of c.1.7mb/d and reserves of 26bn boe.
CNPC (P.R.C.) is the P.R.C.’s state owned oil and gas company, was created in 1988 and is the descendent of the Fuel Ministry created in 1949. It is the second largest company in the world by number of employees. In 1999 its major domestic assets were listed in a separate company, Petrochina. CNPC has been very active in acquiring acreage and assets internationally over the last decade, including in Venezuela, Sudan, Peru, Turkmenistan, Algeria and Kazakhstan. CNPC has oil and gas production of 3.6mb/d and reserves of 32bn boe.
The figure overleaf depicts the family tree of the major NOCs, illustrating clearly the wave of nationalisations that occurred post 1970.
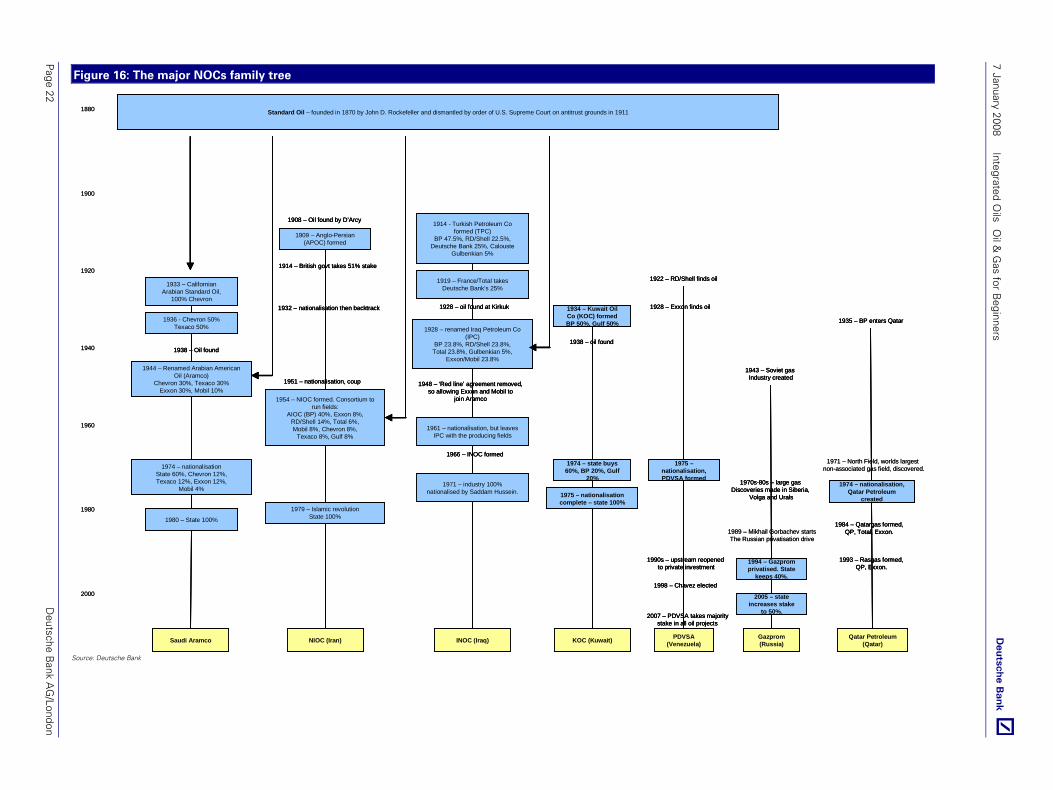
7 January 2008 Integrated O
ils O
il & G
as for Beginners
Page 22
Deutsche B
ank AG
/London
Figure 16: The major NOCs family tree
1900
1920
1940
1960
1980
2000
1880 Standard Oil – founded in 1870 by John D. Rockefeller and dismantled by order of U.S. Supreme Court on antitrust grounds in 1911
Saudi Aramco
1933 – Californian Arabian Standard Oil,
100% Chevron
1936 - Chevron 50%Texaco 50%
1944 – Renamed Arabian American Oil (Aramco)
Chevron 30%, Texaco 30%Exxon 30%, Mobil 10%
1974 – nationalisationState 60%, Chevron 12%,Texaco 12%, Exxon 12%,
Mobil 4%
1980 – State 100%
1938 – Oil found
INOC (Iraq)
1914 - Turkish Petroleum Co formed (TPC)
BP 47.5%, RD/Shell 22.5%,Deutsche Bank 25%, Calouste
Gulbenkian 5%
1919 – France/Total takes Deutsche Bank’s 25%
1928 – renamed Iraq Petroleum Co (IPC)
BP 23.8%, RD/Shell 23.8%,Total 23.8%, Gulbenkian 5%,
Exxon/Mobil 23.8%
1928 – oil found at Kirkuk
1948 – ‘Red line’ agreement removed,so allowing Exxon and Mobil to
join Aramco
1961 – nationalisation, but leaves IPC with the producing fields
1971 – industry 100% nationalised by Saddam Hussein.
1966 – INOC formed
1909 – Anglo-Persian (APOC) formed
NIOC (Iran)
1908 – Oil found by D’Arcy
1954 – NIOC formed. Consortium to run fields:
AIOC (BP) 40%, Exxon 8%,RD/Shell 14%, Total 6%,Mobil 8%, Chevron 8%,
Texaco 8%, Gulf 8%
1979 – Islamic revolutionState 100%
1914 – British govt takes 51% stake
1932 – nationalisation then backtrack
1951 – nationalisation, coup
KOC (Kuwait)
1934 – Kuwait Oil Co (KOC) formedBP 50%, Gulf 50%
1938 – oil found
1974 – state buys 60%, BP 20%, Gulf
20%
1975 – nationalisation complete – state 100%
PDVSA (Venezuela)
1975 –nationalisation, PDVSA formed
1922 – RD/Shell finds oil
1928 – Exxon finds oil
1990s – upstream reopened to private investment
2007 – PDVSA takes majoritystake in all oil projects
1998 – Chavez elected
1989 – Mikhail Gorbachev startsThe Russian privatisation drive
Gazprom (Russia)
1994 – Gazprom privatised. State
keeps 40%.
2005 – state increases stake
to 50%.
1943 – Soviet gas Industry created
1970s-80s – large gas Discoveries made in Siberia,
Volga and Urals
1971 – North Field, worlds largest non-associated gas field, discovered.
Qatar Petroleum (Qatar)
1974 – nationalisation, Qatar Petroleum
created
1935 – BP enters Qatar
1993 – Rasgas formed,QP, Exxon.
1984 – Qatargas formed,QP, Total, Exxon.
1900
1920
1940
1960
1980
2000
1880 Standard Oil – founded in 1870 by John D. Rockefeller and dismantled by order of U.S. Supreme Court on antitrust grounds in 1911
Saudi Aramco
1933 – Californian Arabian Standard Oil,
100% Chevron
1936 - Chevron 50%Texaco 50%
1944 – Renamed Arabian American Oil (Aramco)
Chevron 30%, Texaco 30%Exxon 30%, Mobil 10%
1974 – nationalisationState 60%, Chevron 12%,Texaco 12%, Exxon 12%,
Mobil 4%
1980 – State 100%
1938 – Oil found
Saudi Aramco
1933 – Californian Arabian Standard Oil,
100% Chevron
1936 - Chevron 50%Texaco 50%
1944 – Renamed Arabian American Oil (Aramco)
Chevron 30%, Texaco 30%Exxon 30%, Mobil 10%
1974 – nationalisationState 60%, Chevron 12%,Texaco 12%, Exxon 12%,
Mobil 4%
1980 – State 100%
1938 – Oil found
INOC (Iraq)
1914 - Turkish Petroleum Co formed (TPC)
BP 47.5%, RD/Shell 22.5%,Deutsche Bank 25%, Calouste
Gulbenkian 5%
1919 – France/Total takes Deutsche Bank’s 25%
1928 – renamed Iraq Petroleum Co (IPC)
BP 23.8%, RD/Shell 23.8%,Total 23.8%, Gulbenkian 5%,
Exxon/Mobil 23.8%
1928 – oil found at Kirkuk
1948 – ‘Red line’ agreement removed,so allowing Exxon and Mobil to
join Aramco
1961 – nationalisation, but leaves IPC with the producing fields
1971 – industry 100% nationalised by Saddam Hussein.
1966 – INOC formed
1909 – Anglo-Persian (APOC) formed
NIOC (Iran)
1908 – Oil found by D’Arcy
1954 – NIOC formed. Consortium to run fields:
AIOC (BP) 40%, Exxon 8%,RD/Shell 14%, Total 6%,Mobil 8%, Chevron 8%,
Texaco 8%, Gulf 8%
1979 – Islamic revolutionState 100%
1914 – British govt takes 51% stake
1932 – nationalisation then backtrack
1951 – nationalisation, coup
KOC (Kuwait)
1934 – Kuwait Oil Co (KOC) formedBP 50%, Gulf 50%
1938 – oil found
1974 – state buys 60%, BP 20%, Gulf
20%
1975 – nationalisation complete – state 100%
KOC (Kuwait)
1934 – Kuwait Oil Co (KOC) formedBP 50%, Gulf 50%
1938 – oil found
1974 – state buys 60%, BP 20%, Gulf
20%
1975 – nationalisation complete – state 100%
PDVSA (Venezuela)
1975 –nationalisation, PDVSA formed
1922 – RD/Shell finds oil
1928 – Exxon finds oil
1990s – upstream reopened to private investment
2007 – PDVSA takes majoritystake in all oil projects
1998 – Chavez elected
PDVSA (Venezuela)
1975 –nationalisation, PDVSA formed
1922 – RD/Shell finds oil
1928 – Exxon finds oil
1990s – upstream reopened to private investment
2007 – PDVSA takes majoritystake in all oil projects
1998 – Chavez elected
1989 – Mikhail Gorbachev startsThe Russian privatisation drive
Gazprom (Russia)
1994 – Gazprom privatised. State
keeps 40%.
2005 – state increases stake
to 50%.
1943 – Soviet gas Industry created
1970s-80s – large gas Discoveries made in Siberia,
Volga and Urals
Gazprom (Russia)
1994 – Gazprom privatised. State
keeps 40%.
2005 – state increases stake
to 50%.
1943 – Soviet gas Industry created
1970s-80s – large gas Discoveries made in Siberia,
Volga and Urals
1971 – North Field, worlds largest non-associated gas field, discovered.
Qatar Petroleum (Qatar)
1974 – nationalisation, Qatar Petroleum
created
1935 – BP enters Qatar
1993 – Rasgas formed,QP, Exxon.
1984 – Qatargas formed,QP, Total, Exxon.
Qatar Petroleum (Qatar)
1974 – nationalisation, Qatar Petroleum
created
1935 – BP enters Qatar
1993 – Rasgas formed,QP, Exxon.
1984 – Qatargas formed,QP, Total, Exxon.
Source: Deutsche Bank
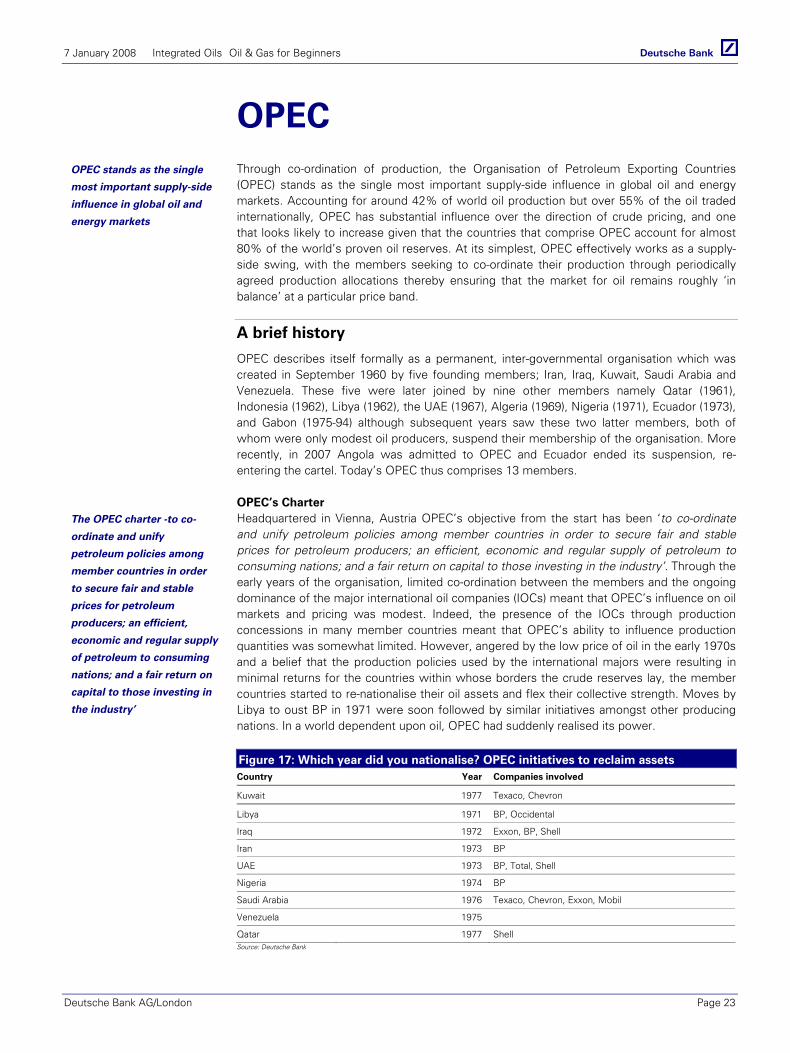
7 January 2008 Integrated Oils Oil & Gas for Beginners
Deutsche Bank AG/London Page 23
OPEC Through co-ordination of production, the Organisation of Petroleum Exporting Countries (OPEC) stands as the single most important supply-side influence in global oil and energy markets. Accounting for around 42% of world oil production but over 55% of the oil traded internationally, OPEC has substantial influence over the direction of crude pricing, and one that looks likely to increase given that the countries that comprise OPEC account for almost 80% of the world’s proven oil reserves. At its simplest, OPEC effectively works as a supply-side swing, with the members seeking to co-ordinate their production through periodically agreed production allocations thereby ensuring that the market for oil remains roughly ‘in balance’ at a particular price band.
A brief history
OPEC describes itself formally as a permanent, inter-governmental organisation which was created in September 1960 by five founding members; Iran, Iraq, Kuwait, Saudi Arabia and Venezuela. These five were later joined by nine other members namely Qatar (1961), Indonesia (1962), Libya (1962), the UAE (1967), Algeria (1969), Nigeria (1971), Ecuador (1973), and Gabon (1975-94) although subsequent years saw these two latter members, both of whom were only modest oil producers, suspend their membership of the organisation. More recently, in 2007 Angola was admitted to OPEC and Ecuador ended its suspension, re-entering the cartel. Today’s OPEC thus comprises 13 members.
OPEC’s Charter Headquartered in Vienna, Austria OPEC’s objective from the start has been ‘to co-ordinate and unify petroleum policies among member countries in order to secure fair and stable prices for petroleum producers; an efficient, economic and regular supply of petroleum to consuming nations; and a fair return on capital to those investing in the industry’. Through the early years of the organisation, limited co-ordination between the members and the ongoing dominance of the major international oil companies (IOCs) meant that OPEC’s influence on oil markets and pricing was modest. Indeed, the presence of the IOCs through production concessions in many member countries meant that OPEC’s ability to influence production quantities was somewhat limited. However, angered by the low price of oil in the early 1970s and a belief that the production policies used by the international majors were resulting in minimal returns for the countries within whose borders the crude reserves lay, the member countries started to re-nationalise their oil assets and flex their collective strength. Moves by Libya to oust BP in 1971 were soon followed by similar initiatives amongst other producing nations. In a world dependent upon oil, OPEC had suddenly realised its power.
Figure 17: Which year did you nationalise? OPEC initiatives to reclaim assets Country Year Companies involved
Kuwait 1977 Texaco, Chevron
Libya 1971 BP, Occidental
Iraq 1972 Exxon, BP, Shell
Iran 1973 BP
UAE 1973 BP, Total, Shell
Nigeria 1974 BP
Saudi Arabia 1976 Texaco, Chevron, Exxon, Mobil
Venezuela 1975
Qatar 1977 Shell Source: Deutsche Bank
OPEC stands as the single
most important supply-side
influence in global oil and
energy markets
The OPEC charter -to co-
ordinate and unify
petroleum policies among
member countries in order
to secure fair and stable
prices for petroleum
producers; an efficient,
economic and regular supply
of petroleum to consuming
nations; and a fair return on
capital to those investing in
the industry’
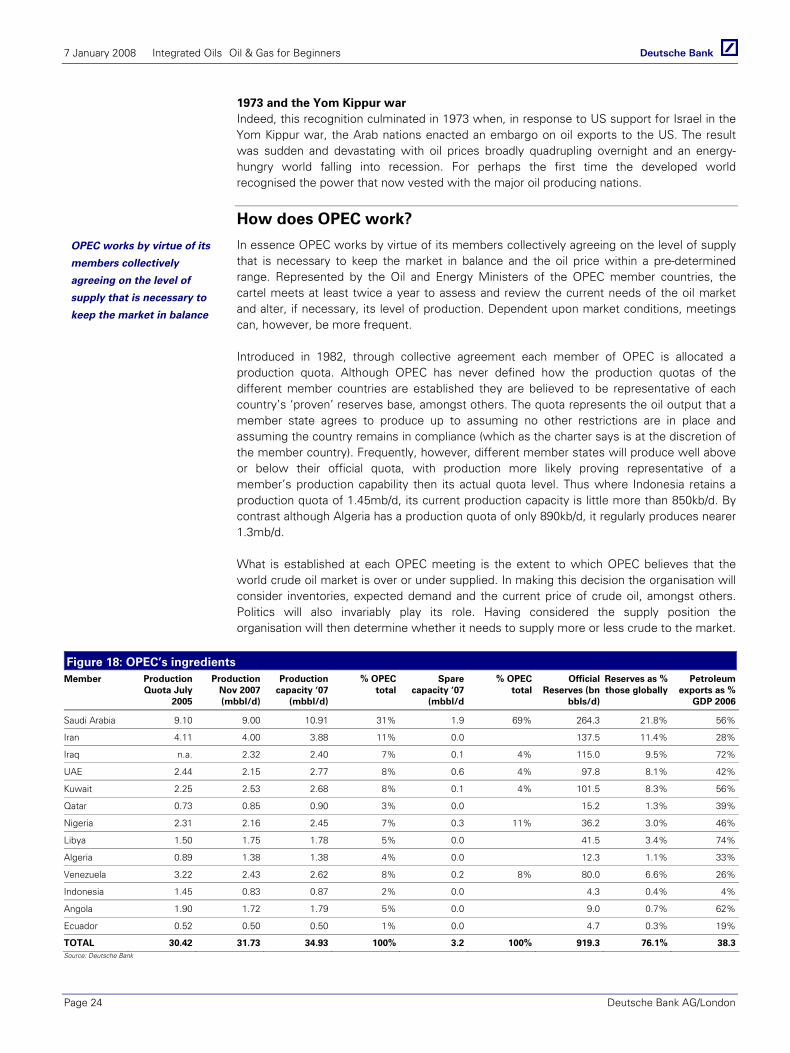
7 January 2008 Integrated Oils Oil & Gas for Beginners
Page 24 Deutsche Bank AG/London
1973 and the Yom Kippur war Indeed, this recognition culminated in 1973 when, in response to US support for Israel in the Yom Kippur war, the Arab nations enacted an embargo on oil exports to the US. The result was sudden and devastating with oil prices broadly quadrupling overnight and an energy-hungry world falling into recession. For perhaps the first time the developed world recognised the power that now vested with the major oil producing nations.
How does OPEC work?
In essence OPEC works by virtue of its members collectively agreeing on the level of supply that is necessary to keep the market in balance and the oil price within a pre-determined range. Represented by the Oil and Energy Ministers of the OPEC member countries, the cartel meets at least twice a year to assess and review the current needs of the oil market and alter, if necessary, its level of production. Dependent upon market conditions, meetings can, however, be more frequent.
Introduced in 1982, through collective agreement each member of OPEC is allocated a production quota. Although OPEC has never defined how the production quotas of the different member countries are established they are believed to be representative of each country’s ‘proven’ reserves base, amongst others. The quota represents the oil output that a member state agrees to produce up to assuming no other restrictions are in place and assuming the country remains in compliance (which as the charter says is at the discretion of the member country). Frequently, however, different member states will produce well above or below their official quota, with production more likely proving representative of a member’s production capability then its actual quota level. Thus where Indonesia retains a production quota of 1.45mb/d, its current production capacity is little more than 850kb/d. By contrast although Algeria has a production quota of only 890kb/d, it regularly produces nearer 1.3mb/d.
What is established at each OPEC meeting is the extent to which OPEC believes that the world crude oil market is over or under supplied. In making this decision the organisation will consider inventories, expected demand and the current price of crude oil, amongst others. Politics will also invariably play its role. Having considered the supply position the organisation will then determine whether it needs to supply more or less crude to the market.
Figure 18: OPEC’s ingredients Member Production
Quota July 2005
Production Nov 2007 (mbbl/d)
Production capacity ‘07
(mbbl/d)
% OPEC total
Spare capacity ‘07
(mbbl/d
% OPEC total
Official Reserves (bn
bbls/d)
Reserves as % those globally
Petroleum exports as %
GDP 2006
Saudi Arabia 9.10 9.00 10.91 31% 1.9 69% 264.3 21.8% 56%
Iran 4.11 4.00 3.88 11% 0.0 137.5 11.4% 28%
Iraq n.a. 2.32 2.40 7% 0.1 4% 115.0 9.5% 72%
UAE 2.44 2.15 2.77 8% 0.6 4% 97.8 8.1% 42%
Kuwait 2.25 2.53 2.68 8% 0.1 4% 101.5 8.3% 56%
Qatar 0.73 0.85 0.90 3% 0.0 15.2 1.3% 39%
Nigeria 2.31 2.16 2.45 7% 0.3 11% 36.2 3.0% 46%
Libya 1.50 1.75 1.78 5% 0.0 41.5 3.4% 74%
Algeria 0.89 1.38 1.38 4% 0.0 12.3 1.1% 33%
Venezuela 3.22 2.43 2.62 8% 0.2 8% 80.0 6.6% 26%
Indonesia 1.45 0.83 0.87 2% 0.0 4.3 0.4% 4%
Angola 1.90 1.72 1.79 5% 0.0 9.0 0.7% 62%
Ecuador 0.52 0.50 0.50 1% 0.0 4.7 0.3% 19%
TOTAL 30.42 31.73 34.93 100% 3.2 100% 919.3 76.1% 38.3Source: Deutsche Bank
OPEC works by virtue of its
members collectively
agreeing on the level of
supply that is necessary to
keep the market in balance
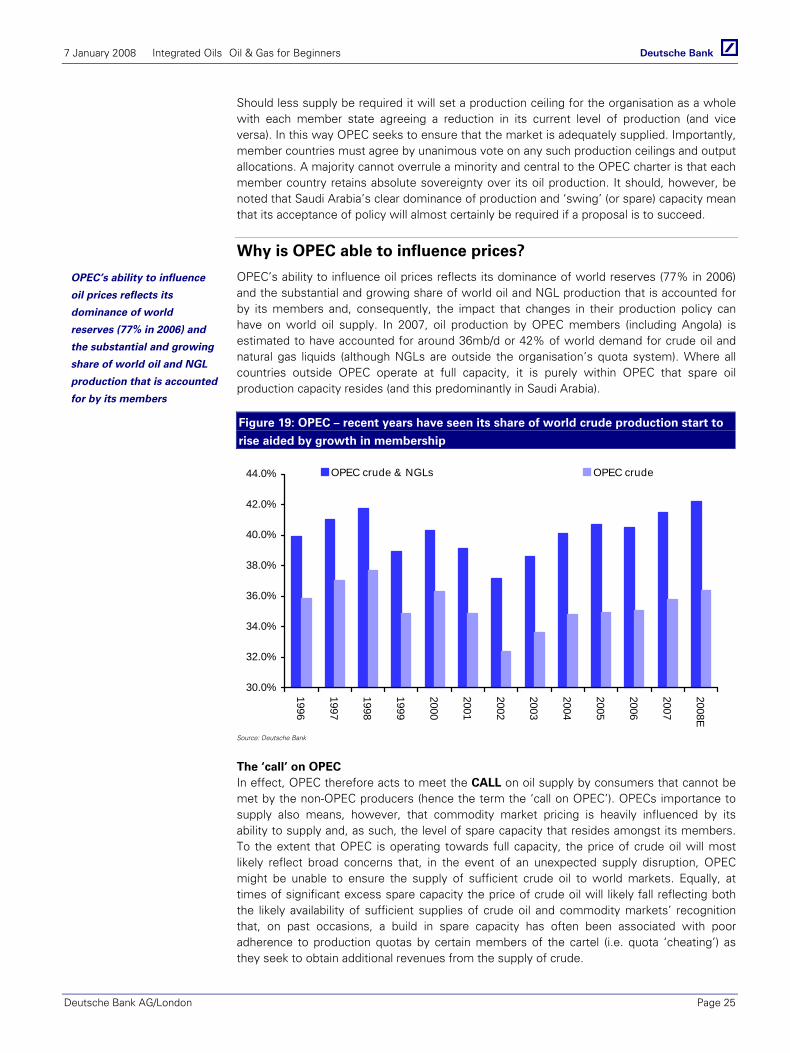
7 January 2008 Integrated Oils Oil & Gas for Beginners
Deutsche Bank AG/London Page 25
Should less supply be required it will set a production ceiling for the organisation as a whole with each member state agreeing a reduction in its current level of production (and vice versa). In this way OPEC seeks to ensure that the market is adequately supplied. Importantly, member countries must agree by unanimous vote on any such production ceilings and output allocations. A majority cannot overrule a minority and central to the OPEC charter is that each member country retains absolute sovereignty over its oil production. It should, however, be noted that Saudi Arabia’s clear dominance of production and ‘swing’ (or spare) capacity mean that its acceptance of policy will almost certainly be required if a proposal is to succeed.
Why is OPEC able to influence prices?
OPEC’s ability to influence oil prices reflects its dominance of world reserves (77% in 2006) and the substantial and growing share of world oil and NGL production that is accounted for by its members and, consequently, the impact that changes in their production policy can have on world oil supply. In 2007, oil production by OPEC members (including Angola) is estimated to have accounted for around 36mb/d or 42% of world demand for crude oil and natural gas liquids (although NGLs are outside the organisation’s quota system). Where all countries outside OPEC operate at full capacity, it is purely within OPEC that spare oil production capacity resides (and this predominantly in Saudi Arabia).
Figure 19: OPEC – recent years have seen its share of world crude production start to
rise aided by growth in membership
30.0%
32.0%
34.0%
36.0%
38.0%
40.0%
42.0%
44.0%1996
1997
1998
1999
2000
2001
2002
2003
2004
2005
2006
2007
2008E
OPEC crude & NGLs OPEC crude
Source: Deutsche Bank
The ‘call’ on OPEC In effect, OPEC therefore acts to meet the CALL on oil supply by consumers that cannot be met by the non-OPEC producers (hence the term the ‘call on OPEC’). OPECs importance to supply also means, however, that commodity market pricing is heavily influenced by its ability to supply and, as such, the level of spare capacity that resides amongst its members. To the extent that OPEC is operating towards full capacity, the price of crude oil will most likely reflect broad concerns that, in the event of an unexpected supply disruption, OPEC might be unable to ensure the supply of sufficient crude oil to world markets. Equally, at times of significant excess spare capacity the price of crude oil will likely fall reflecting both the likely availability of sufficient supplies of crude oil and commodity markets’ recognition that, on past occasions, a build in spare capacity has often been associated with poor adherence to production quotas by certain members of the cartel (i.e. quota ‘cheating’) as they seek to obtain additional revenues from the supply of crude.
OPEC’s ability to influence
oil prices reflects its
dominance of world
reserves (77% in 2006) and
the substantial and growing
share of world oil and NGL
production that is accounted
for by its members

7 January 2008 Integrated Oils Oil & Gas for Beginners
Page 26 Deutsche Bank AG/London
The diagram below depicts recent moves in OPEC production and spare capacity (ex-Angola). It emphasizes that in recent years OPEC has been stretched to capacity with very little slack left in the system. However, as new supply has come on-stream so too capacity has started to build, with spare capacity further augmented by the production restrictions implemented in 2007. Looking forwards, it would seem reasonable to anticipate that, with some 3-4mb/d of spare capacity oil prices would start to weaken. However, given uncertainties around the stability of some 8mb/d of supplies from Iran, Nigeria and Iraq, geopolitical tensions continue to prove an important concern.
Figure 20: OPEC production and spare capacity – getting longer
-2
0
2
4
6
8
10
Jan 01 Jan 02 Jan 03 Jan 04 Jan 05 Jan 06 Jan 0720
22
24
26
28
30
32
34Spare Capacity (mb/d) Production (mb/d) - RHS
Venezuelan strike Chinese demand
Spa
re c
apac
ity (m
b/d) P
roduction mb/d
2007 Quota Cuts
Source: Deutsche Bank
Because OPEC does not have the power to force its members to adhere to their production quotas but instead relies upon their mutual compliance, past efforts to contain the level of supply have invariably seen certain members failing to adhere or ‘cheating’ on their production ceilings. Based on past behaviour, we would opine that compliance by the Gulf States (Saudi Arabia, Kuwait, Qatar and the UAE) tends to be high whilst that of Nigeria, Iran and Venezuela often wavers.
What price does OPEC want?
From the mid-1980s through the start of the current decade, OPEC adopted specific policies on pricing, informing the market of the crude oil price that it would look to achieve for the OPEC basket (see below) and using the quota system to try and maintain prices at around its targeted level. Initially, the organisation set a specific price as its objective with $18/bbl targeted between 1986 and 1991 before an increased $21/bbl was set as a target through the balance of the 1990s. Often poor discipline amongst its members and erosion of its market share meant, however, that the crude oil price invariably traded below its target such that, from 1999, a new approach was adopted – that of maintaining the price within a $22-28/bbl target band.
This policy proved far more successful and the target band has never officially been revised. More recently, however, it is only too apparent that OPEC’s price intentions have changed and dramatically. The introduction of production restrictions in 2004 in defense of a $40/bbl oil price floor and again in late in 2006, at which time the OPEC basket was trading at around $55/bbl argue that OPEC’s expectations are now far higher. Quite what those expectations are is, however, unclear with the organisation seemingly now trying to obtain a maximum
From the mid-1980s through
the start of the current
decade, OPEC adopted
specific policies on pricing

7 January 2008 Integrated Oils Oil & Gas for Beginners
Deutsche Bank AG/London Page 27
price for its oil but, at the same time, not allowing the price to run so high that it significantly curtails global oil demand and economic growth. For the all important Saudis, we believe the maintenance of healthy political relations with the west is also an evident influence.
The OPEC basket
The OPEC basket comprises a mix of 12 different blends of crude produced by the member countries. In determining the price band for crude oil that OPEC wishes to see in world markets it is this basket that is key. As of September 2007 the basket comprised Saharan Blend (Algeria), Girassol (Angola), Minas (Indonesia), Iran Heavy, Basra Light (Iraq), Kuwait Export, Es Sider (Libya), Bonny Light (Nigeria), Qatar Marine, Arab Light (Saudi Arabia), Murban (UAE) and BCF 17 (Venezuela). Note that with the OPEC basket both heavier and more sour than WTI it trades at a typical 5-10% discount.
What is the western IOCs’ exposure to OPEC?
For the IOCs, decisions by OPEC to introduce production restrictions or to manage the pace of capacity growth clearly hold potential implication. For those companies that derive a significant proportion of their oil production in OPEC territories, volumes at a time when restrictions are being implemented will almost certainly be reduced. With this in mind, in the table below we detail our estimates of the companies oil production by OPEC territory together with the percentage of total oil production and hydrocarbon production that is OPEC sourced. What is evident from this is that even today, OPEC territories remain a very important source of IOC barrels most particularly at Total, Chevron, ENI and Exxon although, with the profitability per OPEC barrel tending to be much lower than that elsewhere, the significance of this production to upstream profits is likely to be far lower than the volume percentage may indicate..
Figure 21: The western majors production of crude oil in OPEC territories (2008E) Country BP RDS XOM CVX Total COP ENI Repsol Hess OXY BG Statoil MRA
Saudi Arabia 5%
Iran 1% 2% 1%
Iraq
Kuwait
UAE 9% 7% 12% 17%
Venezuela 1% 1% 5% 4% 1% 2% 2%
Nigeria 13% 14% 11% 12% 4% 8% 2%
Angola 9% 0% 7% 11% 13% 12% 8%
Algeria 1% 1% 1% 7% 2% 4% 1%
Indonesia 9% 1% 1% 2%
Qatar
Libya 2% 5% 3% 11% 4% 24%
Ecuador 1% 1% 3%
As % Oil 21% 22% 33% 42% 51% 12% 35% 7% 18% 4% 0% 13% 24%
As % Group 13% 13% 21% 28% 31% 7% 21% 3% 5% 3% 0% 8% 15%
Group Oil Prodn kb/d 2457 2032 2681 1841 1506 1100 1079 525 257 478 143 1072 233
Total Prodn kboe/d 3900 3280 4200 2700 2450 1927 1800 1100 868 700 640 1750 374Source: Deutsche Bank estimates
What is the western IOCs
exposure to OPEC?
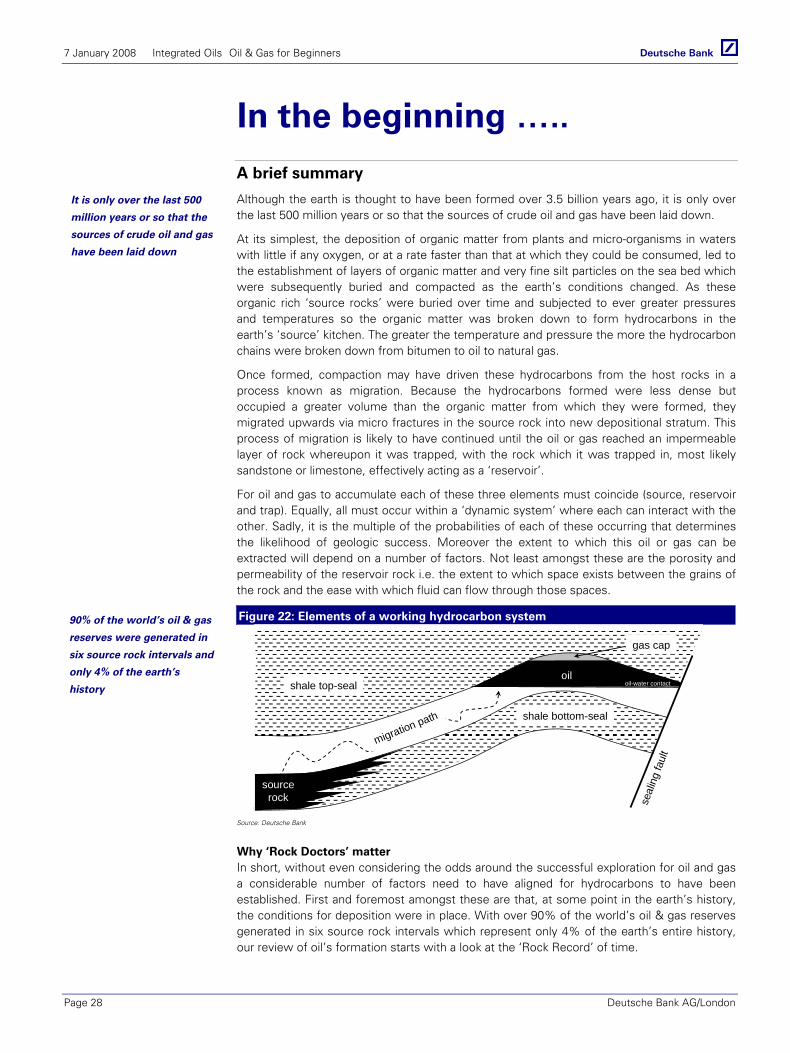
7 January 2008 Integrated Oils Oil & Gas for Beginners
Page 28 Deutsche Bank AG/London
In the beginning ….. A brief summary
Although the earth is thought to have been formed over 3.5 billion years ago, it is only over the last 500 million years or so that the sources of crude oil and gas have been laid down.
At its simplest, the deposition of organic matter from plants and micro-organisms in waters with little if any oxygen, or at a rate faster than that at which they could be consumed, led to the establishment of layers of organic matter and very fine silt particles on the sea bed which were subsequently buried and compacted as the earth’s conditions changed. As these organic rich ‘source rocks’ were buried over time and subjected to ever greater pressures and temperatures so the organic matter was broken down to form hydrocarbons in the earth’s ‘source’ kitchen. The greater the temperature and pressure the more the hydrocarbon chains were broken down from bitumen to oil to natural gas.
Once formed, compaction may have driven these hydrocarbons from the host rocks in a process known as migration. Because the hydrocarbons formed were less dense but occupied a greater volume than the organic matter from which they were formed, they migrated upwards via micro fractures in the source rock into new depositional stratum. This process of migration is likely to have continued until the oil or gas reached an impermeable layer of rock whereupon it was trapped, with the rock which it was trapped in, most likely sandstone or limestone, effectively acting as a ‘reservoir’.
For oil and gas to accumulate each of these three elements must coincide (source, reservoir and trap). Equally, all must occur within a ‘dynamic system’ where each can interact with the other. Sadly, it is the multiple of the probabilities of each of these occurring that determines the likelihood of geologic success. Moreover the extent to which this oil or gas can be extracted will depend on a number of factors. Not least amongst these are the porosity and permeability of the reservoir rock i.e. the extent to which space exists between the grains of the rock and the ease with which fluid can flow through those spaces.
Figure 22: Elements of a working hydrocarbon system
sourcerock
shale top-seal
shale bottom-seal
gas cap
oil
migration path
seal
ing
faul
t
oil-water contact
Source: Deutsche Bank
Why ‘Rock Doctors’ matter In short, without even considering the odds around the successful exploration for oil and gas a considerable number of factors need to have aligned for hydrocarbons to have been established. First and foremost amongst these are that, at some point in the earth’s history, the conditions for deposition were in place. With over 90% of the world’s oil & gas reserves generated in six source rock intervals which represent only 4% of the earth’s entire history, our review of oil’s formation starts with a look at the ‘Rock Record’ of time.
It is only over the last 500
million years or so that the
sources of crude oil and gas
have been laid down
90% of the world’s oil & gas
reserves were generated in
six source rock intervals and
only 4% of the earth’s
history
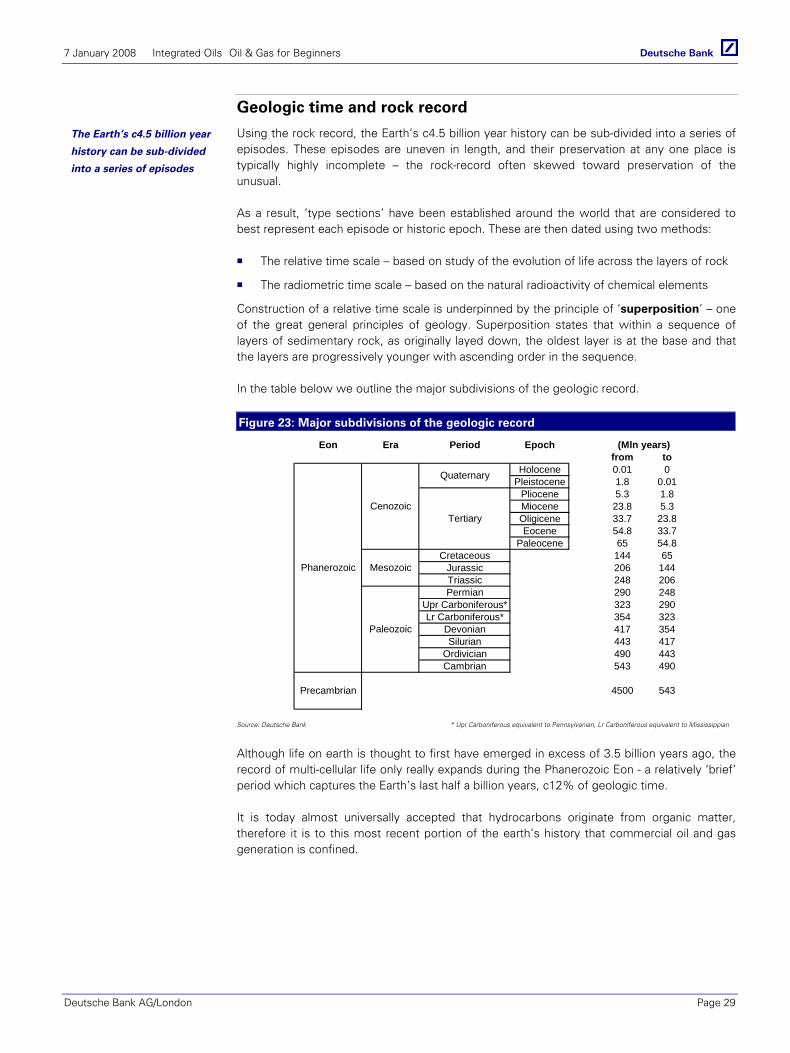
7 January 2008 Integrated Oils Oil & Gas for Beginners
Deutsche Bank AG/London Page 29
Geologic time and rock record
Using the rock record, the Earth’s c4.5 billion year history can be sub-divided into a series of episodes. These episodes are uneven in length, and their preservation at any one place is typically highly incomplete – the rock-record often skewed toward preservation of the unusual.
As a result, ‘type sections’ have been established around the world that are considered to best represent each episode or historic epoch. These are then dated using two methods:
The relative time scale – based on study of the evolution of life across the layers of rock
The radiometric time scale – based on the natural radioactivity of chemical elements
Construction of a relative time scale is underpinned by the principle of ‘superposition’ – one of the great general principles of geology. Superposition states that within a sequence of layers of sedimentary rock, as originally layed down, the oldest layer is at the base and that the layers are progressively younger with ascending order in the sequence.
In the table below we outline the major subdivisions of the geologic record.
Figure 23: Major subdivisions of the geologic record
Eon Era Period Epochfrom to
Holocene 0.01 0Pleistocene 1.8 0.01
Pliocene 5.3 1.8Miocene 23.8 5.3Oligicene 33.7 23.8Eocene 54.8 33.7
Paleocene 65 54.8Cretaceous 144 65
Jurassic 206 144Triassic 248 206Permian 290 248
Upr Carboniferous* 323 290Lr Carboniferous* 354 323
Devonian 417 354Silurian 443 417
Ordivician 490 443Cambrian 543 490
Precambrian 4500 543
Mesozoic
Cenozoic
Phanerozoic
Quaternary
Tertiary
Paleozoic
(Mln years)
Source: Deutsche Bank * Upr Carboniferous equivalent to Pennsylvanian, Lr Carboniferous equivalent to Mississippian
Although life on earth is thought to first have emerged in excess of 3.5 billion years ago, the record of multi-cellular life only really expands during the Phanerozoic Eon - a relatively ‘brief’ period which captures the Earth’s last half a billion years, c12% of geologic time.
It is today almost universally accepted that hydrocarbons originate from organic matter, therefore it is to this most recent portion of the earth’s history that commercial oil and gas generation is confined.
The Earth’s c4.5 billion year
history can be sub-divided
into a series of episodes
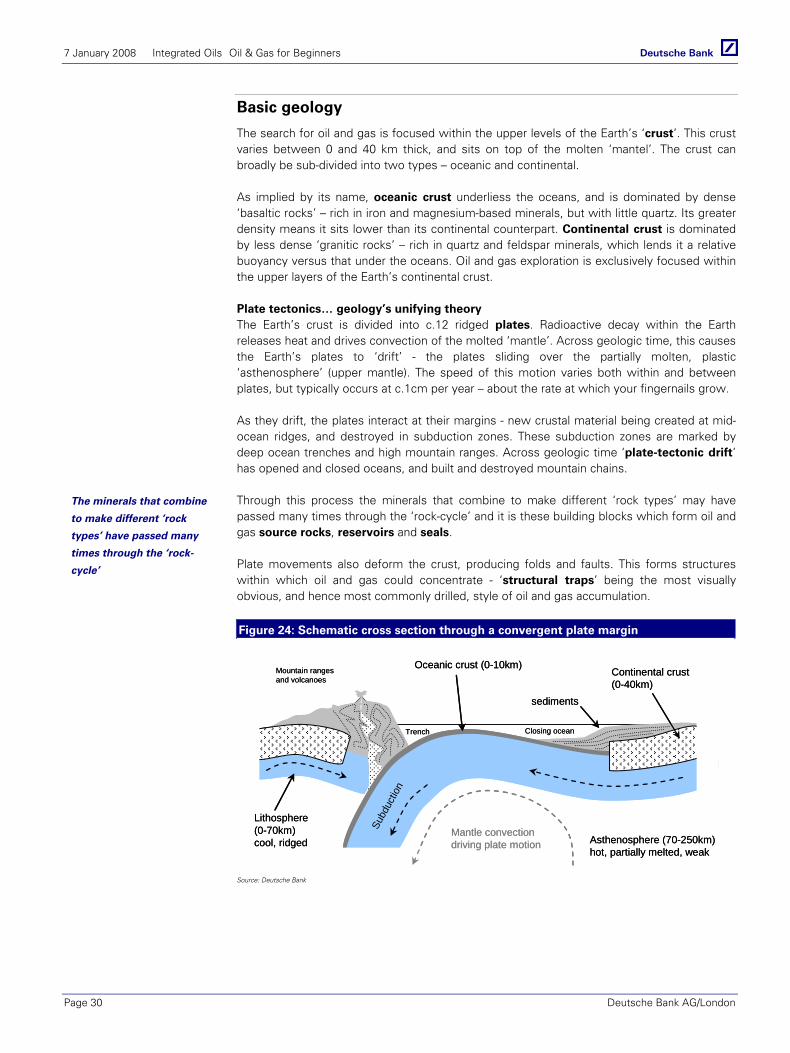
7 January 2008 Integrated Oils Oil & Gas for Beginners
Page 30 Deutsche Bank AG/London
Basic geology
The search for oil and gas is focused within the upper levels of the Earth’s ‘crust’. This crust varies between 0 and 40 km thick, and sits on top of the molten ‘mantel’. The crust can broadly be sub-divided into two types – oceanic and continental.
As implied by its name, oceanic crust underliess the oceans, and is dominated by dense ‘basaltic rocks’ – rich in iron and magnesium-based minerals, but with little quartz. Its greater density means it sits lower than its continental counterpart. Continental crust is dominated by less dense ‘granitic rocks’ – rich in quartz and feldspar minerals, which lends it a relative buoyancy versus that under the oceans. Oil and gas exploration is exclusively focused within the upper layers of the Earth’s continental crust.
Plate tectonics… geology’s unifying theory The Earth’s crust is divided into c.12 ridged plates. Radioactive decay within the Earth releases heat and drives convection of the molted ‘mantle’. Across geologic time, this causes the Earth’s plates to ‘drift’ - the plates sliding over the partially molten, plastic ‘asthenosphere’ (upper mantle). The speed of this motion varies both within and between plates, but typically occurs at c.1cm per year – about the rate at which your fingernails grow.
As they drift, the plates interact at their margins - new crustal material being created at mid-ocean ridges, and destroyed in subduction zones. These subduction zones are marked by deep ocean trenches and high mountain ranges. Across geologic time ‘plate-tectonic drift’ has opened and closed oceans, and built and destroyed mountain chains.
Through this process the minerals that combine to make different ‘rock types’ may have passed many times through the ‘rock-cycle’ and it is these building blocks which form oil and gas source rocks, reservoirs and seals.
Plate movements also deform the crust, producing folds and faults. This forms structures within which oil and gas could concentrate - ‘structural traps’ being the most visually obvious, and hence most commonly drilled, style of oil and gas accumulation.
Figure 24: Schematic cross section through a convergent plate margin
Continental crust(0-40km)
Oceanic crust (0-10km)
Lithosphere(0-70km)cool, ridged Asthenosphere (70-250km)
hot, partially melted, weak
Mantle convectiondriving plate motion
Trench Closing ocean
Mountain rangesand volcanoes
sediments
Continental crust(0-40km)
Oceanic crust (0-10km)
Lithosphere(0-70km)cool, ridged Asthenosphere (70-250km)
hot, partially melted, weak
Mantle convectiondriving plate motion
Trench Closing ocean
Mountain rangesand volcanoes
sediments
Subd
uctio
n
Source: Deutsche Bank
The minerals that combine
to make different ‘rock
types’ have passed many
times through the ‘rock-
cycle’
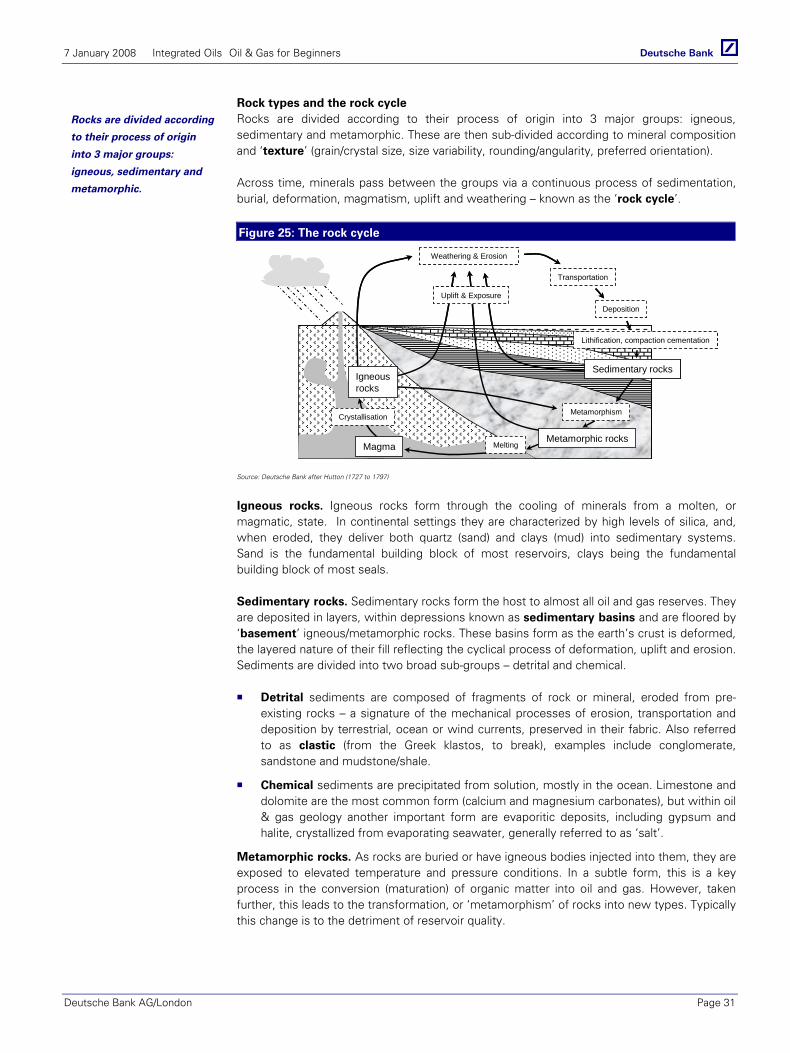
7 January 2008 Integrated Oils Oil & Gas for Beginners
Deutsche Bank AG/London Page 31
Rock types and the rock cycle Rocks are divided according to their process of origin into 3 major groups: igneous, sedimentary and metamorphic. These are then sub-divided according to mineral composition and ‘texture’ (grain/crystal size, size variability, rounding/angularity, preferred orientation).
Across time, minerals pass between the groups via a continuous process of sedimentation, burial, deformation, magmatism, uplift and weathering – known as the ‘rock cycle’.
Figure 25: The rock cycle
Weathering & Erosion
Transportation
Deposition
Lithification, compaction cementation
Metamorphism
Melting
Sedimentary rocks
Metamorphic rocks
Uplift & Exposure
Magma
Crystallisation
Igneousrocks
Weathering & Erosion
Transportation
Deposition
Lithification, compaction cementation
Metamorphism
Melting
Sedimentary rocks
Metamorphic rocks
Uplift & Exposure
Magma
Crystallisation
Igneousrocks
Source: Deutsche Bank after Hutton (1727 to 1797)
Igneous rocks. Igneous rocks form through the cooling of minerals from a molten, or magmatic, state. In continental settings they are characterized by high levels of silica, and, when eroded, they deliver both quartz (sand) and clays (mud) into sedimentary systems. Sand is the fundamental building block of most reservoirs, clays being the fundamental building block of most seals.
Sedimentary rocks. Sedimentary rocks form the host to almost all oil and gas reserves. They are deposited in layers, within depressions known as sedimentary basins and are floored by ‘basement’ igneous/metamorphic rocks. These basins form as the earth’s crust is deformed, the layered nature of their fill reflecting the cyclical process of deformation, uplift and erosion. Sediments are divided into two broad sub-groups – detrital and chemical.
Detrital sediments are composed of fragments of rock or mineral, eroded from pre-existing rocks – a signature of the mechanical processes of erosion, transportation and deposition by terrestrial, ocean or wind currents, preserved in their fabric. Also referred to as clastic (from the Greek klastos, to break), examples include conglomerate, sandstone and mudstone/shale.
Chemical sediments are precipitated from solution, mostly in the ocean. Limestone and dolomite are the most common form (calcium and magnesium carbonates), but within oil & gas geology another important form are evaporitic deposits, including gypsum and halite, crystallized from evaporating seawater, generally referred to as ‘salt’.
Metamorphic rocks. As rocks are buried or have igneous bodies injected into them, they are exposed to elevated temperature and pressure conditions. In a subtle form, this is a key process in the conversion (maturation) of organic matter into oil and gas. However, taken further, this leads to the transformation, or ‘metamorphism’ of rocks into new types. Typically this change is to the detriment of reservoir quality.
Rocks are divided according
to their process of origin
into 3 major groups:
igneous, sedimentary and
metamorphic.

7 January 2008 Integrated Oils Oil & Gas for Beginners
Page 32 Deutsche Bank AG/London
Hunting for sand…
Sandstone and limestone account for c19% and c9% of the Earth’s sedimentary rocks respectively, and these form almost all the world’s discovered oil and gas reservoirs – hydrocarbons sitting between the mineral/rock grains in sandstone, and within voids in limestone.
Enveloping these rocks is a background of mudstone and shale – which accounts for c67% of the Earth’s sedimentary rocks. These fine-gained rocks accumulate in low-energy environments, during periods of quiet deposition. Typically impermeable, they form good ‘seals’ to prevent the escape of hydrocarbons, and their conditions of deposition can also favor the preservation of organic matter – meaning they may be an effective hydrocarbon source.
In this context, one of the exploration geologist’s principle tasks is to develop and apply models that help predict the distribution of reservoir units within a background of mud.
Unraveling depositional settings The processes that shaped the Earth through geologic time (wind action, rivers, waves etc) are broadly the same as those observed today (the principle of uniformitarianism). Therefore, by understanding the relative distribution of sand/carbonate/mud within modern depositional systems, it is possible to subdivide basin fills in the rock-record into units, whose set of characteristics, or ‘facies’, reflect their environment of deposition.
At any one point in time a whole series of depositional environments will coexist from dry-land, into shallow water and then out into the deep ocean (see below). These environments contain sediments/rocks which have differing source, seal and reservoir potential.
Figure 26: Schematic transition in depositional environments from land-to-sea
continental slope
deep sea
terrestrial
shallow water/continental shelf
Sea level
Reservoir Source SealContinental environmentsAlluvial fanAeolian desertBraided streamLakeFloodplainLeveed meandering channelDunes
Shallow waterTidal flatsBarrier islandsBeachLagoonReefsCarbonate muds
DeepwaterCanyonsTurbidite channelsPonded mini-basinsToe-of-slope fansAbysal plainSlope aprons
Source: Deutsche Bank
A key control on grain-size distribution across these environments, and hence reservoir quality/seal integrity, is the path and energy of the currents eroding, transporting or depositing the rock/mineral fragments. As velocity falls, heavier particles are deposited.
Slope gradient is a major factor dictating the energy of flows, and, broadly speaking, sediments tend to become finer grained moving from land out into the deep oceans.
Sandstone and limestone
account for c19% and c9% of
the Earth’s sedimentary
rocks respectively
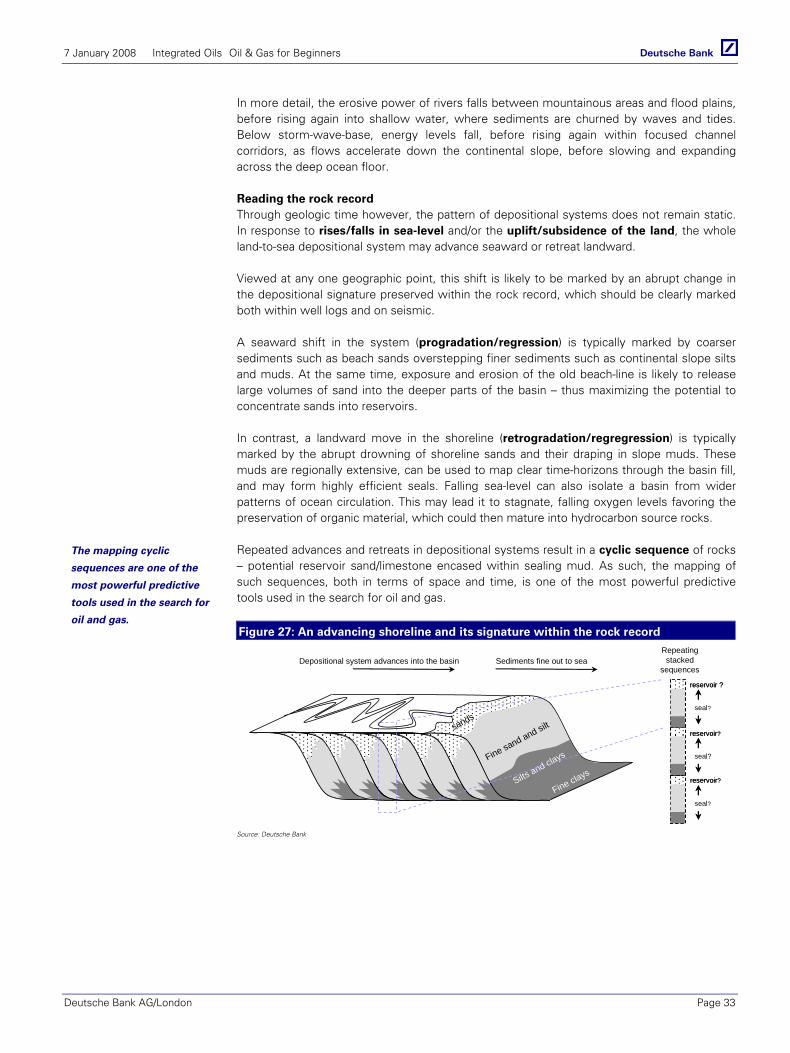
7 January 2008 Integrated Oils Oil & Gas for Beginners
Deutsche Bank AG/London Page 33
In more detail, the erosive power of rivers falls between mountainous areas and flood plains, before rising again into shallow water, where sediments are churned by waves and tides. Below storm-wave-base, energy levels fall, before rising again within focused channel corridors, as flows accelerate down the continental slope, before slowing and expanding across the deep ocean floor.
Reading the rock record Through geologic time however, the pattern of depositional systems does not remain static. In response to rises/falls in sea-level and/or the uplift/subsidence of the land, the whole land-to-sea depositional system may advance seaward or retreat landward.
Viewed at any one geographic point, this shift is likely to be marked by an abrupt change in the depositional signature preserved within the rock record, which should be clearly marked both within well logs and on seismic.
A seaward shift in the system (progradation/regression) is typically marked by coarser sediments such as beach sands overstepping finer sediments such as continental slope silts and muds. At the same time, exposure and erosion of the old beach-line is likely to release large volumes of sand into the deeper parts of the basin – thus maximizing the potential to concentrate sands into reservoirs.
In contrast, a landward move in the shoreline (retrogradation/regregression) is typically marked by the abrupt drowning of shoreline sands and their draping in slope muds. These muds are regionally extensive, can be used to map clear time-horizons through the basin fill, and may form highly efficient seals. Falling sea-level can also isolate a basin from wider patterns of ocean circulation. This may lead it to stagnate, falling oxygen levels favoring the preservation of organic material, which could then mature into hydrocarbon source rocks.
Repeated advances and retreats in depositional systems result in a cyclic sequence of rocks – potential reservoir sand/limestone encased within sealing mud. As such, the mapping of such sequences, both in terms of space and time, is one of the most powerful predictive tools used in the search for oil and gas.
Figure 27: An advancing shoreline and its signature within the rock record
Fine claysSilts and claysFine sand and siltsands
reservoir ?
reservoir?
reservoir?
seal?
seal?
seal?
reservoir ?
reservoir?
reservoir?
seal?
seal?
seal?
Sediments fine out to seaDepositional system advances into the basinRepeating stacked
sequences
Source: Deutsche Bank
The mapping cyclic
sequences are one of the
most powerful predictive
tools used in the search for
oil and gas.
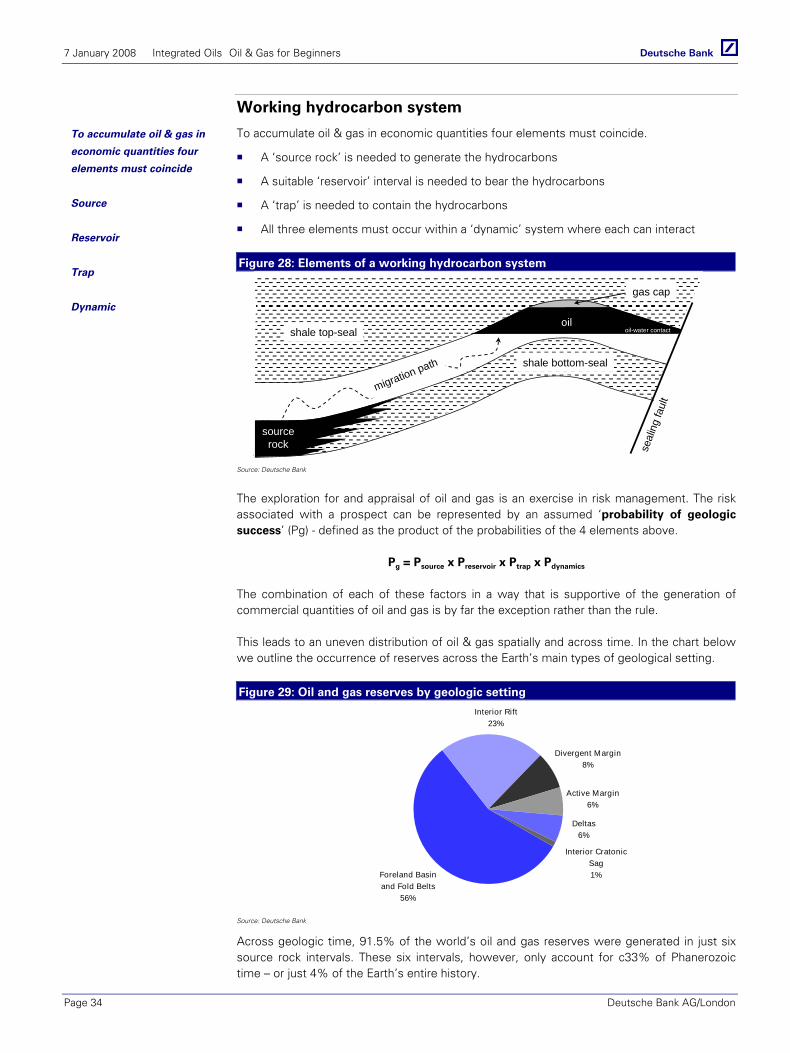
7 January 2008 Integrated Oils Oil & Gas for Beginners
Page 34 Deutsche Bank AG/London
Working hydrocarbon system
To accumulate oil & gas in economic quantities four elements must coincide.
A ‘source rock’ is needed to generate the hydrocarbons
A suitable ‘reservoir’ interval is needed to bear the hydrocarbons
A ‘trap’ is needed to contain the hydrocarbons
All three elements must occur within a ‘dynamic’ system where each can interact
Figure 28: Elements of a working hydrocarbon system
sourcerock
shale top-seal
shale bottom-seal
gas cap
oil
migration path
seal
ing
faul
t
oil-water contact
Source: Deutsche Bank
The exploration for and appraisal of oil and gas is an exercise in risk management. The risk associated with a prospect can be represented by an assumed ‘probability of geologic success’ (Pg) - defined as the product of the probabilities of the 4 elements above.
Pg = Psource x Preservoir x Ptrap x Pdynamics
The combination of each of these factors in a way that is supportive of the generation of commercial quantities of oil and gas is by far the exception rather than the rule.
This leads to an uneven distribution of oil & gas spatially and across time. In the chart below we outline the occurrence of reserves across the Earth’s main types of geological setting.
Figure 29: Oil and gas reserves by geologic setting
Foreland Basin and Fold Belts
56%
Interior Rift23%
Divergent Margin8%
Active Margin6%
Deltas6%
Interior Cratonic Sag1%
Source: Deutsche Bank
Across geologic time, 91.5% of the world’s oil and gas reserves were generated in just six source rock intervals. These six intervals, however, only account for c33% of Phanerozoic time – or just 4% of the Earth’s entire history.
To accumulate oil & gas in
economic quantities four
elements must coincide
Source
Reservoir
Trap
Dynamic

7 January 2008 Integrated Oils Oil & Gas for Beginners
Deutsche Bank AG/London Page 35
Similarly, 96.4% of the world’s oil and gas is trapped within just six reservoir intervals.
Figure 30: Distribution of oil and gas source rocks and reservoir intervals across geologic time (Phanerozoic)
Aptian –Turonian 29%
10 20 30%
Conacian-Eocene 4.6%
Oligocene-Miocene
22.3%
Aptian –Turonian
20.5%
Upper Jurassic 14.2%
Middle Jurassic –Upper Permian
10%
Penn. – L. Permian 11%
Upper Devonian-Lower Miss. 3.5%
Silurian 0.2%
Mid. – Upper Miss. 1.7%
Lower – Mid. Devonian 1.9%
Cambro-Ordovician 2.1%
Upper Proterozoic 0.1%
Neocomian 7.6%
Era PeriodQuaternaryPliocene
Miocene
Oligocene
Eocene
Paleocene
Cretaceous
Jurassic
Triassic
Permian
Carboniferous(Miss. – Penn)
Devonian
Silurian
Ordovician
Cambrian
Upper ProterozoicPRE-
CAMB.
CEN
OZO
ICM
ESO
ZOIC
PA
LEO
ZOIC
Tert
iary
01.75
2537
5565
140
210250
290
360
438
570
Age
( M
illio
n Ye
ars
Bef
ore
Pre
sent
)
10 20 30%
Oil Gas
Conacian-Eocene 2.8%
Oligocene-Miocene12.5%
UpperJurassic
25%
Neocomian 2.6%
Middle Jurassic –Upper Permian
1.2%
Penn. – L. Permian 8.0%
Upper Devonian-Lower Miss. 8.0%
Silurian 9.0%
Mid. – Upper Miss. 0.4%
Lower – Mid. Devonian 0.3%
Cambro-Ordovician 1.0%
Upper Proterozoic 0.2%
Source: Deutsche Bank, data from Ulmishek and Klemme USGS Bull., 1931, 1990
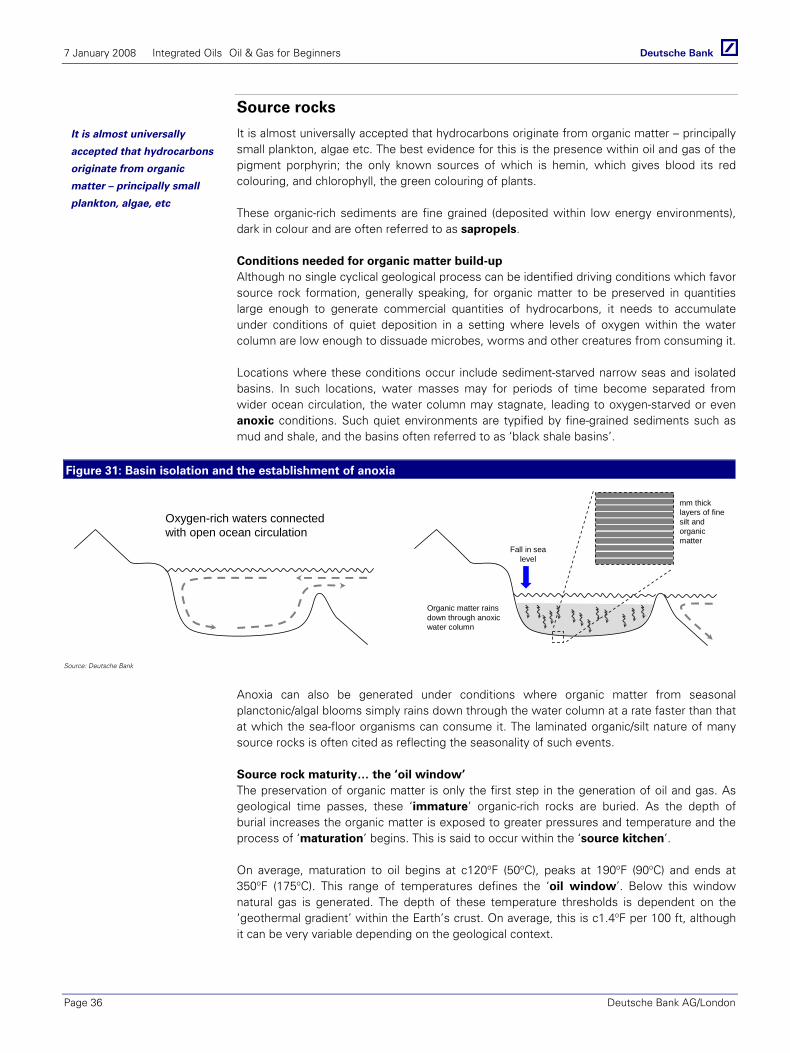
7 January 2008 Integrated Oils Oil & Gas for Beginners
Page 36 Deutsche Bank AG/London
Source rocks
It is almost universally accepted that hydrocarbons originate from organic matter – principally small plankton, algae etc. The best evidence for this is the presence within oil and gas of the pigment porphyrin; the only known sources of which is hemin, which gives blood its red colouring, and chlorophyll, the green colouring of plants.
These organic-rich sediments are fine grained (deposited within low energy environments), dark in colour and are often referred to as sapropels.
Conditions needed for organic matter build-up Although no single cyclical geological process can be identified driving conditions which favor source rock formation, generally speaking, for organic matter to be preserved in quantities large enough to generate commercial quantities of hydrocarbons, it needs to accumulate under conditions of quiet deposition in a setting where levels of oxygen within the water column are low enough to dissuade microbes, worms and other creatures from consuming it.
Locations where these conditions occur include sediment-starved narrow seas and isolated basins. In such locations, water masses may for periods of time become separated from wider ocean circulation, the water column may stagnate, leading to oxygen-starved or even anoxic conditions. Such quiet environments are typified by fine-grained sediments such as mud and shale, and the basins often referred to as ‘black shale basins’.
Figure 31: Basin isolation and the establishment of anoxia
mm thick layers of fine silt and organic matter
Organic matter rains down through anoxic water column
Oxygen-rich waters connected with open ocean circulation
Fall in sea level
Source: Deutsche Bank
Anoxia can also be generated under conditions where organic matter from seasonal planctonic/algal blooms simply rains down through the water column at a rate faster than that at which the sea-floor organisms can consume it. The laminated organic/silt nature of many source rocks is often cited as reflecting the seasonality of such events.
Source rock maturity… the ‘oil window’ The preservation of organic matter is only the first step in the generation of oil and gas. As geological time passes, these ‘immature’ organic-rich rocks are buried. As the depth of burial increases the organic matter is exposed to greater pressures and temperature and the process of ‘maturation’ begins. This is said to occur within the ‘source kitchen’.
On average, maturation to oil begins at c120oF (50oC), peaks at 190oF (90oC) and ends at 350oF (175oC). This range of temperatures defines the ‘oil window’. Below this window natural gas is generated. The depth of these temperature thresholds is dependent on the ‘geothermal gradient’ within the Earth’s crust. On average, this is c1.4oF per 100 ft, although it can be very variable depending on the geological context.
It is almost universally
accepted that hydrocarbons
originate from organic
matter – principally small
plankton, algae, etc
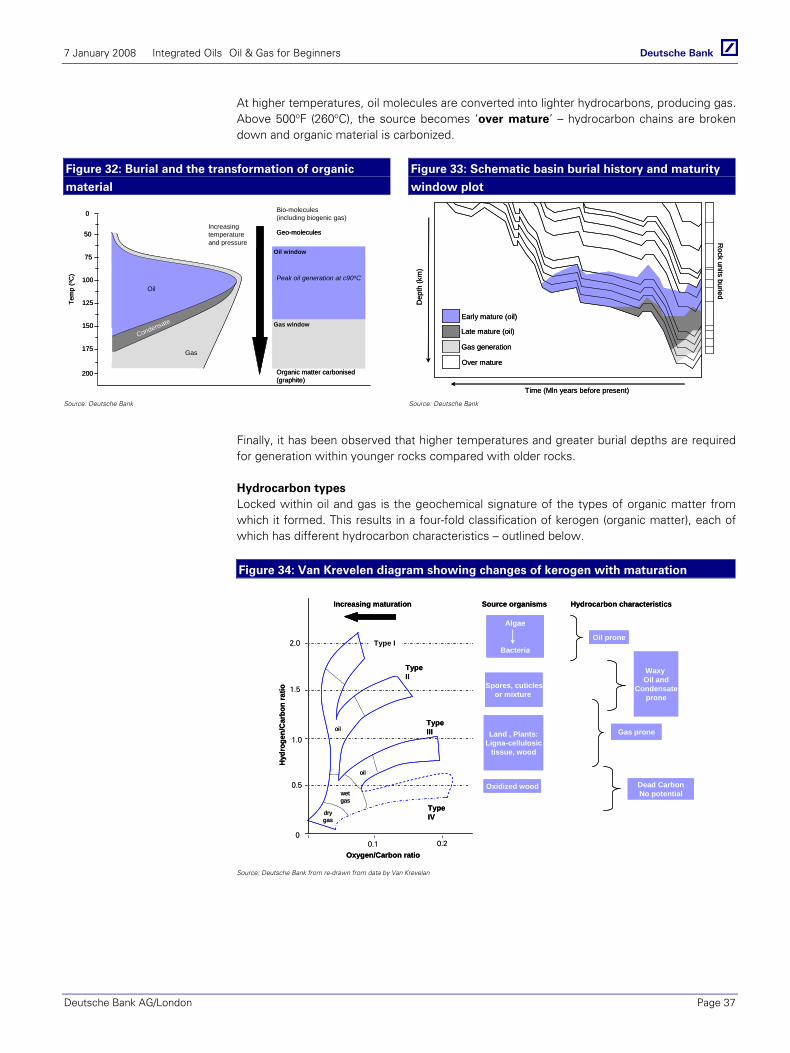
7 January 2008 Integrated Oils Oil & Gas for Beginners
Deutsche Bank AG/London Page 37
At higher temperatures, oil molecules are converted into lighter hydrocarbons, producing gas. Above 500oF (260oC), the source becomes ‘over mature’ – hydrocarbon chains are broken down and organic material is carbonized.
Figure 32: Burial and the transformation of organic
material
Figure 33: Schematic basin burial history and maturity
window plot
Tem
p (o
C)
50
75
100
125
150
Bio-molecules(including biogenic gas)
Geo-molecules
Oil
Increasing temperature and pressure
175
200
0
Organic matter carbonised(graphite)
Gas
Oil
Condensate
Peak oil generation at c90oC
Oil window
Gas window
Tem
p (o
C)
50
75
100
125
150
Bio-molecules(including biogenic gas)
Geo-molecules
Oil
Increasing temperature and pressure
175
200
0
Organic matter carbonised(graphite)
Gas
Oil
Condensate
Peak oil generation at c90oC
Oil window
Gas window
Early mature (oil)
Late mature (oil)
Gas generation
Over mature
Dep
th (k
m)
Time (Mln years before present)
Rock units buried
Early mature (oil)
Late mature (oil)
Gas generation
Over mature
Dep
th (k
m)
Time (Mln years before present)
Rock units buried
Source: Deutsche Bank Source: Deutsche Bank
Finally, it has been observed that higher temperatures and greater burial depths are required for generation within younger rocks compared with older rocks.
Hydrocarbon types Locked within oil and gas is the geochemical signature of the types of organic matter from which it formed. This results in a four-fold classification of kerogen (organic matter), each of which has different hydrocarbon characteristics – outlined below.
Figure 34: Van Krevelen diagram showing changes of kerogen with maturation
Increasing maturation
0
0.5
1.5
1.0
0.1 0.2
Oxygen/Carbon ratio
Hyd
roge
n/C
arbo
n ra
tio
Type II
Type III
Type IV
2.0
Hydrocarbon characteristics
Dead CarbonNo potential
Oil prone
Waxy Oil and
Condensateprone
Gas prone
Oxidized wood
Source organisms
Algae
Bacteria
Spores, cuticlesor mixture
Land , Plants:Ligna-cellulosic
tissue, wood
Type I
drygas
wetgas
oil
oil
Source: Deutsche Bank from re-drawn from data by Van Krevelan

7 January 2008 Integrated Oils Oil & Gas for Beginners
Page 38 Deutsche Bank AG/London
Migration
Once formed, compaction may drive hydrocarbons from the host source rocks in a process known as migration. This process is most often sub-divided into three parts:
Primary migration - movement of oil/gas through the low permeability mature source rock. This typically occurs directly in the hydrocarbon phase movement via micro-fractures.
As temperatures increase, organic mater converts to bitumen and oil – which have lower densities, and occupy a larger volume than the original kerogen. Products are then expelled into adjacent fractures. At even higher temperatures and pressures, liquid hydrocarbons can be dissolved in the gas phase. As this migrates upward, temperatures and pressures reduce, and the oil-phase re-condenses. Source rock’s low permeability means small molecules tend to be preferentially released – the rock’s ‘expulsion efficiency’ measuring the percentage of a particular hydrocarbon escaping.
Secondary migration - movement of oil/gas through carrier rocks or reservoir rocks outside the source rock, or movement through fractures within the source rock.
Hydrocarbon buoyancy is the main force driving secondary migration. This migration typically occurs either through internal permeability or via faults and joints. Generally speaking tensile fractures and normal faults tend to be more open than those formed in compressional regimes where reverse faulting is more dominant (see later). In detail, along the plain of a fault, zones of fractured rock (‘breccias’) can increase permeability. However, in finer grained rock clay ‘gorges’ can form effective barriers to flow.
Tertiary migration - movement of a previously formed oil and gas accumulation.
In the chart below we examine the formation and migration of the world’s oil and gas.
Figure 35: Vertical migration of the world’s reserves (%)
Oligocene –Quaternary
Conacian – Eocene
Aptian – Turonian
Neocomian
U. Jurassic
U. Permian –M. Jurassic
Pennsyl. – L. Permian
M. – U. Miss.
U. Dec. – L. Miss.
L. – M. Dev.
Silurian
Cambro – Ordovician
U. Protero – zoic
RES
ERVO
IR R
OC
K IN
TER
VALS
SOURCE ROCK INTERVALS
12.512.5
18.318.3
14.214.2
7.47.4
3.53.5
0.20.2
6.06.0
1.81.8
1.0
1.21.2
1.71.7
1.6
0.30.3
0.1
0.2
1.01.0
2.22.2
5.15.1
2.5
9.89.8
0.80.8
0.10.1
= Trapped in Source
= Vertical migration1.81.8
0.20.2
Silurian U. Dev –L. Miss
Penn –L. Perm U. Jur Aptian –
TuronianOligo –
Miocene
Source: Deutsche Bank, data from Ulmishek and Klemme USGS Bull., 1931, 1990
Once formed, compaction
may drive hydrocarbons
from the host source rocks
in a process known as
migration

7 January 2008 Integrated Oils Oil & Gas for Beginners
Deutsche Bank AG/London Page 39
Reservoir quality
Key for high quality reservoir formation is the combination of porosity and permeability at the micro-scale, with few internal barriers to flow at the medium-/macro-scale.
Porosity. Porosity describes the fraction of a rock’s bulk volume accounted for by void space between its constituent grains. For sandstones, porosity is usually determined by the sedimentological processes under which the rock’s constituents were originally deposited - primary porosity refering to the original porosity of a rock. This may, however, be enhanced by the action of chemical leeching of minerals or the generation of a fracture system. This overprint is referred to as secondary porosity. For carbonates, the porosity is mainly the result of such post-depositional changes. Post depositional ‘cements’ however can also reduce porosity
Although porosity is independent of grain-size, it is strongly a function of the degree of grain-size uniformity (sorting) within a sediment – porosity decreasing as sorting becomes poorer. Sorting is again an expression of the environment in which the sands were deposited.
Figure 36: Evolution of porosity with burial Figure 37: Grain sorting and depositional environment
Deposition40-50% porosity
Compaction andminor cementation20-30% porosity
Cementation stops
Hydrocarbon charge
Shallow burial
Deep burial
Compaction andextensive cementation
<10% porosity
Metamorphism
Solution of cementand unstable grains
30-40% porosity
Stable grains
Unstable grains
Cement
Oil
Leaching
Deposition40-50% porosity
Deposition40-50% porosity
Compaction andminor cementation20-30% porosity
Cementation stops
Hydrocarbon charge
Shallow burial
Deep burial
Compaction andextensive cementation
<10% porosity
Metamorphism
Solution of cementand unstable grains
30-40% porosity
Solution of cementand unstable grains
30-40% porosity
Stable grains
Unstable grains
Cement
Oil
Leaching
Poor sortingModerate sortingWell sorted
beachsand
windblownsands
riversands
deepwatersands
0
+ve
skew
-ve
skew
increasing primary porosity/permeability
Poor sortingModerate sortingWell sorted
beachsand
windblownsands
riversands
deepwatersands
0
+ve
skew
-ve
skew
increasing primary porosity/permeability
Source: Deutsche Bank, Selley, 1985 Source: Deutsche Bank, Bjorlykke, 1989
Permeability. Permeability, measured in millidarcies (mD), describes the ease with which a fluid can pass through the pore spaces of a rock. A clastic rock’s permeability is strongly influenced by grain size but is also a function of sorting, and can be strongly directional. Similarly to porosity, post-depositional processes can both enhance and reduce permeability.
Effective porosity. Petroleum geologists often refer to ‘effective porosity’ – this is the pore space that contributes to fluid flow through the formation - defined as a rock’s porosity after excluding all isolated pores and pore volume occupied by water adsorbed on clay minerals or other grains.
A hydrocarbon-bearing reservoir rock with porosity but low, or no permeability is described as ‘tight’. Such tight reservoirs can be encouraged to flow via forcibly imposing secondary porosity through fracturing (see later).
The effects of burial. Compaction reduces porosity with depth – porosities in sandstones and carbonates at depths >3km are much more variable than in shale, this being due to chemical alteration (diagenesis), cementation and dissolution.
Key for high quality
reservoir formation is the
combination of porosity and
permeability
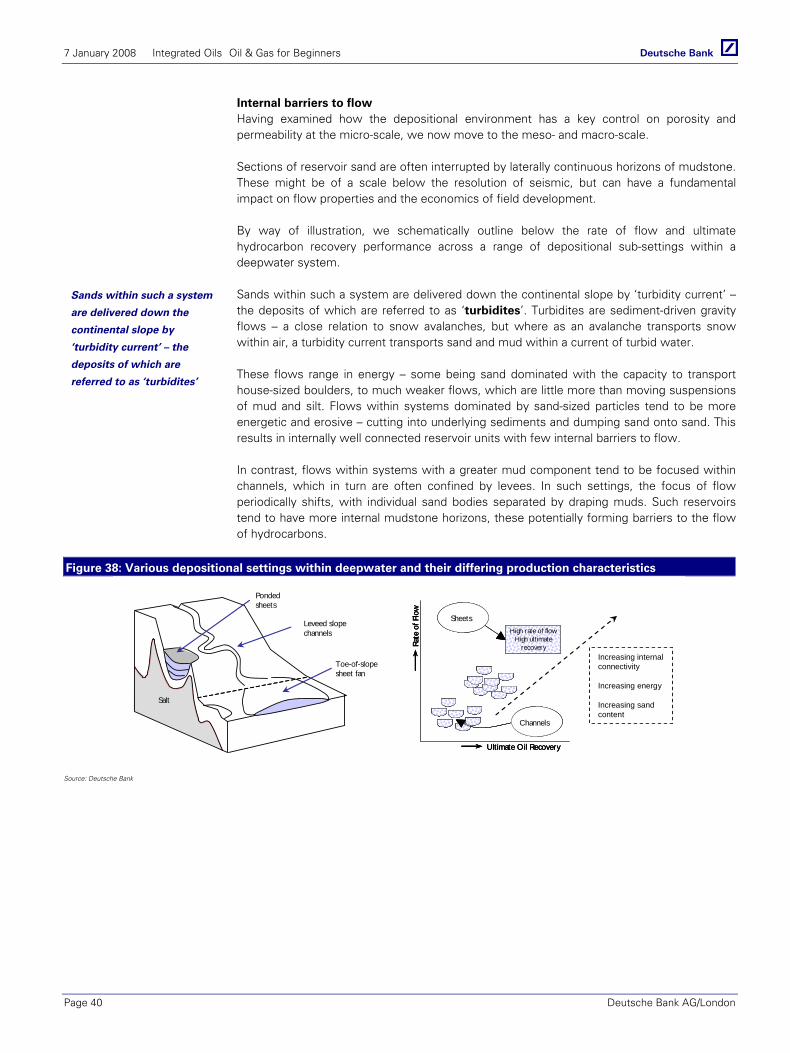
7 January 2008 Integrated Oils Oil & Gas for Beginners
Page 40 Deutsche Bank AG/London
Internal barriers to flow Having examined how the depositional environment has a key control on porosity and permeability at the micro-scale, we now move to the meso- and macro-scale.
Sections of reservoir sand are often interrupted by laterally continuous horizons of mudstone. These might be of a scale below the resolution of seismic, but can have a fundamental impact on flow properties and the economics of field development.
By way of illustration, we schematically outline below the rate of flow and ultimate hydrocarbon recovery performance across a range of depositional sub-settings within a deepwater system.
Sands within such a system are delivered down the continental slope by ‘turbidity current’ – the deposits of which are referred to as ‘turbidites’. Turbidites are sediment-driven gravity flows – a close relation to snow avalanches, but where as an avalanche transports snow within air, a turbidity current transports sand and mud within a current of turbid water.
These flows range in energy – some being sand dominated with the capacity to transport house-sized boulders, to much weaker flows, which are little more than moving suspensions of mud and silt. Flows within systems dominated by sand-sized particles tend to be more energetic and erosive – cutting into underlying sediments and dumping sand onto sand. This results in internally well connected reservoir units with few internal barriers to flow.
In contrast, flows within systems with a greater mud component tend to be focused within channels, which in turn are often confined by levees. In such settings, the focus of flow periodically shifts, with individual sand bodies separated by draping muds. Such reservoirs tend to have more internal mudstone horizons, these potentially forming barriers to the flow of hydrocarbons.
Figure 38: Various depositional settings within deepwater and their differing production characteristics
Salt
Leveed slopechannels
Pondedsheets
Toe-of-slopesheet fan
Rate
of F
low
Ultimate Oil Recovery
Channels
SheetsHigh rate of flow
High ultimaterecoveryRa
te o
f Flo
w
Ultimate Oil Recovery
Channels
SheetsHigh rate of flow
High ultimaterecoveryRa
te o
f Flo
w
Ultimate Oil Recovery
Channels
SheetsHigh rate of flow
High ultimaterecovery
Increasing internalconnectivity
Increasing energy
Increasing sandcontent
Source: Deutsche Bank
Sands within such a system
are delivered down the
continental slope by
‘turbidity current’ – the
deposits of which are
referred to as ‘turbidites’
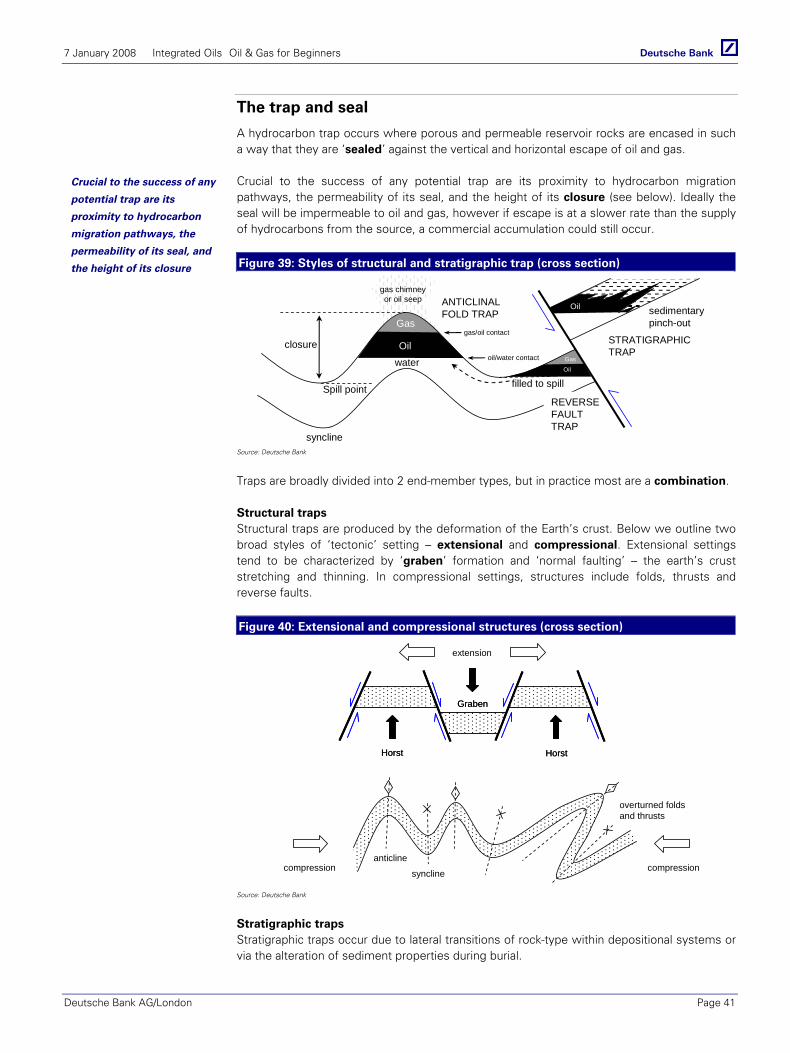
7 January 2008 Integrated Oils Oil & Gas for Beginners
Deutsche Bank AG/London Page 41
The trap and seal
A hydrocarbon trap occurs where porous and permeable reservoir rocks are encased in such a way that they are ‘sealed’ against the vertical and horizontal escape of oil and gas.
Crucial to the success of any potential trap are its proximity to hydrocarbon migration pathways, the permeability of its seal, and the height of its closure (see below). Ideally the seal will be impermeable to oil and gas, however if escape is at a slower rate than the supply of hydrocarbons from the source, a commercial accumulation could still occur.
Figure 39: Styles of structural and stratigraphic trap (cross section)
Gas
Oiloil/water contact
gas/oil contact
Gas
Oil
filled to spillSpill point
closure
Oil
water
ANTICLINALFOLD TRAP
REVERSEFAULTTRAP
STRATIGRAPHICTRAP
sedimentarypinch-out
syncline
gas chimneyor oil seep
Source: Deutsche Bank
Traps are broadly divided into 2 end-member types, but in practice most are a combination.
Structural traps Structural traps are produced by the deformation of the Earth’s crust. Below we outline two broad styles of ‘tectonic’ setting – extensional and compressional. Extensional settings tend to be characterized by ‘graben’ formation and ‘normal faulting’ – the earth’s crust stretching and thinning. In compressional settings, structures include folds, thrusts and reverse faults.
Figure 40: Extensional and compressional structures (cross section)
Horst Horst
Graben
Horst Horst
Graben
syncline
anticline
overturned foldsand thrusts
extension
compressioncompression
Source: Deutsche Bank
Stratigraphic traps Stratigraphic traps occur due to lateral transitions of rock-type within depositional systems or via the alteration of sediment properties during burial.
Crucial to the success of any
potential trap are its
proximity to hydrocarbon
migration pathways, the
permeability of its seal, and
the height of its closure
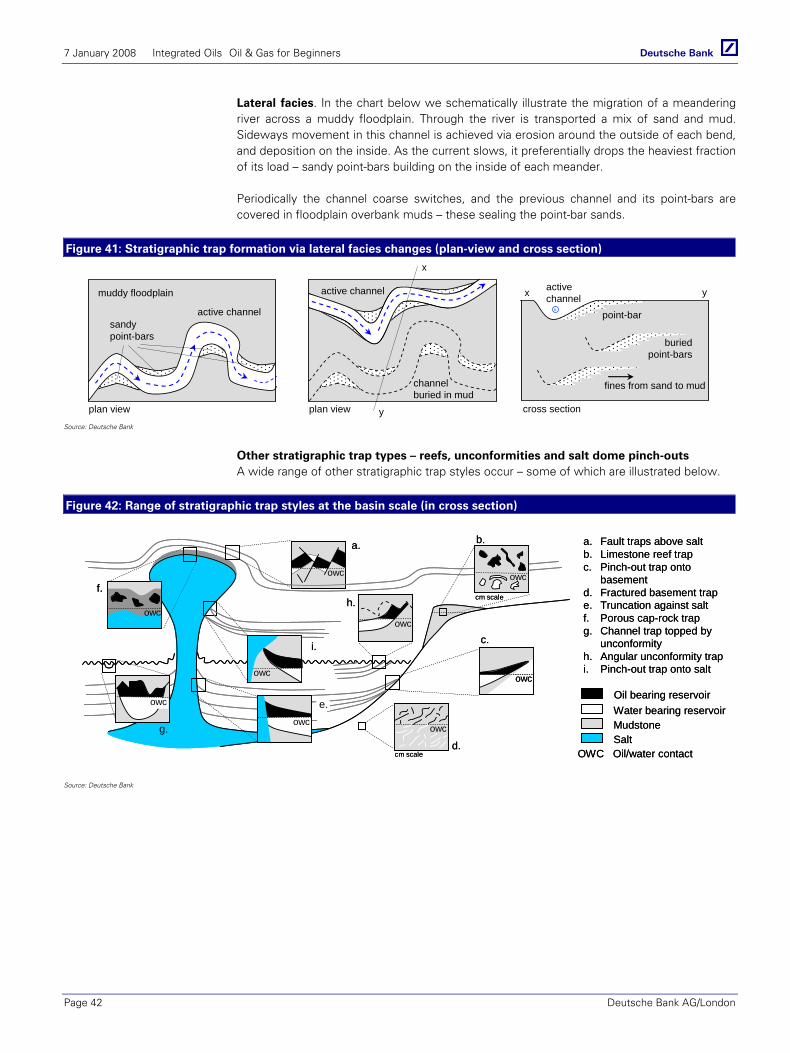
7 January 2008 Integrated Oils Oil & Gas for Beginners
Page 42 Deutsche Bank AG/London
Lateral facies. In the chart below we schematically illustrate the migration of a meandering river across a muddy floodplain. Through the river is transported a mix of sand and mud. Sideways movement in this channel is achieved via erosion around the outside of each bend, and deposition on the inside. As the current slows, it preferentially drops the heaviest fraction of its load – sandy point-bars building on the inside of each meander.
Periodically the channel coarse switches, and the previous channel and its point-bars are covered in floodplain overbank muds – these sealing the point-bar sands.
Figure 41: Stratigraphic trap formation via lateral facies changes (plan-view and cross section)
muddy floodplain
active channelsandypoint-bars
channelburied in mud
active channel
x
y
activechannel
point-bar
fines from sand to mud
buriedpoint-bars
x yx
plan view plan view cross section
Source: Deutsche Bank
Other stratigraphic trap types – reefs, unconformities and salt dome pinch-outs A wide range of other stratigraphic trap styles occur – some of which are illustrated below.
Figure 42: Range of stratigraphic trap styles at the basin scale (in cross section)
c.
owc
owc
d.
owc
a.
f.
owc
g.
owc
owc
owc
a. Fault traps above saltb. Limestone reef trapc. Pinch-out trap onto
basementd. Fractured basement trape. Truncation against saltf. Porous cap-rock trapg. Channel trap topped by
unconformityh. Angular unconformity trapi. Pinch-out trap onto salt
owc
b.
h.
i.
e.Oil bearing reservoirWater bearing reservoirMudstoneSalt
cm scale
cm scale
OWC Oil/water contact
owc
c.
owc
owc
d.
owc
a.
f.
owc
g.
owc
owc
owc
a. Fault traps above saltb. Limestone reef trapc. Pinch-out trap onto
basementd. Fractured basement trape. Truncation against saltf. Porous cap-rock trapg. Channel trap topped by
unconformityh. Angular unconformity trapi. Pinch-out trap onto salt
owcowc
b.
h.
i.
e.Oil bearing reservoirWater bearing reservoirMudstoneSalt
cm scale
cm scale
OWC Oil/water contact
owc
Source: Deutsche Bank
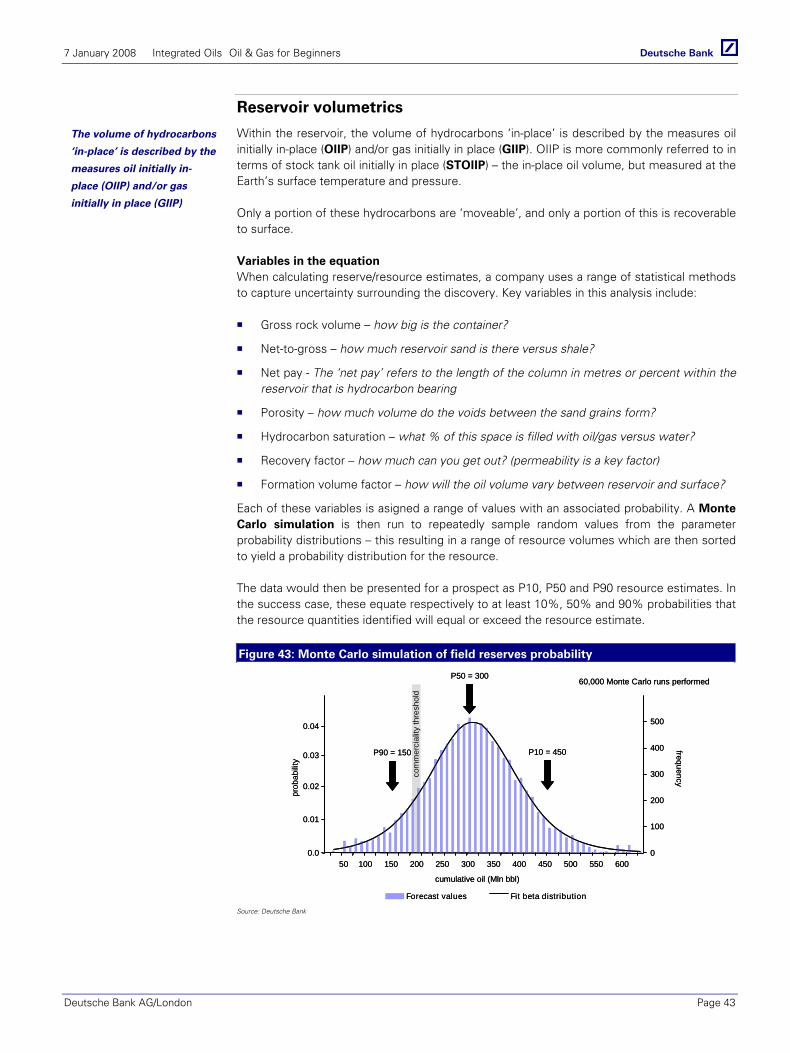
7 January 2008 Integrated Oils Oil & Gas for Beginners
Deutsche Bank AG/London Page 43
Reservoir volumetrics
Within the reservoir, the volume of hydrocarbons ‘in-place’ is described by the measures oil initially in-place (OIIP) and/or gas initially in place (GIIP). OIIP is more commonly referred to in terms of stock tank oil initially in place (STOIIP) – the in-place oil volume, but measured at the Earth’s surface temperature and pressure.
Only a portion of these hydrocarbons are ‘moveable’, and only a portion of this is recoverable to surface.
Variables in the equation When calculating reserve/resource estimates, a company uses a range of statistical methods to capture uncertainty surrounding the discovery. Key variables in this analysis include:
Gross rock volume – how big is the container?
Net-to-gross – how much reservoir sand is there versus shale?
Net pay - The ‘net pay’ refers to the length of the column in metres or percent within the reservoir that is hydrocarbon bearing
Porosity – how much volume do the voids between the sand grains form?
Hydrocarbon saturation – what % of this space is filled with oil/gas versus water?
Recovery factor – how much can you get out? (permeability is a key factor)
Formation volume factor – how will the oil volume vary between reservoir and surface?
Each of these variables is asigned a range of values with an associated probability. A Monte Carlo simulation is then run to repeatedly sample random values from the parameter probability distributions – this resulting in a range of resource volumes which are then sorted to yield a probability distribution for the resource.
The data would then be presented for a prospect as P10, P50 and P90 resource estimates. In the success case, these equate respectively to at least 10%, 50% and 90% probabilities that the resource quantities identified will equal or exceed the resource estimate.
Figure 43: Monte Carlo simulation of field reserves probability
0.0
0.01
0.02
0.03
0.04
0
100
200
300
400
500
Forecast values Fit beta distribution
50 100 150 200 250 300 350 400 450 500 550 600
cumulative oil (Mln bbl)
frequency
prob
abilit
y
P90 = 150 P10 = 450
P50 = 30060,000 Monte Carlo runs performed
0.0
0.01
0.02
0.03
0.04
0
100
200
300
400
500
Forecast values Fit beta distribution
50 100 150 200 250 300 350 400 450 500 550 600
cumulative oil (Mln bbl)
frequency
prob
abilit
y
P90 = 150 P10 = 450
P50 = 30060,000 Monte Carlo runs performed
com
mer
cial
ity th
resh
old
Source: Deutsche Bank
The volume of hydrocarbons
‘in-place’ is described by the
measures oil initially in-
place (OIIP) and/or gas
initially in place (GIIP)

7 January 2008 Integrated Oils Oil & Gas for Beginners
Page 44 Deutsche Bank AG/London
Getting it out The Life Cycle of a Basin
Hydrocarbon basins typically follow a lifecycle of licensing-exploration-development-decline-abandonment. The maturity of a basin is important for a variety of reasons, including:
Tax and incentives that the host nation needs to put in place to attract investments.
State revenues and national budget planning.
Which companies will be most interested in investing; IOCs, independents or mature field specialists for example.
Licensing – establish some legal rights Before any exploration work can start in an unexplored basin, there needs to be a legal
framework put in place so that oil companies have some assurance that they will have a legal right to make money out of any discoveries.
Host governments usually auction leases for exploration acreage at regular intervals and occasionally will commission seismic surveys of the acreage under offer to provide some basic information to prospective bidders. Assuming the acreage is of interest to the industry, bids will all be submitted by a certain cut-off date. Each bid may include an upfront fee, and often has other commitments, such as to acquire a certain amount of seismic data, and/or drill at least a specified number of exploration wells. Lease durations vary greatly around the world; UK licenses are typically awarded for 25 years, whereas in the US the usual initial term is 10 years, although these can usually be extended for a fee or further work commitment. The lease is usually awarded under one of two fiscal regimes; production sharing contracts (PSCs) or tax and royalty concession (see section on taxation).
Exploration – still a high risk game Once acreage is obtained, the oil company will usually commission a seismic survey, from which potential reservoir targets are selected. Once the targets have been ranked in order of attractiveness, a drilling company and associated service companies (supply boats, helicopters, cementing, mud logging etc) are hired and the target is ‘drilled up’. With a mixture of skill and luck the oil company will hopefully make a discovery at some point in its drilling campaign, however even with the advantage of modern seismic the chance of finding commercial oil or gas is still less than 20%.
Assuming a commercial discovery is eventually made then usually a flurry of industry interest will result, and bids for new acreage will often skyrocket.
Development – put the infrastructure in place After discoveries the challenge is to develop the fields, which can take a surprisingly long time. In the following figure for the Northern North Sea for example, the delay of 12 years between a peak in discoveries and peak in production is high, but not uncommon.
Development involves drilling all the production (and if need be, injection) wells, and building infrastructure such as platforms, pipelines, processing plants and possibly export terminals. The development phase for large fields can involve huge capex outlays, and depending on local regulations, can kick start a significant local services industry such as in the UK or Norway.
Hydrocarbon basins
typically follow a lifecycle of
licensing-exploration-
development-decline-
abandonment.

7 January 2008 Integrated Oils Oil & Gas for Beginners
Deutsche Bank AG/London Page 45
Figure 44: North North Sea (UK) discoveries and production, 1971-2031
0
500
1000
1500
2000
2500
3000
1971
1974
1977
1980
1983
1986
1989
1992
1995
1998
2001
2004
2007
2010
2013
2016
2019
2022
2025
2028
2031
mm
bbls
0
500
1000
1500
2000
2500
kb/d
Discoveries Production
Source: Deutsche Bank, Wood Mackenzie
In an ideal world the total oil waiting to be discovered in a basin would be known to all parties. The government could ensure it creates terms that maximise its revenues, could make long term economic plans, oil companies could drill with greater certainty of success and the service industry could be established knowing the appropriate amount of work is inevitably going to be forthcoming. Unfortunately we don’t live in an ideal world; the best the industry can do is make estimates of what reserves remain to be discovered and, as the following figure shows, such estimates can be highly inaccurate until quite late in the basin’s (or field) life.
Figure 45: Typical progression of field reserve estimates over time
exploration productionappraisal
0 time abandonment
Ran
ge in
rese
rve
estim
ates
Ultimaterecovery
Expected reserves
Lower limit of estimate
Upper limit of estimate
exploration productionappraisal
0 time abandonment
Ran
ge in
rese
rve
estim
ates
Ultimaterecovery
Expected reserves
Lower limit of estimate
Upper limit of estimate
Source: Deutsche Bank
Early in a basin’s life the approach to estimating ultimate basin reserves is to use so called ‘creaming curves’.
A creaming curve is a plot of cumulative discoveries versus cumulative wells, as shown in the following left hand figure. The reserves growth curve shown on the right (cumulative discoveries by year) is often also labelled as a creaming curve, which is not strictly correct.
Early in a basin’s life the
approach to estimating
ultimate basin reserves is to
use so called ‘creaming
curves’
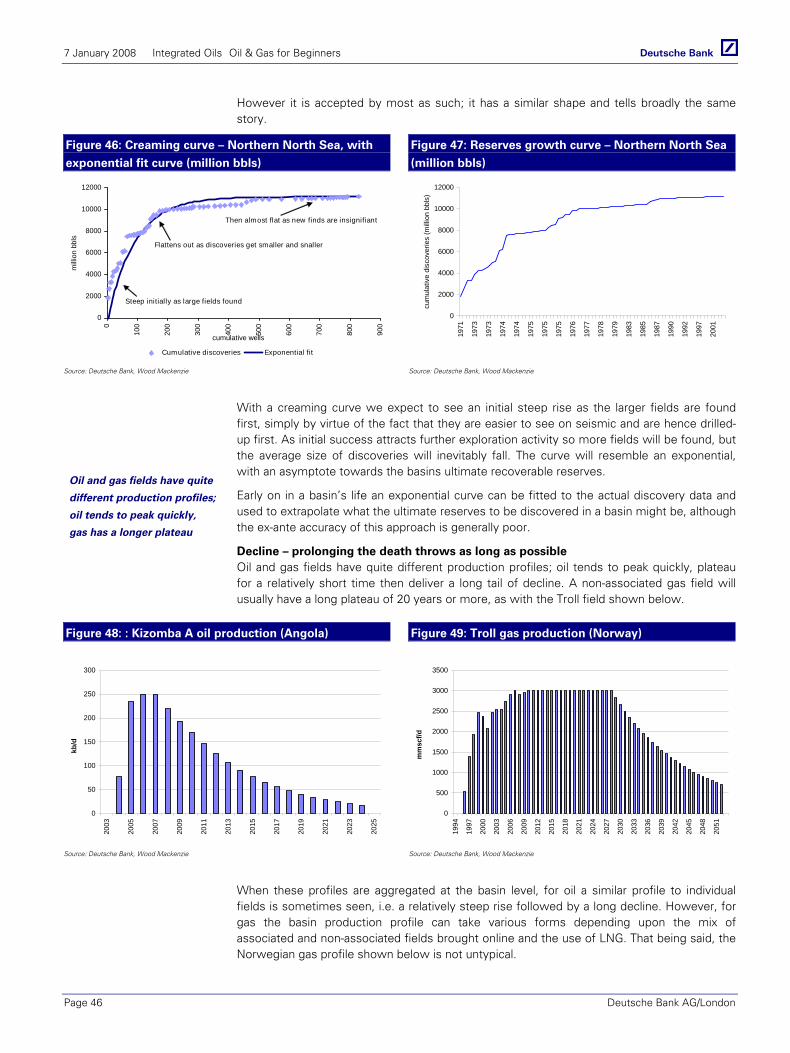
7 January 2008 Integrated Oils Oil & Gas for Beginners
Page 46 Deutsche Bank AG/London
However it is accepted by most as such; it has a similar shape and tells broadly the same story.
Figure 46: Creaming curve – Northern North Sea, with
exponential fit curve (million bbls)
Figure 47: Reserves growth curve – Northern North Sea
(million bbls)
0
2000
4000
6000
8000
10000
12000
0
100
200
300
400
500
600
700
800
900
cumulative wells
mill
ion
bbls
Cumulative discoveries Exponential fit
Steep initially as large fields found
Flattens out as discoveries get smaller and snaller
Then almost flat as new finds are insignifiant
0
2000
4000
6000
8000
10000
12000
1971
1973
1973
1974
1974
1975
1975
1975
1976
1977
1978
1979
1983
1985
1987
1990
1992
1997
2001
cum
ulat
ive
disc
over
ies
(mill
ion
bbls
)
Source: Deutsche Bank, Wood Mackenzie Source: Deutsche Bank, Wood Mackenzie
With a creaming curve we expect to see an initial steep rise as the larger fields are found first, simply by virtue of the fact that they are easier to see on seismic and are hence drilled-up first. As initial success attracts further exploration activity so more fields will be found, but the average size of discoveries will inevitably fall. The curve will resemble an exponential, with an asymptote towards the basins ultimate recoverable reserves.
Early on in a basin’s life an exponential curve can be fitted to the actual discovery data and used to extrapolate what the ultimate reserves to be discovered in a basin might be, although the ex-ante accuracy of this approach is generally poor.
Decline – prolonging the death throws as long as possible Oil and gas fields have quite different production profiles; oil tends to peak quickly, plateau for a relatively short time then deliver a long tail of decline. A non-associated gas field will usually have a long plateau of 20 years or more, as with the Troll field shown below.
Figure 48: : Kizomba A oil production (Angola) Figure 49: Troll gas production (Norway)
0
50
100
150
200
250
300
2003
2005
2007
2009
2011
2013
2015
2017
2019
2021
2023
2025
kb/d
0
500
1000
1500
2000
2500
3000
3500
1994
1997
2000
2003
2006
2009
2012
2015
2018
2021
2024
2027
2030
2033
2036
2039
2042
2045
2048
2051
mm
scf/d
Source: Deutsche Bank, Wood Mackenzie Source: Deutsche Bank, Wood Mackenzie
When these profiles are aggregated at the basin level, for oil a similar profile to individual fields is sometimes seen, i.e. a relatively steep rise followed by a long decline. However, for gas the basin production profile can take various forms depending upon the mix of associated and non-associated fields brought online and the use of LNG. That being said, the Norwegian gas profile shown below is not untypical.
Oil and gas fields have quite
different production profiles;
oil tends to peak quickly,
gas has a longer plateau
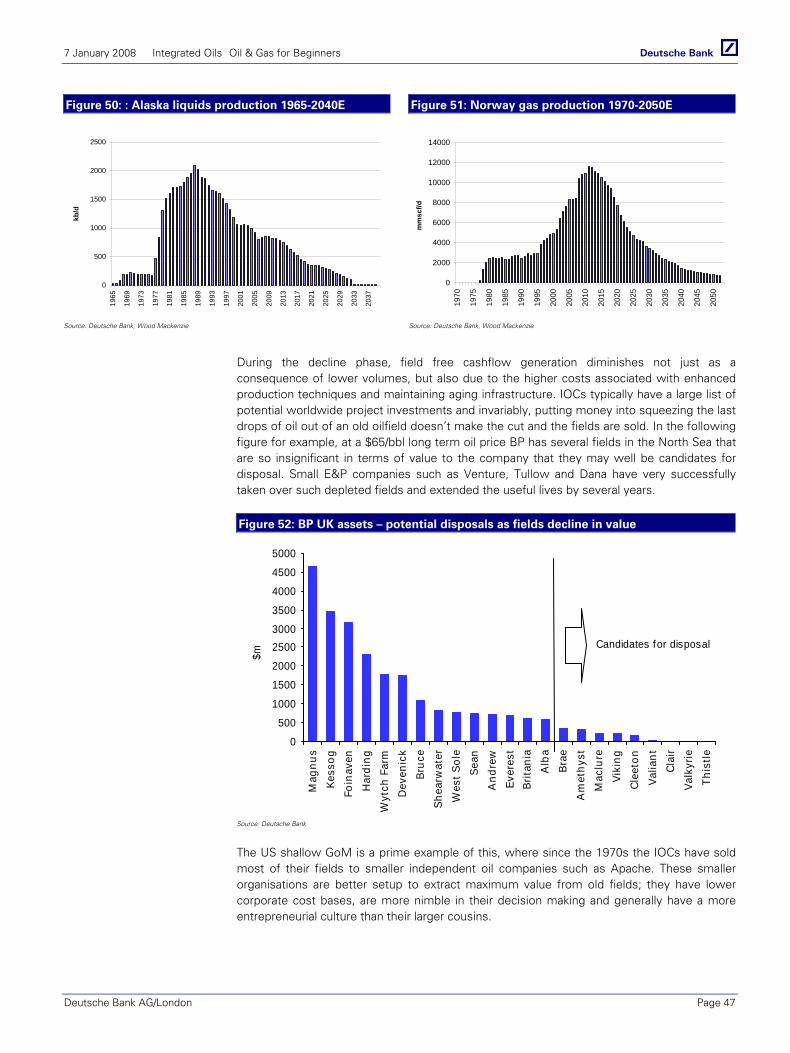
7 January 2008 Integrated Oils Oil & Gas for Beginners
Deutsche Bank AG/London Page 47
Figure 50: : Alaska liquids production 1965-2040E Figure 51: Norway gas production 1970-2050E
0
500
1000
1500
2000
2500
1965
1969
1973
1977
1981
1985
1989
1993
1997
2001
2005
2009
2013
2017
2021
2025
2029
2033
2037
kb/d
0
2000
4000
6000
8000
10000
12000
14000
1970
1975
1980
1985
1990
1995
2000
2005
2010
2015
2020
2025
2030
2035
2040
2045
2050
mm
scf/d
Source: Deutsche Bank, Wood Mackenzie Source: Deutsche Bank, Wood Mackenzie
During the decline phase, field free cashflow generation diminishes not just as a consequence of lower volumes, but also due to the higher costs associated with enhanced production techniques and maintaining aging infrastructure. IOCs typically have a large list of potential worldwide project investments and invariably, putting money into squeezing the last drops of oil out of an old oilfield doesn’t make the cut and the fields are sold. In the following figure for example, at a $65/bbl long term oil price BP has several fields in the North Sea that are so insignificant in terms of value to the company that they may well be candidates for disposal. Small E&P companies such as Venture, Tullow and Dana have very successfully taken over such depleted fields and extended the useful lives by several years.
Figure 52: BP UK assets – potential disposals as fields decline in value
0
500
1000
1500
2000
25003000
3500
4000
4500
5000
Mag
nus
Kess
ogFo
inav
enH
ardi
ngW
ytch
Far
mD
even
ick
Bruc
eSh
earw
ater
Wes
t Sol
eSe
anA
ndre
wEv
eres
tBr
itani
aA
lba
Brae
Am
ethy
stM
aclu
reVi
king
Clee
ton
Valia
ntCl
air
Valk
yrie
This
tle
$m
Candidates for disposal
Source: Deutsche Bank
The US shallow GoM is a prime example of this, where since the 1970s the IOCs have sold most of their fields to smaller independent oil companies such as Apache. These smaller organisations are better setup to extract maximum value from old fields; they have lower corporate cost bases, are more nimble in their decision making and generally have a more entrepreneurial culture than their larger cousins.
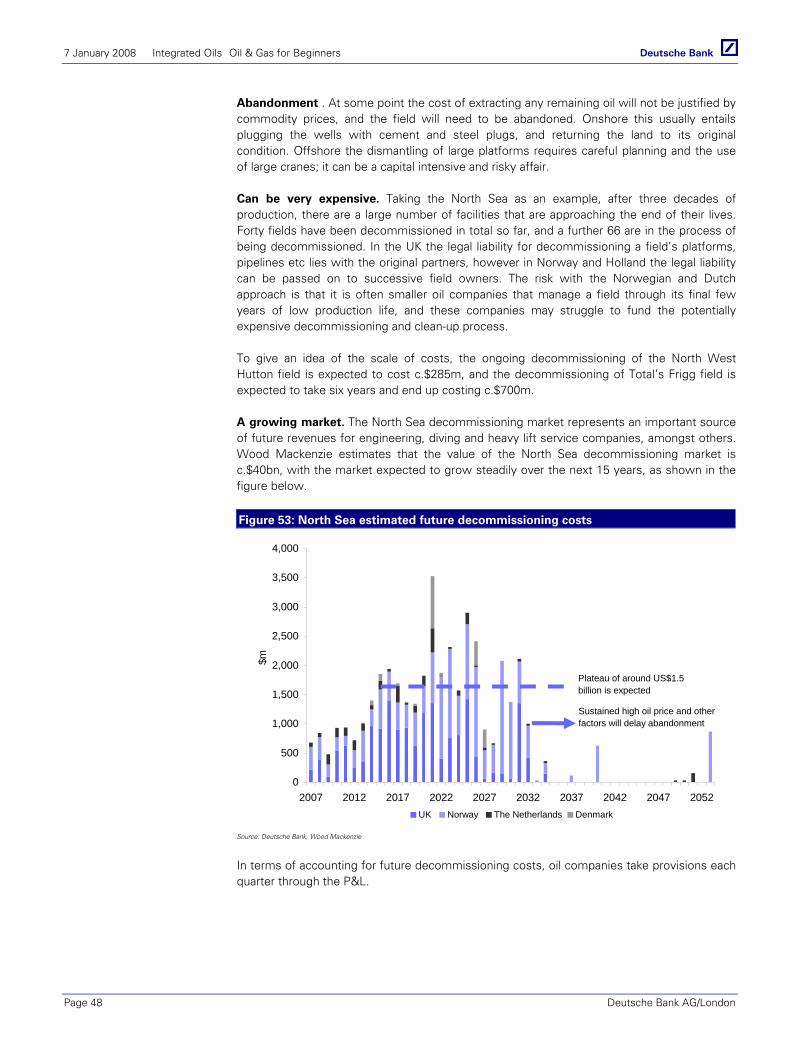
7 January 2008 Integrated Oils Oil & Gas for Beginners
Page 48 Deutsche Bank AG/London
Abandonment . At some point the cost of extracting any remaining oil will not be justified by commodity prices, and the field will need to be abandoned. Onshore this usually entails plugging the wells with cement and steel plugs, and returning the land to its original condition. Offshore the dismantling of large platforms requires careful planning and the use of large cranes; it can be a capital intensive and risky affair.
Can be very expensive. Taking the North Sea as an example, after three decades of production, there are a large number of facilities that are approaching the end of their lives. Forty fields have been decommissioned in total so far, and a further 66 are in the process of being decommissioned. In the UK the legal liability for decommissioning a field’s platforms, pipelines etc lies with the original partners, however in Norway and Holland the legal liability can be passed on to successive field owners. The risk with the Norwegian and Dutch approach is that it is often smaller oil companies that manage a field through its final few years of low production life, and these companies may struggle to fund the potentially expensive decommissioning and clean-up process.
To give an idea of the scale of costs, the ongoing decommissioning of the North West Hutton field is expected to cost c.$285m, and the decommissioning of Total’s Frigg field is expected to take six years and end up costing c.$700m.
A growing market. The North Sea decommissioning market represents an important source of future revenues for engineering, diving and heavy lift service companies, amongst others. Wood Mackenzie estimates that the value of the North Sea decommissioning market is c.$40bn, with the market expected to grow steadily over the next 15 years, as shown in the figure below.
Figure 53: North Sea estimated future decommissioning costs
0
500
1,000
1,500
2,000
2,500
3,000
3,500
4,000
2007 2012 2017 2022 2027 2032 2037 2042 2047 2052
$m
UK Norway The Netherlands Denmark
Plateau of around US$1.5 billion is expected
Sustained high oil price and other factors will delay abandonment
Source: Deutsche Bank, Wood Mackenzie
In terms of accounting for future decommissioning costs, oil companies take provisions each quarter through the P&L.
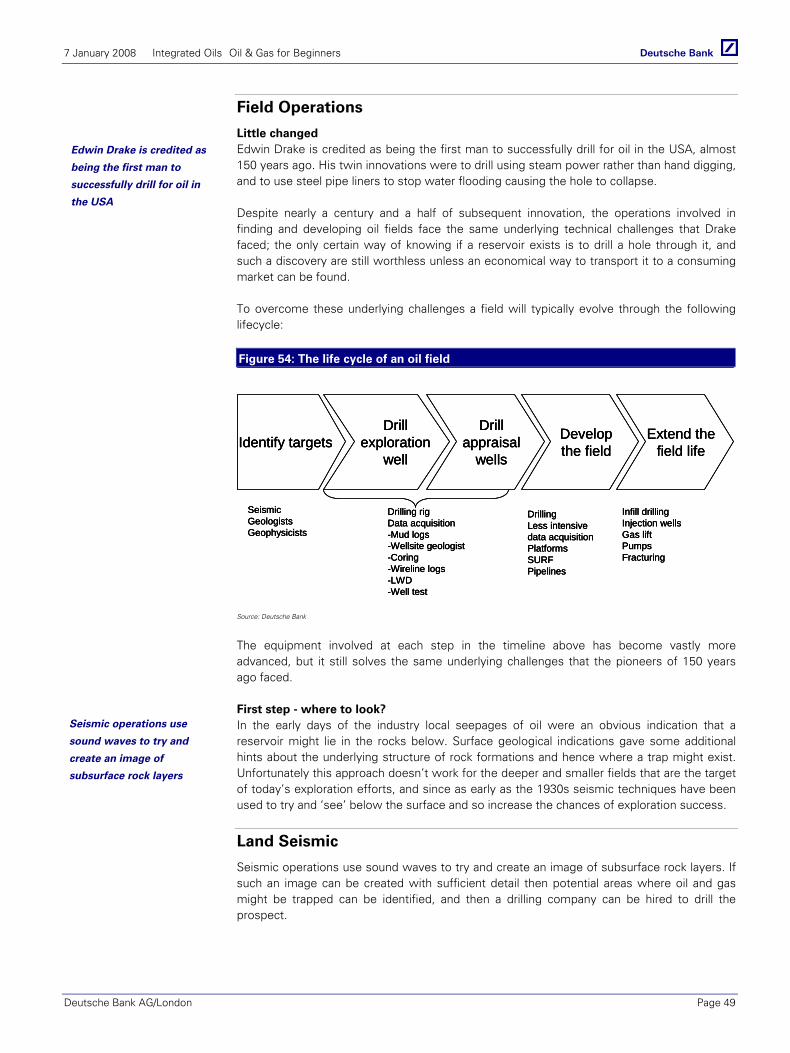
7 January 2008 Integrated Oils Oil & Gas for Beginners
Deutsche Bank AG/London Page 49
Field Operations
Little changed Edwin Drake is credited as being the first man to successfully drill for oil in the USA, almost 150 years ago. His twin innovations were to drill using steam power rather than hand digging, and to use steel pipe liners to stop water flooding causing the hole to collapse.
Despite nearly a century and a half of subsequent innovation, the operations involved in finding and developing oil fields face the same underlying technical challenges that Drake faced; the only certain way of knowing if a reservoir exists is to drill a hole through it, and such a discovery are still worthless unless an economical way to transport it to a consuming market can be found.
To overcome these underlying challenges a field will typically evolve through the following lifecycle:
Figure 54: The life cycle of an oil field
Identify targetsDrill
exploration well
Drill appraisal
wells
Extend the field life
Develop the field
SeismicGeologistsGeophysicists
Infill drillingInjection wellsGas liftPumpsFracturing
Drilling Less intensive data acquisitionPlatformsSURFPipelines
Drilling rigData acquisition-Mud logs-Wellsite geologist-Coring-Wireline logs-LWD-Well test
Source: Deutsche Bank
The equipment involved at each step in the timeline above has become vastly more advanced, but it still solves the same underlying challenges that the pioneers of 150 years ago faced.
First step - where to look? In the early days of the industry local seepages of oil were an obvious indication that a reservoir might lie in the rocks below. Surface geological indications gave some additional hints about the underlying structure of rock formations and hence where a trap might exist. Unfortunately this approach doesn’t work for the deeper and smaller fields that are the target of today’s exploration efforts, and since as early as the 1930s seismic techniques have been used to try and ‘see’ below the surface and so increase the chances of exploration success.
Land Seismic
Seismic operations use sound waves to try and create an image of subsurface rock layers. If such an image can be created with sufficient detail then potential areas where oil and gas might be trapped can be identified, and then a drilling company can be hired to drill the prospect.
Edwin Drake is credited as
being the first man to
successfully drill for oil in
the USA
Seismic operations use
sound waves to try and
create an image of
subsurface rock layers
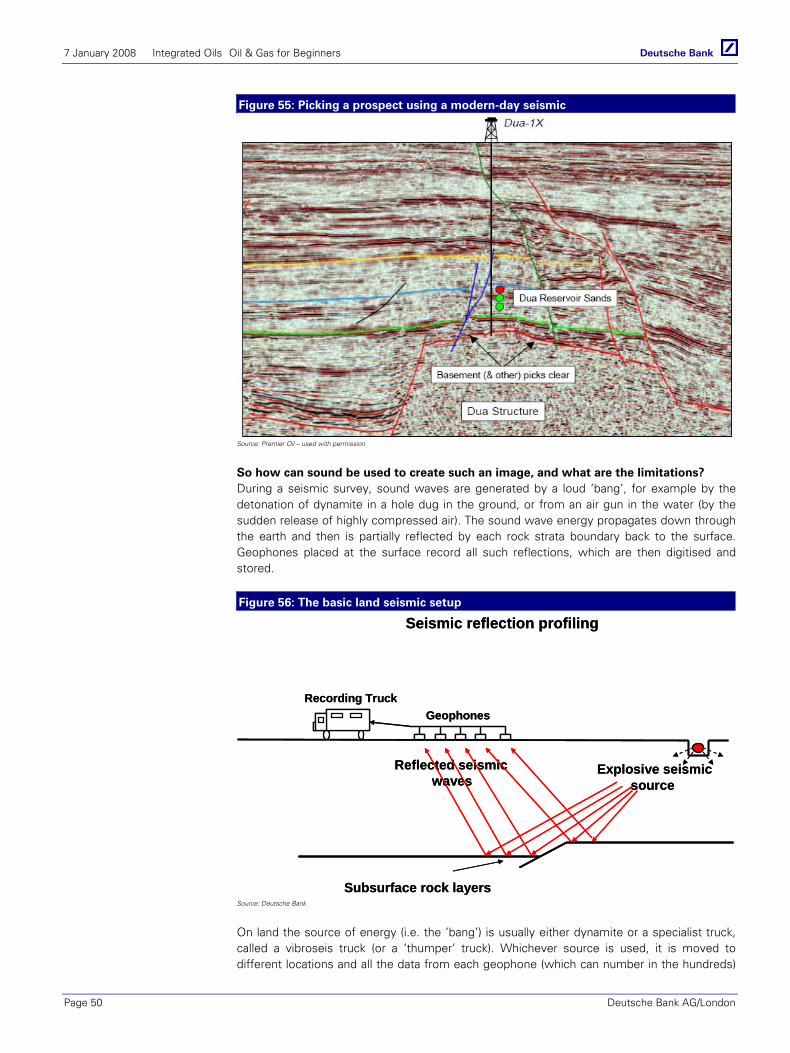
7 January 2008 Integrated Oils Oil & Gas for Beginners
Page 50 Deutsche Bank AG/London
Figure 55: Picking a prospect using a modern-day seismic
Source: Premier Oil – used with permission
So how can sound be used to create such an image, and what are the limitations? During a seismic survey, sound waves are generated by a loud ‘bang’, for example by the detonation of dynamite in a hole dug in the ground, or from an air gun in the water (by the sudden release of highly compressed air). The sound wave energy propagates down through the earth and then is partially reflected by each rock strata boundary back to the surface. Geophones placed at the surface record all such reflections, which are then digitised and stored.
Figure 56: The basic land seismic setup
Subsurface rock layers
Explosive seismicsource
Reflected seismicwaves
Recording Truck
Seismic reflection profiling
Geophones
Subsurface rock layers
Explosive seismicsource
Reflected seismicwaves
Recording Truck
Seismic reflection profiling
Geophones
Source: Deutsche Bank
On land the source of energy (i.e. the ‘bang’) is usually either dynamite or a specialist truck, called a vibroseis truck (or a ‘thumper’ truck). Whichever source is used, it is moved to different locations and all the data from each geophone (which can number in the hundreds)

7 January 2008 Integrated Oils Oil & Gas for Beginners
Deutsche Bank AG/London Page 51
is recorded for each shot. At the end of a seismic survey there is a vast amount of data that in its raw form is useless – it is just a load of squiggles that require significant amounts of processing.
Processing and interpretation is not straight forward The processing is an exercise in reverse engineering. It has to try and deliver a model of the earth’s crust that fits the recorded data and the energy source used. The recorded data is the source ‘bang’ after having been modified by the earth’s rock and the geophones. Mathematically, backing out a model of the rock formation given the recorded data and the source wavelet is a ‘de-convolution’ problem. This is easy enough to complete using today’s computers, but is complicated by several factors that conspire to make the process of seismic processing and interpretation as much an art as a science:
The geophones and recording system introduce distortions – i.e. what gets recorded is not exactly what arrived at the geophones.
The signal to noise (S/N) ratio decreases with depth – the deeper the reflections have travelled to and from, the more attenuated the energy is, and the lower the S/N ratio is. Lower S/N ratios imply less reliable processed results.
Filters are applied to the recorded data to try and remove distortions introduced by equipment and setup, but such filters invariably also remove some useful information, and so decrease the S/N ratio.
Mathematically there may be multiple possible solutions (i.e. models of a sequence of reflective layers in the earths crust) that fit the data. The results can therefore be ambiguous.
The solution is often very sensitive to small changes in applied filters and other model assumptions.
Results are in time, not depth. Seismic processing results in a picture that is scaled in time, rather than depth. Estimates of velocity of sound in rock can be made to try and convert the seismic image to depth (rather than time), but this is inaccurate and can result in the estimated depth of an identified target reservoir being wrong by several hundred feet. From a drilling perspective hitting potential reservoirs much higher than expected is potentially dangerous.
Surface seismic can be accurately tied into depth by the use of well bore seismic data (see later), but unfortunately this can only be performed once an exploration well has been drilled – a chicken and egg scenario. The end result is that for wildcat exploration wells, despite all the sophistication of modern seismic, as the drill bit gets anywhere near any targeted horizons great care must be taken.
Offshore seismic
Offshore seismic is logistically easier than land based operations as there is no need to continuously move geophones around by hand and dig holes for explosive devices (not to mention dealing with a local population that might not be too keen on dynamite blowing up bits of their land). However the nature of a modern offshore seismic acquisition vessel means that it is a far more capital intensive operation than land. A modern acquisition vessel can cost $250m and due to the wear and tear of its salt water based operations, generally the expensive seismic cables, streamers, airguns and hydrophones (the water-based equivalent of geophones) must be replaced every six years.
Seismic processing results
in a picture that is scaled in
time, rather than depth.
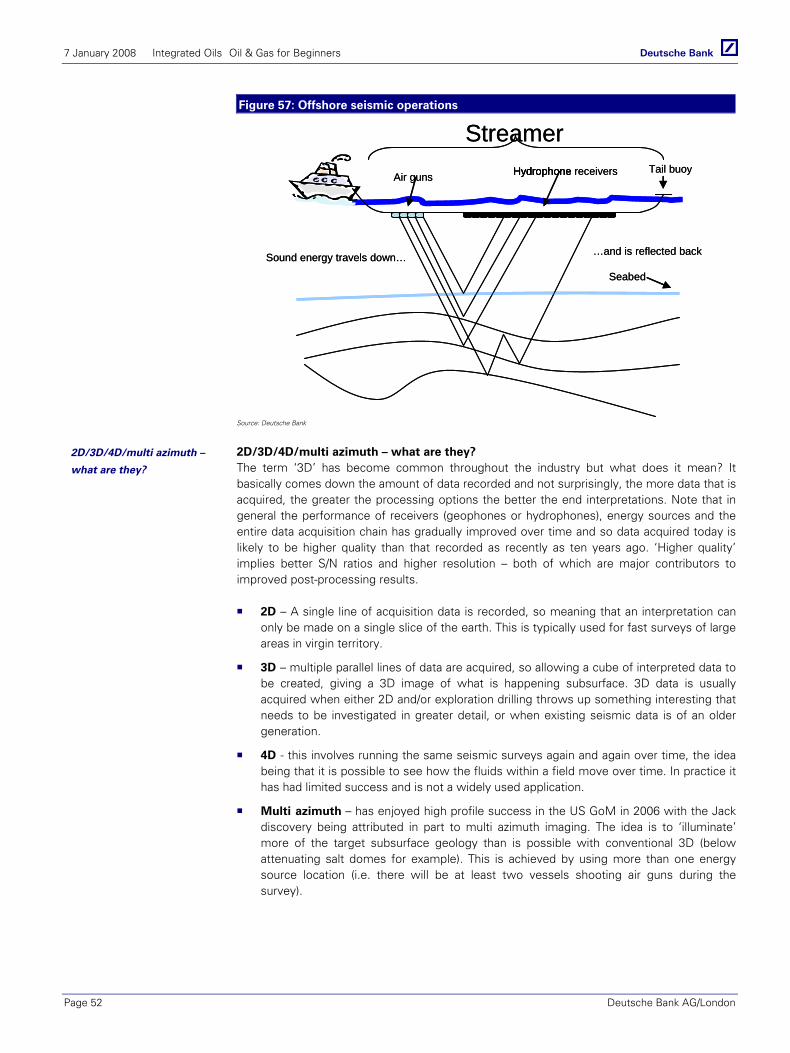
7 January 2008 Integrated Oils Oil & Gas for Beginners
Page 52 Deutsche Bank AG/London
Figure 57: Offshore seismic operations
Tail buoyHydrophoneAir guns
StreamerHydrophone receivers
Seabed
Sound energy travels down… …and is reflected back
Tail buoyHydrophoneAir guns
StreamerHydrophone receivers
Seabed
Sound energy travels down… …and is reflected back
Source: Deutsche Bank
2D/3D/4D/multi azimuth – what are they? The term ‘3D’ has become common throughout the industry but what does it mean? It basically comes down the amount of data recorded and not surprisingly, the more data that is acquired, the greater the processing options the better the end interpretations. Note that in general the performance of receivers (geophones or hydrophones), energy sources and the entire data acquisition chain has gradually improved over time and so data acquired today is likely to be higher quality than that recorded as recently as ten years ago. ‘Higher quality’ implies better S/N ratios and higher resolution – both of which are major contributors to improved post-processing results.
2D – A single line of acquisition data is recorded, so meaning that an interpretation can only be made on a single slice of the earth. This is typically used for fast surveys of large areas in virgin territory.
3D – multiple parallel lines of data are acquired, so allowing a cube of interpreted data to be created, giving a 3D image of what is happening subsurface. 3D data is usually acquired when either 2D and/or exploration drilling throws up something interesting that needs to be investigated in greater detail, or when existing seismic data is of an older generation.
4D - this involves running the same seismic surveys again and again over time, the idea being that it is possible to see how the fluids within a field move over time. In practice it has had limited success and is not a widely used application.
Multi azimuth – has enjoyed high profile success in the US GoM in 2006 with the Jack discovery being attributed in part to multi azimuth imaging. The idea is to ‘illuminate’ more of the target subsurface geology than is possible with conventional 3D (below attenuating salt domes for example). This is achieved by using more than one energy source location (i.e. there will be at least two vessels shooting air guns during the survey).
2D/3D/4D/multi azimuth –
what are they?

7 January 2008 Integrated Oils Oil & Gas for Beginners
Deutsche Bank AG/London Page 53
Assessing risk and reward
Once the geophysicists have identified a set of targets, the next step is to assess the likelihood of discovering an active hydrocarbon system.
Exploration for, and appraisal and development of, oil and gas is an exercise in risk management. In 1997, Chevron published a land-mark paper outlining its approach to risk assessment – defining geologic success (Pg) as the product of the probabilities of 4 principle elements that must coinside in order to accumulate oil & gas in economic quantities: source, reservoir, trap/seal and their connection within a ‘dynamic’ system where each can interact with the other.
Pg = Psource x Preservoir x Ptrap x Pdynamics
The table below outlines the general distribution of project risking through a typical cycle of exploration/appraisal/development activity.
Figure 58: Geological success within differing scenarios
Source: Otis & Schneidermann, AAPG Bulletin 81, Deutsche Bank
Following the identification of a prospect on seismic, key steps in the reduction of uncertainty include drilling or ‘spudding’ the first exploration well often termed the ‘wild cat’, and testing that well – testing providing tangible evidence on which meaningfull recoverable reserve estimates can be made. Note that the date on which a wild-cat well is spudded refers to that on which it first breaks ground.
Exploration for, and
appraisal and development
of, oil and gas is an exercise
in risk management.
Producing area Emerging area Frontier
Same PlayAdjacent Structure
Same PlayNearby Structure
New Play – Same TrendOld Play – New Trend
New Play – New Basinor Play with Negative Data
Very Low Risk
Low Risk
ModerateRisk
High Risk
Very High Risk
Avg Pg = 0.375 Avg Pg = 0.183
Pg = probability of geological success
75%
50%
38%
25%18%
13%9%
1%0%
10%
20%
30%
40%
50%
60%
70%
80%
Appraisal ExplorationDevelopment
Pg >75% 75% - 20% 20% - 0%
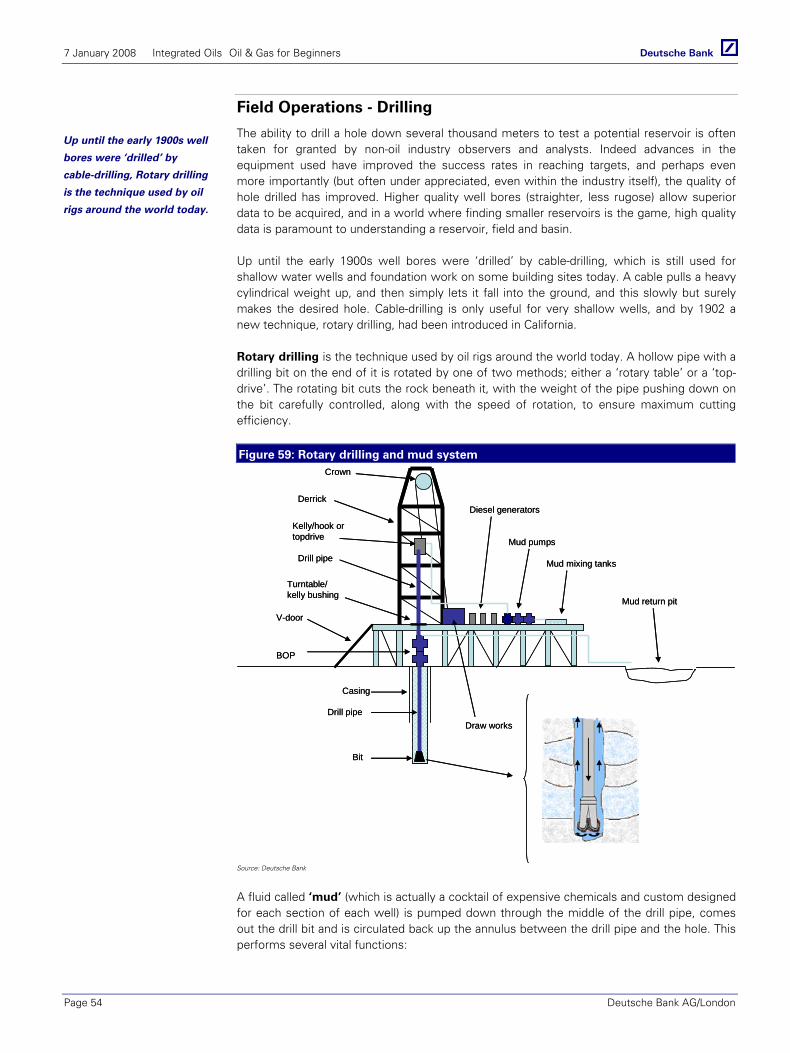
7 January 2008 Integrated Oils Oil & Gas for Beginners
Page 54 Deutsche Bank AG/London
Field Operations - Drilling
The ability to drill a hole down several thousand meters to test a potential reservoir is often taken for granted by non-oil industry observers and analysts. Indeed advances in the equipment used have improved the success rates in reaching targets, and perhaps even more importantly (but often under appreciated, even within the industry itself), the quality of hole drilled has improved. Higher quality well bores (straighter, less rugose) allow superior data to be acquired, and in a world where finding smaller reservoirs is the game, high quality data is paramount to understanding a reservoir, field and basin.
Up until the early 1900s well bores were ‘drilled’ by cable-drilling, which is still used for shallow water wells and foundation work on some building sites today. A cable pulls a heavy cylindrical weight up, and then simply lets it fall into the ground, and this slowly but surely makes the desired hole. Cable-drilling is only useful for very shallow wells, and by 1902 a new technique, rotary drilling, had been introduced in California.
Rotary drilling is the technique used by oil rigs around the world today. A hollow pipe with a drilling bit on the end of it is rotated by one of two methods; either a ‘rotary table’ or a ‘top-drive’. The rotating bit cuts the rock beneath it, with the weight of the pipe pushing down on the bit carefully controlled, along with the speed of rotation, to ensure maximum cutting efficiency.
Figure 59: Rotary drilling and mud system
Drill pipe
Casing
Bit
V-door
Derrick
Crown
Draw works
Kelly/hook or topdrive
Drill pipe
Turntable/kelly bushing
Diesel generators
Mud return pit
Mud pumps
Mud mixing tanks
BOP
Drill pipe
Casing
Bit
V-door
Derrick
Crown
Draw works
Kelly/hook or topdrive
Drill pipe
Turntable/kelly bushing
Diesel generators
Mud return pit
Mud pumps
Mud mixing tanks
BOP
Source: Deutsche Bank
A fluid called ‘mud’ (which is actually a cocktail of expensive chemicals and custom designed for each section of each well) is pumped down through the middle of the drill pipe, comes out the drill bit and is circulated back up the annulus between the drill pipe and the hole. This performs several vital functions:
Up until the early 1900s well
bores were ‘drilled’ by
cable-drilling, Rotary drilling
is the technique used by oil
rigs around the world today.
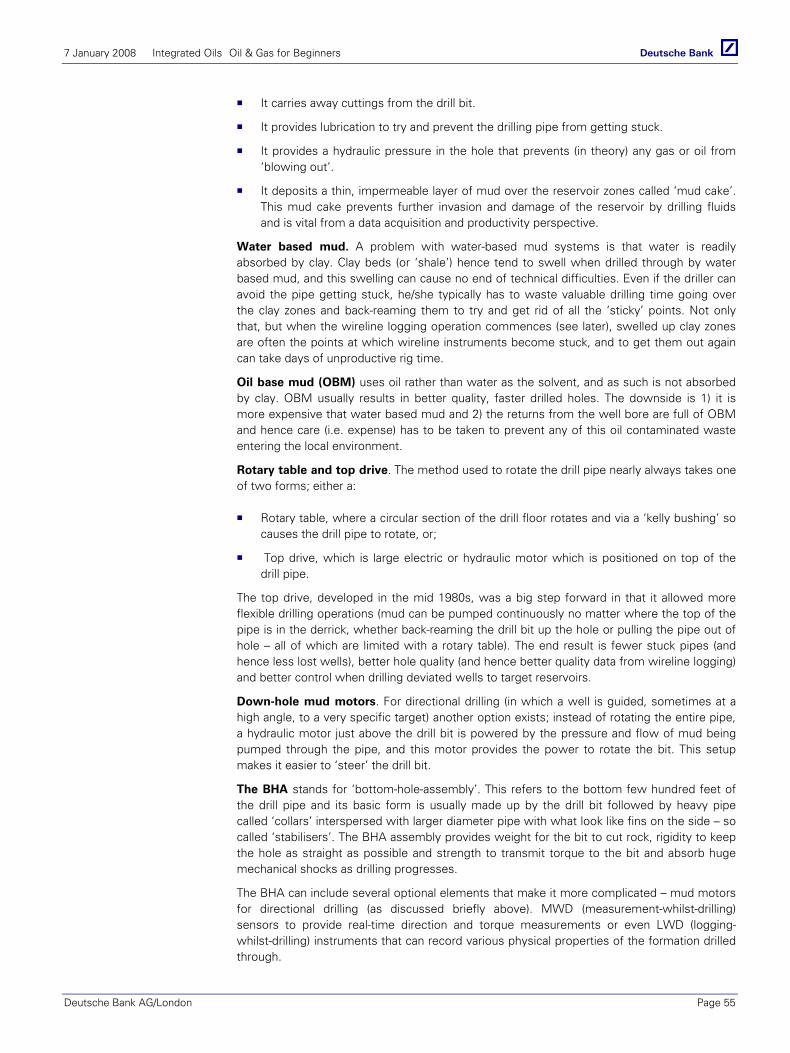
7 January 2008 Integrated Oils Oil & Gas for Beginners
Deutsche Bank AG/London Page 55
It carries away cuttings from the drill bit.
It provides lubrication to try and prevent the drilling pipe from getting stuck.
It provides a hydraulic pressure in the hole that prevents (in theory) any gas or oil from ‘blowing out’.
It deposits a thin, impermeable layer of mud over the reservoir zones called ‘mud cake’. This mud cake prevents further invasion and damage of the reservoir by drilling fluids and is vital from a data acquisition and productivity perspective.
Water based mud. A problem with water-based mud systems is that water is readily absorbed by clay. Clay beds (or ‘shale’) hence tend to swell when drilled through by water based mud, and this swelling can cause no end of technical difficulties. Even if the driller can avoid the pipe getting stuck, he/she typically has to waste valuable drilling time going over the clay zones and back-reaming them to try and get rid of all the ‘sticky’ points. Not only that, but when the wireline logging operation commences (see later), swelled up clay zones are often the points at which wireline instruments become stuck, and to get them out again can take days of unproductive rig time.
Oil base mud (OBM) uses oil rather than water as the solvent, and as such is not absorbed by clay. OBM usually results in better quality, faster drilled holes. The downside is 1) it is more expensive that water based mud and 2) the returns from the well bore are full of OBM and hence care (i.e. expense) has to be taken to prevent any of this oil contaminated waste entering the local environment.
Rotary table and top drive. The method used to rotate the drill pipe nearly always takes one of two forms; either a:
Rotary table, where a circular section of the drill floor rotates and via a ‘kelly bushing’ so causes the drill pipe to rotate, or;
Top drive, which is large electric or hydraulic motor which is positioned on top of the drill pipe.
The top drive, developed in the mid 1980s, was a big step forward in that it allowed more flexible drilling operations (mud can be pumped continuously no matter where the top of the pipe is in the derrick, whether back-reaming the drill bit up the hole or pulling the pipe out of hole – all of which are limited with a rotary table). The end result is fewer stuck pipes (and hence less lost wells), better hole quality (and hence better quality data from wireline logging) and better control when drilling deviated wells to target reservoirs.
Down-hole mud motors. For directional drilling (in which a well is guided, sometimes at a high angle, to a very specific target) another option exists; instead of rotating the entire pipe, a hydraulic motor just above the drill bit is powered by the pressure and flow of mud being pumped through the pipe, and this motor provides the power to rotate the bit. This setup makes it easier to ‘steer’ the drill bit.
The BHA stands for ‘bottom-hole-assembly’. This refers to the bottom few hundred feet of the drill pipe and its basic form is usually made up by the drill bit followed by heavy pipe called ‘collars’ interspersed with larger diameter pipe with what look like fins on the side – so called ‘stabilisers’. The BHA assembly provides weight for the bit to cut rock, rigidity to keep the hole as straight as possible and strength to transmit torque to the bit and absorb huge mechanical shocks as drilling progresses.
The BHA can include several optional elements that make it more complicated – mud motors for directional drilling (as discussed briefly above). MWD (measurement-whilst-drilling) sensors to provide real-time direction and torque measurements or even LWD (logging-whilst-drilling) instruments that can record various physical properties of the formation drilled through.
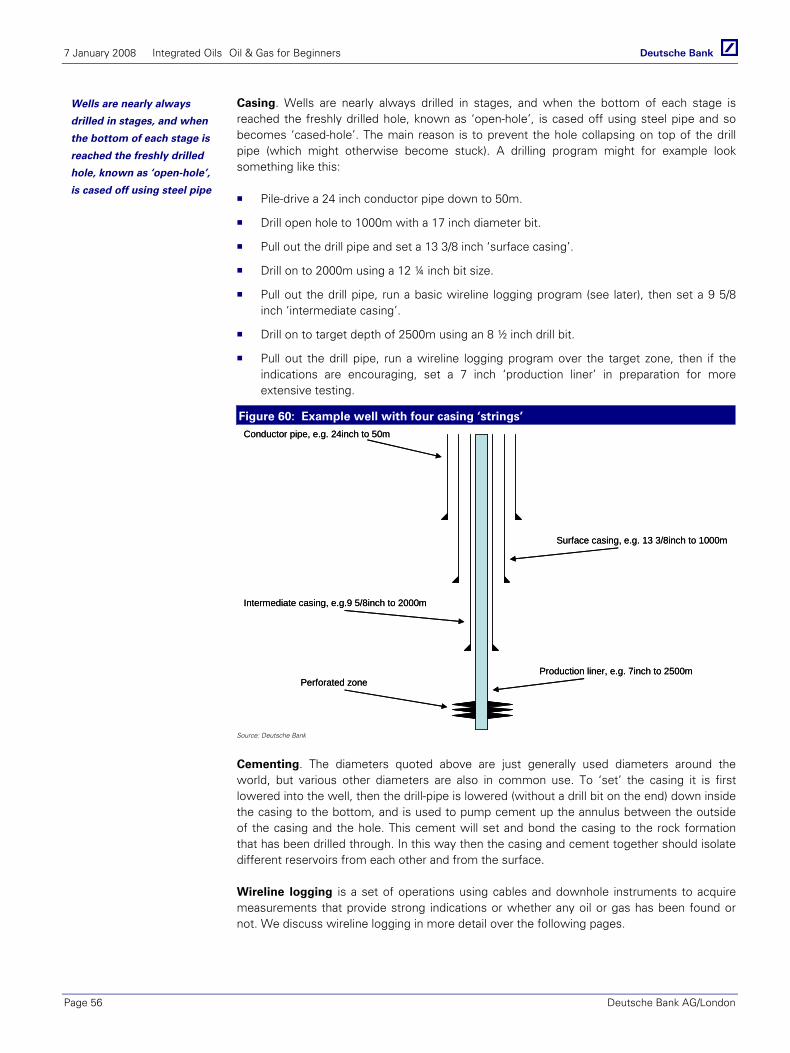
7 January 2008 Integrated Oils Oil & Gas for Beginners
Page 56 Deutsche Bank AG/London
Casing. Wells are nearly always drilled in stages, and when the bottom of each stage is reached the freshly drilled hole, known as ‘open-hole’, is cased off using steel pipe and so becomes ‘cased-hole’. The main reason is to prevent the hole collapsing on top of the drill pipe (which might otherwise become stuck). A drilling program might for example look something like this:
Pile-drive a 24 inch conductor pipe down to 50m.
Drill open hole to 1000m with a 17 inch diameter bit.
Pull out the drill pipe and set a 13 3/8 inch ‘surface casing’.
Drill on to 2000m using a 12 ¼ inch bit size.
Pull out the drill pipe, run a basic wireline logging program (see later), then set a 9 5/8 inch ‘intermediate casing’.
Drill on to target depth of 2500m using an 8 ½ inch drill bit.
Pull out the drill pipe, run a wireline logging program over the target zone, then if the indications are encouraging, set a 7 inch ‘production liner’ in preparation for more extensive testing.
Figure 60: Example well with four casing ‘strings’ Conductor pipe, e.g. 24inch to 50m
Surface casing, e.g. 13 3/8inch to 1000m
Intermediate casing, e.g.9 5/8inch to 2000m
Production liner, e.g. 7inch to 2500mPerforated zone
Conductor pipe, e.g. 24inch to 50m
Surface casing, e.g. 13 3/8inch to 1000m
Intermediate casing, e.g.9 5/8inch to 2000m
Production liner, e.g. 7inch to 2500mPerforated zone
Source: Deutsche Bank
Cementing. The diameters quoted above are just generally used diameters around the world, but various other diameters are also in common use. To ‘set’ the casing it is first lowered into the well, then the drill-pipe is lowered (without a drill bit on the end) down inside the casing to the bottom, and is used to pump cement up the annulus between the outside of the casing and the hole. This cement will set and bond the casing to the rock formation that has been drilled through. In this way then the casing and cement together should isolate different reservoirs from each other and from the surface.
Wireline logging is a set of operations using cables and downhole instruments to acquire measurements that provide strong indications or whether any oil or gas has been found or not. We discuss wireline logging in more detail over the following pages.
Wells are nearly always
drilled in stages, and when
the bottom of each stage is
reached the freshly drilled
hole, known as ‘open-hole’,
is cased off using steel pipe

7 January 2008 Integrated Oils Oil & Gas for Beginners
Deutsche Bank AG/London Page 57
BOPs. BOP stands for blow-out-preventor and is a large set of valves that sit on top of the well being drilled. The BOP will if required, seal the well quickly even if there is a drill pipe in the way. It has several sets of seals (called ‘rams’), as shown in the following figure, which are used in different circumstances.
Figure 61: A blow-out preventor (BOP)
Blind rams (seal an open hole)
Kill line
Ground
Shear rams (cut drill pipe and seal)
Drill floor
Annual preventerMud returns
Pipe rams (seal around drill pipe)
Blind rams (seal an open hole)
Kill line
Ground
Shear rams (cut drill pipe and seal)
Drill floor
Annual preventerMud returns
Pipe rams (seal around drill pipe)
Source: Deutsche Bank
Pipe rams to control a kick. In the case of the mud system failing to control the pressure of a reservoir, this reservoir will force fluid (oil, gas or water) into the well bore which will in turn displace mud out of the top of the well. The driller and mud engineers will see this (it is known as a ‘kick’) and try to regain control by quickly adding heavier mud into the borehole. However if no ready supply of heavy mud is available, it may be necessary to close the pipe rams – these are large rubber seals that will form around the drill pipe and seal in the kicking well. This buys time for the mud engineer to make up heavier mud, which when ready, is pumped down the center of the drill-pipe to ‘kill’ the well.
Shear rams in the last resort. If following a kick the mud weight is not raised quickly enough, or if the pipe rams leak, the reservoir fluids will continue to enter the well bore. This will decrease the aggregate well bore fluid density, and thus its weight and hence a vicious circle is setup which can quickly (within minutes in some cases) spiral into a blow-out. A blow-out initially usually takes the form of a geyser of mud shooting into the drilling rig, but if left unchecked the geyser will become increasingly full of the oil or gas from the uncontrolled reservoir. Depending on the wind conditions, this oil and gas needs only one spark to ignite it and then death and destruction are a real possibility. To avoid this unpleasant scenario the BOP contains a set of ‘shear rams’, which will cut straight through the drill-pipe and seal the well off.
Another risk with kicks is that gas can contain H2S (or ‘sour gas’), and this is not friendly stuff. It smells like rotten eggs in concentrations of 5ppm, but quickly destroys one sense of smell (so people think it has gone away), with inhalation proving fatal at around 20ppm.
BOP stands for blow-out-
preventor and is a large set
of valves that sit on top of
the well being drilled.
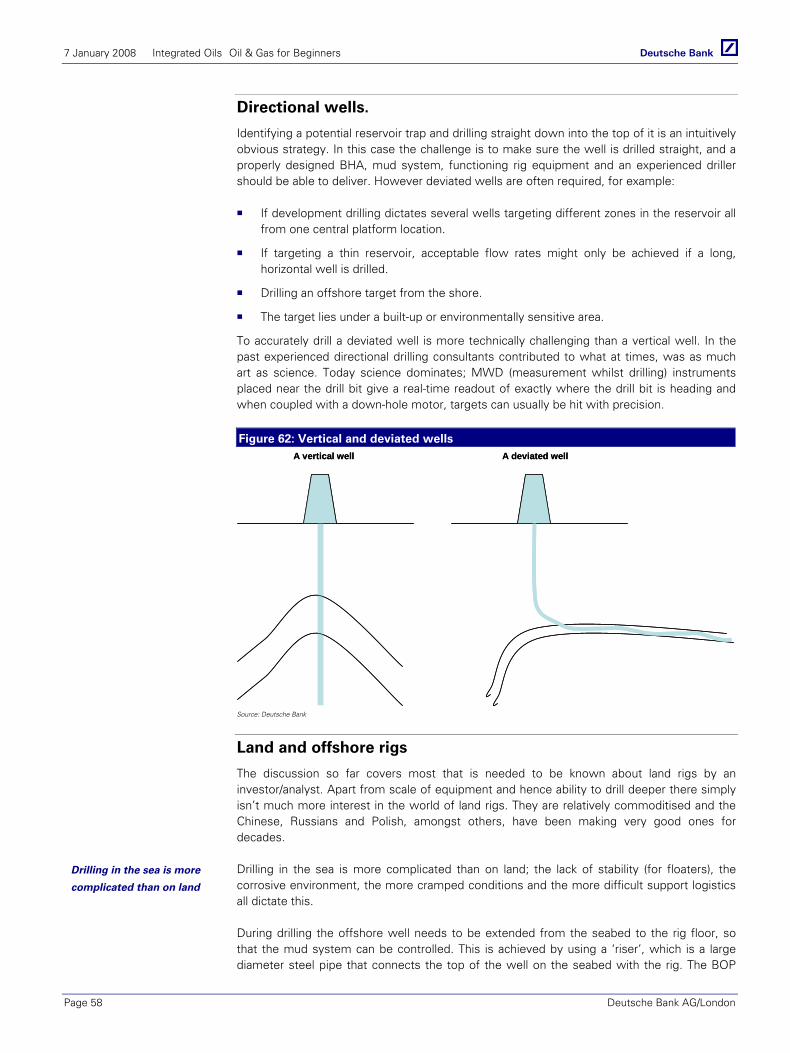
7 January 2008 Integrated Oils Oil & Gas for Beginners
Page 58 Deutsche Bank AG/London
Directional wells.
Identifying a potential reservoir trap and drilling straight down into the top of it is an intuitively obvious strategy. In this case the challenge is to make sure the well is drilled straight, and a properly designed BHA, mud system, functioning rig equipment and an experienced driller should be able to deliver. However deviated wells are often required, for example:
If development drilling dictates several wells targeting different zones in the reservoir all from one central platform location.
If targeting a thin reservoir, acceptable flow rates might only be achieved if a long, horizontal well is drilled.
Drilling an offshore target from the shore.
The target lies under a built-up or environmentally sensitive area.
To accurately drill a deviated well is more technically challenging than a vertical well. In the past experienced directional drilling consultants contributed to what at times, was as much art as science. Today science dominates; MWD (measurement whilst drilling) instruments placed near the drill bit give a real-time readout of exactly where the drill bit is heading and when coupled with a down-hole motor, targets can usually be hit with precision.
Figure 62: Vertical and deviated wells A vertical well A deviated wellA vertical well A deviated well
Source: Deutsche Bank
Land and offshore rigs
The discussion so far covers most that is needed to be known about land rigs by an investor/analyst. Apart from scale of equipment and hence ability to drill deeper there simply isn’t much more interest in the world of land rigs. They are relatively commoditised and the Chinese, Russians and Polish, amongst others, have been making very good ones for decades.
Drilling in the sea is more complicated than on land; the lack of stability (for floaters), the corrosive environment, the more cramped conditions and the more difficult support logistics all dictate this.
During drilling the offshore well needs to be extended from the seabed to the rig floor, so that the mud system can be controlled. This is achieved by using a ‘riser’, which is a large diameter steel pipe that connects the top of the well on the seabed with the rig. The BOP
Drilling in the sea is more
complicated than on land
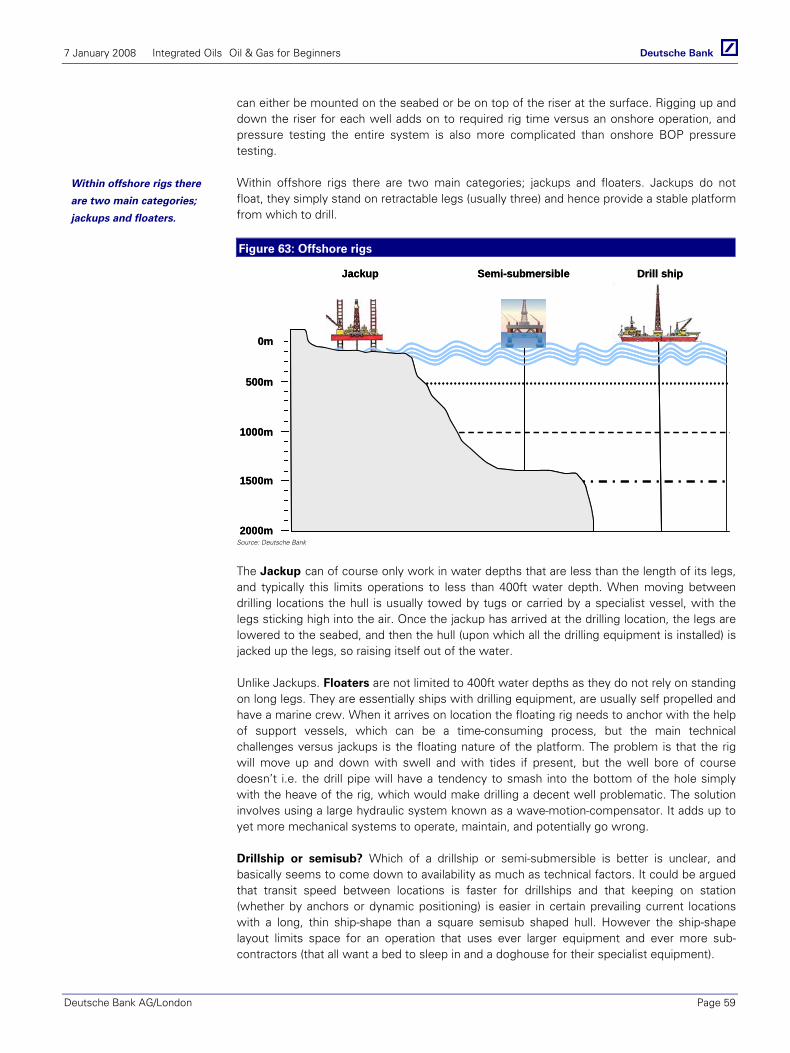
7 January 2008 Integrated Oils Oil & Gas for Beginners
Deutsche Bank AG/London Page 59
can either be mounted on the seabed or be on top of the riser at the surface. Rigging up and down the riser for each well adds on to required rig time versus an onshore operation, and pressure testing the entire system is also more complicated than onshore BOP pressure testing.
Within offshore rigs there are two main categories; jackups and floaters. Jackups do not float, they simply stand on retractable legs (usually three) and hence provide a stable platform from which to drill.
Figure 63: Offshore rigs
Jackup Semi-submersible Drill ship
0m
500m
1000m
1500m
2000m
Jackup Semi-submersible Drill ship
0m
500m
1000m
1500m
2000mSource: Deutsche Bank
The Jackup can of course only work in water depths that are less than the length of its legs, and typically this limits operations to less than 400ft water depth. When moving between drilling locations the hull is usually towed by tugs or carried by a specialist vessel, with the legs sticking high into the air. Once the jackup has arrived at the drilling location, the legs are lowered to the seabed, and then the hull (upon which all the drilling equipment is installed) is jacked up the legs, so raising itself out of the water.
Unlike Jackups. Floaters are not limited to 400ft water depths as they do not rely on standing on long legs. They are essentially ships with drilling equipment, are usually self propelled and have a marine crew. When it arrives on location the floating rig needs to anchor with the help of support vessels, which can be a time-consuming process, but the main technical challenges versus jackups is the floating nature of the platform. The problem is that the rig will move up and down with swell and with tides if present, but the well bore of course doesn’t i.e. the drill pipe will have a tendency to smash into the bottom of the hole simply with the heave of the rig, which would make drilling a decent well problematic. The solution involves using a large hydraulic system known as a wave-motion-compensator. It adds up to yet more mechanical systems to operate, maintain, and potentially go wrong.
Drillship or semisub? Which of a drillship or semi-submersible is better is unclear, and basically seems to come down to availability as much as technical factors. It could be argued that transit speed between locations is faster for drillships and that keeping on station (whether by anchors or dynamic positioning) is easier in certain prevailing current locations with a long, thin ship-shape than a square semisub shaped hull. However the ship-shape layout limits space for an operation that uses ever larger equipment and ever more sub-contractors (that all want a bed to sleep in and a doghouse for their specialist equipment).
Within offshore rigs there
are two main categories;
jackups and floaters.
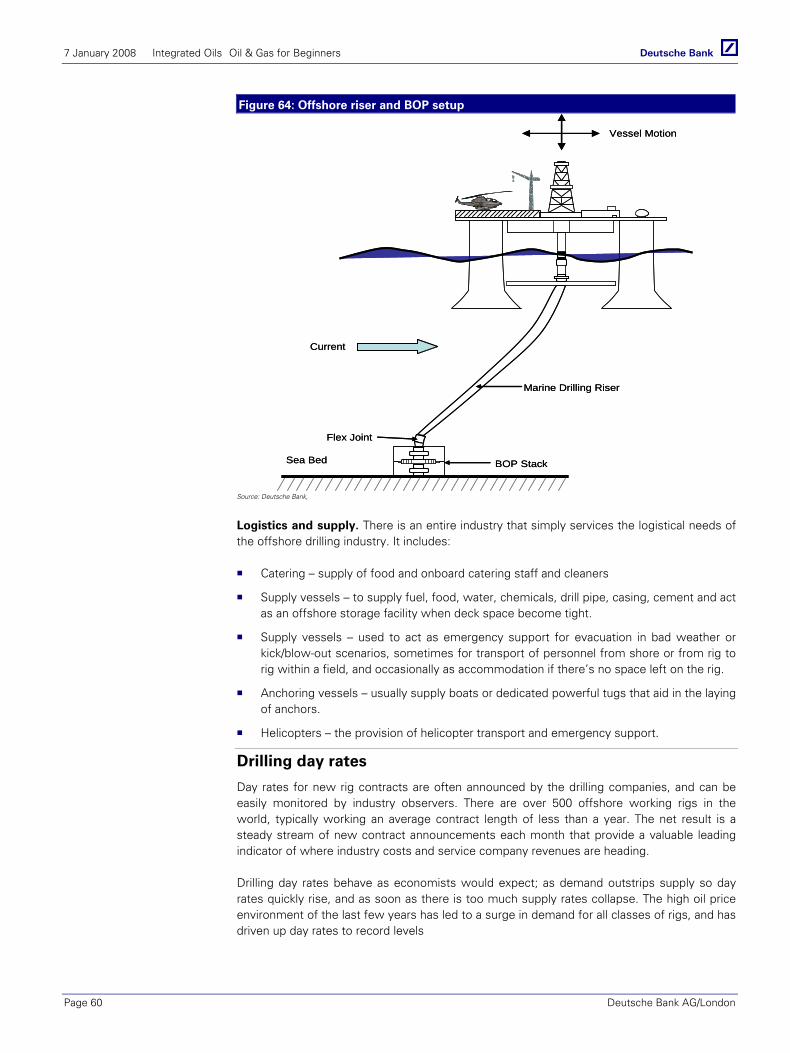
7 January 2008 Integrated Oils Oil & Gas for Beginners
Page 60 Deutsche Bank AG/London
Figure 64: Offshore riser and BOP setup
Flex Joint
Current
Vessel Motion
Marine Drilling Riser
BOP StackSea Bed
Flex Joint
Current
Vessel Motion
Marine Drilling Riser
BOP StackSea Bed
Source: Deutsche Bank,
Logistics and supply. There is an entire industry that simply services the logistical needs of the offshore drilling industry. It includes:
Catering – supply of food and onboard catering staff and cleaners
Supply vessels – to supply fuel, food, water, chemicals, drill pipe, casing, cement and act as an offshore storage facility when deck space become tight.
Supply vessels – used to act as emergency support for evacuation in bad weather or kick/blow-out scenarios, sometimes for transport of personnel from shore or from rig to rig within a field, and occasionally as accommodation if there’s no space left on the rig.
Anchoring vessels – usually supply boats or dedicated powerful tugs that aid in the laying of anchors.
Helicopters – the provision of helicopter transport and emergency support.
Drilling day rates
Day rates for new rig contracts are often announced by the drilling companies, and can be easily monitored by industry observers. There are over 500 offshore working rigs in the world, typically working an average contract length of less than a year. The net result is a steady stream of new contract announcements each month that provide a valuable leading indicator of where industry costs and service company revenues are heading.
Drilling day rates behave as economists would expect; as demand outstrips supply so day rates quickly rise, and as soon as there is too much supply rates collapse. The high oil price environment of the last few years has led to a surge in demand for all classes of rigs, and has driven up day rates to record levels
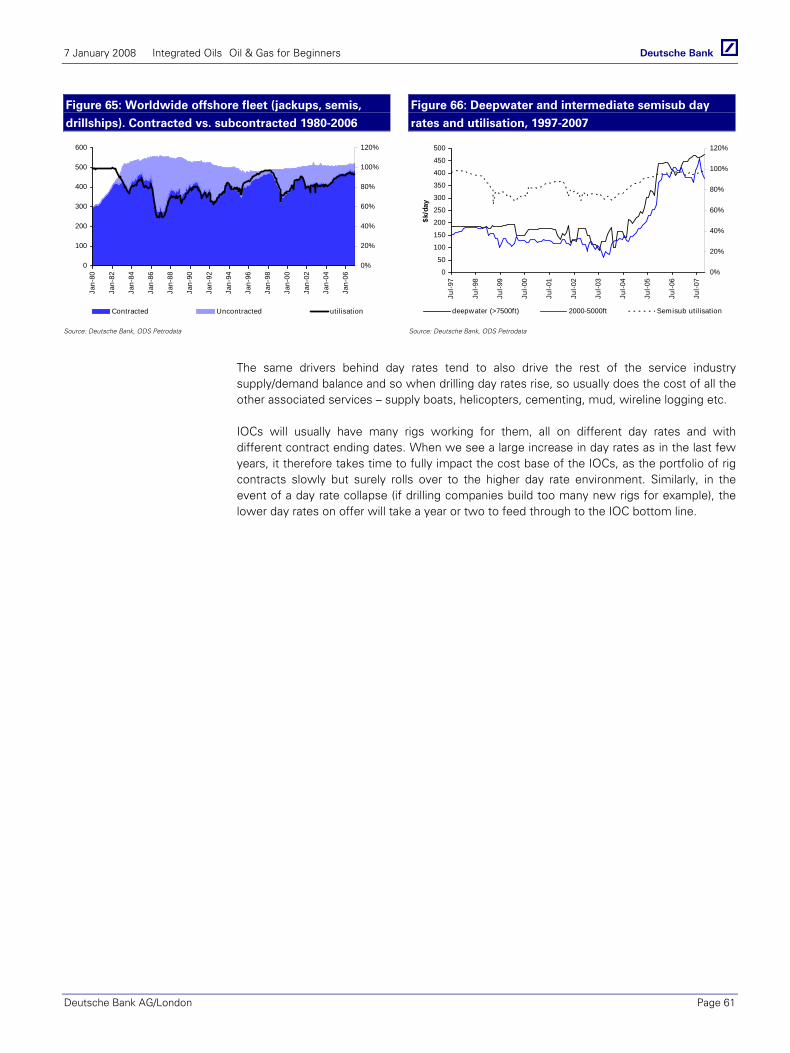
7 January 2008 Integrated Oils Oil & Gas for Beginners
Deutsche Bank AG/London Page 61
Figure 65: Worldwide offshore fleet (jackups, semis,
drillships). Contracted vs. subcontracted 1980-2006
Figure 66: Deepwater and intermediate semisub day
rates and utilisation, 1997-2007
0
100
200
300
400
500
600
Jan-
80
Jan-
82
Jan-
84
Jan-
86
Jan-
88
Jan-
90
Jan-
92
Jan-
94
Jan-
96
Jan-
98
Jan-
00
Jan-
02
Jan-
04
Jan-
06
0%
20%
40%
60%
80%
100%
120%
Contracted Uncontracted utilisation
0
50
100
150
200
250
300
350
400
450
500
Jul-9
7
Jul-9
8
Jul-9
9
Jul-0
0
Jul-0
1
Jul-0
2
Jul-0
3
Jul-0
4
Jul-0
5
Jul-0
6
Jul-0
7
$k/d
ay
0%
20%
40%
60%
80%
100%
120%
deepwater (>7500ft) 2000-5000ft Semisub utilisation
Source: Deutsche Bank, ODS Petrodata Source: Deutsche Bank, ODS Petrodata
The same drivers behind day rates tend to also drive the rest of the service industry supply/demand balance and so when drilling day rates rise, so usually does the cost of all the other associated services – supply boats, helicopters, cementing, mud, wireline logging etc.
IOCs will usually have many rigs working for them, all on different day rates and with different contract ending dates. When we see a large increase in day rates as in the last few years, it therefore takes time to fully impact the cost base of the IOCs, as the portfolio of rig contracts slowly but surely rolls over to the higher day rate environment. Similarly, in the event of a day rate collapse (if drilling companies build too many new rigs for example), the lower day rates on offer will take a year or two to feed through to the IOC bottom line.
7 January 2008 Integrated Oils Oil & Gas for Beginners
Page 62 Deutsche Bank AG/London
Field Operations - Evaluation
Perhaps surprisingly, simply drilling a hole into the ground rarely conclusively reveals whether it has intersected an oil or gas reservoir. For an exploration well, successfully drilling a hole to the target depth is only the start of the story. The drilling of an exploration well is really just a means to an end, and that end is to acquire as much data and knowledge about the subsurface rocks and reservoirs as possible. If a well is drilled that is so crooked, rugose, or ‘sticky’ that no decent quality data can be acquired, then money has been wasted.
Rock Doctors and Mud Loggers – what has been drilled though? Exploration well-sites will almost always have a geologist working on site (the ‘wellsite geologist’, appropriately enough, or to some, the ‘rock doctor’). The role of the wellsite geologist is to analyse the rock cuttings that circulate to the surface from the drill bit, and keep a record of what rock type (sandstone, shale, limestone etc) has been drilled though.
The rock doctor is not the only source of data during drilling, a ‘mud logger’ has equipment that is setup to continuously analyse and record any gas present in the mud returns from the well bore – a sudden increase in gas is an obvious indication that a hydrocarbon reservoir has been drilled through. The mud logger will also regularly take samples of the returned mud and see if it fluoresces under ultra-violet light – another key indicator of hydrocarbons. The wellsite geologist and mud loggers thus provide vital initial analysis on the subsurface structure. However as we discuss below, this data is often compromised and at best an incomplete picture – it needs to be complemented by additional data – typically from coring and/or wireline logging.
Mud – it hides the truth… The mud system, whilst vital to keep control of a well, results in all but a very few wells being drilled in an ‘over balanced’ condition – this is when the pressure of the mud in the well is greater than the reservoir fluid pressures. As such little or no reservoir fluids enter the well during drilling and so the wellsite geologist and mud logger are at a disadvantage when it comes to identifying whether oil or gas has actually been drilled through. The mud log can completely miss an oil or gas bearing reservoir.
Furthermore, although the geologist can use returned mud cuttings to identify what kind of rock has been drilled through, only a relatively rough estimate of the depth that the cuttings came from can be made (who knows how long a particular cutting took to circulate back to the surface?). In a world where reservoirs as thin as 5ft can be potentially commercial, not knowing where it is to within 100ft is a problem.
Coring – ideal but expensive. The best way to asses the formation that has been drilled through is to have physical samples. This can be achieved by ‘coring’, a process where a special drill bit and tubes inside the bottom hole assembly allow a continuous core to be taken whilst drilling. The downsides include:
Drilling is much slower than normal. The speed is limited whilst coring and far more trips in and out the hole with the drill pipe are required. Anything that slows down drilling time is a big issue when you consider $1m/day offshore costs are no longer unusual.
Its not 100% reliable, there can be gaps in the core, or in the worst case, no core at all is gathered – and remember this is a one shot operation; if the core isn’t taken properly then going back to try again is not an option (at least not in the same well).
Rock Doctors and Mud
Loggers – what has been
drilled though?
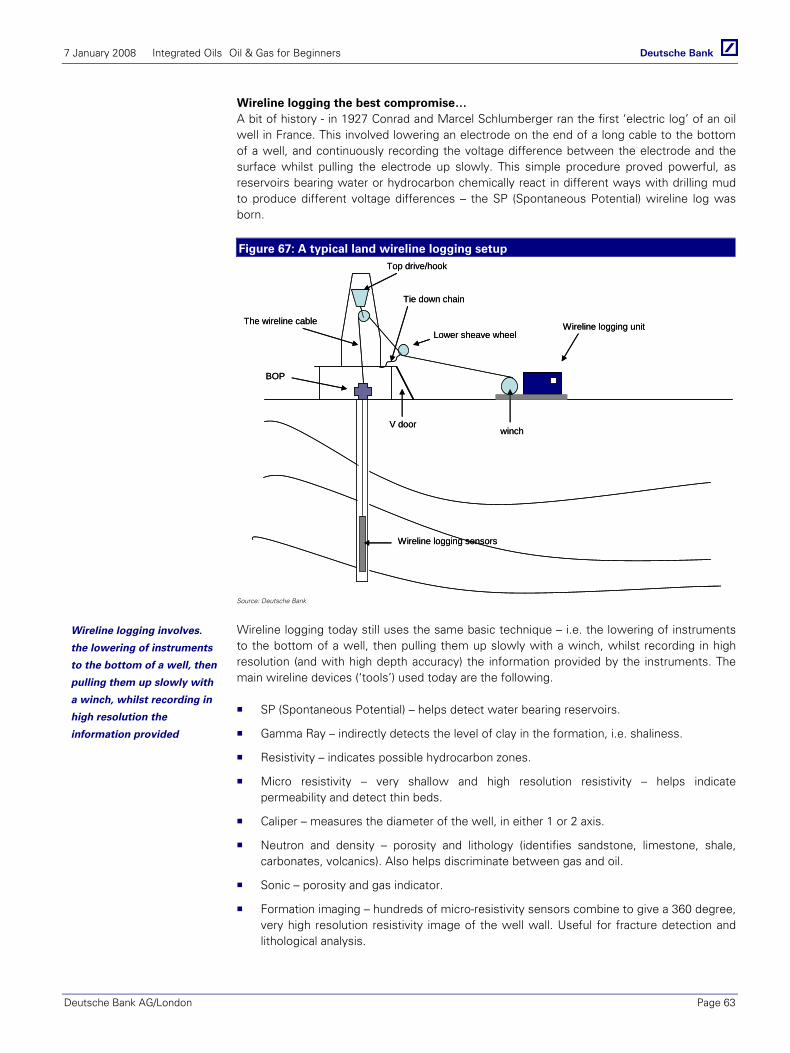
7 January 2008 Integrated Oils Oil & Gas for Beginners
Deutsche Bank AG/London Page 63
Wireline logging the best compromise… A bit of history - in 1927 Conrad and Marcel Schlumberger ran the first ‘electric log’ of an oil well in France. This involved lowering an electrode on the end of a long cable to the bottom of a well, and continuously recording the voltage difference between the electrode and the surface whilst pulling the electrode up slowly. This simple procedure proved powerful, as reservoirs bearing water or hydrocarbon chemically react in different ways with drilling mud to produce different voltage differences – the SP (Spontaneous Potential) wireline log was born.
Figure 67: A typical land wireline logging setup
V doorwinch
Wireline logging unit
Top drive/hook
Tie down chain
Lower sheave wheel
Wireline logging sensors
BOP
The wireline cable
V doorwinch
Wireline logging unit
Top drive/hook
Tie down chain
Lower sheave wheel
Wireline logging sensors
BOP
The wireline cable
Source: Deutsche Bank
Wireline logging today still uses the same basic technique – i.e. the lowering of instruments to the bottom of a well, then pulling them up slowly with a winch, whilst recording in high resolution (and with high depth accuracy) the information provided by the instruments. The main wireline devices (‘tools’) used today are the following.
SP (Spontaneous Potential) – helps detect water bearing reservoirs.
Gamma Ray – indirectly detects the level of clay in the formation, i.e. shaliness.
Resistivity – indicates possible hydrocarbon zones.
Micro resistivity – very shallow and high resolution resistivity – helps indicate permeability and detect thin beds.
Caliper – measures the diameter of the well, in either 1 or 2 axis.
Neutron and density – porosity and lithology (identifies sandstone, limestone, shale, carbonates, volcanics). Also helps discriminate between gas and oil.
Sonic – porosity and gas indicator.
Formation imaging – hundreds of micro-resistivity sensors combine to give a 360 degree, very high resolution resistivity image of the well wall. Useful for fracture detection and lithological analysis.
Wireline logging involves.
the lowering of instruments
to the bottom of a well, then
pulling them up slowly with
a winch, whilst recording in
high resolution the
information provided

7 January 2008 Integrated Oils Oil & Gas for Beginners
Page 64 Deutsche Bank AG/London
Wellbore seismic – a ‘quickshot’ ties in the surface seismic to depth rather than just time. A full ‘VSP’ (vertical seismic profile) survey gives a single seismic column that can be overlaid with a surface seismic.
Pressure and fluid sampling – reservoir pressure gradient measurements discriminate between oil, gas and water zones. Reservoir fluid samples can be brought to surface for further analysis.
Sidewall cores – samples of down-hole rock from specific depths are brought to surface and then used for further analysis.
Magnetic resonance logs – measure formation permeability.
Figure 68: An example Wireline Log
1000m
1050m
1150m
2000m
1100m
Oil bearing sandstone
Water bearing sandstone
Shale (mudstone, clay)
Gas bearing sandstone
Shale (mudstone, clay)
Gamma ray (counts/sec)Spontaneous Potential (mV) Deep resistivity (ohmm)
Shallow resistivity (ohmm)Neutron porosity (pu)
Density (g/cc)Depth
High gamma ray in shales due to radioactive mineral content
Oil has high resistivity
Shallow<deep due to lower resistivity mud invasion
Gas has high resistivity
Neutron porosity tends to read too low in gas
Neutron porosity tends to read too high in shale
Neutron porosity and density overlap in sandstone
Neutron porosity tends to read too high in shale1000m
1050m
1150m
2000m
1100m
Oil bearing sandstone
Water bearing sandstone
Shale (mudstone, clay)
Gas bearing sandstone
Shale (mudstone, clay)
Gamma ray (counts/sec)Spontaneous Potential (mV) Deep resistivity (ohmm)
Shallow resistivity (ohmm)Neutron porosity (pu)
Density (g/cc)Depth
High gamma ray in shales due to radioactive mineral content
Oil has high resistivity
Shallow<deep due to lower resistivity mud invasion
Gas has high resistivity
Neutron porosity tends to read too low in gas
Neutron porosity tends to read too high in shale
Neutron porosity and density overlap in sandstone
Neutron porosity tends to read too high in shale
Source: Deutsche Bank
The oil company will decide which combination of the above services are required for a particular well, but in general most exploration wells will have a combination or all of the above wireline services run.
The logging operation itself means that the wellbore is occupied by wireline equipment, and so whilst the wireline crew work hard for anything up to a week acquiring the required data, for the drilling crew its essentially downtime.
7 January 2008 Integrated Oils Oil & Gas for Beginners
Deutsche Bank AG/London Page 65
LWD - why not acquire the data whilst drilling? Wireline logging has disadvantages – namely:
The entire drilling operation has to go on hold whilst wireline logging is in progress.
The data quality is sometimes compromised by poor borehole conditions and invasion of drilling mud into the formation.
A way to avoid these problems is to use ‘logging whilst drilling’ (LWD) tools to acquire largely the same data (resistivity, sonic, nuclear) whilst drilling.
LWD is technically more challenging than wireline logging; the instruments need to be much stronger due to the immense mechanical stresses that are part and parcel of an active drill string, and the system has to cope with much lower real-time data transmission capabilities (there is no handy wire to transmit data along). However over the last 10 years the reliability issues have been largely resolved and a combination of mud-pulse telemetry systems and down-hole data storage adequately handle the data acquired in most scenarios.
The main disadvantages of LWD are:
The costs of losing the equipment down-hole (due to stuck pipe) are much higher than for wireline instruments.
The cost in rig time of equipment failure, as the entire drill string has to be pulled out is such a scenario that can be significant.
There is a smaller scope of services available versus wireline implying the wireline crew might have to be on the rig anyway, but under-utilised and,
It has potentially lower data resolution.
There’s only one way to be sure – Well Testing Despite the sophistication of LWD and wireline logging instruments, there remains only one way to be sure that a well will flow with commercial rates – a Well Test. A Well Test involves setting up equipment so that the reservoirs can flow oil and gas at controlled rates through surface valves also known as ‘chokes’. Measurement of the flow rates, properties of the fluids produced and fluid surface pressures yield invaluable information about not just the permeability, contents and potential flow rates of the reservoir, but also its physical size.
Appraisal wells – as much data as possible ‘Appraisal’ wells are drilled following a discovery exploration well, primarily to delineate the physical size of the reservoir and to gather as much additional information as possible. The key here, as for exploration wells, is one of data acquisition. An appraisal well that reaches its target depth but falls short on the data acquisition program (e.g. wireline or LWD equipment failure, or poor hole quality) is from a geologists perspective, a largely wasted drilling exercise.
‘Appraisal’ wells are drilled
following a discovery
exploration well, primarily
to delineate the physical
size of the reservoir
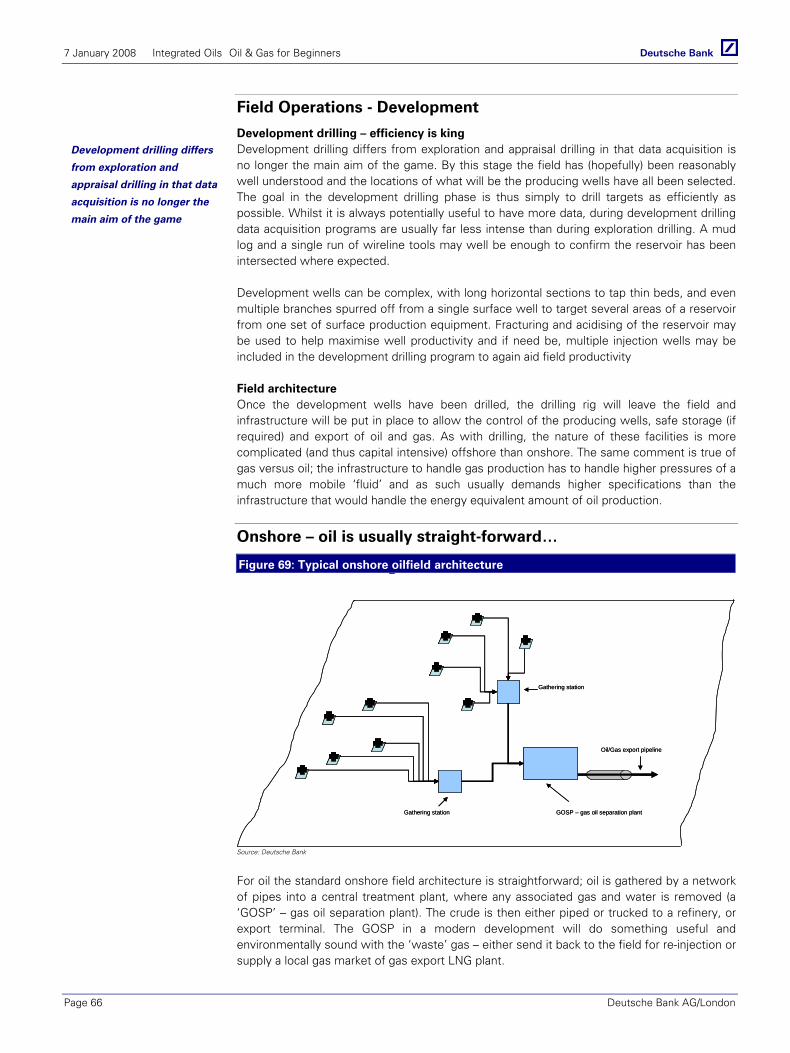
7 January 2008 Integrated Oils Oil & Gas for Beginners
Page 66 Deutsche Bank AG/London
Field Operations - Development
Development drilling – efficiency is king Development drilling differs from exploration and appraisal drilling in that data acquisition is no longer the main aim of the game. By this stage the field has (hopefully) been reasonably well understood and the locations of what will be the producing wells have all been selected. The goal in the development drilling phase is thus simply to drill targets as efficiently as possible. Whilst it is always potentially useful to have more data, during development drilling data acquisition programs are usually far less intense than during exploration drilling. A mud log and a single run of wireline tools may well be enough to confirm the reservoir has been intersected where expected.
Development wells can be complex, with long horizontal sections to tap thin beds, and even multiple branches spurred off from a single surface well to target several areas of a reservoir from one set of surface production equipment. Fracturing and acidising of the reservoir may be used to help maximise well productivity and if need be, multiple injection wells may be included in the development drilling program to again aid field productivity
Field architecture Once the development wells have been drilled, the drilling rig will leave the field and infrastructure will be put in place to allow the control of the producing wells, safe storage (if required) and export of oil and gas. As with drilling, the nature of these facilities is more complicated (and thus capital intensive) offshore than onshore. The same comment is true of gas versus oil; the infrastructure to handle gas production has to handle higher pressures of a much more mobile ‘fluid’ and as such usually demands higher specifications than the infrastructure that would handle the energy equivalent amount of oil production.
Onshore – oil is usually straight-forward…
Figure 69: Typical onshore oilfield architecture
GOSP – gas oil separation plantGathering station
Gathering station
Oil/Gas export pipeline
GOSP – gas oil separation plantGathering station
Gathering station
Oil/Gas export pipeline
Source: Deutsche Bank
For oil the standard onshore field architecture is straightforward; oil is gathered by a network of pipes into a central treatment plant, where any associated gas and water is removed (a ‘GOSP’ – gas oil separation plant). The crude is then either piped or trucked to a refinery, or export terminal. The GOSP in a modern development will do something useful and environmentally sound with the ‘waste’ gas – either send it back to the field for re-injection or supply a local gas market of gas export LNG plant.
Development drilling differs
from exploration and
appraisal drilling in that data
acquisition is no longer the
main aim of the game
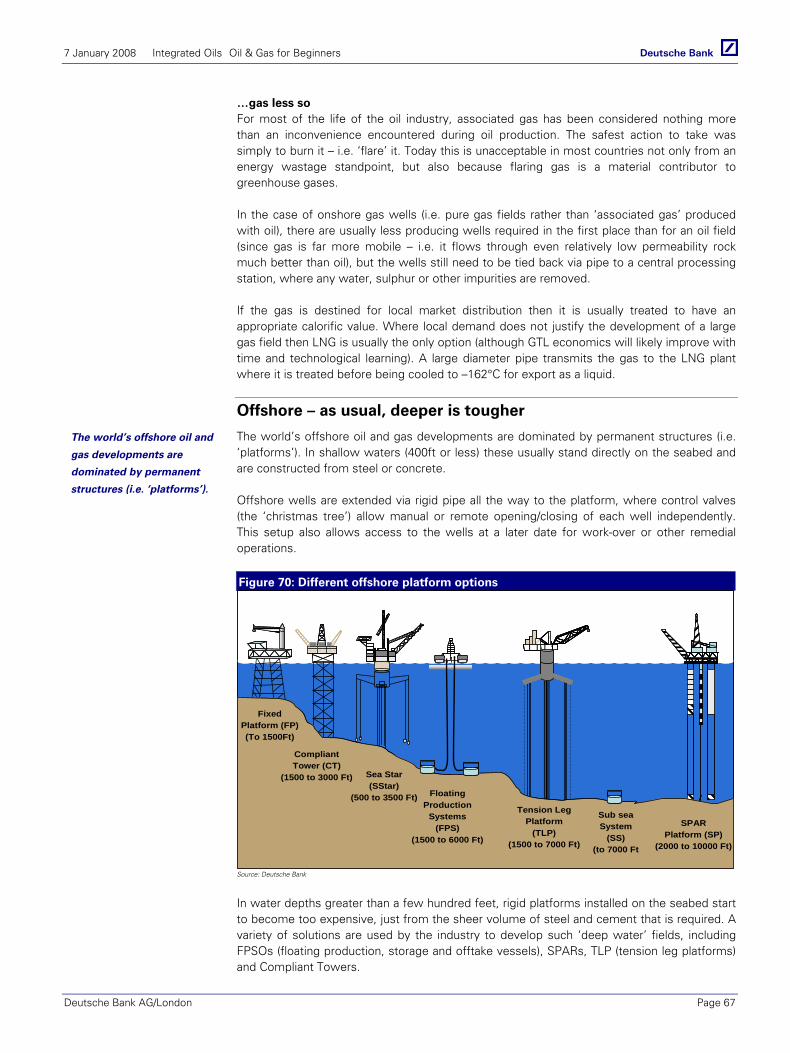
7 January 2008 Integrated Oils Oil & Gas for Beginners
Deutsche Bank AG/London Page 67
…gas less so For most of the life of the oil industry, associated gas has been considered nothing more than an inconvenience encountered during oil production. The safest action to take was simply to burn it – i.e. ‘flare’ it. Today this is unacceptable in most countries not only from an energy wastage standpoint, but also because flaring gas is a material contributor to greenhouse gases.
In the case of onshore gas wells (i.e. pure gas fields rather than ‘associated gas’ produced with oil), there are usually less producing wells required in the first place than for an oil field (since gas is far more mobile – i.e. it flows through even relatively low permeability rock much better than oil), but the wells still need to be tied back via pipe to a central processing station, where any water, sulphur or other impurities are removed.
If the gas is destined for local market distribution then it is usually treated to have an appropriate calorific value. Where local demand does not justify the development of a large gas field then LNG is usually the only option (although GTL economics will likely improve with time and technological learning). A large diameter pipe transmits the gas to the LNG plant where it is treated before being cooled to –162°C for export as a liquid.
Offshore – as usual, deeper is tougher
The world’s offshore oil and gas developments are dominated by permanent structures (i.e. ‘platforms’). In shallow waters (400ft or less) these usually stand directly on the seabed and are constructed from steel or concrete.
Offshore wells are extended via rigid pipe all the way to the platform, where control valves (the ‘christmas tree’) allow manual or remote opening/closing of each well independently. This setup also allows access to the wells at a later date for work-over or other remedial operations.
Figure 70: Different offshore platform options
H
FixedPlatform (FP) (To 1500Ft)
CompliantTower (CT)
(1500 to 3000 Ft) Sea Star(SStar)
(500 to 3500 Ft) Floating Production
Systems (FPS)
(1500 to 6000 Ft)
Tension Leg Platform
(TLP)(1500 to 7000 Ft)
SPARPlatform (SP)
(2000 to 10000 Ft)
Sub sea System
(SS)(to 7000 Ft
H
FixedPlatform (FP) (To 1500Ft)
CompliantTower (CT)
(1500 to 3000 Ft) Sea Star(SStar)
(500 to 3500 Ft) Floating Production
Systems (FPS)
(1500 to 6000 Ft)
Tension Leg Platform
(TLP)(1500 to 7000 Ft)
SPARPlatform (SP)
(2000 to 10000 Ft)
Sub sea System
(SS)(to 7000 Ft
FixedPlatform (FP) (To 1500Ft)
CompliantTower (CT)
(1500 to 3000 Ft) Sea Star(SStar)
(500 to 3500 Ft) Floating Production
Systems (FPS)
(1500 to 6000 Ft)
Tension Leg Platform
(TLP)(1500 to 7000 Ft)
SPARPlatform (SP)
(2000 to 10000 Ft)
Sub sea System
(SS)(to 7000 Ft
Source: Deutsche Bank
In water depths greater than a few hundred feet, rigid platforms installed on the seabed start to become too expensive, just from the sheer volume of steel and cement that is required. A variety of solutions are used by the industry to develop such ‘deep water’ fields, including FPSOs (floating production, storage and offtake vessels), SPARs, TLP (tension leg platforms) and Compliant Towers.
The world’s offshore oil and
gas developments are
dominated by permanent
structures (i.e. ‘platforms’).
7 January 2008 Integrated Oils Oil & Gas for Beginners
Page 68 Deutsche Bank AG/London
FPS – floating production systems usually refers to FPSOs (floating production, storage and off-take vessels) or FPSSs (floating production semi-subs). FPSOs are ships that have been converted (typically from an oil tanker, or built from scratch) to accept oil production from subsurface wells, and store the produced oil until a tanker comes alongside to unload it. FPSOs can range in sophistication from simple barge-like vessels anchored via chains to huge dynamically positioned ships capable of separating out oil/gas and water, storing over 2million bbls of oil and re-injecting produced water or gas.
Some FPSO’s have the capability to weathervane around a cluster of producing risers (via complex equipment known as a ‘turret’), and/or quickly disconnect from the producing fields (in the event of hurricanes for example). FPSOs are the most common solution to deepwater developments off the West African coast, and have also been used extensively by Petrobras in developing their deepwater Brazilian fields. The connection between the wells and the FPSO is either via rigid pipes (risers), flexible pipes or a combination of the two.
FPSOs have the advantage that there is a ready supply of oil tankers to convert, and shipyards are comfortable with building or modifying ship shaped vessels, however the fact that the vessel will float up and down with tide or swell means that the christmas tree usually has to be on the seabed rather than the FPSO, so making future well access a costly affair; the FPSO must be moved off location and a drilling rig hired.
A SPAR is basically a large cylinder with a deck on top, secured in place with anchors. SPARS have been used extensively in the North Sea and shallow water US GoM. They are relatively cheap to fabricate, but have limited deck area and tend to have relatively large vertical movement in rough seas, so as with FPSOs limiting deck access to wells for maintenance.
TLP stands for ‘tension leg platform’. It has very limited storage capability and so is usually used where there is local pipeline infrastructure – shallow water GoM for example. It is anchored via steel tendons to the seabed that are under high tension. This makes the TLP platform relatively stable, so allowing the ‘dry tree’ solution of a steel riser from the seabed to deck, with a Christmas tree control valve on top. This allows a portable rig to be installed on the TLP deck with direct access to problematic wells, without interrupting production of the remaining wells.
SURF – the plumbing A platform is all that can be seen from the surface for a typical offshore development, but on the seabed all the development wells (whether producers or injectors) need to be connected to gathering stations and to the platform. This is usually done via small diameter rigid and flexible pipes that are installed by a specialist installation company (such as Acergy or Technip) and such hardware is collectively known as ‘SURF’ – subsea, umbilicals, risers and flowlines.
Subsea completions - bypass the platform altogether? SURF infrastructure can be spread over a wide area, and indeed several West African fields are tied back via subsea pipelines over 10kms to central platforms. An obvious evolution is to extend the tie backs all the way to the coast, and do away with the need for a platform altogether, so potentially saving capex and the need to support workers offshore. For gas this is already being done, notably with Norway’s Snohvit (StatoilHydro) project, which transmits gas 140kms to a receiving terminal and LNG plant on the Norwegian coast.
For oil however, long subsea tiebacks are more difficult. The cold seabed temperatures make the oil more viscous, to the extent that some grades simply will not flow without extremely powerful pumps and/or commingling with a solvent – but of course without a platform nearby such solutions imply that long power cables and chemical injection lines need to be laid from shore, so reducing project feasibility and economics.
Floating production systems
usually refers to FPSOs
(floating production, storage
and off-take vessels)
A SPAR is basically a large
cylinder with a deck on top
TLP stands for ‘tension leg
platform’
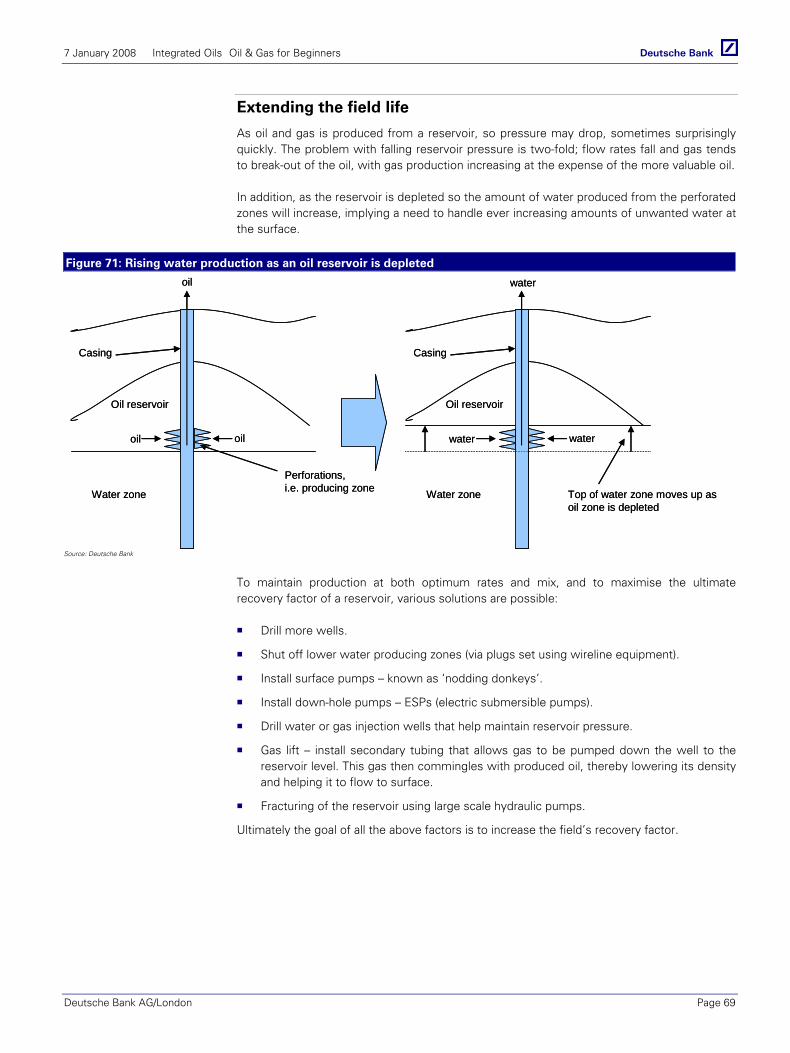
7 January 2008 Integrated Oils Oil & Gas for Beginners
Deutsche Bank AG/London Page 69
Extending the field life
As oil and gas is produced from a reservoir, so pressure may drop, sometimes surprisingly quickly. The problem with falling reservoir pressure is two-fold; flow rates fall and gas tends to break-out of the oil, with gas production increasing at the expense of the more valuable oil.
In addition, as the reservoir is depleted so the amount of water produced from the perforated zones will increase, implying a need to handle ever increasing amounts of unwanted water at the surface.
Figure 71: Rising water production as an oil reservoir is depleted
Oil reservoir
Water zone
Perforations, i.e. producing zone
Casing
oiloil
oil
Oil reservoir
Water zone
Casing
waterwater
water
Top of water zone moves up as oil zone is depleted
Oil reservoir
Water zone
Perforations, i.e. producing zone
Casing
oiloil
oil
Oil reservoir
Water zone
Casing
waterwater
water
Top of water zone moves up as oil zone is depleted
Source: Deutsche Bank
To maintain production at both optimum rates and mix, and to maximise the ultimate recovery factor of a reservoir, various solutions are possible:
Drill more wells.
Shut off lower water producing zones (via plugs set using wireline equipment).
Install surface pumps – known as ‘nodding donkeys’.
Install down-hole pumps – ESPs (electric submersible pumps).
Drill water or gas injection wells that help maintain reservoir pressure.
Gas lift – install secondary tubing that allows gas to be pumped down the well to the reservoir level. This gas then commingles with produced oil, thereby lowering its density and helping it to flow to surface.
Fracturing of the reservoir using large scale hydraulic pumps.
Ultimately the goal of all the above factors is to increase the field’s recovery factor.
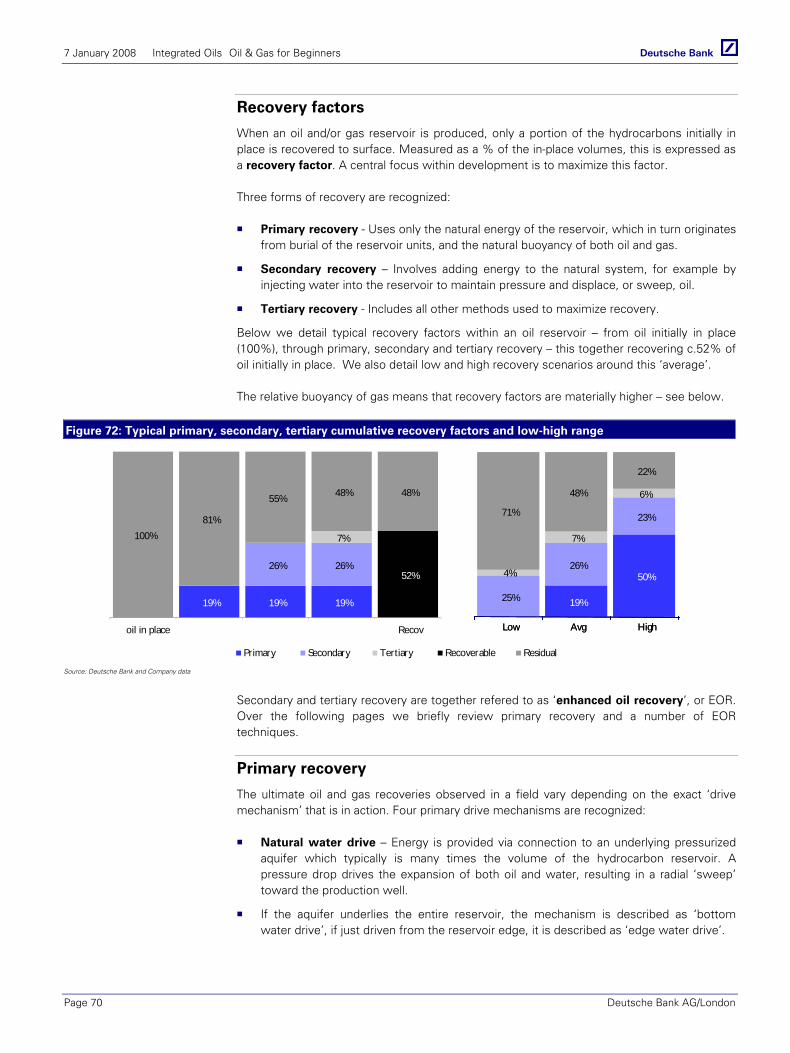
7 January 2008 Integrated Oils Oil & Gas for Beginners
Page 70 Deutsche Bank AG/London
Recovery factors
When an oil and/or gas reservoir is produced, only a portion of the hydrocarbons initially in place is recovered to surface. Measured as a % of the in-place volumes, this is expressed as a recovery factor. A central focus within development is to maximize this factor.
Three forms of recovery are recognized:
Primary recovery - Uses only the natural energy of the reservoir, which in turn originates from burial of the reservoir units, and the natural buoyancy of both oil and gas.
Secondary recovery – Involves adding energy to the natural system, for example by injecting water into the reservoir to maintain pressure and displace, or sweep, oil.
Tertiary recovery - Includes all other methods used to maximize recovery.
Below we detail typical recovery factors within an oil reservoir – from oil initially in place (100%), through primary, secondary and tertiary recovery – this together recovering c.52% of oil initially in place. We also detail low and high recovery scenarios around this ‘average’.
The relative buoyancy of gas means that recovery factors are materially higher – see below.
Figure 72: Typical primary, secondary, tertiary cumulative recovery factors and low-high range
19%
50%
25%
26%
23%
4%
7%
6%
71%
48%
22%
Low Avg High
19% 19% 19%
26% 26%
7%
52%
100%81%
55% 48% 48%
oil in place Recov
Primary Secondary Tertiary Recoverable Residual
19%
50%
25%
26%
23%
4%
7%
6%
71%
48%
22%
Low Avg High
19% 19% 19%
26% 26%
7%
52%
100%81%
55% 48% 48%
oil in place Recov
Primary Secondary Tertiary Recoverable Residual
Source: Deutsche Bank and Company data
Secondary and tertiary recovery are together refered to as ‘enhanced oil recovery’, or EOR. Over the following pages we briefly review primary recovery and a number of EOR techniques.
Primary recovery
The ultimate oil and gas recoveries observed in a field vary depending on the exact ‘drive mechanism’ that is in action. Four primary drive mechanisms are recognized:
Natural water drive – Energy is provided via connection to an underlying pressurized aquifer which typically is many times the volume of the hydrocarbon reservoir. A pressure drop drives the expansion of both oil and water, resulting in a radial ‘sweep’ toward the production well.
If the aquifer underlies the entire reservoir, the mechanism is described as ‘bottom water drive’, if just driven from the reservoir edge, it is described as ‘edge water drive’.
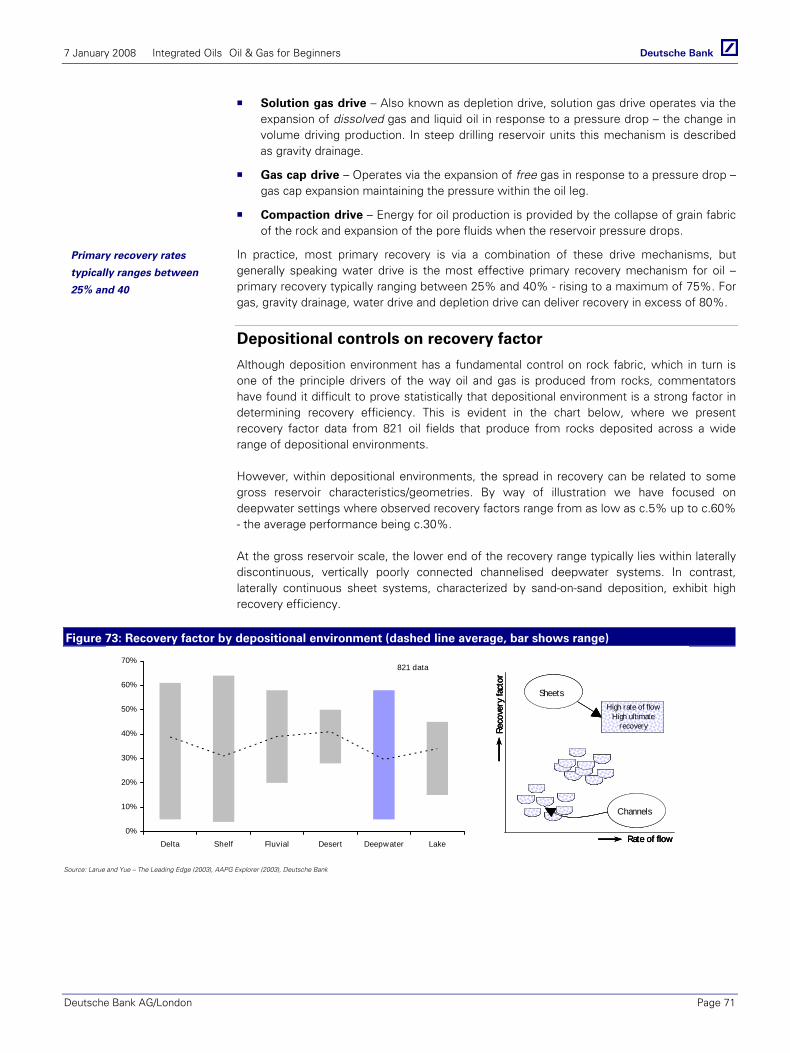
7 January 2008 Integrated Oils Oil & Gas for Beginners
Deutsche Bank AG/London Page 71
Solution gas drive – Also known as depletion drive, solution gas drive operates via the expansion of dissolved gas and liquid oil in response to a pressure drop – the change in volume driving production. In steep drilling reservoir units this mechanism is described as gravity drainage.
Gas cap drive – Operates via the expansion of free gas in response to a pressure drop – gas cap expansion maintaining the pressure within the oil leg.
Compaction drive – Energy for oil production is provided by the collapse of grain fabric of the rock and expansion of the pore fluids when the reservoir pressure drops.
In practice, most primary recovery is via a combination of these drive mechanisms, but generally speaking water drive is the most effective primary recovery mechanism for oil – primary recovery typically ranging between 25% and 40% - rising to a maximum of 75%. For gas, gravity drainage, water drive and depletion drive can deliver recovery in excess of 80%.
Depositional controls on recovery factor
Although deposition environment has a fundamental control on rock fabric, which in turn is one of the principle drivers of the way oil and gas is produced from rocks, commentators have found it difficult to prove statistically that depositional environment is a strong factor in determining recovery efficiency. This is evident in the chart below, where we present recovery factor data from 821 oil fields that produce from rocks deposited across a wide range of depositional environments.
However, within depositional environments, the spread in recovery can be related to some gross reservoir characteristics/geometries. By way of illustration we have focused on deepwater settings where observed recovery factors range from as low as c.5% up to c.60% - the average performance being c.30%.
At the gross reservoir scale, the lower end of the recovery range typically lies within laterally discontinuous, vertically poorly connected channelised deepwater systems. In contrast, laterally continuous sheet systems, characterized by sand-on-sand deposition, exhibit high recovery efficiency.
Figure 73: Recovery factor by depositional environment (dashed line average, bar shows range)
0%
10%
20%
30%
40%
50%
60%
70%
Delta Shelf Fluvial Desert Deepwater Lake
821 data
Reco
very
fact
or
Rate of flow
Channels
SheetsHigh rate of flow
High ultimaterecovery
0%
10%
20%
30%
40%
50%
60%
70%
Delta Shelf Fluvial Desert Deepwater Lake
821 data
Reco
very
fact
or
Rate of flow
Channels
SheetsHigh rate of flow
High ultimaterecoveryRe
cove
ry fa
ctor
Rate of flow
Channels
SheetsHigh rate of flow
High ultimaterecovery
Source: Larue and Yue – The Leading Edge (2003), AAPG Explorer (2003), Deutsche Bank
Primary recovery rates
typically ranges between
25% and 40
7 January 2008 Integrated Oils Oil & Gas for Beginners
Page 72 Deutsche Bank AG/London
Secondary recovery… waterflood
The principle method of secondary recovery is waterflood. In waterflood, water is injected into one or more wells, arranged in a pattern that will maximize the displacement of oil toward a producer. At the production well oil only is initially produced.
However, as the front edge of the transition zone between the oil and water reaches the producer ‘breakthrough’ occurs. After breakthrough, both oil and water are produced, and this ‘water cut’ progressively increases, until the trailing edge of the transition zone is reached and only water is produced.
Tertiary recovery techniques
By altering the relative physical/chemical properties of reservoir liquids, EOR aims to increase hydrocarbon recovery by maximizing displacement efficiency in a cost efficient way. Below we briefly summarize the principle EOR mechanisms which are currently employed.
Thermal EOR is principally employed within accumulations of heavy oil – this being heated to reduce its viscosity and increase its mobility. Common techniques include steamflood and cyclic steam injection - see section on oil sands.
Miscible liquid flooding uses the principle that some fluids can mix with oil and therefore can be used to displace oil with no capillary resistance. Liquids used include methane, ethane, nitrogen and CO2.
Polymer flooding reduces the mobility of displacing water by increasing its viscosity. This is done to reduce instabilities in the oil-water flooding front – these resulting from water’s greater mobility versus the oil it is being used to displace. This technique works best within high permeability reservoirs, and might be applied where high water cuts have developed in the late stages of waterflood.
Micellar floods use surfactants to ‘scrub’ residual oil from pores by reducing interfacial tensions and creating emulsions or dispersions of hydrocarbons and water.
Alkaline flooding, also known as caustic flooding, uses NaOH or KOH to produce soap-like surfactants (see above). Given the relative availability of NaOH and KOH, caustic flooding is one of the cheapest EOR techniques.
Microbial EOR remains experimental, but in theory harnesses micro-organisms together with a source nutrient, which when injected into the reservoir produce H2, CO2 and surfactants that together help mobilize the oil.
The principle method of
secondary recovery is
waterflood

7 January 2008 Integrated Oils Oil & Gas for Beginners
Deutsche Bank AG/London Page 73
Oil Services – What are they and where do they fit?
The oil service companies provide the assets, technology, manpower and project management that enables oil companies to explore for and develop oil and gas fields. Oil service company revenues are essentially the capex spend of the integrated oil companies, national oil companies, the independents, refiners and petrochemical companies. US and European service companies dominate the industry, and the US sector has a market value almost 4x greater than that of the Europeans, as shown below.
Figure 74: Market cap split between the US and
European oil service sectors
Figure 75: US and European oil service companies
market cap ($bn)
US oil services81%
European oil services
19%
0
20
40
60
80
100
120
Sch
lum
berg
erTr
anso
cean
Hal
libur
ton
Bak
er H
ughe
sW
eath
erfo
rd
Dia
mon
dS
aipe
mN
oble
S
mith
S
eadr
illEN
SC
O
Tech
nip
CG
GN
abor
s A
ker
Kva
erne
rB
J S
ervi
ces
Gra
nt P
ride
coK
BR
Chi
cago
Prid
e A
MEC
C
amer
onPG
SS
BM
Offs
hore
Row
anJo
hn W
ood
Ace
rgy
Petr
ofac
Exte
rran
Te
cnic
as
Sub
sea
7Pa
tters
on-U
TIW
-H E
nerg
yLa
mpr
ell
Her
cule
s
$bn
Source: Deutsche Bank Source: Deutsche Bank
Although there is some overlap, the US service companies tend to offer drilling and completion services (e.g. mud logging, supply vessels, pressure pumping etc) and the Europeans focus predominantly on installation, engineering & construction and seismic activities. Drilling and completion accounts for 30-50% of a field’s capex and generates operating margins of 30-50% for the US service names involved. In contrast, European E&C activities involve huge capex spend, but typically generate margins of only 6% or less. This structural difference in exposure to field capex and margins explains why the US sector is so much more valuable.
Making sense of it all
The oil life cycle is principally split into two segments: 1) exploration, appraisal and development (looking for the stuff) and 2) engineering and construction or ‘E&C’ (processing and commercialisation of the commodity). Each segment may or may not involve capital intensive activities e.g. exploration will require (drilling) rigs, E&C will require pipe-laying vessels (see figures below) but what is constant across every function is the heavy reliance on personnel. The service industry is a people business spanning a large breadth of capabilities from construction labourers and welders to engineers and project managers.
Drilling and completion
accounts for 30-50% of a
field’s capex
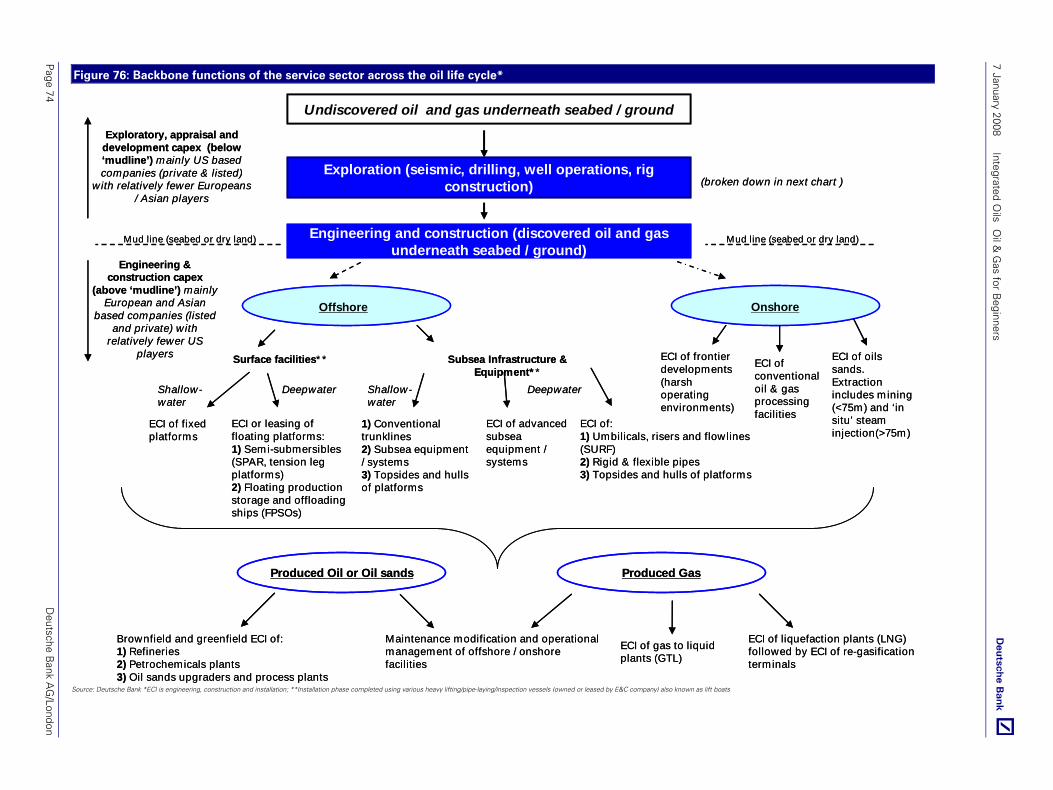
7 January 2008 Integrated O
ils O
il & G
as for Beginners
Page 74
Deutsche B
ank AG
/London
Figure 76: Backbone functions of the service sector across the oil life cycle*
Undiscovered oil and gas underneath seabed / groundExploratory, appraisal and
development capex (below ‘mudline’) mainly US based companies (private & listed)
with relatively fewer Europeans / Asian players
Onshore
ECI of:1) Umbilicals, risers and flowlines (SURF)2) Rigid & flexible pipes3) Topsides and hulls of platforms
ECI of conventional oil & gas processing facilities
ECI of frontier developments (harsh operating environments)
Surface facilities* * Subsea Infrastructure & Equipment* *
ECI of fixed platforms
DeepwaterShallow-water
Shallow-water
Deepwater
ECI or leasing of floating platforms:1) Semi-submersibles (SPAR, tension leg platforms)2) Floating production storage and offloading ships (FPSOs)
1) Conventional trunklines2) Subsea equipment / systems3) Topsides and hulls of platforms
ECI of advanced subsea equipment / systems
Produced Oil or Oil sands
Brownfield and greenfield ECI of:1) Refineries2) Petrochemicals plants3) Oil sands upgraders and process plants
Maintenance modification and operational management of offshore / onshore facilities
ECI of gas to liquid plants (GTL)
Engineering and construction (discovered oil and gas underneath seabed / ground)
Offshore
Produced Gas
ECI of liquefaction plants (LNG) followed by ECI of re-gasification terminals
Engineering & construction capex
(above ‘mudline’) mainly European and Asian
based companies (listed and private) with
relatively fewer US players
Mud line (seabed or dry land) Mud line (seabed or dry land)
Exploration (seismic, drilling, well operations, rig construction) (broken down in next chart )
ECI of oils sands. Extraction includes mining (<75m) and ‘in situ’ steam injection(>75m)
Source: Deutsche Bank *ECI is engineering, construction and installation; **Installation phase completed using various heavy lifting/pipe-laying/inspection vessels (owned or leased by E&C company) also known as lift boats
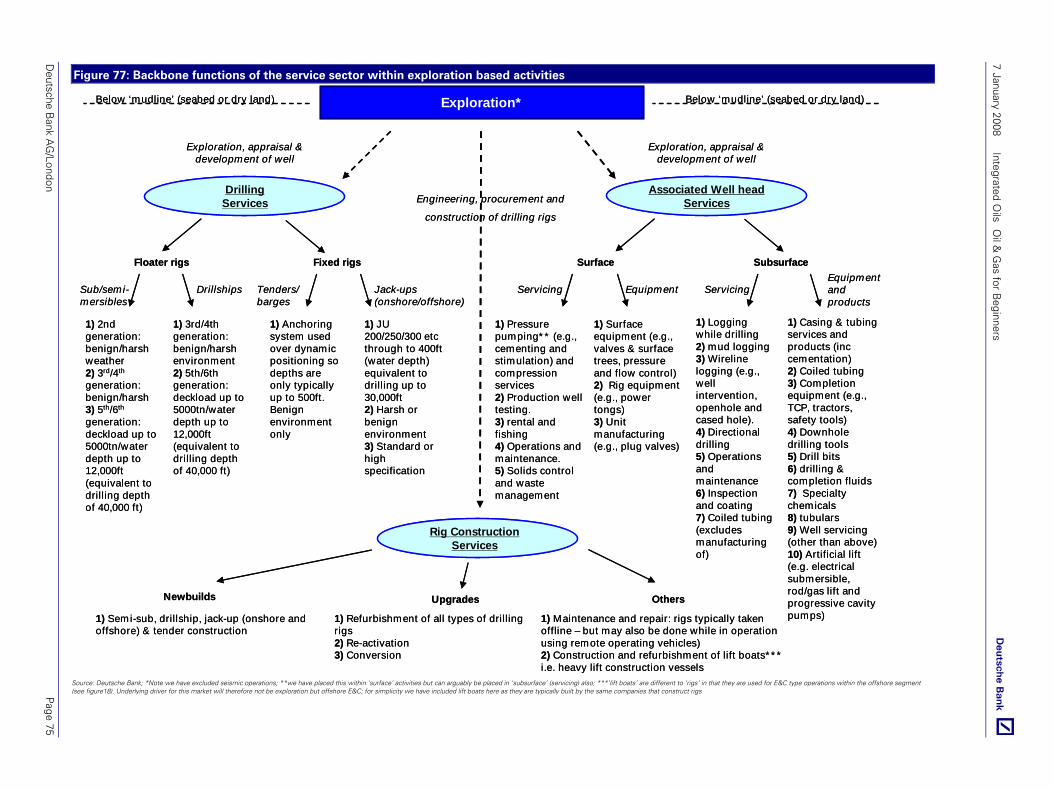
Deutsche B
ank AG
/London P
age 75
7 January 2008 Integrated O
ils O
il & G
as for Beginners
Figure 77: Backbone functions of the service sector within exploration based activities
Exploration*
Exploration, appraisal & development of well
Drilling Services
Associated Well head Services
Surface Subsurface
1) Casing & tubing services and products (inc cementation) 2) Coiled tubing 3) Completion equipment (e.g., TCP, tractors, safety tools) 4) Downhole drilling tools 5) Drill bits 6) drilling & completion fluids 7) Specialty chemicals 8) tubulars 9) Well servicing (other than above)10) Artificial lift (e.g. electrical submersible, rod/gas lift and progressive cavity pumps)
1) Pressure pumping* * (e.g., cementing and stimulation) and compression services2) Production well testing. 3) rental and fishing4) Operations and maintenance. 5) Solids control and waste management
1) Logging while drilling 2) mud logging 3) Wireline logging (e.g., well intervention, openhole and cased hole). 4) Directional drilling 5) Operations and maintenance6) Inspection and coating7) Coiled tubing (excludes manufacturing of)
1) Surface equipment (e.g., valves & surface trees, pressure and flow control)2) Rig equipment (e.g., power tongs)3) Unit manufacturing (e.g., plug valves)
EquipmentServicingEquipment and products
Servicing
Floater rigs Fixed rigs
1) 2nd generation: benign/harsh weather2) 3rd/4th
generation: benign/harsh3) 5th/6th
generation: deckload up to 5000tn/water depth up to 12,000ft (equivalent to drilling depth of 40,000 ft)
DrillshipsSub/semi-mersibles
Tenders/barges
Jack-ups (onshore/offshore)
1) 3rd/4th generation: benign/harsh environment 2) 5th/6th generation: deckload up to 5000tn/water depth up to 12,000ft (equivalent to drilling depth of 40,000 ft)
1) Anchoring system used over dynamic positioning so depths are only typically up to 500ft. Benign environment only
1) JU 200/250/300 etc through to 400ft (water depth) equivalent to drilling up to 30,000ft2) Harsh or benign environment3) Standard or high specification
Rig Construction Services
Engineering, procurement and
construction of drilling rigs
Exploration, appraisal & development of well
Newbuilds Upgrades Others
1) Semi-sub, drillship, jack-up (onshore and offshore) & tender construction
1) Maintenance and repair: rigs typically taken offline – but may also be done while in operation using remote operating vehicles)2) Construction and refurbishment of lift boats* * * i.e. heavy lift construction vessels
Below ‘mudline’ (seabed or dry land)Below ‘mudline’ (seabed or dry land)
1) Refurbishment of all types of drilling rigs2) Re-activation 3) Conversion
Source: Deutsche Bank; *Note we have excluded seismic operations; **we have placed this within ‘surface’ activities but can arguably be placed in ‘subsurface’ (servicing) also; ***’lift boats’ are different to ‘rigs’ in that they are used for E&C type operations within the offshore segment (see figure18). Underlying driver for this market will therefore not be exploration but offshore E&C; for simplicity we have included lift boats here as they are typically built by the same companies that construct rigs
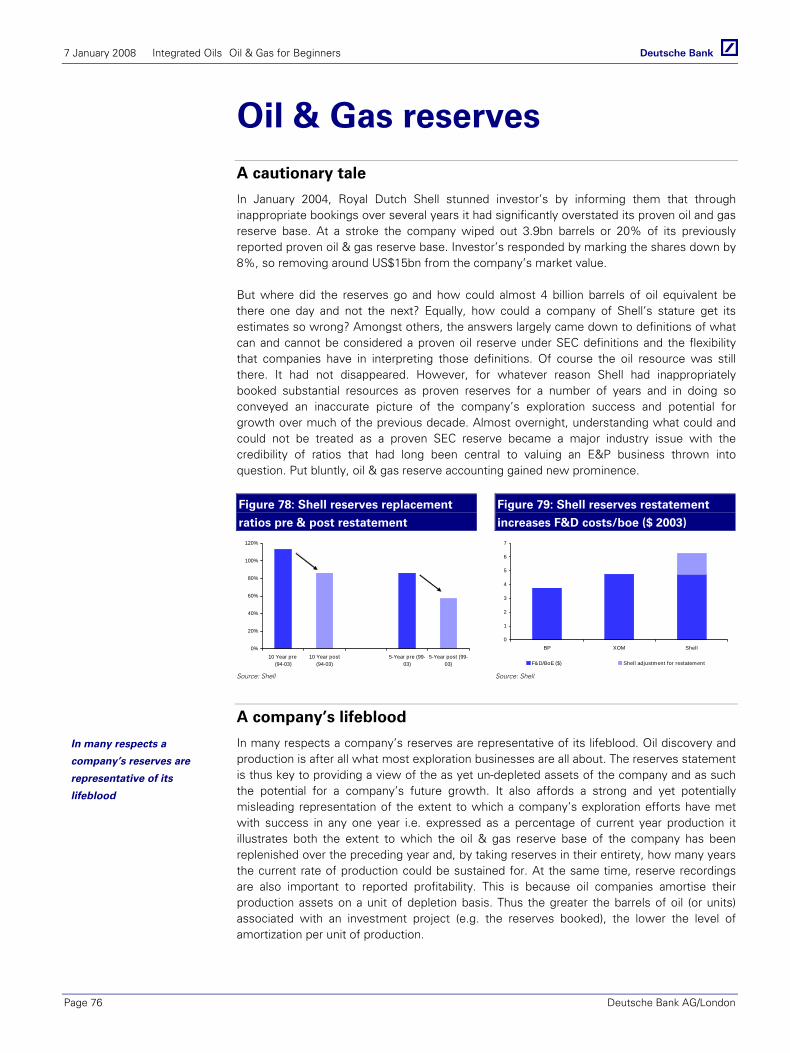
7 January 2008 Integrated Oils Oil & Gas for Beginners
Page 76 Deutsche Bank AG/London
Oil & Gas reserves A cautionary tale
In January 2004, Royal Dutch Shell stunned investor’s by informing them that through inappropriate bookings over several years it had significantly overstated its proven oil and gas reserve base. At a stroke the company wiped out 3.9bn barrels or 20% of its previously reported proven oil & gas reserve base. Investor’s responded by marking the shares down by 8%, so removing around US$15bn from the company’s market value.
But where did the reserves go and how could almost 4 billion barrels of oil equivalent be there one day and not the next? Equally, how could a company of Shell’s stature get its estimates so wrong? Amongst others, the answers largely came down to definitions of what can and cannot be considered a proven oil reserve under SEC definitions and the flexibility that companies have in interpreting those definitions. Of course the oil resource was still there. It had not disappeared. However, for whatever reason Shell had inappropriately booked substantial resources as proven reserves for a number of years and in doing so conveyed an inaccurate picture of the company’s exploration success and potential for growth over much of the previous decade. Almost overnight, understanding what could and could not be treated as a proven SEC reserve became a major industry issue with the credibility of ratios that had long been central to valuing an E&P business thrown into question. Put bluntly, oil & gas reserve accounting gained new prominence.
Figure 78: Shell reserves replacement
ratios pre & post restatement
Figure 79: Shell reserves restatement
increases F&D costs/boe ($ 2003)
0%
20%
40%
60%
80%
100%
120%
10 Year pre (94-03)
10 Year post(94-03)
5-Year pre (99-03)
5-Year post (99-03)
0
1
2
3
4
5
6
7
BP XOM Shell
F&D/BoE ($) Shell adjustment for restatement
Source: Shell Source: Shell
A company’s lifeblood
In many respects a company’s reserves are representative of its lifeblood. Oil discovery and production is after all what most exploration businesses are all about. The reserves statement is thus key to providing a view of the as yet un-depleted assets of the company and as such the potential for a company’s future growth. It also affords a strong and yet potentially misleading representation of the extent to which a company’s exploration efforts have met with success in any one year i.e. expressed as a percentage of current year production it illustrates both the extent to which the oil & gas reserve base of the company has been replenished over the preceding year and, by taking reserves in their entirety, how many years the current rate of production could be sustained for. At the same time, reserve recordings are also important to reported profitability. This is because oil companies amortise their production assets on a unit of depletion basis. Thus the greater the barrels of oil (or units) associated with an investment project (e.g. the reserves booked), the lower the level of amortization per unit of production.
In many respects a
company’s reserves are
representative of its
lifeblood
7 January 2008 Integrated Oils Oil & Gas for Beginners
Deutsche Bank AG/London Page 77
On the face of it, the recording and reporting of reserves data would seem fairly straightforward. A company explores, it discovers and it records the quantity of reserves found. It then amortises the cost associated with the discovery and exploration spend on those reserves on a unit of production basis. However, because determining the amount of oil and gas discovered, yet alone its recoverability involves, amongst others, estimates of field size, rock porosity, rock permeability and fluid type, expressing the recoverable amount is by its very nature uncertain. Add to this uncertainty surrounding the economics of its extraction (i.e. at current prices is it economic to produce) and it is not hard to see that reserves accounting has the potential to be a very inexact science.
Yet because the reserves estimate is so fundamental to the value of a company investors need to have confidence in the reserves estimate. Inaccuracies and both the sustainability and profitability of a company may be misstated. With this in mind and in an effort to protect investors, guidelines have been laid down by various regulatory bodies on reserves accounting with various definitions accorded to reserves dependent upon their status and the probability of their recovery. It is these guidelines, most significantly those that must be adhered to for compliance with the US SEC, that form the basis of today’s reserve statements.
What are reserves? So how are recoverable reserves defined? Clearly, the absolute level of reserves in a given field and their recoverability will never be known until production reaches the economic limit and the reservoir is abandoned. Any reserves estimate is thus almost certain to be inaccurate. With this in mind the objective of the guidelines and requirements on reserves reporting is to provide investors with a realistic but, if anything, conservative estimate of available reserves.
From an industry standpoint, definitions and industry parlance tends to focus on those guidelines provided by both the SEC and the Society of Petrochemical Engineers or SPE. Some knowledge of both is therefore necessary. However, as mentioned previously, most significant for investors and, as a consequence, companies are those laid down by the SEC not least given that use of the SEC’s definitions is obligatory under US reporting requirements. These tend to be more conservative in their approach. Yet, they have also come under some considerable degree of criticism in recent years not least as technological developments within the industry for estimating the scale of recoverability have left them looking somewhat antiquated in their requirements.
SEC Reserves – Proven developed and proven undeveloped.
Under SEC rules, reserves can only be recorded if, per the guidelines as laid down, they are deemed to be proved. Two types of recoverable reserves exist namely proved developed and proved undeveloped. Per SEC guidelines these are defined broadly (but not literally) as follows.
Proved oil & gas reserves. These are estimated quantities of oil, gas and NGL’s which geological and engineering data demonstrate with reasonable certainty to be recoverable from known reservoirs under existing economic conditions (i.e. prices and costs). Reservoirs are considered proved if economic production is supported by either actual production or conclusive formation tests. The area of a reservoir considered proved includes that portion outlined by drilling and defined by gas-oil/water oil boundaries and the immediately adjoining portions not yet drilled but which can be reasonably judged as economically productive on the basis of geological and engineering data. In the absence of data on fluid contacts, the lowest known occurrence of hydrocarbons (i.e. how far do we conclusively know the oil bearing rock extends) should be used. Reserves that can be produced economically through improved recovery
Reserve definitions tend to
focus on those guidelines
provided by both the SEC
and the Society of
Petrochemical Engineers or
SPE
Under SEC rules, reserves
can only be recorded if, per
the guidelines as laid down,
they are deemed to be
proved.
7 January 2008 Integrated Oils Oil & Gas for Beginners
Page 78 Deutsche Bank AG/London
techniques can be included as proved when successful testing by a pilot project or operation of an installed programme is supportive of enhanced recovery in that SPECIFIC rock formation.
Proved developed oil & gas reserves. Proved developed oil and gas reserves are reserves that can be expected to be recovered through existing wells with existing equipment and operating methods. Additional oil and gas expected to be obtained through the application of fluid injection or other improved recovery techniques for supplementing the natural forces and mechanisms of primary recovery should be included as “proved developed reserves” only after testing by a pilot project or after the operation of an installed program has confirmed through production response that increased recovery will be achieved
Proved undeveloped oil & gas reserves. These are (summarily) those reserves expected to be recovered from new wells on un-drilled acreage or from existing wells where major expenditure is required for re-completion. Under no circumstances should estimates for proved undeveloped reserves be attributable to any acreage for which contemplation of an enhanced recovery technique is contemplated unless such techniques have been proven effective by actual tests in the area and the same reservoir.
As stated the above definitions represent a summary rather than the guidelines in full. They emphasise, however, the conservative bias of the guidelines and that as more becomes known about an oil field and its potential, revisions to estimates of reserves will almost certainly need to be made.
The Final Investment Decision or FID Importantly, however, use of terms like ‘reasonable certainty’, ‘reasonably judged’ and ‘economically’ also confer a considerable degree of latitude to the companies in their determination of when a field is proven and the scale of the reserves which they may deem to be recoverable. As such, their application may be more or less conservative. In general, company practice has evolved such that a field will only be included as recoverable once a final investment decision or FID has been taken, committing the company to the actual development of its acreage. The signing of an FID is thus a key indicator for investors and a potentially important indicator of the timing of reserve bookings.
Room for manoeuvre Yet, decisions on what level of reserves to report in any given year can be subject to huge variation and there is certainly the very real potential for companies to massage the level of recoverable reserves reported in any one year and so present a favourable profile of reserve replacement to the outside world.
As an example of quite how bookings and interpretations may vary we show below DB estimates of the bookings made of the Ormen Lange gas field in 2003. Ormen Lange is a major gas field within Norwegian territorial waters with an estimated 14 trillion cubic feet of gas reserves. Under the operatorship of Statoil, five partners were involved in its development at the time that the FID was signed these being Statoil, Shell, Norsk Hydro, Exxon and BP (BP has subsequently sold its position) and, with the final investment decision taken in 2003 the partners were free to book the reserves as ‘Proved’ under SEC definitions in their 2003 accounts. Looking at the reserve bookings and the % shares owned it is possible to estimate the implied ‘proved recoverable’ reserves as interpreted by each of the different companies. As illustrated by the figure overleaf and despite the absence of any disputes between the partners over the field, these varied from an implied 800mmboe at Shell who, following the travails of their reserve restatement in 2004 almost certainly will have adopted an ultra conservative approach, to an implied c2bnboe by a more aggressive BP.
A field will only be included
as recoverable once a final
investment decision or FID
has been taken
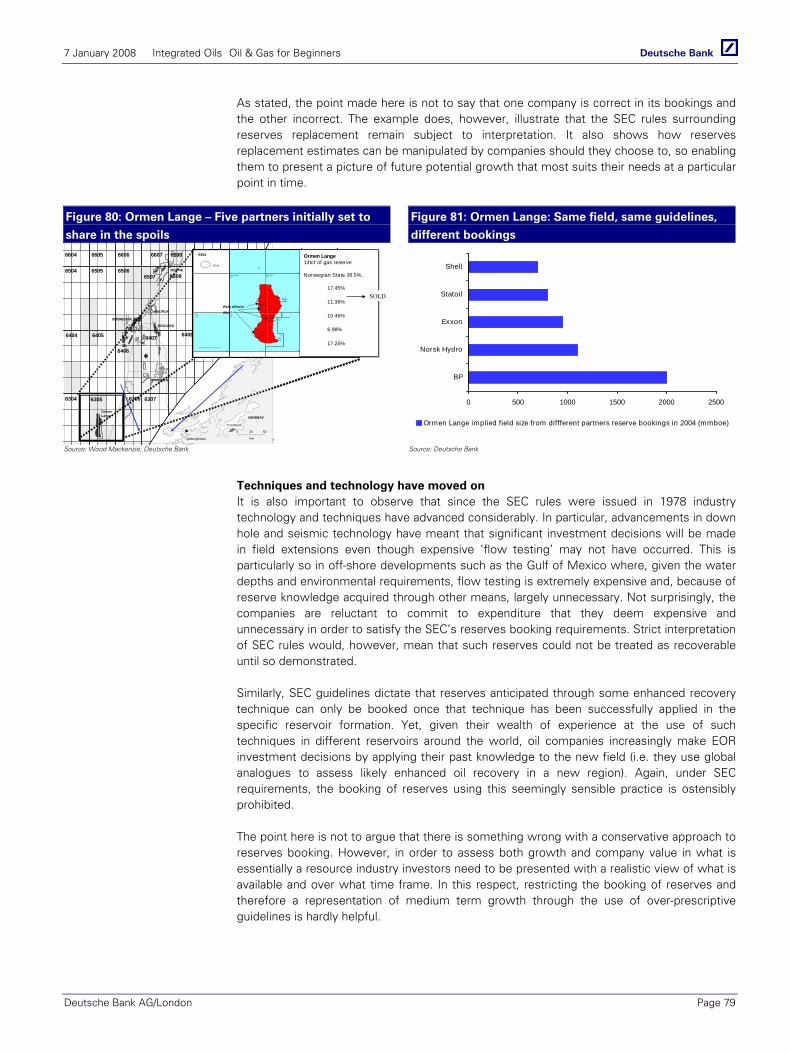
7 January 2008 Integrated Oils Oil & Gas for Beginners
Deutsche Bank AG/London Page 79
As stated, the point made here is not to say that one company is correct in its bookings and the other incorrect. The example does, however, illustrate that the SEC rules surrounding reserves replacement remain subject to interpretation. It also shows how reserves replacement estimates can be manipulated by companies should they choose to, so enabling them to present a picture of future potential growth that most suits their needs at a particular point in time.
Figure 80: Ormen Lange – Five partners initially set to
share in the spoils
Figure 81: Ormen Lange: Same field, same guidelines,
different bookings
6605
6504
6604
6404
6304 6305
6505
6405
6406
6306
OrmenLange
SMØRBUKK
6606
6506
HEIDRUN
6507
6607
MIDGARD
6307
6407
Tjeldbergodden
DRAUGEN
6608
6508
6408
NORNE 6510
6610
6509
6609
5025
Km
0
NORWAY
Trondheim
OrmenLange
XV
XV
SA
XVI
XVI
XV
XVNorsk Hydro
Shell
Norsk Hydro
Norsk Hydro
BP BP
Norsk Hydro
9 7
5
21
a
b
8
4
9
1
1
1
1
1
6304
K m
0 5 10
6305 6306
42
" Å
sg
ard
Tra
ns
po
r ta
tio
n S
ys
tem
(P
r op
os
ed
Ro
ut e
)
Well
Ormen Lange14tcf of gas reserve
SDFI 36%,
17.96%
10.89%
10.77%
7.18%
17.2%
Ormen Lange14tcf of gas reserve
SDFI 36%,
17.96%
10.89%
10.77%
7.18%
17.2%Wells drilled to
date
Ormen Lange14tcf of gas reserve
Norwegian State 36.5%,
17.45%
11.36%
10.46%
6.98%
17.25%
Ormen Lange14tcf of gas reserve
Norwegian State 36.5%,
17.45%
11.36%
10.46%
6.98%
17.25%
SOLD
0 500 1000 1500 2000 2500
BP
Norsk Hydro
Exxon
Statoil
Shell
Ormen Lange implied field size from diffferent partners reserve bookings in 2004 (mmboe)
Source: Wood Mackenzie; Deutsche Bank Source: Deutsche Bank
Techniques and technology have moved on It is also important to observe that since the SEC rules were issued in 1978 industry technology and techniques have advanced considerably. In particular, advancements in down hole and seismic technology have meant that significant investment decisions will be made in field extensions even though expensive ‘flow testing’ may not have occurred. This is particularly so in off-shore developments such as the Gulf of Mexico where, given the water depths and environmental requirements, flow testing is extremely expensive and, because of reserve knowledge acquired through other means, largely unnecessary. Not surprisingly, the companies are reluctant to commit to expenditure that they deem expensive and unnecessary in order to satisfy the SEC’s reserves booking requirements. Strict interpretation of SEC rules would, however, mean that such reserves could not be treated as recoverable until so demonstrated.
Similarly, SEC guidelines dictate that reserves anticipated through some enhanced recovery technique can only be booked once that technique has been successfully applied in the specific reservoir formation. Yet, given their wealth of experience at the use of such techniques in different reservoirs around the world, oil companies increasingly make EOR investment decisions by applying their past knowledge to the new field (i.e. they use global analogues to assess likely enhanced oil recovery in a new region). Again, under SEC requirements, the booking of reserves using this seemingly sensible practice is ostensibly prohibited.
The point here is not to argue that there is something wrong with a conservative approach to reserves booking. However, in order to assess both growth and company value in what is essentially a resource industry investors need to be presented with a realistic view of what is available and over what time frame. In this respect, restricting the booking of reserves and therefore a representation of medium term growth through the use of over-prescriptive guidelines is hardly helpful.
7 January 2008 Integrated Oils Oil & Gas for Beginners
Page 80 Deutsche Bank AG/London
Non-qualifying reserves under the SEC guideline Importantly, the SEC also provides guidance on those reserve types that do not qualify for treatment as reserves.
Oil that may become available from known reservoirs but is classified separately as ‘indicated additional reserves’
Oil, gas and NGL’s the recovery of which is subject to reasonable doubt because of uncertainty as to geology, reservoir characteristics or economic factors
Oil gas and NGL’s that may be recovered from oil shales and sands, coal, gilsonite (natural asphalt) and other sources.
Significant here is the exclusion of the mining of oil sands and oil shales. For those companies with exposure to these oil sources (Shell, TOTAL, Exxon, etc) such sources cannot be included as oil reserves at the present time and tend to be separately disclosed.
SPE definitions - Proven, probable and possible
We have stated that it is the SEC definitions that are most important in determining reported recoverable reserves. The SPE definitions which are based on a more probabilistic approach are, however, also important not least as they potentially present a better representation of the reserves that might more realistically be expected to be recovered.
Under the SPE’s definitions, reserves are presented as proven, probable and possible depending upon the likelihood of their recovery. Thus:
Proven (1P) reserves. These are those reserves that, to a high degree of certainty (90% confidence or P90), are recoverable from known reservoirs under existing economic and operating conditions. There is relatively little risk associated with these reserves. As described earlier, proven developed reserves are reserves that can be recovered from existing wells with existing infrastructure and operating methods. Proven undeveloped reserves require development.
Proven plus Probable (2P) reserves. These are those reserves that analysis of geological and engineering data suggests are more likely than not to be recoverable. There is at least a 50% probability (or P50) that reserves recovered will exceed the estimate of Proven plus Probable reserves. All told this is the level of oil that based on probability analysis is most likely to be recovered.
Proven, Probable plus Possible (3P) reserves. These are those reserves that, to a low degree of certainty (10% confidence or P10), are recoverable. There is relatively high risk associated with these reserves. Reserves under this definition include those for which there is a 90% chance of recovery (proven), a 50% chance of recovery (probable) and up to a 10% chance of recovery (possible). Evidently, 3P reserves are the least conservative and, whilst ultimately 90% recovery may occur, from the outset the odds are that use of this measure will overstate the level of recovery.
Perhaps the simplest way of considering these guidelines is by reference to the probability curve shown below. The curve represents the probability distribution of the amount of oil recoverable in a field under a multitude of different variables and sensitivities. Through reference to the curve is possible to interpret that, under the differing assumptions, in 90% of cases the field would hold at least 270m barrels of oil, in 50% at least 310m barrels of oil and 10% of cases at least 350m barrels of oil. Conservatively and on a P1 basis, the number of barrels that is exceeded by 90% of the scenarios plotted is that which would be recognised as the 1P reserve estimate or in this instance some 270m barrels.
SPE definitions - Proven,
probable and possible
Proven (1P) reserves are
those reserves that, to a
high degree of certainty
(90% confidence or P90), are
recoverable
Proven plus Probable (2P)
reserves have at least a 50%
probability (or P50) that
reserves recovered will
exceed the estimate.
Proven, Probable plus
Possible (3P) reserves are
those reserves that, to a low
degree of certainty (10%
confidence or P10), are
recoverable

7 January 2008 Integrated Oils Oil & Gas for Beginners
Deutsche Bank AG/London Page 81
Figure 82: SPE reserves: Diagrammatic view of the definitions of 1P, 2P and 3P
0102030405060708090
100
250 260 270 280 290 300 310 320 330 340 350 360 370
Proved (P90)
Probable (P50)
Possible (P10)
Source: Deutsche Bank
In addition to these three definitions of reserves, a further category exists for those reserves which for whatever reason are not deemed commercially recoverable at the present time namely contingent resources (or technical reserves). Thus Contingent Resources are those quantities of hydrocarbons which are estimated, on a given date, to be potentially recoverable from known accumulations, but which are not currently considered to be commercially recoverable. Contingent Resources may be of a significant size, but still have constraints to development. These constraints, preventing the booking of reserves, may relate to lack of gas marketing arrangements or to technical, environmental or political barriers. Thus, for example, in the world of LNG while the gas deposits required for plant throughput may be known to be in place, a project will almost certainly not be deemed commercial and investment approval granted until contracts have been signed for the majority of the LNG product. As such, even though the gas reserves are known to exist, the absence of a secure market means that they cannot be treated as recoverable.
SEC and SPE – Some quirks. Roughly speaking (and we mean roughly), reserves that companies may claim as proven under SEC rules correspond with 1P (or P90) reserves under SPE definitions. SEC rules do, however, add additional constraints not least the exclusion of EOR techniques unless their efficacy has been demonstrated and liquids recovered from mining methods. There are however additional important quirks, not least the two below.
a) The SEC guidelines require the use of the market price of oil on 31 December as a basis for calculating proven reserves and future discounted cashflow whereas under SPE requirement long run budgeting assumptions are permitted. For those company’s involved in profit sharing contracts (PSC’s) this can have a meaningful impact on the reserves statement. This is because under PSC’s the oil companies recover their capital costs through reserves and production entitlement to ‘cost oil’. Clearly, the higher the oil price used to estimate their entitlement, the lower their entitlement to reserves. For those for whom PSC’s are significant, the result of applying this guideline in a year when the price of oil has shifted markedly is to require a meaningful negative adjustment to reserves. For example, we estimate that the c. $10 shift in oil prices between 31 December 2003 and the same date in 2004 resulted in a potential 15% reduction in industry reported reserves.
The SEC guidelines require
the use of the market price
of oil on 31 December as a
basis for calculating proven
reserves
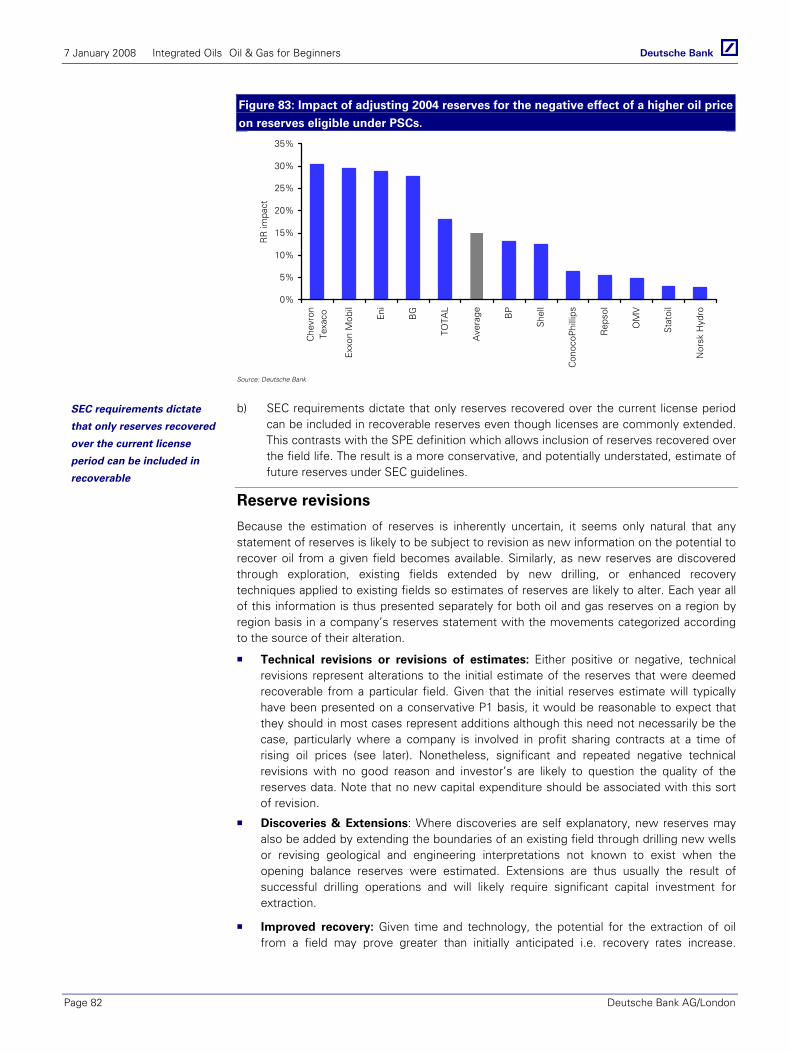
7 January 2008 Integrated Oils Oil & Gas for Beginners
Page 82 Deutsche Bank AG/London
Figure 83: Impact of adjusting 2004 reserves for the negative effect of a higher oil price
on reserves eligible under PSCs.
0%
5%
10%
15%
20%
25%
30%
35%
Che
vron
Texa
co
Exx
on M
obil
Eni
BG
TOTA
L
Ave
rage BP
She
ll
Con
ocoP
hilli
ps
Rep
sol
OM
V
Stat
oil
Nor
sk H
ydro
RR
impa
ct
Source: Deutsche Bank
b) SEC requirements dictate that only reserves recovered over the current license period can be included in recoverable reserves even though licenses are commonly extended. This contrasts with the SPE definition which allows inclusion of reserves recovered over the field life. The result is a more conservative, and potentially understated, estimate of future reserves under SEC guidelines.
Reserve revisions
Because the estimation of reserves is inherently uncertain, it seems only natural that any statement of reserves is likely to be subject to revision as new information on the potential to recover oil from a given field becomes available. Similarly, as new reserves are discovered through exploration, existing fields extended by new drilling, or enhanced recovery techniques applied to existing fields so estimates of reserves are likely to alter. Each year all of this information is thus presented separately for both oil and gas reserves on a region by region basis in a company’s reserves statement with the movements categorized according to the source of their alteration.
Technical revisions or revisions of estimates: Either positive or negative, technical revisions represent alterations to the initial estimate of the reserves that were deemed recoverable from a particular field. Given that the initial reserves estimate will typically have been presented on a conservative P1 basis, it would be reasonable to expect that they should in most cases represent additions although this need not necessarily be the case, particularly where a company is involved in profit sharing contracts at a time of rising oil prices (see later). Nonetheless, significant and repeated negative technical revisions with no good reason and investor’s are likely to question the quality of the reserves data. Note that no new capital expenditure should be associated with this sort of revision.
Discoveries & Extensions: Where discoveries are self explanatory, new reserves may also be added by extending the boundaries of an existing field through drilling new wells or revising geological and engineering interpretations not known to exist when the opening balance reserves were estimated. Extensions are thus usually the result of successful drilling operations and will likely require significant capital investment for extraction.
Improved recovery: Given time and technology, the potential for the extraction of oil from a field may prove greater than initially anticipated i.e. recovery rates increase.
SEC requirements dictate
that only reserves recovered
over the current license
period can be included in
recoverable

7 January 2008 Integrated Oils Oil & Gas for Beginners
Deutsche Bank AG/London Page 83
Typically this will be because at the time the field was first included in the reserves statement, the potential for enhanced oil recovery would not have been assessed.
Acquisitions and disposals: Shown separately, reserves movements on acquisitions and disposals highlight the reserves which have either been disposed of through the year or those acquired as asset parcels or through the purchase of another company.
Figure 84: Sources of industry reserve movements 1990-
2003
Figure 85: The North Sea: technical extensions and
enhanced recovery can be key to production growth.
-15,000
-10,000
-5,000
0
5,000
10,000
15,000
20,000
25,000
1990 1991 1992 1993 1994 1995 1996 1997 1998 1999 2000 2001 2002 2003
mill
ion
boe
10
11
12
13
14
rese
rves
life
(yea
rs)
Revisions Improved recoveryExtensions & discoveries Acquisitions+disposals (net)Production mboe Reserves/production
0
200
400
600
800
1000
1200
1988 1991 1994 1997 2000 2003E 2006E 2009E 2012E 2015E 2018E
'000 boed
Reserves and production creep
1988
1989
1993
1998
2004
Source: Deutsche Bank Source: Deutsche Bank
Intuitively, it would seem natural to expect that the single most important driver of reserve movements would be those reserves discovered through exploration. However, as illustrated above the reality is often very different. For example we estimate that extensions and discoveries on average accounted for around 50% of the increase in reserves in the period 1990 to 2003 (excluding reserve acquisitions). This is also largely illustrated by production and reserve creep in the North Sea. Whilst a significant proportion of the extension of North Sea production will have resulted from the discovery of new fields, a substantial proportion of the improvement arose as a consequence of greater recovery rates than initially anticipated aided by improvements in technology and changed economic circumstances (in this case a notable favourable change in the basis of taxation).
Reserves: What do they actually tell us?
Conceptually, data on reserves is of paramount significance when assessing the valuation of an exploration and production business given that it affords important information on the outlook for near to medium term growth, business sustainability, asset value, exploration and development efficiency and a company’s exploration capability. Indeed, of all of the ratios that are used to analyse a company’s performance, it is those derived from the reserves statement that provide the most insightful information on a company’s prospects and relative profitability.
Medium term growth: On the basis that under SEC reserve rules companies’ capital investment plans and reserve bookings go largely hand in hand, the reserves replacement ratio (i.e. aggregate reserve additions divided by annual production expressed as a percentage) affords a strong insight into near to medium term growth. This is because by booking the reserves the company is in large part indicating that investment plans are in place for the development of a set level of reserves. Thus reserve additions in excess of 100% on average over several years and the company is affording a strong indication that production is likely to grow. Similarly, reserve additions below 100% on average for a sustained period and pretty soon growth is likely to deteriorate.
Reserves: What do they
actually tell us?

7 January 2008 Integrated Oils Oil & Gas for Beginners
Page 84 Deutsche Bank AG/London
Business sustainability: By dividing total year end reserves over annual production, investors are afforded a view of how many years a company could sustain production for at current levels. Clearly, as a resource based industry, the greater the number of years of potential production the greater the value of the company and the more sustainable the valuation. It should be noted that, for a growing business, to maintain proven reserves at a set number of years requires greater than 100% annual reserves replacement. Indeed, for a company growing at 1% annually over the long term with 10.0 years of reserves life, reserve replacement would have to run at 111% per annum if reserves life of 10.0 years were to hold constant.
Figure 86: 2006 SEC 1P reported reserves by company Figure 87: Reserve Life by Company
0
5
10
15
20
25
XO
M BP
RDS
Chev
ron
Cono
co
Tota
l
Eni
Stat
oil
OX
Y
Reps
ol BG
MRO
Hes
s
bn/boe
Oil Gas
22.1
18
11.8 11.6 11.2 11.1
6.44.2
2.9 2.6 2.1 1.3 1.2
15.8
14.313.2 12.9 12.4
11.010.1 10.0 9.8 9.5 9.40 9.3
6.3
0
2
4
6
8
10
12
14
16
18
Cono
co
XO
M
OX
Y
Tota
l
Chev
ron
OM
V
Stat
oil
Eni
BG RDS
MRO
Hes
s
Reps
ol
Yrs
Reserves Life
Source: Deutsche Bank Source: Deutsche Bank
Asset value: As a resource based industry, the absolute level of a company’s reserves is clearly a central part of valuation affording investors a strong view of the company’s net asset base and, consequently, a further means of assessing absolute value and inter-company comparisons.
Cost efficiency. Combined with disclosed costs for exploration and development, reserves data provides investors with a view on the costs associated with discovering and developing a barrel of oil (typically expressed in US$ as finding and development costs per barrel of oil equivalent). This in turn affords investors with insightful information on the potential profitability of a company’s operations and allows for useful inter-company comparisons. Taken over time, this cost information also provides insight into the direction of industry costs and efficiency. Key ratios include finding costs per barrel of oil equivalent, finding and development (F&D) costs per barrel of oil equivalent and technical costs.
Exploration capability: Reserves data affords investors an insight into how successful a company has been relative to its peers at discovering new, commercial resources. All other things being equal, one would clearly expect a company that had shown consistent success in replacing its reserve base to be valued more highly than one whose record was less successful.
SEC Proved reserves versus 2P reserves: To the extent that companies release estimates of their total resource base in addition to SEC reported reserves, investors are afforded some insight into the potential for near term reserves bookings and, potentially, how conservative companies are in their reserve bookings. Perhaps more significantly, the provision by consultants such as Wood MacKenzie of estimated 2P reserves data for the different oil majors affords a useful view of the extent to which companies may or may not be conservative in their SEC reserve bookings together with an idea of how much scope exists to replace reserves from the existing resource bank in the medium term future.
7 January 2008 Integrated Oils Oil & Gas for Beginners
Deutsche Bank AG/London Page 85
Reserves Accounting– FAS 69 FAS 69 sets out a comprehensive set of disclosures which all publicly traded oil and gas companies are required to publish annually. Necessary disclosures include; proved oil and gas reserve quantities, capitalised costs relating to oil and gas producing activities, costs incurred in oil and gas property acquisition, exploration and development activities, results of operations for oil and gas producing activities and a standardised measure of discounted future cash flows.
Disclosure of proved oil and gas reserves
Net (both operating and non-operating interests) quantities of proved and proved developed reserves of crude oil and natural gas must be disclosed as at the beginning and end of the year. Changes in the net reserves should be disclosed separately as follows:
Revisions of previous estimates: Changes in estimates resulting from development drilling/changes in economic factors
Improved recovery: from application of improved recovery techniques
Purchases of reserves in place from other companies
Extensions and discoveries: extension of proved acreage and the discovery of new fields with proved reserves
Production: volume of reserves exploited during the year
Sales of reserves in place to other companies
If reserves relating to royalty interests are not included because the information is unavailable, that fact and the enterprises share of hydrocarbons produced should be disclosed for that year. The geographic location of the reserves should also be disclosed, in addition to oil and gas purchased under long-term supply agreements. As with all the disclosures detailed below, investments that are equity accounted should not be included but disclosed separately.
Disclosure of capitalised cost relating to oil and gas producing activities
The aggregate capitalised costs and the aggregate accumulated depreciation, depletion and amortisation (DDA) incurred during the year must be disclosed.
Capitalised costs comprise all costs capitalised during the year on both proved and unproved properties. DDA costs represent the accumulated depreciation on capitalised oil and gas assets and is included in technical costs, which are calculated on a per barrel of oil equivalent basis. Technical costs also include exploration costs and production costs.
Disclosure of costs incurred in oil and gas property acquisition
Both property acquisition costs expensed during the year and finding and development costs must be disclosed. Finding and development costs are generally quoted on a per barrel of oil equivalent basis. Finding costs comprise the costs of the exploration and appraisal programmes, while development costs are the costs of constructing and installing the facilities to produce and transport the oil and gas. Together they compare the money spent to add reserves with the actual reserves added.
FAS 69 sets out a
comprehensive set of
disclosures which all
publicly traded oil and gas
companies are required to
publish annually.
7 January 2008 Integrated Oils Oil & Gas for Beginners
Page 86 Deutsche Bank AG/London
Disclosure of operational results
Operations for oil and gas producing activities must be disclosed in aggregate and for each geographic region. This disclosure is effectively an income statement for FAS 69 purposes and includes:
Revenues: must be separated into sales to third parties and sales to affiliates. All revenues must be shown at arms length prices. Production or severance taxes should not be deducted in determining gross revenues but should be included as part of production costs. Royalty payments and net profit disbursements should be excluded from gross revenues.
Production costs: also known as lifting or operating costs – comprise staff costs, on-site energy costs, rental of capital equipment and consumables such as drill bits etc.
Exploration costs and DDA as explained above
Income taxes: which are calculated using the statutory tax rate for the period
Disclosure of discounted future net cash flows
A standardised measure of discounted future net cash flows relating to an enterprise’s interests in proved reserves and in reserves subject to purchase under long-term supply agreements must be disclosed at the year end. This incorporates the following:
Future cash inflows: calculated by applying the year-end prices to year end reserve volumes
Future development and production costs: estimated expenditure to be incurred in developing and producing the proved oil and gas reserves based on year end costs (assuming a continuation of existing economic conditions)
Future income tax expenses: calculated by applying the appropriate year-end statutory tax rates, with consideration of future tax rates already legislated, to the future pre-tax net cash flows, less the tax basis of the properties involved
Future net cash flows: future cash inflows less future development and production costs and tax expenses
Discount: discount rate of 10% p.a. to reflect the timing of the future net cash flows
Standardised measure of discounted future net cash flows: future net cash flows less the computed discount
In addition, the aggregate change in the standardised measure must be disclosed and if material should be presented in its individual components; net change in sales and transfer prices and in production costs related to future production, changes in estimated future development costs, sales and transfers of oil and gas produced during the period, net change due to extensions, discoveries and improved recovery, net change due to purchases and sales of mineral in place, net change due to revisions in quantity estimates, previously estimated development costs incurred during the period, accretion of discount, net change in income taxes and other.
Disclosure of current cost information
FAS 69 permits companies to use historical cost/constant dollar measures in computing assets and related expenses. Companies need to present supplementary information in a current cost basis if it has significant holdings of inventory and other non-hydrocarbon related property, plant and equipment balances.
Operations for oil and gas
producing activities must be
disclosed in aggregate and
for each geographic region.
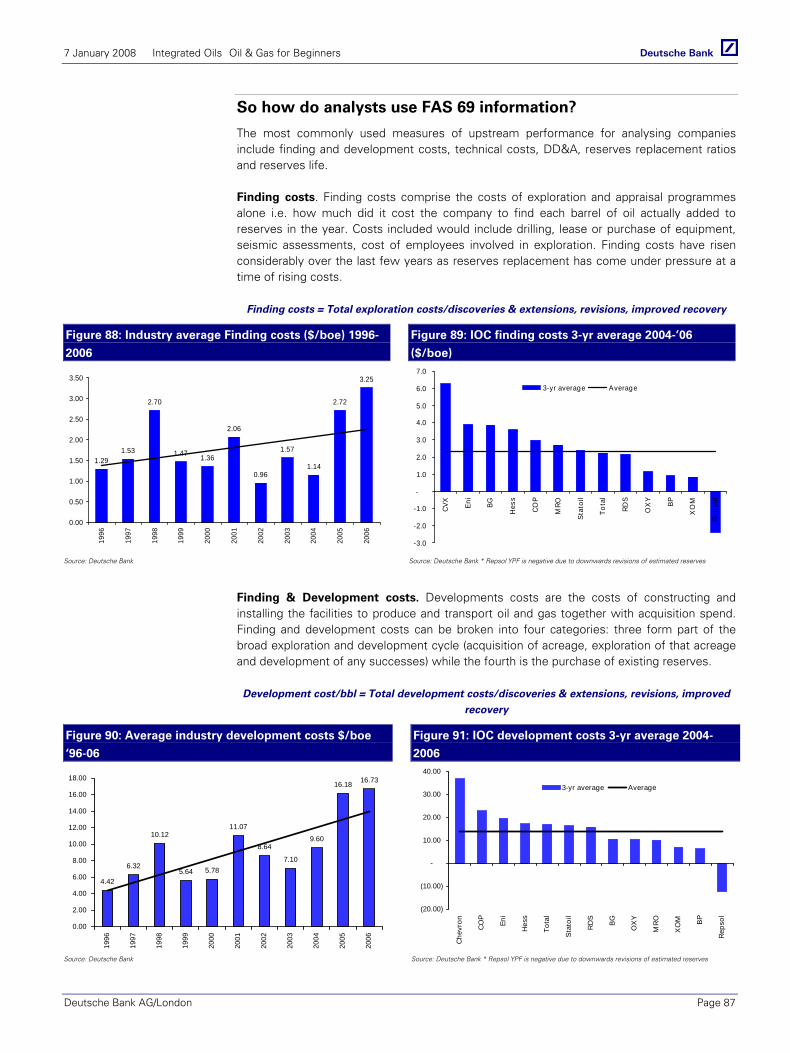
7 January 2008 Integrated Oils Oil & Gas for Beginners
Deutsche Bank AG/London Page 87
So how do analysts use FAS 69 information?
The most commonly used measures of upstream performance for analysing companies include finding and development costs, technical costs, DD&A, reserves replacement ratios and reserves life.
Finding costs. Finding costs comprise the costs of exploration and appraisal programmes alone i.e. how much did it cost the company to find each barrel of oil actually added to reserves in the year. Costs included would include drilling, lease or purchase of equipment, seismic assessments, cost of employees involved in exploration. Finding costs have risen considerably over the last few years as reserves replacement has come under pressure at a time of rising costs.
Finding costs = Total exploration costs/discoveries & extensions, revisions, improved recovery
Figure 88: Industry average Finding costs ($/boe) 1996-
2006
Figure 89: IOC finding costs 3-yr average 2004-’06
($/boe)
1.291.53
2.70
1.47 1.36
2.06
0.96
1.57
1.14
2.72
3.25
0.00
0.50
1.00
1.50
2.00
2.50
3.00
3.50
1996
1997
1998
1999
2000
2001
2002
2003
2004
2005
2006
-3.0
-2.0
-1.0
-
1.0
2.0
3.0
4.0
5.0
6.0
7.0
CVX
Eni
BG
Hes
s
COP
MRO
Stat
oil
Tota
l
RDS
OX
Y BP
XO
M
Reps
ol
3-yr average Average
Source: Deutsche Bank Source: Deutsche Bank * Repsol YPF is negative due to downwards revisions of estimated reserves
Finding & Development costs. Developments costs are the costs of constructing and installing the facilities to produce and transport oil and gas together with acquisition spend. Finding and development costs can be broken into four categories: three form part of the broad exploration and development cycle (acquisition of acreage, exploration of that acreage and development of any successes) while the fourth is the purchase of existing reserves.
Development cost/bbl = Total development costs/discoveries & extensions, revisions, improved
recovery
Figure 90: Average industry development costs $/boe
‘96-06
Figure 91: IOC development costs 3-yr average 2004-
2006
4.42
6.32
10.12
5.64 5.78
11.07
8.64
7.10
9.60
16.18 16.73
0.00
2.00
4.00
6.00
8.00
10.00
12.00
14.00
16.00
18.00
1996
1997
1998
1999
2000
2001
2002
2003
2004
2005
2006
(20.00)
(10.00)
-
10.00
20.00
30.00
40.00
Che
vron
CO
P
Eni
Hes
s
Tota
l
Sta
toil
RD
S
BG
OX
Y
MR
O
XO
M BP
Rep
sol
3-yr average Average
Source: Deutsche Bank Source: Deutsche Bank * Repsol YPF is negative due to downwards revisions of estimated reserves
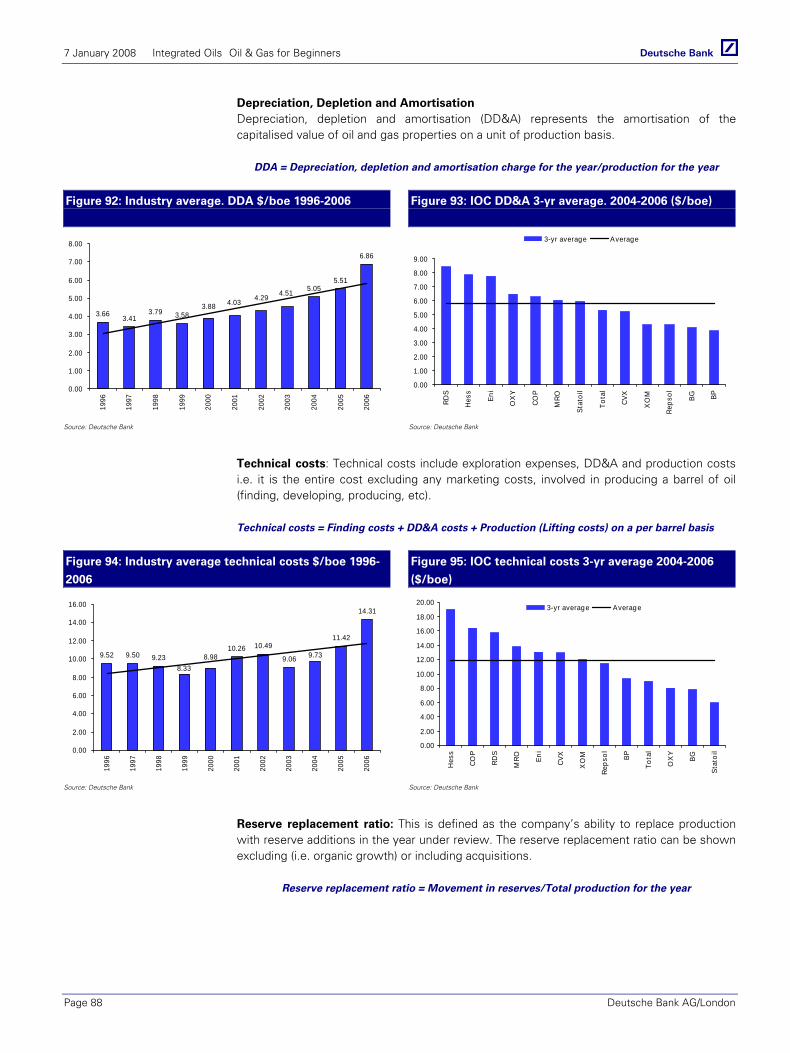
7 January 2008 Integrated Oils Oil & Gas for Beginners
Page 88 Deutsche Bank AG/London
Depreciation, Depletion and Amortisation Depreciation, depletion and amortisation (DD&A) represents the amortisation of the capitalised value of oil and gas properties on a unit of production basis.
DDA = Depreciation, depletion and amortisation charge for the year/production for the year
Figure 92: Industry average. DDA $/boe 1996-2006
Figure 93: IOC DD&A 3-yr average. 2004-2006 ($/boe)
3.66 3.413.79 3.58
5.055.51
6.86
3.88 4.034.514.29
0.00
1.00
2.00
3.00
4.00
5.00
6.00
7.00
8.00
1996
1997
1998
1999
2000
2001
2002
2003
2004
2005
2006
0.00
1.00
2.00
3.00
4.00
5.00
6.00
7.00
8.00
9.00
RDS
Hes
s
Eni
OX
Y
COP
MRO
Stat
oil
Tota
l
CVX
XO
M
Reps
ol BG BP
3-yr average Average
Source: Deutsche Bank Source: Deutsche Bank
Technical costs: Technical costs include exploration expenses, DD&A and production costs i.e. it is the entire cost excluding any marketing costs, involved in producing a barrel of oil (finding, developing, producing, etc).
Technical costs = Finding costs + DD&A costs + Production (Lifting costs) on a per barrel basis
Figure 94: Industry average technical costs $/boe 1996-
2006
Figure 95: IOC technical costs 3-yr average 2004-2006
($/boe)
9.52 9.50 9.2310.26 10.49
9.06
11.42
14.31
9.738.988.33
0.00
2.00
4.00
6.00
8.00
10.00
12.00
14.00
16.00
1996
1997
1998
1999
2000
2001
2002
2003
2004
2005
2006
0.00
2.00
4.00
6.00
8.00
10.00
12.00
14.00
16.00
18.00
20.00
Hes
s
COP
RDS
MRO En
i
CVX
XO
M
Reps
ol BP
Tota
l
OX
Y
BG
Stat
oil
3-yr average Average
Source: Deutsche Bank Source: Deutsche Bank
Reserve replacement ratio: This is defined as the company’s ability to replace production with reserve additions in the year under review. The reserve replacement ratio can be shown excluding (i.e. organic growth) or including acquisitions.
Reserve replacement ratio = Movement in reserves/Total production for the year

7 January 2008 Integrated Oils Oil & Gas for Beginners
Deutsche Bank AG/London Page 89
Figure 96: Industry average reserve replacement %
1996-2006
Figure 97: IOC reserve replacement 3-yr average 2004-
2006
0
20
40
60
80
100
120
140
160
180
1996
1997
1998
1999
2000
2001
2002
2003
2004
2005
2006
-150
-100
-50
0
50
100
150
MR
O
XO
M
OX
Y
Hes
s
BP BG
Tota
l
Sta
toil
RD
S
Eni
CO
P
CV
X
Rep
sol
3-yr average Average
Source: Deutsche Bank Source: Deutsche Bank * Repsol is negative due to significant downward revisions of reserves in ‘05 and ‘06
Reserve Life: This is the number of remaining years of 1P reserves and is calculated as remaining reserves over annual production. It indicates how many years a company can continue to produce from its existing reserves should it find no additional reserves and maintain the same rate of production. Despite much pessimism regarding reserve life, as the below chart shows, the average in 2006 was not very dissimilar to the average 10 years ago. It is also worth noting that these reserve lives are only based on 1P reserves, while most companies have significant volumes of 2P reserves, which are probably a more accurate representation of sustainability.
Reserve Life = Total 1P reserves/annual production
Figure 98: Industry average reserve life 1996-2006
(years)
Figure 99: IOC reserve life 3-yr average 2004-2006 (years)
11.45
11.7111.80
12.04
11.5211.62
11.37
11.23
11.92 11.87
11.22
10.8
11.0
11.2
11.4
11.6
11.8
12.0
12.2
1996
1997
1998
1999
2000
2001
2002
2003
2004
2005
2006
0.0
2.0
4.0
6.0
8.0
10.0
12.0
14.0
16.0
BP
OX
Y
Tota
l
COP
BG Eni
CVX
XO
M
Stat
oil
MRO
Hes
s
Reps
ol
RDS
3-yr average Average
Source: Deutsche Bank Source: Deutsche Bank
All of the above FAS69 indicators are used by the market to asses the efficiency and profitability of each company. However, it should be noted that these measures are not always the most meaningful. For example, the oil sands (12% of remaining reserves) are not allowable 1P reserves under SEC definitions and are as such are excluded from all ratios.

7 January 2008 Integrated Oils Oil & Gas for Beginners
Page 90 Deutsche Bank AG/London
Reserves - Where and what? It is the nature of life that all things most highly sought after are the hardest to find…and oil is no different. Located predominantly in ‘unfriendly’ countries or in technically challenging locations or located in vast quantities in friendly countries but in difficult to extract/process forms, oil reserves are not to be had easily!
Figure 100: Oil reserves around the world – 1,371 billion
barrels at end of 2006
Figure 101: Gas reserves around the world – 6,405 TCF
at end of 2006
Europe & Eurasia11%
Saud i Arab ia19%
Midd le East o ther34%
Africa9%
Asia Pacif ic3%
Canad ian Oil sands12%
S. & Cen t . Am erica
8%
N orth Am erica4%
Russia26%
Europe & Eurasia9%
M idd le East41%
Africa8%
Asia Pacif ic8%
N orth Am erica4% S. & Cen t .
America4%
Source: Deutsche Bank, BP Statistical Review Source: Deutsche Bank, BP Statistical Review
As illustrated above, over 50% of the world’s oil reserves are located in the Middle East, a region which has suffered repeated geopolitical tensions and instability throughout the years. Saudi Arabia alone with its 264 billion barrels is the world’s largest holder of oil reserves and consequently the largest producer and exporter of oil in the world.
It is worth noting that all reserves estimates for OPEC countries are issued by the countries themselves who do not issue any detail on wells or any detailed data hence these estimates could be subject to manipulation (particularly when we consider that OPEC production quotas are tied to its members reserves and that the level of reserves in a country can enable that country to gain access to bigger loans at lower interest rates). It is also worth noting that the definition of reserves varies from country to country e.g. in the US only reserves that are being produced are classified as proven while in Saudi Arabia all known fields are classified as proven, while Venezuela includes non-conventional oil (bitumen) in its reserve base.
So how much oil has been extracted?
While the use of oil is age old, commercial production only truly commenced in the 1860s following Drake’s drilling success in Pennsylvania. Since then some 50,000 oil fields have been discovered and oil production has increased exponentially; in 1859 total annual production in the US was a mere 2,000 barrels, within 47 years this figure was 127m/bbls, and in 2006 a total of 2.5bn bbls were produced in the US. While it is almost impossible to accurately state what total initial; global reserves were (given new fields are discovered every year and reserves estimates are changed as new technology is developed which enables additional reserves to be classified as commercial), it is estimated that approximately 77% of the world’s total recoverable oil has already been discovered of which 39% has already been produced and consumed. As illustrated below, an average 46% of initial reserves in the top ten reserve holders have been depleted since production commenced.
Over 50% of the world’s oil
reserves are located in the
Middle East
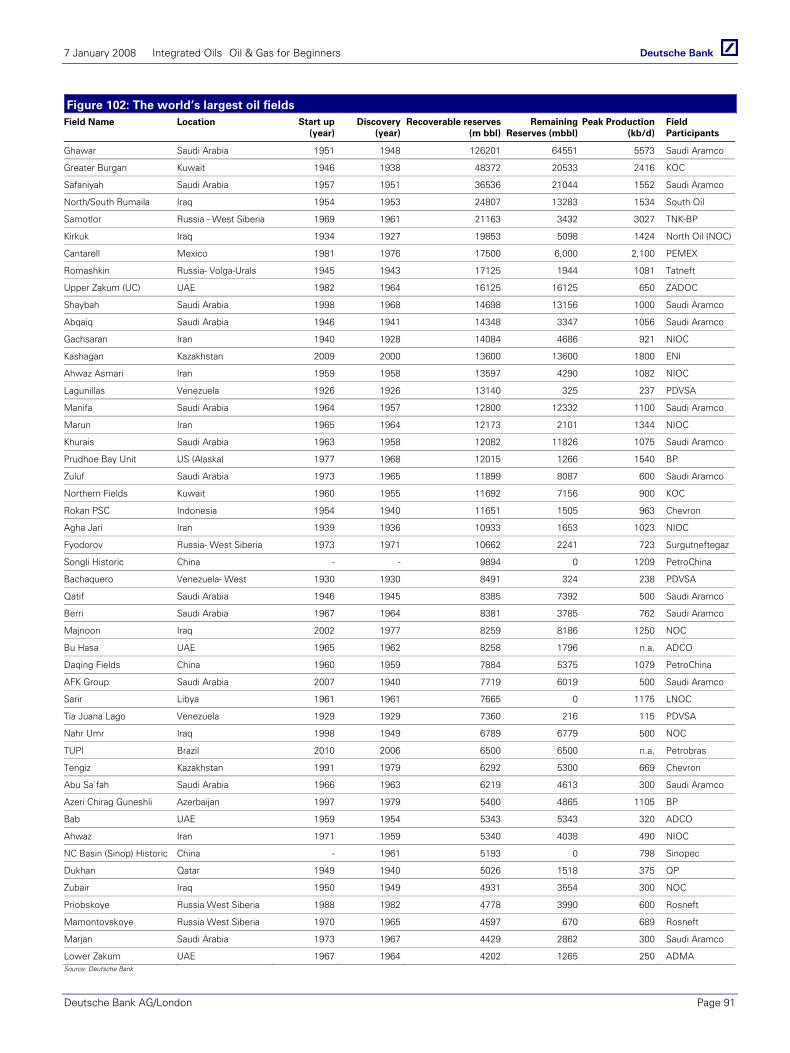
7 January 2008 Integrated Oils Oil & Gas for Beginners
Deutsche Bank AG/London Page 91
Figure 102: The world’s largest oil fields Field Name Location Start up
(year)Discovery
(year)Recoverable reserves
(m bbl)Remaining
Reserves (mbbl) Peak Production
(kb/d)Field Participants
Ghawar Saudi Arabia 1951 1948 126201 64551 5573 Saudi Aramco
Greater Burgan Kuwait 1946 1938 48372 20533 2416 KOC
Safaniyah Saudi Arabia 1957 1951 36536 21044 1552 Saudi Aramco
North/South Rumaila Iraq 1954 1953 24807 13283 1534 South Oil
Samotlor Russia - West Siberia 1969 1961 21163 3432 3027 TNK-BP
Kirkuk Iraq 1934 1927 19853 5098 1424 North Oil (NOC)
Cantarell Mexico 1981 1976 17500 6,000 2,100 PEMEX
Romashkin Russia- Volga-Urals 1945 1943 17125 1944 1081 Tatneft
Upper Zakum (UC) UAE 1982 1964 16125 16125 650 ZADOC
Shaybah Saudi Arabia 1998 1968 14698 13156 1000 Saudi Aramco
Abqaiq Saudi Arabia 1946 1941 14348 3347 1056 Saudi Aramco
Gachsaran Iran 1940 1928 14084 4686 921 NIOC
Kashagan Kazakhstan 2009 2000 13600 13600 1800 ENI
Ahwaz Asmari Iran 1959 1958 13597 4290 1082 NIOC
Lagunillas Venezuela 1926 1926 13140 325 237 PDVSA
Manifa Saudi Arabia 1964 1957 12800 12332 1100 Saudi Aramco
Marun Iran 1965 1964 12173 2101 1344 NIOC
Khurais Saudi Arabia 1963 1958 12082 11826 1075 Saudi Aramco
Prudhoe Bay Unit US (Alaska) 1977 1968 12015 1266 1540 BP
Zuluf Saudi Arabia 1973 1965 11899 8087 600 Saudi Aramco
Northern Fields Kuwait 1960 1955 11692 7156 900 KOC
Rokan PSC Indonesia 1954 1940 11651 1505 963 Chevron
Agha Jari Iran 1939 1936 10933 1653 1023 NIOC
Fyodorov Russia- West Siberia 1973 1971 10662 2241 723 Surgutneftegaz
Songli Historic China - - 9894 0 1209 PetroChina
Bachaquero Venezuela- West 1930 1930 8491 324 238 PDVSA
Qatif Saudi Arabia 1946 1945 8385 7392 500 Saudi Aramco
Berri Saudi Arabia 1967 1964 8381 3785 762 Saudi Aramco
Majnoon Iraq 2002 1977 8259 8186 1250 NOC
Bu Hasa UAE 1965 1962 8258 1796 n.a. ADCO
Daqing Fields China 1960 1959 7884 5375 1079 PetroChina
AFK Group Saudi Arabia 2007 1940 7719 6019 500 Saudi Aramco
Sarir Libya 1961 1961 7665 0 1175 LNOC
Tía Juana Lago Venezuela 1929 1929 7360 216 115 PDVSA
Nahr Umr Iraq 1998 1949 6789 6779 500 NOC
TUPI Brazil 2010 2006 6500 6500 n.a. Petrobras
Tengiz Kazakhstan 1991 1979 6292 5300 669 Chevron
Abu Sa`fah Saudi Arabia 1966 1963 6219 4613 300 Saudi Aramco
Azeri Chirag Guneshli Azerbaijan 1997 1979 5400 4865 1105 BP
Bab UAE 1959 1954 5343 5343 320 ADCO
Ahwaz Iran 1971 1959 5340 4038 490 NIOC
NC Basin (Sinop) Historic China - 1961 5193 0 798 Sinopec
Dukhan Qatar 1949 1940 5026 1518 375 QP
Zubair Iraq 1950 1949 4931 3554 300 NOC
Priobskoye Russia West Siberia 1988 1982 4778 3990 600 Rosneft
Mamontovskoye Russia West Siberia 1970 1965 4597 670 689 Rosneft
Marjan Saudi Arabia 1973 1967 4429 2862 300 Saudi Aramco
Lower Zakum UAE 1967 1964 4202 1265 250 ADMA Source: Deutsche Bank
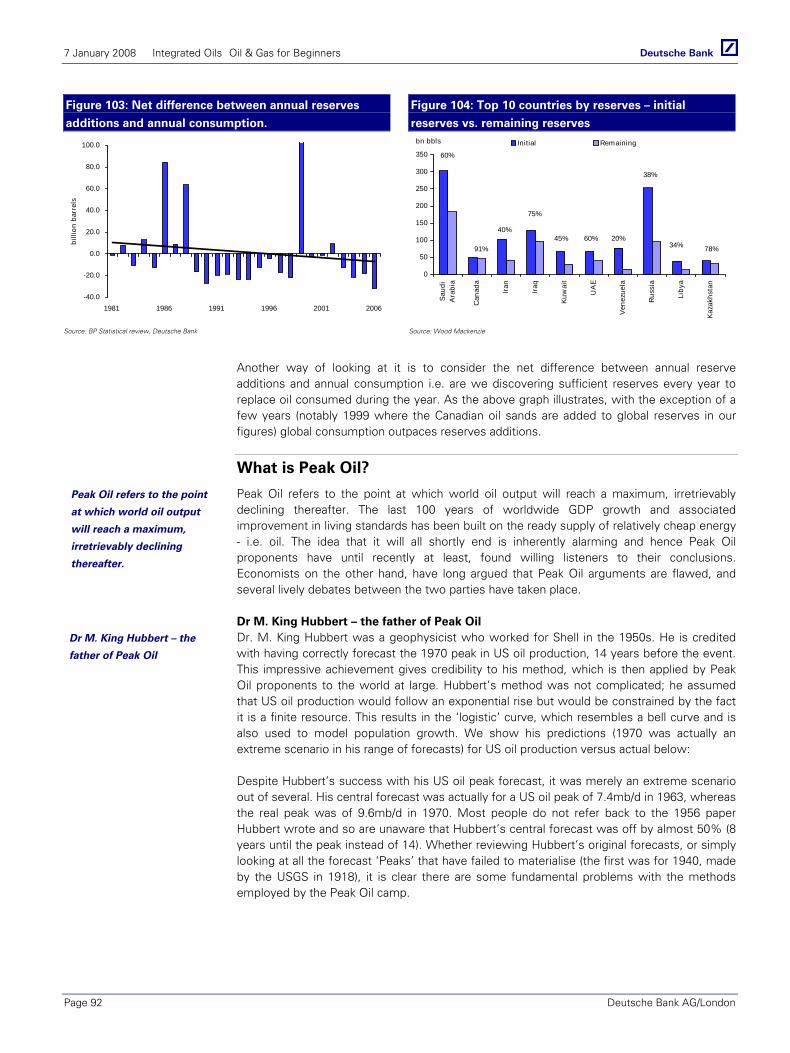
7 January 2008 Integrated Oils Oil & Gas for Beginners
Page 92 Deutsche Bank AG/London
Figure 103: Net difference between annual reserves
additions and annual consumption.
Figure 104: Top 10 countries by reserves – initial
reserves vs. remaining reserves
-40.0
-20.0
0.0
20.0
40.0
60.0
80.0
100.0
1981 1986 1991 1996 2001 2006
billi
on b
arre
ls
0
50
100
150
200
250
300
350
Sau
diA
rabi
a
Can
ada
Iran
Iraq
Kuw
ait
UA
E
Ven
ezue
la
Rus
sia
Liby
a
Kaz
akhs
tan
bn bbls Initial Remaining
60%
91%
40%
75%
45% 60% 20%
38%
34% 78%
Source: BP Statistical review, Deutsche Bank Source: Wood Mackenzie
Another way of looking at it is to consider the net difference between annual reserve additions and annual consumption i.e. are we discovering sufficient reserves every year to replace oil consumed during the year. As the above graph illustrates, with the exception of a few years (notably 1999 where the Canadian oil sands are added to global reserves in our figures) global consumption outpaces reserves additions.
What is Peak Oil?
Peak Oil refers to the point at which world oil output will reach a maximum, irretrievably declining thereafter. The last 100 years of worldwide GDP growth and associated improvement in living standards has been built on the ready supply of relatively cheap energy - i.e. oil. The idea that it will all shortly end is inherently alarming and hence Peak Oil proponents have until recently at least, found willing listeners to their conclusions. Economists on the other hand, have long argued that Peak Oil arguments are flawed, and several lively debates between the two parties have taken place.
Dr M. King Hubbert – the father of Peak Oil Dr. M. King Hubbert was a geophysicist who worked for Shell in the 1950s. He is credited with having correctly forecast the 1970 peak in US oil production, 14 years before the event. This impressive achievement gives credibility to his method, which is then applied by Peak Oil proponents to the world at large. Hubbert’s method was not complicated; he assumed that US oil production would follow an exponential rise but would be constrained by the fact it is a finite resource. This results in the ‘logistic’ curve, which resembles a bell curve and is also used to model population growth. We show his predictions (1970 was actually an extreme scenario in his range of forecasts) for US oil production versus actual below:
Despite Hubbert’s success with his US oil peak forecast, it was merely an extreme scenario out of several. His central forecast was actually for a US oil peak of 7.4mb/d in 1963, whereas the real peak was of 9.6mb/d in 1970. Most people do not refer back to the 1956 paper Hubbert wrote and so are unaware that Hubbert’s central forecast was off by almost 50% (8 years until the peak instead of 14). Whether reviewing Hubbert’s original forecasts, or simply looking at all the forecast ‘Peaks’ that have failed to materialise (the first was for 1940, made by the USGS in 1918), it is clear there are some fundamental problems with the methods employed by the Peak Oil camp.
Peak Oil refers to the point
at which world oil output
will reach a maximum,
irretrievably declining
thereafter.
Dr M. King Hubbert – the
father of Peak Oil
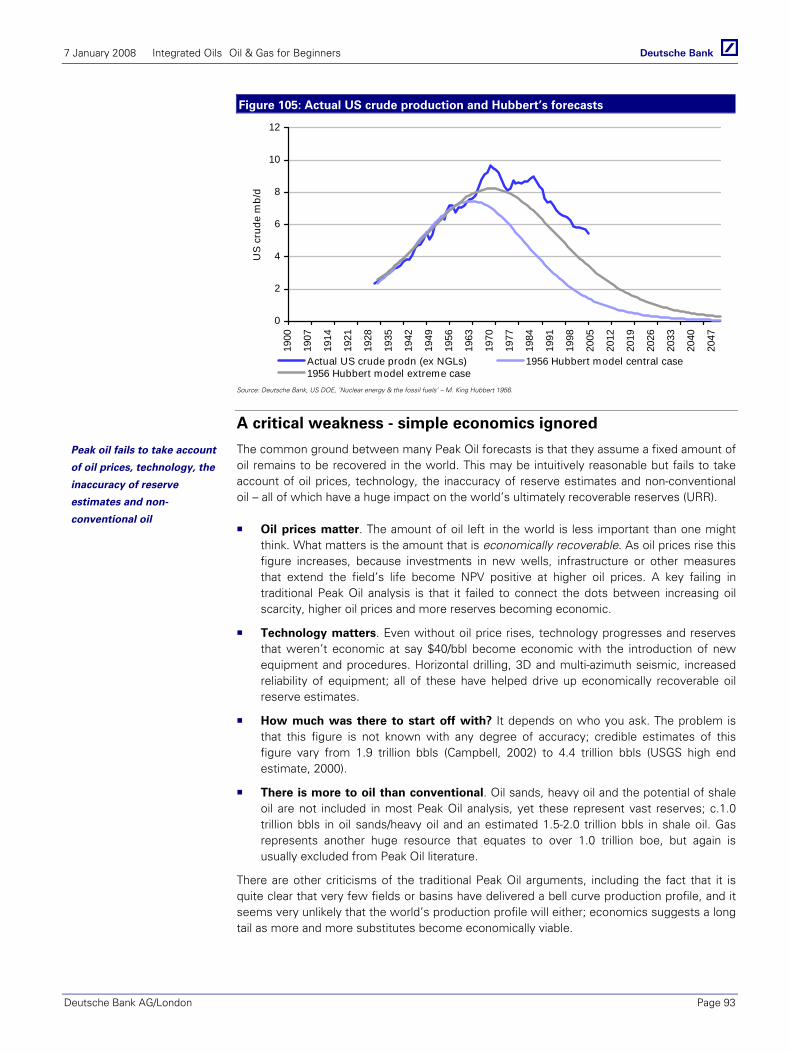
7 January 2008 Integrated Oils Oil & Gas for Beginners
Deutsche Bank AG/London Page 93
Figure 105: Actual US crude production and Hubbert’s forecasts
0
2
4
6
8
10
12
1900
1907
1914
1921
1928
1935
1942
1949
1956
1963
1970
1977
1984
1991
1998
2005
2012
2019
2026
2033
2040
2047
US
cru
de m
b/d
Actual US crude prodn (ex NGLs) 1956 Hubbert model central case1956 Hubbert model extreme case
Source: Deutsche Bank, US DOE, ‘Nuclear energy & the fossil fuels’ – M. King Hubbert 1956.
A critical weakness - simple economics ignored
The common ground between many Peak Oil forecasts is that they assume a fixed amount of oil remains to be recovered in the world. This may be intuitively reasonable but fails to take account of oil prices, technology, the inaccuracy of reserve estimates and non-conventional oil – all of which have a huge impact on the world’s ultimately recoverable reserves (URR).
Oil prices matter. The amount of oil left in the world is less important than one might think. What matters is the amount that is economically recoverable. As oil prices rise this figure increases, because investments in new wells, infrastructure or other measures that extend the field’s life become NPV positive at higher oil prices. A key failing in traditional Peak Oil analysis is that it failed to connect the dots between increasing oil scarcity, higher oil prices and more reserves becoming economic.
Technology matters. Even without oil price rises, technology progresses and reserves that weren’t economic at say $40/bbl become economic with the introduction of new equipment and procedures. Horizontal drilling, 3D and multi-azimuth seismic, increased reliability of equipment; all of these have helped drive up economically recoverable oil reserve estimates.
How much was there to start off with? It depends on who you ask. The problem is that this figure is not known with any degree of accuracy; credible estimates of this figure vary from 1.9 trillion bbls (Campbell, 2002) to 4.4 trillion bbls (USGS high end estimate, 2000).
There is more to oil than conventional. Oil sands, heavy oil and the potential of shale oil are not included in most Peak Oil analysis, yet these represent vast reserves; c.1.0 trillion bbls in oil sands/heavy oil and an estimated 1.5-2.0 trillion bbls in shale oil. Gas represents another huge resource that equates to over 1.0 trillion boe, but again is usually excluded from Peak Oil literature.
There are other criticisms of the traditional Peak Oil arguments, including the fact that it is quite clear that very few fields or basins have delivered a bell curve production profile, and it seems very unlikely that the world’s production profile will either; economics suggests a long tail as more and more substitutes become economically viable.
Peak oil fails to take account
of oil prices, technology, the
inaccuracy of reserve
estimates and non-
conventional oil
7 January 2008 Integrated Oils Oil & Gas for Beginners
Page 94 Deutsche Bank AG/London
So when will a peak occur and does it matter?
In 2006 Exxon stated that it believed there will be no peak for at least 25 years, and the IEA forecasts a peak between 2025-2050. So is there no need to worry?
There will be a peak, and it will probably be within the lifetime of most people that read this text. What matters is not when such a peak occurs but what will the mix of energy supply be in 100 years, and how painful the transition will be. Relying purely on market forces, IOCs and OPEC countries to ensure a smooth transition seems like a recipe for turmoil. Rather, governments need to help the process. For example governments could:
Much more aggressively promote more energy efficiency measures and lifestyles by appropriate tax schemes and other incentives.
Encourage a step change (by say an order of magnitude) in investment by companies, including the IOCs, into alternative energy sources.
Provide substantial state funding for research into alternative energy.
With careful management of both the demand and supply side of oil and gas governments could help minimise the pain in the transition from the hydrocarbon age to a post hydrocarbon world. There are tentative signs that the process has started. The alternative is a much more dramatic change, which can only add to worldwide tensions.
There will be a peak, and it
will probably be within the
lifetime of most people that
read this text
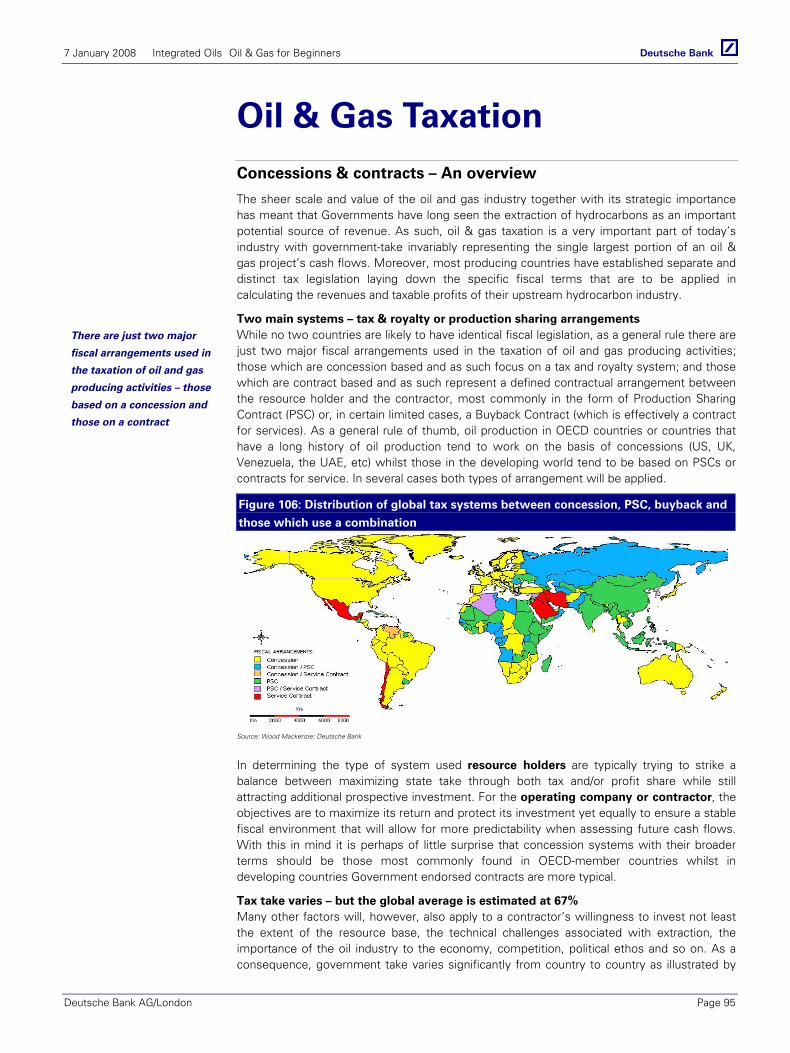
7 January 2008 Integrated Oils Oil & Gas for Beginners
Deutsche Bank AG/London Page 95
Oil & Gas Taxation Concessions & contracts – An overview
The sheer scale and value of the oil and gas industry together with its strategic importance has meant that Governments have long seen the extraction of hydrocarbons as an important potential source of revenue. As such, oil & gas taxation is a very important part of today’s industry with government-take invariably representing the single largest portion of an oil & gas project’s cash flows. Moreover, most producing countries have established separate and distinct tax legislation laying down the specific fiscal terms that are to be applied in calculating the revenues and taxable profits of their upstream hydrocarbon industry.
Two main systems – tax & royalty or production sharing arrangements While no two countries are likely to have identical fiscal legislation, as a general rule there are just two major fiscal arrangements used in the taxation of oil and gas producing activities; those which are concession based and as such focus on a tax and royalty system; and those which are contract based and as such represent a defined contractual arrangement between the resource holder and the contractor, most commonly in the form of Production Sharing Contract (PSC) or, in certain limited cases, a Buyback Contract (which is effectively a contract for services). As a general rule of thumb, oil production in OECD countries or countries that have a long history of oil production tend to work on the basis of concessions (US, UK, Venezuela, the UAE, etc) whilst those in the developing world tend to be based on PSCs or contracts for service. In several cases both types of arrangement will be applied.
Figure 106: Distribution of global tax systems between concession, PSC, buyback and
those which use a combination
Source: Wood Mackenzie; Deutsche Bank
In determining the type of system used resource holders are typically trying to strike a balance between maximizing state take through both tax and/or profit share while still attracting additional prospective investment. For the operating company or contractor, the objectives are to maximize its return and protect its investment yet equally to ensure a stable fiscal environment that will allow for more predictability when assessing future cash flows. With this in mind it is perhaps of little surprise that concession systems with their broader terms should be those most commonly found in OECD-member countries whilst in developing countries Government endorsed contracts are more typical.
Tax take varies – but the global average is estimated at 67% Many other factors will, however, also apply to a contractor’s willingness to invest not least the extent of the resource base, the technical challenges associated with extraction, the importance of the oil industry to the economy, competition, political ethos and so on. As a consequence, government take varies significantly from country to country as illustrated by
There are just two major
fiscal arrangements used in
the taxation of oil and gas
producing activities – those
based on a concession and
those on a contract
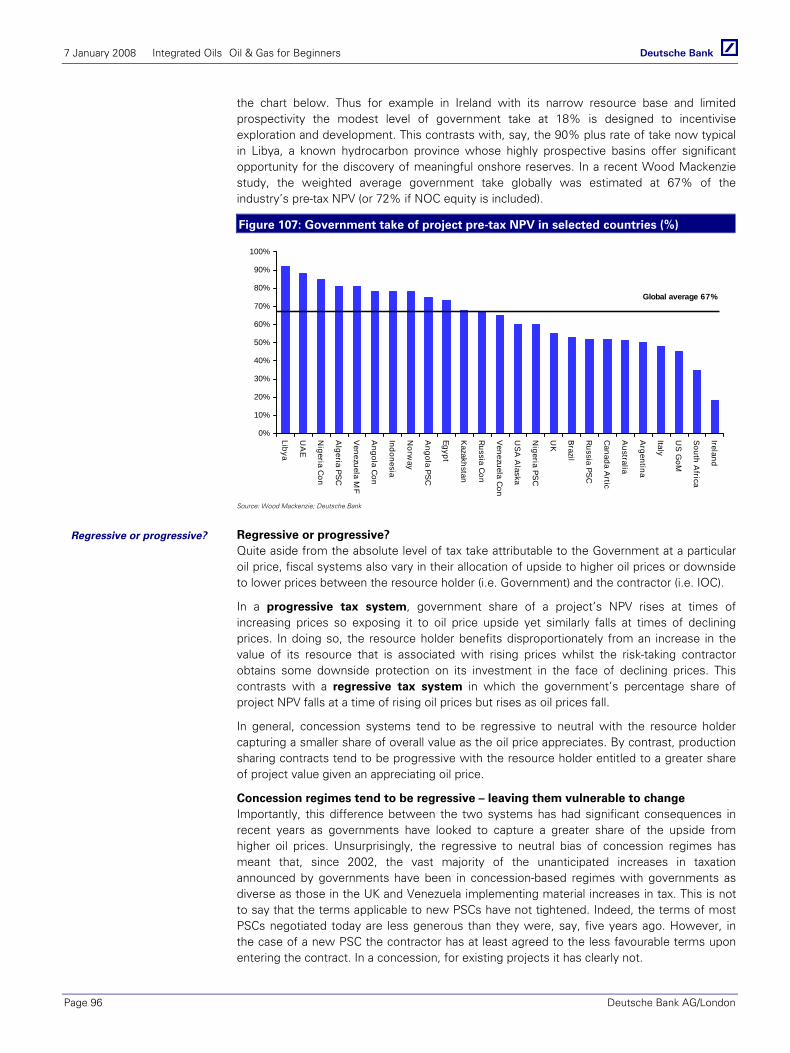
7 January 2008 Integrated Oils Oil & Gas for Beginners
Page 96 Deutsche Bank AG/London
the chart below. Thus for example in Ireland with its narrow resource base and limited prospectivity the modest level of government take at 18% is designed to incentivise exploration and development. This contrasts with, say, the 90% plus rate of take now typical in Libya, a known hydrocarbon province whose highly prospective basins offer significant opportunity for the discovery of meaningful onshore reserves. In a recent Wood Mackenzie study, the weighted average government take globally was estimated at 67% of the industry’s pre-tax NPV (or 72% if NOC equity is included).
Figure 107: Government take of project pre-tax NPV in selected countries (%)
0%
10%
20%
30%
40%
50%
60%
70%
80%
90%
100%
Libya
UA
E
Nigeria C
on
Algeria PS
C
Venezuela M
F
Angola C
on
Indonesia
Norw
ay
Angola PS
C
Egypt
Kazakhstan
Russia Con
Venezuela C
on
US
A A
laska
Nigeria PS
C
UK
Brazil
Russia PS
C
Canada A
rtic
Australia
Argentina
Italy
US
GoM
South A
frica
Ireland
Global average 67%
Source: Wood Mackenzie; Deutsche Bank
Regressive or progressive? Quite aside from the absolute level of tax take attributable to the Government at a particular oil price, fiscal systems also vary in their allocation of upside to higher oil prices or downside to lower prices between the resource holder (i.e. Government) and the contractor (i.e. IOC).
In a progressive tax system, government share of a project’s NPV rises at times of increasing prices so exposing it to oil price upside yet similarly falls at times of declining prices. In doing so, the resource holder benefits disproportionately from an increase in the value of its resource that is associated with rising prices whilst the risk-taking contractor obtains some downside protection on its investment in the face of declining prices. This contrasts with a regressive tax system in which the government’s percentage share of project NPV falls at a time of rising oil prices but rises as oil prices fall.
In general, concession systems tend to be regressive to neutral with the resource holder capturing a smaller share of overall value as the oil price appreciates. By contrast, production sharing contracts tend to be progressive with the resource holder entitled to a greater share of project value given an appreciating oil price.
Concession regimes tend to be regressive – leaving them vulnerable to change Importantly, this difference between the two systems has had significant consequences in recent years as governments have looked to capture a greater share of the upside from higher oil prices. Unsurprisingly, the regressive to neutral bias of concession regimes has meant that, since 2002, the vast majority of the unanticipated increases in taxation announced by governments have been in concession-based regimes with governments as diverse as those in the UK and Venezuela implementing material increases in tax. This is not to say that the terms applicable to new PSCs have not tightened. Indeed, the terms of most PSCs negotiated today are less generous than they were, say, five years ago. However, in the case of a new PSC the contractor has at least agreed to the less favourable terms upon entering the contract. In a concession, for existing projects it has clearly not.
Regressive or progressive?
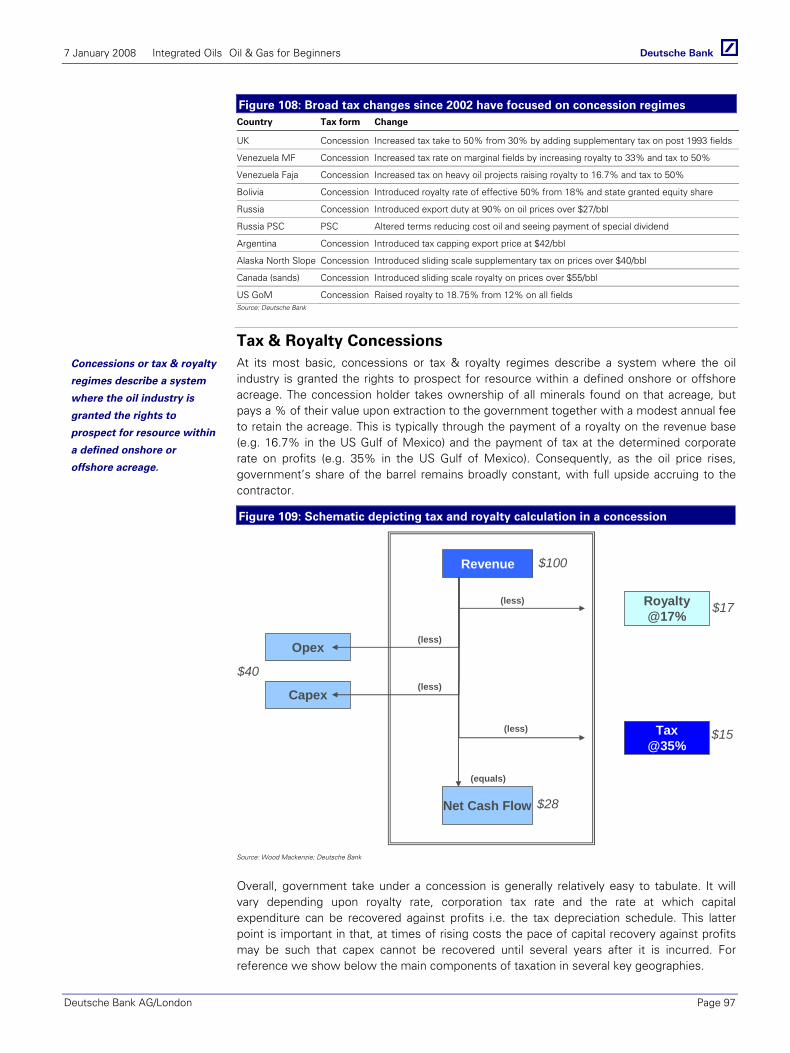
7 January 2008 Integrated Oils Oil & Gas for Beginners
Deutsche Bank AG/London Page 97
Figure 108: Broad tax changes since 2002 have focused on concession regimes Country Tax form Change
UK Concession Increased tax take to 50% from 30% by adding supplementary tax on post 1993 fields
Venezuela MF Concession Increased tax rate on marginal fields by increasing royalty to 33% and tax to 50%
Venezuela Faja Concession Increased tax on heavy oil projects raising royalty to 16.7% and tax to 50%
Bolivia Concession Introduced royalty rate of effective 50% from 18% and state granted equity share
Russia Concession Introduced export duty at 90% on oil prices over $27/bbl
Russia PSC PSC Altered terms reducing cost oil and seeing payment of special dividend
Argentina Concession Introduced tax capping export price at $42/bbl
Alaska North Slope Concession Introduced sliding scale supplementary tax on prices over $40/bbl
Canada (sands) Concession Introduced sliding scale royalty on prices over $55/bbl
US GoM Concession Raised royalty to 18.75% from 12% on all fields Source: Deutsche Bank
Tax & Royalty Concessions At its most basic, concessions or tax & royalty regimes describe a system where the oil industry is granted the rights to prospect for resource within a defined onshore or offshore acreage. The concession holder takes ownership of all minerals found on that acreage, but pays a % of their value upon extraction to the government together with a modest annual fee to retain the acreage. This is typically through the payment of a royalty on the revenue base (e.g. 16.7% in the US Gulf of Mexico) and the payment of tax at the determined corporate rate on profits (e.g. 35% in the US Gulf of Mexico). Consequently, as the oil price rises, government’s share of the barrel remains broadly constant, with full upside accruing to the contractor.
Figure 109: Schematic depicting tax and royalty calculation in a concession
Revenue
Net Cash Flow
Opex
Capex
Tax @35%
Royalty@17%
(less)
(less)
(equals)
(less)
(less)
$100
$17
$15
$40
$28
Source: Wood Mackenzie; Deutsche Bank
Overall, government take under a concession is generally relatively easy to tabulate. It will vary depending upon royalty rate, corporation tax rate and the rate at which capital expenditure can be recovered against profits i.e. the tax depreciation schedule. This latter point is important in that, at times of rising costs the pace of capital recovery against profits may be such that capex cannot be recovered until several years after it is incurred. For reference we show below the main components of taxation in several key geographies.
Concessions or tax & royalty
regimes describe a system
where the oil industry is
granted the rights to
prospect for resource within
a defined onshore or
offshore acreage.
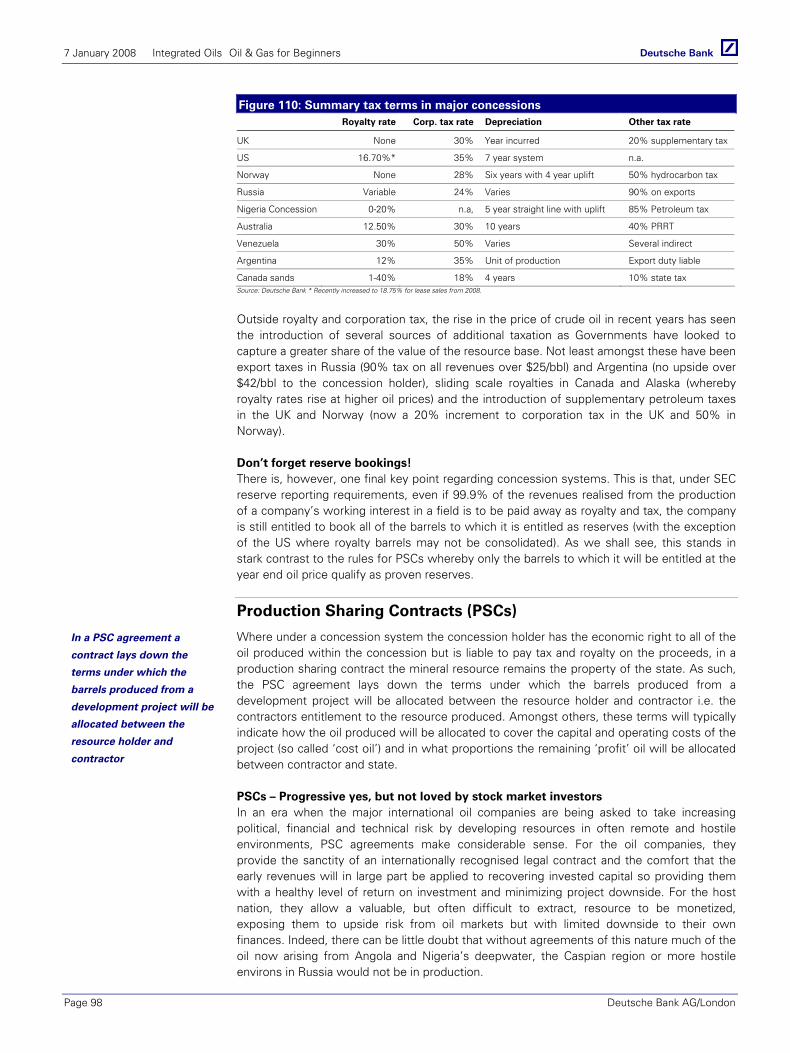
7 January 2008 Integrated Oils Oil & Gas for Beginners
Page 98 Deutsche Bank AG/London
Figure 110: Summary tax terms in major concessions Royalty rate Corp. tax rate Depreciation Other tax rate
UK None 30% Year incurred 20% supplementary tax
US 16.70%* 35% 7 year system n.a.
Norway None 28% Six years with 4 year uplift 50% hydrocarbon tax
Russia Variable 24% Varies 90% on exports
Nigeria Concession 0-20% n.a, 5 year straight line with uplift 85% Petroleum tax
Australia 12.50% 30% 10 years 40% PRRT
Venezuela 30% 50% Varies Several indirect
Argentina 12% 35% Unit of production Export duty liable
Canada sands 1-40% 18% 4 years 10% state tax Source: Deutsche Bank * Recently increased to 18.75% for lease sales from 2008.
Outside royalty and corporation tax, the rise in the price of crude oil in recent years has seen the introduction of several sources of additional taxation as Governments have looked to capture a greater share of the value of the resource base. Not least amongst these have been export taxes in Russia (90% tax on all revenues over $25/bbl) and Argentina (no upside over $42/bbl to the concession holder), sliding scale royalties in Canada and Alaska (whereby royalty rates rise at higher oil prices) and the introduction of supplementary petroleum taxes in the UK and Norway (now a 20% increment to corporation tax in the UK and 50% in Norway).
Don’t forget reserve bookings! There is, however, one final key point regarding concession systems. This is that, under SEC reserve reporting requirements, even if 99.9% of the revenues realised from the production of a company’s working interest in a field is to be paid away as royalty and tax, the company is still entitled to book all of the barrels to which it is entitled as reserves (with the exception of the US where royalty barrels may not be consolidated). As we shall see, this stands in stark contrast to the rules for PSCs whereby only the barrels to which it will be entitled at the year end oil price qualify as proven reserves.
Production Sharing Contracts (PSCs)
Where under a concession system the concession holder has the economic right to all of the oil produced within the concession but is liable to pay tax and royalty on the proceeds, in a production sharing contract the mineral resource remains the property of the state. As such, the PSC agreement lays down the terms under which the barrels produced from a development project will be allocated between the resource holder and contractor i.e. the contractors entitlement to the resource produced. Amongst others, these terms will typically indicate how the oil produced will be allocated to cover the capital and operating costs of the project (so called ‘cost oil’) and in what proportions the remaining ‘profit’ oil will be allocated between contractor and state.
PSCs – Progressive yes, but not loved by stock market investors In an era when the major international oil companies are being asked to take increasing political, financial and technical risk by developing resources in often remote and hostile environments, PSC agreements make considerable sense. For the oil companies, they provide the sanctity of an internationally recognised legal contract and the comfort that the early revenues will in large part be applied to recovering invested capital so providing them with a healthy level of return on investment and minimizing project downside. For the host nation, they allow a valuable, but often difficult to extract, resource to be monetized, exposing them to upside risk from oil markets but with limited downside to their own finances. Indeed, there can be little doubt that without agreements of this nature much of the oil now arising from Angola and Nigeria’s deepwater, the Caspian region or more hostile environs in Russia would not be in production.
In a PSC agreement a
contract lays down the
terms under which the
barrels produced from a
development project will be
allocated between the
resource holder and
contractor
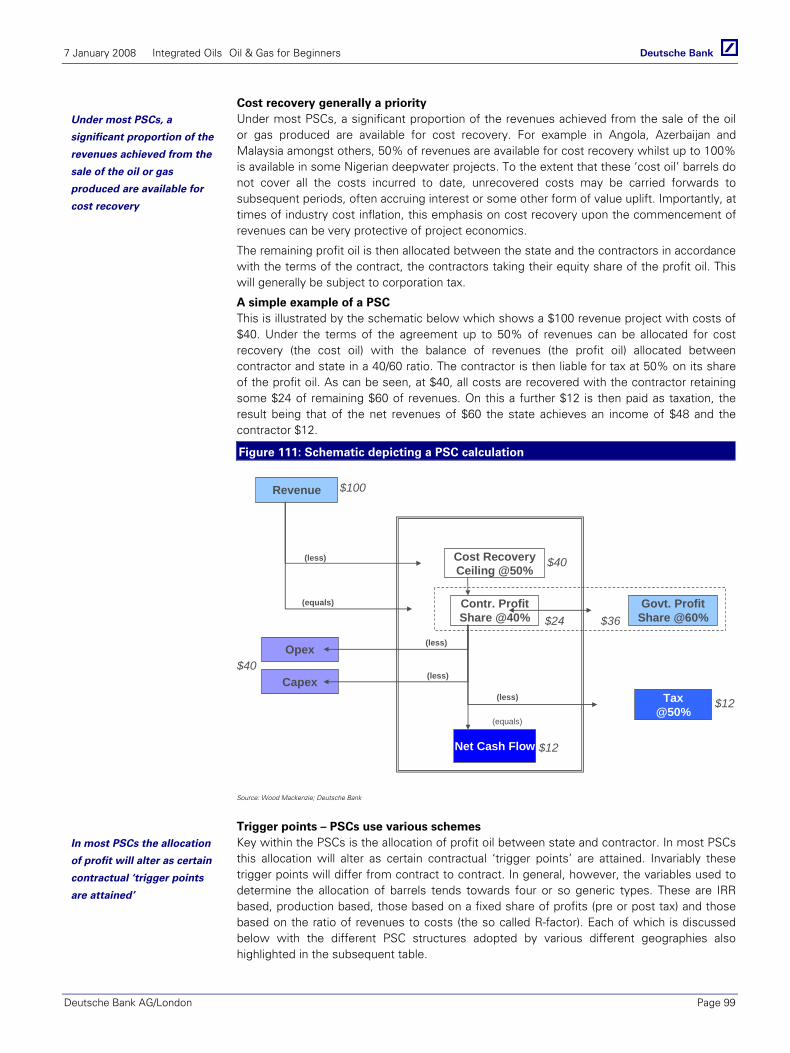
7 January 2008 Integrated Oils Oil & Gas for Beginners
Deutsche Bank AG/London Page 99
Cost recovery generally a priority Under most PSCs, a significant proportion of the revenues achieved from the sale of the oil or gas produced are available for cost recovery. For example in Angola, Azerbaijan and Malaysia amongst others, 50% of revenues are available for cost recovery whilst up to 100% is available in some Nigerian deepwater projects. To the extent that these ‘cost oil’ barrels do not cover all the costs incurred to date, unrecovered costs may be carried forwards to subsequent periods, often accruing interest or some other form of value uplift. Importantly, at times of industry cost inflation, this emphasis on cost recovery upon the commencement of revenues can be very protective of project economics.
The remaining profit oil is then allocated between the state and the contractors in accordance with the terms of the contract, the contractors taking their equity share of the profit oil. This will generally be subject to corporation tax.
A simple example of a PSC This is illustrated by the schematic below which shows a $100 revenue project with costs of $40. Under the terms of the agreement up to 50% of revenues can be allocated for cost recovery (the cost oil) with the balance of revenues (the profit oil) allocated between contractor and state in a 40/60 ratio. The contractor is then liable for tax at 50% on its share of the profit oil. As can be seen, at $40, all costs are recovered with the contractor retaining some $24 of remaining $60 of revenues. On this a further $12 is then paid as taxation, the result being that of the net revenues of $60 the state achieves an income of $48 and the contractor $12.
Figure 111: Schematic depicting a PSC calculation
Revenue
Net Cash Flow
Opex
CapexTax
@50%
Cost Recovery Ceiling @50%
Contr. Profit Share @40%
Govt. Profit Share @60%
(less)
(less)
(equals)
(less)
(less)
$100
$12
$40
$12
$40
$24 $36
(equals)
Source: Wood Mackenzie; Deutsche Bank
Trigger points – PSCs use various schemes Key within the PSCs is the allocation of profit oil between state and contractor. In most PSCs this allocation will alter as certain contractual ‘trigger points’ are attained. Invariably these trigger points will differ from contract to contract. In general, however, the variables used to determine the allocation of barrels tends towards four or so generic types. These are IRR based, production based, those based on a fixed share of profits (pre or post tax) and those based on the ratio of revenues to costs (the so called R-factor). Each of which is discussed below with the different PSC structures adopted by various different geographies also highlighted in the subsequent table.
Under most PSCs, a
significant proportion of the
revenues achieved from the
sale of the oil or gas
produced are available for
cost recovery
In most PSCs the allocation
of profit will alter as certain
contractual ‘trigger points
are attained’
7 January 2008 Integrated Oils Oil & Gas for Beginners
Page 100 Deutsche Bank AG/London
IRR based PSCs: IRR based contracts are structured such that, depending upon the internal rate of return that the project has achieved, the share of profit oil barrels will alter. As with most PSCs they typically allocate a higher share of revenues to the contractor through the early phases of a project but a greater share to the state as the contractors’ capital is recouped and the rate of return on the project rises. Indeed, as their name suggests, changes in the allocation of barrels between state and contractor (trigger points) tend to be associated with the achievement of different internal rates of return. Countries which commonly use IRR-based contracts as a mechanism for determining share include Angola, Russia, Kazakhstan, and Azerbaijan, amongst others. In our opinion, the advantages of IRR based contracts are that they are generally geared towards rewarding the contractor first and directed at the achievement of an acceptable level of return. As such they are very protective of a company’s upfront capital investment (particularly at times of cost inflation). The disadvantage, however, is that once that return has been achieved the change in barrel allocation tends to be quite severe. Equally, depending on the proportion of initial revenues that are available for cost recovery they can mean that the state receives little by way of revenue through the early years of a project. This has led to conflicts between state and contractor, particularly where cost increases have also been evident (e.g. Sakhalin and Kashagan).
Production based PSCs. These contracts generally tend to be written around cumulative production, with changes in total oil or gas produced driving the change in allocation (e.g. Nigeria Deepwater, Malaysian offshore, Egypt, etc). In some cases they may, however, be based on the absolute volume of daily production planned (e.g. Qatar). In our opinion, production based contracts are particularly profitable for the contractor given an upwards shift in the oil price (from that at the time the contract was written) but have the potential to be quite painful given a downward shift. In aggregate they are certainly less sensitive to upwards changes in the oil price than IRR based contracts because the change in allocation is based upon time to produce rather return achieved. Again, the State’s delayed exposure to oil price rises can result in conflict (Nigeria DW).
R-Factor (revenue) based PSCs. PSCs of this nature are based around trigger points that come into effect as certain ratios of revenue to cost are attained. As a consequence they are quite sensitive to the impact of rising oil prices, an event that is almost certain to ensure that trigger points are more rapidly attained. At the same time, however, because revenue allocation will almost certainly remain biased towards the contractor as long as the revenue/cost ratio is low they afford good cost protection at times of industry cost inflation. Examples of countries that tend towards R-factor based contracts include Yemen, Qatar and Libya.
Fixed share PSCs. Although PSCs of this nature share profits between the state and the contractor, in reality because the allocation of profit oil is fixed they have much in common with tax and royalty arrangements. For the contractor, the advantage is that recovery of cost oil is given a priority - again providing protection at times of rising cost. That aside, given that the government’s share of profit oil is fixed, they are not dissimilar to a concession. Examples of a fixed-share PSC include many of those written in Indonesia.
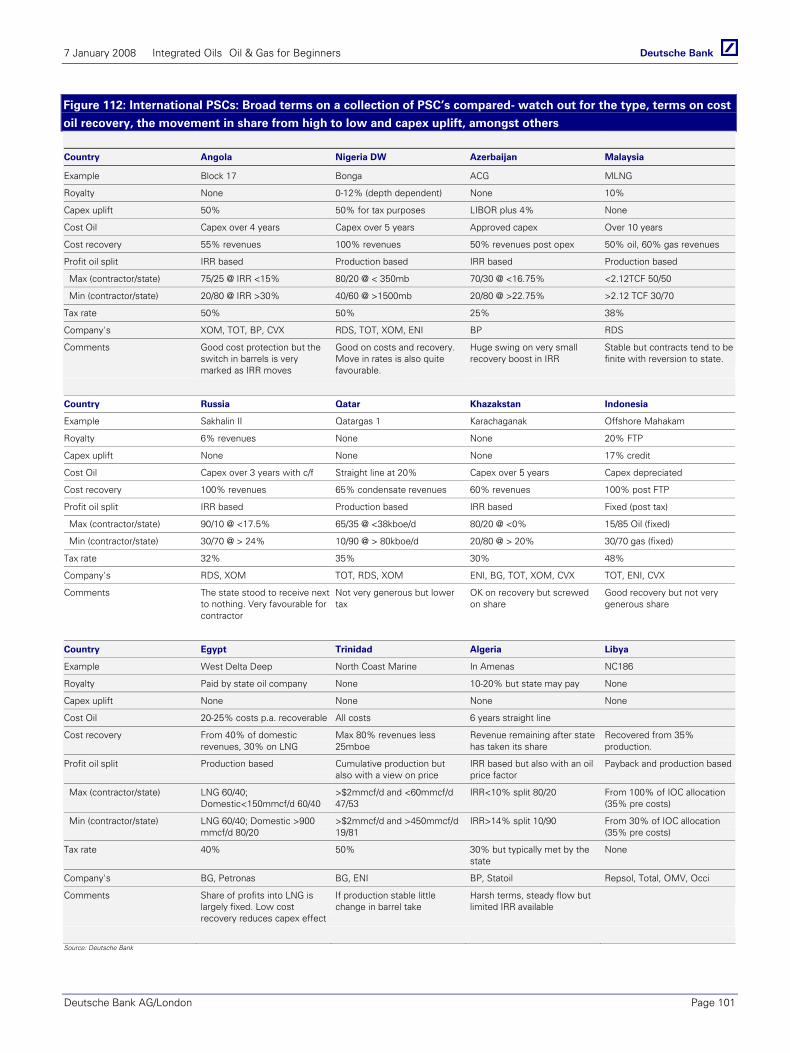
7 January 2008 Integrated Oils Oil & Gas for Beginners
Deutsche Bank AG/London Page 101
Figure 112: International PSCs: Broad terms on a collection of PSC’s compared- watch out for the type, terms on cost
oil recovery, the movement in share from high to low and capex uplift, amongst others
Country Angola Nigeria DW Azerbaijan Malaysia
Example Block 17 Bonga ACG MLNG
Royalty None 0-12% (depth dependent) None 10%
Capex uplift 50% 50% for tax purposes LIBOR plus 4% None
Cost Oil Capex over 4 years Capex over 5 years Approved capex Over 10 years
Cost recovery 55% revenues 100% revenues 50% revenues post opex 50% oil, 60% gas revenues
Profit oil split IRR based Production based IRR based Production based
Max (contractor/state) 75/25 @ IRR <15% 80/20 @ < 350mb 70/30 @ <16.75% <2.12TCF 50/50
Min (contractor/state) 20/80 @ IRR >30% 40/60 @ >1500mb 20/80 @ >22.75% >2.12 TCF 30/70
Tax rate 50% 50% 25% 38%
Company's XOM, TOT, BP, CVX RDS, TOT, XOM, ENI BP RDS
Comments Good cost protection but the switch in barrels is very marked as IRR moves
Good on costs and recovery. Move in rates is also quite favourable.
Huge swing on very small recovery boost in IRR
Stable but contracts tend to be finite with reversion to state.
Country Russia Qatar Khazakstan Indonesia
Example Sakhalin II Qatargas 1 Karachaganak Offshore Mahakam
Royalty 6% revenues None None 20% FTP
Capex uplift None None None 17% credit
Cost Oil Capex over 3 years with c/f Straight line at 20% Capex over 5 years Capex depreciated
Cost recovery 100% revenues 65% condensate revenues 60% revenues 100% post FTP
Profit oil split IRR based Production based IRR based Fixed (post tax)
Max (contractor/state) 90/10 @ <17.5% 65/35 @ <38kboe/d 80/20 @ <0% 15/85 Oil (fixed)
Min (contractor/state) 30/70 @ > 24% 10/90 @ > 80kboe/d 20/80 @ > 20% 30/70 gas (fixed)
Tax rate 32% 35% 30% 48%
Company's RDS, XOM TOT, RDS, XOM ENI, BG, TOT, XOM, CVX TOT, ENI, CVX
Comments The state stood to receive next to nothing. Very favourable for contractor
Not very generous but lower tax
OK on recovery but screwed on share
Good recovery but not very generous share
Country Egypt Trinidad Algeria Libya
Example West Delta Deep North Coast Marine In Amenas NC186
Royalty Paid by state oil company None 10-20% but state may pay None
Capex uplift None None None None
Cost Oil 20-25% costs p.a. recoverable All costs 6 years straight line
Cost recovery From 40% of domestic revenues, 30% on LNG
Max 80% revenues less 25mboe
Revenue remaining after state has taken its share
Recovered from 35% production.
Profit oil split Production based Cumulative production but also with a view on price
IRR based but also with an oil price factor
Payback and production based
Max (contractor/state) LNG 60/40; Domestic<150mmcf/d 60/40
>$2mmcf/d and <60mmcf/d 47/53
IRR<10% split 80/20 From 100% of IOC allocation (35% pre costs)
Min (contractor/state) LNG 60/40; Domestic >900 mmcf/d 80/20
>$2mmcf/d and >450mmcf/d 19/81
IRR>14% split 10/90 From 30% of IOC allocation (35% pre costs)
Tax rate 40% 50% 30% but typically met by the state
None
Company's BG, Petronas BG, ENI BP, Statoil Repsol, Total, OMV, Occi
Comments Share of profits into LNG is largely fixed. Low cost recovery reduces capex effect
If production stable little change in barrel take
Harsh terms, steady flow but limited IRR available
Source: Deutsche Bank
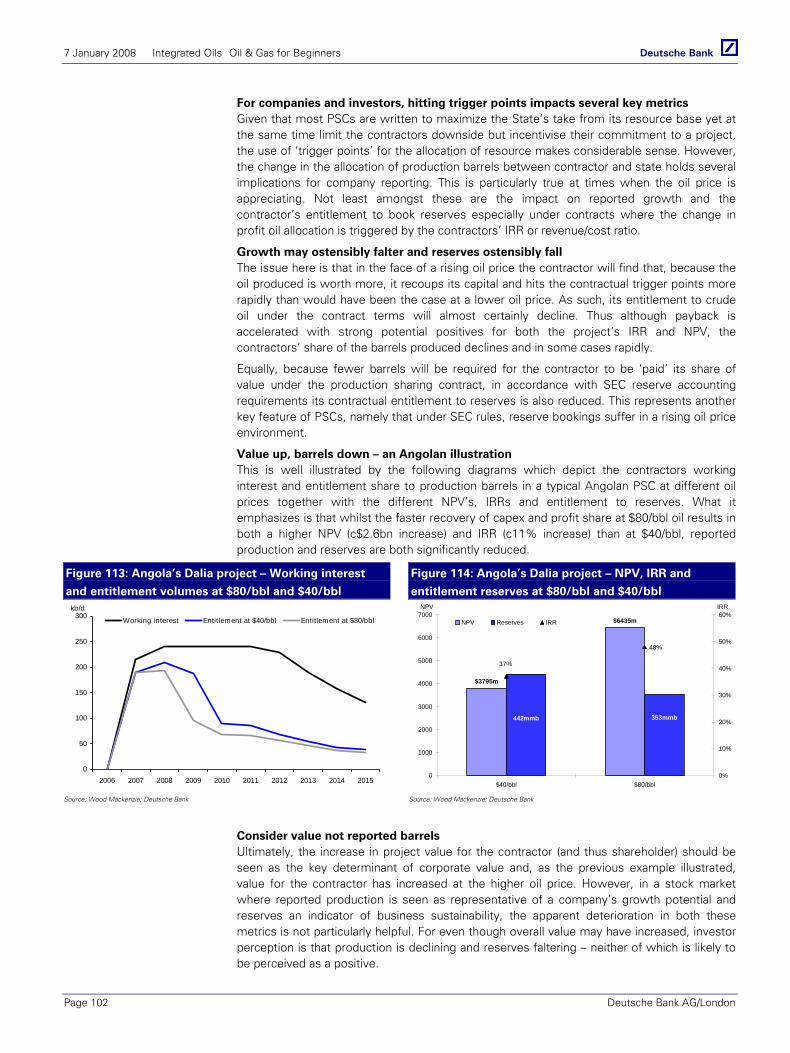
7 January 2008 Integrated Oils Oil & Gas for Beginners
Page 102 Deutsche Bank AG/London
For companies and investors, hitting trigger points impacts several key metrics Given that most PSCs are written to maximize the State’s take from its resource base yet at the same time limit the contractors downside but incentivise their commitment to a project, the use of ‘trigger points’ for the allocation of resource makes considerable sense. However, the change in the allocation of production barrels between contractor and state holds several implications for company reporting. This is particularly true at times when the oil price is appreciating. Not least amongst these are the impact on reported growth and the contractor’s entitlement to book reserves especially under contracts where the change in profit oil allocation is triggered by the contractors’ IRR or revenue/cost ratio.
Growth may ostensibly falter and reserves ostensibly fall The issue here is that in the face of a rising oil price the contractor will find that, because the oil produced is worth more, it recoups its capital and hits the contractual trigger points more rapidly than would have been the case at a lower oil price. As such, its entitlement to crude oil under the contract terms will almost certainly decline. Thus although payback is accelerated with strong potential positives for both the project’s IRR and NPV, the contractors’ share of the barrels produced declines and in some cases rapidly.
Equally, because fewer barrels will be required for the contractor to be ‘paid’ its share of value under the production sharing contract, in accordance with SEC reserve accounting requirements its contractual entitlement to reserves is also reduced. This represents another key feature of PSCs, namely that under SEC rules, reserve bookings suffer in a rising oil price environment.
Value up, barrels down – an Angolan illustration This is well illustrated by the following diagrams which depict the contractors working interest and entitlement share to production barrels in a typical Angolan PSC at different oil prices together with the different NPV’s, IRRs and entitlement to reserves. What it emphasizes is that whilst the faster recovery of capex and profit share at $80/bbl oil results in both a higher NPV (c$2.6bn increase) and IRR (c11% increase) than at $40/bbl, reported production and reserves are both significantly reduced.
Figure 113: Angola’s Dalia project – Working interest
and entitlement volumes at $80/bbl and $40/bbl
Figure 114: Angola’s Dalia project – NPV, IRR and
entitlement reserves at $80/bbl and $40/bbl
0
50
100
150
200
250
300
2006 2007 2008 2009 2010 2011 2012 2013 2014 2015
Working interest Entitlement at $40/bbl Entitlement at $80/bbl
kb/d $6435m
$3795m
353mmb442mmb
48%
37%
0
1000
2000
3000
4000
5000
6000
7000
$40/bbl $80/bbl0%
10%
20%
30%
40%
50%
60%NPV Reserves IRR
NPV IRR
Source: Wood Mackenzie; Deutsche Bank Source: Wood Mackenzie; Deutsche Bank
Consider value not reported barrels Ultimately, the increase in project value for the contractor (and thus shareholder) should be seen as the key determinant of corporate value and, as the previous example illustrated, value for the contractor has increased at the higher oil price. However, in a stock market where reported production is seen as representative of a company’s growth potential and reserves an indicator of business sustainability, the apparent deterioration in both these metrics is not particularly helpful. For even though overall value may have increased, investor perception is that production is declining and reserves faltering – neither of which is likely to be perceived as a positive.
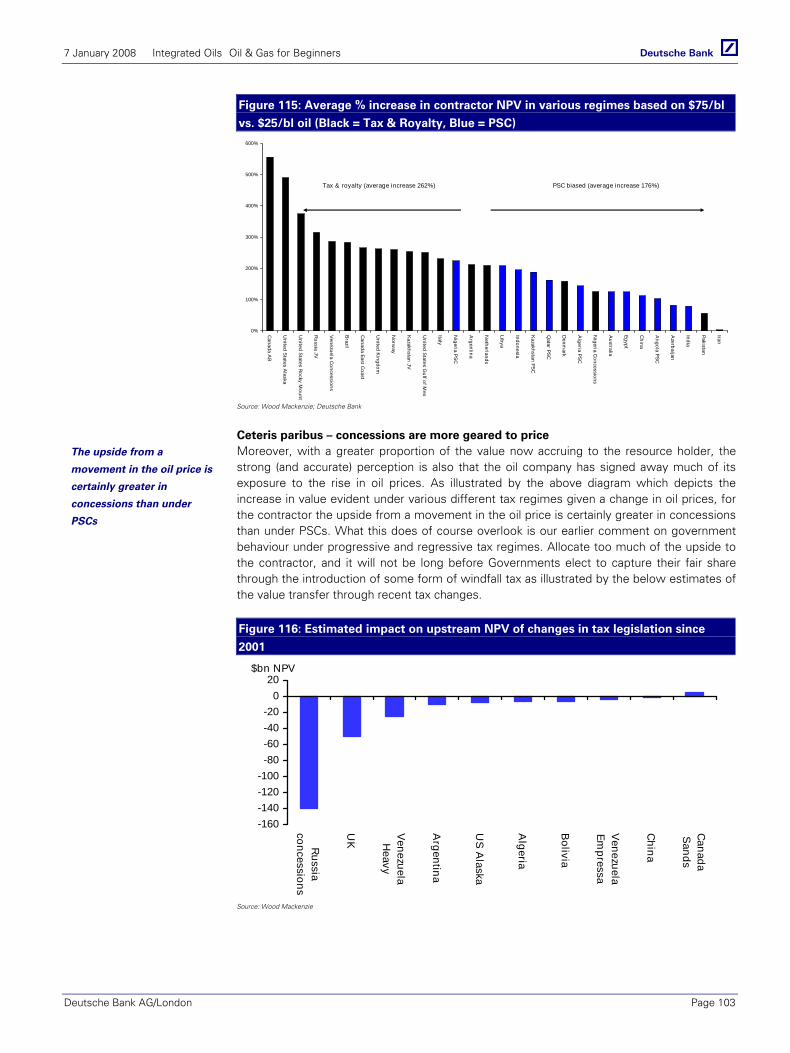
7 January 2008 Integrated Oils Oil & Gas for Beginners
Deutsche Bank AG/London Page 103
Figure 115: Average % increase in contractor NPV in various regimes based on $75/bl
vs. $25/bl oil (Black = Tax & Royalty, Blue = PSC)
0%
100%
200%
300%
400%
500%
600%
Canada A
B
United S
tates Alaska
United S
tates Rocky M
ount
Russia JV
Venezuela C
oncessions
Brazil
Canada East C
oast
United K
ingdom
Norw
ay
Kazakhstan JV
United S
tates Gulf of M
ex
Italy
Nigeria PS
C
Argentina
Netherlands
Libya
Indonesia
Kazakhstan PS
C
Qatar PS
C
Denm
ark
Algeria PS
C
Nigeria C
oncessions
Australia
Egypt
China
Angola PS
C
Azerbaijan
India
Pakistan
Iran
PSC biased (average increase 176%)Tax & royalty (average increase 262%)
Source: Wood Mackenzie; Deutsche Bank
Ceteris paribus – concessions are more geared to price Moreover, with a greater proportion of the value now accruing to the resource holder, the strong (and accurate) perception is also that the oil company has signed away much of its exposure to the rise in oil prices. As illustrated by the above diagram which depicts the increase in value evident under various different tax regimes given a change in oil prices, for the contractor the upside from a movement in the oil price is certainly greater in concessions than under PSCs. What this does of course overlook is our earlier comment on government behaviour under progressive and regressive tax regimes. Allocate too much of the upside to the contractor, and it will not be long before Governments elect to capture their fair share through the introduction of some form of windfall tax as illustrated by the below estimates of the value transfer through recent tax changes.
Figure 116: Estimated impact on upstream NPV of changes in tax legislation since
2001
-160-140-120-100-80-60-40-20
020
Russia
concessions
UK
VenezuelaH
eavy
Argentina
US
Alaska
Algeria
Bolivia
Venezuela
Empressa
China
Canada
Sands
$bn NPV
Source: Wood Mackenzie
The upside from a
movement in the oil price is
certainly greater in
concessions than under
PSCs
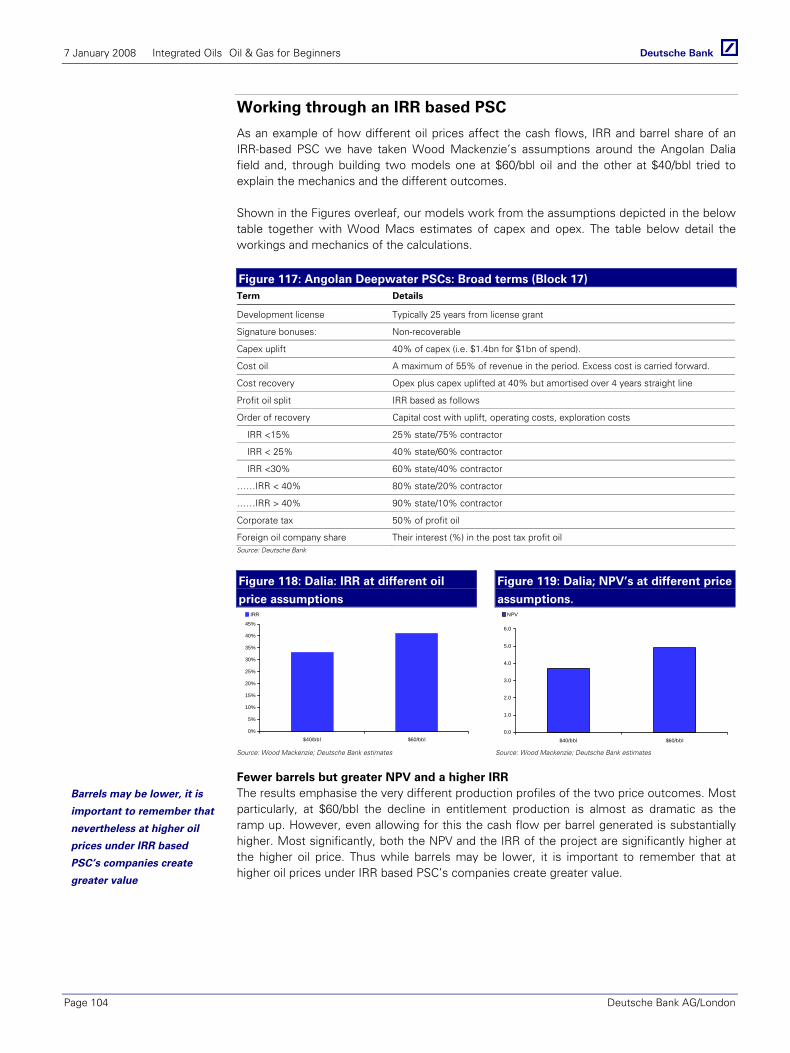
7 January 2008 Integrated Oils Oil & Gas for Beginners
Page 104 Deutsche Bank AG/London
Working through an IRR based PSC
As an example of how different oil prices affect the cash flows, IRR and barrel share of an IRR-based PSC we have taken Wood Mackenzie’s assumptions around the Angolan Dalia field and, through building two models one at $60/bbl oil and the other at $40/bbl tried to explain the mechanics and the different outcomes.
Shown in the Figures overleaf, our models work from the assumptions depicted in the below table together with Wood Macs estimates of capex and opex. The table below detail the workings and mechanics of the calculations.
Figure 117: Angolan Deepwater PSCs: Broad terms (Block 17) Term Details
Development license Typically 25 years from license grant
Signature bonuses: Non-recoverable
Capex uplift 40% of capex (i.e. $1.4bn for $1bn of spend).
Cost oil A maximum of 55% of revenue in the period. Excess cost is carried forward.
Cost recovery Opex plus capex uplifted at 40% but amortised over 4 years straight line
Profit oil split IRR based as follows
Order of recovery Capital cost with uplift, operating costs, exploration costs
IRR <15% 25% state/75% contractor
IRR < 25% 40% state/60% contractor
IRR <30% 60% state/40% contractor
……IRR < 40% 80% state/20% contractor
……IRR > 40% 90% state/10% contractor
Corporate tax 50% of profit oil
Foreign oil company share Their interest (%) in the post tax profit oil Source: Deutsche Bank
Figure 118: Dalia: IRR at different oil
price assumptions
Figure 119: Dalia; NPV’s at different price
assumptions.
0%
5%
10%
15%
20%
25%
30%
35%
40%
45%
$40/bbl $60/bbl
IRR
0.0
1.0
2.0
3.0
4.0
5.0
6.0
$40/bbl $60/bbl
NPV
Source: Wood Mackenzie; Deutsche Bank estimates Source: Wood Mackenzie; Deutsche Bank estimates
Fewer barrels but greater NPV and a higher IRR The results emphasise the very different production profiles of the two price outcomes. Most particularly, at $60/bbl the decline in entitlement production is almost as dramatic as the ramp up. However, even allowing for this the cash flow per barrel generated is substantially higher. Most significantly, both the NPV and the IRR of the project are significantly higher at the higher oil price. Thus while barrels may be lower, it is important to remember that at higher oil prices under IRR based PSC’s companies create greater value.
Barrels may be lower, it is
important to remember that
nevertheless at higher oil
prices under IRR based
PSC’s companies create
greater value
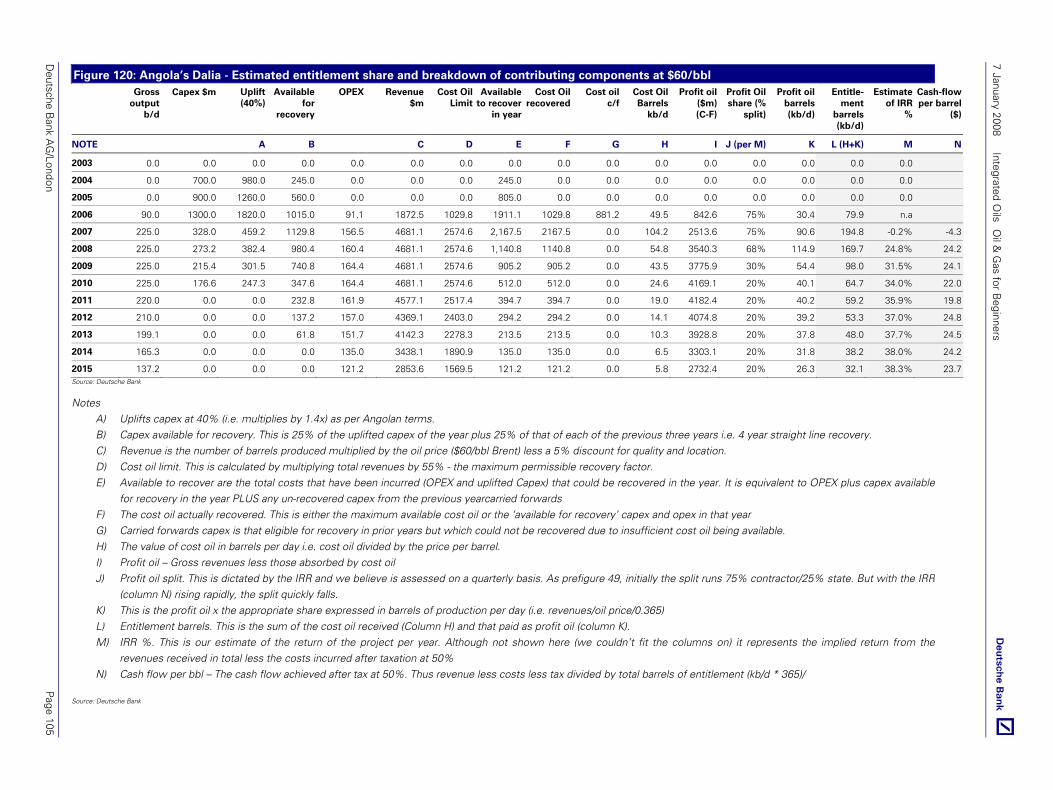
Deutsche B
ank AG
/London P
age 105
7 January 2008 Integrated O
ils O
il & G
as for Beginners
Figure 120: Angola’s Dalia - Estimated entitlement share and breakdown of contributing components at $60/bbl Gross
output b/d
Capex $m Uplift (40%)
Available for
recovery
OPEX Revenue$m
Cost Oil Limit
Available to recover
in year
Cost Oil recovered
Cost oil c/f
Cost Oil Barrels
kb/d
Profit oil ($m) (C-F)
Profit Oil share (%
split)
Profit oil barrels (kb/d)
Entitle-ment
barrels (kb/d)
Estimate of IRR
%
Cash-flow per barrel
($)
NOTE A B C D E F G H I J (per M) K L (H+K) M N
2003 0.0 0.0 0.0 0.0 0.0 0.0 0.0 0.0 0.0 0.0 0.0 0.0 0.0 0.0 0.0 0.0
2004 0.0 700.0 980.0 245.0 0.0 0.0 0.0 245.0 0.0 0.0 0.0 0.0 0.0 0.0 0.0 0.0
2005 0.0 900.0 1260.0 560.0 0.0 0.0 0.0 805.0 0.0 0.0 0.0 0.0 0.0 0.0 0.0 0.0
2006 90.0 1300.0 1820.0 1015.0 91.1 1872.5 1029.8 1911.1 1029.8 881.2 49.5 842.6 75% 30.4 79.9 n.a
2007 225.0 328.0 459.2 1129.8 156.5 4681.1 2574.6 2,167.5 2167.5 0.0 104.2 2513.6 75% 90.6 194.8 -0.2% -4.3
2008 225.0 273.2 382.4 980.4 160.4 4681.1 2574.6 1,140.8 1140.8 0.0 54.8 3540.3 68% 114.9 169.7 24.8% 24.2
2009 225.0 215.4 301.5 740.8 164.4 4681.1 2574.6 905.2 905.2 0.0 43.5 3775.9 30% 54.4 98.0 31.5% 24.1
2010 225.0 176.6 247.3 347.6 164.4 4681.1 2574.6 512.0 512.0 0.0 24.6 4169.1 20% 40.1 64.7 34.0% 22.0
2011 220.0 0.0 0.0 232.8 161.9 4577.1 2517.4 394.7 394.7 0.0 19.0 4182.4 20% 40.2 59.2 35.9% 19.8
2012 210.0 0.0 0.0 137.2 157.0 4369.1 2403.0 294.2 294.2 0.0 14.1 4074.8 20% 39.2 53.3 37.0% 24.8
2013 199.1 0.0 0.0 61.8 151.7 4142.3 2278.3 213.5 213.5 0.0 10.3 3928.8 20% 37.8 48.0 37.7% 24.5
2014 165.3 0.0 0.0 0.0 135.0 3438.1 1890.9 135.0 135.0 0.0 6.5 3303.1 20% 31.8 38.2 38.0% 24.2
2015 137.2 0.0 0.0 0.0 121.2 2853.6 1569.5 121.2 121.2 0.0 5.8 2732.4 20% 26.3 32.1 38.3% 23.7 Source: Deutsche Bank
Notes A) Uplifts capex at 40% (i.e. multiplies by 1.4x) as per Angolan terms. B) Capex available for recovery. This is 25% of the uplifted capex of the year plus 25% of that of each of the previous three years i.e. 4 year straight line recovery. C) Revenue is the number of barrels produced multiplied by the oil price ($60/bbl Brent) less a 5% discount for quality and location. D) Cost oil limit. This is calculated by multiplying total revenues by 55% - the maximum permissible recovery factor. E) Available to recover are the total costs that have been incurred (OPEX and uplifted Capex) that could be recovered in the year. It is equivalent to OPEX plus capex available
for recovery in the year PLUS any un-recovered capex from the previous yearcarried forwards F) The cost oil actually recovered. This is either the maximum available cost oil or the ‘available for recovery’ capex and opex in that year G) Carried forwards capex is that eligible for recovery in prior years but which could not be recovered due to insufficient cost oil being available. H) The value of cost oil in barrels per day i.e. cost oil divided by the price per barrel. I) Profit oil – Gross revenues less those absorbed by cost oil J) Profit oil split. This is dictated by the IRR and we believe is assessed on a quarterly basis. As prefigure 49, initially the split runs 75% contractor/25% state. But with the IRR
(column N) rising rapidly, the split quickly falls. K) This is the profit oil x the appropriate share expressed in barrels of production per day (i.e. revenues/oil price/0.365) L) Entitlement barrels. This is the sum of the cost oil received (Column H) and that paid as profit oil (column K). M) IRR %. This is our estimate of the return of the project per year. Although not shown here (we couldn’t fit the columns on) it represents the implied return from the
revenues received in total less the costs incurred after taxation at 50% N) Cash flow per bbl – The cash flow achieved after tax at 50%. Thus revenue less costs less tax divided by total barrels of entitlement (kb/d * 365)/
Source: Deutsche Bank
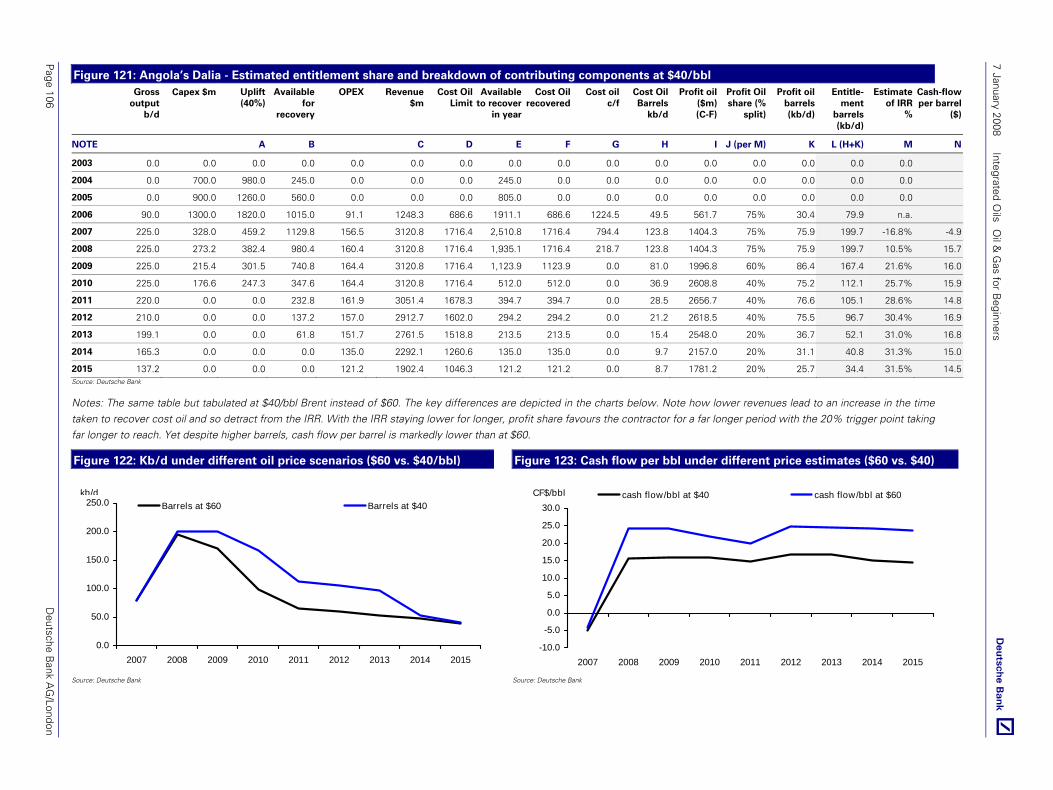
7 January 2008 Integrated O
ils O
il & G
as for Beginners
Page 106
Deutsche B
ank AG
/London
Figure 121: Angola’s Dalia - Estimated entitlement share and breakdown of contributing components at $40/bbl Gross
output b/d
Capex $m Uplift (40%)
Available for
recovery
OPEX Revenue$m
Cost Oil Limit
Available to recover
in year
Cost Oil recovered
Cost oil c/f
Cost Oil Barrels
kb/d
Profit oil ($m) (C-F)
Profit Oil share (%
split)
Profit oil barrels (kb/d)
Entitle-ment
barrels (kb/d)
Estimate of IRR
%
Cash-flow per barrel
($)
NOTE A B C D E F G H I J (per M) K L (H+K) M N
2003 0.0 0.0 0.0 0.0 0.0 0.0 0.0 0.0 0.0 0.0 0.0 0.0 0.0 0.0 0.0 0.0
2004 0.0 700.0 980.0 245.0 0.0 0.0 0.0 245.0 0.0 0.0 0.0 0.0 0.0 0.0 0.0 0.0
2005 0.0 900.0 1260.0 560.0 0.0 0.0 0.0 805.0 0.0 0.0 0.0 0.0 0.0 0.0 0.0 0.0
2006 90.0 1300.0 1820.0 1015.0 91.1 1248.3 686.6 1911.1 686.6 1224.5 49.5 561.7 75% 30.4 79.9 n.a.
2007 225.0 328.0 459.2 1129.8 156.5 3120.8 1716.4 2,510.8 1716.4 794.4 123.8 1404.3 75% 75.9 199.7 -16.8% -4.9
2008 225.0 273.2 382.4 980.4 160.4 3120.8 1716.4 1,935.1 1716.4 218.7 123.8 1404.3 75% 75.9 199.7 10.5% 15.7
2009 225.0 215.4 301.5 740.8 164.4 3120.8 1716.4 1,123.9 1123.9 0.0 81.0 1996.8 60% 86.4 167.4 21.6% 16.0
2010 225.0 176.6 247.3 347.6 164.4 3120.8 1716.4 512.0 512.0 0.0 36.9 2608.8 40% 75.2 112.1 25.7% 15.9
2011 220.0 0.0 0.0 232.8 161.9 3051.4 1678.3 394.7 394.7 0.0 28.5 2656.7 40% 76.6 105.1 28.6% 14.8
2012 210.0 0.0 0.0 137.2 157.0 2912.7 1602.0 294.2 294.2 0.0 21.2 2618.5 40% 75.5 96.7 30.4% 16.9
2013 199.1 0.0 0.0 61.8 151.7 2761.5 1518.8 213.5 213.5 0.0 15.4 2548.0 20% 36.7 52.1 31.0% 16.8
2014 165.3 0.0 0.0 0.0 135.0 2292.1 1260.6 135.0 135.0 0.0 9.7 2157.0 20% 31.1 40.8 31.3% 15.0
2015 137.2 0.0 0.0 0.0 121.2 1902.4 1046.3 121.2 121.2 0.0 8.7 1781.2 20% 25.7 34.4 31.5% 14.5 Source: Deutsche Bank
Notes: The same table but tabulated at $40/bbl Brent instead of $60. The key differences are depicted in the charts below. Note how lower revenues lead to an increase in the timetaken to recover cost oil and so detract from the IRR. With the IRR staying lower for longer, profit share favours the contractor for a far longer period with the 20% trigger point takingfar longer to reach. Yet despite higher barrels, cash flow per barrel is markedly lower than at $60.
Figure 122: Kb/d under different oil price scenarios ($60 vs. $40/bbl) Figure 123: Cash flow per bbl under different price estimates ($60 vs. $40)
0.0
50.0
100.0
150.0
200.0
250.0
2007 2008 2009 2010 2011 2012 2013 2014 2015
Barrels at $60 Barrels at $40kb/d
-10.0
-5.0
0.0
5.0
10.0
15.0
20.0
25.0
30.0
2007 2008 2009 2010 2011 2012 2013 2014 2015
cash flow/bbl at $40 cash flow/bbl at $60CF$/bbl
Source: Deutsche Bank Source: Deutsche Bank

7 January 2008 Integrated Oils Oil & Gas for Beginners
Deutsche Bank AG/London Page 107
Buy Backs
In almost every major oil producing territory, hydrocarbon taxation takes the form of either a concession or production sharing contract. There is, however, one major exception; Iran.
Due to constitutional restrictions and Iran’s suspicions of foreign investors in the oil and gas sector, the concept of ‘buy backs’ or service contracts was introduced as a controlled and workable vehicle for foreign investment. Buy backs are essentially service contracts in which the Iranian National Oil Company, NIOC, subcontracts certain aspects of its responsibilities to a foreign party. No other form of direct investment in the oil gas industry is allowed by foreign persons or companies under current regulations.
The commercial rewards in buy back contracts have changed gradually since the first contract was signed with TOTAL in 1995. The level of return afforded to contractors has reduced from an average of 21% to around 15%. Such tightening of returns to the foreign parties reflect the level of competition for quality assets in the sector and the level of return which participants have been prepared to accept in the contracts signed to date.
Figure 124: Schematic depicting an Iranian buy-back contract
Revenue
Net Cash Flow
Opex
Capex
Govt. Priority
Prod. @40%
Remuneration
Govt. Profit Share
(less)
(less)
(equals)
(less)
(less)
$100
$40
$40
$5
$40
$5$15
Cost Recovery Ceiling @65%*
(less)
Note: *Cost Recovery Ceiling assumes percentage of Total Revenue
Source: Wood Mackenzie; Deutsche Bank
Under a buy back contract the foreign investor will not own any part of the Iranian oil or gas field. The contractor is the designated operator for design, construction, commissioning and start up of all facilities and this responsibility passes to NIOC immediately after start up. The foreign partner provides all the capital for the project and is compensated for its costs and awarded an agreed level of profit. The details of the development programme are contained in the field Master Development Plan, which clearly states the work to be performed and the agreed capital cost for such work.
Cost Recovery Illustrated by the schematic above, under the contract the contractor is compensated for all capital and operating costs and bank charges incurred in fulfilling the specifications of the Master Development Plan. Costs due for recovery are amortised over an agreed number of years (generally five to ten years) from the date of first production. Any costs, which cannot be recovered in any given period, are carried forward and recovered with interest in subsequent periods. If the actual field costs are greater than anticipated then the extra cost is borne solely by the contractor and the additional costs are not eligible for cost recovery.
Buy backs are essentially
service contracts in which
the Iranian National Oil
Company, NIOC,
subcontracts certain aspects
of its responsibilities to a
foreign party.

7 January 2008 Integrated Oils Oil & Gas for Beginners
Page 108 Deutsche Bank AG/London
The result is a contract in which the contractor essentially takes significant risk for the return of what has over time become an ever more modest level of reward. Upside is often negligible with several companies in recent years suffering significant write-downs as a consequence of industry inflation increasing costs to the point of non-recovery (Statoil in particular comes to mind). Looking forward, with considerable uncertainty now presiding around future investment in Iran and many of the contracts currently in place coming towards an end, we think Iranian buy backs are likely to become an even less significant feature of company portfolios for some years to come.
7 January 2008 Integrated Oils Oil & Gas for Beginners
Deutsche Bank AG/London Page 109
Oil & Gas Taxation – Some Key Terms
Production Sharing Contract (PSC): A contract between a resource holder and (generally) an oil company where the oil produced is shared between the resource holder and contractor (oil company) in a pre-arranged manner.
Tax & Royalty regime (concession): A regime under which an oil company is granted a concession to prospect for and extract hydrocarbons. From the revenues generated the concession holder will typically pay a pre-agreed royalty on revenues together with corporation tax on profits.
Cost Oil. Share of barrels produced that is used to pay back the contractor for its capital investment in the project and/or the operating expenses incurred in the year. Typically the resource holder will allow cost oil to be recovered from c.50-60% of project revenues. Once the upfront capital costs have been recovered (generally high in the first years of a project coming on-stream), anything left over is termed profit oil. Capital or operating costs that remain un-recovered in any one year are typically carried forwards for recovery in subsequent years.
Profit Oil: The oil available for distribution to the partners in the project in line with their equity (or working interest) share. Profit oil is invariably that available after costs (capital and annual operating) have been recovered.
Capex uplift. The % increase granted by the state on capex spend for recovery against costs. For example, in Angola’s Block 17 capex is uplifted for recovery against revenues at a rate of 50% i.e. on capital spend of $1.0bn, the contractor will be able to recover $1.5bn against cost oil. The allocation of uplift pays heed to the time that it might take to recover capex invested in a project given restrictions on cost recovery (as a % of revenues) and the time taken from breaking ground to first oil in a development project.
Trigger points (our terminology). The conditions laid out in the PSC contract, the attainment of which lead to changes in the allocation of profit oil share between the state and the contractor.
Working interest: The contractor’s percentage interest in the project as a whole. Thus if a company has a 40% interest in a project producing 100kb/d its working interest in that project would be 40kb/d.
Entitlement share: The number of barrels of profit oil which the contractor is entitled to from the project in any one year. This will typically represent the contractor’s share of cost oil and its equity entitlement to profit oil. Depending on the nature of the PSC terms, the entitlement share will alter over the life of the project as costs are recovered and the oil available for distribution as profit alters following the attainment of trigger points. As an illustration, if a company has a 40% equity interest in a project producing 100kb/d, the profits from which are distributed 50% government and 50% contractor after 10kb/d has been allocated for cost recovery, its share of entitlement barrels would be 22kb/d (i.e. 40% of the 10kb/d of cost oil and 40% of the 45kb/d available to the contractors as profit oil). Note this compares with the 40kb/d in which the contractor has a ‘working interest’.
IRR based PSC. A PSC whose trigger points are determined by the internal rate of return achieved from the date of onset. As the returns from a project move beyond pre-defined levels, so the share of profit oil will alter in favour of the host nation. Common examples include those in Angola, Azerbaijan, Kazakhstan and Russia amongst others.
Production based PSC. A PSC whose trigger points are determined by the achievement of particular levels of production. In some production contracts the production element refers to the cumulative number of barrels produced. In others, the level of daily production achieved. In either case, as the trigger levels are attained, the share of profit oil between the state and the contractor alters. Common examples include those in the Nigerian Deepwater, Qatar, Malaysia, India and many others.
R-factor (and R-factor based PSC). A PSC whose trigger points are determined by the ratio of total revenues to total costs. Typically the contract will stipulate that as revenues meet certain multiples of costs so the share of profit oil between the state and the contractor alters. Common examples include Algeria, Qatar (often mixed with production) and the Yemen.
Fixed share PSC. A PSC which stipulates at the onset the division or post tax or pre-tax profits from the project between the state and the contractor. In effect, these contracts have economics that are similar to those of a tax and royalty regime. Indonesia represents a good example of a fixed share PSC.

7 January 2008 Integrated Oils Oil & Gas for Beginners
Page 110 Deutsche Bank AG/London
World Oil Markets For many years, oil has been the world’s most important source of energy, meeting almost 36% of global energy needs in 2006 (natural gas 24% and coal 28% are its nearest rivals). The oil trade is the world’ largest, whether measured by value, volumes or miles. Indeed, we estimate the physical crude oil market alone to be worth some USD1,600 billion per year based on a 5 year WTI average historical price of USD52.60/bbl and 2006 global demand of 83.7mb/d.
Figure 125: World Energy Consumption by fuel in 2006 (ex. alternatives)
Oil36%
N atural Gas24%
N uclear Energy6%
Hydro elect ric6%
Coal28%
Source: BP Statistical review 2006
The main international exchanges for the trading of oil and oil products are the New York Mercantile Exchange (Nymex) and the Intercontinental Exchange (ICE, formerly the International Petroleum Exchange in London). Both exchanges trade spot or physical contracts for immediate delivery and futures for delivery at a later date, providing hedging, speculating and price discovery opportunities. Given the large number of crudes and the difficulty in following them all, two benchmark crudes are widely used; West Texas Intermediate (WTI) on Nymex and Brent crude on ICE. While these are used as indicative oil prices, most other crudes will trade at a discount or premium depending on their gravity and sulphur content (refer to section on crude for detail on gravity and API and refining for detail on the ‘heavy-light spread’).
The oil price
The nominal price of oil has fluctuated significantly throughout the years, from lows of USD2.5/bbl seen in the 1940-70’s to recent highs of almost USD100/bbl. There are many factors which affect the oil price; the most important being the fundamentals of supply and demand but also the strength of the US dollar given that all oil is traded in US dollars. However increasingly, we are seeing the oil price affected by geopolitics (recent highs in the USD90/bbl range were due in part to tensions between Iraq and Turkey and to Iran’s nuclear programme) and the fact that commodities are increasingly viewed as an asset class by investors which has led to increasing levels of speculation by financial market participants and, consequently, a more volatile oil price.
Oil continues to be the
world’s most important
source of energy

7 January 2008 Integrated Oils Oil & Gas for Beginners
Deutsche Bank AG/London Page 111
Figure 126: Brent oil price 1987 - 2007
0
10
20
30
40
50
60
70
80
90
100
1987
1988
1989
1990
1991
1992
1993
1994
1995
1996
1997
1998
1999
2000
2001
2002
2003
2004
2005
2006
2007
$/bbl
First Gu lf CrisisWarm w in ter and Asian crisis
Opec cu ts ou tpu t and record low
Geopo lit ical tensions & Ch inese grow th
War on Iraq
Source: DataStream, Deutsche Bank
Other factors which impact the oil price include oil product markets and OPEC spare capacity. At a first glance, one would assume that the price of crude drives the price of crude products. However, the reverse is often the case. At times of tight refining capacity, product prices increase which can lead to an increase in the price of crude. Likewise when significant spare refining capacity is evident, or when inventories of oil products are high, this can lead to a decline in the price of crude. OPEC spare capacity, being the volume by which OPEC nations can theoretically increase production if required, has increasingly impacted oil prices as the world has become more reliant on OPEC oil. If OPEC capacity decreases this will invariably put pressure on supply (or fuel fears that supply will tighten) and hence the oil price will increase (see section on OPEC).
Oil Demand
From the early days of boom and bust, demand for oil has experienced sustained growth worldwide over the past 15 years. In 2006, the level of world demand stood at 83.7mb/d. It is forecast to expand by 2.2% per year on average between 2007 and 2012 based on average annual global economic growth of 4.5%. This growth is not surprising given the US and China, two economic giants, are the largest consumers of oil in the world. The US remains by far the largest, accounting for some 25% of total world demand in 2006 with consumption of 20.6mb/d far outstripping the 7.4mb/d demanded by China in the same year.
Figure 127: World oil demand, 1996-2006 (mb/d)
Figure 128: Regional breakdown of world oil demand
2006 (%)
71.5
73.6 73.975.5
76.3 76.877.7
79.2
81.983.1 83.7
64
66
68
70
72
74
76
78
80
82
84
86
1996 1997 1998 1999 2000 2001 2002 2003 2004 2005 2006
Europe & Eurasia
24%
S. & C Am erica6%
N America31%
M idd le East7%
Africa3%
Asia Pacif ic29%
Source: BP Statistical Review Source: BP Statistical Review
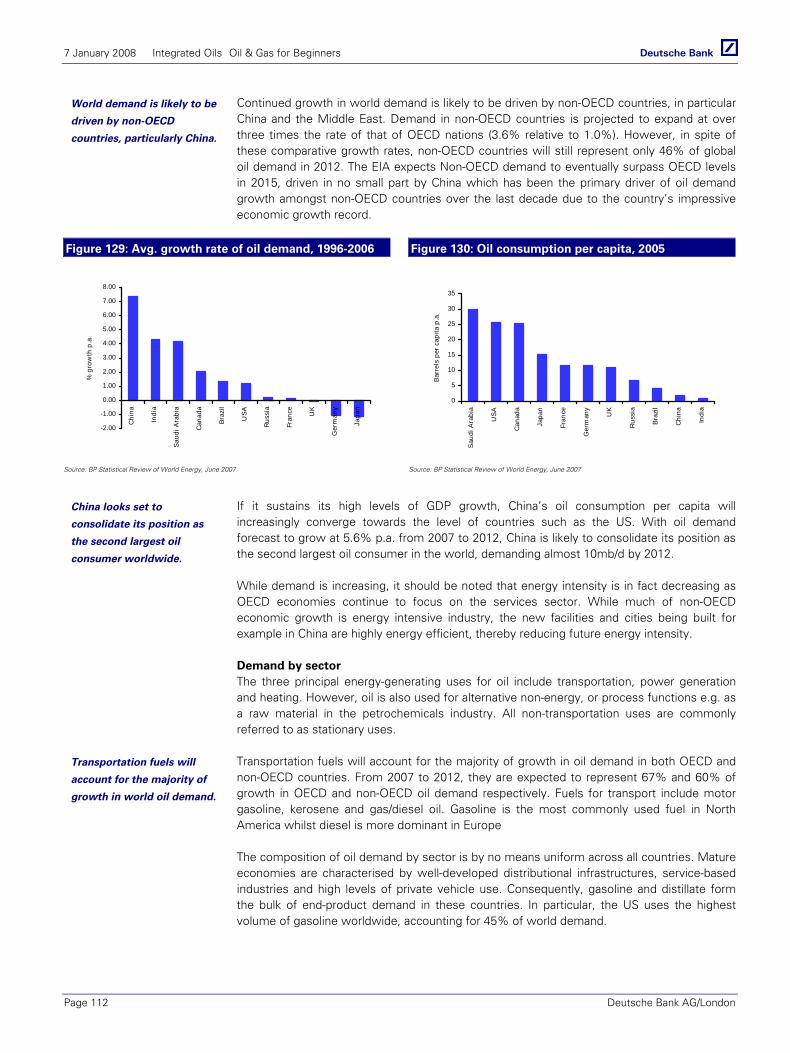
7 January 2008 Integrated Oils Oil & Gas for Beginners
Page 112 Deutsche Bank AG/London
Continued growth in world demand is likely to be driven by non-OECD countries, in particular China and the Middle East. Demand in non-OECD countries is projected to expand at over three times the rate of that of OECD nations (3.6% relative to 1.0%). However, in spite of these comparative growth rates, non-OECD countries will still represent only 46% of global oil demand in 2012. The EIA expects Non-OECD demand to eventually surpass OECD levels in 2015, driven in no small part by China which has been the primary driver of oil demand growth amongst non-OECD countries over the last decade due to the country’s impressive economic growth record.
Figure 129: Avg. growth rate of oil demand, 1996-2006 Figure 130: Oil consumption per capita, 2005
-2.00
-1.00
0.00
1.00
2.00
3.00
4.00
5.00
6.00
7.00
8.00
Chi
na
Indi
a
Sau
di A
rabi
a
Can
ada
Bra
zil
US
A
Rus
sia
Fran
ce UK
Ger
man
y
Japa
n
% g
row
th p
.a.
0
5
10
15
20
25
30
35
Sau
di A
rabi
a
US
A
Can
ada
Japa
n
Fran
ce
Ger
man
y
UK
Rus
sia
Bra
zil
Chi
na
Indi
a
Bar
rels
per
cap
ita p
.a.
Source: BP Statistical Review of World Energy, June 2007 Source: BP Statistical Review of World Energy, June 2007
If it sustains its high levels of GDP growth, China’s oil consumption per capita will increasingly converge towards the level of countries such as the US. With oil demand forecast to grow at 5.6% p.a. from 2007 to 2012, China is likely to consolidate its position as the second largest oil consumer in the world, demanding almost 10mb/d by 2012.
While demand is increasing, it should be noted that energy intensity is in fact decreasing as OECD economies continue to focus on the services sector. While much of non-OECD economic growth is energy intensive industry, the new facilities and cities being built for example in China are highly energy efficient, thereby reducing future energy intensity.
Demand by sector The three principal energy-generating uses for oil include transportation, power generation and heating. However, oil is also used for alternative non-energy, or process functions e.g. as a raw material in the petrochemicals industry. All non-transportation uses are commonly referred to as stationary uses.
Transportation fuels will account for the majority of growth in oil demand in both OECD and non-OECD countries. From 2007 to 2012, they are expected to represent 67% and 60% of growth in OECD and non-OECD oil demand respectively. Fuels for transport include motor gasoline, kerosene and gas/diesel oil. Gasoline is the most commonly used fuel in North America whilst diesel is more dominant in Europe
The composition of oil demand by sector is by no means uniform across all countries. Mature economies are characterised by well-developed distributional infrastructures, service-based industries and high levels of private vehicle use. Consequently, gasoline and distillate form the bulk of end-product demand in these countries. In particular, the US uses the highest volume of gasoline worldwide, accounting for 45% of world demand.
World demand is likely to be
driven by non-OECD
countries, particularly China.
China looks set to
consolidate its position as
the second largest oil
consumer worldwide.
Transportation fuels will
account for the majority of
growth in world oil demand.
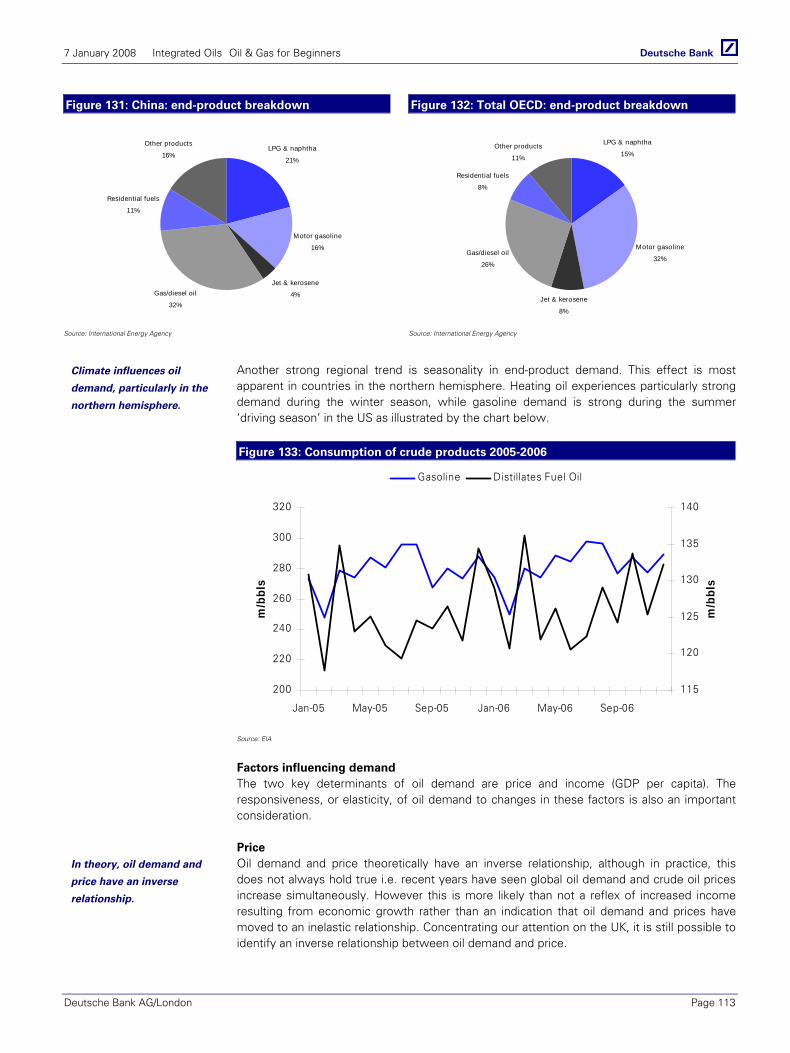
7 January 2008 Integrated Oils Oil & Gas for Beginners
Deutsche Bank AG/London Page 113
Figure 131: China: end-product breakdown Figure 132: Total OECD: end-product breakdown
LPG & naphtha
21%
Motor gasoline
16%
Jet & kerosene
4%Gas/diesel oil
32%
Residential fuels
11%
Other products
16%
LPG & naphtha
15%
Motor gasoline
32%
Jet & kerosene
8%
Gas/diesel oil
26%
Residential fuels
8%
Other products
11%
Source: International Energy Agency Source: International Energy Agency
Another strong regional trend is seasonality in end-product demand. This effect is most apparent in countries in the northern hemisphere. Heating oil experiences particularly strong demand during the winter season, while gasoline demand is strong during the summer ‘driving season’ in the US as illustrated by the chart below.
Figure 133: Consumption of crude products 2005-2006
200
220
240
260
280
300
320
Jan-05 May-05 Sep-05 Jan-06 May-06 Sep-06
m/b
bls
115
120
125
130
135
140
m/b
bls
Gasoline Distillates Fuel Oil
Source: EIA
Factors influencing demand The two key determinants of oil demand are price and income (GDP per capita). The responsiveness, or elasticity, of oil demand to changes in these factors is also an important consideration.
Price Oil demand and price theoretically have an inverse relationship, although in practice, this does not always hold true i.e. recent years have seen global oil demand and crude oil prices increase simultaneously. However this is more likely than not a reflex of increased income resulting from economic growth rather than an indication that oil demand and prices have moved to an inelastic relationship. Concentrating our attention on the UK, it is still possible to identify an inverse relationship between oil demand and price.
Climate influences oil
demand, particularly in the
northern hemisphere.
In theory, oil demand and
price have an inverse
relationship.
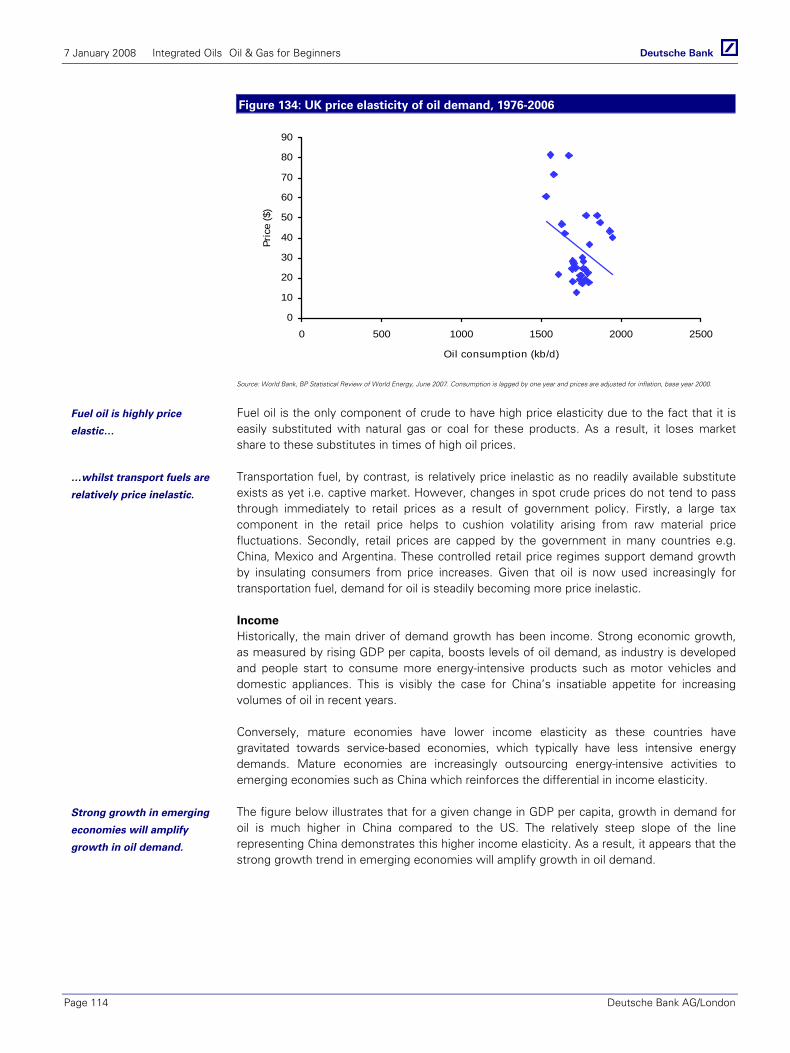
7 January 2008 Integrated Oils Oil & Gas for Beginners
Page 114 Deutsche Bank AG/London
Figure 134: UK price elasticity of oil demand, 1976-2006
0
10
20
30
40
50
60
70
80
90
0 500 1000 1500 2000 2500
Oil consumption (kb/d)
Pric
e ($
)
Source: World Bank, BP Statistical Review of World Energy, June 2007. Consumption is lagged by one year and prices are adjusted for inflation, base year 2000.
Fuel oil is the only component of crude to have high price elasticity due to the fact that it is easily substituted with natural gas or coal for these products. As a result, it loses market share to these substitutes in times of high oil prices.
Transportation fuel, by contrast, is relatively price inelastic as no readily available substitute exists as yet i.e. captive market. However, changes in spot crude prices do not tend to pass through immediately to retail prices as a result of government policy. Firstly, a large tax component in the retail price helps to cushion volatility arising from raw material price fluctuations. Secondly, retail prices are capped by the government in many countries e.g. China, Mexico and Argentina. These controlled retail price regimes support demand growth by insulating consumers from price increases. Given that oil is now used increasingly for transportation fuel, demand for oil is steadily becoming more price inelastic.
Income Historically, the main driver of demand growth has been income. Strong economic growth, as measured by rising GDP per capita, boosts levels of oil demand, as industry is developed and people start to consume more energy-intensive products such as motor vehicles and domestic appliances. This is visibly the case for China’s insatiable appetite for increasing volumes of oil in recent years.
Conversely, mature economies have lower income elasticity as these countries have gravitated towards service-based economies, which typically have less intensive energy demands. Mature economies are increasingly outsourcing energy-intensive activities to emerging economies such as China which reinforces the differential in income elasticity.
The figure below illustrates that for a given change in GDP per capita, growth in demand for oil is much higher in China compared to the US. The relatively steep slope of the line representing China demonstrates this higher income elasticity. As a result, it appears that the strong growth trend in emerging economies will amplify growth in oil demand.
Fuel oil is highly price
elastic…
…whilst transport fuels are
relatively price inelastic.
Strong growth in emerging
economies will amplify
growth in oil demand.
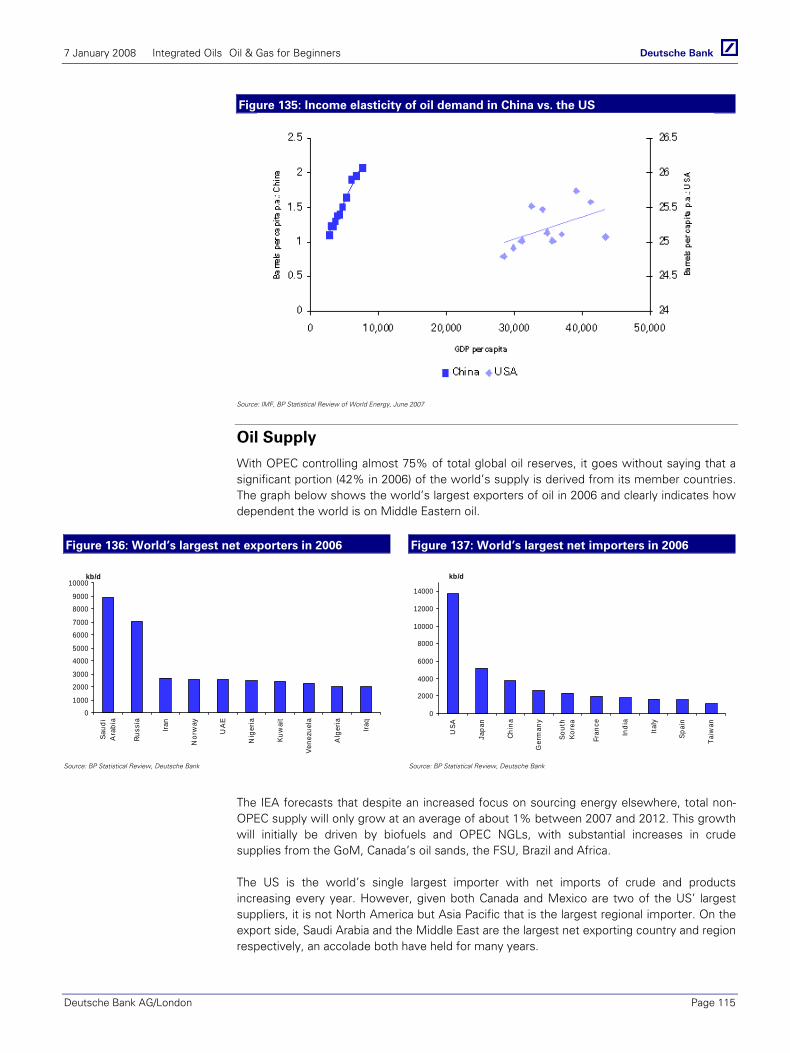
7 January 2008 Integrated Oils Oil & Gas for Beginners
Deutsche Bank AG/London Page 115
Figure 135: Income elasticity of oil demand in China vs. the US
Source: IMF, BP Statistical Review of World Energy, June 2007
Oil Supply
With OPEC controlling almost 75% of total global oil reserves, it goes without saying that a significant portion (42% in 2006) of the world’s supply is derived from its member countries. The graph below shows the world’s largest exporters of oil in 2006 and clearly indicates how dependent the world is on Middle Eastern oil.
Figure 136: World’s largest net exporters in 2006 Figure 137: World’s largest net importers in 2006
0
1000
2000
3000
4000
5000
6000
7000
8000
9000
10000
Saud
iA
rabi
a
Russ
ia
Iran
Nor
way
UA
E
Nig
eria
Kuw
ait
Vene
zuel
a
Alg
eria
Iraq
kb/d
0
2000
4000
6000
8000
10000
12000
14000
USA
Japa
n
Chin
a
Ger
man
y
Sout
hKo
rea
Fran
ce
Indi
a
Italy
Spai
n
Taiw
an
kb/d
Source: BP Statistical Review, Deutsche Bank Source: BP Statistical Review, Deutsche Bank
The IEA forecasts that despite an increased focus on sourcing energy elsewhere, total non-OPEC supply will only grow at an average of about 1% between 2007 and 2012. This growth will initially be driven by biofuels and OPEC NGLs, with substantial increases in crude supplies from the GoM, Canada’s oil sands, the FSU, Brazil and Africa.
The US is the world’s single largest importer with net imports of crude and products increasing every year. However, given both Canada and Mexico are two of the US’ largest suppliers, it is not North America but Asia Pacific that is the largest regional importer. On the export side, Saudi Arabia and the Middle East are the largest net exporting country and region respectively, an accolade both have held for many years.

7 January 2008 Integrated Oils Oil & Gas for Beginners
Page 116 Deutsche Bank AG/London
Inventories
The other key player in oil markets is the level of crude and product inventories as these go some way to smooth any fluctuations in supply and demand. As such any movements in inventories will also impact the market and the price of oil.
The US first started storing oil in 1975 when oil supplies were cut off during the 1973-4 oil embargo in an attempt to mitigate future oil disruptions. This prompted the creation of the Strategic Petroleum Reserve (SPR), an emergency petroleum store which is maintained by the US Department of Energy (DOE). It is the largest emergency supply in the world with current capacity to hold 727m/bbls of crude oil (theoretically 60 days of supply). Every week the Energy Information Administration (EIA, part of the DOE) publishes inventory levels for crude, crude products and refinery utilisation which the market eagerly awaits, as it is largest petroleum inventory in the world and is thus used as an indicator to estimate the current capacity/tightness in the market.
The forward curve
As levels of speculation on the oil price have increased, the importance of the futures curve has increased as an indicator of market sentiment on the state of the market. The shape of this curve reflects expectations of supply/demand over the next 12 months. An upward ‘contango’ curve indicates that the market expects higher prices in the future, implying that demand is expected to be higher relative to supply in the future, or that the current market is well supplied but is expected to be tighter in the future. A downward sloping ‘backwardation’ curve, where the front month commands a premium over the future month’s contracts, suggests current demand is outpacing current supply, with the expectation that the imbalance will become less pronounced in the future. Stripping out any expectations regarding supply and demand, a contango curve is considered ‘normal’ as the costs of carry will always be included, thereby increasing the price of future months. However, recent years have seen the oil futures curve more often than not in backwardation as short-term supply constraints continue to support prices.
Figure 138: Current futures market is in backwardation
85
86
87
88
89
Jan-
08
Feb-
08
Mar
-08
Apr
-08
May
-08
Jun-
08
Jul-0
8
Aug
-08
Sep
-08
Oct
-08
Nov
-08
Dec
-08
$/bbl
Brent WTI
Source: Reuters, Deutsche Bank
While the futures curve incorporates overall market sentiment in relation to the underlying, further insight is given by the weekly publication by the Commodities and Futures Trading Commission (CFTC) published at 15.30 (Eastern Time) every Friday, which shows the speculative long and short position as well as weekly open interest data. Open interest refers to the number of open futures or options contracts that are yet to be closed through either an offsetting transaction, delivery or exercise, with options positions counted in futures equivalent terms.
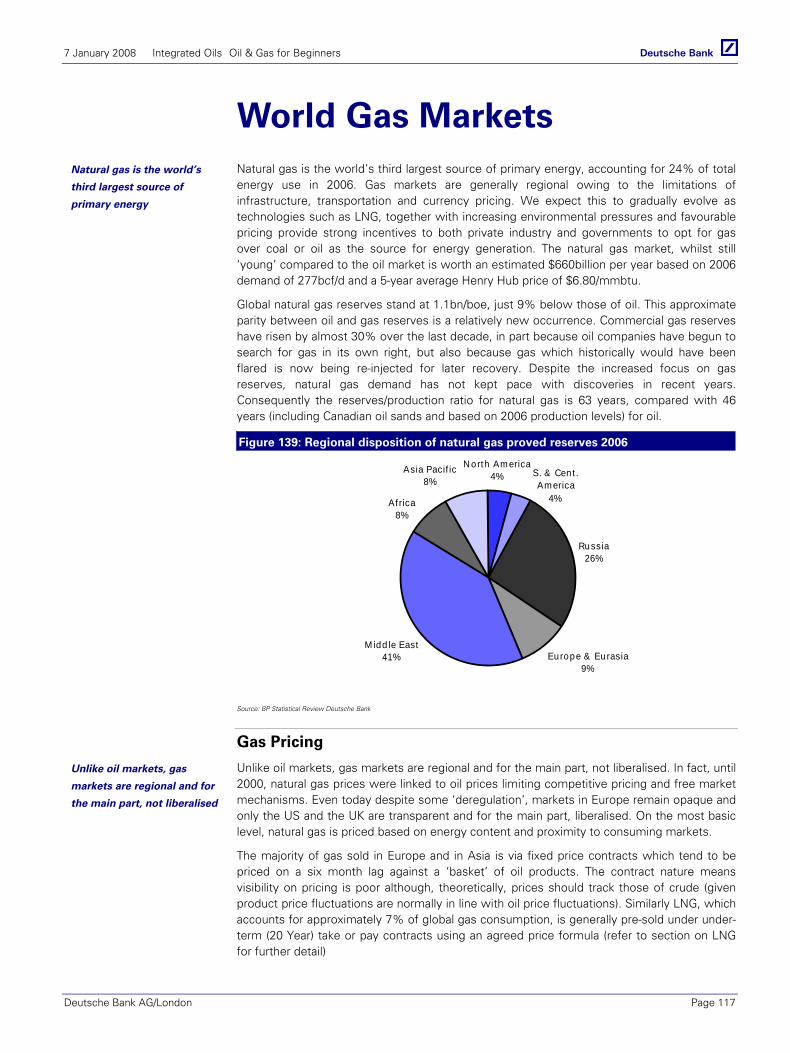
7 January 2008 Integrated Oils Oil & Gas for Beginners
Deutsche Bank AG/London Page 117
World Gas Markets Natural gas is the world’s third largest source of primary energy, accounting for 24% of total energy use in 2006. Gas markets are generally regional owing to the limitations of infrastructure, transportation and currency pricing. We expect this to gradually evolve as technologies such as LNG, together with increasing environmental pressures and favourable pricing provide strong incentives to both private industry and governments to opt for gas over coal or oil as the source for energy generation. The natural gas market, whilst still ‘young’ compared to the oil market is worth an estimated $660billion per year based on 2006 demand of 277bcf/d and a 5-year average Henry Hub price of $6.80/mmbtu.
Global natural gas reserves stand at 1.1bn/boe, just 9% below those of oil. This approximate parity between oil and gas reserves is a relatively new occurrence. Commercial gas reserves have risen by almost 30% over the last decade, in part because oil companies have begun to search for gas in its own right, but also because gas which historically would have been flared is now being re-injected for later recovery. Despite the increased focus on gas reserves, natural gas demand has not kept pace with discoveries in recent years. Consequently the reserves/production ratio for natural gas is 63 years, compared with 46 years (including Canadian oil sands and based on 2006 production levels) for oil.
Figure 139: Regional disposition of natural gas proved reserves 2006
Russia26%
Europe & Eurasia9%
Midd le East41%
Africa8%
Asia Pacif ic8%
N orth America4% S. & Cent .
America4%
Source: BP Statistical Review Deutsche Bank
Gas Pricing
Unlike oil markets, gas markets are regional and for the main part, not liberalised. In fact, until 2000, natural gas prices were linked to oil prices limiting competitive pricing and free market mechanisms. Even today despite some ‘deregulation’, markets in Europe remain opaque and only the US and the UK are transparent and for the main part, liberalised. On the most basic level, natural gas is priced based on energy content and proximity to consuming markets.
The majority of gas sold in Europe and in Asia is via fixed price contracts which tend to be priced on a six month lag against a ‘basket’ of oil products. The contract nature means visibility on pricing is poor although, theoretically, prices should track those of crude (given product price fluctuations are normally in line with oil price fluctuations). Similarly LNG, which accounts for approximately 7% of global gas consumption, is generally pre-sold under under-term (20 Year) take or pay contracts using an agreed price formula (refer to section on LNG for further detail)
Natural gas is the world’s
third largest source of
primary energy
Unlike oil markets, gas
markets are regional and for
the main part, not liberalised
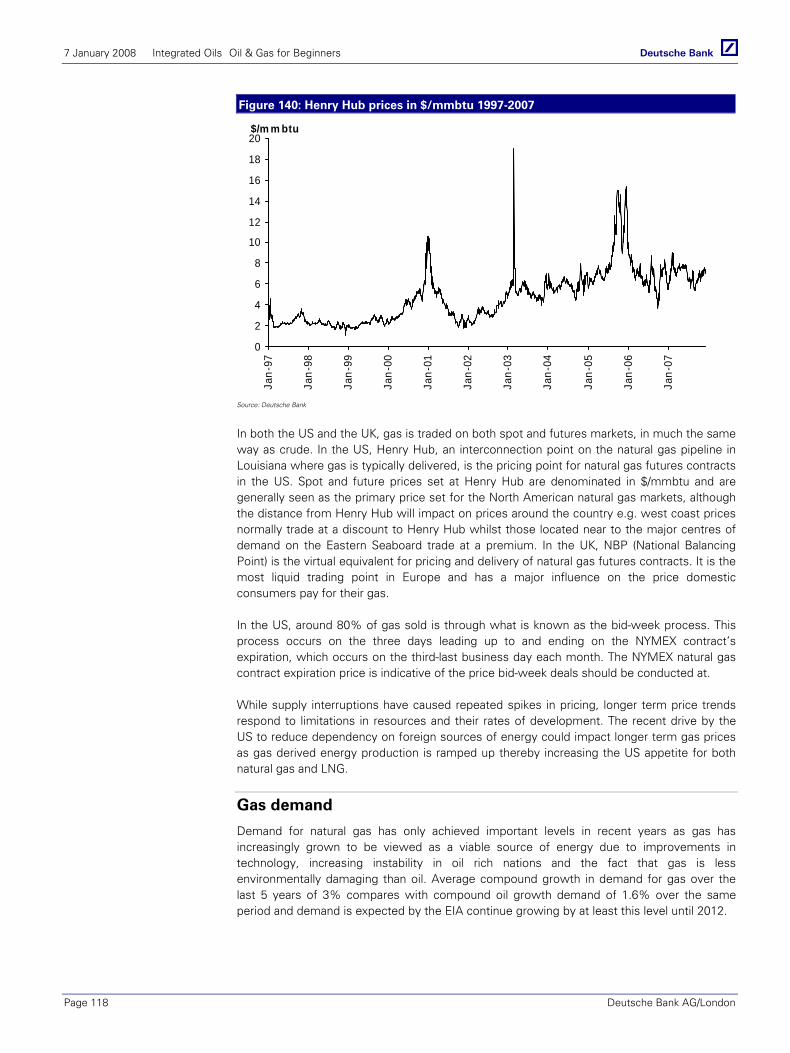
7 January 2008 Integrated Oils Oil & Gas for Beginners
Page 118 Deutsche Bank AG/London
Figure 140: Henry Hub prices in $/mmbtu 1997-2007
0
2
4
6
8
10
12
14
16
18
20
Jan-
97
Jan-
98
Jan-
99
Jan-
00
Jan-
01
Jan-
02
Jan-
03
Jan-
04
Jan-
05
Jan-
06
Jan-
07
$/m m btu
Source: Deutsche Bank
In both the US and the UK, gas is traded on both spot and futures markets, in much the same way as crude. In the US, Henry Hub, an interconnection point on the natural gas pipeline in Louisiana where gas is typically delivered, is the pricing point for natural gas futures contracts in the US. Spot and future prices set at Henry Hub are denominated in $/mmbtu and are generally seen as the primary price set for the North American natural gas markets, although the distance from Henry Hub will impact on prices around the country e.g. west coast prices normally trade at a discount to Henry Hub whilst those located near to the major centres of demand on the Eastern Seaboard trade at a premium. In the UK, NBP (National Balancing Point) is the virtual equivalent for pricing and delivery of natural gas futures contracts. It is the most liquid trading point in Europe and has a major influence on the price domestic consumers pay for their gas.
In the US, around 80% of gas sold is through what is known as the bid-week process. This process occurs on the three days leading up to and ending on the NYMEX contract’s expiration, which occurs on the third-last business day each month. The NYMEX natural gas contract expiration price is indicative of the price bid-week deals should be conducted at.
While supply interruptions have caused repeated spikes in pricing, longer term price trends respond to limitations in resources and their rates of development. The recent drive by the US to reduce dependency on foreign sources of energy could impact longer term gas prices as gas derived energy production is ramped up thereby increasing the US appetite for both natural gas and LNG.
Gas demand
Demand for natural gas has only achieved important levels in recent years as gas has increasingly grown to be viewed as a viable source of energy due to improvements in technology, increasing instability in oil rich nations and the fact that gas is less environmentally damaging than oil. Average compound growth in demand for gas over the last 5 years of 3% compares with compound oil growth demand of 1.6% over the same period and demand is expected by the EIA continue growing by at least this level until 2012.
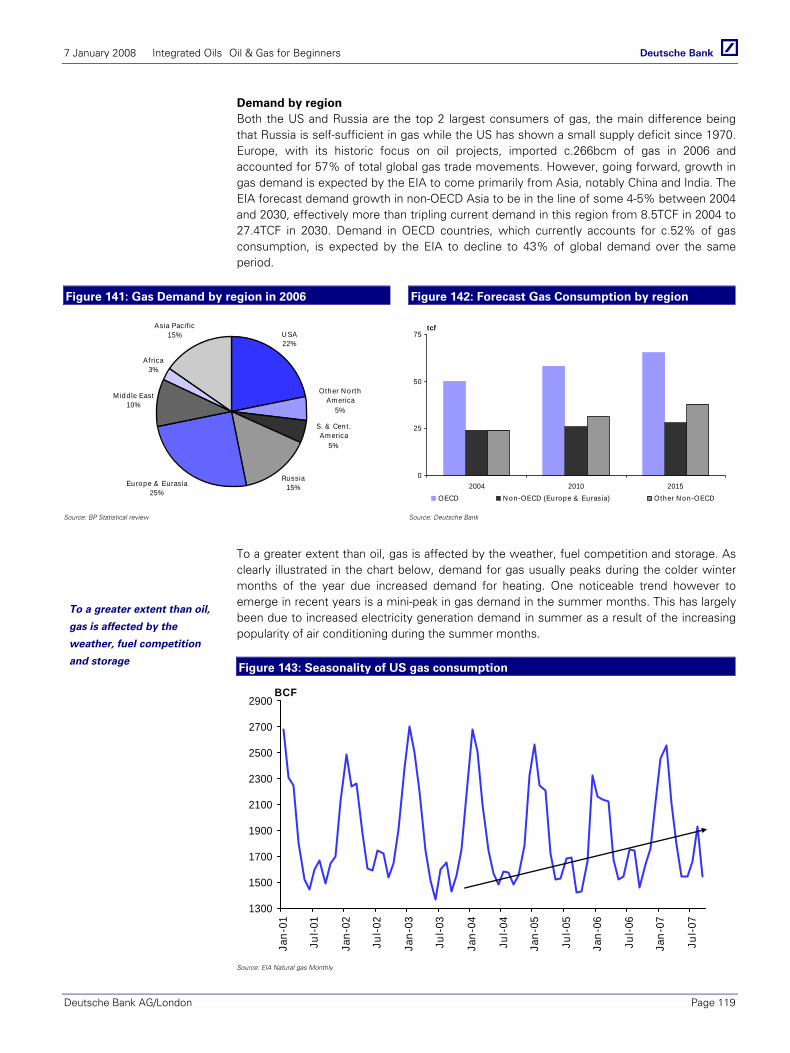
7 January 2008 Integrated Oils Oil & Gas for Beginners
Deutsche Bank AG/London Page 119
Demand by region Both the US and Russia are the top 2 largest consumers of gas, the main difference being that Russia is self-sufficient in gas while the US has shown a small supply deficit since 1970. Europe, with its historic focus on oil projects, imported c.266bcm of gas in 2006 and accounted for 57% of total global gas trade movements. However, going forward, growth in gas demand is expected by the EIA to come primarily from Asia, notably China and India. The EIA forecast demand growth in non-OECD Asia to be in the line of some 4-5% between 2004 and 2030, effectively more than tripling current demand in this region from 8.5TCF in 2004 to 27.4TCF in 2030. Demand in OECD countries, which currently accounts for c.52% of gas consumption, is expected by the EIA to decline to 43% of global demand over the same period.
Figure 141: Gas Demand by region in 2006 Figure 142: Forecast Gas Consumption by region
U SA22%
Other N orth Am erica
5%
S. & Cent . America
5%
Russia15%Europe & Eurasia
25%
Midd le East10%
Africa3%
Asia Pacif ic15%
0
25
50
75
2004 2010 2015
tcf
OECD N on-OECD (Europe & Eurasia) Other N on-OECD
Source: BP Statistical review Source: Deutsche Bank
To a greater extent than oil, gas is affected by the weather, fuel competition and storage. As clearly illustrated in the chart below, demand for gas usually peaks during the colder winter months of the year due increased demand for heating. One noticeable trend however to emerge in recent years is a mini-peak in gas demand in the summer months. This has largely been due to increased electricity generation demand in summer as a result of the increasing popularity of air conditioning during the summer months.
Figure 143: Seasonality of US gas consumption
1300
1500
1700
1900
2100
2300
2500
2700
2900
Jan-
01
Jul-0
1
Jan-
02
Jul-0
2
Jan-
03
Jul-0
3
Jan-
04
Jul-0
4
Jan-
05
Jul-0
5
Jan-
06
Jul-0
6
Jan-
07
Jul-0
7BCF
Source: EIA Natural gas Monthly
To a greater extent than oil,
gas is affected by the
weather, fuel competition
and storage

7 January 2008 Integrated Oils Oil & Gas for Beginners
Page 120 Deutsche Bank AG/London
Unlike the majority of crude uses, natural gas can be replaced with either fuel oil or coal by energy generators depending on which one is most economical at any given time. As such, should the gas price become too high, power generators will switch to a cheaper substitute where possible thereby depressing demand for gas, which should theoretically reduce the price.
Additionally, natural gas storage levels will have a significant impact on the commodity’s price; when storage levels are too low, the market interprets it as there being a smaller supply cushion hence prices will generally rise. Similar to oil inventories, the EIA publishes a ‘Weekly Natural Gas Storage report’ which indicates the volume of gas held in storage in the US that week, in addition to week-on-week movements. See below for further detail on gas storage.
Demand by Sector: The principal uses of gas are for electric power generation, industrial sector processes (such as refrigeration, process heating/cooling) and other (primarily heating, air-conditioning and ventilation for both residential and commercial purposes). The industrial sector accounts for the bulk of consumption (43% in 2004) and growth in demand from this sector is expected by the EIA to grow at a CAGR of c1.9% out to 2030. This is due to the fact that oil prices are expected to remain high, promoting substitution by natural gas in the industrial sector
Gas Supply
In 2006, gas production grew by 3.1% to reach 47.8mboe/d, continuing the upward trend that has seen production more than double since 1977. In fact, since 1996 gas production has grown at a compound rate of 3% (compared to 2% growth in oil production) as demand for LNG has increased and countries increasingly look to gas as an energy source. Gas is now equivalent to c.60% of the level of oil production.
Figure 144: Forecast gas production by region 2004 -2025
0
20
40
60
80
100
120
140
160
2004 2010 2015 2020 2025
OECD No n-OECD Euro pe & Eurasia No n-OECD A sia M iddle East A frica C & S A merica
2% CAGR
Source: EIA, International Energy Outlook 2007
Since 1996 gas production
has grown at a compound
rate of 3%
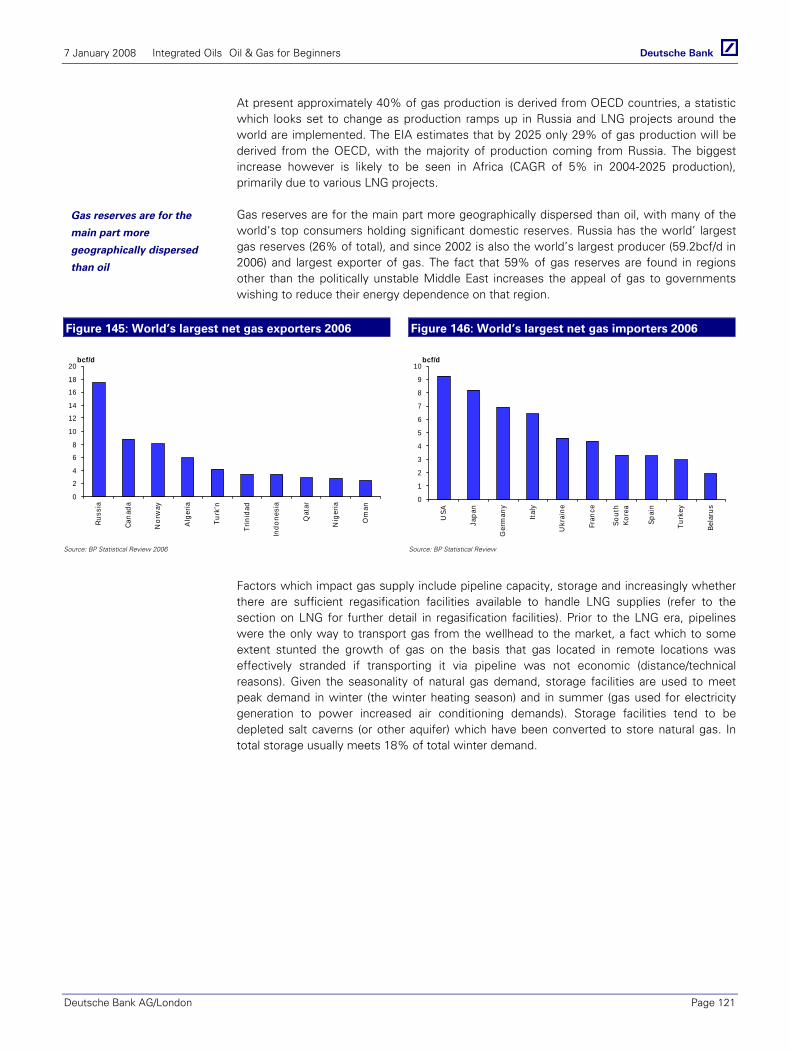
7 January 2008 Integrated Oils Oil & Gas for Beginners
Deutsche Bank AG/London Page 121
At present approximately 40% of gas production is derived from OECD countries, a statistic which looks set to change as production ramps up in Russia and LNG projects around the world are implemented. The EIA estimates that by 2025 only 29% of gas production will be derived from the OECD, with the majority of production coming from Russia. The biggest increase however is likely to be seen in Africa (CAGR of 5% in 2004-2025 production), primarily due to various LNG projects.
Gas reserves are for the main part more geographically dispersed than oil, with many of the world’s top consumers holding significant domestic reserves. Russia has the world’ largest gas reserves (26% of total), and since 2002 is also the world’s largest producer (59.2bcf/d in 2006) and largest exporter of gas. The fact that 59% of gas reserves are found in regions other than the politically unstable Middle East increases the appeal of gas to governments wishing to reduce their energy dependence on that region.
Figure 145: World’s largest net gas exporters 2006 Figure 146: World’s largest net gas importers 2006
0
2
4
6
8
10
12
14
16
18
20
Russ
ia
Cana
da
Nor
way
Alg
eria
Turk
'n
Trin
idad
Indo
nesi
a
Qat
ar
Nig
eria
Om
anbcf/d
0
1
2
3
4
5
6
7
8
9
10
USA
Japa
n
Ger
man
y
Italy
Ukr
aine
Fran
ce
Sout
hKo
rea
Spai
n
Turk
ey
Bela
rus
bcf/d
Source: BP Statistical Review 2006 Source: BP Statistical Review
Factors which impact gas supply include pipeline capacity, storage and increasingly whether there are sufficient regasification facilities available to handle LNG supplies (refer to the section on LNG for further detail in regasification facilities). Prior to the LNG era, pipelines were the only way to transport gas from the wellhead to the market, a fact which to some extent stunted the growth of gas on the basis that gas located in remote locations was effectively stranded if transporting it via pipeline was not economic (distance/technical reasons). Given the seasonality of natural gas demand, storage facilities are used to meet peak demand in winter (the winter heating season) and in summer (gas used for electricity generation to power increased air conditioning demands). Storage facilities tend to be depleted salt caverns (or other aquifer) which have been converted to store natural gas. In total storage usually meets 18% of total winter demand.
Gas reserves are for the
main part more
geographically dispersed
than oil
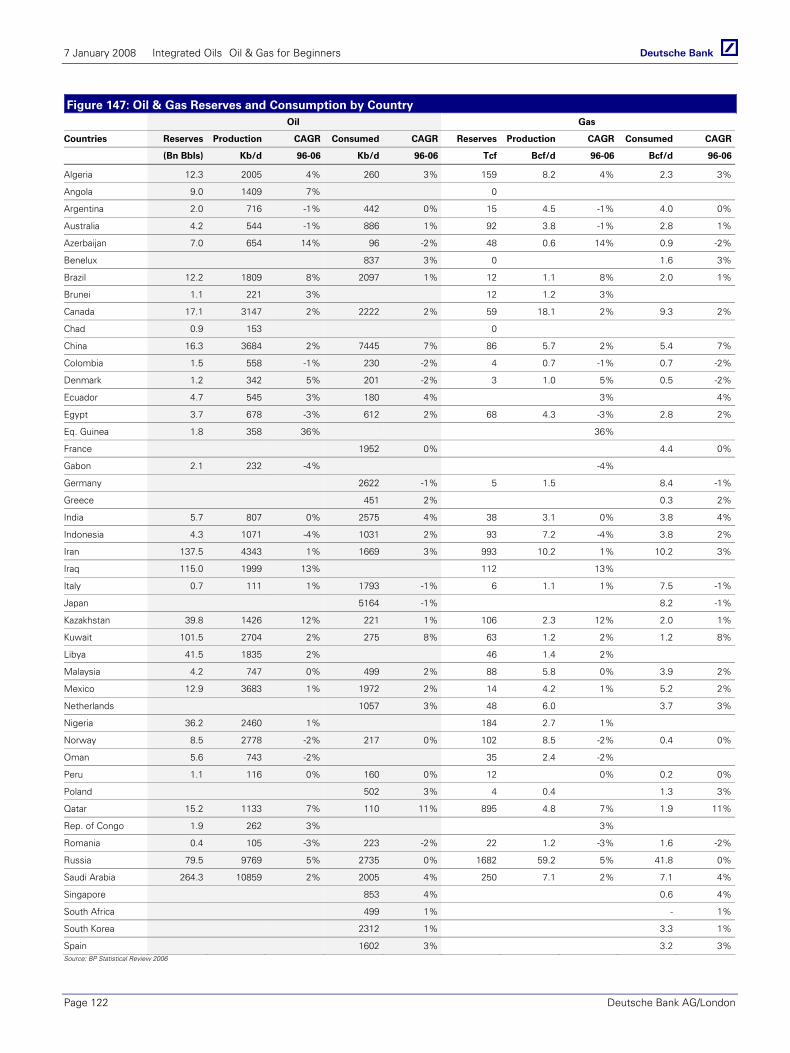
7 January 2008 Integrated Oils Oil & Gas for Beginners
Page 122 Deutsche Bank AG/London
Figure 147: Oil & Gas Reserves and Consumption by Country Oil Gas
Countries Reserves Production CAGR Consumed CAGR Reserves Production CAGR Consumed CAGR
(Bn Bbls) Kb/d 96-06 Kb/d 96-06 Tcf Bcf/d 96-06 Bcf/d 96-06
Algeria 12.3 2005 4% 260 3% 159 8.2 4% 2.3 3%
Angola 9.0 1409 7% 0
Argentina 2.0 716 -1% 442 0% 15 4.5 -1% 4.0 0%
Australia 4.2 544 -1% 886 1% 92 3.8 -1% 2.8 1%
Azerbaijan 7.0 654 14% 96 -2% 48 0.6 14% 0.9 -2%
Benelux 837 3% 0 1.6 3%
Brazil 12.2 1809 8% 2097 1% 12 1.1 8% 2.0 1%
Brunei 1.1 221 3% 12 1.2 3%
Canada 17.1 3147 2% 2222 2% 59 18.1 2% 9.3 2%
Chad 0.9 153 0
China 16.3 3684 2% 7445 7% 86 5.7 2% 5.4 7%
Colombia 1.5 558 -1% 230 -2% 4 0.7 -1% 0.7 -2%
Denmark 1.2 342 5% 201 -2% 3 1.0 5% 0.5 -2%
Ecuador 4.7 545 3% 180 4% 3% 4%
Egypt 3.7 678 -3% 612 2% 68 4.3 -3% 2.8 2%
Eq. Guinea 1.8 358 36% 36%
France 1952 0% 4.4 0%
Gabon 2.1 232 -4% -4%
Germany 2622 -1% 5 1.5 8.4 -1%
Greece 451 2% 0.3 2%
India 5.7 807 0% 2575 4% 38 3.1 0% 3.8 4%
Indonesia 4.3 1071 -4% 1031 2% 93 7.2 -4% 3.8 2%
Iran 137.5 4343 1% 1669 3% 993 10.2 1% 10.2 3%
Iraq 115.0 1999 13% 112 13%
Italy 0.7 111 1% 1793 -1% 6 1.1 1% 7.5 -1%
Japan 5164 -1% 8.2 -1%
Kazakhstan 39.8 1426 12% 221 1% 106 2.3 12% 2.0 1%
Kuwait 101.5 2704 2% 275 8% 63 1.2 2% 1.2 8%
Libya 41.5 1835 2% 46 1.4 2%
Malaysia 4.2 747 0% 499 2% 88 5.8 0% 3.9 2%
Mexico 12.9 3683 1% 1972 2% 14 4.2 1% 5.2 2%
Netherlands 1057 3% 48 6.0 3.7 3%
Nigeria 36.2 2460 1% 184 2.7 1%
Norway 8.5 2778 -2% 217 0% 102 8.5 -2% 0.4 0%
Oman 5.6 743 -2% 35 2.4 -2%
Peru 1.1 116 0% 160 0% 12 0% 0.2 0%
Poland 502 3% 4 0.4 1.3 3%
Qatar 15.2 1133 7% 110 11% 895 4.8 7% 1.9 11%
Rep. of Congo 1.9 262 3% 3%
Romania 0.4 105 -3% 223 -2% 22 1.2 -3% 1.6 -2%
Russia 79.5 9769 5% 2735 0% 1682 59.2 5% 41.8 0%
Saudi Arabia 264.3 10859 2% 2005 4% 250 7.1 2% 7.1 4%
Singapore 853 4% 0.6 4%
South Africa 499 1% - 1%
South Korea 2312 1% 3.3 1%
Spain 1602 3% 3.2 3%Source: BP Statistical Review 2006
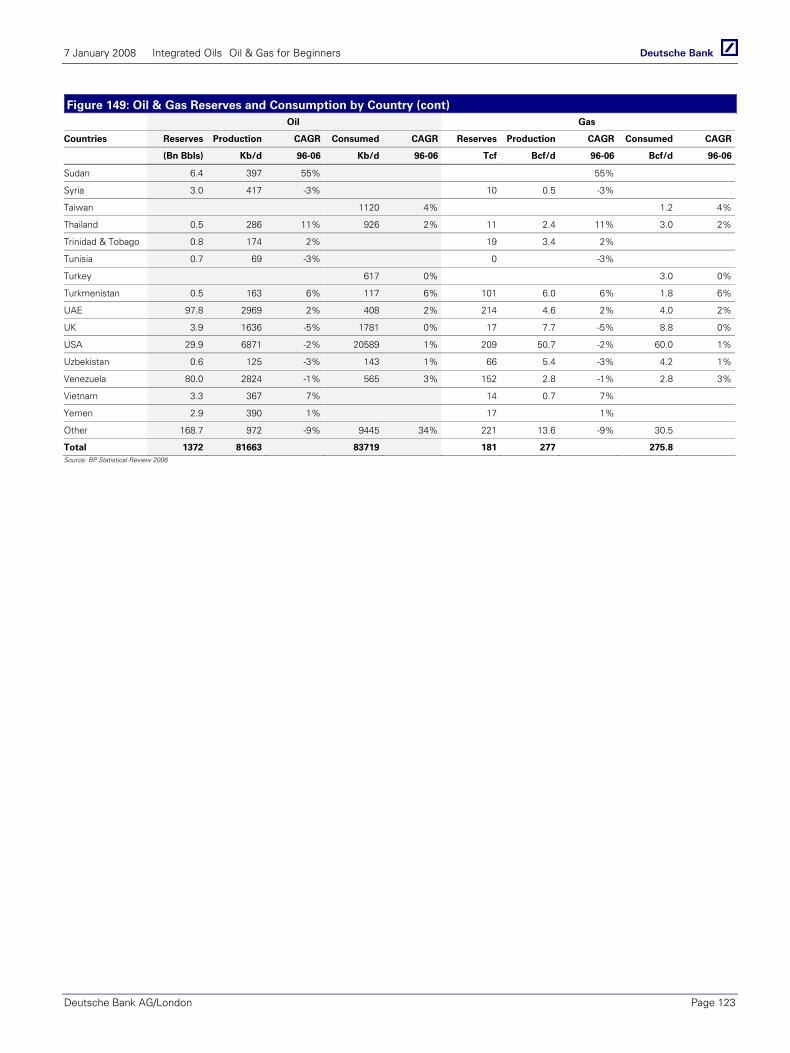
7 January 2008 Integrated Oils Oil & Gas for Beginners
Deutsche Bank AG/London Page 123
Figure 149: Oil & Gas Reserves and Consumption by Country (cont) Oil Gas
Countries Reserves Production CAGR Consumed CAGR Reserves Production CAGR Consumed CAGR
(Bn Bbls) Kb/d 96-06 Kb/d 96-06 Tcf Bcf/d 96-06 Bcf/d 96-06
Sudan 6.4 397 55% 55%
Syria 3.0 417 -3% 10 0.5 -3%
Taiwan 1120 4% 1.2 4%
Thailand 0.5 286 11% 926 2% 11 2.4 11% 3.0 2%
Trinidad & Tobago 0.8 174 2% 19 3.4 2%
Tunisia 0.7 69 -3% 0 -3%
Turkey 617 0% 3.0 0%
Turkmenistan 0.5 163 6% 117 6% 101 6.0 6% 1.8 6%
UAE 97.8 2969 2% 408 2% 214 4.6 2% 4.0 2%
UK 3.9 1636 -5% 1781 0% 17 7.7 -5% 8.8 0%
USA 29.9 6871 -2% 20589 1% 209 50.7 -2% 60.0 1%
Uzbekistan 0.6 125 -3% 143 1% 66 5.4 -3% 4.2 1%
Venezuela 80.0 2824 -1% 565 3% 152 2.8 -1% 2.8 3%
Vietnam 3.3 367 7% 14 0.7 7%
Yemen 2.9 390 1% 17 1%
Other 168.7 972 -9% 9445 34% 221 13.6 -9% 30.5
Total 1372 81663 83719 181 277 275.8Source: BP Statistical Review 2006

7 January 2008 Integrated Oils Oil & Gas for Beginners
Page 124 Deutsche Bank AG/London
Oil & Gas Products What is crude oil?
Not all crude oil is the same! Breaking it down to its most simple form, crude oil consists of lots of carbon chains and molecules all of differing lengths. It is not a homogenous material and its physical appearance varies from a light, almost colourless liquid to a heavy black/brown sludge. The number of hydrocarbons, in addition to the heat at which the hydrocarbons formed, will determine the density and hence the classification of the oil. Density (light/medium/heavy) is classified by the American Petroleum Institute (API). The less dense the oil, the higher the API gravity, hence high gravity oils are known as ‘light’ crudes and low gravity oil are ‘heavy’ crudes. Equally, all oils contain sulphur to some degree which is released on combustion as sulphur dioxide. Oils containing a higher percentage of sulphur are known as sour, and those with lower sulphur levels are known as sweet.
Figure 148: Simple depiction of the structure of the different components that
comprise crude oil. Importantly, not all chains are the same*
C-C-C-C (LPG)
C-C-C-C-C-C (naphtha)
C-C-C-C-C-C-C-C-C (gasoline)
C-C-C-C-C-C-C-C-C-C-C-C-C (diesel)
CH3 - (C-C-C-C-C-S-C-C-C-C-C-C-C-C) - CH3 (long chain bunker fuel)
CH3-(CH2)n-CH3 Bitumen
Source: Deutsche Bank *Chain lengths are for illustrative purposes only rather than an accurate depiction of length and molecular form
Definitions
Light crude usually has an API gravity between 35 and 40 degrees. It has a lower wax content and fewer long chain molecules, hence lower viscosity and as such is easier to pump and transport. This historically has meant lower operating (both production and refining) costs to exploit resources of light crude and hence higher demand by oil companies to gain access to these resources. The majority of refined oil (in all its forms such as petrol, heating oil) to date has been produced from light oil and both the London (Brent) and New York (WTI) oil prices -- the two key international benchmarks -- are for light crude, indicating the dominance of light crude in the global market to date.
Heavy crude usually has an API between 16 and 20 degrees. Physical properties that distinguish heavy crudes from lighter ones include higher viscosity, with a consistency ranging from that of heavy molasses to a solid at room temperature. These oils can often contain high concentrations of sulphur and several metals, particularly nickel and vanadium. These are the properties that make them difficult to pump out of the ground or through a pipeline and interfere with refining. In general, diluents are added at regular distances in pipelines carrying heavy crude to facilitate the flow.
Sweet crude contains less than 0.5% sulphur. High quality, low sulphur crude oil is commonly used for processing into petrol and is in high demand. "Light sweet crude oil" is the most sought-after version of crude oil as it contains a disproportionately large amount of gasoline (petrol), kerosene, and high-quality diesel.
Crudes differ in a large
number of chemical and
physical properties
Light crude usually has an
API gravity between 35 and
40 degrees
Sweet crude contains less
than 0.5% sulphur.

7 January 2008 Integrated Oils Oil & Gas for Beginners
Deutsche Bank AG/London Page 125
What is API gravity? The American Petroleum Institute gravity, or API gravity, is a measure of how heavy or light a petroleum liquid is compared to water. If its API gravity is greater than 10, it is lighter and floats on water; if less than 10, it is heavier and sinks. API gravity is thus a measure of the relative density of a petroleum liquid and the density of water, but it is used to compare the relative densities of petroleum liquids. For example, if one petroleum liquid floats on another and is therefore less dense, it has a greater API gravity. Although mathematically API gravity has no units (see the formula below), it is nevertheless referred to as being in “degrees”. API gravity is graduated in degrees on a hydrometer instrument and was designed so that most values would fall between 10 and 70 API gravity degrees. The formula for API is as follows. Note that the specific gravity (SG) of a liquid is its density relative to water.
API Gravity = 141.5/SG at 60°F – 131.5
Sour crude contains impurities such as hydrogen sulphide and carbon dioxide. When the total sulphide level in the oil is >1% the oil is called ‘sour’. The impurities need to be removed before the lower quality crude can be refined, thereby increasing the cost of processing. This results in higher costs to produce transport and other fuels than those made from sweet crude oil.
Acidity is measured via a total acid number (TAN) index. Acidity above a certain level poses problems for refiners as it can lead to corrosion of the refinery equipment. Special equipment can be installed to handle higher acid crudes or the problem can be addressed via blending but this too has a logistical element to it. Acidity has not played a major role in oil markets to date but with more unconventional sources of oil being explored this could be an important factor going forward.
Figure 149: Typical refining output of crude oil for selected blends
26% 29%37%
74%36%
39%
38%
0%33%
29%22% 24%
5% 3% 3% 2%
0%
10%
20%
30%
40%
50%
60%
70%
80%
90%
100%
Saharan (Algeria) Brent Arab Light (Saudi) Boscan Heavy Oil(Venezuela)
Heavy Products Middle Distillate Light Products Gas
API 44.0°Sulphur 0.2%
API 10.7°Sulphur 5.3%
API 34.0°Sulphur 1.7%
API 37.5°Sulphur 0.3%
Source: Wood Mackenzie
In general both heavy and sour crudes trade at a discount due to higher processing costs and the fact that the majority of refineries were built to process light, sweet crude. The above diagram shows the typical refining slate of a number of different crude oils.
Sour crude contains
impurities such as hydrogen
sulphide and carbon dioxide
Both heavy and sour crude
trades at a discount
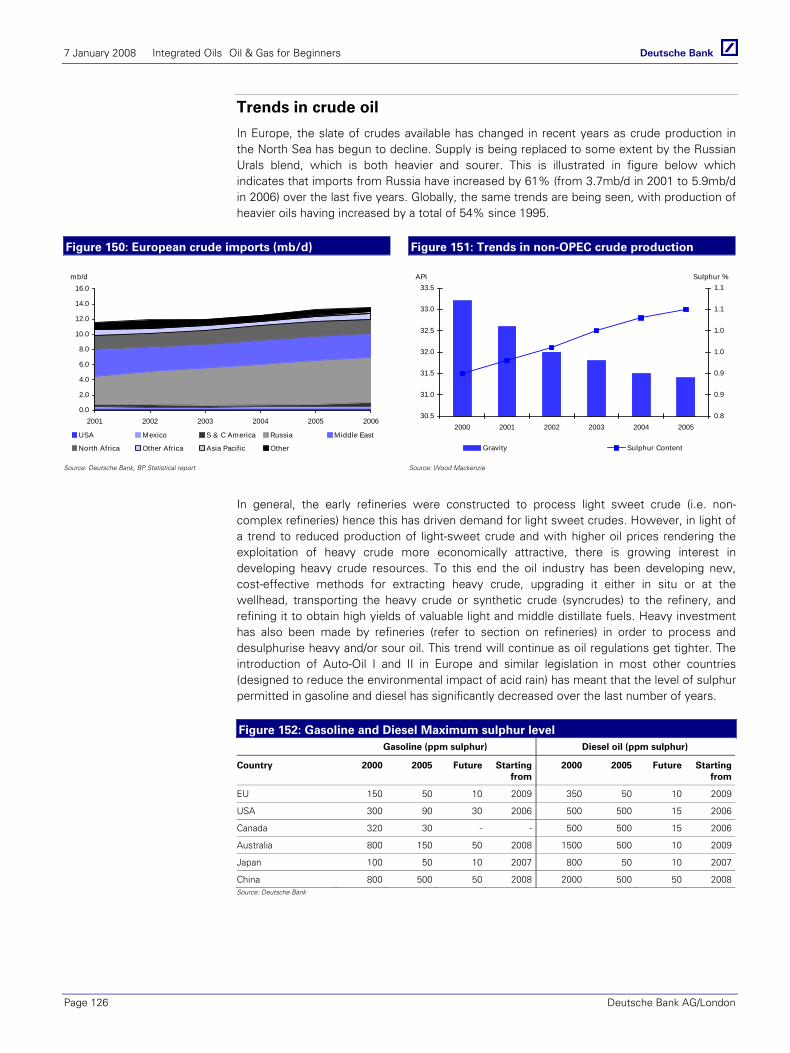
7 January 2008 Integrated Oils Oil & Gas for Beginners
Page 126 Deutsche Bank AG/London
Trends in crude oil
In Europe, the slate of crudes available has changed in recent years as crude production in the North Sea has begun to decline. Supply is being replaced to some extent by the Russian Urals blend, which is both heavier and sourer. This is illustrated in figure below which indicates that imports from Russia have increased by 61% (from 3.7mb/d in 2001 to 5.9mb/d in 2006) over the last five years. Globally, the same trends are being seen, with production of heavier oils having increased by a total of 54% since 1995.
Figure 150: European crude imports (mb/d) Figure 151: Trends in non-OPEC crude production
0.0
2.0
4.0
6.0
8.0
10.0
12.0
14.0
16.0
2001 2002 2003 2004 2005 2006
USA Mexico S & C America Russia Middle East
North Africa Other Africa Asia Pacific Other
mb/d
30.5
31.0
31.5
32.0
32.5
33.0
33.5
2000 2001 2002 2003 2004 20050.8
0.9
0.9
1.0
1.0
1.1
1.1
Gravity Sulphur Content
API Sulphur %
Source: Deutsche Bank, BP Statistical report Source: Wood Mackenzie
In general, the early refineries were constructed to process light sweet crude (i.e. non-complex refineries) hence this has driven demand for light sweet crudes. However, in light of a trend to reduced production of light-sweet crude and with higher oil prices rendering the exploitation of heavy crude more economically attractive, there is growing interest in developing heavy crude resources. To this end the oil industry has been developing new, cost-effective methods for extracting heavy crude, upgrading it either in situ or at the wellhead, transporting the heavy crude or synthetic crude (syncrudes) to the refinery, and refining it to obtain high yields of valuable light and middle distillate fuels. Heavy investment has also been made by refineries (refer to section on refineries) in order to process and desulphurise heavy and/or sour oil. This trend will continue as oil regulations get tighter. The introduction of Auto-Oil I and II in Europe and similar legislation in most other countries (designed to reduce the environmental impact of acid rain) has meant that the level of sulphur permitted in gasoline and diesel has significantly decreased over the last number of years.
Figure 152: Gasoline and Diesel Maximum sulphur level Gasoline (ppm sulphur) Diesel oil (ppm sulphur)
Country 2000 2005 Future Starting from
2000 2005 Future Starting from
EU 150 50 10 2009 350 50 10 2009
USA 300 90 30 2006 500 500 15 2006
Canada 320 30 - - 500 500 15 2006
Australia 800 150 50 2008 1500 500 10 2009
Japan 100 50 10 2007 800 50 10 2007
China 800 500 50 2008 2000 500 50 2008Source: Deutsche Bank
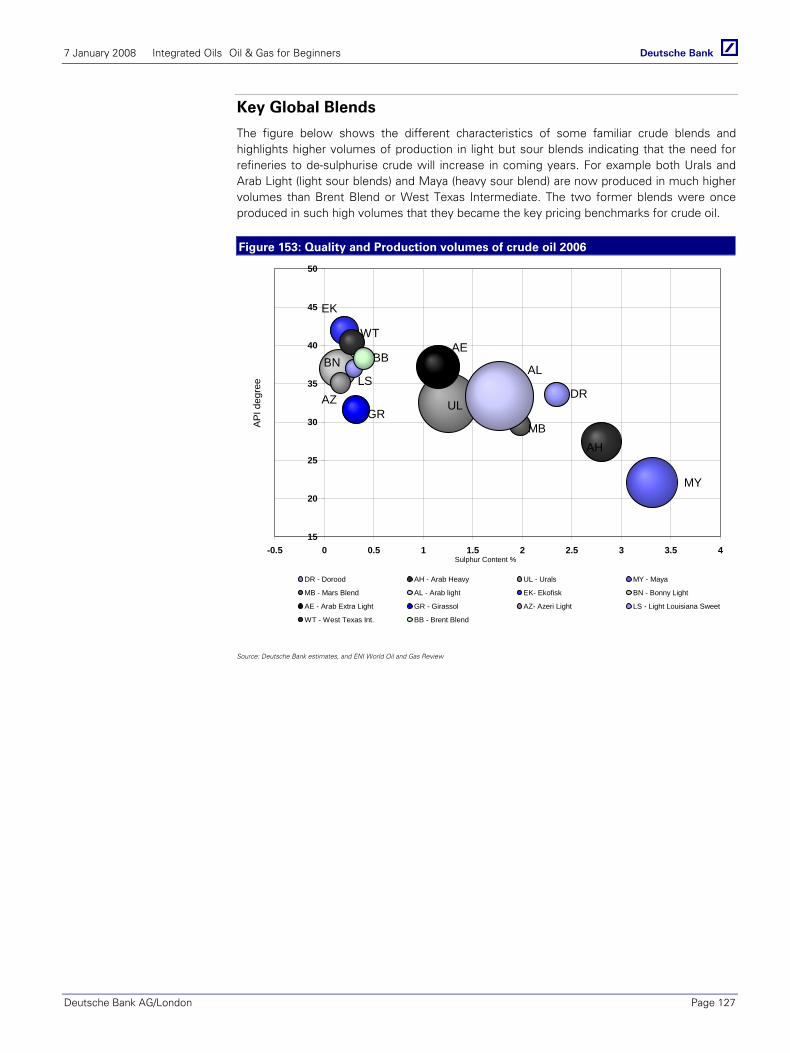
7 January 2008 Integrated Oils Oil & Gas for Beginners
Deutsche Bank AG/London Page 127
Key Global Blends
The figure below shows the different characteristics of some familiar crude blends and highlights higher volumes of production in light but sour blends indicating that the need for refineries to de-sulphurise crude will increase in coming years. For example both Urals and Arab Light (light sour blends) and Maya (heavy sour blend) are now produced in much higher volumes than Brent Blend or West Texas Intermediate. The two former blends were once produced in such high volumes that they became the key pricing benchmarks for crude oil.
Figure 153: Quality and Production volumes of crude oil 2006
DR
AH
UL
MY
MB
AL
EK
BNAE
GRAZ
LS
WT
BB
15
20
25
30
35
40
45
50
-0.5 0 0.5 1 1.5 2 2.5 3 3.5 4Sulphur Content %
API d
egre
e
DR - Dorood AH - Arab Heavy UL - Urals MY - Maya
MB - Mars Blend AL - Arab light EK- Ekofisk BN - Bonny Light
AE - Arab Extra Light GR - Girassol AZ- Azeri Light LS - Light Louisiana Sweet
WT - West Texas Int. BB - Brent Blend
Source: Deutsche Bank estimates, and ENI World Oil and Gas Review
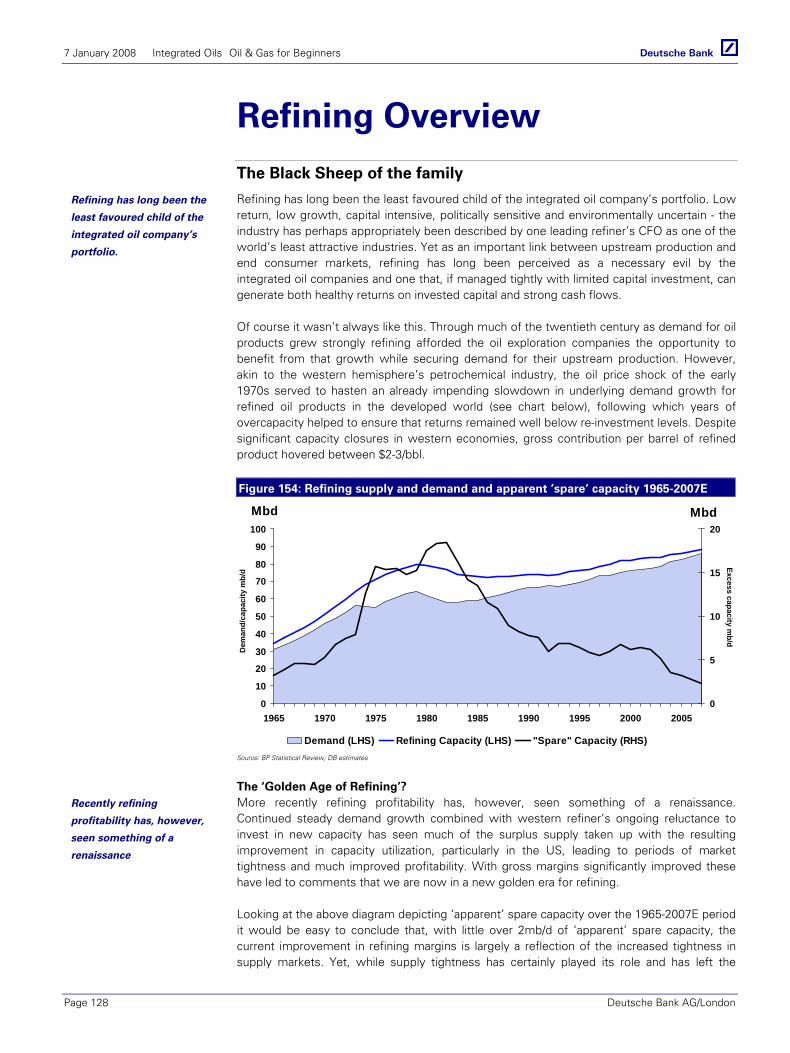
7 January 2008 Integrated Oils Oil & Gas for Beginners
Page 128 Deutsche Bank AG/London
Refining Overview The Black Sheep of the family
Refining has long been the least favoured child of the integrated oil company’s portfolio. Low return, low growth, capital intensive, politically sensitive and environmentally uncertain - the industry has perhaps appropriately been described by one leading refiner’s CFO as one of the world’s least attractive industries. Yet as an important link between upstream production and end consumer markets, refining has long been perceived as a necessary evil by the integrated oil companies and one that, if managed tightly with limited capital investment, can generate both healthy returns on invested capital and strong cash flows.
Of course it wasn’t always like this. Through much of the twentieth century as demand for oil products grew strongly refining afforded the oil exploration companies the opportunity to benefit from that growth while securing demand for their upstream production. However, akin to the western hemisphere’s petrochemical industry, the oil price shock of the early 1970s served to hasten an already impending slowdown in underlying demand growth for refined oil products in the developed world (see chart below), following which years of overcapacity helped to ensure that returns remained well below re-investment levels. Despite significant capacity closures in western economies, gross contribution per barrel of refined product hovered between $2-3/bbl.
Figure 154: Refining supply and demand and apparent ’spare’ capacity 1965-2007E
0
10
20
30
40
50
60
70
80
90
100
1965 1970 1975 1980 1985 1990 1995 2000 2005
Mbd
0
5
10
15
20Mbd
Demand (LHS) Refining Capacity (LHS) "Spare" Capacity (RHS)
Dem
and/
capa
city
mb/
d
Excess capacity mb/d
Source: BP Statistical Review; DB estimates
The ‘Golden Age of Refining’? More recently refining profitability has, however, seen something of a renaissance. Continued steady demand growth combined with western refiner’s ongoing reluctance to invest in new capacity has seen much of the surplus supply taken up with the resulting improvement in capacity utilization, particularly in the US, leading to periods of market tightness and much improved profitability. With gross margins significantly improved these have led to comments that we are now in a new golden era for refining.
Looking at the above diagram depicting ‘apparent’ spare capacity over the 1965-2007E period it would be easy to conclude that, with little over 2mb/d of ‘apparent’ spare capacity, the current improvement in refining margins is largely a reflection of the increased tightness in supply markets. Yet, while supply tightness has certainly played its role and has left the
Refining has long been the
least favoured child of the
integrated oil company’s
portfolio.
Recently refining
profitability has, however,
seen something of a
renaissance
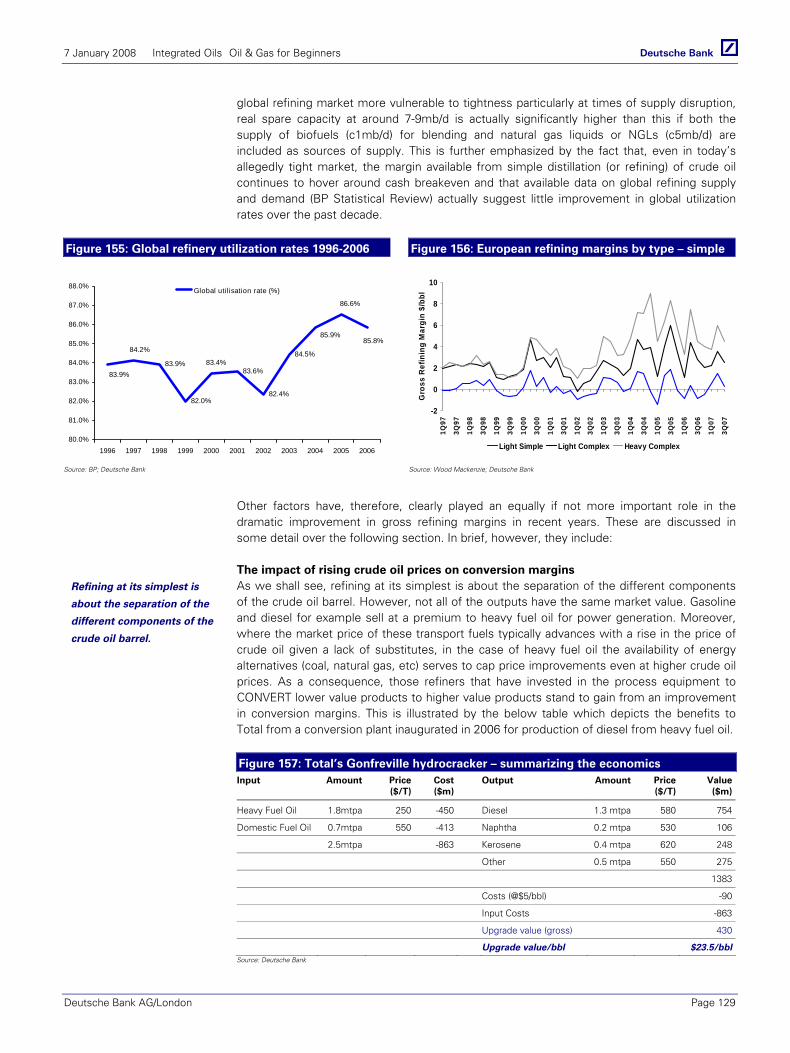
7 January 2008 Integrated Oils Oil & Gas for Beginners
Deutsche Bank AG/London Page 129
global refining market more vulnerable to tightness particularly at times of supply disruption, real spare capacity at around 7-9mb/d is actually significantly higher than this if both the supply of biofuels (c1mb/d) for blending and natural gas liquids or NGLs (c5mb/d) are included as sources of supply. This is further emphasized by the fact that, even in today’s allegedly tight market, the margin available from simple distillation (or refining) of crude oil continues to hover around cash breakeven and that available data on global refining supply and demand (BP Statistical Review) actually suggest little improvement in global utilization rates over the past decade.
Figure 155: Global refinery utilization rates 1996-2006 Figure 156: European refining margins by type – simple
83.9%
82.0%
83.6%
82.4%
84.5%
85.8%85.9%
86.6%
83.4%
84.2%
83.9%
80.0%
81.0%
82.0%
83.0%
84.0%
85.0%
86.0%
87.0%
88.0%
1996 1997 1998 1999 2000 2001 2002 2003 2004 2005 2006
Global utilisation rate (%)
-2
0
2
4
6
8
10
1Q97
3Q97
1Q98
3Q98
1Q99
3Q99
1Q00
3Q00
1Q01
3Q01
1Q02
3Q02
1Q03
3Q03
1Q04
3Q04
1Q05
3Q05
1Q06
3Q06
1Q07
3Q07
Gro
ss R
efin
ing
Mar
gin
$/bb
l
Light Simple Light Complex Heavy Complex
Source: BP; Deutsche Bank Source: Wood Mackenzie; Deutsche Bank
Other factors have, therefore, clearly played an equally if not more important role in the dramatic improvement in gross refining margins in recent years. These are discussed in some detail over the following section. In brief, however, they include:
The impact of rising crude oil prices on conversion margins As we shall see, refining at its simplest is about the separation of the different components of the crude oil barrel. However, not all of the outputs have the same market value. Gasoline and diesel for example sell at a premium to heavy fuel oil for power generation. Moreover, where the market price of these transport fuels typically advances with a rise in the price of crude oil given a lack of substitutes, in the case of heavy fuel oil the availability of energy alternatives (coal, natural gas, etc) serves to cap price improvements even at higher crude oil prices. As a consequence, those refiners that have invested in the process equipment to CONVERT lower value products to higher value products stand to gain from an improvement in conversion margins. This is illustrated by the below table which depicts the benefits to Total from a conversion plant inaugurated in 2006 for production of diesel from heavy fuel oil.
Figure 157: Total’s Gonfreville hydrocracker – summarizing the economics Input Amount Price
($/T) Cost ($m)
Output Amount Price ($/T)
Value ($m)
Heavy Fuel Oil 1.8mtpa 250 -450 Diesel 1.3 mtpa 580 754
Domestic Fuel Oil 0.7mtpa 550 -413 Naphtha 0.2 mtpa 530 106
2.5mtpa -863 Kerosene 0.4 mtpa 620 248
Other 0.5 mtpa 550 275
1383
Costs (@$5/bbl) -90
Input Costs -863
Upgrade value (gross) 430
Upgrade value/bbl $23.5/bblSource: Deutsche Bank
Refining at its simplest is
about the separation of the
different components of the
crude oil barrel.

7 January 2008 Integrated Oils Oil & Gas for Beginners
Page 130 Deutsche Bank AG/London
The light-heavy spread Theoretically, the different price of different crude oils should reflect variances in their composition and the different value of the product slate that emerges from their distillation. However, because not all refineries can process heavier, sour blends, at times of tightness in crude oil markets or if the supply of light, sweet crude oil is restricted, those refiners that cannot process heavy, sour crudes will likely bid up the value of lighter sweeter blends. The result is that the differential between the heavy and light crude oils will increase beyond its theoretical value. Those refiners that have invested in the equipment necessary to process such blends should therefore be able to capture this incremental value.
In an era where the supply of crude oil is likely to remain increasingly tight and where the global barrel, particularly the OPEC barrel, has been getting heavier it seems likely that the opportunity for refiners to benefit from an increase in the spread is likely to become both more frequent and more meaningful. As with conversion margins, because of the absolute increase in the value of a lighter barrel relative to a heavier barrel at higher oil prices, the absolute value of the spread is also likely to be sustained at higher levels than was the case historically.
Product imbalances Although refining capacity globally may be in surplus, there are clear regional differences in capacity utilization. Moreover, whilst it is possible through investment to alter the products emerging from the refining process, ultimately the product slate cannot be tailored to exactly meet the needs of the market. Indeed, given the age of many refineries in the western world considerable rigidity exists within the refining system. Environmental concerns also limit the scope for investment in new build. As such, while a regional market may be long overall capacity, it may be unable to fully meet the local demands for a particular refined product.
This is particularly true of gasoline in both the US market and Europe. Thus where the US market is significantly short of gasoline, the European market produces substantially more than is required. Of course, this European excess can be sold into the US. However, in order to do so prices in the US market need to be sufficient to justify the cost of shipping. This ‘transport premium’ suggests that so long as the US market remains short of gasoline US prices will be better as should US refining margins. By contrast, Europe’s need to export not only means that refining margins will be lower. It also suggests that the health or otherwise of European margins is likely to be critically dependent upon the health of markets elsewhere, not least the US.
Figure 158: US – Future product balances (Mt)
Figure 159: North West Europe – Future product
balances (Mt)
-40
-35
-30
-25
-20
-15
-10
-5
0Naphtha Gasoline Kerosene Gas/diesel Fuel Oil
2002 2005 2010 2015
-30
-20
-10
0
10
20
30
40
50
60
Naphtha Gasoline Kerosene Gas/diesel Fuel Oil
2002 2005 2010 2015
Source: Wood Mackenzie Source: Wood Mackenzie
Theoretically, the different
price of different crude oils
should reflect variances in
their composition and the
different value of the
product slate that emerges
from their distillation

7 January 2008 Integrated Oils Oil & Gas for Beginners
Deutsche Bank AG/London Page 131
Conclusion: A Golden Age – but perhaps for different reasons Ultimately it is not just the increasing tightness in supply markets that has driven the improvement in refining profitability in recent years. It is also the structural shift in oil prices, different rates of demand growth for the end-products of the refining process and the growing product imbalances between different regional markets. Add to these the increase in environmental and regulatory specifications applied to oil products nowadays, most significantly transport fuels all of which require investment and add barriers to the simple flow of products between one region and another, and it seems clear that there is much more at play here than a simple shift in the demand supply balance
The curse of the investment cycle
Of course the danger around all of this is that with profitability much improved, an increase in investment will see the industry lay down more capacity than is needed, something which it has shown itself all too capable of in the past. Looking at plans announced to date this is not an idle threat. Capacity plans are significant and suggest that, by 2009 the rate of supply addition will comfortably exceed expected demand growth. Plans for expansion in the Middle East and Asia Pacific markets look particularly aggressive. No doubt in an environment where the costs have risen sharply some of these plans will be deferred whilst others will be pushed out. As with the upstream industry, in a tight services market plans are subject to delay.
Figure 160: Planned global refining capacity additions and annual expected demand
growth (mb/d)
0.0
0.5
1.0
1.5
2.0
2.5
3.0
2006 2007 2008 2009 2010
Mb/d
Crude Capacity Increase Demand Growth
Demand growth outstrips capacity by 1.7 Mb/d
More capacity begins to balance demand
Source: Wood Mackenzie; Deutsche Bank
Simplistically, we would expect this to place some significant downwards pressure on margins. Distillation margins certainly look likely to remain under pressure and, with capacity building, the scope for gross refining margins to spike at times of temporary tightness as has been the case over the past two to three years looks likely to diminish. Assuming oil prices remain relatively high conversion margins should, however, continue to prove attractive most significantly for those who are able to benefit both from a likely continuation of an exaggerated heavy-light spread.
In conclusion, ‘Golden Age’ it may not be. But for those with the right configuration, the prospects for sustained healthy returns are probably better than they have been at any point over the past four decades.
It is not just the increasing
tightness in supply markets
that has driven the
improvement in refining
profitability in recent years.
It is also the structural shift
in oil prices
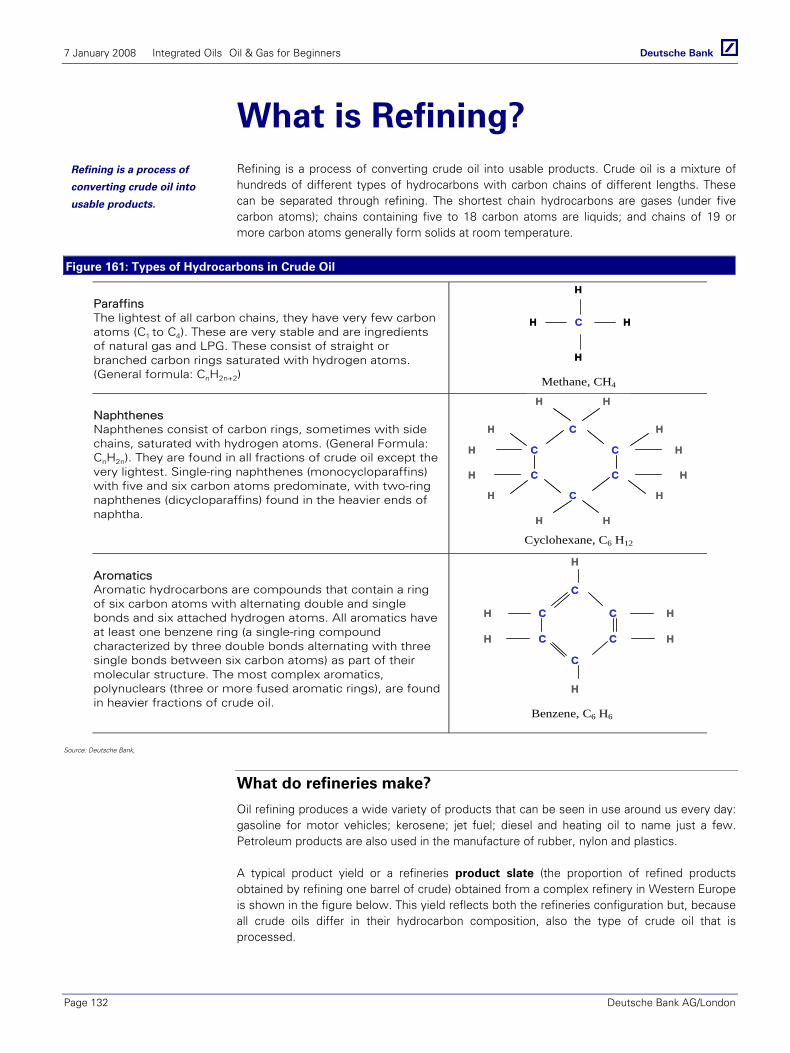
7 January 2008 Integrated Oils Oil & Gas for Beginners
Page 132 Deutsche Bank AG/London
What is Refining? Refining is a process of converting crude oil into usable products. Crude oil is a mixture of hundreds of different types of hydrocarbons with carbon chains of different lengths. These can be separated through refining. The shortest chain hydrocarbons are gases (under five carbon atoms); chains containing five to 18 carbon atoms are liquids; and chains of 19 or more carbon atoms generally form solids at room temperature.
Figure 161: Types of Hydrocarbons in Crude Oil
Paraffins The lightest of all carbon chains, they have very few carbon atoms (C1 to C4). These are very stable and are ingredients of natural gas and LPG. These consist of straight or branched carbon rings saturated with hydrogen atoms. (General formula: CnH2n+2)
CH H
H
H
CH H
H
H
Naphthenes Naphthenes consist of carbon rings, sometimes with side chains, saturated with hydrogen atoms. (General Formula: CnH2n). They are found in all fractions of crude oil except the very lightest. Single-ring naphthenes (monocycloparaffins) with five and six carbon atoms predominate, with two-ring naphthenes (dicycloparaffins) found in the heavier ends of naphtha.
C
C C
C C
C
H
H
H
HH
H
H
H
H
H H
HC
C C
C C
C
H
H
H
HH
H
H
H
H
H H
H
Aromatics Aromatic hydrocarbons are compounds that contain a ring of six carbon atoms with alternating double and single bonds and six attached hydrogen atoms. All aromatics have at least one benzene ring (a single-ring compound characterized by three double bonds alternating with three single bonds between six carbon atoms) as part of their molecular structure. The most complex aromatics, polynuclears (three or more fused aromatic rings), are found in heavier fractions of crude oil.
C
C C
C C
C
H
H
H
H
H
H
C
C C
C C
C
H
H
H
H
H
H
Methane, CH4
Cyclohexane, C6 H12
Benzene, C6 H6
Source: Deutsche Bank,
What do refineries make?
Oil refining produces a wide variety of products that can be seen in use around us every day: gasoline for motor vehicles; kerosene; jet fuel; diesel and heating oil to name just a few. Petroleum products are also used in the manufacture of rubber, nylon and plastics.
A typical product yield or a refineries product slate (the proportion of refined products obtained by refining one barrel of crude) obtained from a complex refinery in Western Europe is shown in the figure below. This yield reflects both the refineries configuration but, because all crude oils differ in their hydrocarbon composition, also the type of crude oil that is processed.
Refining is a process of
converting crude oil into
usable products.

7 January 2008 Integrated Oils Oil & Gas for Beginners
Deutsche Bank AG/London Page 133
The initial product yield can be improved by further processing the oil products using more sophisticated refining units to crack, unify and/or alter the hydrocarbons (see the “How does a refinery work?” section below).
Refinery yields also tend to vary slightly over the year as refiners respond to both the regular seasonal swings in product demand (more heating oil in the winter, more gasoline in the summer) and irregular movements in product prices (the best and most flexible refineries can quickly alter their output to produce the highest priced mix).
Figure 162: Typical Western Europe Product Yield Product Western Europe (%)
Petroleum Gas 3
Naphtha 6
Gasoline 22
Kerosene 6
Gasoil/ Diesel (aka middle distillates) 34
Fuel Oil 20
Others (residuals, lubricants) 9Source: Deutsche Bank
The stream of oil products
The basic building block of the oil and gas sector, hydrocarbons, contain a lot of energy. Fuel products from the refining process take advantage of this attribute. The only difference between each oil product is the length of the carbon chains it contains. As mentioned previously, this determines its physical state (gas. liquid, solid) and also its application. The main refinery outputs can be summarized as follows.
Petroleum gas is the lightest hydrocarbon chain, commonly known by the names methane, ethane, propane and butane. It is a gas at room temperature, easily vaporised and is used for heating, cooking and making plastics. It is often liquefied under pressure to create liquefied petroleum gas (LPG) supplied by pipeline, in filled tanks or in large bottles.
Naphtha is a light, easily vaporised, clear liquid used for further processing into petrochemicals (in western Europe and Asia in particular), as a solvent in dry cleaning fluids, paint solvents and other quick-drying products. It is also an intermediate product that can be further processed to make gasoline.
Gasoline is a motor fuel that vaporises at temperatures below the boiling point of water i.e. it evaporates quickly if spilt on the ground. Gasoline is rated by octane number, an index of quality that reflects the ability of the fuel to resist detonation and burn evenly when subjected to high pressures and temperatures inside an engine. Premature detonation produces “knocking” (backfiring), wastes fuel and may cause engine damage. Previously a form of lead was added to cheaper grades of gasoline to raise the octane rating, but with the environmental crackdown on exhaust emissions, this is no longer permitted. New formulations of gasoline designed to raise the octane number contain increasing amounts of aromatics and oxygen-containing compounds (oxygenates). Cars are now also equipped with catalytic converters that oxidise un-reacted gasoline.
Kerosene is a liquid fuel used for jet engines or as a starting material for making other products.
Gasoil or diesel distillate is a liquid used for automotive diesel fuel and home heating oil, as well as a starting material for making other products.

7 January 2008 Integrated Oils Oil & Gas for Beginners
Page 134 Deutsche Bank AG/London
Lubricating oil is a liquid used to make motor oil, grease and other lubricants. It does not vaporise at room temperature and varies from the very light through various thicknesses of motor oil, gear oils, vaseline and semi-solid greases.
Heavy gas or fuel oil is a liquid fuel used in industry for heat or power generation and as a starting block for making other products. Heavy grades of fuel oil are also used as ‘bunker oil’ to fuel ships. However, because most of the contaminants of oil (sulphur, metals, etc) have very high boiling points they tend to concentrate in the heavy fuel oil. Taken together with a heavy fuel oil’s low hydrogen to carbon ratio, this makes it the most potentially polluting fraction of oil.
Residuals (or resid) are solids such as coke, asphalt, tar and waxes. They are generally the lowest value products in the barrel but can also be used a starting material for making other products.
How does a refinery work?
The function of a refiner is to convert crude oil into finished products required by the market in the most efficient, and therefore profitable, manner. How this is done will vary widely from refinery to refinery, depending upon the location of the site, the configuration of the refinery, crude oil processed and many other factors.
Overall, however, there are four major refining steps taken to separate crude oil into useful substances:
Physical separation through crude distillation
Conversion or upgrading of the basic distillation streams
Product treatment to purify and remove contaminants and pollutants
Product blending to create products that comply with market specifications
Figure 163: The oil refinery crude distillation process – fractionation through blending
Lubricating oil (C20 to C50)
Fuel Oil (C20 to C70)
Distillation
200C
700C
1200C
1700C
2700C
6000C
Gases (C1 to C4)
Naphtha (C5 to C9)
Gasoline (C5 to C10)
Kerosene (C10 to C16)
Diesel (C14 to C20)
Residue (> C70)
Hydrotreating
Reforming
Alkylation
Cracking
Coking
Gases
Light Distillates
Middle Distillates
Heavy Distillates
Conversion Treatment Final ProductsBlending
Lubricating oil (C20 to C50)
Fuel Oil (C20 to C70)
Distillation
200C
700C
1200C
1700C
2700C
6000C
Gases (C1 to C4)
Naphtha (C5 to C9)
Gasoline (C5 to C10)
Kerosene (C10 to C16)
Diesel (C14 to C20)
Residue (> C70)
Hydrotreating
Reforming
Alkylation
Cracking
Coking
Gases
Light Distillates
Middle Distillates
Heavy Distillates
Conversion Treatment Final ProductsBlendingSource: Deutsche Bank
The function of a refiner is to
convert crude oil into
finished products required
by the market in the most
efficient, and therefore
profitable, manner
LPG Petchem Cars Planes Trucks Power Roads & building
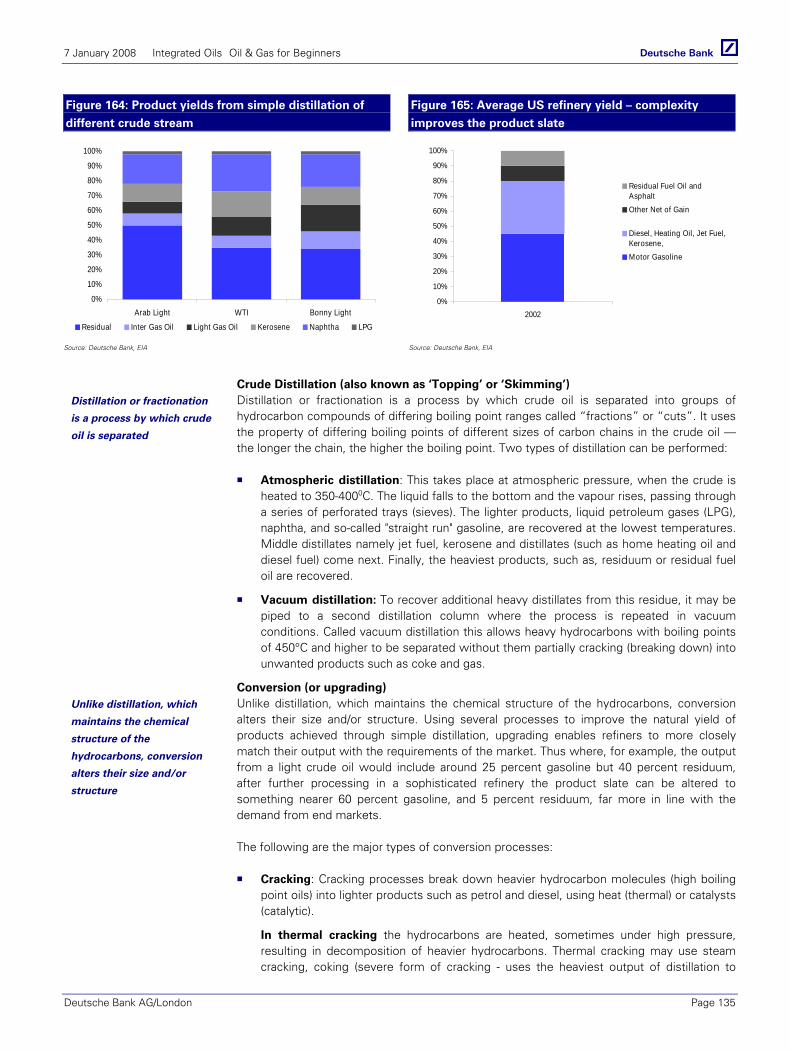
7 January 2008 Integrated Oils Oil & Gas for Beginners
Deutsche Bank AG/London Page 135
Figure 164: Product yields from simple distillation of
different crude stream
Figure 165: Average US refinery yield – complexity
improves the product slate
0%
10%
20%
30%
40%
50%
60%
70%
80%
90%
100%
Arab Light WTI Bonny Light
Residual Inter Gas Oil Light Gas Oil Kerosene Naphtha LPG
0%
10%
20%
30%
40%
50%
60%
70%
80%
90%
100%
2002
Residual Fuel Oil andAsphaltOther Net of Gain
Diesel, Heating Oil, Jet Fuel,Kerosene,Motor Gasoline
Source: Deutsche Bank, EIA Source: Deutsche Bank, EIA
Crude Distillation (also known as ‘Topping’ or ‘Skimming’) Distillation or fractionation is a process by which crude oil is separated into groups of hydrocarbon compounds of differing boiling point ranges called “fractions” or “cuts”. It uses the property of differing boiling points of different sizes of carbon chains in the crude oil — the longer the chain, the higher the boiling point. Two types of distillation can be performed:
Atmospheric distillation: This takes place at atmospheric pressure, when the crude is heated to 350-4000C. The liquid falls to the bottom and the vapour rises, passing through a series of perforated trays (sieves). The lighter products, liquid petroleum gases (LPG), naphtha, and so-called "straight run" gasoline, are recovered at the lowest temperatures. Middle distillates namely jet fuel, kerosene and distillates (such as home heating oil and diesel fuel) come next. Finally, the heaviest products, such as, residuum or residual fuel oil are recovered.
Vacuum distillation: To recover additional heavy distillates from this residue, it may be piped to a second distillation column where the process is repeated in vacuum conditions. Called vacuum distillation this allows heavy hydrocarbons with boiling points of 450°C and higher to be separated without them partially cracking (breaking down) into unwanted products such as coke and gas.
Conversion (or upgrading) Unlike distillation, which maintains the chemical structure of the hydrocarbons, conversion alters their size and/or structure. Using several processes to improve the natural yield of products achieved through simple distillation, upgrading enables refiners to more closely match their output with the requirements of the market. Thus where, for example, the output from a light crude oil would include around 25 percent gasoline but 40 percent residuum, after further processing in a sophisticated refinery the product slate can be altered to something nearer 60 percent gasoline, and 5 percent residuum, far more in line with the demand from end markets.
The following are the major types of conversion processes:
Cracking: Cracking processes break down heavier hydrocarbon molecules (high boiling point oils) into lighter products such as petrol and diesel, using heat (thermal) or catalysts (catalytic).
In thermal cracking the hydrocarbons are heated, sometimes under high pressure, resulting in decomposition of heavier hydrocarbons. Thermal cracking may use steam cracking, coking (severe form of cracking - uses the heaviest output of distillation to
Distillation or fractionation
is a process by which crude
oil is separated
Unlike distillation, which
maintains the chemical
structure of the
hydrocarbons, conversion
alters their size and/or
structure
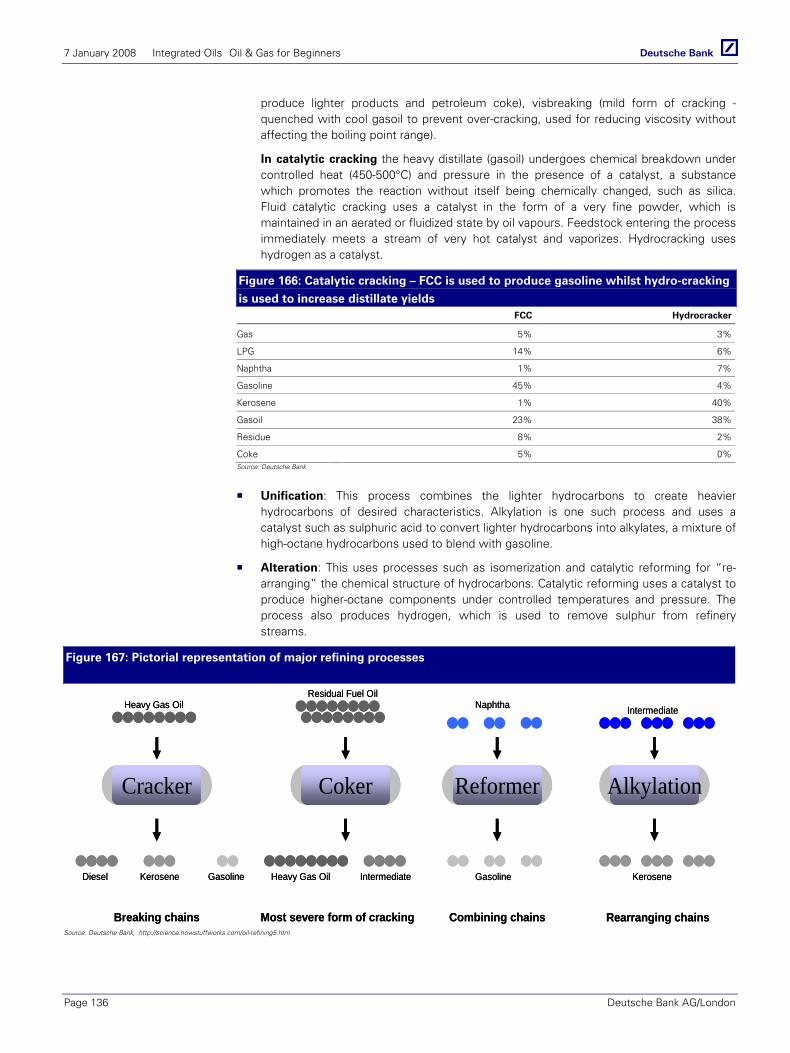
7 January 2008 Integrated Oils Oil & Gas for Beginners
Page 136 Deutsche Bank AG/London
produce lighter products and petroleum coke), visbreaking (mild form of cracking -quenched with cool gasoil to prevent over-cracking, used for reducing viscosity without affecting the boiling point range).
In catalytic cracking the heavy distillate (gasoil) undergoes chemical breakdown under controlled heat (450-500°C) and pressure in the presence of a catalyst, a substance which promotes the reaction without itself being chemically changed, such as silica. Fluid catalytic cracking uses a catalyst in the form of a very fine powder, which is maintained in an aerated or fluidized state by oil vapours. Feedstock entering the process immediately meets a stream of very hot catalyst and vaporizes. Hydrocracking uses hydrogen as a catalyst.
Figure 166: Catalytic cracking – FCC is used to produce gasoline whilst hydro-cracking
is used to increase distillate yields FCC Hydrocracker
Gas 5% 3%
LPG 14% 6%
Naphtha 1% 7%
Gasoline 45% 4%
Kerosene 1% 40%
Gasoil 23% 38%
Residue 8% 2%
Coke 5% 0%Source: Deutsche Bank
Unification: This process combines the lighter hydrocarbons to create heavier hydrocarbons of desired characteristics. Alkylation is one such process and uses a catalyst such as sulphuric acid to convert lighter hydrocarbons into alkylates, a mixture of high-octane hydrocarbons used to blend with gasoline.
Alteration: This uses processes such as isomerization and catalytic reforming for “re-arranging” the chemical structure of hydrocarbons. Catalytic reforming uses a catalyst to produce higher-octane components under controlled temperatures and pressure. The process also produces hydrogen, which is used to remove sulphur from refinery streams.
Figure 167: Pictorial representation of major refining processes
Cracker
Heavy Gas Oil
Diesel Kerosene Gasoline
Coker
Residual Fuel Oil
IntermediateHeavy Gas Oil
Reformer
Naphtha
Gasoline
Alkylation
Intermediate
Kerosene
Breaking chains Most severe form of cracking Combining chains Rearranging chains
Cracker
Heavy Gas Oil
Diesel Kerosene Gasoline
Coker
Residual Fuel Oil
IntermediateHeavy Gas Oil
Reformer
Naphtha
Gasoline
Alkylation
Intermediate
Kerosene
Breaking chains Most severe form of cracking Combining chains Rearranging chainsSource: Deutsche Bank, http://science.howstuffworks.com/oil-refining5.htm
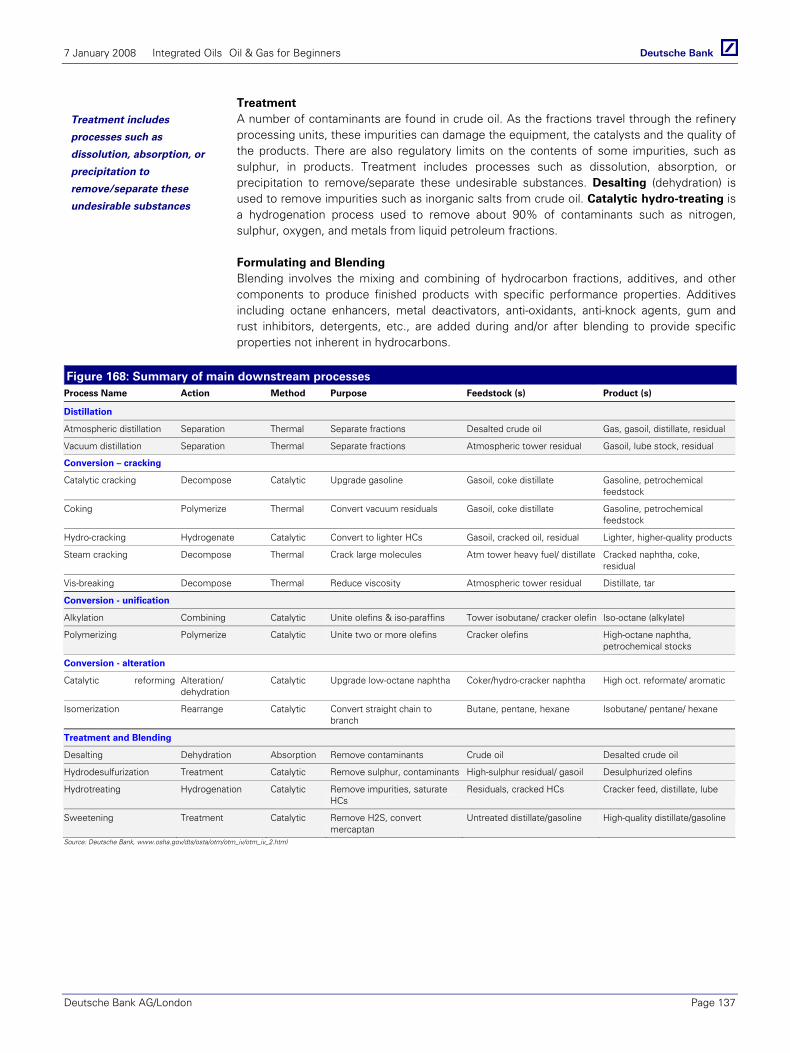
7 January 2008 Integrated Oils Oil & Gas for Beginners
Deutsche Bank AG/London Page 137
Treatment A number of contaminants are found in crude oil. As the fractions travel through the refinery processing units, these impurities can damage the equipment, the catalysts and the quality of the products. There are also regulatory limits on the contents of some impurities, such as sulphur, in products. Treatment includes processes such as dissolution, absorption, or precipitation to remove/separate these undesirable substances. Desalting (dehydration) is used to remove impurities such as inorganic salts from crude oil. Catalytic hydro-treating is a hydrogenation process used to remove about 90% of contaminants such as nitrogen, sulphur, oxygen, and metals from liquid petroleum fractions.
Formulating and Blending Blending involves the mixing and combining of hydrocarbon fractions, additives, and other components to produce finished products with specific performance properties. Additives including octane enhancers, metal deactivators, anti-oxidants, anti-knock agents, gum and rust inhibitors, detergents, etc., are added during and/or after blending to provide specific properties not inherent in hydrocarbons.
Figure 168: Summary of main downstream processes Process Name Action Method Purpose Feedstock (s) Product (s)
Distillation
Atmospheric distillation Separation Thermal Separate fractions Desalted crude oil Gas, gasoil, distillate, residual
Vacuum distillation Separation Thermal Separate fractions Atmospheric tower residual Gasoil, lube stock, residual
Conversion – cracking
Catalytic cracking Decompose Catalytic Upgrade gasoline Gasoil, coke distillate Gasoline, petrochemical feedstock
Coking Polymerize Thermal Convert vacuum residuals Gasoil, coke distillate Gasoline, petrochemical feedstock
Hydro-cracking Hydrogenate Catalytic Convert to lighter HCs Gasoil, cracked oil, residual Lighter, higher-quality products
Steam cracking Decompose Thermal Crack large molecules Atm tower heavy fuel/ distillate Cracked naphtha, coke, residual
Vis-breaking Decompose Thermal Reduce viscosity Atmospheric tower residual Distillate, tar
Conversion - unification
Alkylation Combining Catalytic Unite olefins & iso-paraffins Tower isobutane/ cracker olefin Iso-octane (alkylate)
Polymerizing Polymerize Catalytic Unite two or more olefins Cracker olefins High-octane naphtha, petrochemical stocks
Conversion - alteration
Catalytic reforming
Alteration/ dehydration
Catalytic Upgrade low-octane naphtha Coker/hydro-cracker naphtha High oct. reformate/ aromatic
Isomerization Rearrange Catalytic Convert straight chain to branch
Butane, pentane, hexane Isobutane/ pentane/ hexane
Treatment and Blending
Desalting Dehydration Absorption Remove contaminants Crude oil Desalted crude oil
Hydrodesulfurization Treatment Catalytic Remove sulphur, contaminants High-sulphur residual/ gasoil Desulphurized olefins
Hydrotreating Hydrogenation Catalytic Remove impurities, saturate HCs
Residuals, cracked HCs Cracker feed, distillate, lube
Sweetening Treatment Catalytic Remove H2S, convert mercaptan
Untreated distillate/gasoline High-quality distillate/gasoline
Source: Deutsche Bank, www.osha.gov/dts/osta/otm/otm_iv/otm_iv_2.html
Treatment includes
processes such as
dissolution, absorption, or
precipitation to
remove/separate these
undesirable substances
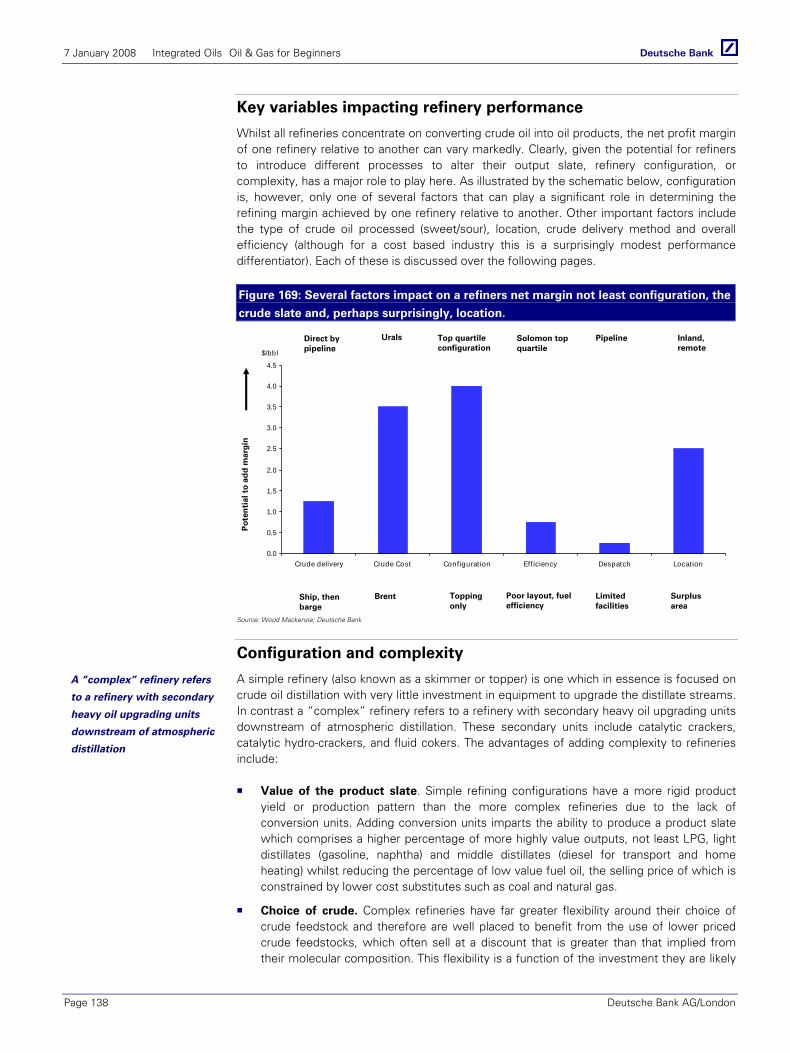
7 January 2008 Integrated Oils Oil & Gas for Beginners
Page 138 Deutsche Bank AG/London
Key variables impacting refinery performance
Whilst all refineries concentrate on converting crude oil into oil products, the net profit margin of one refinery relative to another can vary markedly. Clearly, given the potential for refiners to introduce different processes to alter their output slate, refinery configuration, or complexity, has a major role to play here. As illustrated by the schematic below, configuration is, however, only one of several factors that can play a significant role in determining the refining margin achieved by one refinery relative to another. Other important factors include the type of crude oil processed (sweet/sour), location, crude delivery method and overall efficiency (although for a cost based industry this is a surprisingly modest performance differentiator). Each of these is discussed over the following pages.
Figure 169: Several factors impact on a refiners net margin not least configuration, the
crude slate and, perhaps surprisingly, location.
0.0
0.5
1.0
1.5
2.0
2.5
3.0
3.5
4.0
4.5
Crude delivery Crude Cost Configurat ion Eff iciency Despatch Location
$/bbl
Direct by pipeline
Top quartile configuration
Solomon top quartile
Pipeline Inland, remote
Surplus area
Limited facilities
Poor layout, fuel efficiency
Topping only
BrentShip, then barge
Urals
Po
ten
tial
to
ad
d m
arg
in
Source: Wood Mackenzie; Deutsche Bank
Configuration and complexity
A simple refinery (also known as a skimmer or topper) is one which in essence is focused on crude oil distillation with very little investment in equipment to upgrade the distillate streams. In contrast a “complex” refinery refers to a refinery with secondary heavy oil upgrading units downstream of atmospheric distillation. These secondary units include catalytic crackers, catalytic hydro-crackers, and fluid cokers. The advantages of adding complexity to refineries include:
Value of the product slate. Simple refining configurations have a more rigid product yield or production pattern than the more complex refineries due to the lack of conversion units. Adding conversion units imparts the ability to produce a product slate which comprises a higher percentage of more highly value outputs, not least LPG, light distillates (gasoline, naphtha) and middle distillates (diesel for transport and home heating) whilst reducing the percentage of low value fuel oil, the selling price of which is constrained by lower cost substitutes such as coal and natural gas.
Choice of crude. Complex refineries have far greater flexibility around their choice of crude feedstock and therefore are well placed to benefit from the use of lower priced crude feedstocks, which often sell at a discount that is greater than that implied from their molecular composition. This flexibility is a function of the investment they are likely
A “complex” refinery refers
to a refinery with secondary
heavy oil upgrading units
downstream of atmospheric
distillation
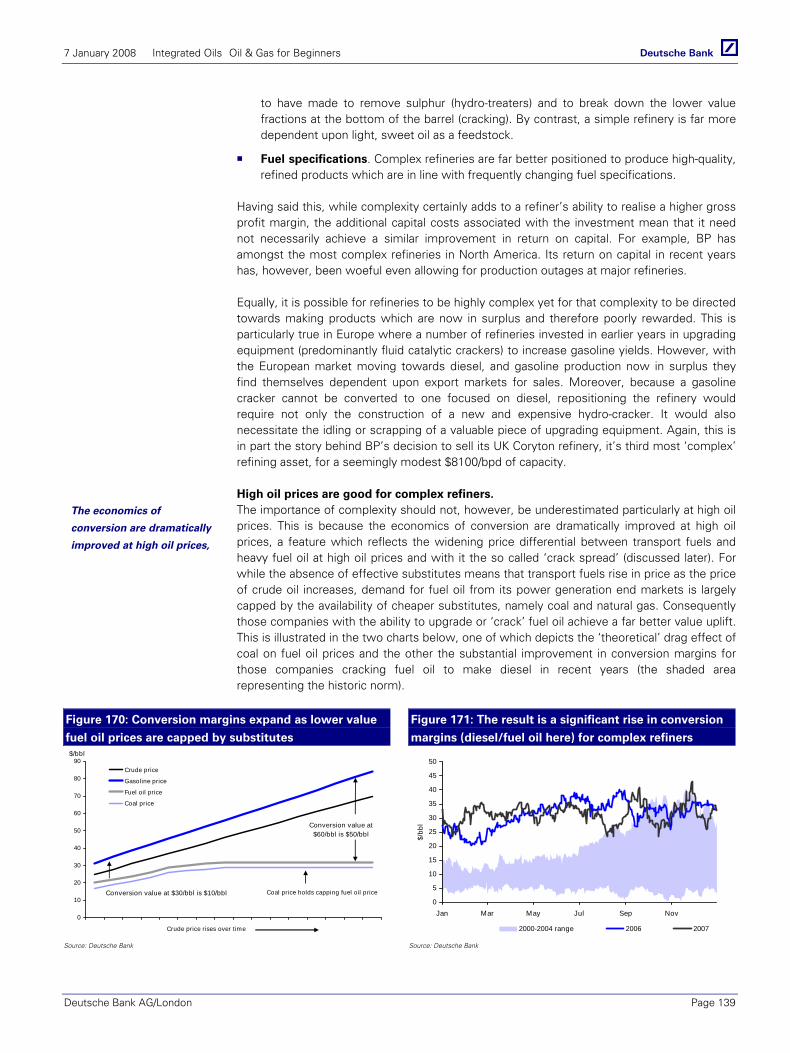
7 January 2008 Integrated Oils Oil & Gas for Beginners
Deutsche Bank AG/London Page 139
to have made to remove sulphur (hydro-treaters) and to break down the lower value fractions at the bottom of the barrel (cracking). By contrast, a simple refinery is far more dependent upon light, sweet oil as a feedstock.
Fuel specifications. Complex refineries are far better positioned to produce high-quality, refined products which are in line with frequently changing fuel specifications.
Having said this, while complexity certainly adds to a refiner’s ability to realise a higher gross profit margin, the additional capital costs associated with the investment mean that it need not necessarily achieve a similar improvement in return on capital. For example, BP has amongst the most complex refineries in North America. Its return on capital in recent years has, however, been woeful even allowing for production outages at major refineries.
Equally, it is possible for refineries to be highly complex yet for that complexity to be directed towards making products which are now in surplus and therefore poorly rewarded. This is particularly true in Europe where a number of refineries invested in earlier years in upgrading equipment (predominantly fluid catalytic crackers) to increase gasoline yields. However, with the European market moving towards diesel, and gasoline production now in surplus they find themselves dependent upon export markets for sales. Moreover, because a gasoline cracker cannot be converted to one focused on diesel, repositioning the refinery would require not only the construction of a new and expensive hydro-cracker. It would also necessitate the idling or scrapping of a valuable piece of upgrading equipment. Again, this is in part the story behind BP’s decision to sell its UK Coryton refinery, it’s third most ‘complex’ refining asset, for a seemingly modest $8100/bpd of capacity.
High oil prices are good for complex refiners. The importance of complexity should not, however, be underestimated particularly at high oil prices. This is because the economics of conversion are dramatically improved at high oil prices, a feature which reflects the widening price differential between transport fuels and heavy fuel oil at high oil prices and with it the so called ‘crack spread’ (discussed later). For while the absence of effective substitutes means that transport fuels rise in price as the price of crude oil increases, demand for fuel oil from its power generation end markets is largely capped by the availability of cheaper substitutes, namely coal and natural gas. Consequently those companies with the ability to upgrade or ‘crack’ fuel oil achieve a far better value uplift. This is illustrated in the two charts below, one of which depicts the ‘theoretical’ drag effect of coal on fuel oil prices and the other the substantial improvement in conversion margins for those companies cracking fuel oil to make diesel in recent years (the shaded area representing the historic norm).
Figure 170: Conversion margins expand as lower value
fuel oil prices are capped by substitutes
Figure 171: The result is a significant rise in conversion
margins (diesel/fuel oil here) for complex refiners
0
10
20
30
40
50
60
70
80
90
1 2 3 4 5 6 7 8 9 10 11 12 13 14 15 16
Crude price
Gasoline price
Fuel oil price
Coal price
$/bbl
Conversion value at $30/bbl is $10/bbl
Conversion value at $60/bbl is $50/bbl
Crude price rises over time
Coal price holds capping fuel oil price
0
5
10
15
20
25
30
35
40
45
50
Jan Mar May Jul Sep Nov
$/bb
l
2000-2004 range 2006 2007
Source: Deutsche Bank Source: Deutsche Bank
The economics of
conversion are dramatically
improved at high oil prices,
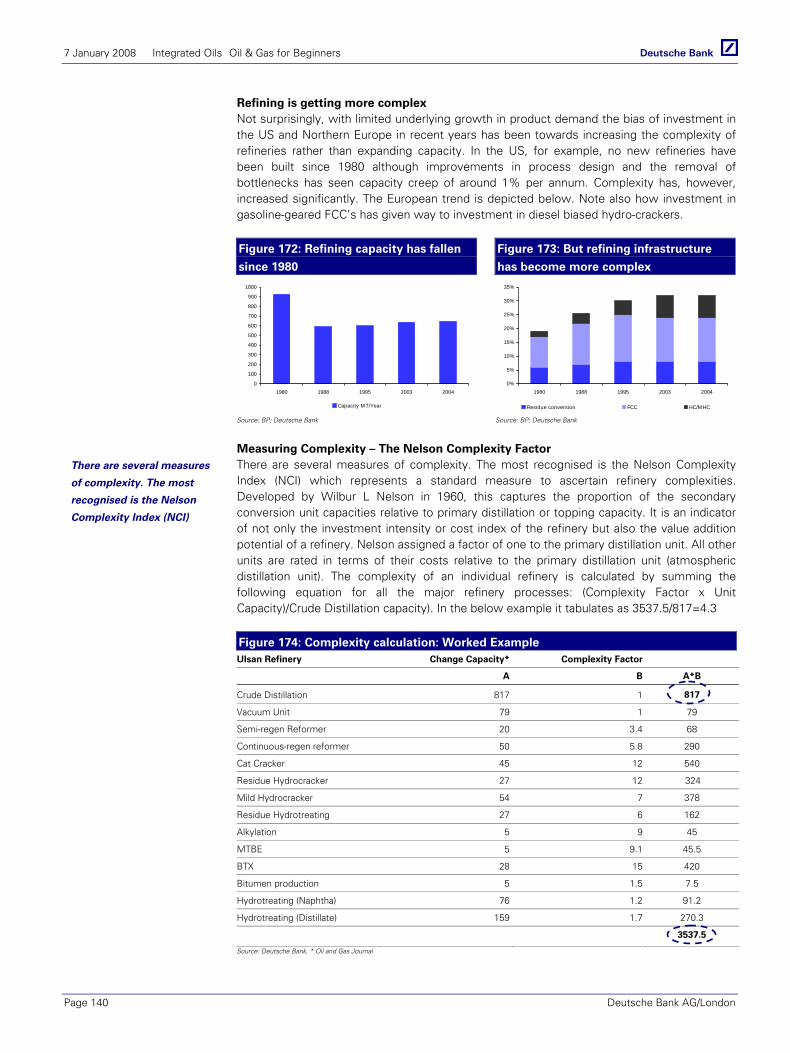
7 January 2008 Integrated Oils Oil & Gas for Beginners
Page 140 Deutsche Bank AG/London
Refining is getting more complex Not surprisingly, with limited underlying growth in product demand the bias of investment in the US and Northern Europe in recent years has been towards increasing the complexity of refineries rather than expanding capacity. In the US, for example, no new refineries have been built since 1980 although improvements in process design and the removal of bottlenecks has seen capacity creep of around 1% per annum. Complexity has, however, increased significantly. The European trend is depicted below. Note also how investment in gasoline-geared FCC’s has given way to investment in diesel biased hydro-crackers.
Figure 172: Refining capacity has fallen
since 1980
Figure 173: But refining infrastructure
has become more complex
0
100
200
300
400
500
600
700
800
900
1000
1980 1988 1995 2003 2004
Capacity MT/Year
0%
5%
10%
15%
20%
25%
30%
35%
1980 1988 1995 2003 2004
Residue conversion FCC HC/MHC
Source: BP; Deutsche Bank Source: BP; Deutsche Bank
Measuring Complexity – The Nelson Complexity Factor There are several measures of complexity. The most recognised is the Nelson Complexity Index (NCI) which represents a standard measure to ascertain refinery complexities. Developed by Wilbur L Nelson in 1960, this captures the proportion of the secondary conversion unit capacities relative to primary distillation or topping capacity. It is an indicator of not only the investment intensity or cost index of the refinery but also the value addition potential of a refinery. Nelson assigned a factor of one to the primary distillation unit. All other units are rated in terms of their costs relative to the primary distillation unit (atmospheric distillation unit). The complexity of an individual refinery is calculated by summing the following equation for all the major refinery processes: (Complexity Factor x Unit Capacity)/Crude Distillation capacity). In the below example it tabulates as 3537.5/817=4.3
Figure 174: Complexity calculation: Worked Example Ulsan Refinery Change Capacity* Complexity Factor
A B A*B
Crude Distillation 817 1 817
Vacuum Unit 79 1 79
Semi-regen Reformer 20 3.4 68
Continuous-regen reformer 50 5.8 290
Cat Cracker 45 12 540
Residue Hydrocracker 27 12 324
Mild Hydrocracker 54 7 378
Residue Hydrotreating 27 6 162
Alkylation 5 9 45
MTBE 5 9.1 45.5
BTX 28 15 420
Bitumen production 5 1.5 7.5
Hydrotreating (Naphtha) 76 1.2 91.2
Hydrotreating (Distillate) 159 1.7 270.3
3537.5
Source: Deutsche Bank, * Oil and Gas Journal
There are several measures
of complexity. The most
recognised is the Nelson
Complexity Index (NCI)

7 January 2008 Integrated Oils Oil & Gas for Beginners
Deutsche Bank AG/London Page 141
The NCI typically varies from about two for hydro-skimming refineries, to about five for cracking refineries, and over nine for coking refineries. A related term to NCI is EDC or Equivalent Distillation Capacity. The calculation of EDC is a two-step process. The first step is the multiplication of the capacity of each unit in the refinery with the Nelson's complexity factor and the second is the sum of these products to arrive at the EDC for the refinery in total.
Figure 175: Typical Western Europe Product Yields: Simple vs. Complex Product Simple Refinery Complex Refinery
Liquid Petroleum Gas 4% 6%
Naphtha 10% 10%
Gasoline 14% 26%
Kerosene 17% 16%
Gasoil/ Diesel (aka middle distillates) 20% 23%
Fuel Oil 35% 19%Source: Deutsche Bank
Choice of Crude – Heavy, sour, sweet and light
We have already discussed the different properties of various crude oils emphasizing that the two key differences are:
whether a crude is heavy or light, with light crude oils containing a greater proportion of more valuable, shorter chain, hydrocarbons such as gasoline and naphtha; and
whether a crude is sweet or sour, indicating the degree of sulphur evident in the crude, with sweet crude oils containing less sulphur and thus requiring less processing equipment and cost to extract the sulphur in order to meet product specifications.
Crude oil prices reflect the different refining value of the distillate slate Crude oil pricing reflects these differences with light sweet crudes such as Brent or WTI trading at a significant price premium to heavy, sour blends such as Russian Urals or Mexican Maya. Theoretically the difference in price should be reflective of the different value of the product slate produced by the simple distillation of each. In other words, if the value of the product slate obtained from the crude distillation of Brent is $4/bbl higher than that from the distillation of Urals, it would seem reasonable to expect Urals to trade at a $4/bbl discount.
In tight markets a processing premium can emerge This is broadly what happens in practice. However, because the refining system is heavily geared towards the processing of a lighter, sweeter barrel, at times when product demand is high or light crude supply is constrained, those refiners who are unable to process heavier or more sour crudes will find themselves having to compete for the available light barrels. The result is that the discount between the price of heavy and light crude oils expands to reflect the scarcity of the light barrel, moving to levels which reflect more than the simple difference between the two crude’s underlying components and processing costs.
Put simply, the refiner capable of processing a heavy crude oil will find that it is effectively receiving a ‘profit’ premium for its ability to do so.
This phenomena is well illustrated by the below chart. This depicts both the different value of the product slate emerging from processing a barrel of Urals crude oil relative to Brent and the actual price discount at which Urals trades relative to Brent. As explained earlier, in a perfect market, one would expect the price discount of Urals to reflect purely the underlying difference in value of its product stream. This was the case through much of the late 1990s and the start of this decade. However, more recently the discount has expanded with Brent trading at a premium to Urals that is more than justified by its higher value product yield.

7 January 2008 Integrated Oils Oil & Gas for Beginners
Page 142 Deutsche Bank AG/London
Figure 176: The theoretical discount at which Urals should trade to Brent based on the
refining value of the product slate compared with the actual price discount
-10
-8
-6
-4
-2
0
Jan
97
Jul 9
7
Jan
98
Jul 9
8
Jan
99
Jul 9
9
Jan
00
Jul 0
0
Jan
01
Jul 0
1
Jan
02
Jul 0
2
Jan
03
Jul 0
3
Jan
04
Jul 0
4
Jan
05
Jul 0
5
Jan
06
Jul 0
6
Jan
07
Jul 0
7
Refining Value Price Discount
US
$ di
scou
nt re
lativ
e to
Bre
nt
Source: Deutsche Bank
In a heavier world this premium is likely to occur more frequently For refiners who are capable of processing the heavier, sourer barrel this price premium clearly represents a profit opportunity. Moreover, in a world in which the supply of crude oil is becoming tighter and the barrel of crude oil heavier, this premium is likely to emerge more frequently placing a greater value premium on refineries capable of processing heavy, sour blends. In particular, given that the marginal OPEC barrel is heavy, at times when OPEC is producing towards capacity the heavy-light spread is likely to broaden (and vice versa). In large part this is reflected by the Saudi’s decision to build to new high conversion facilities in Saudi Arabia at Jubail (one with COP the other Total) as it seeks to add value to the heavy oil arising from new fields such as Manifa and Safinayah.
Figure 177: OPEC production has had a clear influence on the heavy light spread – the
marginal OPEC barrel is a HEAVY barrel
-3
-2
-1
0
1
2
3
1996
1997
1998
1999
2000
2001
2002
2003
2004
2005
2006
2007
FMbd
0
1
2
3
4
5
6$/bbl
Incremental OPEC supply Light Heavy Differential
Increase in heavy OPEC supply widens
differential
OPEC quota cuts largely
heavy blends
Source: Wood Mackenzie
7 January 2008 Integrated Oils Oil & Gas for Beginners
Deutsche Bank AG/London Page 143
An ability to process heavy oil adds flexibility and value Away from the actual benefits to refiners of being able to gain from the heavy-light spread, refiners capable of running heavy blends also gain from the greater flexibility of their system to use a far wider range of crude oils for processing. This leaves them in a far better position to benefit from temporary differences that may emerge between the price of different crude oils in the marketplace or to buy the occasional distress cargo at a discount price.
Warning: Complexity and processing heavy oil need not be the same As a final point, it is often assumed that complexity and the ability to run a heavy, sour crude are the same thing. It is, however, important to emphasise that they are not. Complexity is about investment in a wide range of processes to upgrade distillate, some of which may be associated with desulphurization or upgrading low value fuel oil. There are, however, plenty of complex refineries which are unable to process a heavy, sour barrel. Equally, it should be appreciated that the higher profitability of a complex refiner is not necessarily a function of its ability to buy lower priced crudes. As we have shown, much of the time the heavy light discount is purely a function of the difference in the refining value of the two crude streams. What is, however, key to profitability is the ability to convert lower value products to those of a higher value and so to gain from the conversion premium.
Location
Away from configuration and crude supply, location is probably the third most important determinant of a refinery’s ability to capture profit. Location, and with it likely competition, affects crude freight costs, product despatch costs, product price realisations as well as labour and environmental legislation compliance costs.
The basic technical division lies between coastal and inland plants. Coastal plants will often have low crude supply costs and will be able to access export markets cheaply. However, inland refiners may be closer to areas of high demand (important given that product distribution costs are generally higher than the carriage of crude) and may be specifically configured to relatively isolated markets. To the extent that they dominate a local market or are sole supplier to a local market, reduced competition means that they can be very well placed to capture a significantly higher margin.
Other factors
Away from the above, other factors that are important determinants of refinery profitability include:
Plant reliability and efficiency. Given the relatively high fixed costs associated with running a refinery, reducing unscheduled downtime is a very important determinant of profitability. This is particularly the case for high added value, high cost units such as crackers. Efficiency is reflected in a range of parameters such as scale economies or the physical layout of the refinery. In general, refineries nowadays will be shut for a major maintenance overhaul once every 5 years with the timing of that shutdown generally planned to take place during periods when the relevant market is particularly slow (late summer, early autumn is frequently chosen being the end of the driving season but ahead of the impending winter build in fuel oil). However, unplanned maintenance shutdowns can be very expensive given the refinery is likely to face a total loss of contribution through the entirety of the closure.
Crude delivery. Largely dependent upon location, the source of fuel delivery to a refinery can make a meaningful difference to the effective price paid by the refinery for each barrel of crude that it receives. In general, plants located near an export port or within access of a main oil pipeline will have delivery costs per barrel which are lower than that for a refinery which is supplied by road tanker or rail. As an example, OMV recently indicated that by connecting its Schwechat refinery to the Druzbha Russian pipeline it could reduce its fuel costs by as much as $1.50-2.00/bbl of delivered crude.
Location is probably the
third most important
determinant of a refinery’s
ability to capture profit
7 January 2008 Integrated Oils Oil & Gas for Beginners
Page 144 Deutsche Bank AG/London
Speciality product capacity: Refinery speciality products such as lube base oil, aromatics, solvents and anode grade coke often offer higher margins than bulk fuels. Manufacturing margins for these products often contribute significantly to downstream results. For example, the high margins achieved by Conoco’s UK Killingholme refinery on anode coke probably make it one of the most profitable refineries in Europe. High margins can often also be obtained on other speciality products, but the small volumes involved limit the impact on the bottom line.
Petrochemical integration. Refineries forming part of a larger petrochemical complex have greater flexibility in optimising the use of many of the intermediate product streams as well as benefiting from lower transfer costs and shared operating costs. Depending on transfer pricing between the refinery and petrochemical complex, this integration can add significantly to the refining margin. TOTAL’s Antwerp refinery is an example of a fully integrated petrochemical refinery.
Operating costs. Costs are chiefly dependent on fuel usage, labour costs, efficiency, economies of scale and the degree of investment in automation. Manpower per unit of capacity is a key benchmark since labour costs are a large element of operating costs. However, as the price of crude oil has risen in recent years one of the most significant components of costs has been that of fuel. In general, refineries use some 5-7% of their feedstock as fuel to run the refinery. Energy efficiency has consequently become a far more important component of costs and initiatives designed to improve fuel savings have delivered much greater payback than may have been the case but three years ago.
In general, refineries use
some 5-7% of their
feedstock as fuel to run the
refinery.
7 January 2008 Integrated Oils Oil & Gas for Beginners
Deutsche Bank AG/London Page 145
Regional balances and market structure
Through investment in conversion units, refiners are able to go a long way towards meeting the underlying market demands for the different product streams arising from the crude oil barrel. Invariably, however, the molecular composition of the crude barrel means that it is not economically possible to perfectly match the output from the refinery with the demands of the local regional market. As a consequence, within regional refining markets product imbalances are frequently evident.
Importantly, these product imbalances together with regulatory restrictions and fuel specifications also have an important role to play in refining profitability. To the extent that a local market is short a particular product, refiners will be able to charge a premium for that product – the premium being largely equal to the transport cost for an external source of supply. Similarly, where a product is long the refiner may reduce price to try and encourage sales or incur a transport cost to export. In aggregate, however, whilst refining markets may be tight regionally, product flows ensure that tightness in any one regional market tends not to be sustained. In other words, looked at globally, today’s refining market is not short of supply.
US balances suggest that it will continue to deliver above global-average margins The charts overleaf depict Wood Mackenzie’s estimates of current product balances across four major regional markets and how they are expected to move over the course of the next decade. The charts serve to emphasise that, where the US market is now short across almost every major product group, significant surpluses exist in other regional markets with Europe, for example proving an important supplier of both gasoline to the US but also fuel oil to Asia. Several simple observations can be made.
The US market is now tight across most major product categories, in particular gasoline and therefore import dependent. Given that the US authorities are unlikely to sanction the build of a new grass roots refinery in the US market for environmental reasons, capacity growth is likely to be modest (c1% p.a.) depending essentially on companies’ ability to de-bottleneck plant (so called capacity creep). As such, in the absence of a major deterioration in demand US refining margins can sensibly be expected to be higher on average than those in other regional markets.
The European market is significantly long of both gasoline and fuel oil and is thus export dependent. Given its maturity, demand growth is likely to prove modest and these imbalances more likely to increase than subside. Overall, European margins thus tend to be lower than those in the US – something that is unlikely to change. Europe’s export bias also clearly means that its health is dependent upon continued good demand in other regional markets.
Although modestly long gasoline, Asia is currently a significant net importer of oil products particularly of fuel oil much of which is supplied from Europe. It is also the fastest growing of the three main regions and expected to see an increasing deficit in naphtha (petrochemicals), fuel oil (space heating) and, in time, diesel.
Capacity utilization by region This difference in product balances is also well reflected by refinery utilization rates across the different regional centres. Again, these emphasise that rates have been more robust in US and Asian markets. Europe has staged a recovery, not least as excess capacity in Eastern European markets has been reduced. However, the European improvement has undoubtedly also reflected the need of the other two main regional markets for oil products such as gasoline and fuel oil.
Within regional refining
markets product imbalances
are frequently evident.

7 January 2008 Integrated Oils Oil & Gas for Beginners
Page 146 Deutsche Bank AG/London
Figure 178: US – Future product balances (Mt)
Figure 179: North West Europe – Future product
balances (Mt)
-40
-35
-30
-25
-20
-15
-10
-5
0Naphtha Gasoline Kerosene Gas/diesel Fuel Oil
2002 2005 2010 2015
-30
-20
-10
0
10
20
30
40
50
60
Naphtha Gasoline Kerosene Gas/diesel Fuel Oil
2002 2005 2010 2015
Source: Wood Mackenzie Source: Wood Mackenzie
Figure 180: Total Asia – Future product balances (Mt)
Figure 181: China – Future product balances (Mt)
-100
-80
-60
-40
-20
0
20
40
Naphtha Gasoline Kerosene Gas/diesel Fuel Oil
2002 2005 2010 2015
-100
-80
-60
-40
-20
0
20
40
Naphtha Gasoline Kerosene Gas/diesel Fuel Oil
2002 2005 2010 2015
Source: Wood Mackenzie Source: Wood Mackenzie
Figure 182: Regional capacity utilization rates 1996-2006 (%)
75.0%
77.0%
79.0%
81.0%
83.0%
85.0%
87.0%
89.0%
91.0%
93.0%
95.0%
1996 1997 1998 1999 2000 2001 2002 2003 2004 2005 2006
USA USA ex Hurricane Europe Asia Pacific
Util
isat
ion
(%)
Source: Deutsche Bank
7 January 2008 Integrated Oils Oil & Gas for Beginners
Deutsche Bank AG/London Page 147
Measuring Refining Profitability
Just as the stock market looks to the daily oil price as an indicator of upstream profitability, so it focuses on ‘refining margins’ as a guide to the health of downstream returns. These volatile margins are merely the subtraction of the daily crude price from a basket of oil products. They represent only the additional revenue that can be generated from turning a barrel of crude into something useful – not the costs, or therefore, the profit, of doing so.
Given crude oil and oil product prices are readily visible in most of the major regions of the world, it is possible to calculate the gross refining profit or margin that a refiner is likely to be achieving at any moment in time. Indeed, several newswires (e.g. Reuters) and oil agencies (e.g. Platts) publish daily or weekly gross margins for the major regional refining centres, namely the US Gulf Coast, North West Europe (or Amsterdam, Rotterdam, Antwerp aka ARA) and Singapore. Called ‘indicator’ margins or ‘crack spreads’ these depict the gross margin per barrel that a regional refiner operating with either a simple or complex refinery configuration typical of that area and running a single crude widely processed in the region is likely to be achieving.
Because all refineries are different these published margins are, as their name suggests, no more than an indicator. They do, however, afford a strong view of refining profitability at any one time and the trend in margins (up or down).
Calculating crack spreads In calculating these indicator margins or crack spreads, simple assumptions are made about the output of the local refinery. Thus, for example, the most commonly quoted Gulf Coast 3-2-1 crack spread assumes that for every three barrels of oil, two barrels of gasoline and one of fuel oil are produced (or one barrel of crude gives 0.67 barrels of gasoline and 0.33 barrels of fuel oil). From this it is easy to calculate the gross refining margin.
Consider the following. The price of crude oil per barrel is $71 whilst the price of gasoline is $1.95/gallon and that of heating oil $1.65/gallon. Given that there are 42 gallons in a barrel the crack spread calculates at $6.74/bbl as illustrated by the below calculation.
0.67 x one barrel of gasoline + 0.33 x one barrel of fuel oil – one barrel of crude oil
or
[(0.67*1.95*42) + (0.33*1.65*42)] - $71.00 = ($54.87 + $22.87) - $71.00 = $6.74
Other spread ratios can be used to reflect the refining complexity of the refinery or region. For example, where light crude is refined and there is a higher demand for heating oil the appropriate ratio may be 2-1-1. Similarly a refinery that yields significant amounts of residue might be 6-3-2-1 (gasoline, distillate and residue).
Product cracks Beyond indicator margins or cracks, one can also look at product cracks. These give a strong view of the value of conversion. Most common here are gasoline and diesel fuel oil cracks which depict the value uplift of converting a barrel of heating oil to more highly valued gasoline or diesel.
The following charts depict complex and simple gross refining margins in the three main refining centres over the course of the past several years together with gasoline/fuel oil crack spreads in the US and Europe.
‘Crack spreads’ depict the
gross margin per barrel
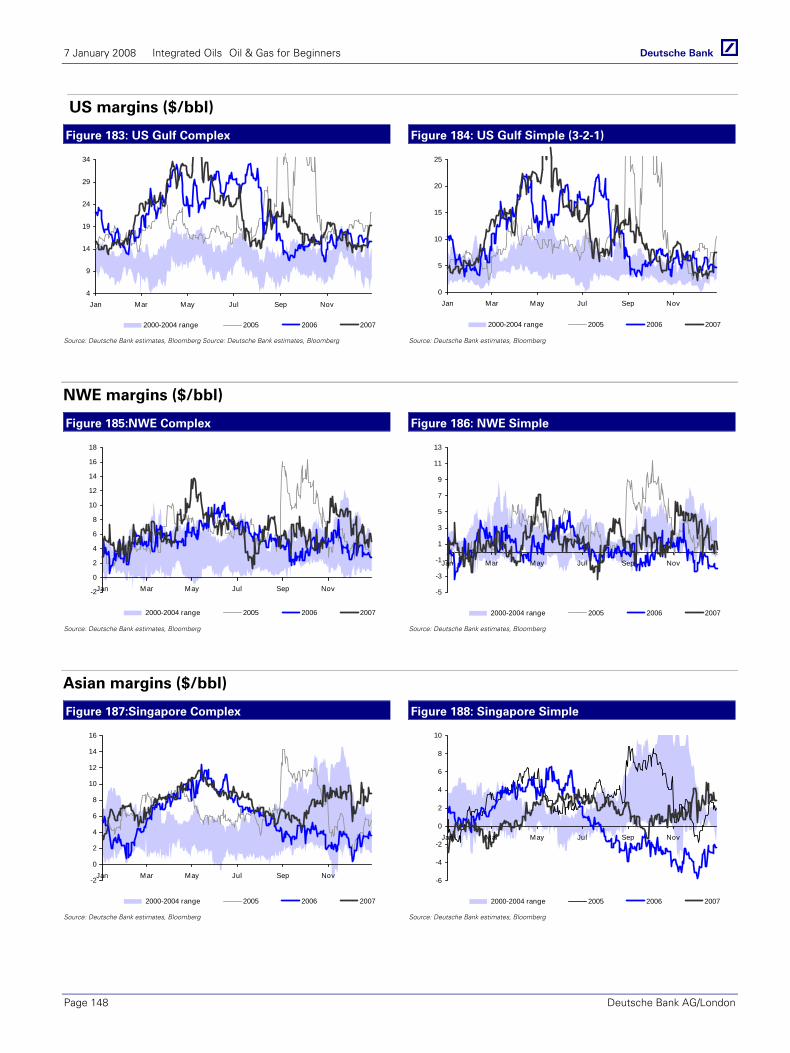
7 January 2008 Integrated Oils Oil & Gas for Beginners
Page 148 Deutsche Bank AG/London
US margins ($/bbl)
Figure 183: US Gulf Complex Figure 184: US Gulf Simple (3-2-1)
4
9
14
19
24
29
34
Jan Mar May Jul Sep Nov
2000-2004 range 2005 2006 2007
0
5
10
15
20
25
Jan Mar May Jul Sep Nov
2000-2004 range 2005 2006 2007
Source: Deutsche Bank estimates, Bloomberg Source: Deutsche Bank estimates, Bloomberg Source: Deutsche Bank estimates, Bloomberg
NWE margins ($/bbl)
Figure 185:NWE Complex Figure 186: NWE Simple
-2
0
2
4
6
8
10
12
14
16
18
Jan Mar May Jul Sep Nov
2000-2004 range 2005 2006 2007
-5
-3
-1
1
3
5
7
9
11
13
Jan Mar May Jul Sep Nov
2000-2004 range 2005 2006 2007
Source: Deutsche Bank estimates, Bloomberg Source: Deutsche Bank estimates, Bloomberg
Asian margins ($/bbl)
Figure 187:Singapore Complex Figure 188: Singapore Simple
-2
0
2
4
6
8
10
12
14
16
Jan Mar May Jul Sep Nov
2000-2004 range 2005 2006 2007
-6
-4
-2
0
2
4
6
8
10
Jan Mar May Jul Sep Nov
2000-2004 range 2005 2006 2007
Source: Deutsche Bank estimates, Bloomberg Source: Deutsche Bank estimates, Bloomberg
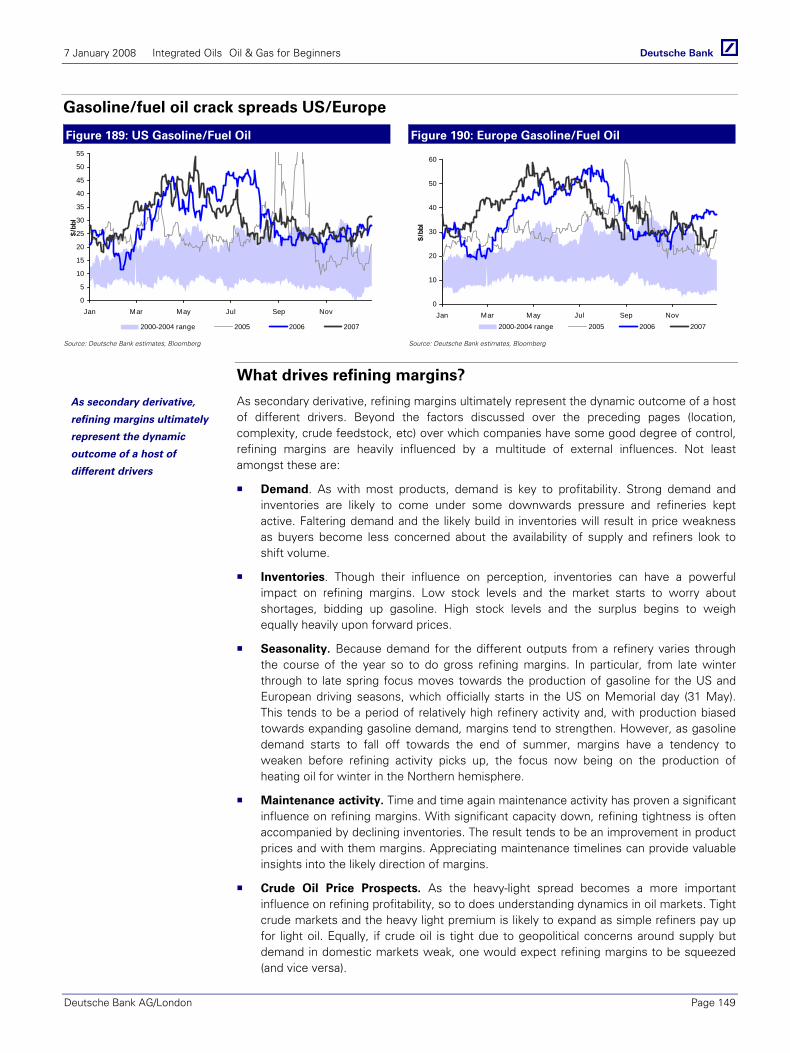
7 January 2008 Integrated Oils Oil & Gas for Beginners
Deutsche Bank AG/London Page 149
Gasoline/fuel oil crack spreads US/Europe
Figure 189: US Gasoline/Fuel Oil Figure 190: Europe Gasoline/Fuel Oil
0
5
10
15
20
25
30
35
40
45
50
55
Jan Mar May Jul Sep Nov
$/bb
l
2000-2004 range 2005 2006 2007
0
10
20
30
40
50
60
Jan Mar May Jul Sep Nov
$/bb
l
2000-2004 range 2005 2006 2007
Source: Deutsche Bank estimates, Bloomberg Source: Deutsche Bank estimates, Bloomberg
What drives refining margins?
As secondary derivative, refining margins ultimately represent the dynamic outcome of a host of different drivers. Beyond the factors discussed over the preceding pages (location, complexity, crude feedstock, etc) over which companies have some good degree of control, refining margins are heavily influenced by a multitude of external influences. Not least amongst these are:
Demand. As with most products, demand is key to profitability. Strong demand and inventories are likely to come under some downwards pressure and refineries kept active. Faltering demand and the likely build in inventories will result in price weakness as buyers become less concerned about the availability of supply and refiners look to shift volume.
Inventories. Though their influence on perception, inventories can have a powerful impact on refining margins. Low stock levels and the market starts to worry about shortages, bidding up gasoline. High stock levels and the surplus begins to weigh equally heavily upon forward prices.
Seasonality. Because demand for the different outputs from a refinery varies through the course of the year so to do gross refining margins. In particular, from late winter through to late spring focus moves towards the production of gasoline for the US and European driving seasons, which officially starts in the US on Memorial day (31 May). This tends to be a period of relatively high refinery activity and, with production biased towards expanding gasoline demand, margins tend to strengthen. However, as gasoline demand starts to fall off towards the end of summer, margins have a tendency to weaken before refining activity picks up, the focus now being on the production of heating oil for winter in the Northern hemisphere.
Maintenance activity. Time and time again maintenance activity has proven a significant influence on refining margins. With significant capacity down, refining tightness is often accompanied by declining inventories. The result tends to be an improvement in product prices and with them margins. Appreciating maintenance timelines can provide valuable insights into the likely direction of margins.
Crude Oil Price Prospects. As the heavy-light spread becomes a more important influence on refining profitability, so to does understanding dynamics in oil markets. Tight crude markets and the heavy light premium is likely to expand as simple refiners pay up for light oil. Equally, if crude oil is tight due to geopolitical concerns around supply but demand in domestic markets weak, one would expect refining margins to be squeezed (and vice versa).
As secondary derivative,
refining margins ultimately
represent the dynamic
outcome of a host of
different drivers

7 January 2008 Integrated Oils Oil & Gas for Beginners
Page 150 Deutsche Bank AG/London
Gasoline differential US/Europe: As an import dependent gasoline market, the scope for arbitrage opportunities from Europe to the US can impact gasoline prices and with them refining margins on both continents. For example, tight US markets tend to pull in product from overseas, so placing pressure on US prices but improving the supply demand balance and pricing in Europe. Weak US prices and the opportunities for exports and price arbitrage fall away, with surplus European gasoline placing added pressure on European gasoline prices and refining margins.
Specification and regulation: To the extent that specification changes can place a temporary restriction on production as refiners struggle to produce on-spec product or distribute it, specification changes can impact refining margins meaningfully. This was particularly evident in the US market in mid-2006 as changes in the specifications for diesel and the removal of MTBE as an oxidant in gasoline impacted supply.
Inter-fuel substitution: This is of particular relevance to fuel oil pricing. Given that fuel oil competes in power markets with gas and coal, the price which the market is willing to bear will depend heavily on that of its alternatives. Falling coal or gas prices and fuel oil prices are likely to deteriorate taking down the margins of simple refineries in particular.
Weather:: Unpredictable as it is, the weather and weather forecasts can play a huge role in the level of refining margins. Key here are perceptions of what the demand and/or supply consequences of periods of extreme weather might be. For example, after the events of 2004 and 2005 when hurricanes resulted in the closure of significant US refining capacity, the fear of hurricanes in the US plays an important part in market psychology through the summer months. Similarly, forecasts of a cold winter will help heating oil prices in the run-up to winter whilst forecasts for a mild winter will tend to undermine them.

7 January 2008 Integrated Oils Oil & Gas for Beginners
Deutsche Bank AG/London Page 151
Refining Industry Structure
The global refining industry continues to be dominated by the integrated oil majors with companies such as Exxon, ConocoPhillips, Shell, BP and Total retaining very substantial distillation capacity (broadly 25% of total supply). However, as these companies have sought to bring their refining exposure more in line with their marketing position in regional markets and reduce overall exposure to refining in mature western markets, so a significant number of sizeable independents have emerged.
Shifting to the independents This has been most evident in the United States where companies, not least Valero, have built strong and broadly spread portfolios of assets through selective acquisition over a number of years. Indeed, within the US market the independents now account for comfortably over half of national crude distillation capacity. Similarly, within Europe a significant independent refining sector now exists although many of the existing companies tend to have relatively modest refining capacity available to them. Several are also focused on emerging markets, not least PKN, MOL and OMV.
Looking forwards, we would expect the western integrated majors to continue to downsize their refining portfolios through the sale of non-strategic assets on a piecemeal basis. This is likely to prove especially true within mature European markets where excess capacity combined with an outlook of static to falling demand mean investment is likely to be focused and very disciplined. This has seen each of the major Europeans (BP, Shell, Total) divest individual refineries in the recent past, in part as they look to upgrade the assets within their portfolios but do so without investing significant excess capital in refining in aggregate.
Asia and the Middle East will gain share Longer run, with oil demand in much of the OECD essentially static, greenfield investment in new capacity is likely to centre on those markets which offer volume growth (essentially Asia) or which are advantaged by virtue of access to raw materials (essentially the Middle East). Little surprise then that it is in these markets that many of the planned capacity increases are anticipated over the next five or so years as companies seek to both meet the needs of the local market but also benefit from the growth on offer.
Petroleum Administration for Defence Districts (PADDS)
The United States is divided into five Petroleum Administration for Defense Districts, or PADDs. These were created in 1942 during World War II under the Petroleum Administration for War to help organize the allocation of fuels derived from petroleum products, including gasoline and diesel (or "distillate") fuel. Although the Administration was abolished in 1946 these regions are still used today for data collection purposes. The five PAD Districts are:
PADD I (East Coast) is composed of the following three sub-districts A (New England); B (Central Atlantic); and C (Lower Atlantic).
PADD II (Midwest): Illinois, Indiana, Iowa, Kansas, Kentucky, Michigan, Minnesota, Missouri, Nebraska, North Dakota, South Dakota, Ohio, Oklahoma, Tennessee, and Wisconsin.
PADD III (Gulf Coast): Alabama, Arkansas, Louisiana, Mississippi, and New Mexico, and Texas.
PADD IV (Rocky Mountain): Colorado, Idaho, Montana, Utah, and Wyoming.
PADD V (West Coast): Alaska, Arizona, California, Hawaii, Nevada, Oregon, and Washington
The global refining industry
continues to be dominated
by the integrated oil majors

7 January 2008 Integrated Oils Oil & Gas for Beginners
Page 152 Deutsche Bank AG/London
Figure 191: Global refining capacity by region 2006
(kb/d
Figure 192: Share of refining capacity in mature markets
integrated and independent (%)
1968017455
16361
7126 7029 66805491
3336 4080
0
5000
10000
15000
20000
25000
Europe exFS
U
US
A
Asia ex
China
Middle East
China
LatAm
FSU
Africa
Other
kb/d
51%43%
57%49%
0%
10%
20%
30%
40%
50%
60%
70%
80%
90%
100%
Europe ex FSU US
Integrated Independent
Source: BP Statistical Review; Deutsche Bank Source: Deutsche Bank
Figure 193: Major US refiners – CDU capacity (bpd)
Figure 194: Major European refiners – CDU capacity
(bpd)
22292114
1960
1475
1012 994 974848
666 646
0
500
1000
1500
2000
2500
Conoco
Valero
Exxon
BP
Chevron
Sunoco
Marathon
RD
S
Tesoro
Citgo
kb/d 2332
1828 1823
922740 701 635 613
380 334 320
0
500
1000
1500
2000
2500
Total
Exxon
RD
S
BP
Repsol
ENI
Conoco
Tupras
OM
V
Chevron
Statoil
kb/d
Source: Deutsche Bank Source: Deutsche Bank
Figure 195: Major US refiners – CDU capacity by PADD
(kb/d)
Figure 196: Major refiners – CDU capacity globally by
region (bpd)
0
500
1,000
1,500
2,000
2,500C
onoco
Valero
Exxon
BP
Chevron
Sunoco
Marathon
RD
S
Tesoro
Total
PADD I PADD II PADD III
PADD IV PADD V
kb/d
0
1000
2000
3000
4000
5000
6000
7000
Exxon
RD
S
Sinopec
Conoco
BP
Total
Petrochina
Valero
Chevron
Repsol
US Europe
Asia Africa
RoW
kb/d
6385
3942
31252796
1234
22212118256426902922
Source: Deutsche Bank Source: Deutsche Bank
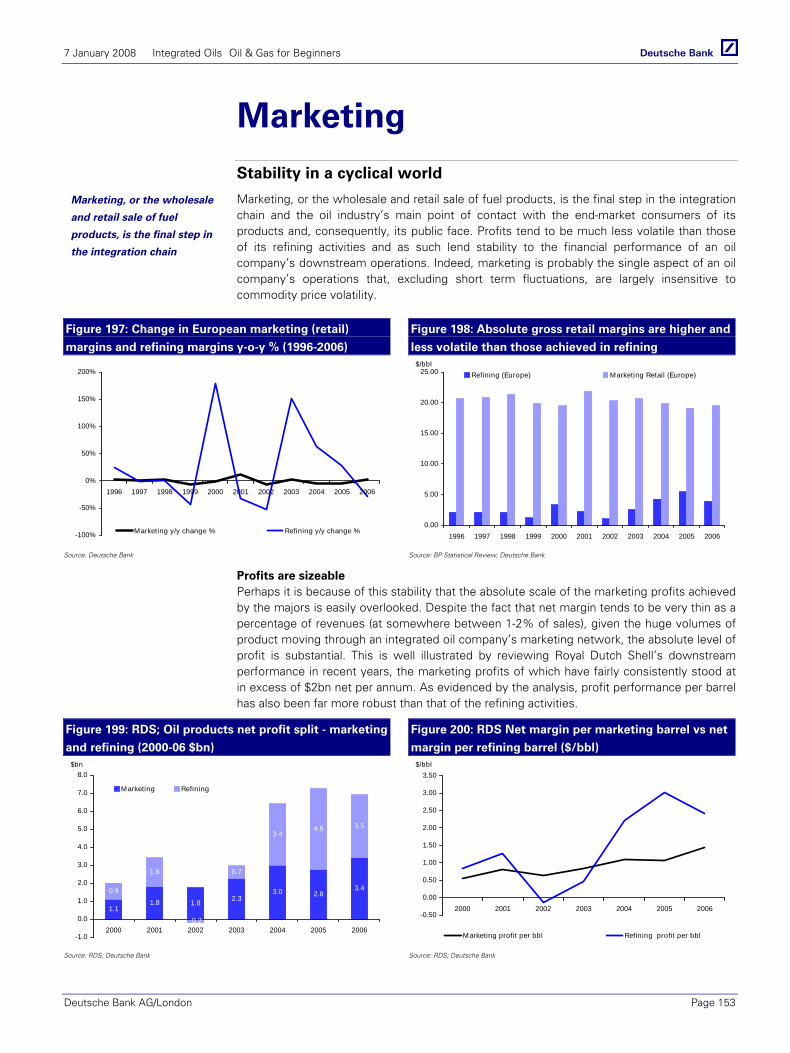
7 January 2008 Integrated Oils Oil & Gas for Beginners
Deutsche Bank AG/London Page 153
Marketing Stability in a cyclical world
Marketing, or the wholesale and retail sale of fuel products, is the final step in the integration chain and the oil industry’s main point of contact with the end-market consumers of its products and, consequently, its public face. Profits tend to be much less volatile than those of its refining activities and as such lend stability to the financial performance of an oil company’s downstream operations. Indeed, marketing is probably the single aspect of an oil company’s operations that, excluding short term fluctuations, are largely insensitive to commodity price volatility.
Figure 197: Change in European marketing (retail)
margins and refining margins y-o-y % (1996-2006)
Figure 198: Absolute gross retail margins are higher and
less volatile than those achieved in refining
-100%
-50%
0%
50%
100%
150%
200%
1996 1997 1998 1999 2000 2001 2002 2003 2004 2005 2006
Marketing y/y change % Refining y/y change %
0.00
5.00
10.00
15.00
20.00
25.00
1996 1997 1998 1999 2000 2001 2002 2003 2004 2005 2006
Refining (Europe) Marketing Retail (Europe)$/bbl
Source: Deutsche Bank Source: BP Statistical Review; Deutsche Bank
Profits are sizeable Perhaps it is because of this stability that the absolute scale of the marketing profits achieved by the majors is easily overlooked. Despite the fact that net margin tends to be very thin as a percentage of revenues (at somewhere between 1-2% of sales), given the huge volumes of product moving through an integrated oil company’s marketing network, the absolute level of profit is substantial. This is well illustrated by reviewing Royal Dutch Shell’s downstream performance in recent years, the marketing profits of which have fairly consistently stood at in excess of $2bn net per annum. As evidenced by the analysis, profit performance per barrel has also been far more robust than that of the refining activities.
Figure 199: RDS; Oil products net profit split - marketing
and refining (2000-06 $bn)
Figure 200: RDS Net margin per marketing barrel vs net
margin per refining barrel ($/bbl)
1.11.8 1.8 2.3
3.0 2.83.40.9
1.6
-0.2
0.7
3.44.5 3.5
-1.0
0.0
1.0
2.0
3.0
4.0
5.0
6.0
7.0
8.0
2000 2001 2002 2003 2004 2005 2006
Marketing Refining
$bn
-0.50
0.00
0.50
1.00
1.50
2.00
2.50
3.00
3.50
2000 2001 2002 2003 2004 2005 2006
Marketing profit per bbl Refining profit per bbl
$/bbl
Source: RDS; Deutsche Bank Source: RDS; Deutsche Bank
Marketing, or the wholesale
and retail sale of fuel
products, is the final step in
the integration chain
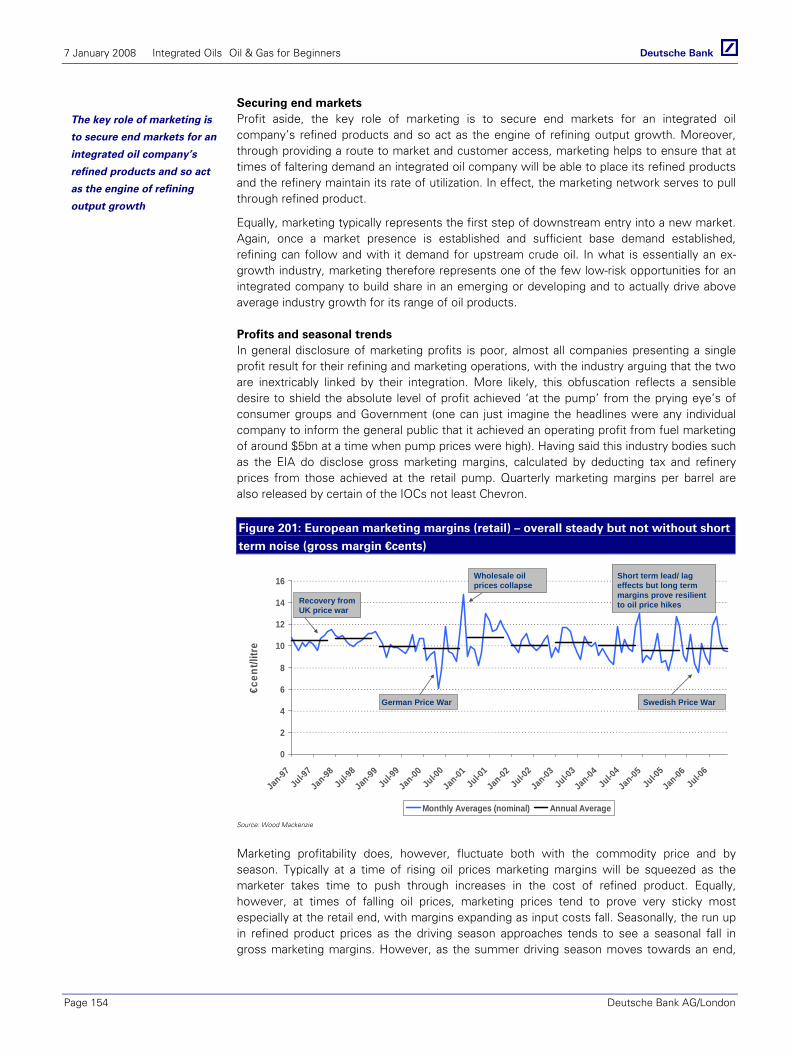
7 January 2008 Integrated Oils Oil & Gas for Beginners
Page 154 Deutsche Bank AG/London
Securing end markets Profit aside, the key role of marketing is to secure end markets for an integrated oil company’s refined products and so act as the engine of refining output growth. Moreover, through providing a route to market and customer access, marketing helps to ensure that at times of faltering demand an integrated oil company will be able to place its refined products and the refinery maintain its rate of utilization. In effect, the marketing network serves to pull through refined product.
Equally, marketing typically represents the first step of downstream entry into a new market. Again, once a market presence is established and sufficient base demand established, refining can follow and with it demand for upstream crude oil. In what is essentially an ex-growth industry, marketing therefore represents one of the few low-risk opportunities for an integrated company to build share in an emerging or developing and to actually drive above average industry growth for its range of oil products.
Profits and seasonal trends In general disclosure of marketing profits is poor, almost all companies presenting a single profit result for their refining and marketing operations, with the industry arguing that the two are inextricably linked by their integration. More likely, this obfuscation reflects a sensible desire to shield the absolute level of profit achieved ‘at the pump’ from the prying eye’s of consumer groups and Government (one can just imagine the headlines were any individual company to inform the general public that it achieved an operating profit from fuel marketing of around $5bn at a time when pump prices were high). Having said this industry bodies such as the EIA do disclose gross marketing margins, calculated by deducting tax and refinery prices from those achieved at the retail pump. Quarterly marketing margins per barrel are also released by certain of the IOCs not least Chevron.
Figure 201: European marketing margins (retail) – overall steady but not without short
term noise (gross margin €cents)
0
2
4
6
8
10
12
14
16
Jan-97
Jul-9
7
Jan-98Jul-9
8
Jan-99
Jul-99
Jan-00
Jul-0
0
Jan-01Jul-0
1
Jan-02
Jul-02
Jan-03
Jul-0
3
Jan-04
Jul-04
Jan-05Ju
l-05
Jan-06
Jul-06
€cen
t/litr
e
Monthly Averages (nominal) Annual Average
German Price War
Recovery from UK price war
Wholesale oil prices collapse
Short term lead/ lag effects but long term margins prove resilient to oil price hikes
Swedish Price War
Source: Wood Mackenzie
Marketing profitability does, however, fluctuate both with the commodity price and by season. Typically at a time of rising oil prices marketing margins will be squeezed as the marketer takes time to push through increases in the cost of refined product. Equally, however, at times of falling oil prices, marketing prices tend to prove very sticky most especially at the retail end, with margins expanding as input costs fall. Seasonally, the run up in refined product prices as the driving season approaches tends to see a seasonal fall in gross marketing margins. However, as the summer driving season moves towards an end,
The key role of marketing is
to secure end markets for an
integrated oil company’s
refined products and so act
as the engine of refining
output growth
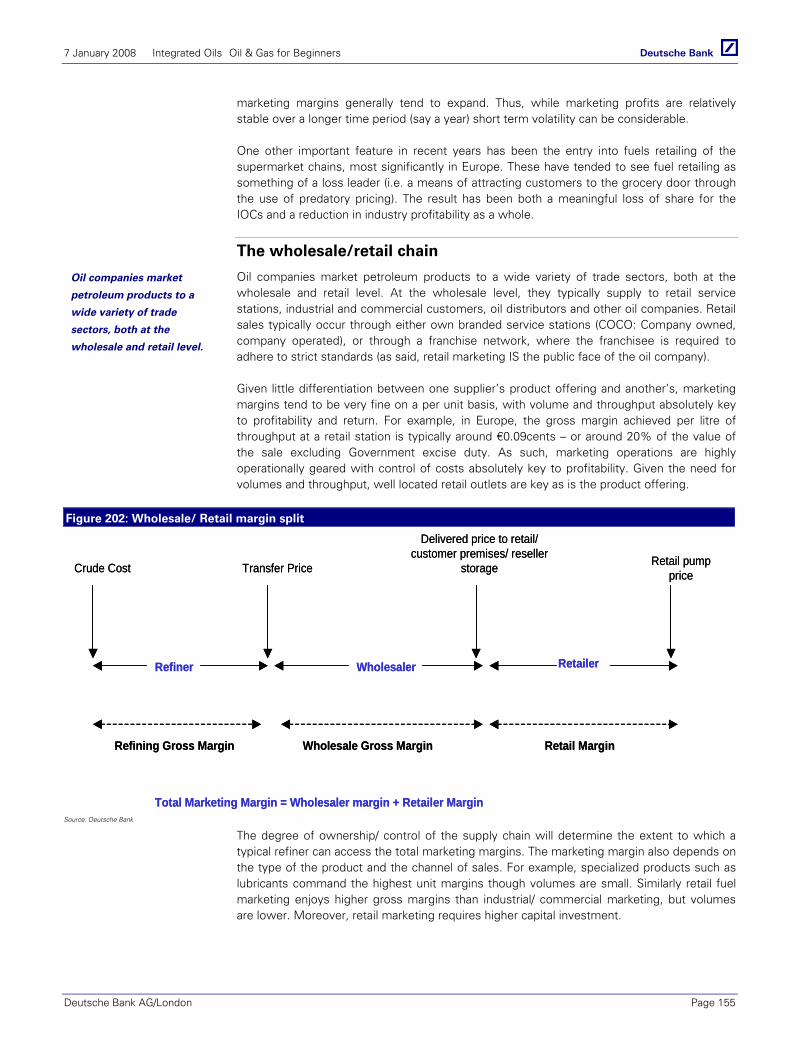
7 January 2008 Integrated Oils Oil & Gas for Beginners
Deutsche Bank AG/London Page 155
marketing margins generally tend to expand. Thus, while marketing profits are relatively stable over a longer time period (say a year) short term volatility can be considerable.
One other important feature in recent years has been the entry into fuels retailing of the supermarket chains, most significantly in Europe. These have tended to see fuel retailing as something of a loss leader (i.e. a means of attracting customers to the grocery door through the use of predatory pricing). The result has been both a meaningful loss of share for the IOCs and a reduction in industry profitability as a whole.
The wholesale/retail chain
Oil companies market petroleum products to a wide variety of trade sectors, both at the wholesale and retail level. At the wholesale level, they typically supply to retail service stations, industrial and commercial customers, oil distributors and other oil companies. Retail sales typically occur through either own branded service stations (COCO: Company owned, company operated), or through a franchise network, where the franchisee is required to adhere to strict standards (as said, retail marketing IS the public face of the oil company).
Given little differentiation between one supplier’s product offering and another’s, marketing margins tend to be very fine on a per unit basis, with volume and throughput absolutely key to profitability and return. For example, in Europe, the gross margin achieved per litre of throughput at a retail station is typically around €0.09cents – or around 20% of the value of the sale excluding Government excise duty. As such, marketing operations are highly operationally geared with control of costs absolutely key to profitability. Given the need for volumes and throughput, well located retail outlets are key as is the product offering.
Figure 202: Wholesale/ Retail margin split
Crude Cost Transfer Price
Delivered price to retail/ customer premises/ reseller
storage Retail pump price
Refiner Wholesaler Retailer
Refining Gross Margin Wholesale Gross Margin Retail Margin
Total Marketing Margin = Wholesaler margin + Retailer Margin
Crude Cost Transfer Price
Delivered price to retail/ customer premises/ reseller
storage Retail pump price
Refiner Wholesaler Retailer
Refining Gross Margin Wholesale Gross Margin Retail Margin
Total Marketing Margin = Wholesaler margin + Retailer MarginSource: Deutsche Bank
The degree of ownership/ control of the supply chain will determine the extent to which a typical refiner can access the total marketing margins. The marketing margin also depends on the type of the product and the channel of sales. For example, specialized products such as lubricants command the highest unit margins though volumes are small. Similarly retail fuel marketing enjoys higher gross margins than industrial/ commercial marketing, but volumes are lower. Moreover, retail marketing requires higher capital investment.
Oil companies market
petroleum products to a
wide variety of trade
sectors, both at the
wholesale and retail level.
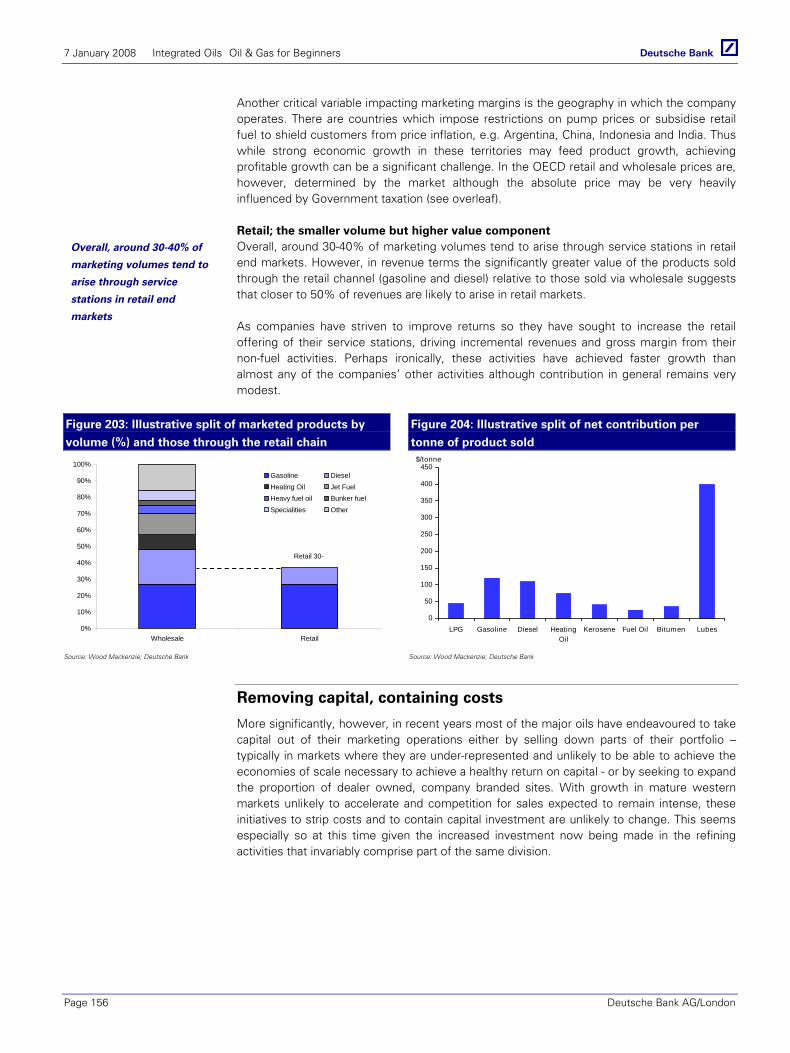
7 January 2008 Integrated Oils Oil & Gas for Beginners
Page 156 Deutsche Bank AG/London
Another critical variable impacting marketing margins is the geography in which the company operates. There are countries which impose restrictions on pump prices or subsidise retail fuel to shield customers from price inflation, e.g. Argentina, China, Indonesia and India. Thus while strong economic growth in these territories may feed product growth, achieving profitable growth can be a significant challenge. In the OECD retail and wholesale prices are, however, determined by the market although the absolute price may be very heavily influenced by Government taxation (see overleaf).
Retail; the smaller volume but higher value component Overall, around 30-40% of marketing volumes tend to arise through service stations in retail end markets. However, in revenue terms the significantly greater value of the products sold through the retail channel (gasoline and diesel) relative to those sold via wholesale suggests that closer to 50% of revenues are likely to arise in retail markets.
As companies have striven to improve returns so they have sought to increase the retail offering of their service stations, driving incremental revenues and gross margin from their non-fuel activities. Perhaps ironically, these activities have achieved faster growth than almost any of the companies’ other activities although contribution in general remains very modest.
Figure 203: Illustrative split of marketed products by
volume (%) and those through the retail chain
Figure 204: Illustrative split of net contribution per
tonne of product sold
0%
10%
20%
30%
40%
50%
60%
70%
80%
90%
100%
Wholesale Retail
Gasoline DieselHeating Oil Jet FuelHeavy fuel oil Bunker fuelSpecialities Other
Retail 30-
0
50
100
150
200
250
300
350
400
450
LPG Gasoline Diesel HeatingOil
Kerosene Fuel Oil Bitumen Lubes
$/tonne
Source: Wood Mackenzie; Deutsche Bank Source: Wood Mackenzie; Deutsche Bank
Removing capital, containing costs
More significantly, however, in recent years most of the major oils have endeavoured to take capital out of their marketing operations either by selling down parts of their portfolio – typically in markets where they are under-represented and unlikely to be able to achieve the economies of scale necessary to achieve a healthy return on capital - or by seeking to expand the proportion of dealer owned, company branded sites. With growth in mature western markets unlikely to accelerate and competition for sales expected to remain intense, these initiatives to strip costs and to contain capital investment are unlikely to change. This seems especially so at this time given the increased investment now being made in the refining activities that invariably comprise part of the same division.
Overall, around 30-40% of
marketing volumes tend to
arise through service
stations in retail end
markets
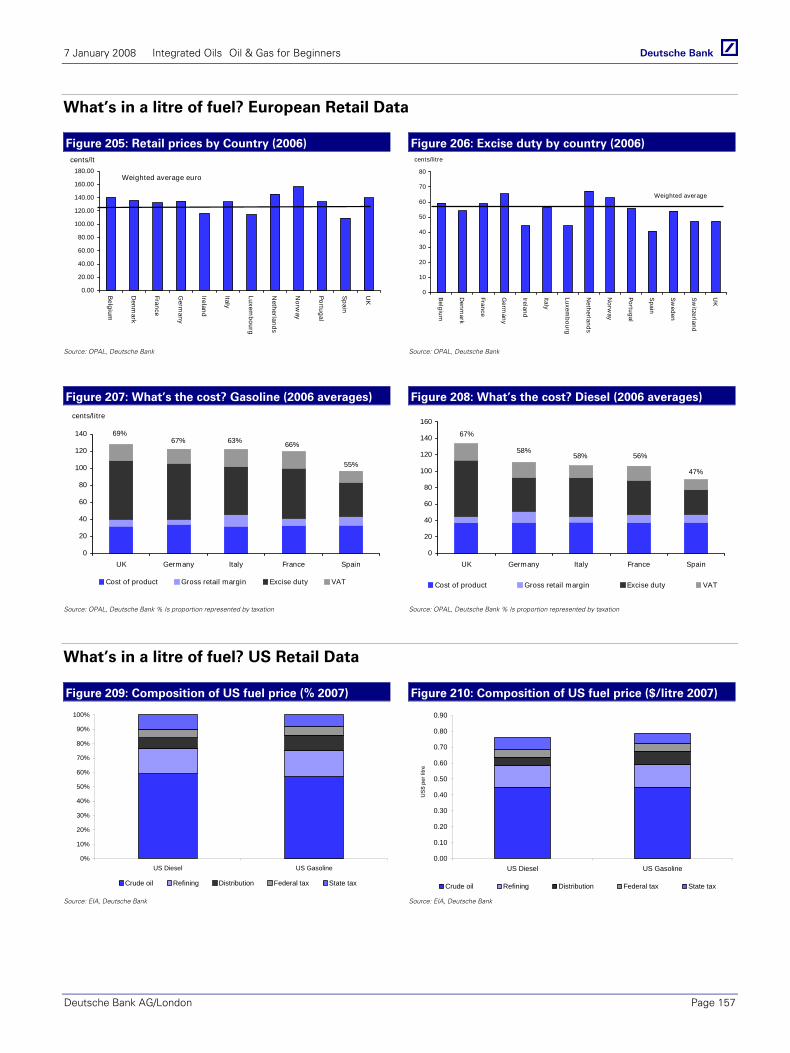
7 January 2008 Integrated Oils Oil & Gas for Beginners
Deutsche Bank AG/London Page 157
What’s in a litre of fuel? European Retail Data
Figure 205: Retail prices by Country (2006) Figure 206: Excise duty by country (2006)
0.00
20.00
40.00
60.00
80.00
100.00
120.00
140.00
160.00
180.00
Belgium
Denm
ark
France
Germ
any
Ireland
Italy
Luxembourg
Netherlands
Norw
ay
Portugal
Spain
UK
Weighted average euro
cents/lt
0
10
20
30
40
50
60
70
80
Belgium
Denm
ark
France
Germ
any
Ireland
Italy
Luxembourg
Netherlands
Norw
ay
Portugal
Spain
Sw
eden
Sw
itzerland
UK
Weighted average
cents/litre
Source: OPAL, Deutsche Bank Source: OPAL, Deutsche Bank
Figure 207: What’s the cost? Gasoline (2006 averages) Figure 208: What’s the cost? Diesel (2006 averages)
0
20
40
60
80
100
120
140
UK Germany Italy France Spain
Cost of product Gross retail margin Excise duty VAT
69%
55%
66%63%67%
cents/litre
0
20
40
60
80
100
120
140
160
UK Germany Italy France Spain
Cost of product Gross retail margin Excise duty VAT
67%
58%58% 56%
47%
Source: OPAL, Deutsche Bank % Is proportion represented by taxation Source: OPAL, Deutsche Bank % Is proportion represented by taxation
What’s in a litre of fuel? US Retail Data
Figure 209: Composition of US fuel price (% 2007) Figure 210: Composition of US fuel price ($/litre 2007)
0%
10%
20%
30%
40%
50%
60%
70%
80%
90%
100%
US Diesel US Gasoline
Crude oil Refining Distribution Federal tax State tax
0.00
0.10
0.20
0.30
0.40
0.50
0.60
0.70
0.80
0.90
US Diesel US Gasoline
Crude oil Refining Distribution Federal tax State tax
US
$ pe
r litr
e
Source: EIA, Deutsche Bank Source: EIA, Deutsche Bank
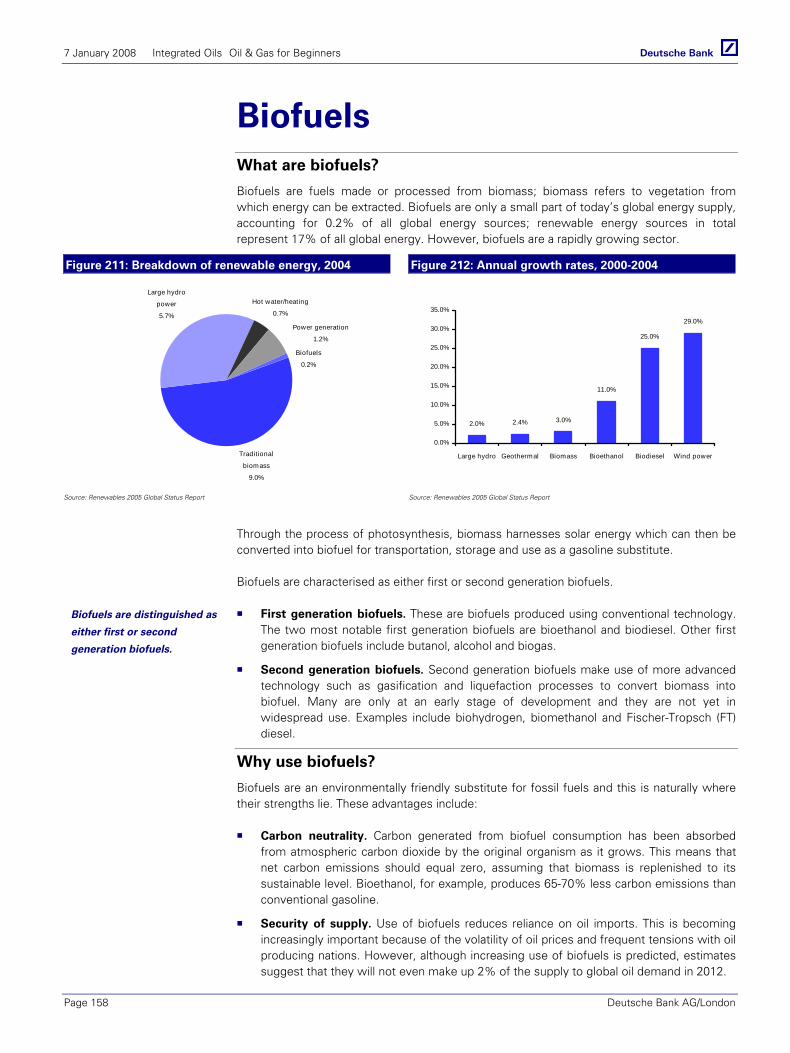
7 January 2008 Integrated Oils Oil & Gas for Beginners
Page 158 Deutsche Bank AG/London
Biofuels What are biofuels?
Biofuels are fuels made or processed from biomass; biomass refers to vegetation from which energy can be extracted. Biofuels are only a small part of today’s global energy supply, accounting for 0.2% of all global energy sources; renewable energy sources in total represent 17% of all global energy. However, biofuels are a rapidly growing sector.
Figure 211: Breakdown of renewable energy, 2004 Figure 212: Annual growth rates, 2000-2004
Biofuels
0.2%
Hot water/heating
0.7%
Power generation
1.2%
Traditional
biomass
9.0%
Large hydro
power
5.7%
2.0% 2.4% 3.0%
11.0%
25.0%
29.0%
0.0%
5.0%
10.0%
15.0%
20.0%
25.0%
30.0%
35.0%
Large hydro Geothermal Biomass Bioethanol Biodiesel Wind power
Source: Renewables 2005 Global Status Report Source: Renewables 2005 Global Status Report
Through the process of photosynthesis, biomass harnesses solar energy which can then be converted into biofuel for transportation, storage and use as a gasoline substitute.
Biofuels are characterised as either first or second generation biofuels.
First generation biofuels. These are biofuels produced using conventional technology. The two most notable first generation biofuels are bioethanol and biodiesel. Other first generation biofuels include butanol, alcohol and biogas.
Second generation biofuels. Second generation biofuels make use of more advanced technology such as gasification and liquefaction processes to convert biomass into biofuel. Many are only at an early stage of development and they are not yet in widespread use. Examples include biohydrogen, biomethanol and Fischer-Tropsch (FT) diesel.
Why use biofuels?
Biofuels are an environmentally friendly substitute for fossil fuels and this is naturally where their strengths lie. These advantages include:
Carbon neutrality. Carbon generated from biofuel consumption has been absorbed from atmospheric carbon dioxide by the original organism as it grows. This means that net carbon emissions should equal zero, assuming that biomass is replenished to its sustainable level. Bioethanol, for example, produces 65-70% less carbon emissions than conventional gasoline.
Security of supply. Use of biofuels reduces reliance on oil imports. This is becoming increasingly important because of the volatility of oil prices and frequent tensions with oil producing nations. However, although increasing use of biofuels is predicted, estimates suggest that they will not even make up 2% of the supply to global oil demand in 2012.
Biofuels are distinguished as
either first or second
generation biofuels.
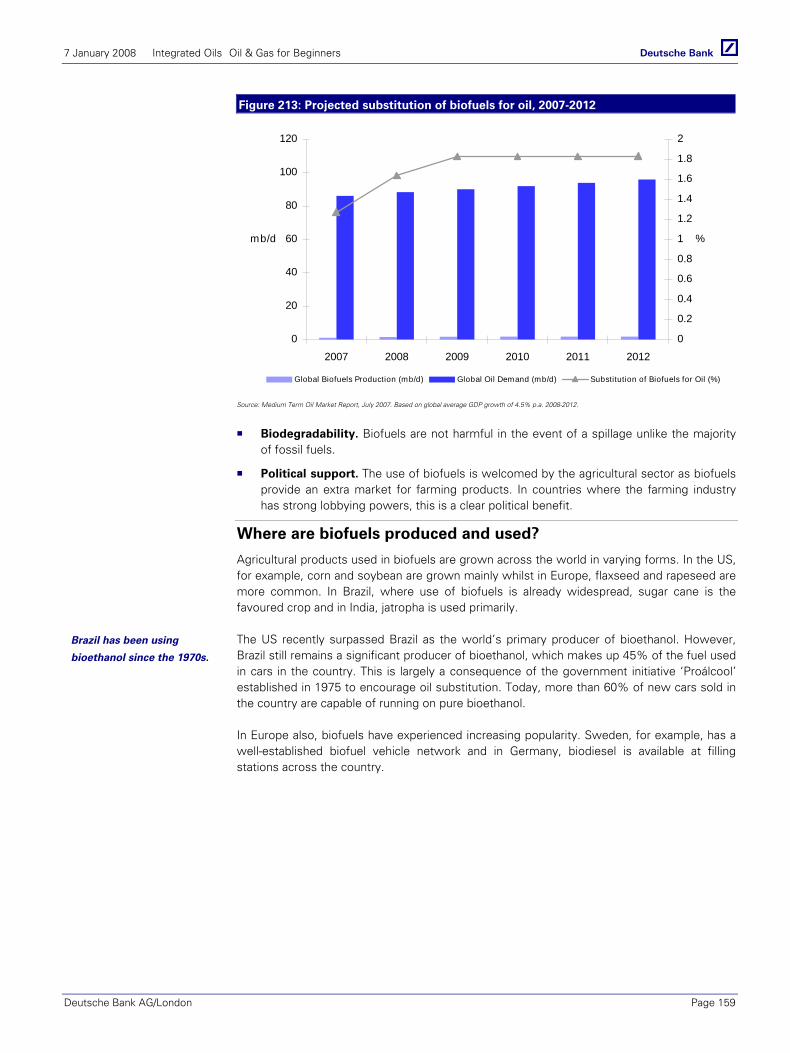
7 January 2008 Integrated Oils Oil & Gas for Beginners
Deutsche Bank AG/London Page 159
Figure 213: Projected substitution of biofuels for oil, 2007-2012
0
20
40
60
80
100
120
2007 2008 2009 2010 2011 2012
mb/d
0
0.2
0.4
0.6
0.8
1
1.2
1.4
1.6
1.8
2
%
Global Biofuels Production (mb/d) Global Oil Demand (mb/d) Substitution of Biofuels for Oil (%)
Source: Medium Term Oil Market Report, July 2007. Based on global average GDP growth of 4.5% p.a. 2008-2012.
Biodegradability. Biofuels are not harmful in the event of a spillage unlike the majority of fossil fuels.
Political support. The use of biofuels is welcomed by the agricultural sector as biofuels provide an extra market for farming products. In countries where the farming industry has strong lobbying powers, this is a clear political benefit.
Where are biofuels produced and used?
Agricultural products used in biofuels are grown across the world in varying forms. In the US, for example, corn and soybean are grown mainly whilst in Europe, flaxseed and rapeseed are more common. In Brazil, where use of biofuels is already widespread, sugar cane is the favoured crop and in India, jatropha is used primarily.
The US recently surpassed Brazil as the world’s primary producer of bioethanol. However, Brazil still remains a significant producer of bioethanol, which makes up 45% of the fuel used in cars in the country. This is largely a consequence of the government initiative ‘Proálcool’ established in 1975 to encourage oil substitution. Today, more than 60% of new cars sold in the country are capable of running on pure bioethanol.
In Europe also, biofuels have experienced increasing popularity. Sweden, for example, has a well-established biofuel vehicle network and in Germany, biodiesel is available at filling stations across the country.
Brazil has been using
bioethanol since the 1970s.
7 January 2008 Integrated Oils Oil & Gas for Beginners
Page 160 Deutsche Bank AG/London
The regulatory framework
Regulation continues to play an important role in the advancement of biofuel use. Strong emphasis has been placed on initiatives which provide direct targets within a specific timescale. The international body that has overseen these current trends is IEA Bioenergy, established in 1978 by the International Energy Agency (IEA). IEA Bioenergy facilitates the development of biofuels by providing a platform for information exchange between countries with national biofuel programs.
United Kingdom The key directive currently in place is the Renewable Transport Fuel Obligation, mandating that 5% of all motorcar fuel must be from a renewable source by 2010.
European Union At present, the Biofuels Directive (October 2001) is the principal regulatory measure for biofuels in the EU. This establishes a non-binding target to replace at least 5.75% of all transportation fuels with biofuels by 2010, rising to 20% by 2020. Although an intermediate target of 2% by the end of 2005 was also implemented, this was not met. In order to meet the overall target, it is estimated that 18% of arable land will be required for biofuel use; currently, only 10% is used. The EU strategy for biofuels (2005) outlines an action plan to achieve these aims, encouraging the introduction of further biofuel obligations.
This is complemented by the EU Directive of Taxation of Energy which grants biofuels special exemption from fuel taxation in member states.
United States The Alternative Motor Fuels Act 1988 provided the foundation for widespread production of motor vehicles capable of operating on alternative fuels such as bioethanol. This has been formalised more recently under the Energy Policy Act 2005 which introduced the Renewable Fuel Standard (RFS) program. This establishes a target to ensure that any gasoline sold contains a minimum volume of renewable fuel. The current required blending volume stands at 4.0 billion gallons in 2006, almost doubling to 7.5 billion gallons in 2012.
President Bush outlined his intentions in his 2006 State of the Union, announcing a target to replace 75% of oil from the Middle East by 2025, potentially with biofuels.
Key legislative measures
Legislation is integral to the effective regulation of the biofuels industry. The industry has witnessed a gradual switch from fiscal-based programs based on tax subsidies to regulation-dominated measures which mandate minimum biofuel blend ratios. Part of the reason for this change has been to remove the additional burden of providing subsidies on tax revenues. More importantly, it eliminates the distortionary impact created by undue reliance on subsidies.
United Kingdom A tax rebate of £0.20 per litre on both bioethanol and biodiesel is currently in place. Mandatory blending obligations are planned although not yet in force. These will begin at 2.50% biofuel in 2008/2009, increasing to 3.75% in 2009/2010 and later 5.00% in 2010/2011.
European Union Germany has been a leader in supportive legislation for biofuels. However, tax exemptions for biodiesel vehicles are currently being phased out and will no longer be in place from January 2008 onwards. The key piece of legislation is the Biokraftstoffquotengesetz which
President Bush has set
ambitious renewable energy
targets for the US.
Policy has switched from tax
subsidies to blending
requirements.
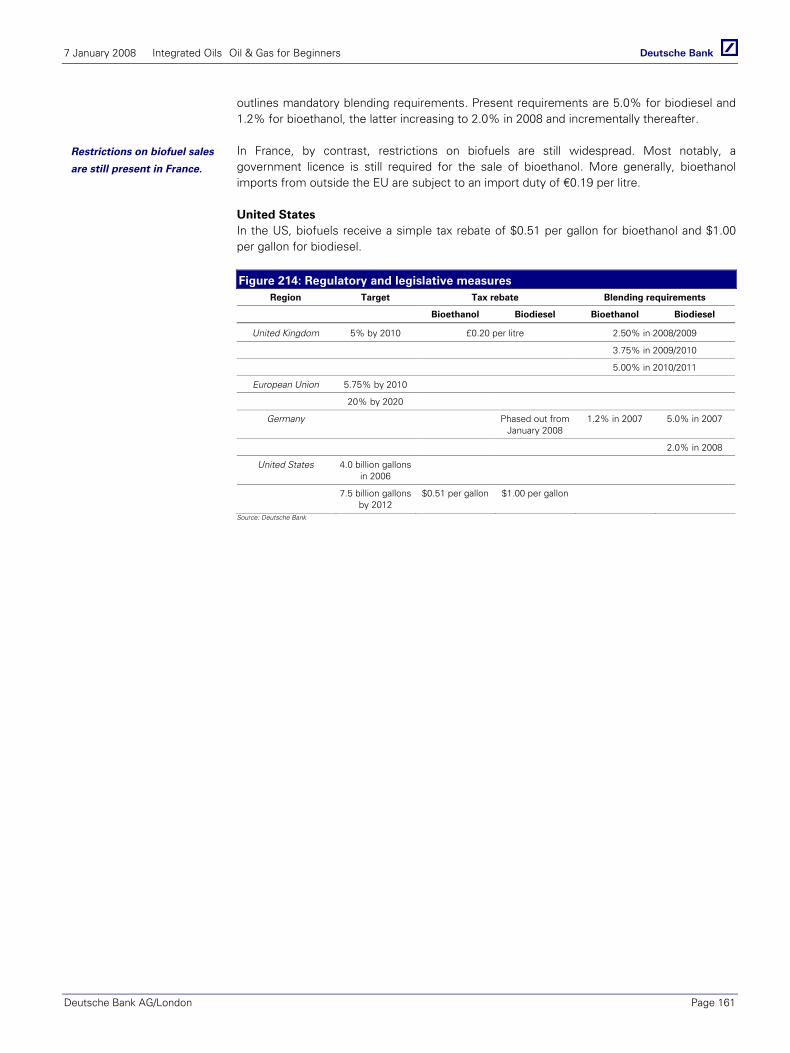
7 January 2008 Integrated Oils Oil & Gas for Beginners
Deutsche Bank AG/London Page 161
outlines mandatory blending requirements. Present requirements are 5.0% for biodiesel and 1.2% for bioethanol, the latter increasing to 2.0% in 2008 and incrementally thereafter.
In France, by contrast, restrictions on biofuels are still widespread. Most notably, a government licence is still required for the sale of bioethanol. More generally, bioethanol imports from outside the EU are subject to an import duty of €0.19 per litre.
United States In the US, biofuels receive a simple tax rebate of $0.51 per gallon for bioethanol and $1.00 per gallon for biodiesel.
Figure 214: Regulatory and legislative measures Region Target Tax rebate Blending requirements
Bioethanol Biodiesel Bioethanol Biodiesel
United Kingdom 5% by 2010 £0.20 per litre 2.50% in 2008/2009
3.75% in 2009/2010
5.00% in 2010/2011
European Union 5.75% by 2010
20% by 2020
Germany Phased out from January 2008
1.2% in 2007 5.0% in 2007
2.0% in 2008
United States 4.0 billion gallons in 2006
7.5 billion gallons by 2012
$0.51 per gallon $1.00 per gallon
Source: Deutsche Bank
Restrictions on biofuel sales
are still present in France.

7 January 2008 Integrated Oils Oil & Gas for Beginners
Page 162 Deutsche Bank AG/London
Bioethanol
Overview Bioethanol is an alcohol-based fuel made through the fermentation of crops such as barley, wheat, corn or sugar cane. It is the most commonly used biofuel worldwide. The US and Brazil represent the major markets for bioethanol, together accounting for 72% of worldwide production.
Principally, it is used in blends with gasoline as a substitute for pure gasoline. As a fuel additive, it reduces the carbon monoxide emissions of conventional combustion engines to promote cleaner burning. Low blends of bioethanol and gasoline, typically comprising 5-10% bioethanol, can be used in conventional engines without modification. The development of flexible fuel vehicles (FFVs) has assisted the growing popularity of higher blends, with FFVs capable of running on an 85% bioethanol mix (E85) after relatively simple modifications. Rubber seals and aluminium parts must be replaced with materials that resist the corrosive properties of bioethanol. However, FFVs are not currently in widespread use across Europe.
Production The bioethanol production process consists of the following stages: processing, fermentation, distillation and dehydration.
Processing. The processing stage of corn can be distinguished as either wet or dry corn milling. In wet corn milling, corn is first soaked in water before processing. In this case, one bushel (56 pounds) of corn yields approximately 31.5 pounds of starch which is then further processed into 2.7 gallons of bioethanol. In dry corn milling, the corn kernel is ground into flour before processing and the bioethanol is then evaporated off. Under dry corn milling, one bushel of corn yields approximately 2.8 gallons of bioethanol and a by-product of 17 pounds of distiller’s dried grains (DDGS), which can be used as an animal feed. Although dry corn mills are less expensive to construct than wet corn mills, they are more expensive to operate.
Fermentation. Sugars are fermented to produce bioethanol, water and carbon dioxide. Sugarcane yields approximately 8 units of fuel energy per unit of energy expended whilst corn is relatively inefficient, yielding only 1.34 units for every unit of energy used.
Distillation. Water is removed from the fermented product, purifying this to 95-96% bioethanol for use as a fuel. This is known as hydrated ethyl alcohol.
Dehydration. Further purity can be attained through dehydration, which removes remaining traces of water to produce anhydrous bioethanol with purity of 99.5-99.9%.
Issues Bioethanol is used as an oxygenate additive to promote cleaner burning of standard gasoline. The gasoline blend, which is known as ETBE (ethyl tertiary butyl ether), contains 47% bioethanol. It has replaced MTBE (methyl tertiary butyl ether) as a standard oxygenate additive largely because MTBE has been shown to contaminate groundwater and is considered to cause cancer. Two key issues surround the blending of ETBE:
Octane. ETBE circumvents the problem of ‘knocking’ caused by conventional gasoline. Knocking occurs when gasoline prematurely combusts in an engine without the spark plug triggering the ignition. This produces an audible sound, hence the name. Octane is a measure of how well a fuel can resist knocking, which can cause engine damage. The addition of bioethanol to gasoline enhances a fuel’s octane rating therefore reducing the probability that knocking will occur.
Reid Vapour Pressure (RVP). RVP is a measure of the pressure required to prevent a substance from evaporating. The evaporation of gasoline is clearly harmful and restrictions have been placed on the permitted RVP of finished gasoline. Bioethanol
Flexible fuel vehicles (FFVs)
will help to increase the
popularity of bioethanol.
ETBE has replaced MTBE as
a gasoline additive.
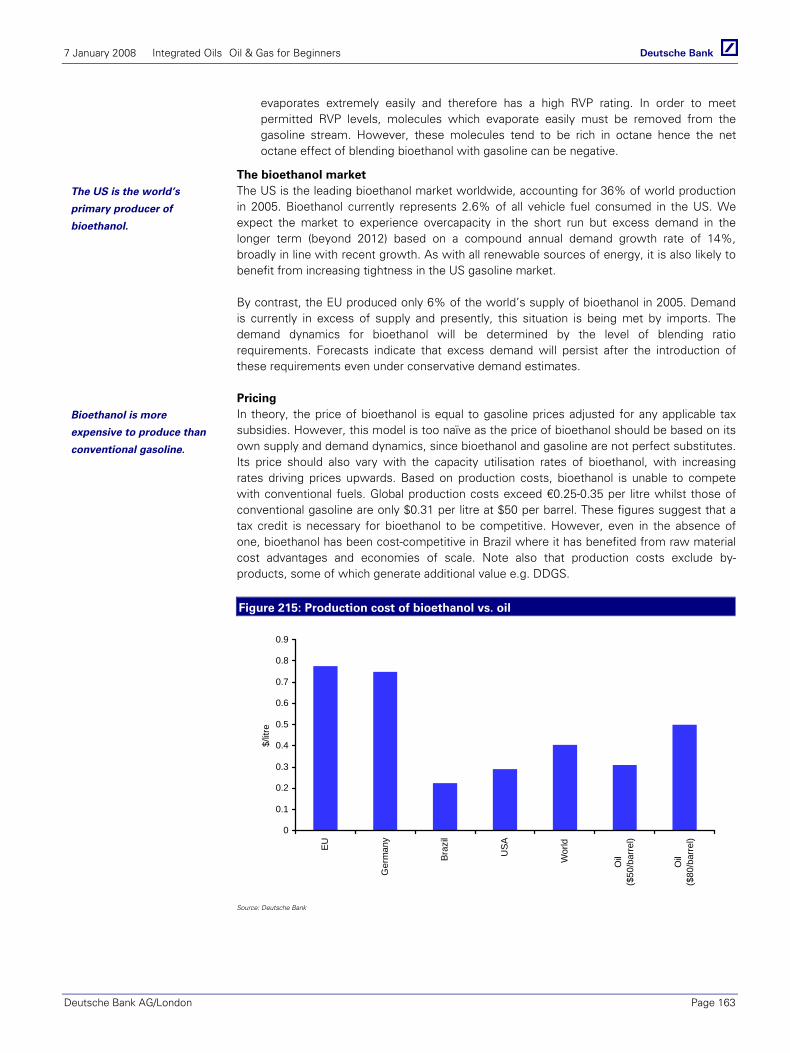
7 January 2008 Integrated Oils Oil & Gas for Beginners
Deutsche Bank AG/London Page 163
evaporates extremely easily and therefore has a high RVP rating. In order to meet permitted RVP levels, molecules which evaporate easily must be removed from the gasoline stream. However, these molecules tend to be rich in octane hence the net octane effect of blending bioethanol with gasoline can be negative.
The bioethanol market The US is the leading bioethanol market worldwide, accounting for 36% of world production in 2005. Bioethanol currently represents 2.6% of all vehicle fuel consumed in the US. We expect the market to experience overcapacity in the short run but excess demand in the longer term (beyond 2012) based on a compound annual demand growth rate of 14%, broadly in line with recent growth. As with all renewable sources of energy, it is also likely to benefit from increasing tightness in the US gasoline market.
By contrast, the EU produced only 6% of the world’s supply of bioethanol in 2005. Demand is currently in excess of supply and presently, this situation is being met by imports. The demand dynamics for bioethanol will be determined by the level of blending ratio requirements. Forecasts indicate that excess demand will persist after the introduction of these requirements even under conservative demand estimates.
Pricing In theory, the price of bioethanol is equal to gasoline prices adjusted for any applicable tax subsidies. However, this model is too naïve as the price of bioethanol should be based on its own supply and demand dynamics, since bioethanol and gasoline are not perfect substitutes. Its price should also vary with the capacity utilisation rates of bioethanol, with increasing rates driving prices upwards. Based on production costs, bioethanol is unable to compete with conventional fuels. Global production costs exceed €0.25-0.35 per litre whilst those of conventional gasoline are only $0.31 per litre at $50 per barrel. These figures suggest that a tax credit is necessary for bioethanol to be competitive. However, even in the absence of one, bioethanol has been cost-competitive in Brazil where it has benefited from raw material cost advantages and economies of scale. Note also that production costs exclude by-products, some of which generate additional value e.g. DDGS.
Figure 215: Production cost of bioethanol vs. oil
0
0.1
0.2
0.3
0.4
0.5
0.6
0.7
0.8
0.9
EU
Ger
man
y
Braz
il
USA
Wor
ld
Oil
($50
/bar
rel)
Oil
($80
/bar
rel)
$/lit
re
Source: Deutsche Bank
The US is the world’s
primary producer of
bioethanol.
Bioethanol is more
expensive to produce than
conventional gasoline.

7 January 2008 Integrated Oils Oil & Gas for Beginners
Page 164 Deutsche Bank AG/London
Biodiesel
Overview Biodiesel is a fuel made from biological sources, such as vegetable oils or animal fats, blended with distillates such as diesel. It is far less flexible than bioethanol as it has fewer sources and applications. In spite of this, biodiesel is the most common biofuel in Europe where the market has experienced rapid development. In 2005, Europe was responsible for the production of 1 billion gallons of biodiesel, equal to 85% of world production, with Germany the leading market.
In the US, the industry is at a relatively early stage of development, producing 75 million gallons of biodiesel in 2005. The preferred source of biodiesel in the US is soybean oil since it constitutes 70% of US vegetable oil production. It is possible to use low blends of biodiesel fuel in unmodified diesel engines. However, in the UK for example, engine warranties only cover the use of 5% biodiesel blends (B5).
Production Biodiesel production uses the process of trans-esterification, also known as alcoholysis. Prior to this, the raw material must undergo purification through filtration to remove impurities and water. Any free fatty acids must also be neutralised. Trans-esterification is based on the reaction between a vegetable oil containing glycerides and a short-chain alcohol such as methanol. This converts vegetable oil into fatty acid methyl esters (FAME) with a by-product of glycerol. One gallon of biodiesel can be produced from 7.5 pounds of vegetable oil.
Figure 216: The overall production process
Fermentation
Dry cornmilling
Wet cornmilling
Bioethanol
Biofuels marketBlended and pure substitutes
Distillation anddehydration
Transesterification
Filtration andneutralisation of free
fatty acids
Biodiesel
Second generationconversion
e.g. enzymatic hydrolysis
Cellulosic bioethanol
DDGS
Sugar cropsCorn, wheat, barley,
sugar cane
Vegetable oilsSoybean, rapeseed,flaxseed, jatropha
Cellulose and wastebiomass
Source: Deutsche Bank
Biodiesel is the most
common biofuel in Europe.
The key process in biodiesel
production is
transesterification.

7 January 2008 Integrated Oils Oil & Gas for Beginners
Deutsche Bank AG/London Page 165
Issues Biodiesel has both technical limitations and advantages. It experiences difficulties in cold weather in comparison to other refined products. One measure of fluid performance in cold weather is the cold filter plugging point (CFPP), the temperature at which a standard fuel filter will clog. Biodiesel has a high CFPP, indicating that it requires special handling in cold weather. A quality-related issue also arises because of the by-production of glycerol. Glycerol can potentially clog mechanical filters, causing engine damage and eventual breakage.
It is also possible to identify technical advantages. Biodiesel contains no elements of sulphur and are well-suited to ultra low sulphur diesel (ULSD) specifications which limit sulphur content in diesel fuel to 15 ppm. In addition, sulphur is not required as a lubricant, allowing blends of any level of biodiesel to operate in non-FFV engines.
The biodiesel market In Europe, there have been announcements of substantial capacity additions and European biodiesel production is projected to reach 12 million tonnes per year by 2010. The global market structure is highly fragmented comprising oil majors, agribusinesses, independents and pure-play biodiesel producers. In contrast, the vegetable oil industry is highly consolidated, with integrated firms dominating the supply of raw materials to the biodiesel industry.
Pricing As in the case of bioethanol, the theoretical price of biodiesel should be equal to the price of diesel, in particular ULSD, plus any existing tax credit. Part of the tax credit will be shared with the retailer in order to accommodate blending margins. Similarly to bioethanol pricing, the supply and demand dynamics of biodiesel are more realistic determinants of its price.
Criticisms of biofuels
A range of criticisms is often directed towards the use of biofuels, some justifiably and others less so. Much of the concern surrounding biofuels has wide-ranging political implications. This will inevitably play an important role in determining the viability of biofuels as a gasoline substitute.
Increasing food prices. There is concern that the widespread use of biofuels will lead to production of ‘fuel crops’ rather than ‘food crops’. Crops grown for fuel are likely to be extremely unpopular politically given the scarcity of food supplies in regions across the world. The limited availability of land also provides an additional constraint. The combination of additional demand for biofuels and scarcity of land is likely to increase the price of raw materials such as corn and vegetable oils. This will exert cost pressures on food prices. Note, however, that grain surpluses in some countries are unable to be sold in any case. Furthermore, demand for crops does not solely originate from biofuel producers; for example, China’s increasing dependence on agricultural imports is an important demand factor.
Environmental impact. The cultivation of crops specifically tailored for biofuel use may be damaging to the existing ecosystem, and will also decrease global biodiversity. Use of high blend fuels, such as E85, would require volumes of bioethanol that are far from feasible under existing systems.
Toxic emissions. A widely cited benefit of biofuels is carbon neutrality. However, agricultural techniques used in the production of biofuels require use of fossil fuels, reducing the net benefit of biofuel use. The production process also results in local air pollution, or smog, caused by nitrous oxides. This contributes to global warming and further offsets the benefit of carbon neutrality.
Use of crops for fuel rather
than food is likely to be an
important political issue.
7 January 2008 Integrated Oils Oil & Gas for Beginners
Page 166 Deutsche Bank AG/London
Cost. The European Commission has stated that biofuels are an “expensive way of reducing greenhouse gas emissions”. This is certainly true of its transportation and storage costs. Bioethanol has two undesirable properties: it is corrosive and hydrophilic, in other words, it is naturally attracted to water. The first property means that bioethanol will dissolve conventional pipelines used in transportation. Use of corrosion-resistant materials is considerably more expensive than those used in a conventional refined product pipeline. The second property implies that any water collected in transportation will make bioethanol unusable. Bioethanol must therefore be stored separately from gasoline throughout transportation and prior to blending, entailing further costs.
Long-term developments in biofuel
Market developments Following the switch from fiscal to regulation-dominated government programs with mandatory blending requirements, blending markets are likely to represent the primary engine of growth in the biofuels industry. Geographically, the EU offers high growth potential because of the relative infancy of the industry in the region. Growing excess demand is unlikely to be met by imports because of the common external tariff currently in place. Consequently, EU biofuel production levels should exhibit high growth rates. Strong volume growth in the bioethanol industry will also require adaptation of existing transportation and storage techniques. This will provide an opportunity for infrastructural developments.
Cellulosic bioethanol Cellulosic bioethanol is made through the fermentation of cellulosic feedstock, which encompasses almost any type of organic feedstock. Wide-scale production of cellulosic bioethanol will deliver major efficiency gains as its raw biomass is cheaper and also does not necessarily have a competing use as a food resource.
Production of cellulosic bioethanol requires second generation conversion technologies. Specifically, enzymatic breakdown, known as hydrolysis, is one necessary stage of production. Although the technology does exist, it is far from being cost-effective. Therefore, cellulosic feedstock is not yet a viable alternative to corn. Projected estimates place a 10 to 30 year timescale of development before it can be introduced as a viable substitute.
Biobutanol Biobutanol is a type of biofuel that can be used as a substitute for bioethanol. It offers several advantages over bioethanol:
It does not suffer from high RVP.
It is hydrophobic and non-corrosive.
It has a higher energy yield than bioethanol.
However, biobutanol is prohibitively costly at its current price of around $4 per gallon. Given that it does not receive a subsidy, it is not yet a cost-competitive fuel. Further development will be necessary to drive production costs down.
The European biofuels
market offers high growth
potential.
Second generation
conversion technologies are
key to progress.
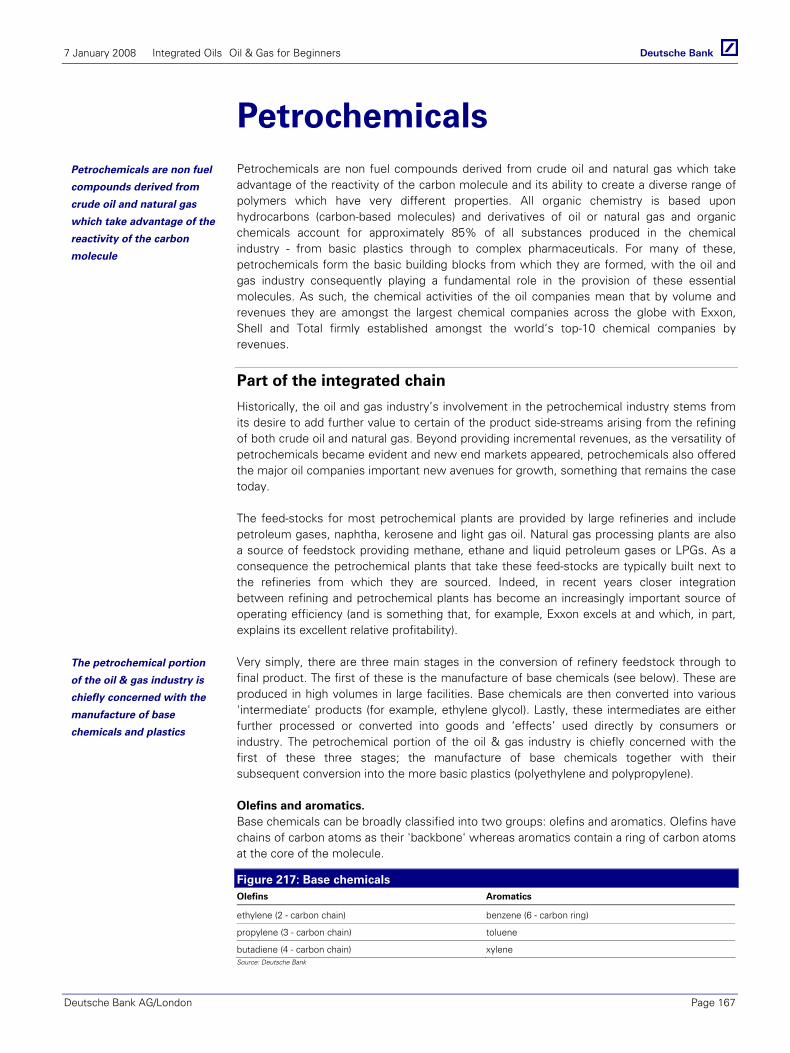
7 January 2008 Integrated Oils Oil & Gas for Beginners
Deutsche Bank AG/London Page 167
Petrochemicals Petrochemicals are non fuel compounds derived from crude oil and natural gas which take advantage of the reactivity of the carbon molecule and its ability to create a diverse range of polymers which have very different properties. All organic chemistry is based upon hydrocarbons (carbon-based molecules) and derivatives of oil or natural gas and organic chemicals account for approximately 85% of all substances produced in the chemical industry - from basic plastics through to complex pharmaceuticals. For many of these, petrochemicals form the basic building blocks from which they are formed, with the oil and gas industry consequently playing a fundamental role in the provision of these essential molecules. As such, the chemical activities of the oil companies mean that by volume and revenues they are amongst the largest chemical companies across the globe with Exxon, Shell and Total firmly established amongst the world’s top-10 chemical companies by revenues.
Part of the integrated chain
Historically, the oil and gas industry’s involvement in the petrochemical industry stems from its desire to add further value to certain of the product side-streams arising from the refining of both crude oil and natural gas. Beyond providing incremental revenues, as the versatility of petrochemicals became evident and new end markets appeared, petrochemicals also offered the major oil companies important new avenues for growth, something that remains the case today.
The feed-stocks for most petrochemical plants are provided by large refineries and include petroleum gases, naphtha, kerosene and light gas oil. Natural gas processing plants are also a source of feedstock providing methane, ethane and liquid petroleum gases or LPGs. As a consequence the petrochemical plants that take these feed-stocks are typically built next to the refineries from which they are sourced. Indeed, in recent years closer integration between refining and petrochemical plants has become an increasingly important source of operating efficiency (and is something that, for example, Exxon excels at and which, in part, explains its excellent relative profitability).
Very simply, there are three main stages in the conversion of refinery feedstock through to final product. The first of these is the manufacture of base chemicals (see below). These are produced in high volumes in large facilities. Base chemicals are then converted into various 'intermediate' products (for example, ethylene glycol). Lastly, these intermediates are either further processed or converted into goods and ‘effects’ used directly by consumers or industry. The petrochemical portion of the oil & gas industry is chiefly concerned with the first of these three stages; the manufacture of base chemicals together with their subsequent conversion into the more basic plastics (polyethylene and polypropylene).
Olefins and aromatics. Base chemicals can be broadly classified into two groups: olefins and aromatics. Olefins have chains of carbon atoms as their 'backbone' whereas aromatics contain a ring of carbon atoms at the core of the molecule.
Figure 217: Base chemicals Olefins Aromatics
ethylene (2 - carbon chain) benzene (6 - carbon ring)
propylene (3 - carbon chain) toluene
butadiene (4 - carbon chain) xylene Source: Deutsche Bank
Petrochemicals are non fuel
compounds derived from
crude oil and natural gas
which take advantage of the
reactivity of the carbon
molecule
The petrochemical portion
of the oil & gas industry is
chiefly concerned with the
manufacture of base
chemicals and plastics
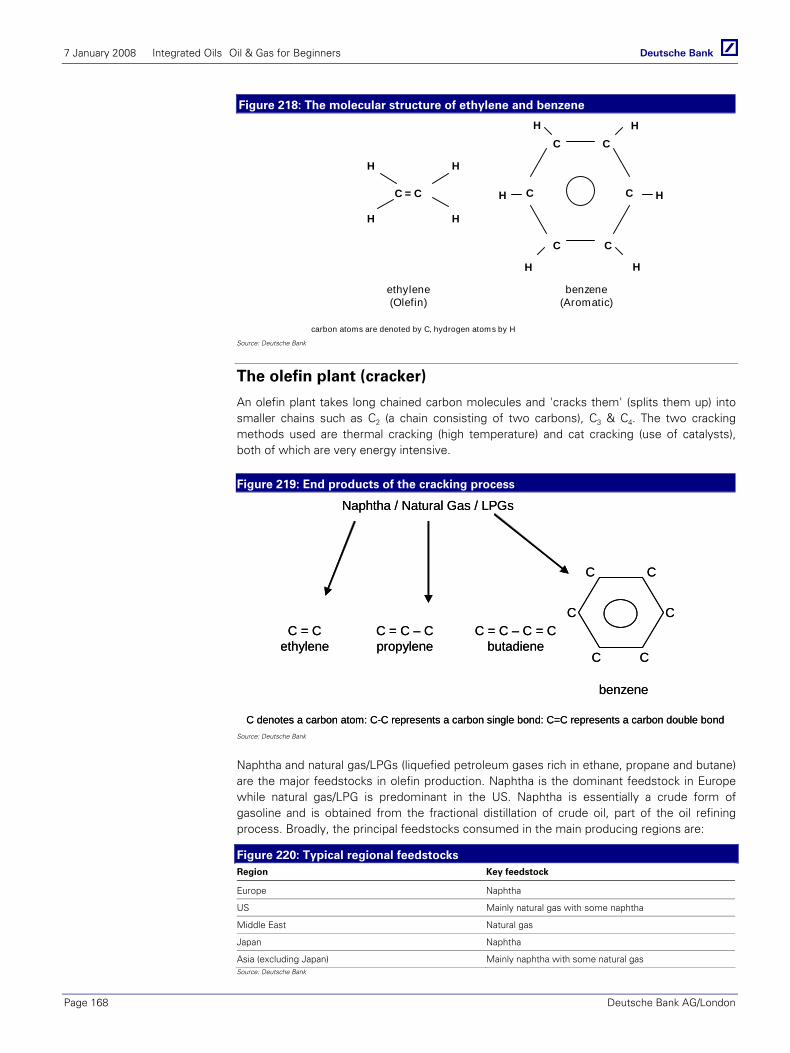
7 January 2008 Integrated Oils Oil & Gas for Beginners
Page 168 Deutsche Bank AG/London
Figure 218: The molecular structure of ethylene and benzene
C C
C C
C C
H H
HH
H
benzene(Aromatic)
C = C
H H
ethylene(Olefin)
H
carbon atoms are denoted by C, hydrogen atoms by H
H H
Source: Deutsche Bank
The olefin plant (cracker)
An olefin plant takes long chained carbon molecules and 'cracks them' (splits them up) into smaller chains such as C2 (a chain consisting of two carbons), C3 & C4. The two cracking methods used are thermal cracking (high temperature) and cat cracking (use of catalysts), both of which are very energy intensive.
Figure 219: End products of the cracking process
C C
C C
C C
benzene
C = Cethylene
C = C – Cpropylene
C = C – C = Cbutadiene
Naphtha / Natural Gas / LPGs
C denotes a carbon atom: C-C represents a carbon single bond: C=C represents a carbon double bond
C C
C C
C C
benzene
C = Cethylene
C = C – Cpropylene
C = C – C = Cbutadiene
Naphtha / Natural Gas / LPGs
C denotes a carbon atom: C-C represents a carbon single bond: C=C represents a carbon double bondSource: Deutsche Bank
Naphtha and natural gas/LPGs (liquefied petroleum gases rich in ethane, propane and butane) are the major feedstocks in olefin production. Naphtha is the dominant feedstock in Europe while natural gas/LPG is predominant in the US. Naphtha is essentially a crude form of gasoline and is obtained from the fractional distillation of crude oil, part of the oil refining process. Broadly, the principal feedstocks consumed in the main producing regions are:
Figure 220: Typical regional feedstocks Region Key feedstock
Europe Naphtha
US Mainly natural gas with some naphtha
Middle East Natural gas
Japan Naphtha
Asia (excluding Japan) Mainly naphtha with some natural gas Source: Deutsche Bank
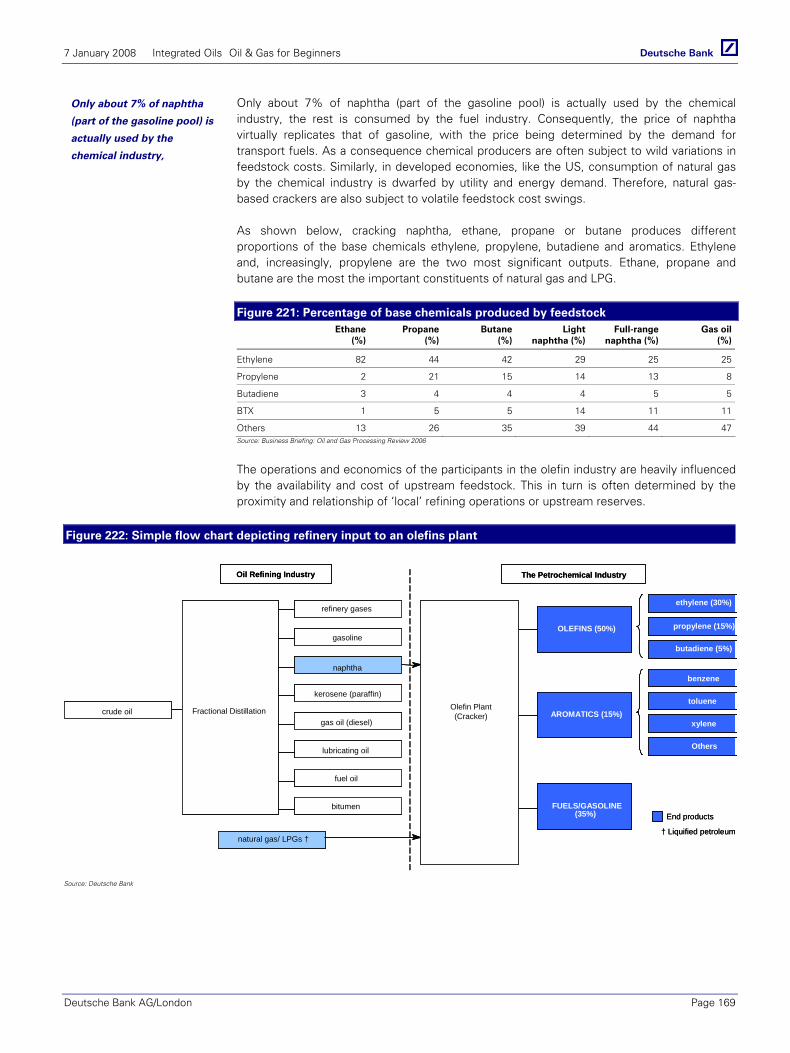
7 January 2008 Integrated Oils Oil & Gas for Beginners
Deutsche Bank AG/London Page 169
Only about 7% of naphtha (part of the gasoline pool) is actually used by the chemical industry, the rest is consumed by the fuel industry. Consequently, the price of naphtha virtually replicates that of gasoline, with the price being determined by the demand for transport fuels. As a consequence chemical producers are often subject to wild variations in feedstock costs. Similarly, in developed economies, like the US, consumption of natural gas by the chemical industry is dwarfed by utility and energy demand. Therefore, natural gas-based crackers are also subject to volatile feedstock cost swings.
As shown below, cracking naphtha, ethane, propane or butane produces different proportions of the base chemicals ethylene, propylene, butadiene and aromatics. Ethylene and, increasingly, propylene are the two most significant outputs. Ethane, propane and butane are the most the important constituents of natural gas and LPG.
Figure 221: Percentage of base chemicals produced by feedstock Ethane
(%)Propane
(%)Butane
(%)Light
naphtha (%) Full-range
naphtha (%)Gas oil
(%)
Ethylene 82 44 42 29 25 25
Propylene 2 21 15 14 13 8
Butadiene 3 4 4 4 5 5
BTX 1 5 5 14 11 11
Others 13 26 35 39 44 47Source: Business Briefing: Oil and Gas Processing Review 2006
The operations and economics of the participants in the olefin industry are heavily influenced by the availability and cost of upstream feedstock. This in turn is often determined by the proximity and relationship of ‘local’ refining operations or upstream reserves.
Figure 222: Simple flow chart depicting refinery input to an olefins plant
natural gas/ LPGs †
kerosene (paraffin)Olefin Plant(Cracker)
† Liquified petroleum
Oil Refining Industry The Petrochemical Industry
crude oil Fractional Distillation
refinery gases
gasoline
naphtha
bitumen
gas oil (diesel)
lubricating oil
fuel oil
AROMATICS (15%)
OLEFINS (50%)
FUELS/GASOLINE(35%) End products
ethylene (30%)
propylene (15%)
butadiene (5%)
benzene
toluene
xylene
Others
Source: Deutsche Bank
Only about 7% of naphtha
(part of the gasoline pool) is
actually used by the
chemical industry,
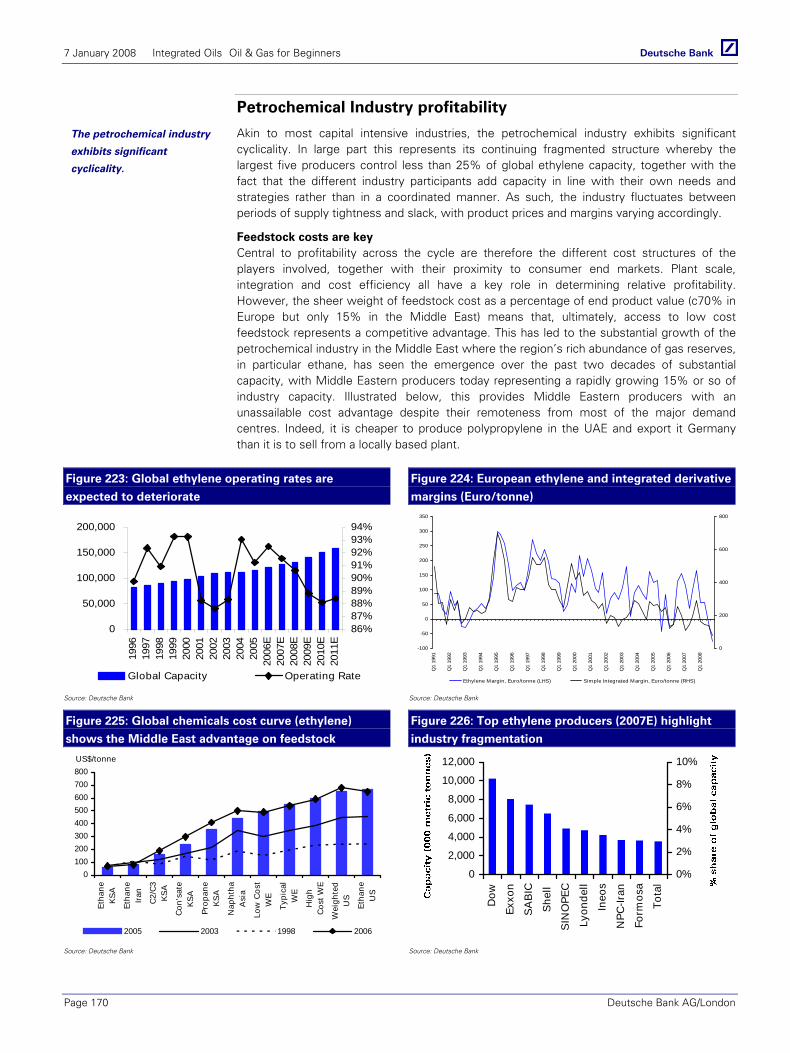
7 January 2008 Integrated Oils Oil & Gas for Beginners
Page 170 Deutsche Bank AG/London
Petrochemical Industry profitability
Akin to most capital intensive industries, the petrochemical industry exhibits significant cyclicality. In large part this represents its continuing fragmented structure whereby the largest five producers control less than 25% of global ethylene capacity, together with the fact that the different industry participants add capacity in line with their own needs and strategies rather than in a coordinated manner. As such, the industry fluctuates between periods of supply tightness and slack, with product prices and margins varying accordingly.
Feedstock costs are key Central to profitability across the cycle are therefore the different cost structures of the players involved, together with their proximity to consumer end markets. Plant scale, integration and cost efficiency all have a key role in determining relative profitability. However, the sheer weight of feedstock cost as a percentage of end product value (c70% in Europe but only 15% in the Middle East) means that, ultimately, access to low cost feedstock represents a competitive advantage. This has led to the substantial growth of the petrochemical industry in the Middle East where the region’s rich abundance of gas reserves, in particular ethane, has seen the emergence over the past two decades of substantial capacity, with Middle Eastern producers today representing a rapidly growing 15% or so of industry capacity. Illustrated below, this provides Middle Eastern producers with an unassailable cost advantage despite their remoteness from most of the major demand centres. Indeed, it is cheaper to produce polypropylene in the UAE and export it Germany than it is to sell from a locally based plant.
Figure 223: Global ethylene operating rates are
expected to deteriorate
Figure 224: European ethylene and integrated derivative
margins (Euro/tonne)
0
50,000
100,000
150,000
200,000
1996
1997
1998
1999
2000
2001
2002
2003
2004
2005
2006
E20
07E
2008
E20
09E
2010
E20
11E
86%87%88%89%90%91%92%93%94%
Global Capacity Operating Rate
-100
-50
0
50
100
150
200
250
300
350
Q1
1991
Q1
1992
Q1
1993
Q1
1994
Q1
1995
Q1
1996
Q1
1997
Q1
1998
Q1
1999
Q1
2000
Q1
2001
Q1
2002
Q1
2003
Q1
2004
Q1
2005
Q1
2006
Q1
2007
Q1
2008
0
200
400
600
800
Ethylene Margin, Euro/tonne (LHS) Simple Integrated Margin, Euro/tonne (RHS)
Source: Deutsche Bank Source: Deutsche Bank
Figure 225: Global chemicals cost curve (ethylene)
shows the Middle East advantage on feedstock
Figure 226: Top ethylene producers (2007E) highlight
industry fragmentation
0100200300400500600700800
Etha
neKS
A
Etha
neIra
n
C2/C
3KS
A
Con'
sate
KSA
Prop
ane
KSA
Nap
htha
Asi
a
Low
Cos
tW
E
Typi
cal
WE
Hig
hCo
st W
E
Wei
ghte
dU
S
Etha
neU
S
2005 2003 1998 2006
US$/tonne
0
2,000
4,000
6,000
8,000
10,000
12,000
Dow
Exxo
n
SA
BIC
She
ll
SIN
OPE
C
Lyon
dell
Ineo
s
NPC
-Iran
Form
osa
Tota
l
0%
2%
4%
6%
8%
10%
Source: Deutsche Bank Source: Deutsche Bank
The petrochemical industry
exhibits significant
cyclicality.
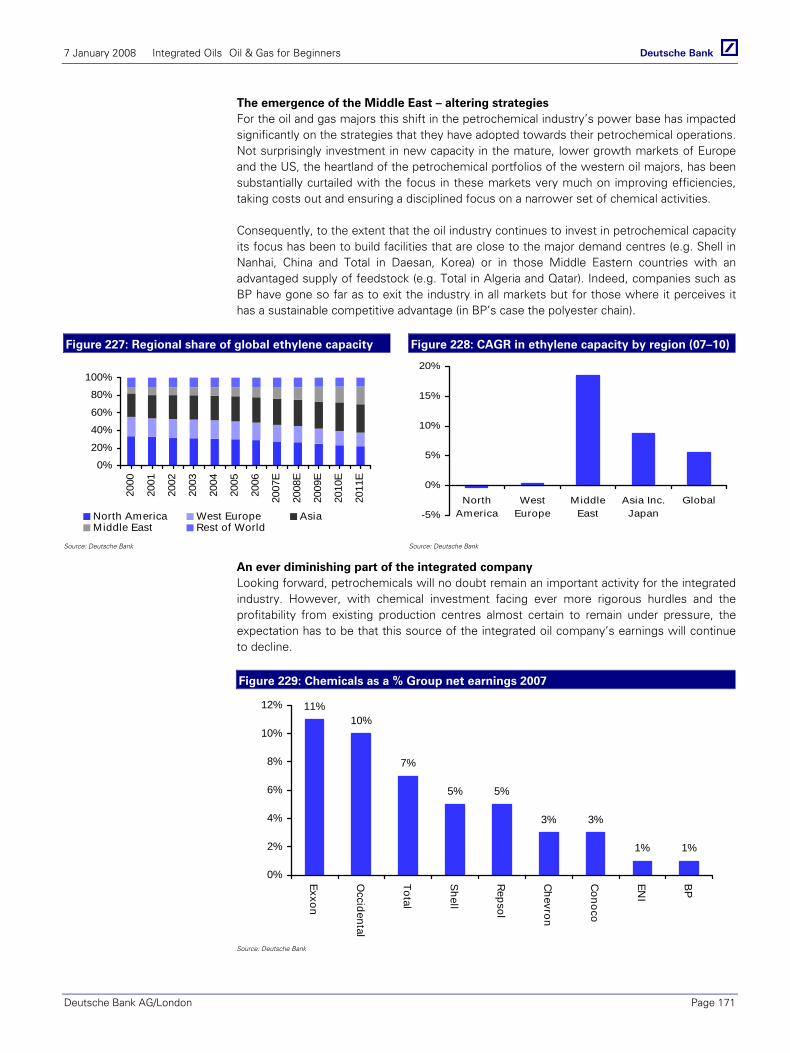
7 January 2008 Integrated Oils Oil & Gas for Beginners
Deutsche Bank AG/London Page 171
The emergence of the Middle East – altering strategies For the oil and gas majors this shift in the petrochemical industry’s power base has impacted significantly on the strategies that they have adopted towards their petrochemical operations. Not surprisingly investment in new capacity in the mature, lower growth markets of Europe and the US, the heartland of the petrochemical portfolios of the western oil majors, has been substantially curtailed with the focus in these markets very much on improving efficiencies, taking costs out and ensuring a disciplined focus on a narrower set of chemical activities.
Consequently, to the extent that the oil industry continues to invest in petrochemical capacity its focus has been to build facilities that are close to the major demand centres (e.g. Shell in Nanhai, China and Total in Daesan, Korea) or in those Middle Eastern countries with an advantaged supply of feedstock (e.g. Total in Algeria and Qatar). Indeed, companies such as BP have gone so far as to exit the industry in all markets but for those where it perceives it has a sustainable competitive advantage (in BP’s case the polyester chain).
Figure 227: Regional share of global ethylene capacity Figure 228: CAGR in ethylene capacity by region (07–10)
0%
20%
40%
60%
80%
100%
2000
2001
2002
2003
2004
2005
2006
2007
E
2008
E
2009
E
2010
E
2011
E
North America West Europe AsiaMiddle East Rest of World
-5%
0%
5%
10%
15%
20%
NorthAmerica
WestEurope
MiddleEast
Asia Inc.Japan
Global
Source: Deutsche Bank Source: Deutsche Bank
An ever diminishing part of the integrated company Looking forward, petrochemicals will no doubt remain an important activity for the integrated industry. However, with chemical investment facing ever more rigorous hurdles and the profitability from existing production centres almost certain to remain under pressure, the expectation has to be that this source of the integrated oil company’s earnings will continue to decline.
Figure 229: Chemicals as a % Group net earnings 2007
11%10%
7%
5% 5%
3% 3%
1% 1%
0%
2%
4%
6%
8%
10%
12%
Exxon
Occidental
Total
Shell
Repsol
Chevron
Conoco
ENI
BP
Source: Deutsche Bank
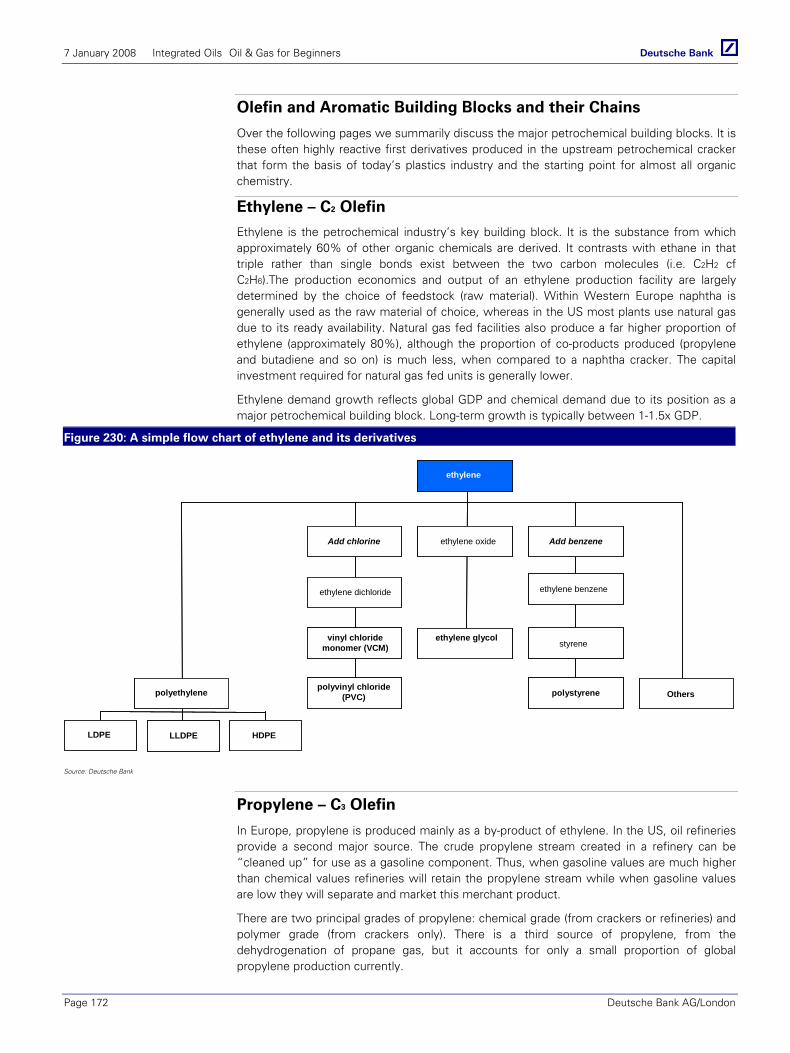
7 January 2008 Integrated Oils Oil & Gas for Beginners
Page 172 Deutsche Bank AG/London
Olefin and Aromatic Building Blocks and their Chains
Over the following pages we summarily discuss the major petrochemical building blocks. It is these often highly reactive first derivatives produced in the upstream petrochemical cracker that form the basis of today’s plastics industry and the starting point for almost all organic chemistry.
Ethylene – C2 Olefin
Ethylene is the petrochemical industry’s key building block. It is the substance from which approximately 60% of other organic chemicals are derived. It contrasts with ethane in that triple rather than single bonds exist between the two carbon molecules (i.e. C2H2 cf C2H6).The production economics and output of an ethylene production facility are largely determined by the choice of feedstock (raw material). Within Western Europe naphtha is generally used as the raw material of choice, whereas in the US most plants use natural gas due to its ready availability. Natural gas fed facilities also produce a far higher proportion of ethylene (approximately 80%), although the proportion of co-products produced (propylene and butadiene and so on) is much less, when compared to a naphtha cracker. The capital investment required for natural gas fed units is generally lower.
Ethylene demand growth reflects global GDP and chemical demand due to its position as a major petrochemical building block. Long-term growth is typically between 1-1.5x GDP.
Figure 230: A simple flow chart of ethylene and its derivatives
polyvinyl chloride (PVC)
vinyl chloride monomer (VCM)
ethylene
Add chlorine ethylene oxide Add benzene
ethylene dichloride
ethylene glycol
polyethylene
LDPE LLDPE HDPE
Others polystyrene
ethylene benzene
styrene
polyvinyl chloride (PVC)
vinyl chloride monomer (VCM)
ethylene
Add chlorine ethylene oxide Add benzene
ethylene dichloride
ethylene glycol
polyethylene
LDPE LLDPE HDPE
Others polystyrene
ethylene benzene
styrene
Source: Deutsche Bank
Propylene – C3 Olefin
In Europe, propylene is produced mainly as a by-product of ethylene. In the US, oil refineries provide a second major source. The crude propylene stream created in a refinery can be “cleaned up” for use as a gasoline component. Thus, when gasoline values are much higher than chemical values refineries will retain the propylene stream while when gasoline values are low they will separate and market this merchant product.
There are two principal grades of propylene: chemical grade (from crackers or refineries) and polymer grade (from crackers only). There is a third source of propylene, from the dehydrogenation of propane gas, but it accounts for only a small proportion of global propylene production currently.

7 January 2008 Integrated Oils Oil & Gas for Beginners
Deutsche Bank AG/London Page 173
Propylene does not have many direct applications in the consumer market but is used extensively as an intermediate product in the chemical chain, for example in the production of fibres, textiles, injection moulded plastics and paints among others. Long-term growth is more than 2x GDP.
Figure 231: The polypropylene chain End Uses
propylene (C3 Olefins)
polypropylene
acyrlonitrile
isopropyl alcohol
propylene oxide
polyethylene
Acrylic Fibres
Polyurethanes/Anti-freeze
Paints/Coating/Adhesives
End Uses
propylene (C3 Olefins)
polypropylene
acyrlonitrile
isopropyl alcohol
propylene oxide
polyethylene
Acrylic Fibres
Polyurethanes/Anti-freeze
Paints/Coating/Adhesives
Source: Deutsche Bank
Butadiene – C4 Olefin
Butadiene, a colourless gas at room temperature (liquid a few degrees below freezing point), is a by-product of the cracking process (that produces ethylene primarily). Approximately 5% of the base chemicals produced in the cracking process are in the form of butadiene (a molecule with four carbon atoms). The raw materials are again natural gas or naphtha. The main use of butadiene is as an intermediate in the manufacture of various forms of rubber, latex and plastics. The largest customers for butadiene include Goodyear Tire & Rubber, Firestone Synthetic Rubber & Latex, DuPont Nylon, Dow Chemical, Lanxess, Michelin North America and Ameripol Synpol.
Figure 232: Production process of butadiene
Synthetic Rubbers, eg SBR
Engineering Plastics, e.g. ABS
Styrene butadiene latex
Petrochemicals
ethylene
propylene
butadiene (5%)
natural gasmethane
ethane
LPG
oil naphtha
Synthetic Rubbers, eg SBR
Engineering Plastics, e.g. ABS
Styrene butadiene latex
Petrochemicals
ethylene
propylene
butadiene (5%)
Synthetic Rubbers, eg SBR
Engineering Plastics, e.g. ABS
Styrene butadiene latex
Petrochemicals
ethylene
propylene
butadiene (5%)
natural gasmethane
ethane
LPG
oil naphtha
Source: Deutsche Bank
Benzene – C6 Aromatic
Benzene can be derived from petroleum based sources or coal. Petroleum sources include refinery streams, pyrolysis gasoline (a by-product of ethylene manufacture in cracking naphtha, gas oil or LPG) and toluene. Coal-derived benzene is obtained from the light oil resulting from coke-oven operations. Some of this light oil is processed by petroleum refiners for benzene recovery.
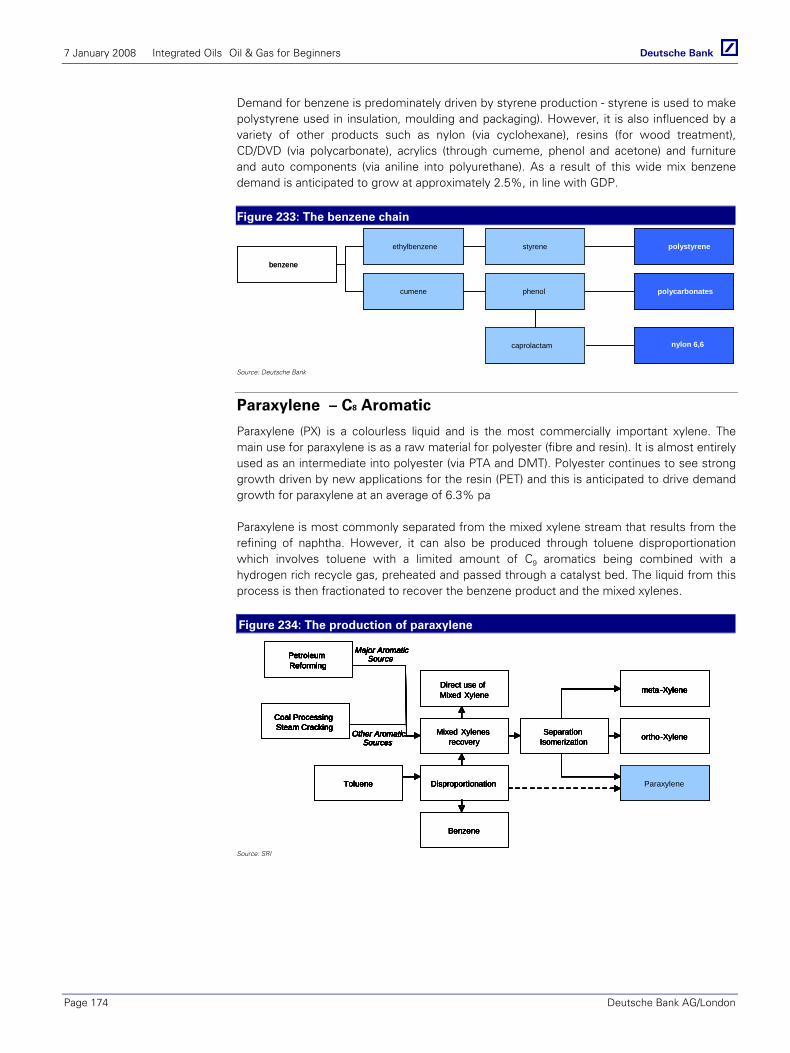
7 January 2008 Integrated Oils Oil & Gas for Beginners
Page 174 Deutsche Bank AG/London
Demand for benzene is predominately driven by styrene production - styrene is used to make polystyrene used in insulation, moulding and packaging). However, it is also influenced by a variety of other products such as nylon (via cyclohexane), resins (for wood treatment), CD/DVD (via polycarbonate), acrylics (through cumeme, phenol and acetone) and furniture and auto components (via aniline into polyurethane). As a result of this wide mix benzene demand is anticipated to grow at approximately 2.5%, in line with GDP.
Figure 233: The benzene chain
benzene
ethylbenzene styrene
cumene phenol
caprolactam nylon 6,6
polycarbonates
polystyrene
benzene
ethylbenzene styrene
cumene phenol
caprolactam nylon 6,6
polycarbonates
polystyrene
Source: Deutsche Bank
Paraxylene – C8 Aromatic
Paraxylene (PX) is a colourless liquid and is the most commercially important xylene. The main use for paraxylene is as a raw material for polyester (fibre and resin). It is almost entirely used as an intermediate into polyester (via PTA and DMT). Polyester continues to see strong growth driven by new applications for the resin (PET) and this is anticipated to drive demand growth for paraxylene at an average of 6.3% pa
Paraxylene is most commonly separated from the mixed xylene stream that results from the refining of naphtha. However, it can also be produced through toluene disproportionation which involves toluene with a limited amount of C9 aromatics being combined with a hydrogen rich recycle gas, preheated and passed through a catalyst bed. The liquid from this process is then fractionated to recover the benzene product and the mixed xylenes.
Figure 234: The production of paraxylene
meta-Xylene
Coal Processing Steam Cracking
Petroleum Reforming
Other Aromatic Sources
Major Aromatic Source
Paraxylene
Benzene
DisproportionationToluene
Mixed Xylenesrecovery
Direct use of Mixed Xylene
Separation Isomerization ortho-Xylene
meta-Xylene
Coal Processing Steam Cracking
Petroleum Reforming
Other Aromatic Sources
Major Aromatic Source
Paraxylene
Benzene
DisproportionationToluene
Mixed Xylenesrecovery
Direct use of Mixed Xylene
Separation Isomerization ortho-Xylene
meta-Xylene
Coal Processing Steam Cracking
Petroleum Reforming
Other Aromatic Sources
Major Aromatic Source
meta-Xylene
Coal Processing Steam Cracking
Petroleum Reforming
Other Aromatic Sources
Major Aromatic Source
Paraxylene
Benzene
DisproportionationToluene
Mixed Xylenesrecovery
Direct use of Mixed Xylene
Separation Isomerization ortho-Xylene
meta-Xylene
Coal Processing Steam Cracking
Petroleum Reforming
Other Aromatic Sources
Major Aromatic Source
Paraxylene
Benzene
DisproportionationToluene
meta-Xylene
Coal Processing Steam Cracking
Petroleum Reforming
Other Aromatic Sources
Major Aromatic Source
Paraxylene
Benzene
DisproportionationToluene
Mixed Xylenesrecovery
Direct use of Mixed Xylene
Separation Isomerization ortho-Xylene
meta-Xylene
Coal Processing Steam Cracking
Petroleum Reforming
Other Aromatic Sources
Major Aromatic Source
Paraxylene
Benzene
DisproportionationToluene
Mixed Xylenesrecovery
Direct use of Mixed Xylene
Separation Isomerization ortho-Xylene
meta-Xylene
Coal Processing Steam Cracking
Petroleum Reforming
Other Aromatic Sources
Major Aromatic Source
Source: SRI
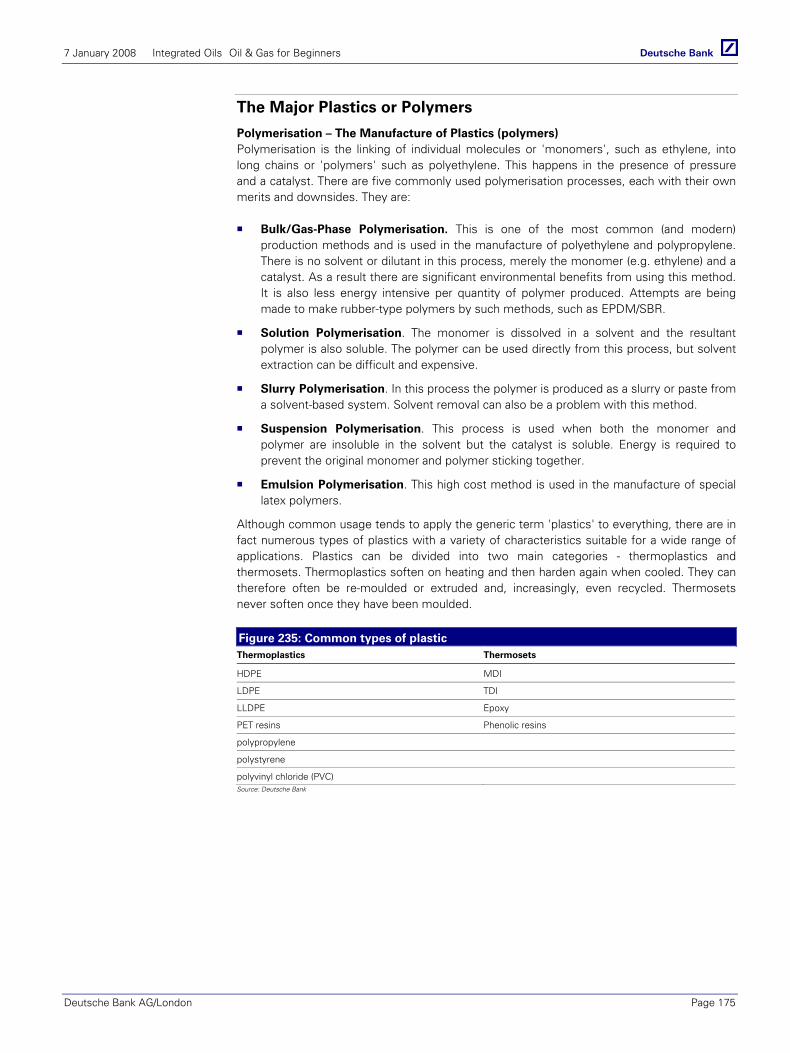
7 January 2008 Integrated Oils Oil & Gas for Beginners
Deutsche Bank AG/London Page 175
The Major Plastics or Polymers
Polymerisation – The Manufacture of Plastics (polymers) Polymerisation is the linking of individual molecules or 'monomers', such as ethylene, into long chains or 'polymers' such as polyethylene. This happens in the presence of pressure and a catalyst. There are five commonly used polymerisation processes, each with their own merits and downsides. They are:
Bulk/Gas-Phase Polymerisation. This is one of the most common (and modern) production methods and is used in the manufacture of polyethylene and polypropylene. There is no solvent or dilutant in this process, merely the monomer (e.g. ethylene) and a catalyst. As a result there are significant environmental benefits from using this method. It is also less energy intensive per quantity of polymer produced. Attempts are being made to make rubber-type polymers by such methods, such as EPDM/SBR.
Solution Polymerisation. The monomer is dissolved in a solvent and the resultant polymer is also soluble. The polymer can be used directly from this process, but solvent extraction can be difficult and expensive.
Slurry Polymerisation. In this process the polymer is produced as a slurry or paste from a solvent-based system. Solvent removal can also be a problem with this method.
Suspension Polymerisation. This process is used when both the monomer and polymer are insoluble in the solvent but the catalyst is soluble. Energy is required to prevent the original monomer and polymer sticking together.
Emulsion Polymerisation. This high cost method is used in the manufacture of special latex polymers.
Although common usage tends to apply the generic term 'plastics' to everything, there are in fact numerous types of plastics with a variety of characteristics suitable for a wide range of applications. Plastics can be divided into two main categories - thermoplastics and thermosets. Thermoplastics soften on heating and then harden again when cooled. They can therefore often be re-moulded or extruded and, increasingly, even recycled. Thermosets never soften once they have been moulded.
Figure 235: Common types of plastic Thermoplastics Thermosets
HDPE MDI
LDPE TDI
LLDPE Epoxy
PET resins Phenolic resins
polypropylene
polystyrene
polyvinyl chloride (PVC) Source: Deutsche Bank
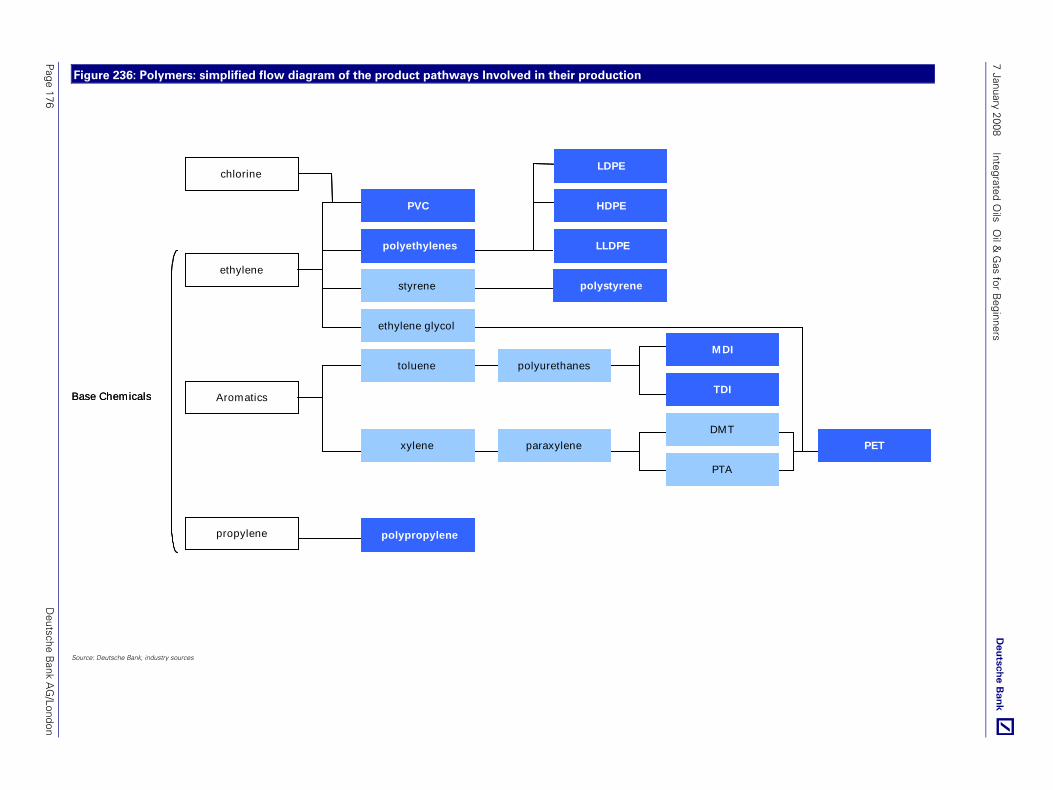
7 January 2008 Integrated O
ils O
il & G
as for Beginners
Page 176
Deutsche B
ank AG
/London
Figure 236: Polymers: simplified flow diagram of the product pathways Involved in their production
polypropylenepropylene
Base Chemicals
ethylene
Aromatics
xylene
toluene polyurethanesMDI
TDI
paraxyleneDMT
PTA
PET
ethylene glycol
styrene polystyrene
LLDPE
HDPE
LDPE
PVC
polyethylenes
chlorine
polypropylenepropylene
Base Chemicals
ethylene
Aromatics
xylene
toluene polyurethanesMDI
TDI
paraxyleneDMT
PTA
PET
ethylene glycol
styrene polystyrene
LLDPE
HDPE
LDPE
PVC
polyethylenes
chlorine
Source: Deutsche Bank, industry sources

7 January 2008 Integrated Oils Oil & Gas for Beginners
Deutsche Bank AG/London Page 177
Polyethylene (PE)
57% of all ethylene produced globally is polymerised to form polyethylene (PE), the most widely used plastic. It is produced in three different forms (HDPE, LLDPE and LDPE) each of which have different properties giving it a wide range of applications. HDPE and LLDPE are often manufactured in the same production facilities. Production can 'swing' from the manufacture of one to the other. LDPE production facilities are dedicated to that product alone. The different ‘grades’ of each polyethylene are produced using different combinations of pressure, temperature or additives. High density polyethylene (HDPE) is a rigid plastic. It is mainly used for rigid packaging items such as detergent or milk bottles, crates or car fuel tanks. Linear low density polyethylene (LLDPE) is a tough plastic which has other monomers such as butane or octane added to it. It is mainly used in the manufacture of films for plastic bags, sheets, plastic wraps and heavy-duty applications, for example, agricultural film. LDPE was the first grade of polyethylene, produced in 1933 by ICI, made at high temperature and pressure. It is a more flexible plastic than HDPE, is and its main uses are in carrier bags, films and 'squeezable' applications such as toothpaste tubes
Long-term HDPE grows at around 2x GDP. LLDPE is experiencing stronger demand growth than both HDPE and LDPE, at around 2-2.5x GDP. LLDPE is gradually replacing LDPE in a range of applications. It has the advantage of a wider range of properties and a more flexible manufacturing process.
Polypropylene
Polypropylene (PP), which is produced in several grades, has a wide range of applications across the industrial, automotive and domestic sectors from injection moulding (car dashboards and toys) to fibres. Although less tough than LDPE, it is much less brittle than HDPE. This allows polypropylene to be used as a replacement for engineering plastics, such as ABS. Polypropylene has very good resistance to fatigue, so that most plastic hinges, such as those on flip-top bottles, are made from this material. Polypropylene demand is growing more rapidly than that of polyethylene, driven by the discovery of new applications such as the substitution of ABS and other engineering plastics. In the coming four years we anticipate growth of on average 5.5% pa
Purified Terephthalic Acid (PTA)
Purified terephthalic acid is a white, water-insoluble powder obtained from the oxidation of paraxylene with the solvent acetic acid. It is used primarily in the manufacture of polyester (either resin called PET or fibre). PTA is also known at TPA (terephthalic acid). Demand growth in PTA is expected by DB to remain strong, averaging 6.5% pa, although we also anticipate this will be outpaced by growth in capacity of 9% over the same period so pressuring margins. The industry’s leading producer is BP.
Figure 237: Production and end uses of PTA
mixed xylenes
Apparel, home, textiles
Water, drink & food containers
4%
83%
12%
1%ethylene glycolacetic acid
paraxylene PTA PET
PET Fibre
PET Solid State
PET Film
EngineeringResins Automotive
Packaging
Source: SRI

7 January 2008 Integrated O
ils O
il & G
as for Beginners
Page 178
Deutsche B
ank AG
/London
Figure 238: Organic chemistry - simplified flow diagram of the derivatives from petrochemical production
Styrene acrylonitrile
caustic soda
natural gas
methane
ethane ethylene
ethylene oxide ethylene glycol
polyethylene
ethyl benzene
C4
benzene
styrene
cylohexane
nitrobenzene MDI
polystyrene caprolactam
Adipic Acid
cumene
propylene polypropylene
acylonitrile
acrylic acidpolyacrylonitrile Acylic fibres
chlorine
Raw Material
Intermediate
End Product
PVC
salt
VCM
ldPE
hdPE
lldPE
DMT
MMA
Phenolic resins phenol
acetone
TDInitrolenetoluene
xylene paraxylene
nylon 6
nylon 6,6
polyester
PTA
isobutane isobutylene
butadiene
olefins hexene
butene
octene ABS
MTBE
methanol
polybutadiene
acetic acid
LPG
oil naphtha
aromatics
Source: Deutsche Bank and SRI
7 January 2008 Integrated Oils Oil & Gas for Beginners
Deutsche Bank AG/London Page 179
Conventionals & Unconventionals Conventionals
LNG
Deepwater
NGLs and Condensates
Unconventionals
Canada’s Oil Sands
Gas-to-Liquids
Coal Bed Methane
Tight Gas

7 January 2008 Integrated Oils Oil & Gas for Beginners
Page 180 Deutsche Bank AG/London
Liquefied Natural Gas (LNG) Overview
Liquefied natural gas (LNG) is produced when natural gas (predominantly methane) is cooled to a temperature of -162°c at atmospheric pressure and condenses to a liquid occupying about a 600th of the volume of natural gas. It is a process that is typically used in order to transport natural gas from a stranded and remote location of origin to a consuming region where to do so by pipeline would prove uneconomic either because of distance (typically 1500km or more) or for technical reasons (i.e. the need to cross deepwater). The process is very capital intensive, requiring substantial upfront investment. As a result, in order to prove economic LNG projects require a large gas resource (at least 5tcf) with the LNG produced generally being pre-sold under long term (20 year) take or pay contracts using an agreed price formula. Importantly, as the major consuming markets of the west (USA, UK, etc) move from a position of self sufficiency in natural gas supply to one of deficit, demand for LNG is growing at an estimated 10-12% per annum. In 2006 LNG capacity at the world’s 18 LNG facilities stood at an estimated 165 million tonnes per annum and represented around 7% of global gas consumption. By 2020, production is expected to stand at around 560mtpa from 38 facilities, a 15 year CAGR of 10%. Major producing countries include Qatar, Nigeria, Indonesia and Australia whilst the major IOCs involved in the production and marketing of LNG include Shell, Exxon and Total.
A brief history Relative to both oil and piped gas, the LNG industry is still very much in its infancy. Efforts to liquefy gas for storage commenced in the early 1900s but it wasn’t until 1959 that the world’s first LNG ship carried a cargo from the US to the UK, proving the potential for LNG to be transported. Five years later the UK began importing 1mtpa of LNG from Algeria under a 15 year contract with gas sourced from Algeria’s huge Saharan gas reserves, so establishing the Algerian state oil company Sonatrach as the world’s first major LNG exporter. This was followed by the 1969 start up of Alaska’s Kenai facility, the output from which was sold under long term contract to Japan’s Tokyo Gas and Tokyo Electric and shortly after, in 1970, the start-up of Libya’s Marsa El Brega facility, with LNG sold into southern European markets.
Figure 239: Global un-contracted gas reserves and the technical reserves of the
industry majors appropriate for an LNG solution (tcf)
939
1,885
196
148
114 108
53
4713
West Africa (Nigeria)
Russia
Australia
Asia (Indonesia, Malaysia)
North Africa (Libya, Algeria, Egypt)
Latin America(Venezuela)
North America
Middle East(Qatar, Iran)
Central Asia
Gas likely to require an LNG option at the majors
0
10
20
30
40
50
60
Chevron RDS BP XOM* Total
Other
Venezuela
Africa
Asia
Australia
TCF
Source: Wood Mackenzie; Deutsche Bank
Liquefied natural gas (LNG)
is produced when natural
gas (predominantly
methane) is cooled to a
temperature of -162°c at
atmospheric pressure
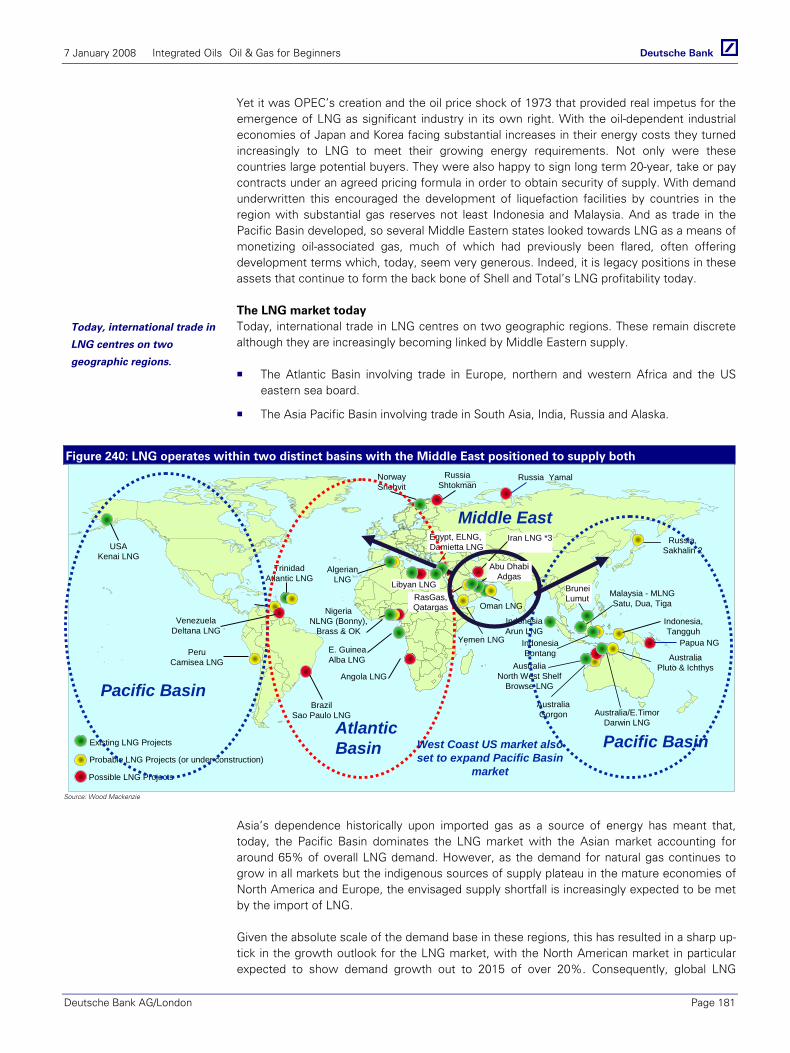
7 January 2008 Integrated Oils Oil & Gas for Beginners
Deutsche Bank AG/London Page 181
Yet it was OPEC’s creation and the oil price shock of 1973 that provided real impetus for the emergence of LNG as significant industry in its own right. With the oil-dependent industrial economies of Japan and Korea facing substantial increases in their energy costs they turned increasingly to LNG to meet their growing energy requirements. Not only were these countries large potential buyers. They were also happy to sign long term 20-year, take or pay contracts under an agreed pricing formula in order to obtain security of supply. With demand underwritten this encouraged the development of liquefaction facilities by countries in the region with substantial gas reserves not least Indonesia and Malaysia. And as trade in the Pacific Basin developed, so several Middle Eastern states looked towards LNG as a means of monetizing oil-associated gas, much of which had previously been flared, often offering development terms which, today, seem very generous. Indeed, it is legacy positions in these assets that continue to form the back bone of Shell and Total’s LNG profitability today.
The LNG market today Today, international trade in LNG centres on two geographic regions. These remain discrete although they are increasingly becoming linked by Middle Eastern supply.
The Atlantic Basin involving trade in Europe, northern and western Africa and the US eastern sea board.
The Asia Pacific Basin involving trade in South Asia, India, Russia and Alaska.
Figure 240: LNG operates within two distinct basins with the Middle East positioned to supply both
Existing LNG Projects
BruneiLumut Malaysia - MLNG
Satu, Dua, Tiga
Russia, Sakhalin 2
Probable LNG Projects (or under construction)
Possible LNG Projects
AustraliaGorgon
Egypt, ELNG, Damietta LNG
Oman LNG
AustraliaPluto & IchthysAustralia
North West ShelfBrowse LNG
NigeriaNLNG (Bonny),
Brass & OK
PeruCamisea LNG
USAKenai LNG
Libyan LNG
Algerian LNG
RasGas, Qatargas
Iran LNG *3
Yemen LNG
TrinidadAtlantic LNG
IndonesiaArun LNG
IndonesiaBontang
Indonesia, Tangguh
NorwaySnohvit
VenezuelaDeltana LNG
Australia/E.TimorDarwin LNG
E. GuineaAlba LNG
Angola LNG
RussiaShtokman
BrazilSao Paulo LNG
Pacific Basin
Pacific BasinAtlantic Basin
Middle East
Abu DhabiAdgas
West Coast US market also set to expand Pacific Basin
market
Papua NG
Russia Yamal
Source: Wood Mackenzie
Asia’s dependence historically upon imported gas as a source of energy has meant that, today, the Pacific Basin dominates the LNG market with the Asian market accounting for around 65% of overall LNG demand. However, as the demand for natural gas continues to grow in all markets but the indigenous sources of supply plateau in the mature economies of North America and Europe, the envisaged supply shortfall is increasingly expected to be met by the import of LNG.
Given the absolute scale of the demand base in these regions, this has resulted in a sharp up-tick in the growth outlook for the LNG market, with the North American market in particular expected to show demand growth out to 2015 of over 20%. Consequently, global LNG
Today, international trade in
LNG centres on two
geographic regions.
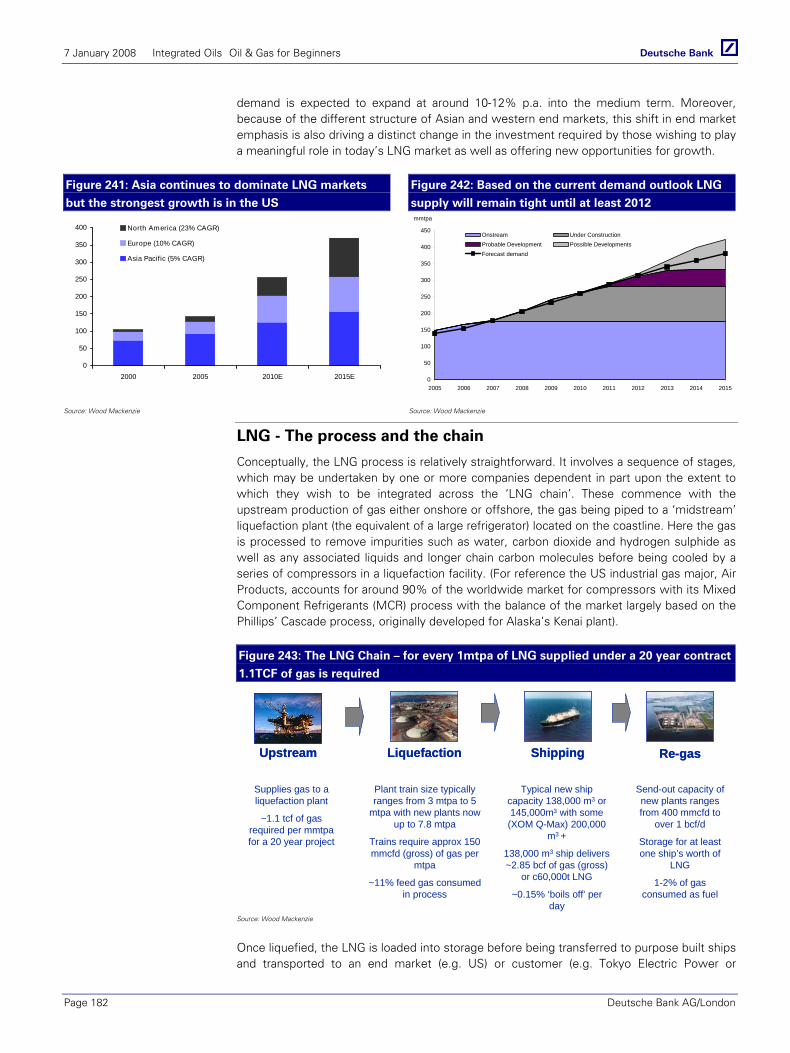
7 January 2008 Integrated Oils Oil & Gas for Beginners
Page 182 Deutsche Bank AG/London
demand is expected to expand at around 10-12% p.a. into the medium term. Moreover, because of the different structure of Asian and western end markets, this shift in end market emphasis is also driving a distinct change in the investment required by those wishing to play a meaningful role in today’s LNG market as well as offering new opportunities for growth.
Figure 241: Asia continues to dominate LNG markets
but the strongest growth is in the US
Figure 242: Based on the current demand outlook LNG
supply will remain tight until at least 2012
0
50
100
150
200
250
300
350
400
2000 2005 2010E 2015E
North America (23% CAGR)
Europe (10% CAGR)
Asia Pacific (5% CAGR)
0
50
100
150
200
250
300
350
400
450
2005 2006 2007 2008 2009 2010 2011 2012 2013 2014 2015
Onstream Under ConstructionProbable Development Possible DevelopmentsForecast demand
mmtpa
Source: Wood Mackenzie Source: Wood Mackenzie
LNG - The process and the chain
Conceptually, the LNG process is relatively straightforward. It involves a sequence of stages, which may be undertaken by one or more companies dependent in part upon the extent to which they wish to be integrated across the ‘LNG chain’. These commence with the upstream production of gas either onshore or offshore, the gas being piped to a ‘midstream’ liquefaction plant (the equivalent of a large refrigerator) located on the coastline. Here the gas is processed to remove impurities such as water, carbon dioxide and hydrogen sulphide as well as any associated liquids and longer chain carbon molecules before being cooled by a series of compressors in a liquefaction facility. (For reference the US industrial gas major, Air Products, accounts for around 90% of the worldwide market for compressors with its Mixed Component Refrigerants (MCR) process with the balance of the market largely based on the Phillips’ Cascade process, originally developed for Alaska’s Kenai plant).
Figure 243: The LNG Chain – for every 1mtpa of LNG supplied under a 20 year contract
1.1TCF of gas is required
Plant train size typically ranges from 3 mtpa to 5
mtpa with new plants now up to 7.8 mtpa
Trains require approx 150 mmcfd (gross) of gas per
mtpa
~11% feed gas consumed in process
Typical new ship capacity 138,000 m3 or 145,000m3 with some (XOM Q-Max) 200,000
m3 +
138,000 m3 ship delivers ~2.85 bcf of gas (gross)
or c60,000t LNG
~0.15% ‘boils off’ per day
Send-out capacity of new plants ranges from 400 mmcfd to
over 1 bcf/d
Storage for at least one ship’s worth of
LNG
1-2% of gas consumed as fuel
Supplies gas to a liquefaction plant
~1.1 tcf of gas required per mmtpa for a 20 year project
LiquefactionLiquefaction ShippingShipping Re-gasRe-gasUpstreamUpstream
Source: Wood Mackenzie
Once liquefied, the LNG is loaded into storage before being transferred to purpose built ships and transported to an end market (e.g. US) or customer (e.g. Tokyo Electric Power or

7 January 2008 Integrated Oils Oil & Gas for Beginners
Deutsche Bank AG/London Page 183
TEPCO). Upon arrival the liquefied gas will normally be transferred to an onshore storage facility where it will be held in liquid form before being passed through a re-gasification plant as, and when, it is required either for use in power generation by the dedicated contractor (e.g. TEPCO) or for sale into a gas hungry national gas market (e.g. US market).
LNG – returns across the chain
Given the different nature of the various activities along the chain and the levels of investment required, the return profile of each activity varies. In most instances the majority of the value associated with the gas molecule is either captured in the upstream or, depending upon the fiscal regime, within the liquefaction plant itself. This contrasts with the more typical cost of capital type returns associated with re-gasification and shipping, a return profile that reflects their utility nature. Not surprisingly, given the superior returns available from the upstream and liquefaction elements of the chain, it is within these two areas that the major oil companies have tended to invest.
Historically, the long-term bias of Asian buyers and their desire to ensure security of supply meant that they would invest in the utility-type assets necessary to transport the liquid gas and re-gasify it once it had come to port. For the major oils this meant that to a large extent they could avoid investment in those parts of the chain that tended to offer utility type returns and concentrate their capital investment in the higher added value upstream and liquefaction activities.
Figure 244: Investment proportions and returns across the LNG chain
US$1.25bn
(~35% investment)
US$0.85bn
(~25% investment)
US$0.325bn
(~10% investment)
US$1bn
(~30% investment)
LiquefactionLiquefaction ShippingShipping Re-gasUpstreamUpstream
8-12% if “tolling”
10-20% otherwise
8-10% 8-10%15-20% or above
“Utility businesses”
“Typ
ical
” Inv
estm
ent
(5 m
mtp
a pr
ojec
t)“T
ypic
al”
Ret
urn 13.7%
(weighted average based
on bold #’s)Players trade-off upstream and liquefaction returns depending upon project specifics
-------------------------------------------------- Returns -------------------------------------------------
---------------------------------------- Investment proportion--------------------------------------
Source: Wood Mackenzie
North America – driving integration across the chain. However, the change in regional emphasis in recent years is driving a change in integration across the LNG chain as well as the price basis of supply. In particular, the existence of a deep liquid, traded gas market in North America with visible pricing and readily available supply has curbed the indigenous buyer’s appetite to commit to long-term contracts or to invest in re-gas and shipping assets. Those wishing to gain access have thus had to push down the LNG chain, investing in re-gas and shipping. Importantly, with few US customers willing to underwrite a long term take-or-pay commitment for LNG, upstream producers have also had to commit to the 15-20 year contractual purchase of LNG, often from their own facilities in order to underwrite the construction of a new LNG supply facility and with it the monetization of their upstream resource. In part, this change in market structure has increased the risks associated with the LNG business through raising both market risk and the investment capital required to establish a position in the Atlantic Basin. It has, however, also opened up new market opportunities for those willing to commit to the long-term
In most instances the
majority of the value
associated with the gas
molecule is either captured
in the upstream or,
depending upon the fiscal
regime, within the
liquefaction plant itself
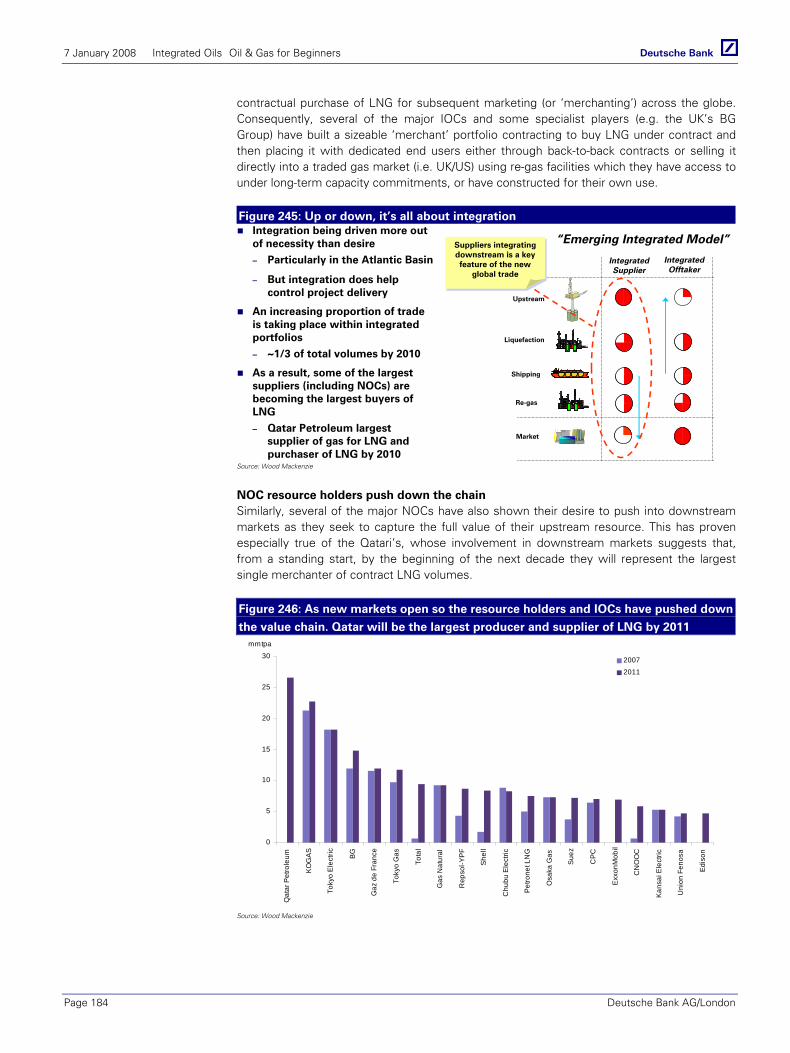
7 January 2008 Integrated Oils Oil & Gas for Beginners
Page 184 Deutsche Bank AG/London
contractual purchase of LNG for subsequent marketing (or ‘merchanting’) across the globe. Consequently, several of the major IOCs and some specialist players (e.g. the UK’s BG Group) have built a sizeable ‘merchant’ portfolio contracting to buy LNG under contract and then placing it with dedicated end users either through back-to-back contracts or selling it directly into a traded gas market (i.e. UK/US) using re-gas facilities which they have access to under long-term capacity commitments, or have constructed for their own use.
Figure 245: Up or down, it’s all about integration
Upstream
Market
Liquefaction
Shipping
Re-gas
Integrated Supplier
Integrated Offtaker
“Emerging Integrated Model”Suppliers integrating downstream is a key feature of the new
global trade
Suppliers integrating downstream is a key feature of the new
global trade
Integration being driven more out of necessity than desire
– Particularly in the Atlantic Basin
– But integration does help control project delivery
An increasing proportion of trade is taking place within integrated portfolios
– ~1/3 of total volumes by 2010
As a result, some of the largest suppliers (including NOCs) are becoming the largest buyers of LNG
– Qatar Petroleum largest supplier of gas for LNG and purchaser of LNG by 2010
Source: Wood Mackenzie
NOC resource holders push down the chain Similarly, several of the major NOCs have also shown their desire to push into downstream markets as they seek to capture the full value of their upstream resource. This has proven especially true of the Qatari’s, whose involvement in downstream markets suggests that, from a standing start, by the beginning of the next decade they will represent the largest single merchanter of contract LNG volumes.
Figure 246: As new markets open so the resource holders and IOCs have pushed down
the value chain. Qatar will be the largest producer and supplier of LNG by 2011
0
5
10
15
20
25
30
Qat
ar P
etro
leum
KO
GA
S
Toky
o E
lect
ric BG
Gaz
de
Fran
ce
Toky
o G
as
Tota
l
Gas
Nat
ural
Rep
sol-Y
PF
She
ll
Chu
bu E
lect
ric
Pet
rone
t LN
G
Osa
ka G
as
Sue
z
CP
C
Exxo
nMob
il
CN
OO
C
Kan
sai E
lect
ric
Uni
on F
enos
a
Edi
son
mmtpa
2007
2011
Source: Wood Mackenzie

7 January 2008 Integrated Oils Oil & Gas for Beginners
Deutsche Bank AG/London Page 185
A contract market – but with a growing tendency to shorter term deals The emergence of North America as an end market also holds potential implication for the growth of spot or short term contract trades. Because of the capital investment required, to launch a project without firm buyers was perceived as too great a risk. As a consequence, the LNG market has historically been largely contract based, little more than 5-10% of the market at any one time being represented by spot trades. Although we see little likelihood of future LNG facilities being built without firm supply contracts being in place, the growing presence of the IOC’s and NOC’s as the buyers of LNG for subsequent resale suggests that the short term market for LNG cargoes is, if anything, likely to increase.
Figure 247: Spot/short term LNG trades – growing in size and number
101120 116
164
132
252
298313
348
195
0
50
100
150
200
250
300
350
400
1996 1997 1998 1999 2000 2001 2002 2003 2004 20050%
2%
4%
6%
8%
10%
12%
14%
Spot Cargoes (LHS)Spot market as % LNG trade (RHS)
Num
ber o
f spo
t car
goes
% LN
G m
arket traded as spot/short term
Source: Wood Mackenzie
Pricing of LNG
As a contract business with terms negotiated individually between supplier and purchaser the pricing structure of one LNG contract is almost certain to differ in some way from that of another. Pricing is also complicated by the absence in all but the UK and North America of deep, liquid, traded markets for natural gas, a feature of gas markets that has meant pricing between regions is dislocated and in certain situations open to arbitrage.
Traditionally, however, with the LNG market dominated by Asian purchasers the main pricing mechanisms have tended to be similar with the price paid per unit of delivered gas indexed against either crude oil or a basket of energy alternatives in a manner that broadly reflects its energy equivalence. Thus Japan uses a mixture of imported crude oils otherwise known as the Japan Crude Cocktail or JCC whilst the typical proxy for sales to European buyers is likely to be an energy index comprising oil, oil products and coal.
Moreover, in order to provide the seller with some protection on the downside and the buyer relief against upward spikes in the oil price, Asian and western European contracts have also tended to have in-built caps and collars. As a consequence, relative to an oil or energy index, the LNG price curve has tended to look a little like the letter S with pricing steady at both low and high oil prices but rising in an almost linear fashion in between.
North America – changing the basis of price The growth of the US as a market for LNG has, however, seen the emergence of contracts which use the market derived, quoted Henry Hub gas price as the basis for contract pricing, buyers paying a fixed percentage of the prevailing Henry Hub price for delivered gas. Not only has this added greater transparency to LNG pricing. With the US a potential home for
The LNG market has
historically been largely
contract based
15% 10 yr CAGR
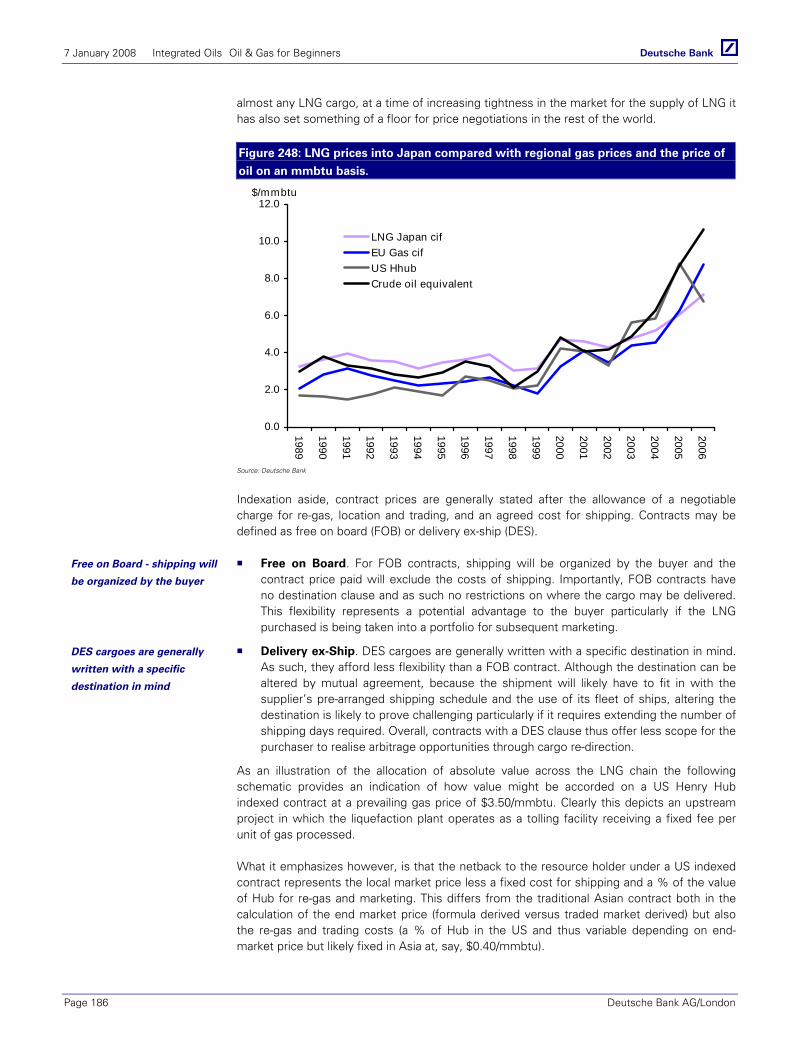
7 January 2008 Integrated Oils Oil & Gas for Beginners
Page 186 Deutsche Bank AG/London
almost any LNG cargo, at a time of increasing tightness in the market for the supply of LNG it has also set something of a floor for price negotiations in the rest of the world.
Figure 248: LNG prices into Japan compared with regional gas prices and the price of
oil on an mmbtu basis.
0.0
2.0
4.0
6.0
8.0
10.0
12.0
1989
1990
1991
1992
1993
1994
1995
1996
1997
1998
1999
2000
2001
2002
2003
2004
2005
2006
LNG Japan cifEU Gas cifUS HhubCrude oil equivalent
$/mmbtu
Source: Deutsche Bank
Indexation aside, contract prices are generally stated after the allowance of a negotiable charge for re-gas, location and trading, and an agreed cost for shipping. Contracts may be defined as free on board (FOB) or delivery ex-ship (DES).
Free on Board. For FOB contracts, shipping will be organized by the buyer and the contract price paid will exclude the costs of shipping. Importantly, FOB contracts have no destination clause and as such no restrictions on where the cargo may be delivered. This flexibility represents a potential advantage to the buyer particularly if the LNG purchased is being taken into a portfolio for subsequent marketing.
Delivery ex-Ship. DES cargoes are generally written with a specific destination in mind. As such, they afford less flexibility than a FOB contract. Although the destination can be altered by mutual agreement, because the shipment will likely have to fit in with the supplier’s pre-arranged shipping schedule and the use of its fleet of ships, altering the destination is likely to prove challenging particularly if it requires extending the number of shipping days required. Overall, contracts with a DES clause thus offer less scope for the purchaser to realise arbitrage opportunities through cargo re-direction.
As an illustration of the allocation of absolute value across the LNG chain the following schematic provides an indication of how value might be accorded on a US Henry Hub indexed contract at a prevailing gas price of $3.50/mmbtu. Clearly this depicts an upstream project in which the liquefaction plant operates as a tolling facility receiving a fixed fee per unit of gas processed.
What it emphasizes however, is that the netback to the resource holder under a US indexed contract represents the local market price less a fixed cost for shipping and a % of the value of Hub for re-gas and marketing. This differs from the traditional Asian contract both in the calculation of the end market price (formula derived versus traded market derived) but also the re-gas and trading costs (a % of Hub in the US and thus variable depending on end-market price but likely fixed in Asia at, say, $0.40/mmbtu).
Free on Board - shipping will
be organized by the buyer
DES cargoes are generally
written with a specific
destination in mind
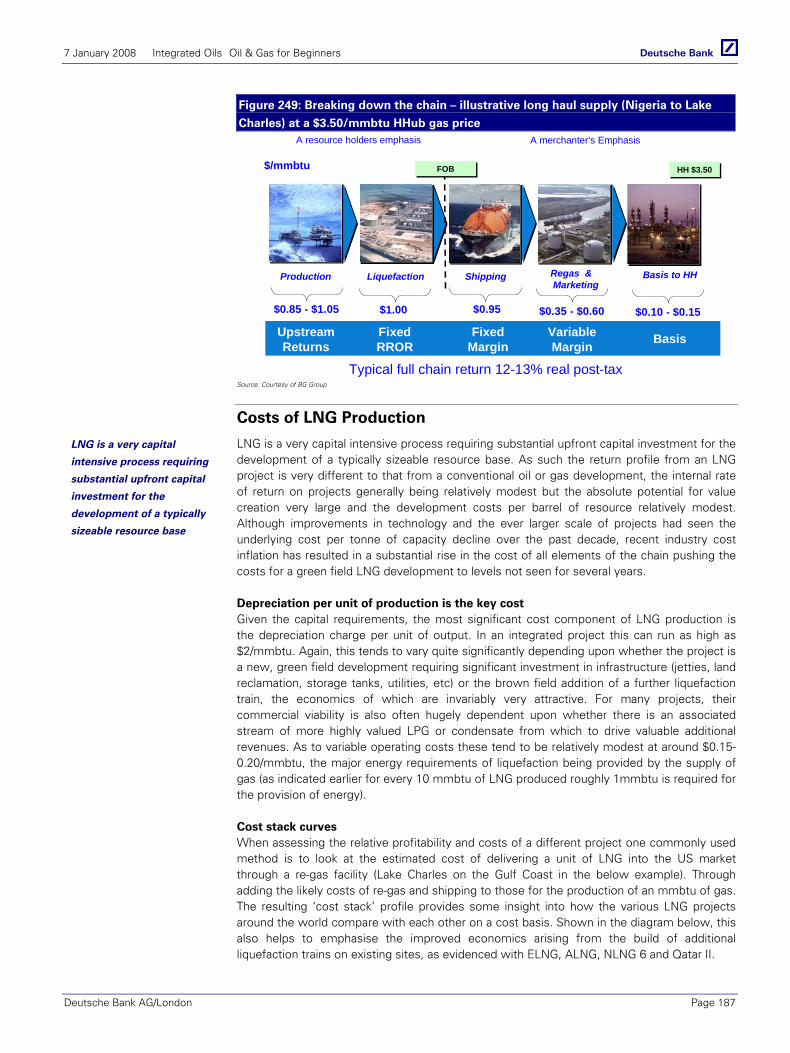
7 January 2008 Integrated Oils Oil & Gas for Beginners
Deutsche Bank AG/London Page 187
Figure 249: Breaking down the chain – illustrative long haul supply (Nigeria to Lake
Charles) at a $3.50/mmbtu HHub gas price
Typical full chain return 12-13% real post-tax
Production Liquefaction Shipping Regas & Marketing
$1.00 $0.95 $0.35 - $0.60
FOBFOB HH $3.50 HH $3.50
$0.85 - $1.05
$/mmbtu
Basis to HH
$0.10 - $0.15
Variable Margin
FixedMargin
Fixed RROR
UpstreamReturns Basis
A merchanter’s EmphasisA resource holders emphasis
Source: Courtesy of BG Group
Costs of LNG Production
LNG is a very capital intensive process requiring substantial upfront capital investment for the development of a typically sizeable resource base. As such the return profile from an LNG project is very different to that from a conventional oil or gas development, the internal rate of return on projects generally being relatively modest but the absolute potential for value creation very large and the development costs per barrel of resource relatively modest. Although improvements in technology and the ever larger scale of projects had seen the underlying cost per tonne of capacity decline over the past decade, recent industry cost inflation has resulted in a substantial rise in the cost of all elements of the chain pushing the costs for a green field LNG development to levels not seen for several years.
Depreciation per unit of production is the key cost Given the capital requirements, the most significant cost component of LNG production is the depreciation charge per unit of output. In an integrated project this can run as high as $2/mmbtu. Again, this tends to vary quite significantly depending upon whether the project is a new, green field development requiring significant investment in infrastructure (jetties, land reclamation, storage tanks, utilities, etc) or the brown field addition of a further liquefaction train, the economics of which are invariably very attractive. For many projects, their commercial viability is also often hugely dependent upon whether there is an associated stream of more highly valued LPG or condensate from which to drive valuable additional revenues. As to variable operating costs these tend to be relatively modest at around $0.15-0.20/mmbtu, the major energy requirements of liquefaction being provided by the supply of gas (as indicated earlier for every 10 mmbtu of LNG produced roughly 1mmbtu is required for the provision of energy).
Cost stack curves When assessing the relative profitability and costs of a different project one commonly used method is to look at the estimated cost of delivering a unit of LNG into the US market through a re-gas facility (Lake Charles on the Gulf Coast in the below example). Through adding the likely costs of re-gas and shipping to those for the production of an mmbtu of gas. The resulting ‘cost stack’ profile provides some insight into how the various LNG projects around the world compare with each other on a cost basis. Shown in the diagram below, this also helps to emphasise the improved economics arising from the build of additional liquefaction trains on existing sites, as evidenced with ELNG, ALNG, NLNG 6 and Qatar II.
LNG is a very capital
intensive process requiring
substantial upfront capital
investment for the
development of a typically
sizeable resource base
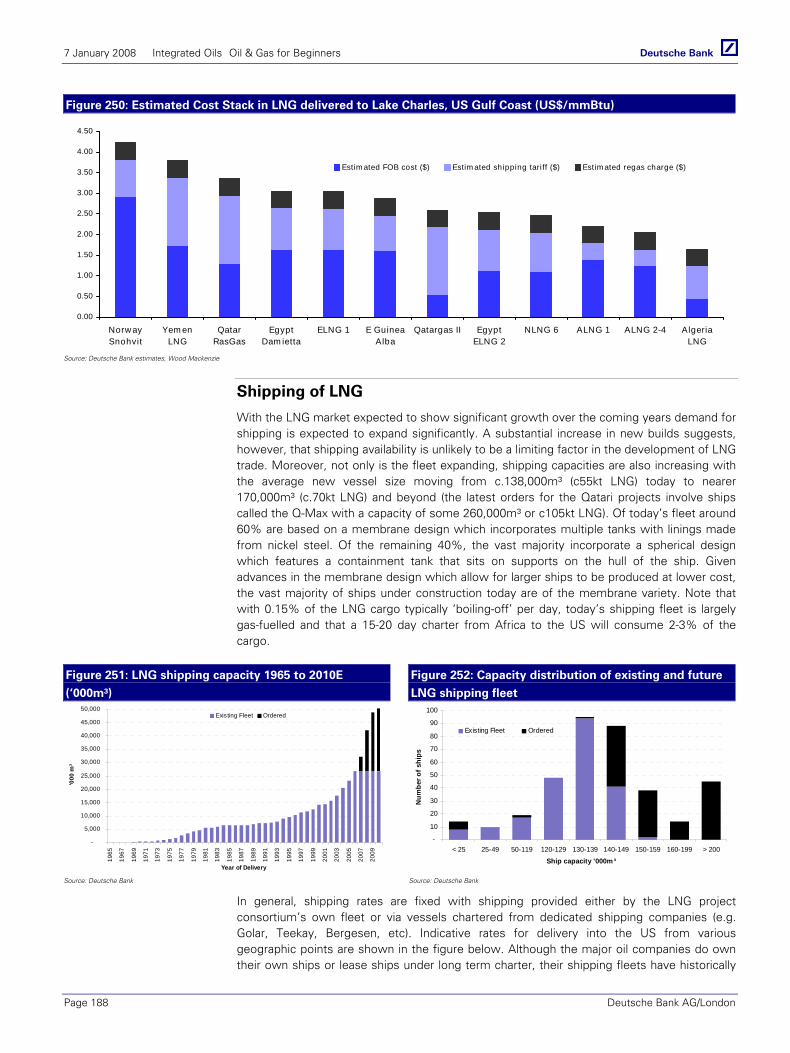
7 January 2008 Integrated Oils Oil & Gas for Beginners
Page 188 Deutsche Bank AG/London
Figure 250: Estimated Cost Stack in LNG delivered to Lake Charles, US Gulf Coast (US$/mmBtu)
0.00
0.50
1.00
1.50
2.00
2.50
3.00
3.50
4.00
4.50
Norw aySnohvit
Yem enLNG
QatarRasGas
EgyptDam ietta
ELNG 1 E GuineaAlba
Qatargas II EgyptELNG 2
NLNG 6 ALNG 1 ALNG 2-4 AlgeriaLNG
Estim ated FOB cost ($) Estim ated shipping tariff ($) Estim ated regas charge ($)
Source: Deutsche Bank estimates, Wood Mackenzie
Shipping of LNG
With the LNG market expected to show significant growth over the coming years demand for shipping is expected to expand significantly. A substantial increase in new builds suggests, however, that shipping availability is unlikely to be a limiting factor in the development of LNG trade. Moreover, not only is the fleet expanding, shipping capacities are also increasing with the average new vessel size moving from c.138,000m³ (c55kt LNG) today to nearer 170,000m³ (c.70kt LNG) and beyond (the latest orders for the Qatari projects involve ships called the Q-Max with a capacity of some 260,000m³ or c105kt LNG). Of today’s fleet around 60% are based on a membrane design which incorporates multiple tanks with linings made from nickel steel. Of the remaining 40%, the vast majority incorporate a spherical design which features a containment tank that sits on supports on the hull of the ship. Given advances in the membrane design which allow for larger ships to be produced at lower cost, the vast majority of ships under construction today are of the membrane variety. Note that with 0.15% of the LNG cargo typically ‘boiling-off’ per day, today’s shipping fleet is largely gas-fuelled and that a 15-20 day charter from Africa to the US will consume 2-3% of the cargo.
Figure 251: LNG shipping capacity 1965 to 2010E
(‘000m³)
Figure 252: Capacity distribution of existing and future
LNG shipping fleet
-
5,000
10,000
15,000
20,000
25,000
30,000
35,000
40,000
45,000
50,000
1965
1967
1969
1971
1973
1975
1977
1979
1981
1983
1985
1987
1989
1991
1993
1995
1997
1999
2001
2003
2005
2007
2009
Year of Delivery
'000
m³
Existing Fleet Ordered
-
10
20
30
40
50
60
70
80
90
100
< 25 25-49 50-119 120-129 130-139 140-149 150-159 160-199 > 200
Ship capacity '000m³
Num
ber o
f shi
ps
Existing Fleet Ordered
Source: Deutsche Bank Source: Deutsche Bank
In general, shipping rates are fixed with shipping provided either by the LNG project consortium’s own fleet or via vessels chartered from dedicated shipping companies (e.g. Golar, Teekay, Bergesen, etc). Indicative rates for delivery into the US from various geographic points are shown in the figure below. Although the major oil companies do own their own ships or lease ships under long term charter, their shipping fleets have historically

7 January 2008 Integrated Oils Oil & Gas for Beginners
Deutsche Bank AG/London Page 189
been relatively modest. As mentioned earlier this reflected their desire not to invest in assets with utility type returns. The emergence of a more global market in LNG and with it increasing opportunities for price arbitrage has, however, seen some build in the shipping fleets of the IOC majors, not least BG, BP and RDS.
Figure 253: Representative LNG Shipping Rates ($/mmbtu)
Source: LNG Shipping Solutions
Re-gasification of LNG
Given the utility nature of the re-gas business, investment in re-gasification facilities was for a long time eschewed by the integrated oil companies. To the extent that facilities were required they were either constructed by the consumers of gas or specialist utility companies. The opening of new markets for LNG not least the US, UK, China and India has, however, placed added importance on having re-gas capacity rights in order to access these new and emerging markets. Moreover, through owning access rights in a multitude of different national markets, those companies involved in the marketing of LNG have been able to:
Take advantage of price discrepancies in different regional markets through diversion of cargoes (i.e. arbitrage price);
Reduce their dependence on any single market for the sale of their contracted gas;
Argue for higher prices from end-customers given their range of end-market options;
Negotiate more favourable terms of supply from upstream producers through arguing that they will be able to maximize the price achievable for the resource holder’s gas.
In general, re-gas assets outside of the United States are likely to be owned either in full or in part by the companies with capacity rights. Local market regulators may, however, insist that a proportion of any facility’s capacity remains available for all to use (i.e. grants open access rights) in order to ensure competition. By contrast, in the United States most of the facilities in existence at present are owned and operated by pipeline companies. Although these facilities are also termed ‘open access’, with firm capacity rights granted to companies that have subscribed to pay committed reservation fees for an agreed period (typically 20 years), the majority of facilities are in effect closed. These fees broadly cover the financing costs of the facility plus a return on capital that is regulated by the Federal Energy Regulatory Commission (FERC).
In the United States, there were concerns earlier in the decade that as demand for LNG grew insufficient re-gas capacity would be available to allow for the import of gas. However, with a
Re-gas capacity rights afford
access to new markets
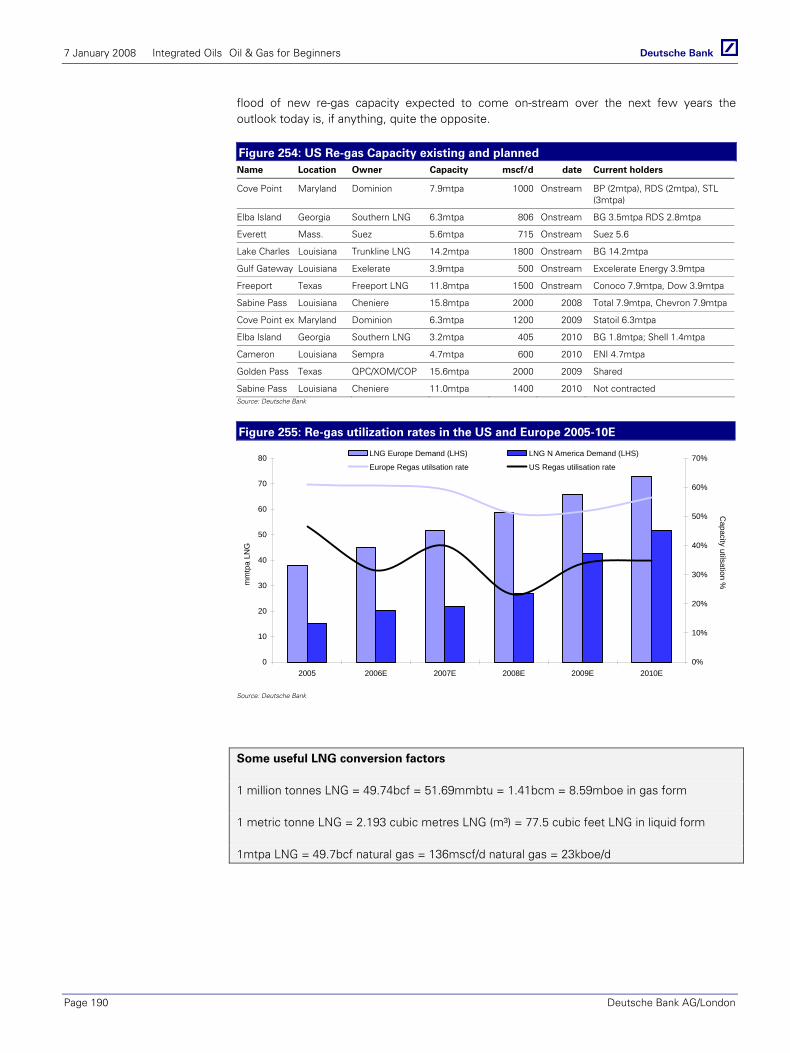
7 January 2008 Integrated Oils Oil & Gas for Beginners
Page 190 Deutsche Bank AG/London
flood of new re-gas capacity expected to come on-stream over the next few years the outlook today is, if anything, quite the opposite.
Figure 254: US Re-gas Capacity existing and planned Name Location Owner Capacity mscf/d date Current holders
Cove Point Maryland Dominion 7.9mtpa 1000 Onstream BP (2mtpa), RDS (2mtpa), STL (3mtpa)
Elba Island Georgia Southern LNG 6.3mtpa 806 Onstream BG 3.5mtpa RDS 2.8mtpa
Everett Mass. Suez 5.6mtpa 715 Onstream Suez 5.6
Lake Charles Louisiana Trunkline LNG 14.2mtpa 1800 Onstream BG 14.2mtpa
Gulf Gateway Louisiana Exelerate 3.9mtpa 500 Onstream Excelerate Energy 3.9mtpa
Freeport Texas Freeport LNG 11.8mtpa 1500 Onstream Conoco 7.9mtpa, Dow 3.9mtpa
Sabine Pass Louisiana Cheniere 15.8mtpa 2000 2008 Total 7.9mtpa, Chevron 7.9mtpa
Cove Point ex Maryland Dominion 6.3mtpa 1200 2009 Statoil 6.3mtpa
Elba Island Georgia Southern LNG 3.2mtpa 405 2010 BG 1.8mtpa; Shell 1.4mtpa
Cameron Louisiana Sempra 4.7mtpa 600 2010 ENI 4.7mtpa
Golden Pass Texas QPC/XOM/COP 15.6mtpa 2000 2009 Shared
Sabine Pass Louisiana Cheniere 11.0mtpa 1400 2010 Not contracted Source: Deutsche Bank
Figure 255: Re-gas utilization rates in the US and Europe 2005-10E
0
10
20
30
40
50
60
70
80
2005 2006E 2007E 2008E 2009E 2010E0%
10%
20%
30%
40%
50%
60%
70%LNG Europe Demand (LHS) LNG N America Demand (LHS)
Europe Regas utilsation rate US Regas utilisation rate
mm
tpa
LNG
Capacity utilsation %
Source: Deutsche Bank
Some useful LNG conversion factors
1 million tonnes LNG = 49.74bcf = 51.69mmbtu = 1.41bcm = 8.59mboe in gas form
1 metric tonne LNG = 2.193 cubic metres LNG (m³) = 77.5 cubic feet LNG in liquid form
1mtpa LNG = 49.7bcf natural gas = 136mscf/d natural gas = 23kboe/d
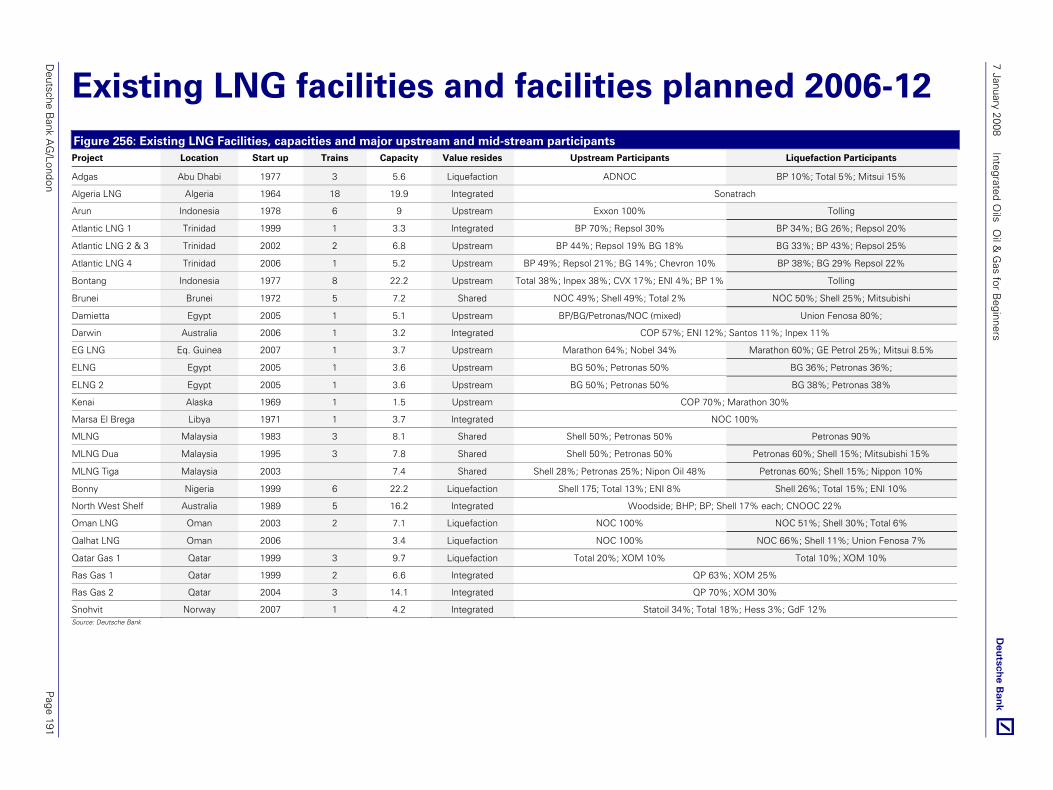
Deutsche B
ank AG
/London P
age 191
7 January 2008 Integrated O
ils O
il & G
as for Beginners
Existing LNG facilities and facilities planned 2006-12 Figure 256: Existing LNG Facilities, capacities and major upstream and mid-stream participants Project Location Start up Trains Capacity Value resides Upstream Participants Liquefaction Participants
Adgas Abu Dhabi 1977 3 5.6 Liquefaction ADNOC BP 10%; Total 5%; Mitsui 15%
Algeria LNG Algeria 1964 18 19.9 Integrated Sonatrach
Arun Indonesia 1978 6 9 Upstream Exxon 100% Tolling
Atlantic LNG 1 Trinidad 1999 1 3.3 Integrated BP 70%; Repsol 30% BP 34%; BG 26%; Repsol 20%
Atlantic LNG 2 & 3 Trinidad 2002 2 6.8 Upstream BP 44%; Repsol 19% BG 18% BG 33%; BP 43%; Repsol 25%
Atlantic LNG 4 Trinidad 2006 1 5.2 Upstream BP 49%; Repsol 21%; BG 14%; Chevron 10% BP 38%; BG 29% Repsol 22%
Bontang Indonesia 1977 8 22.2 Upstream Total 38%; Inpex 38%; CVX 17%; ENI 4%; BP 1% Tolling
Brunei Brunei 1972 5 7.2 Shared NOC 49%; Shell 49%; Total 2% NOC 50%; Shell 25%; Mitsubishi
Damietta Egypt 2005 1 5.1 Upstream BP/BG/Petronas/NOC (mixed) Union Fenosa 80%;
Darwin Australia 2006 1 3.2 Integrated COP 57%; ENI 12%; Santos 11%; Inpex 11%
EG LNG Eq. Guinea 2007 1 3.7 Upstream Marathon 64%; Nobel 34% Marathon 60%; GE Petrol 25%; Mitsui 8.5%
ELNG Egypt 2005 1 3.6 Upstream BG 50%; Petronas 50% BG 36%; Petronas 36%;
ELNG 2 Egypt 2005 1 3.6 Upstream BG 50%; Petronas 50% BG 38%; Petronas 38%
Kenai Alaska 1969 1 1.5 Upstream COP 70%; Marathon 30%
Marsa El Brega Libya 1971 1 3.7 Integrated NOC 100%
MLNG Malaysia 1983 3 8.1 Shared Shell 50%; Petronas 50% Petronas 90%
MLNG Dua Malaysia 1995 3 7.8 Shared Shell 50%; Petronas 50% Petronas 60%; Shell 15%; Mitsubishi 15%
MLNG Tiga Malaysia 2003 7.4 Shared Shell 28%; Petronas 25%; Nipon Oil 48% Petronas 60%; Shell 15%; Nippon 10%
Bonny Nigeria 1999 6 22.2 Liquefaction Shell 175; Total 13%; ENI 8% Shell 26%; Total 15%; ENI 10%
North West Shelf Australia 1989 5 16.2 Integrated Woodside; BHP; BP; Shell 17% each; CNOOC 22%
Oman LNG Oman 2003 2 7.1 Liquefaction NOC 100% NOC 51%; Shell 30%; Total 6%
Qalhat LNG Oman 2006 3.4 Liquefaction NOC 100% NOC 66%; Shell 11%; Union Fenosa 7%
Qatar Gas 1 Qatar 1999 3 9.7 Liquefaction Total 20%; XOM 10% Total 10%; XOM 10%
Ras Gas 1 Qatar 1999 2 6.6 Integrated QP 63%; XOM 25%
Ras Gas 2 Qatar 2004 3 14.1 Integrated QP 70%; XOM 30%
Snohvit Norway 2007 1 4.2 Integrated Statoil 34%; Total 18%; Hess 3%; GdF 12% Source: Deutsche Bank

7 January 2008 Integrated O
ils O
il & G
as for Beginners
Page 192
Deutsche B
ank AG
/London
Figure 257: LNG – Main planned projects 2007-12+E Project Country Start-up Scale
mtpa Gas inmscf
Main plant IOC's Main Upstream IOC's Project cost – LNG plant
FOB B/E (US$/mmbtu)
Buyers
2007
NLNG T6 Nigeria 2007 4.0 671 RDS 26%, TOTAL 15%, ENI 10% Shell 21%, ENI 7%, Total 17%, XOM 6%, US$1.3bn US$1.11 Shell, Total
EG LNGa Eq. Guinea 2007 3.7 675 Marathon 63.3%, Nobel 33.7%, Marathon 60%; Nobel 33.8% US$1.4bn US$1.40 BG
Snohvit Norway 2007 4.2 589 Statoil 34%, Total 18%, Hess 3% Statoil 34%, Total 18%, Hess 3% US$8.5bn US$4.05 Statoil, Iberdrola, Total, GdF
2008
Qatar II Qatar 2008 15.6 2251 XOM 23%, Total 8% XOM 23%, Total 8% US$6.0bn US$0.54 Total, XOM
Rasgas II (T4/5) Qatar 2008 14.1 2035 XOM 30% US$4.9bn US$1.08 Petronet, Endesa, Edison
NWS5 Australia 2007 4.2 478 Woodside, BHP, BP, CVX, RDS 12.5% each, CNOOC 25%
Woodside, BHP, BP, CVX, RDS 12.5% each, CNOOC 25%
US$1.4bn US$0.53u Kansai Electric, CNOOC
Sakhalin 2 Russia 2008 9.6 1507 Shell 55%, Mitsui 25%, Mitsubishi 20% US$22.3bn US$3.97 Tokyo Gas, TEPCO, Toho Gas,
Alba Eq. Guinea 2008 3.4 496 Marathon 75% Marathon 63% US$1.4bn US$1.36 BG
2009
Tangguh Indonesia 2008 8.0 1257 Gov Indonesia BP 37%, CNOOC 17% US$3bn US$0.87 CNOOC, POSCO, Sempra
Qatar III Qatar 2009 7.8 1200 COP 30% Integrated US$4.2bn US$0.22 COP
Yemen LNG Yemen 2010 6.65 1108 Total 40%, Hunt 18%, SK 10% Yemen Gas Company US$4.0bn US$1.83 KOGAS, Total, Tractebel
2010
Qatar IV Qatar 2011 7.8 1200 Shell 30% Integrated US$4.2bn US$0.22e RDS
Peru LNG Peru 2010 4.0 620 Hunt 50%, SK Corp 30%, Repsol 20%
Hunt 25%, Pluspetrol 27%, SK Corp 18%, Repsol, Sonatrach, Tecpetrol 10% each
US$1.7bn US$1.95 Repsol
2011
Pluto Australia 2011 5.0 800 Woodside 100% Woodside 100% US$5.5bn US$6.70 Tokyo Gas, Kansai Electric
NLNG 7 Nigeria 2011 8.0 1250 RDS 26%, TOTAL 15%, ENI 10% RDS21%, ENI7%, Total17%, XOM6%, US$6bn n.a. Unnamed
2012 plus
OK LNG** Nigeria 2012+ 22.0a 3300 CVX 20%, RDS 15%, TOT 5%, ENI 3% CVX 18.5%%, RDS 18.5%, BG 13.5% US$11.0bn US$2.19 Equity lifted
Angola LNG Angola 2011 5.0 750 Sonangol CVX 36.4, ENI, TOT, BP 13.6% each US$7.0bn USD3.36 Unnamed
Brass LNG** Nigeria 2012+ 10.0 1466 TOT/COP/ENI 17% each TOT 20%, ENI 10%, COP 10% US$6.00bn US$1.14 BG, BP, Suez, ENI, TOT
Gorgon** Australia 2013+ 10.0 1430 CVX 50%, RDS 25%, XOM 25% CVX 50%, RDS 25%, XOM 25% US$12.0bn US$3.44 RDS, CVX, CNPC
Ichthys Australia 2013 8.4 1300 Inpex; (76%) Total (24%) Inpex (76%), Total (24%) US$8bn n.a. Unnamed
PARS LNG Iran 2012+ 10.0 1600 Total 30%; Petronas 30% NIOC n.a. n.a. Petronas; Total; other
PNG LNG Papua NG 2012+ 6.4 1050 XOM 40%; Oil Search 30%; Santos 5% US$4bn n.a. n.a.
Shtokman LNG Russia 2014 7.8 1200 Gazprom 75%; Total 25% Gazprom 75%; Total 25% US$8bn n.a. n.a.
Source: Deutsche Bank
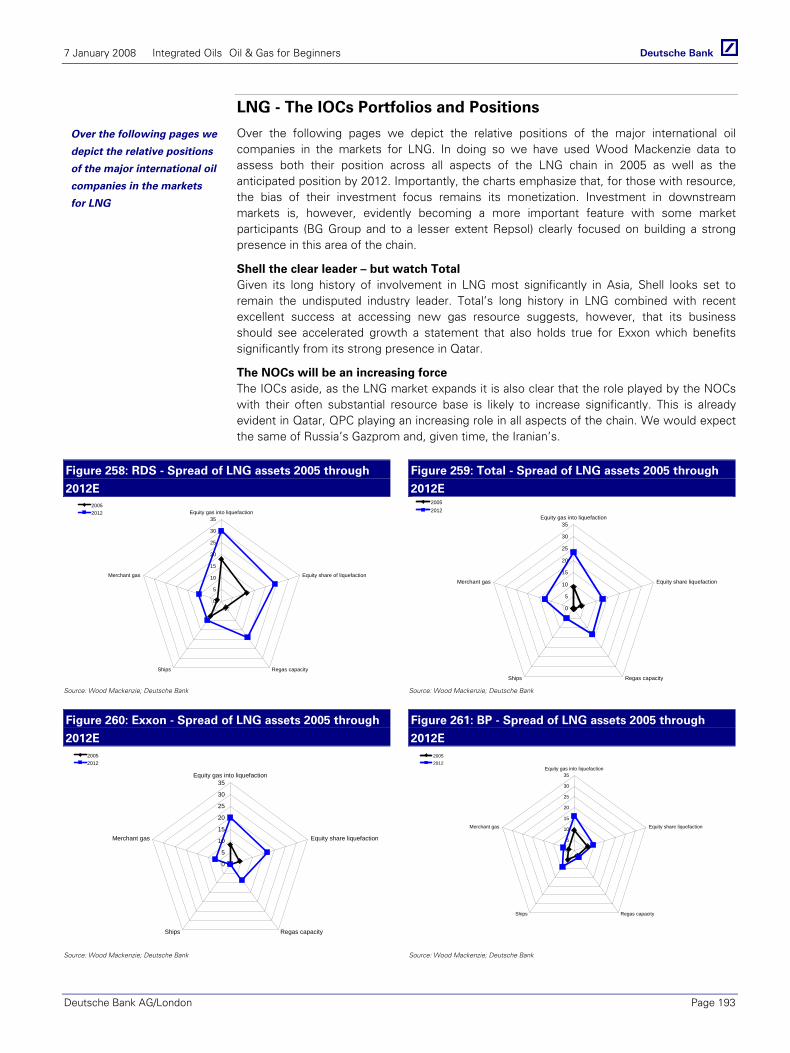
7 January 2008 Integrated Oils Oil & Gas for Beginners
Deutsche Bank AG/London Page 193
LNG - The IOCs Portfolios and Positions
Over the following pages we depict the relative positions of the major international oil companies in the markets for LNG. In doing so we have used Wood Mackenzie data to assess both their position across all aspects of the LNG chain in 2005 as well as the anticipated position by 2012. Importantly, the charts emphasize that, for those with resource, the bias of their investment focus remains its monetization. Investment in downstream markets is, however, evidently becoming a more important feature with some market participants (BG Group and to a lesser extent Repsol) clearly focused on building a strong presence in this area of the chain.
Shell the clear leader – but watch Total Given its long history of involvement in LNG most significantly in Asia, Shell looks set to remain the undisputed industry leader. Total’s long history in LNG combined with recent excellent success at accessing new gas resource suggests, however, that its business should see accelerated growth a statement that also holds true for Exxon which benefits significantly from its strong presence in Qatar.
The NOCs will be an increasing force The IOCs aside, as the LNG market expands it is also clear that the role played by the NOCs with their often substantial resource base is likely to increase significantly. This is already evident in Qatar, QPC playing an increasing role in all aspects of the chain. We would expect the same of Russia’s Gazprom and, given time, the Iranian’s.
Figure 258: RDS - Spread of LNG assets 2005 through
2012E
Figure 259: Total - Spread of LNG assets 2005 through
2012E
0
5
10
15
20
25
30
35Equity gas into liquefaction
Equity share of liquefaction
Regas capacityShips
Merchant gas
20052012
0
5
10
15
20
25
30
35Equity gas into liquefaction
Equity share liquefaction
Regas capacityShips
Merchant gas
20052012
Source: Wood Mackenzie; Deutsche Bank Source: Wood Mackenzie; Deutsche Bank
Figure 260: Exxon - Spread of LNG assets 2005 through
2012E
Figure 261: BP - Spread of LNG assets 2005 through
2012E
0
5
10
15
20
25
30
35Equity gas into liquefaction
Equity share liquefaction
Regas capacityShips
Merchant gas
20052012
0
5
10
15
20
25
30
35Equity gas into liquefaction
Equity share liquefaction
Regas capacityShips
Merchant gas
20052012
Source: Wood Mackenzie; Deutsche Bank Source: Wood Mackenzie; Deutsche Bank
Over the following pages we
depict the relative positions
of the major international oil
companies in the markets
for LNG
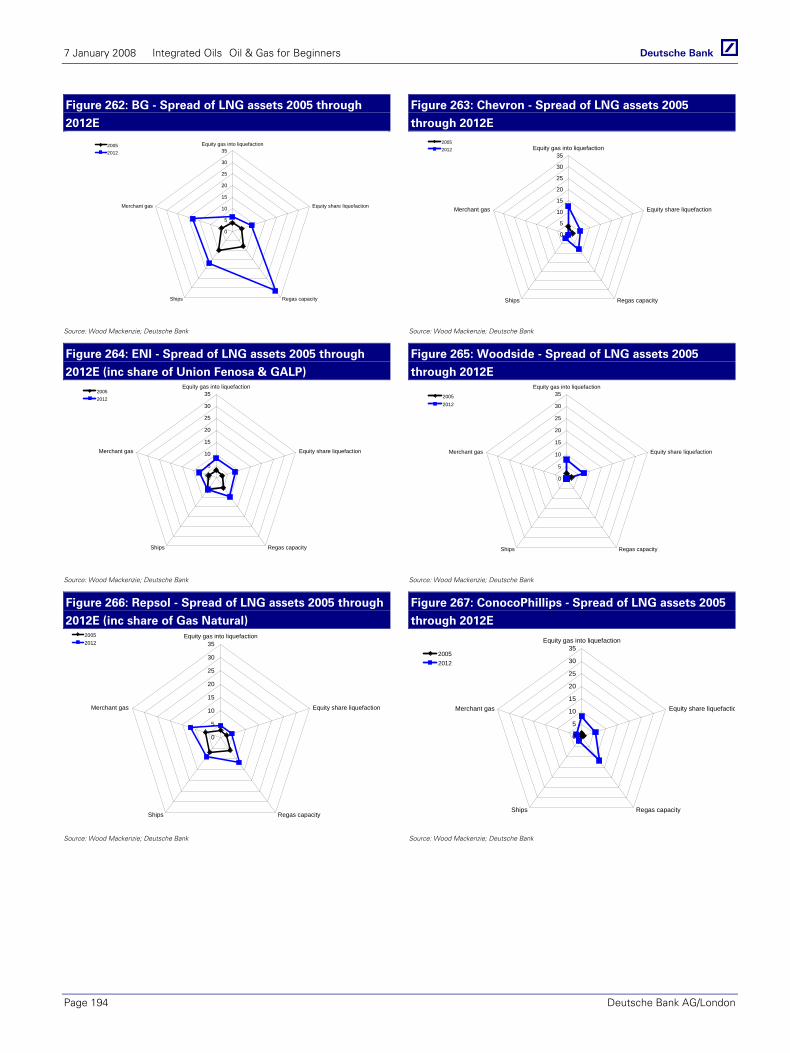
7 January 2008 Integrated Oils Oil & Gas for Beginners
Page 194 Deutsche Bank AG/London
Figure 262: BG - Spread of LNG assets 2005 through
2012E
Figure 263: Chevron - Spread of LNG assets 2005
through 2012E
0
5
10
15
20
25
30
35Equity gas into liquefaction
Equity share liquefaction
Regas capacityShips
Merchant gas
20052012
0
5
10
15
20
25
30
35Equity gas into liquefaction
Equity share liquefaction
Regas capacityShips
Merchant gas
20052012
Source: Wood Mackenzie; Deutsche Bank Source: Wood Mackenzie; Deutsche Bank
Figure 264: ENI - Spread of LNG assets 2005 through
2012E (inc share of Union Fenosa & GALP)
Figure 265: Woodside - Spread of LNG assets 2005
through 2012E
0
5
10
15
20
25
30
35Equity gas into liquefaction
Equity share liquefaction
Regas capacityShips
Merchant gas
20052012
0
5
10
15
20
25
30
35Equity gas into liquefaction
Equity share liquefaction
Regas capacityShips
Merchant gas
20052012
Source: Wood Mackenzie; Deutsche Bank Source: Wood Mackenzie; Deutsche Bank
Figure 266: Repsol - Spread of LNG assets 2005 through
2012E (inc share of Gas Natural)
Figure 267: ConocoPhillips - Spread of LNG assets 2005
through 2012E
0
5
10
15
20
25
30
35Equity gas into liquefaction
Equity share liquefaction
Regas capacityShips
Merchant gas
20052012
0
5
10
15
20
25
30
35Equity gas into liquefaction
Equity share liquefactio
Regas capacityShips
Merchant gas
20052012
Source: Wood Mackenzie; Deutsche Bank Source: Wood Mackenzie; Deutsche Bank
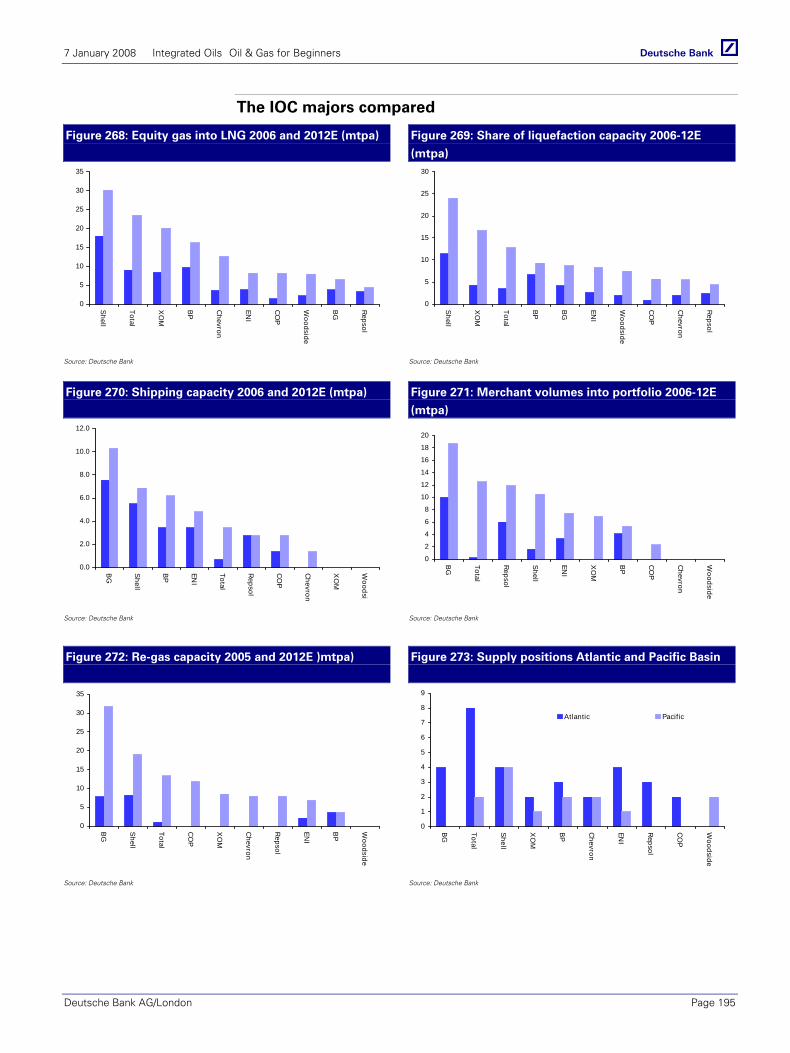
7 January 2008 Integrated Oils Oil & Gas for Beginners
Deutsche Bank AG/London Page 195
The IOC majors compared
Figure 268: Equity gas into LNG 2006 and 2012E (mtpa)
Figure 269: Share of liquefaction capacity 2006-12E
(mtpa)
0
5
10
15
20
25
30
35
Shell
Total
XO
M
BP
Chevron
ENI
CO
P
Woodside
BG
Repsol
0
5
10
15
20
25
30
Shell
XO
M
Total
BP
BG
ENI
Woodside
CO
P
Chevron
Repsol
Source: Deutsche Bank Source: Deutsche Bank
Figure 270: Shipping capacity 2006 and 2012E (mtpa)
Figure 271: Merchant volumes into portfolio 2006-12E
(mtpa)
0.0
2.0
4.0
6.0
8.0
10.0
12.0
BG
Shell
BP
ENI
Total
Repsol
CO
P
Chevron
XO
M
Woodsi
0
2
4
6
8
10
12
14
16
18
20
BG
Total
Repsol
Shell
ENI
XO
M
BP
CO
P
Chevron
Woodside
Source: Deutsche Bank Source: Deutsche Bank
Figure 272: Re-gas capacity 2005 and 2012E )mtpa)
Figure 273: Supply positions Atlantic and Pacific Basin
0
5
10
15
20
25
30
35B
G
Shell
Total
CO
P
XO
M
Chevron
Repsol
ENI
BP
Woodside
0
1
2
3
4
5
6
7
8
9
BG
Total
Shell
XO
M
BP
Chevron
ENI
Repsol
CO
P
Woodside
Atlantic Pacific
Source: Deutsche Bank Source: Deutsche Bank
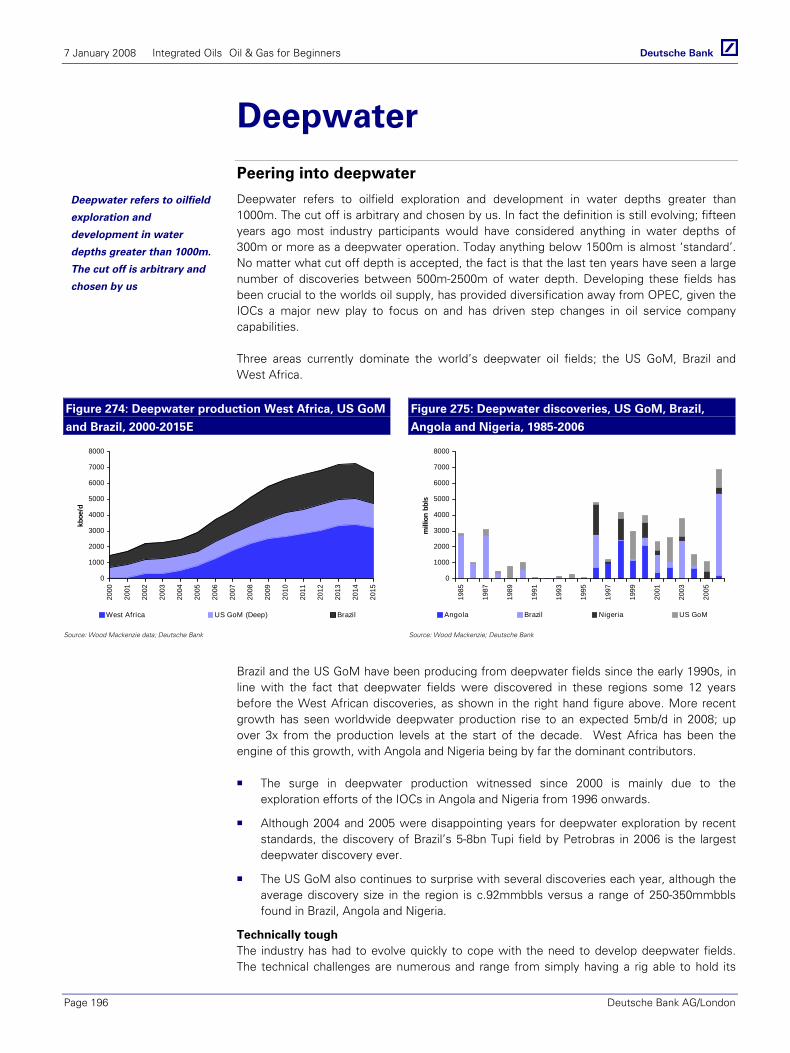
7 January 2008 Integrated Oils Oil & Gas for Beginners
Page 196 Deutsche Bank AG/London
Deepwater Peering into deepwater
Deepwater refers to oilfield exploration and development in water depths greater than 1000m. The cut off is arbitrary and chosen by us. In fact the definition is still evolving; fifteen years ago most industry participants would have considered anything in water depths of 300m or more as a deepwater operation. Today anything below 1500m is almost ‘standard’. No matter what cut off depth is accepted, the fact is that the last ten years have seen a large number of discoveries between 500m-2500m of water depth. Developing these fields has been crucial to the worlds oil supply, has provided diversification away from OPEC, given the IOCs a major new play to focus on and has driven step changes in oil service company capabilities.
Three areas currently dominate the world’s deepwater oil fields; the US GoM, Brazil and West Africa.
Figure 274: Deepwater production West Africa, US GoM
and Brazil, 2000-2015E
Figure 275: Deepwater discoveries, US GoM, Brazil,
Angola and Nigeria, 1985-2006
0
1000
2000
3000
4000
5000
6000
7000
8000
2000
2001
2002
2003
2004
2005
2006
2007
2008
2009
2010
2011
2012
2013
2014
2015
kboe
/d
West Africa US GoM (Deep) Brazil
0
1000
2000
3000
4000
5000
6000
7000
800019
85
1987
1989
1991
1993
1995
1997
1999
2001
2003
2005
mill
ion
bbls
Angola Brazil Nigeria US GoM
Source: Wood Mackenzie data; Deutsche Bank Source: Wood Mackenzie; Deutsche Bank
Brazil and the US GoM have been producing from deepwater fields since the early 1990s, in line with the fact that deepwater fields were discovered in these regions some 12 years before the West African discoveries, as shown in the right hand figure above. More recent growth has seen worldwide deepwater production rise to an expected 5mb/d in 2008; up over 3x from the production levels at the start of the decade. West Africa has been the engine of this growth, with Angola and Nigeria being by far the dominant contributors.
The surge in deepwater production witnessed since 2000 is mainly due to the exploration efforts of the IOCs in Angola and Nigeria from 1996 onwards.
Although 2004 and 2005 were disappointing years for deepwater exploration by recent standards, the discovery of Brazil’s 5-8bn Tupi field by Petrobras in 2006 is the largest deepwater discovery ever.
The US GoM also continues to surprise with several discoveries each year, although the average discovery size in the region is c.92mmbbls versus a range of 250-350mmbbls found in Brazil, Angola and Nigeria.
Technically tough The industry has had to evolve quickly to cope with the need to develop deepwater fields. The technical challenges are numerous and range from simply having a rig able to hold its
Deepwater refers to oilfield
exploration and
development in water
depths greater than 1000m.
The cut off is arbitrary and
chosen by us
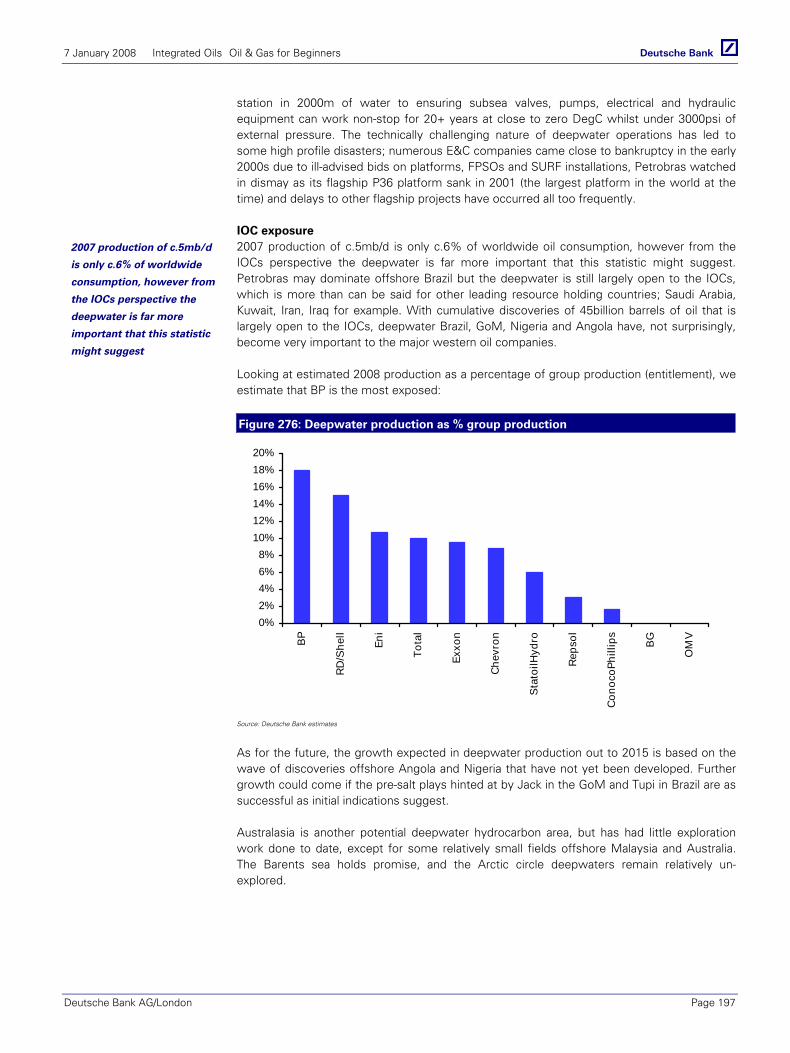
7 January 2008 Integrated Oils Oil & Gas for Beginners
Deutsche Bank AG/London Page 197
station in 2000m of water to ensuring subsea valves, pumps, electrical and hydraulic equipment can work non-stop for 20+ years at close to zero DegC whilst under 3000psi of external pressure. The technically challenging nature of deepwater operations has led to some high profile disasters; numerous E&C companies came close to bankruptcy in the early 2000s due to ill-advised bids on platforms, FPSOs and SURF installations, Petrobras watched in dismay as its flagship P36 platform sank in 2001 (the largest platform in the world at the time) and delays to other flagship projects have occurred all too frequently.
IOC exposure 2007 production of c.5mb/d is only c.6% of worldwide oil consumption, however from the IOCs perspective the deepwater is far more important that this statistic might suggest. Petrobras may dominate offshore Brazil but the deepwater is still largely open to the IOCs, which is more than can be said for other leading resource holding countries; Saudi Arabia, Kuwait, Iran, Iraq for example. With cumulative discoveries of 45billion barrels of oil that is largely open to the IOCs, deepwater Brazil, GoM, Nigeria and Angola have, not surprisingly, become very important to the major western oil companies.
Looking at estimated 2008 production as a percentage of group production (entitlement), we estimate that BP is the most exposed:
Figure 276: Deepwater production as % group production
0%2%4%6%8%
10%12%14%16%18%20%
BP
RD
/She
ll
Eni
Tota
l
Exxo
n
Chev
ron
Sta
toilH
ydro
Rep
sol
Con
ocoP
hilli
ps BG
OM
V
Source: Deutsche Bank estimates
As for the future, the growth expected in deepwater production out to 2015 is based on the wave of discoveries offshore Angola and Nigeria that have not yet been developed. Further growth could come if the pre-salt plays hinted at by Jack in the GoM and Tupi in Brazil are as successful as initial indications suggest.
Australasia is another potential deepwater hydrocarbon area, but has had little exploration work done to date, except for some relatively small fields offshore Malaysia and Australia. The Barents sea holds promise, and the Arctic circle deepwaters remain relatively un-explored.
2007 production of c.5mb/d
is only c.6% of worldwide
consumption, however from
the IOCs perspective the
deepwater is far more
important that this statistic
might suggest
7 January 2008 Integrated Oils Oil & Gas for Beginners
Page 198 Deutsche Bank AG/London
NGLs and condensates A valuable by-product
Condensates and natural gas liquids (NGLs) are a valuable by-product from gas production. As gas is produced and travels down a pipeline (or even as it travels up the well), within a short distance it will cool down to a point where the heavier hydrocarbons (C4 to C11+) it contains will liquefy and the gas will become a mixture of gas and condensate, also known as ‘wet gas’.
The wet gas is passed into a vessel known as a field separator which separates out the wet gas into gas and ‘condensate’, but this a simple process (an expansion vessel) and invariably some hydrocarbons heavier than methane (C1) or ethane (C2) remain in the gas. These residual liquids are recovered by a dedicated gas processing plant and are known as ‘natural gas liquids’, or NGLs. Condensate and NGLs are very similar, with the main difference being that condensates contain slightly longer chain hydrocarbons. The two are often blended together and contain hydrocarbons ranging from C2-C11+, i.e. including ethane, butane, propane, pentane and other hydrocarbon compounds, including gasoline-range molecules.
Its all oil from a supply/demand perspective When people talk about world oil production, they are nearly always referring to crude AND NGL/condensate production. The BP statistical review rolls the figures into one number and the IEA monthly oil report also discusses world oil supply with NGLs included. This makes sense, since like crude oil, NGLs and condensates ultimately end up satisfying liquid hydrocarbon demand. From a processing perspective NGLs can be thought of as just another blend of crude, and indeed sell for roughly 70% the price of WTI on a per barrel basis.
NGLs are an important part of the industry; they account for c.7% of world ‘oil’ supplies, 70% of ethylene feedstock and c.10% of US motor gasoline requirements.
The main constituents of condensates and NGLs are:
Ethane (C2H6): mainly used as feedstock for ethylene production – the building block for the bulk of the worlds plastics.
Propane (C3H8): is readily liquefied by compression and cooling and used as a fuel and chemical feedstock. It can be found in cigarette lighters, portable stoves and lamps.
Normal Butane (C4H10): is also easily liquefied at room temperature by compression. It is used as a gasoline additive, fuel and as chemical feedstock. Propane and butane are also known as liquid petroleum gas, or LPG.
Iso-butane (C4H10): is used in the manufacture of MTBE (methyl tertiary butyl ether), a high octane additive for reformulated gasoline, as a petrochemicals feedstock and more recently as a refrigerant (replacing freon).
Natural Gasoline: a gasoline blending component used as a refinery intermediate feedstock, crude diluent and as a petrochemical feedstock.
Condensate and NGLs are
very similar, with the main
difference being that
condensates contain longer
chain hydrocarbons

7 January 2008 Integrated Oils Oil & Gas for Beginners
Deutsche Bank AG/London Page 199
Canada’s Oil Sands A huge unconventional resource
Canada’s oil sands represent the largest single undeveloped, discovered, oil resource globally. All told, an estimated 175bn barrels of recoverable oil lie in the sand, water and clay of Northern Alberta. These reserves are second in size only to Saudi Arabia and 50% greater than those of Iraq. Moreover, with an estimated total resource of as much as 2.5 trillion barrels, huge potential exists for technological improvements to further enhance the extent to which this resource can ultimately be recovered.
Figure 277: Of 2.5trillion bbls, 175bn are
recoverable and 3.5bn produced to date
Figure 278: Oil sands mean Canada has
reserves second only to Saudi Arabia Produced
2%Commercial
23%
Undeveloped75%
Proven7%
Total resource93%
0
50
100
150
200
250
300
Saudi
Arabia
Canada
Iran
Iraq
Kuw
ait
UA
E
Venezuela
Russia
Libya
Nigeria
Conventional Oil Sandsbn bbls
Source: Oil & Gas Journal Source: oil & Gas Journal
Three locations, two principle extraction techniques Oil sands represent heavy and thick deposits of bitumen-coated sand. They are found in three different deposits in northern Alberta; Athabasca; Peace River and Cold Lake, which extends into neighbouring Saskatchewan (see map). In contrast with conventional crude oil which flows naturally or is pumped from the ground, the bitumen from oil sands must be mined or recovered in situ (i.e. the bitumen will be extracted in place rather than mined and extracted subsequently). The Athabasca deposit which is the largest of the three has the highest concentration of developments, a feature which in large part reflects the fact that it is the only one shallow enough to be suitable for surface mining. This can be done at depths of up to 75 metres. However, at depths of greater than 75 metres mining becomes uneconomic and alternative ‘in-situ’ methods are required. Two methods of in-situ extraction are used; steam assisted gravity and drainage (or SAGD) and cyclic steam stimulation (CSS). Of these, SAGD’s higher recovery rates mean it is by far the most frequently used.
Of the current reserves base 80% are expected to require in-situ extraction. However, of the reserves attributed to current projects around two-thirds will be exploited by mining.
This is not crude oil – it is low value bitumen Compared with conventional production methods, the oil sands are very capital intensive and expensive to extract requiring significant energy. This is particularly true of the in-situ processes which require a mscf of natural gas for every barrel of bitumen recovered. The bitumen produced is also not suited to the North American refining market, its very low API (under 10°) requiring specialist refineries. Consequently it sells at a substantial ~$25/bbl discount to WTI. Most of the current mines therefore have invested in expensive upgraders. This second and separate process takes the bitumen and upgrades it to create a lighter product with similar characteristics to conventional crude oil. The resulting synthetic crude oil or syncrude as it is commonly termed, sells at a similar price to WTI.
An estimated 175bn barrels
of recoverable oil lie in the
sand, water and clay of
Northern Alberta.
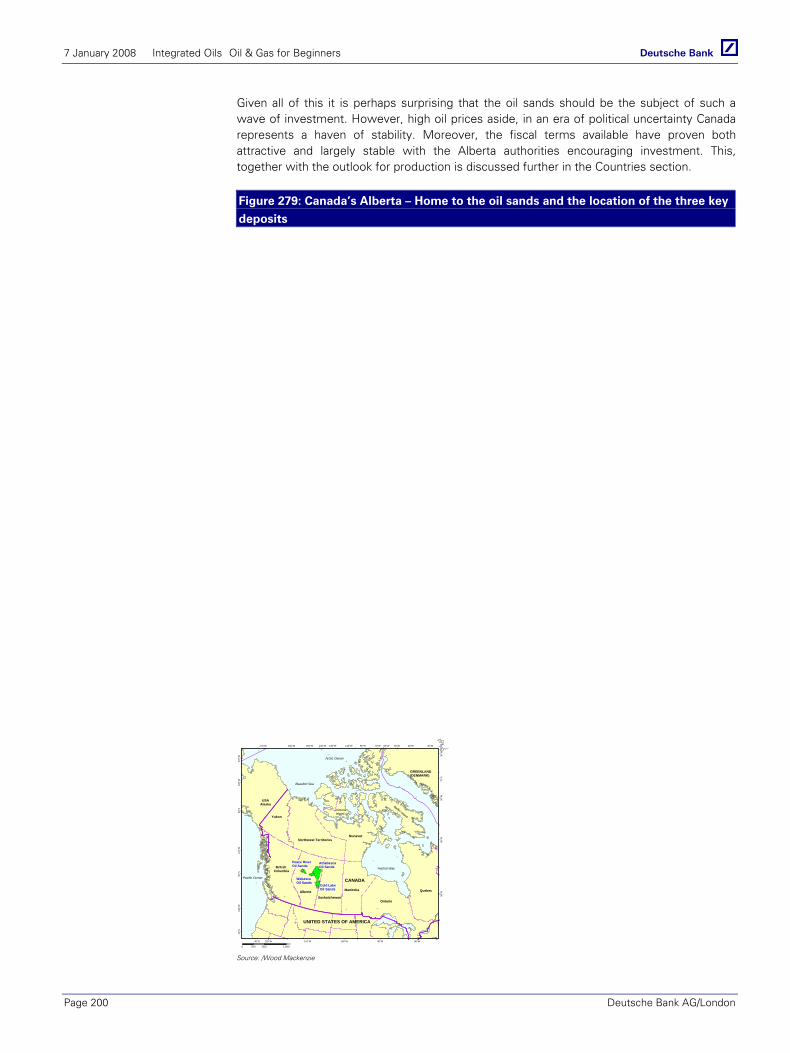
7 January 2008 Integrated Oils Oil & Gas for Beginners
Page 200 Deutsche Bank AG/London
Given all of this it is perhaps surprising that the oil sands should be the subject of such a wave of investment. However, high oil prices aside, in an era of political uncertainty Canada represents a haven of stability. Moreover, the fiscal terms available have proven both attractive and largely stable with the Alberta authorities encouraging investment. This, together with the outlook for production is discussed further in the Countries section.
Figure 279: Canada’s Alberta – Home to the oil sands and the location of the three key
deposits
Hudson Bay
Nunavut
CANADA
UNITED STATES OF AMERICA
Arctic Ocean
Northwest Territories
Yukon
Beaufort Sea
VictoriaIsland
Baffin Island
GREENLAND(DENMARK)
BritishColumbia
AlbertaSaskatchewan
Manitoba
Ontario
Quebec
USAAlaska
Pacific Ocean
AthabascaOil Sands
Cold LakeOil Sands
Peace RiverOil Sands
WabascaOil Sands
130°W140°W150°W160°W170°W
120°W 110°W
110°W
100°W
90°W
90°W 80°W
70°W 60°W 50°W 40°W 30°W
40°N
50°N
50°N
60°N
60°N
70°N
130°
W14
0°W
160°
W17
0°W
50°W
30°W
40°N
0 500 1,000250km
Source: /Wood Mackenzie
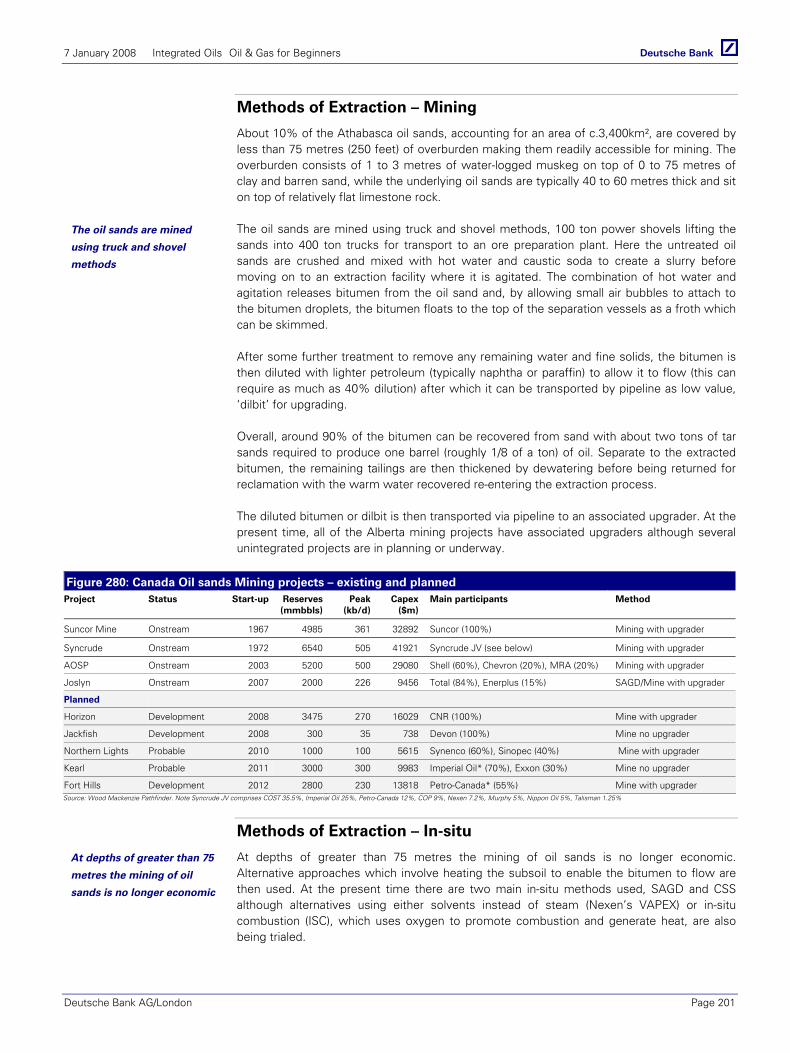
7 January 2008 Integrated Oils Oil & Gas for Beginners
Deutsche Bank AG/London Page 201
Methods of Extraction – Mining
About 10% of the Athabasca oil sands, accounting for an area of c.3,400km², are covered by less than 75 metres (250 feet) of overburden making them readily accessible for mining. The overburden consists of 1 to 3 metres of water-logged muskeg on top of 0 to 75 metres of clay and barren sand, while the underlying oil sands are typically 40 to 60 metres thick and sit on top of relatively flat limestone rock.
The oil sands are mined using truck and shovel methods, 100 ton power shovels lifting the sands into 400 ton trucks for transport to an ore preparation plant. Here the untreated oil sands are crushed and mixed with hot water and caustic soda to create a slurry before moving on to an extraction facility where it is agitated. The combination of hot water and agitation releases bitumen from the oil sand and, by allowing small air bubbles to attach to the bitumen droplets, the bitumen floats to the top of the separation vessels as a froth which can be skimmed.
After some further treatment to remove any remaining water and fine solids, the bitumen is then diluted with lighter petroleum (typically naphtha or paraffin) to allow it to flow (this can require as much as 40% dilution) after which it can be transported by pipeline as low value, ‘dilbit’ for upgrading.
Overall, around 90% of the bitumen can be recovered from sand with about two tons of tar sands required to produce one barrel (roughly 1/8 of a ton) of oil. Separate to the extracted bitumen, the remaining tailings are then thickened by dewatering before being returned for reclamation with the warm water recovered re-entering the extraction process.
The diluted bitumen or dilbit is then transported via pipeline to an associated upgrader. At the present time, all of the Alberta mining projects have associated upgraders although several unintegrated projects are in planning or underway.
Figure 280: Canada Oil sands Mining projects – existing and planned Project Status Start-up Reserves
(mmbbls) Peak
(kb/d)Capex
($m)Main participants Method
Suncor Mine Onstream 1967 4985 361 32892 Suncor (100%) Mining with upgrader
Syncrude Onstream 1972 6540 505 41921 Syncrude JV (see below) Mining with upgrader
AOSP Onstream 2003 5200 500 29080 Shell (60%), Chevron (20%), MRA (20%) Mining with upgrader
Joslyn Onstream 2007 2000 226 9456 Total (84%), Enerplus (15%) SAGD/Mine with upgrader
Planned
Horizon Development 2008 3475 270 16029 CNR (100%) Mine with upgrader
Jackfish Development 2008 300 35 738 Devon (100%) Mine no upgrader
Northern Lights Probable 2010 1000 100 5615 Synenco (60%), Sinopec (40%) Mine with upgrader
Kearl Probable 2011 3000 300 9983 Imperial Oil* (70%), Exxon (30%) Mine no upgrader
Fort Hills Development 2012 2800 230 13818 Petro-Canada* (55%) Mine with upgrader Source: Wood Mackenzie Pathfinder. Note Syncrude JV comprises COST 35.5%, Imperial Oil 25%, Petro-Canada 12%, COP 9%, Nexen 7.2%, Murphy 5%, Nippon Oil 5%, Talisman 1.25%
Methods of Extraction – In-situ
At depths of greater than 75 metres the mining of oil sands is no longer economic. Alternative approaches which involve heating the subsoil to enable the bitumen to flow are then used. At the present time there are two main in-situ methods used, SAGD and CSS although alternatives using either solvents instead of steam (Nexen’s VAPEX) or in-situ combustion (ISC), which uses oxygen to promote combustion and generate heat, are also being trialed.
The oil sands are mined
using truck and shovel
methods
At depths of greater than 75
metres the mining of oil
sands is no longer economic
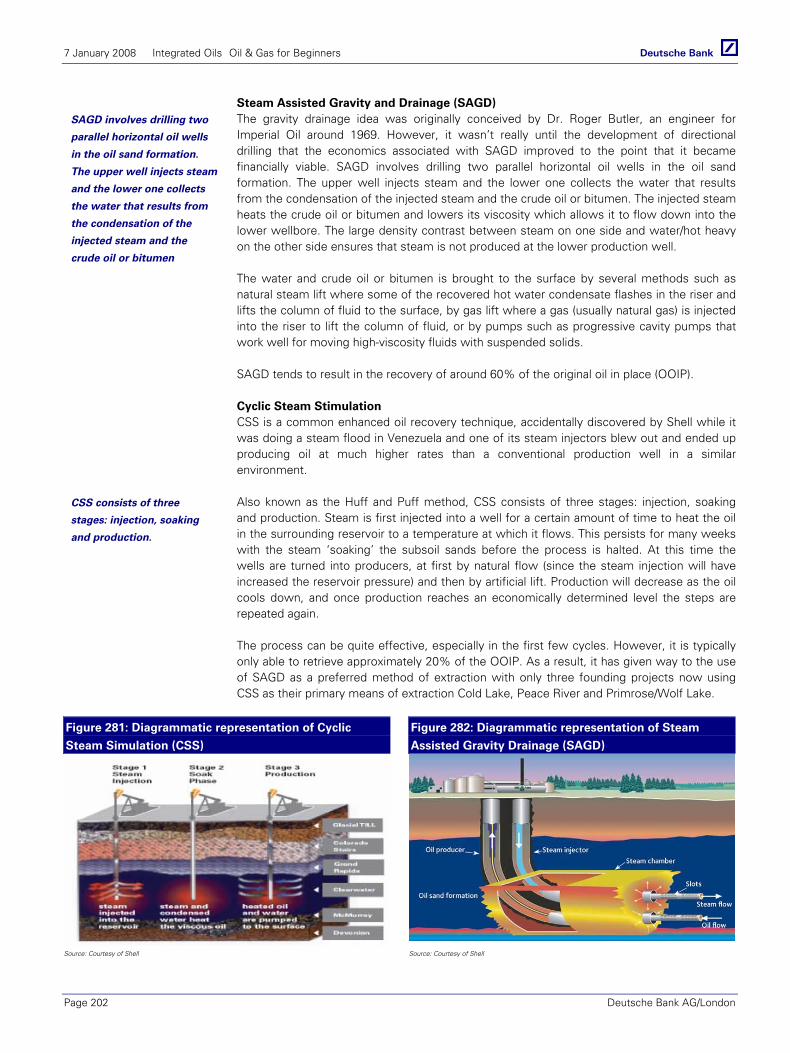
7 January 2008 Integrated Oils Oil & Gas for Beginners
Page 202 Deutsche Bank AG/London
Steam Assisted Gravity and Drainage (SAGD) The gravity drainage idea was originally conceived by Dr. Roger Butler, an engineer for Imperial Oil around 1969. However, it wasn’t really until the development of directional drilling that the economics associated with SAGD improved to the point that it became financially viable. SAGD involves drilling two parallel horizontal oil wells in the oil sand formation. The upper well injects steam and the lower one collects the water that results from the condensation of the injected steam and the crude oil or bitumen. The injected steam heats the crude oil or bitumen and lowers its viscosity which allows it to flow down into the lower wellbore. The large density contrast between steam on one side and water/hot heavy on the other side ensures that steam is not produced at the lower production well.
The water and crude oil or bitumen is brought to the surface by several methods such as natural steam lift where some of the recovered hot water condensate flashes in the riser and lifts the column of fluid to the surface, by gas lift where a gas (usually natural gas) is injected into the riser to lift the column of fluid, or by pumps such as progressive cavity pumps that work well for moving high-viscosity fluids with suspended solids.
SAGD tends to result in the recovery of around 60% of the original oil in place (OOIP).
Cyclic Steam Stimulation CSS is a common enhanced oil recovery technique, accidentally discovered by Shell while it was doing a steam flood in Venezuela and one of its steam injectors blew out and ended up producing oil at much higher rates than a conventional production well in a similar environment.
Also known as the Huff and Puff method, CSS consists of three stages: injection, soaking and production. Steam is first injected into a well for a certain amount of time to heat the oil in the surrounding reservoir to a temperature at which it flows. This persists for many weeks with the steam ‘soaking’ the subsoil sands before the process is halted. At this time the wells are turned into producers, at first by natural flow (since the steam injection will have increased the reservoir pressure) and then by artificial lift. Production will decrease as the oil cools down, and once production reaches an economically determined level the steps are repeated again.
The process can be quite effective, especially in the first few cycles. However, it is typically only able to retrieve approximately 20% of the OOIP. As a result, it has given way to the use of SAGD as a preferred method of extraction with only three founding projects now using CSS as their primary means of extraction Cold Lake, Peace River and Primrose/Wolf Lake.
Figure 281: Diagrammatic representation of Cyclic
Steam Simulation (CSS)
Figure 282: Diagrammatic representation of Steam
Assisted Gravity Drainage (SAGD)
Source: Courtesy of Shell Source: Courtesy of Shell
SAGD involves drilling two
parallel horizontal oil wells
in the oil sand formation.
The upper well injects steam
and the lower one collects
the water that results from
the condensation of the
injected steam and the
crude oil or bitumen
CSS consists of three
stages: injection, soaking
and production.

7 January 2008 Integrated Oils Oil & Gas for Beginners
Deutsche Bank AG/London Page 203
Figure 283: Canada Oil sands Projects and start up dates (all Athabasca except those shaded) Project Status Start-up Reserves
(mmbbls) Peak
(kb/d)Capex
($m)Main participants Method
Primrose Wolf Lake Onstream 1983 810 120 2915 CNR (100%) CSS/SAGD No upgrader
Peace River Onstream 1986 170 16 686 Shell (100%) CSS No upgrader
Cold Lake Onstream 1986 1425 150 2523 Imperial Oil (100%) CSS No upgrader
Hangingstone Onstream 1999 430 45 811 Japan COS 75%; Nexen 25% SAGD No upgrader
Foster Creek* Onstream 2001 1425 150 2523 EnCana/COPJV SAGD No upgrader
Christina Lake* Onstream 2002 828 108 1564 EnCana/COPJV SAGD No upgrader
MacKay River Onstream 2002 540 68 1686 Petro-Canada (100%) SAGD No upgrader
Suncor SAGD Onstream 2004 1940 174 7937 Suncor (100%) SAGD with upgrader
Joslyn Onstream 2006 2000 226 9456 Total* (84%) SAGD/Mine with upgrader
Surmont Onstream 2006 1000 110 2262 Conoco(50%), Total (50%) SAGD no upgrader
Tucker Cold Lake Onstream 2006 350 30 784 Husky (100%) SAGD with upgrader
Long Lake Development 2007 1480 144 8711 Nexen (50%), OPTI (50%) SAGD with upgrader
Orion Cold Lake Development 2007 190 20 466 Shell (100%) SAGD no upgrader
Sunrise Development 2012 2600 200 4674 Husky (50%)/BP (50%) SAGD no upgrader Source: Wood Mackenzie Pathfinder. *Encana and COP established a JV with COP taking an upstream interest in the Encana fields but offering scope for upgrading of bitumen at two COP facilities
Upgrading
Because of limited demand for bitumen itself in North America, the bitumen output from the oil sands needs to be upgraded if it is to find a market. Consequently, many of those involved in the production of the tar sands have invested in complex upgrading refineries designed to break down the long chain bitumen carbon molecules into shorter, lighter chains more representative of crude oil. In the first stage of the upgrading coking or hydro-cracking is used to break up the heavy hydrocarbons. The second stage, hydro-treating, uses hydrogen to remove impurities, namely sulphur. Depending upon the technology chosen and the capex spent upgraders can be designed to produce differing API crudes with different sulphur content.
The scale of the cost should not, however, be underestimated. On making a recent regulatory application to build a new 400kb/d upgrader Shell indicated in 2007 that the total project could cost as much as $27billion or $67,500/flowing bbl. This compares with the estimated $15,000/flowing barrel cost of a green-field refinery. Nevertheless, given a twenty five year life, the estimated fixed cost per unit of production at around US$8/bbl means that, provided the price of crude oil remains above $40/bbl the investment will prove economic.
Because the majority of the large mining projects have associated upgraders, around 70% of the oil sands production is sold in North American markets as synthetic crude oil or syncrude. This can readily be refined within North American markets. Nonetheless, as production from often smaller SAGD developments builds, so the volume of untreated diluted bitumen is also expected to increase significantly.
This represents both an opportunity for refiners but a potential threat to the tar sands industry. To the extent that investment in expensive cokers and hydrocrackers is made across North American refineries, it represents a good opportunity to capture a significant proportion of the value of the tar sands barrel. This is a strategy that companies such as BP are looking towards as a way of benefiting from the growth in production from Canada’s oil sands. However, if this investment is not made, the resulting surplus in bitumen production is almost certain to see an increase in the discount to WTI at which dilbit currently sells, so placing further potential pressure on the economics of an already very costly process.
The bitumen output from
the oil sands needs to be
upgraded if it is to find a
market.
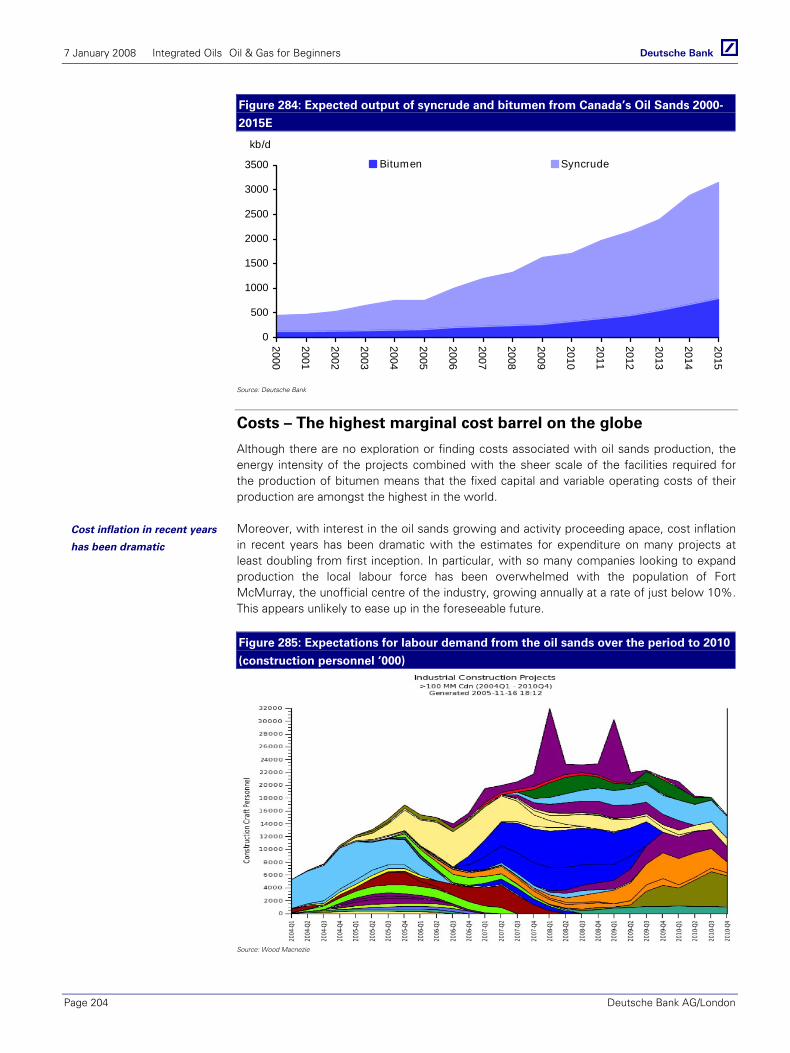
7 January 2008 Integrated Oils Oil & Gas for Beginners
Page 204 Deutsche Bank AG/London
Figure 284: Expected output of syncrude and bitumen from Canada’s Oil Sands 2000-
2015E
0
500
1000
1500
2000
2500
3000
3500
2000
2001
2002
2003
2004
2005
2006
2007
2008
2009
2010
2011
2012
2013
2014
2015
Bitumen Syncrude
kb/d
Source: Deutsche Bank
Costs – The highest marginal cost barrel on the globe
Although there are no exploration or finding costs associated with oil sands production, the energy intensity of the projects combined with the sheer scale of the facilities required for the production of bitumen means that the fixed capital and variable operating costs of their production are amongst the highest in the world.
Moreover, with interest in the oil sands growing and activity proceeding apace, cost inflation in recent years has been dramatic with the estimates for expenditure on many projects at least doubling from first inception. In particular, with so many companies looking to expand production the local labour force has been overwhelmed with the population of Fort McMurray, the unofficial centre of the industry, growing annually at a rate of just below 10%. This appears unlikely to ease up in the foreseeable future.
Figure 285: Expectations for labour demand from the oil sands over the period to 2010
(construction personnel ‘000)
Source: Wood Macnezie
Cost inflation in recent years
has been dramatic

7 January 2008 Integrated Oils Oil & Gas for Beginners
Deutsche Bank AG/London Page 205
The very heavy, upfront capital costs associated with doing business in the oil sands are thus very high a feature that not surprisingly, weighs very heavily on the internal rates of return that these projects can achieve. However, because of the very large reserves associated with most developments, at around $7-8 per upgraded barrel the DD&A cost is not dissimilar to those seen in many other parts of the oil industry.
The DD&A charge is, however, as nothing when compared with the variable operating costs associated with extracting an oil sands barrel. At comfortably over $20 per upgraded barrel there can be little doubt that the oil sands represent amongst the highest marginal cost barrels in the world. Not least amongst these costs are those for natural gas given that for every barrel produced under the SAGD process at least 1mscf of gas will be required. Indeed, even an upgraded mined barrel requires around 0.75mscf/bbl of production given the energy requirements of the upgrader (0.5mscf/bbl). Add to this the costs associated with diluting the bitumen for transport and the pipeline costs themselves, and it soon becomes very clear that the oil sands need high crude prices to prove economic.
In the table below we have used Wood Mackenzie estimates of full cycle project costs to estimate the fixed and variable costs per barrel of production over a range of different projects. The analysis emphasizes that on average, the full costs for a mined, upgraded barrel runs at around $30/bbl with the more recent projects looking at something nearer $35/bbl. Of this the variable component stands at $23/bbl. Remove the upgrader and the full costs per barrel fall by a significant $13/bbl to $17/bbl. However, this reduction in cost is achieved for a c$25/bbl reduction in end market price.
For SAGD projects the upfront capital costs are cheaper with DD&A running at a modest $3.40/bbl against nearer $7/bbl for those from a mined barrel with upgrader. At $17/bbl the variable costs of production are, however, even higher than those of a non-upgraded mine a feature which in large part reflects the even greater energy-requirements of the SAGD process (namely the gas required to produce steam).
Figure 286: Fixed, variable and full cost estimates for a range of oil sand facilities Project Resource
(mb)Capex ($m)
Opex ($m)
DD&A/boE ($/bbl)
Opex/BoE ($/bbl)
Full cost ($/bbl)
Syncrude 6541 45603 130085 6.97 19.89 26.86
AOSP integrated 5600 39686 134579 7.09 24.03 31.12
Suncor mining 5000 33735 76966 6.75 15.39 22.14
Joslyn integrated 2000 16696 43565 8.35 21.78 30.13
Horizon 3475 24293 83373 6.99 23.99 30.98
Northern Lights 1135 9439 29044 8.32 25.59 33.91
Fort Hills 4000 35482 114249 8.87 28.56 37.43
Average to mine with upgrader 7.62 22.75 30.37
Jackfish 300 887 3945 2.96 13.15 16.11
Kearl 3000 15129 41111 5.04 13.70 18.75
Average to mine ex upgrader 4.00 13.43 17.43
Mackay River 615 3072 9800 5.00 15.93 20.93
Surmont 1000 2874 16456 2.87 16.46 19.33
Orion 190 609 2711 3.21 14.27 17.47
Sunrise 3200 9131 60703 2.85 18.97 21.82
Foster Creek 1900 6388 25249 3.36 13.29 16.65
Hangingstone 430 1310 7709 3.05 17.93 20.97
Christina Lake 1400 4864 18592 3.47 13.28 16.75
Average to SAGD no upgrader 3.40 15.73 19.13Source: Deutsche Bank
On average, the full costs for
a mined, upgraded barrel
runs at around $30/bbl with
the more recent projects
looking at something nearer
$35/bbl
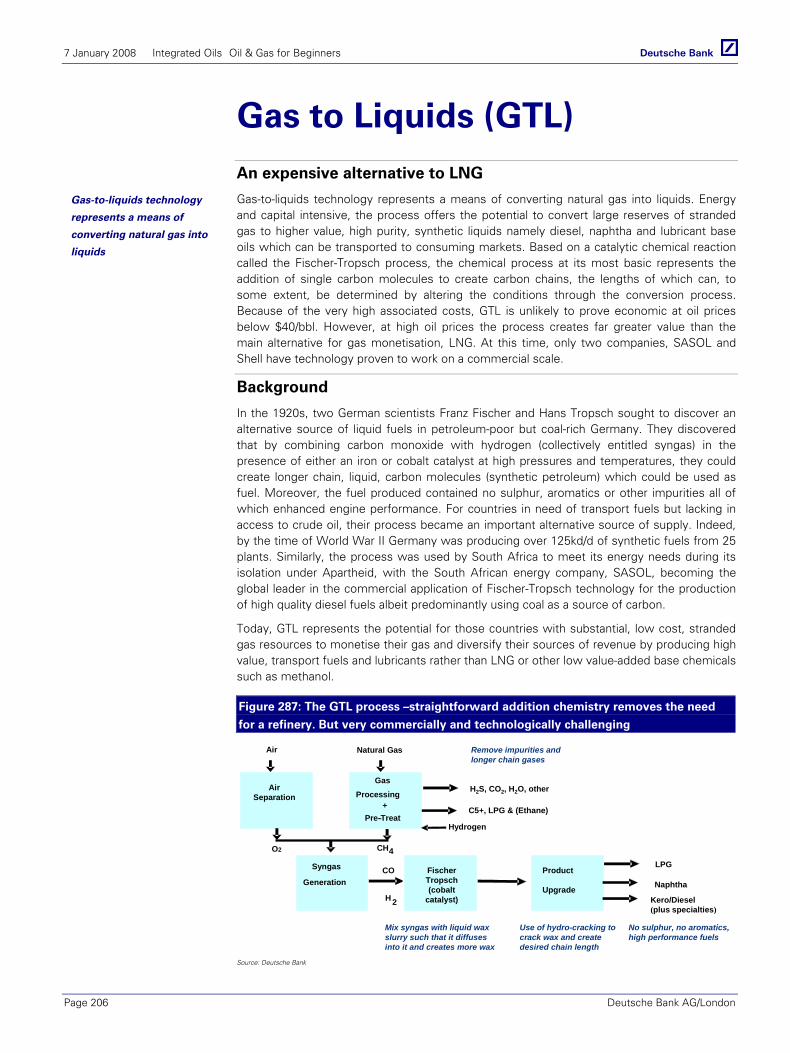
7 January 2008 Integrated Oils Oil & Gas for Beginners
Page 206 Deutsche Bank AG/London
Gas to Liquids (GTL) An expensive alternative to LNG
Gas-to-liquids technology represents a means of converting natural gas into liquids. Energy and capital intensive, the process offers the potential to convert large reserves of stranded gas to higher value, high purity, synthetic liquids namely diesel, naphtha and lubricant base oils which can be transported to consuming markets. Based on a catalytic chemical reaction called the Fischer-Tropsch process, the chemical process at its most basic represents the addition of single carbon molecules to create carbon chains, the lengths of which can, to some extent, be determined by altering the conditions through the conversion process. Because of the very high associated costs, GTL is unlikely to prove economic at oil prices below $40/bbl. However, at high oil prices the process creates far greater value than the main alternative for gas monetisation, LNG. At this time, only two companies, SASOL and Shell have technology proven to work on a commercial scale.
Background
In the 1920s, two German scientists Franz Fischer and Hans Tropsch sought to discover an alternative source of liquid fuels in petroleum-poor but coal-rich Germany. They discovered that by combining carbon monoxide with hydrogen (collectively entitled syngas) in the presence of either an iron or cobalt catalyst at high pressures and temperatures, they could create longer chain, liquid, carbon molecules (synthetic petroleum) which could be used as fuel. Moreover, the fuel produced contained no sulphur, aromatics or other impurities all of which enhanced engine performance. For countries in need of transport fuels but lacking in access to crude oil, their process became an important alternative source of supply. Indeed, by the time of World War II Germany was producing over 125kd/d of synthetic fuels from 25 plants. Similarly, the process was used by South Africa to meet its energy needs during its isolation under Apartheid, with the South African energy company, SASOL, becoming the global leader in the commercial application of Fischer-Tropsch technology for the production of high quality diesel fuels albeit predominantly using coal as a source of carbon.
Today, GTL represents the potential for those countries with substantial, low cost, stranded gas resources to monetise their gas and diversify their sources of revenue by producing high value, transport fuels and lubricants rather than LNG or other low value-added base chemicals such as methanol.
Figure 287: The GTL process –straightforward addition chemistry removes the need
for a refinery. But very commercially and technologically challenging
Product
Upgrade
LPG
Kero/Diesel(plus specialties)
Naphtha
Syngas
Generation
H 2
CO
O2
Air Separation
Air
Fischer Tropsch(cobalt
catalyst)
GasGasProcessing
++Pre-Treat--
Natural Gas
C5+, LPG & (Ethane)
H2S, CO2, H2O, other
Hydrogen
Remove impurities and longer chain gases
Use of hydro-cracking to crack wax and create desired chain length
Mix syngas with liquid wax slurry such that it diffuses into it and creates more wax
No sulphur, no aromatics, high performance fuels
CH4
Source: Deutsche Bank
Gas-to-liquids technology
represents a means of
converting natural gas into
liquids
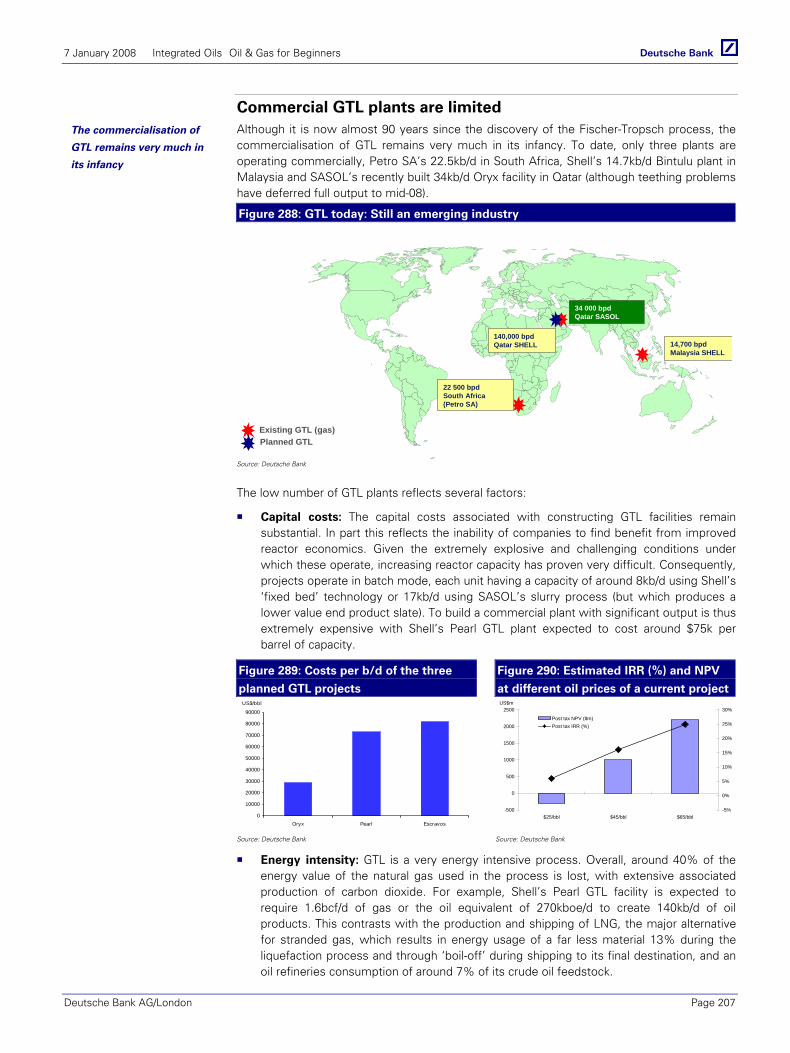
7 January 2008 Integrated Oils Oil & Gas for Beginners
Deutsche Bank AG/London Page 207
Commercial GTL plants are limited Although it is now almost 90 years since the discovery of the Fischer-Tropsch process, the commercialisation of GTL remains very much in its infancy. To date, only three plants are operating commercially, Petro SA’s 22.5kb/d in South Africa, Shell’s 14.7kb/d Bintulu plant in Malaysia and SASOL’s recently built 34kb/d Oryx facility in Qatar (although teething problems have deferred full output to mid-08).
Figure 288: GTL today: Still an emerging industry
Existing GTL (gas)
22 500 bpd South Africa (Petro SA)
34 000 bpd Qatar SASOL
Planned GTL
140,000 bpd Qatar SHELL 14,700 bpd
Malaysia SHELL
Source: Deutsche Bank
The low number of GTL plants reflects several factors:
Capital costs: The capital costs associated with constructing GTL facilities remain substantial. In part this reflects the inability of companies to find benefit from improved reactor economics. Given the extremely explosive and challenging conditions under which these operate, increasing reactor capacity has proven very difficult. Consequently, projects operate in batch mode, each unit having a capacity of around 8kb/d using Shell’s ‘fixed bed’ technology or 17kb/d using SASOL’s slurry process (but which produces a lower value end product slate). To build a commercial plant with significant output is thus extremely expensive with Shell’s Pearl GTL plant expected to cost around $75k per barrel of capacity.
Figure 289: Costs per b/d of the three
planned GTL projects
Figure 290: Estimated IRR (%) and NPV
at different oil prices of a current project
0
10000
20000
30000
40000
50000
60000
70000
80000
90000
Oryx Pearl Escravos
US$/bbl
-500
0
500
1000
1500
2000
2500
$25/bbl $45/bbl $65/bbl-5%
0%
5%
10%
15%
20%
25%
30%
Post tax NPV ($m)Post tax IRR (%)
US$m
Source: Deutsche Bank Source: Deutsche Bank
Energy intensity: GTL is a very energy intensive process. Overall, around 40% of the energy value of the natural gas used in the process is lost, with extensive associated production of carbon dioxide. For example, Shell’s Pearl GTL facility is expected to require 1.6bcf/d of gas or the oil equivalent of 270kboe/d to create 140kb/d of oil products. This contrasts with the production and shipping of LNG, the major alternative for stranded gas, which results in energy usage of a far less material 13% during the liquefaction process and through ‘boil-off’ during shipping to its final destination, and an oil refineries consumption of around 7% of its crude oil feedstock.
The commercialisation of
GTL remains very much in
its infancy
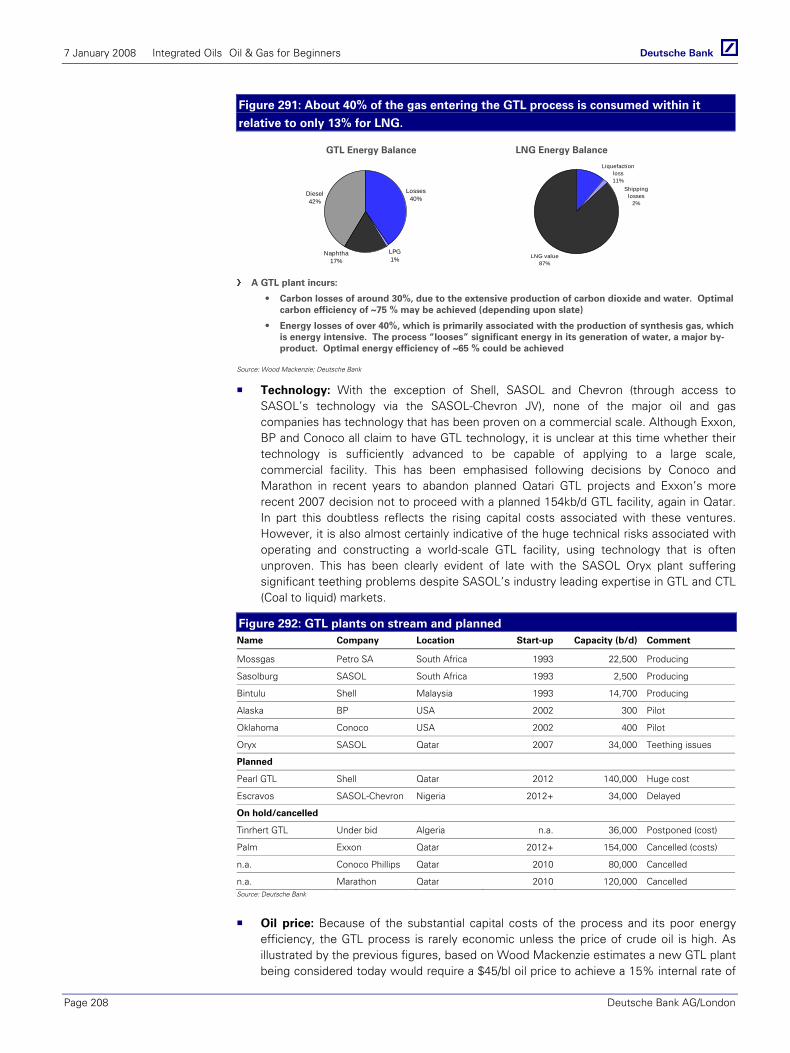
7 January 2008 Integrated Oils Oil & Gas for Beginners
Page 208 Deutsche Bank AG/London
Figure 291: About 40% of the gas entering the GTL process is consumed within it
relative to only 13% for LNG.
GTL Energy Balance LNG Energy Balance
A GTL plant incurs:
• Carbon losses of around 30%, due to the extensive production of carbon dioxide and water. Optimal carbon efficiency of ~75 % may be achieved (depending upon slate)
• Energy losses of over 40%, which is primarily associated with the production of synthesis gas, which is energy intensive. The process “looses” significant energy in its generation of water, a major by-product. Optimal energy efficiency of ~65 % could be achieved
LNG value87%
Shipping losses
2%
Liquefaction loss 11%
Losses40%
LPG1%
Diesel42%
Naphtha17%
Source: Wood Mackenzie; Deutsche Bank
Technology: With the exception of Shell, SASOL and Chevron (through access to SASOL’s technology via the SASOL-Chevron JV), none of the major oil and gas companies has technology that has been proven on a commercial scale. Although Exxon, BP and Conoco all claim to have GTL technology, it is unclear at this time whether their technology is sufficiently advanced to be capable of applying to a large scale, commercial facility. This has been emphasised following decisions by Conoco and Marathon in recent years to abandon planned Qatari GTL projects and Exxon’s more recent 2007 decision not to proceed with a planned 154kb/d GTL facility, again in Qatar. In part this doubtless reflects the rising capital costs associated with these ventures. However, it is also almost certainly indicative of the huge technical risks associated with operating and constructing a world-scale GTL facility, using technology that is often unproven. This has been clearly evident of late with the SASOL Oryx plant suffering significant teething problems despite SASOL’s industry leading expertise in GTL and CTL (Coal to liquid) markets.
Figure 292: GTL plants on stream and planned Name Company Location Start-up Capacity (b/d) Comment
Mossgas Petro SA South Africa 1993 22,500 Producing
Sasolburg SASOL South Africa 1993 2,500 Producing
Bintulu Shell Malaysia 1993 14,700 Producing
Alaska BP USA 2002 300 Pilot
Oklahoma Conoco USA 2002 400 Pilot
Oryx SASOL Qatar 2007 34,000 Teething issues
Planned
Pearl GTL Shell Qatar 2012 140,000 Huge cost
Escravos SASOL-Chevron Nigeria 2012+ 34,000 Delayed
On hold/cancelled
Tinrhert GTL Under bid Algeria n.a. 36,000 Postponed (cost)
Palm Exxon Qatar 2012+ 154,000 Cancelled (costs)
n.a. Conoco Phillips Qatar 2010 80,000 Cancelled
n.a. Marathon Qatar 2010 120,000 Cancelled Source: Deutsche Bank
Oil price: Because of the substantial capital costs of the process and its poor energy efficiency, the GTL process is rarely economic unless the price of crude oil is high. As illustrated by the previous figures, based on Wood Mackenzie estimates a new GTL plant being considered today would require a $45/bl oil price to achieve a 15% internal rate of

7 January 2008 Integrated Oils Oil & Gas for Beginners
Deutsche Bank AG/London Page 209
return. Historically, the expectation that oil prices were likely to trade at around a $20/bbl band has meant that the economics around GTL made little commercial sense.
There are positives
Yet despite the costs and the technical challenges, at high crude oil and product prices GTL represents a substantial opportunity for those countries with substantial gas resources at their disposal to establish a very profitable and value creating revenue stream. Although the breakeven costs are high, because of the absolute scale of the investment and the resource being monetised at oil prices above US$45/bbl the NPV of the project is substantial.
For example, Wood Mackenzie estimates that where Shell’s Pearl project would create little more than $3bn of NPV at $25/bbl oil on a $15bn investment, at $45/bbl the project would create value of almost US$20bn over its life-cycle.
For the resource holder GTL also offers the potential to reduce its dependence upon international gas prices and gain greater exposure to the higher value oil products, not least diesel and lubricants, so diversifying its risk. Equally, for the integrated oil company, the high quality of the output slate offers the opportunity to market a high performance, differentiated fuel that because of its purity (no sulphur, no metals) burns more cleanly and with limited particulate emissions.
Figure 293: Difference between product slate of a refinery and Qatari GTL projects –
with no low value fuel oil produced the GTL slate is of far greater value Traditional Crude Slate Shell GTL slate Sasol GTL slate
Raw material Crude oil Natural Gas Natural Gas
Process Refinery
Product slate Product slate Product slate
LPG 3% 3% 3%
Naphtha 7% 28% 26%
Gasoline 27% 0% 0%
Middle distillate 40% 54% 71%
Fuel oil 21% 0% 0%
Lubricants/waxes 2% 15% 0% Source: Deutsche Bank
An uncertain future at this time
GTL’s future role in energy markets is thus likely to depend heavily on the direction of future oil prices and the extent to which technology can bring down the associated capital costs. In the near term, however, its role in energy markets is likely to be determined more than anything by the success or otherwise of both SASOL and Shell’s development projects. If technologies are proven here and costs contained at budgeted levels, considerable enthusiasm could follow. In its absence, however, GTL is likely to play only a niche role in energy markets for some time to come.
GTL represents a substantial
opportunity for those
countries with substantial
gas resources at their
disposal to establish a very
profitable and value creating
revenue stream
7 January 2008 Integrated Oils Oil & Gas for Beginners
Page 210 Deutsche Bank AG/London
Coal Bed Methane Exactly what it says on the label
While natural gas is perhaps most commonly associated with oil, it also occurs with coal. Coal bed methane (CBM) is simply methane found in coal seams. It is generated either from a biological process as a result of microbial action or from a thermal process as a result of increasing heat with depth of the coal. Whereas in a natural gas reservoir such as sandstone the gas is held in the void spaces within the rock, methane in coal is retained on the surface of the coal within the micropore structure. Often a coal seam is saturated with water, with methane held in the coal by water pressure. Release this pressure and it allows methane to escape from the coal.
A substantial resource During coalification large quantities of methane rich gas are generated and stored within the coal on internal surfaces. Because the coal has such a large internal surface area it can store surprisingly large volumes of gas – perhaps six or seven times those of a conventional gas reservoir of equal rock volume. In addition, much of the coal and thus methane lies at shallow depths making wells easier to drill, whilst exploration costs are low given that the location of many of the world’s coal reserves are well known.
Although scientific understanding of, and production experience with, coal bed methane is in the early learning stage, it is believed to represent a very substantial resource of natural gas. In the US alone, US Geological Society estimates suggest that as much as 700TCF of CBM exists in place, of which perhaps 100TCF could prove economically recoverable.
Extracting CBM Several methods exist for extracting CBM. The focus of most extraction techniques is, however, to reduce the pressure of the coal stream and the water within it, predominantly by releasing a large volume of water and fracturing the coal seam. Since CBM travels with ground water in coal seams, extraction of CBM involves pumping available water from the saturated coal seam in order to reduce the water pressure that holds gas in the seam. CBM has very low solubility in water and readily separates as pressure decreases, allowing it to be piped out of the well separately from the water. Water moving from the coal seam to the well bore encourages gas migration toward the well. The production profiles of CBM wells are typically characterized by a ‘negative decline’ in which the gas production rate initially increases as the water is pumped off and gas begins to desorb and flow.
Environmental pro’s and cons CBM does, however, produce very large volumes of high salinity water, the disposal of which represents a significant challenge given the toxic impact of salt water on vegetation. More positively, however, through capturing methane that may otherwise find its way to the earth’s atmosphere it holds the potential to significantly reduce global methane emissions.
Coal bed methane (CBM) is
simply methane found in
coal seams
The focus of most extraction
techniques is to reduce the
pressure of the coal stream
and the water within it
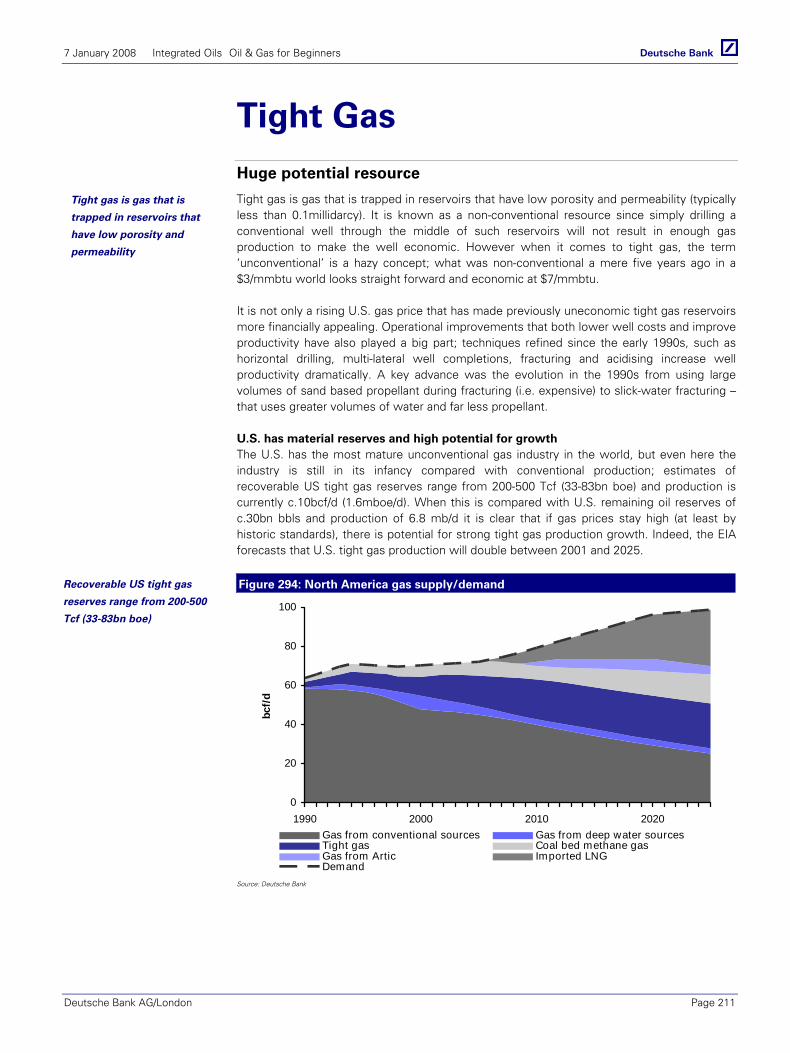
7 January 2008 Integrated Oils Oil & Gas for Beginners
Deutsche Bank AG/London Page 211
Tight Gas Huge potential resource
Tight gas is gas that is trapped in reservoirs that have low porosity and permeability (typically less than 0.1millidarcy). It is known as a non-conventional resource since simply drilling a conventional well through the middle of such reservoirs will not result in enough gas production to make the well economic. However when it comes to tight gas, the term ‘unconventional’ is a hazy concept; what was non-conventional a mere five years ago in a $3/mmbtu world looks straight forward and economic at $7/mmbtu.
It is not only a rising U.S. gas price that has made previously uneconomic tight gas reservoirs more financially appealing. Operational improvements that both lower well costs and improve productivity have also played a big part; techniques refined since the early 1990s, such as horizontal drilling, multi-lateral well completions, fracturing and acidising increase well productivity dramatically. A key advance was the evolution in the 1990s from using large volumes of sand based propellant during fracturing (i.e. expensive) to slick-water fracturing – that uses greater volumes of water and far less propellant.
U.S. has material reserves and high potential for growth The U.S. has the most mature unconventional gas industry in the world, but even here the industry is still in its infancy compared with conventional production; estimates of recoverable US tight gas reserves range from 200-500 Tcf (33-83bn boe) and production is currently c.10bcf/d (1.6mboe/d). When this is compared with U.S. remaining oil reserves of c.30bn bbls and production of 6.8 mb/d it is clear that if gas prices stay high (at least by historic standards), there is potential for strong tight gas production growth. Indeed, the EIA forecasts that U.S. tight gas production will double between 2001 and 2025.
Figure 294: North America gas supply/demand
0
20
40
60
80
100
1990 2000 2010 2020
bcf/
d
Gas from conventional sources Gas from deep water sourcesTight gas Coal bed methane gasGas from Artic Imported LNGDemand
Source: Deutsche Bank
Tight gas is gas that is
trapped in reservoirs that
have low porosity and
permeability
Recoverable US tight gas
reserves range from 200-500
Tcf (33-83bn boe)
7 January 2008 Integrated Oils Oil & Gas for Beginners
Page 212 Deutsche Bank AG/London
Economic at current prices
U.S. tight gas reservoirs are considered to be economic in a broad range of $4.0-8.0/mmbtu and tight gas currently supplies 24% of U.S. gas production. U.S. tight gas production comfortably exceeds the country’s production from other non-conventional gas resources, e.g. coalbed-methane, shale gas and deepwater gas. Major tight gas producers include Anadarko, ConocoPhillips (via its 2006 acquisition of Burlington Resources), Chesapeake, Encana and XTO Energy.
Elsewhere in the world there are thought to be significant tight gas reserves that are relatively untapped at present. As provinces mature (in hydrocarbon production terms) so tight gas reserves will likely be exploited. Continental Europe, the UK North Sea and Argentina are all areas where investment in tight gas production is increasing, although production levels are not meaningful as yet.

7 January 2008 Integrated Oils Oil & Gas for Beginners
Deutsche Bank AG/London Page 213
Section II: The Countries
7 January 2008 Integrated Oils Oil & Gas for Beginners
Page 214 Deutsche Bank AG/London
Major non-OPEC producers
Norway
UK
USA – Alaska
USA – Gulf of Mexico
Canada – Oil Sands
Azerbaijan
Kazakhstan
Russia
Argentina
Brazil

7 January 2008 Integrated Oils Oil & Gas for Beginners
Deutsche Bank AG/London Page 215
Norway Norway is a relatively mature hydrocarbon province having commenced oil production in the early 1970s. Nevertheless, helped by the Norwegian State’s generally conservative approach to the development of the country’s natural resource base, it retains substantial hydrocarbon reserves estimated by Wood Mackenzie at end 2007 to stand at 9.6bn bbls of oil (2P) and 85TCF of gas (2P). Production is entirely offshore and, in 2007, production of oil ran at around 2.7mb/d of which circa 2.5mb/d was exported, making Norway the world’s third largest net oil exporter, while gas production ran at 1.5mboe/d. Importantly, the Norwegian state holds a significant interest in the nation’s oil production both directly through the State Direct Financial Interest (SDFI) and but also indirectly through its 62.5% interest in StatoilHydro. Major IOCs with a strong presence in Norway include StatoilHydro, Exxon and Total.
Basic geology and topology
All of Norway’s oil reserves are located offshore on the Norwegian Continental Shelf. This can be divided into three main areas namely the North Sea, the mid Norwegian Shelf and the Barents Sea. The bulk of Norway’s oil production occurs in the central and northern sections of the North Sea where hydrocarbons reside in two reservoir horizons created during the Jurassic and Lower Tertiary. In the central North Sea these are dominated by the Central Graben which contains, amongst others, the giant Ekofisk field. In the northern North Sea the Viking Graben dominates. Major fields include Troll, Oseberg and Sleipner.
Moving further north, the mid Norwegian Shelf has traditionally been perceived as a gas prone province. To date most of the exploration has concentrated on the Haltenbanken area and, with the geological knowledge of the Shelf still limited, expectations around exploration remain relatively high. Similarly, the Barents Sea which contains the most northerly acreage in the Norwegian sector remains highly prospective although enthusiasm has waned in recent years following disappointing results from early exploration. Having said this, significant finds have been made around the Hammerfest Basin not least Statoil’s Snohvit and Eni’s Goliat.
Regulation and history
The rights to Norway’s natural resources are administered by the Norwegian Petroleum Directorate or NPD. The NPD’s primary function is to ensure that exploration and production is carried out in accordance with Government legislation, to ensure safety regulations are adhered to and to serve as advisor to, amongst others, the Ministry of Petroleum and Energy.
Importantly, the State plays a dominant role in the Norwegian Petroleum Industry and has taken a direct interest in all licenses awarded since the second licensing round in 1969. Initially these interests were held through the state owned oil company, Statoil, which was established in 1972 to explore, transport market and refine petroleum products. However, in 1985 the Norwegian state established the aforementioned SDFI at which time the majority of Statoil’s interests were split between it and the SDFI. Subsequently, in 2001 the State underwent a further major restructuring of its interests. An 18% interest in Statoil was listed on the Oslo and New York exchanges via an IPO while management of the State’s remaining assets was transferred to a new state-owned company, Petoro, the purpose of which was to create a commercial portfolio that would maximize the value of the holdings for the nation as a whole. At the same time, a new company called Gassco was established with responsibility for operation of the gas pipeline network and treatment facilities for the benefit of all companies wishing to use the gas network. Statoil retains responsibility for the marketing and sale of State hydrocarbons.
Key facts Oil production 2007E 2.7mb/d Gas production 2007E 1.5mboe/d Oil reserves 2007E 9.6bn bbls Gas reserve 2007E 85.3TCF Reserve life (oil) 9.3 years Reserve life (gas) 21.4 years GDP 2007E ($bn) 295bn GDP Growth 2007E (%) 2.5% Population (m) 4.6m Oil consumption (mb/d) 228kb/d Oil exports (mb/d) 2.6mb/d Fiscal regime Tax & royalty Marginal tax rate 78% Top 3 Oil fields (2007E) Troll 675kboe/d Ekofisk 346kboe/d Asgard 375kboe/d Top 3 Producers (2007E) Statoil Hydro 1,480kboe/d Exxon 860kboe/d Total 790kboe/d
Source: Wood Mackenzie; EIA
Oil Production profile kb/d
0
500
1000
1500
2000
2500
3000
3500
4000
2000
2001
2002
2003
2004
2005
2006
2007
2008
2009
2010
2011
2012
2013
2014
2015
Central North Sea Northern North Sea
Norwegian Sea Barents Sea
kb/d
Source: Wood Mackenzie data
Remaining reserves split %
Oil50%
Gas50%
Source: Wood Mackenzie data
Initial versus remaining reserves
Produced52%
Remaining48%
Source: Wood Mackenzie data
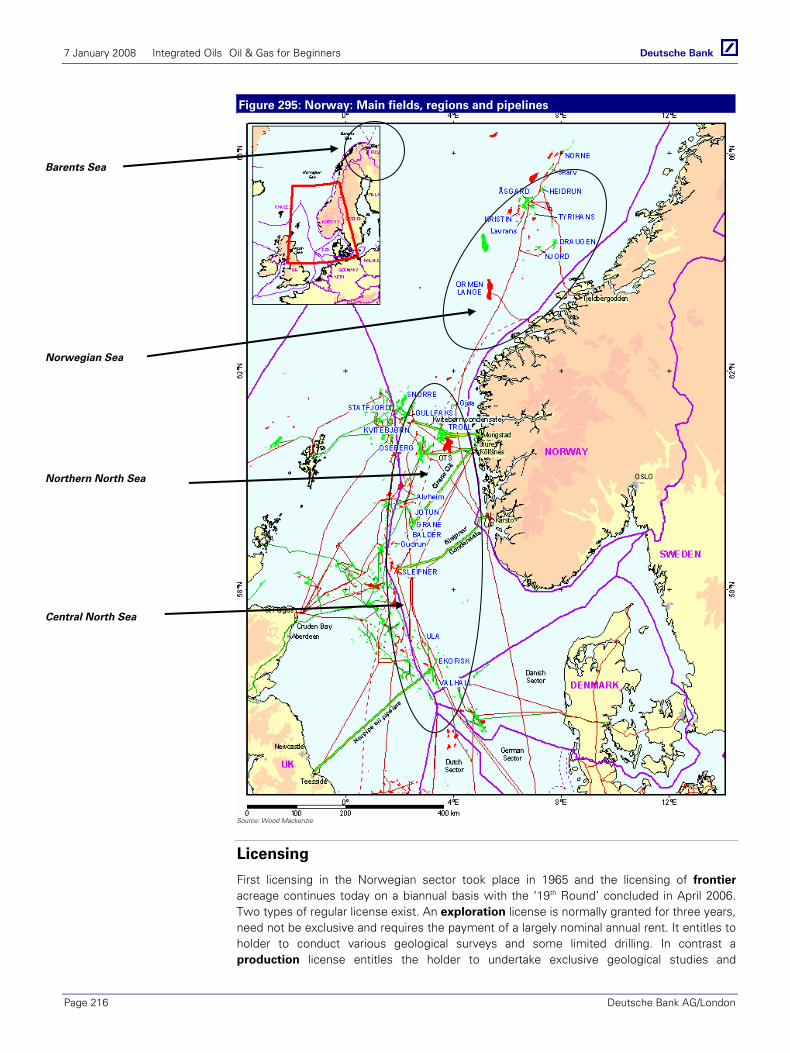
7 January 2008 Integrated Oils Oil & Gas for Beginners
Page 216 Deutsche Bank AG/London
Figure 295: Norway: Main fields, regions and pipelines
Source: Wood Mackenzie
Licensing
First licensing in the Norwegian sector took place in 1965 and the licensing of frontier acreage continues today on a biannual basis with the ‘19th Round’ concluded in April 2006. Two types of regular license exist. An exploration license is normally granted for three years, need not be exclusive and requires the payment of a largely nominal annual rent. It entitles to holder to conduct various geological surveys and some limited drilling. In contrast a production license entitles the holder to undertake exclusive geological studies and
Barents Sea
Norwegian Sea
Northern North Sea
Central North Sea

7 January 2008 Integrated Oils Oil & Gas for Beginners
Deutsche Bank AG/London Page 217
exploration under a pre-defined work programme which generally lasts from 2-6 years. Following this the holder may retain areas covering discoveries only for up to 30 years.
More recently, the Norwegian authorities have introduced a second licensing scheme entitled the Awards in Pre-defined Areas (or APA). Occurring annually, this seeks to award open acreage in more mature parts of the shelf, the intention of the authorities being to reduce fallow acreage and maximize the use of existing infrastructure. Exploration may extend for up to three years. However, at the end of this period the holder must either ‘drill or drop’. Similarly, by the end of the fourth year the license holder must either decide to proceed with an application for a Plan of Development and Operation (PDO) or relinquish the acreage. Assuming that this application is successful, the license holders are allowed to retain half their initial license for a further 15 years during which time the plan may be executed and they may lift the oil or gas to which they are entitled.
Production of Oil & Gas
Norwegian oil production rose strongly through the 1980s and into the 1990s, peaking at around 3.3mb/d at the start of this decade. Today, production remains concentrated in the North Sea which accounts for 2mb/d of volume. As these fields continue to mature it is likely that output will now gradually decline, Wood Mackenzie data suggesting that by 2010 liquids production will be running at 2.5mb/d. There is, however, some hope that success in the Barents Sea will go some way to offset the pace of decline. In 2006 the largest producing field in Norway was the 280kb/d Ekofisk, operated by COP, with other important fields including Grane (220kboe/d), Troll (190kboe/d), Asgard (180kboe/d), Heidrun (140kboe/d) and Gullfaks (220kboe/d).
Norway is the world’s eighth largest gas producer. In contrast to liquids, gas production has shown significant growth in recent years. This trend is expected to continue into the next decade, not least following the start up in 2007 of the 14TCF Ormen Lange with its 2bcf/d plus of anticipated production. In 2006, Norway produced around 8.5 bcf/d (1.5mboe/d) yet with demand for gas in Europe growing strongly Norway is expected to be producing c12.0bcf/d (2.1mboe/d) by 2010. Major gas fields in 2006 included Troll, which at 3.0bcf/d, accounts for over a third of Norway’s gas production. Other important fields include Sleipner (1.3bcf/d) and Aasgard (900mscf/d).
From a company perspective, it comes as little surprise that in 2006 Statoil and Hydro were the country’s main producers. These two aside, Exxon and Total represent the international players with the greatest absolute exposure to Norway’s upstream.
Figure 296: Norwegian Oil production 2000-15E (kb/d)
Figure 297: Norwegian gas production 2000-15E
(mscf/d)
0
500
1000
1500
2000
2500
3000
3500
4000
2000
2001
2002
2003
2004
2005
2006
2007
2008
2009
2010
2011
2012
2013
2014
2015
Central North Sea Northern North Sea
Norwegian Sea Barents Sea
kb/d
0
2000
4000
6000
8000
10000
12000
14000
2000
2001
2002
2003
2004
2005
2006
2007
2008
2009
2010
2011
2012
2013
2014
2015
Central North Sea Northern North Sea
Norwegian Sea Barents Sea
mmscf/d
Source: Wood Mackenzie Source: Wood Mackenzie

7 January 2008 Integrated Oils Oil & Gas for Beginners
Page 218 Deutsche Bank AG/London
Figure 298: Liquids production 2007 by company (kb/d) Figure 299: Gas production 2007 by company (kboe/d)
0
100
200
300
400
500
600
700
800
900
SD
FI
Statoil
Hydro
XO
M
Total
CO
P
Eni
Shell
BP
Marathon
kb/d
0
100
200
300
400
500
600
SD
FI
Statoil
Hydro
XO
M
Total
Shell
CO
P
Eni
Marathon
BP
kboe
Source: Wood Mackenzie Source: Wood Mackenzie
Reserves and resources
Based on Wood Mackenzie data, 2P reserves in Norway at the end of 2007 included some 9.6bn bbls of oil and 85.3TCF of gas. Of these an estimated 53% are located in the North Sea. In recent years, reserve growth has tended to arise through additions to existing fields rather than new discoveries. Nevertheless, despite its maturity Norway remains highly prospective with the NPD estimating total undiscovered resources of some 22bn boe largely in the relatively unexplored Norwegian (8bn boe) and Barents (6bn boe) Seas. The Barents in particular has been a source of significant excitement although to date results have, by and large, been relatively disappointing. Nevertheless, with oil discovered on several different horizons within the Triassic in addition to those of Goliat and Snohvit in the Jurassic, the Barents remains a much discussed frontier province. New discoveries aside, with an average field recovery factor estimated by the NPD at 42%, significant potential also remains for reserve additions through improved recovery techniques and field developments.
Pipelines and infrastructure
Norway’s crude oil transport pipelines are all located in the North Sea and carry the crude oil to shore. Key pipelines include the Norpipe system which links Ekofisk with the UK at Teeside and the Oseberg Transportation System, Troll Oil System and Grane Oil Pipeline, all of which connect facilities in the northern North Sea to the Norwegian mainland at Mongstad and Sture. Similarly, the country has established a significant number of gas pipelines both to connect the offshore fields to the Norwegian mainland as well as to other European markets. Several of the major gas pipelines are indicated in the table below.
Figure 300: Selected international gas pipelines Name length (km) Fields Destination Volume
Langeled 1200 Ormen Lange Easington 750bcf/y
Frigg 350 Frigg St Fergus 510bcf/y
Zeepipe 1 814 Sleipner Zeebruge 460bcf/y
Franpipe 830 Troll/Sleipner Dunkerque 530bcf/y
Europipe 716 Asgard Dunkirk 700bcf/y Source: Deutsche Bank
Crude Oil Blends and Quality
Norwegian oils are in the main light, sweet blends. The most important blend is Ekofisk which has an API of 37.8 and 0.3% sulphur content i.e. very similar to the UK’s Brent. Variations in crude quality are not expected to prove significant going forwards.
7 January 2008 Integrated Oils Oil & Gas for Beginners
Deutsche Bank AG/London Page 219
Broad Fiscal Terms
All licenses in Norway are granted as tax and royalty concessions. The main tax components are corporation tax of 28% and a special tax levied on hydrocarbon production of 50%. The resulting 78% effective tax rate makes Norway one of the highest tax regimes globally. However, whilst the rate of tax is high, tax allowances are relatively generous. Capex is amortizable against income on a six year straight line basis with a 30% value uplift available for tax purposes (which is recoverable over four years). In addition, as an incentive to encourage greater exploration activity, exploration costs are allowable as an offset against tax in the year in which they are incurred whether a company has income or not. This effectively reduces the cost of exploration to 22 cents in the US$.
Refining and downstream markets
Norway had some 310kb/d of refining capacity in 2007 through two major refining facilities; the Exxon owned and operated 110kb/d Slagen plant and the Statoil operated 200kb/d Mongstad facility (21% of which is owned by Shell). Norway produces more petroleum products than it consumes and is thus a net exporter of c80kb/d of finished products as well as crude oil. Not surprisingly, Statoil (46%), Shell (27%) and Exxon (20%) dominate the Norwegian downstream product markets.
LNG
To date LNG has played no role in natural gas exports from Norway and in this respect the commissioning of Statoil’s 4.7mtpa Snohvit facility at the end of 2007 will open new markets for Norwegian gas. Fed by a cluster of gas discoveries in the Barents Sea in the early 1980s the development of an LNG project was seen as the only feasible option for the monetization of some 6TCF of gas. Completion of the project has, however, not been without its delays and disappointments not least a very substantial increase in cost. At over $8bn this is double that anticipated when the initial FID was taken. Dependent upon the discovery of additional gas reserves it is hoped that additional train(s) may be added at some future point.

7 January 2008 Integrated Oils Oil & Gas for Beginners
Page 220 Deutsche Bank AG/London
Norway - Notes
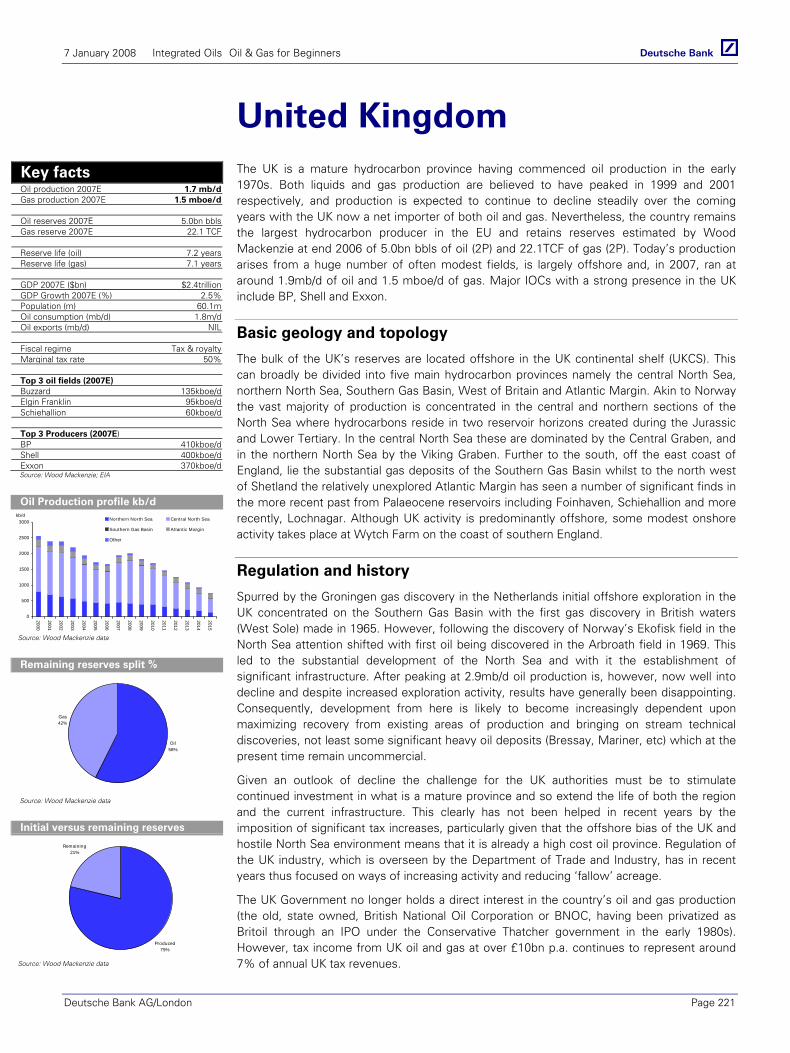
7 January 2008 Integrated Oils Oil & Gas for Beginners
Deutsche Bank AG/London Page 221
United Kingdom The UK is a mature hydrocarbon province having commenced oil production in the early 1970s. Both liquids and gas production are believed to have peaked in 1999 and 2001 respectively, and production is expected to continue to decline steadily over the coming years with the UK now a net importer of both oil and gas. Nevertheless, the country remains the largest hydrocarbon producer in the EU and retains reserves estimated by Wood Mackenzie at end 2006 of 5.0bn bbls of oil (2P) and 22.1TCF of gas (2P). Today’s production arises from a huge number of often modest fields, is largely offshore and, in 2007, ran at around 1.9mb/d of oil and 1.5 mboe/d of gas. Major IOCs with a strong presence in the UK include BP, Shell and Exxon.
Basic geology and topology
The bulk of the UK’s reserves are located offshore in the UK continental shelf (UKCS). This can broadly be divided into five main hydrocarbon provinces namely the central North Sea, northern North Sea, Southern Gas Basin, West of Britain and Atlantic Margin. Akin to Norway the vast majority of production is concentrated in the central and northern sections of the North Sea where hydrocarbons reside in two reservoir horizons created during the Jurassic and Lower Tertiary. In the central North Sea these are dominated by the Central Graben, and in the northern North Sea by the Viking Graben. Further to the south, off the east coast of England, lie the substantial gas deposits of the Southern Gas Basin whilst to the north west of Shetland the relatively unexplored Atlantic Margin has seen a number of significant finds in the more recent past from Palaeocene reservoirs including Foinhaven, Schiehallion and more recently, Lochnagar. Although UK activity is predominantly offshore, some modest onshore activity takes place at Wytch Farm on the coast of southern England.
Regulation and history
Spurred by the Groningen gas discovery in the Netherlands initial offshore exploration in the UK concentrated on the Southern Gas Basin with the first gas discovery in British waters (West Sole) made in 1965. However, following the discovery of Norway’s Ekofisk field in the North Sea attention shifted with first oil being discovered in the Arbroath field in 1969. This led to the substantial development of the North Sea and with it the establishment of significant infrastructure. After peaking at 2.9mb/d oil production is, however, now well into decline and despite increased exploration activity, results have generally been disappointing. Consequently, development from here is likely to become increasingly dependent upon maximizing recovery from existing areas of production and bringing on stream technical discoveries, not least some significant heavy oil deposits (Bressay, Mariner, etc) which at the present time remain uncommercial.
Given an outlook of decline the challenge for the UK authorities must be to stimulate continued investment in what is a mature province and so extend the life of both the region and the current infrastructure. This clearly has not been helped in recent years by the imposition of significant tax increases, particularly given that the offshore bias of the UK and hostile North Sea environment means that it is already a high cost oil province. Regulation of the UK industry, which is overseen by the Department of Trade and Industry, has in recent years thus focused on ways of increasing activity and reducing ‘fallow’ acreage.
The UK Government no longer holds a direct interest in the country’s oil and gas production (the old, state owned, British National Oil Corporation or BNOC, having been privatized as Britoil through an IPO under the Conservative Thatcher government in the early 1980s). However, tax income from UK oil and gas at over £10bn p.a. continues to represent around 7% of annual UK tax revenues.
Key facts Oil production 2007E 1.7 mb/d Gas production 2007E 1.5 mboe/d Oil reserves 2007E 5.0bn bbls Gas reserve 2007E 22.1 TCF Reserve life (oil) 7.2 years Reserve life (gas) 7.1 years GDP 2007E ($bn) $2.4trillion GDP Growth 2007E (%) 2.5% Population (m) 60.1m Oil consumption (mb/d) 1.8m/d Oil exports (mb/d) NIL Fiscal regime Tax & royalty Marginal tax rate 50% Top 3 oil fields (2007E) Buzzard 135kboe/d Elgin Franklin 95kboe/d Schiehallion 60kboe/d Top 3 Producers (2007E) BP 410kboe/d Shell 400kboe/d Exxon 370kboe/d
Source: Wood Mackenzie; EIA
Oil Production profile kb/d
0
500
1000
1500
2000
2500
3000
2000
2001
2002
2003
2004
2005
2006
2007
2008
2009
2010
2011
2012
2013
2014
2015
Northern North Sea Central North Sea
Southern Gas Basin Atlantic Margin
Other
kb/d
Source: Wood Mackenzie data
Remaining reserves split %
Oil58%
Gas42%
Source: Wood Mackenzie data
Initial versus remaining reserves
Produced79%
Remaining21%
Source: Wood Mackenzie data
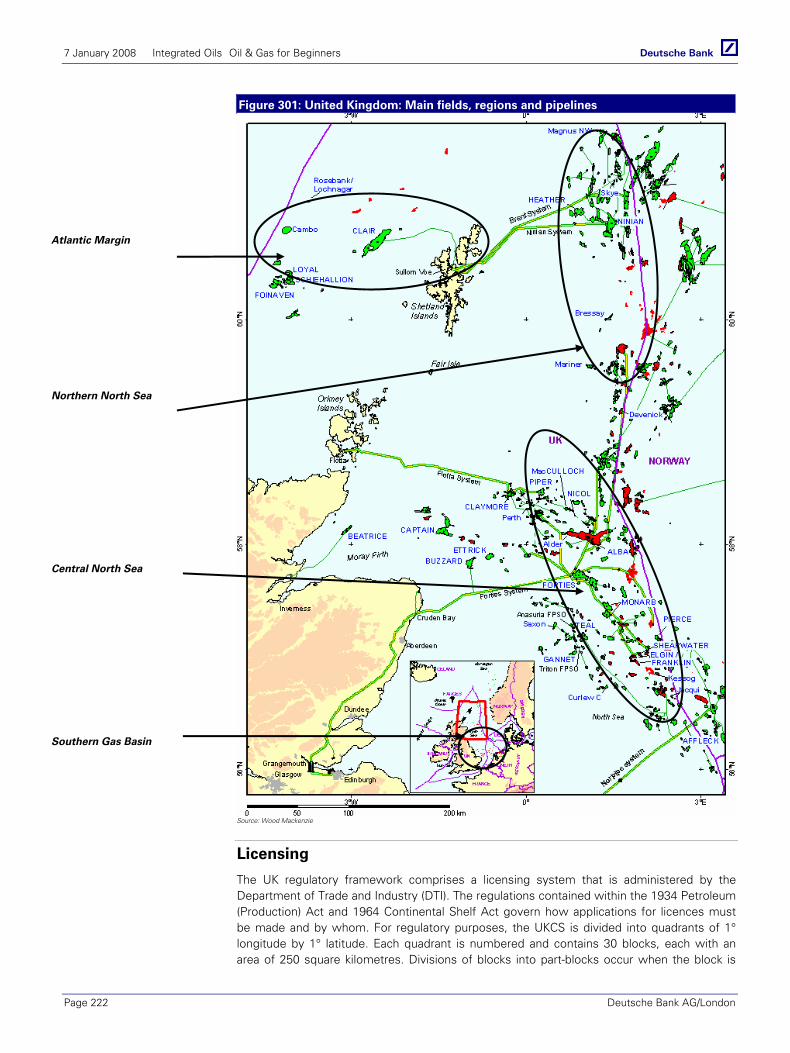
7 January 2008 Integrated Oils Oil & Gas for Beginners
Page 222 Deutsche Bank AG/London
Figure 301: United Kingdom: Main fields, regions and pipelines
Source: Wood Mackenzie
Licensing
The UK regulatory framework comprises a licensing system that is administered by the Department of Trade and Industry (DTI). The regulations contained within the 1934 Petroleum (Production) Act and 1964 Continental Shelf Act govern how applications for licences must be made and by whom. For regulatory purposes, the UKCS is divided into quadrants of 1° longitude by 1° latitude. Each quadrant is numbered and contains 30 blocks, each with an area of 250 square kilometres. Divisions of blocks into part-blocks occur when the block is
Atlantic Margin
Northern North Sea
Central North Sea
Southern Gas Basin

7 January 2008 Integrated Oils Oil & Gas for Beginners
Deutsche Bank AG/London Page 223
partially relinquished. Licence holders are required to pay an application fee in addition to a licence fee, which is calculated for each square kilometre included in the licence area, for the initial term, and then subsequent payment for each year in the further term.
Five types of what are termed ‘Seaward Production Licenses’ are available of which the most important are the ‘Traditional’, ‘Frontier’ and ‘Promote’. It is of note that in recent years license periods have been reduced as the authorities have sought to both increase exploration activity and prevent acreage from becoming ‘fallow’.
Seaward Production Licence (Traditional). This enables the holder to explore and exploit the reserves in the area awarded in the form of an Offshore Licensing Round. The license runs for an initial 4 years at which point half the acreage must be relinquished with the option to extend on the balance for a further four years. All acreage not covered by a development plan must be relinquished at the end of the second term.
Seaward Production Licence (Promote). In February 2003, DTI introduced the Seaward Promote License. This is awarded in the same way as the traditional license but has a lower rental fee and expires within two years if a work programme is not in place.
Seaward Production Licence (Frontier). Introduced in the 22nd round in 2004, companies were able to apply for Frontier Licenses in the West of Shetland sector. These have an initial term of just two years with rental set at 10% of the Traditional License rental. At the end of this period 75% of the acreage must be relinquished. The Licensees then have a further four years in which to complete a work programme.
Production of Oil & Gas
Despite a temporary renaissance in oil production associated with the start up of the Buzzard field in 2007, hydrocarbon production in the UK is now expected to show a steady and permanent decline. Most fields are today relatively small, with only two fields, Buzzard and Elgin-Franklin, expected to produce over 100kb/d in 2007 and only seven over 50kb/d. Indeed, with almost 40% of industry infrastructure at risk of decommissioning by 2020 unless significant investment is made, time is becoming an increasingly important factor in the UK’s ability to maximise recovery from currently stranded reserves. To the extent that the majors are divesting tail assets and attracting smaller players to the region with different economic hurdles, the pace of decline may ease. Activity remains, however, very oil price dependent.
With the exception of BP this pace of decline is also reflected in the production profiles of the major players not least Exxon, Shell, Total and Conoco, each of whom is expected to witness a c35-40% reduction in their annual rate of UK production over the next four or so years.
Figure 302: UK: Liquids production 2000-15E (kb/d) Figure 303: UK: Gas production 2000-15E (kboe/d)
0
500
1000
1500
2000
2500
3000
2000
2001
2002
2003
2004
2005
2006
2007
2008
2009
2010
2011
2012
2013
2014
2015
Northern North Sea Central North Sea
Southern Gas Basin Atlantic Margin
Other
kb/d
0
2000
4000
6000
8000
10000
12000
2000
2001
2002
2003
2004
2005
2006
2007
2008
2009
2010
2011
2012
2013
2014
2015
Northern North Sea Central North Sea
Southern Gas Basin Atlantic Margin
Other
mscf/d
Source: Wood Mackenzie Source: Wood Mackenzie
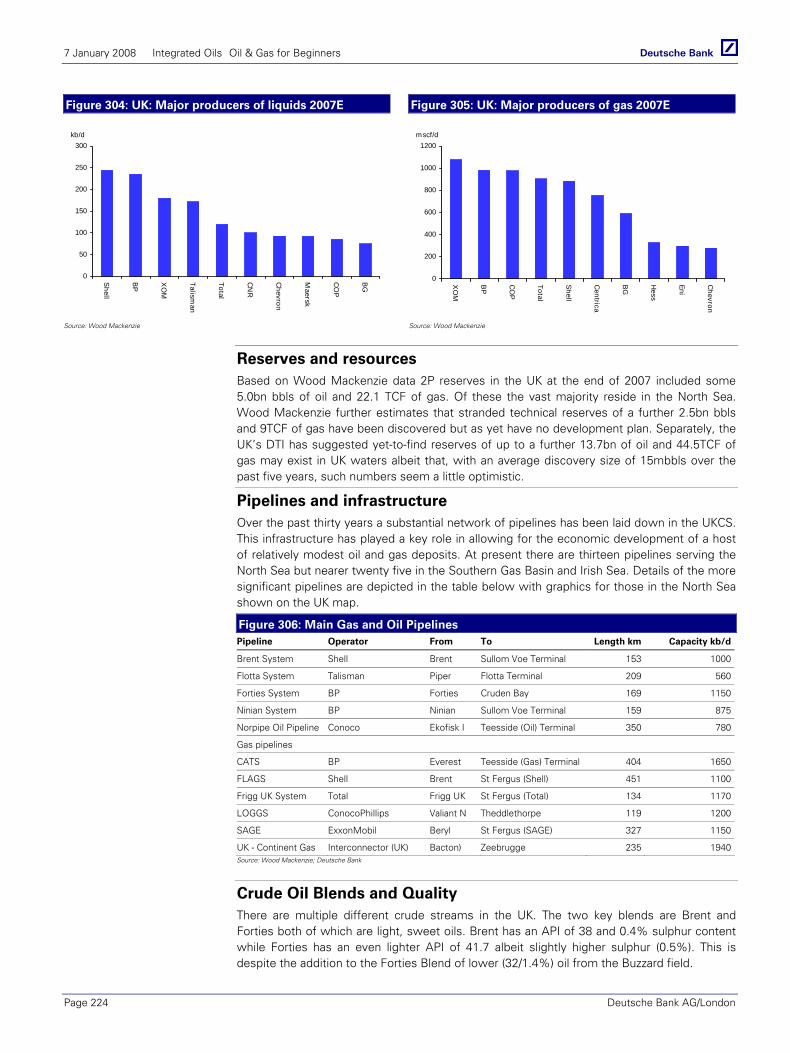
7 January 2008 Integrated Oils Oil & Gas for Beginners
Page 224 Deutsche Bank AG/London
Figure 304: UK: Major producers of liquids 2007E Figure 305: UK: Major producers of gas 2007E
0
50
100
150
200
250
300
Shell
BP
XO
M
Talisman
Total
CN
R
Chevron
Maersk
CO
P
BG
kb/d
0
200
400
600
800
1000
1200
XO
M
BP
CO
P
Total
Shell
Centrica
BG
Hess
Eni
Chevron
mscf/d
Source: Wood Mackenzie Source: Wood Mackenzie
Reserves and resources Based on Wood Mackenzie data 2P reserves in the UK at the end of 2007 included some 5.0bn bbls of oil and 22.1 TCF of gas. Of these the vast majority reside in the North Sea. Wood Mackenzie further estimates that stranded technical reserves of a further 2.5bn bbls and 9TCF of gas have been discovered but as yet have no development plan. Separately, the UK’s DTI has suggested yet-to-find reserves of up to a further 13.7bn of oil and 44.5TCF of gas may exist in UK waters albeit that, with an average discovery size of 15mbbls over the past five years, such numbers seem a little optimistic.
Pipelines and infrastructure Over the past thirty years a substantial network of pipelines has been laid down in the UKCS. This infrastructure has played a key role in allowing for the economic development of a host of relatively modest oil and gas deposits. At present there are thirteen pipelines serving the North Sea but nearer twenty five in the Southern Gas Basin and Irish Sea. Details of the more significant pipelines are depicted in the table below with graphics for those in the North Sea shown on the UK map.
Figure 306: Main Gas and Oil Pipelines Pipeline Operator From To Length km Capacity kb/d
Brent System Shell Brent Sullom Voe Terminal 153 1000
Flotta System Talisman Piper Flotta Terminal 209 560
Forties System BP Forties Cruden Bay 169 1150
Ninian System BP Ninian Sullom Voe Terminal 159 875
Norpipe Oil Pipeline Conoco Ekofisk I Teesside (Oil) Terminal 350 780
Gas pipelines
CATS BP Everest Teesside (Gas) Terminal 404 1650
FLAGS Shell Brent St Fergus (Shell) 451 1100
Frigg UK System Total Frigg UK St Fergus (Total) 134 1170
LOGGS ConocoPhillips Valiant N Theddlethorpe 119 1200
SAGE ExxonMobil Beryl St Fergus (SAGE) 327 1150
UK - Continent Gas Interconnector (UK) Bacton) Zeebrugge 235 1940Source: Wood Mackenzie; Deutsche Bank
Crude Oil Blends and Quality There are multiple different crude streams in the UK. The two key blends are Brent and Forties both of which are light, sweet oils. Brent has an API of 38 and 0.4% sulphur content while Forties has an even lighter API of 41.7 albeit slightly higher sulphur (0.5%). This is despite the addition to the Forties Blend of lower (32/1.4%) oil from the Buzzard field.
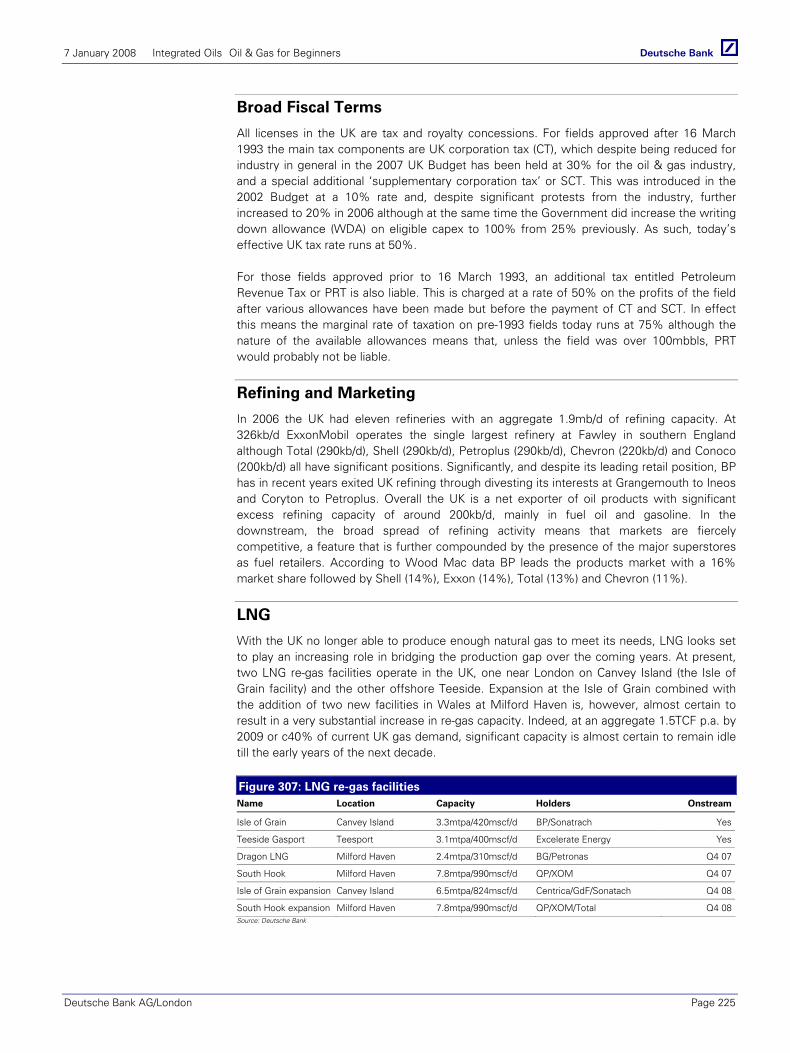
7 January 2008 Integrated Oils Oil & Gas for Beginners
Deutsche Bank AG/London Page 225
Broad Fiscal Terms
All licenses in the UK are tax and royalty concessions. For fields approved after 16 March 1993 the main tax components are UK corporation tax (CT), which despite being reduced for industry in general in the 2007 UK Budget has been held at 30% for the oil & gas industry, and a special additional ‘supplementary corporation tax’ or SCT. This was introduced in the 2002 Budget at a 10% rate and, despite significant protests from the industry, further increased to 20% in 2006 although at the same time the Government did increase the writing down allowance (WDA) on eligible capex to 100% from 25% previously. As such, today’s effective UK tax rate runs at 50%.
For those fields approved prior to 16 March 1993, an additional tax entitled Petroleum Revenue Tax or PRT is also liable. This is charged at a rate of 50% on the profits of the field after various allowances have been made but before the payment of CT and SCT. In effect this means the marginal rate of taxation on pre-1993 fields today runs at 75% although the nature of the available allowances means that, unless the field was over 100mbbls, PRT would probably not be liable.
Refining and Marketing
In 2006 the UK had eleven refineries with an aggregate 1.9mb/d of refining capacity. At 326kb/d ExxonMobil operates the single largest refinery at Fawley in southern England although Total (290kb/d), Shell (290kb/d), Petroplus (290kb/d), Chevron (220kb/d) and Conoco (200kb/d) all have significant positions. Significantly, and despite its leading retail position, BP has in recent years exited UK refining through divesting its interests at Grangemouth to Ineos and Coryton to Petroplus. Overall the UK is a net exporter of oil products with significant excess refining capacity of around 200kb/d, mainly in fuel oil and gasoline. In the downstream, the broad spread of refining activity means that markets are fiercely competitive, a feature that is further compounded by the presence of the major superstores as fuel retailers. According to Wood Mac data BP leads the products market with a 16% market share followed by Shell (14%), Exxon (14%), Total (13%) and Chevron (11%).
LNG
With the UK no longer able to produce enough natural gas to meet its needs, LNG looks set to play an increasing role in bridging the production gap over the coming years. At present, two LNG re-gas facilities operate in the UK, one near London on Canvey Island (the Isle of Grain facility) and the other offshore Teeside. Expansion at the Isle of Grain combined with the addition of two new facilities in Wales at Milford Haven is, however, almost certain to result in a very substantial increase in re-gas capacity. Indeed, at an aggregate 1.5TCF p.a. by 2009 or c40% of current UK gas demand, significant capacity is almost certain to remain idle till the early years of the next decade.
Figure 307: LNG re-gas facilities Name Location Capacity Holders Onstream
Isle of Grain Canvey Island 3.3mtpa/420mscf/d BP/Sonatrach Yes
Teeside Gasport Teesport 3.1mtpa/400mscf/d Excelerate Energy Yes
Dragon LNG Milford Haven 2.4mtpa/310mscf/d BG/Petronas Q4 07
South Hook Milford Haven 7.8mtpa/990mscf/d QP/XOM Q4 07
Isle of Grain expansion Canvey Island 6.5mtpa/824mscf/d Centrica/GdF/Sonatach Q4 08
South Hook expansion Milford Haven 7.8mtpa/990mscf/d QP/XOM/Total Q4 08Source: Deutsche Bank

7 January 2008 Integrated Oils Oil & Gas for Beginners
Page 226 Deutsche Bank AG/London
United Kingdom - Notes
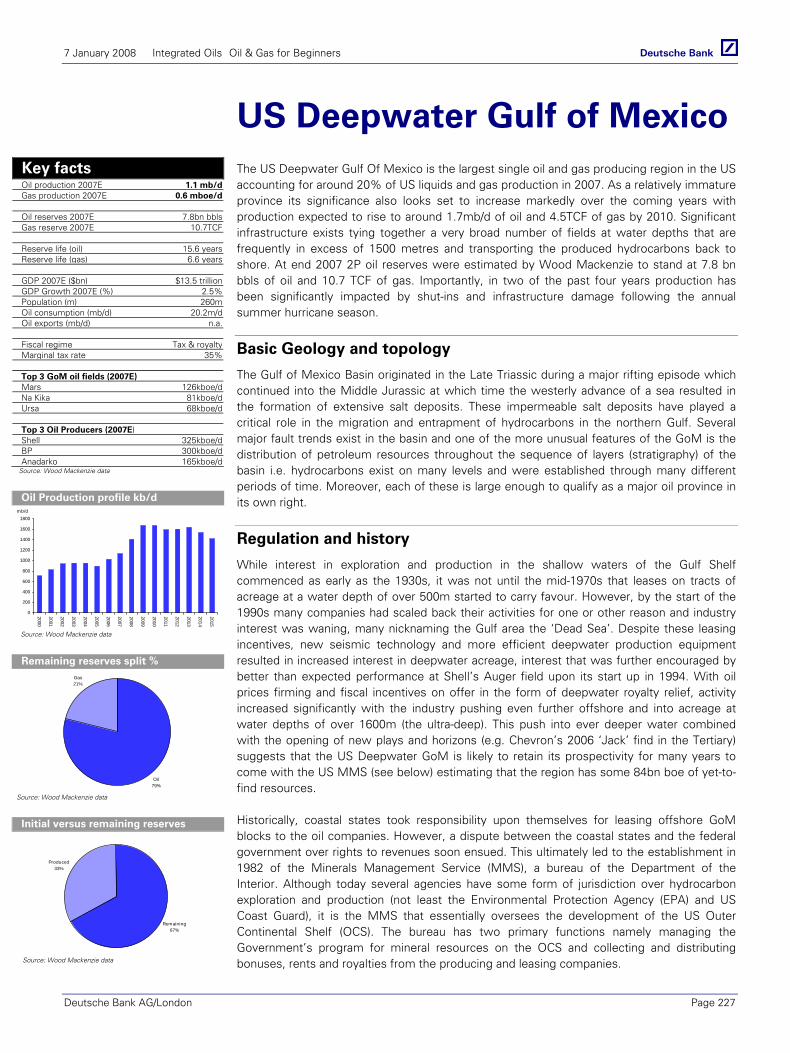
7 January 2008 Integrated Oils Oil & Gas for Beginners
Deutsche Bank AG/London Page 227
US Deepwater Gulf of Mexico The US Deepwater Gulf Of Mexico is the largest single oil and gas producing region in the US accounting for around 20% of US liquids and gas production in 2007. As a relatively immature province its significance also looks set to increase markedly over the coming years with production expected to rise to around 1.7mb/d of oil and 4.5TCF of gas by 2010. Significant infrastructure exists tying together a very broad number of fields at water depths that are frequently in excess of 1500 metres and transporting the produced hydrocarbons back to shore. At end 2007 2P oil reserves were estimated by Wood Mackenzie to stand at 7.8 bn bbls of oil and 10.7 TCF of gas. Importantly, in two of the past four years production has been significantly impacted by shut-ins and infrastructure damage following the annual summer hurricane season.
Basic Geology and topology
The Gulf of Mexico Basin originated in the Late Triassic during a major rifting episode which continued into the Middle Jurassic at which time the westerly advance of a sea resulted in the formation of extensive salt deposits. These impermeable salt deposits have played a critical role in the migration and entrapment of hydrocarbons in the northern Gulf. Several major fault trends exist in the basin and one of the more unusual features of the GoM is the distribution of petroleum resources throughout the sequence of layers (stratigraphy) of the basin i.e. hydrocarbons exist on many levels and were established through many different periods of time. Moreover, each of these is large enough to qualify as a major oil province in its own right.
Regulation and history
While interest in exploration and production in the shallow waters of the Gulf Shelf commenced as early as the 1930s, it was not until the mid-1970s that leases on tracts of acreage at a water depth of over 500m started to carry favour. However, by the start of the 1990s many companies had scaled back their activities for one or other reason and industry interest was waning, many nicknaming the Gulf area the ‘Dead Sea’. Despite these leasing incentives, new seismic technology and more efficient deepwater production equipment resulted in increased interest in deepwater acreage, interest that was further encouraged by better than expected performance at Shell’s Auger field upon its start up in 1994. With oil prices firming and fiscal incentives on offer in the form of deepwater royalty relief, activity increased significantly with the industry pushing even further offshore and into acreage at water depths of over 1600m (the ultra-deep). This push into ever deeper water combined with the opening of new plays and horizons (e.g. Chevron’s 2006 ‘Jack’ find in the Tertiary) suggests that the US Deepwater GoM is likely to retain its prospectivity for many years to come with the US MMS (see below) estimating that the region has some 84bn boe of yet-to-find resources.
Historically, coastal states took responsibility upon themselves for leasing offshore GoM blocks to the oil companies. However, a dispute between the coastal states and the federal government over rights to revenues soon ensued. This ultimately led to the establishment in 1982 of the Minerals Management Service (MMS), a bureau of the Department of the Interior. Although today several agencies have some form of jurisdiction over hydrocarbon exploration and production (not least the Environmental Protection Agency (EPA) and US Coast Guard), it is the MMS that essentially oversees the development of the US Outer Continental Shelf (OCS). The bureau has two primary functions namely managing the Government’s program for mineral resources on the OCS and collecting and distributing bonuses, rents and royalties from the producing and leasing companies.
Key facts Oil production 2007E 1.1 mb/d Gas production 2007E 0.6 mboe/d Oil reserves 2007E 7.8bn bbls Gas reserve 2007E 10.7TCF Reserve life (oil) 15.6 years Reserve life (gas) 6.6 years GDP 2007E ($bn) $13.5 trillion GDP Growth 2007E (%) 2.5% Population (m) 260m Oil consumption (mb/d) 20.2m/d Oil exports (mb/d) n.a. Fiscal regime Tax & royalty Marginal tax rate 35% Top 3 GoM oil fields (2007E) Mars 126kboe/d Na Kika 81kboe/d Ursa 68kboe/d Top 3 Oil Producers (2007E) Shell 325kboe/d BP 300kboe/d Anadarko 165kboe/d
Source: Wood Mackenzie data
Oil Production profile kb/d
0
200
400
600
800
1000
1200
1400
1600
1800
2000
2001
2002
2003
2004
2005
2006
2007
2008
2009
2010
2011
2012
2013
2014
2015
mb/d
Source: Wood Mackenzie data
Remaining reserves split %
Oil79%
Gas21%
Source: Wood Mackenzie data
Initial versus remaining reserves
Remaining67%
Produced33%
Source: Wood Mackenzie data
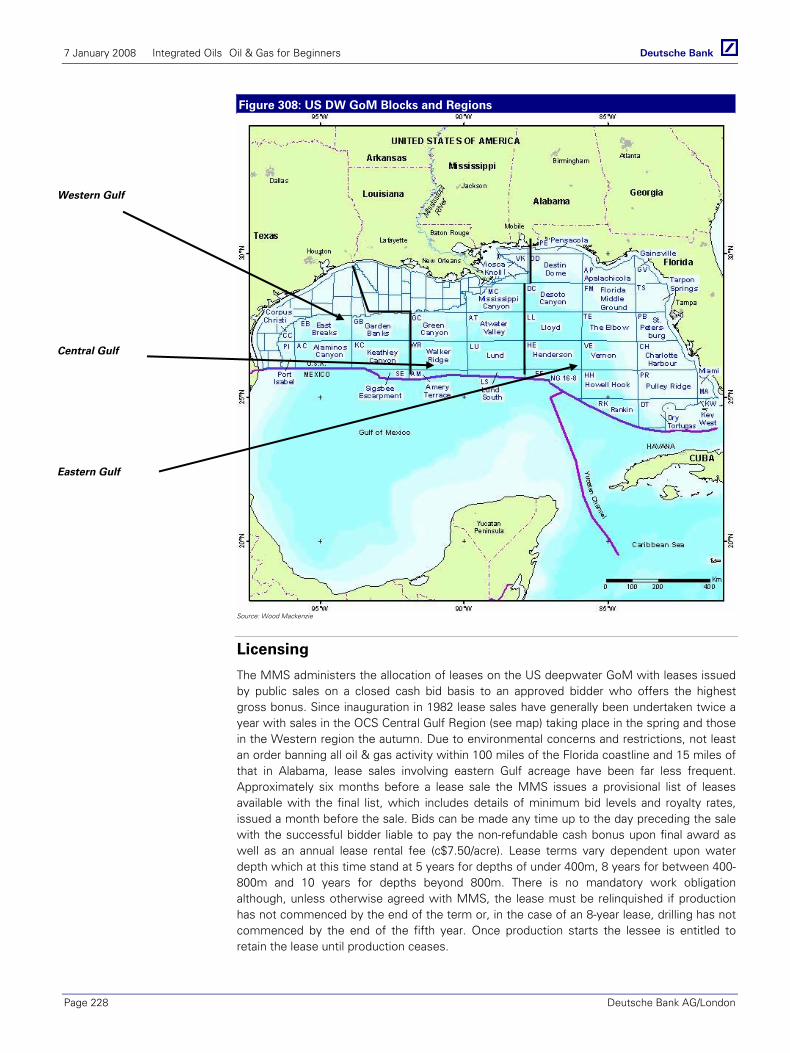
7 January 2008 Integrated Oils Oil & Gas for Beginners
Page 228 Deutsche Bank AG/London
Figure 308: US DW GoM Blocks and Regions
Source: Wood Mackenzie
Licensing
The MMS administers the allocation of leases on the US deepwater GoM with leases issued by public sales on a closed cash bid basis to an approved bidder who offers the highest gross bonus. Since inauguration in 1982 lease sales have generally been undertaken twice a year with sales in the OCS Central Gulf Region (see map) taking place in the spring and those in the Western region the autumn. Due to environmental concerns and restrictions, not least an order banning all oil & gas activity within 100 miles of the Florida coastline and 15 miles of that in Alabama, lease sales involving eastern Gulf acreage have been far less frequent. Approximately six months before a lease sale the MMS issues a provisional list of leases available with the final list, which includes details of minimum bid levels and royalty rates, issued a month before the sale. Bids can be made any time up to the day preceding the sale with the successful bidder liable to pay the non-refundable cash bonus upon final award as well as an annual lease rental fee (c$7.50/acre). Lease terms vary dependent upon water depth which at this time stand at 5 years for depths of under 400m, 8 years for between 400-800m and 10 years for depths beyond 800m. There is no mandatory work obligation although, unless otherwise agreed with MMS, the lease must be relinquished if production has not commenced by the end of the term or, in the case of an 8-year lease, drilling has not commenced by the end of the fifth year. Once production starts the lessee is entitled to retain the lease until production ceases.
Western Gulf
Central Gulf
Eastern Gulf
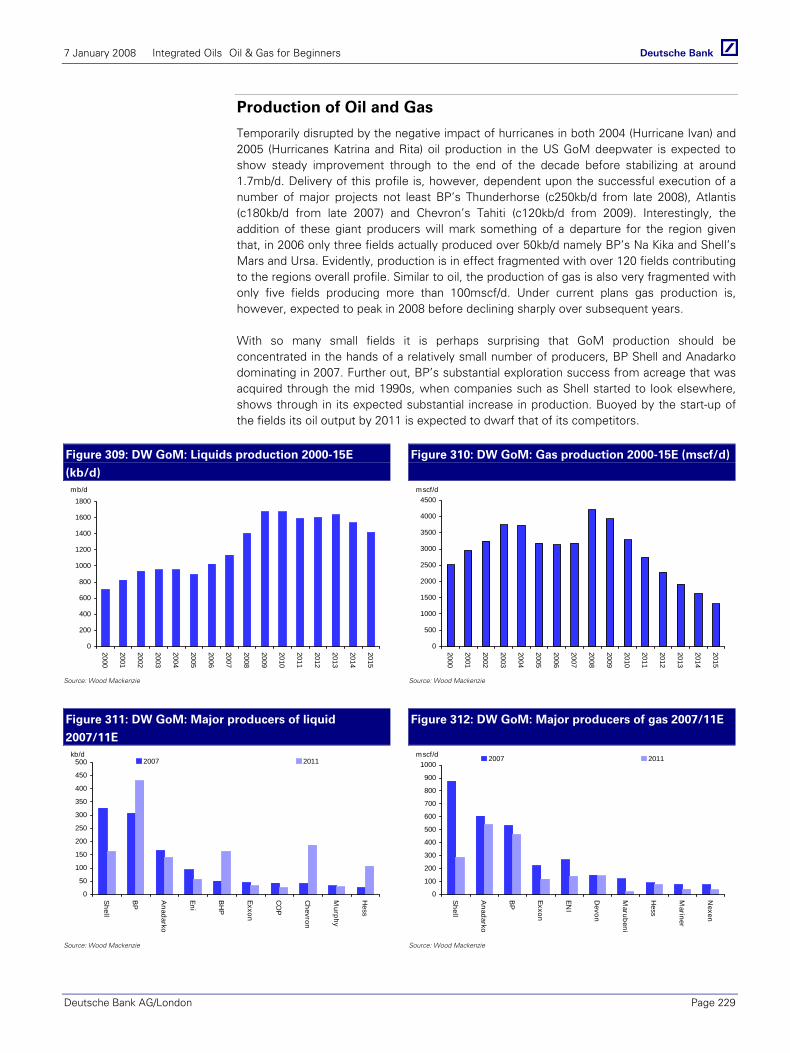
7 January 2008 Integrated Oils Oil & Gas for Beginners
Deutsche Bank AG/London Page 229
Production of Oil and Gas
Temporarily disrupted by the negative impact of hurricanes in both 2004 (Hurricane Ivan) and 2005 (Hurricanes Katrina and Rita) oil production in the US GoM deepwater is expected to show steady improvement through to the end of the decade before stabilizing at around 1.7mb/d. Delivery of this profile is, however, dependent upon the successful execution of a number of major projects not least BP’s Thunderhorse (c250kb/d from late 2008), Atlantis (c180kb/d from late 2007) and Chevron’s Tahiti (c120kb/d from 2009). Interestingly, the addition of these giant producers will mark something of a departure for the region given that, in 2006 only three fields actually produced over 50kb/d namely BP’s Na Kika and Shell’s Mars and Ursa. Evidently, production is in effect fragmented with over 120 fields contributing to the regions overall profile. Similar to oil, the production of gas is also very fragmented with only five fields producing more than 100mscf/d. Under current plans gas production is, however, expected to peak in 2008 before declining sharply over subsequent years.
With so many small fields it is perhaps surprising that GoM production should be concentrated in the hands of a relatively small number of producers, BP Shell and Anadarko dominating in 2007. Further out, BP’s substantial exploration success from acreage that was acquired through the mid 1990s, when companies such as Shell started to look elsewhere, shows through in its expected substantial increase in production. Buoyed by the start-up of the fields its oil output by 2011 is expected to dwarf that of its competitors.
Figure 309: DW GoM: Liquids production 2000-15E
(kb/d)
Figure 310: DW GoM: Gas production 2000-15E (mscf/d)
0
200
400
600
800
1000
1200
1400
1600
1800
2000
2001
2002
2003
2004
2005
2006
2007
2008
2009
2010
2011
2012
2013
2014
2015
mb/d
0
500
1000
1500
2000
2500
3000
3500
4000
4500
2000
2001
2002
2003
2004
2005
2006
2007
2008
2009
2010
2011
2012
2013
2014
2015
mscf/d
Source: Wood Mackenzie Source: Wood Mackenzie
Figure 311: DW GoM: Major producers of liquid
2007/11E
Figure 312: DW GoM: Major producers of gas 2007/11E
0
50
100
150
200
250
300
350
400
450
500
Shell
BP
Anadarko
Eni
BH
P
Exxon
CO
P
Chevron
Murphy
Hess
2007 2011kb/d
0
100
200
300
400
500
600
700
800
900
1000
Shell
Anadarko
BP
Exxon
ENI
Devon
Marubeni
Hess
Mariner
Nexen
2007 2011mscf/d
Source: Wood Mackenzie Source: Wood Mackenzie

7 January 2008 Integrated Oils Oil & Gas for Beginners
Page 230 Deutsche Bank AG/London
Reserves and Resources
Based on Wood Mackenzie data 2P reserves in the US DW GoM at the end of 2006 stood at some 7.8bn bbls of oil and 10.7TCF of gas of which the majority lie in the central Gulf. The substantial prospectivity of the region is, however, reflected by MMS data which suggests undiscovered resources at the end of 2006 stood at around 84 billion bbls of oil and gas i.e. twice the level of reserves that have been produced to date. Amongst the companies BP clearly dominates, its equity interest in existing and future developments accounting for almost 20% of the 2P reserves estimate, more than twice those of the next nearest player, Shell with c860m bbls.
Pipelines and Infrastructure
Over the past 40 years an extensive network of platform and pipeline infrastructure has been developed in the GoM. This includes both field-specific pipelines and shared gathering systems such as the Mardi Gras Oil & Gas Transportation system. Hub facilities established on the edge of the Gulf Shelf in the 1970s and 1980s also provide important processing points. The reluctance of the US Government to sanction offshore loading in the US GoM and its strict no-flare policy suggest, however, that at some point the development of major deepwater infrastructure will be necessary. Although applications for the deployment of FPSO’s are now permitted, to date none have been deployed.
Crude Oil Blends and Quality
Crude oil from the US GoM tends to be slightly heavier and more sour than WTI. The principle marker is Mars Blend which with an API of 28 and sulphur content of 2.28% serves as a price barometer for imported sours such as Arab Medium and Kuwait Medium.
Broad Fiscal Terms
As a tax and royalty concession, taxation in the US GoM is comprised of two key elements namely royalty and federal corporate income tax. There is no state corporation tax for federal OCS areas. Historically, in order to encourage drilling in the deepwater, royalty rates varied by water depth with additional tax relief granted on a set volume of production (entitled the royalty suspension volume or RSV). Details of the tax rates and relief volumes are depicted in the table below. However, more recently royalty rates on new leases have been set at a fixed 16.67% irrespective of location. From 2008 this is to be raised to 18.75%.
Figure 313: US GoM tax , royalty and deepwater royalty relief Water Depth Royalty rate (%) DWRR RSV mboe Tax rate (%)
<200m 16.67 0 35
200-400m 16.67 0 35
400-800m 12.50 5 35
800-1600m 12.50 9 35
1600-2000m 12.50 12 35
>2000m 12.50 16 35Source: Deutsche Bank
Where taxation in the US is by global standards very generous, recovery of capital expenditure is less so. In general, capital costs are recovered over a period of seven years under a convention entitled the Modified Accelerated Cost Recovery System or MACRS. This provides for a depreciation schedule with pre-stipulated rates of depreciation namely 14.3% in year 1, 24.5% year 2, 17.5% in year 3, 12.5% year 4, 8.9% in each of years 5-7 and a final 4.5% in year 8.
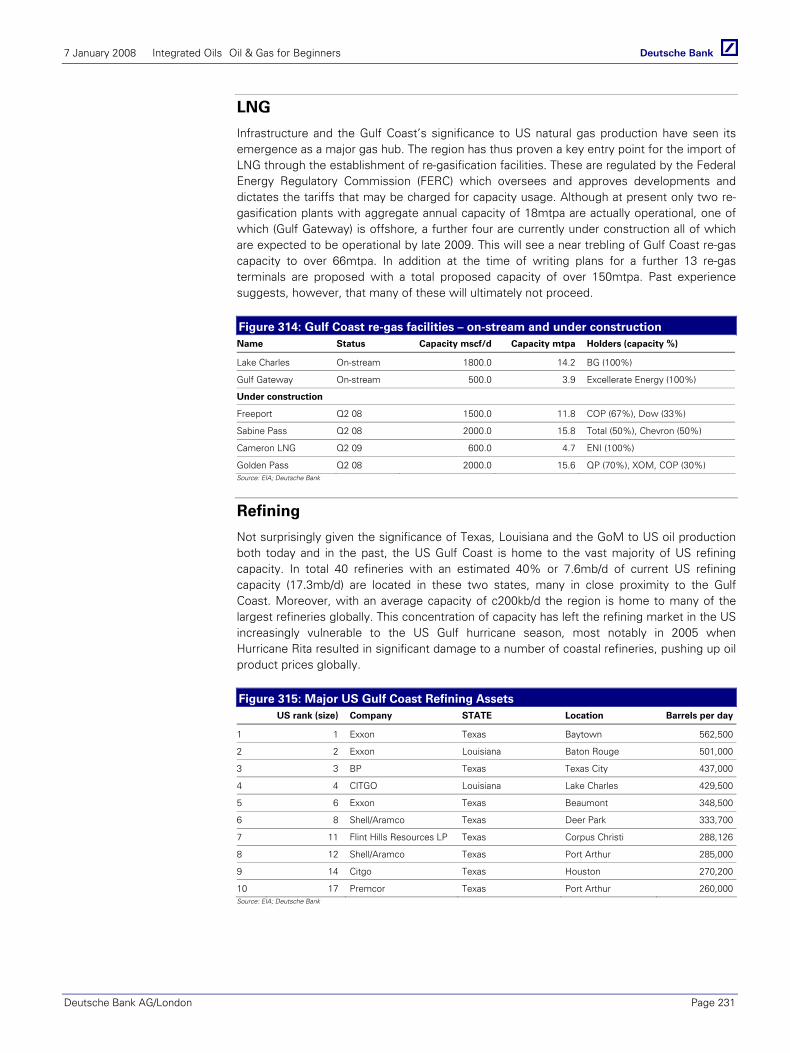
7 January 2008 Integrated Oils Oil & Gas for Beginners
Deutsche Bank AG/London Page 231
LNG
Infrastructure and the Gulf Coast’s significance to US natural gas production have seen its emergence as a major gas hub. The region has thus proven a key entry point for the import of LNG through the establishment of re-gasification facilities. These are regulated by the Federal Energy Regulatory Commission (FERC) which oversees and approves developments and dictates the tariffs that may be charged for capacity usage. Although at present only two re-gasification plants with aggregate annual capacity of 18mtpa are actually operational, one of which (Gulf Gateway) is offshore, a further four are currently under construction all of which are expected to be operational by late 2009. This will see a near trebling of Gulf Coast re-gas capacity to over 66mtpa. In addition at the time of writing plans for a further 13 re-gas terminals are proposed with a total proposed capacity of over 150mtpa. Past experience suggests, however, that many of these will ultimately not proceed.
Figure 314: Gulf Coast re-gas facilities – on-stream and under construction Name Status Capacity mscf/d Capacity mtpa Holders (capacity %)
Lake Charles On-stream 1800.0 14.2 BG (100%)
Gulf Gateway On-stream 500.0 3.9 Excellerate Energy (100%)
Under construction
Freeport Q2 08 1500.0 11.8 COP (67%), Dow (33%)
Sabine Pass Q2 08 2000.0 15.8 Total (50%), Chevron (50%)
Cameron LNG Q2 09 600.0 4.7 ENI (100%)
Golden Pass Q2 08 2000.0 15.6 QP (70%), XOM, COP (30%) Source: EIA; Deutsche Bank
Refining
Not surprisingly given the significance of Texas, Louisiana and the GoM to US oil production both today and in the past, the US Gulf Coast is home to the vast majority of US refining capacity. In total 40 refineries with an estimated 40% or 7.6mb/d of current US refining capacity (17.3mb/d) are located in these two states, many in close proximity to the Gulf Coast. Moreover, with an average capacity of c200kb/d the region is home to many of the largest refineries globally. This concentration of capacity has left the refining market in the US increasingly vulnerable to the US Gulf hurricane season, most notably in 2005 when Hurricane Rita resulted in significant damage to a number of coastal refineries, pushing up oil product prices globally.
Figure 315: Major US Gulf Coast Refining Assets US rank (size) Company STATE Location Barrels per day
1 1 Exxon Texas Baytown 562,500
2 2 Exxon Louisiana Baton Rouge 501,000
3 3 BP Texas Texas City 437,000
4 4 CITGO Louisiana Lake Charles 429,500
5 6 Exxon Texas Beaumont 348,500
6 8 Shell/Aramco Texas Deer Park 333,700
7 11 Flint Hills Resources LP Texas Corpus Christi 288,126
8 12 Shell/Aramco Texas Port Arthur 285,000
9 14 Citgo Texas Houston 270,200
10 17 Premcor Texas Port Arthur 260,000Source: EIA; Deutsche Bank

7 January 2008 Integrated Oils Oil & Gas for Beginners
Page 232 Deutsche Bank AG/London
US Deepwater GoM - Notes

7 January 2008 Integrated Oils Oil & Gas for Beginners
Deutsche Bank AG/London Page 233
US Alaska Given its 30 year history of oil production, Alaska is in many respects a mature oil province. However, with much of its land and artic waters as yet unexplored the region remains one that is believed to have substantial prospectivity, with as much as 50 billion bbls of yet-to-find oil suggested to exist both onshore and offshore by the USGS and MMS. At this time both oil and gas production are, however, in decline although with over 850kb/d of oil produced in the state in 2007 it continues to account for comfortably over 10% of total US liquids production. At the end of 2007 Wood Mackenzie estimates that 2P oil reserves stood at 4.2bn barrels and those for gas at 32TCF, although of the gas reserves almost 95% are associated with Artic located fields that, as yet, have no route to market.
Basic geology and topology
To date hydrocarbon exploration and production has focused on two main areas, the predominantly gaseous Cook Inlet and the Alaskan North Slope (ANS), which borders the Artic Ocean and accounts for near all of the state’s oil production. Formed during the Triassic and Jurassic, the ANS lies within the Artic-located Colville River Basin and it is this basin which is the source of its hydrocarbons including those of the giant Prudhoe Bay and Kuparuk fields. Some 500km further south, the gas producing Cook Inlet Basin in the Gulf of Alaska also derives its hydrocarbons from source rock laid down during the Jurassic.
History and regulation
Alaska has a long history of oil exploration, with seepages of oil first noted by the Russians prior to their sale of the lands to the US in 1867. Indeed, such was its confidence that the US Government set aside land as a potential national source of oil for the country’s naval fleet (the National Petroleum Reserve-Alaska or NPR-A) in the 1920s. However, despite considerable exploration through the early 20th century initial finds were modest and, given the distance from consumer end-markets, invariably uneconomic. This all changed in 1957 with the discovery of the Swanson River oil field on the Kenai Peninsula, a discovery which resulted in a period of intense and often successful activity in the Cook Inlet not least Unocal’s 1959 discovery of the Kenai gas field. By the end of the 1960s interest in the Cook Inlet was, however, waning and, following ARCO’s 1968 discovery of the 10bn bbl Prudhoe Bay oil field (America’s largest ever) on Alaska’s North Slope, attention switched to this artic area. Other major fields including Kuparuk (second largest ever US field) were discovered shortly thereafter. The remote and hostile location of the ANS meant, however, that in order to get the oil to market a reliable system was needed to transport the crude oil to the Lower 48 refineries. After much debate and opposition not least from environmental groups and native Alaskans, the 1287km Trans-Alaska Pipeline System (TAPS) was decided upon to transport crude oil from Prudhoe Bay to the port of Valdez in Prince William Sound. Built at a cost of US$8bn, the pipeline was completed in mid-1977 with a nominal capacity of 2.1mb/d (although the rate of flow today is no more than 1mb/d).
Alaskan oil & gas leases are mainly state owned with activity governed by either the State or the Federal Government. Leasing is overseen by the US Department of Natural Resources with the Alaskan Oil & Gas Conservation Commission responsible for overseeing the below-ground operations of the industry. Importantly, the Federal Government also owns significant blocks of land namely the aforementioned NPR-A which at 23 million acres is the largest piece of undeveloped federal land in the US and the 19 million acre Alaskan National Wildlife Refuge (ANWR). Discussed later, these two tracts of largely untouched wilderness are estimated by the USGS to potentially contain over 30 billion barrels of recoverable oil. Not surprisingly, the industry has long expressed considerable interest in their development.
Key facts Oil production 2007E 0.9 mb/d Gas production 2007 E 0.1mboe/d Oil reserves 2007E 4.2bn bbls Gas reserve 2007E 32TCF Reserve life (oil) 13.2 years Reserve life (gas) 205 years US GDP 2007E ($bn) $13.5 trillion US GDP Growth 2007E (%) 2.5% US Population (m) 260m US Oil consumption (mb/d) 20.2m/d US Oil exports (mb/d) n.a. Fiscal regime Tax & royalty Marginal tax rate c.65% Top 3 GoM oil fields (2007E) Prudhoe Bay 360kboe/d Kuparuk 130kboe/d Alpine 125kboe/d Top 3 Oil Producers (2007E) Conoco 375kboe/d Exxon 300kboe/d BP 175kboe/d
Source: Wood Mackenzie data; EIA
Oil Production profile kb/d
0
200
400
600
800
1000
1200
2000
2001
2002
2003
2004
2005
2006
2007
2008
2009
2010
2011
2012
2013
2014
2015
ANS- Onshore ANS - Beaufort Sea Cook Inlet
kb/d
Source: Wood Mackenzie data
Remaining reserves split %
Oil48%Gas
52%
Source: Wood Mackenzie data
Initial versus remaining reserves
Produced67%
Remaining33%
Source: Wood Mackenzie data
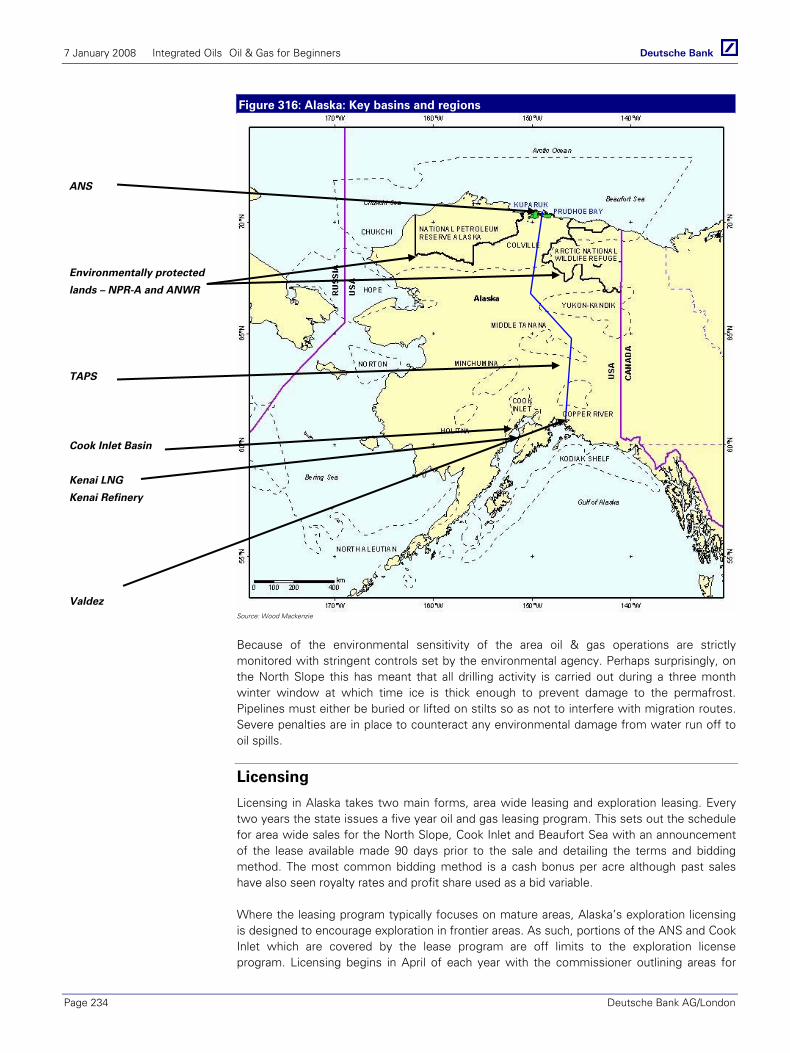
7 January 2008 Integrated Oils Oil & Gas for Beginners
Page 234 Deutsche Bank AG/London
Figure 316: Alaska: Key basins and regions
Source: Wood Mackenzie
Because of the environmental sensitivity of the area oil & gas operations are strictly monitored with stringent controls set by the environmental agency. Perhaps surprisingly, on the North Slope this has meant that all drilling activity is carried out during a three month winter window at which time ice is thick enough to prevent damage to the permafrost. Pipelines must either be buried or lifted on stilts so as not to interfere with migration routes. Severe penalties are in place to counteract any environmental damage from water run off to oil spills.
Licensing
Licensing in Alaska takes two main forms, area wide leasing and exploration leasing. Every two years the state issues a five year oil and gas leasing program. This sets out the schedule for area wide sales for the North Slope, Cook Inlet and Beaufort Sea with an announcement of the lease available made 90 days prior to the sale and detailing the terms and bidding method. The most common bidding method is a cash bonus per acre although past sales have also seen royalty rates and profit share used as a bid variable.
Where the leasing program typically focuses on mature areas, Alaska’s exploration licensing is designed to encourage exploration in frontier areas. As such, portions of the ANS and Cook Inlet which are covered by the lease program are off limits to the exploration license program. Licensing begins in April of each year with the commissioner outlining areas for
ANS
Environmentally protected
lands – NPR-A and ANWR
TAPS
Cook Inlet Basin
Kenai LNG
Kenai Refinery
Valdez
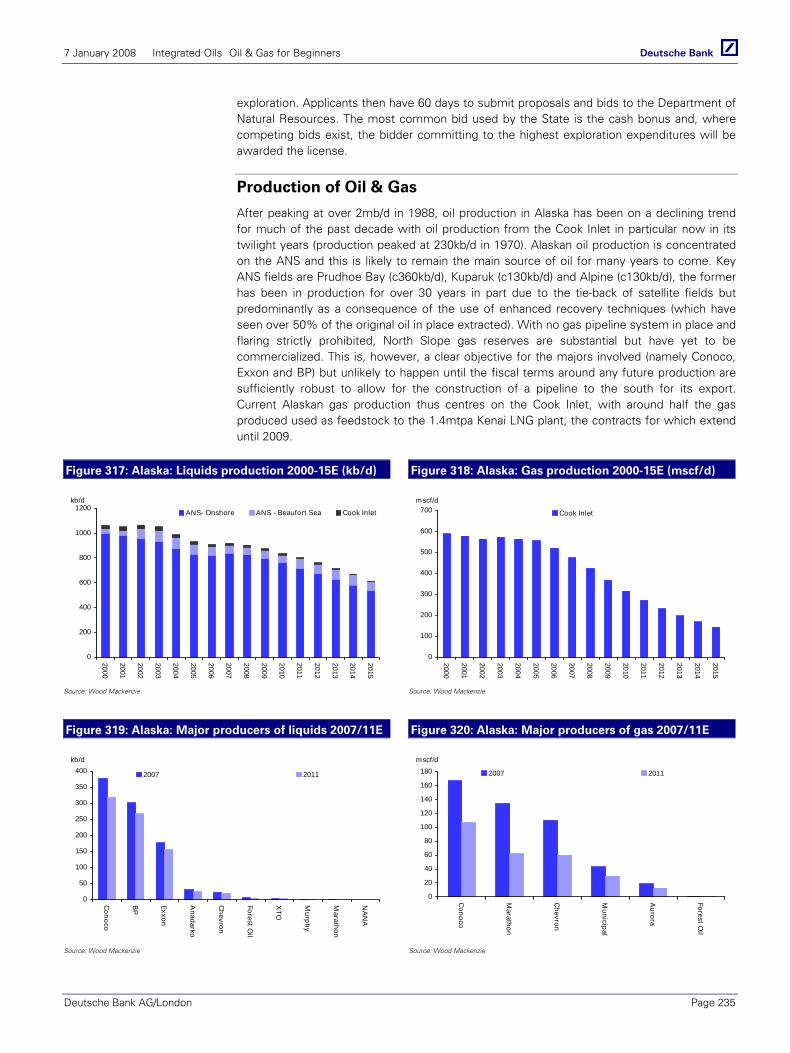
7 January 2008 Integrated Oils Oil & Gas for Beginners
Deutsche Bank AG/London Page 235
exploration. Applicants then have 60 days to submit proposals and bids to the Department of Natural Resources. The most common bid used by the State is the cash bonus and, where competing bids exist, the bidder committing to the highest exploration expenditures will be awarded the license.
Production of Oil & Gas
After peaking at over 2mb/d in 1988, oil production in Alaska has been on a declining trend for much of the past decade with oil production from the Cook Inlet in particular now in its twilight years (production peaked at 230kb/d in 1970). Alaskan oil production is concentrated on the ANS and this is likely to remain the main source of oil for many years to come. Key ANS fields are Prudhoe Bay (c360kb/d), Kuparuk (c130kb/d) and Alpine (c130kb/d), the former has been in production for over 30 years in part due to the tie-back of satellite fields but predominantly as a consequence of the use of enhanced recovery techniques (which have seen over 50% of the original oil in place extracted). With no gas pipeline system in place and flaring strictly prohibited, North Slope gas reserves are substantial but have yet to be commercialized. This is, however, a clear objective for the majors involved (namely Conoco, Exxon and BP) but unlikely to happen until the fiscal terms around any future production are sufficiently robust to allow for the construction of a pipeline to the south for its export. Current Alaskan gas production thus centres on the Cook Inlet, with around half the gas produced used as feedstock to the 1.4mtpa Kenai LNG plant, the contracts for which extend until 2009.
Figure 317: Alaska: Liquids production 2000-15E (kb/d) Figure 318: Alaska: Gas production 2000-15E (mscf/d)
0
200
400
600
800
1000
1200
2000
2001
2002
2003
2004
2005
2006
2007
2008
2009
2010
2011
2012
2013
2014
2015
ANS- Onshore ANS - Beaufort Sea Cook Inlet
kb/d
0
100
200
300
400
500
600
700
2000
2001
2002
2003
2004
2005
2006
2007
2008
2009
2010
2011
2012
2013
2014
2015
Cook Inlet
mscf/d
Source: Wood Mackenzie Source: Wood Mackenzie
Figure 319: Alaska: Major producers of liquids 2007/11E Figure 320: Alaska: Major producers of gas 2007/11E
0
50
100
150
200
250
300
350
400
Conoco
BP
Exxon
Anadarko
Chevron
Forest Oil
XTO
Murphy
Marathon
NA
NA
2007 2011
kb/d
0
20
40
60
80
100
120
140
160
180
Conoco
Marathon
Chevron
Municipal
Aurora
Forest Oil
2007 2011
mscf/d
Source: Wood Mackenzie Source: Wood Mackenzie

7 January 2008 Integrated Oils Oil & Gas for Beginners
Page 236 Deutsche Bank AG/London
Reserves and resources
At the end of 2007 Wood Mackenzie estimates that oil reserves on a 2P basis stood at just over 4bn barrels with around 60% of these associated with Prudhoe Bay and Kuparuk. Compared with initial recoverable reserves of 21bn barrels this clearly illustrates the maturity of existing production. Similarly, the Cook Inlet estimated remaining reserves of under 300mboe compare with an initial recoverable reserve of over 10x that figure. In this respect Alaska thus looks a spent force in the world of hydrocarbon production.
However, with some 30TCF of proven ANS gas reserves as yet untapped, gas production at least remains a relatively substantial near term opportunity for the players involved with many commentators assuming that the issues surrounding development (a stable and attractive fiscal environment) will allow for the required infrastructure investment. First delivery is anticipated through the second half of the next decade. The US DoE also estimates that heavy oil reserves of some 36bn barrels of viscous heavy oil overlie the main producing zones at Prudhoe Bay and Kuparuk although this is as yet uneconomic to produce.
Perhaps more significant, however, is the perceived prospectivity of two as yet untapped tracts of protected Artic wilderness, each of which is estimated by the USGS to contain between five and twelve billion barrels of potentially recoverable oil.
ANWR. Lying on the shores of the Artic Ocean to the east of Prudhoe Bay, the Alaskan National Wildlife refuge represents 19 million acres of untouched wilderness. Its Coastal Plain, which accounts for 8% of the total acreage, is also regarded by many geologists as having greater potential for petroleum discoveries than any other onshore area. However, to date only limited exploration drilling has taken place and the lands remain subject of an intense debate between the industry and environmental groups with no clear resolution on an opening of the Coastal Plain achieved.
NPR-A. In 1923 President Harding set aside this 23 million acre tract of land to provide emergency supplies for a US navy that was, at that time, switching from the use of coal to oil to power its ships. Located to the west of the 430m barrel Alpine field, several lease sales have taken place over the years and borne successful exploration results, confirming earlier positive results by the US Navy and military. Despite both the Clinton and Bush Administrations opening up tracts exploration has, however, been limited with license awards prevented by the environmental agencies.
Pipelines and infrastructure
Alaska’s oil and gas infrastructure centres on the two main areas of production. For the ANS the key oil pipeline is clearly the aforementioned Trans Alaska Pipeline System (TAPS or Ayelaska Pipeline) with all fields in the region linked into TAPS by series of field pipelines and gathering systems. These have recently been upgraded by BP following its embarrassing decision to close the entire Prudhoe Bay production area in 2006 after the integrity of the pipeline was found to be in question. TAPS runs through to Valdez in the south of the state from which oil is transported to the US west coast for refining. Within the Cook Inlet producing area, 100km of gas pipeline links the producing fields with the Kenai LNG facility. Otherwise, gas produced is largely transported to Anchorage through the Marathon/Chevron-owned Cook Inlet Gas Gathering System (CIGGS). Cook Inlet oil production is either transferred through pipeline or tanker to the state’s sole refinery some 100km south of Anchorage, with the products produced largely feeding the needs of the Alaskan market.
7 January 2008 Integrated Oils Oil & Gas for Beginners
Deutsche Bank AG/London Page 237
As yet, whilst there has been much discussion around the development of a pipeline, the infrastructure to transport gas from the ANS is not in place. Consequently, the gas produced is either used as fuel or recycled. Nevertheless, given the scale of the resource base (26.5TCF) it is the clear desire of the producers involved (BP, COP, Exxon) to lay down infrastructure. However, with the state wishing to ensure that it captures it share of the value of the resource base and the producers reluctant to invest the $25billion plus that a pipeline would likely cost unless they are certain of the fiscal back cloth, progress has been limited.
Crude oil blends and quality
With all North Slope oil transported through the TAPS pipeline there is only one Alaskan Blend, ANS. With an API of 32° and around 1% sulphur this is both heavier and more sour than benchmark WTI and trades at around a $5/bbl discount.
Broad fiscal terms
Alaska operates as a tax and royalty concession. The tax regime is, however, complicated by the application of state taxes in addition to the typical elements of royalty (normally 12.5% but can vary by field) and federal corporate income tax (which is charged at 35% on profits after royalty and state taxes). The basic rate of State Income Tax applied in Alaska runs at 9.4% with a further 2% being charged as a property tax on the tax book value of the producing assets. Moreover, from April 2006 the state introduced a new mechanism for calculating the main state tax. Entitled Profit-sharing Production Tax this replaced the former severance tax and contains a progressive element. Simplistically, this is charged at 25% of the production tax value (which in crude terms is equal to the well head revenue less royalty and allowable costs including depreciation) increasing by 0.25% for every $1/bbl increase in the price of oil over $40/bbl up to a maximum of 47.5%. At $60/bbl oil PPT would thus run at 30% with a company typically receiving around 30 cents per US$ of revenues.
Refining
Alaska is home to one refinery. Owned by Tesoro, the Kenai Refinery has a capacity of 72kb/d and is located 100km south of Anchorage. It is fed with oil produced in the Cook Inlet and its output used to supply the local market, most particularly the jet fuel requirements of Anchorage International Airport.
LNG
Given its remote location and the distance of gas from potential markets, Alaska is home to one of the first ever LNG plants. Constructed in 1969 and owned by Marathon (30%) and Conoco (70%) Kenai LNG is a 1.5mtpa nameplate facility located on the southern shores of the Cook Inlet. LNG produced is sold under two long term contracts expiring in 2009 with Japanese utility contracts. Absent the discovery of significant new supplies of gas the plant is unlikely to remain in production post this time.

7 January 2008 Integrated Oils Oil & Gas for Beginners
Page 238 Deutsche Bank AG/London
US Alaska - Notes
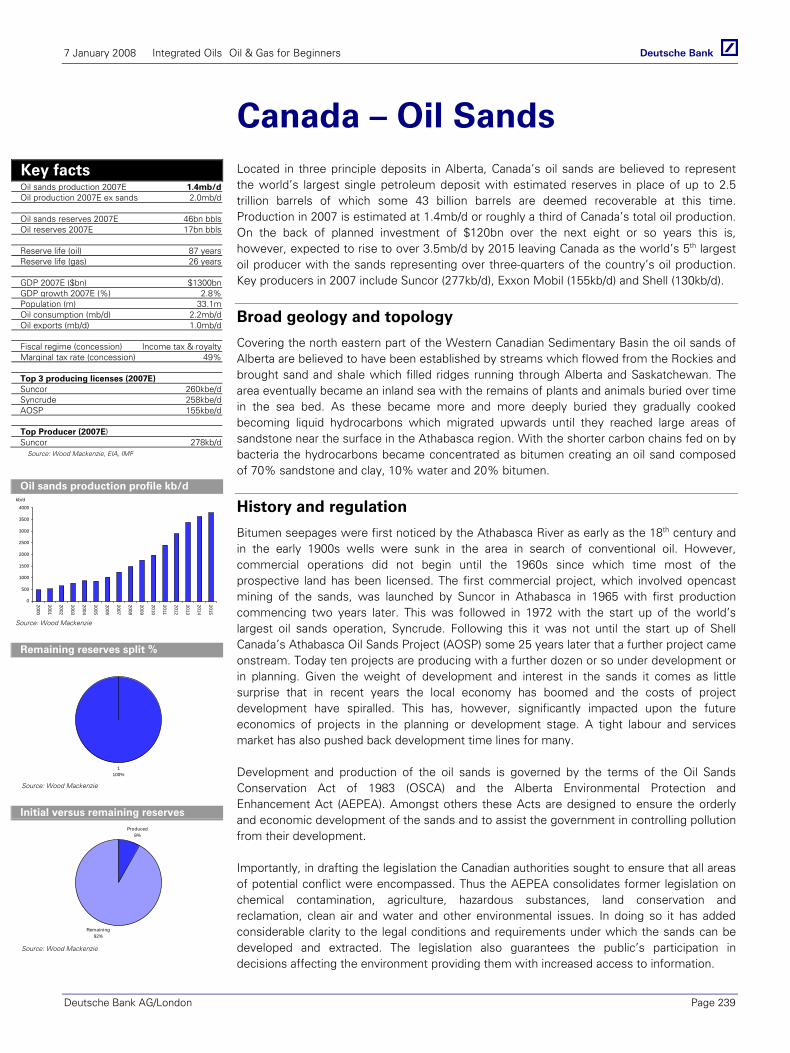
7 January 2008 Integrated Oils Oil & Gas for Beginners
Deutsche Bank AG/London Page 239
Canada – Oil Sands Located in three principle deposits in Alberta, Canada’s oil sands are believed to represent the world’s largest single petroleum deposit with estimated reserves in place of up to 2.5 trillion barrels of which some 43 billion barrels are deemed recoverable at this time. Production in 2007 is estimated at 1.4mb/d or roughly a third of Canada’s total oil production. On the back of planned investment of $120bn over the next eight or so years this is, however, expected to rise to over 3.5mb/d by 2015 leaving Canada as the world’s 5th largest oil producer with the sands representing over three-quarters of the country’s oil production. Key producers in 2007 include Suncor (277kb/d), Exxon Mobil (155kb/d) and Shell (130kb/d).
Broad geology and topology
Covering the north eastern part of the Western Canadian Sedimentary Basin the oil sands of Alberta are believed to have been established by streams which flowed from the Rockies and brought sand and shale which filled ridges running through Alberta and Saskatchewan. The area eventually became an inland sea with the remains of plants and animals buried over time in the sea bed. As these became more and more deeply buried they gradually cooked becoming liquid hydrocarbons which migrated upwards until they reached large areas of sandstone near the surface in the Athabasca region. With the shorter carbon chains fed on by bacteria the hydrocarbons became concentrated as bitumen creating an oil sand composed of 70% sandstone and clay, 10% water and 20% bitumen.
History and regulation
Bitumen seepages were first noticed by the Athabasca River as early as the 18th century and in the early 1900s wells were sunk in the area in search of conventional oil. However, commercial operations did not begin until the 1960s since which time most of the prospective land has been licensed. The first commercial project, which involved opencast mining of the sands, was launched by Suncor in Athabasca in 1965 with first production commencing two years later. This was followed in 1972 with the start up of the world’s largest oil sands operation, Syncrude. Following this it was not until the start up of Shell Canada’s Athabasca Oil Sands Project (AOSP) some 25 years later that a further project came onstream. Today ten projects are producing with a further dozen or so under development or in planning. Given the weight of development and interest in the sands it comes as little surprise that in recent years the local economy has boomed and the costs of project development have spiralled. This has, however, significantly impacted upon the future economics of projects in the planning or development stage. A tight labour and services market has also pushed back development time lines for many.
Development and production of the oil sands is governed by the terms of the Oil Sands Conservation Act of 1983 (OSCA) and the Alberta Environmental Protection and Enhancement Act (AEPEA). Amongst others these Acts are designed to ensure the orderly and economic development of the sands and to assist the government in controlling pollution from their development.
Importantly, in drafting the legislation the Canadian authorities sought to ensure that all areas of potential conflict were encompassed. Thus the AEPEA consolidates former legislation on chemical contamination, agriculture, hazardous substances, land conservation and reclamation, clean air and water and other environmental issues. In doing so it has added considerable clarity to the legal conditions and requirements under which the sands can be developed and extracted. The legislation also guarantees the public’s participation in decisions affecting the environment providing them with increased access to information.
Key facts Oil sands production 2007E 1.4mb/d Oil production 2007E ex sands 2.0mb/d Oil sands reserves 2007E 46bn bbls Oil reserves 2007E 17bn bbls Reserve life (oil) 87 years Reserve life (gas) 26 years GDP 2007E ($bn) $1300bn GDP growth 2007E (%) 2.8% Population (m) 33.1m Oil consumption (mb/d) 2.2mb/d Oil exports (mb/d) 1.0mb/d Fiscal regime (concession) Income tax & royalty Marginal tax rate (concession) 49% Top 3 producing licenses (2007E) Suncor 260kbe/d Syncrude 258kbe/d AOSP 155kbe/d Top Producer (2007E) Suncor 278kb/d Source: Wood Mackenzie, EIA, IMF
Oil sands production profile kb/d
0
500
1000
1500
2000
2500
3000
3500
4000
2000
2001
2002
2003
2004
2005
2006
2007
2008
2009
2010
2011
2012
2013
2014
2015
kb/d
Source: Wood Mackenzie
Remaining reserves split %
1100%
Source: Wood Mackenzie
Initial versus remaining reserves Produced
8%
Remaining92%
Source: Wood Mackenzie
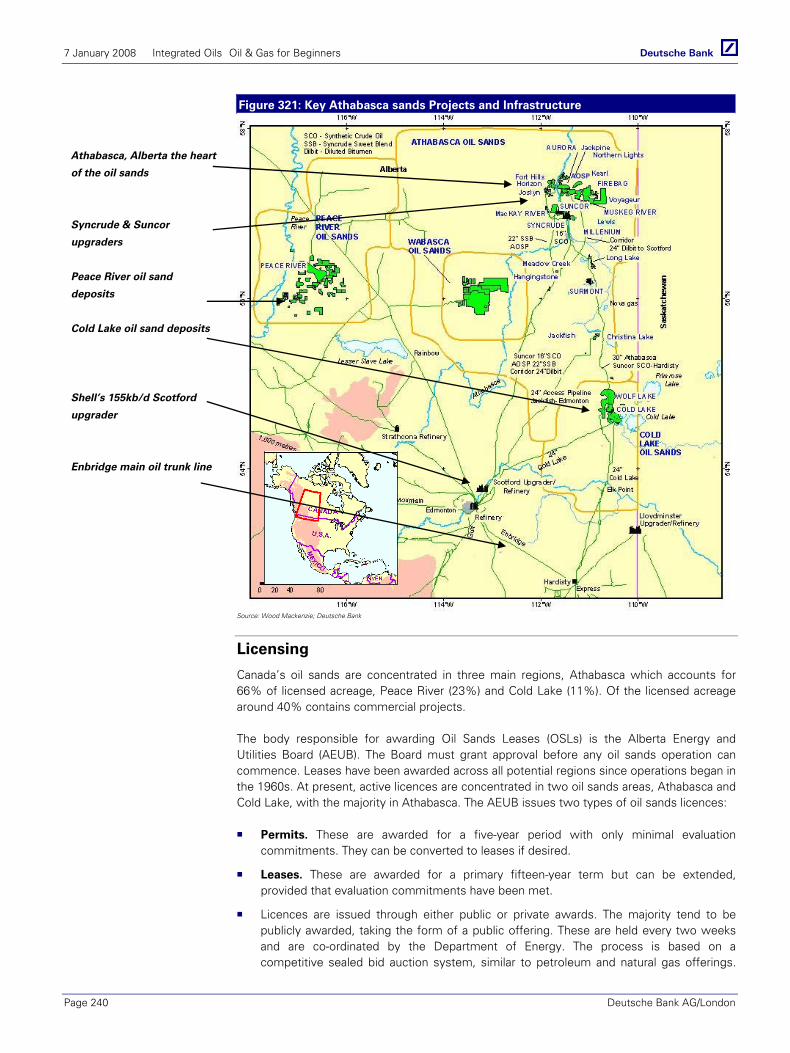
7 January 2008 Integrated Oils Oil & Gas for Beginners
Page 240 Deutsche Bank AG/London
Figure 321: Key Athabasca sands Projects and Infrastructure
AOSP
Source: Wood Mackenzie; Deutsche Bank
Licensing
Canada’s oil sands are concentrated in three main regions, Athabasca which accounts for 66% of licensed acreage, Peace River (23%) and Cold Lake (11%). Of the licensed acreage around 40% contains commercial projects.
The body responsible for awarding Oil Sands Leases (OSLs) is the Alberta Energy and Utilities Board (AEUB). The Board must grant approval before any oil sands operation can commence. Leases have been awarded across all potential regions since operations began in the 1960s. At present, active licences are concentrated in two oil sands areas, Athabasca and Cold Lake, with the majority in Athabasca. The AEUB issues two types of oil sands licences:
Permits. These are awarded for a five-year period with only minimal evaluation commitments. They can be converted to leases if desired.
Leases. These are awarded for a primary fifteen-year term but can be extended, provided that evaluation commitments have been met.
Licences are issued through either public or private awards. The majority tend to be publicly awarded, taking the form of a public offering. These are held every two weeks and are co-ordinated by the Department of Energy. The process is based on a competitive sealed bid auction system, similar to petroleum and natural gas offerings.
Athabasca, Alberta the heart
of the oil sands
Syncrude & Suncor
upgraders
Peace River oil sand
deposits
Cold Lake oil sand deposits
Shell’s 155kb/d Scotford
upgrader
Enbridge main oil trunk line
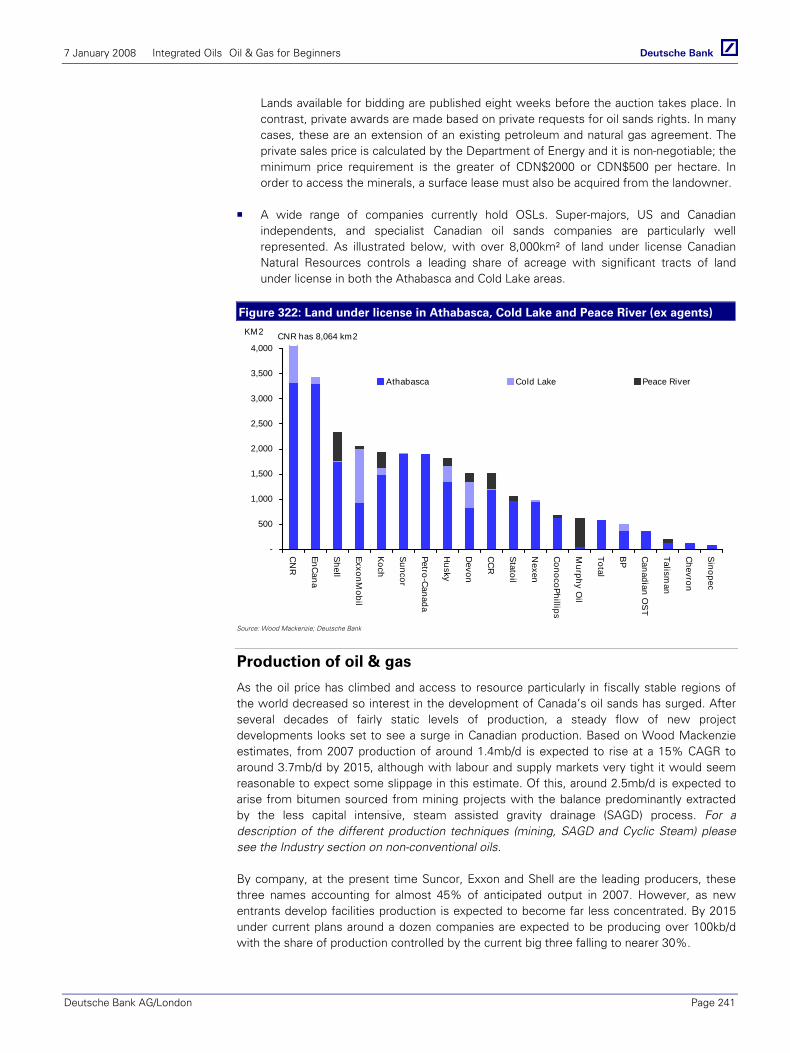
7 January 2008 Integrated Oils Oil & Gas for Beginners
Deutsche Bank AG/London Page 241
Lands available for bidding are published eight weeks before the auction takes place. In contrast, private awards are made based on private requests for oil sands rights. In many cases, these are an extension of an existing petroleum and natural gas agreement. The private sales price is calculated by the Department of Energy and it is non-negotiable; the minimum price requirement is the greater of CDN$2000 or CDN$500 per hectare. In order to access the minerals, a surface lease must also be acquired from the landowner.
A wide range of companies currently hold OSLs. Super-majors, US and Canadian independents, and specialist Canadian oil sands companies are particularly well represented. As illustrated below, with over 8,000km² of land under license Canadian Natural Resources controls a leading share of acreage with significant tracts of land under license in both the Athabasca and Cold Lake areas.
Figure 322: Land under license in Athabasca, Cold Lake and Peace River (ex agents)
-
500
1,000
1,500
2,000
2,500
3,000
3,500
4,000
CN
R
EnCana
Shell
ExxonMobil
Koch
Suncor
Petro-Canada
Husky
Devon
CC
R
Statoil
Nexen
ConocoPhillips
Murphy O
il
Total
BP
Canadian O
ST
Talisman
Chevron
Sinopec
Athabasca Cold Lake Peace River
KM2 CNR has 8,064 km2
Source: Wood Mackenzie; Deutsche Bank
Production of oil & gas
As the oil price has climbed and access to resource particularly in fiscally stable regions of the world decreased so interest in the development of Canada’s oil sands has surged. After several decades of fairly static levels of production, a steady flow of new project developments looks set to see a surge in Canadian production. Based on Wood Mackenzie estimates, from 2007 production of around 1.4mb/d is expected to rise at a 15% CAGR to around 3.7mb/d by 2015, although with labour and supply markets very tight it would seem reasonable to expect some slippage in this estimate. Of this, around 2.5mb/d is expected to arise from bitumen sourced from mining projects with the balance predominantly extracted by the less capital intensive, steam assisted gravity drainage (SAGD) process. For a description of the different production techniques (mining, SAGD and Cyclic Steam) please see the Industry section on non-conventional oils.
By company, at the present time Suncor, Exxon and Shell are the leading producers, these three names accounting for almost 45% of anticipated output in 2007. However, as new entrants develop facilities production is expected to become far less concentrated. By 2015 under current plans around a dozen companies are expected to be producing over 100kb/d with the share of production controlled by the current big three falling to nearer 30%.
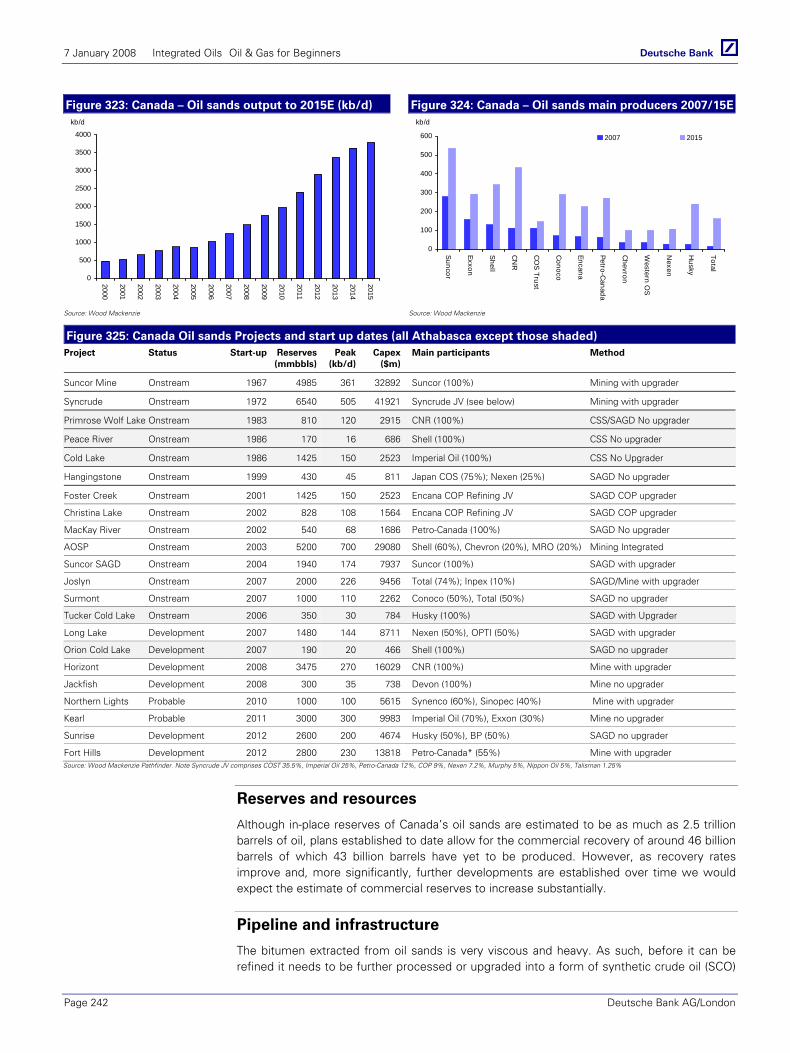
7 January 2008 Integrated Oils Oil & Gas for Beginners
Page 242 Deutsche Bank AG/London
Figure 323: Canada – Oil sands output to 2015E (kb/d) Figure 324: Canada – Oil sands main producers 2007/15E
0
500
1000
1500
2000
2500
3000
3500
4000
2000
2001
2002
2003
2004
2005
2006
2007
2008
2009
2010
2011
2012
2013
2014
2015
kb/d
0
100
200
300
400
500
600
Suncor
Exxon
Shell
CN
R
CO
S Trust
Conoco
Encana
Petro-Canada
Chevron
Western O
S
Nexen
Husky
Total
2007 2015
kb/d
Source: Wood Mackenzie Source: Wood Mackenzie
Figure 325: Canada Oil sands Projects and start up dates (all Athabasca except those shaded) Project Status Start-up Reserves
(mmbbls) Peak
(kb/d)Capex
($m)Main participants Method
Suncor Mine Onstream 1967 4985 361 32892 Suncor (100%) Mining with upgrader
Syncrude Onstream 1972 6540 505 41921 Syncrude JV (see below) Mining with upgrader
Primrose Wolf Lake Onstream 1983 810 120 2915 CNR (100%) CSS/SAGD No upgrader
Peace River Onstream 1986 170 16 686 Shell (100%) CSS No upgrader
Cold Lake Onstream 1986 1425 150 2523 Imperial Oil (100%) CSS No Upgrader
Hangingstone Onstream 1999 430 45 811 Japan COS (75%); Nexen (25%) SAGD No upgrader
Foster Creek Onstream 2001 1425 150 2523 Encana COP Refining JV SAGD COP upgrader
Christina Lake Onstream 2002 828 108 1564 Encana COP Refining JV SAGD COP upgrader
MacKay River Onstream 2002 540 68 1686 Petro-Canada (100%) SAGD No upgrader
AOSP Onstream 2003 5200 700 29080 Shell (60%), Chevron (20%), MRO (20%) Mining Integrated
Suncor SAGD Onstream 2004 1940 174 7937 Suncor (100%) SAGD with upgrader
Joslyn Onstream 2007 2000 226 9456 Total (74%); Inpex (10%) SAGD/Mine with upgrader
Surmont Onstream 2007 1000 110 2262 Conoco (50%), Total (50%) SAGD no upgrader
Tucker Cold Lake Onstream 2006 350 30 784 Husky (100%) SAGD with Upgrader
Long Lake Development 2007 1480 144 8711 Nexen (50%), OPTI (50%) SAGD with upgrader
Orion Cold Lake Development 2007 190 20 466 Shell (100%) SAGD no upgrader
Horizont Development 2008 3475 270 16029 CNR (100%) Mine with upgrader
Jackfish Development 2008 300 35 738 Devon (100%) Mine no upgrader
Northern Lights Probable 2010 1000 100 5615 Synenco (60%), Sinopec (40%) Mine with upgrader
Kearl Probable 2011 3000 300 9983 Imperial Oil (70%), Exxon (30%) Mine no upgrader
Sunrise Development 2012 2600 200 4674 Husky (50%), BP (50%) SAGD no upgrader
Fort Hills Development 2012 2800 230 13818 Petro-Canada* (55%) Mine with upgrader Source: Wood Mackenzie Pathfinder. Note Syncrude JV comprises COST 35.5%, Imperial Oil 25%, Petro-Canada 12%, COP 9%, Nexen 7.2%, Murphy 5%, Nippon Oil 5%, Talisman 1.25%
Reserves and resources
Although in-place reserves of Canada’s oil sands are estimated to be as much as 2.5 trillion barrels of oil, plans established to date allow for the commercial recovery of around 46 billion barrels of which 43 billion barrels have yet to be produced. However, as recovery rates improve and, more significantly, further developments are established over time we would expect the estimate of commercial reserves to increase substantially.
Pipeline and infrastructure
The bitumen extracted from oil sands is very viscous and heavy. As such, before it can be refined it needs to be further processed or upgraded into a form of synthetic crude oil (SCO)
7 January 2008 Integrated Oils Oil & Gas for Beginners
Deutsche Bank AG/London Page 243
that is less viscous and of an API that allows it to be processed by a more conventional refinery. This either takes place in the Alberta region or at a more distant upgrading refinery, the bitumen being mixed with condensates as a diluent (to form ‘dilbit’) or with synthetic crude oil (to create ‘syndbit’) so that it can meet the density and viscosity requirements for pipeline transportation. Currently there are four principle upgraders operating in Alberta. These are associated with the major producers, Suncor and Syncrude operating the two main facilities with a current upgrading capacity of 500kb/d in the Athabasca area. Shell’s 155kb/d Scotford upgrader (which it intends expanding to some 700kb/d) is located some 450km to the south near Edmonton. Husky’s 77kb/d facility lies some 150km to the East of Scotford on the Alberta Saskatchewan border (see area map). These facilities aside, a number of other projects are either under development or have been proposed to increase Alberta’s upgrading capacity.
Whether in the form of synthetic crude oil or diluent, bitumen produced from the oil sands is pumped either to Edmonton or Hardisty. Once here it is shipped through one of the main trunklines to markets in Canada and the United States. Most significant is the Enbridge mainline which, with a capacity of 2.2mb/d runs from Edmonton through to the Great Lakes region and on to the United States where it connects with US liquids infrastructure. Of the other main export lines, the 1260km Express pipeline has the capacity to carry 172kb/d of Canadian crude to Montana, Wyoming and Utah whilst the Platte runs 1490km carrying crude to Colorado, Kansas and Illinois.
Crude oil blends and quality
Although several ‘syndbit’ and ‘dilbit’ blends are marketed, the streams tend to be relatively small. More recently, blending of product from several suppliers has seen the establishment of a new crude stream entitled ‘Western Canada Select’. Blended at Hardisty, volumes at present total around 250kb/d although with several new projects coming on stream volumes are likely to increase substantially. Lloyd blend serves as a marker for bitumen prices.
Broad fiscal terms
All licenses in Canada are governed by concession terms and have been structured to encourage investment and maintain the growth in the development of the State’s tar sands base. Tax comprises royalty, federal tax and provincial tax and, once the costs of a project have been recovered and an agreed return achieved, the marginal rate of tax (government take) in 2007 calculates at around 49% or around 33% on projects that are yet to cover costs.
Royalty: Royalties on oil sands are structured to allow recognition of the financial viability of the project. From 2009, royalty will be payable at a minimum rate of 1% on all production at a WTI oil price of under $55/bbl rising to 9% in a straight line at oil prices of $120/bbl and above. However, from 2009 once a project has achieved payout (including a return equivalent to that of the Government of Canada Long Bond Rate) royalty is payable at 25% of net revenues (net revenues equalling revenue from the sale of bitumen or SCO less opex less capex and less the return allowance) at oil prices of below $55/bbl rising to 40% at oil prices of $120/bbl and above. As such, royalty and taxation tends to be very modest through the early years of a project’s life.
Tax. Beyond royalty, tax is payable at both the federal and provincial level, with the effective rate of federal tax incorporating full allowance for provincial taxes paid. Given that provincial tax in Alberta currently stands at 10%, federal tax is currently payable at an effective rate of 21% rather than its 31% nominal rate. Moreover, federal tax is scheduled to fall to a nominal rate of 28.5% by 2011, declining by around 0.5% per annum over the next four years. This should mean a further decline in the effective rate paid on the oil sands. Assuming no change in the 10% rate of Alberta’s provincial tax, the effective rate of federal tax by 2011 should stand at 18.5% implying a marginal rate of tax on a project paying full royalties of 46.4% or circa 29% on projects which have not yet achieved payout at oil prices below $55/bbl.

7 January 2008 Integrated Oils Oil & Gas for Beginners
Page 244 Deutsche Bank AG/London
Canada Oil Sands - Notes
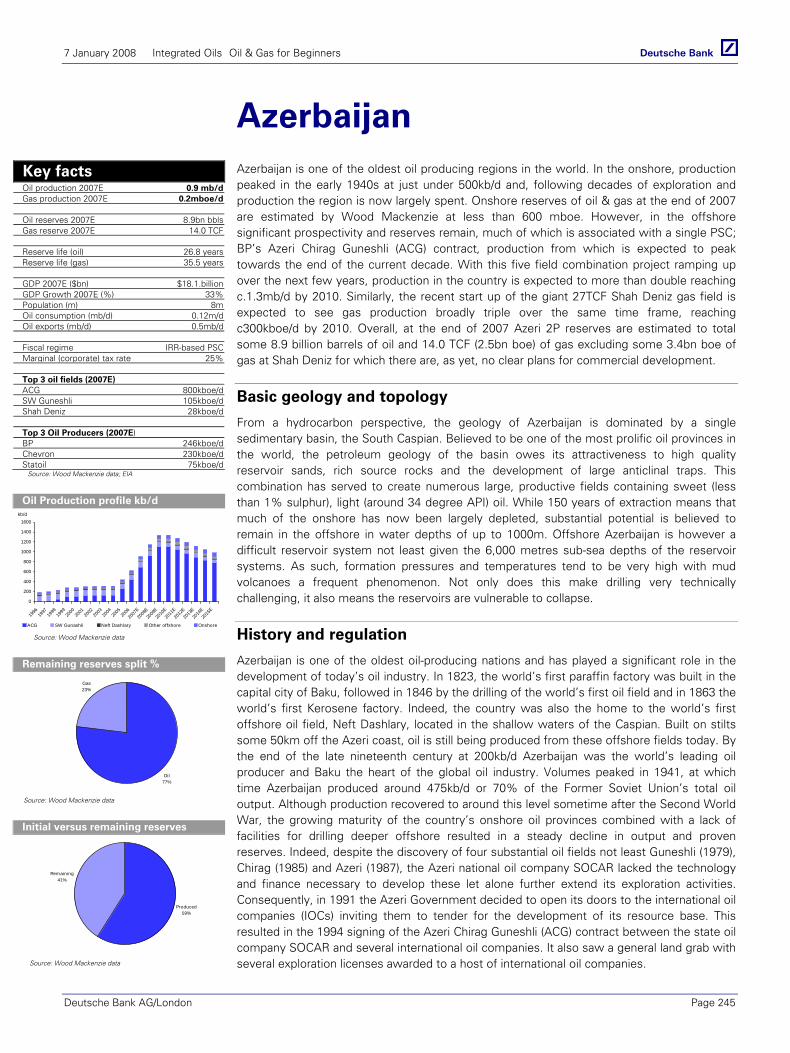
7 January 2008 Integrated Oils Oil & Gas for Beginners
Deutsche Bank AG/London Page 245
Azerbaijan Azerbaijan is one of the oldest oil producing regions in the world. In the onshore, production peaked in the early 1940s at just under 500kb/d and, following decades of exploration and production the region is now largely spent. Onshore reserves of oil & gas at the end of 2007 are estimated by Wood Mackenzie at less than 600 mboe. However, in the offshore significant prospectivity and reserves remain, much of which is associated with a single PSC; BP’s Azeri Chirag Guneshli (ACG) contract, production from which is expected to peak towards the end of the current decade. With this five field combination project ramping up over the next few years, production in the country is expected to more than double reaching c.1.3mb/d by 2010. Similarly, the recent start up of the giant 27TCF Shah Deniz gas field is expected to see gas production broadly triple over the same time frame, reaching c300kboe/d by 2010. Overall, at the end of 2007 Azeri 2P reserves are estimated to total some 8.9 billion barrels of oil and 14.0 TCF (2.5bn boe) of gas excluding some 3.4bn boe of gas at Shah Deniz for which there are, as yet, no clear plans for commercial development.
Basic geology and topology
From a hydrocarbon perspective, the geology of Azerbaijan is dominated by a single sedimentary basin, the South Caspian. Believed to be one of the most prolific oil provinces in the world, the petroleum geology of the basin owes its attractiveness to high quality reservoir sands, rich source rocks and the development of large anticlinal traps. This combination has served to create numerous large, productive fields containing sweet (less than 1% sulphur), light (around 34 degree API) oil. While 150 years of extraction means that much of the onshore has now been largely depleted, substantial potential is believed to remain in the offshore in water depths of up to 1000m. Offshore Azerbaijan is however a difficult reservoir system not least given the 6,000 metres sub-sea depths of the reservoir systems. As such, formation pressures and temperatures tend to be very high with mud volcanoes a frequent phenomenon. Not only does this make drilling very technically challenging, it also means the reservoirs are vulnerable to collapse.
History and regulation
Azerbaijan is one of the oldest oil-producing nations and has played a significant role in the development of today’s oil industry. In 1823, the world’s first paraffin factory was built in the capital city of Baku, followed in 1846 by the drilling of the world’s first oil field and in 1863 the world’s first Kerosene factory. Indeed, the country was also the home to the world’s first offshore oil field, Neft Dashlary, located in the shallow waters of the Caspian. Built on stilts some 50km off the Azeri coast, oil is still being produced from these offshore fields today. By the end of the late nineteenth century at 200kb/d Azerbaijan was the world’s leading oil producer and Baku the heart of the global oil industry. Volumes peaked in 1941, at which time Azerbaijan produced around 475kb/d or 70% of the Former Soviet Union’s total oil output. Although production recovered to around this level sometime after the Second World War, the growing maturity of the country’s onshore oil provinces combined with a lack of facilities for drilling deeper offshore resulted in a steady decline in output and proven reserves. Indeed, despite the discovery of four substantial oil fields not least Guneshli (1979), Chirag (1985) and Azeri (1987), the Azeri national oil company SOCAR lacked the technology and finance necessary to develop these let alone further extend its exploration activities. Consequently, in 1991 the Azeri Government decided to open its doors to the international oil companies (IOCs) inviting them to tender for the development of its resource base. This resulted in the 1994 signing of the Azeri Chirag Guneshli (ACG) contract between the state oil company SOCAR and several international oil companies. It also saw a general land grab with several exploration licenses awarded to a host of international oil companies.
Key facts Oil production 2007E 0.9 mb/d Gas production 2007E 0.2mboe/d Oil reserves 2007E 8.9bn bbls Gas reserve 2007E 14.0 TCF Reserve life (oil) 26.8 years Reserve life (gas) 35.5 years GDP 2007E ($bn) $18.1.billion GDP Growth 2007E (%) 33% Population (m) 8m Oil consumption (mb/d) 0.12m/d Oil exports (mb/d) 0.5mb/d Fiscal regime IRR-based PSC Marginal (corporate) tax rate 25% Top 3 oil fields (2007E) ACG 800kboe/d SW Guneshli 105kboe/d Shah Deniz 28kboe/d Top 3 Oil Producers (2007E) BP 246kboe/d Chevron 230kboe/d Statoil 75kboe/d Source: Wood Mackenzie data; EIA
Oil Production profile kb/d
0
200
400
600
800
1000
1200
1400
1600
1996
1997
1998
1999
2000
2001
2002
2003
2004
2005
2006
2007
E20
08E20
09E20
10E20
11E20
12E20
13E20
14E20
15E
ACG SW Gunashli Neft Dashlary Other offshore Onshore
kb/d
Source: Wood Mackenzie data
Remaining reserves split %
Oil77%
Gas23%
Source: Wood Mackenzie data
Initial versus remaining reserves
Produced59%
Remaining41%
Source: Wood Mackenzie data
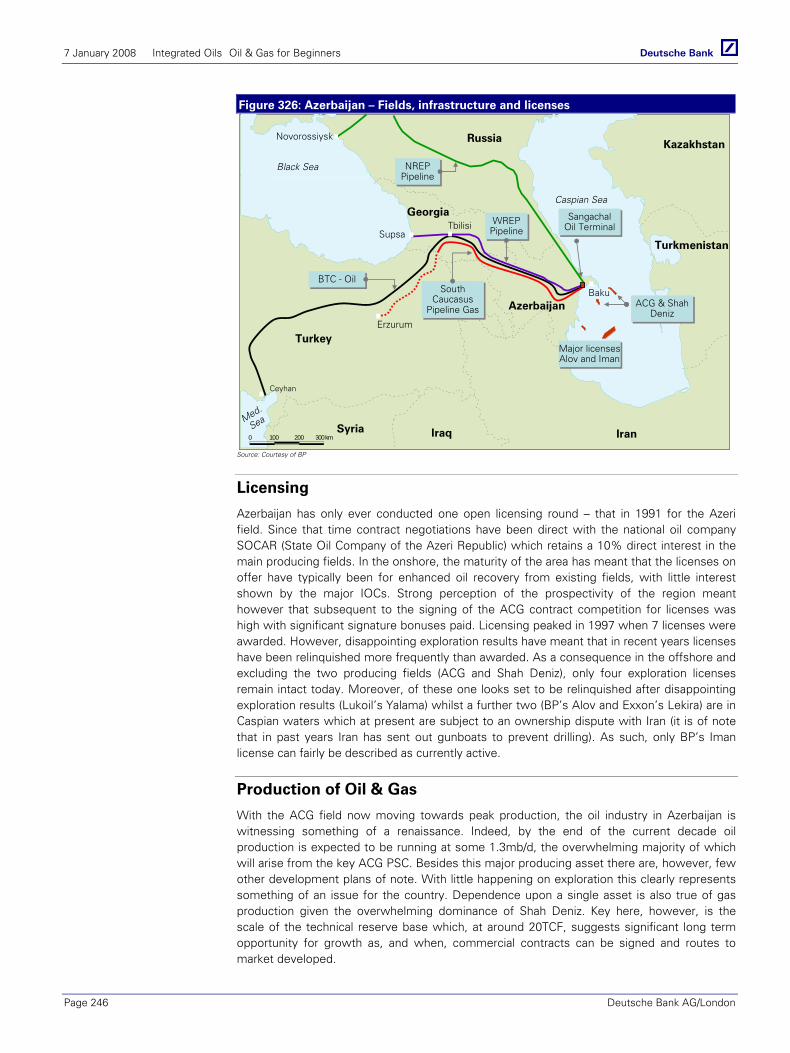
7 January 2008 Integrated Oils Oil & Gas for Beginners
Page 246 Deutsche Bank AG/London
Figure 326: Azerbaijan – Fields, infrastructure and licenses
0 300 km200100
Turkey
IraqSyria
Russia
Georgia
Ceyhan
Erzurum
Black Sea
Tbilisi
Med.
Sea
South Caucasus
Pipeline Gas
South Caucasus
Pipeline Gas
WREP PipelineWREP
Pipeline
BTC - OilBTC - Oil
NREPPipelineNREP
Pipeline
Supsa
Novorossiysk
Caspian Sea
Iran
Kazakhstan
Turkmenistan
Azerbaijan
Baku
0 300 km200100
Turkey
IraqSyria
Russia
Georgia
Ceyhan
Erzurum
Black Sea
Tbilisi
Med.
Sea
South Caucasus
Pipeline Gas
South Caucasus
Pipeline Gas
WREP PipelineWREP
Pipeline
BTC - OilBTC - Oil
NREPPipelineNREP
Pipeline
Supsa
Novorossiysk
Caspian Sea
Iran
Kazakhstan
Turkmenistan
Azerbaijan
BakuACG & Shah
DenizACG & Shah
Deniz
Major licenses Alov and ImanMajor licenses Alov and Iman
SangachalOil TerminalSangachal
Oil Terminal
Source: Courtesy of BP
Licensing
Azerbaijan has only ever conducted one open licensing round – that in 1991 for the Azeri field. Since that time contract negotiations have been direct with the national oil company SOCAR (State Oil Company of the Azeri Republic) which retains a 10% direct interest in the main producing fields. In the onshore, the maturity of the area has meant that the licenses on offer have typically been for enhanced oil recovery from existing fields, with little interest shown by the major IOCs. Strong perception of the prospectivity of the region meant however that subsequent to the signing of the ACG contract competition for licenses was high with significant signature bonuses paid. Licensing peaked in 1997 when 7 licenses were awarded. However, disappointing exploration results have meant that in recent years licenses have been relinquished more frequently than awarded. As a consequence in the offshore and excluding the two producing fields (ACG and Shah Deniz), only four exploration licenses remain intact today. Moreover, of these one looks set to be relinquished after disappointing exploration results (Lukoil’s Yalama) whilst a further two (BP’s Alov and Exxon’s Lekira) are in Caspian waters which at present are subject to an ownership dispute with Iran (it is of note that in past years Iran has sent out gunboats to prevent drilling). As such, only BP’s Iman license can fairly be described as currently active.
Production of Oil & Gas
With the ACG field now moving towards peak production, the oil industry in Azerbaijan is witnessing something of a renaissance. Indeed, by the end of the current decade oil production is expected to be running at some 1.3mb/d, the overwhelming majority of which will arise from the key ACG PSC. Besides this major producing asset there are, however, few other development plans of note. With little happening on exploration this clearly represents something of an issue for the country. Dependence upon a single asset is also true of gas production given the overwhelming dominance of Shah Deniz. Key here, however, is the scale of the technical reserve base which, at around 20TCF, suggests significant long term opportunity for growth as, and when, commercial contracts can be signed and routes to market developed.
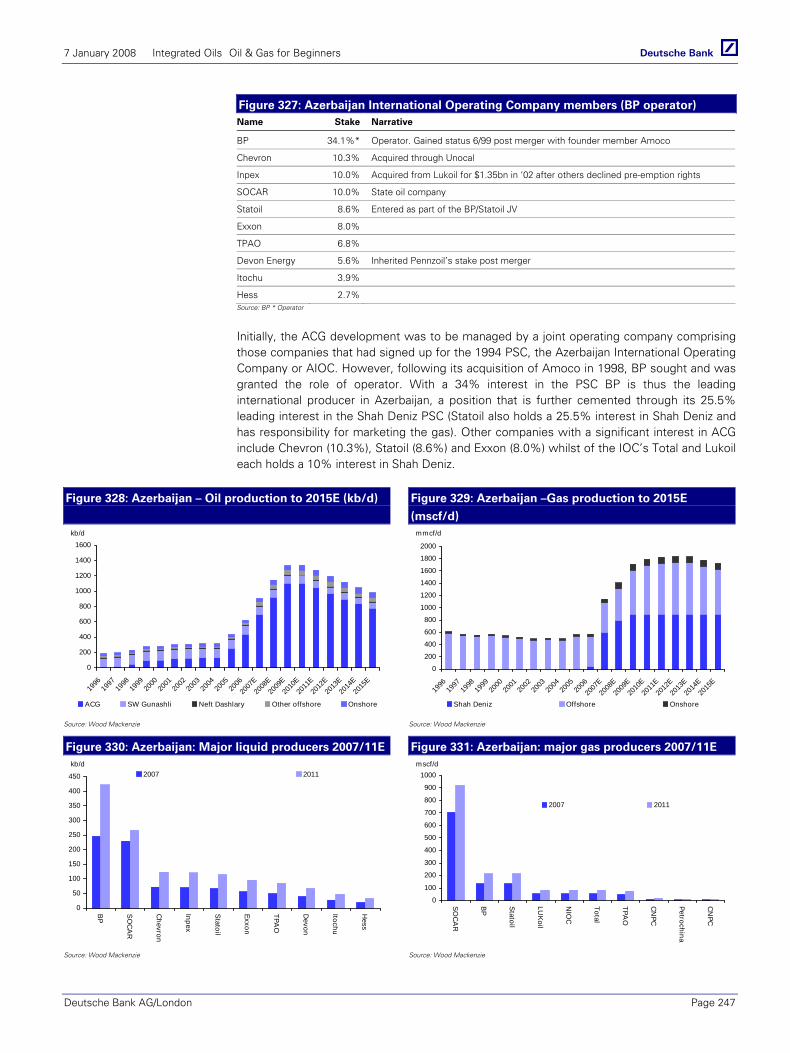
7 January 2008 Integrated Oils Oil & Gas for Beginners
Deutsche Bank AG/London Page 247
Figure 327: Azerbaijan International Operating Company members (BP operator) Name Stake Narrative
BP 34.1%* Operator. Gained status 6/99 post merger with founder member Amoco
Chevron 10.3% Acquired through Unocal
Inpex 10.0% Acquired from Lukoil for $1.35bn in ‘02 after others declined pre-emption rights
SOCAR 10.0% State oil company
Statoil 8.6% Entered as part of the BP/Statoil JV
Exxon 8.0%
TPAO 6.8%
Devon Energy 5.6% Inherited Pennzoil’s stake post merger
Itochu 3.9%
Hess 2.7% Source: BP * Operator
Initially, the ACG development was to be managed by a joint operating company comprising those companies that had signed up for the 1994 PSC, the Azerbaijan International Operating Company or AIOC. However, following its acquisition of Amoco in 1998, BP sought and was granted the role of operator. With a 34% interest in the PSC BP is thus the leading international producer in Azerbaijan, a position that is further cemented through its 25.5% leading interest in the Shah Deniz PSC (Statoil also holds a 25.5% interest in Shah Deniz and has responsibility for marketing the gas). Other companies with a significant interest in ACG include Chevron (10.3%), Statoil (8.6%) and Exxon (8.0%) whilst of the IOC’s Total and Lukoil each holds a 10% interest in Shah Deniz.
Figure 328: Azerbaijan – Oil production to 2015E (kb/d)
Figure 329: Azerbaijan –Gas production to 2015E
(mscf/d)
0
200
400
600
800
1000
1200
1400
1600
1996
1997
1998
1999
2000
2001
2002
2003
2004
2005
2006
2007
E20
08E20
09E20
10E20
11E20
12E20
13E20
14E20
15E
ACG SW Gunashli Neft Dashlary Other offshore Onshore
kb/d
0
200
400
600
800
1000
1200
1400
1600
1800
2000
1996
1997
1998
1999
2000
2001
2002
2003
2004
2005
2006
2007
E20
08E20
09E20
10E20
11E20
12E20
13E20
14E20
15E
Shah Deniz Offshore Onshore
mmcf/d
Source: Wood Mackenzie Source: Wood Mackenzie
Figure 330: Azerbaijan: Major liquid producers 2007/11E Figure 331: Azerbaijan: major gas producers 2007/11E
0
50
100
150
200
250
300
350
400
450
BP
SO
CA
R
Chevron
Inpex
Statoil
Exxon
TPAO
Devon
Itochu
Hess
2007 2011kb/d
0
100
200
300
400
500
600
700
800
900
1000
SO
CA
R
BP
Statoil
LUK
oil
NIO
C
Total
TPAO
CN
PC
Petrochina
CN
PC
2007 2011
mscf/d
Source: Wood Mackenzie Source: Wood Mackenzie
7 January 2008 Integrated Oils Oil & Gas for Beginners
Page 248 Deutsche Bank AG/London
Reserves and resources
At the end of 2007 Wood Mackenzie estimates that total 2P reserves of liquids stood at 8.9bn barrels of which 7.9bn were associated with the ACG fields. Similarly, 2P Gas reserves are estimated at 2.1bn boe, 1.4 billion boe of which are associated with Shah Deniz. It is, however, of note that a further 20TCF of gas are estimated to be associated with Shah Deniz although with no commercial contracts in place for their sale at this time these are regarded as a technical resource. These reserves aside, SOCAR estimates that there could be 1.5bn boe associated with BP’s Iman offshore prospect. In 2007 BP also announced the discovery of a further but deeper gas bearing reservoir in the Shah Deniz field.
Pipelines and Infrastructure
Historically, of the 350-400kb/d of Azeri oil and products not intended for domestic consumption, 150-200kb/d had typically been exported via rail to Black Sea ports in Georgia with the balance reaching the Black Sea for export through two main pipeline routes.
The Western Route: Running from Baku to Supsa on Georgia’s Black Sea Coast, this 830km, 155kb/d line has been running at full capacity.
The Northern route from Baku to Novorossiisk on Russia’s Black Sea coast. Extending for 1346km and operated on the Azeri side by AIOC (and Transneft from the Russian border) this has a capacity of 100kb/d. Utilization has tended to be below capacity because of the discount ($5/bl) received when light Azeri oil is blended with heavier Russian Urals.
The development of ACG meant, however, that new routes to market would be required. Consequently, in 2001 the 1760km Baku Tbilisi Ceyhan (BTC) pipeline route was decided upon. Inaugurated in May 2006 the BTC has a current capacity of 500kb/d but will be increased to 1mb/d by 2008 with a maximum throughput of 1.8mb/d possible. In addition to oil pipelines, the development of Shah Deniz has seen construction of a new gas pipeline for delivery of gas to the Turkish/Georgian border, the South Caucasus’ pipeline or SCP. With an initial capacity of 780mscf/d, this 690km pipeline runs through Azerbaijan and Georgia and into Northern Turkey where it connects to the national network. We would expect this pipeline to connect to others feeding into northern Europe in the years to come.
Crude oil blends and quality
With production dominated by the output from the giant ACG PSC the main oil blend is Azeri light. This is a light, sweet oil with under 1% sulphur and a 34 degree API.
Broad fiscal terms
Hydrocarbons in Azerbaijan are produced under production sharing contracts with the share of profits dependent upon the internal rate of return achieved by the project. Profits are calculated and shared between the state and the members of the PSC after the recovery of capex and operating costs, the first 50% of profits being available for cost oil recovery. (Note that capex not recovered in the year in which it is incurred can be carried forwards at LIBOR plus 4%). Given the scale of the investment and the absolute level of capital returned the trigger points for a change in the profit share between contractor and state are relatively fine. Thus, using the ACG contract as an example, at its minimum hurdle rate (16.75% IRR) profits are shared 70/30 in favour of the contractors, a split which moves to 20/80 in favour of the State once the maximum 22.75% IRR has been achieved. The consequence of these terms is a very sharp fall in consolidated entitlement barrels for the AIOC partners as the different trigger points are attained. The share of profits aside, profits achieved are under the PSC are liable to corporation tax at a rate of 25%, slightly higher than the standard CT rate of 22%.
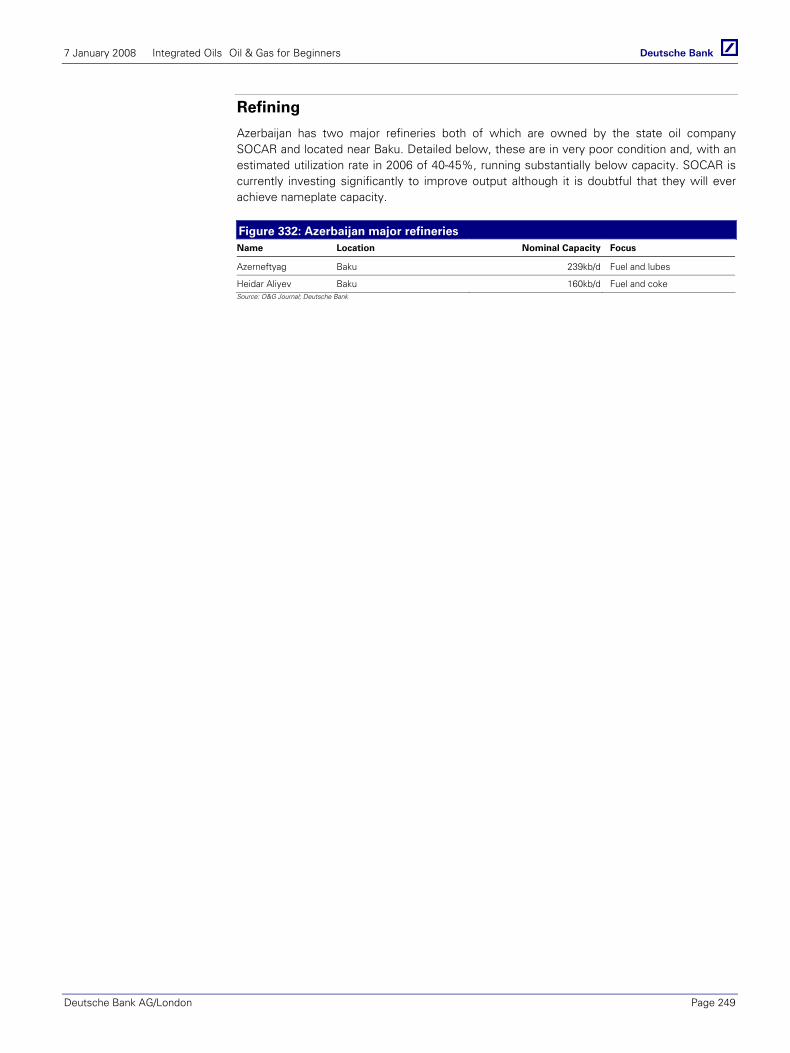
7 January 2008 Integrated Oils Oil & Gas for Beginners
Deutsche Bank AG/London Page 249
Refining
Azerbaijan has two major refineries both of which are owned by the state oil company SOCAR and located near Baku. Detailed below, these are in very poor condition and, with an estimated utilization rate in 2006 of 40-45%, running substantially below capacity. SOCAR is currently investing significantly to improve output although it is doubtful that they will ever achieve nameplate capacity.
Figure 332: Azerbaijan major refineries Name Location Nominal Capacity Focus
Azerneftyag Baku 239kb/d Fuel and lubes
Heidar Aliyev Baku 160kb/d Fuel and coke Source: O&G Journal; Deutsche Bank

7 January 2008 Integrated Oils Oil & Gas for Beginners
Page 250 Deutsche Bank AG/London
Azerbaijan - Notes

7 January 2008 Integrated Oils Oil & Gas for Beginners
Deutsche Bank AG/London Page 251
Kazakhstan Predominantly an oil province, Kazakhstan accounts for the lion’s share of reserves in the Caspian Sea and is the second largest FSU producer after Russia. At 1.4mb/d the country has achieved growth in oil production of around 15% per annum since the start of the decade, and growth from the country’s 31 billion barrel oil reserve base is expected to continue at around 10% into the medium term. This production performance is expected to centre on the output from three giant fields, Kashagan, Tengiz and Karachaganak. At almost 60TCF the country also has substantial reserves of natural gas, most all of which is associated with its liquids output, and for which export routes are at present very limited. Production is dominated by the state oil company KazMuniGaz (KMG) while the major IOCs with a position in Kazakhstan include Chevron, Eni and Exxon.
Basic Geology and topology
In many respects the geology of Kazakhstan reads as though the country is one giant oil field. Over 60% of Kazakhstan’s 2.7 million square kilometers are occupied by some 15 sedimentary basins of varying sizes, the most prolific of which, the Precaspian, lies to the west of the country around the Caspian. Accounting for around 90% of the country’s remaining 2P reserves the Precaspian includes the giant fields of Kashagan, Karachaganak and Tengiz all of which have been found in its pre-salt mega-sequence. The Precaspian aside, Kazakhstan’s more important producing basins include the Mangyshlak which lies to the south west of the country and extends into Uzbekistan and Turkmenistan, and the North Ustyurt which lies inbetween the Precaspian and Mangyshlak to the west of the country.
History and regulation
For many years Kazakhstan represented the smallest of the three main Soviet production areas. Although first commercial production commenced in 1911, with significant production coming from Azerbaijan and Russia there was little need to develop Kazakhstan’s reserves. However, the discovery and development in the 1960s of two major fields in the Mangyshlak Basin combined with declining Azeri output saw all of this change. By the mid-1970s Kazakhstan had become an important source of Soviet oil with production of around 500kb/d. Yet, faced with significant technical challenges, not least the depth and complexity of the larger reservoirs in the Precaspian Basin, output struggled to move beyond this level and it was only upon the introduction of the major IOCs in the 1990s that Kazakh production started to make progress again most notably as the Karachaganak and Tengiz fields commenced production.
Oil & gas activities are overseen and regulated by the Ministry of Energy and Mineral Resources. However, the state plays a direct role in the country’s day to day activities in hydrocarbons through the national oil company KazMunaiGaz (KMG). Through its subsidiaries KMG not only holds material stakes in a number of key fields (Kashagan, Tengiz, Uzen) but, through KazMunaiGaz E&P, also acts as the operator for a multitude of others. Moreover, through KazTransOil (KTO) and KazTransGaz (KTG) the company has a near monopoly on the transport infrastructure for both oil and gas. Through a joint venture company with Gazprom (KazRosGaz) it is also responsible for the trading and export of Kazakh natural gas. Oil & gas production aside, KMG’s key functions include its participation in the strategic planning and development of the country’s hydrocarbon resources base and in overseeing the conduct of tenders amongst potential contractors. Following legislation laid down in 2005, the Government has also mandated that KazMunaiGaz will be entitled to a 50% shareholding in all future offshore PSCs, with its share of any costs carried through the exploration phase.
Key facts Oil production 2007E 1.4mb/d Gas production 2007E 0.3mboe/d Oil reserves 2007E 31.1bn bbls Gas reserve 2007E 57.9TCF Reserve life (oil) 60 years Reserve life (gas) 86 years GDP 2007E ($bn) $65.billion GDP Growth 2007E (%) 9% Population (m) 15.2m Oil consumption (mb/d) 0.25m/d Oil exports (mb/d) 1.25mb/d Fiscal regime T&R and PSC Marginal (corporate) tax rate 67% Top 3 oil fields (2007E) Tengiz 374kboe/d Karachaganak 250kboe/d Uzen 137kboe/d Top 3 Oil Producers (2007E) Chevron 236kboe/d Lukoil 116kboe/d Exxon 94kboe/d
Source: Wood Mackenzie; EIA data
Oil Production profile kb/d
0
500
1000
1500
2000
2500
3000
2000
2001
2002
2003
2004
2005
2006
2007
2008
2009
2010
2011
2012
2013
2014
2015
Precaspian Other
kb/d
Source: Wood Mackenzie data
Remaining reserves split %
Oil78%
Gas22%
Source: Wood Mackenzie data
Initial versus remaining reserves
Produced21%
Remaining79%
Source: Wood Mackenzie data
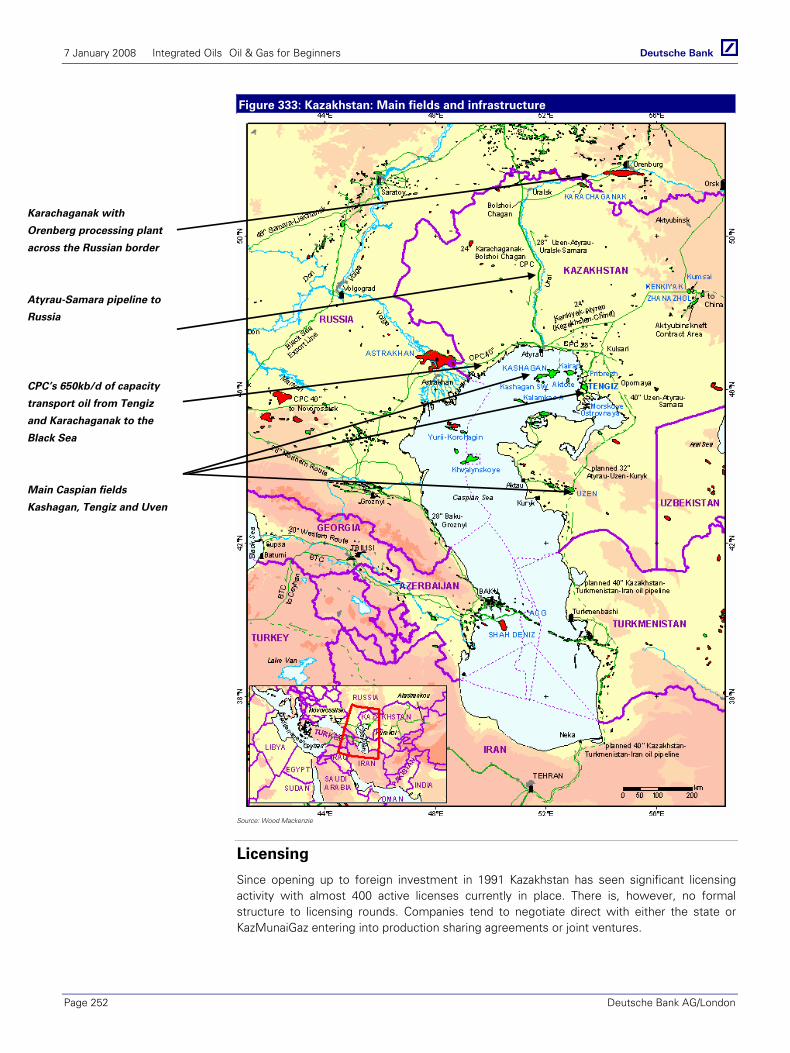
7 January 2008 Integrated Oils Oil & Gas for Beginners
Page 252 Deutsche Bank AG/London
Figure 333: Kazakhstan: Main fields and infrastructure
Source: Wood Mackenzie
Licensing
Since opening up to foreign investment in 1991 Kazakhstan has seen significant licensing activity with almost 400 active licenses currently in place. There is, however, no formal structure to licensing rounds. Companies tend to negotiate direct with either the state or KazMunaiGaz entering into production sharing agreements or joint ventures.
Karachaganak with
Orenberg processing plant
across the Russian border
Atyrau-Samara pipeline to
Russia
CPC’s 650kb/d of capacity
transport oil from Tengiz
and Karachaganak to the
Black Sea
Main Caspian fields
Kashagan, Tengiz and Uven
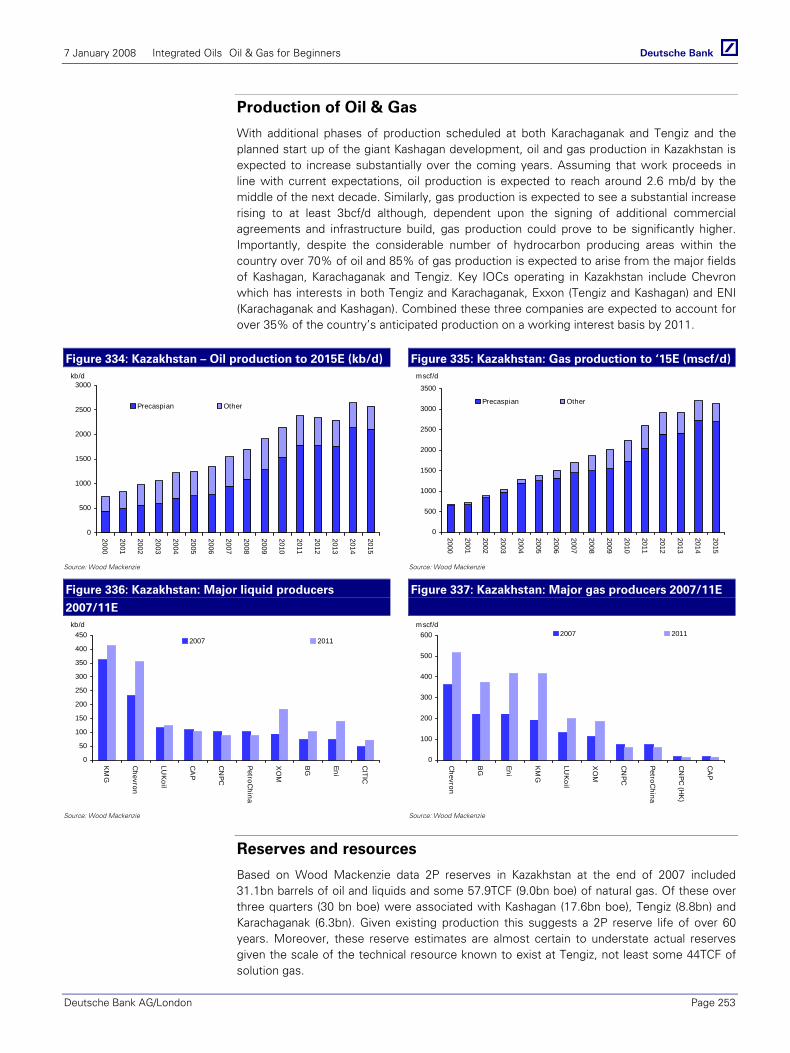
7 January 2008 Integrated Oils Oil & Gas for Beginners
Deutsche Bank AG/London Page 253
Production of Oil & Gas
With additional phases of production scheduled at both Karachaganak and Tengiz and the planned start up of the giant Kashagan development, oil and gas production in Kazakhstan is expected to increase substantially over the coming years. Assuming that work proceeds in line with current expectations, oil production is expected to reach around 2.6 mb/d by the middle of the next decade. Similarly, gas production is expected to see a substantial increase rising to at least 3bcf/d although, dependent upon the signing of additional commercial agreements and infrastructure build, gas production could prove to be significantly higher. Importantly, despite the considerable number of hydrocarbon producing areas within the country over 70% of oil and 85% of gas production is expected to arise from the major fields of Kashagan, Karachaganak and Tengiz. Key IOCs operating in Kazakhstan include Chevron which has interests in both Tengiz and Karachaganak, Exxon (Tengiz and Kashagan) and ENI (Karachaganak and Kashagan). Combined these three companies are expected to account for over 35% of the country’s anticipated production on a working interest basis by 2011.
Figure 334: Kazakhstan – Oil production to 2015E (kb/d) Figure 335: Kazakhstan: Gas production to ‘15E (mscf/d)
0
500
1000
1500
2000
2500
3000
2000
2001
2002
2003
2004
2005
2006
2007
2008
2009
2010
2011
2012
2013
2014
2015
Precaspian Other
kb/d
0
500
1000
1500
2000
2500
3000
3500
2000
2001
2002
2003
2004
2005
2006
2007
2008
2009
2010
2011
2012
2013
2014
2015
Precaspian Other
mscf/d
Source: Wood Mackenzie Source: Wood Mackenzie
Figure 336: Kazakhstan: Major liquid producers
2007/11E
Figure 337: Kazakhstan: Major gas producers 2007/11E
0
50
100
150
200
250
300
350
400
450
KM
G
Chevron
LUK
oil
CA
P
CN
PC
PetroChina
XO
M
BG
Eni
CITIC
2007 2011
kb/d
0
100
200
300
400
500
600
Chevron
BG
Eni
KM
G
LUK
oil
XO
M
CN
PC
PetroChina
CN
PC (H
K)
CA
P
2007 2011mscf/d
Source: Wood Mackenzie Source: Wood Mackenzie
Reserves and resources
Based on Wood Mackenzie data 2P reserves in Kazakhstan at the end of 2007 included 31.1bn barrels of oil and liquids and some 57.9TCF (9.0bn boe) of natural gas. Of these over three quarters (30 bn boe) were associated with Kashagan (17.6bn boe), Tengiz (8.8bn) and Karachaganak (6.3bn). Given existing production this suggests a 2P reserve life of over 60 years. Moreover, these reserve estimates are almost certain to understate actual reserves given the scale of the technical resource known to exist at Tengiz, not least some 44TCF of solution gas.

7 January 2008 Integrated Oils Oil & Gas for Beginners
Page 254 Deutsche Bank AG/London
Pipelines and infrastructure
As an essentially land-locked market the establishment of adequate export infrastructure has been central to the development of Kazakhstan’s hydrocarbon base. Although upon independence, significant infrastructure was in place, it had largely been laid down with a view to transporting oil and gas to and from Russia. Much was also in a poor state of repair. Since independence, infrastructure development has consequently focused on establishing new export routes to supply Kazakh oil to both western and eastern markets and ensuring the major new fields were connected to these and already existing export routes. Significant investment has also been made in upgrading what was an aging system. Shown in the diagram below the major pipelines include the following:
CPC: Central to Kazakhstan’s needs has been the development of the 1500km CPC (Caspian Pipeline Consortium) pipeline. Largely financed by a consortium of the major IOCs (whose equity interests afford them access), its capacity is expected to stand at 1.45mb/d by 2008. CPC runs from the shores of the Caspian to Russia’s Black Sea port of Novorossiysk. It has substantially reduced Kazakhstan’s dependence on the Russian Transneft system and provided much of the capacity required to export oil from Tengiz, Karachaganak and, in future years Kashagan.
KCTS: Beyond CPC, the development of the Kazahstan Caspian Transport System will establish pipeline transport for oil from Kashagan, and other connected fields, to the Caspian port of Kuryk. From here oil can be transported by ship to Baku before being transported through the BTC to southern Turkey. Scheduled to be completed in line with the start up of Kashagan, initial capacity is planned at 300kb/d rising to a potential 1mb/d.
K-C: Looking to the east, CNPC is developing the Kazakhstan-China oil pipeline. This c.3000km pipeline is being built in three phases. To date the Kenkiyak-Atyrau and Kumkol-Alashankou sections have been constructed with the final Kenkiyak-Kumkol connecting section expected to be completed by end 2008. Once infrastructure in China is established the pipeline will have a potential oil export capacity of up to 1mb/d
These two major export routes aside, the key export line is the Atyrau-Samara pipeline which connects the Kazakh and Russian systems. This has a current capacity of 300kb/d but, by 2010, should be capable of transporting 500kb/d.
Figure 338: Major oil pipelines: existing and in development
Source: Courtesy of ENI

7 January 2008 Integrated Oils Oil & Gas for Beginners
Deutsche Bank AG/London Page 255
Other routes to export markets Pipelines aside Kazakhstan has the potential to export up to 340kb/d of oil by rail and 200kb/d by ship from the port of Aktau. Shipping facilities are, however, expected to be significantly increased with capacity at Aktau moving to 400kb/d by 2010 with similar capacity also laid down at the new port of Kuryk.
Figure 339: Export routes for Kazakhstan’s main producing fields Field Export routes
Tengiz CPC to Novorossiysk - 650kb/d
Atyrau-Samara to Russia (and on through Transneft) – Limited export at present
To BTC via future Kazakh Caspian Transport System (KCTS)
Rail potential for 120kb/d
Karachaganak To CPC through the Bolshoi Chagan-Atyrau pipeline – 150kb/d
Atyrau-Samara to Russia (and on through Transneft) - 66kb/d by 2012
Rail - 100kb/d by 2012
Orenburg processing plant - 80kb/d condensate processing
Orenburg processing plant - 8bcm rising to 16 bcm in 2012. Sold to KRG.
Kashagan Likely to be a mix of CPC, BTC, Atyrau-Samara and Kazakh-China Source: Deutsche Bank
Gas Infrastructure Kazakhstan’s gas infrastructure was predominantly designed with a view to transporting large volumes of Turkmen and Uzbek gas across the country to Russia. Little thought was given to the collection and forward distribution of domestic gas production, much of which was associated with Kazakh oil production. As a consequence, Kazakhstan’s gas infrastructure is largely underutilized with many of the pipelines in a poor state of repair and connections between areas of production and consumption limited. Operation of the domestic pipelines is managed by KaxTransGaz a subsidiary of KazMunaiGaz which intends constructing new pipelines for the collection and export of Kazakh gas. At the current time, Kazakhstan remains, however, very dependent upon Gazprom for access to international markets. With this in mind, in 2002 the state company KazMunaiGas established a joint venture marketing company with Gazprom and Rosneft (now sold). Named KazRosGaz, this 50/50 JV with Gazprom provides Kazakhstan with access to the Russian gas pipeline system so enabling it to realize some international income from domestic production albeit at relatively low prices.
Crude oil blends and quality
Clearly to the extent that Kazakh oil is fed into the Russian pipeline system it suffers from being blended with often heavier Urals product, undermining its end market price. However, product that emerges through the CPC pipeline is sold as ‘CPC blend’ a light (43.3° API), sweet (0.6% sulphur) blend of Caspian oil.
Broad fiscal terms
Overall, taxation in Kazakhstan is complicated. Most contracts in Kazakhstan currently operate as joint ventures paying royalty and tax although both Karachaganak and Kashagan are structured as PSCs. For tax and royalty regimes, recent years have seen a significant increase in Government take not least through the introduction of Rent Tax, a progressive tax whose % take alters with the price of oil.
Joint Ventures (tax & royalty): Subsequent to the changes under 2005 tax law, JVs now find themselves subject to several different forms of Government take. These include a production based royalty (varying between a minimum of 2% for production of under 10kb/d to a maximum of 6% on production over 100kb/d); Excess Profit Tax (which is levied on profits at a rate of between 10% and 60% once cumulative income exceeds 1.2x cumulative

7 January 2008 Integrated Oils Oil & Gas for Beginners
Page 256 Deutsche Bank AG/London
tax); corporation tax which is charged at a rate of 30%; and Rent Tax on Exported Oil, which akin to royalties is levied on the gross revenues less transport costs at a rate that varies between 1% if the price per barrel is $19 to 33% if the price per barrel is above $40. The result is that at high oil prices Government take can be as high as 86% of gross income.
PSCs: Similarly, under PSCs the trigger points established under the country’s IRR based contract system are such that as returns move from under 12% to beyond 20% the Government’s share of a projects net profits rises from 30% to 90%. This is after payment of corporation tax at 30% and significantly limits the scope for the holders to make exceptional returns. Cost oil allowances are, however, relatively generous running at an estimated 60-70% of revenues although capex uplift is not available.
Refining
The refining sector in Kazakhstan comprises several small (c10kb/d) facilities together with three relatively large (150kb/d), strategically located, state controlled facilities; one in the North at Pavlodar, which uses Russian crude as feedstock, one in the west at Atyrau and one in the south at Shymkent. Both Atyrau and Shymkent have access to domestic crude oil. After some considerable state investment in recent years refining performance has improved significantly with utilization rates rising to over 50% of nameplate capacity. Despite the poor performance of the country’s three refineries, production is sufficient to meet the country’s demand requirements which in 2006 stood at around 250kb/d.

7 January 2008 Integrated Oils Oil & Gas for Beginners
Deutsche Bank AG/London Page 257
Kazakhstan - Notes

7 January 2008 Integrated Oils Oil & Gas for Beginners
Page 258 Deutsche Bank AG/London
Kazakhstan - Notes
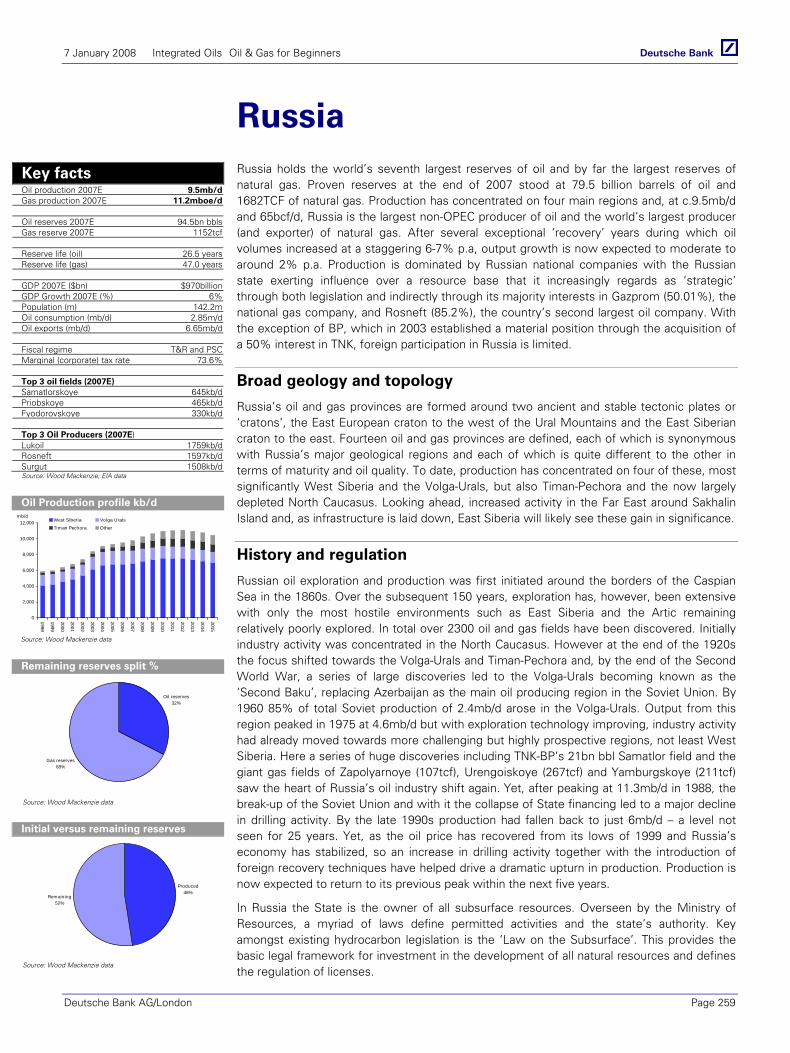
7 January 2008 Integrated Oils Oil & Gas for Beginners
Deutsche Bank AG/London Page 259
Russia Russia holds the world’s seventh largest reserves of oil and by far the largest reserves of natural gas. Proven reserves at the end of 2007 stood at 79.5 billion barrels of oil and 1682TCF of natural gas. Production has concentrated on four main regions and, at c.9.5mb/d and 65bcf/d, Russia is the largest non-OPEC producer of oil and the world’s largest producer (and exporter) of natural gas. After several exceptional ‘recovery’ years during which oil volumes increased at a staggering 6-7% p.a, output growth is now expected to moderate to around 2% p.a. Production is dominated by Russian national companies with the Russian state exerting influence over a resource base that it increasingly regards as ‘strategic’ through both legislation and indirectly through its majority interests in Gazprom (50.01%), the national gas company, and Rosneft (85.2%), the country’s second largest oil company. With the exception of BP, which in 2003 established a material position through the acquisition of a 50% interest in TNK, foreign participation in Russia is limited.
Broad geology and topology
Russia’s oil and gas provinces are formed around two ancient and stable tectonic plates or ‘cratons’, the East European craton to the west of the Ural Mountains and the East Siberian craton to the east. Fourteen oil and gas provinces are defined, each of which is synonymous with Russia’s major geological regions and each of which is quite different to the other in terms of maturity and oil quality. To date, production has concentrated on four of these, most significantly West Siberia and the Volga-Urals, but also Timan-Pechora and the now largely depleted North Caucasus. Looking ahead, increased activity in the Far East around Sakhalin Island and, as infrastructure is laid down, East Siberia will likely see these gain in significance.
History and regulation
Russian oil exploration and production was first initiated around the borders of the Caspian Sea in the 1860s. Over the subsequent 150 years, exploration has, however, been extensive with only the most hostile environments such as East Siberia and the Artic remaining relatively poorly explored. In total over 2300 oil and gas fields have been discovered. Initially industry activity was concentrated in the North Caucasus. However at the end of the 1920s the focus shifted towards the Volga-Urals and Timan-Pechora and, by the end of the Second World War, a series of large discoveries led to the Volga-Urals becoming known as the ‘Second Baku’, replacing Azerbaijan as the main oil producing region in the Soviet Union. By 1960 85% of total Soviet production of 2.4mb/d arose in the Volga-Urals. Output from this region peaked in 1975 at 4.6mb/d but with exploration technology improving, industry activity had already moved towards more challenging but highly prospective regions, not least West Siberia. Here a series of huge discoveries including TNK-BP’s 21bn bbl Samatlor field and the giant gas fields of Zapolyarnoye (107tcf), Urengoiskoye (267tcf) and Yamburgskoye (211tcf) saw the heart of Russia’s oil industry shift again. Yet, after peaking at 11.3mb/d in 1988, the break-up of the Soviet Union and with it the collapse of State financing led to a major decline in drilling activity. By the late 1990s production had fallen back to just 6mb/d – a level not seen for 25 years. Yet, as the oil price has recovered from its lows of 1999 and Russia’s economy has stabilized, so an increase in drilling activity together with the introduction of foreign recovery techniques have helped drive a dramatic upturn in production. Production is now expected to return to its previous peak within the next five years.
In Russia the State is the owner of all subsurface resources. Overseen by the Ministry of Resources, a myriad of laws define permitted activities and the state’s authority. Key amongst existing hydrocarbon legislation is the ‘Law on the Subsurface’. This provides the basic legal framework for investment in the development of all natural resources and defines the regulation of licenses.
Key facts Oil production 2007E 9.5mb/d Gas production 2007E 11.2mboe/d Oil reserves 2007E 94.5bn bbls Gas reserve 2007E 1152tcf Reserve life (oil) 26.5 years Reserve life (gas) 47.0 years GDP 2007E ($bn) $970billion GDP Growth 2007E (%) 6% Population (m) 142.2m Oil consumption (mb/d) 2.85m/d Oil exports (mb/d) 6.65mb/d Fiscal regime T&R and PSC Marginal (corporate) tax rate 73.6% Top 3 oil fields (2007E) Samatlorskoye 645kb/d Priobskoye 465kb/d Fyodorovskoye 330kb/d Top 3 Oil Producers (2007E) Lukoil 1759kb/d Rosneft 1597kb/d Surgut 1508kb/d
Source: Wood Mackenzie; EIA data
Oil Production profile kb/d
0
2,000
4,000
6,000
8,000
10,000
12,000
1998
1999
2000
2001
2002
2003
2004
2005
2006
2007
2008
2009
2010
2011
2012
2013
2014
2015
West Siberia Volga Urals
Timan Pechora Other
mb/d
Source: Wood Mackenzie data
Remaining reserves split %
Oil reserves32%
Gas reserves68%
Source: Wood Mackenzie data
Initial versus remaining reserves
Produced48%
Remaining52%
Source: Wood Mackenzie data
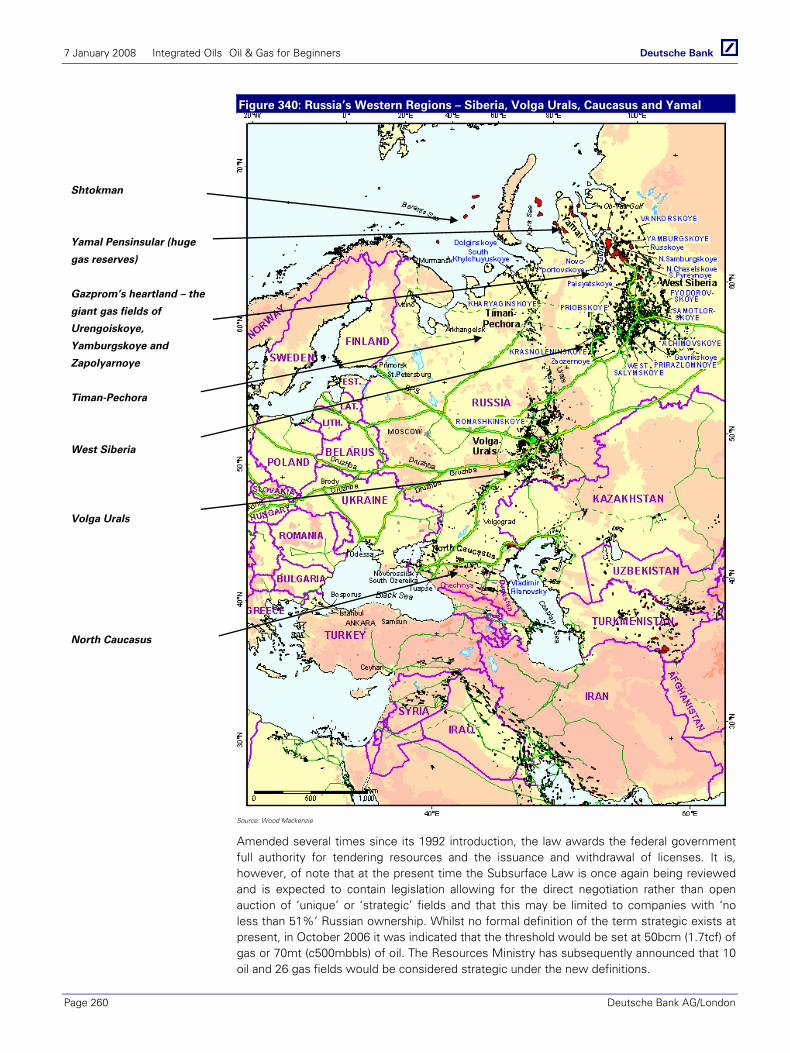
7 January 2008 Integrated Oils Oil & Gas for Beginners
Page 260 Deutsche Bank AG/London
Figure 340: Russia’s Western Regions – Siberia, Volga Urals, Caucasus and Yamal
Source: Wood Mackenzie
Amended several times since its 1992 introduction, the law awards the federal government full authority for tendering resources and the issuance and withdrawal of licenses. It is, however, of note that at the present time the Subsurface Law is once again being reviewed and is expected to contain legislation allowing for the direct negotiation rather than open auction of ‘unique’ or ‘strategic’ fields and that this may be limited to companies with ‘no less than 51%’ Russian ownership. Whilst no formal definition of the term strategic exists at present, in October 2006 it was indicated that the threshold would be set at 50bcm (1.7tcf) of gas or 70mt (c500mbbls) of oil. The Resources Ministry has subsequently announced that 10 oil and 26 gas fields would be considered strategic under the new definitions.
Shtokman
Yamal Pensinsular (huge
gas reserves)
Gazprom’s heartland – the
giant gas fields of
Urengoiskoye,
Yamburgskoye and
Zapolyarnoye
Timan-Pechora
West Siberia
Volga Urals
North Caucasus
7 January 2008 Integrated Oils Oil & Gas for Beginners
Deutsche Bank AG/London Page 261
Indeed, under the guidance of President Putin the state’s growing desire to use its mineral wealth for strategic and political ends has served to add considerable uncertainty around foreign investment in Russia. Starting with the 2004 dissolution of the country’s then largest oil company, Yukos, for alleged tax evasion, the state has sought to recapture control over significant resources that were licensed to foreign companies under earlier administrations, often through the assertion of questionable claims of license infringement. Thus the dilution of Shell’s interest in the Sakhalin II PSA and the ‘negotiated’ purchase of BP’s interest in the giant Kovytka field have raised the stakes for foreign investment and made very clear that foreign involvement over and above that which exists today is only likely to arise on terms set by the state, with the international investor very clearly in a minority position.
Licensing
As indicated, licensing is controlled by the Ministry of Natural Resources. Licenses are awarded by way of tender and the payment of a bonus although under an amendment to the Subsurface Law in 2000, the winner of a tender may now be chosen for the national security of Russia. At present licenses may be assigned to joint ventures in which the license holder has a 50% share. Licenses typically allow a five year period for exploration with production licenses granted for a twenty year period (although applications for extensions were commonly granted). Following amendments to the law in 2000 licenses are now granted for production over the life of the field.
Production of oil & gas
Having recovered strongly through the early years of the current decade production of both gas and oil in Russia is expected to continue to grow over the next few years, albeit at a much slower rate. According to Wood Mackenzie estimates, oil production is expected to rise to a peak of 11.1mb/d by 2012 and gas to roughly 85bcf/d by 2015. For oil production to continue to expand beyond this period will, however, require substantial investment, much of the improvement in recent years coming from enhanced recovery at existing fields rather than greenfield investment. Historically, several super giant fields contributed significantly to oil output. For example, in 1980 Samatlor’s 3mb/d of production accounted for almost 40% of Russia’s production. However, with many of these in decline production today is far more widespread. Key fields include Samatlor (680kb/d). Rosneft’s Priobskoye (465kb/d), and Surgut’s Fyodorovskoye (c330kb/d). Russia’s oil production is dominated by the national majors Rosneft, Lukoil and Surgut and the BP joint venture, TNK-BP. With the state playing an increasing role in overseeing resource allocation Rosneft’ looks set emerge as the leading producer over the coming years.
Similar to oil, gas production is expected to grow at some 2-3% for the foreseeable future rising to an estimated 85bcf/d by 2015. However, gas production is far more concentrated with the three largest fields (Urengoy, Yamburg and Zapolyary) accounting for over 55% of current production. With production from the first two of these now in decline, sustaining growth into the medium term is almost certain to require increased levels of investment and the development of giant fields which lie in very hostile environments, namely Bovanenkovskoye on the Yamal Peninsular and Shtokman in the Artic waters of the Barents Sea.
Gas production is dominated by state controlled Gazprom, which by law has the right to any gas fields deemed of strategic importance (provided no development licence has been granted), a monopoly over gas exports and domestic supply. Gazprom also retains a monopoly over Russia’s gas transport network the Unified Gas Supply System (UGSS). Although other companies produce gas in Russia, not least Novatek, their prospects are heavily dependent upon their relationship with Gazprom given its monopoly of gas infrastructure and domestic supply.
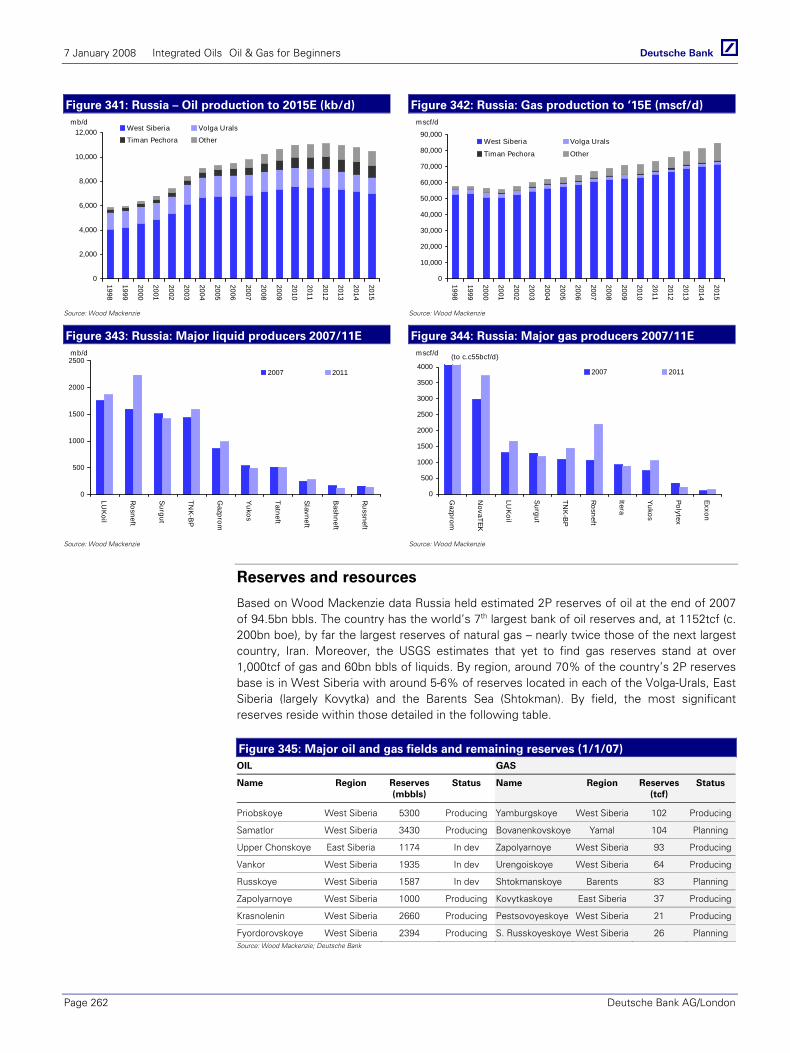
7 January 2008 Integrated Oils Oil & Gas for Beginners
Page 262 Deutsche Bank AG/London
Figure 341: Russia – Oil production to 2015E (kb/d) Figure 342: Russia: Gas production to ‘15E (mscf/d)
0
2,000
4,000
6,000
8,000
10,000
12,000
1998
1999
2000
2001
2002
2003
2004
2005
2006
2007
2008
2009
2010
2011
2012
2013
2014
2015
West Siberia Volga Urals
Timan Pechora Other
mb/d
0
10,000
20,000
30,000
40,000
50,000
60,000
70,000
80,000
90,000
1998
1999
2000
2001
2002
2003
2004
2005
2006
2007
2008
2009
2010
2011
2012
2013
2014
2015
West Siberia Volga Urals
Timan Pechora Other
mscf/d
Source: Wood Mackenzie Source: Wood Mackenzie
Figure 343: Russia: Major liquid producers 2007/11E Figure 344: Russia: Major gas producers 2007/11E
0
500
1000
1500
2000
2500
LUK
oil
Rosneft
Surgut
TNK
-BP
Gazprom
Yukos
Tatneft
Slavneft
Bashneft
Russneft
2007 2011
mb/d
0
500
1000
1500
2000
2500
3000
3500
4000
Gazprom
NovaTEK
LUK
oil
Surgut
TNK
-BP
Rosneft
Itera
Yukos
Polytex
Exxon
2007 2011
(to c.c55bcf/d)mscf/d
Source: Wood Mackenzie Source: Wood Mackenzie
Reserves and resources
Based on Wood Mackenzie data Russia held estimated 2P reserves of oil at the end of 2007 of 94.5bn bbls. The country has the world’s 7th largest bank of oil reserves and, at 1152tcf (c. 200bn boe), by far the largest reserves of natural gas – nearly twice those of the next largest country, Iran. Moreover, the USGS estimates that yet to find gas reserves stand at over 1,000tcf of gas and 60bn bbls of liquids. By region, around 70% of the country’s 2P reserves base is in West Siberia with around 5-6% of reserves located in each of the Volga-Urals, East Siberia (largely Kovytka) and the Barents Sea (Shtokman). By field, the most significant reserves reside within those detailed in the following table.
Figure 345: Major oil and gas fields and remaining reserves (1/1/07) OIL GAS
Name Region Reserves(mbbls)
Status Name Region Reserves (tcf)
Status
Priobskoye West Siberia 5300 Producing Yamburgskoye West Siberia 102 Producing
Samatlor West Siberia 3430 Producing Bovanenkovskoye Yamal 104 Planning
Upper Chonskoye East Siberia 1174 In dev Zapolyarnoye West Siberia 93 Producing
Vankor West Siberia 1935 In dev Urengoiskoye West Siberia 64 Producing
Russkoye West Siberia 1587 In dev Shtokmanskoye Barents 83 Planning
Zapolyarnoye West Siberia 1000 Producing Kovytkaskoye East Siberia 37 Producing
Krasnolenin West Siberia 2660 Producing Pestsovoyeskoye West Siberia 21 Producing
Fyordorovskoye West Siberia 2394 Producing S. Russkoyeskoye West Siberia 26 Planning Source: Wood Mackenzie; Deutsche Bank
7 January 2008 Integrated Oils Oil & Gas for Beginners
Deutsche Bank AG/London Page 263
Pipeline and infrastructure
With 220,000km of pipelines, Russia has extensive pipeline infrastructure albeit that much of it is in urgent need of investment. Virtually all of this is owned and operated by Government controlled entities. Pipelines for oil are operated by Transneft, gas by Gazprom and oil products by Transnefteprodukt. Including rail and ports Russia is believed to have a current export capacity of 10.6mb/d. Of this 4.0mb/d (38%) is represented by the main Druzhba pipeline, 4.6mb/d (43%) by ports in the Baltic (predominantly 1.5mb/d at Primorsk) and Black Seas (largely Novorossiysk 1mb/d). At 1.2mb/d (11%) rail makes up much of the balance.
Oil infrastructure: The original design capacity of the Russian oil pipeline system was for 13mb/d but bottlenecks limit the overall capacity. The main export pipeline today is the 4mb/d Druzhba. This has a total length of almost 7,000km and connects oil produced in West Siberia and the Urals to markets in western Russia and Europe. Other key pipelines providing access to western export markets include the Baltic Pipeline System which has a capacity of 1.5mb/d and connects oil from West Siberia and Timan Pechora, amongst others, to the Baltic port of Primorsk and the 1.45mb/d Caspian Pipeline Company (or CPC), which although predominantly for Kazakh exports from the Caspian Sea also carries Russian oil to the Black Sea port of Novorossiysk. At the present time, infrastructure across the east of Russia is limited. However, in 2006 Transneft commenced construction of Stage 1 of the East Siberia to Pacific Ocean Pipeline (or ESPO). This is intended to connect West and East Siberian fields to China and Pacific markets, although quite where the pipeline will ultimately extend to is likely to depend heavily on world politics. The 600kb/d first stage is intended to run from Tayshet to Skovorodino (see diagram), from where oil will then be transported by rail to a port terminal that is currently being constructed on the Pacific Coast at Kozimino (near Vladivostok). At present Russia’s preferred route for the second stage is to connect Skovorodino to Kozimino with a separate spur running down to Daquing in China.
Gas infrastructure: Russia has the world’s largest network of gas pipelines, collecting gas and distributing some 22tcf of gas per annum both for the domestic market and for sale into Europe. Many are, however, in need of investment with annual leakages estimated at a huge 800mscf/d. Key international pipelines include Blue Stream (owned jointly with ENI) which runs under the Black Sea exporting up to 1.6bcf/d of gas from Russia to Turkey, the Soyuz system which carries gas from the Orenburg processing plant on the border with Kazakhstan into Europe, Northern Lights which carries gas from West Siberia and Timan Pechora into the Baltic states, the Brotherhood System which starts at the giant fields of West Siberia and carries gas through the Ukraine into Europe and the 3.2bcf/d Yamal Pipeline which carries gas across Belarus and into Poland from the Yamal Peninsula and for which a second pipe (Yamal 2) is planned. Several international projects are also under development. The Nord Stream pipeline will carry 2.7bcf/d of gas across the Baltic Sea to Germany under the first phase of its development and potentially, should a second phase proceed, extend transportation to the UK. Gazprom has also been considering extending its gas network to China with gas potentially coming from Kovytka or the Sakhalin fields whilst the 2007 selection of Total for the Shtokman project will include the construction of a c1.3bcf/d pipeline linking this huge field in the Barents Sea with markets in Germany and beyond.
Crude oil blends and quality
With almost all oil in Russia entering the Transneft network, which does not have a quality bank, the vast majority of Russian oil is sold as Urals Blend. This has a typical API of 31.8 and relatively high sulphur content (1.35%). In an attempt to retain value some producers do, however, export higher product via rail. This lighter (35.6 API), sweeter (0.46% sulphur) oil is sold as Siberian Light.
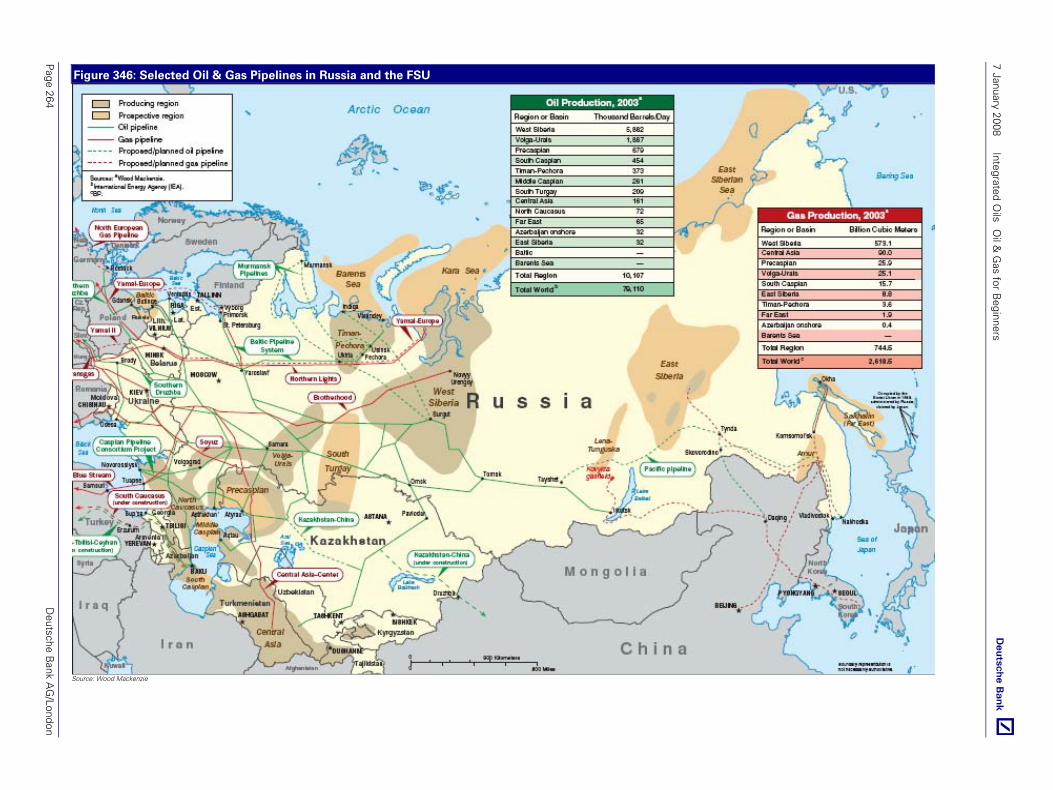
7 January 2008 Integrated O
ils O
il & G
as for Beginners
Page 264
Deutsche B
ank AG
/London
Figure 346: Selected Oil & Gas Pipelines in Russia and the FSU
Source: Wood Mackenzie
7 January 2008 Integrated Oils Oil & Gas for Beginners
Deutsche Bank AG/London Page 265
Broad fiscal terms
Fiscal terms in Russia tend to be based on a concession/tax and royalty system. Although projects operating under PSCs do exist (Exxon’s Sakhalin 1, Shell’s Sakhalin 2 and Total’s Kharyaga) recent events suggest that in future the use of PSCs is likely to be limited in the extreme. As such, we focus solely on the general tax terms surrounding concessions.
Simplistically, the standard fiscal regime in Russia includes three main fiscal components; a mineral extraction tax (MET), corporation tax and, if the oil is exported, an export tax.
MET in effect represents a royalty payable by the producer on the volume of extracted resource, the tax receipts being shared between the federal and regional governments in an 80/20 ratio. MET varies depending on whether the resource is oil, condensate or gas. For oil, the calculation of duty involves some adjustments for the oil price and changes in the roubles rate of exchange against the US$. As a proxy, however, the rate of oil MET typically runs at around 16.5% of the well head price. On gas MET is set at a fixed RR147/mcm (c$6/mcm) and on condensate at 17.5% of the well-head price.
Export duties were introduced in January 2003 and revised upwards significantly in 2004. They apply to oil and are calculated on a sliding scale rising from 0% at a price below $15/bbl to 65% at an average price above $25/bbl. The duty payable is calculated on the average official Mediterranean and Rotterdam price over the previous two months.
Beyond these two taxes, companies are liable to corporate tax at a standard rate of 24%.
The consequence of Russian export tax is that at oil prices of over $25/bbl the effective marginal rate of tax per $/bbl increase in the price of crude is around 75%, with the total rate (i.e. including MET) nearer 90%. In general, at prices of over $40/bbl export tax represents a major financial incentive to convert crude to products (gasoline, diesel, etc) before exporting.
Refining
According to the EIA, Russia has some 41 refineries with a total distillation capacity of 5490kb/d. Although a dozen or so have a capacity of over 250kb/d many of the refineries are old and inefficient. Utilization rates, whilst improving, remain relatively low at an estimated 80%, with around 4.4mb/d of oil products produced. The refining system is also relatively simple producing large volumes of fuel oil (around 40% of output) but only limited gasoline (20% of output). Furthermore, with almost 25% of refining capacity located around Moscow but under 10% in the all important West Siberian region, crude oil needs to travel significant distance before conversion adding to costs. Outside these two areas 40% of capacity is located in the Volga Urals and 10% the North Caucasus. Given that Russian product demand runs at c2.8mb/d, the refining sector is a major exporter even at its depressed rates of utilisation. In particular it is an important source for Europe of diesel.
LNG
Despite its substantial gas resources, Russia’s proximity to Europe has meant that its main and most economical export routes have been via pipeline. Through Gazprom the state has, however, exhibited a growing interest in diversifying its supply options through the construction of LNG facilities. The Shell-led Sakhalin II project on the East coast of the country will represent the country’s first commissioned LNG facility. With an initial capacity of 9.6mtpa, the first phase of this development is expected to come on-stream in 2008 with plans to at least add a second train through the course of the next decade. Separately, Gazprom has also recently announced its intention to establish a second LNG facility, of 7.8mtpa capacity, near Murmansk with feed gas coming from the Shtokman field in the Barents Sea. Plans have also been mooted to establish a facility on the Artic Coast around the Yamal Peninsular (Baltic LNG) although as yet no firm plans have been laid.

7 January 2008 Integrated Oils Oil & Gas for Beginners
Page 266 Deutsche Bank AG/London
Russia - Notes
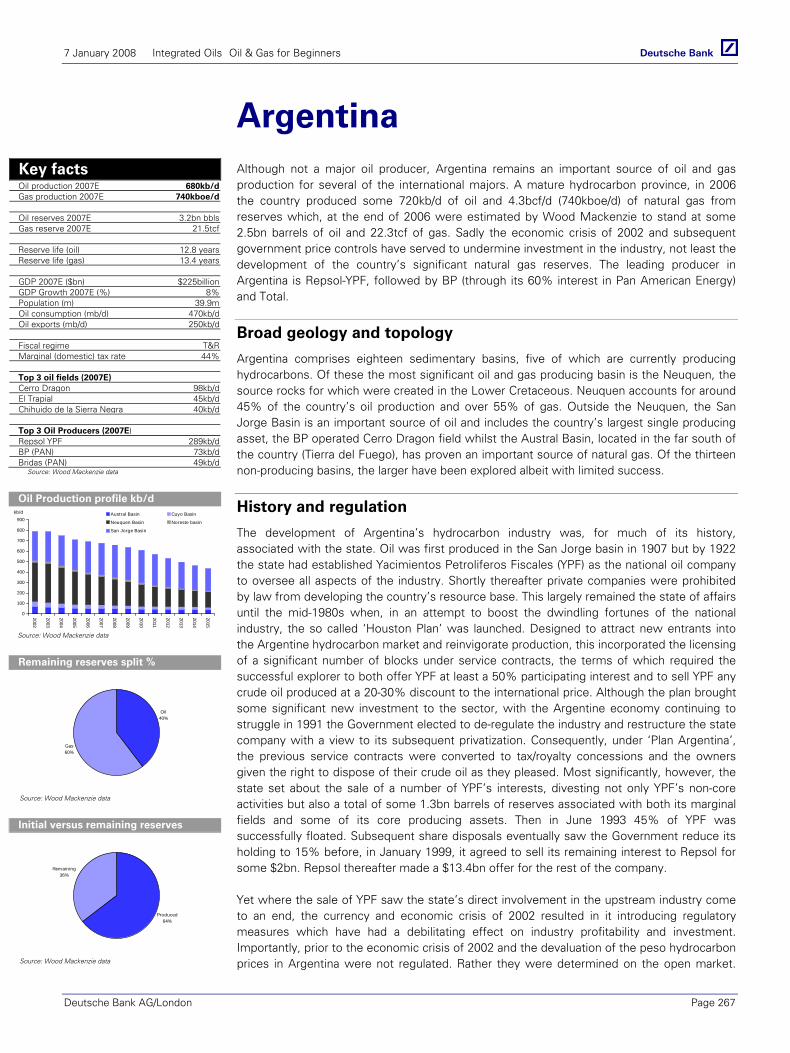
7 January 2008 Integrated Oils Oil & Gas for Beginners
Deutsche Bank AG/London Page 267
Argentina Although not a major oil producer, Argentina remains an important source of oil and gas production for several of the international majors. A mature hydrocarbon province, in 2006 the country produced some 720kb/d of oil and 4.3bcf/d (740kboe/d) of natural gas from reserves which, at the end of 2006 were estimated by Wood Mackenzie to stand at some 2.5bn barrels of oil and 22.3tcf of gas. Sadly the economic crisis of 2002 and subsequent government price controls have served to undermine investment in the industry, not least the development of the country’s significant natural gas reserves. The leading producer in Argentina is Repsol-YPF, followed by BP (through its 60% interest in Pan American Energy) and Total.
Broad geology and topology
Argentina comprises eighteen sedimentary basins, five of which are currently producing hydrocarbons. Of these the most significant oil and gas producing basin is the Neuquen, the source rocks for which were created in the Lower Cretaceous. Neuquen accounts for around 45% of the country’s oil production and over 55% of gas. Outside the Neuquen, the San Jorge Basin is an important source of oil and includes the country’s largest single producing asset, the BP operated Cerro Dragon field whilst the Austral Basin, located in the far south of the country (Tierra del Fuego), has proven an important source of natural gas. Of the thirteen non-producing basins, the larger have been explored albeit with limited success.
History and regulation
The development of Argentina’s hydrocarbon industry was, for much of its history, associated with the state. Oil was first produced in the San Jorge basin in 1907 but by 1922 the state had established Yacimientos Petroliferos Fiscales (YPF) as the national oil company to oversee all aspects of the industry. Shortly thereafter private companies were prohibited by law from developing the country’s resource base. This largely remained the state of affairs until the mid-1980s when, in an attempt to boost the dwindling fortunes of the national industry, the so called ‘Houston Plan’ was launched. Designed to attract new entrants into the Argentine hydrocarbon market and reinvigorate production, this incorporated the licensing of a significant number of blocks under service contracts, the terms of which required the successful explorer to both offer YPF at least a 50% participating interest and to sell YPF any crude oil produced at a 20-30% discount to the international price. Although the plan brought some significant new investment to the sector, with the Argentine economy continuing to struggle in 1991 the Government elected to de-regulate the industry and restructure the state company with a view to its subsequent privatization. Consequently, under ‘Plan Argentina’, the previous service contracts were converted to tax/royalty concessions and the owners given the right to dispose of their crude oil as they pleased. Most significantly, however, the state set about the sale of a number of YPF’s interests, divesting not only YPF’s non-core activities but also a total of some 1.3bn barrels of reserves associated with both its marginal fields and some of its core producing assets. Then in June 1993 45% of YPF was successfully floated. Subsequent share disposals eventually saw the Government reduce its holding to 15% before, in January 1999, it agreed to sell its remaining interest to Repsol for some $2bn. Repsol thereafter made a $13.4bn offer for the rest of the company.
Yet where the sale of YPF saw the state’s direct involvement in the upstream industry come to an end, the currency and economic crisis of 2002 resulted in it introducing regulatory measures which have had a debilitating effect on industry profitability and investment. Importantly, prior to the economic crisis of 2002 and the devaluation of the peso hydrocarbon prices in Argentina were not regulated. Rather they were determined on the open market.
Key facts Oil production 2007E 680kb/d Gas production 2007E 740kboe/d Oil reserves 2007E 3.2bn bbls Gas reserve 2007E 21.5tcf Reserve life (oil) 12.8 years Reserve life (gas) 13.4 years GDP 2007E ($bn) $225billion GDP Growth 2007E (%) 8% Population (m) 39.9m Oil consumption (mb/d) 470kb/d Oil exports (mb/d) 250kb/d Fiscal regime T&R Marginal (domestic) tax rate 44% Top 3 oil fields (2007E) Cerro Dragon 98kb/d El Trapial 45kb/d Chihuido de la Sierra Negra 40kb/d Top 3 Oil Producers (2007E) Repsol YPF 289kb/d BP (PAN) 73kb/d Bridas (PAN) 49kb/d Source: Wood Mackenzie data
Oil Production profile kb/d
0
100
200
300
400
500
600
700
800
900
2002
2003
2004
2005
2006
2007
2008
2009
2010
2011
2012
2013
2014
2015
Austral Basin Cuyo Basin
Neuquen Basin Noreste basin
San Jorge Basin
kb/d
Source: Wood Mackenzie data
Remaining reserves split %
Oil40%
Gas60%
Source: Wood Mackenzie data
Initial versus remaining reserves
Produced64%
Remaining36%
Source: Wood Mackenzie data

7 January 2008 Integrated Oils Oil & Gas for Beginners
Page 268 Deutsche Bank AG/London
However, with the value of the peso collapsing against the US$ and energy prices effectively spiralling out of control, in March 2002 the Government introduced an export tax on crude oil. Initially set at 20% the rate was subsequently raised in 2004 to a maximum of 45%. Most significant, however, has been the government’s regulation of domestic gas prices with the previous $-based, market determined price frozen at its March 2002, pre-devaluation, peso equivalent. For the producers this effectively implied a 65% price cut, the price of gas at the well-head effectively falling to the equivalent of c.$0.40/mscf. Although in 2004 the government and industry agreed to implement staged price increases (the government at the same time introducing a 20% export tax on gas) progress to date has been slow in the extreme. Moreover, as demand from the economy for lowly priced gas has increased but domestic gas production struggled to make progress, Argentina has moved from a position of gas self sufficiency to one bordering on import dependence. Export contracts with Chile have been curtailed and contracts for the supply of gas from Bolivia extended. Perhaps ironically, at $5.00/mmbtu these require Argentina to pay almost ten times the amount it pays its own producers for gas supplied into the residential market at this time.
Figure 347: The location of Argentina’s major fields and oil infrastructure
Source: Wood Mackenzie; Deutsche Bank
Licensing
At present the upstream sector in Argentina is regulated at the federal level by the State Secretariat for Energy. A new Hydrocarbon Law which will almost certainly give the provincial authorities greater powers is, however, under development. This follows initiatives
Noroeste Gas basin
Cuyo basin (modest oil
province)
Argentina’s key Neuquen
Basin and Repsol-YPF’s
Loma la Lata gas field
San Jorge Oil Basin with the
largest oil asset Pan
American’s ‘Cerro Dragon’
field
Austral Basin – Tierra del
Fuego assets
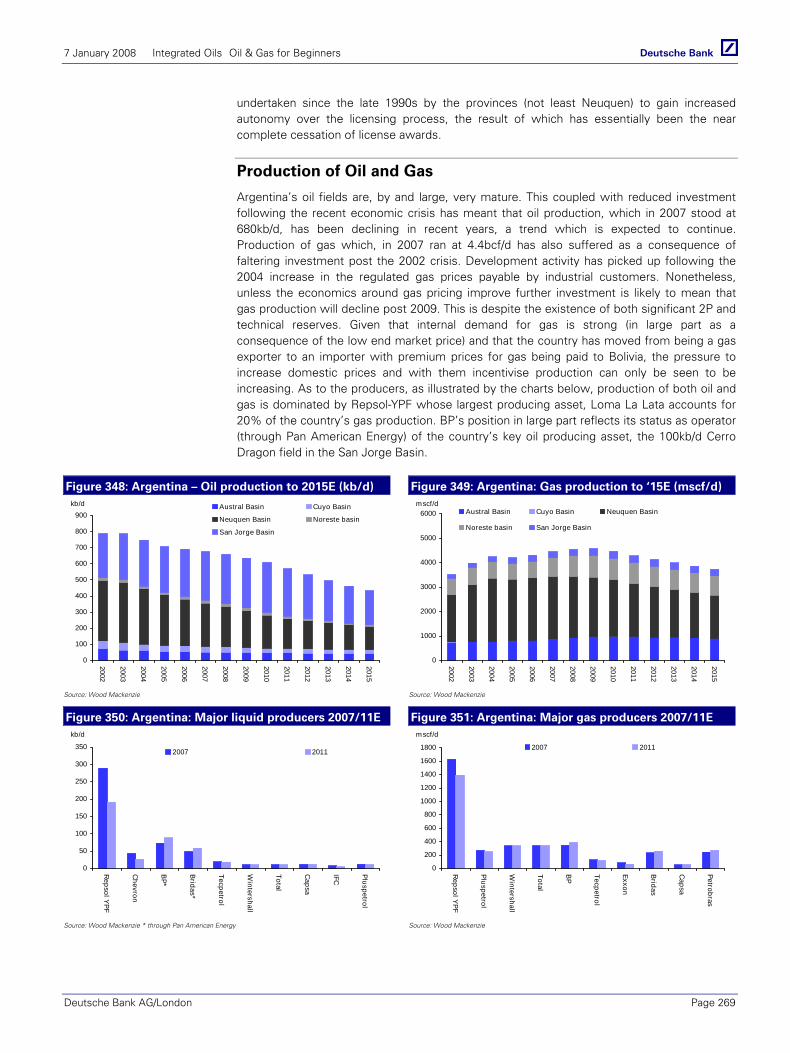
7 January 2008 Integrated Oils Oil & Gas for Beginners
Deutsche Bank AG/London Page 269
undertaken since the late 1990s by the provinces (not least Neuquen) to gain increased autonomy over the licensing process, the result of which has essentially been the near complete cessation of license awards.
Production of Oil and Gas
Argentina’s oil fields are, by and large, very mature. This coupled with reduced investment following the recent economic crisis has meant that oil production, which in 2007 stood at 680kb/d, has been declining in recent years, a trend which is expected to continue. Production of gas which, in 2007 ran at 4.4bcf/d has also suffered as a consequence of faltering investment post the 2002 crisis. Development activity has picked up following the 2004 increase in the regulated gas prices payable by industrial customers. Nonetheless, unless the economics around gas pricing improve further investment is likely to mean that gas production will decline post 2009. This is despite the existence of both significant 2P and technical reserves. Given that internal demand for gas is strong (in large part as a consequence of the low end market price) and that the country has moved from being a gas exporter to an importer with premium prices for gas being paid to Bolivia, the pressure to increase domestic prices and with them incentivise production can only be seen to be increasing. As to the producers, as illustrated by the charts below, production of both oil and gas is dominated by Repsol-YPF whose largest producing asset, Loma La Lata accounts for 20% of the country’s gas production. BP’s position in large part reflects its status as operator (through Pan American Energy) of the country’s key oil producing asset, the 100kb/d Cerro Dragon field in the San Jorge Basin.
Figure 348: Argentina – Oil production to 2015E (kb/d) Figure 349: Argentina: Gas production to ‘15E (mscf/d)
0
100
200
300
400
500
600
700
800
900
2002
2003
2004
2005
2006
2007
2008
2009
2010
2011
2012
2013
2014
2015
Austral Basin Cuyo Basin
Neuquen Basin Noreste basin
San Jorge Basin
kb/d
0
1000
2000
3000
4000
5000
6000
2002
2003
2004
2005
2006
2007
2008
2009
2010
2011
2012
2013
2014
2015
Austral Basin Cuyo Basin Neuquen Basin
Noreste basin San Jorge Basin
mscf/d
Source: Wood Mackenzie Source: Wood Mackenzie
Figure 350: Argentina: Major liquid producers 2007/11E Figure 351: Argentina: Major gas producers 2007/11E
0
50
100
150
200
250
300
350
Repsol Y
PF
Chevron
BP*
Bridas*
Tecpetrol
Wintershall
Total
Capsa
IFC
Pluspetrol
2007 2011
kb/d
0
200
400
600
800
1000
1200
1400
1600
1800
Repsol Y
PF
Pluspetrol
Wintershall
Total
BP
Tecpetrol
Exxon
Bridas
Capsa
Petrobras
2007 2011
mscf/d
Source: Wood Mackenzie * through Pan American Energy Source: Wood Mackenzie
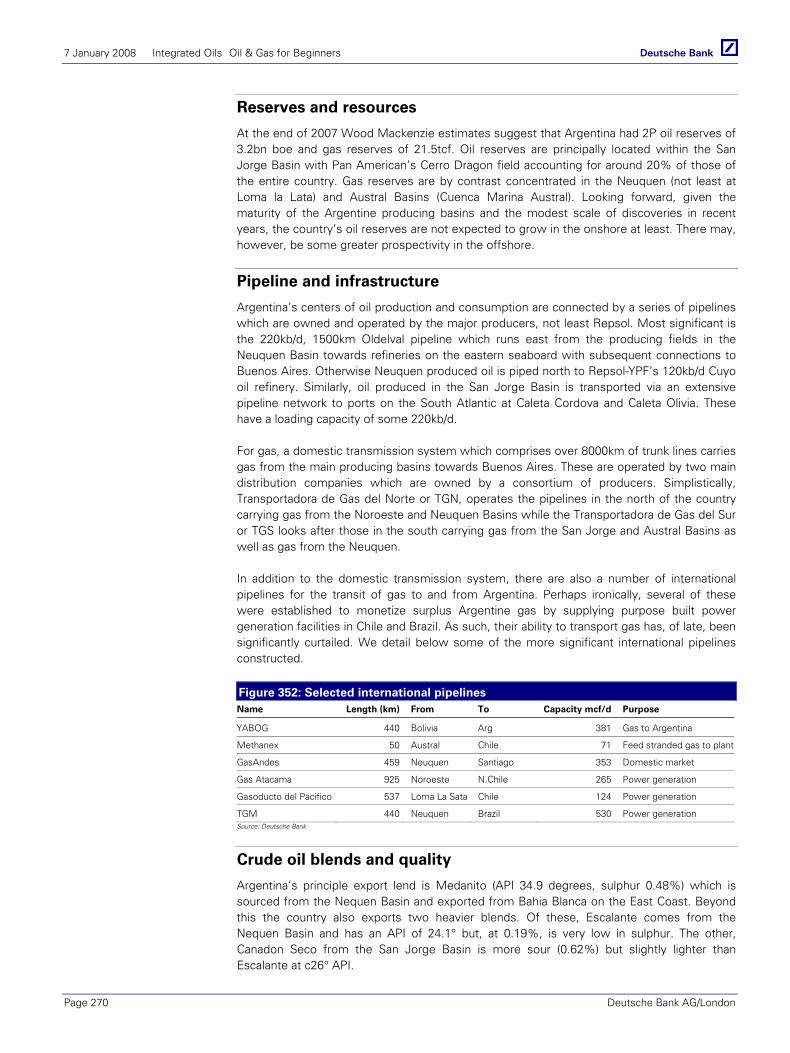
7 January 2008 Integrated Oils Oil & Gas for Beginners
Page 270 Deutsche Bank AG/London
Reserves and resources
At the end of 2007 Wood Mackenzie estimates suggest that Argentina had 2P oil reserves of 3.2bn boe and gas reserves of 21.5tcf. Oil reserves are principally located within the San Jorge Basin with Pan American’s Cerro Dragon field accounting for around 20% of those of the entire country. Gas reserves are by contrast concentrated in the Neuquen (not least at Loma la Lata) and Austral Basins (Cuenca Marina Austral). Looking forward, given the maturity of the Argentine producing basins and the modest scale of discoveries in recent years, the country’s oil reserves are not expected to grow in the onshore at least. There may, however, be some greater prospectivity in the offshore.
Pipeline and infrastructure
Argentina’s centers of oil production and consumption are connected by a series of pipelines which are owned and operated by the major producers, not least Repsol. Most significant is the 220kb/d, 1500km Oldelval pipeline which runs east from the producing fields in the Neuquen Basin towards refineries on the eastern seaboard with subsequent connections to Buenos Aires. Otherwise Neuquen produced oil is piped north to Repsol-YPF’s 120kb/d Cuyo oil refinery. Similarly, oil produced in the San Jorge Basin is transported via an extensive pipeline network to ports on the South Atlantic at Caleta Cordova and Caleta Olivia. These have a loading capacity of some 220kb/d.
For gas, a domestic transmission system which comprises over 8000km of trunk lines carries gas from the main producing basins towards Buenos Aires. These are operated by two main distribution companies which are owned by a consortium of producers. Simplistically, Transportadora de Gas del Norte or TGN, operates the pipelines in the north of the country carrying gas from the Noroeste and Neuquen Basins while the Transportadora de Gas del Sur or TGS looks after those in the south carrying gas from the San Jorge and Austral Basins as well as gas from the Neuquen.
In addition to the domestic transmission system, there are also a number of international pipelines for the transit of gas to and from Argentina. Perhaps ironically, several of these were established to monetize surplus Argentine gas by supplying purpose built power generation facilities in Chile and Brazil. As such, their ability to transport gas has, of late, been significantly curtailed. We detail below some of the more significant international pipelines constructed.
Figure 352: Selected international pipelines Name Length (km) From To Capacity mcf/d Purpose
YABOG 440 Bolivia Arg 381 Gas to Argentina
Methanex 50 Austral Chile 71 Feed stranded gas to plant
GasAndes 459 Neuquen Santiago 353 Domestic market
Gas Atacama 925 Noroeste N.Chile 265 Power generation
Gasoducto del Pacifico 537 Loma La Sata Chile 124 Power generation
TGM 440 Neuquen Brazil 530 Power generation Source: Deutsche Bank
Crude oil blends and quality
Argentina’s principle export lend is Medanito (API 34.9 degrees, sulphur 0.48%) which is sourced from the Nequen Basin and exported from Bahia Blanca on the East Coast. Beyond this the country also exports two heavier blends. Of these, Escalante comes from the Nequen Basin and has an API of 24.1° but, at 0.19%, is very low in sulphur. The other, Canadon Seco from the San Jorge Basin is more sour (0.62%) but slightly lighter than Escalante at c26° API.
7 January 2008 Integrated Oils Oil & Gas for Beginners
Deutsche Bank AG/London Page 271
Broad fiscal terms
Following the introduction of ‘Plan Argentina’ in 1991, Argentina moved to a tax & royalty regime. Historically, the fiscal system was relatively generous. Key fiscal components included the payment of a tax deductible royalty on the wellhead value of the hydrocarbons produced, typically at 12%, provincial sales tax of 1-2% on hydrocarbons sold in the domestic market and profit tax at 35% (after deduction of royalty and provincial tax). As such, the marginal tax rate ran at roughly 44%. However, following the economic crisis of 2002 the government introduced an additional 20% ‘Export Tax’ on crude oil exports for a period of five years. Subsequently increased, the export tax now works on a sliding scale with 25% payable when the price of the WTI marker is below $32/bbl but a maximum of 45% paid when the WTI price is above $45/bbl. Separately, since May 2004 an Export Tax of 20% has been payable on gas exports. At current oil prices, the marginal tax rate on crude oil exports is thus around 74%. Although both Export Taxes were only intended to run until 2007 there is very little expectation of their being rescinded.
Refining
According to the Oil & Gas Journal Argentina’s ten refineries have 625kb/d of refining capacity compared with a demand for product from the domestic market of some 470kb/d of crude oil. Utilization is consequently relatively low at around 75-80% with the simplicity of the industry’s configuration limiting its ability to export product. Most of the capacity is located near Buenos Aires. Repsol-YPF dominates the sector through ownership of three refineries with a total capacity of c330kb/d, most significantly the 190kb/d La Plata refinery located near the capital. Shell (Dock Sud 110kb/d) and Exxon (Campana 85kb/d) also operate refineries which again are located near Buenos Aires.
It should be noted that Argentina effectively control’s product prices at the retail pump a feature which again significantly limits the profitability of the domestic oil market.
LNG
At the present time Argentina has no LNG facilities either for the export of or, more likely, the import of gas.

7 January 2008 Integrated Oils Oil & Gas for Beginners
Page 272 Deutsche Bank AG/London
Argentina - Notes
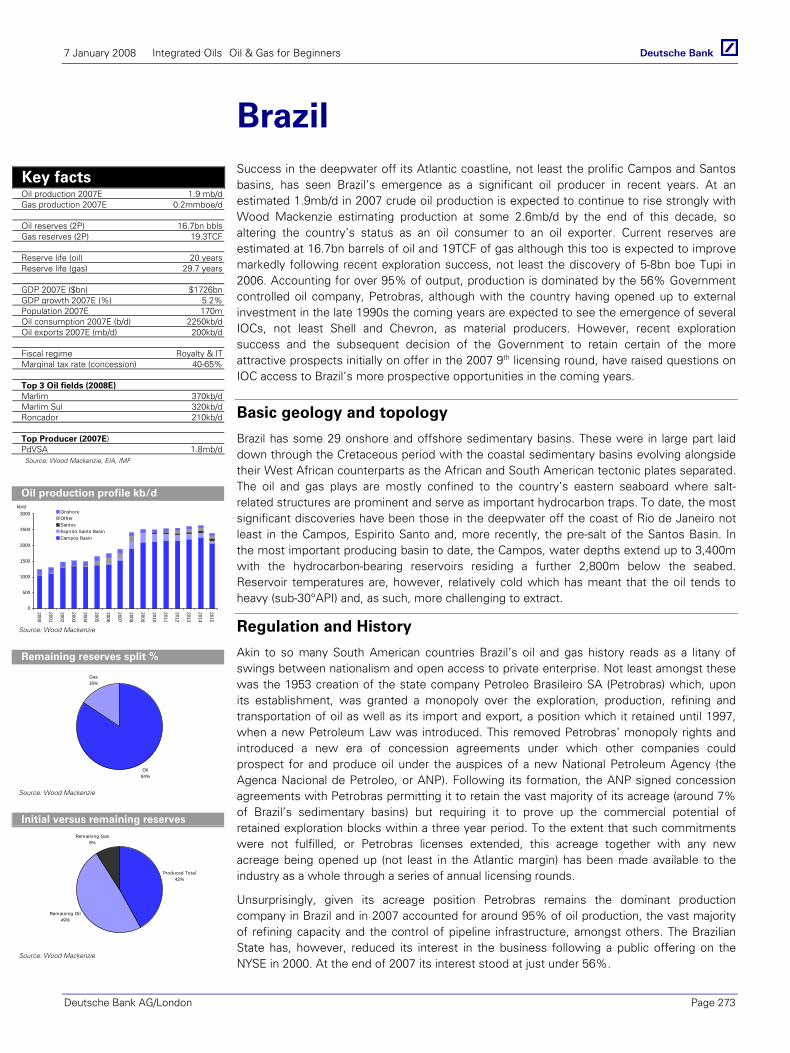
7 January 2008 Integrated Oils Oil & Gas for Beginners
Deutsche Bank AG/London Page 273
Brazil Success in the deepwater off its Atlantic coastline, not least the prolific Campos and Santos basins, has seen Brazil’s emergence as a significant oil producer in recent years. At an estimated 1.9mb/d in 2007 crude oil production is expected to continue to rise strongly with Wood Mackenzie estimating production at some 2.6mb/d by the end of this decade, so altering the country’s status as an oil consumer to an oil exporter. Current reserves are estimated at 16.7bn barrels of oil and 19TCF of gas although this too is expected to improve markedly following recent exploration success, not least the discovery of 5-8bn boe Tupi in 2006. Accounting for over 95% of output, production is dominated by the 56% Government controlled oil company, Petrobras, although with the country having opened up to external investment in the late 1990s the coming years are expected to see the emergence of several IOCs, not least Shell and Chevron, as material producers. However, recent exploration success and the subsequent decision of the Government to retain certain of the more attractive prospects initially on offer in the 2007 9th licensing round, have raised questions on IOC access to Brazil’s more prospective opportunities in the coming years.
Basic geology and topology
Brazil has some 29 onshore and offshore sedimentary basins. These were in large part laid down through the Cretaceous period with the coastal sedimentary basins evolving alongside their West African counterparts as the African and South American tectonic plates separated. The oil and gas plays are mostly confined to the country’s eastern seaboard where salt-related structures are prominent and serve as important hydrocarbon traps. To date, the most significant discoveries have been those in the deepwater off the coast of Rio de Janeiro not least in the Campos, Espirito Santo and, more recently, the pre-salt of the Santos Basin. In the most important producing basin to date, the Campos, water depths extend up to 3,400m with the hydrocarbon-bearing reservoirs residing a further 2,800m below the seabed. Reservoir temperatures are, however, relatively cold which has meant that the oil tends to heavy (sub-30°API) and, as such, more challenging to extract.
Regulation and History
Akin to so many South American countries Brazil’s oil and gas history reads as a litany of swings between nationalism and open access to private enterprise. Not least amongst these was the 1953 creation of the state company Petroleo Brasileiro SA (Petrobras) which, upon its establishment, was granted a monopoly over the exploration, production, refining and transportation of oil as well as its import and export, a position which it retained until 1997, when a new Petroleum Law was introduced. This removed Petrobras’ monopoly rights and introduced a new era of concession agreements under which other companies could prospect for and produce oil under the auspices of a new National Petroleum Agency (the Agenca Nacional de Petroleo, or ANP). Following its formation, the ANP signed concession agreements with Petrobras permitting it to retain the vast majority of its acreage (around 7% of Brazil’s sedimentary basins) but requiring it to prove up the commercial potential of retained exploration blocks within a three year period. To the extent that such commitments were not fulfilled, or Petrobras licenses extended, this acreage together with any new acreage being opened up (not least in the Atlantic margin) has been made available to the industry as a whole through a series of annual licensing rounds.
Unsurprisingly, given its acreage position Petrobras remains the dominant production company in Brazil and in 2007 accounted for around 95% of oil production, the vast majority of refining capacity and the control of pipeline infrastructure, amongst others. The Brazilian State has, however, reduced its interest in the business following a public offering on the NYSE in 2000. At the end of 2007 its interest stood at just under 56%.
Key facts Oil production 2007E 1.9 mb/d Gas production 2007E 0.2mmboe/d Oil reserves (2P) 16.7bn bbls Gas reserves (2P) 19.3TCF Reserve life (oil) 20 years Reserve life (gas) 29.7 years GDP 2007E ($bn) $1726bn GDP growth 2007E (%) 5.2% Population 2007E 170m Oil consumption 2007E (b/d) 2250kb/d Oil exports 2007E (mb/d) 200kb/d Fiscal regime Royalty & IT Marginal tax rate (concession) 40-65% Top 3 Oil fields (2008E) Marlim 370kb/d Marlim Sul 320kb/d Roncador 210kb/d Top Producer (2007E) PdVSA 1.8mb/d Source: Wood Mackenzie, EIA, IMF
Oil production profile kb/d
0
500
1000
1500
2000
2500
3000
2000
2001
2002
2003
2004
2005
2006
2007
2008
2009
2010
2011
2012
2013
2014
2015
OnshoreOtherSantosEspirito Santo BasinCampos Basin
kb/d
Source: Wood Mackenzie
Remaining reserves split %
Oil84%
Gas16%
Source: Wood Mackenzie
Initial versus remaining reserves
Produced Total42%
Remaining Oil49%
Remaining Gas9%
Source: Wood Mackenzie
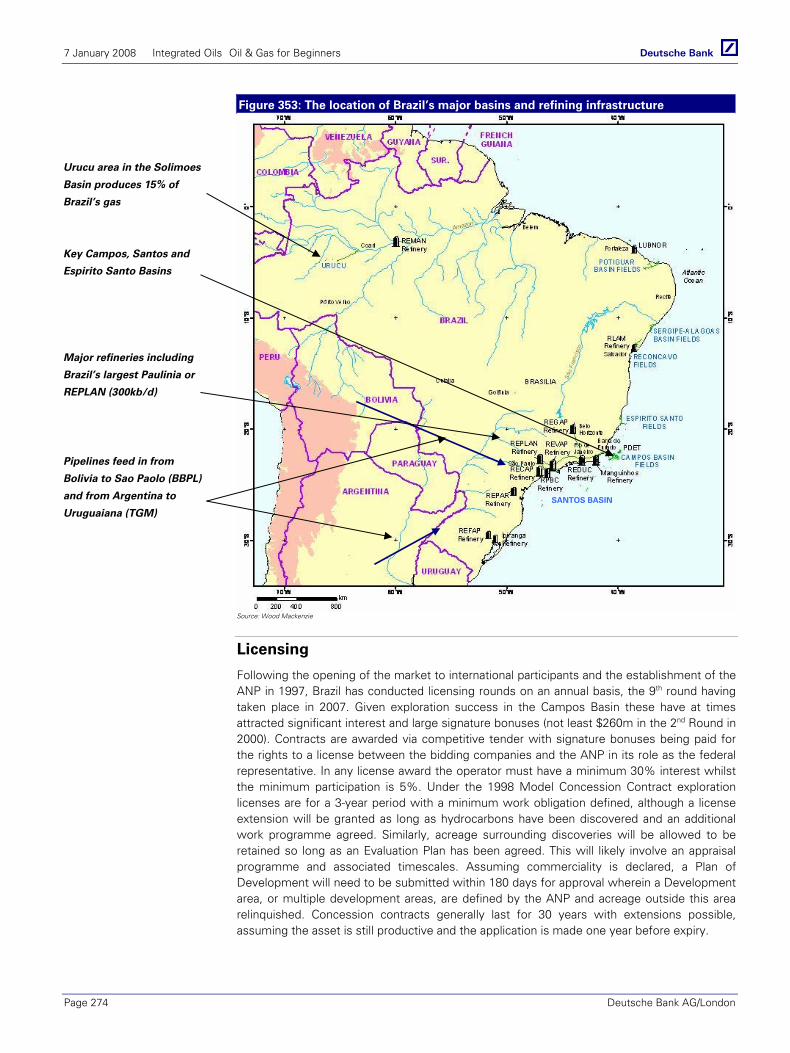
7 January 2008 Integrated Oils Oil & Gas for Beginners
Page 274 Deutsche Bank AG/London
Figure 353: The location of Brazil’s major basins and refining infrastructure
Source: Wood Mackenzie
Licensing
Following the opening of the market to international participants and the establishment of the ANP in 1997, Brazil has conducted licensing rounds on an annual basis, the 9th round having taken place in 2007. Given exploration success in the Campos Basin these have at times attracted significant interest and large signature bonuses (not least $260m in the 2nd Round in 2000). Contracts are awarded via competitive tender with signature bonuses being paid for the rights to a license between the bidding companies and the ANP in its role as the federal representative. In any license award the operator must have a minimum 30% interest whilst the minimum participation is 5%. Under the 1998 Model Concession Contract exploration licenses are for a 3-year period with a minimum work obligation defined, although a license extension will be granted as long as hydrocarbons have been discovered and an additional work programme agreed. Similarly, acreage surrounding discoveries will be allowed to be retained so long as an Evaluation Plan has been agreed. This will likely involve an appraisal programme and associated timescales. Assuming commerciality is declared, a Plan of Development will need to be submitted within 180 days for approval wherein a Development area, or multiple development areas, are defined by the ANP and acreage outside this area relinquished. Concession contracts generally last for 30 years with extensions possible, assuming the asset is still productive and the application is made one year before expiry.
Urucu area in the Solimoes
Basin produces 15% of
Brazil’s gas
Key Campos, Santos and
Espirito Santo Basins
Major refineries including
Brazil’s largest Paulinia or
REPLAN (300kb/d)
Pipelines feed in from
Bolivia to Sao Paolo (BBPL)
and from Argentina to
Uruguaiana (TGM) SANTOS BASIN
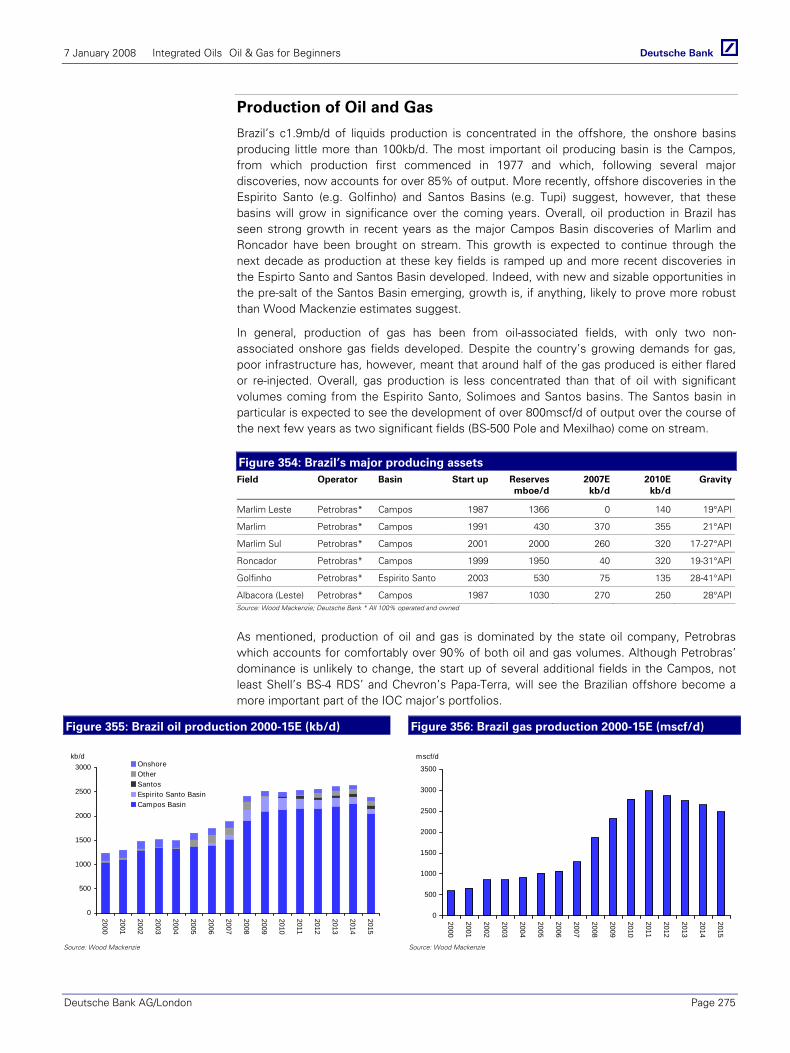
7 January 2008 Integrated Oils Oil & Gas for Beginners
Deutsche Bank AG/London Page 275
Production of Oil and Gas
Brazil’s c1.9mb/d of liquids production is concentrated in the offshore, the onshore basins producing little more than 100kb/d. The most important oil producing basin is the Campos, from which production first commenced in 1977 and which, following several major discoveries, now accounts for over 85% of output. More recently, offshore discoveries in the Espirito Santo (e.g. Golfinho) and Santos Basins (e.g. Tupi) suggest, however, that these basins will grow in significance over the coming years. Overall, oil production in Brazil has seen strong growth in recent years as the major Campos Basin discoveries of Marlim and Roncador have been brought on stream. This growth is expected to continue through the next decade as production at these key fields is ramped up and more recent discoveries in the Espirto Santo and Santos Basin developed. Indeed, with new and sizable opportunities in the pre-salt of the Santos Basin emerging, growth is, if anything, likely to prove more robust than Wood Mackenzie estimates suggest.
In general, production of gas has been from oil-associated fields, with only two non-associated onshore gas fields developed. Despite the country’s growing demands for gas, poor infrastructure has, however, meant that around half of the gas produced is either flared or re-injected. Overall, gas production is less concentrated than that of oil with significant volumes coming from the Espirito Santo, Solimoes and Santos basins. The Santos basin in particular is expected to see the development of over 800mscf/d of output over the course of the next few years as two significant fields (BS-500 Pole and Mexilhao) come on stream.
Figure 354: Brazil’s major producing assets Field Operator Basin Start up Reserves
mboe/d2007E
kb/d 2010E kb/d
Gravity
Marlim Leste Petrobras* Campos 1987 1366 0 140 19°API
Marlim Petrobras* Campos 1991 430 370 355 21°API
Marlim Sul Petrobras* Campos 2001 2000 260 320 17-27°API
Roncador Petrobras* Campos 1999 1950 40 320 19-31°API
Golfinho Petrobras* Espirito Santo 2003 530 75 135 28-41°API
Albacora (Leste) Petrobras* Campos 1987 1030 270 250 28°APISource: Wood Mackenzie; Deutsche Bank * All 100% operated and owned
As mentioned, production of oil and gas is dominated by the state oil company, Petrobras which accounts for comfortably over 90% of both oil and gas volumes. Although Petrobras’ dominance is unlikely to change, the start up of several additional fields in the Campos, not least Shell’s BS-4 RDS’ and Chevron’s Papa-Terra, will see the Brazilian offshore become a more important part of the IOC major’s portfolios.
Figure 355: Brazil oil production 2000-15E (kb/d) Figure 356: Brazil gas production 2000-15E (mscf/d)
0
500
1000
1500
2000
2500
3000
2000
2001
2002
2003
2004
2005
2006
2007
2008
2009
2010
2011
2012
2013
2014
2015
OnshoreOtherSantosEspirito Santo BasinCampos Basin
kb/d
0
500
1000
1500
2000
2500
3000
3500
2000
2001
2002
2003
2004
2005
2006
2007
2008
2009
2010
2011
2012
2013
2014
2015
mscf/d
Source: Wood Mackenzie Source: Wood Mackenzie

7 January 2008 Integrated Oils Oil & Gas for Beginners
Page 276 Deutsche Bank AG/London
Figure 357: Brazil: Major hydrocarbon producers
2007/11E excluding Petrobras
Figure 358: Petrobras: Hydrocarbon production in Brazil
2007-11E
0
10
20
30
40
50
60
70
Shell
Anadarko
Statoil
Chevron
Queiroz
ON
GC
Repsol
INPEX
El Paso
Norse
Devon
2007 2011
kboe/d
0
500
1000
1500
2000
2500
3000
2007 2008 2009 2010 2011
Oil Gaskboe/d
Source: Wood Mackenzie, Source: Wood Mackenzie
Reserves and Resources
At the end of 2007 Wood Mackenzie estimates suggest that Brazil had 2P reserves of 16.7bn barrels and 19TCF of natural gas. At least 80% of these are concentrated in the deepwater of the Campos basin and, as such, are relatively heavy given a typical sub 30°API. Following Petrobras’ 2007 announcement of a potential 5-8 billion barrels of recoverable reserves at Tupi in the Santos basin (Petrobras 65%, BG Group 25%, GALP 10%) we would expect reserves growth in the coming years in Brazil to be substantial although the technical challenges associated with commercializing these are likely to be significant.
Pipelines and Infrastructure
The deepwater bias of Brazilian oil production has meant that most of its production is associated with FPSOs. Pipeline infrastructure is, as a consequence, relatively limited with production tending to be tanker loaded and shipped directly to coastal terminals and refineries located around the major conurbations of Rio and Sao Paolo. In the Campos Basin two oil pipelines carrying oil to shore are in place although capacity is relatively limited. Otherwise, pipeline systems do connect the remote onshore basins with the major centres of demand (production is, however, modest). Similarly, gas infrastructure is under developed, covering mainly the urban centers of Rio and Sao Paolo. Recent years have, however, seen investment in two major international pipelines, the 1200mscf/d Bolivia to Brazil pipeline (BBPL) and the Transportadora de Gas del Mercosur (TGM) pipeline carrying gas from the Nequen province in Argentina to a 600MW power station in southern Brazil at Uruguaiana.
Crude Oil Blends and Quality
Brazil’s continuing import dependence and Government policies designed to contain exports have meant that, to date, the export of crude oil has been limited to that quantity of heavy oil that the country’s internal refining system was unable to process. The main crude stream is Marlim, from the field of the same name, which is a sweet (<1%), heavy (20°API) crude. With production of oil now expanding beyond the capacity of the country’s refining system and, indeed, its internal needs, exports are expected to increase significantly.
Broad Fiscal Terms
Brazil operates on the basis of tax and royalty concessions with no obligatory state participation in project equity. Federal tax is collected through three particular means namely royalty; special participation tax (SPT); and corporation tax (CT). Of these royalty, is typically 10% of gross revenue (but can be less dependent upon agreement with the ANP), while CT
7 January 2008 Integrated Oils Oil & Gas for Beginners
Deutsche Bank AG/London Page 277
stands at 34% and is calculated after the deduction of royalty, SPT and capital allowances (which run on a less than generous 10-20 year asset life schedule).
Dependent upon the scale of the producing asset, Special Participation Tax (SPT) can be a far more meaningful component of tax take. Chargeable on a sliding scale in accordance with an ANP defined production schedule, the rate depends upon the location of the field (onshore, offshore and depth), the rate of production (0-60kb, 61-90kb/d, 91-120kb/d, etc) and the year of production (lower tax in year one and full rates by year four). Because most of Brazil’s fields are relatively modest (i.e. under 50kb/d) SPT tends to be low (sub 10%). However, on the larger fields the rate of SPT on production over 140kb/d can run at 40% (albeit that, as a staged tax, the rate of the production between 0 and 140kb/d will be taxed at a lower level thereby reducing the average SPT rate). Importantly, SPT is struck after all costs, including depreciation, but before corporation tax.
Federal taxes aside, there are also several indirect taxes. These are typically levied on the cost of capital equipment and services and, taken together, can add significantly to that cost, much to the detraction of project economics. Of the numerous taxes that exist the most significant are the Imposto de Importacao or II which, at 11-18%, is an import tax levied on the value of externally sourced equipment and state value added tax (ICMS) which, at around 18% is levied on the value of all goods and services bought (although this can be recouped further down the value chain as ICMS is subsequently charged by the enterprise for the oil that it sells in the domestic market).
Refining and Downstream markets
Brazil is estimated to have around 1.9mb/d of refining capacity spread across 13 refineries of which 8 are located close to the major centres of demand and production in Rio de Janeiro and Sao Paolo. Of these 11 are operated by Petrobras, with Repsol the only international major with any kind of material presence. In line with the country’s ‘Refining Plan’ which seeks to minimize oil product exports, capacity expansions are strictly controlled although in September 2005 Petrobras and Venezuela’s PDVSA announced plans to build a new 200kb/d refinery which would be capable of processing heavy oil sourced from each country. In part this addition of capacity reflects one of the challenges that the Brazilian refining sector has faced of late, namely its inability to process the volumes of heavy oil sourced from the Campos Basin. Of the 13 refineries, over 60% of capacity is associated with the county’s five largest facilities not least the 305kb/d Paulina facility located near Sao Paolo.
Figure 359: Brazilian Refineries with over 200kb/d of capacity Name Location Nominal Capacity Operator
Paulinia (REPLAN) Sao Paolo 305kb/d Petrobras
Landulpho Alves (RLAM) Bahia 284kb/d Petrobras
Duque de Caixas (REDUC) Rio de Janeiro 222kb/d Petrobras
Henrique Laje Refinery (REVAP) Sao Paolo 210kb/d Petrobras Source: Deutsche Bank
LNG
Despite its significant reserves, as an importer of natural gas at this time Brazil has sought to diversify its current dependence for gas on other LatAm states. Consequently, in 2007 Petrobras commissioned the construction of two floating re-gasification and storage units. Designed to provide a combined 670mscf/d of gas send out capacity these are expected to come onstream in 2008/9 with the larger (450mscf/d) moored off the coast of Rio and the second further north at Fortaleza suggesting Brazil will, in future, become a further delivery point for Atlantic Basin trade. As yet, contracts for committed supply have not been signed.

7 January 2008 Integrated Oils Oil & Gas for Beginners
Page 278 Deutsche Bank AG/London
Brazil - Notes

7 January 2008 Integrated Oils Oil & Gas for Beginners
Deutsche Bank AG/London Page 279
Major OPEC Producers
Angola
Iran
Iraq
Kuwait
Libya
Nigeria
Saudi Arabia
UAE
Venezuela

7 January 2008 Integrated Oils Oil & Gas for Beginners
Page 280 Deutsche Bank AG/London
Major OPEC - Notes

7 January 2008 Integrated Oils Oil & Gas for Beginners
Deutsche Bank AG/London Page 281
Angola Although Angola’s admission to OPEC membership in 2007 with a 1.9mb/d production quota has raised some uncertainties over the future pace of its development as a major oil producer, the successful discovery in the deepwater of over 12 billion barrels suggests an outlook of continued strong production growth over the medium term. Complemented by ongoing production of around 350kb/d from the Chevron-operated shallow waters of the Cabinda enclave to the north of the country, developments in a host of deepwater blocks not least by Exxon in Block 15, Total in Block 17 and BP in Block’s 18 and ultra-deep 31 offer the potential for some 2.4mb/d of crude oil production by 2012. This will be complimented by the planned 2012 start up of the country’s first LNG facility, to be operated by Chevron with nameplate capacity of some 5.2mtpa. Key producers include Exxon, Total, BP and Chevron together with the state oil company, Sonangol.
Basic geology and topology
The evolution of Angola’s coastal basins stems from the separation of the African and South American tectonic plates through the Early Cretaceous period. This separation saw the establishment of several major salt basins on Africa’s Atlantic margin of which Angola straddles three, namely the Congo, the Kwanza and the, yet to be explored, Namibe. Key to current production is the Congo Basin which contains the entire Cabinda enclave as well as deepwater blocks 14-18 which lie in water depths of 1200-1500m. To date, discoveries and production from the largely onshore Kwanza Basin have been relatively modest.
Regulation and History
Oil was first noticed in certain parts of Angola as long ago as the 18th century. However, it was not until the late 1950s that discoveries demonstrated Angola’s commercial potential both onshore and in the shallow waters of the Cabinda enclave. Following the award of a concession license by the, then Portuguese authorities to the Cabinda Gulf Oil Company or CABGOG (today Chevron), the still ongoing extraction of Cabinda’s estimated 5 billion barrels of recoverable reserves was to prove the mainstay of Angolan production for the better part of the next four decades.
Yet perhaps ironically, it was Angola’s independence from Portugal in 1975 and its ensuing civil war that helped spur greater interest in the exploration of the country’s offshore basins. With onshore exploration severely curtailed in the face of the onshore hostilities, the new state oil company Sociedade Nacional de Cobustiveis de Angola (Sonangol) looked towards opportunities on the country’s Atlantic coastline as it sought to encourage exploration interest from the international oil companies. Offshore activity pushed ahead as Sonangol licensed sizeable tracts of acreage, first in Angola’s shallow waters to the south of Cabinda in 1980 and then in the deeper waters some 100km offshore a decade later. Importantly, it is the exploration success in the deepwater that has been central to Angola’s growth as an oil exporting nation. In total, discoveries to date in the offshore have delivered over 12 billion barrels of recoverable reserves, not least those in Exxon-operated Block 15 (3bn barrels) and Total-operated Block 17 (c4bn barrels).
In early 2007 OPEC announced that it had accepted Angola’s application to join OPEC and in January 2008 the country became a full member with its initial production quota set at some 1.9mb/d. Whether this serves to contain Angola’s planned production growth will clearly depend upon many factors, not least the extent to which global oil demand continues to expand. It does, however, add a greater element of uncertainty to the timing of several investments, the start-up of which are presently expected by Wood Mackenzie to see the country’s production rise to nearer 2.4mb/d by 2012.
Key facts Oil production 2007E 1.8 mb/d Gas production 2007E mmboe/d Oil reserves 2007E 10.9bn bbls Gas reserves 2007E 4TCF Reserve life (oil) 15.5years Reserve life (gas) n.a. GDP 2007E ($bn) $44bn GDP growth 2007E (%) 15.1% Population 2007E 170m Oil consumption 2007E (b/d) 62kb/d Oil exports 2007E (mb/d) 1800kb/d Fiscal regime Mixed Marginal tax rate (concession) 72.5% Top 3 Oil fields (2008E) Girassol 250kb/d Kizomba A 250kb/d Kizomba B 250kb/d Top Producers (2007E) Sonangol 228kb/d Chevron 195kb/d Total 178kb/d Source: Wood Mackenzie, EIA, IMF
Oil production profile kb/d
0
500
1000
1500
2000
2500
3000
2000
2001
2002
2003
2004
2005
2006
2007
2008
2009
2010
2011
2012
2013
2014
2015
Ultra deepwaterDeepwaterShallow offshore (Cabinda)Onshore
kb/d
Source: Wood Mackenzie
Remaining reserves split %
Oil94%
Gas6%
Source: Wood Mackenzie
Initial versus remaining reserves
Remaining oil64%Remaining gas
4%
Produced oil32%
Source: Wood Mackenzie

7 January 2008 Integrated Oils Oil & Gas for Beginners
Page 282 Deutsche Bank AG/London
Figure 360: The location of Angola’s major basins and refining infrastructure
Source: Wood Mackenzie; Deutsche Bank
Licensing
The principle laws relating to the licensing and production of hydrocarbons in Angola were laid down in 1978. These established the state oil company Sonangol and gave it exclusive rights to the country’s hydrocarbon resources as well as the authority to contract foreign companies to undertake work on its behalf. Initially, the offshore shelf areas in Angola’s shallow waters were sub-divided into 13 blocks of 4000km² each for licensing. This was followed in 1990 by the delineation of seventeen separate blocks, 14 thru 30, again of around
Key shallow water Cabinda
A&B concession areas
(Chevron operated)
Malongo terminal and
shipping point for Cabinda
production
Planned 5.2mtpa LNG
facility at Soyo
Key deepwater blocks 15
(Exxon) & 17 (Total)
Ultra-deepwater Blocks 31
(BP) and 32 (Total)

7 January 2008 Integrated Oils Oil & Gas for Beginners
Deutsche Bank AG/London Page 283
4,000 km² running along the whole of Angola’s deepwater shelf and in 1999 the creation of four ultra deepwater blocks (31-34) running to the west of blocks 15-18. Through various licensing rounds, the latest of which took place in 2006 when several relinquished territories in the shallow and deepwater were re-licensed, Sonangol has set in place a series of production sharing contracts for the exploration and production of oil. License awards depend upon the signature bonus offered, with Sonangol often taking an equity interest in the awarded Block. This interest will typically be carried through the exploration phase.
Production of Oil and Gas
In 2007 oil production in Angola was estimated at 1.8mb/d. This has the potential to expand aggressively with current plans for developments suggesting a production peak by 2012 of some 2.4mb/d, subject to OPEC quota restrictions. For 2008 Angola’s OPEC quota has been set at 1.9mb/d with the country’s official ability to drive growth therefore dependent upon the extent to which its quota sees expansion (assuming of course, Angola’s intent to comply). Evidenced below, the key producing Blocks are Exxon operated Block 15, the production from which is expected to peak at 630kb/d in 2009 and Total’s Block 17 (the so-called ‘Golden Block’) with peak production of 650kb/d in 2012. First production from BP’s ultra-deepwater Block 31 is anticipated in 2010 with that from Total’s Block 32 following in 2012.
Figure 361: Angolan oil production 2000-15E by Block
(kb/d)
Figure 362: Angolan oil production 2000-15E by location
(kb/d)
0
500
1000
1500
2000
2500
3000
2000
2001
2002
2003
2004
2005
2006
2007
2008
2009
2010
2011
2012
2013
2014
2015
Cabinda Block 14 Block 15 Block 17 Block 18
Block 31 Block 32 Onshore Other
kb/d
0
500
1000
1500
2000
2500
3000
2000
2001
2002
2003
2004
2005
2006
2007
2008
2009
2010
2011
2012
2013
2014
2015
Ultra deepwaterDeepwaterShallow offshore (Cabinda)Onshore
kb/d
Source: Wood Mackenzie Source: Wood Mackenzie
Figure 363: Angolan oil production 2000-15E by Block on
an entitlement basis (kb/d)
Figure 364: Angolan oil production 2000-15E by company
on a working interest basis (kb/d)
0
200
400
600
800
1000
1200
1400
1600
2000
2001
2002
2003
2004
2005
2006
2007
2008
2009
2010
2011
2012
2013
2014
2015
Sonangol Chevron Total Eni
BP ExxonMobil StatoilHydro
kb/d
0
500
1000
1500
2000
2500
3000
2000
2001
2002
2003
2004
2005
2006
2007
2008
2009
2010
2011
2012
2013
2014
2015
Sonangol Chevron Total Eni
BP ExxonMobil Norsk Hydro Other
kb/d
Source: Wood Mackenzie Source: Wood Mackenzie
Historically, Chevron’s dominance of the shallow water offshore Cabinda concession positioned it as Angola’s leading producer. Although the Cabinda concession remains a significant producer of crude (owned 39.2% Chevron, 10% Total, 9.8% ENI and 41% Sonangol), the success of Total, BP and Exxon in developing Angola’s deepwater is expected
7 January 2008 Integrated Oils Oil & Gas for Beginners
Page 284 Deutsche Bank AG/London
to see each of these generating over 400kb/d of working interest production by 2013. Note, however, that as a consequence of the PSC structure of Angola’s deepwater licenses, entitlement production will be significantly lower.
Crude oil aside, there is currently no production of sales gas in Angola. Following the 2012 planned start up of Angola LNG some 125mscf/d of sales gas is, however, expected to be processed for domestic markets.
Reserves and Resources
Remaining Angolan reserves of oil at the end of 2007 stood at an estimated 10.9bn barrels with some 85% of this associated with the deep and ultra-deepwater blocks 14, 15, 17, 18, 31 and 32. With considerable exploration work continuing, reserves growth is expected to be meaningful over the next several years. Although no sales gas is produced, Angola has estimated proven and probable reserves of high quality gas in its offshore licenses of around 10TCF, most of which is re-injected to aid oil recovery. Possible reserves are estimated at up to 26TCF.
Pipelines and Infrastructure
Oil and gas infrastructure in Angola is limited. In large part this reflects the offshore and deepwater bias of the country’s production which has resulted in most developments loading production directly onto tankers from FPSOs. Pipelines are, however, in place to carry shallow water Cabinda production to onshore terminals at Malongo for loading onto ships or internal transport by rail to Sonangol’s Luanda refinery.
At present there is no sales gas in Angola and all new oil developments in Angola are approved subject to the understanding that no gas will be flared but rather stored of re-injected for oil recovery. Sonangol intends, however, to develop a pipeline network such that gas can in future be supplied to the planned 5mtpa Angolan LNG facility (see later). Initially this will see the development of a pipeline in the shallow water Cabinda area near the proposed Soyo LNG site.
Crude Oil Blends and Quality
Several different blends of crude oil emerge from Angola reflecting its bias towards deepwater facilities which operate using an FPSO to load crude directly onto tanker for export. Most Angolan oil is light (c30°) and sweet (<1% sulphur) with the notable exceptions being crude from B17’s Dalia (23.7°API) and B14’s Kuito (c20°API). The most significant and well known blend is Cabinda which is a mix of all the crude produced in the offshore Cabinda A concession. This light sweet oil trades at a modest 2-3% discount to Brent
Broad Fiscal Terms
The tax structure applicable to production licenses in Angola varies depending upon whether the operated fields are in the shallow water Cabinda concession, to which tax and royalty terms apply, or the offshore which is subject to production sharing contracts or PSCs.
Cabinda (tax and royalty): Government take in the concession areas typically arises through three main sources. Royalty, which is charged at 20% on gross revenues, Petroleum Revenue Tax (or IRP) which is charged at 65.75%, and Taxa de Transacca de Petroleo or TTP. This is charged before corporation tax but after a production allowance (which increases by 7% per annum and is estimated at $22.32/bbl in 2008). For the purposes of TTP an investment allowance or uplift equating to 50% of capital spend is also allowable.

7 January 2008 Integrated Oils Oil & Gas for Beginners
Deutsche Bank AG/London Page 285
Deepwater: Angola’s deepwater blocks are subject to production sharing contracts. Terms between these may vary by block. In general, however, Angolan PSCs are structured as IRR-based profit sharing contracts. In most PSCs, 50% of revenues are available for the recovery of cost oil with the remaining profit oil divided between state and contractor in proportions that vary dependent upon the project’s quarterly-measured IRR (%), the resulting profits being taxed at a rate of 50%. Importantly, in determining cost oil, capex is uplifted by as much as 50% and is depreciated for tax purposes on a 4 year straight line basis. It is of note that in the more recent licensing rounds the terms applicable to the PSCs awarded have deteriorated somewhat for the contractors (as illustrated below) with capital uplift reduced and the trigger points for a change in the share of profit oil based on lower project IRRs.
Figure 365: Change in Angolan Deepwater terms upon recent re-licensing License Block 15
initial Block 15/06 re-license Block 17
initial Block 17/06 re-
license
Signature bonus $35m $900m $6m To be decided
Cost oil limit 50% 50% 55% 50%
Uplift 145% 130% 150% 130%
Profit shares (IRR/contractor share)
IRR <15% 75% <15% 70% <15% 75% <15% 70%
IRR 15-25% 65% 15-20% 60% 15-25% 60% 15-20% 60%
IRR 25-30% 45% 20-30% …40% 25-30% …40% 20-30% …40%
IRR >30% 25% >30% 20% >30% 20% >30% 20% Source: Sonangol; Deutsche Bank
Refining and Downstream markets
Angola presently has one refinery based in Luanda with a capacity of c63kb/d, although processing capacity is currently nearer 40kb/d. The refinery was 56% owned by Total but, following its successful bid for Block 17/06, Total passed its equity interest to Sonangol as part of its signature bonus payment. While this single refinery meets most of the country’s requirements for oil products, in 2006 Sonangol agreed a deal with Sinopec whereby Sinopec will finance the construction of a new 200kb/d refinery at Lobito in Southern Angola. This is expected to cost c$3.75bn with commissioning scheduled for 2012.
LNG
The Angola LNG project took FID in late 2007 and is expected to see the construction of a 5.2mtpa LNG facility at Soyo in the north of the country by early 2012. This will be operated by Chevron which has a 36.4% interest in the project, the other equity holders being Sonangol (22.8%), Total (13.6%), Eni (13.6%) and BP (13.6%). Despite much discussion and several years of planning, FID was only taken in December 2007 with the delay owing, in part, to the significant anticipated costs of both construction and laying down the necessary infrastructure to gather gas from the producing fields in Cabinda and Blocks 14, 15, 17 and 18 and transport it to shore. Note that the LNG produced is expected to be delivered to the Pasaguola re-gas terminal in Mississippi where it will be purchased as natural gas for marketing in the US by the respective partner’s US gas marketing operations.

7 January 2008 Integrated Oils Oil & Gas for Beginners
Page 286 Deutsche Bank AG/London
Angola - Notes
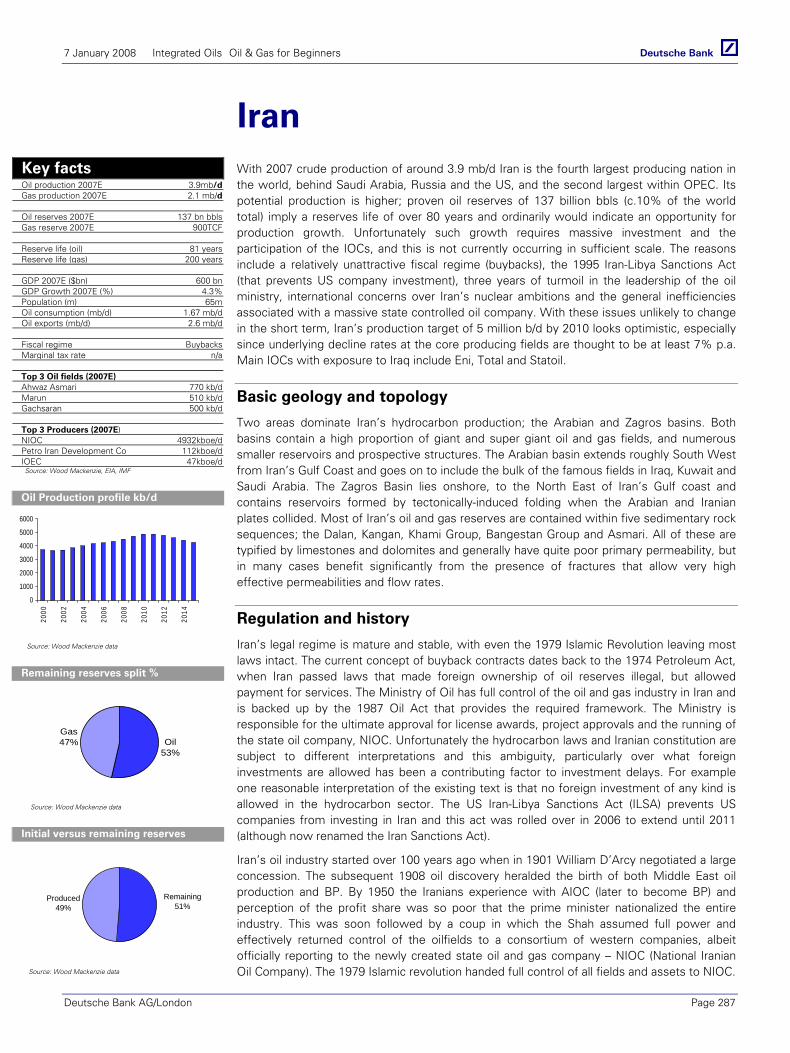
7 January 2008 Integrated Oils Oil & Gas for Beginners
Deutsche Bank AG/London Page 287
Iran With 2007 crude production of around 3.9 mb/d Iran is the fourth largest producing nation in the world, behind Saudi Arabia, Russia and the US, and the second largest within OPEC. Its potential production is higher; proven oil reserves of 137 billion bbls (c.10% of the world total) imply a reserves life of over 80 years and ordinarily would indicate an opportunity for production growth. Unfortunately such growth requires massive investment and the participation of the IOCs, and this is not currently occurring in sufficient scale. The reasons include a relatively unattractive fiscal regime (buybacks), the 1995 Iran-Libya Sanctions Act (that prevents US company investment), three years of turmoil in the leadership of the oil ministry, international concerns over Iran’s nuclear ambitions and the general inefficiencies associated with a massive state controlled oil company. With these issues unlikely to change in the short term, Iran’s production target of 5 million b/d by 2010 looks optimistic, especially since underlying decline rates at the core producing fields are thought to be at least 7% p.a. Main IOCs with exposure to Iraq include Eni, Total and Statoil.
Basic geology and topology
Two areas dominate Iran’s hydrocarbon production; the Arabian and Zagros basins. Both basins contain a high proportion of giant and super giant oil and gas fields, and numerous smaller reservoirs and prospective structures. The Arabian basin extends roughly South West from Iran’s Gulf Coast and goes on to include the bulk of the famous fields in Iraq, Kuwait and Saudi Arabia. The Zagros Basin lies onshore, to the North East of Iran’s Gulf coast and contains reservoirs formed by tectonically-induced folding when the Arabian and Iranian plates collided. Most of Iran’s oil and gas reserves are contained within five sedimentary rock sequences; the Dalan, Kangan, Khami Group, Bangestan Group and Asmari. All of these are typified by limestones and dolomites and generally have quite poor primary permeability, but in many cases benefit significantly from the presence of fractures that allow very high effective permeabilities and flow rates.
Regulation and history
Iran’s legal regime is mature and stable, with even the 1979 Islamic Revolution leaving most laws intact. The current concept of buyback contracts dates back to the 1974 Petroleum Act, when Iran passed laws that made foreign ownership of oil reserves illegal, but allowed payment for services. The Ministry of Oil has full control of the oil and gas industry in Iran and is backed up by the 1987 Oil Act that provides the required framework. The Ministry is responsible for the ultimate approval for license awards, project approvals and the running of the state oil company, NIOC. Unfortunately the hydrocarbon laws and Iranian constitution are subject to different interpretations and this ambiguity, particularly over what foreign investments are allowed has been a contributing factor to investment delays. For example one reasonable interpretation of the existing text is that no foreign investment of any kind is allowed in the hydrocarbon sector. The US Iran-Libya Sanctions Act (ILSA) prevents US companies from investing in Iran and this act was rolled over in 2006 to extend until 2011 (although now renamed the Iran Sanctions Act).
Iran’s oil industry started over 100 years ago when in 1901 William D’Arcy negotiated a large concession. The subsequent 1908 oil discovery heralded the birth of both Middle East oil production and BP. By 1950 the Iranians experience with AIOC (later to become BP) and perception of the profit share was so poor that the prime minister nationalized the entire industry. This was soon followed by a coup in which the Shah assumed full power and effectively returned control of the oilfields to a consortium of western companies, albeit officially reporting to the newly created state oil and gas company – NIOC (National Iranian Oil Company). The 1979 Islamic revolution handed full control of all fields and assets to NIOC.
Key facts Oil production 2007E 3.9mb/d Gas production 2007E 2.1 mb/d Oil reserves 2007E 137 bn bbls Gas reserve 2007E 900TCF Reserve life (oil) 81 years Reserve life (gas) 200 years GDP 2007E ($bn) 600 bn GDP Growth 2007E (%) 4.3% Population (m) 65m Oil consumption (mb/d) 1.67 mb/d Oil exports (mb/d) 2.6 mb/d Fiscal regime Buybacks Marginal tax rate n/a Top 3 Oil fields (2007E) Ahwaz Asmari 770 kb/d Marun 510 kb/d Gachsaran 500 kb/d Top 3 Producers (2007E) NIOC 4932kboe/d Petro Iran Development Co 112kboe/d IOEC 47kboe/d Source: Wood Mackenzie, EIA, IMF
Oil Production profile kb/d
0
1000
2000
3000
4000
5000
6000
2000
2002
2004
2006
2008
2010
2012
2014
Source: Wood Mackenzie data
Remaining reserves split %
Oil53%
Gas47%
Source: Wood Mackenzie data
Initial versus remaining reserves
Produced49%
Remaining51%
Source: Wood Mackenzie data
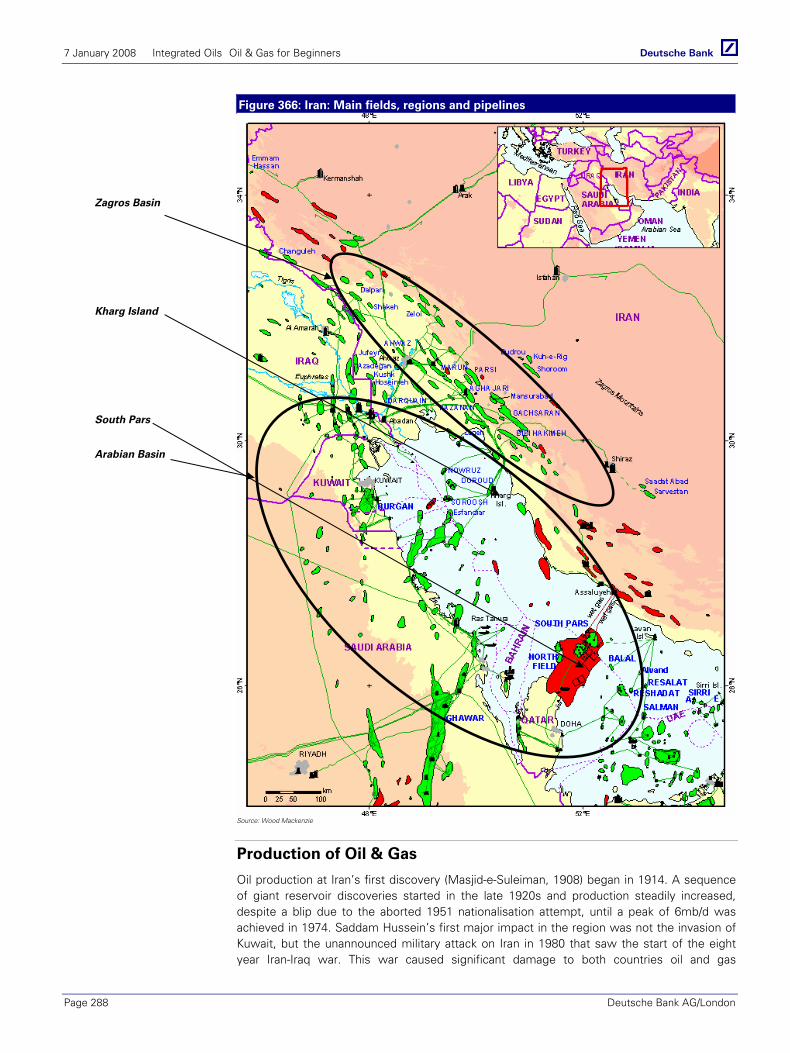
7 January 2008 Integrated Oils Oil & Gas for Beginners
Page 288 Deutsche Bank AG/London
Figure 366: Iran: Main fields, regions and pipelines
Source: Wood Mackenzie
Production of Oil & Gas
Oil production at Iran’s first discovery (Masjid-e-Suleiman, 1908) began in 1914. A sequence of giant reservoir discoveries started in the late 1920s and production steadily increased, despite a blip due to the aborted 1951 nationalisation attempt, until a peak of 6mb/d was achieved in 1974. Saddam Hussein’s first major impact in the region was not the invasion of Kuwait, but the unannounced military attack on Iran in 1980 that saw the start of the eight year Iran-Iraq war. This war caused significant damage to both countries oil and gas
Zagros Basin Kharg Island South Pars
Arabian Basin

7 January 2008 Integrated Oils Oil & Gas for Beginners
Deutsche Bank AG/London Page 289
infrastructure, and indeed Iran’s production was only 3mb/d, half its 1974 peak, by the time the war ended.
Iran’s crude oil production was c.3.9 mb/d in 2007, however the giant South Pars gas field provides NGLs to the extent of another c.0.4mb/d, taking total liquids production to c.4.3mb/d. The largest oil producer is the giant onshore Ahwaz field (c.770kb/d). This field, together with nine other giant fields (all but one of which lie in the onshore Zagros basin) have supplied c.90% of Iran’s cumulative oil production to-date. Production growth since the late 1990s has come mainly as a result of IOC investment under the buyback contract regime, starting with Siri A & E (Total, currently 79kb/d) in 1995 and continuing with Soroosh-Norwruz (Shell, currently 133kb/d), South Pars 2&3 (Total, currently 118kb/d), South Pars 4&5 (Eni, currently 119kb/d), Darquain (Eni, currently 55kb/d), and Doroud (Eni, Total, currently 140kb/d) amongst others. Without buyback contracts with IOCs Iran would have likely at best posted flat production from the late 1990s onwards, and the fact that additional such contracts are not being signed in the current environment leaves the future production profile at risk. The main legacy fields are mature and well past peak production, with underlying decline rates of around 7% or more. As with buyback contracts, NIOC plans to implement further secondary recovery projects on its major declining fields but is struggling in the face of delays in project awards.
Figure 367: Key Fields in Production Field Remaining Reserves
(mmbbl)*Production 2005 (Kb/d) Production 2010 (Kb/d)
Ahwaz** 8330 936 994
Marun 2100 418 307
Gachsaran 4690 651 700
Agha Jari 1650 174 200
Doroud 1020 156 173
Soroosh Nowruz 1230 130 178Source: Wood Mackenzie. * As at 1.1.2007; Proven plus Probable; total liquids. ** Ahwaz Asmari reservoir, plus the Ahwaz area Bangestan reservoirs
In Wood Mackenzie’s scenario (which we regard as a best possible outcome) Iran’s overall liquids production is forecast to increase steadily through the rest of this decade. Most of the net growth in liquids production is the result of the planned increase in condensate production from the South Pars field. Conventional oil production is forecast to increase slowly, at best.
Figure 368: Iran liquids production, 2000-2015E (kb/d) Figure 369: Iran gas production, 2000-2015E (mmcf/d)
0
1000
2000
3000
4000
5000
6000
2000
2001
2002
2003
2004
2005
2006
2007
2008
2009
2010
2011
2012
2013
2014
2015
0
5000
10000
15000
20000
25000
2000
2001
2002
2003
2004
2005
2006
2007
2008
2009
2010
2011
2012
2013
2014
2015
Source: Wood Mackenzie ; Deutsche Bank Source: Wood Mackenzie;Deutsche Bank
Gas production has historically been associated with onshore oil fields; however non-associated gas fields have been developed from 1983 onwards. The significant increase in gas production that has occurred from 2002 onwards is mainly due to the various South Pars
7 January 2008 Integrated Oils Oil & Gas for Beginners
Page 290 Deutsche Bank AG/London
phases coming on-stream – some of this production is used for re-injection into ageing onshore oilfields.
IOCs have made significant investments in Iran over the last ten years, but a combination of high oil prices and the buyback contract model means that the current IOC exposure by production is insignificant; in 2007 Eni was estimated to be the highest, receiving 20.8kboe/d via buyback contracts, followed by Total with 14.7kboe/d and then Gazprom with 8.8kboe/d.
Reserves and Resources
Iran’s stated proven oil reserves are at 137 bn bbls. The offshore Arabian basin and the onshore Zagros basin contain over 90% of these 2P reserve estimates, with some small prospectivity thought to also exist in the largely unexplored South Caspian Sea.
Although Iran is one of the world’s leading oil producers, it retains a high potential for major new discoveries. This is supported by the rate of new, giant oil and gas discoveries that have been made over the last 10-15 years, which include Azadegan, Kushk, Housseineh and Anaran. All these finds have been in the established producing region of the Zagros basin and suggest that there is a high probability of further discoveries of perhaps a similar scale. There is also significant potential for new discoveries in the less explored basins of Iran, such as in the offshore Persian Gulf and the Main Central Basin
Iran has the second largest gas reserves in the world after Russia. With the massive South Pars field’s 150bn boe of 2P reserves largely untapped as yet, Iran has a gas reserves life of over 130 years. As with oil, there is plenty of scope, from a resource perspective, to increase production.
Pipelines and infrastructure
Iran has a well-established and extensive oil pipeline infrastructure that links its oil fields to its nine refineries and export facilities throughout the country. Its pipeline infrastructure consists of five (13,500km) crude oil trunk pipelines and a 44,000km gas pipelines network. The oil pipeline network is used to export oil and serve refineries in Iran and is complemented by multiple international projects under appraisal. The majority of Iran’s export pipeline network is used for transporting oil from the producing fields in the Zagros Basin for export at the Kharg Island terminal. The terminal has a capacity of 4mb/d and is the loading point for almost all of Iran’s exported oil.
A high profile new oil pipeline project is the proposal for the import of oil produced in the Caspian region (Kazakhstan, Turkmenistan and Azerbaijan). The imported crude will be consumed in the Northern industrialized areas of Iran and equivalent amounts are sold from the Kharg export island in the South, where Iran’s own oil is produced – it is hence a swap arrangement. NIOC has stated that it expects as much as 1.6m b/d of Caspian crude to ‘cross’ its territory by 2010.
Iran’s regional gas supply network is dominated by two regional transmission lines, the Iranian Gas Trunk lines IGAT-1 and IGAT-2. The pipelines IGAT-1 and IGAT-2 have a capacity of 2.0bcf/d and 2.6bcf/d respectively. They form the primary trunk lines carrying gas from the Zagros fields to the main industrial areas and population centers of northern Iran. A third IGAT line is in its first phase of construction and will carry gas from the staged development of the South Pars field. IGAT-3 is expected have a capacity of 3.0bcf/d.

7 January 2008 Integrated Oils Oil & Gas for Beginners
Deutsche Bank AG/London Page 291
Crude Oil Blends and Quality
Iran exports oil as a series of blends, with Iran Heavy and Iran Light making up around 90% of the total. Iran Heavy is a typical Middle Eastern, medium-gravity, high sulphur crude, while Iran Light is comparable in quality to Arab Light. The outlook for Iranian crudes is a trend towards heavier and sourer grades over time as lower quality crude is produced from newly developed fields that replace falling production from legacy assets.
Figure 370: Summary of main crude blends and characteristics Crude Oil Gravity (°API) Sulphur (%)
Doroud 36 2.4
Foroozan Blend 29.7 2.34
Iran Heavy 30.2 1.77
Iran Light 33.1 1.5Source: The International Crude Oil Market Handbook 2007, Energy Intelligence Research
Broad Fiscal Terms
All contracts for Iranian production and exploration must be negotiated with NIOC, which in turn has to seek final approval from the Ministry for Oil. Foreign companies can only invest via buyback contracts, the first of which was awarded to Total in 1995. Buyback contracts stipulate that the foreign company (or ‘contractor’) must fund and execute all appropriate exploration and development and then recoup a fixed, pre-agreed return (in the form of barrels of oil) from the subsequent production, assuming the production is successful enough to do so. Each buyback contract goes out to tender and companies must bid their best offer in terms of the lowest return they will accept. A key part of the buyback contract is the Master Development Plan document, where exact details of what will be done, and how much it will cost (the Capital Cost Allowance) are recorded and committed to. The problem today is that with a current environment of industry-wide cost escalation, committing to a certain capex level with no hope of a decent return in the face of any cost overrun is not a risk most IOCs are willing to take. There is a proposal to alter the buyback model so that the Capital Cost Allowance is not finalised until late in the tender process, however such changes do not tend to occur quickly in Iran.
Refining and downstream markets
Iran has a total refining capacity of 1.64mb/d split between nine refineries. It plans to increase its refining capacity by 55% to 2.54mb/d by 2010, although as with other areas of the Iranian oil and gas industry, the poor terms on offer have dissuaded many E&C firms from bidding for such work, so such growth plans seem optimistic at present.
Figure 371: Main refineries in Iran Operator Refinery Capacity (Kb/d)
National Iranian Oil Company Abadan Refinery 500
National Iranian Oil Company Arak Refinery 165
National Iranian Oil Company Bandar Abbas Refinery 232
National Iranian Oil Company Isfahan Refinery 265
National Iranian Oil Company Tabriz Refinery 112
National Iranian Oil Company Tehran Refinery 225Source: The International Crude Oil Market Handbook 2007, Energy Intelligence Research
A surprising statistic is that as much as 40% of the country’s total gasoline consumption is met by imports. The planned refinery capacity expansion is aimed at increasing gasoline production by upgrading the refineries’ ability to process heavier crudes; if such plans could

7 January 2008 Integrated Oils Oil & Gas for Beginners
Page 292 Deutsche Bank AG/London
actually be implemented then indeed Iran would cease to be a net importer of gasoline. Perhaps a more appropriate place to look for explanations is not the lack of refining capacity, but rather subsidized gasoline prices of merely 42cents/gallon, which promotes unsustainably high fuel demand (10% p.a. growth over the last six years).
LNG
The huge South Pars gas field is an obvious candidate for Iran to enter the world as a major supplier of LNG, however to date progress has been far less than has been seen in Qatar, which shares South Pars (known by Qatar as the North Field). Four projects are currently on the drawing board:
Pars LNG – a 10 mmtpa liquefaction plant using gas from South Pars phase 11 (Total, Petronas and NIGEC).
NIOC LNG – another 10 mmtpa plant to use phase 12 gas (NIOC, OMV).
Persian LNG – a 16 mmtpa plant to use gas from phases 13 and 14 (Shell, RepsolYPF and NIOC).
In 2006 an MOU was signed between CNOOC and NIOC to develop a 20 mmtpa facility.
The LNG projects are bedeviled by inflexible contract structures; no IOC wants to take on fixed returns for pre-agreed capital costs when it is clear that capital costs are currently extremely volatile. Furthermore, no international E&C firm wants to submit a binding bid for building an LNG plant (where they are obliged to use a high percentage of local content) without a massive cushion for potential cost overruns being built in. If bids are submitted, they are thus far higher than NIOC can understand.
Pars LNG is thought to be the most advanced of the projects, but FID has not been taken and the project status is still highly uncertain.
Various MOUs have been signed by Iran to supply LNG, including to Sinopec, India (2009), PTT (Thailand, 2011) and Petrochina.

7 January 2008 Integrated Oils Oil & Gas for Beginners
Deutsche Bank AG/London Page 293
Iran - Notes

7 January 2008 Integrated Oils Oil & Gas for Beginners
Page 294 Deutsche Bank AG/London
Iran - Notes
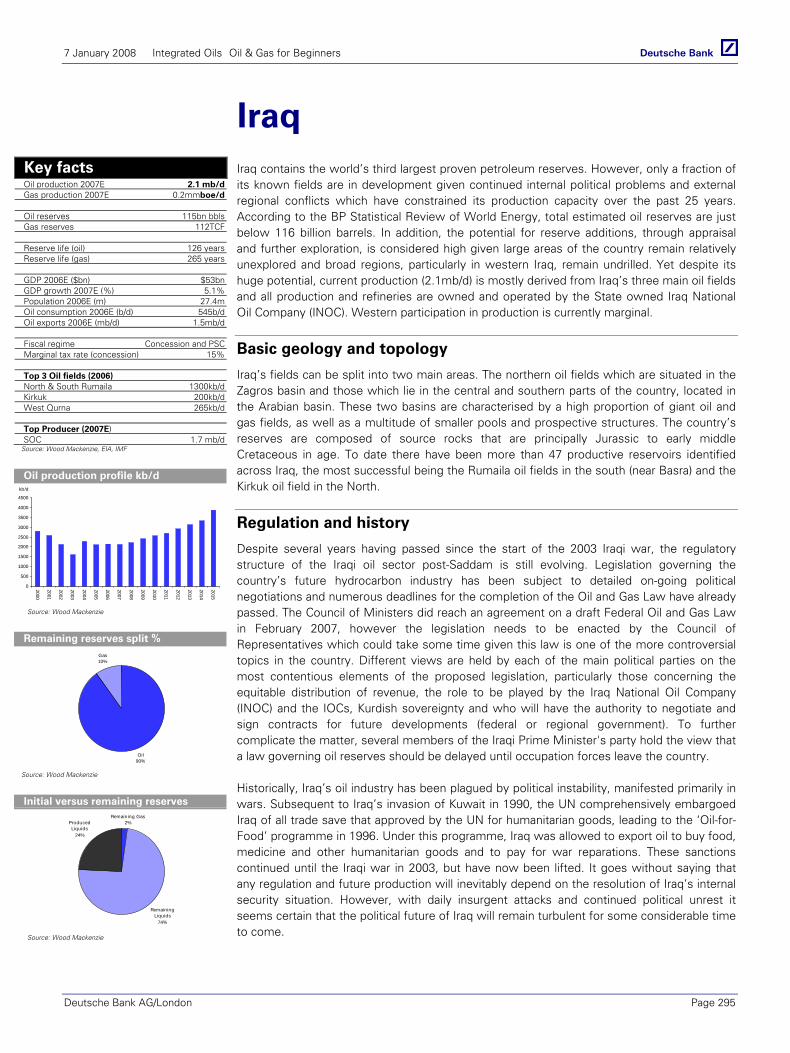
7 January 2008 Integrated Oils Oil & Gas for Beginners
Deutsche Bank AG/London Page 295
Iraq Iraq contains the world’s third largest proven petroleum reserves. However, only a fraction of its known fields are in development given continued internal political problems and external regional conflicts which have constrained its production capacity over the past 25 years. According to the BP Statistical Review of World Energy, total estimated oil reserves are just below 116 billion barrels. In addition, the potential for reserve additions, through appraisal and further exploration, is considered high given large areas of the country remain relatively unexplored and broad regions, particularly in western Iraq, remain undrilled. Yet despite its huge potential, current production (2.1mb/d) is mostly derived from Iraq’s three main oil fields and all production and refineries are owned and operated by the State owned Iraq National Oil Company (INOC). Western participation in production is currently marginal.
Basic geology and topology
Iraq’s fields can be split into two main areas. The northern oil fields which are situated in the Zagros basin and those which lie in the central and southern parts of the country, located in the Arabian basin. These two basins are characterised by a high proportion of giant oil and gas fields, as well as a multitude of smaller pools and prospective structures. The country’s reserves are composed of source rocks that are principally Jurassic to early middle Cretaceous in age. To date there have been more than 47 productive reservoirs identified across Iraq, the most successful being the Rumaila oil fields in the south (near Basra) and the Kirkuk oil field in the North.
Regulation and history
Despite several years having passed since the start of the 2003 Iraqi war, the regulatory structure of the Iraqi oil sector post-Saddam is still evolving. Legislation governing the country’s future hydrocarbon industry has been subject to detailed on-going political negotiations and numerous deadlines for the completion of the Oil and Gas Law have already passed. The Council of Ministers did reach an agreement on a draft Federal Oil and Gas Law in February 2007, however the legislation needs to be enacted by the Council of Representatives which could take some time given this law is one of the more controversial topics in the country. Different views are held by each of the main political parties on the most contentious elements of the proposed legislation, particularly those concerning the equitable distribution of revenue, the role to be played by the Iraq National Oil Company (INOC) and the IOCs, Kurdish sovereignty and who will have the authority to negotiate and sign contracts for future developments (federal or regional government). To further complicate the matter, several members of the Iraqi Prime Minister's party hold the view that a law governing oil reserves should be delayed until occupation forces leave the country.
Historically, Iraq’s oil industry has been plagued by political instability, manifested primarily in wars. Subsequent to Iraq’s invasion of Kuwait in 1990, the UN comprehensively embargoed Iraq of all trade save that approved by the UN for humanitarian goods, leading to the ‘Oil-for-Food’ programme in 1996. Under this programme, Iraq was allowed to export oil to buy food, medicine and other humanitarian goods and to pay for war reparations. These sanctions continued until the Iraqi war in 2003, but have now been lifted. It goes without saying that any regulation and future production will inevitably depend on the resolution of Iraq’s internal security situation. However, with daily insurgent attacks and continued political unrest it seems certain that the political future of Iraq will remain turbulent for some considerable time to come.
Key facts Oil production 2007E 2.1 mb/d Gas production 2007E 0.2mmboe/d Oil reserves 115bn bbls Gas reserves 112TCF Reserve life (oil) 126 years Reserve life (gas) 265 years GDP 2006E ($bn) $53bn GDP growth 2007E (%) 5.1% Population 2006E (m) 27.4m Oil consumption 2006E (b/d) 545b/d Oil exports 2006E (mb/d) 1.5mb/d Fiscal regime Concession and PSC Marginal tax rate (concession) 15% Top 3 Oil fields (2006) North & South Rumaila 1300kb/d Kirkuk 200kb/d West Qurna 265kb/d Top Producer (2007E) SOC 1.7 mb/d
Source: Wood Mackenzie, EIA, IMF
Oil production profile kb/d
0
500
1000
1500
2000
2500
3000
3500
4000
4500
2000
2001
2002
2003
2004
2005
2006
2007
2008
2009
2010
2011
2012
2013
2014
2015
kb/d
Source: Wood Mackenzie
Remaining reserves split %
Oil 90%
Gas10%
Source: Wood Mackenzie
Initial versus remaining reserves Remaining Gas
2%
Remaining Liquids
74%
Produced Liquids
24%
Source: Wood Mackenzie
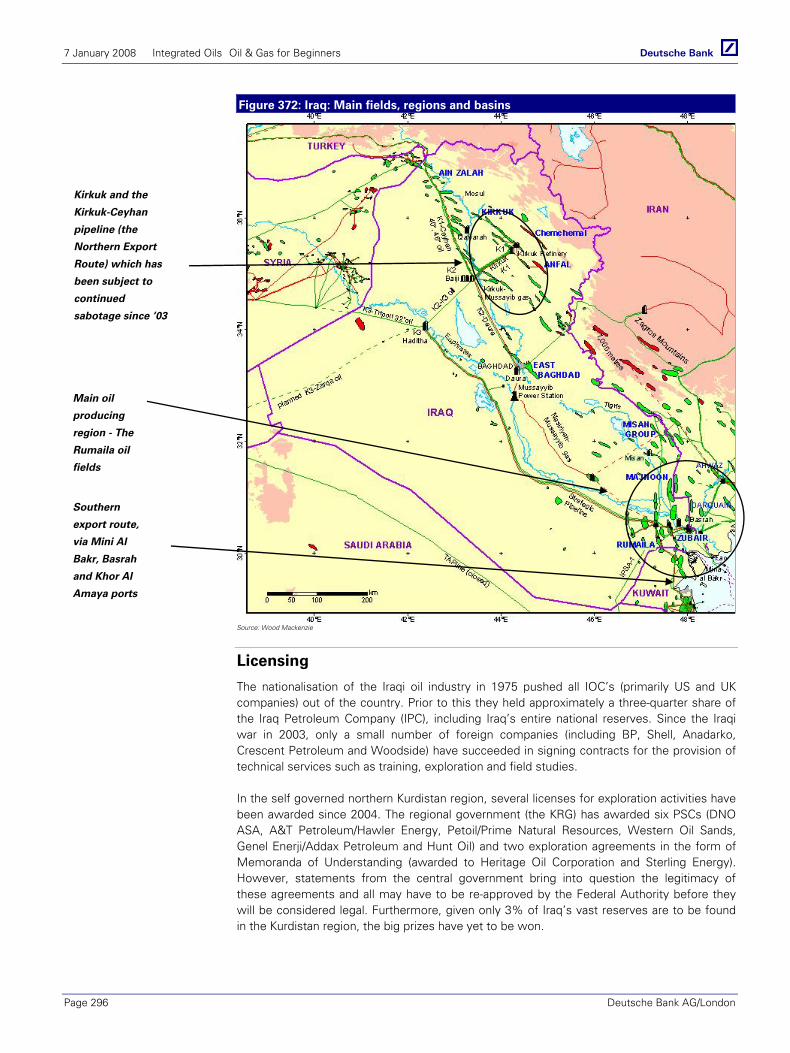
7 January 2008 Integrated Oils Oil & Gas for Beginners
Page 296 Deutsche Bank AG/London
Figure 372: Iraq: Main fields, regions and basins
Source: Wood Mackenzie
Licensing
The nationalisation of the Iraqi oil industry in 1975 pushed all IOC’s (primarily US and UK companies) out of the country. Prior to this they held approximately a three-quarter share of the Iraq Petroleum Company (IPC), including Iraq’s entire national reserves. Since the Iraqi war in 2003, only a small number of foreign companies (including BP, Shell, Anadarko, Crescent Petroleum and Woodside) have succeeded in signing contracts for the provision of technical services such as training, exploration and field studies.
In the self governed northern Kurdistan region, several licenses for exploration activities have been awarded since 2004. The regional government (the KRG) has awarded six PSCs (DNO ASA, A&T Petroleum/Hawler Energy, Petoil/Prime Natural Resources, Western Oil Sands, Genel Enerji/Addax Petroleum and Hunt Oil) and two exploration agreements in the form of Memoranda of Understanding (awarded to Heritage Oil Corporation and Sterling Energy). However, statements from the central government bring into question the legitimacy of these agreements and all may have to be re-approved by the Federal Authority before they will be considered legal. Furthermore, given only 3% of Iraq’s vast reserves are to be found in the Kurdistan region, the big prizes have yet to be won.
Kirkuk and the
Kirkuk-Ceyhan
pipeline (the
Northern Export
Route) which has
been subject to
continued
sabotage since ‘03
Main oil
producing
region - The
Rumaila oil
fields
Southern
export route,
via Mini Al
Bakr, Basrah
and Khor Al
Amaya ports

7 January 2008 Integrated Oils Oil & Gas for Beginners
Deutsche Bank AG/London Page 297
Contract award process under the proposed new law The Ministry of Oil, INOC and Regional Authorities are nominated as Designated Authorities (DA) under the new proposed law, and will hold the right to award. An institutional process has been designed to satisfy the conflicting views of the Kurdistan region and the central government with respect to the formers degree of autonomy in the award of petroleum development contracts. Once a contract has been granted, the DA must submit it to the Federal Oil and Gas Council (FOGC) within 30 days. The FOGC will approve the contract or refer it to the PIA, if it is considered to be inconsistent with FOGC guidelines.
Production of Oil and Gas
Commercial production in Iraq commenced in 1927 and gradually increased throughout the 1960s and 70s, peaking at approximately 3.5m b/d in 1979. However, despite the fact that it started producing oil more than 75 years ago, Iraq’s oil production potential has yet to reach a level commensurate with its reserves. Internal political problems and regional conflicts have constrained production capacity and crippled the infrastructure for the last 25 years. Production was disrupted in 1980 by the Iran-Iraq war, in 1991 by the Gulf War and again in 2003 by the War on Iraq.
Historically, approximately two thirds of total production arose in the southern fields. At present, the majority of Iraqi oil production comes from just three fields; North and South Rumaila and Kirkuk. The Rumaila fields have been producing 1.5 to 1.9m b/d which is close to pre-war levels. However, daily production at Kirkuk of around 200kb/d is only a fraction of its pre-war level of 680kb/d. The Ministry of Oil has announced a goal of 6mb/d of sustainable production by the end of the decade, estimating that up to $75 billion investment will be needed to achieve such production levels.
Iraq has not been party to OPEC’s formal production agreements for more than a decade and it is unlikely that its role will improve over the next few years given the expected slow growth in its production capacity. However, given Iraq’s production quota represented just over 14% of total OPEC production quota in 1990, Iraq does have the potential to once again become a powerful OPEC member, should all conflicts and internal issues be successfully resolved. Iraq’s key oil fields are as follows:
Figure 373: Iraq’s key fields and production Initial Reserves
(mb)Remaining
Reserves (mb)*Start-
upProduction 2005 (kb/d)
Production 2010 (kb/d)
Production 2015
(‘000b/d)
North and South Rumaila 24,800 13,702 1954 1,100 1,300 1,535
Kirkuk 19,850 5,171 1934 250 400 800
West Qurna 8,340 7,998 1998 125 300 700Source: Wood Mackenzie
From a company perspective, all of Iraq’s current production is controlled by the Ministry of Oil via its two operating units the North (NOC) and the South (SOC) Oil Companies. As detailed above, while licences for exploration and appraisal have been awarded to a number of western companies, little progress has been made given the continuing conflict in the country. DNO has been the most active company in the region, reporting positive results from testing and drilling carried out in 2007.
Iraq’s gas production is estimated by Wood Mackenzie to have stood at 1.27bcf/d in 2007. Significant potential for growth exists given approximately 60% of all associated gas is currently flared and related infrastructure is antiquated. Iraq’s near term gas production plans focus on meeting domestic gas needs, but there are plans to develop the industry with a view to export.

7 January 2008 Integrated Oils Oil & Gas for Beginners
Page 298 Deutsche Bank AG/London
Figure 374: Iraqi oil production over the last 30 years
(kb/d)
Figure 375: Iraqi oil production 2000-15E(kb/d)
-
500
1,000
1,500
2,000
2,500
3,000
3,500
1978 1983 1988 1993 1998 2003
kb/d
Iran-Iraq war
Gulf War
War on Iraq
0
500
1000
1500
2000
2500
3000
3500
4000
4500
2000
2001
2002
2003
2004
2005
2006
2007
2008
2009
2010
2011
2012
2013
2014
2015
kb/d
Source: Wood Mackenzie; Deutsche Bank Source: Wood Mackenzie; Deutsche Bank
Reserves and Resources
In global terms, with reserves standing at 116bn bbls of oil and 112TCF of gas, Iraq’s reserves are the world’s third largest after Saudi Arabia and Russia. Of these, 80% are contained within the southern Arabian basin and the remainder in the North. However, due to reasons described above, large volumes of oil remain undeveloped and Iraq has the lowest reserves to production ratio of the major oil-producing countries (126 years). Wood Mackenzie estimates that further appraisal and exploration could supplement the reserve base by as much as 50%, of which 40% could easily be added just by introducing modern technology and reservoir techniques.
Key fields for development in forthcoming years include Majnoon and Nahr Umr. Majnoon has huge reserves and has long been sought after for development by Total and Chevron, who recently submitted a study for the development of the field. Longer term development plans for Nahr Umr envisage production of 500 kb/d although commercial production is not envisaged to commence until 2015.
Figure 376: Potential new fields in Iraq Recoverable
Reserves (mb)Remaining Reserves
(mb)*Start-up Current Production
(kb/d)
Majnoon 8,260 8,204 1939 45
Nahr Umr 6,790 6,780 1964 0Source: Wood Mackenzie
In the past, exploration has concentrated on oil hence almost all of Iraq’s gas reserves are classified as technical as they lack commercial development plans. Approximately 70% of the reserves are associated gas, with the main non-associated gas fields being contained within seven fields (Kormor, Chemchemal, Khashm al-Ahmar, Jaria Pika, Mansuriyah, Siba and Akkas). With the exception of Komor it is thought none of these are in production. Talks were conducted with Kuwait regarding the development of the Siba gas field for export. However, development plans were put on hold when Kuwait made a significant discovery of its own in 2006. Consequently, the current emphasis in Iraq is for the rehabilitation of gas infrastructure and the utilisation of gas for domestic power generation.
7 January 2008 Integrated Oils Oil & Gas for Beginners
Deutsche Bank AG/London Page 299
Pipelines and Infrastructure
Iraq has a long established and extensive oil pipeline system which links its oil fields to refineries and export facilities throughout the country. This infrastructure was severely damaged during both Gulf Wars (1980-88 and again in 1990-91) and in the 2003 War on Iraq, significantly reducing capacity. The infrastructure requires major modernisation and investment in order to restore the industry to former production levels. Such restoration did commence immediately after the 2003 Iraqi war. However, acts of sabotage on Iraqi infrastructure continue to hamper operations and restrict production.
The main pipelines which provide the potential capacity to supply the domestic market and to deliver crude for export are the Strategic Pipeline (capacity of 800kb/d, intended to transport southern production to Baghdad), the Kirkuk-Ceyhan pipeline (also known as the much beleaguered ‘Northern Route’ with a capacity of 1,600kb/d), the Kirkuk-Banias/Tripoli pipeline (with a combined capacity of 1,080kb/d but both closed) and the Iraqi pipeline to Saudi Arabia (capacity of 500kb/d, also closed). Together these pipelines have a design capacity of almost 4mb/d although actual usage is nowhere near this level. At present, most of Iraq’s oil is exported by sea through key ports on the south coast near Basra namely Mina al-Bakr (1.4mb/d) and Khor al-Amaya (100kb/d). Further port export capacity at Al-Fao and Basra remain closed.
Gas infrastructure within Iraq is limited resulting in under-utilisation of associated gas reserves. In April 2007, estimates indicated that around 60% of Iraq’s gas production was flared. Since 2003, the Kurdistan region has signed a contract with Dana Gas to assist in both the development of the regions gas reserves and for the installation of processing and transmission facilities to supply gas for power generation.
Crude Oil Blends and Quality
Iraqi crudes vary greatly in quality with gravity ranging from 15˚ API to more than 40˚ API. Sulphur is also varied (0.1% to 4%). Under the terms of UN sanctions, Iraq only exported two blends in significant volumes, produced primarily in Kirkuk and Rumaila. However, since the lifting of the sanctions Basra blend has been exported without restriction and it is expected that exportation of further blends will increase as production gradually intensifies.
Figure 377: Main crude streams and loading points Crude Oil Loading Point Gravity (°API) Sulphur (%)
Basra Blend Mina al-Bakr 34.4 2.10
Kirkuk Ceyhan/Botas, Turkey 35.8 2.06Source: Wood Mackenzie
Broad Fiscal Terms
Fiscal terms prior to 2003 were characterised in two forms of contract – the Production Sharing Contract (PSC) and the Development and Production Contract (DPC). Given the range of fields and exploration opportunities in Iraq, it is likely that a range of alternative fiscal structures will be employed once the Federal Oil and Gas legislation is passed. The proposed draft indicated that contracts may be based upon DPCs, PSCs and other fiscal regimes, all of which will form the basis for negotiation with bidding companies. The main tax components will be corporation tax at 15% and a royalty of 12.5% on gross production. In addition there are municipal and local taxes which could also be levied.
7 January 2008 Integrated Oils Oil & Gas for Beginners
Page 300 Deutsche Bank AG/London
Refining and Downstream markets
As with infrastructure, refineries have been subject to much sabotage over the years. Currently the sector has not been able to meet domestic demand for refined products like gasoline, kerosene and diesel and at the start of 2007 the government liberalised the fuel import market in order to increase imports to meet local demand. The IMF estimates that imports have cost Iraq close to $2.5 billion annually since 2004.
Total refining capacity at Iraq’s 12 oil refineries is 677kb/d although effective capacity is likely under 400kb/d. The main refineries include Daura (110kb/d), Baiji (310kb/d) and Basrah (150kb/d). In order to alleviate domestic fuel shortages the Government has initiated a $4billion plan to attract investment in downstream operations with the aim to increase refinery capacity to around 1mb/d. Expansions are planned at three of Iraq’s main refineries with a new green-field refinery proposed at Koya.
LNG
At present Iraq has no LNG facilities. However, with the potential to significantly increase its gas reserves, Iraq will likely look to promote the viability of both LNG and GTL technology to provide the prospect of realising value from its significant gas resource base. In 2004, Shell announced that it had received approval from the Iraqi Oil Ministry to assist in the development of a gas master plan. It is believed to have completed this exercise in 2006, but no further details have been released.

7 January 2008 Integrated Oils Oil & Gas for Beginners
Deutsche Bank AG/London Page 301
Iraq - Notes

7 January 2008 Integrated Oils Oil & Gas for Beginners
Page 302 Deutsche Bank AG/London
Iraq - Notes

7 January 2008 Integrated Oils Oil & Gas for Beginners
Deutsche Bank AG/London Page 303
Kuwait Kuwait is one of the richest nations in the world on a per capita basis, due primarily to its significant accumulated oil wealth. With official reserves of 102bn bbls, it is the fourth largest oil producer in the Middle East with oil revenues accounting for around 90-95% of total export earnings and around 40% of GDP. Current production is approximately 2.6mb/d. However, the government plans to spend an estimated $27.6 billion through 2020 to increase sustainable production capacity to 4mb/d 2020. To this end, Kuwait is considering inviting the IOCs to return to the country in order to help meet its hydrocarbon targets via the somewhat controversial ‘Project Kuwait’.
Basic geology and topology
Kuwait lies in the prolific Arabian basin which contains some of the world’s largest and richest oil and gas accumulations. Predominantly an oil province, the principal reservoirs in Kuwait comprise Cretaceous carbonates and sandstones, although oil has more recently been produced from Jurassic formations. The principal reservoir is the Cretaceous Burgan Sandstone which has world class permeability and contains the majority of Kuwait’s giant oil fields. Source rock in Kuwait is Jurassic to Cretaceous in age and fields are dominated by oil, with relatively low gas content. Major oil plays include Burgan, Minagish, Umm Gudair and the Northern fields.
Regulation and History
Oil was first discovered in Kuwait in 1938 by the Kuwait Oil Company, a joint venture between the Anglo-Persian Oil Company (now BP) and Gulf Oil (now Chevron) with production starting in earnest following World War II. Nationalised in 1975, the State’s constitution was amended to forbid any future foreign ownership of Kuwait’s vast hydrocarbon resources. Since then, the only foreign participation has been in the Partitioned Zone and through service contracts which have been signed with IOCs at various interjections to assist Kuwait rebuild its upstream infrastructure. IOC’s including BP, Shell, and ChevronTexaco have maintained a presence in Kuwait through these service contracts. The partitioned or neutral zone is an area of land between Saudi Arabia and Kuwait with significant reserves (estimated at some 5 billion barrels) which are shared 50:50 between the two countries. To date Kuwait has only awarded licences under concession terms in the neutral zone to Japanese-owned Arabian Oil Company (AOC) in the offshore and to Aminoil in the onshore. However, both companies were eventually replaced by KOC as operator.
Oil and gas activities are primarily the responsibility of the Supreme Petroleum Council (SPC) which sets oil and gas strategy and oversees the operations of the Kuwait Petroleum Corporation (KPC). However, the state plays a direct role in the day to day activities of the hydrocarbon sector through the Minister of Oil who is responsible for providing the legislation which governs the industry, in addition to being the chairman of KPC and sitting on the board of SPC. The proposed re-entry of foreign companies is a very contentious point in the country and the parliament has been determined in its opposition to the proposal. The government is, however, determined to invite the IOCs to participate in developing the country’s resources in order to secure continued military support from those western countries involved. The presence of the IOCs would also help to maintain the production capacity and optimise the production lives of Kuwait’s major oil fields.
Key facts Oil production 2007E 2.6 mb/d Gas production 2007E 0.2mboe/d Oil reserves 2007E 101.5bn bbls Gas reserves 2007E 62.8 TCF Reserve life (oil) 106.9years Reserve life (gas) 122.9years GDP 2007E ($bn) $60bn GDP growth 2007E (%) 5% Population 2006 (m) 2.3m Oil consumption 2006E (b/d) 405kb/d Oil exports 2006E (mb/d) 2.4mb/d Fiscal regime OSA, Royalty, IT Marginal tax rate 55% Top 3 Oil fields (2007E) Greater Burgan 1,210kb/d Raudhatain 380kb/d Saudit-Kuwaiti Neutral Zone 286kb/d Top Producer (2006E) KOC 2.6mb/d Source: Wood Mackenzie, EIA, IMF
Oil production profile kb/d
0
500
1000
1500
2000
2500
3000
2000
2001
2002
2003
2004
2005
2006
2007
2008
2009
2010
2011
2012
2013
2014
2015
kb/d
Source: Wood Mackenzie
Remaining reserves split %
Oil91%
Gas9%
Source: Wood Mackenzie
Initial versus remaining reserves Remaing Gas
4%
Remaining Oil41%
Produced Oil50%
Produced Gas5%
Source: Wood Mackenzie
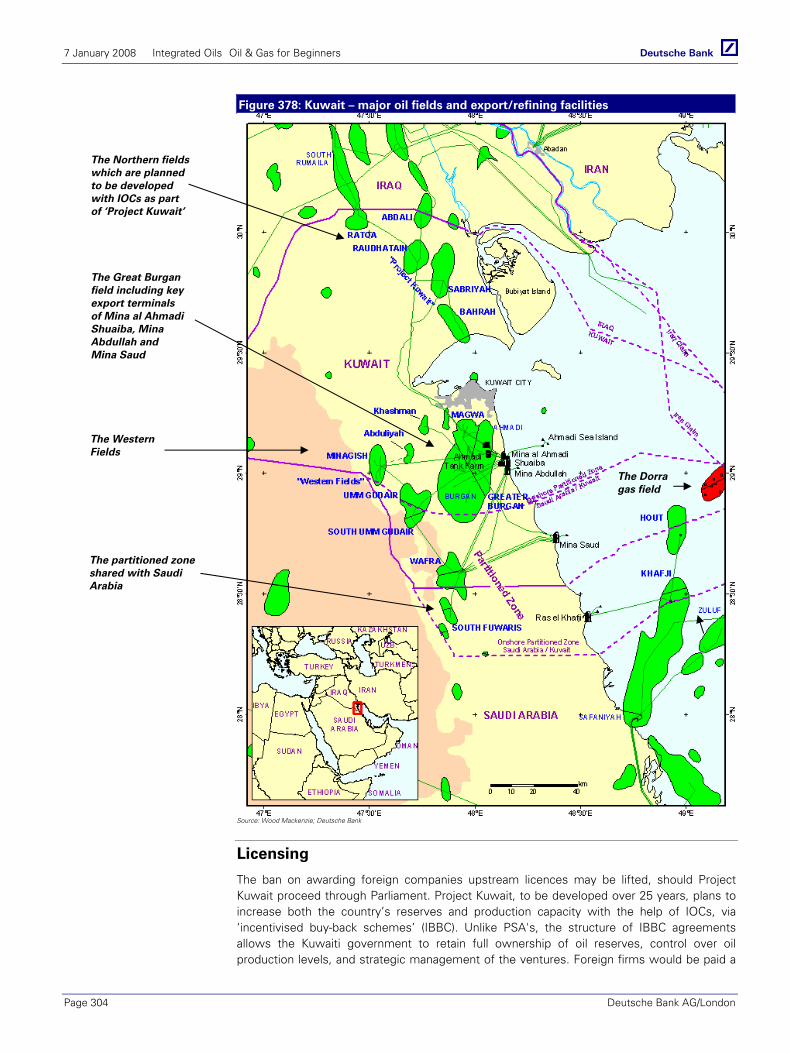
7 January 2008 Integrated Oils Oil & Gas for Beginners
Page 304 Deutsche Bank AG/London
Figure 378: Kuwait – major oil fields and export/refining facilities
Source: Wood Mackenzie; Deutsche Bank
Licensing
The ban on awarding foreign companies upstream licences may be lifted, should Project Kuwait proceed through Parliament. Project Kuwait, to be developed over 25 years, plans to increase both the country’s reserves and production capacity with the help of IOCs, via ‘incentivised buy-back schemes’ (IBBC). Unlike PSA's, the structure of IBBC agreements allows the Kuwaiti government to retain full ownership of oil reserves, control over oil production levels, and strategic management of the ventures. Foreign firms would be paid a
The Northern fields which are planned to be developed with IOCs as part of ‘Project Kuwait’
The partitioned zone shared with Saudi Arabia
The Dorra gas field
The Great Burgan field including key export terminals of Mina al Ahmadi Shuaiba, Mina Abdullah and Mina Saud
The Western Fields
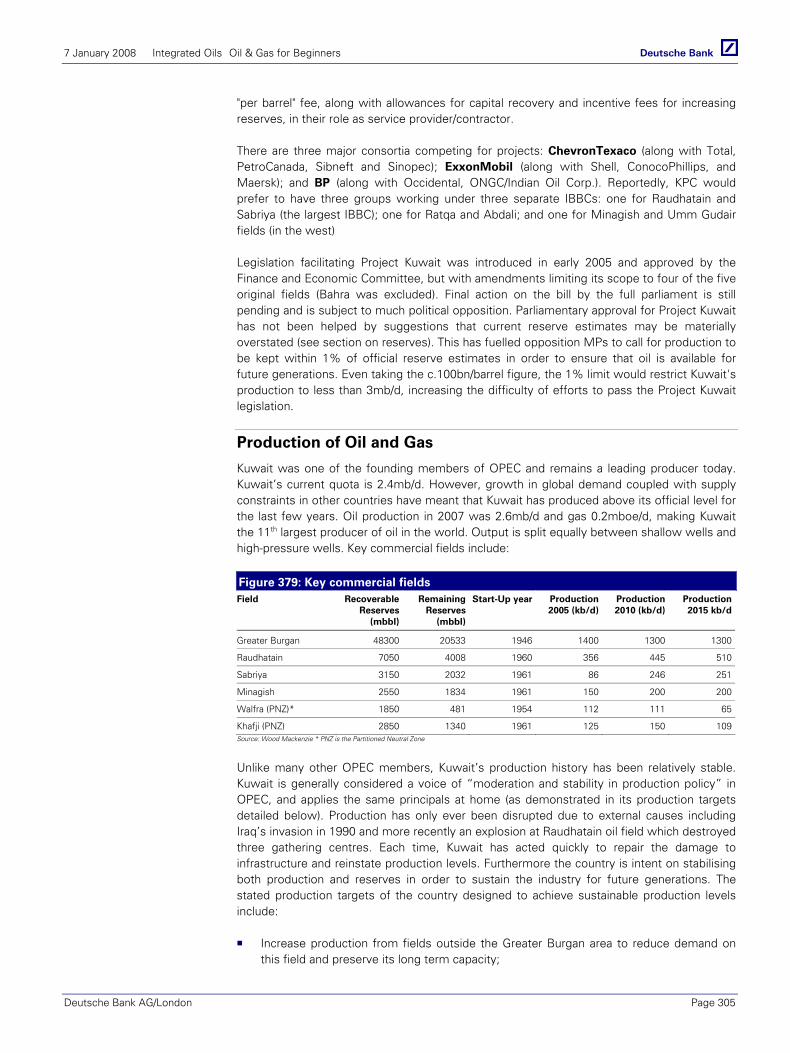
7 January 2008 Integrated Oils Oil & Gas for Beginners
Deutsche Bank AG/London Page 305
"per barrel" fee, along with allowances for capital recovery and incentive fees for increasing reserves, in their role as service provider/contractor.
There are three major consortia competing for projects: ChevronTexaco (along with Total, PetroCanada, Sibneft and Sinopec); ExxonMobil (along with Shell, ConocoPhillips, and Maersk); and BP (along with Occidental, ONGC/Indian Oil Corp.). Reportedly, KPC would prefer to have three groups working under three separate IBBCs: one for Raudhatain and Sabriya (the largest IBBC); one for Ratqa and Abdali; and one for Minagish and Umm Gudair fields (in the west)
Legislation facilitating Project Kuwait was introduced in early 2005 and approved by the Finance and Economic Committee, but with amendments limiting its scope to four of the five original fields (Bahra was excluded). Final action on the bill by the full parliament is still pending and is subject to much political opposition. Parliamentary approval for Project Kuwait has not been helped by suggestions that current reserve estimates may be materially overstated (see section on reserves). This has fuelled opposition MPs to call for production to be kept within 1% of official reserve estimates in order to ensure that oil is available for future generations. Even taking the c.100bn/barrel figure, the 1% limit would restrict Kuwait's production to less than 3mb/d, increasing the difficulty of efforts to pass the Project Kuwait legislation.
Production of Oil and Gas
Kuwait was one of the founding members of OPEC and remains a leading producer today. Kuwait’s current quota is 2.4mb/d. However, growth in global demand coupled with supply constraints in other countries have meant that Kuwait has produced above its official level for the last few years. Oil production in 2007 was 2.6mb/d and gas 0.2mboe/d, making Kuwait the 11th largest producer of oil in the world. Output is split equally between shallow wells and high-pressure wells. Key commercial fields include:
Figure 379: Key commercial fields Field Recoverable
Reserves (mbbl)
Remaining Reserves
(mbbl)
Start-Up year Production 2005 (kb/d)
Production 2010 (kb/d)
Production 2015 kb/d
Greater Burgan 48300 20533 1946 1400 1300 1300
Raudhatain 7050 4008 1960 356 445 510
Sabriya 3150 2032 1961 86 246 251
Minagish 2550 1834 1961 150 200 200
Walfra (PNZ)* 1850 481 1954 112 111 65
Khafji (PNZ) 2850 1340 1961 125 150 109Source: Wood Mackenzie * PNZ is the Partitioned Neutral Zone
Unlike many other OPEC members, Kuwait’s production history has been relatively stable. Kuwait is generally considered a voice of “moderation and stability in production policy” in OPEC, and applies the same principals at home (as demonstrated in its production targets detailed below). Production has only ever been disrupted due to external causes including Iraq’s invasion in 1990 and more recently an explosion at Raudhatain oil field which destroyed three gathering centres. Each time, Kuwait has acted quickly to repair the damage to infrastructure and reinstate production levels. Furthermore the country is intent on stabilising both production and reserves in order to sustain the industry for future generations. The stated production targets of the country designed to achieve sustainable production levels include:
Increase production from fields outside the Greater Burgan area to reduce demand on this field and preserve its long term capacity;
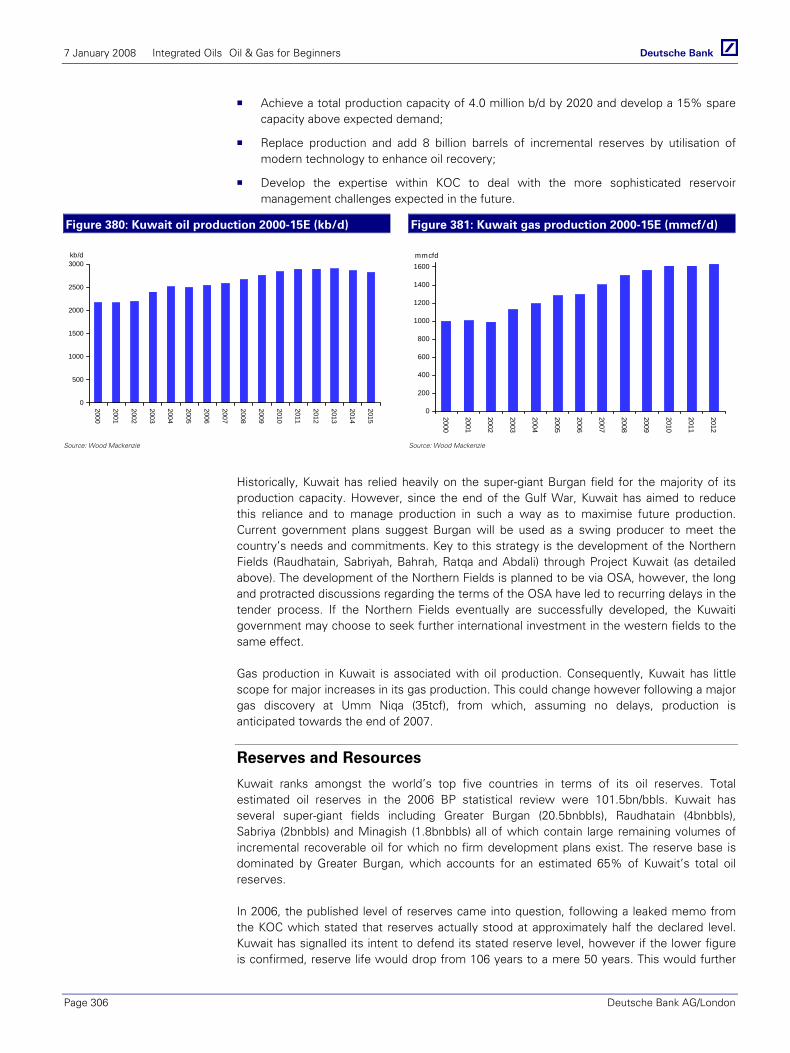
7 January 2008 Integrated Oils Oil & Gas for Beginners
Page 306 Deutsche Bank AG/London
Achieve a total production capacity of 4.0 million b/d by 2020 and develop a 15% spare capacity above expected demand;
Replace production and add 8 billion barrels of incremental reserves by utilisation of modern technology to enhance oil recovery;
Develop the expertise within KOC to deal with the more sophisticated reservoir management challenges expected in the future.
Figure 380: Kuwait oil production 2000-15E (kb/d) Figure 381: Kuwait gas production 2000-15E (mmcf/d)
0
500
1000
1500
2000
2500
3000
2000
2001
2002
2003
2004
2005
2006
2007
2008
2009
2010
2011
2012
2013
2014
2015
kb/d
0
200
400
600
800
1000
1200
1400
1600
2000
2001
2002
2003
2004
2005
2006
2007
2008
2009
2010
2011
2012
mmcfd
Source: Wood Mackenzie Source: Wood Mackenzie
Historically, Kuwait has relied heavily on the super-giant Burgan field for the majority of its production capacity. However, since the end of the Gulf War, Kuwait has aimed to reduce this reliance and to manage production in such a way as to maximise future production. Current government plans suggest Burgan will be used as a swing producer to meet the country’s needs and commitments. Key to this strategy is the development of the Northern Fields (Raudhatain, Sabriyah, Bahrah, Ratqa and Abdali) through Project Kuwait (as detailed above). The development of the Northern Fields is planned to be via OSA, however, the long and protracted discussions regarding the terms of the OSA have led to recurring delays in the tender process. If the Northern Fields eventually are successfully developed, the Kuwaiti government may choose to seek further international investment in the western fields to the same effect.
Gas production in Kuwait is associated with oil production. Consequently, Kuwait has little scope for major increases in its gas production. This could change however following a major gas discovery at Umm Niqa (35tcf), from which, assuming no delays, production is anticipated towards the end of 2007.
Reserves and Resources
Kuwait ranks amongst the world’s top five countries in terms of its oil reserves. Total estimated oil reserves in the 2006 BP statistical review were 101.5bn/bbls. Kuwait has several super-giant fields including Greater Burgan (20.5bnbbls), Raudhatain (4bnbbls), Sabriya (2bnbbls) and Minagish (1.8bnbbls) all of which contain large remaining volumes of incremental recoverable oil for which no firm development plans exist. The reserve base is dominated by Greater Burgan, which accounts for an estimated 65% of Kuwait’s total oil reserves.
In 2006, the published level of reserves came into question, following a leaked memo from the KOC which stated that reserves actually stood at approximately half the declared level. Kuwait has signalled its intent to defend its stated reserve level, however if the lower figure is confirmed, reserve life would drop from 106 years to a mere 50 years. This would further

7 January 2008 Integrated Oils Oil & Gas for Beginners
Deutsche Bank AG/London Page 307
decrease (to approx 30 years) were production levels increased to the government’s 4mb/d target.
Given the majority of Kuwait’s oil fields have been producing for more than sixty years, field maturity is becoming an issue. One aspect of Project Kuwait is thus to gain access to expertise in Enhanced Oil Recovery (EOR) techniques. Agreements to assist in developing EOR have already been reached with Chevron, ExxonMobil and the Japan National Oil Corporation (JNOC).
Kuwait’s total gas reserves are estimated at c.68TCF, the majority of which was associated gas until the discovery of Umm Niqa (35tcf) in 2005. Until this discovery the Dorra field (7tcf), located in the offshore Partitioned Zone, was Kuwait's only significant non-associated gas field. Due to the field's location, close to the disputed border between Iran and the Partitioned Zone, the Dorra field has yet to be developed.
Pipelines and Infrastructure
Given Kuwait’s long history of oil production and exports, the country correspondingly has an established, if somewhat aging, network of oil and gas pipeline infrastructure that links the country’s oil fields to its refineries and export terminals. Most of Kuwait’s onshore oil is gathered from individual wellheads and transferred directly to one of the dedicated gathering centres. It is then piped to the Central Mixing Manifold (CMM) for blending at the Burgan field, prior to transfer to the Ahmadi tank farms. Significant portions of Kuwait’s infrastructure were damaged during the Gulf War and again following a major explosion at the Raudhatain field. This damage was quickly repaired and capacity reinstated to normal levels.
Kuwait’s position on the western coast of the Arabian Gulf means that export of crude oil to world markets is relatively easy. Kuwait has four export terminals which are all located on the Arabian Gulf coast. The main export terminal is centred around Mina al-Ahmadi (2.7mb/d) which exports both crude and refined products. Shuaiba (733kb/d) and Mina Abdallah (1.5mb/d) and Mina al Zour (1.0mb/d) are also significant export terminals.
Prior to the development of the first LPG plant at Ahmadi in the late 1970's, the majority of Kuwait's gas production was flared. Today, however, Kuwait's associated gas is collected via a network of pipelines and processing facilities. Gas is separated from oil at the gathering centres situated across the major fields and then piped to LPG plants situated at Ahmadi and Shuaiba. The offshore Partitioned Zone produces large volumes of gas (capacity of 300mmcf/d) which is then piped to offshore facilities at Khafji and Hout and then to Mina Saud. The bulk of Kuwait's LPG production is exported to the Asian market
Crude Oil Blends and Quality
Kuwait’s crudes are generally of low to medium gravity (19-35˚ API) with moderate to high sulphur content (1-4%). The plans to increase production by developing the Northern Fields which contain significant volumes of heavy crude could see the characteristics of Kuwaiti crude change in coming years
Figure 382: Main crude streams and loading points Crude Oil Loading Point Gravity (˚API) Sulphur (%)
Kuwait Blend Mina al Ahmadj 32.4 2.55
Khafji (PNZ) Ras al Khafji 28.5 2.85
Walfra (PNZ) Mina Saud 24.2 4.00Source: Wood Mackenzie
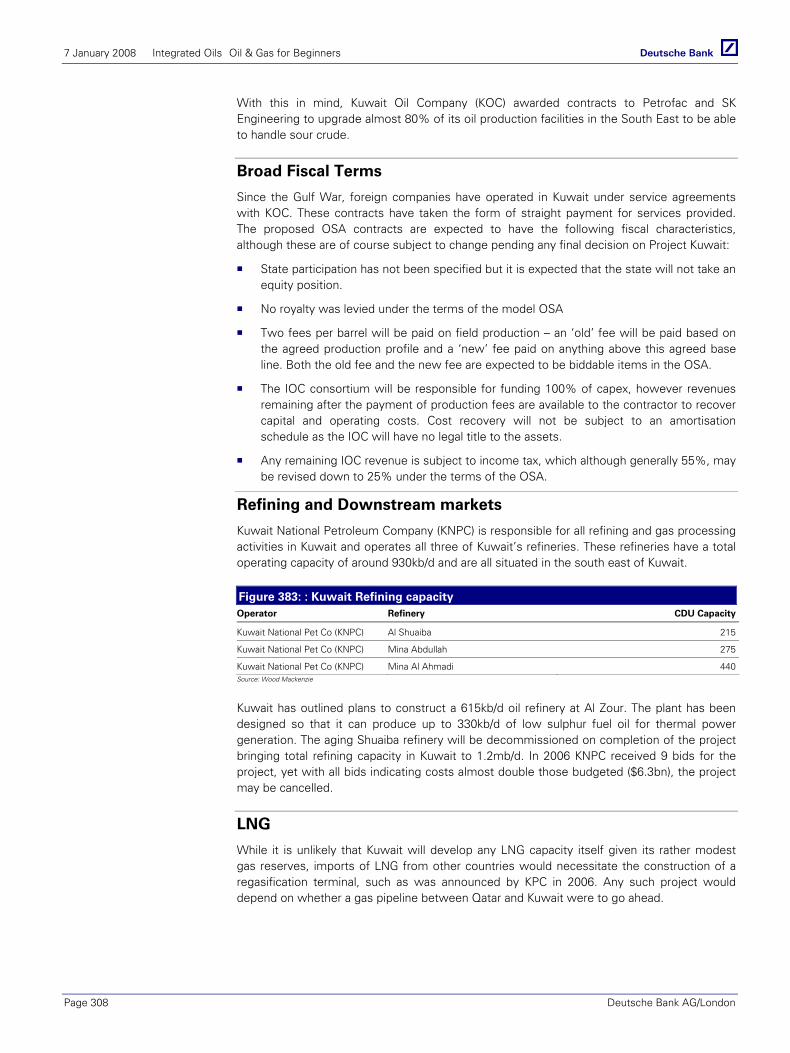
7 January 2008 Integrated Oils Oil & Gas for Beginners
Page 308 Deutsche Bank AG/London
With this in mind, Kuwait Oil Company (KOC) awarded contracts to Petrofac and SK Engineering to upgrade almost 80% of its oil production facilities in the South East to be able to handle sour crude.
Broad Fiscal Terms
Since the Gulf War, foreign companies have operated in Kuwait under service agreements with KOC. These contracts have taken the form of straight payment for services provided. The proposed OSA contracts are expected to have the following fiscal characteristics, although these are of course subject to change pending any final decision on Project Kuwait:
State participation has not been specified but it is expected that the state will not take an equity position.
No royalty was levied under the terms of the model OSA
Two fees per barrel will be paid on field production – an ‘old’ fee will be paid based on the agreed production profile and a ‘new’ fee paid on anything above this agreed base line. Both the old fee and the new fee are expected to be biddable items in the OSA.
The IOC consortium will be responsible for funding 100% of capex, however revenues remaining after the payment of production fees are available to the contractor to recover capital and operating costs. Cost recovery will not be subject to an amortisation schedule as the IOC will have no legal title to the assets.
Any remaining IOC revenue is subject to income tax, which although generally 55%, may be revised down to 25% under the terms of the OSA.
Refining and Downstream markets
Kuwait National Petroleum Company (KNPC) is responsible for all refining and gas processing activities in Kuwait and operates all three of Kuwait’s refineries. These refineries have a total operating capacity of around 930kb/d and are all situated in the south east of Kuwait.
Figure 383: : Kuwait Refining capacity Operator Refinery CDU Capacity
Kuwait National Pet Co (KNPC) Al Shuaiba 215
Kuwait National Pet Co (KNPC) Mina Abdullah 275
Kuwait National Pet Co (KNPC) Mina Al Ahmadi 440Source: Wood Mackenzie
Kuwait has outlined plans to construct a 615kb/d oil refinery at Al Zour. The plant has been designed so that it can produce up to 330kb/d of low sulphur fuel oil for thermal power generation. The aging Shuaiba refinery will be decommissioned on completion of the project bringing total refining capacity in Kuwait to 1.2mb/d. In 2006 KNPC received 9 bids for the project, yet with all bids indicating costs almost double those budgeted ($6.3bn), the project may be cancelled.
LNG
While it is unlikely that Kuwait will develop any LNG capacity itself given its rather modest gas reserves, imports of LNG from other countries would necessitate the construction of a regasification terminal, such as was announced by KPC in 2006. Any such project would depend on whether a gas pipeline between Qatar and Kuwait were to go ahead.

7 January 2008 Integrated Oils Oil & Gas for Beginners
Deutsche Bank AG/London Page 309
Kuwait - Notes

7 January 2008 Integrated Oils Oil & Gas for Beginners
Page 310 Deutsche Bank AG/London
Kuwait - Notes
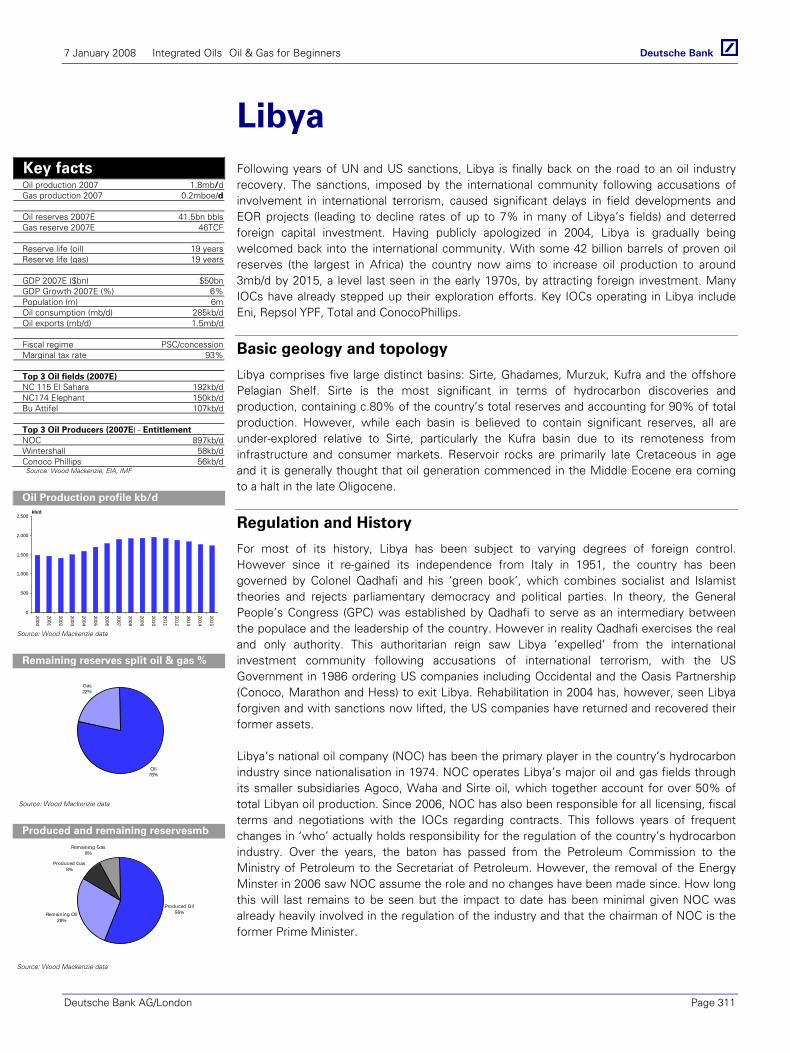
7 January 2008 Integrated Oils Oil & Gas for Beginners
Deutsche Bank AG/London Page 311
Libya Following years of UN and US sanctions, Libya is finally back on the road to an oil industry recovery. The sanctions, imposed by the international community following accusations of involvement in international terrorism, caused significant delays in field developments and EOR projects (leading to decline rates of up to 7% in many of Libya’s fields) and deterred foreign capital investment. Having publicly apologized in 2004, Libya is gradually being welcomed back into the international community. With some 42 billion barrels of proven oil reserves (the largest in Africa) the country now aims to increase oil production to around 3mb/d by 2015, a level last seen in the early 1970s, by attracting foreign investment. Many IOCs have already stepped up their exploration efforts. Key IOCs operating in Libya include Eni, Repsol YPF, Total and ConocoPhillips.
Basic geology and topology
Libya comprises five large distinct basins: Sirte, Ghadames, Murzuk, Kufra and the offshore Pelagian Shelf. Sirte is the most significant in terms of hydrocarbon discoveries and production, containing c.80% of the country’s total reserves and accounting for 90% of total production. However, while each basin is believed to contain significant reserves, all are under-explored relative to Sirte, particularly the Kufra basin due to its remoteness from infrastructure and consumer markets. Reservoir rocks are primarily late Cretaceous in age and it is generally thought that oil generation commenced in the Middle Eocene era coming to a halt in the late Oligocene.
Regulation and History
For most of its history, Libya has been subject to varying degrees of foreign control. However since it re-gained its independence from Italy in 1951, the country has been governed by Colonel Qadhafi and his ‘green book’, which combines socialist and Islamist theories and rejects parliamentary democracy and political parties. In theory, the General People’s Congress (GPC) was established by Qadhafi to serve as an intermediary between the populace and the leadership of the country. However in reality Qadhafi exercises the real and only authority. This authoritarian reign saw Libya ‘expelled’ from the international investment community following accusations of international terrorism, with the US Government in 1986 ordering US companies including Occidental and the Oasis Partnership (Conoco, Marathon and Hess) to exit Libya. Rehabilitation in 2004 has, however, seen Libya forgiven and with sanctions now lifted, the US companies have returned and recovered their former assets.
Libya’s national oil company (NOC) has been the primary player in the country’s hydrocarbon industry since nationalisation in 1974. NOC operates Libya’s major oil and gas fields through its smaller subsidiaries Agoco, Waha and Sirte oil, which together account for over 50% of total Libyan oil production. Since 2006, NOC has also been responsible for all licensing, fiscal terms and negotiations with the IOCs regarding contracts. This follows years of frequent changes in ‘who’ actually holds responsibility for the regulation of the country’s hydrocarbon industry. Over the years, the baton has passed from the Petroleum Commission to the Ministry of Petroleum to the Secretariat of Petroleum. However, the removal of the Energy Minster in 2006 saw NOC assume the role and no changes have been made since. How long this will last remains to be seen but the impact to date has been minimal given NOC was already heavily involved in the regulation of the industry and that the chairman of NOC is the former Prime Minister.
Key facts Oil production 2007 1.8mb/d Gas production 2007 0.2mboe/d Oil reserves 2007E 41.5bn bbls Gas reserve 2007E 46TCF
Reserve life (oil) 19 years Reserve life (gas) 19 years
GDP 2007E ($bn) $50bn GDP Growth 2007E (%) 6% Population (m) 6m Oil consumption (mb/d) 285kb/d Oil exports (mb/d) 1.5mb/d
Fiscal regime PSC/concession Marginal tax rate 93%
Top 3 Oil fields (2007E) NC 115 El Sahara 192kb/d NC174 Elephant 150kb/d Bu Attifel 107kb/d
Top 3 Oil Producers (2007E) - Entitlement NOC 897kb/d Wintershall 58kb/d Conoco Phillips 56kb/d Source: Wood Mackenzie, EIA, IMF
Oil Production profile kb/d
0
500
1,000
1,500
2,000
2,500
2000
2001
2002
2003
2004
2005
2006
2007
2008
2009
2010
2011
2012
2013
2014
2015
kb/d
Source: Wood Mackenzie data
Remaining reserves split oil & gas %
Oil78%
Gas22%
Source: Wood Mackenzie data
Produced and remaining reservesmb
Produced Oil56%Remaining Oil
28%
Produced Gas8%
Remaining Gas8%
Source: Wood Mackenzie data
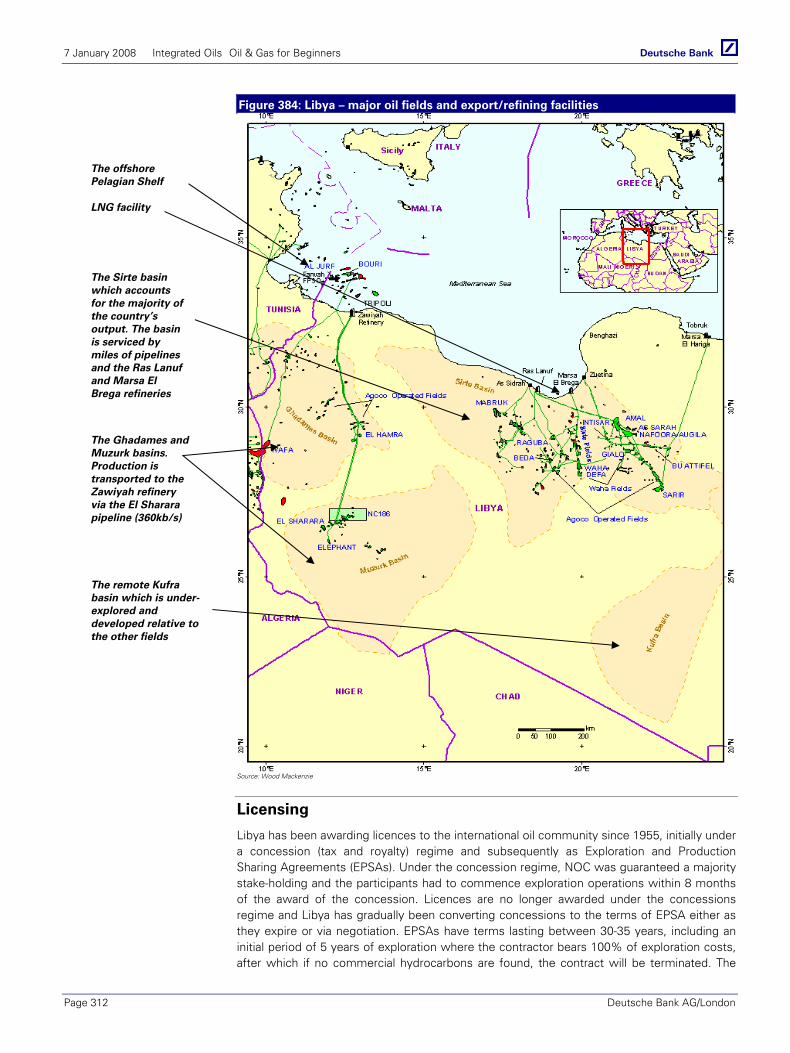
7 January 2008 Integrated Oils Oil & Gas for Beginners
Page 312 Deutsche Bank AG/London
Figure 384: Libya – major oil fields and export/refining facilities
Source: Wood Mackenzie
Licensing
Libya has been awarding licences to the international oil community since 1955, initially under a concession (tax and royalty) regime and subsequently as Exploration and Production Sharing Agreements (EPSAs). Under the concession regime, NOC was guaranteed a majority stake-holding and the participants had to commence exploration operations within 8 months of the award of the concession. Licences are no longer awarded under the concessions regime and Libya has gradually been converting concessions to the terms of EPSA either as they expire or via negotiation. EPSAs have terms lasting between 30-35 years, including an initial period of 5 years of exploration where the contractor bears 100% of exploration costs, after which if no commercial hydrocarbons are found, the contract will be terminated. The
The offshore Pelagian Shelf LNG facility
The remote Kufra basin which is under-explored and developed relative to the other fields
The Sirte basin which accounts for the majority of the country’s output. The basin is serviced by miles of pipelines and the Ras Lanuf and Marsa El Brega refineries
The Ghadames and Muzurk basins. Production is transported to the Zawiyah refinery via the El Sharara pipeline (360kb/s)
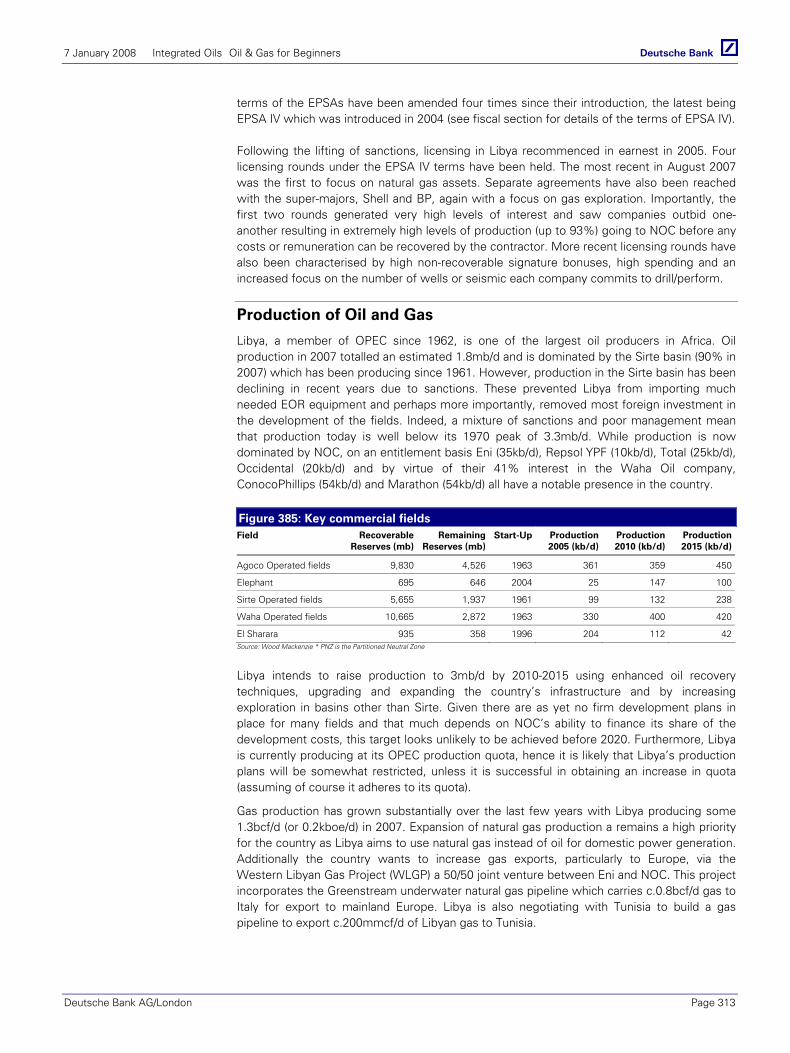
7 January 2008 Integrated Oils Oil & Gas for Beginners
Deutsche Bank AG/London Page 313
terms of the EPSAs have been amended four times since their introduction, the latest being EPSA IV which was introduced in 2004 (see fiscal section for details of the terms of EPSA IV).
Following the lifting of sanctions, licensing in Libya recommenced in earnest in 2005. Four licensing rounds under the EPSA IV terms have been held. The most recent in August 2007 was the first to focus on natural gas assets. Separate agreements have also been reached with the super-majors, Shell and BP, again with a focus on gas exploration. Importantly, the first two rounds generated very high levels of interest and saw companies outbid one-another resulting in extremely high levels of production (up to 93%) going to NOC before any costs or remuneration can be recovered by the contractor. More recent licensing rounds have also been characterised by high non-recoverable signature bonuses, high spending and an increased focus on the number of wells or seismic each company commits to drill/perform.
Production of Oil and Gas
Libya, a member of OPEC since 1962, is one of the largest oil producers in Africa. Oil production in 2007 totalled an estimated 1.8mb/d and is dominated by the Sirte basin (90% in 2007) which has been producing since 1961. However, production in the Sirte basin has been declining in recent years due to sanctions. These prevented Libya from importing much needed EOR equipment and perhaps more importantly, removed most foreign investment in the development of the fields. Indeed, a mixture of sanctions and poor management mean that production today is well below its 1970 peak of 3.3mb/d. While production is now dominated by NOC, on an entitlement basis Eni (35kb/d), Repsol YPF (10kb/d), Total (25kb/d), Occidental (20kb/d) and by virtue of their 41% interest in the Waha Oil company, ConocoPhillips (54kb/d) and Marathon (54kb/d) all have a notable presence in the country.
Figure 385: Key commercial fields Field Recoverable
Reserves (mb)Remaining
Reserves (mb)Start-Up Production
2005 (kb/d) Production 2010 (kb/d)
Production 2015 (kb/d)
Agoco Operated fields 9,830 4,526 1963 361 359 450
Elephant 695 646 2004 25 147 100
Sirte Operated fields 5,655 1,937 1961 99 132 238
Waha Operated fields 10,665 2,872 1963 330 400 420
El Sharara 935 358 1996 204 112 42Source: Wood Mackenzie * PNZ is the Partitioned Neutral Zone
Libya intends to raise production to 3mb/d by 2010-2015 using enhanced oil recovery techniques, upgrading and expanding the country’s infrastructure and by increasing exploration in basins other than Sirte. Given there are as yet no firm development plans in place for many fields and that much depends on NOC’s ability to finance its share of the development costs, this target looks unlikely to be achieved before 2020. Furthermore, Libya is currently producing at its OPEC production quota, hence it is likely that Libya’s production plans will be somewhat restricted, unless it is successful in obtaining an increase in quota (assuming of course it adheres to its quota).
Gas production has grown substantially over the last few years with Libya producing some 1.3bcf/d (or 0.2kboe/d) in 2007. Expansion of natural gas production a remains a high priority for the country as Libya aims to use natural gas instead of oil for domestic power generation. Additionally the country wants to increase gas exports, particularly to Europe, via the Western Libyan Gas Project (WLGP) a 50/50 joint venture between Eni and NOC. This project incorporates the Greenstream underwater natural gas pipeline which carries c.0.8bcf/d gas to Italy for export to mainland Europe. Libya is also negotiating with Tunisia to build a gas pipeline to export c.200mmcf/d of Libyan gas to Tunisia.
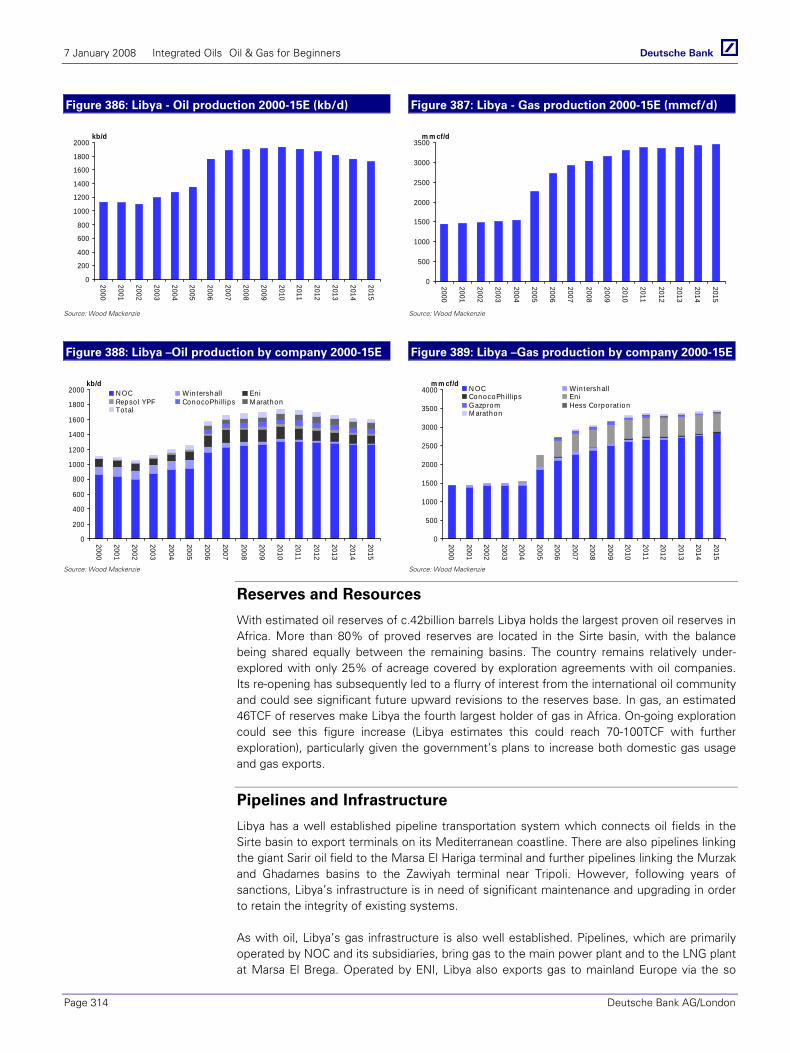
7 January 2008 Integrated Oils Oil & Gas for Beginners
Page 314 Deutsche Bank AG/London
Figure 386: Libya - Oil production 2000-15E (kb/d) Figure 387: Libya - Gas production 2000-15E (mmcf/d)
0
200
400
600
800
1000
1200
1400
1600
1800
2000
2000
2001
2002
2003
2004
2005
2006
2007
2008
2009
2010
2011
2012
2013
2014
2015
kb/d
0
500
1000
1500
2000
2500
3000
3500
2000
2001
2002
2003
2004
2005
2006
2007
2008
2009
2010
2011
2012
2013
2014
2015
m m cf/d
Source: Wood Mackenzie Source: Wood Mackenzie
Figure 388: Libya –Oil production by company 2000-15E Figure 389: Libya –Gas production by company 2000-15E
0
200
400
600
800
1000
1200
1400
1600
1800
2000
2000
2001
2002
2003
2004
2005
2006
2007
2008
2009
2010
2011
2012
2013
2014
2015
kb/dN OC Wintershall En iRepso l YPF ConocoPhillips M arathonTotal
0
500
1000
1500
2000
2500
3000
3500
4000
2000
2001
2002
2003
2004
2005
2006
2007
2008
2009
2010
2011
2012
2013
2014
2015
m m cf/dN OC WintershallConocoPh illips En iGazprom Hess Corporat ionM arathon
Source: Wood Mackenzie Source: Wood Mackenzie
Reserves and Resources
With estimated oil reserves of c.42billion barrels Libya holds the largest proven oil reserves in Africa. More than 80% of proved reserves are located in the Sirte basin, with the balance being shared equally between the remaining basins. The country remains relatively under-explored with only 25% of acreage covered by exploration agreements with oil companies. Its re-opening has subsequently led to a flurry of interest from the international oil community and could see significant future upward revisions to the reserves base. In gas, an estimated 46TCF of reserves make Libya the fourth largest holder of gas in Africa. On-going exploration could see this figure increase (Libya estimates this could reach 70-100TCF with further exploration), particularly given the government’s plans to increase both domestic gas usage and gas exports.
Pipelines and Infrastructure
Libya has a well established pipeline transportation system which connects oil fields in the Sirte basin to export terminals on its Mediterranean coastline. There are also pipelines linking the giant Sarir oil field to the Marsa El Hariga terminal and further pipelines linking the Murzak and Ghadames basins to the Zawiyah terminal near Tripoli. However, following years of sanctions, Libya’s infrastructure is in need of significant maintenance and upgrading in order to retain the integrity of existing systems.
As with oil, Libya’s gas infrastructure is also well established. Pipelines, which are primarily operated by NOC and its subsidiaries, bring gas to the main power plant and to the LNG plant at Marsa El Brega. Operated by ENI, Libya also exports gas to mainland Europe via the so
7 January 2008 Integrated Oils Oil & Gas for Beginners
Deutsche Bank AG/London Page 315
called Green Stream pipeline which runs from Mellitah to Sicily and represents the export link of ENI’s West Libya Gas Project (which connects the NC41 and Wafa gas fields to the Mellitah processing plant). Additional export gas pipelines are planned to Tunisia, and Libya is also in on-going discussions with Egypt regarding the construction of a gas pipeline between Libya and Egypt.
Figure 390: Libya – Key domestic oil pipelines Pipeline Operator Length km Capacity kb/d Utilisation %
Intisar A-Zueitina Occidental 220 1000 15
Dahra-As Sidrah Waha Oil Company 138 823 20
Nasser-Brega Sirte Oil Company 171 805 20
Sarir-Marsa El Hariga Agoco 509 505 50
Amal-Ras Lanuf Agoco 273 420 25Source: Wood Mackenzie
Crude Oil Blends and Quality
Libya’s crudes are generally of high quality, being predominantly light (26-43˚ API) and sweet (0-2%). The Bouri blend is the heaviest and sourest with an API of 26.3˚ and 1.91% sulphur content. In total, almost 60% of current production is light and sweet and Wood Mackenzie forecast this to increase to 75% by 2020. The country exports nine different blends, the main ones being:
Figure 391: Main crude streams and loading points Crude Oil Loading Point Gravity (˚API) Sulphur (%)
Zueitina Zueitina 41.5 0.31
Es Sider Es Sider 36.3 0.44
El Sharara Zawiyah terminal 43.1 0.07Source: Wood Mackenzie
The lighter, sweeter grades are generally sold to Europe, with the heavier crudes often being exported to Asian markets. The majority of Libyan oil is sold on a term basis to various companies, including major European IOCs and refiners.
Broad Fiscal Terms
While a small number of Libya’s oldest producing assets continue to operate under vintage concession terms, the majority of recent discoveries are governed by Exploration and Production Sharing Agreements (EPSAs).
Concessions: Under all concession agreements the NOC is the majority stakeholder with 51% in the license. Concessions do not involve payment of any signature bonus and are subject to royalty and other production taxes. Royalty is typically 16.67% of the value of the recovered crude and is a deductible operating expense for tax purposes. The corporate tax rate for concessions is not fixed and will vary. The contractor is, however, guaranteed 6.5% of gross revenues for remuneration.
PSAs: Libya’s EPSAs are fundamentally different in structure to other PSAs in that the government takes a large share of production ‘off the top’. The percentage of production the contractor seeks in order to recover costs and for remuneration (the production allocation) is the primary biddable parameter in the award of licenses. The subsequent profit-oil split is determined by NOC for each licence and will depend typically on production rates and the payback ratio. High levels of competition in the first EPSA IV round resulted in IOC production shares of 10-20%, which dropped as low as 7% in the second licensing round i.e. NOC receives 93% of production before any contractor costs (or remuneration) can be recovered, implying the contractor is unlikely to recover its
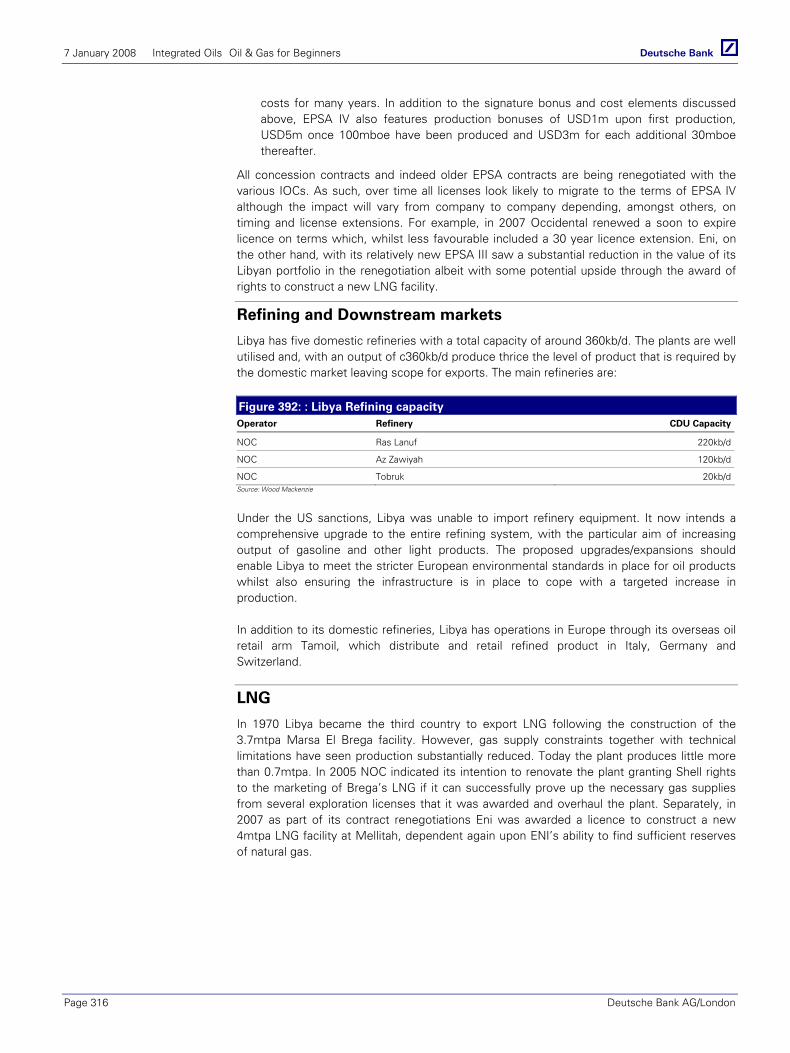
7 January 2008 Integrated Oils Oil & Gas for Beginners
Page 316 Deutsche Bank AG/London
costs for many years. In addition to the signature bonus and cost elements discussed above, EPSA IV also features production bonuses of USD1m upon first production, USD5m once 100mboe have been produced and USD3m for each additional 30mboe thereafter.
All concession contracts and indeed older EPSA contracts are being renegotiated with the various IOCs. As such, over time all licenses look likely to migrate to the terms of EPSA IV although the impact will vary from company to company depending, amongst others, on timing and license extensions. For example, in 2007 Occidental renewed a soon to expire licence on terms which, whilst less favourable included a 30 year licence extension. Eni, on the other hand, with its relatively new EPSA III saw a substantial reduction in the value of its Libyan portfolio in the renegotiation albeit with some potential upside through the award of rights to construct a new LNG facility.
Refining and Downstream markets
Libya has five domestic refineries with a total capacity of around 360kb/d. The plants are well utilised and, with an output of c360kb/d produce thrice the level of product that is required by the domestic market leaving scope for exports. The main refineries are:
Figure 392: : Libya Refining capacity Operator Refinery CDU Capacity
NOC Ras Lanuf 220kb/d
NOC Az Zawiyah 120kb/d
NOC Tobruk 20kb/dSource: Wood Mackenzie
Under the US sanctions, Libya was unable to import refinery equipment. It now intends a comprehensive upgrade to the entire refining system, with the particular aim of increasing output of gasoline and other light products. The proposed upgrades/expansions should enable Libya to meet the stricter European environmental standards in place for oil products whilst also ensuring the infrastructure is in place to cope with a targeted increase in production.
In addition to its domestic refineries, Libya has operations in Europe through its overseas oil retail arm Tamoil, which distribute and retail refined product in Italy, Germany and Switzerland.
LNG
In 1970 Libya became the third country to export LNG following the construction of the 3.7mtpa Marsa El Brega facility. However, gas supply constraints together with technical limitations have seen production substantially reduced. Today the plant produces little more than 0.7mtpa. In 2005 NOC indicated its intention to renovate the plant granting Shell rights to the marketing of Brega’s LNG if it can successfully prove up the necessary gas supplies from several exploration licenses that it was awarded and overhaul the plant. Separately, in 2007 as part of its contract renegotiations Eni was awarded a licence to construct a new 4mtpa LNG facility at Mellitah, dependent again upon ENI’s ability to find sufficient reserves of natural gas.

7 January 2008 Integrated Oils Oil & Gas for Beginners
Deutsche Bank AG/London Page 317
Libya - Notes

7 January 2008 Integrated Oils Oil & Gas for Beginners
Page 318 Deutsche Bank AG/London
Libya - Notes
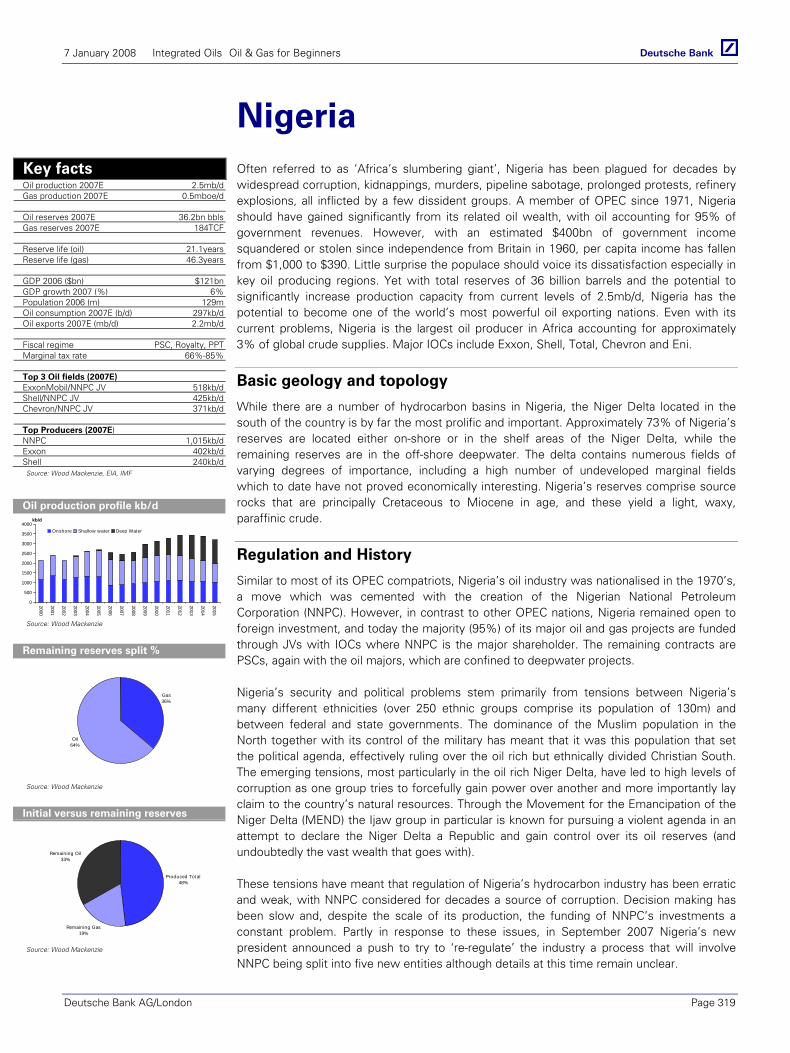
7 January 2008 Integrated Oils Oil & Gas for Beginners
Deutsche Bank AG/London Page 319
Nigeria Often referred to as ‘Africa’s slumbering giant’, Nigeria has been plagued for decades by widespread corruption, kidnappings, murders, pipeline sabotage, prolonged protests, refinery explosions, all inflicted by a few dissident groups. A member of OPEC since 1971, Nigeria should have gained significantly from its related oil wealth, with oil accounting for 95% of government revenues. However, with an estimated $400bn of government income squandered or stolen since independence from Britain in 1960, per capita income has fallen from $1,000 to $390. Little surprise the populace should voice its dissatisfaction especially in key oil producing regions. Yet with total reserves of 36 billion barrels and the potential to significantly increase production capacity from current levels of 2.5mb/d, Nigeria has the potential to become one of the world’s most powerful oil exporting nations. Even with its current problems, Nigeria is the largest oil producer in Africa accounting for approximately 3% of global crude supplies. Major IOCs include Exxon, Shell, Total, Chevron and Eni.
Basic geology and topology
While there are a number of hydrocarbon basins in Nigeria, the Niger Delta located in the south of the country is by far the most prolific and important. Approximately 73% of Nigeria’s reserves are located either on-shore or in the shelf areas of the Niger Delta, while the remaining reserves are in the off-shore deepwater. The delta contains numerous fields of varying degrees of importance, including a high number of undeveloped marginal fields which to date have not proved economically interesting. Nigeria’s reserves comprise source rocks that are principally Cretaceous to Miocene in age, and these yield a light, waxy, paraffinic crude.
Regulation and History
Similar to most of its OPEC compatriots, Nigeria’s oil industry was nationalised in the 1970’s, a move which was cemented with the creation of the Nigerian National Petroleum Corporation (NNPC). However, in contrast to other OPEC nations, Nigeria remained open to foreign investment, and today the majority (95%) of its major oil and gas projects are funded through JVs with IOCs where NNPC is the major shareholder. The remaining contracts are PSCs, again with the oil majors, which are confined to deepwater projects.
Nigeria’s security and political problems stem primarily from tensions between Nigeria’s many different ethnicities (over 250 ethnic groups comprise its population of 130m) and between federal and state governments. The dominance of the Muslim population in the North together with its control of the military has meant that it was this population that set the political agenda, effectively ruling over the oil rich but ethnically divided Christian South. The emerging tensions, most particularly in the oil rich Niger Delta, have led to high levels of corruption as one group tries to forcefully gain power over another and more importantly lay claim to the country’s natural resources. Through the Movement for the Emancipation of the Niger Delta (MEND) the Ijaw group in particular is known for pursuing a violent agenda in an attempt to declare the Niger Delta a Republic and gain control over its oil reserves (and undoubtedly the vast wealth that goes with).
These tensions have meant that regulation of Nigeria’s hydrocarbon industry has been erratic and weak, with NNPC considered for decades a source of corruption. Decision making has been slow and, despite the scale of its production, the funding of NNPC’s investments a constant problem. Partly in response to these issues, in September 2007 Nigeria’s new president announced a push to try to ‘re-regulate’ the industry a process that will involve NNPC being split into five new entities although details at this time remain unclear.
Key facts Oil production 2007E 2.5mb/d Gas production 2007E 0.5mboe/d Oil reserves 2007E 36.2bn bbls Gas reserves 2007E 184TCF Reserve life (oil) 21.1years Reserve life (gas) 46.3years GDP 2006 ($bn) $121bn GDP growth 2007 (%) 6% Population 2006 (m) 129m Oil consumption 2007E (b/d) 297kb/d Oil exports 2007E (mb/d) 2.2mb/d Fiscal regime PSC, Royalty, PPT Marginal tax rate 66%-85% Top 3 Oil fields (2007E) ExxonMobil/NNPC JV 518kb/d Shell/NNPC JV 425kb/d Chevron/NNPC JV 371kb/d Top Producers (2007E) NNPC 1,015kb/d Exxon 402kb/d Shell 240kb/d Source: Wood Mackenzie, EIA, IMF
Oil production profile kb/d
0
500
1000
1500
2000
2500
3000
3500
4000
2000
2001
2002
2003
2004
2005
2006
2007
2008
2009
2010
2011
2012
2013
2014
2015
kb/d
Onshore Shallow water Deep Water
Source: Wood Mackenzie
Remaining reserves split %
Gas36%
Oil64%
Source: Wood Mackenzie
Initial versus remaining reserves
Produced Total48%
Remaining Gas19%
Remaining Oil33%
Source: Wood Mackenzie
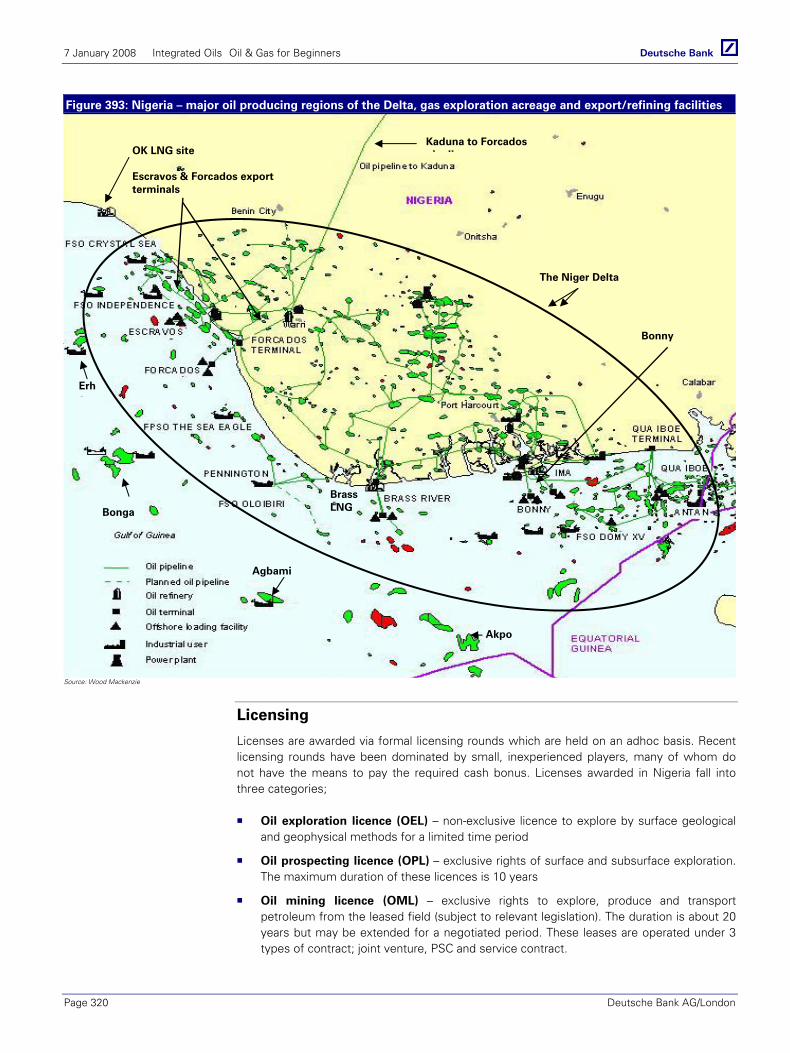
7 January 2008 Integrated Oils Oil & Gas for Beginners
Page 320 Deutsche Bank AG/London
Figure 393: Nigeria – major oil producing regions of the Delta, gas exploration acreage and export/refining facilities
Source: Wood Mackenzie
Licensing
Licenses are awarded via formal licensing rounds which are held on an adhoc basis. Recent licensing rounds have been dominated by small, inexperienced players, many of whom do not have the means to pay the required cash bonus. Licenses awarded in Nigeria fall into three categories;
Oil exploration licence (OEL) – non-exclusive licence to explore by surface geological and geophysical methods for a limited time period
Oil prospecting licence (OPL) – exclusive rights of surface and subsurface exploration. The maximum duration of these licences is 10 years
Oil mining licence (OML) – exclusive rights to explore, produce and transport petroleum from the leased field (subject to relevant legislation). The duration is about 20 years but may be extended for a negotiated period. These leases are operated under 3 types of contract; joint venture, PSC and service contract.
Kaduna to Forcados i eline
The Niger Delta
Bonny
OK LNG site Escravos & Forcados export terminals
Bonga
Agbami
Erha
Akpo
Brass LNG
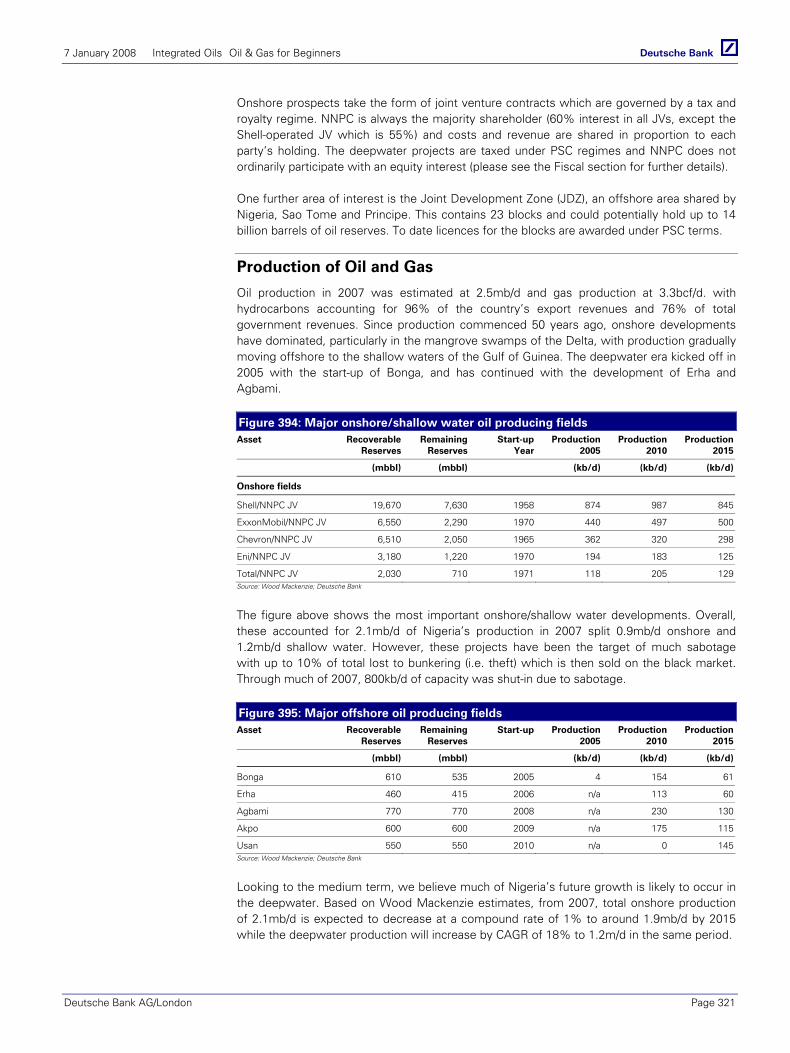
7 January 2008 Integrated Oils Oil & Gas for Beginners
Deutsche Bank AG/London Page 321
Onshore prospects take the form of joint venture contracts which are governed by a tax and royalty regime. NNPC is always the majority shareholder (60% interest in all JVs, except the Shell-operated JV which is 55%) and costs and revenue are shared in proportion to each party’s holding. The deepwater projects are taxed under PSC regimes and NNPC does not ordinarily participate with an equity interest (please see the Fiscal section for further details).
One further area of interest is the Joint Development Zone (JDZ), an offshore area shared by Nigeria, Sao Tome and Principe. This contains 23 blocks and could potentially hold up to 14 billion barrels of oil reserves. To date licences for the blocks are awarded under PSC terms.
Production of Oil and Gas
Oil production in 2007 was estimated at 2.5mb/d and gas production at 3.3bcf/d. with hydrocarbons accounting for 96% of the country’s export revenues and 76% of total government revenues. Since production commenced 50 years ago, onshore developments have dominated, particularly in the mangrove swamps of the Delta, with production gradually moving offshore to the shallow waters of the Gulf of Guinea. The deepwater era kicked off in 2005 with the start-up of Bonga, and has continued with the development of Erha and Agbami.
Figure 394: Major onshore/shallow water oil producing fields Asset Recoverable
Reserves Remaining
ReservesStart-up
YearProduction
2005 Production
2010Production
2015
(mbbl) (mbbl) (kb/d) (kb/d) (kb/d)
Onshore fields
Shell/NNPC JV 19,670 7,630 1958 874 987 845
ExxonMobil/NNPC JV 6,550 2,290 1970 440 497 500
Chevron/NNPC JV 6,510 2,050 1965 362 320 298
Eni/NNPC JV 3,180 1,220 1970 194 183 125
Total/NNPC JV 2,030 710 1971 118 205 129Source: Wood Mackenzie; Deutsche Bank
The figure above shows the most important onshore/shallow water developments. Overall, these accounted for 2.1mb/d of Nigeria’s production in 2007 split 0.9mb/d onshore and 1.2mb/d shallow water. However, these projects have been the target of much sabotage with up to 10% of total lost to bunkering (i.e. theft) which is then sold on the black market. Through much of 2007, 800kb/d of capacity was shut-in due to sabotage.
Figure 395: Major offshore oil producing fields Asset Recoverable
Reserves Remaining
ReservesStart-up Production
2005 Production
2010Production
2015
(mbbl) (mbbl) (kb/d) (kb/d) (kb/d)
Bonga 610 535 2005 4 154 61
Erha 460 415 2006 n/a 113 60
Agbami 770 770 2008 n/a 230 130
Akpo 600 600 2009 n/a 175 115
Usan 550 550 2010 n/a 0 145Source: Wood Mackenzie; Deutsche Bank
Looking to the medium term, we believe much of Nigeria’s future growth is likely to occur in the deepwater. Based on Wood Mackenzie estimates, from 2007, total onshore production of 2.1mb/d is expected to decrease at a compound rate of 1% to around 1.9mb/d by 2015 while the deepwater production will increase by CAGR of 18% to 1.2m/d in the same period.
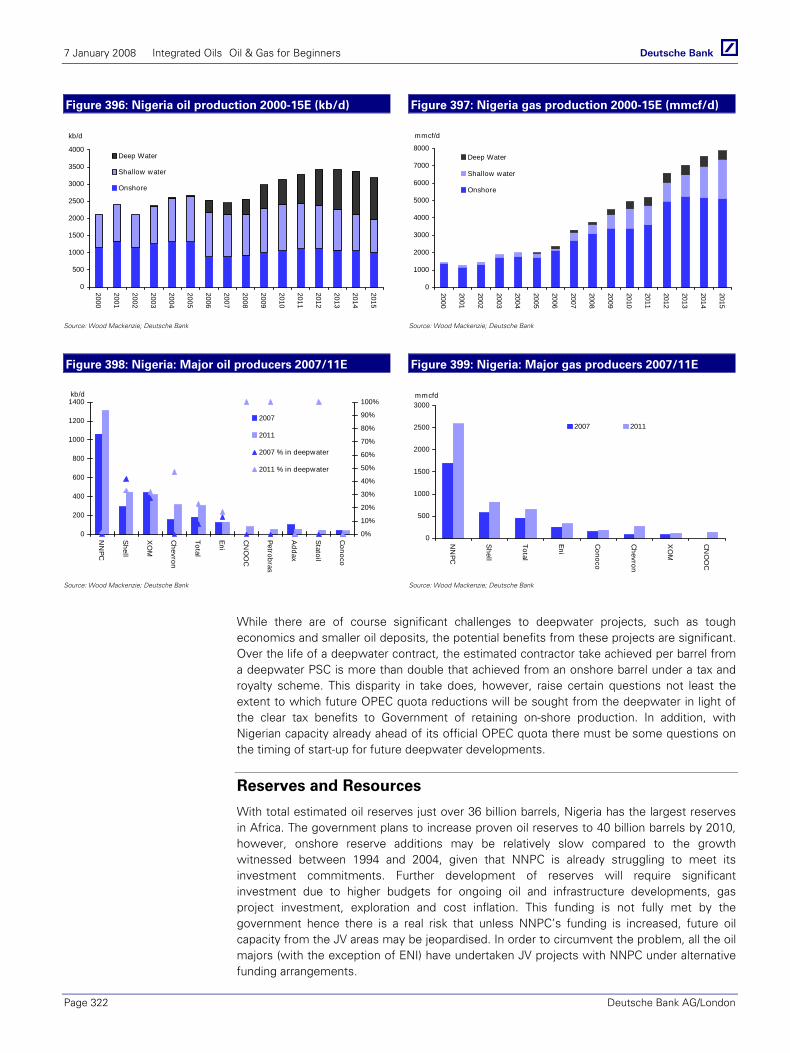
7 January 2008 Integrated Oils Oil & Gas for Beginners
Page 322 Deutsche Bank AG/London
Figure 396: Nigeria oil production 2000-15E (kb/d) Figure 397: Nigeria gas production 2000-15E (mmcf/d)
0
500
1000
1500
2000
2500
3000
3500
4000
2000
2001
2002
2003
2004
2005
2006
2007
2008
2009
2010
2011
2012
2013
2014
2015
kb/d
Deep Water
Shallow water
Onshore
0
1000
2000
3000
4000
5000
6000
7000
8000
2000
2001
2002
2003
2004
2005
2006
2007
2008
2009
2010
2011
2012
2013
2014
2015
mmcf/d
Deep Water
Shallow water
Onshore
Source: Wood Mackenzie; Deutsche Bank Source: Wood Mackenzie; Deutsche Bank
Figure 398: Nigeria: Major oil producers 2007/11E Figure 399: Nigeria: Major gas producers 2007/11E
0
200
400
600
800
1000
1200
1400
NN
PC
Shell
XO
M
Chevron
Total
Eni
CN
OO
C
Petrobras
Addax
Statoil
Conoco
0%
10%
20%
30%
40%
50%
60%
70%
80%
90%
100%
2007
2011
2007 % in deepwater
2011 % in deepwater
kb/d
0
500
1000
1500
2000
2500
3000
NN
PC
Shell
Total
Eni
Conoco
Chevron
XO
M
CN
OO
C
mmcfd
2007 2011
Source: Wood Mackenzie; Deutsche Bank Source: Wood Mackenzie; Deutsche Bank
While there are of course significant challenges to deepwater projects, such as tough economics and smaller oil deposits, the potential benefits from these projects are significant. Over the life of a deepwater contract, the estimated contractor take achieved per barrel from a deepwater PSC is more than double that achieved from an onshore barrel under a tax and royalty scheme. This disparity in take does, however, raise certain questions not least the extent to which future OPEC quota reductions will be sought from the deepwater in light of the clear tax benefits to Government of retaining on-shore production. In addition, with Nigerian capacity already ahead of its official OPEC quota there must be some questions on the timing of start-up for future deepwater developments.
Reserves and Resources
With total estimated oil reserves just over 36 billion barrels, Nigeria has the largest reserves in Africa. The government plans to increase proven oil reserves to 40 billion barrels by 2010, however, onshore reserve additions may be relatively slow compared to the growth witnessed between 1994 and 2004, given that NNPC is already struggling to meet its investment commitments. Further development of reserves will require significant investment due to higher budgets for ongoing oil and infrastructure developments, gas project investment, exploration and cost inflation. This funding is not fully met by the government hence there is a real risk that unless NNPC’s funding is increased, future oil capacity from the JV areas may be jeopardised. In order to circumvent the problem, all the oil majors (with the exception of ENI) have undertaken JV projects with NNPC under alternative funding arrangements.
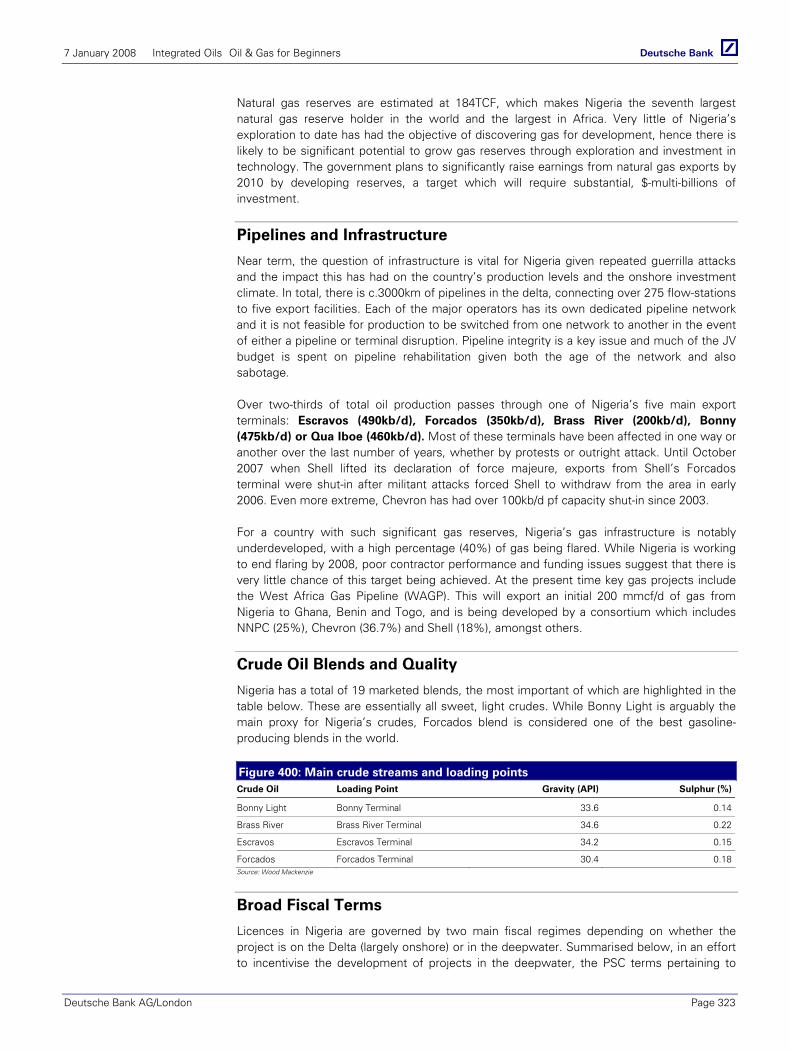
7 January 2008 Integrated Oils Oil & Gas for Beginners
Deutsche Bank AG/London Page 323
Natural gas reserves are estimated at 184TCF, which makes Nigeria the seventh largest natural gas reserve holder in the world and the largest in Africa. Very little of Nigeria’s exploration to date has had the objective of discovering gas for development, hence there is likely to be significant potential to grow gas reserves through exploration and investment in technology. The government plans to significantly raise earnings from natural gas exports by 2010 by developing reserves, a target which will require substantial, $-multi-billions of investment.
Pipelines and Infrastructure
Near term, the question of infrastructure is vital for Nigeria given repeated guerrilla attacks and the impact this has had on the country’s production levels and the onshore investment climate. In total, there is c.3000km of pipelines in the delta, connecting over 275 flow-stations to five export facilities. Each of the major operators has its own dedicated pipeline network and it is not feasible for production to be switched from one network to another in the event of either a pipeline or terminal disruption. Pipeline integrity is a key issue and much of the JV budget is spent on pipeline rehabilitation given both the age of the network and also sabotage.
Over two-thirds of total oil production passes through one of Nigeria’s five main export terminals: Escravos (490kb/d), Forcados (350kb/d), Brass River (200kb/d), Bonny (475kb/d) or Qua Iboe (460kb/d). Most of these terminals have been affected in one way or another over the last number of years, whether by protests or outright attack. Until October 2007 when Shell lifted its declaration of force majeure, exports from Shell’s Forcados terminal were shut-in after militant attacks forced Shell to withdraw from the area in early 2006. Even more extreme, Chevron has had over 100kb/d pf capacity shut-in since 2003.
For a country with such significant gas reserves, Nigeria’s gas infrastructure is notably underdeveloped, with a high percentage (40%) of gas being flared. While Nigeria is working to end flaring by 2008, poor contractor performance and funding issues suggest that there is very little chance of this target being achieved. At the present time key gas projects include the West Africa Gas Pipeline (WAGP). This will export an initial 200 mmcf/d of gas from Nigeria to Ghana, Benin and Togo, and is being developed by a consortium which includes NNPC (25%), Chevron (36.7%) and Shell (18%), amongst others.
Crude Oil Blends and Quality
Nigeria has a total of 19 marketed blends, the most important of which are highlighted in the table below. These are essentially all sweet, light crudes. While Bonny Light is arguably the main proxy for Nigeria’s crudes, Forcados blend is considered one of the best gasoline-producing blends in the world.
Figure 400: Main crude streams and loading points Crude Oil Loading Point Gravity (API) Sulphur (%)
Bonny Light Bonny Terminal 33.6 0.14
Brass River Brass River Terminal 34.6 0.22
Escravos Escravos Terminal 34.2 0.15
Forcados Forcados Terminal 30.4 0.18Source: Wood Mackenzie
Broad Fiscal Terms
Licences in Nigeria are governed by two main fiscal regimes depending on whether the project is on the Delta (largely onshore) or in the deepwater. Summarised below, in an effort to incentivise the development of projects in the deepwater, the PSC terms pertaining to

7 January 2008 Integrated Oils Oil & Gas for Beginners
Page 324 Deutsche Bank AG/London
these are invariably far more attractive than those for the onshore/shallow water JVs given there is no required minimum NNPC stake, cost recovery is at a minimum of 80% and the tax rate is only 50% compared to 85% onshore. More recently there have, however, been early indications from the Nigerian authorities that the Deepwater PSC terms could be subject to review.
Figure 401: Key fiscal characteristics for JV and PSC Onshore JV 1993 Deepwater PSC 2005/6 Deepwater PSC
Minimum NNPC stake % 60 n/a n/a
Minimum bid round bonus ($m) n/a 25 50
Cost recovery ceiling (%) n/a 100 80
Investment Uplift (%) 5 50 50
Royalty/Production charge (%) 20 0 8
Petroleum Profit Tax (%) 85 50 50
State share of profit oil n/a 20%-60% 30%-75%Source: Wood Mackenzie
Oil aside, the government is making concerted efforts to ensure that there is a favourable investment climate in the country’s gas sector. Investors in the gas sector (both associated and non-associated) benefit from a broad range of fiscal incentives, including zero royalty rate, a tax rate of only 30%, the ability to offset expenditure on gas infrastructure against oil revenues and an initial tax free period of 5 years which can be extended by a further 2 years.
Refining and Downstream markets
Put simply, Nigeria’s downstream market is in disarray. Although its four refineries have a capacity of 445kb/d, internal disruption combined with limited investment has served to significantly undermine performance with utilisation rates frequently collapsing. As a consequence the country suffers frequent fuel shortages, necessitating the import of petroleum products (which are then sold at a subsidised price to the domestic market). The main refineries are highlighted in the table below:
Figure 402: Nigeria: Refining capacity vs. throughput (2006) Operator Refinery CDU Capacity Throughput (2006)
Port Harcourt Refining Company Port Harcourt I 60 25
Port Harcourt Refining Company Port Harcourt II 150 63
Warri Refining & Petrochem Co Warri 125 0
Kaduna Refining & Petrochem Co Kaduna 110 37
Total CDU 445 125Source: WoodMackenzie
Efforts are being made to reinstate refinery activity. However, in the absence of an end to the civil unrest disruptions will almost certainly continue to undermine performance.
LNG
Until the late 1990’s, the sole focus of development in the Delta was crude oil production, with the majority of associated gas being flared. However, following the 1999 start-up of Nigeria (Bonny) LNG, much gas is now being diverted to LNG projects or being re-injected to improve oil production. As such in 2007, Nigeria accounted for around 25% of Atlantic Basin LNG supply and around 10% of that globally.
LNG in Nigeria is highly profitable, with gas currently transported to the liquefaction plant at a nominal cost of under $1/mmbtu hence the value is consequently in the liquefaction plant.
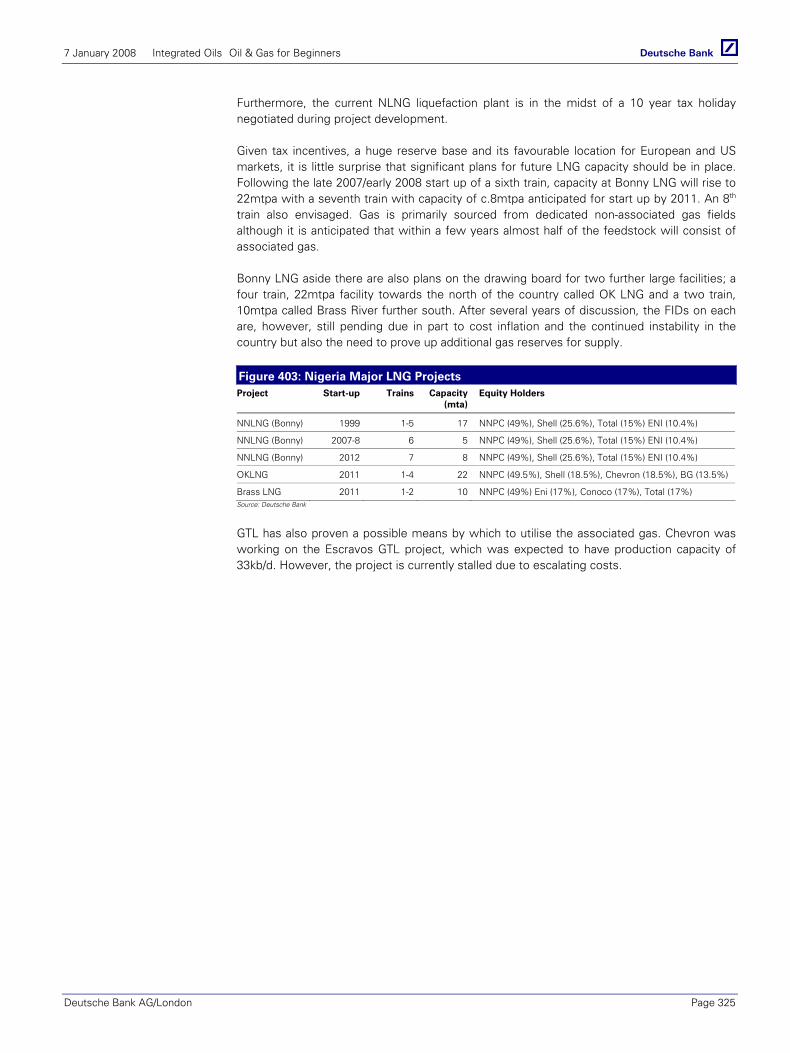
7 January 2008 Integrated Oils Oil & Gas for Beginners
Deutsche Bank AG/London Page 325
Furthermore, the current NLNG liquefaction plant is in the midst of a 10 year tax holiday negotiated during project development.
Given tax incentives, a huge reserve base and its favourable location for European and US markets, it is little surprise that significant plans for future LNG capacity should be in place. Following the late 2007/early 2008 start up of a sixth train, capacity at Bonny LNG will rise to 22mtpa with a seventh train with capacity of c.8mtpa anticipated for start up by 2011. An 8th train also envisaged. Gas is primarily sourced from dedicated non-associated gas fields although it is anticipated that within a few years almost half of the feedstock will consist of associated gas.
Bonny LNG aside there are also plans on the drawing board for two further large facilities; a four train, 22mtpa facility towards the north of the country called OK LNG and a two train, 10mtpa called Brass River further south. After several years of discussion, the FIDs on each are, however, still pending due in part to cost inflation and the continued instability in the country but also the need to prove up additional gas reserves for supply.
Figure 403: Nigeria Major LNG Projects Project Start-up Trains Capacity
(mta)Equity Holders
NNLNG (Bonny) 1999 1-5 17 NNPC (49%), Shell (25.6%), Total (15%) ENI (10.4%)
NNLNG (Bonny) 2007-8 6 5 NNPC (49%), Shell (25.6%), Total (15%) ENI (10.4%)
NNLNG (Bonny) 2012 7 8 NNPC (49%), Shell (25.6%), Total (15%) ENI (10.4%)
OKLNG 2011 1-4 22 NNPC (49.5%), Shell (18.5%), Chevron (18.5%), BG (13.5%)
Brass LNG 2011 1-2 10 NNPC (49%) Eni (17%), Conoco (17%), Total (17%) Source: Deutsche Bank
GTL has also proven a possible means by which to utilise the associated gas. Chevron was working on the Escravos GTL project, which was expected to have production capacity of 33kb/d. However, the project is currently stalled due to escalating costs.

7 January 2008 Integrated Oils Oil & Gas for Beginners
Page 326 Deutsche Bank AG/London
Nigeria - Notes
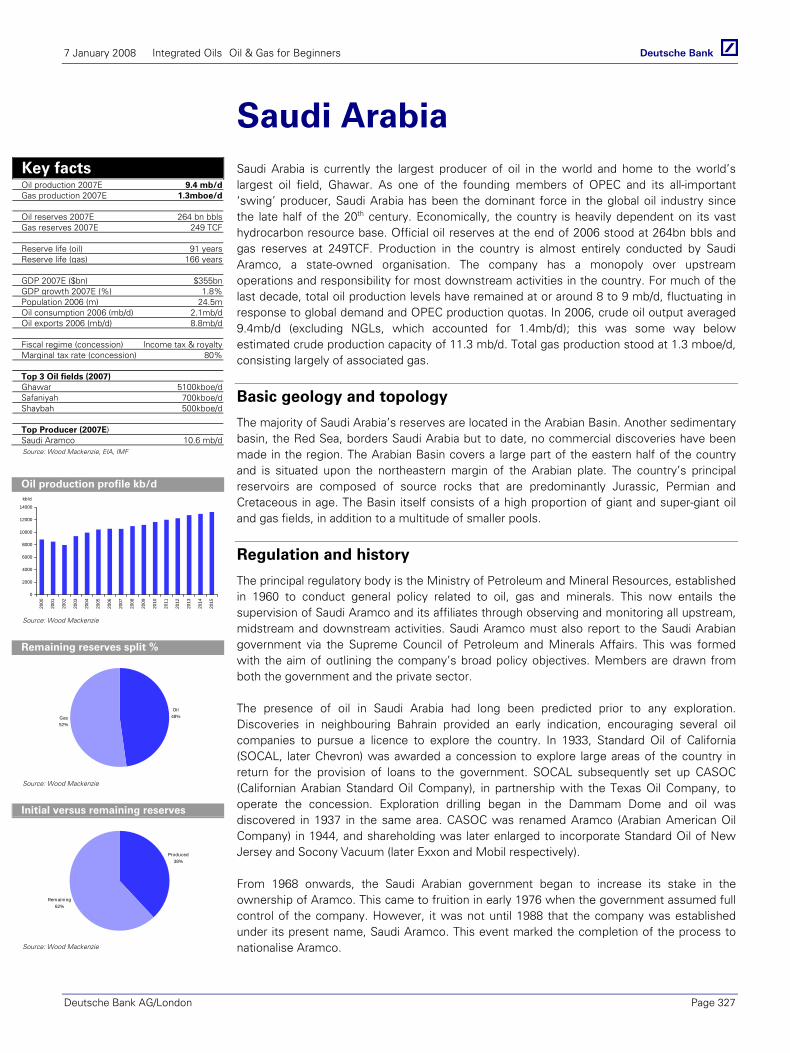
7 January 2008 Integrated Oils Oil & Gas for Beginners
Deutsche Bank AG/London Page 327
Saudi Arabia Saudi Arabia is currently the largest producer of oil in the world and home to the world’s largest oil field, Ghawar. As one of the founding members of OPEC and its all-important ‘swing’ producer, Saudi Arabia has been the dominant force in the global oil industry since the late half of the 20th century. Economically, the country is heavily dependent on its vast hydrocarbon resource base. Official oil reserves at the end of 2006 stood at 264bn bbls and gas reserves at 249TCF. Production in the country is almost entirely conducted by Saudi Aramco, a state-owned organisation. The company has a monopoly over upstream operations and responsibility for most downstream activities in the country. For much of the last decade, total oil production levels have remained at or around 8 to 9 mb/d, fluctuating in response to global demand and OPEC production quotas. In 2006, crude oil output averaged 9.4mb/d (excluding NGLs, which accounted for 1.4mb/d); this was some way below estimated crude production capacity of 11.3 mb/d. Total gas production stood at 1.3 mboe/d, consisting largely of associated gas.
Basic geology and topology
The majority of Saudi Arabia’s reserves are located in the Arabian Basin. Another sedimentary basin, the Red Sea, borders Saudi Arabia but to date, no commercial discoveries have been made in the region. The Arabian Basin covers a large part of the eastern half of the country and is situated upon the northeastern margin of the Arabian plate. The country’s principal reservoirs are composed of source rocks that are predominantly Jurassic, Permian and Cretaceous in age. The Basin itself consists of a high proportion of giant and super-giant oil and gas fields, in addition to a multitude of smaller pools.
Regulation and history
The principal regulatory body is the Ministry of Petroleum and Mineral Resources, established in 1960 to conduct general policy related to oil, gas and minerals. This now entails the supervision of Saudi Aramco and its affiliates through observing and monitoring all upstream, midstream and downstream activities. Saudi Aramco must also report to the Saudi Arabian government via the Supreme Council of Petroleum and Minerals Affairs. This was formed with the aim of outlining the company’s broad policy objectives. Members are drawn from both the government and the private sector.
The presence of oil in Saudi Arabia had long been predicted prior to any exploration. Discoveries in neighbouring Bahrain provided an early indication, encouraging several oil companies to pursue a licence to explore the country. In 1933, Standard Oil of California (SOCAL, later Chevron) was awarded a concession to explore large areas of the country in return for the provision of loans to the government. SOCAL subsequently set up CASOC (Californian Arabian Standard Oil Company), in partnership with the Texas Oil Company, to operate the concession. Exploration drilling began in the Dammam Dome and oil was discovered in 1937 in the same area. CASOC was renamed Aramco (Arabian American Oil Company) in 1944, and shareholding was later enlarged to incorporate Standard Oil of New Jersey and Socony Vacuum (later Exxon and Mobil respectively).
From 1968 onwards, the Saudi Arabian government began to increase its stake in the ownership of Aramco. This came to fruition in early 1976 when the government assumed full control of the company. However, it was not until 1988 that the company was established under its present name, Saudi Aramco. This event marked the completion of the process to nationalise Aramco.
Key facts Oil production 2007E 9.4 mb/d Gas production 2007E 1.3mboe/d Oil reserves 2007E 264 bn bbls Gas reserves 2007E 249 TCF Reserve life (oil) 91 years Reserve life (gas) 166 years GDP 2007E ($bn) $355bn GDP growth 2007E (%) 1.8% Population 2006 (m) 24.5m Oil consumption 2006 (mb/d) 2.1mb/d Oil exports 2006 (mb/d) 8.8mb/d Fiscal regime (concession) Income tax & royalty Marginal tax rate (concession) 80% Top 3 Oil fields (2007) Ghawar 5100kboe/d Safaniyah 700kboe/d Shaybah 500kboe/d Top Producer (2007E) Saudi Aramco 10.6 mb/d
Source: Wood Mackenzie, EIA, IMF
Oil production profile kb/d
0
2000
4000
6000
8000
10000
12000
14000
2000
2001
2002
2003
2004
2005
2006
2007
2008
2009
2010
2011
2012
2013
2014
2015
kb/d
Source: Wood Mackenzie
Remaining reserves split %
Oil48%Gas
52%
Source: Wood Mackenzie
Initial versus remaining reserves
Produced38%
Remaining62%
Source: Wood Mackenzie
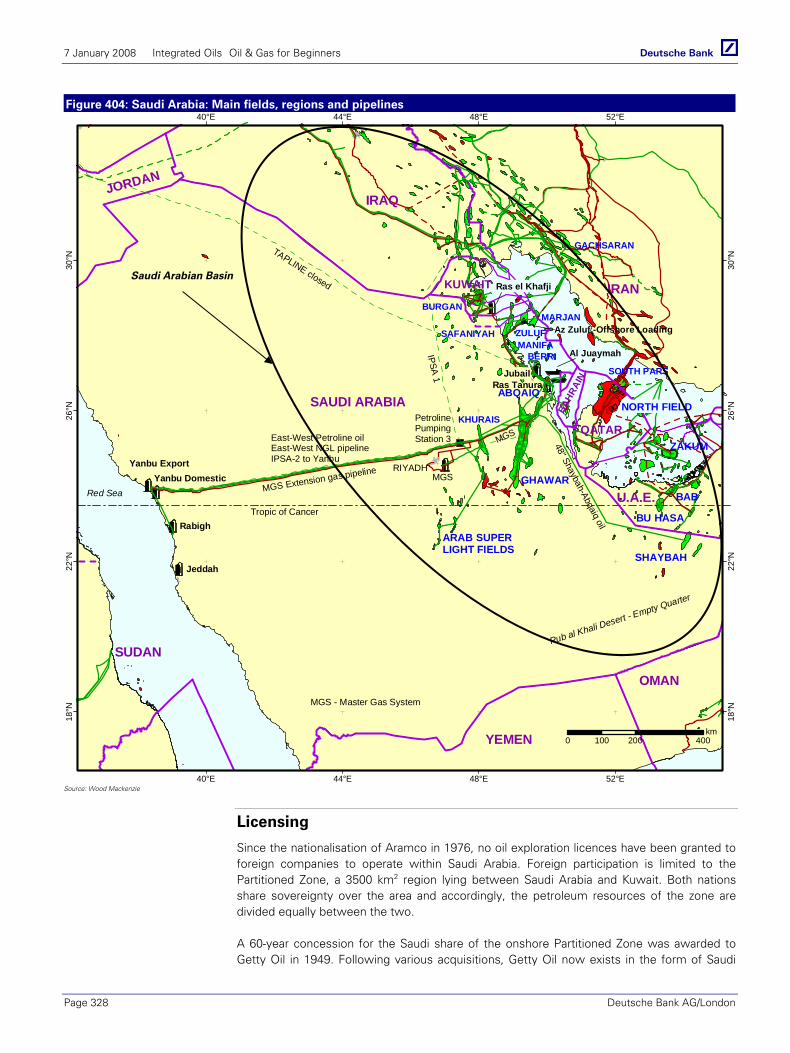
7 January 2008 Integrated Oils Oil & Gas for Beginners
Page 328 Deutsche Bank AG/London
Figure 404: Saudi Arabia: Main fields, regions and pipelines
IRAN
YEMEN
Ras Tanura
KUWAIT
BAHR
AIN
SAUDI ARABIA
QATAR
U.A.E.
IRAQ
GHAWAR
NORTH FIELDABQAIQ
BERRI
SAFANIYAH
ARAB SUPERLIGHT FIELDS
ZULUFMARJAN
MANIFA
BURGAN
SOUTH PARS
KHURAIS
GACHSARAN
ZAKUM
SHAYBAH
RIYADH
IPSA 1
48" Shaybah-Abqaiq oil
TAPLINE closed
East-West Petroline oilEast-West NGL pipelineIPSA-2 to Yanbu
BAB
BU HASA
Rub al Khali Desert - Empty Quarter
OMAN
SUDAN
PetrolinePumpingStation 3
Al Juaymah
Az Zuluf -Offshore Loading
Ras el Khafji
Jubail
Yanbu ExportYanbu Domestic
Rabigh
Jeddah
JORDAN
Tropic of Cancer
Red Sea MGS Extension gas pipeline
MGS - Master Gas System
MGS
MGS
40°E
40°E
44°E
44°E
48°E
48°E
52°E
52°E
18°N
18°N
22°N
22°N
26°N
26°N
30°N
30°N
0 200 400100km
Source: Wood Mackenzie
Licensing
Since the nationalisation of Aramco in 1976, no oil exploration licences have been granted to foreign companies to operate within Saudi Arabia. Foreign participation is limited to the Partitioned Zone, a 3500 km2 region lying between Saudi Arabia and Kuwait. Both nations share sovereignty over the area and accordingly, the petroleum resources of the zone are divided equally between the two.
A 60-year concession for the Saudi share of the onshore Partitioned Zone was awarded to Getty Oil in 1949. Following various acquisitions, Getty Oil now exists in the form of Saudi
Saudi Arabian Basin

7 January 2008 Integrated Oils Oil & Gas for Beginners
Deutsche Bank AG/London Page 329
Arabian Texaco, a subsidiary of ChevronTexaco. The onshore concession is jointly operated with the Kuwait Oil Company, which holds the Kuwaiti interest in the licence. The Saudi Arabian part of the concession is due to expire in 2009 and negotiations to extend the concession beyond this date are reported to be underway. The Saudi offshore concession was previously operated by a Japanese-owned subsidiary called the Arabian Oil Company. This agreement expired in 2000 and was not subsequently renewed. The concession is now operated by Aramco Gulf Operations Company (AGOC), a subsidiary of Saudi Aramco.
In 2003, Shell and Total were awarded gas exploration contracts for the South Rub’ Al Khali region. This marked the first foreign involvement in the Saudi Arabian gas sector since nationalisation. Further contracts were awarded in 2004 to Lukoil, Sinopec and ENI/Repsol to explore areas across the country totalling 120 000 km2. This follows from the Natural Gas Initiative, launched in the late 1990s with the aim of attracting foreign oil companies into the country to explore for and produce non-associated gas. Problems concerning prospective exploration, however, led to the collapse of negotiations in 2002. Hence, a redesign of the contract terms was required before the agreement with Shell and Total could be concluded.
Production of Oil and Gas
The discovery of Ghawar in 1948 and subsequent development of new and existing fields led to sustained growth in oil production until the 1970s. However, weakness in global demand and the introduction of OPEC production quotas in 1983 constrained Saudi output thereafter. As a result, production has never quite returned to its historical peak of 10 mb/d in 1980.
For much of the last decade, crude output has remained between 8 and 9 mb/d. However, the Iraq War and events in other OPEC nations have allowed Saudi Arabia to expand its production levels. Crude production now exceeds 9 mb/d and in 2007, it averaged 9.2mb/d. With the inclusion of NGLs, this figure rises to 10.6mb/d. Production is heavily dominated by Ghawar, the largest oil field in the world. This single oil field accounted for 5.4 mb/d of oil, over 50% of Saudi production and an estimated 6.25% of total world production.
Gas production in Saudi Arabia also has considerable potential. However, only a small proportion of this has been utilised to date. In 2007, gas production stood at 5.7bcf/d but although significant additional potential exists, installation of the appropriate facilities is still required at most existing crude oil fields. Current gas production consists predominantly of associated gas and therefore remains heavily dependent on the global oil market. The government has addressed this issue by introducing the Natural Gas Initiative and it is hoped that this will increase production of non-associated gas.
Figure 405: Saudi Arabia liquids production, 2000-2015 Figure 406: Saudi Arabia gas production, 2000-2015
0
2000
4000
6000
8000
10000
12000
14000
2000
2001
2002
2003
2004
2005
2006
2007
2008
2009
2010
2011
2012
2013
2014
2015
kb/d
0
2000
4000
6000
8000
10000
12000
2000
2001
2002
2003
2004
2005
2006
2007
2008
2009
2010
2011
2012
2013
2014
2015
mmcf/d
Source: Wood Mackenzie Source: Wood Mackenzie
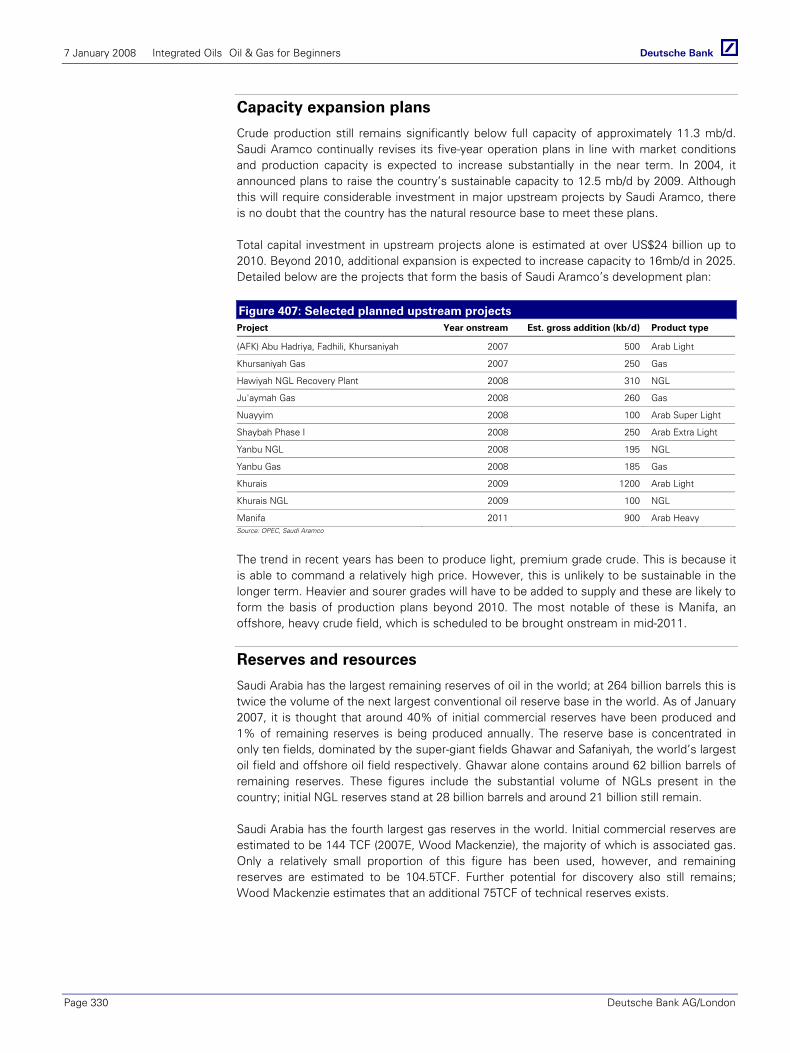
7 January 2008 Integrated Oils Oil & Gas for Beginners
Page 330 Deutsche Bank AG/London
Capacity expansion plans
Crude production still remains significantly below full capacity of approximately 11.3 mb/d. Saudi Aramco continually revises its five-year operation plans in line with market conditions and production capacity is expected to increase substantially in the near term. In 2004, it announced plans to raise the country’s sustainable capacity to 12.5 mb/d by 2009. Although this will require considerable investment in major upstream projects by Saudi Aramco, there is no doubt that the country has the natural resource base to meet these plans.
Total capital investment in upstream projects alone is estimated at over US$24 billion up to 2010. Beyond 2010, additional expansion is expected to increase capacity to 16mb/d in 2025. Detailed below are the projects that form the basis of Saudi Aramco’s development plan:
Figure 407: Selected planned upstream projects Project Year onstream Est. gross addition (kb/d) Product type
(AFK) Abu Hadriya, Fadhili, Khursaniyah 2007 500 Arab Light
Khursaniyah Gas 2007 250 Gas
Hawiyah NGL Recovery Plant 2008 310 NGL
Ju'aymah Gas 2008 260 Gas
Nuayyim 2008 100 Arab Super Light
Shaybah Phase I 2008 250 Arab Extra Light
Yanbu NGL 2008 195 NGL
Yanbu Gas 2008 185 Gas
Khurais 2009 1200 Arab Light
Khurais NGL 2009 100 NGL
Manifa 2011 900 Arab Heavy Source: OPEC, Saudi Aramco
The trend in recent years has been to produce light, premium grade crude. This is because it is able to command a relatively high price. However, this is unlikely to be sustainable in the longer term. Heavier and sourer grades will have to be added to supply and these are likely to form the basis of production plans beyond 2010. The most notable of these is Manifa, an offshore, heavy crude field, which is scheduled to be brought onstream in mid-2011.
Reserves and resources
Saudi Arabia has the largest remaining reserves of oil in the world; at 264 billion barrels this is twice the volume of the next largest conventional oil reserve base in the world. As of January 2007, it is thought that around 40% of initial commercial reserves have been produced and 1% of remaining reserves is being produced annually. The reserve base is concentrated in only ten fields, dominated by the super-giant fields Ghawar and Safaniyah, the world’s largest oil field and offshore oil field respectively. Ghawar alone contains around 62 billion barrels of remaining reserves. These figures include the substantial volume of NGLs present in the country; initial NGL reserves stand at 28 billion barrels and around 21 billion still remain.
Saudi Arabia has the fourth largest gas reserves in the world. Initial commercial reserves are estimated to be 144 TCF (2007E, Wood Mackenzie), the majority of which is associated gas. Only a relatively small proportion of this figure has been used, however, and remaining reserves are estimated to be 104.5TCF. Further potential for discovery also still remains; Wood Mackenzie estimates that an additional 75TCF of technical reserves exists.
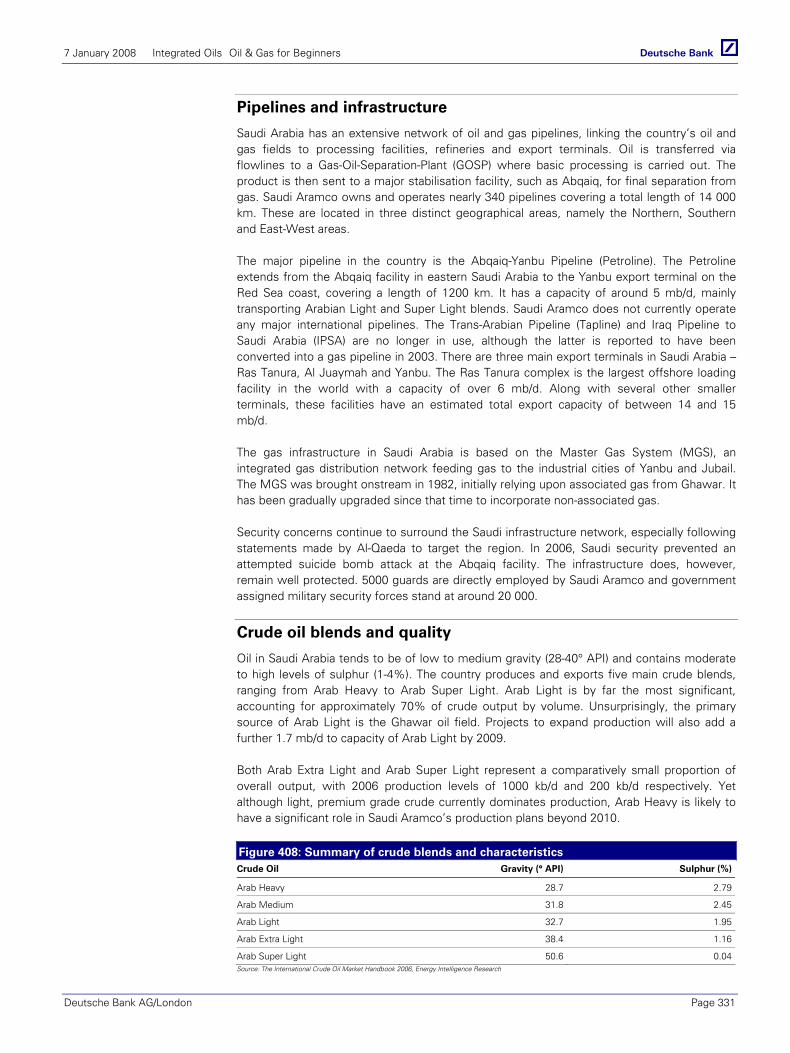
7 January 2008 Integrated Oils Oil & Gas for Beginners
Deutsche Bank AG/London Page 331
Pipelines and infrastructure
Saudi Arabia has an extensive network of oil and gas pipelines, linking the country’s oil and gas fields to processing facilities, refineries and export terminals. Oil is transferred via flowlines to a Gas-Oil-Separation-Plant (GOSP) where basic processing is carried out. The product is then sent to a major stabilisation facility, such as Abqaiq, for final separation from gas. Saudi Aramco owns and operates nearly 340 pipelines covering a total length of 14 000 km. These are located in three distinct geographical areas, namely the Northern, Southern and East-West areas.
The major pipeline in the country is the Abqaiq-Yanbu Pipeline (Petroline). The Petroline extends from the Abqaiq facility in eastern Saudi Arabia to the Yanbu export terminal on the Red Sea coast, covering a length of 1200 km. It has a capacity of around 5 mb/d, mainly transporting Arabian Light and Super Light blends. Saudi Aramco does not currently operate any major international pipelines. The Trans-Arabian Pipeline (Tapline) and Iraq Pipeline to Saudi Arabia (IPSA) are no longer in use, although the latter is reported to have been converted into a gas pipeline in 2003. There are three main export terminals in Saudi Arabia – Ras Tanura, Al Juaymah and Yanbu. The Ras Tanura complex is the largest offshore loading facility in the world with a capacity of over 6 mb/d. Along with several other smaller terminals, these facilities have an estimated total export capacity of between 14 and 15 mb/d.
The gas infrastructure in Saudi Arabia is based on the Master Gas System (MGS), an integrated gas distribution network feeding gas to the industrial cities of Yanbu and Jubail. The MGS was brought onstream in 1982, initially relying upon associated gas from Ghawar. It has been gradually upgraded since that time to incorporate non-associated gas.
Security concerns continue to surround the Saudi infrastructure network, especially following statements made by Al-Qaeda to target the region. In 2006, Saudi security prevented an attempted suicide bomb attack at the Abqaiq facility. The infrastructure does, however, remain well protected. 5000 guards are directly employed by Saudi Aramco and government assigned military security forces stand at around 20 000.
Crude oil blends and quality
Oil in Saudi Arabia tends to be of low to medium gravity (28-40° API) and contains moderate to high levels of sulphur (1-4%). The country produces and exports five main crude blends, ranging from Arab Heavy to Arab Super Light. Arab Light is by far the most significant, accounting for approximately 70% of crude output by volume. Unsurprisingly, the primary source of Arab Light is the Ghawar oil field. Projects to expand production will also add a further 1.7 mb/d to capacity of Arab Light by 2009.
Both Arab Extra Light and Arab Super Light represent a comparatively small proportion of overall output, with 2006 production levels of 1000 kb/d and 200 kb/d respectively. Yet although light, premium grade crude currently dominates production, Arab Heavy is likely to have a significant role in Saudi Aramco’s production plans beyond 2010.
Figure 408: Summary of crude blends and characteristics Crude Oil Gravity (° API) Sulphur (%)
Arab Heavy 28.7 2.79
Arab Medium 31.8 2.45
Arab Light 32.7 1.95
Arab Extra Light 38.4 1.16
Arab Super Light 50.6 0.04Source: The International Crude Oil Market Handbook 2006, Energy Intelligence Research
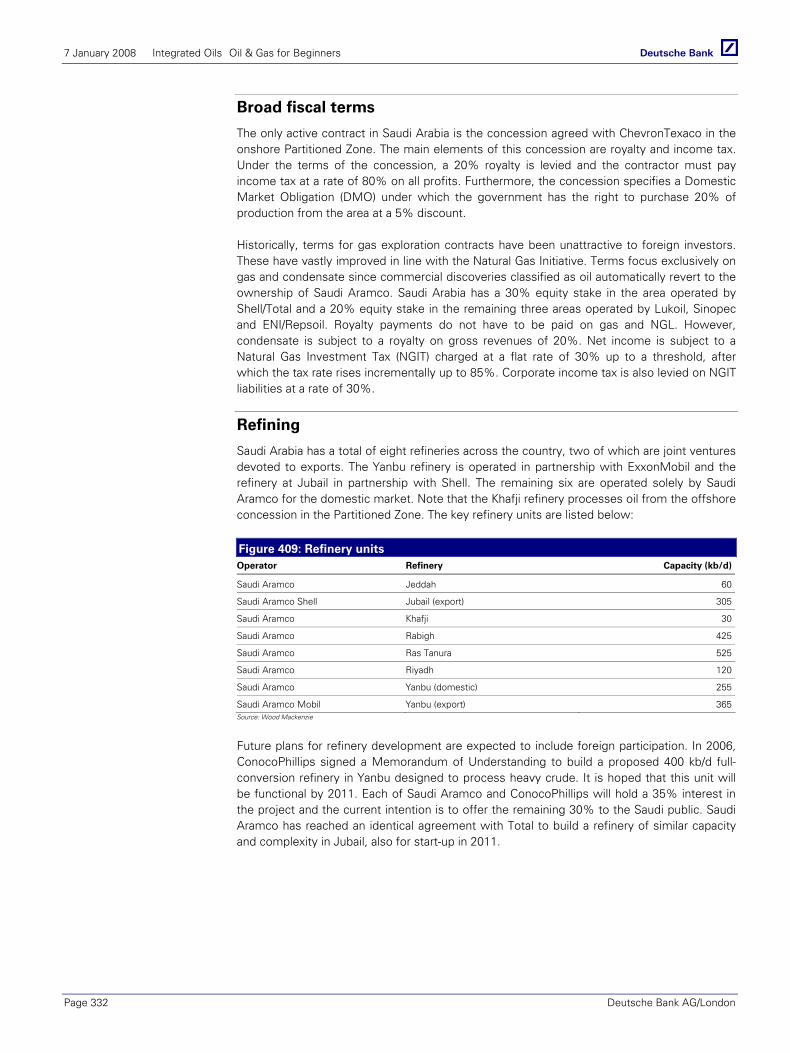
7 January 2008 Integrated Oils Oil & Gas for Beginners
Page 332 Deutsche Bank AG/London
Broad fiscal terms
The only active contract in Saudi Arabia is the concession agreed with ChevronTexaco in the onshore Partitioned Zone. The main elements of this concession are royalty and income tax. Under the terms of the concession, a 20% royalty is levied and the contractor must pay income tax at a rate of 80% on all profits. Furthermore, the concession specifies a Domestic Market Obligation (DMO) under which the government has the right to purchase 20% of production from the area at a 5% discount.
Historically, terms for gas exploration contracts have been unattractive to foreign investors. These have vastly improved in line with the Natural Gas Initiative. Terms focus exclusively on gas and condensate since commercial discoveries classified as oil automatically revert to the ownership of Saudi Aramco. Saudi Arabia has a 30% equity stake in the area operated by Shell/Total and a 20% equity stake in the remaining three areas operated by Lukoil, Sinopec and ENI/Repsoil. Royalty payments do not have to be paid on gas and NGL. However, condensate is subject to a royalty on gross revenues of 20%. Net income is subject to a Natural Gas Investment Tax (NGIT) charged at a flat rate of 30% up to a threshold, after which the tax rate rises incrementally up to 85%. Corporate income tax is also levied on NGIT liabilities at a rate of 30%.
Refining
Saudi Arabia has a total of eight refineries across the country, two of which are joint ventures devoted to exports. The Yanbu refinery is operated in partnership with ExxonMobil and the refinery at Jubail in partnership with Shell. The remaining six are operated solely by Saudi Aramco for the domestic market. Note that the Khafji refinery processes oil from the offshore concession in the Partitioned Zone. The key refinery units are listed below:
Figure 409: Refinery units Operator Refinery Capacity (kb/d)
Saudi Aramco Jeddah 60
Saudi Aramco Shell Jubail (export) 305
Saudi Aramco Khafji 30
Saudi Aramco Rabigh 425
Saudi Aramco Ras Tanura 525
Saudi Aramco Riyadh 120
Saudi Aramco Yanbu (domestic) 255
Saudi Aramco Mobil Yanbu (export) 365Source: Wood Mackenzie
Future plans for refinery development are expected to include foreign participation. In 2006, ConocoPhillips signed a Memorandum of Understanding to build a proposed 400 kb/d full-conversion refinery in Yanbu designed to process heavy crude. It is hoped that this unit will be functional by 2011. Each of Saudi Aramco and ConocoPhillips will hold a 35% interest in the project and the current intention is to offer the remaining 30% to the Saudi public. Saudi Aramco has reached an identical agreement with Total to build a refinery of similar capacity and complexity in Jubail, also for start-up in 2011.

7 January 2008 Integrated Oils Oil & Gas for Beginners
Deutsche Bank AG/London Page 333
Saudi Arabia - Notes

7 January 2008 Integrated Oils Oil & Gas for Beginners
Page 334 Deutsche Bank AG/London
Saudi Arabia - Notes
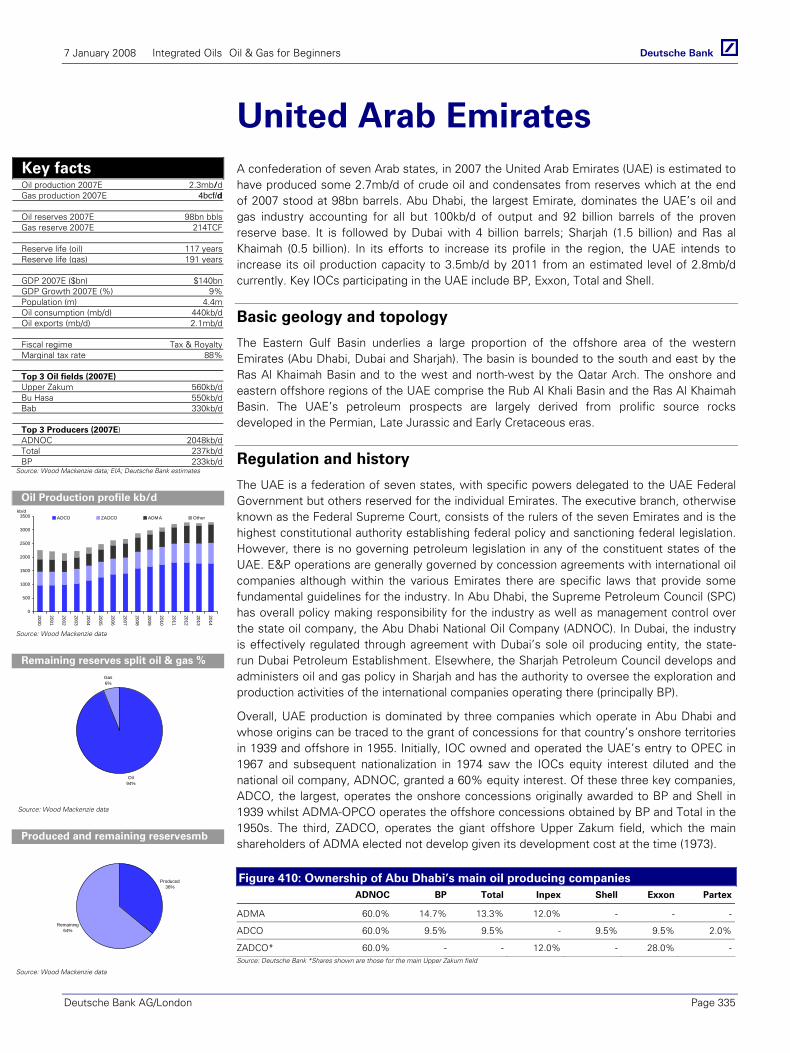
7 January 2008 Integrated Oils Oil & Gas for Beginners
Deutsche Bank AG/London Page 335
United Arab Emirates A confederation of seven Arab states, in 2007 the United Arab Emirates (UAE) is estimated to have produced some 2.7mb/d of crude oil and condensates from reserves which at the end of 2007 stood at 98bn barrels. Abu Dhabi, the largest Emirate, dominates the UAE’s oil and gas industry accounting for all but 100kb/d of output and 92 billion barrels of the proven reserve base. It is followed by Dubai with 4 billion barrels; Sharjah (1.5 billion) and Ras al Khaimah (0.5 billion). In its efforts to increase its profile in the region, the UAE intends to increase its oil production capacity to 3.5mb/d by 2011 from an estimated level of 2.8mb/d currently. Key IOCs participating in the UAE include BP, Exxon, Total and Shell.
Basic geology and topology
The Eastern Gulf Basin underlies a large proportion of the offshore area of the western Emirates (Abu Dhabi, Dubai and Sharjah). The basin is bounded to the south and east by the Ras Al Khaimah Basin and to the west and north-west by the Qatar Arch. The onshore and eastern offshore regions of the UAE comprise the Rub Al Khali Basin and the Ras Al Khaimah Basin. The UAE’s petroleum prospects are largely derived from prolific source rocks developed in the Permian, Late Jurassic and Early Cretaceous eras.
Regulation and history
The UAE is a federation of seven states, with specific powers delegated to the UAE Federal Government but others reserved for the individual Emirates. The executive branch, otherwise known as the Federal Supreme Court, consists of the rulers of the seven Emirates and is the highest constitutional authority establishing federal policy and sanctioning federal legislation. However, there is no governing petroleum legislation in any of the constituent states of the UAE. E&P operations are generally governed by concession agreements with international oil companies although within the various Emirates there are specific laws that provide some fundamental guidelines for the industry. In Abu Dhabi, the Supreme Petroleum Council (SPC) has overall policy making responsibility for the industry as well as management control over the state oil company, the Abu Dhabi National Oil Company (ADNOC). In Dubai, the industry is effectively regulated through agreement with Dubai’s sole oil producing entity, the state-run Dubai Petroleum Establishment. Elsewhere, the Sharjah Petroleum Council develops and administers oil and gas policy in Sharjah and has the authority to oversee the exploration and production activities of the international companies operating there (principally BP).
Overall, UAE production is dominated by three companies which operate in Abu Dhabi and whose origins can be traced to the grant of concessions for that country’s onshore territories in 1939 and offshore in 1955. Initially, IOC owned and operated the UAE’s entry to OPEC in 1967 and subsequent nationalization in 1974 saw the IOCs equity interest diluted and the national oil company, ADNOC, granted a 60% equity interest. Of these three key companies, ADCO, the largest, operates the onshore concessions originally awarded to BP and Shell in 1939 whilst ADMA-OPCO operates the offshore concessions obtained by BP and Total in the 1950s. The third, ZADCO, operates the giant offshore Upper Zakum field, which the main shareholders of ADMA elected not develop given its development cost at the time (1973).
Figure 410: Ownership of Abu Dhabi’s main oil producing companies ADNOC BP Total Inpex Shell Exxon Partex
ADMA 60.0% 14.7% 13.3% 12.0% - - -
ADCO 60.0% 9.5% 9.5% - 9.5% 9.5% 2.0%
ZADCO* 60.0% - - 12.0% - 28.0% -Source: Deutsche Bank *Shares shown are those for the main Upper Zakum field
Key facts Oil production 2007E 2.3mb/d Gas production 2007E 4bcf/d Oil reserves 2007E 98bn bbls Gas reserve 2007E 214TCF
Reserve life (oil) 117 years Reserve life (gas) 191 years
GDP 2007E ($bn) $140bn GDP Growth 2007E (%) 9% Population (m) 4.4m Oil consumption (mb/d) 440kb/d Oil exports (mb/d) 2.1mb/d
Fiscal regime Tax & Royalty Marginal tax rate 88%
Top 3 Oil fields (2007E) Upper Zakum 560kb/d Bu Hasa 550kb/d Bab 330kb/d
Top 3 Producers (2007E) ADNOC 2048kb/d Total 237kb/d BP 233kb/d
Source: Wood Mackenzie data; EIA; Deutsche Bank estimates
Oil Production profile kb/d
0
500
1000
1500
2000
2500
3000
3500
2000
2001
2002
2003
2004
2005
2006
2007
2008
2009
2010
2011
2012
2013
2014
ADCO ZADCO ADMA Otherkb/d
Source: Wood Mackenzie data
Remaining reserves split oil & gas %
Oil94%
Gas6%
Source: Wood Mackenzie data
Produced and remaining reservesmb
Produced36%
Remaining64%
Source: Wood Mackenzie data

7 January 2008 Integrated Oils Oil & Gas for Beginners
Page 336 Deutsche Bank AG/London
Figure 411: UAE: Main fields, regions, and pipelines
Source: Wood Mackenzie
Licensing
Direct participation in the upstream oil and gas industry in the UAE occurs only in Abu Dhabi and Sharjah and with near all of their territories already awarded under concession agreements, licensing opportunities for oil production in the UAE have been relatively limited. In particular, within Abu Dhabi no new license has been granted since the 1980s although in 2004 Exxon was granted a 28% interest in the Upper Zakum following a competitive tender in which companies were asked to submit plans to increase production from the field.
Importantly, the concession rights to ADCOs territories are due to expire in 2014 and ADMA’s in 2018. Both are thus likely to see discussion around contract extension over the next few years. The contract for Upper Zakum expires in 2026.
Opportunities have, however, emerged in the gas sector. In particular, in late 2006, ADNOC launched a sour gas development project with the aim of delivering 1bcf/d of sales gas from the two onshore fields of Bab and Shah by 2011 (both of which require complex development plans given the high levels of associated hydrogen sulphide). ADNOC’s plans have, however, subsequently been revised with only the Shah field now being considered for initial development. Four companies have been short-listed including Exxon, Shell, Conoco and Occidental. The announcement of an award is expected to be made in early 2008.
Das Island home of ADGAS
LNG’s 5.2mtpa facility
Major Zakum and Umm
Shaif (ADMA/ZADCO)
offshore fields
Main condensate processing
facility
500kb/d Ruwais refinery
Key Bab, Bu Hasa and Asab
fields onshore (ADCO)
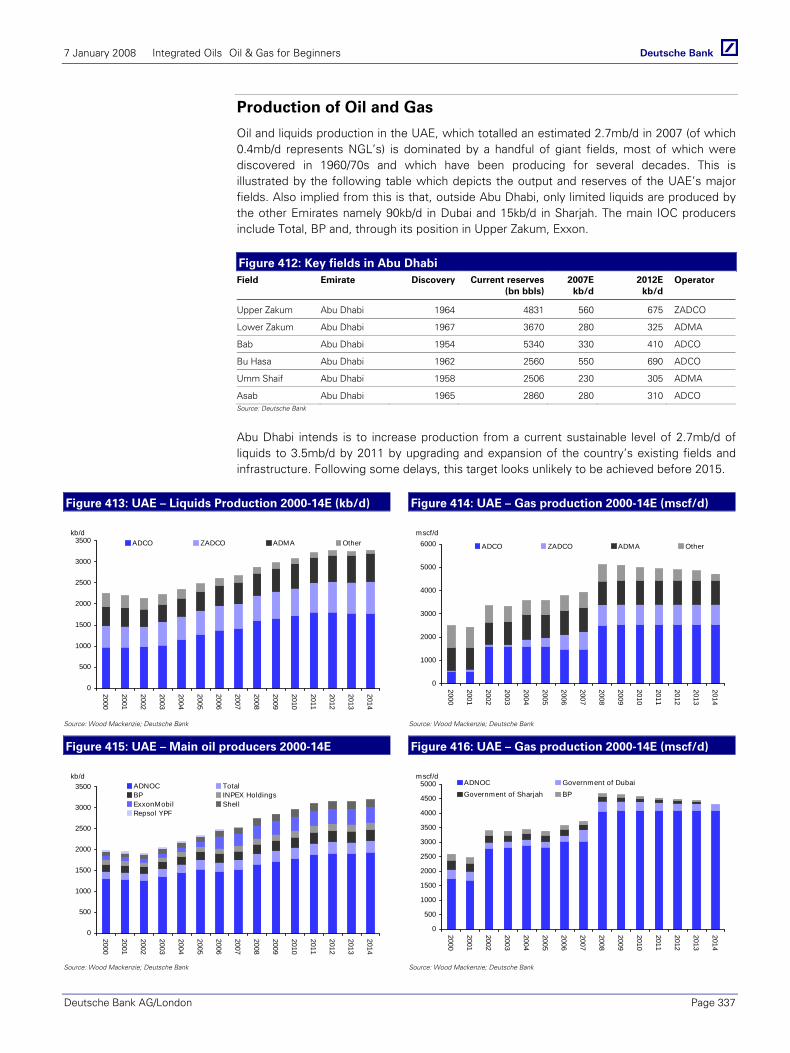
7 January 2008 Integrated Oils Oil & Gas for Beginners
Deutsche Bank AG/London Page 337
Production of Oil and Gas
Oil and liquids production in the UAE, which totalled an estimated 2.7mb/d in 2007 (of which 0.4mb/d represents NGL’s) is dominated by a handful of giant fields, most of which were discovered in 1960/70s and which have been producing for several decades. This is illustrated by the following table which depicts the output and reserves of the UAE’s major fields. Also implied from this is that, outside Abu Dhabi, only limited liquids are produced by the other Emirates namely 90kb/d in Dubai and 15kb/d in Sharjah. The main IOC producers include Total, BP and, through its position in Upper Zakum, Exxon.
Figure 412: Key fields in Abu Dhabi Field Emirate Discovery Current reserves
(bn bbls)2007E
kb/d 2012E
kb/dOperator
Upper Zakum Abu Dhabi 1964 4831 560 675 ZADCO
Lower Zakum Abu Dhabi 1967 3670 280 325 ADMA
Bab Abu Dhabi 1954 5340 330 410 ADCO
Bu Hasa Abu Dhabi 1962 2560 550 690 ADCO
Umm Shaif Abu Dhabi 1958 2506 230 305 ADMA
Asab Abu Dhabi 1965 2860 280 310 ADCO Source: Deutsche Bank
Abu Dhabi intends is to increase production from a current sustainable level of 2.7mb/d of liquids to 3.5mb/d by 2011 by upgrading and expansion of the country’s existing fields and infrastructure. Following some delays, this target looks unlikely to be achieved before 2015.
Figure 413: UAE – Liquids Production 2000-14E (kb/d) Figure 414: UAE – Gas production 2000-14E (mscf/d)
0
500
1000
1500
2000
2500
3000
3500
2000
2001
2002
2003
2004
2005
2006
2007
2008
2009
2010
2011
2012
2013
2014
ADCO ZADCO ADMA Otherkb/d
0
1000
2000
3000
4000
5000
6000
2000
2001
2002
2003
2004
2005
2006
2007
2008
2009
2010
2011
2012
2013
2014
ADCO ZADCO ADMA Other
mscf/d
Source: Wood Mackenzie; Deutsche Bank Source: Wood Mackenzie; Deutsche Bank
Figure 415: UAE – Main oil producers 2000-14E Figure 416: UAE – Gas production 2000-14E (mscf/d)
0
500
1000
1500
2000
2500
3000
3500
2000
2001
2002
2003
2004
2005
2006
2007
2008
2009
2010
2011
2012
2013
2014
ADNOC TotalBP INPEX HoldingsExxonMobil ShellRepsol YPF
kb/d
0
500
1000
1500
2000
2500
3000
3500
4000
4500
5000
2000
2001
2002
2003
2004
2005
2006
2007
2008
2009
2010
2011
2012
2013
2014
ADNOC Government of DubaiGovernment of Sharjah BP
mscf/d
Source: Wood Mackenzie; Deutsche Bank Source: Wood Mackenzie; Deutsche Bank
7 January 2008 Integrated Oils Oil & Gas for Beginners
Page 338 Deutsche Bank AG/London
In natural gas, strong domestic growth in demand has seen the UAE struggle to meet the requirements of its economy from its domestic production. Gas production in 2007 was around 4bcf/d, of which a quarter was exported as LNG, but is expected to grow to nearer 5bcf/d from 2008 as new sources are brought onstream, not least the huge Khuff reservoir in the Umm Shaif field. Despite this growth, the Emirates’ emerging gas deficit has seen it source some 2bcf/d from neighbouring Qatar through the $3.5bn Dolphin project constructed by Total (24.5%) and Occidental (24.5%). Outside Abu Dhabi, around 600mscf of gas is produced in both Sharjah and Dubai although production from both is now in decline.
Reserves and Resources
At the end of 2007 proven oil reserves in the UAE stood at 97.6 billion barrels and were dominated by those of Abu Dhabi (92 billion). Reserves in the remaining Emirates are largely exhausted (Dubai and Sharjah) or undeveloped. In Abu Dhabi there is substantial scope for further upward revisions given that production to date has concentrated on a small number of giant fields with appraisal work on other potential structures incomplete. In gas, the UAE is the world’s fourth largest holder with some 214TCF of proven reserves. The high sulphur content of several fields has, however, added considerably to the complexities associated with future production from this reserve base.
Pipelines and infrastructure
The oil infrastructure of the UAE is well established, especially in Abu Dhabi and Dubai. The offshore network focuses on oil export terminals at Das Island and Zirku Island which are fed by pipelines from the Umm Shaif and Zakum fields. Onshore, an extensive network of pipelines in Abu Dhabi connects with export terminals at Ruwais and Jebel Dhanna as well as feeding the regions two main coastal refineries at Ruwais and Umm Al Nar. More recently, plans have been laid to develop a 1.5mb/d pipeline to carry oil from the Bab field to the port of Fujairah on the eastern coast north of Oman so circumventing the need to run tankers through the Straits of Hormuz.
As with oil, gas infrastructure is also well established. In particular pipelines from the offshore Umm Shaif, Zakum and Abu fields feed the 5.6mpta Adgas LNG facility on Das Island whilst gas processing is concentrated at a 3bcf/d facility located near the Bab onshore oilfield.
Crude Oil Blends and Quality
UAE’s crude streams are light and sweet compared with many other Middle Eastern producers. Moreover, many of the undeveloped fields also contain relatively light, sweet, oil. The key blend is that of Murban (40° API) which is sourced from the onshore fields of Bu Hasa, Asab and Bab. Otherwise oil from the major offshore fields, which are piped directly to storage facilities onshore, is sold under their respective field names.
Figure 417: Summary of crude blends and characteristics Crude Oil Gravity (°API) Sulphur (%)
Murban Blend 39.6 0.7
Upper Zakum 32.9 1.8
Zakum 40.2 1.0
Umm Shaif 36.5 1.4 Source: The International Crude Oil Market Handbook 2007, Energy Intelligence Research
Broad Fiscal Terms
Most contracts in the UAE are in the form of concession agreements, where contractors are liable to pay royalty and income tax. Although the contracts are relatively standard across the

7 January 2008 Integrated Oils Oil & Gas for Beginners
Deutsche Bank AG/London Page 339
Emirates, tax and royalty levels vary. Royalty percentages are usually negotiable but stand at 20% for fields with production above 200kb/d (and as such apply to nearly all of the UAE’s output). Income tax is payable on net profits at a basic tax rate of 55% although, again, on those fields producing over 200kb/d a higher 85% rate of income tax is applied. For most fields marginal government take thus runs at 88%. Note that capex is off-settable against profits on a 10-year straight line basis.
Refining and Downstream Markets
With most of its crude exported, the refining capacity of the UAE’s four oil refineries at around 750kb/d is modest relative to oil production. Capacity is dominated by the 500kb/d Ruwais refinery in Abu Dhabi. Otherwise, one further 88kb/d refinery resides in Abu Dhabi at Umm Al Nar (88kb/d), the others being located in Sharjah (75kb/d at Hamriyah) and Fujairah (90kb/d). At the time of writing plans to build a further 500kb/d refinery in Fujairah are also being studied.
LNG
The UAE operates one LNG plant. Built in 1977 the ADGAS facility on Das Island offshore Abu Dhabi has a current capacity of 5.2mtpa, that capacity being reached post the start up of a 3mtpa second train in 1994. It receives its feed gas from the ADMA operated offshore fields of Zakum and Umm Shaif, amongst others. The plant is owed 70% ADNOC, 15% Mitsui, 10% BP and 5% Total. Given the growth in domestic demand for gas further expansions of the ADGAS facility are not envisaged at this time despite the Emirates huge proven reserves of natural gas.

7 January 2008 Integrated Oils Oil & Gas for Beginners
Page 340 Deutsche Bank AG/London
UAE - Notes
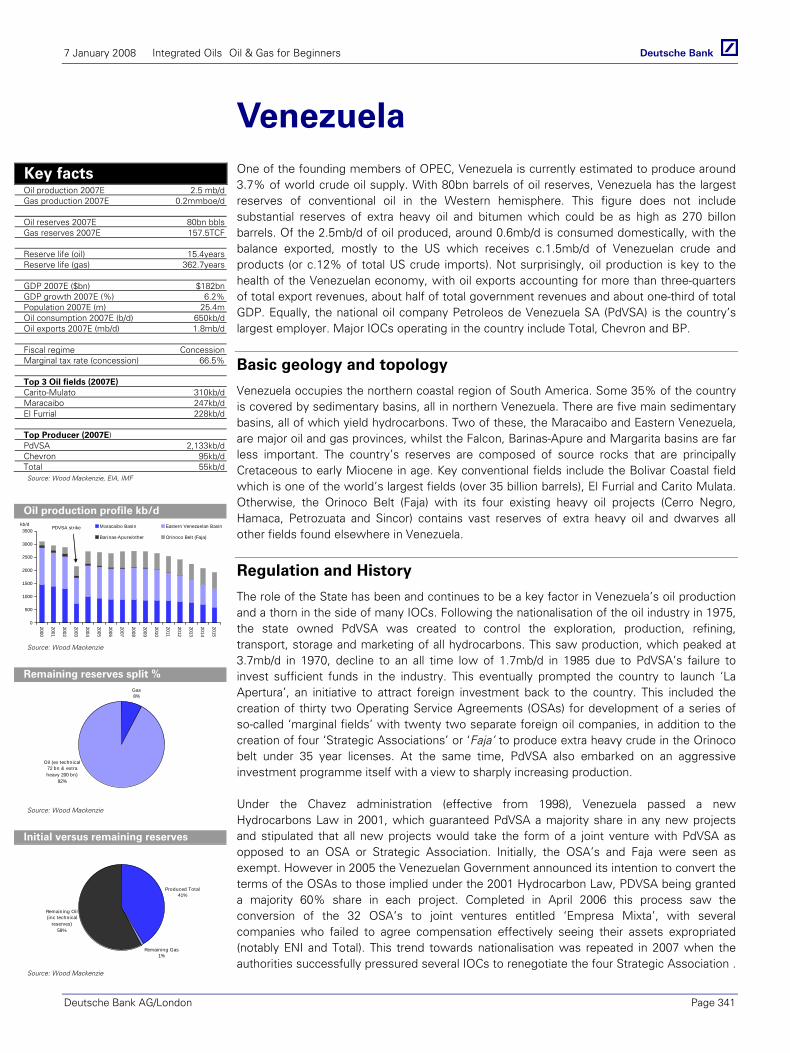
7 January 2008 Integrated Oils Oil & Gas for Beginners
Deutsche Bank AG/London Page 341
Venezuela One of the founding members of OPEC, Venezuela is currently estimated to produce around 3.7% of world crude oil supply. With 80bn barrels of oil reserves, Venezuela has the largest reserves of conventional oil in the Western hemisphere. This figure does not include substantial reserves of extra heavy oil and bitumen which could be as high as 270 billon barrels. Of the 2.5mb/d of oil produced, around 0.6mb/d is consumed domestically, with the balance exported, mostly to the US which receives c.1.5mb/d of Venezuelan crude and products (or c.12% of total US crude imports). Not surprisingly, oil production is key to the health of the Venezuelan economy, with oil exports accounting for more than three-quarters of total export revenues, about half of total government revenues and about one-third of total GDP. Equally, the national oil company Petroleos de Venezuela SA (PdVSA) is the country’s largest employer. Major IOCs operating in the country include Total, Chevron and BP.
Basic geology and topology
Venezuela occupies the northern coastal region of South America. Some 35% of the country is covered by sedimentary basins, all in northern Venezuela. There are five main sedimentary basins, all of which yield hydrocarbons. Two of these, the Maracaibo and Eastern Venezuela, are major oil and gas provinces, whilst the Falcon, Barinas-Apure and Margarita basins are far less important. The country’s reserves are composed of source rocks that are principally Cretaceous to early Miocene in age. Key conventional fields include the Bolivar Coastal field which is one of the world’s largest fields (over 35 billion barrels), El Furrial and Carito Mulata. Otherwise, the Orinoco Belt (Faja) with its four existing heavy oil projects (Cerro Negro, Hamaca, Petrozuata and Sincor) contains vast reserves of extra heavy oil and dwarves all other fields found elsewhere in Venezuela.
Regulation and History
The role of the State has been and continues to be a key factor in Venezuela’s oil production and a thorn in the side of many IOCs. Following the nationalisation of the oil industry in 1975, the state owned PdVSA was created to control the exploration, production, refining, transport, storage and marketing of all hydrocarbons. This saw production, which peaked at 3.7mb/d in 1970, decline to an all time low of 1.7mb/d in 1985 due to PdVSA’s failure to invest sufficient funds in the industry. This eventually prompted the country to launch ‘La Apertura’, an initiative to attract foreign investment back to the country. This included the creation of thirty two Operating Service Agreements (OSAs) for development of a series of so-called ‘marginal fields’ with twenty two separate foreign oil companies, in addition to the creation of four ‘Strategic Associations’ or ‘Faja’ to produce extra heavy crude in the Orinoco belt under 35 year licenses. At the same time, PdVSA also embarked on an aggressive investment programme itself with a view to sharply increasing production.
Under the Chavez administration (effective from 1998), Venezuela passed a new Hydrocarbons Law in 2001, which guaranteed PdVSA a majority share in any new projects and stipulated that all new projects would take the form of a joint venture with PdVSA as opposed to an OSA or Strategic Association. Initially, the OSA’s and Faja were seen as exempt. However in 2005 the Venezuelan Government announced its intention to convert the terms of the OSAs to those implied under the 2001 Hydrocarbon Law, PDVSA being granted a majority 60% share in each project. Completed in April 2006 this process saw the conversion of the 32 OSA’s to joint ventures entitled ‘Empresa Mixta’, with several companies who failed to agree compensation effectively seeing their assets expropriated (notably ENI and Total). This trend towards nationalisation was repeated in 2007 when the authorities successfully pressured several IOCs to renegotiate the four Strategic Association .
Key facts Oil production 2007E 2.5 mb/d Gas production 2007E 0.2mmboe/d Oil reserves 2007E 80bn bbls Gas reserves 2007E 157.5TCF Reserve life (oil) 15.4years Reserve life (gas) 362.7years GDP 2007E ($bn) $182bn GDP growth 2007E (%) 6.2% Population 2007E (m) 25.4m Oil consumption 2007E (b/d) 650kb/d Oil exports 2007E (mb/d) 1.8mb/d Fiscal regime Concession Marginal tax rate (concession) 66.5% Top 3 Oil fields (2007E) Carito-Mulato 310kb/d Maracaibo 247kb/d El Furrial 228kb/d Top Producer (2007E) PdVSA 2,133kb/d Chevron 95kb/d Total 55kb/d Source: Wood Mackenzie, EIA, IMF
Oil production profile kb/d
0
500
1000
1500
2000
2500
3000
3500
2000
2001
2002
2003
2004
2005
2006
2007
2008
2009
2010
2011
2012
2013
2014
2015
Maracaibo Basin Eastern Venezuelan Basin
Barinas-Apure/other Orinoco Belt (Faja)
PDVSA strikekb/d
Source: Wood Mackenzie
Remaining reserves split % Gas8%
Oil (ex technical 72 bn & extra heavy 200 bn)
92%
Source: Wood Mackenzie
Initial versus remaining reserves
Produced Total41%
Remaining Gas1%
Remaining Oil (inc technical
reserves)58%
Source: Wood Mackenzie
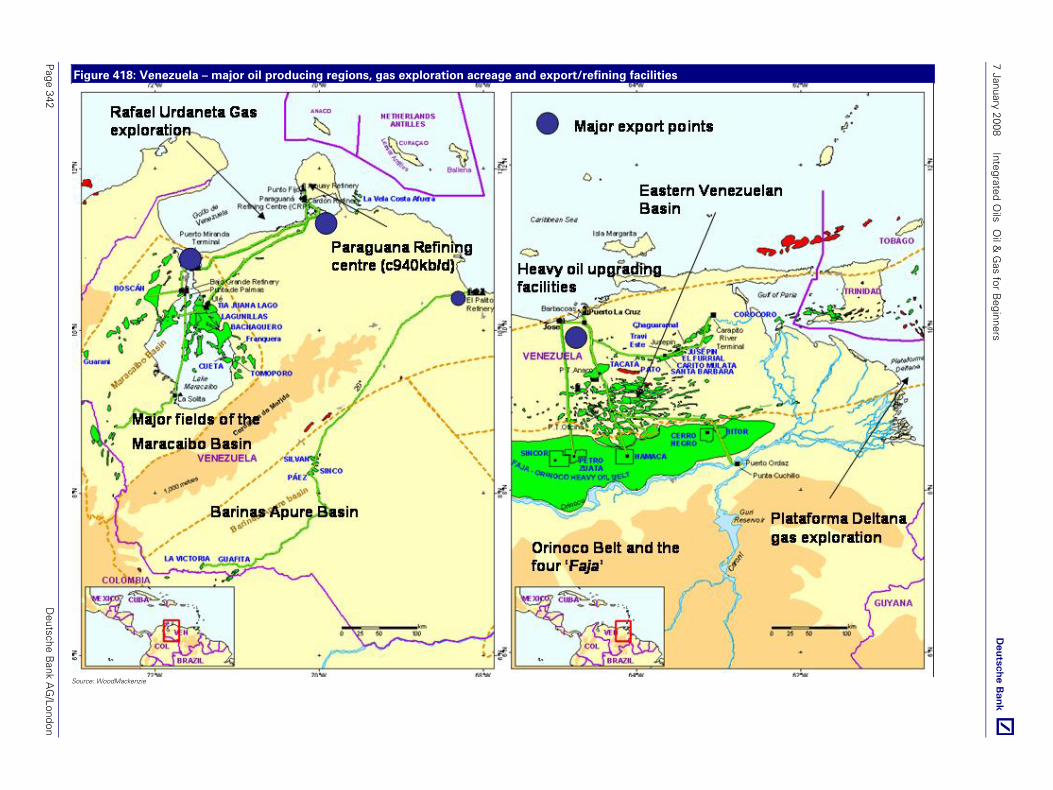
7 January 2008 Integrated O
ils O
il & G
as for Beginners
Page 342
Deutsche B
ank AG
/London
Figure 418: Venezuela – major oil producing regions, gas exploration acreage and export/refining facilities
Source: WoodMackenzie
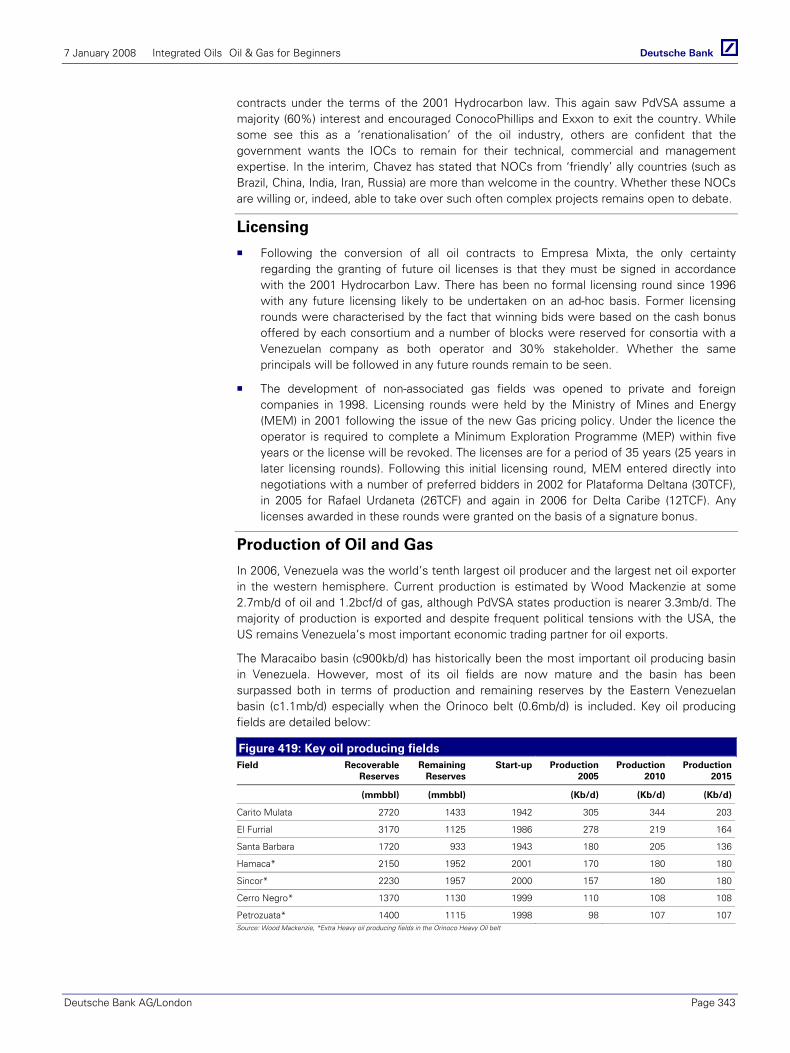
7 January 2008 Integrated Oils Oil & Gas for Beginners
Deutsche Bank AG/London Page 343
contracts under the terms of the 2001 Hydrocarbon law. This again saw PdVSA assume a majority (60%) interest and encouraged ConocoPhillips and Exxon to exit the country. While some see this as a ‘renationalisation’ of the oil industry, others are confident that the government wants the IOCs to remain for their technical, commercial and management expertise. In the interim, Chavez has stated that NOCs from ‘friendly’ ally countries (such as Brazil, China, India, Iran, Russia) are more than welcome in the country. Whether these NOCs are willing or, indeed, able to take over such often complex projects remains open to debate.
Licensing Following the conversion of all oil contracts to Empresa Mixta, the only certainty
regarding the granting of future oil licenses is that they must be signed in accordance with the 2001 Hydrocarbon Law. There has been no formal licensing round since 1996 with any future licensing likely to be undertaken on an ad-hoc basis. Former licensing rounds were characterised by the fact that winning bids were based on the cash bonus offered by each consortium and a number of blocks were reserved for consortia with a Venezuelan company as both operator and 30% stakeholder. Whether the same principals will be followed in any future rounds remain to be seen.
The development of non-associated gas fields was opened to private and foreign companies in 1998. Licensing rounds were held by the Ministry of Mines and Energy (MEM) in 2001 following the issue of the new Gas pricing policy. Under the licence the operator is required to complete a Minimum Exploration Programme (MEP) within five years or the license will be revoked. The licenses are for a period of 35 years (25 years in later licensing rounds). Following this initial licensing round, MEM entered directly into negotiations with a number of preferred bidders in 2002 for Plataforma Deltana (30TCF), in 2005 for Rafael Urdaneta (26TCF) and again in 2006 for Delta Caribe (12TCF). Any licenses awarded in these rounds were granted on the basis of a signature bonus.
Production of Oil and Gas
In 2006, Venezuela was the world’s tenth largest oil producer and the largest net oil exporter in the western hemisphere. Current production is estimated by Wood Mackenzie at some 2.7mb/d of oil and 1.2bcf/d of gas, although PdVSA states production is nearer 3.3mb/d. The majority of production is exported and despite frequent political tensions with the USA, the US remains Venezuela’s most important economic trading partner for oil exports.
The Maracaibo basin (c900kb/d) has historically been the most important oil producing basin in Venezuela. However, most of its oil fields are now mature and the basin has been surpassed both in terms of production and remaining reserves by the Eastern Venezuelan basin (c1.1mb/d) especially when the Orinoco belt (0.6mb/d) is included. Key oil producing fields are detailed below:
Figure 419: Key oil producing fields Field Recoverable
ReservesRemaining
ReservesStart-up Production
2005 Production
2010Production
2015
(mmbbl) (mmbbl) (Kb/d) (Kb/d) (Kb/d)
Carito Mulata 2720 1433 1942 305 344 203
El Furrial 3170 1125 1986 278 219 164
Santa Barbara 1720 933 1943 180 205 136
Hamaca* 2150 1952 2001 170 180 180
Sincor* 2230 1957 2000 157 180 180
Cerro Negro* 1370 1130 1999 110 108 108
Petrozuata* 1400 1115 1998 98 107 107Source: Wood Mackenzie, *Extra Heavy oil producing fields in the Orinoco Heavy Oil belt

7 January 2008 Integrated Oils Oil & Gas for Beginners
Page 344 Deutsche Bank AG/London
Venezuela has a very chequered past in terms of production. The highs of the 1970’s when production reached 3.7mb/d, were followed by a post-nationalisation decline. Subsequent to the introduction of the ‘Apertura’, Venezuela regularly exceeded its OPEC quota in the guise of increasing production to meet increasing global demand. However, since the election of President Chavez, Venezuela has broadly adhered to the country’s quota, recognising the importance of higher prices rather then increased production.
In 2002/3, a nationwide strike effectively shut down a large portion of the country’s oil industry. Output fell sharply to 700kb/d for several months as Chavez dismissed almost half of PdVSA employees. Although production was returned to more normal levels on the strike’s cessation, the loss of technical staff together with consequent damage to the main producing reservoirs have meant that production has never fully recovered to its pre-strike level. Despite official denials, questions remain on Venezuela’s ability to produce in line with its stated production capacity of 3.3mb/d.
Gas production in Venezuela has always been tied to oil production, with the oil industry consuming up to 70% of output to enhance oil recovery. Total commercial gas production in 2007 was only 1.3bcf. However, PdVSA Gas has set a target of increasing domestic gas sales to 2.5bcf by 2012, a target it aims to achieve through expansion of the non-associated gas reserves base. Repsol-YPF is the largest private natural gas producer in Venezuela with total production of 227mmcf/d (largely Quirequire) in 2006, but other IOCs such as Total, Chevron, Statoil, BP and Eni also have a presence in the gas sector.
Figure 420: Venezuela oil production 2000-15E (kb/d) Figure 421: Venezuela gas production 2006-15E mmcf/d)
0
500
1000
1500
2000
2500
3000
3500
2000
2001
2002
2003
2004
2005
2006
2007
2008
2009
2010
2011
2012
2013
2014
2015
Maracaibo Basin Eastern Venezuelan Basin
Barinas-Apure/other Orinoco Belt (Faja)
PDVSA strikekb/d
0
200
400
600
800
1,000
1,200
1,400
1,600
1,800
2006
2007
2008
2009
2010
2011
2012
2013
2014
2015
mscf/d
Source: Wood Mackenzie Source: Wood Mackenzie
Figure 422: Venezuela: Major Oil producers 2007/15E Figure 423: Venezuela: Major Gas producers 2007/15E
0
25
50
75
100
PDV
SA
Chevron
Total
Conoco **
BP
Shell
Statoil
Petrobras
XO
M **
Repsol Y
PF
kb/d
2007 2015
PdVSA at 2.6mb/d in 2007 falling to 1.9mb/d in 2015
0
50
100
150
200
250
PDV
SA
Repsol Y
PF
INPEX
Total
Chevron
HN
R
PetroFalcon
Inelectra
XO
M **
Otepi
mscf/d
2007 2015
PDVSA to 951mscf/d in 2007 falling to 700mscf/d in 2015
Source: Deutsche Bank, ** exited country in 2007 Source: Deutsche Bank, ** exited country in 2007
7 January 2008 Integrated Oils Oil & Gas for Beginners
Deutsche Bank AG/London Page 345
Reserves and Resources
With total estimated remaining reserves of conventional oil at 80bn barrels Venezuela has the largest proven reserves in the western hemisphere. Conventional oil reserves aside the country has an additional 1.3 billion barrels of extra heavy oil in place in the Orinoco belt of which 270 billion barrels are estimated to be recoverable.
PdVSA has stated that it plans to invest some $26 billion in expanding reserves and production between 2004 and 2009, with the goal of increasing production to 5.8mb/d by 2012. However, a possible impediment to PdVSAs ability to meet these investment commitments is the increasing financial demands being placed upon it by the government. Currently PdVSA spends more per annum on social programs than investments to maintain and expand oil production capacity. This drain on its finances, coupled with the diminishing presence of IOCs in the country has brought into question PdVSA’s ability to meet the necessary investment required. Key fields for future development include Tomporo (100mbbl), Chaguaranal (350mbbls) and further development of the Orinoco Heavy Oil belt’s 182bn bbls of reserves.
Oil aside, at 157tcf Venezuela has the largest gas reserves in South America. However, over 90% of these are associated gas, of which some 70% is injected to improve oil production. As mentioned earlier recent license rounds (Plataforma Deltana, Delta Caribe) have now seen the country initiate programs to expand non-associated gas production.
Pipelines and Infrastructure
Venezuelan crude oil pipeline infrastructure is in excess of 3,400 kilometres and connects the major oil fields with refineries and export terminals on the Caribbean coast, Lake Maracaibo, San Juan and the Orinoco. Most of the existing system is owned by PdVSA, although a number of private companies have constructed pipelines in recent years to transport heavy oil from the Orinoco belt to Jose for upgrading. Key crude oil pipelines include:
Figure 424: Key Crude Oil Pipelines in Venezuela Pipeline Operator From To Capacity (kb/d)
P.T. Oficina to Jose PDVSA P.T. Oficina Jose Petrochemical Complex 800
Lagunillas-La Salina PDVSA Lagunillas La Salina 650
Cerro Negro to P.T. Oficina PDVSA Cerro Negro P.T. Oficina 600
Zuata-Jose PDVSA Zuata Jose Petrochemical Complex 510Source: Wood Mackenzie
Venezuela lacks adequate domestic natural gas infrastructure and it is estimated some $1.2 billion will need to be invested in pipelines over the next five years. At present there are two pipelines linking the main gas field Anaco to both Puerto Ordaz and Puerto la Cruz with total capacity of 850mmcf/d. Construction has begun on the Central-Occidental Interconnection (ICO) pipeline which will connect the central and western parts of the country (550mmcf/d). The intention is to supply more gas in the west for re-injection into oil fields. Construction has also begun on the 150mscf/d Gasoducto Transcaribeno pipeline linking Columbia with Venezuela. Intended initially to supply gas from Columbia for enhanced oil production in the Maracaibo area, it is envisaged that the flow here will eventually be reversed once Venezuela has further developed its own domestic gas resources.
Crude Oil Blends and Quality
Venezuelan crude is predominantly heavy and sour. Its main export blend is BCF-17, a heavy (16° API) sour (2.5%) crude. A significant proportion of its output (c0.6mb/d) is also of synthetic crude produced from upgrading the extra heavy (9˚ API) crude from the projects in

7 January 2008 Integrated Oils Oil & Gas for Beginners
Page 346 Deutsche Bank AG/London
the Orinoco belt to syncrude with an API of nearer 26-36° in purpose built facilities. Syncrude which cannot be sold on the open market is sold for further upgrading in USA.
Outside these main crude blends, Venezuela also continues to market 100kb/d of Orimulsion, a blend of 70% bitumen, water and surfactant which is used as boiler fuel in power plants. Orimulsion falls outside the country’s OPEC quota given bitumen is seen as a non-oil hydrocarbon.
Broad Fiscal Terms
Venezuela operates through tax and royalty concessions. The 2001 Hydrocarbon Law now governs the fiscal terms applicable to all oil contracts. Both OSAs and Strategic Associations which applied to the majority of foreign operated contracts terminated throughout 2006-7. The corporation tax rate which is applied to all oil projects now stands at 50% and the royalty (which is deductible for tax purposes) is set at 33%. It should however be noted that for the heavy oil projects of the Orinoco Belt royalty is levied upon the value of the heavy oil blend (which tends to sell at a significant discount to WTI) rather than upgraded syncrude. No royalty is payable on upgrading.
Refining and Downstream markets
In 2006 Venezuela’s six domestic refineries had a total refining capacity of 1.3mb/d. The country’s two largest refineries, Amuay at 635kb/d and Cardon at 305kb/d, which are located on the Paraguana peninsular to the north east of the Maracaibo Basin, together form the Paraguana Refining Centre (or CRP). These facilities aside production from the Barinas Basin is connected to the 130kb/d El Palito refinery near to Caracas on the Caribbean coast whilst production from the Eastern Venezuelan Basin feeds into the 195kb/d Puerto La Cruz refinery, again on the Caribbean coast line. In 2005, PdVSA announced plans to build three new refineries by 2009 and to upgrade facilities at El Palito and Puerto la Cruz, which should add a further 650kb/d to domestic refining capacity.
Importantly, the development of the Strategic Associations entailed the construction of four heavy oil upgrading facilities on the coast at Jose to the east of Caracas. These refineries process extra heavy oil piped north from the Orinoco belt and produce the Sincor, Petrozuata, Hamaca and Cerro Negro blends.
Separately, it is also of note that through its ownership of the US refiner, CITGO, amongst others PdVSA is actually one of the world’s largest refiners with total distillation capacity including that in Venezuela itself of an estimated 3.4mb/d. The company has, however, recently announced its desire to sell the CITGO business as well as other regional refining assets.
LNG
Despite its favourable location and significant gas reserves, Venezuela’s attempts to establish an LNG industry have to date come to nothing. In 1994 and again in 2000, PdVSA signed agreements with Shell and Mitsubishi to develop gas reserves on the Paria Peninsula. These included the construction of an LNG export terminal (the Mariscal Sucre project). However, difficulties associated with securing a market for the gas saw these projects abandoned. More recently, in February 2005 Petrobras signed a MoU with PdVSA to study the prospect of developing the Rio Caribe gas field for the domestic market. PdVSA maintains that there are sufficient reserves to support an LNG export terminal although at this time no such development appears likely for the foreseeable future.

7 January 2008 Integrated Oils Oil & Gas for Beginners
Deutsche Bank AG/London Page 347
Venezuela - Notes

7 January 2008 Integrated Oils Oil & Gas for Beginners
Page 348 Deutsche Bank AG/London
This page has been intentionally left in blank
7 January 2008 Integrated Oils Oil & Gas for Beginners
Deutsche Bank AG/London Page 349
Section III: The Companies The European Majors
BP
RDS
Total
ENI
Repsol
StatoilHydro
BG Group
The US Majors
ExxonMobil
Chevron
ConocoPhillips
Occidental
Hess
Marathon

7 January 2008 Integrated Oils Oil & Gas for Beginners
Page 350 Deutsche Bank AG/London
This page has been intentionally left in blank

7 January 2008 Integrated Oils Oil & Gas for Beginners
Deutsche Bank AG/London Page 351
Europe United Kingdom Oil & Gas Integrated Oils
4 January 2008
BP Reuters: BP.L Bloomberg: BP/ LN
Coming out of rehab
After three disappointing years and significant management change, BP's performance looks set for a useful improvement. We expect production to rally (growth of c.2% to 2010) not least as the New Profit Centres (GoM, Angola, Azerbaijan, T&T and Asia Pacific LNG) more than offset declines in the North Sea and Alaska. Downstream, the return of significant US refining capacity should prove a strong driver of profit with BP’s US mid-western refineries well placed to capture value from the upgrading of heavy oils. Financial discipline should also see continued cash returned to shareholder. Our BUY stance reflects these strengths.
Russian focussed E&P: Over the last decade, BP has built leading positions in some of the world’s largest basins, not least the GoM, Angola and Caspian, and has found more oil and gas at a lower cost than any of its peers. Yet despite its clear strength in conventional oil and gas, its portfolio lacks the functional and geographical diversity of its peers, not least given its more limited exposure to development-led growth opportunities in the oil sands, LNG and GTL. Elsewhere, BP’s unique and differentiated position in Russia via BP-TNK is fundamental to the company’s overall performance (c.25% upstream volume), as well as appearing core to organic reserve replacement at this time.
Downstream: Despite roughly 55% of its nominal 2.8mb/d of refining capacity being located in higher margin US markets, BP’s downstream performance in recent years has been woeful. In particular, a fatal explosion at its key 460kb/d Texas City refinery in 2005 and its later closure have impacted heavily on refining profits, not to mention the company’s US reputation. Following a series of investigations and operational reviews, utilisation and profitability should, however, improve dramatically from here and better reflect the businesses underlying complexity and potential.
Other: BP has a leading presence in the growth petrochemical markets for polyester precursors (para-xylene and purified tere-phthalic acid or PTA). It is also active in alternate energy sources such as solar, wind, hydrogen and biofuels.
Valuation & Risk BP’s potential for recovery combined with the depth of its resource base suggest to us that it should trade at a useful 10-15% premium to our target 12x 2008 sector P/E multiple. Our 725p target price is in line with our DCF value which, using a sector beta of 0.9x and 2% long run growth suggests fair value of 715p. Risks include delay to key projects not least Thunder Horse and Texas City. Forecasts and ratios
Year End Dec 31 2005A 2006A 2007E 2008E 2009E
DB EPS (USD) 0.99 1.01 1.02 1.25 1.23
P/E (x) 10.9 11.4 12.3 10.1 10.2
Dividend Yield (%) 3.3 3.4 3.5 3.8 4.1
Source: Deutsche Bank estimates, company data
Buy Price at 3 Jan 2008 (GBP) 635.50Price Target (GBP) 725.0052-week range (GBP) 635.50 - 507.50
BP Production Profile 06-11E
3650
3700
3750
3800
3850
3900
3950
4000
4050
4100
2006 2007 E 2008 E 2009 E 2010 E 2011 E
kboe/d
Source: Deutsche Bank
Upstream CAGR (2006 – 10E) 0.8%Oil production (2006) 2,475kb/dGas production (2006) 1,447kboe/dOil Reserves (1P) 9.7bn/bblsGas Reserves (1P) 7.9bn/boeRefining capacity 2,823kb/dMarketing volumes 5,801kb/dWood Mackenzie 2P(E) Total reserves 29.5bn/boePSC sensitivity to $1/bbl move in oil (E) c.0.17 %
Sensitivity to $1/bbl move in oil
1.6%
0.0%
0.5%
1.0%
1.5%
2.0%
2.5%
3.0%
Sunc
or
Hes
s
Chev
ron
Petr
o-Ca
nada
Occ
iden
tal
COP
BP
XO
M
Stat
oilH
ydro
Eni
Reps
ol
Tota
l
RDS
Mar
atho
n
BG
Source: Deutsche Bank
Sensitivity to $1/bbl move in refining
3.3%
0%
1%
2%
3%
4%
5%
6%
7%
Reps
ol
Mar
atho
n
COP
RDS
Tota
l
BP
XO
M
Chev
ron
Hes
s
Petr
o-Ca
nada
Sunc
or
Eni
Stat
oilH
ydro
Occ
iden
tal
BG
Source: Deutsche Bank
Reserve Life (1P)
12.3
0
5
10
15
20
25
30
Sunc
or
COP
XO
M
Occ
iden
tal
Tota
l
Chev
ron
BP
Petr
o-Ca
nada
Stat
oilH
ydro
Eni
BG RDS
Mar
atho
n
Hes
s
Reps
ol
Reserves Life Average
Source: Deutsche Bank
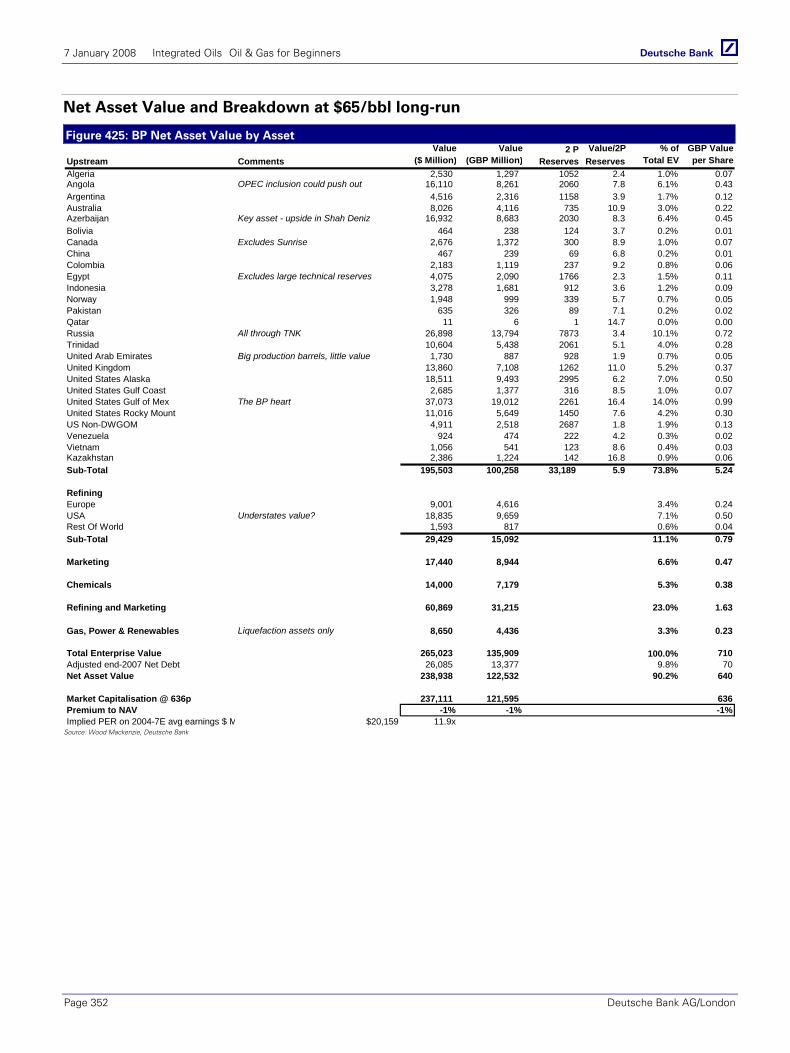
7 January 2008 Integrated Oils Oil & Gas for Beginners
Page 352 Deutsche Bank AG/London
Net Asset Value and Breakdown at $65/bbl long-run
Figure 425: BP Net Asset Value by Asset Value Value 2 P Value/2P % of GBP Value
($ Million) (GBP Million) Reserves Reserves Total EV per ShareAlgeria 2,530 1,297 1052 2.4 1.0% 0.07Angola OPEC inclusion could push out 16,110 8,261 2060 7.8 6.1% 0.43Argentina 4,516 2,316 1158 3.9 1.7% 0.12Australia 8,026 4,116 735 10.9 3.0% 0.22Azerbaijan Key asset - upside in Shah Deniz 16,932 8,683 2030 8.3 6.4% 0.45Bolivia 464 238 124 3.7 0.2% 0.01Canada Excludes Sunrise 2,676 1,372 300 8.9 1.0% 0.07China 467 239 69 6.8 0.2% 0.01Colombia 2,183 1,119 237 9.2 0.8% 0.06Egypt Excludes large technical reserves 4,075 2,090 1766 2.3 1.5% 0.11Indonesia 3,278 1,681 912 3.6 1.2% 0.09Norway 1,948 999 339 5.7 0.7% 0.05Pakistan 635 326 89 7.1 0.2% 0.02Qatar 11 6 1 14.7 0.0% 0.00Russia All through TNK 26,898 13,794 7873 3.4 10.1% 0.72Trinidad 10,604 5,438 2061 5.1 4.0% 0.28United Arab Emirates Big production barrels, little value 1,730 887 928 1.9 0.7% 0.05United Kingdom 13,860 7,108 1262 11.0 5.2% 0.37United States Alaska 18,511 9,493 2995 6.2 7.0% 0.50United States Gulf Coast 2,685 1,377 316 8.5 1.0% 0.07United States Gulf of Mex The BP heart 37,073 19,012 2261 16.4 14.0% 0.99United States Rocky Mount 11,016 5,649 1450 7.6 4.2% 0.30US Non-DWGOM 4,911 2,518 2687 1.8 1.9% 0.13Venezuela 924 474 222 4.2 0.3% 0.02Vietnam 1,056 541 123 8.6 0.4% 0.03Kazakhstan 2,386 1,224 142 16.8 0.9% 0.06Sub-Total 195,503 100,258 33,189 5.9 73.8% 5.24
RefiningEurope 9,001 4,616 3.4% 0.24USA Understates value? 18,835 9,659 7.1% 0.50Rest Of World 1,593 817 0.6% 0.04Sub-Total 29,429 15,092 11.1% 0.79
Marketing 17,440 8,944 6.6% 0.47
Chemicals 14,000 7,179 5.3% 0.38
Refining and Marketing 60,869 31,215 23.0% 1.63
Gas, Power & Renewables Liquefaction assets only 8,650 4,436 3.3% 0.23
Total Enterprise Value 265,023 135,909 100.0% 710Adjusted end-2007 Net Debt 26,085 13,377 9.8% 70Net Asset Value 238,938 122,532 90.2% 640
Market Capitalisation @ 636p 237,111 121,595 636Premium to NAV -1% -1% -1%Implied PER on 2004-7E avg earnings $ M $20,159 11.9x
Upstream Comments
Source: Wood Mackenzie, Deutsche Bank
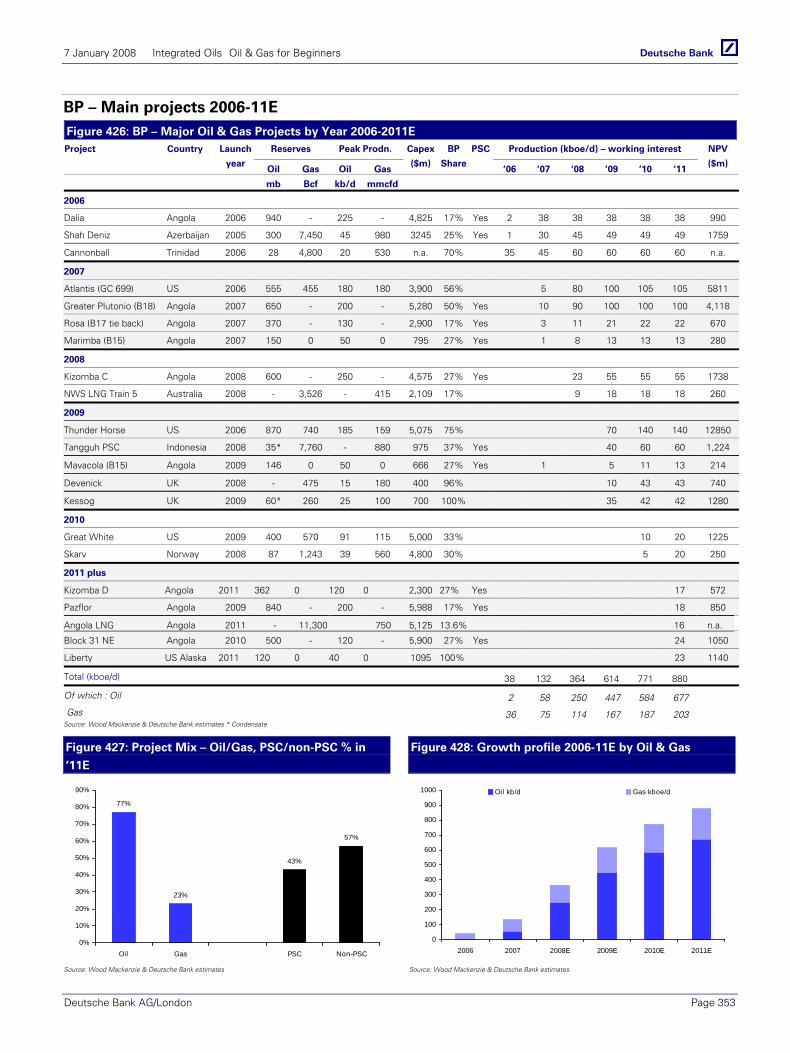
7 January 2008 Integrated Oils Oil & Gas for Beginners
Deutsche Bank AG/London Page 353
BP – Main projects 2006-11E Figure 426: BP – Major Oil & Gas Projects by Year 2006-2011E
Reserves Peak Prodn. Production (kboe/d) – working interest Project Country Launch
year Oil Gas Oil Gas
Capex
($m)
BP
Share
PSC
‘06 ‘07 ‘08 ‘09 ‘10 ‘11
NPV
($m)
mb Bcf kb/d mmcfd
2006
Dalia Angola 2006 940 - 225 - 4,825 17% Yes 2 38 38 38 38 38 990
Shah Deniz Azerbaijan 2005 300 7,450 45 980 3245 25% Yes 1 30 45 49 49 49 1759
Cannonball Trinidad 2006 28 4,800 20 530 n.a. 70% 35 45 60 60 60 60 n.a.
2007
Atlantis (GC 699) US 2006 555 455 180 180 3,900 56% 5 80 100 105 105 5811
Greater Plutonio (B18) Angola 2007 650 - 200 - 5,280 50% Yes 10 90 100 100 100 4,118
Rosa (B17 tie back) Angola 2007 370 - 130 - 2,900 17% Yes 3 11 21 22 22 670
Marimba (B15) Angola 2007 150 0 50 0 795 27% Yes 1 8 13 13 13 280
2008
Kizomba C Angola 2008 600 - 250 - 4,575 27% Yes 23 55 55 55 1738
NWS LNG Train 5 Australia 2008 - 3,526 - 415 2,109 17% 9 18 18 18 260
2009
Thunder Horse US 2006 870 740 185 159 5,075 75% 70 140 140 12850
Tangguh PSC Indonesia 2008 35* 7,760 - 880 975 37% Yes 40 60 60 1,224
Mavacola (B15) Angola 2009 146 0 50 0 666 27% Yes 1 5 11 13 214
Devenick UK 2008 - 475 15 180 400 96% 10 43 43 740
Kessog UK 2009 60* 260 25 100 700 100% 35 42 42 1280
2010
Great White US 2009 400 570 91 115 5,000 33% 10 20 1225
Skarv Norway 2008 87 1,243 39 560 4,800 30% 5 20 250
2011 plus
Kizomba D Angola 2011 362 0 120 0 2,300 27% Yes 17 572
Pazflor Angola 2009 840 - 200 - 5,988 17% Yes 18 850
Angola LNG Angola 2011 - 11,300 750 5,125 13.6% 16 n.a.
Block 31 NE Angola 2010 500 - 120 - 5,900 27% Yes 24 1050
Liberty US Alaska 2011 120 0 40 0 1095 100% 23 1140
Total (kboe/d) 38 132 364 614 771 880
Of which : Oil 2 58 250 447 584 677
Gas 36 75 114 167 187 203 Source: Wood Mackenzie & Deutsche Bank estimates * Condensate
Figure 427: Project Mix – Oil/Gas, PSC/non-PSC % in
‘11E
Figure 428: Growth profile 2006-11E by Oil & Gas
77%
23%
43%
57%
0%
10%
20%
30%
40%
50%
60%
70%
80%
90%
Oil Gas PSC Non-PSC
0
100
200
300
400
500
600
700
800
900
1000
2006 2007 2008E 2009E 2010E 2011E
Oil kb/d Gas kboe/d
Source: Wood Mackenzie & Deutsche Bank estimates Source: Wood Mackenzie & Deutsche Bank estimates
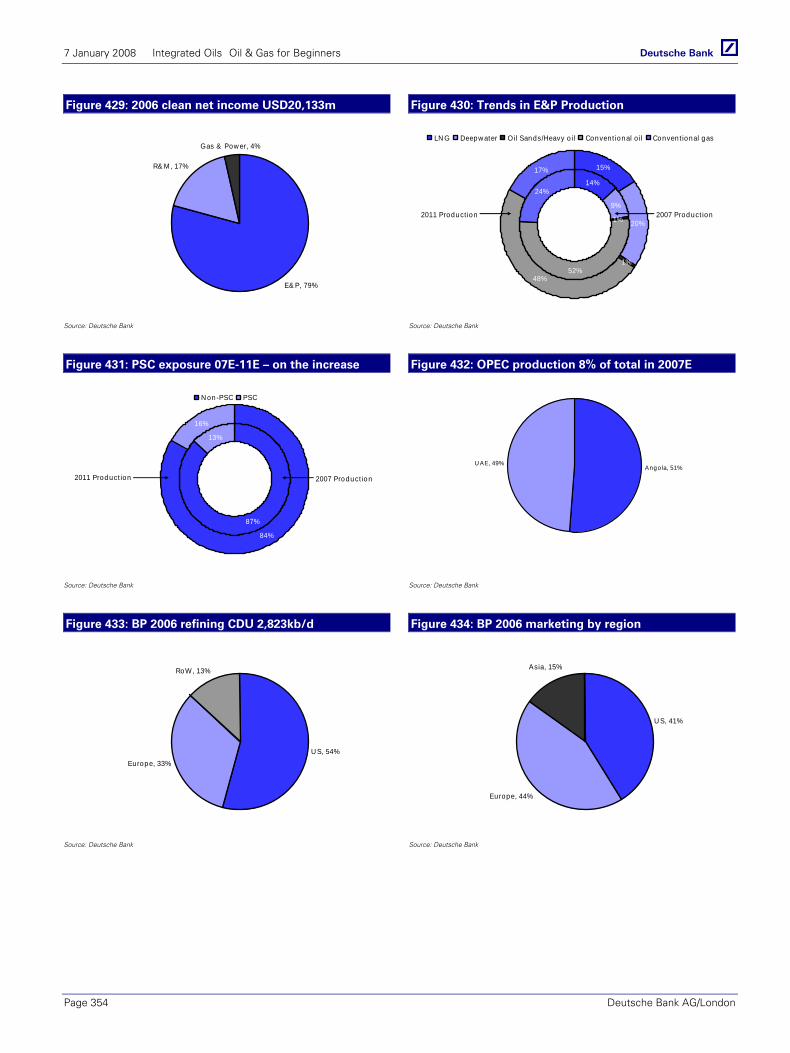
7 January 2008 Integrated Oils Oil & Gas for Beginners
Page 354 Deutsche Bank AG/London
Figure 429: 2006 clean net income USD20,133m Figure 430: Trends in E&P Production
E& P, 79%
R& M , 17%
Gas & Pow er, 4%
14%
9%
52%
24%
15%
20%
48%
17%
1%
1%
LN G Deepw ater Oil Sands/Heavy o il Convent ional o il Conven t ional gas
2011 Product ion 2007 Product ion
Source: Deutsche Bank Source: Deutsche Bank
Figure 431: PSC exposure 07E-11E – on the increase Figure 432: OPEC production 8% of total in 2007E
87%
84%
13%
16%
N on-PSC PSC
2011 Product ion 2007 Product ion
Angola, 51%U AE, 49%
Source: Deutsche Bank Source: Deutsche Bank
Figure 433: BP 2006 refining CDU 2,823kb/d Figure 434: BP 2006 marketing by region
U S, 54%Europe, 33%
RoW, 13%
U S, 41%
Europe, 44%
Asia, 15%
Source: Deutsche Bank Source: Deutsche Bank

7 January 2008 Integrated Oils Oil & Gas for Beginners
Deutsche Bank AG/London Page 355
Europe Netherlands Oil & Gas Integrated Oils
4 January 2008
Royal Dutch Shell plc Reuters: RDSa.L Bloomberg: RDSA LN
Building a long lived base
Post the 2004 reserves debacle, Shell is a company transformed. Exploration success, whilst expensive, has afforded management the confidence that it can discover resource, communication across the business has been simplified driving savings and operational improvement and continued strength in crude means that Shell’s strategic investments in growth areas which are long-lived, geared to a high oil price and afford access to a substantial resource base are now highly economically attractive. In the downstream, greater marketing exposure than its peers adds robustness. Our BUY stance reflects these positive attributes.
Upstream: Having committed to substantial exploration spend, Shell now boasts one of the few truly global exploration portfolios with plays in many of the world’s largest basins such as the Gulf of Mexico, Nigeria, Brazil and Australia. Shell is the by far and away the global leader in LNG, a leader in the Canadian oil sands and is pioneering new uses of gas including GTL via its Pearl GTL project in Qatar. These long-term positions mean that Shell is positioned to enjoy sustained reserve and production growth (CAGR to 2012 is 2-3%) and offers the potential for strong cash generation in addition to opportunities for further profitable growth.
Downstream: Downstream the emphasis remains on sustained cash generation and a focus on the growing markets of Asia Pacific. The company is a substantial European refiner but also has significant exposure to more profitable US markets, not least through its Motiva partnership with Aramco. In contrast with most of its peers the company’s downstream activities are more heavily weighted towards marketing which historically has represented at least 50% of Oil Products net income and adds greater robustness to the downstream portfolio.
Other: Shell’s Chemicals business encompasses the production and sale of bulk petrochemicals (olefins, aromatics etc), with a focus on integrating chemicals with refining at super-sites. Shell is also active in developing alternative energy sources and it is one of the world’s leading distributors of bio-fuels.
Valuation & Risk The quality and depth of the RDS portfolio suggest to us the shares should trade at around our 12x 2008 target sector multiple implying fair value per RDS share of 2450p. This is supported by our DCF model (2% growth, 7% CoC) and net asset analysis. Downside risks include ongoing Nigerian disruption and further rises in capex forcing delays at key projects (Pearl, AOSP, etc).
Forecasts and ratios
Year End Dec 31 2005A 2006A 2007E 2008E 2009E
DB EPS (USD) 3.25 3.90 4.22 4.38 4.33
P/E (x) 9.5 8.5 9.9 9.6 9.7
Dividend Yield (%) 3.7 3.8 3.4 3.8 4.0Source: Deutsche Bank estimates, company data
Buy Price at 3 Jan 2008 (GBP) 2,176.00Price Target (GBP) 2,450.0052-week range (GBP) 2,176.00 - 1,625.00
RDS Production Profile 2006 – 11E
3000
3100
3200
3300
3400
3500
3600
3700
3800
2006 2007 E 2008 E 2009 E 2010 E 2011 E
kboe/d
Source: Deutsche Bank
Upstream CAGR (2006 – 10E) 0.5%Oil production (2006) 2,032kb/dGas production (2006) 1,443kboe/dOil Reserves (1P) 4.2bn/bblsGas Reserves (1P) 7.6bn/boeRefining capacity 4,044kb/dMarketing volumes 8,957kb/dWood Mackenzie 2P(E) Total reserves 28.4bn/boePSC sensitivity to $1/bbl move in oil (E) c.0.1%
Sensitivity to $1/bbl move in oil
1.0%
0.0%
0.5%
1.0%
1.5%
2.0%
2.5%
3.0%Su
ncor
Hes
s
Chev
ron
Petr
o-Ca
nada
Occ
iden
tal
COP
BP
XO
M
Stat
oilH
ydro
Eni
Reps
ol
Tota
l
RDS
Mar
atho
n
BG
Source: Deutsche Bank
Sensitivity to $1/bbl move in refining
3.5%
0%
1%
2%
3%
4%
5%
6%
7%
Reps
ol
Mar
atho
n
COP
RDS
Tota
l
BP
XO
M
Chev
ron
Hes
s
Petr
o-Ca
nada
Sunc
or
Eni
Stat
oilH
ydro
Occ
iden
tal
BG
Source: Deutsche Bank
Reserve Life (1P)
9.5
0
5
10
15
20
25
30
Sunc
or
COP
XO
M
Occ
iden
tal
Tota
l
Chev
ron
BP
Petr
o-Ca
nada
Stat
oilH
ydro
Eni
BG RDS
Mar
atho
n
Hes
s
Reps
ol
Reserves Life Average
Source: Deutsche Bank
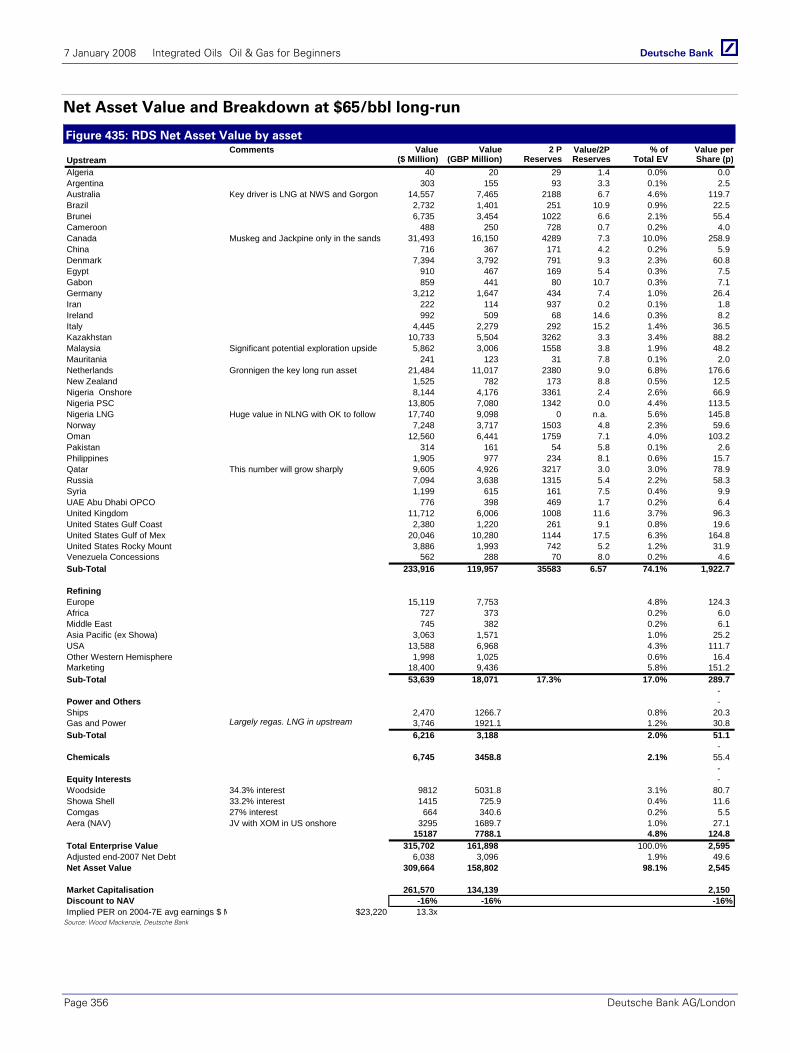
7 January 2008 Integrated Oils Oil & Gas for Beginners
Page 356 Deutsche Bank AG/London
Net Asset Value and Breakdown at $65/bbl long-run
Figure 435: RDS Net Asset Value by asset Comments Value Value 2 P Value/2P % of Value per
Upstream ($ Million) (GBP Million) Reserves Reserves Total EV Share (p)Algeria 40 20 29 1.4 0.0% 0.0 Argentina 303 155 93 3.3 0.1% 2.5 Australia Key driver is LNG at NWS and Gorgon 14,557 7,465 2188 6.7 4.6% 119.7 Brazil 2,732 1,401 251 10.9 0.9% 22.5 Brunei 6,735 3,454 1022 6.6 2.1% 55.4 Cameroon 488 250 728 0.7 0.2% 4.0 Canada Muskeg and Jackpine only in the sands 31,493 16,150 4289 7.3 10.0% 258.9 China 716 367 171 4.2 0.2% 5.9 Denmark 7,394 3,792 791 9.3 2.3% 60.8 Egypt 910 467 169 5.4 0.3% 7.5 Gabon 859 441 80 10.7 0.3% 7.1 Germany 3,212 1,647 434 7.4 1.0% 26.4 Iran 222 114 937 0.2 0.1% 1.8 Ireland 992 509 68 14.6 0.3% 8.2 Italy 4,445 2,279 292 15.2 1.4% 36.5 Kazakhstan 10,733 5,504 3262 3.3 3.4% 88.2 Malaysia Significant potential exploration upside 5,862 3,006 1558 3.8 1.9% 48.2 Mauritania 241 123 31 7.8 0.1% 2.0 Netherlands Gronnigen the key long run asset 21,484 11,017 2380 9.0 6.8% 176.6 New Zealand 1,525 782 173 8.8 0.5% 12.5 Nigeria Onshore 8,144 4,176 3361 2.4 2.6% 66.9 Nigeria PSC 13,805 7,080 1342 0.0 4.4% 113.5 Nigeria LNG Huge value in NLNG with OK to follow 17,740 9,098 0 n.a. 5.6% 145.8 Norway 7,248 3,717 1503 4.8 2.3% 59.6 Oman 12,560 6,441 1759 7.1 4.0% 103.2 Pakistan 314 161 54 5.8 0.1% 2.6 Philippines 1,905 977 234 8.1 0.6% 15.7 Qatar This number will grow sharply 9,605 4,926 3217 3.0 3.0% 78.9 Russia 7,094 3,638 1315 5.4 2.2% 58.3 Syria 1,199 615 161 7.5 0.4% 9.9 UAE Abu Dhabi OPCO 776 398 469 1.7 0.2% 6.4 United Kingdom 11,712 6,006 1008 11.6 3.7% 96.3 United States Gulf Coast 2,380 1,220 261 9.1 0.8% 19.6 United States Gulf of Mex 20,046 10,280 1144 17.5 6.3% 164.8 United States Rocky Mount 3,886 1,993 742 5.2 1.2% 31.9 Venezuela Concessions 562 288 70 8.0 0.2% 4.6 Sub-Total 233,916 119,957 35583 6.57 74.1% 1,922.7
RefiningEurope 15,119 7,753 4.8% 124.3 Africa 727 373 0.2% 6.0 Middle East 745 382 0.2% 6.1 Asia Pacific (ex Showa) 3,063 1,571 1.0% 25.2 USA 13,588 6,968 4.3% 111.7 Other Western Hemisphere 1,998 1,025 0.6% 16.4 Marketing 18,400 9,436 5.8% 151.2 Sub-Total 53,639 18,071 17.3% 17.0% 289.7
- Power and Others - Ships 2,470 1266.7 0.8% 20.3 Gas and Power Largely regas. LNG in upstream 3,746 1921.1 1.2% 30.8 Sub-Total 6,216 3,188 2.0% 51.1
- Chemicals 6,745 3458.8 2.1% 55.4
- Equity Interests - Woodside 34.3% interest 9812 5031.8 3.1% 80.7 Showa Shell 33.2% interest 1415 725.9 0.4% 11.6 Comgas 27% interest 664 340.6 0.2% 5.5 Aera (NAV) JV with XOM in US onshore 3295 1689.7 1.0% 27.1
15187 7788.1 4.8% 124.8 Total Enterprise Value 315,702 161,898 100.0% 2,595 Adjusted end-2007 Net Debt 6,038 3,096 1.9% 49.6 Net Asset Value 309,664 158,802 98.1% 2,545
Market Capitalisation 261,570 134,139 2,150 Discount to NAV -16% -16% -16%Implied PER on 2004-7E avg earnings $ M $23,220 13.3x
Source: Wood Mackenzie, Deutsche Bank
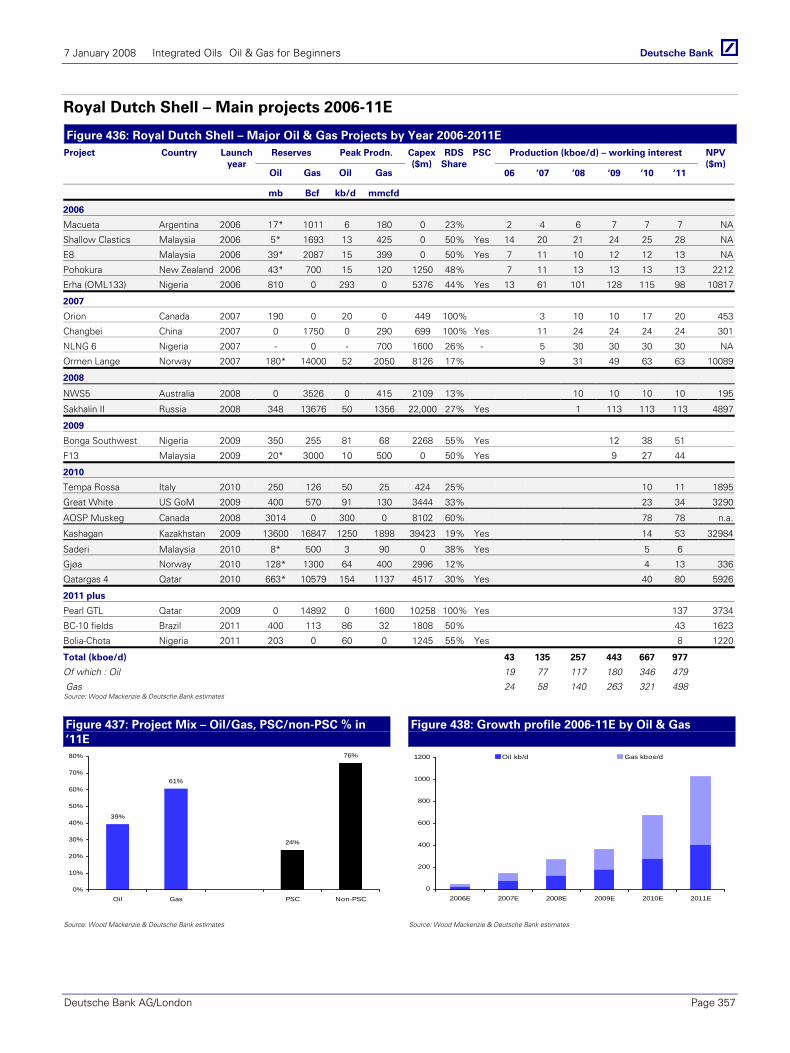
7 January 2008 Integrated Oils Oil & Gas for Beginners
Deutsche Bank AG/London Page 357
Royal Dutch Shell – Main projects 2006-11E
Figure 436: Royal Dutch Shell – Major Oil & Gas Projects by Year 2006-2011E Reserves Peak Prodn. Production (kboe/d) – working interest Project Country Launch
year Oil Gas Oil Gas
Capex($m)
RDS Share
PSC
06 ‘07 ‘08 ‘09 ‘10 ‘11
NPV($m)
mb Bcf kb/d mmcfd
2006
Macueta Argentina 2006 17* 1011 6 180 0 23% 2 4 6 7 7 7 NA
Shallow Clastics Malaysia 2006 5* 1693 13 425 0 50% Yes 14 20 21 24 25 28 NA
E8 Malaysia 2006 39* 2087 15 399 0 50% Yes 7 11 10 12 12 13 NA
Pohokura New Zealand 2006 43* 700 15 120 1250 48% 7 11 13 13 13 13 2212
Erha (OML133) Nigeria 2006 810 0 293 0 5376 44% Yes 13 61 101 128 115 98 10817
2007
Orion Canada 2007 190 0 20 0 449 100% 3 10 10 17 20 453
Changbei China 2007 0 1750 0 290 699 100% Yes 11 24 24 24 24 301
NLNG 6 Nigeria 2007 - 0 - 700 1600 26% - 5 30 30 30 30 NA
Ormen Lange Norway 2007 180* 14000 52 2050 8126 17% 9 31 49 63 63 10089
2008
NWS5 Australia 2008 0 3526 0 415 2109 13% 10 10 10 10 195
Sakhalin II Russia 2008 348 13676 50 1356 22,000 27% Yes 1 113 113 113 4897
2009
Bonga Southwest Nigeria 2009 350 255 81 68 2268 55% Yes 12 38 51
F13 Malaysia 2009 20* 3000 10 500 0 50% Yes 9 27 44
2010
Tempa Rossa Italy 2010 250 126 50 25 424 25% 10 11 1895
Great White US GoM 2009 400 570 91 130 3444 33% 23 34 3290
AOSP Muskeg Canada 2008 3014 0 300 0 8102 60% 78 78 n.a.
Kashagan Kazakhstan 2009 13600 16847 1250 1898 39423 19% Yes 14 53 32984
Saderi Malaysia 2010 8* 500 3 90 0 38% Yes 5 6
Gjøa Norway 2010 128* 1300 64 400 2996 12% 4 13 336
Qatargas 4 Qatar 2010 663* 10579 154 1137 4517 30% Yes 40 80 5926
2011 plus
Pearl GTL Qatar 2009 0 14892 0 1600 10258 100% Yes 137 3734
BC-10 fields Brazil 2011 400 113 86 32 1808 50% 43 1623
Bolia-Chota Nigeria 2011 203 0 60 0 1245 55% Yes 8 1220
Total (kboe/d) 43 135 257 443 667 977
Of which : Oil 19 77 117 180 346 479
Gas 24 58 140 263 321 498 Source: Wood Mackenzie & Deutsche Bank estimates
Figure 437: Project Mix – Oil/Gas, PSC/non-PSC % in ‘11E
Figure 438: Growth profile 2006-11E by Oil & Gas
39%
61%
24%
76%
0%
10%
20%
30%
40%
50%
60%
70%
80%
Oil Gas PSC Non-PSC
0
200
400
600
800
1000
1200
2006E 2007E 2008E 2009E 2010E 2011E
Oil kb/d Gas kboe/d
Source: Wood Mackenzie & Deutsche Bank estimates Source: Wood Mackenzie & Deutsche Bank estimates
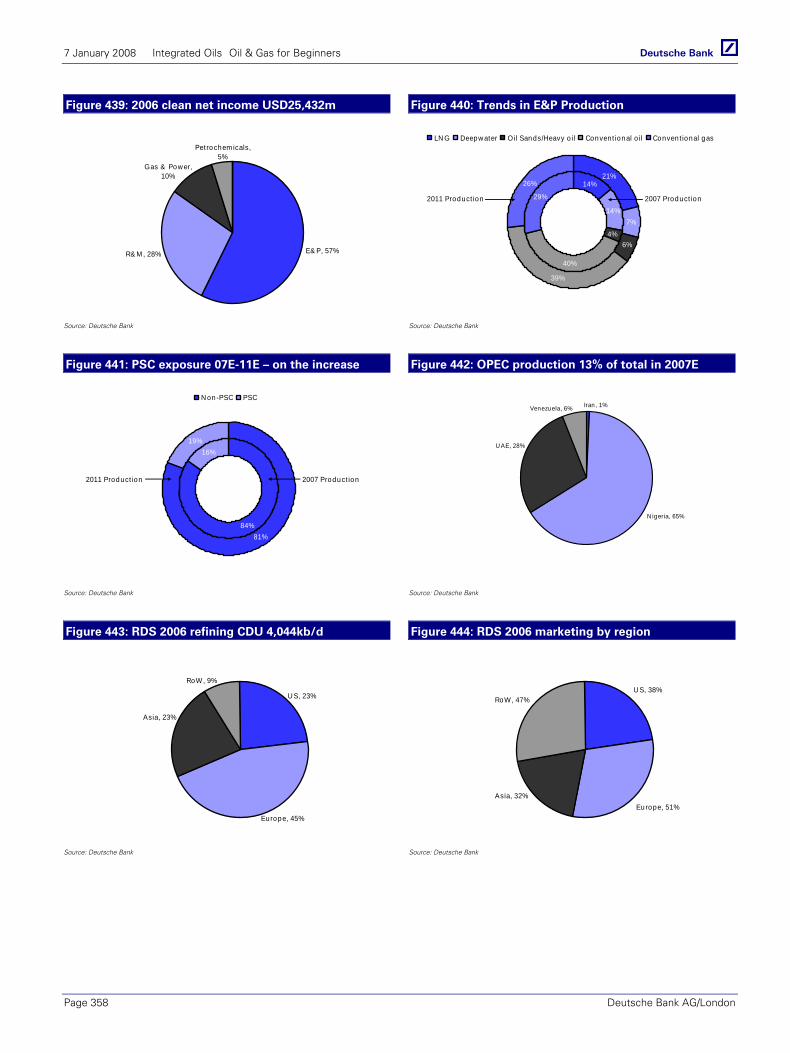
7 January 2008 Integrated Oils Oil & Gas for Beginners
Page 358 Deutsche Bank AG/London
Figure 439: 2006 clean net income USD25,432m Figure 440: Trends in E&P Production
E& P, 57%R& M , 28%
Gas & Pow er, 10%
Petrochem icals, 5%
14%
14%
40%
29%
21%
7%
39%
26%
4%6%
LN G Deepw ater Oil Sands/Heavy o il Convent ional o il Conven t ional gas
2011 Product ion 2007 Product ion
Source: Deutsche Bank Source: Deutsche Bank
Figure 441: PSC exposure 07E-11E – on the increase Figure 442: OPEC production 13% of total in 2007E
84%
16%
81%
19%
N on-PSC PSC
2011 Product ion 2007 Product ion
N igeria, 65%
Venezuela, 6% Iran , 1%
U AE, 28%
Source: Deutsche Bank Source: Deutsche Bank
Figure 443: RDS 2006 refining CDU 4,044kb/d Figure 444: RDS 2006 marketing by region
RoW, 9%
Europe, 45%
U S, 23%
Asia, 23%
U S, 38%
Europe, 51%
RoW, 47%
Asia, 32%
Source: Deutsche Bank Source: Deutsche Bank
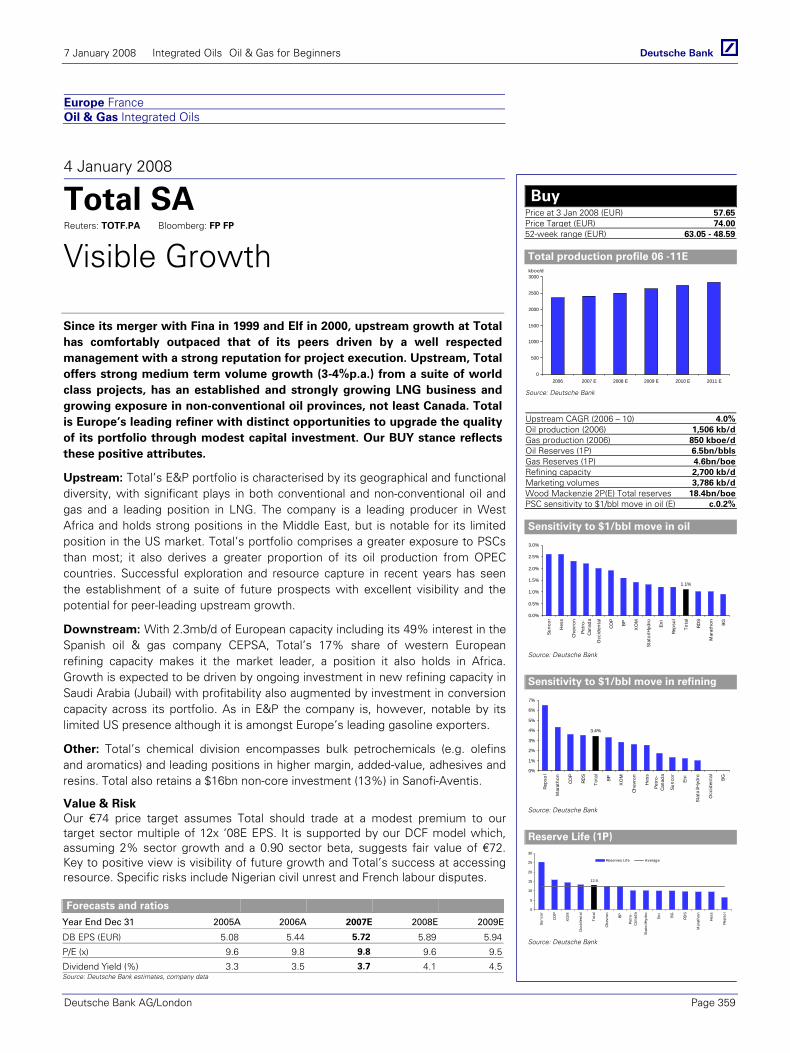
7 January 2008 Integrated Oils Oil & Gas for Beginners
Deutsche Bank AG/London Page 359
Europe France Oil & Gas Integrated Oils
4 January 2008
Total SA Reuters: TOTF.PA Bloomberg: FP FP
Visible Growth
Since its merger with Fina in 1999 and Elf in 2000, upstream growth at Total has comfortably outpaced that of its peers driven by a well respected management with a strong reputation for project execution. Upstream, Total offers strong medium term volume growth (3-4%p.a.) from a suite of world class projects, has an established and strongly growing LNG business and growing exposure in non-conventional oil provinces, not least Canada. Total is Europe’s leading refiner with distinct opportunities to upgrade the quality of its portfolio through modest capital investment. Our BUY stance reflects these positive attributes.
Upstream: Total’s E&P portfolio is characterised by its geographical and functional diversity, with significant plays in both conventional and non-conventional oil and gas and a leading position in LNG. The company is a leading producer in West Africa and holds strong positions in the Middle East, but is notable for its limited position in the US market. Total’s portfolio comprises a greater exposure to PSCs than most; it also derives a greater proportion of its oil production from OPEC countries. Successful exploration and resource capture in recent years has seen the establishment of a suite of future prospects with excellent visibility and the potential for peer-leading upstream growth.
Downstream: With 2.3mb/d of European capacity including its 49% interest in the Spanish oil & gas company CEPSA, Total’s 17% share of western European refining capacity makes it the market leader, a position it also holds in Africa. Growth is expected to be driven by ongoing investment in new refining capacity in Saudi Arabia (Jubail) with profitability also augmented by investment in conversion capacity across its portfolio. As in E&P the company is, however, notable by its limited US presence although it is amongst Europe’s leading gasoline exporters.
Other: Total’s chemical division encompasses bulk petrochemicals (e.g. olefins and aromatics) and leading positions in higher margin, added-value, adhesives and resins. Total also retains a $16bn non-core investment (13%) in Sanofi-Aventis.
Value & Risk Our €74 price target assumes Total should trade at a modest premium to our target sector multiple of 12x ‘08E EPS. It is supported by our DCF model which, assuming 2% sector growth and a 0.90 sector beta, suggests fair value of €72. Key to positive view is visibility of future growth and Total’s success at accessing resource. Specific risks include Nigerian civil unrest and French labour disputes.
Forecasts and ratios
Year End Dec 31 2005A 2006A 2007E 2008E 2009E
DB EPS (EUR) 5.08 5.44 5.72 5.89 5.94
P/E (x) 9.6 9.8 9.8 9.6 9.5
Dividend Yield (%) 3.3 3.5 3.7 4.1 4.5Source: Deutsche Bank estimates, company data
Buy Price at 3 Jan 2008 (EUR) 57.65Price Target (EUR) 74.0052-week range (EUR) 63.05 - 48.59
Total production profile 06 -11E
0
500
1000
1500
2000
2500
3000
2006 2007 E 2008 E 2009 E 2010 E 2011 E
kboe/d
Source: Deutsche Bank
Upstream CAGR (2006 – 10) 4.0%Oil production (2006) 1,506 kb/dGas production (2006) 850 kboe/dOil Reserves (1P) 6.5bn/bblsGas Reserves (1P) 4.6bn/boeRefining capacity 2,700 kb/dMarketing volumes 3,786 kb/dWood Mackenzie 2P(E) Total reserves 18.4bn/boePSC sensitivity to $1/bbl move in oil (E) c.0.2%
Sensitivity to $1/bbl move in oil
1.1%
0.0%
0.5%
1.0%
1.5%
2.0%
2.5%
3.0%Su
ncor
Hes
s
Chev
ron
Petr
o-Ca
nada
Occ
iden
tal
COP
BP
XO
M
Stat
oilH
ydro
Eni
Reps
ol
Tota
l
RDS
Mar
atho
n
BG
Source: Deutsche Bank
Sensitivity to $1/bbl move in refining
3.4%
0%
1%
2%
3%
4%
5%
6%
7%
Reps
ol
Mar
atho
n
COP
RDS
Tota
l
BP
XO
M
Chev
ron
Hes
s
Petr
o-Ca
nada
Sunc
or
Eni
Stat
oilH
ydro
Occ
iden
tal
BG
Source: Deutsche Bank
Reserve Life (1P)
12.9
0
5
10
15
20
25
30
Sunc
or
COP
XO
M
Occ
iden
tal
Tota
l
Chev
ron
BP
Petr
o-Ca
nada
Stat
oilH
ydro
Eni
BG RDS
Mar
atho
n
Hes
s
Reps
ol
Reserves Life Average
Source: Deutsche Bank
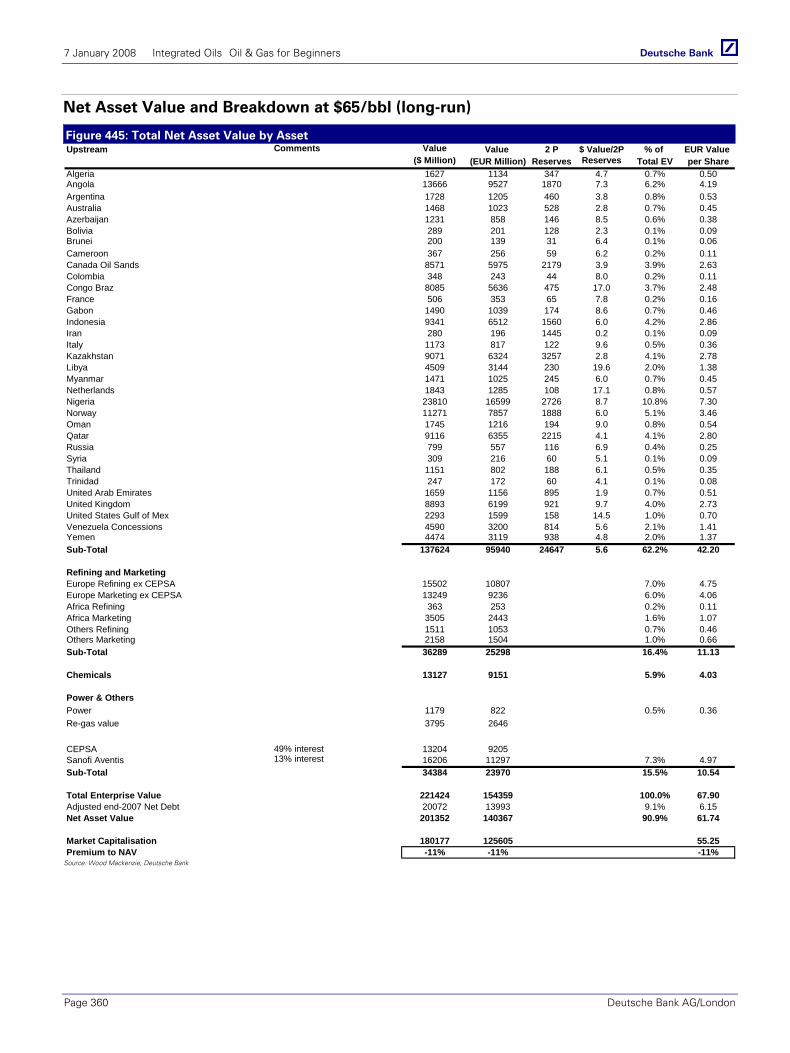
7 January 2008 Integrated Oils Oil & Gas for Beginners
Page 360 Deutsche Bank AG/London
Net Asset Value and Breakdown at $65/bbl (long-run)
Figure 445: Total Net Asset Value by Asset Upstream Comments Value Value 2 P $ Value/2P % of EUR Value
($ Million) (EUR Million) Reserves Reserves Total EV per ShareAlgeria 1627 1134 347 4.7 0.7% 0.50Angola 13666 9527 1870 7.3 6.2% 4.19Argentina 1728 1205 460 3.8 0.8% 0.53Australia 1468 1023 528 2.8 0.7% 0.45Azerbaijan 1231 858 146 8.5 0.6% 0.38Bolivia 289 201 128 2.3 0.1% 0.09Brunei 200 139 31 6.4 0.1% 0.06Cameroon 367 256 59 6.2 0.2% 0.11Canada Oil Sands 8571 5975 2179 3.9 3.9% 2.63Colombia 348 243 44 8.0 0.2% 0.11Congo Braz 8085 5636 475 17.0 3.7% 2.48France 506 353 65 7.8 0.2% 0.16Gabon 1490 1039 174 8.6 0.7% 0.46Indonesia 9341 6512 1560 6.0 4.2% 2.86Iran 280 196 1445 0.2 0.1% 0.09Italy 1173 817 122 9.6 0.5% 0.36Kazakhstan 9071 6324 3257 2.8 4.1% 2.78Libya 4509 3144 230 19.6 2.0% 1.38Myanmar 1471 1025 245 6.0 0.7% 0.45Netherlands 1843 1285 108 17.1 0.8% 0.57Nigeria 23810 16599 2726 8.7 10.8% 7.30Norway 11271 7857 1888 6.0 5.1% 3.46Oman 1745 1216 194 9.0 0.8% 0.54Qatar 9116 6355 2215 4.1 4.1% 2.80Russia 799 557 116 6.9 0.4% 0.25Syria 309 216 60 5.1 0.1% 0.09Thailand 1151 802 188 6.1 0.5% 0.35Trinidad 247 172 60 4.1 0.1% 0.08United Arab Emirates 1659 1156 895 1.9 0.7% 0.51United Kingdom 8893 6199 921 9.7 4.0% 2.73United States Gulf of Mex 2293 1599 158 14.5 1.0% 0.70Venezuela Concessions 4590 3200 814 5.6 2.1% 1.41Yemen 4474 3119 938 4.8 2.0% 1.37Sub-Total 137624 95940 24647 5.6 62.2% 42.20
Refining and MarketingEurope Refining ex CEPSA 15502 10807 7.0% 4.75Europe Marketing ex CEPSA 13249 9236 6.0% 4.06Africa Refining 363 253 0.2% 0.11Africa Marketing 3505 2443 1.6% 1.07Others Refining 1511 1053 0.7% 0.46Others Marketing 2158 1504 1.0% 0.66Sub-Total 36289 25298 16.4% 11.13
Chemicals 13127 9151 5.9% 4.03
Power & OthersPower 1179 822 0.5% 0.36Re-gas value 3795 2646
CEPSA 49% interest 13204 9205Sanofi Aventis 13% interest 16206 11297 7.3% 4.97Sub-Total 34384 23970 15.5% 10.54
Total Enterprise Value 221424 154359 100.0% 67.90Adjusted end-2007 Net Debt 20072 13993 9.1% 6.15Net Asset Value 201352 140367 90.9% 61.74
Market Capitalisation 180177 125605 55.25Premium to NAV -11% -11% -11%
Source: Wood Mackenzie, Deutsche Bank
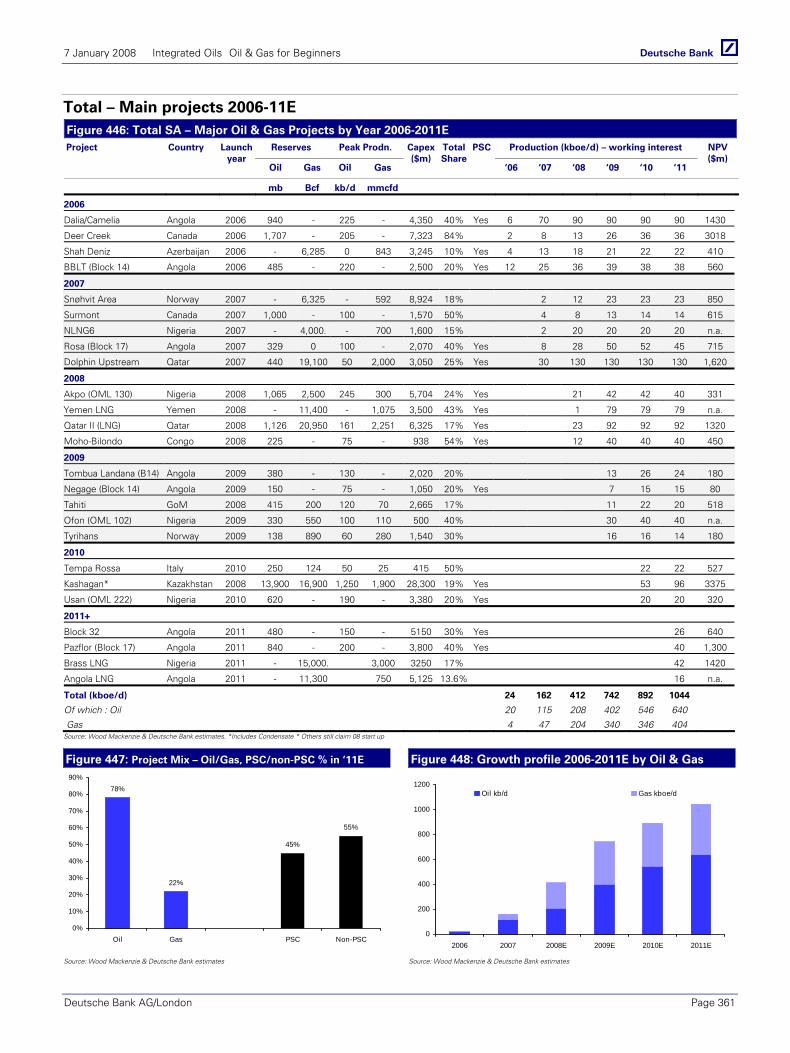
7 January 2008 Integrated Oils Oil & Gas for Beginners
Deutsche Bank AG/London Page 361
Total – Main projects 2006-11E Figure 446: Total SA – Major Oil & Gas Projects by Year 2006-2011E
Reserves Peak Prodn. Production (kboe/d) – working interest Project Country Launch year
Oil Gas Oil Gas
Capex($m)
Total Share
PSC
‘06 ‘07 ‘08 ‘09 ‘10 ‘11
NPV ($m)
mb Bcf kb/d mmcfd
2006
Dalia/Camelia Angola 2006 940 - 225 - 4,350 40% Yes 6 70 90 90 90 90 1430
Deer Creek Canada 2006 1,707 - 205 - 7,323 84% 2 8 13 26 36 36 3018
Shah Deniz Azerbaijan 2006 - 6,285 0 843 3,245 10% Yes 4 13 18 21 22 22 410
BBLT (Block 14) Angola 2006 485 - 220 - 2,500 20% Yes 12 25 36 39 38 38 560
2007
Snøhvit Area Norway 2007 - 6,325 - 592 8,924 18% 2 12 23 23 23 850
Surmont Canada 2007 1,000 - 100 - 1,570 50% 4 8 13 14 14 615
NLNG6 Nigeria 2007 - 4,000. - 700 1,600 15% 2 20 20 20 20 n.a.
Rosa (Block 17) Angola 2007 329 0 100 - 2,070 40% Yes 8 28 50 52 45 715
Dolphin Upstream Qatar 2007 440 19,100 50 2,000 3,050 25% Yes 30 130 130 130 130 1,620
2008
Akpo (OML 130) Nigeria 2008 1,065 2,500 245 300 5,704 24% Yes 21 42 42 40 331
Yemen LNG Yemen 2008 - 11,400 - 1,075 3,500 43% Yes 1 79 79 79 n.a.
Qatar II (LNG) Qatar 2008 1,126 20,950 161 2,251 6,325 17% Yes 23 92 92 92 1320
Moho-Bilondo Congo 2008 225 - 75 - 938 54% Yes 12 40 40 40 450
2009
Tombua Landana (B14) Angola 2009 380 - 130 - 2,020 20% 13 26 24 180
Negage (Block 14) Angola 2009 150 - 75 - 1,050 20% Yes 7 15 15 80
Tahiti GoM 2008 415 200 120 70 2,665 17% 11 22 20 518
Ofon (OML 102) Nigeria 2009 330 550 100 110 500 40% 30 40 40 n.a.
Tyrihans Norway 2009 138 890 60 280 1,540 30% 16 16 14 180
2010
Tempa Rossa Italy 2010 250 124 50 25 415 50% 22 22 527
Kashagan* Kazakhstan 2008 13,900 16,900 1,250 1,900 28,300 19% Yes 53 96 3375
Usan (OML 222) Nigeria 2010 620 - 190 - 3,380 20% Yes 20 20 320
2011+
Block 32 Angola 2011 480 - 150 - 5150 30% Yes 26 640
Pazflor (Block 17) Angola 2011 840 - 200 - 3,800 40% Yes 40 1,300
Brass LNG Nigeria 2011 - 15,000. 3,000 3250 17% 42 1420
Angola LNG Angola 2011 - 11,300 750 5,125 13.6% 16 n.a.
Total (kboe/d) 24 162 412 742 892 1044
Of which : Oil 20 115 208 402 546 640
Gas 4 47 204 340 346 404 Source: Wood Mackenzie & Deutsche Bank estimates. *Includes Condensate * Others still claim 08 start up
Figure 447: Project Mix – Oil/Gas, PSC/non-PSC % in ‘11E Figure 448: Growth profile 2006-2011E by Oil & Gas
78%
22%
45%
55%
0%
10%
20%
30%
40%
50%
60%
70%
80%
90%
Oil Gas PSC Non-PSC
0
200
400
600
800
1000
1200
2006 2007 2008E 2009E 2010E 2011E
Oil kb/d Gas kboe/d
Source: Wood Mackenzie & Deutsche Bank estimates Source: Wood Mackenzie & Deutsche Bank estimates
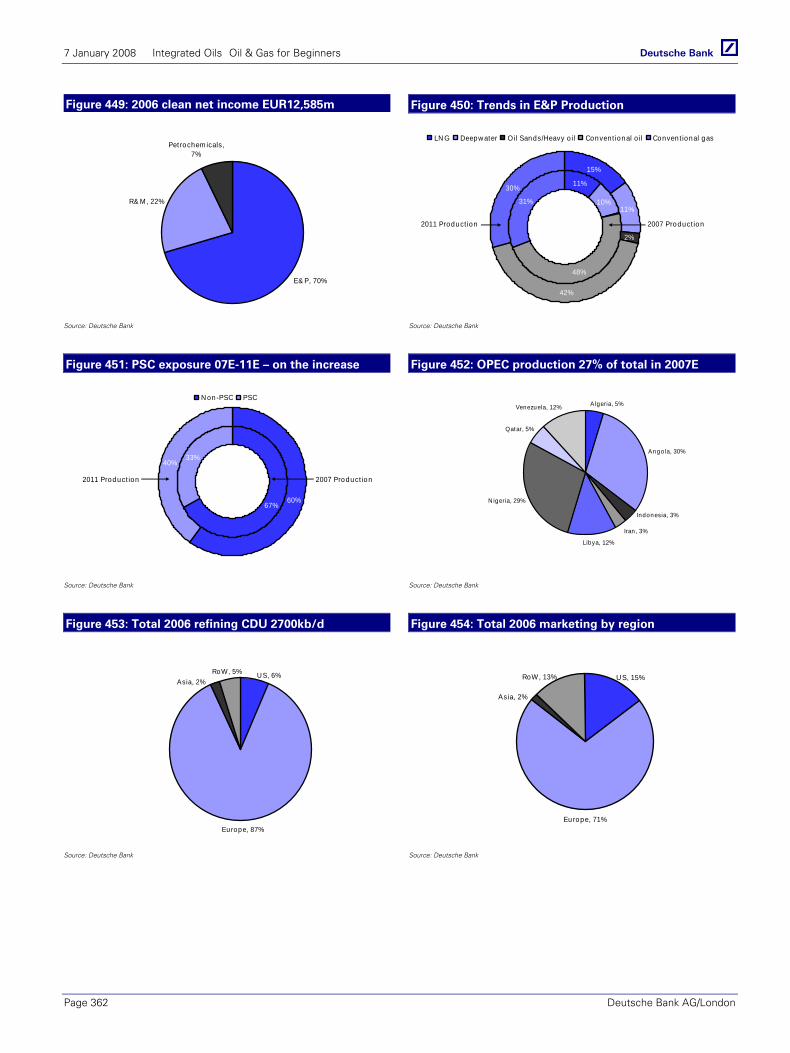
7 January 2008 Integrated Oils Oil & Gas for Beginners
Page 362 Deutsche Bank AG/London
Figure 449: 2006 clean net income EUR12,585m Figure 450: Trends in E&P Production
E& P, 70%
R& M, 22%
Petrochem icals, 7%
11%
10%
48%
31%
15%
11%
42%
30%
2%
LN G Deepw ater Oil Sands/Heavy o il Convent ional o il Conven t ional gas
2011 Product ion 2007 Product ion
Source: Deutsche Bank Source: Deutsche Bank
Figure 451: PSC exposure 07E-11E – on the increase Figure 452: OPEC production 27% of total in 2007E
67%
33%
60%
40%
N on-PSC PSC
2011 Product ion 2007 Product ion
Angola, 30%
Iran , 3%
Libya, 12%
N igeria, 29%
Qatar, 5%
Venezuela, 12% Algeria, 5%
Indonesia, 3%
Source: Deutsche Bank Source: Deutsche Bank
Figure 453: Total 2006 refining CDU 2700kb/d Figure 454: Total 2006 marketing by region
Europe, 87%
U S, 6%RoW, 5%Asia, 2%
Europe, 71%
U S, 15%RoW, 13%
Asia, 2%
Source: Deutsche Bank Source: Deutsche Bank
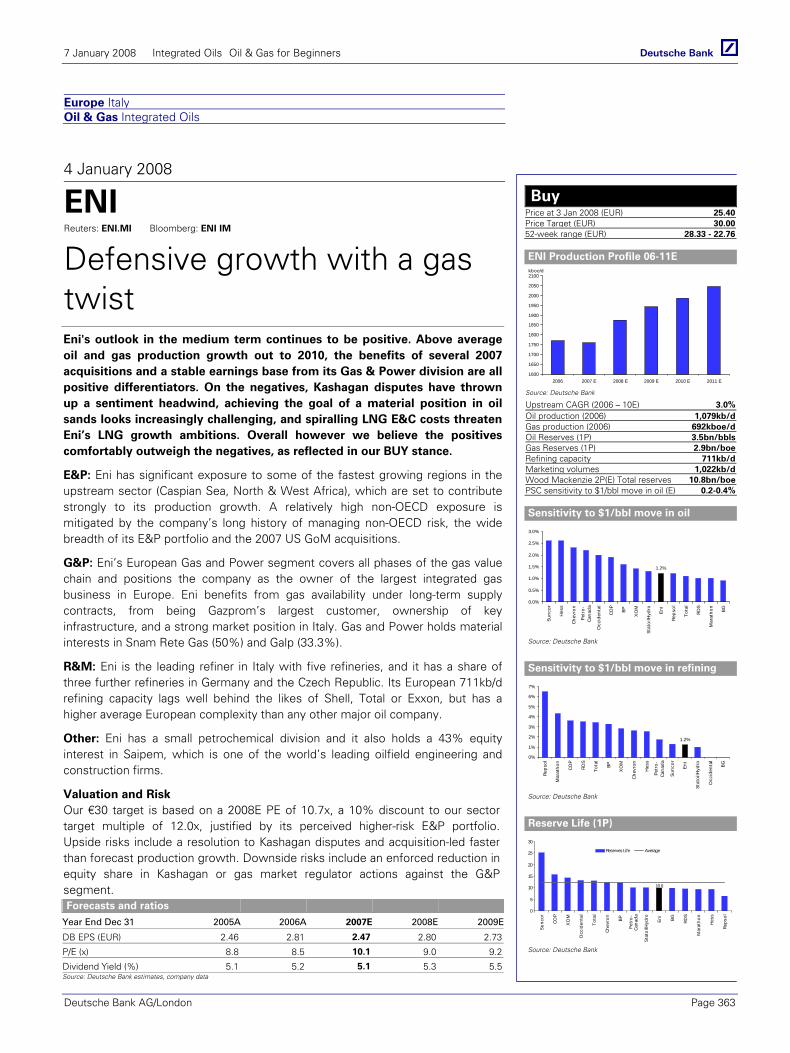
7 January 2008 Integrated Oils Oil & Gas for Beginners
Deutsche Bank AG/London Page 363
Europe Italy Oil & Gas Integrated Oils
4 January 2008
ENI Reuters: ENI.MI Bloomberg: ENI IM
Defensive growth with a gas twist
Eni's outlook in the medium term continues to be positive. Above average oil and gas production growth out to 2010, the benefits of several 2007 acquisitions and a stable earnings base from its Gas & Power division are all positive differentiators. On the negatives, Kashagan disputes have thrown up a sentiment headwind, achieving the goal of a material position in oil sands looks increasingly challenging, and spiralling LNG E&C costs threaten Eni’s LNG growth ambitions. Overall however we believe the positives comfortably outweigh the negatives, as reflected in our BUY stance.
E&P: Eni has significant exposure to some of the fastest growing regions in the upstream sector (Caspian Sea, North & West Africa), which are set to contribute strongly to its production growth. A relatively high non-OECD exposure is mitigated by the company’s long history of managing non-OECD risk, the wide breadth of its E&P portfolio and the 2007 US GoM acquisitions.
G&P: Eni’s European Gas and Power segment covers all phases of the gas value chain and positions the company as the owner of the largest integrated gas business in Europe. Eni benefits from gas availability under long-term supply contracts, from being Gazprom’s largest customer, ownership of key infrastructure, and a strong market position in Italy. Gas and Power holds material interests in Snam Rete Gas (50%) and Galp (33.3%).
R&M: Eni is the leading refiner in Italy with five refineries, and it has a share of three further refineries in Germany and the Czech Republic. Its European 711kb/d refining capacity lags well behind the likes of Shell, Total or Exxon, but has a higher average European complexity than any other major oil company.
Other: Eni has a small petrochemical division and it also holds a 43% equity interest in Saipem, which is one of the world’s leading oilfield engineering and construction firms.
Valuation and Risk Our €30 target is based on a 2008E PE of 10.7x, a 10% discount to our sector target multiple of 12.0x, justified by its perceived higher-risk E&P portfolio. Upside risks include a resolution to Kashagan disputes and acquisition-led faster than forecast production growth. Downside risks include an enforced reduction in equity share in Kashagan or gas market regulator actions against the G&P segment. Forecasts and ratios
Year End Dec 31 2005A 2006A 2007E 2008E 2009E
DB EPS (EUR) 2.46 2.81 2.47 2.80 2.73
P/E (x) 8.8 8.5 10.1 9.0 9.2
Dividend Yield (%) 5.1 5.2 5.1 5.3 5.5Source: Deutsche Bank estimates, company data
Buy Price at 3 Jan 2008 (EUR) 25.40Price Target (EUR) 30.0052-week range (EUR) 28.33 - 22.76
ENI Production Profile 06-11E
1600
1650
1700
1750
1800
1850
1900
1950
2000
2050
2100
2006 2007 E 2008 E 2009 E 2010 E 2011 E
kboe/d
Source: Deutsche Bank
Upstream CAGR (2006 – 10E) 3.0%Oil production (2006) 1,079kb/dGas production (2006) 692kboe/dOil Reserves (1P) 3.5bn/bblsGas Reserves (1P) 2.9bn/boeRefining capacity 711kb/dMarketing volumes 1,022kb/dWood Mackenzie 2P(E) Total reserves 10.8bn/boePSC sensitivity to $1/bbl move in oil (E) 0.2-0.4%
Sensitivity to $1/bbl move in oil
1.2%
0.0%
0.5%
1.0%
1.5%
2.0%
2.5%
3.0%
Sunc
or
Hes
s
Chev
ron
Petr
o-Ca
nada
Occ
iden
tal
COP
BP
XO
M
Stat
oilH
ydro
Eni
Reps
ol
Tota
l
RDS
Mar
atho
n
BG
Source: Deutsche Bank
Sensitivity to $1/bbl move in refining
1.2%
0%
1%
2%
3%
4%
5%
6%
7%
Reps
ol
Mar
atho
n
COP
RDS
Tota
l
BP
XO
M
Chev
ron
Hes
s
Petr
o-Ca
nada
Sunc
or
Eni
Stat
oilH
ydro
Occ
iden
tal
BG
Source: Deutsche Bank
Reserve Life (1P)
10.0
0
5
10
15
20
25
30
Sunc
or
COP
XO
M
Occ
iden
tal
Tota
l
Chev
ron
BP
Petr
o-Ca
nada
Stat
oilH
ydro
Eni
BG RDS
Mar
atho
n
Hes
s
Reps
ol
Reserves Life Average
Source: Deutsche Bank
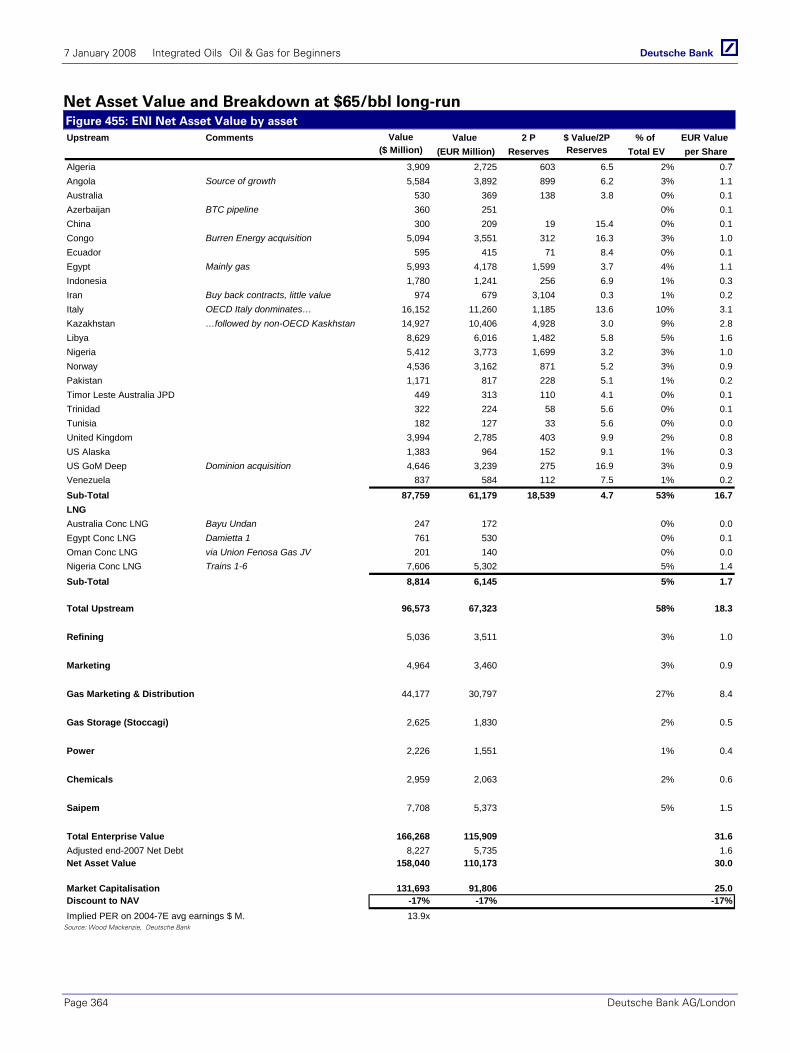
7 January 2008 Integrated Oils Oil & Gas for Beginners
Page 364 Deutsche Bank AG/London
Net Asset Value and Breakdown at $65/bbl long-run Figure 455: ENI Net Asset Value by asset Upstream Comments Value Value 2 P $ Value/2P % of EUR Value
($ Million) (EUR Million) Reserves Reserves Total EV per ShareAlgeria 3,909 2,725 603 6.5 2% 0.7Angola Source of growth 5,584 3,892 899 6.2 3% 1.1Australia 530 369 138 3.8 0% 0.1Azerbaijan BTC pipeline 360 251 0% 0.1China 300 209 19 15.4 0% 0.1Congo Burren Energy acquisition 5,094 3,551 312 16.3 3% 1.0Ecuador 595 415 71 8.4 0% 0.1Egypt Mainly gas 5,993 4,178 1,599 3.7 4% 1.1Indonesia 1,780 1,241 256 6.9 1% 0.3Iran Buy back contracts, little value 974 679 3,104 0.3 1% 0.2Italy OECD Italy donminates… 16,152 11,260 1,185 13.6 10% 3.1Kazakhstan …followed by non-OECD Kaskhstan 14,927 10,406 4,928 3.0 9% 2.8Libya 8,629 6,016 1,482 5.8 5% 1.6Nigeria 5,412 3,773 1,699 3.2 3% 1.0Norway 4,536 3,162 871 5.2 3% 0.9Pakistan 1,171 817 228 5.1 1% 0.2Timor Leste Australia JPD 449 313 110 4.1 0% 0.1Trinidad 322 224 58 5.6 0% 0.1Tunisia 182 127 33 5.6 0% 0.0United Kingdom 3,994 2,785 403 9.9 2% 0.8US Alaska 1,383 964 152 9.1 1% 0.3US GoM Deep Dominion acquisition 4,646 3,239 275 16.9 3% 0.9Venezuela 837 584 112 7.5 1% 0.2Sub-Total 87,759 61,179 18,539 4.7 53% 16.7LNGAustralia Conc LNG Bayu Undan 247 172 0% 0.0Egypt Conc LNG Damietta 1 761 530 0% 0.1Oman Conc LNG via Union Fenosa Gas JV 201 140 0% 0.0Nigeria Conc LNG Trains 1-6 7,606 5,302 5% 1.4Sub-Total 8,814 6,145 5% 1.7
Total Upstream 96,573 67,323 58% 18.3
Refining 5,036 3,511 3% 1.0
Marketing 4,964 3,460 3% 0.9
Gas Marketing & Distribution 44,177 30,797 27% 8.4
Gas Storage (Stoccagi) 2,625 1,830 2% 0.5
Power 2,226 1,551 1% 0.4
Chemicals 2,959 2,063 2% 0.6
Saipem 7,708 5,373 5% 1.5
Total Enterprise Value 166,268 115,909 31.6Adjusted end-2007 Net Debt 8,227 5,735 1.6Net Asset Value 158,040 110,173 30.0
Market Capitalisation 131,693 91,806 25.0Discount to NAV -17% -17% -17%Implied PER on 2004-7E avg earnings $ M. 13.9x
Source: Wood Mackenzie, Deutsche Bank
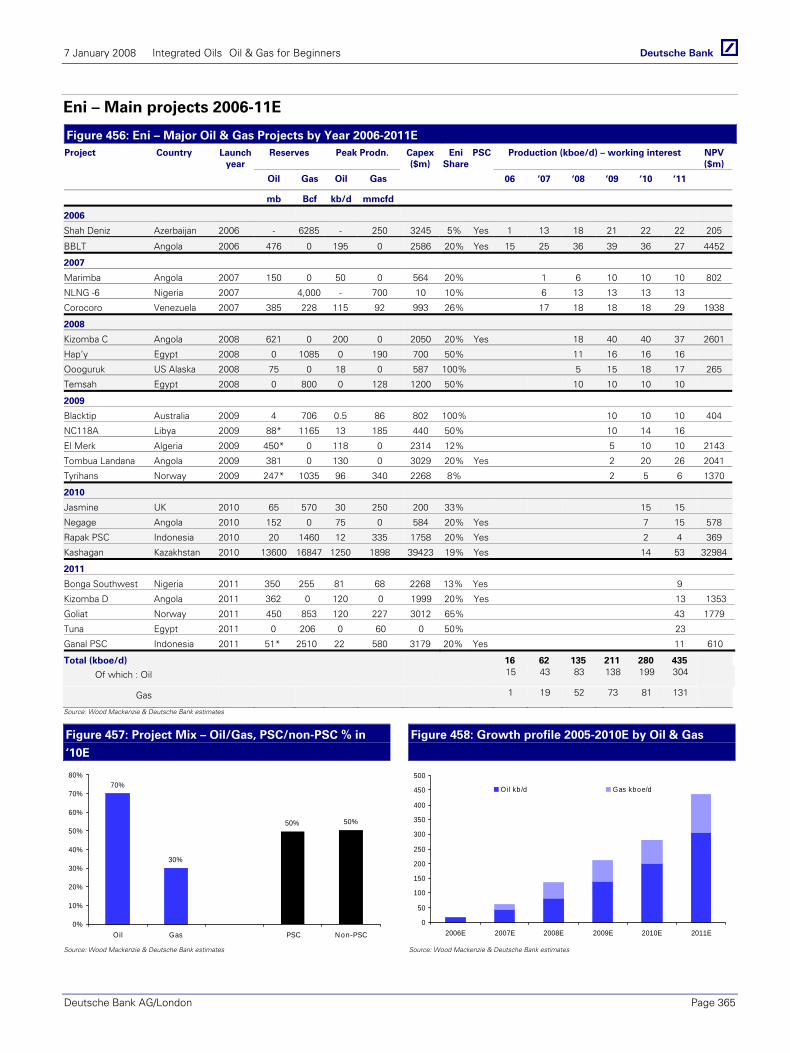
7 January 2008 Integrated Oils Oil & Gas for Beginners
Deutsche Bank AG/London Page 365
Eni – Main projects 2006-11E
Figure 456: Eni – Major Oil & Gas Projects by Year 2006-2011E Reserves Peak Prodn. Production (kboe/d) – working interest NPV
($m) Project Country Launch
year
Oil Gas Oil Gas
Capex($m)
Eni Share
PSC
06 ‘07 ‘08 ‘09 ‘10 ‘11
mb Bcf kb/d mmcfd
2006
Shah Deniz Azerbaijan 2006 - 6285 - 250 3245 5% Yes 1 13 18 21 22 22 205
BBLT Angola 2006 476 0 195 0 2586 20% Yes 15 25 36 39 36 27 4452
2007
Marimba Angola 2007 150 0 50 0 564 20% 1 6 10 10 10 802
NLNG -6 Nigeria 2007 4,000 - 700 10 10% 6 13 13 13 13
Corocoro Venezuela 2007 385 228 115 92 993 26% 17 18 18 18 29 1938
2008
Kizomba C Angola 2008 621 0 200 0 2050 20% Yes 18 40 40 37 2601
Hap’y Egypt 2008 0 1085 0 190 700 50% 11 16 16 16
Oooguruk US Alaska 2008 75 0 18 0 587 100% 5 15 18 17 265
Temsah Egypt 2008 0 800 0 128 1200 50% 10 10 10 10
2009
Blacktip Australia 2009 4 706 0.5 86 802 100% 10 10 10 404
NC118A Libya 2009 88* 1165 13 185 440 50% 10 14 16
El Merk Algeria 2009 450* 0 118 0 2314 12% 5 10 10 2143
Tombua Landana Angola 2009 381 0 130 0 3029 20% Yes 2 20 26 2041
Tyrihans Norway 2009 247* 1035 96 340 2268 8% 2 5 6 1370
2010
Jasmine UK 2010 65 570 30 250 200 33% 15 15
Negage Angola 2010 152 0 75 0 584 20% Yes 7 15 578
Rapak PSC Indonesia 2010 20 1460 12 335 1758 20% Yes 2 4 369
Kashagan Kazakhstan 2010 13600 16847 1250 1898 39423 19% Yes 14 53 32984
2011
Bonga Southwest Nigeria 2011 350 255 81 68 2268 13% Yes 9
Kizomba D Angola 2011 362 0 120 0 1999 20% Yes 13 1353
Goliat Norway 2011 450 853 120 227 3012 65% 43 1779
Tuna Egypt 2011 0 206 0 60 0 50% 23
Ganal PSC Indonesia 2011 51* 2510 22 580 3179 20% Yes 11 610
Total (kboe/d) 16 62 135 211 280 435
Of which : Oil 15 43 83 138 199 304
Gas 1 19 52 73 81 131
Source: Wood Mackenzie & Deutsche Bank estimates
Figure 457: Project Mix – Oil/Gas, PSC/non-PSC % in
‘10E
Figure 458: Growth profile 2005-2010E by Oil & Gas
70%
30%
50% 50%
0%
10%
20%
30%
40%
50%
60%
70%
80%
Oil Gas PSC N on-PSC
0
50
100
150
200
250
300
350
400
450
500
2006E 2007E 2008E 2009E 2010E 2011E
Oil kb/d Gas kboe/d
Source: Wood Mackenzie & Deutsche Bank estimates Source: Wood Mackenzie & Deutsche Bank estimates
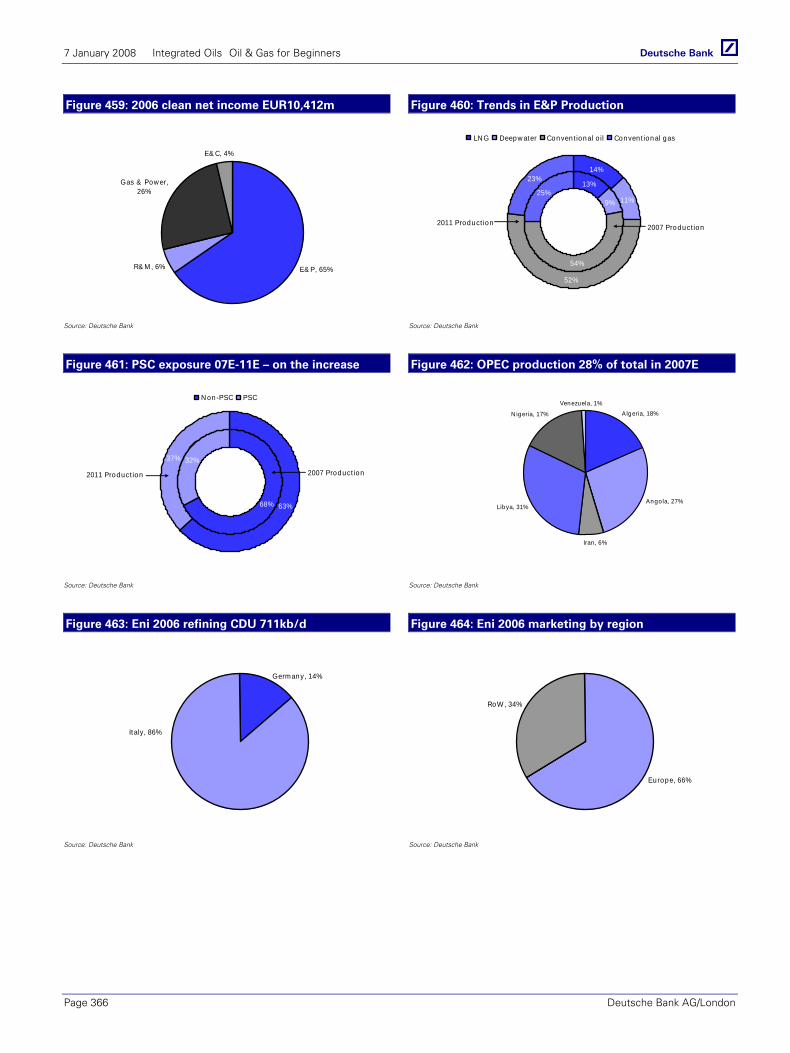
7 January 2008 Integrated Oils Oil & Gas for Beginners
Page 366 Deutsche Bank AG/London
Figure 459: 2006 clean net income EUR10,412m Figure 460: Trends in E&P Production
E& P, 65%R& M , 6%
Gas & Pow er, 26%
E& C, 4%
13%
9%
54%
25%
14%
11%
52%
23%
LN G Deepw ater Convent ional o il Convent ional gas
2011 Product ion 2007 Product ion
Source: Deutsche Bank Source: Deutsche Bank
Figure 461: PSC exposure 07E-11E – on the increase Figure 462: OPEC production 28% of total in 2007E
68%
32%
63%
37%
N on-PSC PSC
2011 Product ion 2007 Product ion
Algeria, 18%
Angola, 27%
Iran, 6%
Libya, 31%
N igeria, 17%
Venezuela, 1%
Source: Deutsche Bank Source: Deutsche Bank
Figure 463: Eni 2006 refining CDU 711kb/d Figure 464: Eni 2006 marketing by region
Germany, 14%
Italy, 86%
Europe, 66%
RoW, 34%
Source: Deutsche Bank Source: Deutsche Bank

7 January 2008 Integrated Oils Oil & Gas for Beginners
Deutsche Bank AG/London Page 367
Europe Spain Oil & Gas Integrated Oils
4 January 2008
Repsol Reuters: REP.MC Bloomberg: REP SQ
Latin America Laggard
With a significant portion of its reserves and production based in Latin America Repsol has an upstream portfolio that is less geographically diversified than its peers. Unfortunately, as a result of the Argentine economic crisis in 2002, Repsol earnings have suffered due to oil and gas price controls and the company’s upstream value has been further eroded by a 2006 downgrade of reserves in both Argentina and Bolivia. Although an MOU has been signed to sell up to 25% of YPF, Argentine risks remain high. A low reserves life, falling production, poor E&P positioning and previous failed strategies all merit a discount rating in our opinion, which is reflected in our SELL rating.
E&P: High Latam exposure implies a higher risk portfolio while a sector low reserves life implies the company must spend more than the peers to reach parity. Its falling production profile only makes the problem more severe. Efforts to diversify its asset base and secure future growth have resulted in the company paying above-the-odds for stakes in the GoM (deepwater) and a botched attempted entry into Algeria LNG. Further potential future growth looks set to come from Libya where Repsol is a leading player and where increased upstream opportunities are emerging. Repsol is also well exposed to the deepwater basin of Brazil holding rights to blocks in the Santos, Campos and Espirito Santo basins.
R&M: Repsol has significant refining capacity (1.2mb/d) in both Spain and Latin America from its interests in a number of refineries. In Europe, Repsol enjoys close proximity to the markets it supplies, thus benefiting from a location premium. Repsol has the highest sensitivity to movements in refining margins, which goes partially offsets its restricted exposure to commodity prices.
Other: Repsol has a presence in both the petrochemicals industry (where it is the market leader in Spain) and in gas and power. It owns 30% of Gas Natural (the Spanish gas utility) and has an LNG JV agreement with Gas Natural.
Valuation & Risks We target the sector to trade at c12.0x and for Repsol to trade at a 20-30% discount to this due not least to its poorly diversified E&P portfolio and poor reserves life. Our valuation is backed up by DCF and SOTP analysis. Upside risks include faster than expected Argentine price liberalisation, a surge of emerging market investments or a resumption of Spanish M&A speculation. Further downside risks include slower Argentine price liberalisation and/or a faster production decline
Forecasts and ratios
Year End Dec 31 2005A 2006A 2007E 2008E 2009E
DB EPS (EUR) 2.89 2.42 2.55 2.73 2.93
P/E (x) 7.8 9.8 9.7 9.0 8.4
Dividend Yield (%) 2.7 3.0 4.0 4.1 4.2Source: Deutsche Bank estimates, company data
Sell Price at 3 Jan 2008 (EUR) 24.87Price Target (EUR) 23.0052-week range (EUR) 30.35 - 23.02
Repsol Production Profile 2006 – 2011E
1000
1020
1040
1060
1080
1100
1120
1140
2006 2007 E 2008 E 2009 E 2010 E 2011 E
kboe/d
Source: Deutsche Bank
Upstream CAGR (2006 – 10E) -2%Oil production (2006) 525kb/dGas production (2006) 603kboe/dOil Reserves (1P) 1.1bn/bblsGas Reserves (1P) 1.6bn/boeRefining capacity 1,234kb/dMarketing volumes 4,445kb/dWood Mackenzie 2P(E) Total reserves 6.0bn/boePSC sensitivity to $1/bbl move in oil (E) c.0.04%
Sensitivity to $1/bbl move in oil
1.2%
0.0%
0.5%
1.0%
1.5%
2.0%
2.5%
3.0%
Sunc
or
Hes
s
Chev
ron
Petr
o-Ca
nada
Occ
iden
tal
COP
BP
XO
M
Stat
oilH
ydro
Eni
Reps
ol
Tota
l
RDS
Mar
atho
n
BG
Source: Deutsche Bank
Sensitivity to $1/bbl move in refining
6.5%
0%
1%
2%
3%
4%
5%
6%
7%
Reps
ol
Mar
atho
n
COP
RDS
Tota
l
BP
XO
M
Chev
ron
Hes
s
Petr
o-Ca
nada
Sunc
or
Eni
Stat
oilH
ydro
Occ
iden
tal
BG
Source: Deutsche Bank
Reserve Life (1P)
6.3
0
5
10
15
20
25
30
Sunc
or
COP
XO
M
Occ
iden
tal
Tota
l
Chev
ron
BP
Petr
o-Ca
nada
Stat
oilH
ydro
Eni
BG RDS
Mar
atho
n
Hes
s
Reps
ol
Reserves Life Average
Source: Deutsche Bank
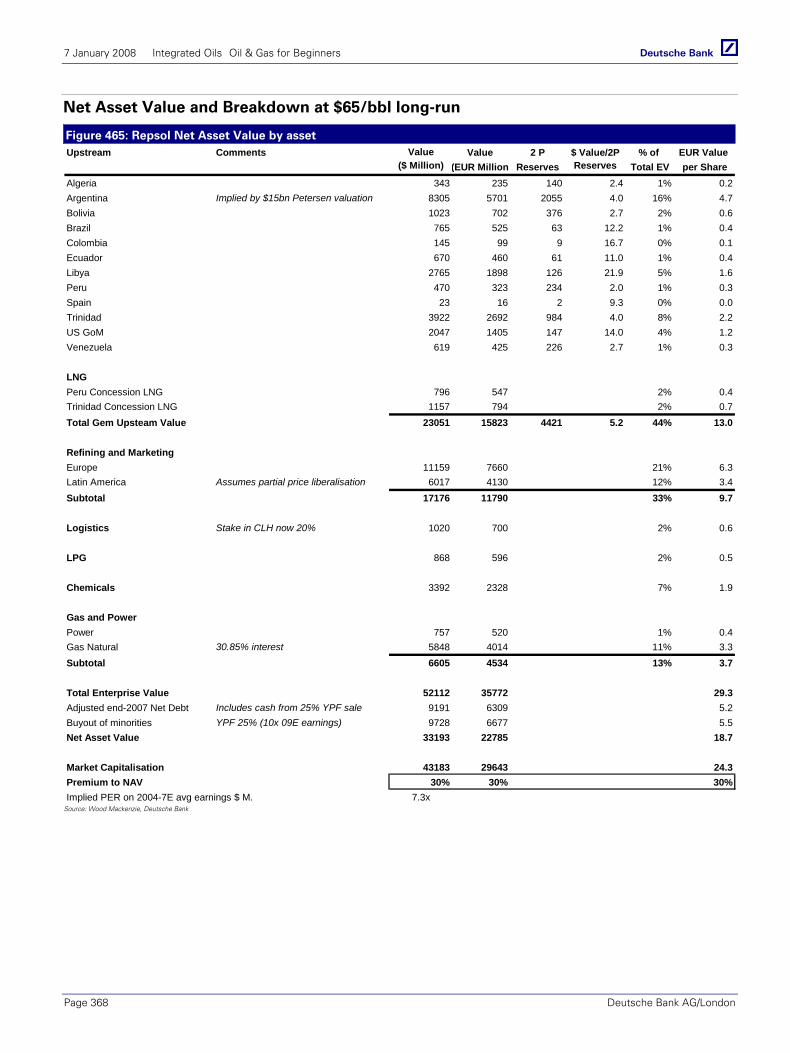
7 January 2008 Integrated Oils Oil & Gas for Beginners
Page 368 Deutsche Bank AG/London
Net Asset Value and Breakdown at $65/bbl long-run
Figure 465: Repsol Net Asset Value by asset Upstream Comments Value Value 2 P $ Value/2P % of EUR Value
($ Million) (EUR Million) Reserves Reserves Total EV per ShareAlgeria 343 235 140 2.4 1% 0.2Argentina Implied by $15bn Petersen valuation 8305 5701 2055 4.0 16% 4.7Bolivia 1023 702 376 2.7 2% 0.6Brazil 765 525 63 12.2 1% 0.4Colombia 145 99 9 16.7 0% 0.1Ecuador 670 460 61 11.0 1% 0.4Libya 2765 1898 126 21.9 5% 1.6Peru 470 323 234 2.0 1% 0.3Spain 23 16 2 9.3 0% 0.0Trinidad 3922 2692 984 4.0 8% 2.2US GoM 2047 1405 147 14.0 4% 1.2Venezuela 619 425 226 2.7 1% 0.3
LNGPeru Concession LNG 796 547 2% 0.4Trinidad Concession LNG 1157 794 2% 0.7Total Gem Upsteam Value 23051 15823 4421 5.2 44% 13.0
Refining and MarketingEurope 11159 7660 21% 6.3Latin America Assumes partial price liberalisation 6017 4130 12% 3.4Subtotal 17176 11790 33% 9.7
Logistics Stake in CLH now 20% 1020 700 2% 0.6
LPG 868 596 2% 0.5
Chemicals 3392 2328 7% 1.9
Gas and PowerPower 757 520 1% 0.4Gas Natural 30.85% interest 5848 4014 11% 3.3Subtotal 6605 4534 13% 3.7
Total Enterprise Value 52112 35772 29.3Adjusted end-2007 Net Debt Includes cash from 25% YPF sale 9191 6309 5.2Buyout of minorities YPF 25% (10x 09E earnings) 9728 6677 5.5Net Asset Value 33193 22785 18.7
Market Capitalisation 43183 29643 24.3Premium to NAV 30% 30% 30%Implied PER on 2004-7E avg earnings $ M. 7.3x
Source: Wood Mackenzie, Deutsche Bank
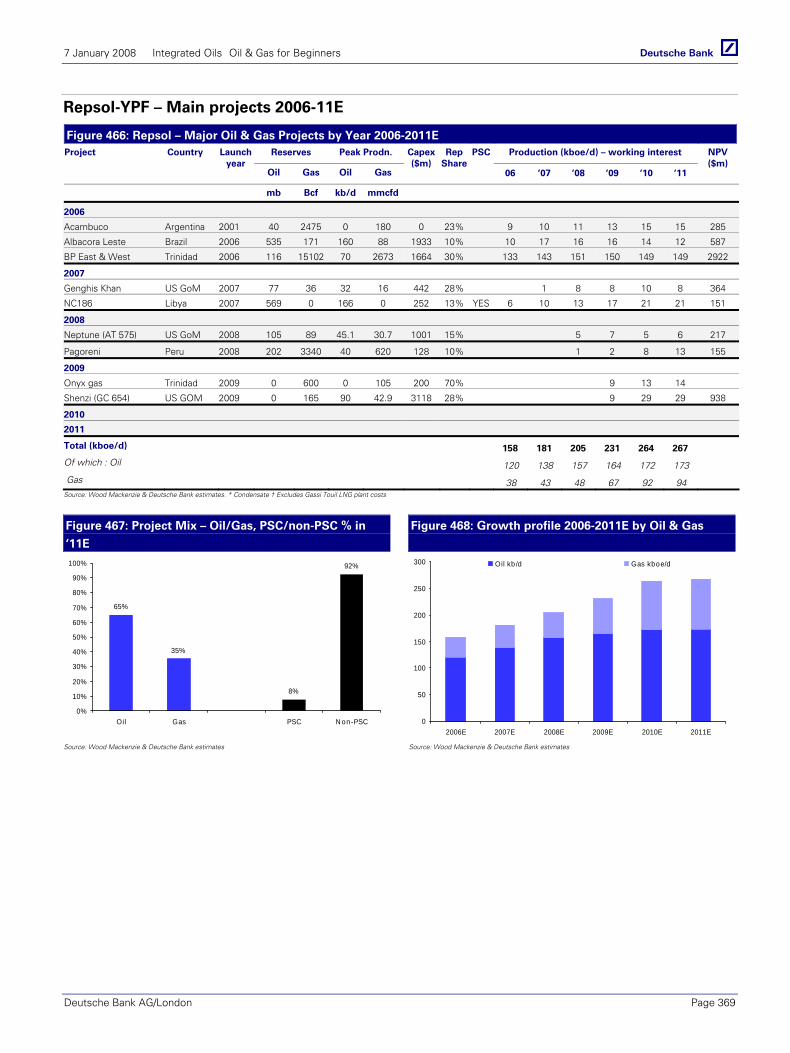
7 January 2008 Integrated Oils Oil & Gas for Beginners
Deutsche Bank AG/London Page 369
Repsol-YPF – Main projects 2006-11E
Figure 466: Repsol – Major Oil & Gas Projects by Year 2006-2011E Reserves Peak Prodn. Production (kboe/d) – working interest Project Country Launch
year Oil Gas Oil Gas
Capex($m)
Rep Share
PSC
06 ‘07 ‘08 ‘09 ‘10 ‘11
NPV ($m)
mb Bcf kb/d mmcfd
2006
Acambuco Argentina 2001 40 2475 0 180 0 23% 9 10 11 13 15 15 285
Albacora Leste Brazil 2006 535 171 160 88 1933 10% 10 17 16 16 14 12 587
BP East & West Trinidad 2006 116 15102 70 2673 1664 30% 133 143 151 150 149 149 2922
2007
Genghis Khan US GoM 2007 77 36 32 16 442 28% 1 8 8 10 8 364
NC186 Libya 2007 569 0 166 0 252 13% YES 6 10 13 17 21 21 151
2008
Neptune (AT 575) US GoM 2008 105 89 45.1 30.7 1001 15% 5 7 5 6 217
Pagoreni Peru 2008 202 3340 40 620 128 10% 1 2 8 13 155
2009
Onyx gas Trinidad 2009 0 600 0 105 200 70% 9 13 14
Shenzi (GC 654) US GOM 2009 0 165 90 42.9 3118 28% 9 29 29 938
2010
2011
Total (kboe/d) 158 181 205 231 264 267
Of which : Oil 120 138 157 164 172 173
Gas 38 43 48 67 92 94 Source: Wood Mackenzie & Deutsche Bank estimates. * Condensate † Excludes Gassi Touil LNG plant costs
Figure 467: Project Mix – Oil/Gas, PSC/non-PSC % in
‘11E
Figure 468: Growth profile 2006-2011E by Oil & Gas
65%
35%
8%
92%
0%
10%
20%
30%
40%
50%
60%
70%
80%
90%
100%
Oil Gas PSC N on-PSC
0
50
100
150
200
250
300
2006E 2007E 2008E 2009E 2010E 2011E
Oil kb /d Gas kboe/d
Source: Wood Mackenzie & Deutsche Bank estimates Source: Wood Mackenzie & Deutsche Bank estimates
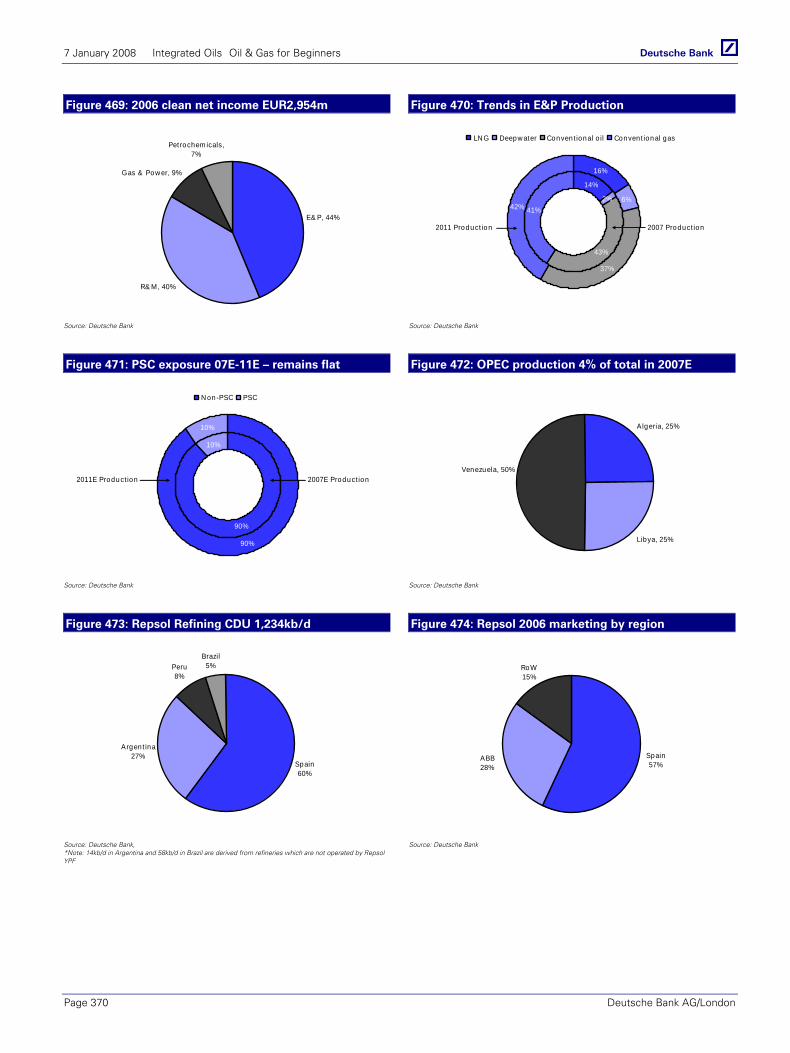
7 January 2008 Integrated Oils Oil & Gas for Beginners
Page 370 Deutsche Bank AG/London
Figure 469: 2006 clean net income EUR2,954m Figure 470: Trends in E&P Production
E& P, 44%
R& M, 40%
Gas & Pow er, 9%
Petrochem icals, 7%
14%
2%
43%
41%
16%
6%
37%
42%
LN G Deepw ater Convent ional o il Convent ional gas
2011 Product ion 2007 Product ion
Source: Deutsche Bank Source: Deutsche Bank
Figure 471: PSC exposure 07E-11E – remains flat Figure 472: OPEC production 4% of total in 2007E
90%
10%
90%
10%
N on-PSC PSC
2011E Product ion 2007E Product ion
Algeria, 25%
Libya, 25%
Venezuela, 50%
Source: Deutsche Bank Source: Deutsche Bank
Figure 473: Repsol Refining CDU 1,234kb/d Figure 474: Repsol 2006 marketing by region
Spain60%
Argent ina27%
Peru8%
Brazil5%
RoW15%
Spain57%
ABB28%
Source: Deutsche Bank, *Note: 14kb/d in Argentina and 58kb/d in Brazil are derived from refineries which are not operated by Repsol YPF
Source: Deutsche Bank
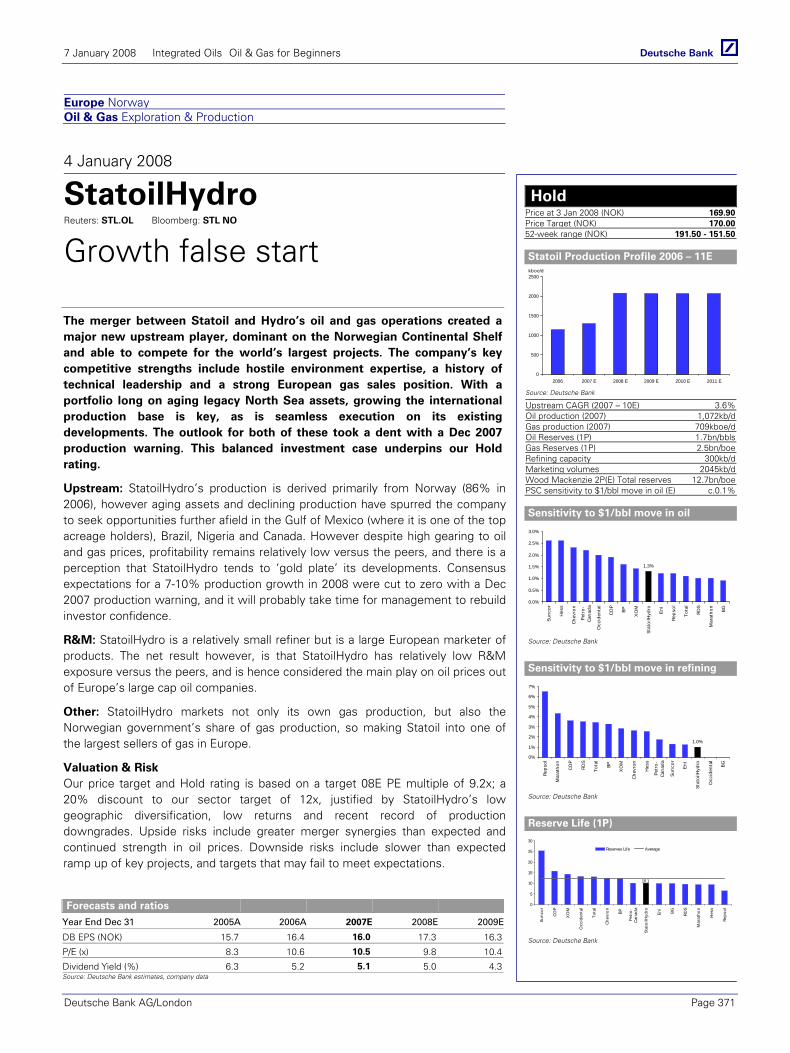
7 January 2008 Integrated Oils Oil & Gas for Beginners
Deutsche Bank AG/London Page 371
Europe Norway Oil & Gas Exploration & Production
4 January 2008
StatoilHydro Reuters: STL.OL Bloomberg: STL NO
Growth false start
The merger between Statoil and Hydro’s oil and gas operations created a major new upstream player, dominant on the Norwegian Continental Shelf and able to compete for the world’s largest projects. The company’s key competitive strengths include hostile environment expertise, a history of technical leadership and a strong European gas sales position. With a portfolio long on aging legacy North Sea assets, growing the international production base is key, as is seamless execution on its existing developments. The outlook for both of these took a dent with a Dec 2007 production warning. This balanced investment case underpins our Hold rating.
Upstream: StatoilHydro’s production is derived primarily from Norway (86% in 2006), however aging assets and declining production have spurred the company to seek opportunities further afield in the Gulf of Mexico (where it is one of the top acreage holders), Brazil, Nigeria and Canada. However despite high gearing to oil and gas prices, profitability remains relatively low versus the peers, and there is a perception that StatoilHydro tends to ‘gold plate’ its developments. Consensus expectations for a 7-10% production growth in 2008 were cut to zero with a Dec 2007 production warning, and it will probably take time for management to rebuild investor confidence.
R&M: StatoilHydro is a relatively small refiner but is a large European marketer of products. The net result however, is that StatoilHydro has relatively low R&M exposure versus the peers, and is hence considered the main play on oil prices out of Europe’s large cap oil companies.
Other: StatoilHydro markets not only its own gas production, but also the Norwegian government’s share of gas production, so making Statoil into one of the largest sellers of gas in Europe.
Valuation & Risk Our price target and Hold rating is based on a target 08E PE multiple of 9.2x; a 20% discount to our sector target of 12x, justified by StatoilHydro’s low geographic diversification, low returns and recent record of production downgrades. Upside risks include greater merger synergies than expected and continued strength in oil prices. Downside risks include slower than expected ramp up of key projects, and targets that may fail to meet expectations.
Forecasts and ratios
Year End Dec 31 2005A 2006A 2007E 2008E 2009E
DB EPS (NOK) 15.7 16.4 16.0 17.3 16.3
P/E (x) 8.3 10.6 10.5 9.8 10.4
Dividend Yield (%) 6.3 5.2 5.1 5.0 4.3Source: Deutsche Bank estimates, company data
Hold Price at 3 Jan 2008 (NOK) 169.90Price Target (NOK) 170.0052-week range (NOK) 191.50 - 151.50
Statoil Production Profile 2006 – 11E
0
500
1000
1500
2000
2500
2006 2007 E 2008 E 2009 E 2010 E 2011 E
kboe/d
Source: Deutsche Bank
Upstream CAGR (2007 – 10E) 3.6%Oil production (2007) 1,072kb/dGas production (2007) 709kboe/dOil Reserves (1P) 1.7bn/bblsGas Reserves (1P) 2.5bn/boeRefining capacity 300kb/dMarketing volumes 2045kb/dWood Mackenzie 2P(E) Total reserves 12.7bn/boePSC sensitivity to $1/bbl move in oil (E) c.0.1%
Sensitivity to $1/bbl move in oil
1.3%
0.0%
0.5%
1.0%
1.5%
2.0%
2.5%
3.0%
Sunc
or
Hes
s
Chev
ron
Petr
o-Ca
nada
Occ
iden
tal
COP
BP
XO
M
Stat
oilH
ydro
Eni
Reps
ol
Tota
l
RDS
Mar
atho
n
BG
Source: Deutsche Bank
Sensitivity to $1/bbl move in refining
1.0%
0%
1%
2%
3%
4%
5%
6%
7%
Reps
ol
Mar
atho
n
COP
RDS
Tota
l
BP
XO
M
Chev
ron
Hes
s
Petr
o-Ca
nada
Sunc
or
Eni
Stat
oilH
ydro
Occ
iden
tal
BG
Source: Deutsche Bank
Reserve Life (1P)
10.1
0
5
10
15
20
25
30
Sunc
or
COP
XO
M
Occ
iden
tal
Tota
l
Chev
ron
BP
Petr
o-Ca
nada
Stat
oilH
ydro
Eni
BG RDS
Mar
atho
n
Hes
s
Reps
ol
Reserves Life Average
Source: Deutsche Bank

7 January 2008 Integrated Oils Oil & Gas for Beginners
Page 372 Deutsche Bank AG/London
Net Asset Value and Breakdown at $65/bbl long-run
Figure 475: StatoilHydro Net Asset Value by asset Upstream Comments Value Value 2 P $ Value/2P % of NOK Value
($ Million) (NOK Million) Reserves Reserves Total EV per ShareAlgeria 2061 11186 991 2.1 2% 3.5Angola 8520 46246 1289 6.6 9% 14.5Azerbaijan 5994 32538 787 7.6 6% 10.2Brazil Conc 930 5050 175 5.3 1% 1.6Canada 6943 37690 2342 3.0 7% 11.8China -23 -123 2 0% 0.0Iran 325 1765 598 0.5 0% 0.6Ireland 822 4464 55 15.0 1% 1.4Libya 827 4490 71 11.7 1% 1.4Nigeria High value bbls 2990 16227 170 17.6 3% 5.1Norway NPV/bbl suppressed by tax and costs 40537 220037 8216 4.9 41% 69.1Russia 639 3471 92 6.9 1% 1.1UK 1201 6520 133 9.0 1% 2.0US GoM 5094 27653 493 10.3 5% 8.7Venezuela 1465 7953 191 7.7 1% 2.5
Subtotal 78328 425166 15605 5.0 79% 133.5
LNGNorway Conc LNG 3391 18408 437 3% 5.8Total Upstream Value 81719 443575 16041 5.1 82% 139.2
Refining and MarketingRefining 1939 10527 2% 3.3Marketing 7327 39772 7% 12.5
Subtotal 9266 50299 9% 15.8
Natural Gas Marketing 8622 46800 9% 14.7
Total Enterprise Value 99607 540674 169.7Adjusted end-2007 Net Debt 9804 53218 16.7Buyout of minorities 1429 7755 2.4Net Asset Value 88374 479701 150.6
Market Capitalisation 99183 538371 169.0Premium to NAV 12% 12% 12%Implied PER on 2004-7E avg earnings $ M. 14.9x
Source: Wood Mackenzie, Deutsche Bank
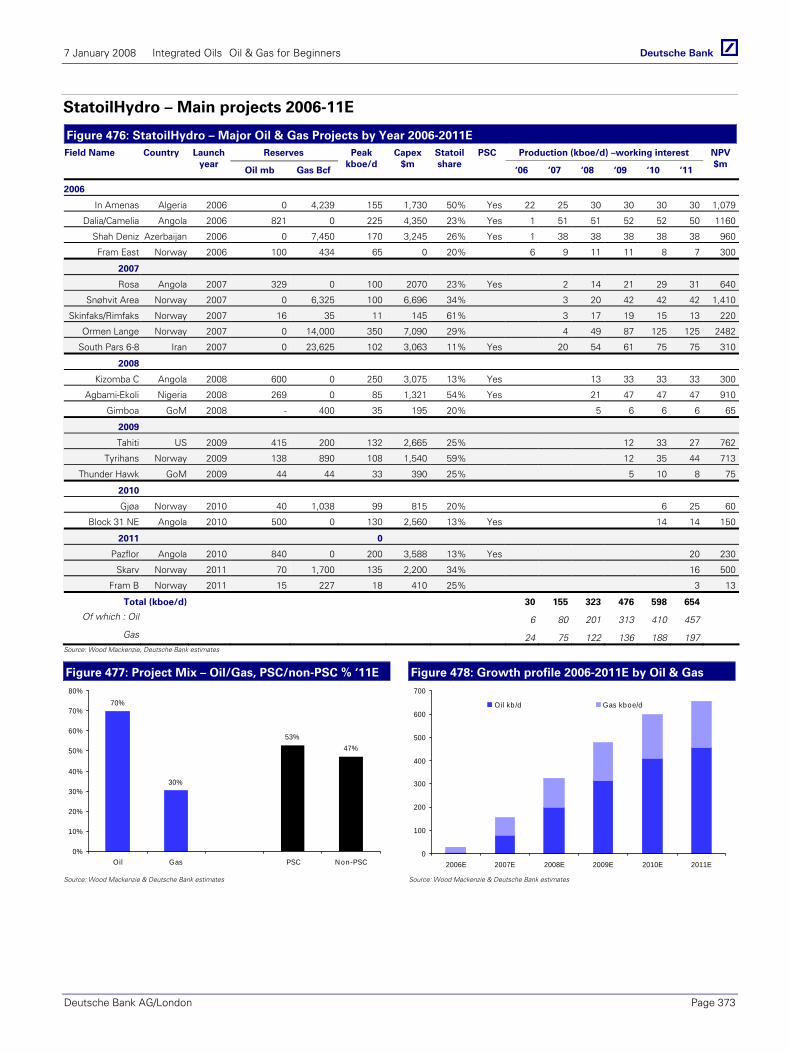
7 January 2008 Integrated Oils Oil & Gas for Beginners
Deutsche Bank AG/London Page 373
StatoilHydro – Main projects 2006-11E
Figure 476: StatoilHydro – Major Oil & Gas Projects by Year 2006-2011E Reserves Production (kboe/d) –working interest Field Name Country Launch
year Oil mb Gas Bcf
Peak kboe/d
Capex$m
Statoil share
PSC
‘06 ‘07 ‘08 ‘09 ‘10 ‘11
NPV$m
2006
In Amenas Algeria 2006 0 4,239 155 1,730 50% Yes 22 25 30 30 30 30 1,079
Dalia/Camelia Angola 2006 821 0 225 4,350 23% Yes 1 51 51 52 52 50 1160
Shah Deniz Azerbaijan 2006 0 7,450 170 3,245 26% Yes 1 38 38 38 38 38 960
Fram East Norway 2006 100 434 65 0 20% 6 9 11 11 8 7 300
2007
Rosa Angola 2007 329 0 100 2070 23% Yes 2 14 21 29 31 640
Snøhvit Area Norway 2007 0 6,325 100 6,696 34% 3 20 42 42 42 1,410
Skinfaks/Rimfaks Norway 2007 16 35 11 145 61% 3 17 19 15 13 220
Ormen Lange Norway 2007 0 14,000 350 7,090 29% 4 49 87 125 125 2482
South Pars 6-8 Iran 2007 0 23,625 102 3,063 11% Yes 20 54 61 75 75 310
2008
Kizomba C Angola 2008 600 0 250 3,075 13% Yes 13 33 33 33 300
Agbami-Ekoli Nigeria 2008 269 0 85 1,321 54% Yes 21 47 47 47 910
Gimboa GoM 2008 - 400 35 195 20% 5 6 6 6 65
2009
Tahiti US 2009 415 200 132 2,665 25% 12 33 27 762
Tyrihans Norway 2009 138 890 108 1,540 59% 12 35 44 713
Thunder Hawk GoM 2009 44 44 33 390 25% 5 10 8 75
2010
Gjøa Norway 2010 40 1,038 99 815 20% 6 25 60
Block 31 NE Angola 2010 500 0 130 2,560 13% Yes 14 14 150
2011 0
Pazflor Angola 2010 840 0 200 3,588 13% Yes 20 230
Skarv Norway 2011 70 1,700 135 2,200 34% 16 500
Fram B Norway 2011 15 227 18 410 25% 3 13
Total (kboe/d) 30 155 323 476 598 654
Of which : Oil 6 80 201 313 410 457
Gas 24 75 122 136 188 197
Source: Wood Mackenzie, Deutsche Bank estimates
Figure 477: Project Mix – Oil/Gas, PSC/non-PSC % ‘11E Figure 478: Growth profile 2006-2011E by Oil & Gas
70%
30%
53%47%
0%
10%
20%
30%
40%
50%
60%
70%
80%
Oil Gas PSC N on-PSC
0
100
200
300
400
500
600
700
2006E 2007E 2008E 2009E 2010E 2011E
Oil kb /d Gas kboe/d
Source: Wood Mackenzie & Deutsche Bank estimates Source: Wood Mackenzie & Deutsche Bank estimates
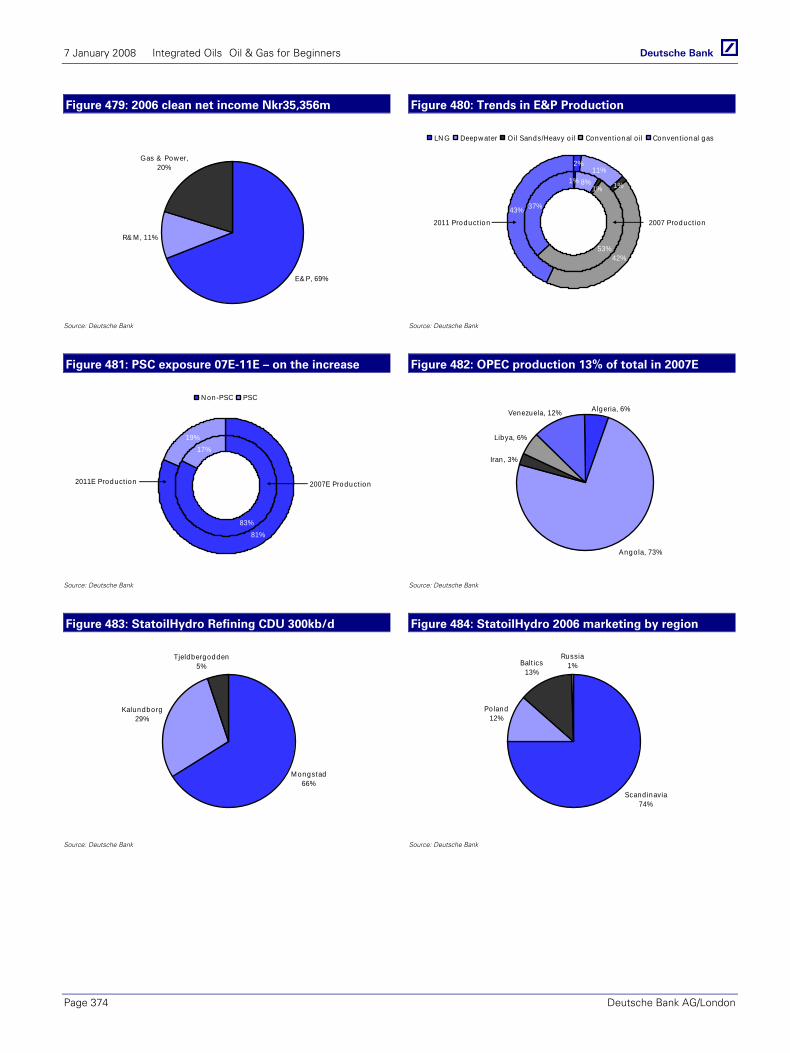
7 January 2008 Integrated Oils Oil & Gas for Beginners
Page 374 Deutsche Bank AG/London
Figure 479: 2006 clean net income Nkr35,356m Figure 480: Trends in E&P Production
E& P, 69%
R& M , 11%
Gas & Pow er, 20%
1%
53%
37%
11%
42%
43%
8%1%
2%
1%
LN G Deepw ater Oil Sands/Heavy o il Convent ional o il Conven t ional gas
2011 Product ion 2007 Product ion
Source: Deutsche Bank Source: Deutsche Bank
Figure 481: PSC exposure 07E-11E – on the increase Figure 482: OPEC production 13% of total in 2007E
83%
17%
81%
19%
N on-PSC PSC
2011E Product ion 2007E Product ion
Angola, 73%
Libya, 6%
Algeria, 6%Venezuela, 12%
Iran , 3%
Source: Deutsche Bank Source: Deutsche Bank
Figure 483: StatoilHydro Refining CDU 300kb/d Figure 484: StatoilHydro 2006 marketing by region
M ongstad66%
Kalundborg29%
Tjeldbergodden5%
Scand inavia74%
Poland12%
Balt ics13%
Russia1%
Source: Deutsche Bank Source: Deutsche Bank
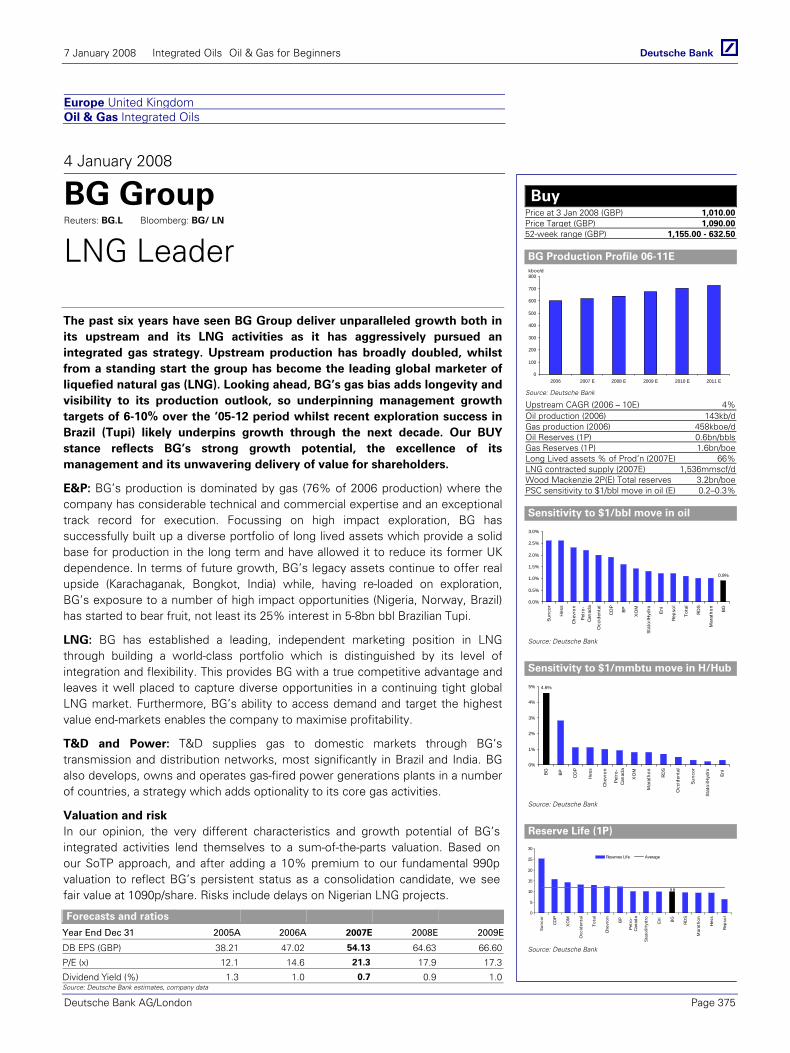
7 January 2008 Integrated Oils Oil & Gas for Beginners
Deutsche Bank AG/London Page 375
Europe United Kingdom Oil & Gas Integrated Oils
4 January 2008
BG Group Reuters: BG.L Bloomberg: BG/ LN
LNG Leader
The past six years have seen BG Group deliver unparalleled growth both in its upstream and its LNG activities as it has aggressively pursued an integrated gas strategy. Upstream production has broadly doubled, whilst from a standing start the group has become the leading global marketer of liquefied natural gas (LNG). Looking ahead, BG’s gas bias adds longevity and visibility to its production outlook, so underpinning management growth targets of 6-10% over the ’05-12 period whilst recent exploration success in Brazil (Tupi) likely underpins growth through the next decade. Our BUY stance reflects BG’s strong growth potential, the excellence of its management and its unwavering delivery of value for shareholders.
E&P: BG’s production is dominated by gas (76% of 2006 production) where the company has considerable technical and commercial expertise and an exceptional track record for execution. Focussing on high impact exploration, BG has successfully built up a diverse portfolio of long lived assets which provide a solid base for production in the long term and have allowed it to reduce its former UK dependence. In terms of future growth, BG’s legacy assets continue to offer real upside (Karachaganak, Bongkot, India) while, having re-loaded on exploration, BG’s exposure to a number of high impact opportunities (Nigeria, Norway, Brazil) has started to bear fruit, not least its 25% interest in 5-8bn bbl Brazilian Tupi.
LNG: BG has established a leading, independent marketing position in LNG through building a world-class portfolio which is distinguished by its level of integration and flexibility. This provides BG with a true competitive advantage and leaves it well placed to capture diverse opportunities in a continuing tight global LNG market. Furthermore, BG’s ability to access demand and target the highest value end-markets enables the company to maximise profitability.
T&D and Power: T&D supplies gas to domestic markets through BG’s transmission and distribution networks, most significantly in Brazil and India. BG also develops, owns and operates gas-fired power generations plants in a number of countries, a strategy which adds optionality to its core gas activities.
Valuation and risk In our opinion, the very different characteristics and growth potential of BG’s integrated activities lend themselves to a sum-of-the-parts valuation. Based on our SoTP approach, and after adding a 10% premium to our fundamental 990p valuation to reflect BG’s persistent status as a consolidation candidate, we see fair value at 1090p/share. Risks include delays on Nigerian LNG projects.
Forecasts and ratios
Year End Dec 31 2005A 2006A 2007E 2008E 2009E
DB EPS (GBP) 38.21 47.02 54.13 64.63 66.60
P/E (x) 12.1 14.6 21.3 17.9 17.3
Dividend Yield (%) 1.3 1.0 0.7 0.9 1.0Source: Deutsche Bank estimates, company data
Buy Price at 3 Jan 2008 (GBP) 1,010.00Price Target (GBP) 1,090.0052-week range (GBP) 1,155.00 - 632.50
BG Production Profile 06-11E
0
100
200
300
400
500
600
700
800
2006 2007 E 2008 E 2009 E 2010 E 2011 E
kboe/d
Source: Deutsche Bank
Upstream CAGR (2006 – 10E) 4%Oil production (2006) 143kb/dGas production (2006) 458kboe/dOil Reserves (1P) 0.6bn/bblsGas Reserves (1P) 1.6bn/boeLong Lived assets % of Prod’n (2007E) 66%LNG contracted supply (2007E) 1,536mmscf/dWood Mackenzie 2P(E) Total reserves 3.2bn/boePSC sensitivity to $1/bbl move in oil (E) 0.2–0.3%
Sensitivity to $1/bbl move in oil
0.9%
0.0%
0.5%
1.0%
1.5%
2.0%
2.5%
3.0%
Sunc
or
Hes
s
Chev
ron
Petr
o-Ca
nada
Occ
iden
tal
COP
BP
XO
M
Stat
oilH
ydro
Eni
Reps
ol
Tota
l
RDS
Mar
atho
n
BG
Source: Deutsche Bank
Sensitivity to $1/mmbtu move in H/Hub
4.6%
0%
1%
2%
3%
4%
5%
BG BP
COP
Hes
s
Chev
ron
Petr
o-Ca
nada
XO
M
Mar
atho
n
RDS
Occ
iden
tal
Sunc
or
Stat
oilH
ydro
Eni
Source: Deutsche Bank
Reserve Life (1P)
9.8
0
5
10
15
20
25
30
Sunc
or
COP
XO
M
Occ
iden
tal
Tota
l
Chev
ron
BP
Petr
o-Ca
nada
Stat
oilH
ydro
Eni
BG RDS
Mar
atho
n
Hes
s
Reps
ol
Reserves Life Average
Source: Deutsche Bank
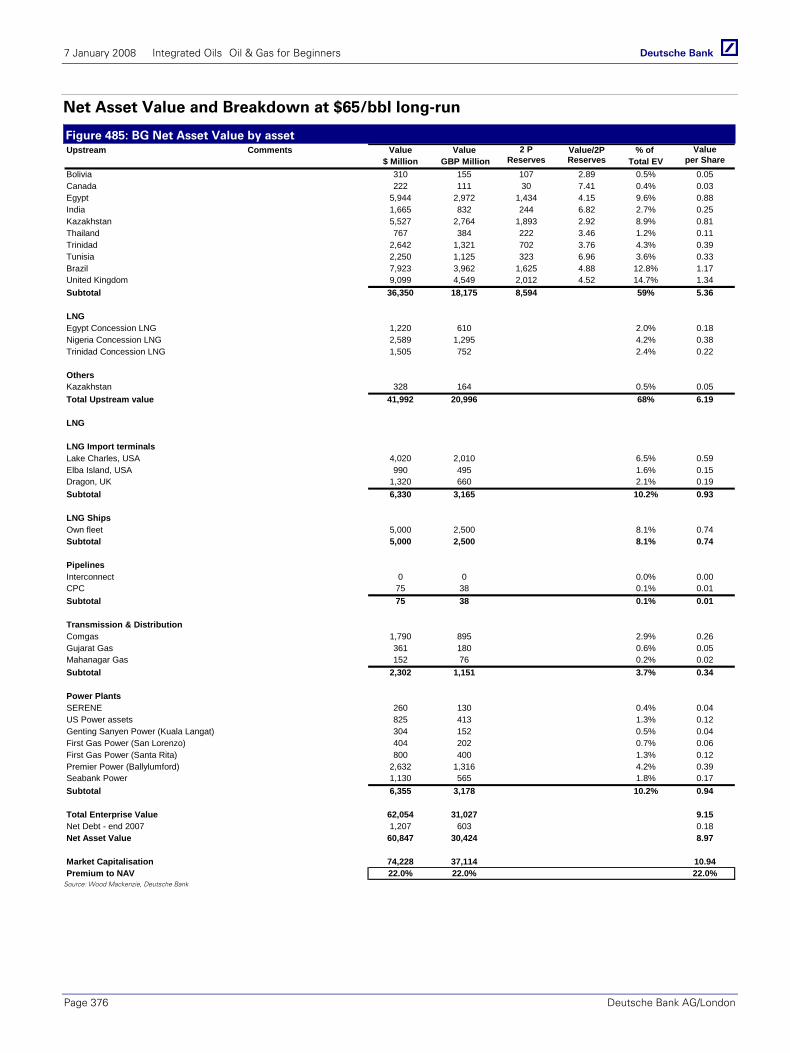
7 January 2008 Integrated Oils Oil & Gas for Beginners
Page 376 Deutsche Bank AG/London
Net Asset Value and Breakdown at $65/bbl long-run
Figure 485: BG Net Asset Value by asset Upstream Comments Value Value 2 P Value/2P % of Value
$ Million GBP Million Reserves Reserves Total EV per ShareBolivia 310 155 107 2.89 0.5% 0.05Canada 222 111 30 7.41 0.4% 0.03Egypt 5,944 2,972 1,434 4.15 9.6% 0.88India 1,665 832 244 6.82 2.7% 0.25Kazakhstan 5,527 2,764 1,893 2.92 8.9% 0.81Thailand 767 384 222 3.46 1.2% 0.11Trinidad 2,642 1,321 702 3.76 4.3% 0.39Tunisia 2,250 1,125 323 6.96 3.6% 0.33Brazil 7,923 3,962 1,625 4.88 12.8% 1.17United Kingdom 9,099 4,549 2,012 4.52 14.7% 1.34Subtotal 36,350 18,175 8,594 59% 5.36
LNGEgypt Concession LNG 1,220 610 2.0% 0.18Nigeria Concession LNG 2,589 1,295 4.2% 0.38Trinidad Concession LNG 1,505 752 2.4% 0.22
OthersKazakhstan 328 164 0.5% 0.05Total Upstream value 41,992 20,996 68% 6.19
LNG
LNG Import terminalsLake Charles, USA 4,020 2,010 6.5% 0.59Elba Island, USA 990 495 1.6% 0.15Dragon, UK 1,320 660 2.1% 0.19Subtotal 6,330 3,165 10.2% 0.93
LNG ShipsOwn fleet 5,000 2,500 8.1% 0.74Subtotal 5,000 2,500 8.1% 0.74
PipelinesInterconnect 0 0 0.0% 0.00CPC 75 38 0.1% 0.01Subtotal 75 38 0.1% 0.01
Transmission & DistributionComgas 1,790 895 2.9% 0.26Gujarat Gas 361 180 0.6% 0.05Mahanagar Gas 152 76 0.2% 0.02Subtotal 2,302 1,151 3.7% 0.34
Power PlantsSERENE 260 130 0.4% 0.04US Power assets 825 413 1.3% 0.12Genting Sanyen Power (Kuala Langat) 304 152 0.5% 0.04First Gas Power (San Lorenzo) 404 202 0.7% 0.06First Gas Power (Santa Rita) 800 400 1.3% 0.12Premier Power (Ballylumford) 2,632 1,316 4.2% 0.39Seabank Power 1,130 565 1.8% 0.17Subtotal 6,355 3,178 10.2% 0.94
Total Enterprise Value 62,054 31,027 9.15Net Debt - end 2007 1,207 603 0.18Net Asset Value 60,847 30,424 8.97
Market Capitalisation 74,228 37,114 10.94Premium to NAV 22.0% 22.0% 22.0%
Source: Wood Mackenzie, Deutsche Bank
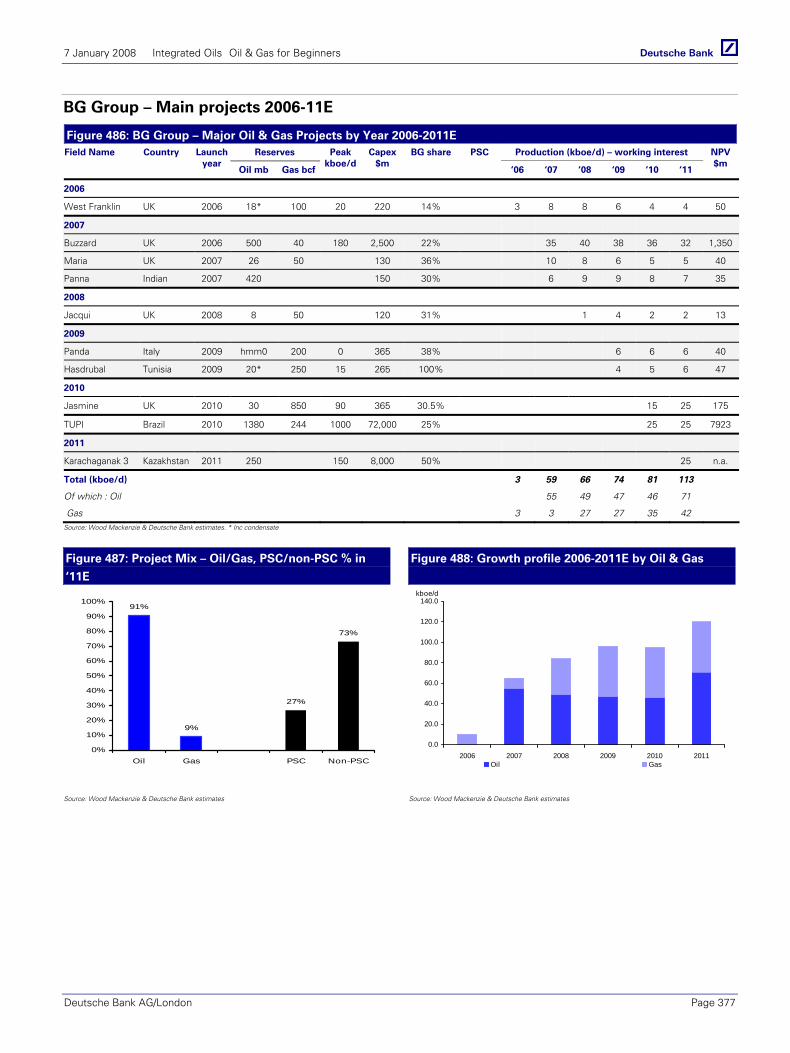
7 January 2008 Integrated Oils Oil & Gas for Beginners
Deutsche Bank AG/London Page 377
BG Group – Main projects 2006-11E
Figure 486: BG Group – Major Oil & Gas Projects by Year 2006-2011E Reserves Production (kboe/d) – working interest Field Name Country Launch
year Oil mb Gas bcf
Peak kboe/d
Capex$m
BG share PSC
‘06 ‘07 ‘08 ‘09 ‘10 ‘11
NPV$m
2006
West Franklin UK 2006 18* 100 20 220 14% 3 8 8 6 4 4 50
2007
Buzzard UK 2006 500 40 180 2,500 22% 35 40 38 36 32 1,350
Maria UK 2007 26 50 130 36% 10 8 6 5 5 40
Panna Indian 2007 420 150 30% 6 9 9 8 7 35
2008
Jacqui UK 2008 8 50 120 31% 1 4 2 2 13
2009
Panda Italy 2009 hmm0 200 0 365 38% 6 6 6 40
Hasdrubal Tunisia 2009 20* 250 15 265 100% 4 5 6 47
2010
Jasmine UK 2010 30 850 90 365 30.5% 15 25 175
TUPI Brazil 2010 1380 244 1000 72,000 25% 25 25 7923
2011
Karachaganak 3 Kazakhstan 2011 250 150 8,000 50% 25 n.a.
Total (kboe/d) 3 59 66 74 81 113
Of which : Oil 55 49 47 46 71
Gas 3 3 27 27 35 42 Source: Wood Mackenzie & Deutsche Bank estimates. * Inc condensate
Figure 487: Project Mix – Oil/Gas, PSC/non-PSC % in
‘11E
Figure 488: Growth profile 2006-2011E by Oil & Gas
91%
9%
27%
73%
0%
10%
20%
30%
40%
50%
60%
70%
80%
90%
100%
Oil Gas PSC Non-PSC
0.0
20.0
40.0
60.0
80.0
100.0
120.0
140.0
2006 2007 2008 2009 2010 2011Oil Gas
kboe/d
Source: Wood Mackenzie & Deutsche Bank estimates Source: Wood Mackenzie & Deutsche Bank estimates
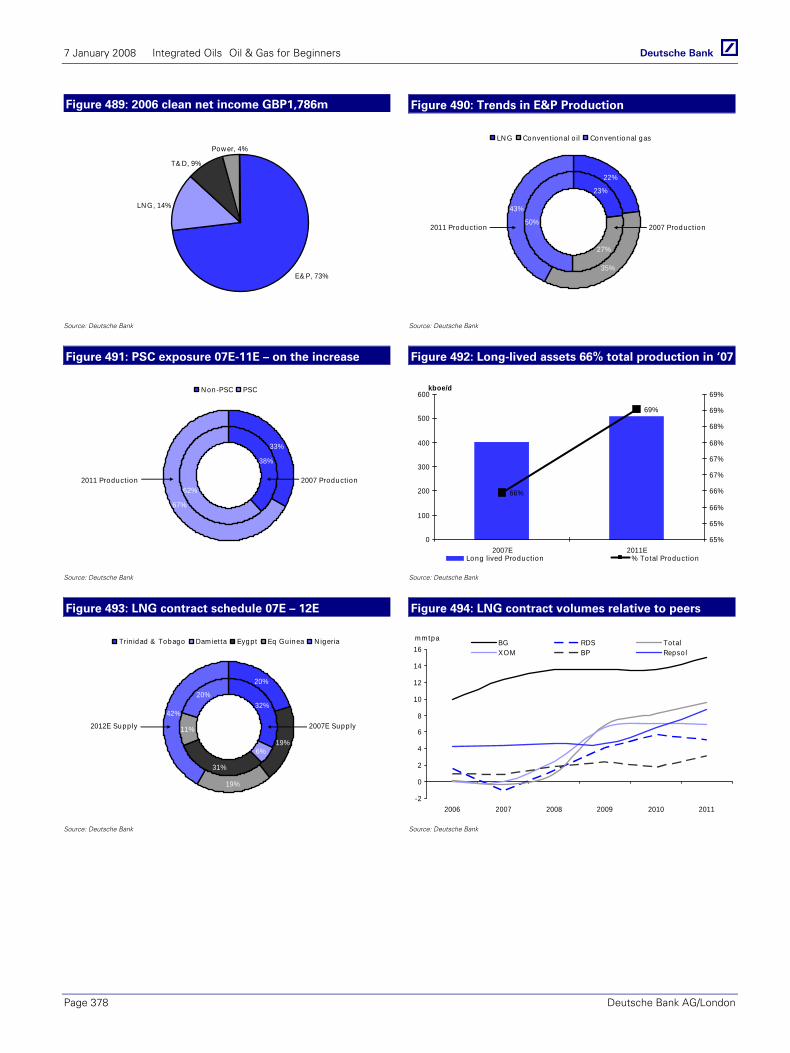
7 January 2008 Integrated Oils Oil & Gas for Beginners
Page 378 Deutsche Bank AG/London
Figure 489: 2006 clean net income GBP1,786m Figure 490: Trends in E&P Production
E& P, 73%
LN G, 14%
Pow er, 4%
T& D, 9%
23%
27%
50%
22%
35%
43%
LN G Conven t ional o il Conven t ional gas
2011 Product ion 2007 Product ion
Source: Deutsche Bank Source: Deutsche Bank
Figure 491: PSC exposure 07E-11E – on the increase Figure 492: Long-lived assets 66% total production in ‘07
38%
62%
33%
67%
N on-PSC PSC
2011 Product ion 2007 Product ion
66%
69%
0
100
200
300
400
500
600
2007E 2011E
kboe/d
65%
65%
66%
66%
67%
67%
68%
68%
69%
69%
Long lived Product ion % Total Product ion
Source: Deutsche Bank Source: Deutsche Bank
Figure 493: LNG contract schedule 07E – 12E Figure 494: LNG contract volumes relative to peers
32%
6%
31%
11%
20%
20%
19%
19%
42%
Trin idad & Tobago Dam iet ta Eygpt Eq Guinea N igeria
2012E Supp ly 2007E Supply
-2
0
2
4
6
8
10
12
14
16
2006 2007 2008 2009 2010 2011
BG RDS TotalXOM BP Repso l
m mtpa
Source: Deutsche Bank Source: Deutsche Bank
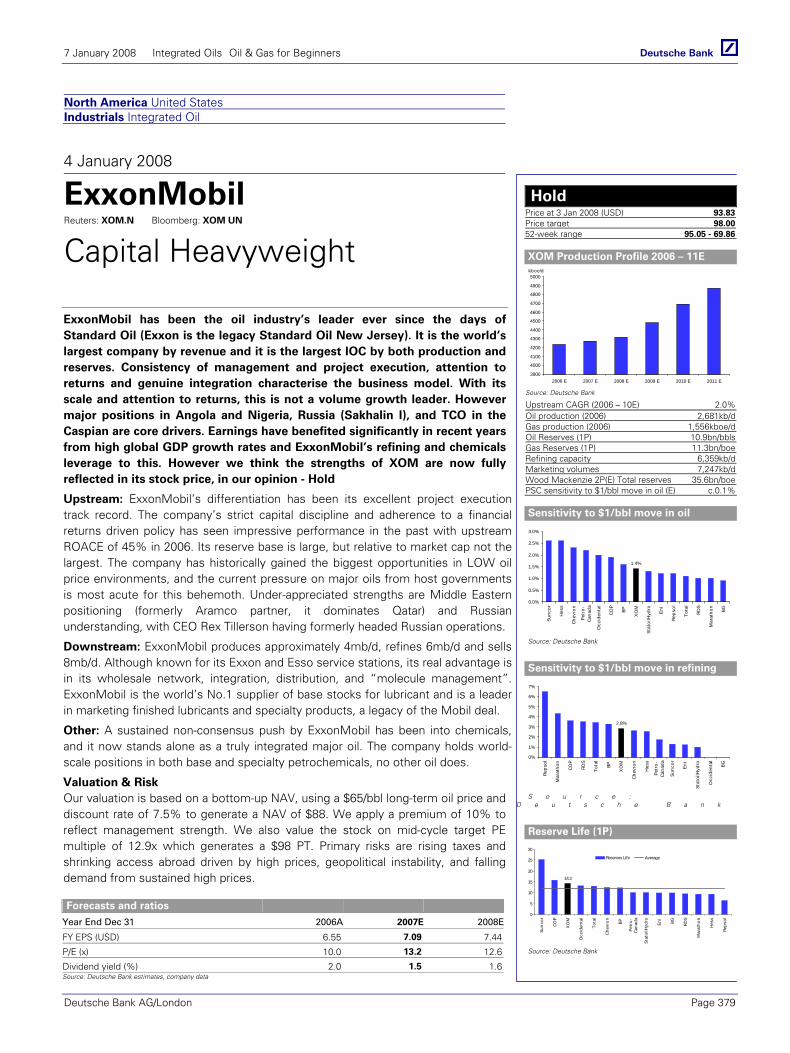
7 January 2008 Integrated Oils Oil & Gas for Beginners
Deutsche Bank AG/London Page 379
North America United States Industrials Integrated Oil
4 January 2008
ExxonMobil Reuters: XOM.N Bloomberg: XOM UN
Capital Heavyweight
ExxonMobil has been the oil industry’s leader ever since the days of Standard Oil (Exxon is the legacy Standard Oil New Jersey). It is the world’s largest company by revenue and it is the largest IOC by both production and reserves. Consistency of management and project execution, attention to returns and genuine integration characterise the business model. With its scale and attention to returns, this is not a volume growth leader. However major positions in Angola and Nigeria, Russia (Sakhalin I), and TCO in the Caspian are core drivers. Earnings have benefited significantly in recent years from high global GDP growth rates and ExxonMobil’s refining and chemicals leverage to this. However we think the strengths of XOM are now fully reflected in its stock price, in our opinion - Hold
Upstream: ExxonMobil’s differentiation has been its excellent project execution track record. The company’s strict capital discipline and adherence to a financial returns driven policy has seen impressive performance in the past with upstream ROACE of 45% in 2006. Its reserve base is large, but relative to market cap not the largest. The company has historically gained the biggest opportunities in LOW oil price environments, and the current pressure on major oils from host governments is most acute for this behemoth. Under-appreciated strengths are Middle Eastern positioning (formerly Aramco partner, it dominates Qatar) and Russian understanding, with CEO Rex Tillerson having formerly headed Russian operations.
Downstream: ExxonMobil produces approximately 4mb/d, refines 6mb/d and sells 8mb/d. Although known for its Exxon and Esso service stations, its real advantage is in its wholesale network, integration, distribution, and “molecule management”. ExxonMobil is the world’s No.1 supplier of base stocks for lubricant and is a leader in marketing finished lubricants and specialty products, a legacy of the Mobil deal.
Other: A sustained non-consensus push by ExxonMobil has been into chemicals, and it now stands alone as a truly integrated major oil. The company holds world-scale positions in both base and specialty petrochemicals, no other oil does.
Valuation & Risk Our valuation is based on a bottom-up NAV, using a $65/bbl long-term oil price and discount rate of 7.5% to generate a NAV of $88. We apply a premium of 10% to reflect management strength. We also value the stock on mid-cycle target PE multiple of 12.9x which generates a $98 PT. Primary risks are rising taxes and shrinking access abroad driven by high prices, geopolitical instability, and falling demand from sustained high prices.
Forecasts and ratios
Year End Dec 31 2006A 2007E 2008E
FY EPS (USD) 6.55 7.09 7.44
P/E (x) 10.0 13.2 12.6
Dividend yield (%) 2.0 1.5 1.6Source: Deutsche Bank estimates, company data
Hold Price at 3 Jan 2008 (USD) 93.83Price target 98.0052-week range 95.05 - 69.86
XOM Production Profile 2006 – 11E
3900
4000
4100
4200
4300
4400
4500
4600
4700
4800
4900
5000
2006 E 2007 E 2008 E 2009 E 2010 E 2011 E
kboe/d
Source: Deutsche Bank
Upstream CAGR (2006 – 10E) 2.0%Oil production (2006) 2,681kb/dGas production (2006) 1,556kboe/dOil Reserves (1P) 10.9bn/bblsGas Reserves (1P) 11.3bn/boeRefining capacity 6,359kb/dMarketing volumes 7,247kb/dWood Mackenzie 2P(E) Total reserves 35.6bn/boePSC sensitivity to $1/bbl move in oil (E) c.0.1%
Sensitivity to $1/bbl move in oil
1.4%
0.0%
0.5%
1.0%
1.5%
2.0%
2.5%
3.0%
Sunc
or
Hes
s
Chev
ron
Petr
o-Ca
nada
Occ
iden
tal
COP
BP
XO
M
Stat
oilH
ydro
Eni
Reps
ol
Tota
l
RDS
Mar
atho
n
BG
Source: Deutsche Bank
Sensitivity to $1/bbl move in refining
2.8%
0%
1%
2%
3%
4%
5%
6%
7%
Reps
ol
Mar
atho
n
COP
RDS
Tota
l
BP
XO
M
Chev
ron
Hes
s
Petr
o-Ca
nada
Sunc
or
Eni
Stat
oilH
ydro
Occ
iden
tal
BG
S o u r c e : D e u t s c h e B a n k
Reserve Life (1P)
14.3
0
5
10
15
20
25
30
Sunc
or
COP
XO
M
Occ
iden
tal
Tota
l
Chev
ron
BP
Petr
o-Ca
nada
Stat
oilH
ydro
Eni
BG RDS
Mar
atho
n
Hes
s
Reps
ol
Reserves Life Average
Source: Deutsche Bank
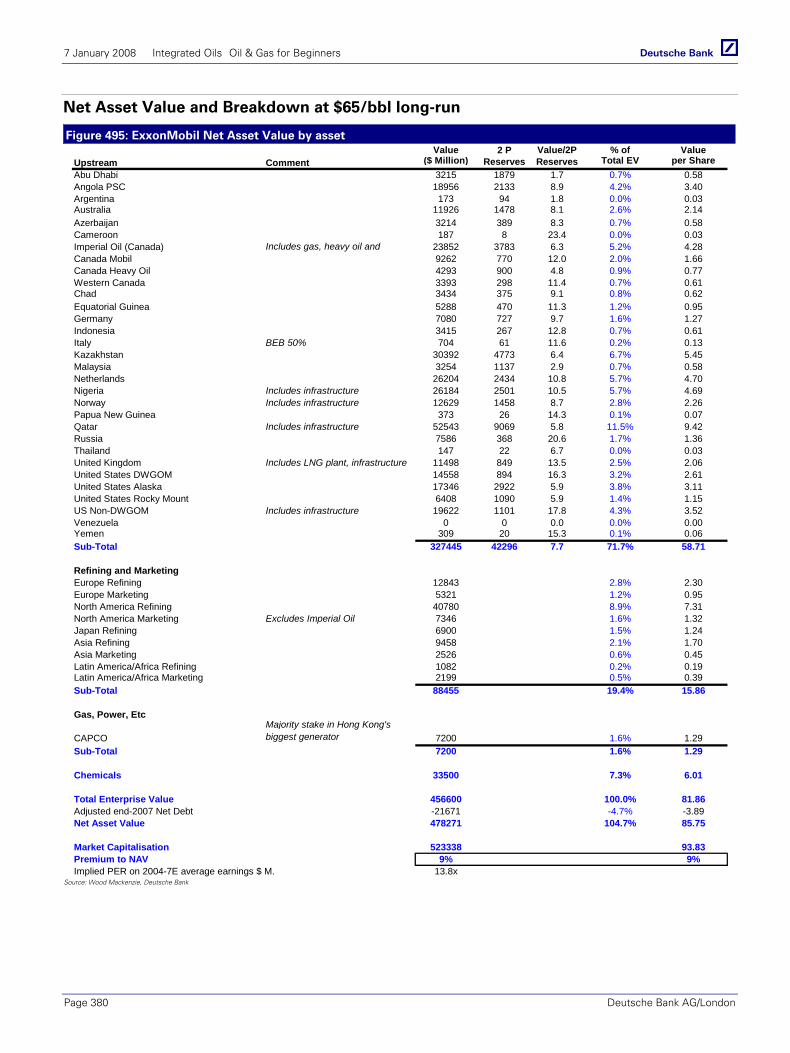
7 January 2008 Integrated Oils Oil & Gas for Beginners
Page 380 Deutsche Bank AG/London
Net Asset Value and Breakdown at $65/bbl long-run
Figure 495: ExxonMobil Net Asset Value by asset Value 2 P Value/2P % of Value
($ Million) Reserves Reserves Total EV per ShareAbu Dhabi 3215 1879 1.7 0.7% 0.58Angola PSC 18956 2133 8.9 4.2% 3.40Argentina 173 94 1.8 0.0% 0.03Australia 11926 1478 8.1 2.6% 2.14Azerbaijan 3214 389 8.3 0.7% 0.58Cameroon 187 8 23.4 0.0% 0.03Imperial Oil (Canada) Includes gas, heavy oil and 23852 3783 6.3 5.2% 4.28Canada Mobil 9262 770 12.0 2.0% 1.66Canada Heavy Oil 4293 900 4.8 0.9% 0.77Western Canada 3393 298 11.4 0.7% 0.61Chad 3434 375 9.1 0.8% 0.62Equatorial Guinea 5288 470 11.3 1.2% 0.95Germany 7080 727 9.7 1.6% 1.27Indonesia 3415 267 12.8 0.7% 0.61Italy BEB 50% 704 61 11.6 0.2% 0.13Kazakhstan 30392 4773 6.4 6.7% 5.45Malaysia 3254 1137 2.9 0.7% 0.58Netherlands 26204 2434 10.8 5.7% 4.70Nigeria Includes infrastructure 26184 2501 10.5 5.7% 4.69Norway Includes infrastructure 12629 1458 8.7 2.8% 2.26Papua New Guinea 373 26 14.3 0.1% 0.07Qatar Includes infrastructure 52543 9069 5.8 11.5% 9.42Russia 7586 368 20.6 1.7% 1.36Thailand 147 22 6.7 0.0% 0.03United Kingdom Includes LNG plant, infrastructure 11498 849 13.5 2.5% 2.06United States DWGOM 14558 894 16.3 3.2% 2.61United States Alaska 17346 2922 5.9 3.8% 3.11United States Rocky Mount 6408 1090 5.9 1.4% 1.15US Non-DWGOM Includes infrastructure 19622 1101 17.8 4.3% 3.52Venezuela 0 0 0.0 0.0% 0.00Yemen 309 20 15.3 0.1% 0.06Sub-Total 327445 42296 7.7 71.7% 58.71
Refining and MarketingEurope Refining 12843 2.8% 2.30Europe Marketing 5321 1.2% 0.95North America Refining 40780 8.9% 7.31North America Marketing Excludes Imperial Oil 7346 1.6% 1.32Japan Refining 6900 1.5% 1.24Asia Refining 9458 2.1% 1.70Asia Marketing 2526 0.6% 0.45Latin America/Africa Refining 1082 0.2% 0.19Latin America/Africa Marketing 2199 0.5% 0.39Sub-Total 88455 19.4% 15.86
Gas, Power, Etc
CAPCOMajority stake in Hong Kong's biggest generator 7200 1.6% 1.29
Sub-Total 7200 1.6% 1.29
Chemicals 33500 7.3% 6.01
Total Enterprise Value 456600 100.0% 81.86Adjusted end-2007 Net Debt -21671 -4.7% -3.89Net Asset Value 478271 104.7% 85.75
Market Capitalisation 523338 93.83Premium to NAV 9% 9%Implied PER on 2004-7E average earnings $ M. 13.8x
Upstream Comment
Source: Wood Mackenzie, Deutsche Bank
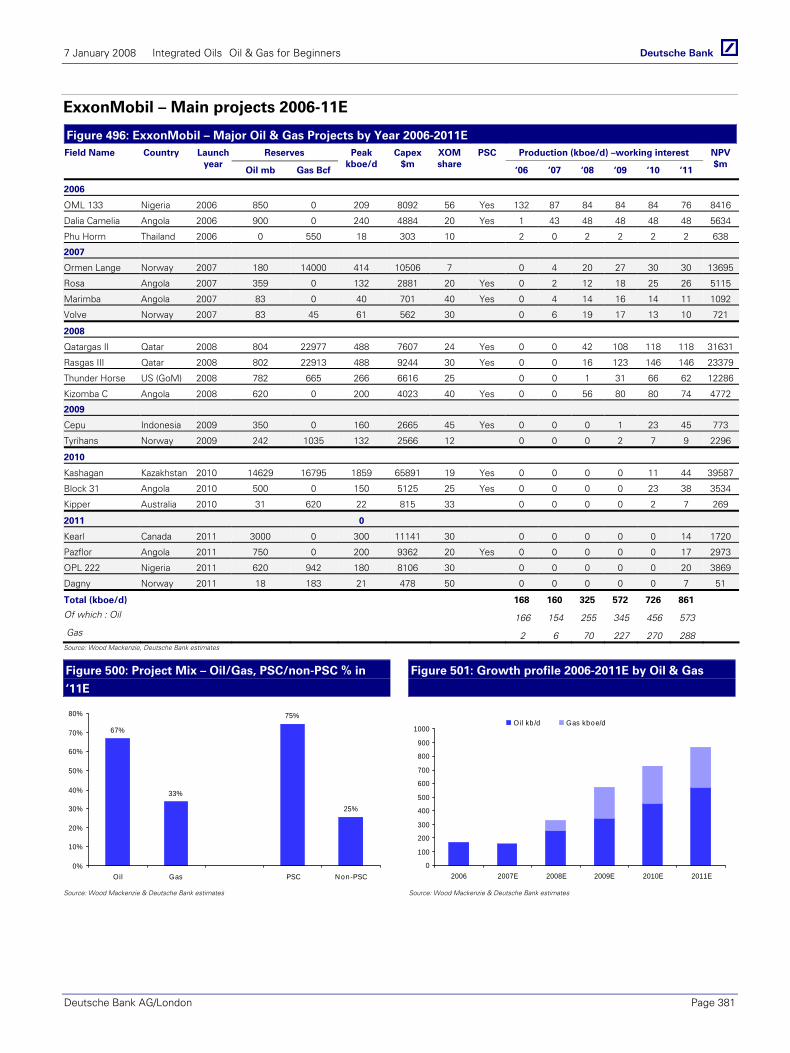
7 January 2008 Integrated Oils Oil & Gas for Beginners
Deutsche Bank AG/London Page 381
ExxonMobil – Main projects 2006-11E
Figure 496: ExxonMobil – Major Oil & Gas Projects by Year 2006-2011E Reserves Production (kboe/d) –working interest Field Name Country Launch
year Oil mb Gas Bcf
Peak kboe/d
Capex$m
XOM share
PSC
‘06 ‘07 ‘08 ‘09 ‘10 ‘11
NPV$m
2006
OML 133 Nigeria 2006 850 0 209 8092 56 Yes 132 87 84 84 84 76 8416
Dalia Camelia Angola 2006 900 0 240 4884 20 Yes 1 43 48 48 48 48 5634
Phu Horm Thailand 2006 0 550 18 303 10 2 0 2 2 2 2 638
2007
Ormen Lange Norway 2007 180 14000 414 10506 7 0 4 20 27 30 30 13695
Rosa Angola 2007 359 0 132 2881 20 Yes 0 2 12 18 25 26 5115
Marimba Angola 2007 83 0 40 701 40 Yes 0 4 14 16 14 11 1092
Volve Norway 2007 83 45 61 562 30 0 6 19 17 13 10 721
2008
Qatargas II Qatar 2008 804 22977 488 7607 24 Yes 0 0 42 108 118 118 31631
Rasgas III Qatar 2008 802 22913 488 9244 30 Yes 0 0 16 123 146 146 23379
Thunder Horse US (GoM) 2008 782 665 266 6616 25 0 0 1 31 66 62 12286
Kizomba C Angola 2008 620 0 200 4023 40 Yes 0 0 56 80 80 74 4772
2009
Cepu Indonesia 2009 350 0 160 2665 45 Yes 0 0 0 1 23 45 773
Tyrihans Norway 2009 242 1035 132 2566 12 0 0 0 2 7 9 2296
2010
Kashagan Kazakhstan 2010 14629 16795 1859 65891 19 Yes 0 0 0 0 11 44 39587
Block 31 Angola 2010 500 0 150 5125 25 Yes 0 0 0 0 23 38 3534
Kipper Australia 2010 31 620 22 815 33 0 0 0 0 2 7 269
2011 0
Kearl Canada 2011 3000 0 300 11141 30 0 0 0 0 0 14 1720
Pazflor Angola 2011 750 0 200 9362 20 Yes 0 0 0 0 0 17 2973
OPL 222 Nigeria 2011 620 942 180 8106 30 0 0 0 0 0 20 3869
Dagny Norway 2011 18 183 21 478 50 0 0 0 0 0 7 51
Total (kboe/d) 168 160 325 572 726 861
Of which : Oil 166 154 255 345 456 573
Gas 2 6 70 227 270 288
Source: Wood Mackenzie, Deutsche Bank estimates
Figure 500: Project Mix – Oil/Gas, PSC/non-PSC % in
‘11E
Figure 501: Growth profile 2006-2011E by Oil & Gas
67%
33%
75%
25%
0%
10%
20%
30%
40%
50%
60%
70%
80%
Oil Gas PSC N on-PSC
0
100
200
300
400
500
600
700
800
900
1000
2006 2007E 2008E 2009E 2010E 2011E
Oil kb /d Gas kboe/d
Source: Wood Mackenzie & Deutsche Bank estimates Source: Wood Mackenzie & Deutsche Bank estimates
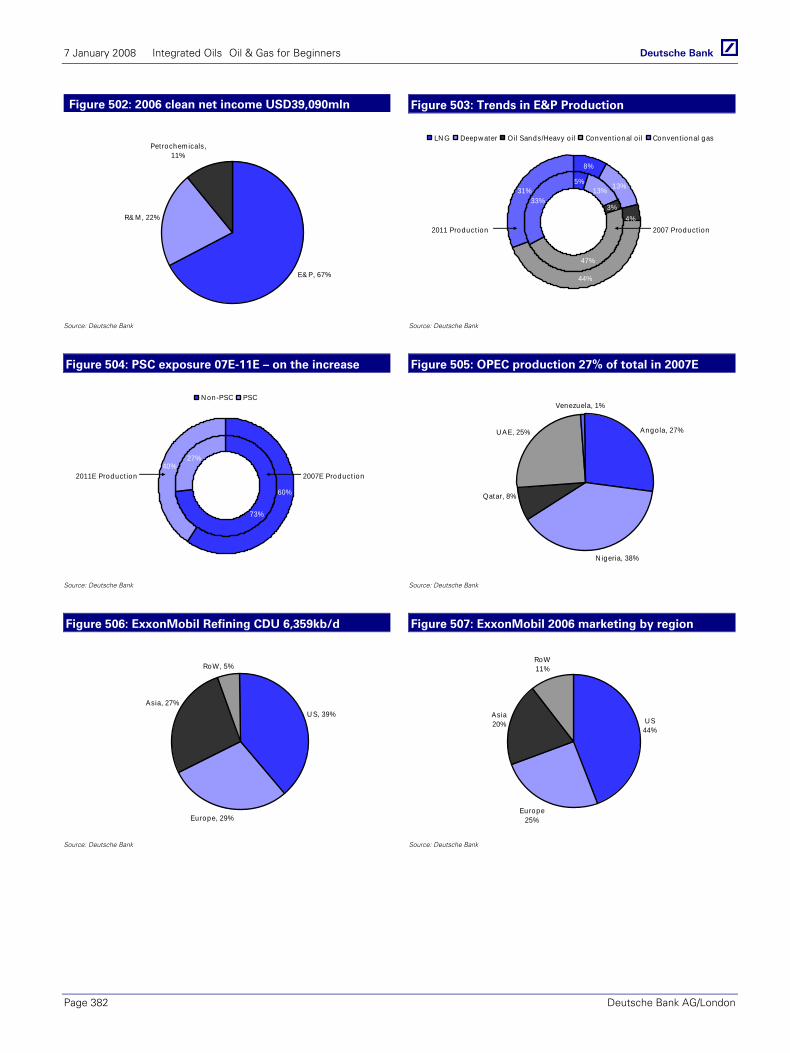
7 January 2008 Integrated Oils Oil & Gas for Beginners
Page 382 Deutsche Bank AG/London
Figure 502: 2006 clean net income USD39,090mln Figure 503: Trends in E&P Production
E& P, 67%
R& M , 22%
Petrochemicals, 11%
5%13%
3%
47%
33%
8%
13%
44%
31%
4%
LN G Deepw ater Oil Sands/Heavy o il Convent ional o il Conven t ional gas
2011 Product ion 2007 Product ion
Source: Deutsche Bank Source: Deutsche Bank
Figure 504: PSC exposure 07E-11E – on the increase Figure 505: OPEC production 27% of total in 2007E
73%
27%40%
60%
N on-PSC PSC
2011E Product ion 2007E Product ion
Angola, 27%
N igeria, 38%
U AE, 25%
Venezuela, 1%
Qatar, 8%
Source: Deutsche Bank Source: Deutsche Bank
Figure 506: ExxonMobil Refining CDU 6,359kb/d Figure 507: ExxonMobil 2006 marketing by region
U S, 39%
Europe, 29%
RoW, 5%
Asia, 27%
U S44%
Europe25%
Asia20%
RoW11%
Source: Deutsche Bank Source: Deutsche Bank
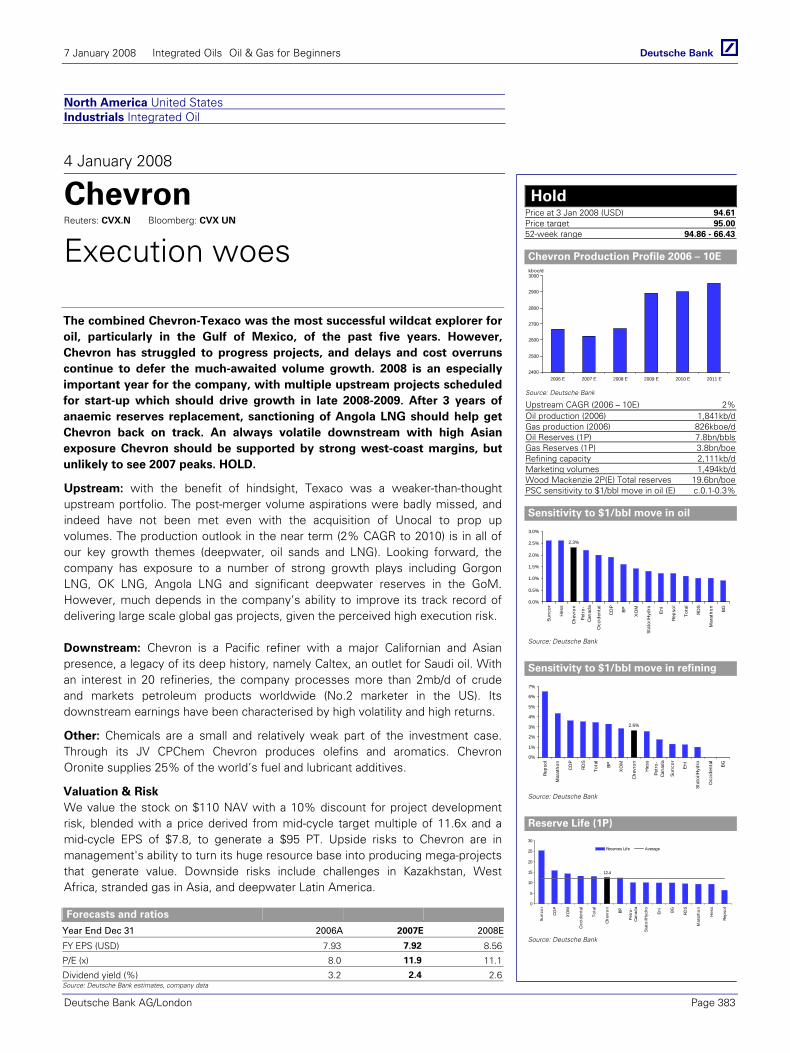
7 January 2008 Integrated Oils Oil & Gas for Beginners
Deutsche Bank AG/London Page 383
North America United States Industrials Integrated Oil
4 January 2008
Chevron Reuters: CVX.N Bloomberg: CVX UN
Execution woes
The combined Chevron-Texaco was the most successful wildcat explorer for oil, particularly in the Gulf of Mexico, of the past five years. However, Chevron has struggled to progress projects, and delays and cost overruns continue to defer the much-awaited volume growth. 2008 is an especially important year for the company, with multiple upstream projects scheduled for start-up which should drive growth in late 2008-2009. After 3 years of anaemic reserves replacement, sanctioning of Angola LNG should help get Chevron back on track. An always volatile downstream with high Asian exposure Chevron should be supported by strong west-coast margins, but unlikely to see 2007 peaks. HOLD.
Upstream: with the benefit of hindsight, Texaco was a weaker-than-thought upstream portfolio. The post-merger volume aspirations were badly missed, and indeed have not been met even with the acquisition of Unocal to prop up volumes. The production outlook in the near term (2% CAGR to 2010) is in all of our key growth themes (deepwater, oil sands and LNG). Looking forward, the company has exposure to a number of strong growth plays including Gorgon LNG, OK LNG, Angola LNG and significant deepwater reserves in the GoM. However, much depends in the company’s ability to improve its track record of delivering large scale global gas projects, given the perceived high execution risk.
Downstream: Chevron is a Pacific refiner with a major Californian and Asian presence, a legacy of its deep history, namely Caltex, an outlet for Saudi oil. With an interest in 20 refineries, the company processes more than 2mb/d of crude and markets petroleum products worldwide (No.2 marketer in the US). Its downstream earnings have been characterised by high volatility and high returns.
Other: Chemicals are a small and relatively weak part of the investment case. Through its JV CPChem Chevron produces olefins and aromatics. Chevron Oronite supplies 25% of the world’s fuel and lubricant additives.
Valuation & Risk We value the stock on $110 NAV with a 10% discount for project development risk, blended with a price derived from mid-cycle target multiple of 11.6x and a mid-cycle EPS of $7.8, to generate a $95 PT. Upside risks to Chevron are in management's ability to turn its huge resource base into producing mega-projects that generate value. Downside risks include challenges in Kazakhstan, West Africa, stranded gas in Asia, and deepwater Latin America.
Forecasts and ratios
Year End Dec 31 2006A 2007E 2008E
FY EPS (USD) 7.93 7.92 8.56
P/E (x) 8.0 11.9 11.1
Dividend yield (%) 3.2 2.4 2.6Source: Deutsche Bank estimates, company data
Hold Price at 3 Jan 2008 (USD) 94.61Price target 95.0052-week range 94.86 - 66.43
Chevron Production Profile 2006 – 10E
2400
2500
2600
2700
2800
2900
3000
2006 E 2007 E 2008 E 2009 E 2010 E 2011 E
kboe/d
Source: Deutsche Bank
Upstream CAGR (2006 – 10E) 2%Oil production (2006) 1,841kb/dGas production (2006) 826kboe/dOil Reserves (1P) 7.8bn/bblsGas Reserves (1P) 3.8bn/boeRefining capacity 2,111kb/dMarketing volumes 1,494kb/dWood Mackenzie 2P(E) Total reserves 19.6bn/boePSC sensitivity to $1/bbl move in oil (E) c.0.1-0.3%
Sensitivity to $1/bbl move in oil
2.3%
0.0%
0.5%
1.0%
1.5%
2.0%
2.5%
3.0%
Sunc
or
Hes
s
Chev
ron
Petr
o-Ca
nada
Occ
iden
tal
COP
BP
XO
M
Stat
oilH
ydro
Eni
Reps
ol
Tota
l
RDS
Mar
atho
n
BG
Source: Deutsche Bank
Sensitivity to $1/bbl move in refining
2.6%
0%
1%
2%
3%
4%
5%
6%
7%
Reps
ol
Mar
atho
n
COP
RDS
Tota
l
BP
XO
M
Chev
ron
Hes
s
Petr
o-Ca
nada
Sunc
or
Eni
Stat
oilH
ydro
Occ
iden
tal
BG
Source: Deutsche Bank
Reserve Life (1P)
12.4
0
5
10
15
20
25
30
Sunc
or
COP
XO
M
Occ
iden
tal
Tota
l
Chev
ron
BP
Petr
o-Ca
nada
Stat
oilH
ydro
Eni
BG RDS
Mar
atho
n
Hes
s
Reps
ol
Reserves Life Average
Source: Deutsche Bank
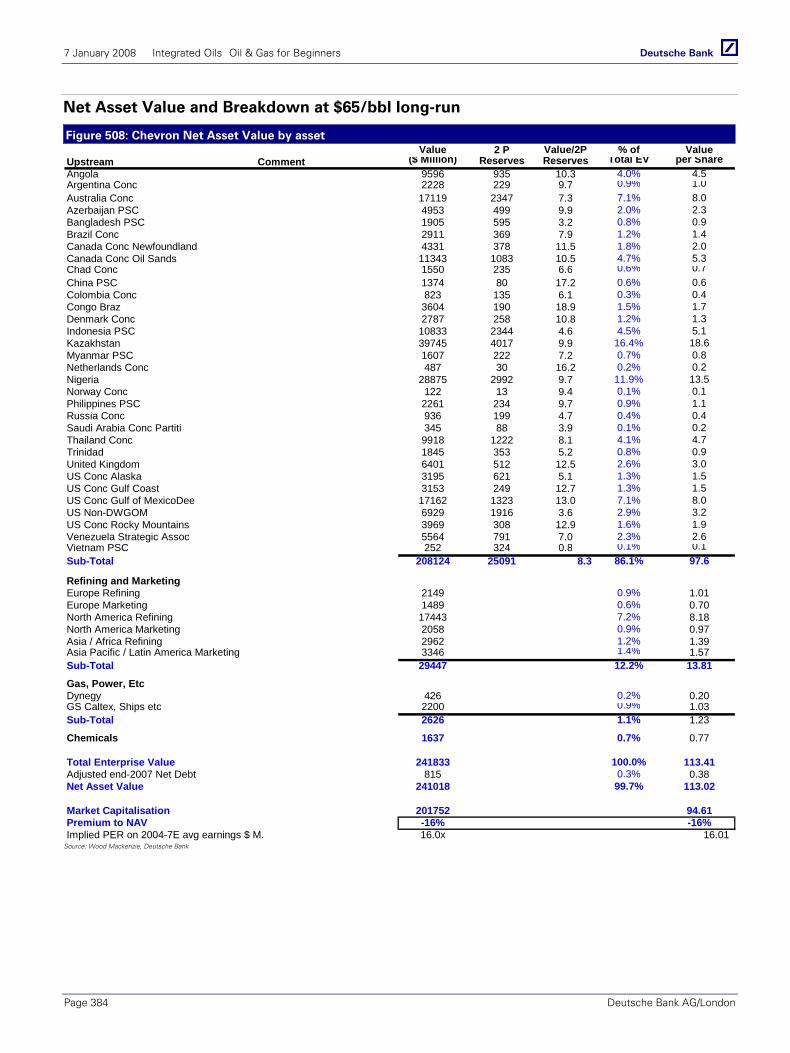
7 January 2008 Integrated Oils Oil & Gas for Beginners
Page 384 Deutsche Bank AG/London
Net Asset Value and Breakdown at $65/bbl long-run
Figure 508: Chevron Net Asset Value by asset Value 2 P Value/2P % of Value
($ Million) Reserves Reserves Total EV per ShareAngola 9596 935 10.3 4.0% 4.5Argentina Conc 2228 229 9.7 0.9% 1.0Australia Conc 17119 2347 7.3 7.1% 8.0Azerbaijan PSC 4953 499 9.9 2.0% 2.3Bangladesh PSC 1905 595 3.2 0.8% 0.9Brazil Conc 2911 369 7.9 1.2% 1.4Canada Conc Newfoundland 4331 378 11.5 1.8% 2.0Canada Conc Oil Sands 11343 1083 10.5 4.7% 5.3Chad Conc 1550 235 6.6 0.6% 0.7China PSC 1374 80 17.2 0.6% 0.6Colombia Conc 823 135 6.1 0.3% 0.4Congo Braz 3604 190 18.9 1.5% 1.7Denmark Conc 2787 258 10.8 1.2% 1.3Indonesia PSC 10833 2344 4.6 4.5% 5.1Kazakhstan 39745 4017 9.9 16.4% 18.6Myanmar PSC 1607 222 7.2 0.7% 0.8Netherlands Conc 487 30 16.2 0.2% 0.2Nigeria 28875 2992 9.7 11.9% 13.5Norway Conc 122 13 9.4 0.1% 0.1Philippines PSC 2261 234 9.7 0.9% 1.1Russia Conc 936 199 4.7 0.4% 0.4Saudi Arabia Conc Partiti 345 88 3.9 0.1% 0.2Thailand Conc 9918 1222 8.1 4.1% 4.7Trinidad 1845 353 5.2 0.8% 0.9United Kingdom 6401 512 12.5 2.6% 3.0US Conc Alaska 3195 621 5.1 1.3% 1.5US Conc Gulf Coast 3153 249 12.7 1.3% 1.5US Conc Gulf of MexicoDee 17162 1323 13.0 7.1% 8.0US Non-DWGOM 6929 1916 3.6 2.9% 3.2US Conc Rocky Mountains 3969 308 12.9 1.6% 1.9Venezuela Strategic Assoc 5564 791 7.0 2.3% 2.6Vietnam PSC 252 324 0.8 0.1% 0.1Sub-Total 208124 25091 8.3 86.1% 97.6
Refining and MarketingEurope Refining 2149 0.9% 1.01Europe Marketing 1489 0.6% 0.70North America Refining 17443 7.2% 8.18North America Marketing 2058 0.9% 0.97Asia / Africa Refining 2962 1.2% 1.39Asia Pacific / Latin America Marketing 3346 1.4% 1.57Sub-Total 29447 12.2% 13.81
Gas, Power, EtcDynegy 426 0.2% 0.20GS Caltex, Ships etc 2200 0.9% 1.03Sub-Total 2626 1.1% 1.23
Chemicals 1637 0.7% 0.77
Total Enterprise Value 241833 100.0% 113.41Adjusted end-2007 Net Debt 815 0.3% 0.38Net Asset Value 241018 99.7% 113.02
Market Capitalisation 201752 94.61Premium to NAV -16% -16%Implied PER on 2004-7E avg earnings $ M. 16.0x 16.01
Upstream Comment
Source: Wood Mackenzie, Deutsche Bank
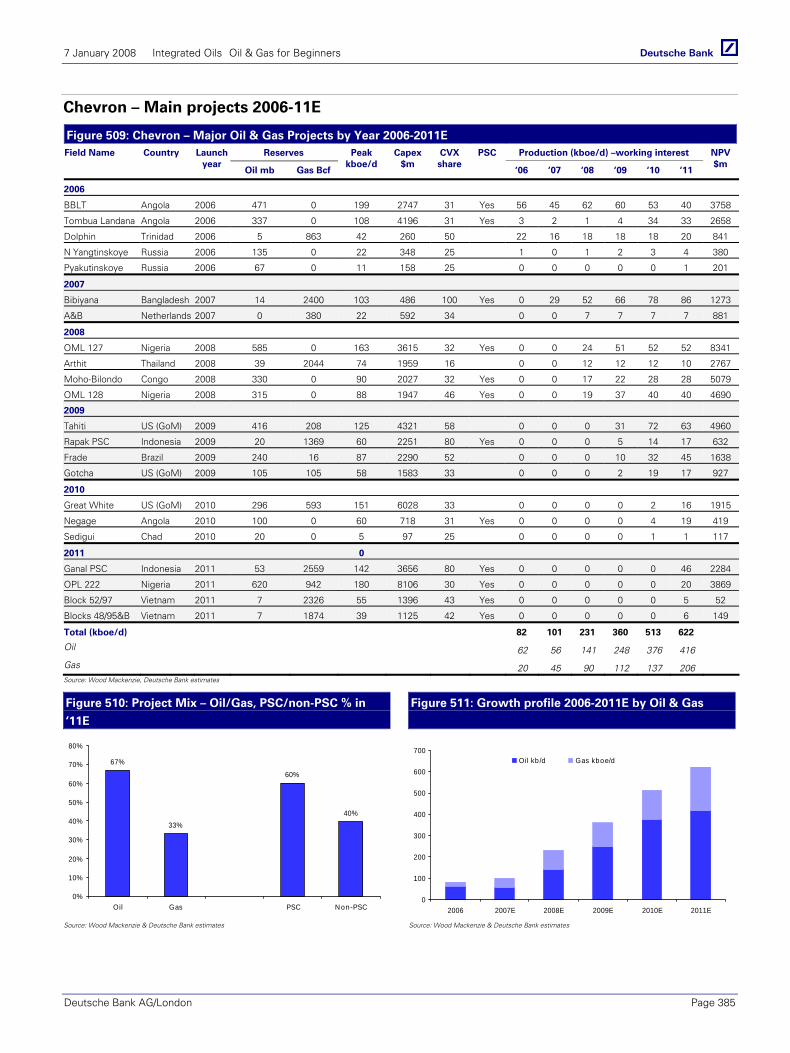
7 January 2008 Integrated Oils Oil & Gas for Beginners
Deutsche Bank AG/London Page 385
Chevron – Main projects 2006-11E
Figure 509: Chevron – Major Oil & Gas Projects by Year 2006-2011E Reserves Production (kboe/d) –working interest Field Name Country Launch
year Oil mb Gas Bcf
Peak kboe/d
Capex$m
CVX share
PSC
‘06 ‘07 ‘08 ‘09 ‘10 ‘11
NPV$m
2006
BBLT Angola 2006 471 0 199 2747 31 Yes 56 45 62 60 53 40 3758
Tombua Landana Angola 2006 337 0 108 4196 31 Yes 3 2 1 4 34 33 2658
Dolphin Trinidad 2006 5 863 42 260 50 22 16 18 18 18 20 841
N Yangtinskoye Russia 2006 135 0 22 348 25 1 0 1 2 3 4 380
Pyakutinskoye Russia 2006 67 0 11 158 25 0 0 0 0 0 1 201
2007
Bibiyana Bangladesh 2007 14 2400 103 486 100 Yes 0 29 52 66 78 86 1273
A&B Netherlands 2007 0 380 22 592 34 0 0 7 7 7 7 881
2008
OML 127 Nigeria 2008 585 0 163 3615 32 Yes 0 0 24 51 52 52 8341
Arthit Thailand 2008 39 2044 74 1959 16 0 0 12 12 12 10 2767
Moho-Bilondo Congo 2008 330 0 90 2027 32 Yes 0 0 17 22 28 28 5079
OML 128 Nigeria 2008 315 0 88 1947 46 Yes 0 0 19 37 40 40 4690
2009
Tahiti US (GoM) 2009 416 208 125 4321 58 0 0 0 31 72 63 4960
Rapak PSC Indonesia 2009 20 1369 60 2251 80 Yes 0 0 0 5 14 17 632
Frade Brazil 2009 240 16 87 2290 52 0 0 0 10 32 45 1638
Gotcha US (GoM) 2009 105 105 58 1583 33 0 0 0 2 19 17 927
2010
Great White US (GoM) 2010 296 593 151 6028 33 0 0 0 0 2 16 1915
Negage Angola 2010 100 0 60 718 31 Yes 0 0 0 0 4 19 419
Sedigui Chad 2010 20 0 5 97 25 0 0 0 0 1 1 117
2011 0
Ganal PSC Indonesia 2011 53 2559 142 3656 80 Yes 0 0 0 0 0 46 2284
OPL 222 Nigeria 2011 620 942 180 8106 30 Yes 0 0 0 0 0 20 3869
Block 52/97 Vietnam 2011 7 2326 55 1396 43 Yes 0 0 0 0 0 5 52
Blocks 48/95&B Vietnam 2011 7 1874 39 1125 42 Yes 0 0 0 0 0 6 149
Total (kboe/d) 82 101 231 360 513 622
Oil 62 56 141 248 376 416
Gas 20 45 90 112 137 206
Source: Wood Mackenzie, Deutsche Bank estimates
Figure 510: Project Mix – Oil/Gas, PSC/non-PSC % in
‘11E
Figure 511: Growth profile 2006-2011E by Oil & Gas
67%
33%
60%
40%
0%
10%
20%
30%
40%
50%
60%
70%
80%
Oil Gas PSC N on-PSC
0
100
200
300
400
500
600
700
2006 2007E 2008E 2009E 2010E 2011E
Oil kb /d Gas kboe/d
Source: Wood Mackenzie & Deutsche Bank estimates Source: Wood Mackenzie & Deutsche Bank estimates
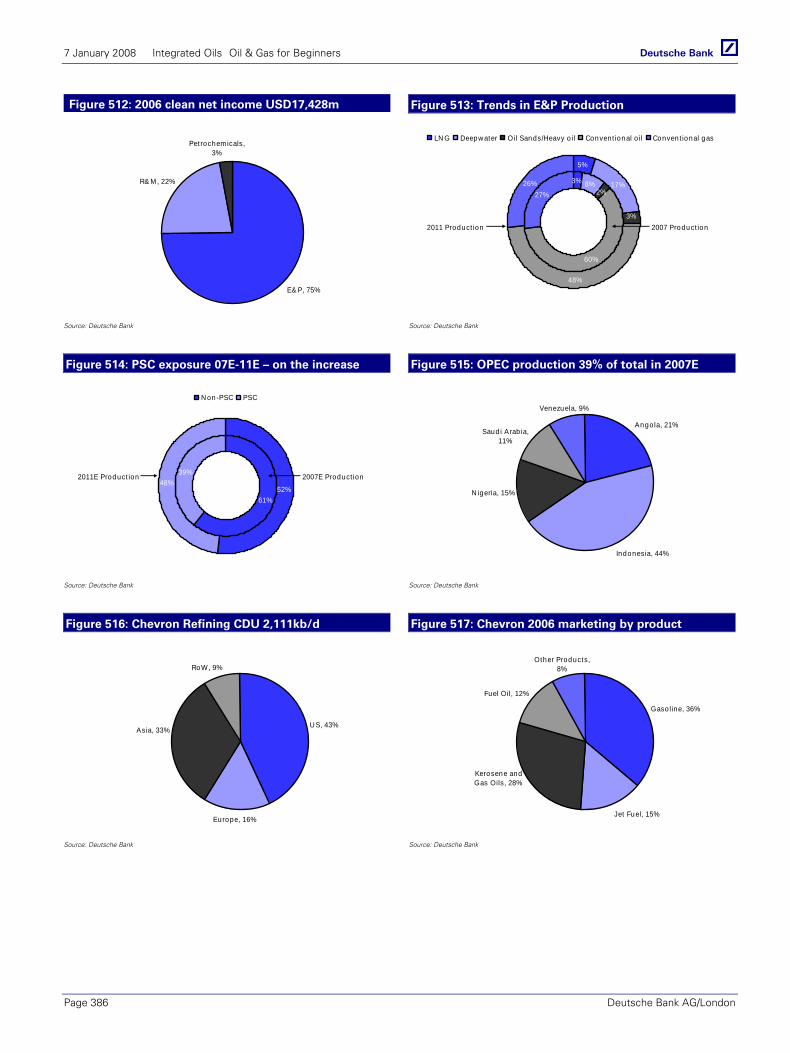
7 January 2008 Integrated Oils Oil & Gas for Beginners
Page 386 Deutsche Bank AG/London
Figure 512: 2006 clean net income USD17,428m Figure 513: Trends in E&P Production
E& P, 75%
R& M , 22%
Petrochem icals, 3%
3% 8%
60%
27%
5%
17%
48%
26%2%
3%
LN G Deepw ater Oil Sands/Heavy o il Convent ional o il Conven t ional gas
2011 Product ion 2007 Product ion
Source: Deutsche Bank Source: Deutsche Bank
Figure 514: PSC exposure 07E-11E – on the increase Figure 515: OPEC production 39% of total in 2007E
61%
39%
52%48%
N on-PSC PSC
2011E Product ion 2007E Product ion
Indonesia, 44%
Angola, 21%Saud i Arab ia,
11%
Venezuela, 9%
N igeria, 15%
Source: Deutsche Bank Source: Deutsche Bank
Figure 516: Chevron Refining CDU 2,111kb/d Figure 517: Chevron 2006 marketing by product
U S, 43%
Europe, 16%
RoW, 9%
Asia, 33%
Gasoline, 36%
Jet Fuel, 15%
Fuel Oil, 12%
Other Products, 8%
Kerosene and Gas Oils, 28%
Source: Deutsche Bank Source: Deutsche Bank

7 January 2008 Integrated Oils Oil & Gas for Beginners
Deutsche Bank AG/London Page 387
North America United States Industrials Integrated Oil
4 January 2008
ConocoPhillips Reuters: COP.N Bloomberg: COP UN
Legacy Led
ConocoPhillips (COP) has grown via acquisition into the third largest IOC in the US and the world’s fifth largest holder of reserves, with a presence in more than 70 countries. Having grown reserves through M&A activity, its primary challenge is to address the weakness of its upstream portfolio. Volumes declined in 2007, driven by slowing production at mature assets and the loss of ~100kbd from Venezuela following its exit from the country, factors which will continue to weigh on growth targets. However, at high oil prices the company generates significant cash flow, and its named strategy of avoiding further acquisitions and return cash to shareholders (7.9% in 2008) provides support. The concern is that the company isn’t growing. HOLD
Upstream: COP’s upstream portfolio is distinct in that it derives the majority of its production from OECD countries and is dominated by organic growth from its legacy assets in the US, Alaska and the North Sea. The expensive acquisition of Burlington in 2006 means COP is the most highly exposed major to US gas prices (sensitivity of 1.1% to a $1/mmbtu move) and its alliance with Lukoil (20% interest) means that COP has exposure to the highly valued Russian upstream whilst being shielded from some of the pressures that other IOCs face. COP also tripled its exposure to the Canadian oil sands in 2006 via its JV with Encana.
Downstream: COP is the second largest refiner in North America behind only Valero (COP is fifth largest in world) with total refining capacity of 2,899kb/d. It is relatively unsophisticated and short marketing, making it a highly levered play, with proportionately more US east coast exposure than most.
Other: Through its 50% interest in Chevron Phillips Chemical Company, COP is has its toe in the chemicals business, but this is not the investment case.
Valuation & Risk We value ConocoPhillips on Net Asset Valuation of $97, with a 10% discount for price volatility for a price target of $87. We blend this with a 9.2x target of our mid-cycle EPS estimate of $9.04 (based on 2004-2010 long-term averages) to arrive at our $85 PT. Primary upside risks for ConocoPhillips include the counter-seasonal rise in crude and refining margins. Downside risks are higher costs and lower upstream earning per barrel, and the possibility of another low reserves replacement number.
Forecasts and ratios
Year End Dec 31 2006A 2007E 2008E
FY EPS (USD) 10.00 9.08 10.19
P/E (x) 6.4 9.7 8.7
Dividend yield (%) 2.3 1.9 2.0Source: Deutsche Bank estimates, company data
Hold Price at 3 Jan 2008 (USD) 88.25Price target 85.0052-week range 90.17 - 61.82
COP Production Profile 2006 – 11E
2260
2280
2300
2320
2340
2360
2380
2400
2420
2440
2460
2006 E 2007 E 2008 E 2009 E 2010 E 2011 E
kboe/d
Source: Deutsche Bank
Upstream CAGR (2006 – 10E) 0%Oil production (2006) 1.1kb/dGas production (2006) 827kboe/dOil Reserves (1P) 6.7bn/bblsGas Reserves (1P) 4.5bn/boeRefining capacity 2,899kb/dMarketing volumes 3,149kb/dWood Mackenzie 2P(E) Total reserves 22.4bn/boePSC sensitivity to $1/bbl move in oil (E) c.0.04%
Sensitivity to $1/bbl move in oil
1.9%
0.0%
0.5%
1.0%
1.5%
2.0%
2.5%
3.0%
Sunc
or
Hes
s
Chev
ron
Petr
o-Ca
nada
Occ
iden
tal
COP
BP
XO
M
Stat
oilH
ydro
Eni
Reps
ol
Tota
l
RDS
Mar
atho
n
BG
Source Deutsche Bank
Sensitivity to $1/bbl move in refining
3.6%
0%
1%
2%
3%
4%
5%
6%
7%
Reps
ol
Mar
atho
n
COP
RDS
Tota
l
BP
XO
M
Chev
ron
Hes
s
Petr
o-Ca
nada
Sunc
or
Eni
Stat
oilH
ydro
Occ
iden
tal
BG
Source Deutsche Bank
Reserve Life (1P)
15.8
0
5
10
15
20
25
30
Sunc
or
COP
XO
M
Occ
iden
tal
Tota
l
Chev
ron
BP
Petr
o-Ca
nada
Stat
oilH
ydro
Eni
BG RDS
Mar
atho
n
Hes
s
Reps
ol
Reserves Life Average
Source Deutsche Bank

7 January 2008 Integrated Oils Oil & Gas for Beginners
Page 388 Deutsche Bank AG/London
Net Asset Value and Breakdown at $65/bbl long-run
Figure 518: ConocoPhillips Net Asset Value by asset Value 2 P Value/2P % of Value
($ Million) Reserves Reserves Total EV per ShareAustralia Bayu Undan 3142 492 6.4 1.8% 1.91Algeria 615 102 6.0 0.4% 0.37Argentina 0 0 0.3 0.0% 0.00Azerbaijan 209 0 0.1% 0.13Canada Onshore Canada Arctic and Oil Sands 16381 2856 5.7 9.3% 9.96Western Canada 3713 237 15.7 2.1% 2.26China 5576 481 11.6 3.2% 3.39Ecuador 220 23 9.4 0.1% 0.13Egypt -3 0 0.0 0.0% 0.00Indonesia Natuna gas to Singapore 6495 893 7.3 3.7% 3.95Kazakhstan Kashagan 3366 1614 2.1 1.9% 2.05Libya Returns with Oasis 1234 521 2.4 0.7% 0.75Lukoil 20% Stake in LUKOIL 14380 7950 1.8 8.2% 8.74Malaysia 1580 132 12.0 0.9% 0.96Netherlands 587 29 20.3 0.3% 0.36Nigeria 7163 889 8.1 4.1% 4.35Norway Massive ex-Phillips position 8470 1067 7.9 4.8% 5.15Qatar QatarGas 3 6108 668 9.1 3.5% 3.71Russia 2775 395 7.0 1.6% 1.69United Kingdom 8841 637 13.9 5.0% 5.37United States Alaska Great deal, from BP/Arco 13498 3111 4.3 7.7% 8.21United States DW Gulf of Mex Magnolia development 1160 113 10.3 0.7% 0.71United States Rocky Mount San Juan 14080 2508 5.6 8.0% 8.56United States Gulf Coast 7372 635 11.6 4.2% 4.48US Non-DWGOM 4710 98 47.9 2.7% 2.86VenezuelaVietnam 2044 198 10.3 1.2% 1.24Sub-Total 133716 25648 5.21 76.3% 81.29
Refining and MarketingEurope Refining 4113 2.3% 2.50Europe Marketing 1766 1.0% 1.07US Refining 29275 16.7% 17.80US Marketing and logistics 2910 1.7% 1.77ROW Refining 414 0.2% 0.25ROW Marketing 112 0.1% 0.07Sub-Total 38589 22.0% 23.46
Gas, Power, EtcGTL 120 0.1% 0.07Power 400 0.2% 0.24Duke Energy Field Services 50% owned by Phillips 236 0.1% 0.14Other Midstream 550 0.3% 0.33Sub-Total - 'other' 1306 0.7% 0.79
Chemicals 1715 1.0% 1.04
Total Enterprise Value 175326 100.0% 106.58Adjusted end-2007 Net Debt 20499 11.7% 12.46Net Asset Value 154827 88.3% 94.12
Market Capitalisation 145171 88.25Premium to NAV -6% -6%Implied PER on 2004-7Eav earnings $ M. 11.8x
Upstream Comment
Source: Wood Mackenzie, Deutsche Bank
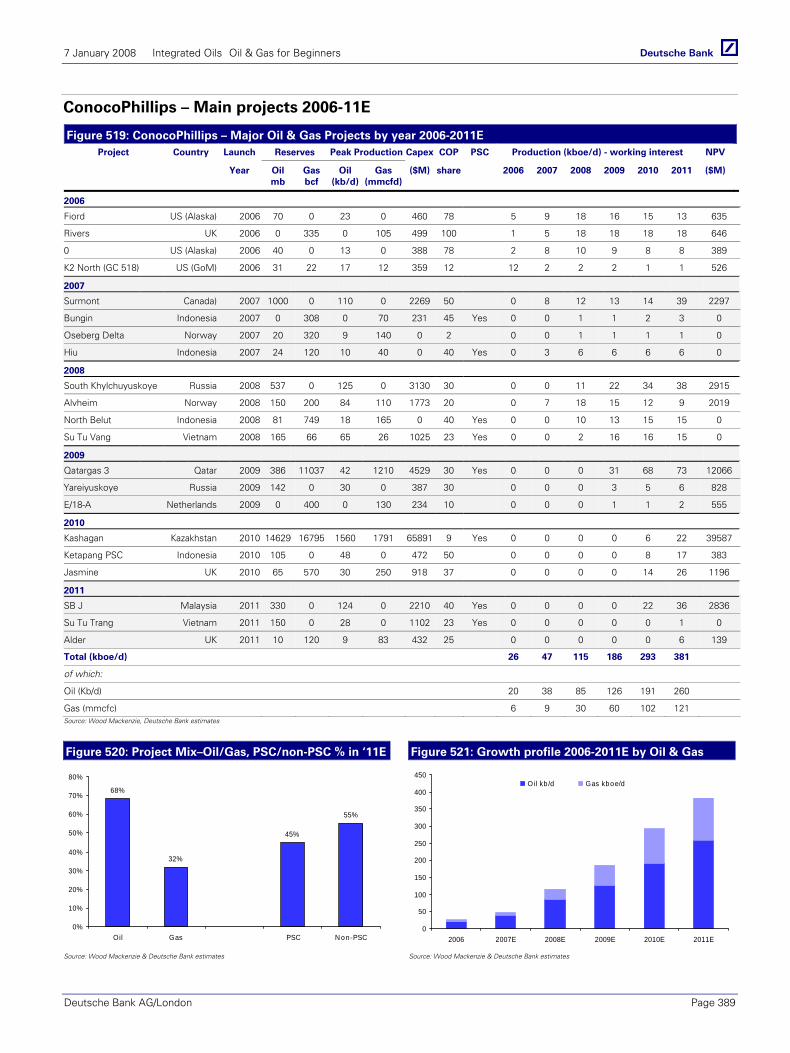
7 January 2008 Integrated Oils Oil & Gas for Beginners
Deutsche Bank AG/London Page 389
ConocoPhillips – Main projects 2006-11E
Figure 519: ConocoPhillips – Major Oil & Gas Projects by year 2006-2011E Project Country Launch Reserves Peak Production Capex COP PSC Production (kboe/d) - working interest NPV
Year Oil mb
Gas bcf
Oil (kb/d)
Gas (mmcfd)
($M) share 2006 2007 2008 2009 2010 2011 ($M)
2006
Fiord US (Alaska) 2006 70 0 23 0 460 78 5 9 18 16 15 13 635
Rivers UK 2006 0 335 0 105 499 100 1 5 18 18 18 18 646
0 US (Alaska) 2006 40 0 13 0 388 78 2 8 10 9 8 8 389
K2 North (GC 518) US (GoM) 2006 31 22 17 12 359 12 12 2 2 2 1 1 526
2007
Surmont Canada) 2007 1000 0 110 0 2269 50 0 8 12 13 14 39 2297
Bungin Indonesia 2007 0 308 0 70 231 45 Yes 0 0 1 1 2 3 0
Oseberg Delta Norway 2007 20 320 9 140 0 2 0 0 1 1 1 1 0
Hiu Indonesia 2007 24 120 10 40 0 40 Yes 0 3 6 6 6 6 0
2008
South Khylchuyuskoye Russia 2008 537 0 125 0 3130 30 0 0 11 22 34 38 2915
Alvheim Norway 2008 150 200 84 110 1773 20 0 7 18 15 12 9 2019
North Belut Indonesia 2008 81 749 18 165 0 40 Yes 0 0 10 13 15 15 0
Su Tu Vang Vietnam 2008 165 66 65 26 1025 23 Yes 0 0 2 16 16 15 0
2009
Qatargas 3 Qatar 2009 386 11037 42 1210 4529 30 Yes 0 0 0 31 68 73 12066
Yareiyuskoye Russia 2009 142 0 30 0 387 30 0 0 0 3 5 6 828
E/18-A Netherlands 2009 0 400 0 130 234 10 0 0 0 1 1 2 555
2010
Kashagan Kazakhstan 2010 14629 16795 1560 1791 65891 9 Yes 0 0 0 0 6 22 39587
Ketapang PSC Indonesia 2010 105 0 48 0 472 50 0 0 0 0 8 17 383
Jasmine UK 2010 65 570 30 250 918 37 0 0 0 0 14 26 1196
2011
SB J Malaysia 2011 330 0 124 0 2210 40 Yes 0 0 0 0 22 36 2836
Su Tu Trang Vietnam 2011 150 0 28 0 1102 23 Yes 0 0 0 0 0 1 0
Alder UK 2011 10 120 9 83 432 25 0 0 0 0 0 6 139
Total (kboe/d) 26 47 115 186 293 381
of which:
Oil (Kb/d) 20 38 85 126 191 260
Gas (mmcfc) 6 9 30 60 102 121 Source: Wood Mackenzie, Deutsche Bank estimates
Figure 520: Project Mix–Oil/Gas, PSC/non-PSC % in ‘11E Figure 521: Growth profile 2006-2011E by Oil & Gas
68%
32%
45%
55%
0%
10%
20%
30%
40%
50%
60%
70%
80%
Oil Gas PSC N on-PSC
0
50
100
150
200
250
300
350
400
450
2006 2007E 2008E 2009E 2010E 2011E
Oil kb /d Gas kboe/d
Source: Wood Mackenzie & Deutsche Bank estimates Source: Wood Mackenzie & Deutsche Bank estimates
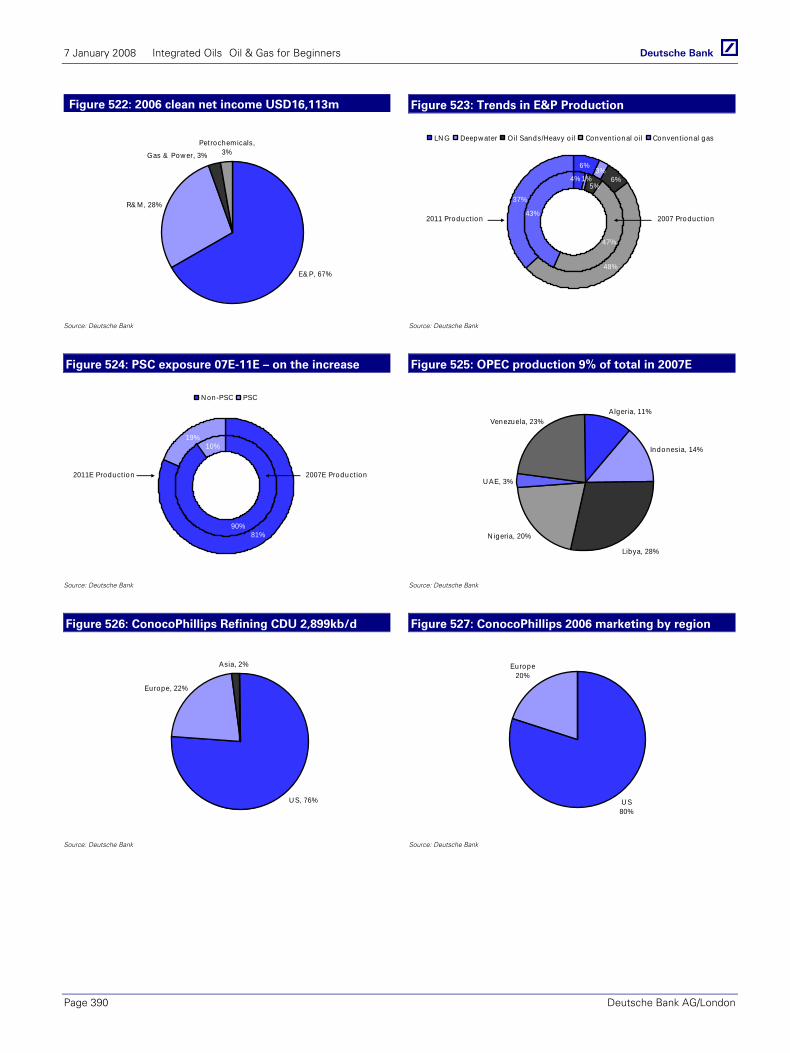
7 January 2008 Integrated Oils Oil & Gas for Beginners
Page 390 Deutsche Bank AG/London
Figure 522: 2006 clean net income USD16,113m Figure 523: Trends in E&P Production
E& P, 67%
R& M , 28%
Gas & Pow er, 3%
Petrochem icals, 3%
47%
43%
6%
48%
37%
4% 1%5%
3%6%
LN G Deepw ater Oil Sands/Heavy o il Convent ional o il Conven t ional gas
2011 Product ion 2007 Product ion
Source: Deutsche Bank Source: Deutsche Bank
Figure 524: PSC exposure 07E-11E – on the increase Figure 525: OPEC production 9% of total in 2007E
90%
10%
81%
19%
N on-PSC PSC
2011E Product ion 2007E Product ion
Indonesia, 14%
N igeria, 20%
U AE, 3%
Algeria, 11%Venezuela, 23%
Libya, 28%
Source: Deutsche Bank Source: Deutsche Bank
Figure 526: ConocoPhillips Refining CDU 2,899kb/d Figure 527: ConocoPhillips 2006 marketing by region
U S, 76%
Europe, 22%
Asia, 2%
U S80%
Europe20%
Source: Deutsche Bank Source: Deutsche Bank
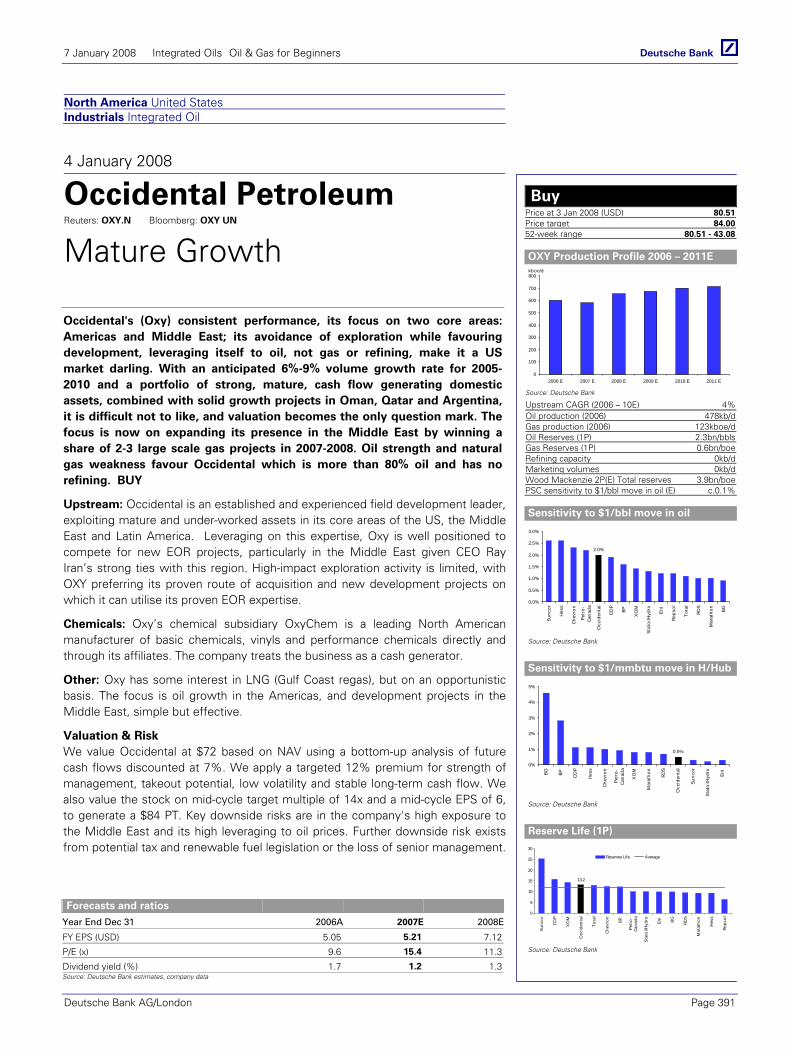
7 January 2008 Integrated Oils Oil & Gas for Beginners
Deutsche Bank AG/London Page 391
North America United States Industrials Integrated Oil
4 January 2008
Occidental Petroleum Reuters: OXY.N Bloomberg: OXY UN
Mature Growth
Occidental's (Oxy) consistent performance, its focus on two core areas: Americas and Middle East; its avoidance of exploration while favouring development, leveraging itself to oil, not gas or refining, make it a US market darling. With an anticipated 6%-9% volume growth rate for 2005-2010 and a portfolio of strong, mature, cash flow generating domestic assets, combined with solid growth projects in Oman, Qatar and Argentina, it is difficult not to like, and valuation becomes the only question mark. The focus is now on expanding its presence in the Middle East by winning a share of 2-3 large scale gas projects in 2007-2008. Oil strength and natural gas weakness favour Occidental which is more than 80% oil and has no refining. BUY
Upstream: Occidental is an established and experienced field development leader, exploiting mature and under-worked assets in its core areas of the US, the Middle East and Latin America. Leveraging on this expertise, Oxy is well positioned to compete for new EOR projects, particularly in the Middle East given CEO Ray Iran’s strong ties with this region. High-impact exploration activity is limited, with OXY preferring its proven route of acquisition and new development projects on which it can utilise its proven EOR expertise.
Chemicals: Oxy’s chemical subsidiary OxyChem is a leading North American manufacturer of basic chemicals, vinyls and performance chemicals directly and through its affiliates. The company treats the business as a cash generator.
Other: Oxy has some interest in LNG (Gulf Coast regas), but on an opportunistic basis. The focus is oil growth in the Americas, and development projects in the Middle East, simple but effective.
Valuation & Risk We value Occidental at $72 based on NAV using a bottom-up analysis of future cash flows discounted at 7%. We apply a targeted 12% premium for strength of management, takeout potential, low volatility and stable long-term cash flow. We also value the stock on mid-cycle target multiple of 14x and a mid-cycle EPS of 6, to generate a $84 PT. Key downside risks are in the company's high exposure to the Middle East and its high leveraging to oil prices. Further downside risk exists from potential tax and renewable fuel legislation or the loss of senior management.
Forecasts and ratios
Year End Dec 31 2006A 2007E 2008E
FY EPS (USD) 5.05 5.21 7.12
P/E (x) 9.6 15.4 11.3
Dividend yield (%) 1.7 1.2 1.3Source: Deutsche Bank estimates, company data
Buy Price at 3 Jan 2008 (USD) 80.51Price target 84.0052-week range 80.51 - 43.08
OXY Production Profile 2006 – 2011E
0
100
200
300
400
500
600
700
800
2006 E 2007 E 2008 E 2009 E 2010 E 2011 E
kboe/d
Source: Deutsche Bank
Upstream CAGR (2006 – 10E) 4%Oil production (2006) 478kb/dGas production (2006) 123kboe/dOil Reserves (1P) 2.3bn/bblsGas Reserves (1P) 0.6bn/boeRefining capacity 0kb/dMarketing volumes 0kb/dWood Mackenzie 2P(E) Total reserves 3.9bn/boePSC sensitivity to $1/bbl move in oil (E) c.0.1%
Sensitivity to $1/bbl move in oil
2.0%
0.0%
0.5%
1.0%
1.5%
2.0%
2.5%
3.0%
Sunc
or
Hes
s
Chev
ron
Petr
o-Ca
nada
Occ
iden
tal
COP
BP
XO
M
Stat
oilH
ydro
Eni
Reps
ol
Tota
l
RDS
Mar
atho
n
BG
Source: Deutsche Bank
Sensitivity to $1/mmbtu move in H/Hub
0.5%
0%
1%
2%
3%
4%
5%
BG BP
COP
Hes
s
Chev
ron
Petr
o-Ca
nada
XO
M
Mar
atho
n
RDS
Occ
iden
tal
Sunc
or
Stat
oilH
ydro
Eni
Source: Deutsche Bank
Reserve Life (1P)
13.2
0
5
10
15
20
25
30
Sunc
or
COP
XO
M
Occ
iden
tal
Tota
l
Chev
ron
BP
Petr
o-Ca
nada
Stat
oilH
ydro
Eni
BG RDS
Mar
atho
n
Hes
s
Reps
ol
Reserves Life Average
Source: Deutsche Bank
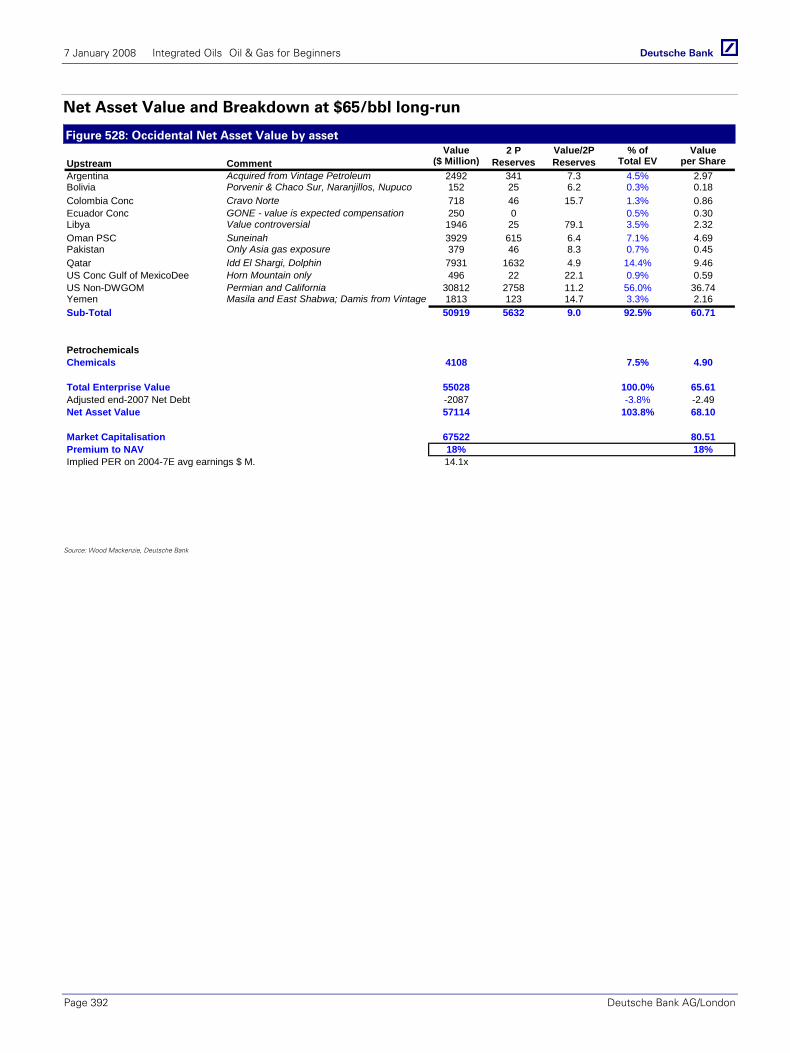
7 January 2008 Integrated Oils Oil & Gas for Beginners
Page 392 Deutsche Bank AG/London
Net Asset Value and Breakdown at $65/bbl long-run
Figure 528: Occidental Net Asset Value by asset Value 2 P Value/2P % of Value
($ Million) Reserves Reserves Total EV per ShareArgentina Acquired from Vintage Petroleum 2492 341 7.3 4.5% 2.97Bolivia Porvenir & Chaco Sur, Naranjillos, Ñupuco 152 25 6.2 0.3% 0.18Colombia Conc Cravo Norte 718 46 15.7 1.3% 0.86Ecuador Conc GONE - value is expected compensation 250 0 0.5% 0.30Libya Value controversial 1946 25 79.1 3.5% 2.32Oman PSC Suneinah 3929 615 6.4 7.1% 4.69Pakistan Only Asia gas exposure 379 46 8.3 0.7% 0.45Qatar Idd El Shargi, Dolphin 7931 1632 4.9 14.4% 9.46US Conc Gulf of MexicoDee Horn Mountain only 496 22 22.1 0.9% 0.59US Non-DWGOM Permian and California 30812 2758 11.2 56.0% 36.74Yemen Masila and East Shabwa; Damis from Vintage 1813 123 14.7 3.3% 2.16Sub-Total 50919 5632 9.0 92.5% 60.71
PetrochemicalsChemicals 4108 7.5% 4.90
Total Enterprise Value 55028 100.0% 65.61Adjusted end-2007 Net Debt -2087 -3.8% -2.49Net Asset Value 57114 103.8% 68.10
Market Capitalisation 67522 80.51Premium to NAV 18% 18%Implied PER on 2004-7E avg earnings $ M. 14.1x
Upstream Comment
Source: Wood Mackenzie, Deutsche Bank
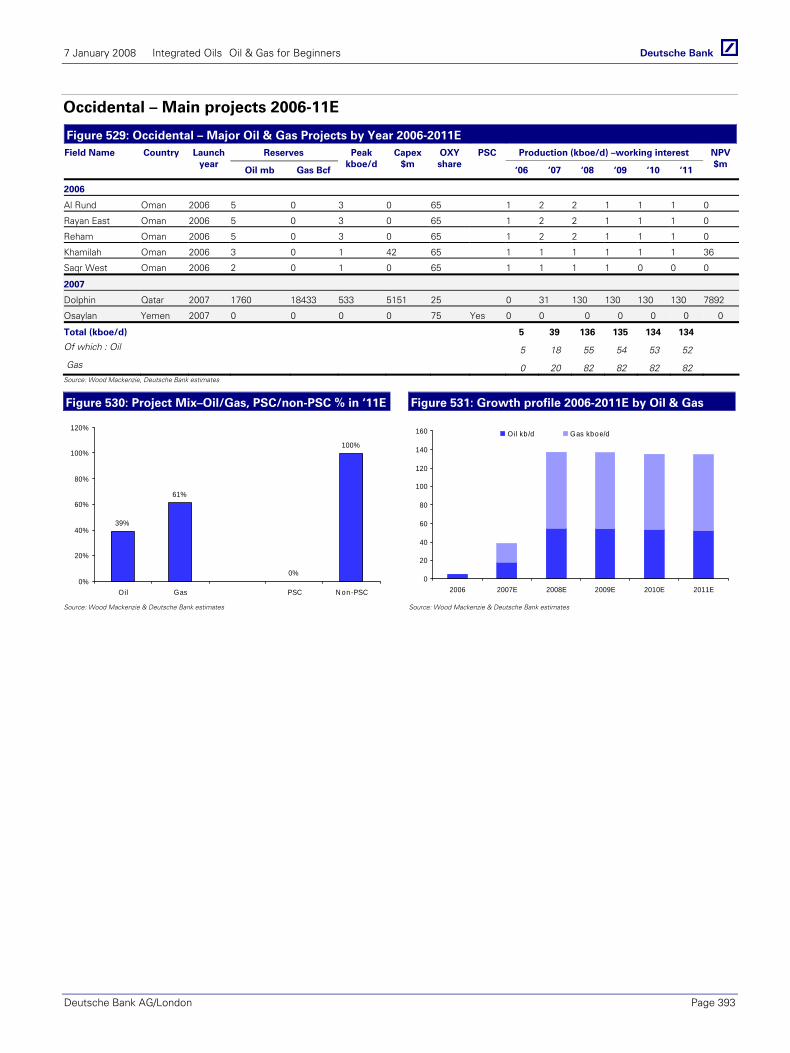
7 January 2008 Integrated Oils Oil & Gas for Beginners
Deutsche Bank AG/London Page 393
Occidental – Main projects 2006-11E
Figure 529: Occidental – Major Oil & Gas Projects by Year 2006-2011E Reserves Production (kboe/d) –working interest Field Name Country Launch
year Oil mb Gas Bcf
Peak kboe/d
Capex$m
OXY share
PSC
‘06 ‘07 ‘08 ‘09 ‘10 ‘11
NPV$m
2006
Al Rund Oman 2006 5 0 3 0 65 1 2 2 1 1 1 0
Rayan East Oman 2006 5 0 3 0 65 1 2 2 1 1 1 0
Reham Oman 2006 5 0 3 0 65 1 2 2 1 1 1 0
Khamilah Oman 2006 3 0 1 42 65 1 1 1 1 1 1 36
Saqr West Oman 2006 2 0 1 0 65 1 1 1 1 0 0 0
2007
Dolphin Qatar 2007 1760 18433 533 5151 25 0 31 130 130 130 130 7892
Osaylan Yemen 2007 0 0 0 0 75 Yes 0 0 0 0 0 0 0
Total (kboe/d) 5 39 136 135 134 134
Of which : Oil 5 18 55 54 53 52
Gas 0 20 82 82 82 82 Source: Wood Mackenzie, Deutsche Bank estimates
Figure 530: Project Mix–Oil/Gas, PSC/non-PSC % in ‘11E Figure 531: Growth profile 2006-2011E by Oil & Gas
39%
61%
0%
100%
0%
20%
40%
60%
80%
100%
120%
Oil Gas PSC N on-PSC
0
20
40
60
80
100
120
140
160
2006 2007E 2008E 2009E 2010E 2011E
Oil kb /d Gas kboe/d
Source: Wood Mackenzie & Deutsche Bank estimates Source: Wood Mackenzie & Deutsche Bank estimates
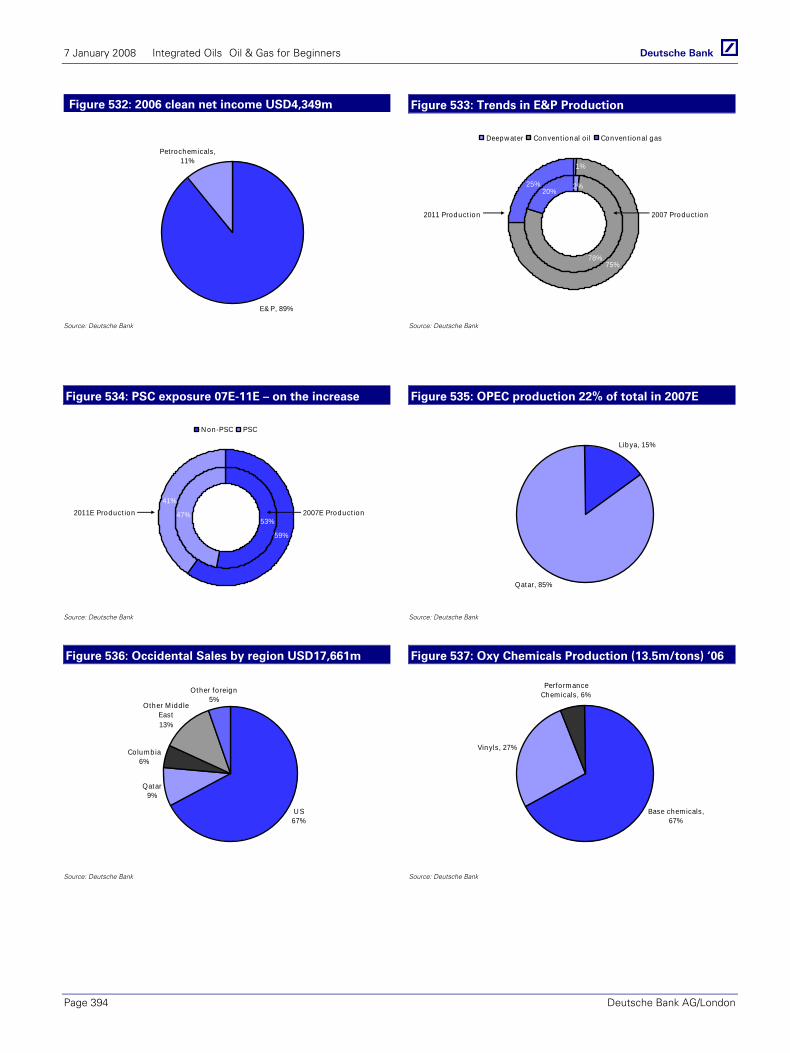
7 January 2008 Integrated Oils Oil & Gas for Beginners
Page 394 Deutsche Bank AG/London
Figure 532: 2006 clean net income USD4,349m Figure 533: Trends in E&P Production
E& P, 89%
Petrochemicals, 11%
78%
20%
75%
25% 2%
1%
Deepw ater Convent ional o il Convent ional gas
2011 Product ion 2007 Product ion
Source: Deutsche Bank Source: Deutsche Bank
Figure 534: PSC exposure 07E-11E – on the increase Figure 535: OPEC production 22% of total in 2007E
53%47%
59%
41%
N on-PSC PSC
2011E Product ion 2007E Product ion
Libya, 15%
Qatar, 85%
Source: Deutsche Bank Source: Deutsche Bank
Figure 536: Occidental Sales by region USD17,661m Figure 537: Oxy Chemicals Production (13.5m/tons) ‘06
U S67%
Qatar9%
Columb ia6%
Other M idd le East13%
Other fo reign5%
Base chemicals, 67%
Vinyls, 27%
Perfo rm ance Chem icals, 6%
Source: Deutsche Bank Source: Deutsche Bank
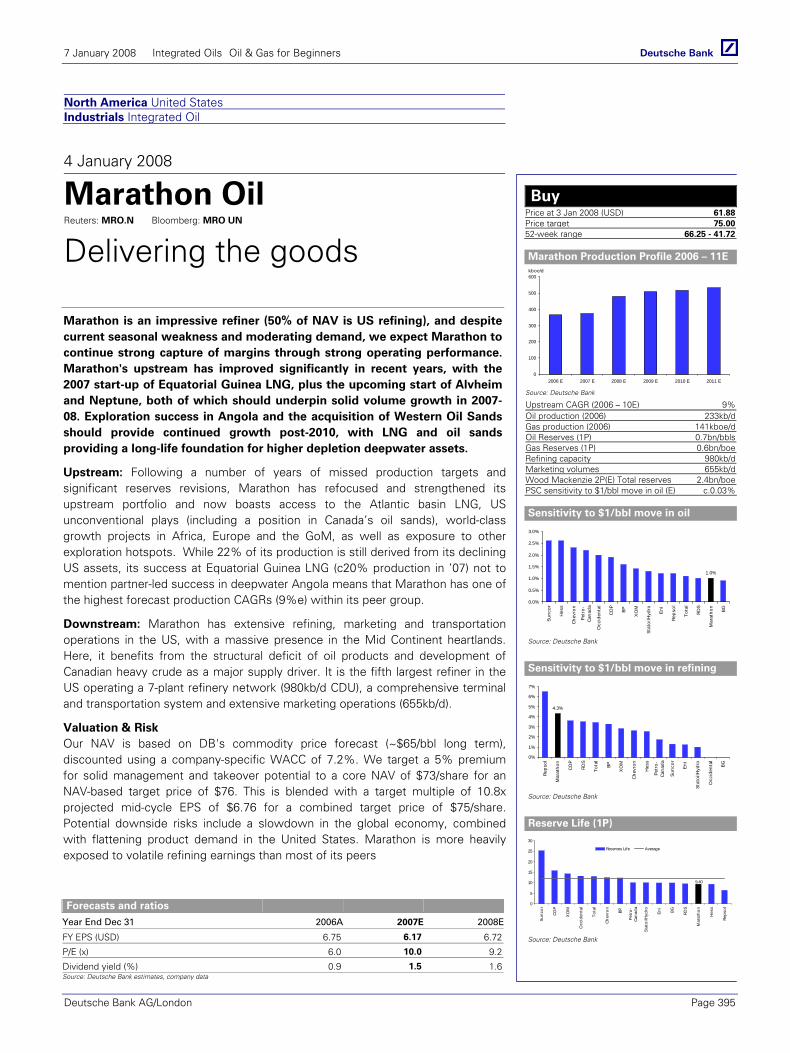
7 January 2008 Integrated Oils Oil & Gas for Beginners
Deutsche Bank AG/London Page 395
North America United States Industrials Integrated Oil
4 January 2008
Marathon Oil Reuters: MRO.N Bloomberg: MRO UN
Delivering the goods
Marathon is an impressive refiner (50% of NAV is US refining), and despite current seasonal weakness and moderating demand, we expect Marathon to continue strong capture of margins through strong operating performance. Marathon's upstream has improved significantly in recent years, with the 2007 start-up of Equatorial Guinea LNG, plus the upcoming start of Alvheim and Neptune, both of which should underpin solid volume growth in 2007-08. Exploration success in Angola and the acquisition of Western Oil Sands should provide continued growth post-2010, with LNG and oil sands providing a long-life foundation for higher depletion deepwater assets.
Upstream: Following a number of years of missed production targets and significant reserves revisions, Marathon has refocused and strengthened its upstream portfolio and now boasts access to the Atlantic basin LNG, US unconventional plays (including a position in Canada’s oil sands), world-class growth projects in Africa, Europe and the GoM, as well as exposure to other exploration hotspots. While 22% of its production is still derived from its declining US assets, its success at Equatorial Guinea LNG (c20% production in ’07) not to mention partner-led success in deepwater Angola means that Marathon has one of the highest forecast production CAGRs (9%e) within its peer group.
Downstream: Marathon has extensive refining, marketing and transportation operations in the US, with a massive presence in the Mid Continent heartlands. Here, it benefits from the structural deficit of oil products and development of Canadian heavy crude as a major supply driver. It is the fifth largest refiner in the US operating a 7-plant refinery network (980kb/d CDU), a comprehensive terminal and transportation system and extensive marketing operations (655kb/d).
Valuation & Risk Our NAV is based on DB's commodity price forecast (~$65/bbl long term), discounted using a company-specific WACC of 7.2%. We target a 5% premium for solid management and takeover potential to a core NAV of $73/share for an NAV-based target price of $76. This is blended with a target multiple of 10.8x projected mid-cycle EPS of $6.76 for a combined target price of $75/share. Potential downside risks include a slowdown in the global economy, combined with flattening product demand in the United States. Marathon is more heavily exposed to volatile refining earnings than most of its peers
Forecasts and ratios
Year End Dec 31 2006A 2007E 2008E
FY EPS (USD) 6.75 6.17 6.72
P/E (x) 6.0 10.0 9.2
Dividend yield (%) 0.9 1.5 1.6Source: Deutsche Bank estimates, company data
Buy Price at 3 Jan 2008 (USD) 61.88Price target 75.0052-week range 66.25 - 41.72
Marathon Production Profile 2006 – 11E
0
100
200
300
400
500
600
2006 E 2007 E 2008 E 2009 E 2010 E 2011 E
kboe/d
Source: Deutsche Bank
Upstream CAGR (2006 – 10E) 9%Oil production (2006) 233kb/dGas production (2006) 141kboe/dOil Reserves (1P) 0.7bn/bblsGas Reserves (1P) 0.6bn/boeRefining capacity 980kb/dMarketing volumes 655kb/dWood Mackenzie 2P(E) Total reserves 2.4bn/boePSC sensitivity to $1/bbl move in oil (E) c.0.03%
Sensitivity to $1/bbl move in oil
1.0%
0.0%
0.5%
1.0%
1.5%
2.0%
2.5%
3.0%
Sunc
or
Hes
s
Chev
ron
Petr
o-Ca
nada
Occ
iden
tal
COP
BP
XO
M
Stat
oilH
ydro
Eni
Reps
ol
Tota
l
RDS
Mar
atho
n
BG
Source: Deutsche Bank
Sensitivity to $1/bbl move in refining
4.3%
0%
1%
2%
3%
4%
5%
6%
7%
Reps
ol
Mar
atho
n
COP
RDS
Tota
l
BP
XO
M
Chev
ron
Hes
s
Petr
o-Ca
nada
Sunc
or
Eni
Stat
oilH
ydro
Occ
iden
tal
BG
Source: Deutsche Bank
Reserve Life (1P)
9.40
0
5
10
15
20
25
30
Sunc
or
COP
XO
M
Occ
iden
tal
Tota
l
Chev
ron
BP
Petr
o-Ca
nada
Stat
oilH
ydro
Eni
BG RDS
Mar
atho
n
Hes
s
Reps
ol
Reserves Life Average
Source: Deutsche Bank
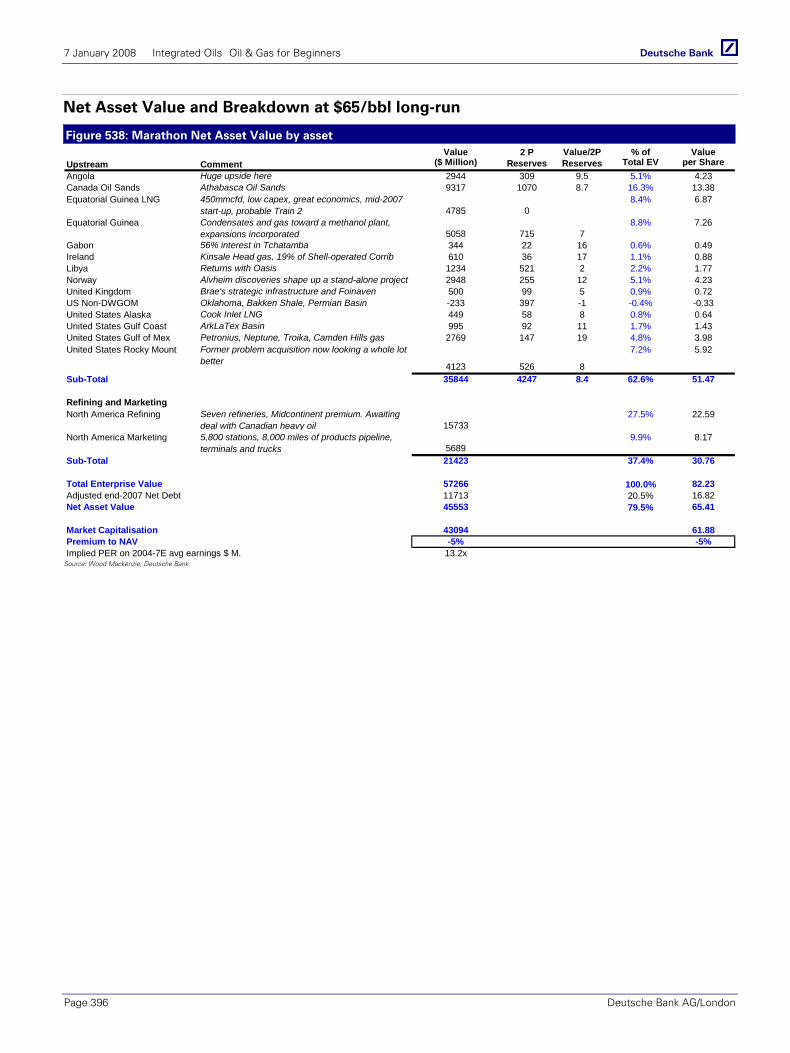
7 January 2008 Integrated Oils Oil & Gas for Beginners
Page 396 Deutsche Bank AG/London
Net Asset Value and Breakdown at $65/bbl long-run
Figure 538: Marathon Net Asset Value by asset Value 2 P Value/2P % of Value
($ Million) Reserves Reserves Total EV per ShareAngola Huge upside here 2944 309 9.5 5.1% 4.23Canada Oil Sands Athabasca Oil Sands 9317 1070 8.7 16.3% 13.38Equatorial Guinea LNG 450mmcfd, low capex, great economics, mid-2007
start-up, probable Train 2 4785 08.4% 6.87
Equatorial Guinea Condensates and gas toward a methanol plant, expansions incorporated 5058 715 7
8.8% 7.26
Gabon 56% interest in Tchatamba 344 22 16 0.6% 0.49Ireland Kinsale Head gas, 19% of Shell-operated Corrib 610 36 17 1.1% 0.88Libya Returns with Oasis 1234 521 2 2.2% 1.77Norway Alvheim discoveries shape up a stand-alone project 2948 255 12 5.1% 4.23United Kingdom Brae's strategic infrastructure and Foinaven 500 99 5 0.9% 0.72US Non-DWGOM Oklahoma, Bakken Shale, Permian Basin -233 397 -1 -0.4% -0.33United States Alaska Cook Inlet LNG 449 58 8 0.8% 0.64United States Gulf Coast ArkLaTex Basin 995 92 11 1.7% 1.43United States Gulf of Mex Petronius, Neptune, Troika, Camden Hills gas 2769 147 19 4.8% 3.98United States Rocky Mount Former problem acquisition now looking a whole lot
better 4123 526 8
7.2% 5.92
Sub-Total 35844 4247 8.4 62.6% 51.47
Refining and MarketingNorth America Refining Seven refineries, Midcontinent premium. Awaiting
deal with Canadian heavy oil 1573327.5% 22.59
North America Marketing 5,800 stations, 8,000 miles of products pipeline, terminals and trucks 5689
9.9% 8.17
Sub-Total 21423 37.4% 30.76
Total Enterprise Value 57266 100.0% 82.23Adjusted end-2007 Net Debt 11713 20.5% 16.82Net Asset Value 45553 79.5% 65.41
Market Capitalisation 43094 61.88Premium to NAV -5% -5%Implied PER on 2004-7E avg earnings $ M. 13.2x
Upstream Comment
Source: Wood Mackenzie, Deutsche Bank
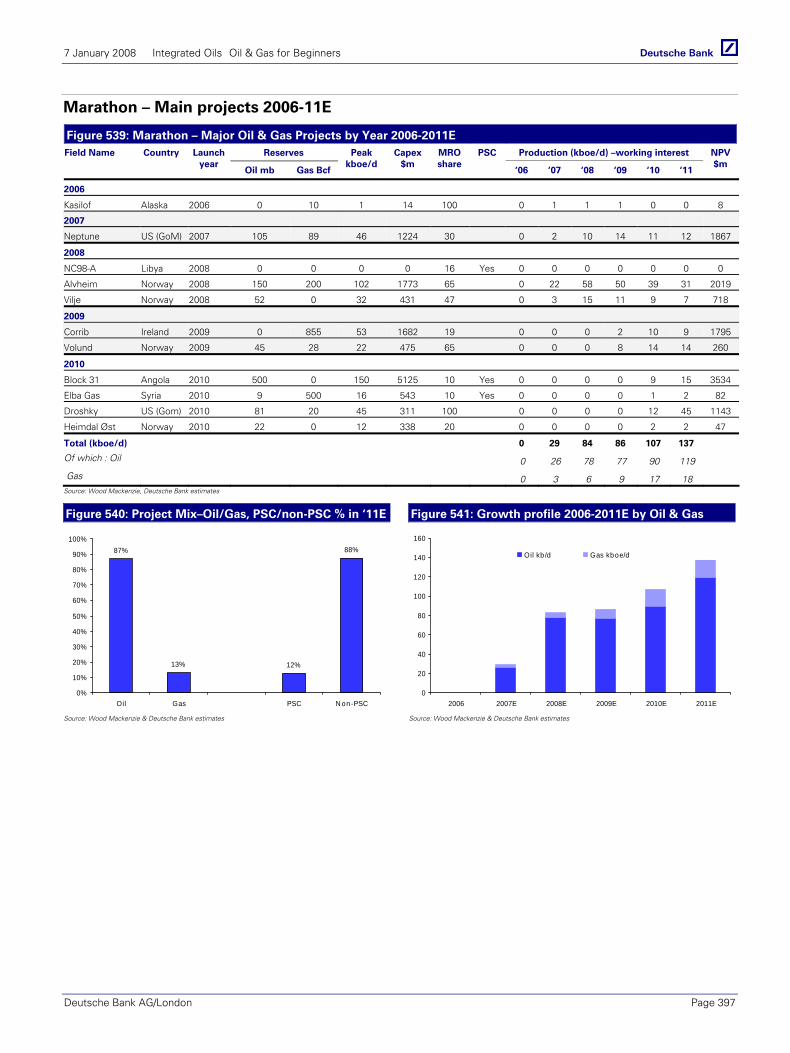
7 January 2008 Integrated Oils Oil & Gas for Beginners
Deutsche Bank AG/London Page 397
Marathon – Main projects 2006-11E
Figure 539: Marathon – Major Oil & Gas Projects by Year 2006-2011E Reserves Production (kboe/d) –working interest Field Name Country Launch
year Oil mb Gas Bcf
Peak kboe/d
Capex$m
MRO share
PSC
‘06 ‘07 ‘08 ‘09 ‘10 ‘11
NPV$m
2006
Kasilof Alaska 2006 0 10 1 14 100 0 1 1 1 0 0 8
2007
Neptune US (GoM) 2007 105 89 46 1224 30 0 2 10 14 11 12 1867
2008
NC98-A Libya 2008 0 0 0 0 16 Yes 0 0 0 0 0 0 0
Alvheim Norway 2008 150 200 102 1773 65 0 22 58 50 39 31 2019
Vilje Norway 2008 52 0 32 431 47 0 3 15 11 9 7 718
2009
Corrib Ireland 2009 0 855 53 1682 19 0 0 0 2 10 9 1795
Volund Norway 2009 45 28 22 475 65 0 0 0 8 14 14 260
2010
Block 31 Angola 2010 500 0 150 5125 10 Yes 0 0 0 0 9 15 3534
Elba Gas Syria 2010 9 500 16 543 10 Yes 0 0 0 0 1 2 82
Droshky US (Gom) 2010 81 20 45 311 100 0 0 0 0 12 45 1143
Heimdal Øst Norway 2010 22 0 12 338 20 0 0 0 0 2 2 47
Total (kboe/d) 0 29 84 86 107 137
Of which : Oil 0 26 78 77 90 119
Gas 0 3 6 9 17 18
Source: Wood Mackenzie, Deutsche Bank estimates
Figure 540: Project Mix–Oil/Gas, PSC/non-PSC % in ‘11E Figure 541: Growth profile 2006-2011E by Oil & Gas
87%
13% 12%
88%
0%
10%
20%
30%
40%
50%
60%
70%
80%
90%
100%
Oil Gas PSC N on-PSC
0
20
40
60
80
100
120
140
160
2006 2007E 2008E 2009E 2010E 2011E
Oil kb /d Gas kboe/d
Source: Wood Mackenzie & Deutsche Bank estimates Source: Wood Mackenzie & Deutsche Bank estimates

7 January 2008 Integrated Oils Oil & Gas for Beginners
Page 398 Deutsche Bank AG/London
Figure 542: 2006 clean net income USD4,879m Figure 543: Trends in E&P Production
E& P, 41%
R& M, 59%
9%5%
53%
33%
13%
13%
44%
29%
LN G Deepw ater Convent ional o il Convent ional gas
2011 Product ion 2007 Produ t ion
Source: Deutsche Bank Source: Deutsche Bank
Figure 544: PSC exposure 07E-11E – on the increase Figure 545: OPEC production 15% of total in 2007E
81%
19%
81%
19%
N on-PSC PSC
2011E Product ion 2007E Product ion
Libya, 100%
Source: Deutsche Bank Source: Deutsche Bank
Figure 546: Marathon refining CDU 980kb/d Figure 547: Marathon 2006 net sales by region
Louisiana, 25%
Kentucky, 23%
Mich igan , 10%
Ohio , 7%
Texas, 7%
Minneso ta, 7%
Illino is, 20%
U S, 46%
Europe, 19%
Africa, 35%
Source: Deutsche Bank Source: Deutsche Bank
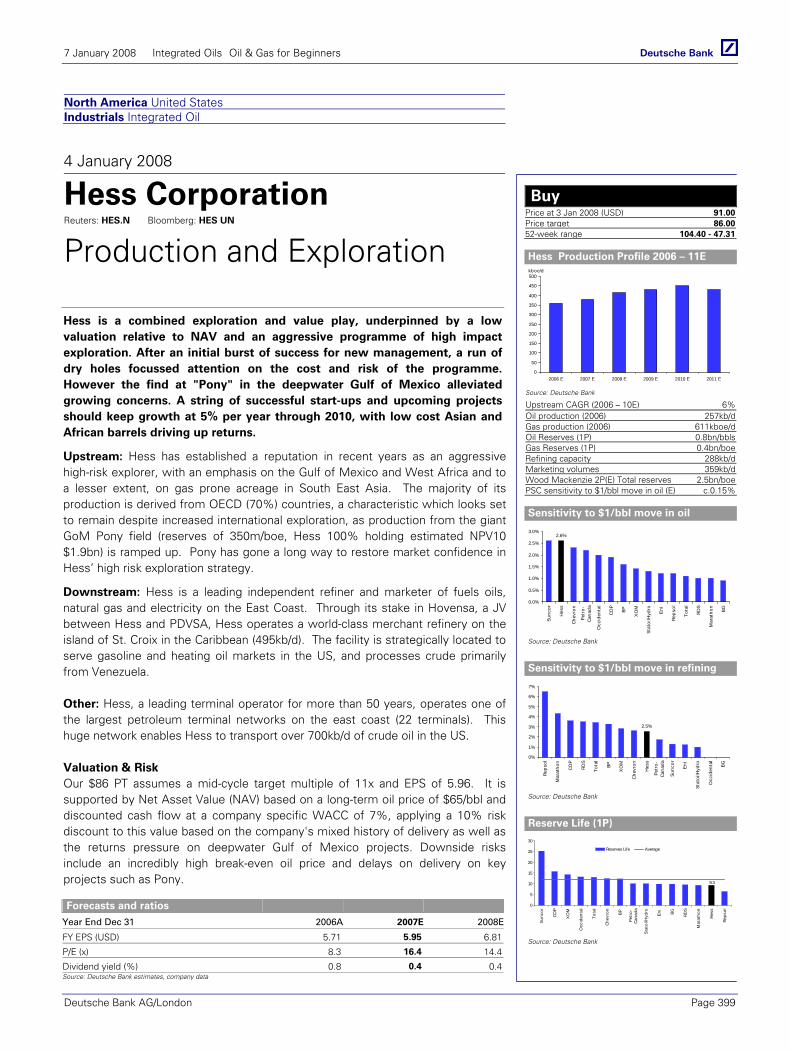
7 January 2008 Integrated Oils Oil & Gas for Beginners
Deutsche Bank AG/London Page 399
North America United States Industrials Integrated Oil
4 January 2008
Hess Corporation Reuters: HES.N Bloomberg: HES UN
Production and Exploration
Hess is a combined exploration and value play, underpinned by a low valuation relative to NAV and an aggressive programme of high impact exploration. After an initial burst of success for new management, a run of dry holes focussed attention on the cost and risk of the programme. However the find at "Pony" in the deepwater Gulf of Mexico alleviated growing concerns. A string of successful start-ups and upcoming projects should keep growth at 5% per year through 2010, with low cost Asian and African barrels driving up returns.
Upstream: Hess has established a reputation in recent years as an aggressive high-risk explorer, with an emphasis on the Gulf of Mexico and West Africa and to a lesser extent, on gas prone acreage in South East Asia. The majority of its production is derived from OECD (70%) countries, a characteristic which looks set to remain despite increased international exploration, as production from the giant GoM Pony field (reserves of 350m/boe, Hess 100% holding estimated NPV10 $1.9bn) is ramped up. Pony has gone a long way to restore market confidence in Hess’ high risk exploration strategy.
Downstream: Hess is a leading independent refiner and marketer of fuels oils, natural gas and electricity on the East Coast. Through its stake in Hovensa, a JV between Hess and PDVSA, Hess operates a world-class merchant refinery on the island of St. Croix in the Caribbean (495kb/d). The facility is strategically located to serve gasoline and heating oil markets in the US, and processes crude primarily from Venezuela.
Other: Hess, a leading terminal operator for more than 50 years, operates one of the largest petroleum terminal networks on the east coast (22 terminals). This huge network enables Hess to transport over 700kb/d of crude oil in the US.
Valuation & Risk Our $86 PT assumes a mid-cycle target multiple of 11x and EPS of 5.96. It is supported by Net Asset Value (NAV) based on a long-term oil price of $65/bbl and discounted cash flow at a company specific WACC of 7%, applying a 10% risk discount to this value based on the company's mixed history of delivery as well as the returns pressure on deepwater Gulf of Mexico projects. Downside risks include an incredibly high break-even oil price and delays on delivery on key projects such as Pony.
Forecasts and ratios
Year End Dec 31 2006A 2007E 2008E
FY EPS (USD) 5.71 5.95 6.81
P/E (x) 8.3 16.4 14.4
Dividend yield (%) 0.8 0.4 0.4Source: Deutsche Bank estimates, company data
Buy Price at 3 Jan 2008 (USD) 91.00Price target 86.0052-week range 104.40 - 47.31
Hess Production Profile 2006 – 11E
0
50
100
150
200
250
300
350
400
450
500
2006 E 2007 E 2008 E 2009 E 2010 E 2011 E
kboe/d
Source: Deutsche Bank
Upstream CAGR (2006 – 10E) 6%Oil production (2006) 257kb/dGas production (2006) 611kboe/dOil Reserves (1P) 0.8bn/bblsGas Reserves (1P) 0.4bn/boeRefining capacity 288kb/dMarketing volumes 359kb/dWood Mackenzie 2P(E) Total reserves 2.5bn/boePSC sensitivity to $1/bbl move in oil (E) c.0.15%
Sensitivity to $1/bbl move in oil
2.6%
0.0%
0.5%
1.0%
1.5%
2.0%
2.5%
3.0%
Sunc
or
Hes
s
Chev
ron
Petr
o-Ca
nada
Occ
iden
tal
COP
BP
XO
M
Stat
oilH
ydro
Eni
Reps
ol
Tota
l
RDS
Mar
atho
n
BG
Source: Deutsche Bank
Sensitivity to $1/bbl move in refining
2.5%
0%
1%
2%
3%
4%
5%
6%
7%
Reps
ol
Mar
atho
n
COP
RDS
Tota
l
BP
XO
M
Chev
ron
Hes
s
Petr
o-Ca
nada
Sunc
or
Eni
Stat
oilH
ydro
Occ
iden
tal
BG
Source: Deutsche Bank
Reserve Life (1P)
9.3
0
5
10
15
20
25
30
Sunc
or
COP
XO
M
Occ
iden
tal
Tota
l
Chev
ron
BP
Petr
o-Ca
nada
Stat
oilH
ydro
Eni
BG RDS
Mar
atho
n
Hes
s
Reps
ol
Reserves Life Average
Source: Deutsche Bank
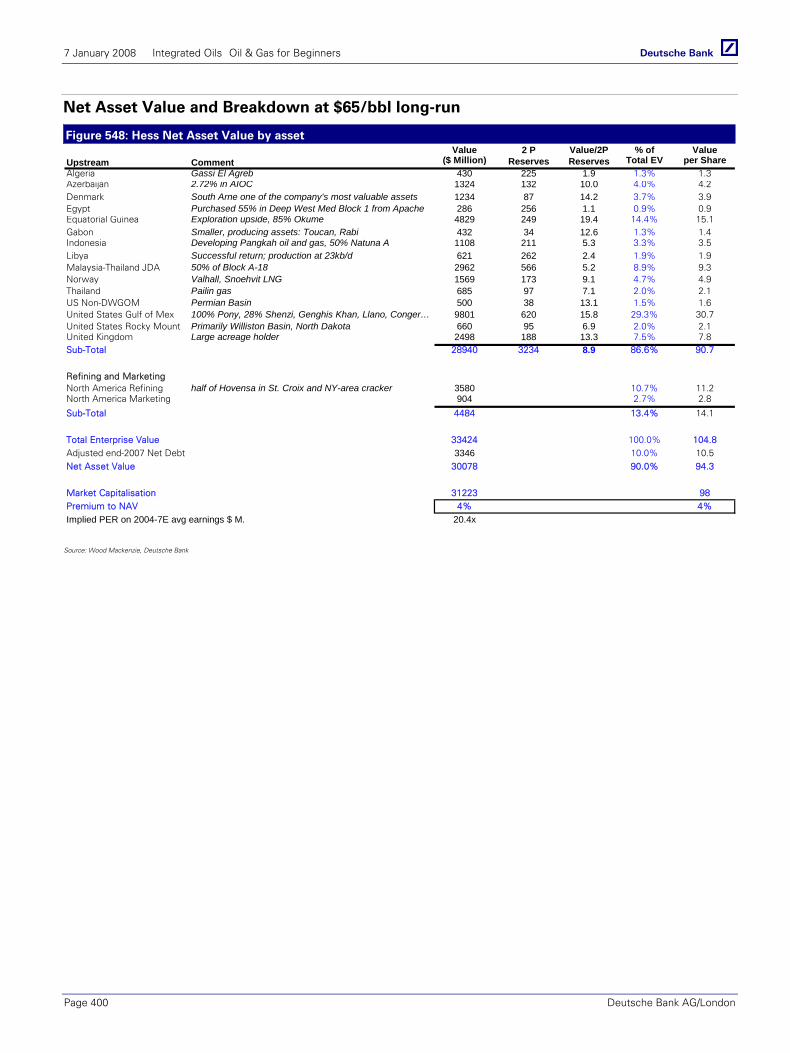
7 January 2008 Integrated Oils Oil & Gas for Beginners
Page 400 Deutsche Bank AG/London
Net Asset Value and Breakdown at $65/bbl long-run
Figure 548: Hess Net Asset Value by asset Value 2 P Value/2P % of Value
($ Million) Reserves Reserves Total EV per ShareAlgeria Gassi El Agreb 430 225 1.9 1.3% 1.3Azerbaijan 2.72% in AIOC 1324 132 10.0 4.0% 4.2Denmark South Arne one of the company's most valuable assets 1234 87 14.2 3.7% 3.9Egypt Purchased 55% in Deep West Med Block 1 from Apache 286 256 1.1 0.9% 0.9Equatorial Guinea Exploration upside, 85% Okume 4829 249 19.4 14.4% 15.1Gabon Smaller, producing assets: Toucan, Rabi 432 34 12.6 1.3% 1.4Indonesia Developing Pangkah oil and gas, 50% Natuna A 1108 211 5.3 3.3% 3.5Libya Successful return; production at 23kb/d 621 262 2.4 1.9% 1.9Malaysia-Thailand JDA 50% of Block A-18 2962 566 5.2 8.9% 9.3Norway Valhall, Snoehvit LNG 1569 173 9.1 4.7% 4.9Thailand Pailin gas 685 97 7.1 2.0% 2.1US Non-DWGOM Permian Basin 500 38 13.1 1.5% 1.6United States Gulf of Mex 100% Pony, 28% Shenzi, Genghis Khan, Llano, Conger… 9801 620 15.8 29.3% 30.7United States Rocky Mount Primarily Williston Basin, North Dakota 660 95 6.9 2.0% 2.1United Kingdom Large acreage holder 2498 188 13.3 7.5% 7.8Sub-Total 28940 3234 8.9 86.6% 90.7
Refining and MarketingNorth America Refining half of Hovensa in St. Croix and NY-area cracker 3580 10.7% 11.2North America Marketing 904 2.7% 2.8
Sub-Total 4484 13.4% 14.1
Total Enterprise Value 33424 100.0% 104.8Adjusted end-2007 Net Debt 3346 10.0% 10.5Net Asset Value 30078 90.0% 94.3
Market Capitalisation 31223 98Premium to NAV 4% 4%Implied PER on 2004-7E avg earnings $ M. 20.4x
Upstream Comment
Source: Wood Mackenzie, Deutsche Bank
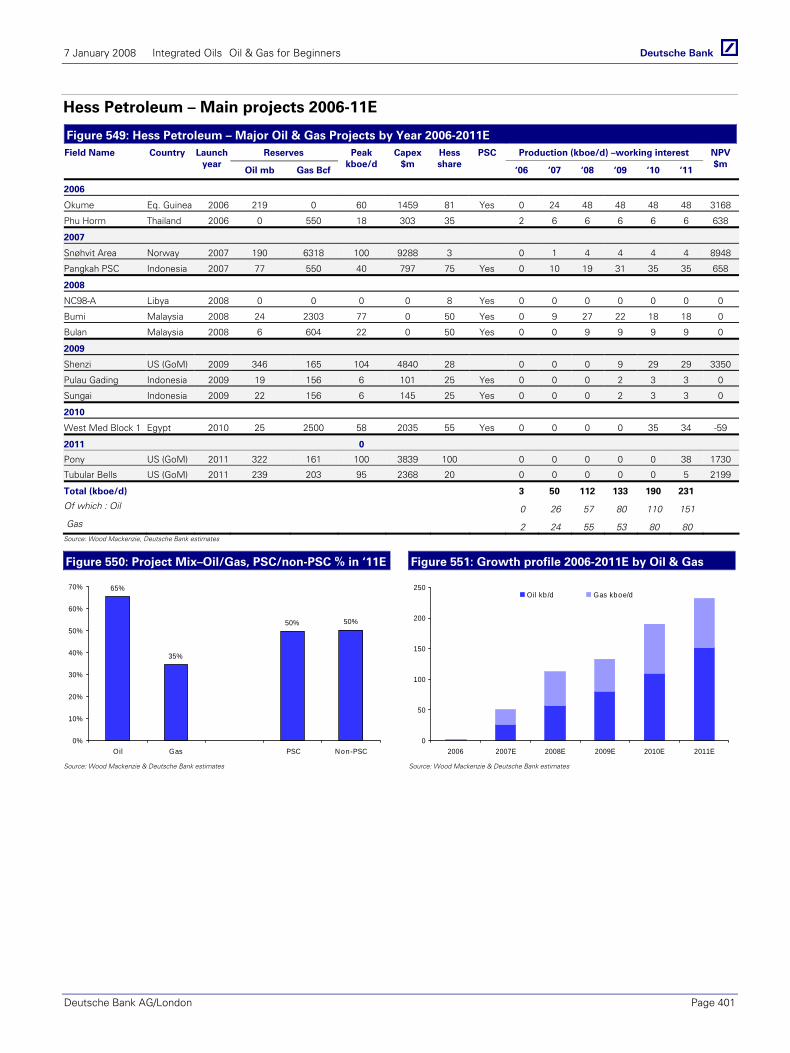
7 January 2008 Integrated Oils Oil & Gas for Beginners
Deutsche Bank AG/London Page 401
Hess Petroleum – Main projects 2006-11E
Figure 549: Hess Petroleum – Major Oil & Gas Projects by Year 2006-2011E Reserves Production (kboe/d) –working interest Field Name Country Launch
year Oil mb Gas Bcf
Peak kboe/d
Capex$m
Hess share
PSC
‘06 ‘07 ‘08 ‘09 ‘10 ‘11
NPV$m
2006
Okume Eq. Guinea 2006 219 0 60 1459 81 Yes 0 24 48 48 48 48 3168
Phu Horm Thailand 2006 0 550 18 303 35 2 6 6 6 6 6 638
2007
Snøhvit Area Norway 2007 190 6318 100 9288 3 0 1 4 4 4 4 8948
Pangkah PSC Indonesia 2007 77 550 40 797 75 Yes 0 10 19 31 35 35 658
2008
NC98-A Libya 2008 0 0 0 0 8 Yes 0 0 0 0 0 0 0
Bumi Malaysia 2008 24 2303 77 0 50 Yes 0 9 27 22 18 18 0
Bulan Malaysia 2008 6 604 22 0 50 Yes 0 0 9 9 9 9 0
2009
Shenzi US (GoM) 2009 346 165 104 4840 28 0 0 0 9 29 29 3350
Pulau Gading Indonesia 2009 19 156 6 101 25 Yes 0 0 0 2 3 3 0
Sungai Indonesia 2009 22 156 6 145 25 Yes 0 0 0 2 3 3 0
2010
West Med Block 1 Egypt 2010 25 2500 58 2035 55 Yes 0 0 0 0 35 34 -59
2011 0
Pony US (GoM) 2011 322 161 100 3839 100 0 0 0 0 0 38 1730
Tubular Bells US (GoM) 2011 239 203 95 2368 20 0 0 0 0 0 5 2199
Total (kboe/d) 3 50 112 133 190 231
Of which : Oil 0 26 57 80 110 151
Gas 2 24 55 53 80 80
Source: Wood Mackenzie, Deutsche Bank estimates
Figure 550: Project Mix–Oil/Gas, PSC/non-PSC % in ‘11E Figure 551: Growth profile 2006-2011E by Oil & Gas
65%
35%
50% 50%
0%
10%
20%
30%
40%
50%
60%
70%
Oil Gas PSC N on-PSC
0
50
100
150
200
250
2006 2007E 2008E 2009E 2010E 2011E
Oil kb /d Gas kboe/d
Source: Wood Mackenzie & Deutsche Bank estimates Source: Wood Mackenzie & Deutsche Bank estimates

7 January 2008 Integrated Oils Oil & Gas for Beginners
Page 402 Deutsche Bank AG/London
Figure 552: 2006 clean net income USD1,809m Figure 553: Trends in E&P Production
E& P, 81%
R& M, 19%
3%18%
60%
18%
9%
34%
47%
10%
LN G Deepw ater Convent ional o il Convent ional gas
2011 Product ion 2007 Product ion
Source: Deutsche Bank Source: Deutsche Bank
Figure 554: PSC exposure 07E-11E – on the increase Figure 555: OPEC production 16% of total in 2007E
71%
29%
55%
45%
N on-PSC PSC
2011E Product ion 2007E Product ion
Algeria, 50%
Indonesia, 3%
Libya, 48%
Source: Deutsche Bank Source: Deutsche Bank
Figure 556: Hess refining CDU 288kb/d Figure 557: Hess 2006 marketing by region
Hovensa79%
Port Read ing21%
U S, 18%
Europe, 45%
RoW, 24%
Asia, 14%
Source: Deutsche Bank Source: Deutsche Bank

7 January 2008 Integrated Oils Oil & Gas for Beginners
Deutsche Bank AG/London Page 403
Glossary Abandonment to cease work on a well which is non-productive/uneconomic
Acidisation a process whereby acid is pumped at high pressure into a reservoir in an attempt to dissolve some of the rock and improve wellbore flow characteristics. Often used in conjunction with fracturing.
Acreage the area over which a company has hydrocarbon exploration interests
Alkylation refers to the alkylation of isobutane with olefins in the presence of a strong acid catalyst which has the result of increasing the octane level and therefore the overall quality of the gasoline
Alteration uses process such as isomerisation and catalytic reforming to rearrange the chemical structure of hydrocarbons.
Annulus the space between the drill string and the well wall, or between casing strings, or between the casing and the production tubing
Anoxic an environment in which there is little or no oxygen. These are the conditions needed to organic matter build-up
Anti-clines potential traps formed when strata deforms into teh shape of a dome-like fold
API gravity the American Petroleum Institute gravity is a measure of how heavy or light a petroleum liquid is compared to water. It is measured in degrees and the higher the API, the lighter the crude
Appraisal well well drill after the field has been discovered to appraise its content. Used particularly offshore to establish the optimum platform location.
Aromatic a group of unsaturated cyclic hydrocarbons containing one or more structural carbon rings. They are highly reactive and chemically versatile.
Associated gas natural gas associated with accumulation of oil. May be dissolved in the oil or may form a cap of free gas above the oil
Back off to unscrew one piece of drill pipe from another. Also used to describe the process of using wireline conveyed small explosives to help unscrew a specific joint of pipe deep underground when a pipe is stuck and all other attempts to free it have failed
Back-Reaming used during drilling to improve the condition of the hole. The drill pipe is run up and down over problem zones repeatedly whilst rotating the bit and circulating mud.
Backwardation term used on the futures market to describe a downward sloping forward curve. This indicates that the market expects lower prices in the future i.e. demand is expected to be lower than supply in the future
Barge master the supervisor of crane drivers and roustabouts on a rig
Barrel the most commonly used unit of measurement for petroleum and its products (7.33 barrels = 1 ton or 6.29 barrels = 1 cubic metro). Represents 42 gallons of oil.
Bed the geological term defining a stratum of any thickness and of uniform homogenous texture
Benzene a liquid that is flammable and explosive, used to make ethylbenzene, phenol, cyclohexane (for nylon) and detergents
Biodiesel a fuel made from biological sources, such as vegetable or animal fats, blended with distillates such as diesel
Bioethanal alcohol based fuel made through the fermentation of crops such as barley, wheat, corn or sugar cane
Biofuels fuels made from or processed from biomass e.g. bioethanol or biodiesel
Biomass vegetation from which energy can be extracted e.g. sugar cane, corn or soybean
Bit a sophisticated cutting tool used in drilling. There are two main types of bit used in drilling oil/gas wells: rock bits and diamond bits.
Bitumen naturally occurring near-solid hydrocarbon which is a mixture of organic liquids. Bitumen also results from the distillation process
Block an acreage sub-division. Although varies from country to country, generally tends to be approximately 10 x 20 kms.
Blow down condensate and gas are produced simultaneously from the outset of production
Blow out occurs during drilling when reservoir pressure exceeds the ability of the well-head valves (BOP) to control it, resulting in uncontrolled ejection of wellbore fluid from the top of the well
Blow-out Preventor (BOP)
high pressure wellhead valve which is designed to seal the well quickly in the event of an uncontrolled flow of hydrocarbons
Borehole the hole as drilled by the drill bit
Bottom-hole Assembly (BHA)
lower part of drill string from the bit to the drill pipe. Can consist of drill collars, stabilisers mud motors and a bit amongst others. Provides weight for the bit to cut rock.

7 January 2008 Integrated Oils Oil & Gas for Beginners
Page 404 Deutsche Bank AG/London
Bottoms up circulation of drilling fluid in a well, so that mud from the bottom of the drill pipe is pumped back to surface
Breccia rock composed of angular fragments of rocks or minerals in a matrix
Butadiene a colourless gas at room temperature which is a by-product of the cracking process. Main use is as an intermediate in the manufacture of various forms of rubber, latex and plastics
Butane a highly flammable, colourless and easily liquefied gas (see LPG). Butane gas is sold as bottled gas for fuel for cooking and it is also used as a feedstock for the production of base petrochemicals in steam cracking
Buy-back contracts only used in Iran and is essentially a contract for services. The contractor is the designated operator for design, construction, commissioning and start up of all facilities and this responsibility passes to NIOC immediately after start up. The foreign partner provides all the capital for the project and is compensated for its costs and awarded an agreed level of profit.
Call on OPEC the level of oil demand that cannot be met by non-OPEC producers
Cap rock impermeable rock overlaying a reservoir
Capex Uplift the % increase granted by the state on capex spend for recovery against costs. The allocation of uplift pays heed to the time that it might take to recover capex invested in a project given restrictions on cost recovery (as a % of revenues) and the time taken from breaking ground to first oil in a development project.
Carbonate rock a sedimentary rock which occasionally forms petroleum reserves. It is primarily composed of limestone or chalk or dolomite
Cased hole hole in which casing has been set
Casing the steel lining that supports the sides of the well and prevents the flow of fluid both from and into the well bore
Casing shoe a reinforced section of casing placed on the bottom of the casing string that protects against damage
Catalyst a substance that enables a chemical reaction to take place at a faster rate or under different condition that otherwise possible
Catalytic hydro-treating hydrogenation process used to remove c.90% of contaminants such as nitrogen, sulphur, oxygen and metals from crude oil fractions.
Catwalk the working area in front of the V-door, upon which casing is usually placed before being pulled up to the drill floor
CDU crude distillation unit. The basic building block of a refinery, where atmospheric distillation of crude occurs.
Cellar the pit dug in the ground beneath the drill floor for land drilling, often lined with cement for larger wells
Cellulosic bioethanol made through the fermentation of cellulosic feedstock which encompasses almost any kind of organic feedstock. However, requires second generation conversion technologies (e.g. enzymatic breakdown), hence not currently economically viable
Cementing the filling of the space between the casing and the borehole wall with cement. This ensures the casing remain stationary and also prevents any leakage
Cetane number a measure of diesels tendency to self ignite under pressure. Higher cetane diesels self ignite quicker, which gives more time for the fuel to fully combust and is hence more desirable than lower cetane diesel.
Christmas Tree an assembly of valves, spools and fittings for an oil well, named for its resemblance to a decorated tree. Its function is to prevent the release of oil/gas from an oil well and to direct and control the flow of formation fluids from the well.
Clastic rocks sedimentary rocks composed of fragments of pre-existing rocks
Coal Bed Methane (CBM) methane found in coal seams which is retained on the surface of the coal within the micropore structure. It is generated either from a biological process as a result of microbial action or from a thermal process as a result of increasing heat with depth of the coal.
Coker an oil refinery processing unit that converts the residual oil into lighter hydrocarbon gases, naphtha, light and heavy gas oils and petroleum coke.
Cold filter plugging point (CFPP)
the temperature at which a standard fuel filter will clog
Commodities and Futures Trading Commission (CFTC)
an independent US agency that regulates commodity futures and options markets in the US. Its aim is to protect market users from fraud, manipulation and abusive practices and to encourage competition and efficiency in the futures markets.
Complexity where a refiner invests in in a wide range of processes to upgrade distillate
Condensate hydrocarbons which are gaseous under reservoir condition but which become liquid when temperature or pressure is reduced.
Contango term used on the futures market to describe an upward sloping forward curve. This indicates that the market expects higher prices in the future i.e. demand is expected to be higher than supply in the future
7 January 2008 Integrated Oils Oil & Gas for Beginners
Deutsche Bank AG/London Page 405
Continental crust dominated by granite rocks (rich in quartz and feldspar minerals). Relatively buoyant comparative to oceanic crust.
Contingent Resources those quantites of hydrocarbons which are estimated to be potentially recoverable from known accumulation, but which are not yet commercially recoverable
Conversion process which alters the size and/or structure of hydrocarbons in other to further upgrade the crude output in order to give a higher yield of more valuable products such as gasoline. See Cracking, unification and alteration
Coring drilling with a doughnut-shaped bit that allows a cylinder-shaped core of undrilled rock to rise up inside the pipe above the bit. The core is then removed with the drill string is tripped out of the hole
Cost oil share of barrels produced that is used to pay back the contractor for its capital investment in the project and/or the operating expenses incurred in the year. Typically the resource holder will allow cost oil to be recovered from c.50-60% of project revenues. Once the upfront capital costs have been recovered (generally high in the first years of a project coming on-stream), anything left over is termed profit oil. Capital or operating costs that remain un-recovered in any one year are typically carried forwards for recovery in subsequent years.
Cracking break down heavier hydrocarbon molecules into lighter products using heat (thermal) or by the addition of catalysts (catalytic)
Creaming curve a plot of the number of discoveries against the number of wells in a basin in order to estimate the quantity of ultimate basin reserves.
Crude oil a mixture of liquid hydrocarbons of different molecular weight, containing different levels of impurities such as sulphur, water
Cyclic Steam Stimulation (CSS)
consists of three stages: injection, soaking and production. Steam is first injected into a well for a certain amount of time to heat the bitumen in the surrounding reservoir to a temperature at which it flows. This persists for many weeks with the steam ‘soaking’ the subsoil sands before the process is halted. At this time the wells are turned into producers, at first by natural flow (since the steam injection will have increased the reservoir pressure) and then by artificial lift. Also known as Huff and Puff
Deepwater refers to oilfield exploration and development in water depths greater than c.1000m (note this is an arbitrary figure chosen by Deutsche Bank)
Delivery ex-ship (DES) contracts
DES cargoes are generally written with a specific destination in mind and as such are less flexible than FOB contracts. While the destination can be changed by mutual agreement, this is likely to prove difficult to arrange given the shipment will have to fit in with the suppliers pre-arranged shipping schedule
Depositional Environment the conditions under which a series of rock strata were laid down. Depositional environments can be divided into six subgroups: marine, lagoonal, deltaic (laid down by a river at its delta), alluvial/fluvial (laid down by a river), lacustrine (laid down under a lake) and aeolian (laid down by wind)
Depreciation, depletion and amortisation (DD&A)
the release of capitalised hydrocarbon assets to the income statement over their economic useful lives
Derrick the tower-like structure that houses most of the drilling controls
Derrick man the labourer that works at the top of the derrick and helps guide drill pipe to its correct position during drill pipe makeup. Is sometimes replaced by electro-mechanical systems on more modern rigs.
Desalting process used to remove/separate contaminants such as inorganic salts found in crude oil. Also referred to as dehydration
Development costs costs of constructing and installing the facilities to produce and transport the oil and gas
Dewpoint the pressure at which liquid comes out of solution in a gas condensate
Diagensis any chemical, physical or biological change undergone by a sediment after its initial deposition which results in changes to the rocks original mineralogy and texture.
Directional drilling the art of guiding the drill bit to a target that is not vertically below the drill floor. Downhole mud motors, special stabilisers, MWD and LWD sensors and telemetry (communications system) can all be used to increase accuracy.
Distillation the process via which the various components of crude are separated into groups of hydrocarbon compounds on the basis of the difference in relative boiling points. Distillation can be atmospheric or vacuum. Also known as topping or skimming
Distillation margins the gross profit from a CDU - equivalent to distilled product price minus crude cost
Doghouse a metal shack used for storing equipment and working in
Donkey dick the rubber guide placed beneath wireline logging tools that help them get past well bore obstructions when being lowered to total depth
Downstream includes oil refineries, petrochemical plants, petroleum product distribution, retail outlets and natural gas distribution companies.
Draw works the winch that pulls on the steel cable that in turn raises and lowers the travelling block in the derrick

7 January 2008 Integrated Oils Oil & Gas for Beginners
Page 406 Deutsche Bank AG/London
Drawworks the large rotating drum that spools the drilling line in and out to raise the load on a drilling rig
Drill collar heavyweight drillpipe that goes on the bottom of the drill string to provide weight-on-bit and stability
Drill pipe pipe that connects drillfloor torque to the drill collars and ultimately the drill bit. Drill pipe is hollow to allow mud to circulate through it.
Drill string (drill pipe) comprises lengths of drill pipe and drill collars that connect the drill bit with the drilling rig. The drill string is used to rotate the drill bit and to act as a conduit to circulate drilling mud to the cutting face
Driller the person responsible for drilling a decent hole by constantly monitoring and adjusting drill pipe torque and weight-on-bit
Drilling fluid see 'mud'
Drilling Rig any kind of drilling unit (i.e. land, submersible, semi-submersible, jack-up or drill ship). Also incorporates the derrick and its associated machinery
Dry gas natural gas composed mainly of methane with only minor amounts of ethane, propane and butane and little or no heavier hydrocarbons in the gasoline range
Dry hole see duster
Duster a well that fails to find any commercial oil or gas
Enhanced Oil Recovery (EOR)
Increases hydrocarbon recovery by maximising displacement efficiency in a cost efficient manner. Methods include thermal EOR, flooding the reservoir with various substances or Microbial EOR.
Entitlement share the number of barrels of profit oil which the contractor is entitled to from the project in any one year. This will typically represent the contractor’s share of cost oil and its equity entitlement to profit oil. Depending on the nature of the PSC terms, the entitlement share will alter over the life of the project as costs are recovered and the oil available for distribution as profit alters following the attainment of trigger points. As an illustration, if a company has a 40% equity interest in a project producing 100kb/d, the profits from which are distributed 50% government and 50% contractor after 10kb/d has been allocated for cost recovery, its share of entitlement barrels would be 22kb/d (i.e. 40% of the 10kb/d of cost oil and 40% of the 45kb/d available to the contractors as profit oil). Note this compares with the 40kb/d in which the contractor has a ‘working interest’.
Ethane part of the methane series, this forms one of the main components of naturally occurring gas
Ethylene a colourless gas with a slightly sweet odour. It turns from liquid into gas at -155˚F and in general has triple bonds between the two carbon molecules. It is flammable and explosive and is use to produce petrochemical products
Facies a distinctive rock that forms under certain conditions of sedimentation, reflecting a particular process or environment.
Farm-in a term used to describe when an oil company buys a portion of the acreage in a block from another company, usually in return for cash and for taking on a portion of the selling company's work commitments.
Fault a fracture along which the rocks on one side are displaced relative to those on the other
Fault trap these are created when a reservoir layer such as sandstone is faulted and juxtaposed against an impervious rock which thus prevents the migration of hydrocarbons leading to oil or gas accumulations against the fault
Field a geographical area under which an oil or gas reservoir lies
Final Investment Decision (FID)
the point at which sufficient field data has been obtained in order to determine whether there are sufficient proven reserves which are economically recoverable at a set oil price. In general companies only book reserves once a positive FID has been made.
Finding costs the costs of exploration and appraisal programmes i.e. how much did its cost the company to find each barrel of oil actually added to reserves in the year
Fischer-Tropsch process
a catalytic chemical reaction whereby single carbon molecules are added together to create carbon chains, the lengths of which can to some extent be determined by altering the conditions through the conversion process
Fishing a procedure whereby drillpipe is used to retrieve items lost in the hole - e.g. a dropped spanner, clamp, wirelineinstruments or even other drillpipe. It can consume great amounts of time, can be dangerous and is universally hated (except by fishing consultants)
Flare a vent for burning off petroleum products which cannot be produced or re-injected into the reservoir. Flaring is becoming increasingly prohibited in most countries due to the environmental impact it has
Floater floating production units including floating platforms and FPSO’s.
Flow rate the rate at which hydrocarbons flow up through the oil well. The rate is expressed in terms of bbls/day for oil and SCF/day for gas
FPSO Floating Production, Storage and Offloading system comprising a large tanker equipped with a high-capacity production facility. This system, moored at the bow to maintain a geo-stationary position, is effectively a temporarily fixed platform that uses risers to connect the sub-sea wellheads to the on-board processing, storage and offloading systems.
Fraction that part of petroleum separated off from other parts at a particular boiling range

7 January 2008 Integrated Oils Oil & Gas for Beginners
Deutsche Bank AG/London Page 407
Fracturing an EOR procedure to improve reservoir effective permeability. Fluid (sometimes acid) and propellant are pumped at high pressure into the reservoir. The reservoir rock fractures and the propellant wedges inside the fractures to keep them open once pressure is removed.
Free-on-board (FOB) contracts
LNG contracts where the shipping is organised by the buyer and the contract price paid will exclude the costs of shipping. FOB contracts have no destination clause hence no restrictions on where the cargo may be delivered i.e. the buyer can ship to the market where it will obtain the best price
Fuel Oil liquid fuel used on industry for heat or power generation
Gas injection processing by which gas is re-injected into the reservoir either to conserve the gas for extraction at later date or to maintain the pressure within the reservoir (known as gas lift)
Gasoil liquid used for motor diesel fuel and for home heating oil
Gas-oil contact the depth in a reservoir where gas sits on top of oil
Gas-oil ratio the volume of gas at atmospheric pressure and temperature produced per unit volume of oil produced
Gasoline light petroleum product; also known as petrol
Gas-to-Liquids (GTL) using highly energy and capital intensive technology (see the Fischer Tropsch process) natural gas is converted into higher value, high purity, synthetic liquids, namely diesel, naphtha and lubricant base oils which can then be exported to consuming markets
Geophone an instrument that detects seismic waves passing through the earth's crust
GIIP gas initially in place in a reservoir refers to the total volumes of gas contained in a reservoir
Gross Refining margins
Henry Hub an interconnection point on the natural gas pipeline in Louisiana where gas is typically delivered. It is the pricing point for natural gas futures contracts in the US.
Hydrocarbon an organic compound consisting only of carbon and hydrogen. The majority of hydrocarbons found naturally occur in crude oil, where decomposed organic matter provides an abundance of carbon and hydrogen
Hydrocarbon saturation the percentage of the voids within a rock which is filled with oil/gas versus water
Hydrosulphurisation used to clean products or inputs by reducing the sulphur content by using hydrogen under pressure over a catalyst. Also referred to as hydro-treating.
ICE Intercontinental Exchange - see NYMEX
Igneous rocks deliver both sand (which is the building block for most reservoirs) and clay (which forms seals)
Injection well a well used for pumping water or gas into the reservoir
In-situ extraction when mining the oil sands is no longer economic (generally at depths greater than 75m) the subsoil is heated to enable the bitumen to flow. There are two principal methods of in-situ extraction: Steam assisted gravity and drainage and Cyclic Steam Stimulation
International Oil Company (IOC)
normally refers to a large, western, listed, integrated oil company e.g. Exxon, Shell, Chevron, Total
Iron roughneck an electro-mechanical device that spins two pieces of pipe together to a specified torque - safer and faster than using roughnecks, chain and tongs
Isomerisation the transformation of a molecule into a different isomer
Jacket the steel legs of an offshore platform - the legs are usually installed separately, and then the topside modules (accommodation, drilling etc) are installed
Jack-up mobile self-lifting unit comprising a hull and retractable legs, used for offshore drilling operations
Kelly a hexagonal piece of pipe that screws into the top of the drill string, and passes through the kelly bushing. Torque is passed from the rotary table to the kelly bushing, and so to the kelly and on to the drill pipe and bit. Not used if drilling is being undertaken with a top drive.
Kelly bushing an adaptor that sits on top of the rotary table, so allowing the transmission of torque from the rotary table to the kelly, and hence drill pipe. Not used if drilling is being undertaken with a top drive.
Kerogen mixture of organic chemical compounds that make up a portion of the organic matter in sedimentary rocks. When heated to the right temperature in the earth's crust, some types of kerogen release hydrocarbons
Kerosene liquid fuel used for jet engines, tractors or as a starting material for making other products
Kick a 'kick' occurs during the drilling process when reservoir pressure exceeds borehole fluid pressure and so forces mud to be displaced out of the top of the well. An uncontrolled kick can lead to a blow out.
Knocking occurs when gasoline prematurely combusts in an engine without the spark plus triggering the ignition - the process of which produces an audible 'knocking' sound
Liquefaction plant plant which process natural gas to remove any impurities such as water or carbon dioxide before cooling the gas via a series of compressors i.e. it is the equivalent of a large refrigerator. Also referred to as the LNG train

7 January 2008 Integrated Oils Oil & Gas for Beginners
Page 408 Deutsche Bank AG/London
Liquefied Natural Gas (LNG)
naturally occurring gas which has been cooled to a temperature of -162˚C at atmospheric pressure in order to condense the gas into a liquid which can be more easily stored, handled and transported.
Liquefied Petroleum Gas (LPG)
propane and butanes liquefied under relatively low pressure and ambient temperatures. LPG is a gaseous fuel which is stored under pressures at refineries and sold in pressurised cylinders as bottled gas for domestic use
Logging whilst drilling (LWD)
similar to MWD but provides more detailed measurement and can replicate wireline logging measurements.
Lubricating oil liquid used to make motor oil, grease and other lubricants
Marketing the wholesales or retail sale of fuel products
Measured depth (MD) the actual length of the borehole, irrespective of how deep it is vertically (see true vertical depth)
Measurement whilst drilling (MWD)
uses sensors placed near the drillbit to acquire basic information such as mud pressure, temperature and torque; all of which aid in more efficient drilling and weight on the bit
Merchant portfolio whereby a company contracts to purchase a product under one contract and then sells the product to dedicated end users either through back-to-back contracts or by selling directly on the spot markets. Used in this document to describe BG's LNG portfolio
Metamorphic rocks result of the transformation of a pre-existing rock type which has been subjected to great heat and pressure causing profound physical and/or chemical change
Middle Distillate refers to kerosene and all gasoils
Midstream the midstream sector processes, stores and transports commodities such as crude oil, natural gas and syncrudes
Mining where traditional mining techniques such as truck and shovel are used to extract the oil sands from the reservoir
Monkey board the platform near the top of the derrick where the derrickman works
Mousehole an opening to a tube beneath the drill floor usually used to store the kelly when it is not being used
Mud a mixture base chemicals and additives used to carry cuttings from the drill bit, lubricate the drill bit and to provide pressure that in theory prevents any oil or gas from blowing out
Mud logging equipment which continuously analyses and records and gas present in the mud returns from the well bore
Mud man the engineer responsible for ensuring the mud is in optimum condition to drill the well successfully
Multi azimuth type of seismic survey which gives a better pictures of the target subsurface geology by using more than one energy source location.
Multi-client survey a seismic survey run by a seismic company on its own account, to provide speculative data that can be resold many times over to future clients, IF they happen to be interested in the acreage the seismic company has chosen to survey
Naphtha light, easily vaporised clear liquid used for further processing into petrochemicals
Naphtha the gasoline fractions arising from the straight-run distillation of crude. Naphtha is used as a feedstock for catalytic reforming and for chemicals manufacture
National Oil Company (NOC) a state owned or majority state owned oil company, often established as a result of large domestic reserves.
Natural Gas Liquid (NGL) liquid hydrocarbons found in association with natural gas
Neutral Zone the territory between Saudi Arabia and Kuwait where production is shared 50/50 and is included in each countries respective OPEC quotas
Nipple up the process of assembling and pressure testing the BOP
NYMEX New York Merchantile exchange - along with ICE these are the two main exchanges where oil and gas and associated products are trade
Oceanic Crust underlies the ocean and is dominated by basaltic rocks (rich in iron and magnesium-based minerals)
Octane the level of gasoline's resistance to pre-ignition. The higher the octane the better high compression engines run. Where gasoline has a low octane this can cause knocking (see knocking)
OIIP/STOIIP oil initially in place refers to the total volume of oil contained in a reservoir i.e. will be higher than the estimated recoverable reserves of oil in the same reservoir. Stock tank oil initially in place also refers to the in-place oil volume but is measured at the Earths surface temperature and pressure
Oil sands heavy and thick deposits of bitumen-coated sand
Oil window range of temperatures in which oil matures. Generally said to begin at c.120˚F (50˚C), peak at 190˚F (90˚C) and end at 350˚F (175˚C)
Oil-water contact the depth in a reservoir where oil sits on top of water
Olefin a class of unsaturated hydrocarbons with the general formula of one carbon for every two hydrogens. Olefins are the 'ene' form of paraffins i.e. ethylene is the olefin of the paraffin ethane.
7 January 2008 Integrated Oils Oil & Gas for Beginners
Deutsche Bank AG/London Page 409
OPEC Organisation of Petroleum Exporting Countries
OPEC basket mix of 12 different blends produced by OPEC member states which is used to determine the price band that OPEC wishes to see the world oil markets
Open hole drilled hole in which casing has not been set
Paraxylene (PX) a colourless liquid which is the most commercially important xylene. Main use of paraxylene is as a raw material for polyester
Peak oil the hypothetical point at which oil output will reach a maximum, irretrievably declining thereafter
Perforated zone see perforations
Perforations holes that are blasted through casing by explosive shaped charges conveyed either by wireline of drillpipe. The holes provide a path for reservoir fluids to enter the casing, and then tubing to be produced at surface.
Permeability the ease with which a fluid can pass though the pore spaces of a rock
Petrochemical any organic chemical for which petroleum or natural gas is the ultimate raw ingredient
Petroleum Administration for Defence Districts (PADDs)
the US is divided into five PADDs which were created during WW II to help organise the distribution of petroleum products
Petroleum gas gaseous fossil fuel consisting primarily of methane but also contains significant volumes of ethane, propane and butane.
Platform an offshore structure that is permanently fixed to the sea bed.
Play a hydrocarbon play is when a set of circumstance combine to create the necessary conditions for the accumulation of oil and/or gas. A single play may contain a number of discoveries and prospects
Plugged where a bore hole is sealed or plugged using cement
Polyethylene (PE) a solid, wax-like material make by polymerising ethylene which is the most widely used plastic. Application include LLDPE/LDPE which are used in packaging film, toys, electrical insulation, wire and cable coating and HDPE which is used in moulded products, fibres, gasoline and man-made paper
Polymerisation process of bonding monomers (single molecules) together through a variety of reaction mechanisms to form longer chains named polymers. This happens in the presence of pressure and a catalyst. The are five commonly used processes: Bulk/Gas-Phase Polymerisation, Colution Polymerisation, Slurry Polymerisation, Suspension Polymerisation and Emulsion Polymerisation
Polypropane (PP) a thermoplastic resin that is translucent, readily coloured and maintains its strength after repeated flexing. Primary uses are food wrapping, yarn, fibre and moulded parts
Porosity The fraction of a rocks' bulk volumes accounts for by void space between its constituent grains
Primary Recovery Recovery of oil/gas from a reservoir purely by using the natural pressure in the reservoir to force the oil or gas out
Product cracks the gross margin being gained on different crude products. Primarily used to give a view on the value of conversion
Product slate the proportion of refined products obtained by refining one barrel of crude
Production quotas oil output that each OPEC member country agrees to produce up to, assuming no other restrictions in place and assuming the country remains in compliance
Profit Oil the oil available for distribution to the partners in the project in line with their equity (or working interest) share. Profit oil is invariably that available after costs (capital and annual operating) have been recovered.
Profit Sharing Contract (PSC)
a contract between a resource holder and (generally) an oil company where the oil produced is shared between the resource holder and contractor (oil company) in a pre-arranged manner.
Progressive tax system government share of a projects NPV rises at times of increasing prices. PSC's increasingly are examples of a progressive tax system
Propane normally a gas, but compressible to a liquid that is transportable (see LPG). It is commonly used as fuel for engines and home heating systems
Propellant tiny particles used during fracturing to ensure that induced fractures remain open once pressure is removed
Propylene a colourless gas that is flammable and explosive which is produced mainly as a by-product of ethylene; used extensively as an intermediate product in the chemical chain e.g. in the production of fibres, textiles, plastics and paints among other
Proved (1P) reserves there is 'reasonable certainty' (90% confidence of P90) the reserves are commercially recoverable from known reservoirs under existing economic and operating conditions. Proven developed reserves are reserves that can be recovered from existing wells with existing infrastructure and operating methods. Proven undeveloped reserves require development.

7 January 2008 Integrated Oils Oil & Gas for Beginners
Page 410 Deutsche Bank AG/London
Proved plus Probable (2P) reserves
probable reserves are unproven, but they are more likely than not (at least a 50% probability or P50) to be recoverable
Proved, Probable plus Possible (3P) reserves
possible reserves are unproven and are less likely to be recoverable (only 10% confidence or P10) than probable reserves
PSC - Fixed share a PSC which stipulates at the onset the division or post tax or pre-tax profits from the project between the state and the contractor. In effect, these contracts have economics that are similar to those of a tax and royalty regime. Indonesia represents a good example of a fixed share PSC.
PSC - IRR a PSC whose trigger points are determined by the internal rate of return achieved from the date of onset. As the returns from a project move beyond pre-defined levels, so the share of profit oil will alter in favour of the host nation. Common examples include those in Angola, Azerbaijan, Kazakhstan and Russia amongst others.
PSC - Production a PSC whose trigger points are determined by the achievement of particular levels of production. In some production contracts the production element refers to the cumulative number of barrels produced. In others, the level of daily production achieved. In either case, as the trigger levels are attained, the share of profit oil between the state and the contractor alters. Common examples include those in the Nigerian Deepwater, Qatar, Malaysia, India and many others.
PSC - R-Factor a PSC whose trigger points are determined by the ratio of total revenues to total costs. Typically the contract will stipulate that as revenues meet certain multiples of costs so the share of profit oil between the state and the contractor alters. Common examples include Algeria, Qatar (often mixed with production) and the Yemen.
Purified Terephthalic Acid (PTA)
a white, water-insoluble powder obtained from the oxidation of paraxylene with acetic acid. It is used primarily in the manufacture of polyester
Rat hole hole in the drill floor used to store the kelly and kelly bushing when not in use
Recovery factor the ratio of recoverable oil/gas reserves to the estimated oil/gas in place in the reservoir
Refining the conversion of crude oil into finished products required by the market in the most efficient and profitable manner
Refining margins also referred to as indicator or crack spreads, this depicts the gross margin per barrel that a regional refiner with either a simple or complex refinery configuration typical of that area and running a single crude widely processed in the region is likely to be achieving
Reforming the process by which the molecular structure of gasoline fractions is altered to improve the 'anti-knock' quality by increasing the octane level thereby allowing greater performance from an engine.
Re-gasification plant plant in which the chilled LNG is heated to the appropriate temperature to reconvert it back to gas, after which it is used in power generation or sold into a national gas market for consumption
Regressive tax system governments percentage share of the project NPV falls at a time of increasing oil prices. Concession systems tend to be regressive to neutral
Reid Vapour Pressure (RVP) measure of the pressure required to prevent a substance from evaporating
Reserve life number of remaining years of 1P reserves and is calculated as remaining reserves over annual production
Reserve replacement ratio a company's ability to replace production with reserve additions in the year under review
Reserves volumes of oil and gas in a reservoir that are commercially producible. See also SEC reserves
Reservoir hydrocarbons sitting between the mineral/rock grains in sandstone, and within voids in limestone
Residuals solids such as coke, asphalt, tar and waxes which are 'leftover' after distillation
Rig supervisor the shift supervisor of a rig crew, to which all rig personnel report - eg the barge master and driller
Riser large diameter steel pipe that connects the top of the well on the seabed with the rig
Rotary Table a circular piece of equipment in the middle of the drill floor that can be rotated in either direction with great torque. The kelly bushing is mounted on top, and this imparts torque (i.e. rotation) to the kelly and hence drill pipe. Its always present, but is not used if drilling is being undertaken with a top drive.
Rough neck labourers that work on a rig - usually associated with handling pipe and equipment on the drill floor
Roustabout a general labourer on a rig
Royalty a cash payment or payment in kind to the resource holder
Sapropel dark-coloured sediments that are rich in organic matter
Seal typical mudstone and shale which overlies reservoir rock, the seal prevents the escape of hydrocarbons from the reservoir. Also referred to as 'cap'
SEC reserves under SEC rules companies can only account for proved reserves. See Proved (1P) reserves.
Secondary Recovery recovery of oil/gas from a reservoir by artificially enhancing the pressure within the reservoir by injecting water, gas or other substances into the reservoir
7 January 2008 Integrated Oils Oil & Gas for Beginners
Deutsche Bank AG/London Page 411
Sedimentary Rocks the primary source of almost all oil and gas reserves. The are formed by the compaction of mineral grains which have been laid down as a result of terrestrial, wind or ocean currents.
Seismic survey a technique used to obtain geophysical data by projecting sound waves below the surface to try and create an image of subsurface rock layers
Separator a pressure vessel that separates produced fluids into oil, water and gas.
Seven Sisters the seven IOC's that dominated the oil industry until the 1970's. Comprised Exxon, Mobil, Chevron, Texaco, RDS, BP and Gulf.
Shale oil oil which is extracted by heat, from clays that are impregnated with oil (much like oil sands)
Source Kitchen see source rock
Source Rock hydrocarbons originate from organic matter which is deposited and preserved within sedimentary rocks. Any sediments that have high organic carbon content and produce hydrocarbons in significant amounts are known as source rocks
SPAR floating production system, anchored to the seabed through a semi-rigid mooring system, comprising a vertical cylindrical hull supporting the platform structure.
Spill point the structurally lowest point in a reservoir that can contain hydrocarbons
Spud the operation of drilling the first part of a new well
Steam assisted gravity and drainage (SAGD)
involves drilling two parallel horizontal oil wells in the oil sand formation. The upper well injects steam and the lower one collects the water from any resultant condensation. The injected steam heats the crude oil or bitumen and lowers its viscosity which allows it to flow down into the lower wellbore
Steam cracking crackers that use steam to initiate the process of breaking down larger, heavier more complex hydrocarbons
Straight-run production resulting from the distillation of petroleum without chemical conversion i.e. no adjustment to the molecular structure or size
Structural Traps result from plate movements such as folding and/or faulting of the reservoir and cap rock. Typical examples are anti-clinal and fault traps which are sometime connected with salt domes.
Superposition within a sequence of layers of sedimentary rock, the oldest layer is at the base and that the layers are progressively younger with ascending order in the sequence
SURF facilities sub-sea Umbilical Risers Flowlines – pipelines and equipment connecting the well or sub-sea system to a floating unit.
Swing the fluctuation in oil/gas demand. Resource holders with spare capacity (namely Saudi Arabia and Nigeria) are often referred to as swing producers as they have the capacity to increase production at times of increased demand
Syncrudes Synthetic Crude is a liquid fuel obtained from coal, gas or heavy oil sands. Synthetic crude is created via CTL (Coal-to-Liquids), GTL (Gas to liquids) and by upgrading bitumen found in oil sands
Tax & Royalty regime (concession)
a regime under which an oil company is granted a concession to prospect for and extract hydrocarbons. From the revenues generated the concession holder will typically pay a pre-agreed royalty on revenues together with corporation tax on profits.
Technical costs include exploration expenses, DD&A and production costs i.e. it is the entire cost involved in producing a barrel of oil
Tension Leg Platform (TLP) fixed-type floating platform held in position by a system of tendons and anchored to ballast caissons located on the seabed. These platforms are used in ultra-deep waters.
Tertiary recovery methods of increasing recovery from oil/gas fields beyond that achieved by secondary recovery. These techniques are often referred to as Enhanced Oil Recovery (EOR)
Texas Railroad Commission the US forerunner to OPEC, created to regulate oil production
Thermoplastics a plastic that melts to a liquid when heated and freezes to a brittle, very glassy state when cooled sufficiently i.e. they can be re-moulded, extruded or even recycled
Thermosets polymer material that set to a stronger form through the addition of energy (normally heat or through a chemical reaction). Unlike thermoplastics, thermosets never soften once they have been moulded
Tight gas gas that is trapped in reservoirs that have low porosity and permeability
Tongs vice like large grips that clamp on to drill pipe and allow two pieces of pipe to be screwed together tightly via chain and pulleys on the draw works
Tool pusher the person in charge of drilling operations, to whom the driller and roughnecks report
Top Drive a large electric or hydraulic motor which is positioned on top of the drill pipe and which can move up and down in the derrick. It transmits torque directly to the top of the drill pipe and simultaneously allows high pressure mud to be circulated, even if pulling the pipe out of hole - a feat that rotary table drilling can not perform. It makes the rotary table, kelly bushing and kelly redundant.
7 January 2008 Integrated Oils Oil & Gas for Beginners
Page 412 Deutsche Bank AG/London
Topsides the modules that are installed above the sealevel on an offshore platform, e.g. accommodation, drilling package, power, mud pumps, separators
Torque a rotating force defined as the force applied to a lever, multiplied by the distance from the levers fulcrum (turning point)
Total depth the bottom of the well
Transesterification based on the reaction between a vegetable oil containing glycerides and a short-chain alcohol such as methanol which converts vegetable oil into fatty acid methyl esters (FAME). Also known as alcoholysis
Treating processes additional processes carried out at refineries prior to the petroleum products being marketed. Treating is used to 'clean up' products' e.g. the reduction of sulphur content in gasoline
Trigger points the conditions laid out in the PSC contract, the attainment of which lead to changes in the allocation of profit oil share between the state and the contractor.
True vertical depth (TVD) the vertical depth of a well, which in the case of a deviated hole can be much lower than the measured depth
Turbidites sands within a depositional environment which are delivered down the continental slope by turbidity current. (A turbidity current transports sand and mud within a current of turbid water, much like a snow avalanche transport snow within air)
Turntable rotating platform which is used to work the drill
Unconventional Oil/Gas generally refers to oil sands, gas-to-liquids, coal bed methane and tight gas, which all require advanced technology and in the past were considered un-commercial given the high development costs
Unification combines the lighter hydrocarbons to create heavier hydrocarbons of desired characteristics
Uniformitarianism the principal developed by Charles Lyell which states that geological processes have not changed throughout the Earth's history
Upgrading the process by which the bitumen obtained from the oil sands is upgraded into shorter lighter carbon chains more representative of crude. Hydro-cracking and hydro-treating are just two of the processes used to upgrade the bitumen
Upstream term commonly used to refer to the searching for and the recovery and production of crude oil and natural gas.
V-door something that all rig trainees must find the keys for (since time immemorial), which is problematic, as it is simply a metal ramp that allows pipe to be pulled up from the main deck of a rig to the drill floor
Vibroseis truck an alternative to explosives for generating seismic data. A vibroseis truck drops a steel pad from its underbelly, jacks itself up on the pad, then vibrates the pad to generate shock waves
Vis-breaking thermal cracking used to reduced the thickness of residual oils
Water cut the percentage of produced fluids that are water
Water flood an EOR method that involves pumping water down through injector wells to force oil towards the wellbore that otherwise would have not been produced.
Weight-on-bit the force that is allowed by the driller to be transmitted to the bit. This is controlled by the use of the 'brake', that slows down (or halts) the descent of the travelling block in the derrick.
Well test also referred to as a 'flow test', this refers to pumping oil and gas at controlled rates for a period of time in order to gain further information about the permeability, contents, potential flow rates of the reservoir and its physical size
Wellhead the part of an oil well which terminates at the surface where petroleum or gas can be withdrawn
Wet gas geological term for a mixture of gas that contains significant amounts for liquid or condensable compounds heavier than ethane. Wet gas is generally derived from a reservoir that contains some amounts of water
Wildcat well speculative drilling on unproven acreage. Also known as exploration well
Wireline logging uses cables and downhole instruments to acquire measurements that provide strong indications or whether any oil/gas has been found
Working Interest the contractor’s percentage interest in the project as a whole. Thus if a company has a 40% interest in a project producing 100kb/d its working interest in that project would be 40kb/d.
Source: Deutsche Bank
7 January 2008 Integrated Oils Oil & Gas for Beginners
Deutsche Bank AG/London Page 413
Industry Investment thesis Outlook
At the outset, with oil trading close to $100/bbl 2008 looks set to be another very strong year for the oil sector. Earnings momentum has improved notably and should remain strong in our opinion, at least through the first quarter of the year. Very weak refining margins may have eaten into some of the recent oil price upside. However, with OPEC showing greater discipline in its attempts to support prices and with some good success, our confidence in the long run oil price has seen us significantly increase our long run mid-cycle expectations to $65/bbl. Cost inflation may be taking its toll on the profits of the major oils. The threat posed by a collapse in the oil price is, however, increasingly receding. Against a very resource constrained supply market, 2008 is however likely to prove another one of limited upstream growth. However, with the price of the black stuff proving higher than most had anticipated and refining still throwing off considerable excess cash, the year will most likely prove another of exceptional cash generation. All told, sector prospects look generally robust, something that can only be seen to increase if investors become more sanguine about the longer term prospects for the price of crude oil, and fundamental value is very apparent. Yet, in a stock market that one moment is looking towards economic recovery and the next economic recession, swings in sentiment towards what has traditionally been seen as a default sector are likely to be high. It will be a bumpy ride but the oils look a default sector of choice if not as a place to hide at a time of economic uncertainty.
Valuation
We use a multitude of earnings and cash flow valuation techniques to value the oils. These include P/E relatives, cash return on capital analysis (CROCI) and discounted cash flow models amongst others. On the basis of our current forecasts we believe that we are now approaching the middle of the current price cycle. Not only does the price of crude oil look set to hover at above $60/bbl into the medium term. The pace of cost inflation is also starting to ameliorate. As such we now anticipate that the return on capital achieved by the sector is now likely to decline at a slower rate than may previously have been feared. With this in mind, our analysis of the sector’s historical P/E multiple range suggests that the valuation multiple placed upon the sector should be moving towards a mid-cycle level (c16x) rather than holding at that seen through the peak for returns (c9-10x). This suggests a fair sector P/E multiple on average of around 12x on prospective 2008 earnings estimates. Similarly, on cash return (CROCI) metrics, our analysis suggests that, while the multiple placed on the sector’s capital remains some 5% below the long run average the sector is expected to achieve returns in 2008E some 10% above those of the past ten years. We accept that the vagaries of the pricing of crude oil mean that predicting the future for returns is inherently uncertain. However, given the demand and supply outlook over the medium term, the implied rate of return fade is, in our opinion, too aggressive.
Risks
Key to our overweight stance is our expectation that the price of Brent oil will average $65/bbl over the medium term Material downwards adjustment would have a meaningful impact on our perception of value and could be caused by a faltering outlook for global economic growth. Other risks include material changes in Government policy on oil and gas resource, be they on oil & gas taxation or changes in resource ownership. Elsewhere, higher than anticipated spend on project developments across the sector could have a meaningful impact on both the earnings profile of individual companies and the return profile of the sector in aggregate as well as continuing to delay investment in growth projects.

7 January 2008 Integrated Oils Oil & Gas for Beginners
Page 414 Deutsche Bank AG/London
Figure 558: Deutsche Bank Global Oil & Gas Team European OilsLucas Herrmann [email protected] +44 207 547 3636James Hubbard [email protected] +44 207 5457905Christyan Malek [email protected] +44 207 545 8429Jonathan Copus [email protected] +44 207 545 1202Elaine Dunphy [email protected] +44 207 545 9138
European CountriesJussi Uskola [email protected] +35 89 2525 2551Gergely Varkonyi, CFA [email protected] +36 1 301 3748Sinan Velioglu [email protected] +90 212 252 4960
US Majors/RefinersPaul Sankey [email protected] + 1 212 250 6137Ryan Todd [email protected] + 1 212 250 8529Richard Voliva [email protected] + 1 212 250 5696
US E&PShannon Nome [email protected] + 1 713 409 4367Scott Arndt [email protected] + 1 832 239 3103
Oil Field ServicesMichael Urban [email protected] +1 212 250 3113Fleur Spiegel, CFA [email protected] +1 212 250 0334
Latin AmericaLucrecia Tam [email protected] +1 212 250 6968Marcus Sequeira [email protected] +1 646 442 0703
RussiaPavel Kushnir [email protected] +7 501 967 3727Olga Danilenko [email protected] +7 501 967 3727
China - KoreaDavid J Clark [email protected] +852 2203 6149Christine Pu [email protected] +86 21 3896 2831
IndiaS Ramesh [email protected] +91 22 6658 4029Raj Ghandi [email protected] +91 22 6658 4213
AustraliaJohn Hirjee [email protected] +613 9270 4318Tony Lee [email protected] +613 9270 4165
South AfricaJonathan Kennedy-Good [email protected] +27 11 775 7258Tim Clark [email protected] +27 11 775 7268
Specialist SalesJohn Syropoulo [email protected] +44 20 7547 5527
Oil & Gas MarketsAdam Sieminski, CFA [email protected] +1 212 250 2928
Source: Deutsche Bank

7 January 2008 Integrated Oils Oil & Gas for Beginners
Deutsche Bank AG/London Page 415
The author of this report wishes to acknowledge the contribution made by K Viswanath Rao, an employee of Irevna, a third party provider to Deutsche Bank of offshore research support services.
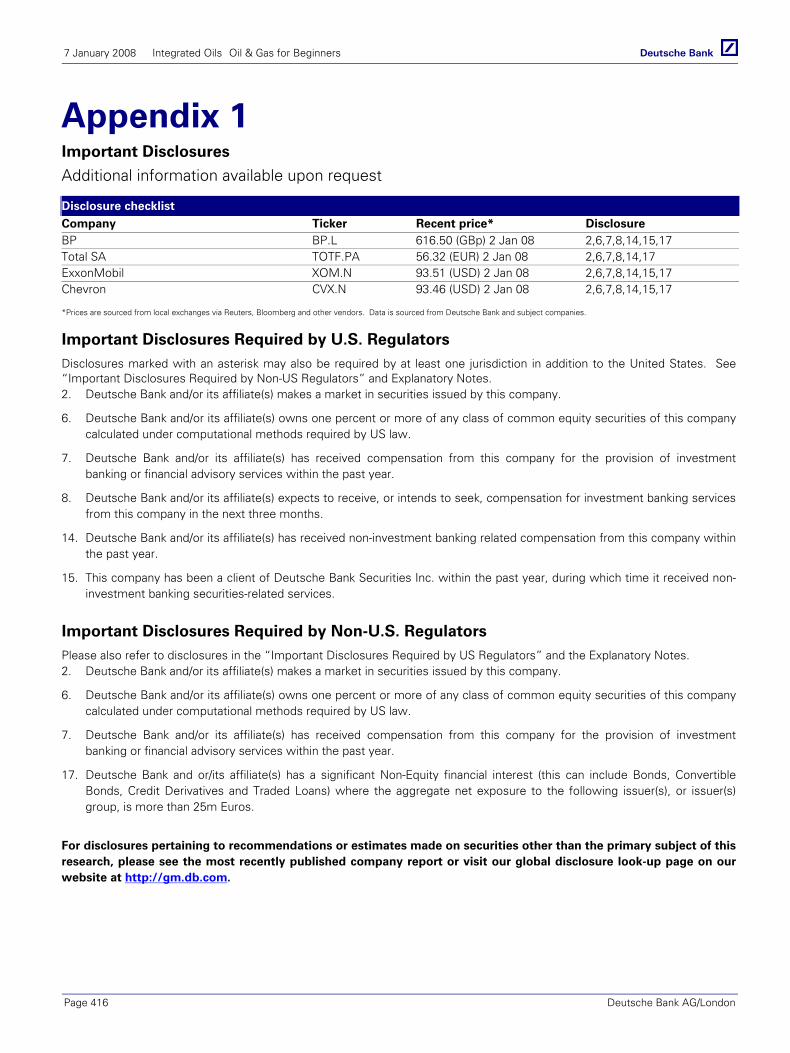
7 January 2008 Integrated Oils Oil & Gas for Beginners
Page 416 Deutsche Bank AG/London
Appendix 1 Important Disclosures
Additional information available upon request
Disclosure checklist Company Ticker Recent price* Disclosure BP BP.L 616.50 (GBp) 2 Jan 08 2,6,7,8,14,15,17 Total SA TOTF.PA 56.32 (EUR) 2 Jan 08 2,6,7,8,14,17 ExxonMobil XOM.N 93.51 (USD) 2 Jan 08 2,6,7,8,14,15,17 Chevron CVX.N 93.46 (USD) 2 Jan 08 2,6,7,8,14,15,17 *Prices are sourced from local exchanges via Reuters, Bloomberg and other vendors. Data is sourced from Deutsche Bank and subject companies.
Important Disclosures Required by U.S. Regulators Disclosures marked with an asterisk may also be required by at least one jurisdiction in addition to the United States. See “Important Disclosures Required by Non-US Regulators” and Explanatory Notes. 2. Deutsche Bank and/or its affiliate(s) makes a market in securities issued by this company.
6. Deutsche Bank and/or its affiliate(s) owns one percent or more of any class of common equity securities of this company calculated under computational methods required by US law.
7. Deutsche Bank and/or its affiliate(s) has received compensation from this company for the provision of investment banking or financial advisory services within the past year.
8. Deutsche Bank and/or its affiliate(s) expects to receive, or intends to seek, compensation for investment banking services from this company in the next three months.
14. Deutsche Bank and/or its affiliate(s) has received non-investment banking related compensation from this company within the past year.
15. This company has been a client of Deutsche Bank Securities Inc. within the past year, during which time it received non-investment banking securities-related services.
Important Disclosures Required by Non-U.S. Regulators Please also refer to disclosures in the “Important Disclosures Required by US Regulators” and the Explanatory Notes. 2. Deutsche Bank and/or its affiliate(s) makes a market in securities issued by this company.
6. Deutsche Bank and/or its affiliate(s) owns one percent or more of any class of common equity securities of this company calculated under computational methods required by US law.
7. Deutsche Bank and/or its affiliate(s) has received compensation from this company for the provision of investment banking or financial advisory services within the past year.
17. Deutsche Bank and or/its affiliate(s) has a significant Non-Equity financial interest (this can include Bonds, Convertible Bonds, Credit Derivatives and Traded Loans) where the aggregate net exposure to the following issuer(s), or issuer(s) group, is more than 25m Euros.
For disclosures pertaining to recommendations or estimates made on securities other than the primary subject of this research, please see the most recently published company report or visit our global disclosure look-up page on our website at http://gm.db.com.

7 January 2008 Integrated Oils Oil & Gas for Beginners
Deutsche Bank AG/London Page 417
Analyst Certification
The views expressed in this report accurately reflect the personal views of the undersigned lead analyst about the subject issuers and the securities of those issuers. In addition, the undersigned lead analyst has not and will not receive any compensation for providing a specific recommendation or view in this report. Lucas Herrmann
Historical recommendations and target price: BP (BP.L)
(as of 02/01/2008)
1716151413
121110987
65
432
1
0.00
1.00
2.00
3.00
4.00
5.00
6.00
7.00
8.00
Jan 05 Apr 05 Jul 05 Oct 05 Jan 06 Apr 06 Jul 06 Oct 06 Jan 07 Apr 07 Jul 07 Oct 07
Date
Se
cu
rity
Pri
ce
Previous Recommendations
Strong Buy Buy Market Perform Underperform Not Rated Suspended Rating
Current Recommendations
Buy Hold Sell Not Rated Suspended Rating
*New Recommendation Structure as of September 9, 2002
1. 24/2/2005: Hold, Target Price Change GBP5.80
2. 11/7/2005: Hold, Target Price Change GBP6.75
3. 16/9/2005: Upgrade to Buy, Target Price Change GBP7.50
4. 7/1/2006: Buy, Target Price Change GBP7.25
5. 7/2/2006: Buy, Target Price Change GBP7.10
6. 11/4/2006: Buy, Target Price Change GBP7.50
7. 23/6/2006: Buy, Target Price Change GBP8.00
8. 26/7/2006: Buy, Target Price Change GBP7.00
9. 18/9/2006: Buy, Target Price Change GBP6.90
10. 4/10/2006: Buy, Target Price Change GBP6.80
11. 8/1/2007: Buy, Target Price Change GBP6.30
12. 6/2/2007: Buy, Target Price Change GBP5.80
13. 24/4/2007: Downgrade to Hold, GBP5.80
14. 6/7/2007: Upgrade to Buy, Target Price Change GBP6.70
15. 24/7/2007: Buy, Target Price Change GBP7.25
16. 23/10/2007: Buy, Target Price Change GBP6.90
17. 16/11/2007: Buy, Target Price Change GBP7.25
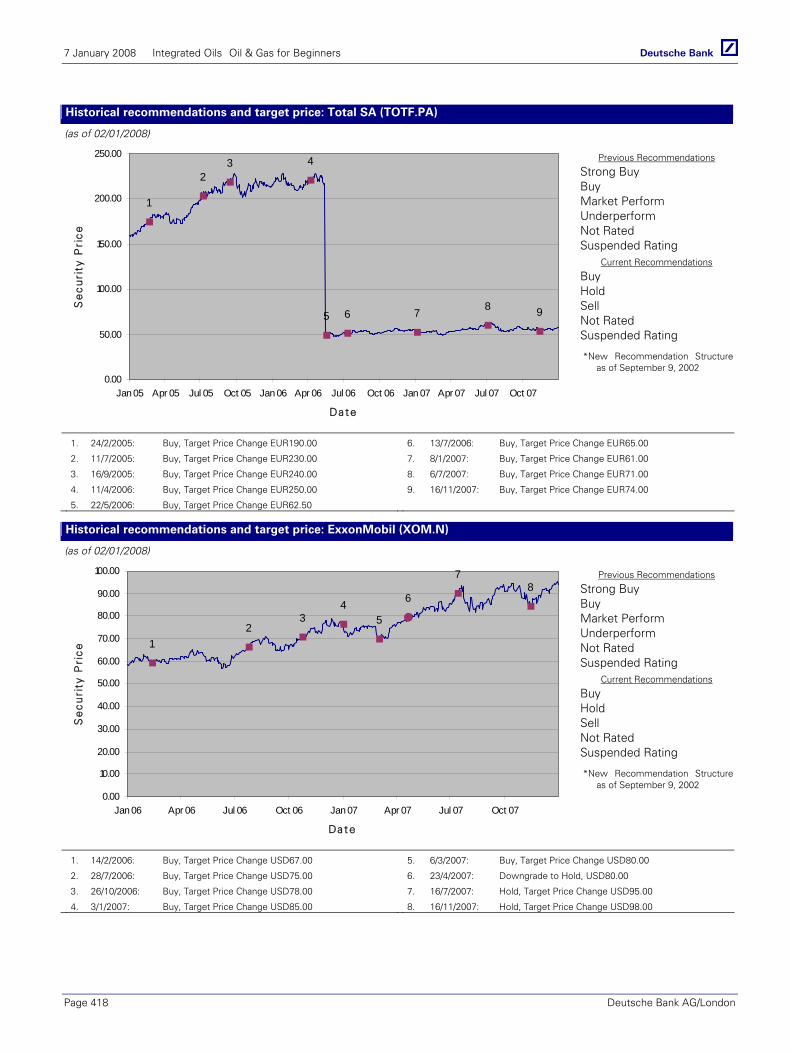
7 January 2008 Integrated Oils Oil & Gas for Beginners
Page 418 Deutsche Bank AG/London
Historical recommendations and target price: Total SA (TOTF.PA)
(as of 02/01/2008)
98765
432
1
0.00
50.00
100.00
150.00
200.00
250.00
Jan 05 Apr 05 Jul 05 Oct 05 Jan 06 Apr 06 Jul 06 Oct 06 Jan 07 Apr 07 Jul 07 Oct 07
Date
Se
cu
rity
Pri
ce
Previous Recommendations
Strong Buy Buy Market Perform Underperform Not Rated Suspended Rating
Current Recommendations
Buy Hold Sell Not Rated Suspended Rating
*New Recommendation Structure as of September 9, 2002
1. 24/2/2005: Buy, Target Price Change EUR190.00
2. 11/7/2005: Buy, Target Price Change EUR230.00
3. 16/9/2005: Buy, Target Price Change EUR240.00
4. 11/4/2006: Buy, Target Price Change EUR250.00
5. 22/5/2006: Buy, Target Price Change EUR62.50
6. 13/7/2006: Buy, Target Price Change EUR65.00
7. 8/1/2007: Buy, Target Price Change EUR61.00
8. 6/7/2007: Buy, Target Price Change EUR71.00
9. 16/11/2007: Buy, Target Price Change EUR74.00
Historical recommendations and target price: ExxonMobil (XOM.N)
(as of 02/01/2008)
87
6
54
32
1
0.00
10.00
20.00
30.00
40.00
50.00
60.00
70.00
80.00
90.00
100.00
Jan 06 Apr 06 Jul 06 Oct 06 Jan 07 Apr 07 Jul 07 Oct 07
Date
Se
cu
rity
Pri
ce
Previous Recommendations
Strong Buy Buy Market Perform Underperform Not Rated Suspended Rating
Current Recommendations
Buy Hold Sell Not Rated Suspended Rating
*New Recommendation Structure as of September 9, 2002
1. 14/2/2006: Buy, Target Price Change USD67.00
2. 28/7/2006: Buy, Target Price Change USD75.00
3. 26/10/2006: Buy, Target Price Change USD78.00
4. 3/1/2007: Buy, Target Price Change USD85.00
5. 6/3/2007: Buy, Target Price Change USD80.00
6. 23/4/2007: Downgrade to Hold, USD80.00
7. 16/7/2007: Hold, Target Price Change USD95.00
8. 16/11/2007: Hold, Target Price Change USD98.00
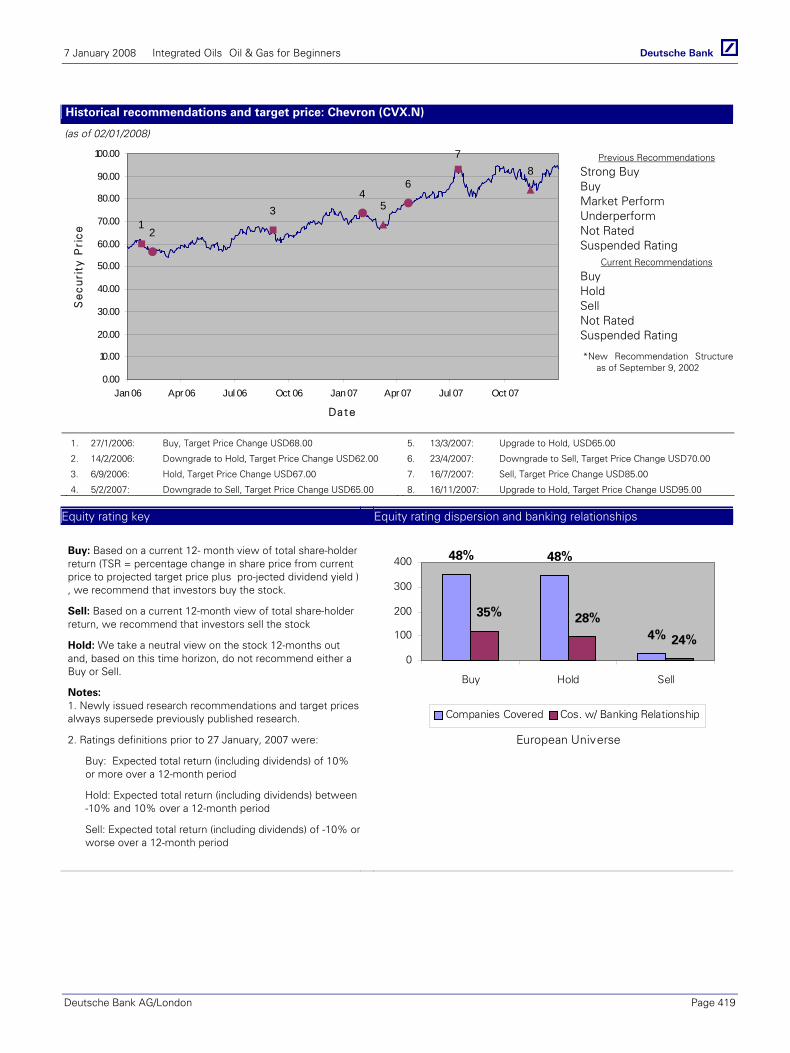
7 January 2008 Integrated Oils Oil & Gas for Beginners
Deutsche Bank AG/London Page 419
Historical recommendations and target price: Chevron (CVX.N)
(as of 02/01/2008)
87
6
54
3
21
0.00
10.00
20.00
30.00
40.00
50.00
60.00
70.00
80.00
90.00
100.00
Jan 06 Apr 06 Jul 06 Oct 06 Jan 07 Apr 07 Jul 07 Oct 07
Date
Se
cu
rity
Pri
ce
Previous Recommendations
Strong Buy Buy Market Perform Underperform Not Rated Suspended Rating
Current Recommendations
Buy Hold Sell Not Rated Suspended Rating
*New Recommendation Structure as of September 9, 2002
1. 27/1/2006: Buy, Target Price Change USD68.00
2. 14/2/2006: Downgrade to Hold, Target Price Change USD62.00
3. 6/9/2006: Hold, Target Price Change USD67.00
4. 5/2/2007: Downgrade to Sell, Target Price Change USD65.00
5. 13/3/2007: Upgrade to Hold, USD65.00
6. 23/4/2007: Downgrade to Sell, Target Price Change USD70.00
7. 16/7/2007: Sell, Target Price Change USD85.00
8. 16/11/2007: Upgrade to Hold, Target Price Change USD95.00
Equity rating key Equity rating dispersion and banking relationships
Buy: Based on a current 12- month view of total share-holder return (TSR = percentage change in share price from current price to projected target price plus pro-jected dividend yield ) , we recommend that investors buy the stock.
Sell: Based on a current 12-month view of total share-holder return, we recommend that investors sell the stock
Hold: We take a neutral view on the stock 12-months out and, based on this time horizon, do not recommend either a Buy or Sell.
Notes: 1. Newly issued research recommendations and target prices always supersede previously published research.
2. Ratings definitions prior to 27 January, 2007 were:
Buy: Expected total return (including dividends) of 10% or more over a 12-month period
Hold: Expected total return (including dividends) between -10% and 10% over a 12-month period
Sell: Expected total return (including dividends) of -10% or worse over a 12-month period
4%
48%48%
24%
28%35%
0
100
200
300
400
Buy Hold Sell
European Universe
Companies Covered Cos. w/ Banking Relationship
7 January 2008 Integrated Oils Oil & Gas for Beginners
Page 420 Deutsche Bank AG/London
Regulatory Disclosures
SOLAR Disclosure
For select companies, Deutsche Bank equity research analysts may identify shorter-term trade opportunities that are consistent or inconsistent with Deutsche Bank's existing longer term ratings. This information is made available only to Deutsche Bank clients, who may access it through the SOLAR stock list, which can be found at http://gm.db.com
Disclosures required by United States laws and regulations
See company-specific disclosures above for any of the following disclosures required for covered companies referred to in this report: acting as a financial advisor, manager or co-manager in a pending transaction; 1% or other ownership; compensation for certain services; types of client relationships; managed/comanaged public offerings in prior periods; directorships; market making and/or specialist role.
The following are additional required disclosures:
Ownership and Material Conflicts of Interest: DBSI prohibits its analysts, persons reporting to analysts and members of their households from owning securities of any company in the analyst's area of coverage. Analyst compensation: Analysts are paid in part based on the profitability of DBSI, which includes investment banking revenues. Analyst as Officer or Director: DBSI policy prohibits its analysts, persons reporting to analysts or members of their households from serving as an officer, director, advisory board member or employee of any company in the analyst's area of coverage. Distribution of ratings: See the distribution of ratings disclosure above. Price Chart: See the price chart, with changes of ratings and price targets in prior periods, above, or, if electronic format or if with respect to multiple companies which are the subject of this report, on the DBSI website at http://gm.db.com.
Additional disclosures required under the laws and regulations of jurisdictions other than the United States
The following disclosures are those required by the jurisdiction indicated, in addition to those already made pursuant to United States laws and regulations. Analyst compensation: Analysts are paid in part based on the profitability of Deutsche Bank AG and its affiliates, which includes investment banking revenues Australia: This research, and any access to it, is intended only for "wholesale clients" within the meaning of the Australian Corporations Act. EU: A general description of how Deutsche Bank AG identifies and manages conflicts of interest in Europe is contained in our public facing policy for managing conflicts of interest in connection with investment research.Disclosures relating to the firm's obligations under MiFiD can be found at http://globalmarkets.db.com/riskdisclosures. Germany: See company-specific disclosures above for holdings of five percent or more of the share capital. In order to prevent or deal with conflicts of interests Deutsche Bank AG has implemented the necessary organisational procedures to comply with legal requirements and regulatory decrees. Adherence to these procedures is monitored by the Compliance-Department. Hong Kong: See http://gm.db.com for company-specific disclosures required under Hong Kong regulations in connection with this research report. Disclosure #5 includes an associate of the research analyst. Disclosure #6, satisfies the disclosure of financial interests for the purposes of paragraph 16.5(a) of the SFC's Code of Conduct (the "Code"). The 1% or more interests is calculated as of the previous month end. Disclosures #7 and #8 combined satisfy the SFC requirement under paragraph 16.5(d) of the Code to disclose an investment banking relationship. Japan: See company-specific disclosures as to any applicable disclosures required by Japanese stock exchanges, the Japanese Securities Dealers Association or the Japanese Securities Finance Company. Russia: The information, interpretation and opinions submitted herein are not in the context of, and do not constitute, any appraisal or evaluation activity requiring a licence in the Russian Federation. South Africa: Publisher: Deutsche Securities (Pty) Ltd, 3 Exchange Square, 87 Maude Street, Sandton, 2196, South Africa. Author: As referred to on the front cover. All rights reserved. When quoting, please cite Deutsche Securities Research as the source. Turkey: The information, interpretation and advice submitted herein are not in the context of an investment consultancy service. Investment consultancy services are provided by brokerage firms, portfolio management companies and banks that are not authorized to accept deposits through an investment consultancy agreement to be entered into such corporations and

7 January 2008 Integrated Oils Oil & Gas for Beginners
Deutsche Bank AG/London Page 421
their clients. The interpretation and advices herein are submitted on the basis of personal opinion of the relevant interpreters and consultants. Such opinion may not fit your financial situation and your profit/risk preferences. Accordingly, investment decisions solely based on the information herein may not result in expected outcomes. United Kingdom: Persons who would be categorized as private customers in the United Kingdom, as such term is defined in the rules of the Financial Services Authority, should read this research in conjunction with prior Deutsche Bank AG research on the companies which are the subject of this research. Disclosures relating to the firm's obligations under MiFiD can be found at http://globalmarkets.db.com/riskdisclosures.
European locations
Deutsche Bank AG London 1 Great Winchester Street London EC2N 2EQ Tel: (44) 20 7545 8000
Deutsche-Bank AG, Seccursale de Paris 3, Avenue de Friedland 75008 Paris Cedex 8 France Tel: (33) 1 44 95 64 00
Deutsche Bank AG Equity Research Große Gallusstraße 10-14 60272 Frankfurt am Main Germany Tel: (49) 69 910 0
Deutsche Bank Sim S.p.a Via Santa Margherita 4 20123 Milan Italy Tel: (39) 0 24 024 1
Deutsche Bank AG Herengracht 450 1017 CA Amsterdam Netherlands Tel: (31) 20 555 4911
Deutsche Securities S.V.B, S.A. P0 de la Castellana, 42 7th Floor 28046 Madrid, Spain Tel: (34) 91 782 8400
Deutsche Bank AG Stureplan 4 A, Box 5781 S-114 87 Stockholm Sweden Tel: (46) 8 463 5500
Deutsche Bank AG Uraniastrasse 9 PO Box 7370 8023 Zürich Switzerland Tel: (41) 1 224 5000
Deutsche Bank AG, Helsinki Kaivokatu 10 A, P.O.Bvox 650 FIN-00101 Helsinki Finland Tel: (358) 9 25 25 25 0
Deutsche Bank AG Hohenstaufengasse 4 1010 Vienna Austria Tel: (43) 1 5318 10
Deutsche Bank AG Aurora business park 82 bld.2 Sadovnicheskaya street Moscow, 115035 Russia Tel: (7) 495 797-5000
Deutsche Bank AG, Warsaw al. Armii Ludowej 26 Budynek FOCUS 00-609 Warsaw Poland Tel: (+48) 22 579-98
Deutsche Bank AG, Turkey Eski Buyukdere Cad. Tekfen Tower No:209 Kat:17-18 TR-34394 Istanbul Tel: (+90) 212 317 01 00
Deutsche Bank AG, Greece 23A Vassilissis Sofias Avenue 6th Floor 10674 Athens, Greece Tel: (+30) 210 72 56 150
International locations
Deutsche Bank Securities Inc. 60 Wall Street New York, NY 10005 United States of America Tel: (1) 212 250 2500
Deutsche Bank AG London 1 Great Winchester Street London EC2N 2EQ United Kingdom Tel: (44) 20 7545 8000
Deutsche Bank AG Große Gallusstraße 10-14 60272 Frankfurt am Main Germany Tel: (49) 69 910 0
Deutsche Bank AG Deutsche Bank Place, Level 16 Corner of Hunter & Phillip Streets Sydney, NSW 2000 Australia Tel: (61) 2 8258 1234
Deutsche Bank AG Level 55 Cheung Kong Center 2 Queen’s Road Central Hong Kong Tel: (852) 2203 8888
Deutsche Securities Inc. 2-11-1 Nagatacho Sanno Park Tower Chiyoda-ku, Tokyo 100-6171 Japan Tel: (81) 3 5156 6701
Global Disclaimer The information and opinions in this report were prepared by Deutsche Bank AG or one of its affiliates (collectively “Deutsche Bank”) for its clients. The information herein is believed by Deutsche Bank to be reliable and has been obtained from public sources believed to be reliable. With the exception of information about Deutsche Bank, Deutsche Bank makes no representation as to the accuracy or completeness of such information.
This published research report may be considered by Deutsche Bank when Deutsche Bank is deciding to buy or sell proprietary positions in the securities mentioned in this report.
For select companies, Deutsche Bank equity research analysts may identify shorter-term opportunities that are consistent or inconsistent with Deutsche Bank's existing, longer-term Buy or Sell recommendations. This information is made available on the SOLAR stock list, which can be found at http://gm.db.com.
Deutsche Bank may trade for its own account as a result of the short term trading suggestions of analysts and may also engage in securities transactions in a manner inconsistent with this research report and with respect to securities covered by this report, will sell to or buy from customers on a principal basis. Disclosures of conflicts of interest, if any, are discussed at the end of the text of this report or on the Deutsche Bank website at http://gm.db.com.
Opinions, estimates and projections in this report constitute the current judgement of the author as of the date of this report. They do not necessarily reflect the opinions of Deutsche Bank and are subject to change without notice. Deutsche Bank has no obligation to update, modify or amend this report or to otherwise notify a reader thereof in the event that any matter stated herein, or any opinion, projection, forecast or estimate set forth herein, changes or subsequently becomes inaccurate, except if research on the subject company is withdrawn. Prices and availability of financial instruments also are subject to change without notice. This report is provided for informational purposes only. It is not to be construed as an offer to buy or sell or a solicitation of an offer to buy or sell any financial instruments or to participate in any particular trading strategy in any jurisdiction or as an advertisement of any financial instruments.
Derivative transactions involve numerous risks including, among others, market, counterparty default and illiquidity risk. The appropriateness or otherwise of these products for use by investors is dependent on the investors' own circumstances including their tax position, their regulatory environment and the nature of their other assets and liabilities and as such investors should take expert legal and financial advice before entering into any transaction similar to or inspired by the contents of this publication. Trading in options involves risk and is not suitable for all investors. Prior to buying or selling an option investors must review the "Characteristics and Risks of Standardized Options," at http://www.optionsclearing.com/publications/risks/riskchap1.jsp. If you are unable to access the website please contact Deutsche Bank AG at +1 (212) 250-7994, for a copy of this important document. Furthermore, past performance is not necessarily indicative of future results. Please note that multi-leg options strategies will incur multiple commissions.
The financial instruments discussed in this report may not be suitable for all investors and investors must make their own investment decisions using their own independent advisors as they believe necessary and based upon their specific financial situations and investment objectives. If a financial instrument is denominated in a currency other than an investor’s currency, a change in exchange rates may adversely affect the price or value of, or the income derived from, the financial instrument, and such investor effectively assumes currency risk. In addition, income from an investment may fluctuate and the price or value of financial instruments described in this report, either directly or indirectly, may rise or fall. Furthermore, past performance is not necessarily indicative of future results.
Unless governing law provides otherwise, all transactions should be executed through the Deutsche Bank entity in the investor’s home jurisdiction . In the U.S. this report is approved and/or distributed by Deutsche Bank Securities Inc., a member of the NYSE, the NASD, NFA and SIPC. In Germany this report is approved and/or communicated by Deutsche Bank AG Frankfurt authorised by Bundesanstalt für Finanzdienstleistungsaufsicht. In the United Kingdom this report is approved and/or communicated by Deutsche Bank AG London, a member of the London Stock Exchange and regulated by the Financial Services Authority for the conduct of investment business in the UK and authorised by Bundesanstalt für Finanzdienstleistungsaufsicht (BaFin). This report is distributed in Hong Kong by Deutsche Bank AG, Hong Kong Branch, in Korea by Deutsche Securities Korea Co. and in Singapore by Deutsche Bank AG, Singapore Branch. In Japan this report is approved and/or distributed by Deutsche Securities Inc. The information contained in this report does not constitute the provision of investment advice. In Australia, retail clients should obtain a copy of a Product Disclosure Statement (PDS) relating to any financial product referred to in this report and consider the PDS before making any decision about whether to acquire the product. Deutsche Bank AG Johannesburg is incorporated in the Federal Republic of Germany (Branch Register Number in South Africa: 1998/003298/10) Additional information relative to securities, other financial products or issuers discussed in this report is available upon request. This report may not be reproduced, distributed or published by any person for any purpose without Deutsche Bank's prior written consent. Please cite source when quoting.
Copyright © 2008 Deutsche Bank AG
GRCM2008PROD012169
Copyright © 2022 FDOKUMEN