Financing Development Stage Biotechnology Companies: Reverse Mergers vs. IPOs
Upload
independentCategory
view
5download
0
ORI GINAL RESEARCH
The effects of R&D, venture capital, and technologyon the underpricing of IPOs in Taiwan
Cheng Shou Lu • Lanfeng Kao • Anlin Chen
Published online: 18 October 2011� Springer Science+Business Media, LLC 2011
Abstract Information asymmetry and value uncertainty causes high -research and
development (R&D) or high-tech Initial Public Offerings (IPOs) to become underpriced.
Venture capital can serve as a moderator to mitigate the information asymmetry and value
uncertainty to reduce IPO underpricing. High-tech industries significantly contribute to
Taiwan’s economic growth. With the unique Taiwan data, we find that venture-backed
IPOs are less underpriced. More importantly, IPO underpricing due to technology
decreases with the use of venture capital and decreases with the interaction between R&D
expenditure and technology. Technology requirement reduces the underpricing of high-
R&D IPOs. Accordingly, R&D spending reduces the underpricing of high-tech IPOs.
Keywords High-tech firms � Initial public offerings � R&D expenditure � Technology �Venture capital
JEL Classification G24
1 Introduction
R&D is important for firms to gain competitive advantages to develop new markets and to
maintain existing market share, especially for high-tech firms. R&D obviously is crucial
for firm’s future value. High-tech industries are the main engines of Taiwan’s economic
growth. In 2007, the total high-tech industries production in Taiwan is approximately 220
billion US dollars, which is about 12.3% of the GNP of Taiwan and the high-tech stocks
C. S. Lu (&)Graduate Institute of Finance, Economics, and Business Decision,National Kaohsiung University of Applied Sciences, Kaohsiung, Taiwane-mail: [email protected]
L. KaoDepartment of Finance, National University of Kaohsiung, Kaohsiung, Taiwan
A. ChenDepartment of Business Management, National Sun Yat-Sen University, Kaohsiung, Taiwan
123
Rev Quant Finan Acc (2012) 39:423–445DOI 10.1007/s11156-011-0259-7
are the most frequently traded in Taiwan Stock Exchange. Tsai and Wang (2008) suggest
that high-tech firms in Taiwan have put tremendous efforts in R&D to reduce losses and
the threat of technological competition. Consequently, Taiwan provides a good example to
examine the relation between firm value and R&D expenditure from the angle of
technology.
R&D expenditures not only reinforce corporate investments but also create information
asymmetry to outside investors. Compared with investments in tangible assets such as
factories and machinery, investments in intangible assets like R&D will cause information
asymmetry due to the restrictions of accounting assessment methods (Aboody and Lev
2000; Guo et al. 2006). In addition, from the point of view of agency theory, Jensen and
Smith (2000) show that the managers may engage in R&D investments to enhance their
own compensation. As a consequence, apart from improving a firm’s future value, R&D
also brings costs to the firms.
Reducing the uncertainty arising from R&D will be able to mitigate information
asymmetry and to reduce the related costs. Shleifer and Vishny (1997) demonstrate that
external governance mechanisms can ensure R&D beneficial to shareholders. External
monitoring mechanisms, such as venture capitalists, can effectively prevent managers’
opportunistic behaviors and ensure R&D expenditures to favor shareholders (Wright et al.
2002).
Venture capitalists provide more than just money to their portfolio companies. Firstly,
Lerner (1994b) argues that venture capitalists often take an active role in guiding the exit
decision, such as going public and that venture capital enables young firms to go public
when public market valuations are especially high. Loughran and Shive (2010) indicate
that younger firms bear the brunt of the effect of venture capital flows. Secondly, Barry
et al. (1990) and Megginson and Weiss (1991) show that venture capitalists are considered
to monitor managers and thus to certify firm value. Lerner (1995) further indicates that
venture capitalists might serve as directors when future of the venture-backed firm
becomes more uncertain. Consequently, for IPOs, where information asymmetry between
investors and issuers is extreme, monitoring and certification through venture capital are
even more important. Shu et al. (2011) confirm the reputation effect associated with
venture capital in IPOs. The venture capitalist’s reputation also helps to attract a presti-
gious underwriter for an initial public offering and ease information asymmetry leading to
less underpricing (Megginson and Weiss 1991; Lerner 1994a).
Chang and Su (2010) argue that R&D is not always beneficial. R&D induces infor-
mation asymmetry and thus raises IPO underpricing. Guo et al. (2006) indicate that an
issuer’s R&D expenditure is the main source of information asymmetry of an IPO. Chin
et al. (2006) also argue that innovation capital regulations result in accounting information
asymmetry and suggest that the greater the R&D expenditure of the issuer in Taiwan, the
greater the underpricing of its IPO.
There usually exists a high level of information asymmetry in the IPOs of high-tech
firms, which in turn leads to a relatively large amount of underpricing (Lowry and Schwert
2002). Tsai and Wang (2004) indicate that technologies and products are updated rapidly in
the dynamic competitive environment of Taiwan’s high-tech industries and that R&D can
give a significant boost to a high-tech firm’s competitive advantage.
IPOs in Taiwan are seriously underpriced (Loughran et al. 1994)1 and high-tech
industries drive the growth of Taiwan’s economy. The accumulated capitals created by
venture capitalists exceed 75 billion US dollars, which is about 19% of Taiwan GDP in
1 Loughran et al. updated the average initial returns of IPOs in 39 countries in the world in 2006.
424 C. S. Lu et al.
123
2007. Up to 2007, 49.6% of high-tech listed firms are venture-backed and 50.4% of high-
tech listed firms are non-venture-backed. Venture Capital contributes substantially to the
Taiwan economy. As a result, Taiwan IPO markets provide a good data sample to
investigate the effect of R&D on IPO underpricing through the moderating effects of
technology and venture capital. Although prior studies have ever examined the relationship
between R&D spending and IPO underpricing (Chin et al. 2006; Guo et al. 2006) or the
relationship between venture-backing and IPO underpricing (Megginson and Weiss 1991),
previous studies did not introduce the role of technology requirement nor examine the
moderating effect among R&D, venture capital, and technology on IPO underpricing. This
paper contributes to the literature by filling this gap. We investigate the effect of R&D on
IPO underpricing through the interaction effects of technology and venture capital. We
explore whether venture backing influences the relationship between R&D and IPO
underpricing and the relationship between technology and IPO underpricing. We further
investigate if the interaction between technology and R&D expenditure influences IPO
underpricing due to technology requirement or R&D spending.
Using a sample of 938 Taiwanese IPOs during 1992–2005, we find that venture capi-
talists influence the relationship between technology and IPO underpricing. The results
demonstrate that venture capital backing can signal the value of high-tech firms to
investors, which can lessen the information asymmetry due to technology. Moreover, we
show that the interaction between technology and R&D influences IPO underpricing due to
technology requirement or R&D spending. An IPO with both high technology and high
R&D spending will experience a less underpricing than an IPO only has either high R&D
spending or high technology because of the interaction between technology and R&D
spending.
The remainder of the paper is organized as follows. Section 2 describes Taiwan stock
markets. Section 3 develops hypotheses. Data source and variable measurement are
described in Sect. 4. Methodologies and results are presented in Sect. 5. Section 6 dis-
cusses the sensitivity tests. Finally, Sect. 7 concludes.
2 Taiwan stock markets
Taiwan stock markets were established in 1961. During the early period, Taiwan stock
markets were very sloppy with few stocks traded and small market capitalization. How-
ever, since 1990s numerous firms have listed on the markets each year and the transactions
and turnover have increased considerably. As of December 31st 2009, Taiwan stock
markets had 1,287 listed companies with a combined market capitalization of 764 billion
US dollars.
Unlike the stock markets in developed countries, individual investors play a significant
role in Taiwan stock markets. As of 31 December 2009, 42% of the capital of listed firms
was owned by domestic individual investors and 36% of the transactions were traded by
domestic individual investors. Investors in Taiwan are generally considered as less
informed and more sentimental.
Claessens et al. (2000) indicate that the controlling shareholders (or controlling fami-
lies) in Taiwan typically gain control by pyramid structure and cross-holding. Separation of
management from ownership control is rare. Even though there is a separation between
ownership and management, there is no separation between control and management in
Taiwan.
R&D, venture capital, and technology on IPO underpricing 425
123
IPOs in Taiwan can be offered to the market through either auction or fixed-price
method. Book-building was not allowed for IPO underwriting in Taiwan until October
2005. Even though auction method is allowed, auctions have been losing market shares in
IPO markets and are barely used. More than 90% of Taiwan IPOs are issued by the fixed-
price method. Only domestic individual investors can subscribe to fixed-priced IPO shares.
For over-subscribed IPOs, winners are determined by public lottery drawing. Allocation
winners have 7 days to decide to withdraw from their allocations or to pay for their
allocations. If a firm-commitment offering is over-subscribed and all the winners pay for
their allocations, the IPO distribution is completed. If the offering is under-subscribed or
some of the winners withdraw from their allocations, the underwriters have to purchase the
unpaid or unsubscribed shares (Lin et al. 2010).
3 Hypotheses development
Ritter (1998) and Ljungqvist and Wilhelm (2002), document that IPOs are underpriced in
many countries. Chen et al. (2002) show that Taiwan IPOs are deliberately underpriced.
IPO underpricing is generally attributed to information asymmetry. High-tech IPOs are
subject to higher underpricing since high-tech firms usually experience relatively higher
risk (Lowry and Schwert 2002). Lowry and Shu (2002) attribute the severe underpricing of
high-tech IPOs to the uncertainty concerning a high-tech firm’s future growth opportuni-
ties. Chen et al. (2007) confirm the arguments of prior studies (Lowry and Schwert 2002;
Lowry and Shu 2002) and demonstrate that IPOs of high-tech industry in Taiwan such as
electronics industry are more underpriced than those of other industries.
Venture capitalists serve as an independent governance mechanism to monitor the
management (Amit et al. 1998; Bouresli et al. 2002). Megginson and Weiss (1991) argue
that the certification role of venture capitalists enhances firm value, reduces information
asymmetry, and thus reduces IPO underpricing.
High-tech IPOs need to be more underpriced due to higher uncertainty about their
future. However, high-tech IPOs can employ the assistance of venture capitalists to reduce
the uncertainty and thereby lessen the underpricing. As a consequence, our Hypotheses 1a
and 1b are as follows:
Hypothesis 1a: High-tech IPOs are more underpriced.
Hypothesis 1b: Venture capitalists can lessen the uncertainty attached to high-tech IPOs
and thereby lessen underpricing of high-tech IPOs.
Aboody and Lev (2000) point out that R&D is a source of information asymmetry
between investors and managers. Guo et al. (2006) further argue that the R&D expendi-
tures of an IPO firm are the main source for IPO information asymmetry. Chin et al. (2006)
confirm the argument of Guo et al. (2006) with evidence from Taiwan indicating that the
accounting information asymmetry from innovation capital regulations leads to the fact
that IPOs of high R&D expenditure are more underpriced in Taiwan.
Hausman et al. (1984) and Chin et al. (2006) express a strong association between R&D
expenditures and patent counts. Patent statistics are considered as a direct measure of
R&D’s effectiveness. Chin et al. (2006) also find that pre-IPO R&D expenditures, granted
patents count, and patent citations are significantly related to IPO underpricing. Even
though R&D expenditures cause information asymmetry leading to the depreciation of firm
value, the patent creation owing to R&D expenditure raises firm value. Kortum and Lerner
426 C. S. Lu et al.
123
(2000) find that venture capital activities increase the patenting rates. Loughran and Shive
(2010) also document that high patent production firms receive venture capital money and
that venture capital can lead to innovations of new technologies or patents.
Venture capitalists can monitor R&D expenditures to favor shareholders (Wright et al.
2002). Venture capital has an important supervisory role between R&D and firm perfor-
mance (Gomez-Mejia et al. 2003; Le et al. 2006). The participation of venture capitalists
can signal the value of R&D and thus alleviate the information asymmetry caused by
R&D. We, thus, infer that venture capital has an effect on the relationship between R&D
expenditure and IPO underpricing and can reduce IPO underpricing due to R&D.
Hypotheses 2a and 2b are as follows:
Hypothesis 2a: High-R&D IPOs are more underpriced.
Hypothesis 2b: Venture capitalists can lessen the uncertainty attached to high-R&D
IPOs and thereby lessen underpricing of high-R&D IPOs.2
High-tech firms urgently need the support of R&D to create profits (Han and Chuang
2011; Wallin and Gilman 1986; Zahra 1996; Zahra and Bogner 2000). Duysters and
Hagedoorn (2000) even argue that R&D is the resource of competitive advantage in high-
tech industry. Investors generally assess higher valuation on R&D activities of high-tech
firms than those of non-tech firms (Chan et al. 1990; Zantout and Tsetsekos 1994;
Szewczyk et al. 1996). Furthermore, Tsai and Wang (2004) indicate that technologies and
products are updated rapidly in Taiwan’s high-tech industries and that R&D significantly
supports a high-tech firm’s competitive advantage. Tsai and Wang (2008) further dem-
onstrate that high-tech firms in Taiwan have put tremendous efforts in R&D to reduce
losses and the threat of technological competition.
To show that a firm with high technology and high R&D spending will experience a less
information asymmetry than a firm only has either high R&D spending or high technology,
we examine the uncertainty of cash flows of firms with respect to technology and R&D
spending.3 The uncertainty of cash flows is measured by the standard deviation of quarterly
cash flows from operations to lagged assets of the listed firms in Taiwan during the period
from 1993 to 2010. Table 1 reports the descriptive statistics of the uncertainty of cash
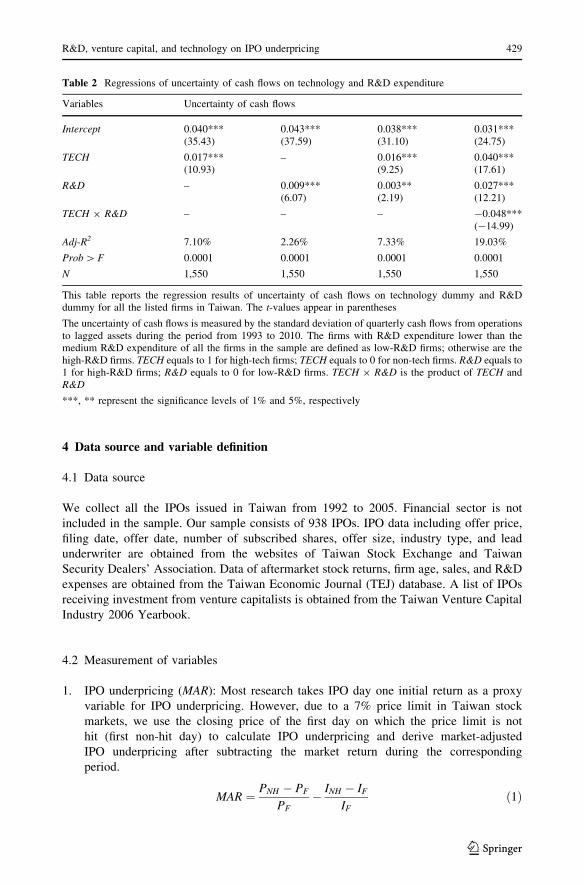
flows of firms by technology and R&D expenditure, while Table 2 expresses the regression
results of uncertainty of cash flows on technology and R&D expenditure.
Panel A of Table 1 shows that the uncertainty of cash flows of high tech firms (high-
R&D firms) is higher than that of non-tech firms (low-R&D firms). However, Panels B and
C of Table 1 further demonstrate that the uncertainty of cash flows of firms with high-tech
and high-R&D (mean = 0.051) is lower that that of firms with high-tech and low-R&D
(mean = 0.072) and lower than that of non-tech and high-R&D (mean = 0.059). Table 2
further indicates that technology and R&D spending are both positively related to the
uncertainty of cash flows. However, the interaction of R&D spending and technology is
negatively related to the uncertainty of cash flows (coefficient = -0.048, t value =
-14.99).
2 Ideally, we should also test if patent creation can lessen the uncertainty attached to high-R&D IPOs andthereby lessen underpricing of high-R&D IPOs. However, the data of patent counts or patent citations ofIPO firm in Taiwan are not available to us. The Intellectual Property Office of Ministry of Economic Affairsin Taiwan started to report patent statistics in 2001. The patent data in the early 2000 s are not complete andnot quite reliable. How patent creation influences the underpricing of IPOs related to R&D expenditure isthus deferred to future research.3 We thank an anonymous referee for suggesting this idea to us.
R&D, venture capital, and technology on IPO underpricing 427
123
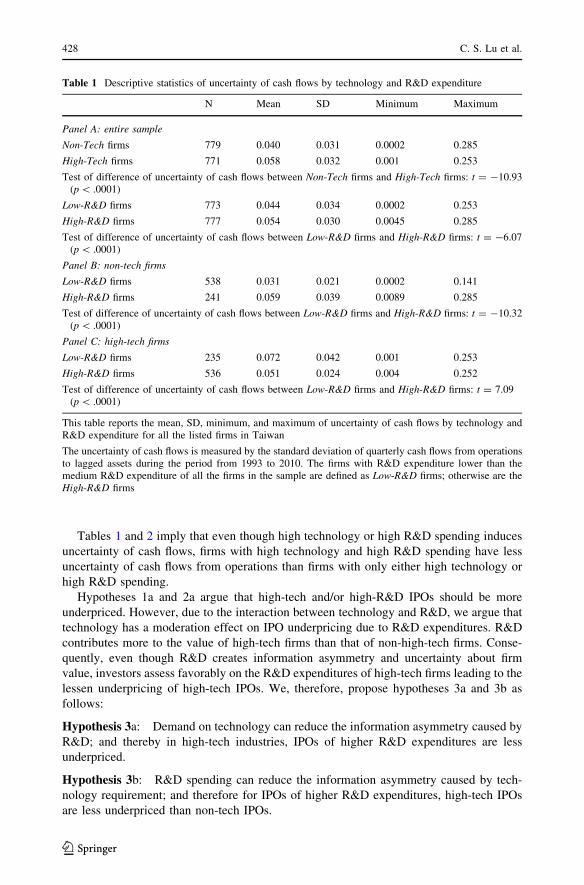
Tables 1 and 2 imply that even though high technology or high R&D spending induces
uncertainty of cash flows, firms with high technology and high R&D spending have less
uncertainty of cash flows from operations than firms with only either high technology or
high R&D spending.
Hypotheses 1a and 2a argue that high-tech and/or high-R&D IPOs should be more
underpriced. However, due to the interaction between technology and R&D, we argue that
technology has a moderation effect on IPO underpricing due to R&D expenditures. R&D
contributes more to the value of high-tech firms than that of non-high-tech firms. Conse-
quently, even though R&D creates information asymmetry and uncertainty about firm
value, investors assess favorably on the R&D expenditures of high-tech firms leading to the
lessen underpricing of high-tech IPOs. We, therefore, propose hypotheses 3a and 3b as
follows:
Hypothesis 3a: Demand on technology can reduce the information asymmetry caused by
R&D; and thereby in high-tech industries, IPOs of higher R&D expenditures are less
underpriced.
Hypothesis 3b: R&D spending can reduce the information asymmetry caused by tech-
nology requirement; and therefore for IPOs of higher R&D expenditures, high-tech IPOs
are less underpriced than non-tech IPOs.
Table 1 Descriptive statistics of uncertainty of cash flows by technology and R&D expenditure
N Mean SD Minimum Maximum
Panel A: entire sample
Non-Tech firms 779 0.040 0.031 0.0002 0.285
High-Tech firms 771 0.058 0.032 0.001 0.253
Test of difference of uncertainty of cash flows between Non-Tech firms and High-Tech firms: t = -10.93(p \ .0001)
Low-R&D firms 773 0.044 0.034 0.0002 0.253
High-R&D firms 777 0.054 0.030 0.0045 0.285
Test of difference of uncertainty of cash flows between Low-R&D firms and High-R&D firms: t = -6.07(p \ .0001)
Panel B: non-tech firms
Low-R&D firms 538 0.031 0.021 0.0002 0.141
High-R&D firms 241 0.059 0.039 0.0089 0.285
Test of difference of uncertainty of cash flows between Low-R&D firms and High-R&D firms: t = -10.32(p \ .0001)
Panel C: high-tech firms
Low-R&D firms 235 0.072 0.042 0.001 0.253
High-R&D firms 536 0.051 0.024 0.004 0.252
Test of difference of uncertainty of cash flows between Low-R&D firms and High-R&D firms: t = 7.09(p \ .0001)
This table reports the mean, SD, minimum, and maximum of uncertainty of cash flows by technology andR&D expenditure for all the listed firms in Taiwan
The uncertainty of cash flows is measured by the standard deviation of quarterly cash flows from operationsto lagged assets during the period from 1993 to 2010. The firms with R&D expenditure lower than themedium R&D expenditure of all the firms in the sample are defined as Low-R&D firms; otherwise are theHigh-R&D firms
428 C. S. Lu et al.
123
4 Data source and variable definition
4.1 Data source
We collect all the IPOs issued in Taiwan from 1992 to 2005. Financial sector is not
included in the sample. Our sample consists of 938 IPOs. IPO data including offer price,
filing date, offer date, number of subscribed shares, offer size, industry type, and lead
underwriter are obtained from the websites of Taiwan Stock Exchange and Taiwan
Security Dealers’ Association. Data of aftermarket stock returns, firm age, sales, and R&D
expenses are obtained from the Taiwan Economic Journal (TEJ) database. A list of IPOs
receiving investment from venture capitalists is obtained from the Taiwan Venture Capital
Industry 2006 Yearbook.
4.2 Measurement of variables
1. IPO underpricing (MAR): Most research takes IPO day one initial return as a proxy
variable for IPO underpricing. However, due to a 7% price limit in Taiwan stock
markets, we use the closing price of the first day on which the price limit is not
hit (first non-hit day) to calculate IPO underpricing and derive market-adjusted
IPO underpricing after subtracting the market return during the corresponding
period.
MAR ¼ PNH � PF
PF� INH � IF
IFð1Þ
Table 2 Regressions of uncertainty of cash flows on technology and R&D expenditure
Variables Uncertainty of cash flows
Intercept 0.040***(35.43)
0.043***(37.59)
0.038***(31.10)
0.031***(24.75)
TECH 0.017***(10.93)
– 0.016***(9.25)
0.040***(17.61)
R&D – 0.009***(6.07)
0.003**(2.19)
0.027***(12.21)
TECH 9 R&D – – – -0.048***(-14.99)
Adj-R2 7.10% 2.26% 7.33% 19.03%
Prob [ F 0.0001 0.0001 0.0001 0.0001
N 1,550 1,550 1,550 1,550
This table reports the regression results of uncertainty of cash flows on technology dummy and R&Ddummy for all the listed firms in Taiwan. The t-values appear in parentheses
The uncertainty of cash flows is measured by the standard deviation of quarterly cash flows from operationsto lagged assets during the period from 1993 to 2010. The firms with R&D expenditure lower than themedium R&D expenditure of all the firms in the sample are defined as low-R&D firms; otherwise are thehigh-R&D firms. TECH equals to 1 for high-tech firms; TECH equals to 0 for non-tech firms. R&D equals to1 for high-R&D firms; R&D equals to 0 for low-R&D firms. TECH 9 R&D is the product of TECH andR&D
***, ** represent the significance levels of 1% and 5%, respectively
R&D, venture capital, and technology on IPO underpricing 429
123
where PNH is the closing price of the first day on which the price limit is not hit, PF is the
offer price, and INH and IF are the market indexes of the first day on which the price limit is
not hit and the filing date, respectively.
2. Market returns prior to IPO filing date (MKT): The market condition prior to IPO filing
date can be used as public information concerning the determination of IPO offer price
(Lowry and Schwert 2002). This study uses market return 30 days prior to filing date
as an indicator of the market’s condition prior to IPO issuance:
MKT ¼ IF � IF�30
IF�30
ð2Þ
where IF is the market index on the filing date and IF-30 is the market index 30 days prior to
the filing date.
3. Subscription ratio (SUBSCRIPTION): Subscription ratio is a ratio of the number of
shares subscribed by investors to the total number of offered shares of an IPO. The
subscription ratio is used to assess the level of market demand for IPO shares.
SUBSCRIPTION is defined as follows:
SUBSCRIPTION ¼ Number of shares subscribed by investors
Number of IPO shares offered: ð3Þ
4. Offer size (PROC): To take care of information asymmetry source other than R&D
expenditure, we employ offer size, underwriter reputation, and IPO age as control
variables in our empirical design. Beatty and Ritter (1986) and Hanley (1993) use offer
size to assess IPO risk about information asymmetry and find that the larger the offer
size, the smaller the risk of information asymmetry and the less IPO underpricing. We
use the logarithm of IPO total proceeds to measure offer size.
5. Underwriter reputation (UNDR): Carter and Manaster (1990) demonstrate that
underwriter reputation can reduce the information asymmetry between the issuers
and the investors. Following Megginson and Weiss (1991), we define underwriter’s
market share as a proxy variable for underwriter reputation.
UNDR ¼ Total proceeds of IPOs underwritten by a certain underwriter
Total IPO proceeds during the sample periodð4Þ
6. Age of IPO firm (AGE): Beatty and Ritter (1986) suggest that the longer a firm has
been in existence, the better the market can gauge its business performance, which
reduces information asymmetry between the issuer and the investors. We use the
logarithm of years of an IPO from its establishment to the time of filing issuance plus
one as a proxy variable for the firm age.4
4 One is added before logging to avoid taking logarithm of zeroes.
430 C. S. Lu et al.
123
7. Venture capital (VC): VC = 1 if an IPO is venture-backed; otherwise VC = 0.
8. Demand on technology (TECH): We use a high-tech industry dummy variable as a proxy
for demand on technology. TECH = 1 if an IPO is in a high-tech industry according to
Taiwan National Science Council’s categories, i.e. pharmaceutical, OA, computer
equipment, electronics and communications, medical equipment, precision machinery,
optoelectronics equipment, or aerospace industry; otherwise TECH = 0. High-tech
IPOs are assumed to have higher demand on technology than non-high-tech IPOs.
9. R&D intensity (RD): Following Wallin and Gilman (1986) and Guo et al. (2006), we
use the ratio of R&D expenses to sales during the year prior to issuance to assess firms’
R&D; RD is defined as follows5:
RD ¼ ln 1þ RDE
SALES� 100
� �ð5Þ
where RDE and SALES are respectively R&D expenses and sales of the year prior to IPO
issuance.
5 Empirical methodologies and results
The interaction terms of variables in regression models are used to examine the moderating
effects on the relationship between the dependent and independent variables. The signif-
icant interaction terms imply moderating effects. However, the multicollinearity due to
high correlation between the main effect and its cross-product terms is often encountered
with the moderated regressions. We thus further employ the cross-product residual-cen-
tering approach suggested by Lance (1988) to avoid the multicollinearity problem in our
moderated regressions.
5.1 Descriptive statistics
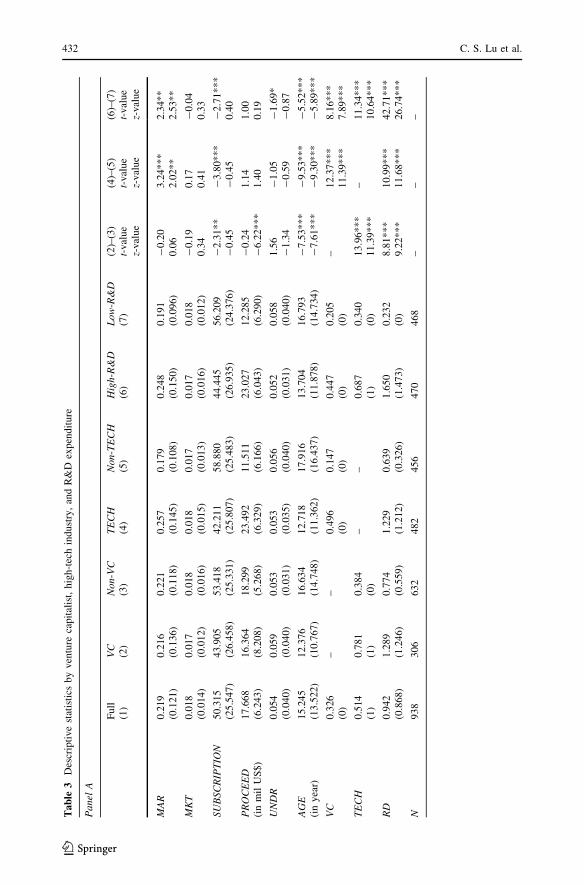
Panel A of Table 3 presents descriptive statistics for the full sample and subsamples by
venture backing, technology, and R&D spending. Panels B and C present the statistics for
the double classification between venture backing, technology, and R&D spending. Panel A
reveals that the average IPO initial return is 21.9%, which indicates that Taiwan’s IPOs are
underpriced. In addition, the average (median) underpricing levels of high-tech and high-
R&D IPOs are 25.7% (14.5%) and 24.8% (15.0%) respectively, which are higher than those
of non-high-tech and low-R&D IPOs implying that the IPOs in high-tech industries and/or
with high levels of R&D expenditure have greater information asymmetry problems.
Positive market return prior to IPO filing implies that firms tend to go public during the bull
markets. The average subscription ratio is 50.315. Note that the average subscription ratio
for non venture-backed IPOs is 53.418, while for venture-backed IPOs is a surprisingly low
at 43.905. Moreover, non-high-tech and low-R&D IPOs have subscription ratios of 58.880
and 56.209 respectively, higher than the corresponding figures for high-tech and high-R&D
IPOs indicating that investors have a greater preference for low-risk IPOs.
5 See footnote 4.
R&D, venture capital, and technology on IPO underpricing 431
123
Ta
ble
3D
escr
ipti
ve
stat
isti
csby
ven
ture
capit
alis
t,hig
h-t
ech
indust
ry,
and
R&
Dex
pen
dit
ure
Pa
nel
A
Fu
ll(1
)V
C(2
)N
on-V
C(3
)T
EC
H(4
)N
on-T
EC
H(5
)H
igh-
R&
D(6
)L
ow
-R&
D(7
)(2
)–(3
)t-
val
ue
z-val
ue
(4)–
(5)
t-val
ue
z-v
alu
e
(6)–
(7)
t-v
alu
ez-
val
ue
MA
R0
.219
(0.1
21)
0.2
16
(0.1
36
)0
.221
(0.1
18)
0.2
57
(0.1
45)
0.1
79
(0.1
08
)0
.24
8(0
.15
0)
0.1
91
(0.0
96)
-0
.20
0.0
63
.24*
**
2.0
2*
*2
.34*
*2
.53*
*
MK
T0
.018
(0.0
14)
0.0
17
(0.0
12
)0
.018
(0.0
16)
0.0
18
(0.0
15)
0.0
17
(0.0
13
)0
.01
7(0
.01
6)
0.0
18
(0.0
12)
-0
.19
0.3
40
.17
0.4
1-
0.0
40
.33
SU
BSC
RIP
TIO
N5
0.3
15
(25
.547
)4
3.9
05
(26
.45
8)
53
.41
8(2
5.3
31
)4
2.2
11
(25
.807
)5
8.8
80
(25
.48
3)
44
.44
5(2
6.9
35
)5
6.2
09
(24
.376
)-
2.3
1*
*-
0.4
5-
3.8
0*
**
-0
.45
-2
.71*
**
0.4
0
PR
OC
EE
D(i
nm
ilU
S$
)1
7.6
68
(6.2
43)
16
.36
4(8
.20
8)
18
.29
9(5
.26
8)
23
.49
2(6
.32
9)
11
.51
1(6
.16
6)
23
.02
7(6
.04
3)
12
.28
5(6
.29
0)
-0
.24
-6
.22*
**
1.1
41
.40
1.0
00
.19
UN
DR
0.0
54
(0.0
40)
0.0
59
(0.0
40
)0
.053
(0.0
31)
0.0
53
(0.0
35)
0.0
56
(0.0
40
)0
.05
2(0
.03
1)
0.0
58
(0.0
40)
1.5
6-
1.3
4-
1.0
5-
0.5
9-
1.6
9*
-0
.87
AG
E(i
ny
ear)
15
.24
5(1
3.5
22
)1
2.3
76
(10
.76
7)
16
.63
4(1
4.7
48
)1
2.7
18
(11
.362
)1
7.9
16
(16
.43
7)
13
.70
4(1
1.8
78
)1
6.7
93
(14
.734
)-
7.5
3*
**
-7
.61*
**
-9
.53*
**
-9
.30*
**
-5
.52*
**
-5
.89*
**
VC
0.3
26
(0)
––
0.4
96
(0)
0.1
47
(0)
0.4
47
(0)
0.2
05
(0)
–1
2.3
7*
**
11
.39
**
*8
.16*
**
7.8
9*
**
TE
CH
0.5
14
(1)
0.7
81
(1)
0.3
84
(0)
––
0.6
87
(1)
0.3
40
(0)
13
.96
**
*1
1.3
9*
**
–1
1.3
4*
**
10
.64
**
*
RD
0.9
42
(0.8
68)
1.2
89
(1.2
46
)0
.774
(0.5
59)
1.2
29
(1.2
12)
0.6
39
(0.3
26
)1
.65
0(1
.47
3)
0.2
32
(0)
8.8
1*
**
9.2
2*
**
10
.99
**
*1
1.6
8*
**
42
.71
**
*2
6.7
4*
**
N9
38
30
66
32
48
24
56
47
04
68
––
–
432 C. S. Lu et al.
123
Ta
ble
3co
nti
nu
ed
Pa
nel
B
VC
/T
EC
H(1
)
No
n-V
C/
TE
CH
(2)
VC
/N
on-T
EC
H(3
)
No
n-V
C/
No
n-T
EC
H(4
)
VC
/H
igh-R
&D
(5)
No
n-V
C/
Hig
h-R
&D
(6)
(1)–
(2)
t-v
alu
ez-
val
ue
(3)–
(4)
t-v
alu
ez-
val
ue
(5)–
(6)
t-v
alu
ez-
val
ue
MA
R0
.221
(0.1
44)
0.2
92
(0.1
46)
0.1
96
(0.0
97)
0.1
76
(0.1
08)
0.2
40
(0.1
47
)0
.254
(0.1
51)
-1
.87
*1
.05
0.4
80
.08
-0
.40
-0
.49
MK
T0
.020
(0.0
13)
0.0
16
(0.0
15)
0.0
05
(0.0
04)
0.0
19
(0.0
16)
0.0
14
(0.0
12
)0
.020
(0.0
21)
0.3
9-
0.1
8-
1.0
5-
1.2
0-
0.6
5-
0.8
3
SU
BSC
RIP
TIO
N4
1.9
08
(25
.227
)4
2.5
09
(26
.449
)5
1.0
31
(29
.900
)6
0.2
32
(24
.277
)4
5.5
87
(27
.82
7)
43
.52
3(2
6.6
01
)-
0.1
30
.01
-1
.14
1.0
70
.42
0.6
8
PR
OC
EE
D(i
nm
ilU
S$
)5
66
.98
0(2
64
.60
0)
93
3.4
57
(14
6.9
70
)3
69
.09
6(2
62
.08
0)
36
8.2
30
(19
0.4
02
)5
21
.82
1(2
59
.21
5)
91
0.5
78
(14
9.0
10
)-
0.5
5-
6.3
0*
**
0.0
21
.84
*-
0.6
3-
5.5
9*
**
UN
DR
0.0
60
(0.0
44)
0.0
45
(0.0
31)
0.0
52
(0.0
31)
0.0
57
(0.0
40)
0.0
55
(0.0
31
)0
.049
(0.0
40)
3.3
9*
**
2.7
2*
**
-0
.68
-1
.01
1.2
4-
0.6
9
AG
E(i
ny
ear)
11
.12
0(9
.59
5)
14
.29
0(1
3.3
42
)1
6.8
56
(15
.504
)1
8.0
98
(16
.666
)1
1.1
71
(9.6
10
)1
5.7
49
(14
.451
)-
4.7
5*
**
-5
.07
**
*-
1.0
3-
0.8
1-
6.3
0*
**
-6
.05*
**
TE
CH
––
––
0.8
24
(1)
0.5
77
(0)
––
6.1
0*
**
5.7
3*
**
RD
1.3
37
(1.2
73)
1.1
23
(1.0
91)
1.1
19
(0.9
21)
0.5
56
(0.1
09)
1.6
93
(1.5
55
)1
.615
(1.3
96)
2.9
0*
**
2.9
0*
**
4.6
1*
**
5.4
4*
**
1.2
91
.74*
N2
39
24
36
73
89
21
02
60
––
–
Pa
nel
C
Hig
h-R
&D
/T
EC
H(1
)
Lo
w-R
&D
/T
EC
H(2
)
No
n-T
EC
H/
Hig
h-R
&D
(3)
No
n-T
EC
H/
Lo
w-R
&D
(4)
(1)–
(2)
t-v
alu
ez-
val
ue
(1)–
(3)
t-val
ue
z-v
alu
e
(3)–
(4)
t-v
alu
ez-
val
ue
(2)–
(4)
t-v
alu
ez-
val
ue
MA
R0
.264
(0.1
67
)0
.244
(0.0
99)
0.2
12
(0.1
37)
0.1
63
(0.0
95
)0
.48
-1
.16
1.5
00
.74
1.6
01
.55
2.0
4*
*0
.90
R&D, venture capital, and technology on IPO underpricing 433
123
Ta
ble
3co
nti
nu
ed
Pa
nel
C
Hig
h-R
&D
/T
EC
H(1
)
Lo
w-R
&D
/T
EC
H(2
)
No
n-T
EC
H/
Hig
h-R
&D
(3)
No
n-T
EC
H/
Lo
w-R
&D
(4)
(1)–
(2)
t-val
ue
z-v
alu
e
(1)–
(3)
t-v
alu
ez-
val
ue
(3)–
(4)
t-v
alu
ez-
val
ue
(2)–
(4)
t-v
alu
ez-
val
ue
MK
T0
.024
(0.0
20)
0.0
07
(0.0
02
)0
.004
(0.0
11)
0.0
23
(0.0
17)
1.6
8*
1.8
7*
2.0
3*
*1
.92*
-1
.88
*-
1.6
0-
1.5
6-
1.4
5
SU
BSC
RIP
TIO
N4
2.4
56
(26
.208
)4
1.7
13
(25
.30
7)
48
.81
5(2
8.3
06
)6
3.6
69
(24
.277
)0
.15
-0
.52
-1
.12
-0
.45
-2
.10
**
0.3
7-
3.3
6*
**
0.3
0
PR
OC
EE
D(i
nm
ilU
S$
)9
16
.35
5(2
03
.94
0)
41
7.3
33
(18
4.1
10
)3
42
.51
8(1
72
.15
0)
38
0.6
50
(20
5.9
20
)1
.00
-0
.51
1.1
51
.87*
-0
.72
0.9
60
.54
-0
.21
UN
DR
0.0
51
(0.0
31)
0.0
56
(0.0
40
)0
.052
(0.0
31)
0.0
58
(0.0
40)
0.9
90
.21
-0
.26
0.0
6-
1.0
8-
0.7
3-
0.4
40
.47
AG
E(i
ny
ear)
12
.08
7(1
0.7
34
)1
4.0
01
(12
.66
0)
17
.25
7(1
5.9
48
)1
8.2
30
(16
.641
)-
2.6
5*
**
-3
.08*
**
-6
.04*
**
-5
.99*
**
-1
.07
-1
.07
-5
.35
**
*-
5.0
5*
**
VC
0.5
36
(1)
0.4
15
(0)
0.2
52
(0)
0.0
97
(0)
2.5
0*
*2
.49
**
6.2
5*
**
5.7
3*
**
3.9
0*
**
4.3
5*
**
7.4
5*
**
8.0
6*
**
RD
1.6
68
(1.5
38)
0.3
37
(0.3
11
)1
.609
(1.3
94)
0.1
77
(0)
31
.93
**
*1
7.8
8*
**
0.8
22
.24*
*2
1.8
7*
**
17
.83
**
*5
.38*
**
5.2
5*
**
N3
23
15
91
47
30
9–
––
–
Th
ista
ble
rep
ort
sth
em
ean
and
med
ian
of
IPO
char
acte
rist
ics
incl
ud
ing
mar
ket
-ad
just
edin
itia
lre
turn
,m
ark
etco
nd
itio
nb
efo
reis
suan
cep
roce
eds,
ov
ersu
bsc
rip
tion
rate
,p
roce
eds,
un
der
wri
ter
repu
tati
on
,fi
rmag
e,v
entu
reca
pit
al,te
chd
um
my
,an
dR
&D
inte
nsi
tyb
ased
on
the
ven
ture
bac
kin
g,te
chno
log
y,an
dR
&D
exp
end
itu
res.
Wh
ile
Pan
els
Ban
dC
pre
sent
the
stat
isti
csfo
rth
edouble
clas
sifi
cati
on
bet
wee
nven
ture
bac
kin
g,te
chnolo
gy,an
dR
&D
spen
din
g.M
eans
of
the
var
iable
sar
epre
sente
din
the
tab
le.In
bra
cket
sar
eth
em
edia
no
fth
ev
aria
ble
s.T
he
t -v
alu
ean
dz-
val
ue
are
from
dif
fere
nce
inm
eans
and
med
ian
test
sre
spec
tiv
ely
MA
Ris
mar
ket
-ad
just
edin
itia
lre
turn
mea
sure
dfr
om
off
erp
rice
toth
efi
rst
no
n-h
itcl
osi
ng
pri
ce.M
KT
defi
ned
asth
em
ark
etco
nd
itio
nb
efo
reis
suan
cem
easu
red
by
the
mar
ket
retu
rn3
0d
ays
bef
ore
the
fili
ng
dat
e.SU
BSC
RIP
TIO
Nis
oper
atio
nal
lyd
efined
asnum
ber
of
shar
essu
bsc
ribed
div
ided
by
the
num
ber
of
shar
esoff
ered
.P
RO
CE
ED
den
ote
sth
eIP
Op
roce
ed.
UN
DR
isu
nd
erw
rite
rre
pu
tati
on
and
defi
ned
asth
em
ark
etsh
are
of
ace
rtai
nu
nd
erw
rite
r.A
GE
isan
IPO
age
atis
suan
ce.
VC
equ
als
to1
ifan
IPO
wit
hV
C-
bac
kin
g,
and
0if
hav
en
oV
Cin
vo
lvem
ent
atth
eIP
O.T
EC
Heq
ual
sto
1if
anIP
Obel
ongs
toa
hig
h-t
ech
indust
ryan
d0
oth
erw
ise.
RD
isth
en
atu
ral
logar
ith
mo
fo
ne
plu
sR
DS
91
00
,w
her
eR
DS
=(R
&D
expen
ses/
sale
sof
the
yea
rpri
or
toIP
Ois
suan
ce).
Hig
h-R
&D
den
ote
sth
eh
igh
R&
Din
ten
sity
sub
gro
up
,if
R&
Din
ten
sity
isab
ov
em
edia
n(w
hic
hw
as0
.86
8).
Lo
w-R
&D
den
ote
sth
elo
wR
&D
inte
nsi
tysu
bgro
up
,if
the
RD
isle
ssth
an0
.868
***,
**,
and
*re
pre
sent
the
signifi
cance
level
sof
1%
,5%
,an
d10%
,re
spec
tivel
y
434 C. S. Lu et al.
123
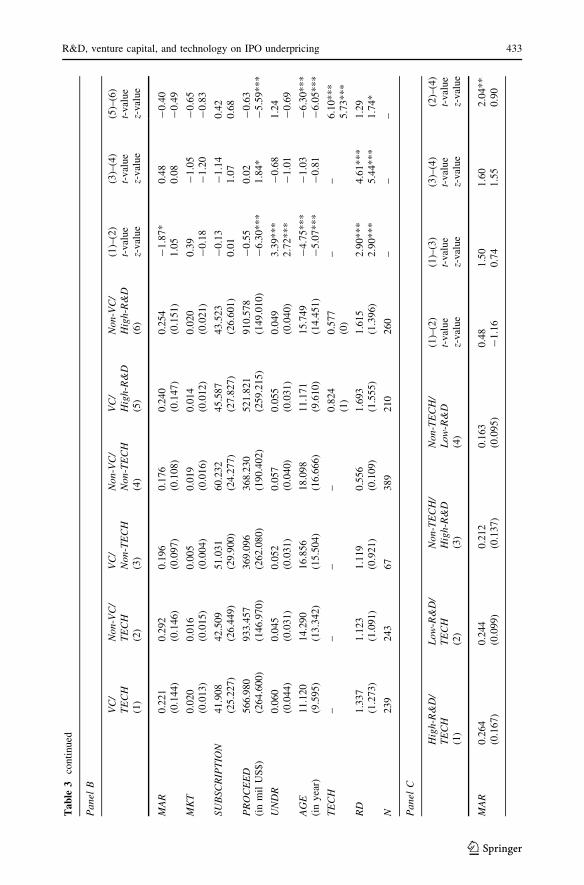
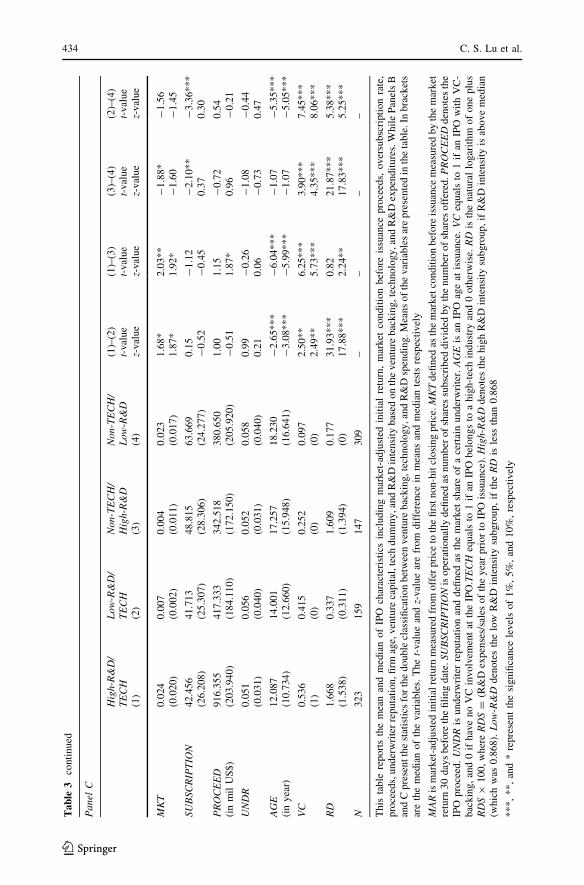
Underwriter reputation of low-R&D IPOs (UNDR = 0.058) is higher than that of for
high-R&D IPOs (UNDR = 0.052). Venture-backed, high-tech, and high-R&D IPOs are
younger. 32.6% of entire sample is venture-backed, while 49.6% of the high-tech IPOs are
venture-backed, much higher than the corresponding figure of 14.7% for non-high-tech
firms. This indicates that venture capitalists prefer to invest in high-tech firms. Moreover,
44.7% of the high-R&D IPOs are venture-backed, higher than the corresponding figure of
20.5% for low-R&D IPOs. High-tech IPOs account for more than half (51.4%) of the IPOs
in the sample. Among high-R&D IPOs, high-tech IPOs account for 68.7%, which are
higher than the 34.0% of low-R&D IPOs. Finally, the average (median) R&D intensity for
the whole sample is 0.942 (0.868), while the R&D intensity of venture-backed IPOs is
1.289 (1.246), which is much higher than that of non-venture-backed IPOs. This reveals
that venture capital backing indeed induces managers to make relatively larger investments
in R&D.
Panel B indicates that VC/TECH IPOs are less underpriced than Non-VC/TECH IPOs
(22.1% vs. 29.2%) implying that venture backing reduces the uncertainty of high-tech IPOs
and thus reduces their underpricing. The underpricing between VC/Non-TECH and Non-
VC/Non-TECH IPOs is not significantly different. Since non-tech IPOs do not experience
severe information asymmetry, they do not need the certification support from the venture
capitalists. The underprcing between VC/High-RD and Non-VC/High-RD IPOs is not
significantly different implying that the way of venture capital influencing the relation
between IPO underpricing and technology is different from that between IPO underpricing
and R&D spending. Panel C demonstrates that IPO underpricing is not significantly dif-
ferent between the double classification by technology and R&D spending. The univariate
results confirm the single classification roles but not the double classification roles of
venture capital, technology, and R&D spending in IPO underpricing. We thus further
conduct the multivariate analyses to examine the interaction among venture capital,
technology, and R&D spending on IPO underpricing.
5.2 Moderating effect of venture capital on the relationship between technology
and IPO underpricing
Regression (6) examines the relevant control variables related to IPO underpricing,
including market conditions prior to filing date (MKT), subscription ratio (SUBSCRIP-TION), offer size (PROC), underwrite reputation (UNDR), and age of the IPO (AGE).
MAR ¼ a0 þ a1MKT þ a2SUBSCRIPTION þ a3PROC þ a4UNDRþ a5AGE þ e ð6ÞColumn 1 of Table 4 exhibits that MKT is positively related to IPO underpricing
(t = 8.82) indicating that market condition is simply partly reflected into IPO pricing,
which is consistent with Lowry and Schwert (2002). SUBSCRIPTION is positively related
to IPO underpricing (t = 10.12) supporting the winner’s curse hypothesis, which is con-
sistent with Amihud et al. (2003).
Regression (7) includes the independent and moderating variables of R&D (RD),
venture capital backing (VC), and high-tech industry dummy (TECH).
MAR ¼b0 þ b1MKT þ b2SUBSCRIPTION þ b3PROC þ b4UNDR
þ b5AGE þ b6VC þ b7TECH þ b8RDþ mð7Þ
Column 2 of Table 4 explains that venture capital backing can effectively reduce IPO
underpricing (t = -2.24). The high-tech IPOs are relatively more risky, which ordinarily
R&D, venture capital, and technology on IPO underpricing 435
123
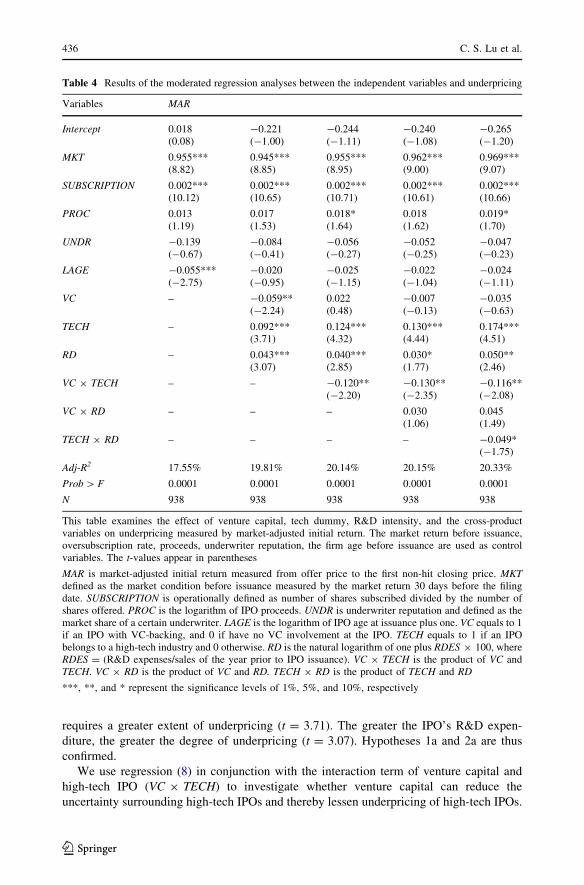
requires a greater extent of underpricing (t = 3.71). The greater the IPO’s R&D expen-
diture, the greater the degree of underpricing (t = 3.07). Hypotheses 1a and 2a are thus
confirmed.
We use regression (8) in conjunction with the interaction term of venture capital and
high-tech IPO (VC 9 TECH) to investigate whether venture capital can reduce the
uncertainty surrounding high-tech IPOs and thereby lessen underpricing of high-tech IPOs.
Table 4 Results of the moderated regression analyses between the independent variables and underpricing
Variables MAR
Intercept 0.018(0.08)
-0.221(-1.00)
-0.244(-1.11)
-0.240(-1.08)
-0.265(-1.20)
MKT 0.955***(8.82)
0.945***(8.85)
0.955***(8.95)
0.962***(9.00)
0.969***(9.07)
SUBSCRIPTION 0.002***(10.12)
0.002***(10.65)
0.002***(10.71)
0.002***(10.61)
0.002***(10.66)
PROC 0.013(1.19)
0.017(1.53)
0.018*(1.64)
0.018(1.62)
0.019*(1.70)
UNDR -0.139(-0.67)
-0.084(-0.41)
-0.056(-0.27)
-0.052(-0.25)
-0.047(-0.23)
LAGE -0.055***(-2.75)
-0.020(-0.95)
-0.025(-1.15)
-0.022(-1.04)
-0.024(-1.11)
VC – -0.059**(-2.24)
0.022(0.48)
-0.007(-0.13)
-0.035(-0.63)
TECH – 0.092***(3.71)
0.124***(4.32)
0.130***(4.44)
0.174***(4.51)
RD – 0.043***(3.07)
0.040***(2.85)
0.030*(1.77)
0.050**(2.46)
VC 9 TECH – – -0.120**(-2.20)
-0.130**(-2.35)
-0.116**(-2.08)
VC 9 RD – – – 0.030(1.06)
0.045(1.49)
TECH 9 RD – – – – -0.049*(-1.75)
Adj-R2 17.55% 19.81% 20.14% 20.15% 20.33%
Prob [ F 0.0001 0.0001 0.0001 0.0001 0.0001
N 938 938 938 938 938
This table examines the effect of venture capital, tech dummy, R&D intensity, and the cross-productvariables on underpricing measured by market-adjusted initial return. The market return before issuance,oversubscription rate, proceeds, underwriter reputation, the firm age before issuance are used as controlvariables. The t-values appear in parentheses
MAR is market-adjusted initial return measured from offer price to the first non-hit closing price. MKTdefined as the market condition before issuance measured by the market return 30 days before the filingdate. SUBSCRIPTION is operationally defined as number of shares subscribed divided by the number ofshares offered. PROC is the logarithm of IPO proceeds. UNDR is underwriter reputation and defined as themarket share of a certain underwriter. LAGE is the logarithm of IPO age at issuance plus one. VC equals to 1if an IPO with VC-backing, and 0 if have no VC involvement at the IPO. TECH equals to 1 if an IPObelongs to a high-tech industry and 0 otherwise. RD is the natural logarithm of one plus RDES 9 100, whereRDES = (R&D expenses/sales of the year prior to IPO issuance). VC 9 TECH is the product of VC andTECH. VC 9 RD is the product of VC and RD. TECH 9 RD is the product of TECH and RD
***, **, and * represent the significance levels of 1%, 5%, and 10%, respectively
436 C. S. Lu et al.
123
MAR ¼c0 þ c1MKT þ c2SUBSCRIPTION þ c3PROC þ c4UNDRþ c5AGE
þ c6VC þ c7TECH þ c8RDþ c9VC � TECH þ lð8Þ
Column 3 of Table 4 indicates that high-tech IPOs are more underpriced (t = 4.32). We
find that the interaction term (VC 9 TECH) is significantly negative (t = -2.20) but VC is
insignificant (t = 0.48) indicating that venture capital can thus lessen the influence of
uncertainty due to technology demand on IPO underpricing, which confirms Hypothesis
1b. Venture capital backing is a moderator and reduces the positive relationship between
technology and IPO underpricing.
5.3 The moderating effect of venture capital of the relationship between R&D and IPO
underpricing
This section employs regression (9) to investigate whether venture capital can induce
investors to assign a higher value to R&D expenditure and thereby lessen IPO
underpricing.
MAR ¼k0 þ k1MKT þ k2SUBSCRIPTION þ k3PROC þ k4UNDRþ k5AGE
þ k6VC þ k7TECH þ k8RDþ k9VC � TECH þ k10VC � RDþ tð9Þ
Column 4 of Table 4 indicates that the greater R&D the higher IPO underpricing
(t = 1.77). Moreover, the interaction term (VC 9 RD) is not significant (t = 1.06) along
with insignificant venture capital (VC) (t = -0.13), which indicates that venture capital
does not directly moderate the form of the relationship between R&D and IPO under-
pricing. This implies that venture capitalists do not directly participate in IPOs’ R&D
decisions (Le et al. 2006).
5.4 Indirect influence of venture capital on the relationship between R&D Intensity
and IPO underpricing
Column 4 of Table 4 implies that venture capital backing does not directly influence the
relationship between R&D and IPO underpricing. Thus, we further investigate if venture
capital indirectly moderates the relationship between R&D and IPO underpricing. Fol-
lowing Sharma et al. (1981) and Le et al. (2006), we divide the entire sample into two
subsets based on venture capital backing.
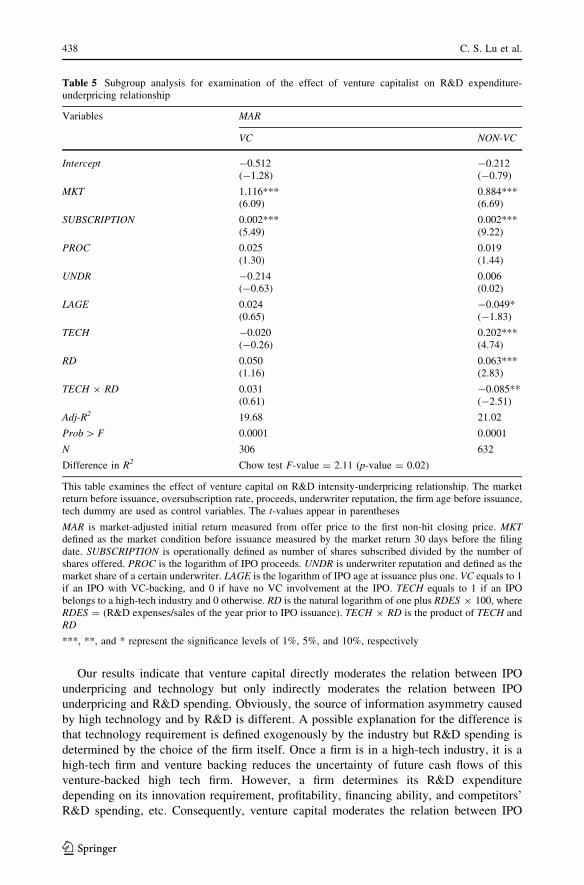
In column 1 of Table 5 for venture-backed IPOs, R&D (RD) is insignificant (t = 1.16).
In contrast, for non-venture-backed IPOs, R&D is significant with t = 2.83. The Chow test
further demonstrates that there is a significant difference in the explanatory power of the
regressions between the two sub-samples (F-value = 2.11). These results suggest that
venture capital can indirectly moderate the relationship between R&D and IPO underpricing
but not directly moderate the relationship. Venture capital is consequently a moderator
variable (homologizer) with regard to the relation between R&D and IPO underpricing
(Sharma et al. 1981; Le et al. 2006), which confirms Hypothesis 2b indirectly.6
6 We also examine the difference between VC/TECH and Non-VC/TECH, VC/Non-TECH and Non-VC/Non-TECH, VC/High-R&D and Non-VC/High-R&D, VC/Low-R&D and Non-VC/Low- R&D, TECH/High-R&D and Non-TECH/High-R&D, TECH/Low-R&D and Non-TECH/Low-R&D by running regres-sions of subsamples of VC versus non-VC, TECH versus Non-TECH, and High-R&D versus Low-R&D. Ourresults are robust to the double classifications between VC, TECH, and R&D expenditure. These results arenot reported in the paper to save space but are available from the author upon request.
R&D, venture capital, and technology on IPO underpricing 437
123
Our results indicate that venture capital directly moderates the relation between IPO
underpricing and technology but only indirectly moderates the relation between IPO
underpricing and R&D spending. Obviously, the source of information asymmetry caused
by high technology and by R&D is different. A possible explanation for the difference is
that technology requirement is defined exogenously by the industry but R&D spending is
determined by the choice of the firm itself. Once a firm is in a high-tech industry, it is a
high-tech firm and venture backing reduces the uncertainty of future cash flows of this
venture-backed high tech firm. However, a firm determines its R&D expenditure
depending on its innovation requirement, profitability, financing ability, and competitors’
R&D spending, etc. Consequently, venture capital moderates the relation between IPO
Table 5 Subgroup analysis for examination of the effect of venture capitalist on R&D expenditure-underpricing relationship
Variables MAR
VC NON-VC
Intercept -0.512(-1.28)
-0.212(-0.79)
MKT 1.116***(6.09)
0.884***(6.69)
SUBSCRIPTION 0.002***(5.49)
0.002***(9.22)
PROC 0.025(1.30)
0.019(1.44)
UNDR -0.214(-0.63)
0.006(0.02)
LAGE 0.024(0.65)
-0.049*(-1.83)
TECH -0.020(-0.26)
0.202***(4.74)
RD 0.050(1.16)
0.063***(2.83)
TECH 9 RD 0.031(0.61)
-0.085**(-2.51)
Adj-R2 19.68 21.02
Prob [ F 0.0001 0.0001
N 306 632
Difference in R2 Chow test F-value = 2.11 (p-value = 0.02)
This table examines the effect of venture capital on R&D intensity-underpricing relationship. The marketreturn before issuance, oversubscription rate, proceeds, underwriter reputation, the firm age before issuance,tech dummy are used as control variables. The t-values appear in parentheses
MAR is market-adjusted initial return measured from offer price to the first non-hit closing price. MKTdefined as the market condition before issuance measured by the market return 30 days before the filingdate. SUBSCRIPTION is operationally defined as number of shares subscribed divided by the number ofshares offered. PROC is the logarithm of IPO proceeds. UNDR is underwriter reputation and defined as themarket share of a certain underwriter. LAGE is the logarithm of IPO age at issuance plus one. VC equals to 1if an IPO with VC-backing, and 0 if have no VC involvement at the IPO. TECH equals to 1 if an IPObelongs to a high-tech industry and 0 otherwise. RD is the natural logarithm of one plus RDES 9 100, whereRDES = (R&D expenses/sales of the year prior to IPO issuance). TECH 9 RD is the product of TECH andRD
***, **, and * represent the significance levels of 1%, 5%, and 10%, respectively
438 C. S. Lu et al.
123
underpricing and technology and the relation between IPO underpricing and R&D
spending differently.
5.5 The interaction between technology and R&D on IPO underpricing
R&D will cause information asymmetry between the firm and investors. However,
investors can give more favorable assessment to the R&D expenditures of the firms that
have stronger demand on technology. Accordingly, technology requirement also causes
information asymmetry between the firm and investors. R&D spending supports the future
growth of high-tech firms and thus investors can assess high-tech IPOs with high R&D
spending favorably. This section investigates whether technology requirement will ease the
information asymmetry caused by its R&D and thereby lessen underpricing of high-R&D
IPOs or whether R&D spending can ease information asymmetry due to technology
requirement and thus reduce underpricing of high-tech IPOs with regression (10).
MAR ¼ h0 þ h1MKT þ h2SUBSCRIPTION þ h3PROC þ h4UNDRþ h5AGE þ h6VCþ h7TECH þ h8RDþ h9VC � TECH þ h10VC � RDþ h11TECH � RDþ x
ð10ÞColumn 5 of Table 4 exhibits that R&D is positively related to IPO underpricing
(t = 2.46). The interaction term (TECH 9 RD) is significantly negative (t = -1.75). In
addition, the significant correlation between the high-tech dummy (TECH) and IPO un-
derpricing (MAR) indicates that technology can thus reduce the uncertainty of R&D on IPO
underpricing, which confirms Hypotheses 3a and 3b. Note that for high-tech IPOs, the
R&D coefficient is only 0.001 (0.050–0.049 = 0.001, RD coefficient of 0.050 plus
TECH 9 RD coefficient of -0.049). This implies that R&D expenditure can hardly raise
underpricing of high-tech IPOs. In contrast, for non-high-tech IPOs, a 1 unit increase in
R&D will increase IPO underpricing by 0.05. This suffices to clarify that demand on
technology indeed influences investors’ assessment of R&D expenditure and can also
influence the underpricing level of IPOs or that R&D spending reduces the underpricing of
high-tech IPOs.
We demonstrate that, for non-venture-backed IPOs, R&D (RD) has relatively significant
explanatory power with regard to IPO underpricing. This implies that, for non-venture-
backed IPOs, R&D is indeed positively correlated with IPO underpricing, which explains
much of the variation in IPO underpricing. Nevertheless, there is no significant correlation
between R&D and IPO underpricing for the venture-backed IPO sample. We argue that
venture capitalists do not participate directly in R&D decision-making and thus do not
directly improve R&D quality or induce investors to appraise more favorably on the IPOs.
Rather, by providing information concerning the IPO’s R&D, venture capitalists may be
able to attract institutional investors, and thus indirectly lessen R&D-induced information
asymmetry between the issuers and investors to alleviate the effect of R&D on IPO pricing.
6 Sensitivity test
We further measure R&D with dummy variables (D1 and D2) rather than a continuous
variable to examine the role of venture capital on IPO underpricing. For IPOs with zero
R&D, D1 = 0 and D2 = 0. For IPOs with R&D less than the median of positive R&D for
that year, then D1 = 1 and D2 = 0. For IPOs with R&D greater than the median of positive
R&D, venture capital, and technology on IPO underpricing 439
123
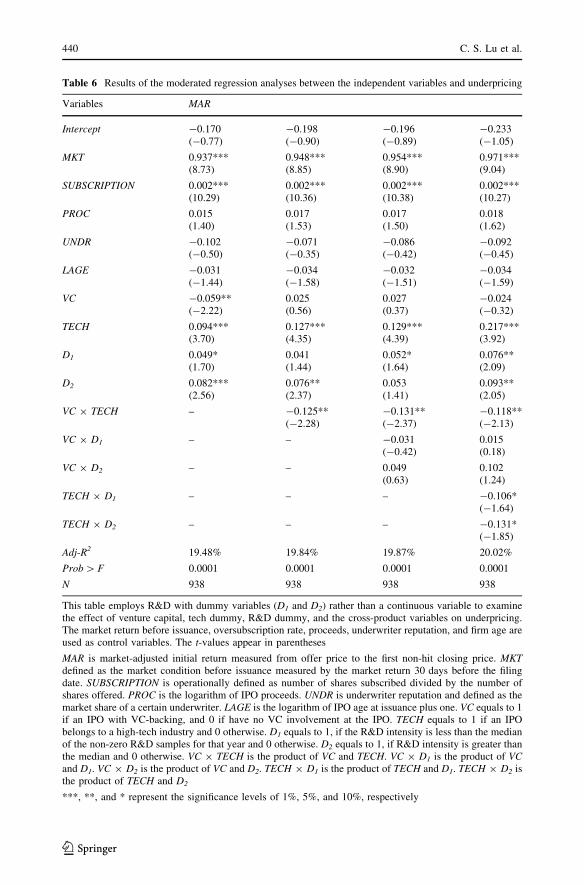
Table 6 Results of the moderated regression analyses between the independent variables and underpricing
Variables MAR
Intercept -0.170(-0.77)
-0.198(-0.90)
-0.196(-0.89)
-0.233(-1.05)
MKT 0.937***(8.73)
0.948***(8.85)
0.954***(8.90)
0.971***(9.04)
SUBSCRIPTION 0.002***(10.29)
0.002***(10.36)
0.002***(10.38)
0.002***(10.27)
PROC 0.015(1.40)
0.017(1.53)
0.017(1.50)
0.018(1.62)
UNDR -0.102(-0.50)
-0.071(-0.35)
-0.086(-0.42)
-0.092(-0.45)
LAGE -0.031(-1.44)
-0.034(-1.58)
-0.032(-1.51)
-0.034(-1.59)
VC -0.059**(-2.22)
0.025(0.56)
0.027(0.37)
-0.024(-0.32)
TECH 0.094***(3.70)
0.127***(4.35)
0.129***(4.39)
0.217***(3.92)
D1 0.049*(1.70)
0.041(1.44)
0.052*(1.64)
0.076**(2.09)
D2 0.082***(2.56)
0.076**(2.37)
0.053(1.41)
0.093**(2.05)
VC 9 TECH – -0.125**(-2.28)
-0.131**(-2.37)
-0.118**(-2.13)
VC 9 D1 – – -0.031(-0.42)
0.015(0.18)
VC 9 D2 – – 0.049(0.63)
0.102(1.24)
TECH 9 D1 – – – -0.106*(-1.64)
TECH 9 D2 – – – -0.131*(-1.85)
Adj-R2 19.48% 19.84% 19.87% 20.02%
Prob [ F 0.0001 0.0001 0.0001 0.0001
N 938 938 938 938
This table employs R&D with dummy variables (D1 and D2) rather than a continuous variable to examinethe effect of venture capital, tech dummy, R&D dummy, and the cross-product variables on underpricing.The market return before issuance, oversubscription rate, proceeds, underwriter reputation, and firm age areused as control variables. The t-values appear in parentheses
MAR is market-adjusted initial return measured from offer price to the first non-hit closing price. MKTdefined as the market condition before issuance measured by the market return 30 days before the filingdate. SUBSCRIPTION is operationally defined as number of shares subscribed divided by the number ofshares offered. PROC is the logarithm of IPO proceeds. UNDR is underwriter reputation and defined as themarket share of a certain underwriter. LAGE is the logarithm of IPO age at issuance plus one. VC equals to 1if an IPO with VC-backing, and 0 if have no VC involvement at the IPO. TECH equals to 1 if an IPObelongs to a high-tech industry and 0 otherwise. D1 equals to 1, if the R&D intensity is less than the medianof the non-zero R&D samples for that year and 0 otherwise. D2 equals to 1, if R&D intensity is greater thanthe median and 0 otherwise. VC 9 TECH is the product of VC and TECH. VC 9 D1 is the product of VCand D1. VC 9 D2 is the product of VC and D2. TECH 9 D1 is the product of TECH and D1. TECH 9 D2 isthe product of TECH and D2
***, **, and * represent the significance levels of 1%, 5%, and 10%, respectively
440 C. S. Lu et al.
123
R&D, then D1 = 0 and D2 = 1. The dummy variables (D1 and D2) are then used to replace
the original R&D (RD), which yields the results illustrated in Table 6.
The results in Table 6 are consistent with those in Table 4. High-tech industry dummy
and R&D are positively related to IPO underpricing. However, the interaction terms
between high-tech dummy and venture capital backing and between high-tech dummy and
R&D are significantly negative. The insignificant venture capital backing and insignificant
interaction terms of venture capital and R&D dummies (VC 9 D1, VC 9 D2) indicate that
venture capital does not directly affect the relationship between R&D and IPO under-
pricing. The negative interaction terms of VC 9 TECH, TECH 9 D1, and TECH 9 D2
imply that venture capital and R&D can alleviate the information asymmetry in high-tech
industries leading to the lower IPO underpricing. Consequently, IPOs of high-tech
industries need more R&D support than firms in other industries or high-R&D IPOs should
have higher technology requirement than low-R&D firms to reduce information asymmetry
leading to more reasonable IPO pricing.
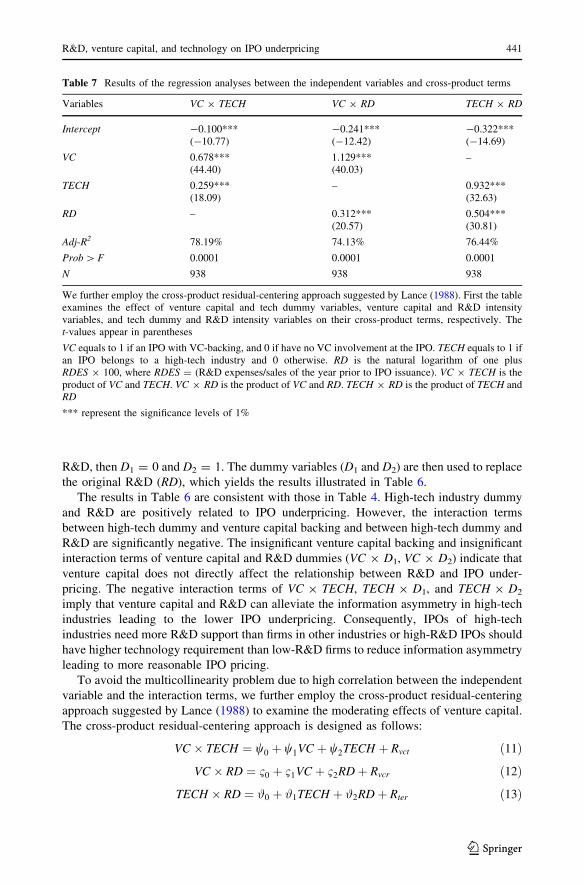
To avoid the multicollinearity problem due to high correlation between the independent
variable and the interaction terms, we further employ the cross-product residual-centering
approach suggested by Lance (1988) to examine the moderating effects of venture capital.
The cross-product residual-centering approach is designed as follows:
VC � TECH ¼ w0 þ w1VC þ w2TECH þ Rvct ð11Þ
VC � RD ¼ 10 þ 11VC þ 12RDþ Rvcr ð12Þ
TECH � RD ¼ #0 þ #1TECH þ #2RDþ Rter ð13Þ
Table 7 Results of the regression analyses between the independent variables and cross-product terms
Variables VC 9 TECH VC 9 RD TECH 9 RD
Intercept -0.100***(-10.77)
-0.241***(-12.42)
-0.322***(-14.69)
VC 0.678***(44.40)
1.129***(40.03)
–
TECH 0.259***(18.09)
– 0.932***(32.63)
RD – 0.312***(20.57)
0.504***(30.81)
Adj-R2 78.19% 74.13% 76.44%
Prob [ F 0.0001 0.0001 0.0001
N 938 938 938
We further employ the cross-product residual-centering approach suggested by Lance (1988). First the tableexamines the effect of venture capital and tech dummy variables, venture capital and R&D intensityvariables, and tech dummy and R&D intensity variables on their cross-product terms, respectively. Thet-values appear in parentheses
VC equals to 1 if an IPO with VC-backing, and 0 if have no VC involvement at the IPO. TECH equals to 1 ifan IPO belongs to a high-tech industry and 0 otherwise. RD is the natural logarithm of one plusRDES 9 100, where RDES = (R&D expenses/sales of the year prior to IPO issuance). VC 9 TECH is theproduct of VC and TECH. VC 9 RD is the product of VC and RD. TECH 9 RD is the product of TECH andRD
*** represent the significance levels of 1%
R&D, venture capital, and technology on IPO underpricing 441
123
where, Rvct, Rvcr, and Rter are the error terms of the regressions (11), (12), and (13),
respectively and results of the above regression analyses are illustrated in Table 7. The
cross-product residuals are constructed as:
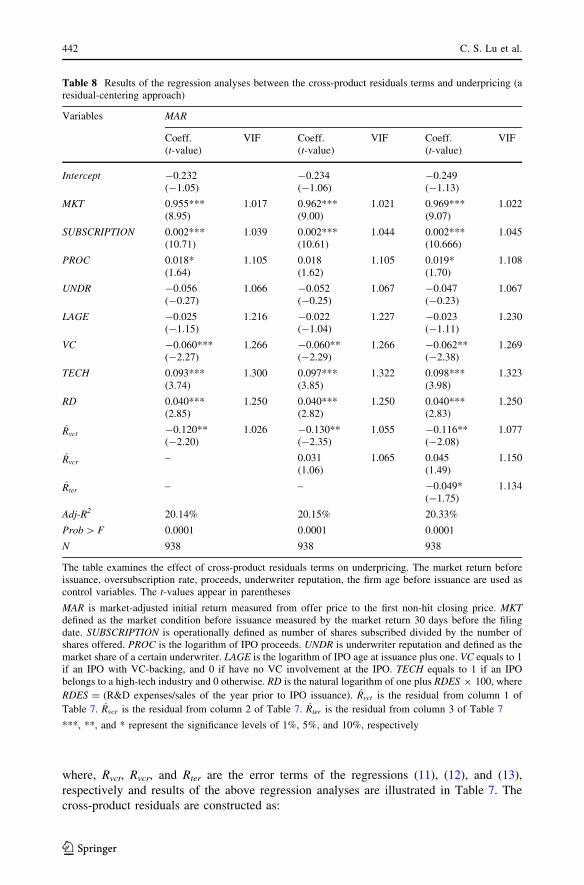
Table 8 Results of the regression analyses between the cross-product residuals terms and underpricing (aresidual-centering approach)
Variables MAR
Coeff.(t-value)
VIF Coeff.(t-value)
VIF Coeff.(t-value)
VIF
Intercept -0.232(-1.05)
-0.234(-1.06)
-0.249(-1.13)
MKT 0.955***(8.95)
1.017 0.962***(9.00)
1.021 0.969***(9.07)
1.022
SUBSCRIPTION 0.002***(10.71)
1.039 0.002***(10.61)
1.044 0.002***(10.666)
1.045
PROC 0.018*(1.64)
1.105 0.018(1.62)
1.105 0.019*(1.70)
1.108
UNDR -0.056(-0.27)
1.066 -0.052(-0.25)
1.067 -0.047(-0.23)
1.067
LAGE -0.025(-1.15)
1.216 -0.022(-1.04)
1.227 -0.023(-1.11)
1.230
VC -0.060***(-2.27)
1.266 -0.060**(-2.29)
1.266 -0.062**(-2.38)
1.269
TECH 0.093***(3.74)
1.300 0.097***(3.85)
1.322 0.098***(3.98)
1.323
RD 0.040***(2.85)
1.250 0.040***(2.82)
1.250 0.040***(2.83)
1.250
Rvct -0.120**(-2.20)
1.026 -0.130**(-2.35)
1.055 -0.116**(-2.08)
1.077
Rvcr – 0.031(1.06)
1.065 0.045(1.49)
1.150
Rter – – -0.049*(-1.75)
1.134
Adj-R2 20.14% 20.15% 20.33%
Prob [ F 0.0001 0.0001 0.0001
N 938 938 938
The table examines the effect of cross-product residuals terms on underpricing. The market return beforeissuance, oversubscription rate, proceeds, underwriter reputation, the firm age before issuance are used ascontrol variables. The t-values appear in parentheses
MAR is market-adjusted initial return measured from offer price to the first non-hit closing price. MKTdefined as the market condition before issuance measured by the market return 30 days before the filingdate. SUBSCRIPTION is operationally defined as number of shares subscribed divided by the number ofshares offered. PROC is the logarithm of IPO proceeds. UNDR is underwriter reputation and defined as themarket share of a certain underwriter. LAGE is the logarithm of IPO age at issuance plus one. VC equals to 1if an IPO with VC-backing, and 0 if have no VC involvement at the IPO. TECH equals to 1 if an IPObelongs to a high-tech industry and 0 otherwise. RD is the natural logarithm of one plus RDES 9 100, where
RDES = (R&D expenses/sales of the year prior to IPO issuance). Rvct is the residual from column 1 of
Table 7. Rvcr is the residual from column 2 of Table 7. Rter is the residual from column 3 of Table 7
***, **, and * represent the significance levels of 1%, 5%, and 10%, respectively
442 C. S. Lu et al.
123
Rvct ¼ VC � TECH � w0 þ w1VC þ w2TECH� �
ð14Þ
Rvcr ¼ VC � RD� 10 þ 11VC þ 12RDð Þ ð15Þ
Rter ¼ TECH � RD� #0 þ #1TECH þ #2RD� �
ð16Þ
and then used to replace the interaction terms in regressions (8), (9), (10).
The cross-product residuals of Rvct in columns 1, 3, and 5 of Table 8 are significantly
negative (t = -2.20, -2.35, and -2.08) to confirms Hypothesis 1b. Furthermore, the
insignificant Rvcr in column 3 of Table 8 indicates that venture capital backing does not
directly influence the relationship between R&D and underpricing. The negative cross-
product residual terms of Rter (t = -1.75) implies that the requirement of technology can
alleviate the information asymmetry from R&D expenditures leading to the lower
underpricing or that R&D spending reduces the underpricing of high-tech IPOs. All the
variance inflation factors (VIFs) in Table 8 are smaller than 2 indicating no multicollin-
earity problems at all.
7 Conclusions
IPOs are generally underpriced which is often attributed to information asymmetry and
future value uncertainty. R&D expenditures create information asymmetry to outside
investors. Technology requirements induce the uncertainty of firms’ future value. Taiwan
is an emerging country with higher information asymmetry than developed countries
making Taiwan’s IPO data a good data set to examine the role of R&D, venture capital,
and technology on IPO underpricing.
This paper examines the effects of R&D, venture capital, and technology on the
underpricing of IPOs in Taiwan. Especially, we focus on the moderation role of venture
capital and interaction between R&D expenditure and technology. This paper reconfirms
that high-tech and/or high R&D IPOs are underpriced. More importantly, this paper
contributes to the literature by demonstrating the moderating effects of venture capital and
the interaction effect between technology and R&D on IPO underpricing. IPO underpricing
is due to technology decreases with the use of venture capital. Moreover, technology
requirement justifies the expenditures of R&D and thus, reduce the underpricing of high-
R&D IPOs. Accordingly, R&D spending supports the future growth of high-tech firms and
therefore reduces the underpricing of high-tech IPOs. IPO pricing will be more efficient by
understanding the roles among R&D expenditures, high-tech industries, and venture
capital.
Acknowledgments We appreciate the helpful comments from the seminar participants at 2010 PBFEAM,National University of Kaohsiung, and National Sun Yat-Sen University. Cheng-Shou Lu thanks NationalScience Council (Taiwan) for the financial support (Research grant: NSC98-2410-H-151-024). All theremaining errors are ours.
References
Aboody D, Lev B (2000) Information asymmetry, R&D, and insider gains. J Financ 55(6):2747–2766Amihud Y, Hauser S, Kirsh A (2003) Allocations, adverse selection, and cascades in IPOs: evidence from
the Tel Aviv stock exchange. J Financ Econ 68(1):137–158
R&D, venture capital, and technology on IPO underpricing 443
123
Amit R, Brander J, Zott C (1998) Why do venture capital firms exist? Theory and Canadian evidence. J BusVentur 13(6):441–466
Barry CB, Muscarella CJ, Peavy JW, Vetsuypens MR (1990) The role of venture capital in the creation ofpublic companies: evidence from the going-public process. J Financ Econ 27(2):447–471
Beatty RP, Ritter JR (1986) Investment banking, reputation, and the underpricing of initial public offering.J Financ Econ 15(1–2):213–232
Bouresli AK, Davidson WN III, Abdulsalam FA (2002) Role of venture capitalists in IPO corporategovernance and operating performance. Q J Bus Econ 41(3–4):71–83
Carter RB, Manaster S (1990) Initial public offerings and underwriter reputation. J Financ 45(4):1045–1068Chan SH, Martin JD, Kensinger JW (1990) Corporate research and development expenditures and share
value. J Financ Econ 26(2):255–276Chang HL, Su CW (2010) Is R&D always beneficial? Rev Pac Basin Financ Mark Policies 13(1):157–174Chen A, Hung CC, Wu CS (2002) The underpricing and excess returns of initial public offerings in Taiwan
based on noisy trading: a stochastic frontier model. Rev Quant Financ Acc 18(2):139–159Chen HC, Jhou CJ, Yeh HC (2007) Signaling by underwriter retention rate in the IPO market. Appl Econ
39(15):1973–1983Chin CL, Lee P, Kleinman G (2006) IPO anomalies and innovation capital. Rev Quant Financ Acc
27(1):67–91Claessens S, Djankov S, Lang L (2000) The separation of ownership and control in East Asian Corporations.
J Financ Econ 58(1–2):81–112Duysters G, Hagedoorn J (2000) Core competences and company performance in the world-wide computer
industry. J High Technol Manag Res 11(1):75–91Gomez-Mejia LR, Larraza-Kintana M, Makri M (2003) The determinants of executive compensation in
family-controlled public corporations. Acad Manag J 46(2):226–237Guo RJ, Lev B, Shi C (2006) Explaining the short- and long-term IPO anomalies in the US by R&D. J Bus
Financ Account 33(3):550–579Han I, Chuang CM (2011) The impacts of R&D investment on company performance: US vs. Taiwanese
technology-intensive industry. Rev Pac Basin Financ Mark Policies 14(1):171–194Hanley KW (1993) The underpricing of initial public offerings and the partial adjustment phenomenon.
J Financ Econ 34(2):231–250Hausman J, Hall BH, Griliches Z (1984) Econometric models for count data with an application to the
patents-R&D relationship. Econometrica 52(4):909–937Jensen MC, Smith CW (2000) Stockholder, manager, and creditor interests: application of agency theory,
theory of the firm: governance, residual, claims, and organizational forms. Harvard University press,Cambridge
Kortum S, Lerner J (2000) Assessing the contribution of venture capital to innovation. Rand J Econ31(4):674–692
Lance CE (1988) Residual centering, exploratory and confirmatory moderator analysis, and decompositionof effects in path models containing interactions. Appl Psychol Meas 12(2):163–175
Le SA, Walters B, Kroll M (2006) The moderating effects of external monitors on the relationship betweenR&D expenditure and firm performance. J Bus Res 59(2):278–287
Lerner J (1994a) The syndication of venture capital investments. Financ Manag 23(3):16–27Lerner J (1994b) Venture capitalists and the decision to go public. J Financ Econ 35(3):293–316Lerner J (1995) Venture capitalists and the oversight of private firms. J Financ 50(1):301–318Lin DKJ, Kao L, Chen A (2010) Winner’s curse in initial public offering subscriptions with investors’
withdrawal options. Asia Pac J Financ Stud 39(1):1–25Ljungqvist AP, Wilhelm WJ (2002) IPO allocations: discriminatory or discretionary? J Financ Econ
65(2):167–201Loughran T, Shive S (2010) The impact of venture capital investments on public firm stock performance.
J Behav Financ (accepted)Loughran T, Ritter JR, Rydqvist K (1994) Initial public offerings: international insights. Pac Basin Financ J
2(2–3):165–199 (updated in 2006)Lowry M, Schwert GW (2002) IPO market cycles: bubbles or sequential learning. J Financ 57(3):1171–1200Lowry M, Shu S (2002) Litigation risk and IPO underpricing. J Financ Econ 65(3):309–335Megginson W, Weiss K (1991) Venture capitalist certification in initial public offerings. J Financ
46(3):879–903Ritter JR (1998) Initial public offerings. Contemp Financ Dig 2(1):5–30Sharma S, Durand RM, Gur-Arie O (1981) Identification and analysis of moderator variables. J Mark Res
18(3):291–300Shleifer A, Vishny R (1997) A survey of corporate governance. J Financ 52(2):737–783
444 C. S. Lu et al.
123

Shu PG, Yeh YH, Chiu SB, Ho FS (2011) The reputation effect of venture capital. Rev Quant Financ Acc36(4):533–554
Szewczyk SH, Tsetsekos GP, Zantout ZZ (1996) The valuation of corporate R&D expenditures: evidencefrom investment opportunities and free cash flow. Financ Manag 25(1):105–110
Tsai KH, Wang JC (2004) The R&D performance in Taiwan’s electronics industry: a longitudinal exam-ination. R&D Manag 34(2):179–189
Tsai KH, Wang JC (2008) External technology acquisition and firm performance: a longitudinal study. J BusVentur 23(1):91–112
Wallin C, Gilman J (1986) Determining the optimum level for R&D expenditure. Res Manag 29(5):19–24Wright P, Kroll M, Elenkov D (2002) Acquisition returns, increase in firm size, and chief executive officer
compensation: the moderating role of monitoring. Acad Manag J 45(3):599–608Zahra SA (1996) Governance, ownership, and corporate entrepreneurship: the moderating impact of
industry technological opportunities. Acad Manag J 39(6):1713–1734Zahra SA, Bogner WC (2000) Technology strategy and software new ventures’ performance: exploring the
moderating effect of the competitive environment. J Bus Ventur 15(2):135–173Zantout ZZ, Tsetsekos GP (1994) The wealth effects of announcement of R&D expenditure increases.
J Financ Res 17(2):205–216
R&D, venture capital, and technology on IPO underpricing 445
123

Reproduced with permission of the copyright owner. Further reproduction prohibited without permission.
Copyright © 2022 FDOKUMEN