Metering and modelling residential end-use electricity load curves
Upload
khangminh22Category
view
0download
0
The transition from underpricing residential electricity
in Bangladesh: fiscal and distributional impacts
January 2013
Policy Note
Faizuddin Ahmed
Chris Trimble
Nobuo Yoshida
World Bank Report Number: 76441-BD
Pub
lic D
iscl
osur
e A
utho
rized
Pub
lic D
iscl
osur
e A
utho
rized
Pub
lic D
iscl
osur
e A
utho
rized
Pub
lic D
iscl
osur
e A
utho
rized

The transition from underpricing electricity in Bangladesh: fiscal and distributional impacts 2013
2
Abbreviations
BERC Bangladesh Energy Regulatory Commission
BIDS Bangladesh Institute of Development Studies
BPL below the poverty line
BPDP Bangladesh Power Development Board
BUET Bangladesh University of Engineering and Technology
CPI Consumer Price Index
DESA Dhaka Electricity Supply Authority
DESCO Dhaka Electric Supply Co. Ltd
DISCO Distribution Company
FY fiscal year
GDP gross domestic product
GOB government of Bangladesh
HIES Household Income and Expenditure Survey
IBT incremental block tariff
IEA International Energy Agency
IMF International Monetary Fund
IPP independent power producer
km kilometer(s)
kWh kilowatt hour(s)
MW megawatt(s)
MoPEMR Ministry of Power, Energy, and Mineral Resource
PGCB Power Grid Company of Bangladesh
REB Rural Electrification Board
REP Rural Electrification Program
Tk taka
Acknowledgments
The authors would like to acknowledge the helpful feedback and guidance provided by Sanjay Kathuria,
Zahid Hussain, Mohua Mukherjee, and Zubair Sadeque on earlier drafts of this policy note, and to
Gabriela Inchauste and Sudeshna Banerjee for their helpful feedback as peer reviewers. The authors are
grateful for the inputs of Sudeshna Banerjee and Kristy Mayer related to similar studies in India. The
authors would like to acknowledge the valuable contributions from participants of a consultative
workshop, who provided feedback on an earlier version of this policy note. Participants included Dr. M.
Asaduzzaman (BIDS), Mr. Mollah Amzad Hoaasin (Energy & Power Newsletter), Dr. Ijaz Hossain (BUET),
Dr. Mirza A. B. M. Azizul Islam (BUET), Dr. Salim Mahmud (BERC), Mr Nahid Anjum Siddiqui (Energy &
Power). Mehar Khan and Kamrun Chowdhury supported the preparation and organization of the
consultation workshop. This report was financed by the South Asia Regional Window of the Multi‐Donor
Trust Fund for Poverty and Social Impact Analysis provided by Germany, the United Kingdom, Norway,
the Netherlands, and Switzerland.

The transition from underpricing electricity in Bangladesh: fiscal and distributional impacts 2013
0
Contents
1 Executive Summary ....................................................................................................................1
2 Introduction ...............................................................................................................................3
3 Electricity Subsidies and the Key Elements of the Electricity Sector ..............................................6
3.1 Policy context ...................................................................................................................................... 6 3.2 Installed capacity and sources of fuel ................................................................................................. 6 3.3 Toward universal access to electricity ................................................................................................ 7 3.4 Electricity consumption profiles ......................................................................................................... 8 3.5 Brief overview of electricity tariffs in Bangladesh ............................................................................ 10
4 Distribution Analysis of Electricity Subsidies .............................................................................. 12
4.1 Width versus depth of subsidies ....................................................................................................... 12 4.2 From gross to net: the limited impact of cross-subsidies in Bangladesh .......................................... 12 4.3 Distributional analysis of electricity subsidies .................................................................................. 13 4.4 The relative value of subsidies .......................................................................................................... 14
5 Key Changes in the Electricity Sector in 2010–12 ........................................................................ 15
5.1 Increase in cost of electricity supply ................................................................................................. 15 5.2 Increase in tariff levels ...................................................................................................................... 16 5.3 Removal of slab benefits ................................................................................................................... 17 5.4 Increase in electricity consumption .................................................................................................. 18
6 2010 versus 2012: The Distribution and Fiscal Burden of Subsidy Benefits .................................. 19
6.1 More cross-subsidies, but higher net subsidies ................................................................................ 19 6.2 Distribution of subsidy benefits improving, though more expensive ............................................... 20 6.3 Disaggregation of change in fiscal burden ........................................................................................ 21
7 Moving Forward: Scenarios of Policy Options ............................................................................ 22
7.1 Overview of scenarios ....................................................................................................................... 22 7.2 Scenario results ................................................................................................................................. 23
8 Conclusions and Policy Recommendations ................................................................................ 25
References ....................................................................................................................................... 27
Annexes........................................................................................................................................... 28
Annex 1 Structure of Power Sector ................................................................................................... 28 Annex 2 Technical Notes on Benefits Analysis Methodology ........................................................... 31 Annex 3 Detailed Consumption Analyses ......................................................................................... 35 Annex 4 BPL Tariffs in India ............................................................................................................... 37 Annex 5 Detailed Scenario Results .................................................................................................... 38

The transition from underpricing electricity in Bangladesh: fiscal and distributional impacts 2013
1 1
1 Executive Summary
The electricity sector in Bangladesh has been facing unprecedented challenges, with severe capacity
constraints and sector subsidies that quadrupled from 0.2 percent to 0.8 percent of gross domestic
product (GDP) between 2010 and 2012, driving the government’s fiscal deficit deeper. Rising global
energy prices and high-cost rental power plants have increased the fiscal burden of maintaining
electricity subsidies that have been in place for decades. In response, the government of Bangladesh has
been undertaking a series of difficult reforms for the sector.
This policy note examines the poverty and distribution impact of one such reform – residential
electricity tariff increases - along with their fiscal implications. A challenge of such adjustments is how to
minimize their impact on the poor and vulnerable. Using household survey data, this report studies the
distributional and fiscal implications of the residential tariff adjustments between March 2010 and
March 2012 on to inform policy dialogue on the provision and targeting of electricity subsidies.
An important determinant of how effective subsidies can be to protect the poor is the level of access to
electricity among poor households. According to HIES 2010, just over half of the population in
Bangladesh had access to electricity in 2010 (55 percent). Rural access to electricity remains very low (42
percent), and is even lower among households in the poorest quintile (21 percent). This means that
using electricity subsidies as a social protection mechanism is automatically limited: very low levels of
access among poor households mean changes in electricity tariffs and subsidies will not affect them.
Electricity subsidies are defined as the difference between the cost of supplying a unit of electricity and
the tariff the end-user is charged for a given unit. Between 2010 and 2012, real cost of supply increased
almost 20 percent. On the transition from underpricing to cost recovery tariffs, real tariffs more than
doubled for high levels of consumption, while they actually fell for low levels of consumption. The
combined impact of these changes meant that in both 2010 and 2012, almost all units of electricity
consumed (80–90 percent) were subsidized to some extent, limiting the ability to offset the fiscal
burden through cross-subsidies from high consumers to low consumers.
In 2010, the average unit of electricity was subsidized 25 percent, which remained constant in 2012. For
low levels of consumption—where the majority of households consume—virtually stagnant real tariffs
coupled with a soaring real cost of supply mean that the degree of subsidy provided on each unit of
electricity has almost doubled in real terms. On the other hand, the cross-subsidy provided through high
levels of consumption increased dramatically with the removal of slab benefits.
There was an unequal distribution of subsidy benefits in 2010. The significant leakage suggests the
structure of tariffs and subsidies is not pro-poor. Households in the richest quintile receive subsidy
benefits that are seven times more than households in the poorest quintile (42 percent versus 6
percent). Leakage of subsidies improved between 2010 and 2012, mainly driven by the removal of slab
benefits for higher levels of consumption, meaning households in the richest quintile provided cross-
subsidies to households in lower quintiles.

2013 The transition from underpricing electricity in Bangladesh: fiscal and distributional impacts
2
The fiscal deficit in Bangladesh is forecasted to increase from 3.1 percent of GDP in fiscal year (FY) 2010
to 4.4 percent of GDP in FY2012. Subsidies to the power sector are an important factor in this increase.
The fiscal burden of electricity subsidies provided to residential customers increased by over 40 percent
in real terms between 2010 and 2012.
This policy note focuses on just one part of a much broader and complex system of connected energy
policies. The policy implications of this analysis should only be considered in light of this broader
context. In particular, this note does not study in detail the complex issues of generation and
operational efficiency (in transmission and distribution). The public debate on these topics is particularly
strong, with a sizeable portion of voices arguing that the government should not make households pay
for generation and operational inefficiencies.
Second, this note does not study the political economy of tariff and subsidy reform. Tariff increases have
been a source of social unrest, and planned increases could generate additional unrest. It will be
important for the government to consider the political economy of further reform carefully. In
particular, care should be taken to communicate and educate the public on what changes are planned,
the rationale for such changes, and what improvements households can expect as a result of these
changes.
Moving forward, both of the new slab systems being discussed could relieve the fiscal burden of
subsidies. In the medium term, generation and operational efficiency gains would help reduce leakage
and fiscal burden. This analysis suggests that if the government could bring supply costs back down to
2010 levels, the fiscal burden would be reduced by more than 50 percent. In the long term, as
Bangladesh moves toward universal access, it will be important for the government to offset the
increased fiscal burden of having more households connected. Below poverty line tariffs, the seven and
nine slab system, and reduced costs of supply could all help achieve the dual policy goal of well-targeted
subsidies and low-to-zero fiscal burden. In the best-case scenario, the structure of tariffs and subsidies
could actually generate a net fiscal contribution, creating resources for future investments in
infrastructure.

The transition from underpricing electricity in Bangladesh: fiscal and distributional impacts 2013
3 3
2 Introduction
The electricity sector in Bangladesh has been facing unprecedented challenges. Despite aggressive
efforts to increase generation capacity, demand continues to outstrip supply, leading to continued load
shedding and blackouts. Soaring costs of electricity supply, driven by the high cost of quick-fix rental
power plants, are forcing tariff increases and leading to increased social unrest. Yet tariff increases have
not kept up with this cost of supply, leading to a ballooning in the fiscal burden of electricity subsidies,
which has increased fivefold from Tk 12 billion in FY2010 to Tk 60 billion in FY2012 (and is forecasted to
be Tk 56 billion in FY2013).
Electricity subsidies are a key element in the broader fiscal deficit. According to the International
Monetary Fund (IMF) estimations for Bangladesh, the fiscal deficit will increase from 3.1 percent of GDP
in FY2010 to 4.4 percent of GDP in FY20121. A key driver of this increasing deficit is subsidies provided
for various needs in the country. As illustrated in figure 1, the total cost of subsidies has more than
doubled, from around 1.5 percent in FY2010 to more than 3.5 percent of GDP in FY2012. One of the
most important subsidies that has increased is electricity, which between FY2010 and FY2012 increased
from 0.2 percent of GDP to 0.8 percent of GDP.2
Figure 1: Fiscal balance and fiscal cost of subsidies
The question of electricity tariffs and subsidies is just one policy choice in a balancing act of
interconnected—but sometimes competing—policy goals across multiple sectors (figure 2). On one
hand, there are a range of policy goals including universal access, reliable electricity supply, and
affordable electricity. On the other hand, there are the fiscal implications of achieving each of these
goals and the desire to have well-targeted social protection with minimal leakage to rich households. To
succeed in this balancing act, the government has a range of policy choices available, including, but not
limited to, infrastructure investments and the structure of tariffs and subsidies. Underpinning these
choices is the political economy of policy reform.
1 IMF Article IV, November 2011
2MTBF, FY13 – FY17
0.2%
0.6%
0.8%
0.0%
1.0%
2.0%
3.0%
4.0%
FY07 FY08 FY09 FY10 FY11 FY12
% G
DP
Fiscal cost of subsidies in Bangladesh, 2006-12, as a % of GDP
Source: MTBF FY13-16
Others
Food
Export
BJMC and others
Electricity (PDB)
Agriculture
Fuel (BPC)
1.3pp increase in fiscal deficit 2010-12
-3.7%
-3.1%
-3.7%
-4.4%-5.0%
-4.0%
-3.0%
-2.0%
-1.0%
0.0%
FY09 FY10 FY11 est FY12 proj.
Bangladesh overall fiscal balance (including grants), as % GDP
Source: IMF
2.1 pp increase in fiscal cost of
subsidies

2013 The transition from underpricing electricity in Bangladesh: fiscal and distributional impacts
4
Figure 2: Policy Framework
Source: Authors’ illustration
In this challenging context, this policy note adds to the policy dialogue already underway in Bangladesh
by providing evidence-based analysis that can inform decision making. This note uses household survey
data (HIES 2010) combined with electricity data inputs such as tariff structures.3 Specifically, the four
objectives of this note are to:
i) estimate the distribution of electricity subsidies provided to residential customers;
ii) estimate how this distribution has changed between 2010 and 2012, during which time
there have been significant changes in underlying tariffs and costs of supply;
iii) estimate how the fiscal burden of the subsidies provided to residential customers has
changed between 2010 and 2012; and finally
iv) analyze the potential impact of various policy options.
The primary audience for this poverty and social impact analysis is the regulator (BERC) with the
responsibility for setting tariffs. The secondary audience includes the Ministry of Finance which pays for
the many of the subsidies in the energy sector, and the Ministry of Power, Energy and Mineral
Resources, and the Ministry of Social Welfare which oversees many of the social protection systems in
Bangladesh.
This policy note focuses on residential electricity consumption, and does not include subsidies provided
to other parts of the economy such as agriculture, and small businesses. As shown in figure 3, residential
electricity consumption accounts for the majority of electricity consumption. Broader analysis of the
energy sector is important (such as cost recovery in the electricity sector overall) but is beyond the
scope of this analysis. Deep analysis of the political economy issues underlying policy choices and
broader questions in the electricity sector, especially on issues such as efficiency in the generation,
transmission and distribution of electricity, are also beyond the scope of this policy note.
3 See annex 2 for methodology.
Policy Choices / Tools
• Infrastructure investments
• Structure of tariffs and subsidies
POLITICAL ECONOMY

The transition from underpricing electricity in Bangladesh: fiscal and distributional impacts 2013
5 5
Figure 3: Electricity consumption by customer type, FY12
Residential, 53%
Industry, 28%
Commercial, 10% Irrigation, 7%
Other, 2%
Source: Utility company reports (REB, DPDC, BPDB)
2013 The transition from underpricing electricity in Bangladesh: fiscal and distributional impacts
6
3 Electricity Subsidies and the Key Elements of the Electricity Sector
This section provides an overview of some of the key elements of the electricity sector in Bangladesh as
they relate to the benefits-incidence analysis and fiscal burden of electricity subsidies.4 This includes
some of the important goals in the policy context; factors that affect the usefulness of subsidies as a
social protection mechanism, including access and consumption profiles; and elements that determine
subsidies, including cost of electricity supply and tariff levels.
To understand how effective electricity subsidies can be as a tool for providing protection to poor
households in Bangladesh, it is important to understand patterns of electricity consumption. The
subsections that follow illustrate two powerful points:
i) electricity subsidies have a limited role in providing protection when very few poor
households have access to electricity; and
ii) the benefit of limiting the fiscal cost of subsidies through cross-subsidization from richer
households (consuming in higher tariff slabs) is small—if not redundant—when
consumption is so low that no households consume enough to provide a cross-subsidy.
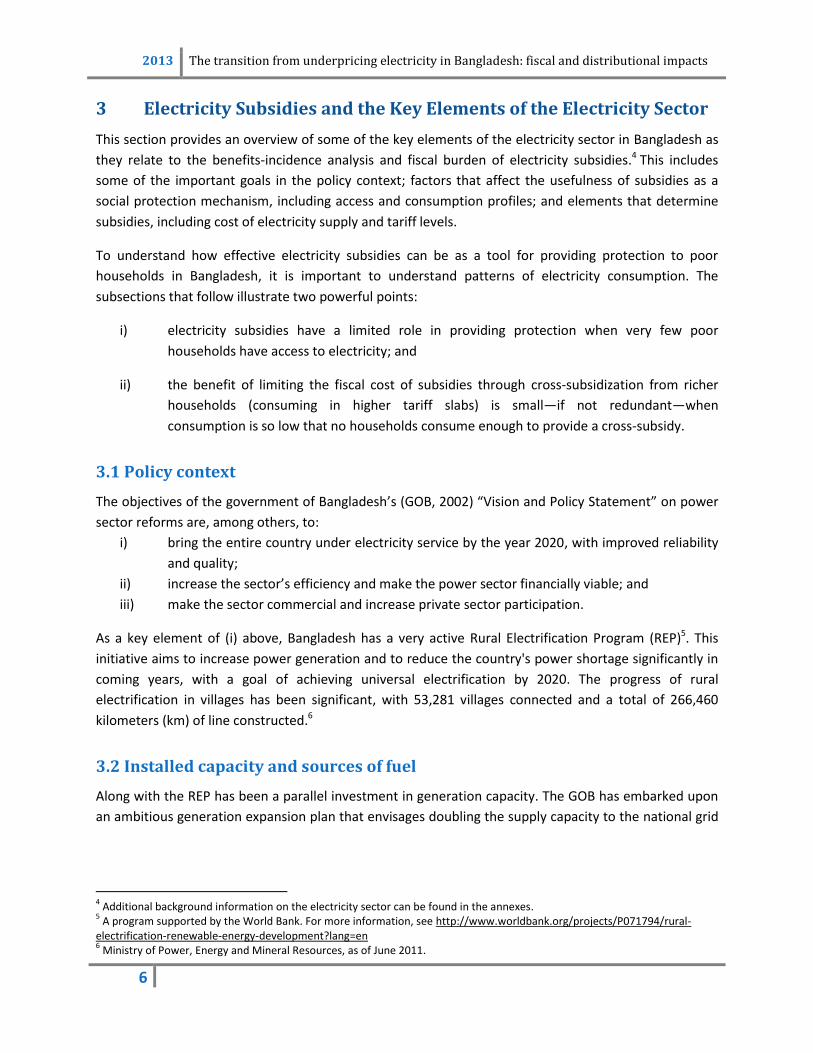
3.1 Policy context
The objectives of the government of Bangladesh’s (GOB, 2002) “Vision and Policy Statement” on power
sector reforms are, among others, to:
i) bring the entire country under electricity service by the year 2020, with improved reliability
and quality;
ii) increase the sector’s efficiency and make the power sector financially viable; and
iii) make the sector commercial and increase private sector participation.
As a key element of (i) above, Bangladesh has a very active Rural Electrification Program (REP)5. This
initiative aims to increase power generation and to reduce the country's power shortage significantly in
coming years, with a goal of achieving universal electrification by 2020. The progress of rural
electrification in villages has been significant, with 53,281 villages connected and a total of 266,460
kilometers (km) of line constructed.6
3.2 Installed capacity and sources of fuel
Along with the REP has been a parallel investment in generation capacity. The GOB has embarked upon
an ambitious generation expansion plan that envisages doubling the supply capacity to the national grid
4 Additional background information on the electricity sector can be found in the annexes.
5 A program supported by the World Bank. For more information, see http://www.worldbank.org/projects/P071794/rural-
electrification-renewable-energy-development?lang=en 6 Ministry of Power, Energy and Mineral Resources, as of June 2011.
The transition from underpricing electricity in Bangladesh: fiscal and distributional impacts 2013
7 7
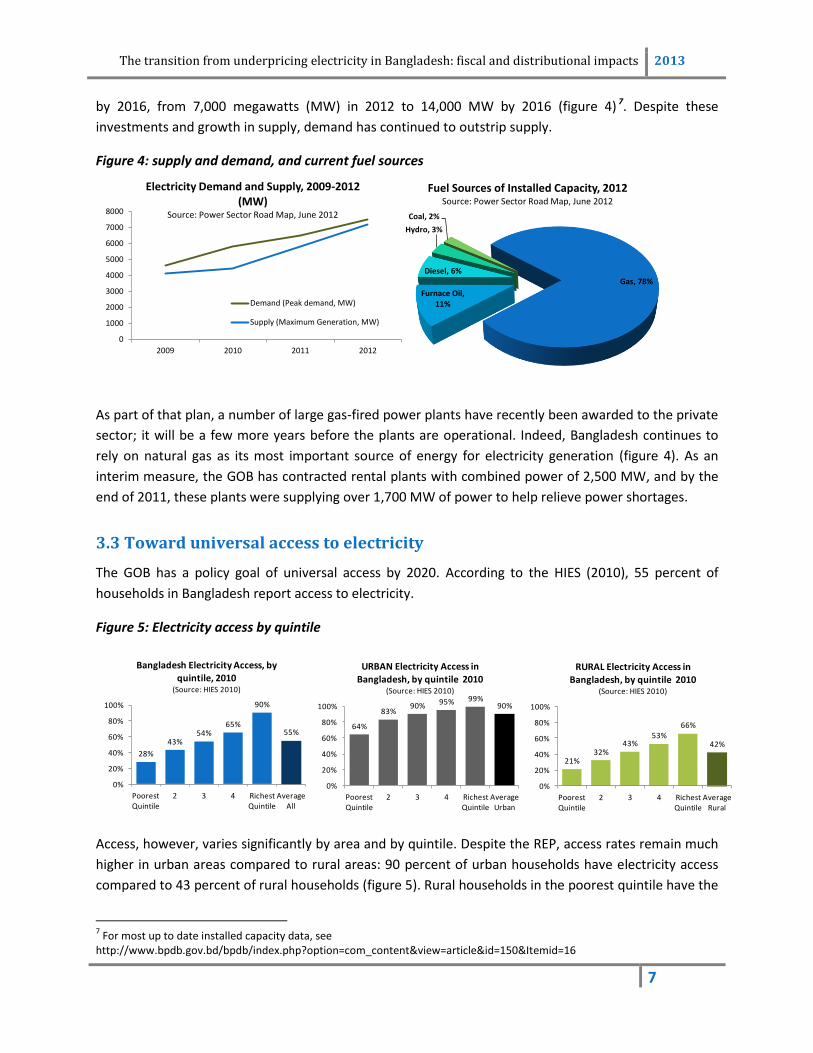
by 2016, from 7,000 megawatts (MW) in 2012 to 14,000 MW by 2016 (figure 4) 7. Despite these
investments and growth in supply, demand has continued to outstrip supply.
Figure 4: supply and demand, and current fuel sources
As part of that plan, a number of large gas-fired power plants have recently been awarded to the private
sector; it will be a few more years before the plants are operational. Indeed, Bangladesh continues to
rely on natural gas as its most important source of energy for electricity generation (figure 4). As an
interim measure, the GOB has contracted rental plants with combined power of 2,500 MW, and by the
end of 2011, these plants were supplying over 1,700 MW of power to help relieve power shortages.
3.3 Toward universal access to electricity
The GOB has a policy goal of universal access by 2020. According to the HIES (2010), 55 percent of
households in Bangladesh report access to electricity.
Figure 5: Electricity access by quintile
Access, however, varies significantly by area and by quintile. Despite the REP, access rates remain much
higher in urban areas compared to rural areas: 90 percent of urban households have electricity access
compared to 43 percent of rural households (figure 5). Rural households in the poorest quintile have the
7 For most up to date installed capacity data, see
http://www.bpdb.gov.bd/bpdb/index.php?option=com_content&view=article&id=150&Itemid=16
0
1000
2000
3000
4000
5000
6000
7000
8000
2009 2010 2011 2012
Electricity Demand and Supply, 2009-2012 (MW)
Source: Power Sector Road Map, June 2012
Demand (Peak demand, MW)
Supply (Maximum Generation, MW)
Gas, 78%
Furnace Oil, 11%
Diesel, 6%
Hydro, 3%
Coal, 2%
Fuel Sources of Installed Capacity, 2012Source: Power Sector Road Map, June 2012
21%32%
43%53%
66%
42%
0%
20%
40%
60%
80%
100%
Poorest Quintile
2 3 4 Richest Quintile
Average Rural
RURAL Electricity Access in
Bangladesh, by quintile 2010(Source: HIES 2010)
64%
83%90% 95% 99%
90%
0%
20%
40%
60%
80%
100%
Poorest Quintile
2 3 4 Richest Quintile
Average Urban
URBAN Electricity Access in
Bangladesh, by quintile 2010(Source: HIES 2010)
28%
43%54%
65%
90%
55%
0%
20%
40%
60%
80%
100%
Poorest Quintile
2 3 4 Richest Quintile
Average All
Bangladesh Electricity Access, by quintile, 2010
(Source: HIES 2010)

2013 The transition from underpricing electricity in Bangladesh: fiscal and distributional impacts
8
lowest levels of access: only one in five rural households in the poorest quintile has access to electricity
(85 percent of households in the poorest quintile are rural).
3.4 Electricity consumption profiles
Analysis of household survey data suggest that over 80 percent of households, rich and poor, consumed
less than 100 kWh per month in 2010 (figure 6), and accounted for almost 40 percent of total electricity
consumed. Almost all households in the poorest quintile consume less than 100 kWh per month. The
only exception is households in the richest quintile, of which the majority consume 100–300 kWh per
month. Less than 2 percent of households in Bangladesh consume more than 300 kWh per month, while
accounting for almost 10 percent of total electricity consumption.8
Figure 6: Electricity consumption profiles by slab (Source: authors estimates based on HIES data)
This means that using electricity subsidies as a social protection mechanism is limited: very low levels of
access among poor households mean changes in electricity tariffs and subsidies will not affect them.
This pattern of low consumption and low levels of access results in low levels of per capita consumption,
which is consistent with global data. Bangladesh has one of the lowest per capita electricity
consumption levels in the world. For example, according to the International Energy Agency (IEA)9, in
2009, electricity consumption was 252 kilowatt hours (kWh) per capita (figure 7), compared to an
average double that level for both sub-Saharan Africa and South Asia (517 kWh per capita).
8 See annex 3 for more detailed consumption analysis (split by rural/urban/urban Dhaka).
9 See http://www.iea.org/stats/index.asp
83%
16%
1%
0%
10%
20%
30%
40%
50%
60%
70%
80%
90%
100%
0-100 kWh 100-400kWh >400kWh
Proportion of households in each quintile whose monthly consumption falls into each slab (2010, All
Households)
38%
53%
9%
0%
10%
20%
30%
40%
50%
60%
70%
80%
90%
100%
0-100 kWh 100-400kWh >400kWh
Proportion of electricity consumed by households whose monthly consumption falls into each slab
(2010, All Households)
Poorest quintile
2
3
4
Richest quintile
ALL

The transition from underpricing electricity in Bangladesh: fiscal and distributional impacts 2013
9 9
Figure 7: Global electric power consumption
- 2,000 4,000 6,000 8,000 10,000 12,000 14,000 16,000 18,000 20,000
Haiti
Tanzania
Myanmar
Sudan
Congo, Rep.
Angola
Bangladesh
Sri Lanka
Nicaragua
India
Zambia
Morocco
Gabon
Zimbabwe
Iraq
Tunisia
Kyrgyz Republic
Egypt, Arab Rep.
Namibia
Uzbekistan
Costa Rica
Tajikistan
Brazil
Turkey
Uruguay
Latvia
Ukraine
Lithuania
Malaysia
Libya
Malta
Cyprus
Italy
United Kingdom
Estonia
Slovenia
Denmark
Netherlands
Japan
Singapore
Korea, Rep.
Australia
Sweden
Finland
Norway
2009 kWh per capita
Source: International Energy Agency, Energy Statistics and Balances of Non-OECD
Nepal, 91 kWh
Bangladesh, 252 kWhSri Lanka, 413 kWh
Pakistan, 449 kWh
India, 570 kWh

2013 The transition from underpricing electricity in Bangladesh: fiscal and distributional impacts
10
3.5 Brief overview of electricity tariffs in Bangladesh
Residential electricity tariffs are structured by an incremental block tariff (IBT), with one set of tariffs for
urban households and another for each of the distribution companies serving rural households. Note
there are three slabs for urban households and four for rural households, as illustrated in table 110.
Households only receive slab benefits for two slabs: the one where their final consumption falls, and the
one previous. For example, an urban household consuming 450 kWh of electricity in March 2012, will be
charged Tk 7.89 for the 50 units above 400, and Tk 4.29 for the first 400 units.
Table 1. Price by Block, Tk/kWh
March 2010 (Tk)
Urban
0–100 units 2.6
101– 400 units 3.3
> 400 units 5.65
Rurala
0–100 units 2.53–2.90
101–300 units 2.57–2.95
301–500 units 3.89–4.15
> 500 units 4.99–5.95
Cost of supply 3.8 Source: Authors’ compilation. a. There are several utility companies supplying rural households, so tariff
ranges provided.
3.6 Electricity subsidies in Bangladesh
In this report, the electricity subsidy provided on each unit of electricity consumed by a household is
measured by the difference between the prices households face (the tariffs charged) and the cost of
supplying that electricity.
Figure 8: Electricity Subsidies in Bangladesh 2010 (Urban)
10
Note in the past a minimum charge of Tk 100 was in place. This is important since it strongly affects the average tariff paid by low consuming households. Based on input from a number of sources, this analysis assumes no minimum charge is in place, but this should be clarified for future analysis given conflicting reports on the existence of a minimum charge e.g. http://www.berc.org.bd/images/stories/pdf/existing_retail_tariff_w.e.f_01_september_2012.pdf

The transition from underpricing electricity in Bangladesh: fiscal and distributional impacts 2013
11 11
For varying levels of consumption, figure 8 illustrates the average tariff per kilowatt hour for urban
households and the cost of supply. It shows that at low levels of consumption (below 100 kWh), the
average tariff is Tk 2.6 against a cost of supply of Tk 3.8, meaning each unit under 100 kWh was
subsidized Tk 1.2 (or 32 percent). Even at higher levels of consumption, electricity remains subsidized.
Note that although the marginal tariff is above cost for consumption above 400 kWh (table 1), the
average tariff only increases above cost of supply when a household consumes more than 550 kWh. This
is because of slab benefits that were in place in 2010: all households benefit from the prices of all slabs
independently of how much electricity they consume.
Table 2. Regional Comparison of Electricity Costs
Calculating the cost of 100 kWh of electricity for an urban household in March 2010 (table 2) in
Bangladesh, Pakistan, and India (using the representative state of Uttar Pradesh) provides a regional
comparison. This basic indicator shows that urban residential households pay relatively less than similar
households in neighboring countries, perhaps because they are more heavily subsidized.
38
% o
f con
sum
ptio
n b
elo
w 1
00
kW
h
Less
th
an
10
% a
bo
ve 4
00
kW
h
Subsidy Cross-Subsidy
0
1
2
3
4
5
6
7
0 200 400 600 800Avera
ge tari
ff (2010 taka p
er kW
h)
Monthly consumtpion (kWh)
Average tariff 2010
Cost of Supply 2010
What is a subsidy?
• Subsidy: for units of
electricity consumed
where the tariff is
below the cost of
supply, households
are receive a
subsidy from the
state
• Cross-subsidy: for
units consumed
where the tariff is
above the cost of
supply, households
are paying a cross-
subsidy
For 100 kWh of electricity consumption for an urban household in 2010 Electricity bill (Tk) Supply cost (Tk) Subsidy (Tk) Subsidy as % cost
Pakistan 322 752 429 57
India, Uttar Pradesh 366 544 178 33
Bangladesh 260 380 120 32
Source: Authors’ compilation

2013 The transition from underpricing electricity in Bangladesh: fiscal and distributional impacts
12
4 Distribution Analysis of Electricity Subsidies
One of the main arguments for providing subsidies is that they provide social protection for poor
households. Given the high cost of providing these subsidies and the fiscal burden they place on the
government, it is especially important to understand how the benefits are distributed among different
income quintiles to assess the efficiency in targeting poor households.
Before analyzing the distribution of benefits, there are two important aspects to analyze that will affect
the distribution of subsidies: the depth and width of subsidies, and the degree of cross-subsidization
from high-consuming households to low-consuming households.
4.1 Width versus depth of subsidies
One of the key questions that emerge when consumption patterns are
overlaid on the existing tariff structure (figure 8) is how wide and how
deep electricity subsidies are.
Figure 7 illustrated that 90 percent of electricity consumption is below 400
kWh, while it is only above 400 kWh that the marginal price is above cost
(table 1). This means that 90 percent of electricity consumed by residential
households was subsidized to some extent in 2010. Note this width of
subsidies will limit the ability to offset the fiscal burden through cross-
subsidies from high consumers to low consumers.
In terms of depth, the consumption of the average connected household
was subsidized 25 percent in 2010. The average connected household spent Tk 281 consuming 149 kWh
of electricity that cost Tk 373 to supply. This means the average connected household therefore
received Tk 90 in subsidies (or 25 percent of the
cost of supply).
4.2 From gross to net: the limited
impact of cross-subsidies in
Bangladesh
One of the design features in an IBT structure is
that high-consuming households pay above the
cost of supply for their high levels of consumption,
providing a cross-subsidy and helping to offset
some of the cost of providing subsidies. This is an
important factor to consider in relation to the
fiscal burden of subsidies.
As described above, approximately 90 percent of electricity units consumed in 2010 were subsidized to
some extent. This limits the impact of cross-subsidies in Bangladesh which is illustrated on Figure 9.
Width: proportion of
electricity units
consumed that receive
some level of subsidy
Depth: the degree to
which the average
connected household
was subsidized
Figure 9: Gross to net electricity subsidy for the
average connected household (2010). Source:
authors estimates based on HIES
95 3.6
92
0
25
50
75
100
Gross subsidy Cross-subsidy Net Subsidy

The transition from underpricing electricity in Bangladesh: fiscal and distributional impacts 2013
13 13
Cross-subsidies are the difference between the gross cost of subsidies (before cross-subsidies are taken
into account) and the net cost (after cross-subsidies are taken into account).
On a gross basis, the average connected household received Tk 95 in March 2010, which reduces only
marginally to Tk 92 on a net basis. Most of the cross-subsidies come from high consuming households
which tend to be urban households in the richest quintile. The very limited consumption at high levels
means cross-subsidies only reduced the fiscal burden of subsidies by 4 percent; this is important for the
distributional analysis because it implies that rich households on net still receive significant subsidies.
4.3 Distributional analysis of electricity subsidies
A distributional analysis allows us to estimate how the benefits provided through subsidies are
distributed among different quintiles in Bangladesh. The key objectives of this analysis are (i) to
understand how well the subsidy is targeted to the intended beneficiaries and (ii) how much leakage
there is from these intended beneficiaries to others.
Figure 10: Distributional Analysis of Electricity Subsidies in Bangladesh, 2010. Source: World Bank
Analysis
Rich households receive overwhelmingly more of the subsidy benefits than do households in the
poorest quintile. Households in the richest quintile receive seven times more than households in the
poorest quintile (42 percent versus 6 percent, figure 10). This means that not only are the subsidies not
well targeted, but there is significant leakage to households that arguably have less need for subsidy
support.
There are at least three important factors producing this result (figure 11). First, the very low electricity
access rate among poor households limits the ability of subsidies to reach them. Only 27 percent of
households in the poorest quintile had access to electricity in 2010. Second, as discussed above,
consumption levels are low, meaning a significant proportion (almost 40 percent) of electricity is
6%
11%
17%
24%
42%
0%
5%
10%
15%
20%
25%
30%
35%
40%
45%
Poorest Quintile 2 3 4 Richest Quintile

2013 The transition from underpricing electricity in Bangladesh: fiscal and distributional impacts
14
Figure 11: Key Factors contributing to
unequal distribution of electricity
subsidies. Source: authors illustration
Only 27 percent of households in the
poorest quintile have access to
electricity. These low access rates
limits the ability for electricity subsidy
benefit poor households
Almost 40% of consumption is by
households consuming less than 100
kWh, where consumption is highly
subsidized (over 30% of the cost is
subsidized)
Limited cross-subsidization from rich
households to poor households i.e. a
high threshold for cost-recovery
pricing
consumed by households in the deeply subsidized
slab (less than 100 kWh). Third, and related, because
of this low consumption, cross-subsidies from rich
households to poor households are limited. The
typical international experience is that higher levels of
consumption are priced above the threshold for cost-
recovery pricing, meaning enough households
consume above the threshold, helping to offset
subsidies paid at low levels of consumption. In
Bangladesh, as illustrated in figure 8, there is very
limited cross-subsidization taking place because so
few households consume above the threshold for
cost-recovery pricing.
4.4 The relative value of subsidies
An important final comment on the distribution of
benefits is the degree to which subsidies represent an
important source of value to households. In an abstract sense, a poor household may value Tk 100 in
subsidies more highly than a rich household. While it is difficult to measure this sense of value, one
proxy could be the scale of the subsidy provided in relation to total household spending.
For households consuming electricity in March 2010, the value of subsidies provided to households were
worth almost 2 percent of total household spending for the average household in the poorest quintile,
compared to only 1 percent for the richest quintile. Therefore while poor households receive much less
of a subsidy, it represents a higher proportion of their overall spending, so it could be more important to
them. This is an important consideration, particularly with respect to the political economy of subsidy
reform.

The transition from underpricing electricity in Bangladesh: fiscal and distributional impacts 2013
15 15
5 Key Changes in the Electricity Sector in 2010–12
This section will briefly outline four key changes in the electricity sector relevant to the distribution of
and fiscal burden of residential electricity subsidies:
the increase in cost of electricity supply;
the increase in tariffs;
the removal of slab benefits; and
the increase in electricity consumption.
While these changes have different directional impacts on the distribution and fiscal burden of subsidies
(for example, increase in the cost of supply will tend to increase the fiscal burden, while removal of slab
benefits will tend to decrease the fiscal burden), the analysis will show that on net, subsidies have
increased between 2010 and 2012 as a result of these changes.
5.1 Increase in cost of electricity supply The cost of electricity supply is a critical component for determining the level of subsidization within
each Distributing Company (DISCO). While tariffs increased substantially in nominal terms between 2010
and 2012, the cost of electricity supply increased over 80 percent between July 2010 and March 2012
(from Tk 2.96 to Tk 5.47 per kWh), or around 50 percent in real terms.
There are two main factors behind this increase; the first is increasing prices in global energy markets.
Natural gas remains the primary fuel source for electricity generation, and while Bangladesh has
significant domestic reserves, the GOB has increased gas prices along with global price increases11.
Figure 12 illustrates that during July 2010–March 2012, cost of supply increased 50 percent in real
terms, which is very comparable to increases in global energy prices over the same period.
Figure 12: Cost of Electricity Supply in Bangladesh vs Global Energy Prices (in July 2010 prices, indexed)
11
Helping to avoid the introduction of another layer of untargeted subsidies
0
20
40
60
80
100
120
140
160
180
Real cost of electricity supply in BangladeshReal natural gas price, EuropeReal LNG price, JapanReal Crude Oil price

2013 The transition from underpricing electricity in Bangladesh: fiscal and distributional impacts
16
The second factor is the high cost of rental power plants. By the end of 2011, 27 rental and quick rental
power plants had come online: 7 quick rental power plants with a generation capacity of 522 MW, and
20 rental plants with a production capacity of 1,173 MW. Most are diesel fired or furnace oil run, which
increases the cost of supplying electricity. According to some reports, the Bangladesh Power
Development Board (BPDB) has been purchasing electricity at Tk 13 to Tk 14 per unit from new diesel-
fired rental and quick rental power plants, and at around Tk 7 per unit from new furnace oil–run power
plants. The electricity purchase rate from gas-fired independent power producer (IPP) power plants is
around Tk 2.12
5.2 Increase in tariff levels
Partly in response to this rising cost of supply, along with a drive toward cost recovery, the government
of Bangladesh increased tariffs significantly between 2010 and 2012. The focus of tariff increases has
been in high levels of consumption (40–60 percent increase at the higher levels of consumption, table
3), and further increases are expected as the government transitions from underpricing electricity
towards cost recovery pricing.
Table 3. Price by Block, Tk/kWh (rates in current taka)
2005 March 2010 February 2011 March 2012
Nominal increase (% 2010–
12)
Urban
0–100 units 2.5 2.6 2.6 3.05 17
101–400 units 3 3.3 3.47 4.29 30
> 400 units 5 5.65 5.93 7.89 40
Rural
0–100 units
2.53–2.90 2.64–3.03 3.08–3.55 23
101–300 units
2.57–2.95 2.95–3.39 3.67–4.20 42
301–500 units
3.89–4.15 4.49–4.78 5.98–6.35 53
> 500 units
4.99–5.95 5.92–7.05 7.88–9.38 58
Cost of supply 3.8 4.15 5.47 44
Trend of increasing tariffs: nominal versus real
Tariffs have increased significantly in nominal terms between 2010 and 2012, by up to at least 15
percent for the lowest slabs and up to 60 percent in the higher consumption slabs. However, with high
rates of inflation, tariff increases have not been so large in real terms. According to the Consumer Price
Index (CPI), prices increased by more than 20 percent between March 2010 and March 2012. This means
12
See http://www.thefinancialexpress-bd.com/more.php?news_id=98188&date=2011-12-21.

The transition from underpricing electricity in Bangladesh: fiscal and distributional impacts 2013
17 17
that tariffs at the higher slabs increased less than 30 percent in real terms, and urban households
consuming less than 100 kWh per month actually experienced a real decrease.
5.3 Removal of slab benefits
A second key change in pricing along in the transition from underpricing has been the removal of slab
benefits. In 2010, all households benefited from all slabs. This meant that a household consuming 500
kWh benefited from the low tariffs at low levels of consumption, for example, at 100 kWh. From March
2010, slab benefits were removed for households consuming more than 300 kWh (urban and rural). This
volume-based tariff applies a fixed rate to all levels of consumption. If this is applied to the figure used
previously (based on average tariff), the new tariff system means there are significant “steps” at the slab
boundaries, as illustrated in figure 13.
Figure 13: Electricity Subsidies in Bangladesh 2010-12 (Urban, 2010 taka per kWh). Source: authors
compilation
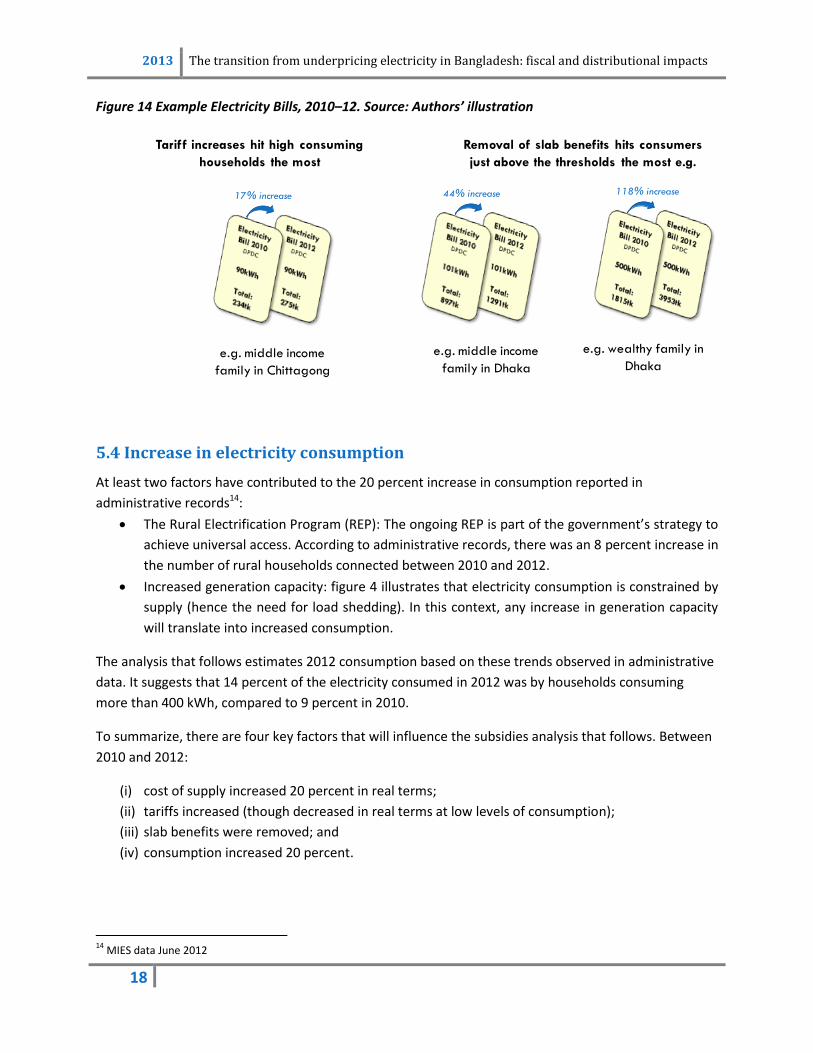
The combination of higher tariffs and the removal of slab benefits resulted in significant increases in
electricity bills. Most households have experienced at least a 17 percent increase in their bills during the
two year period. However, wealthy households have been hardest hit by the increases, with some
household bills more than doubling (figure 14). There has been strong public outcry in response to these
sharp increases in electricity bills,13 which adds to the political economy considerations the government
must factor as it contemplates further tariff reform.
13
For example, see http://www.thedailystar.net/newDesign/news-details.php?nid=238636.
0
1
2
3
4
5
6
7
8
0 100 200 300 400 500 600Avera
ge tari
ff (2010 taka p
er kW
h)
Monthly consumtpion (kWh)
Average tariff 2010
Average tariff 2012
Cost of Supply 2010
Cost of Supply 2012
Significant
increase in
subsidies at low
levels of
consumption
Large increase in
bills at higher
levels of
consumption
2013 The transition from underpricing electricity in Bangladesh: fiscal and distributional impacts
18
Figure 14 Example Electricity Bills, 2010–12. Source: Authors’ illustration
5.4 Increase in electricity consumption
At least two factors have contributed to the 20 percent increase in consumption reported in
administrative records14:
The Rural Electrification Program (REP): The ongoing REP is part of the government’s strategy to
achieve universal access. According to administrative records, there was an 8 percent increase in
the number of rural households connected between 2010 and 2012.
Increased generation capacity: figure 4 illustrates that electricity consumption is constrained by
supply (hence the need for load shedding). In this context, any increase in generation capacity
will translate into increased consumption.
The analysis that follows estimates 2012 consumption based on these trends observed in administrative
data. It suggests that 14 percent of the electricity consumed in 2012 was by households consuming
more than 400 kWh, compared to 9 percent in 2010.
To summarize, there are four key factors that will influence the subsidies analysis that follows. Between
2010 and 2012:
(i) cost of supply increased 20 percent in real terms;
(ii) tariffs increased (though decreased in real terms at low levels of consumption);
(iii) slab benefits were removed; and
(iv) consumption increased 20 percent.
14
MIES data June 2012
Tariff increases hit high consuming
households the most
Removal of slab benefits hits consumers
just above the thresholds the most e.g.
118% increase17% increase
e.g. middle income
family in Chittagong
e.g. wealthy family in
Dhakae.g. middle income
family in Dhaka
44% increase

The transition from underpricing electricity in Bangladesh: fiscal and distributional impacts 2013
19 19
6 2010 versus 2012: The Distribution and Fiscal Burden of Subsidy
Benefits
This section will discuss the impact of the changes described in section five. It will look at the impact on
the distribution of benefits and on the fiscal burden. This section will also disaggregate the change in
fiscal burden by each of the changes described in section five. Results show that the cost of supply was a
key factor in the increase of the fiscal burden, although the removal of slab benefits helped to limit this
increase.
6.1 More cross-subsidies, but higher net subsidies
Electricity was subsidized as deeply and almost as widely in 2012 as in 2010. In both years, almost all
electricity units consumed (80–90 percent) were subsidized to some extent. Depth remained around 25
percent in 2012, although there was a change in the underlying pattern of subsidies. For low levels of
consumption, virtually stagnant real tariffs coupled with a soaring real cost of supply (figure 13) meant
that the degree of subsidy provided on each unit of electricity almost doubled in real terms. On the
other hand, the cross-subsidy provided through high levels of consumption increased dramatically with
the removal of slab benefits.
The net effect of these opposing forces was neutral in terms of average degree of subsidization.
However, the amount of cross-subsidization did increase as a result of tariff and consumption increases,
but not enough to offset the effects of the rising cost of supply and consumption at lower levels, so net
subsidies increased. Figure 15 illustrates this for the average connected household. In 2010, this
household received 95 taka in gross subsidies, paid 4 taka in cross subsidies, and so received 92 taka in
net subsidies. In 2012, the cross-subsidy increased to 5 taka, but on a gross subsidy of 123 taka, meaning
the net subsidy received was 118 taka (up from 92 taka in 2010).
Figure 15: Gross to net electricity subsidy for the average connected household, 2010 vs 2012. Source:
authors estimates based on HIES data
95 4
92
0
25
50
75
100
125
150
Gross subsidy Cross-subsidy Net Subsidy
Taka
2010
123 5
118
0
25
50
75
100
125
150
Gross subsidy Cross-subsidy Net Subsidy
2012

2013 The transition from underpricing electricity in Bangladesh: fiscal and distributional impacts
20
6.2 Distribution of subsidy benefits improving, though more expensive
Figure 16 illustrates that the distribution of benefits improved between 2010 and 2012. Overall, the
distribution was more equal in 2012, with the increased cross-subsidies paid by rich household reducing
the net subsidies they receive by almost half. While the share received by poor households also
improved, they still only receive around one-third of the benefits of households in the top two quintiles.
This suggests that there remains significant leakage.
Figure 16 Benefits Incidence of Electricity Subsidies in Bangladesh, Source: authors estimates based on
HIES data
The second critical question to analyze is the fiscal burden of subsidies. This is particularly important in
the context of a difficult and deteriorating overall fiscal position in Bangladesh. According to the most
recent IMF estimations for Bangladesh, the fiscal deficit will increase from 3.1 percent of GDP in FY2010
to 4.4 percent of GDP in FY2012. A key driver of this increasing deficit is subsidies provided for various
needs in the country.
Electricity subsidies include subsidies provided to households (residential subsidies) as well as to other
sectors (for example, agricultural subsidies)—the focus here is on residential subsidies. According to this
analysis, the real fiscal burden of residential subsidies increased by over 40 percent between 2010 and
2012.
100%141%
Fiscal burden
6%
11%
17%
24%
42%
0%
10%
20%
30%
40%
50%
Poorest
Quintile
2 3 4 Richest
Quintile
2010
9%
16%
22%
29%
24%
0%
10%
20%
30%
40%
50%
Poorest
Quintile
2 3 4 Richest
Quintile
2012

The transition from underpricing electricity in Bangladesh: fiscal and distributional impacts 2013
21 21
6.3 Disaggregation of change in fiscal burden
The major contributing factor was the increased cost of electricity supply, which increased the fiscal
burden by 75 percent (figure 17). Increased consumption increased the fiscal burden by a further 29
percent. These increases were offset to some extent by tariff increases between 2010 and 2012, which
helped to reduce the fiscal burden by 12 percent, and the removal of slab benefits, which reduced the
fiscal burden by a further 52 percent. On net, the fiscal burden increased by 41 percent.
Figure 17: Disaggregation of change in fiscal burden, 2010-2012
0%
50%
100%
150%
200%
250%
March 2010 Cost of supplyincrease
Demandincrease
through REP
Demandincrease supply
increase
Tariff increases Removal ofslab benefits
March 2012
Tariff
increases
helped
reduce the
fiscal burden
13%
Increased
cost of
supply
increased
fiscal
burden 75%
Net increase in
fiscal burden
of 41%
Removal
of slab
benefits
reduced a
further
52%
Increased
demand
through the
rural
electrification
program
increased
fiscal burden
7%
Increased
demand
through
generation
increases
increased
fiscal burden
22%
Perc
ent
of
2010 c
ost
of
dom
est
ic e
lect
rici
ty s
ubsidie
s
2013 The transition from underpricing electricity in Bangladesh: fiscal and distributional impacts
22
7 Moving Forward: Scenarios of Policy Options
This section briefly explores five policy-relevant scenarios using a partial equilibrium analysis that
includes policies already being pursued by the GOB, for example, the trend toward cost-recovery pricing
and the push toward achieving universal electrification. The results suggest that the move toward cost-
recovery pricing will help reduce the leakage and inefficiency of subsidies, but subsidies will always have
some degree of leakage and inefficiency.
7.1 Overview of scenarios
The scenario analysis looks at the impact of various policy choices available to the government in the
short term (that is, next 12 months), as well as policy choices that could be implemented in the medium
(3–5 years) and long term (5–10 years).
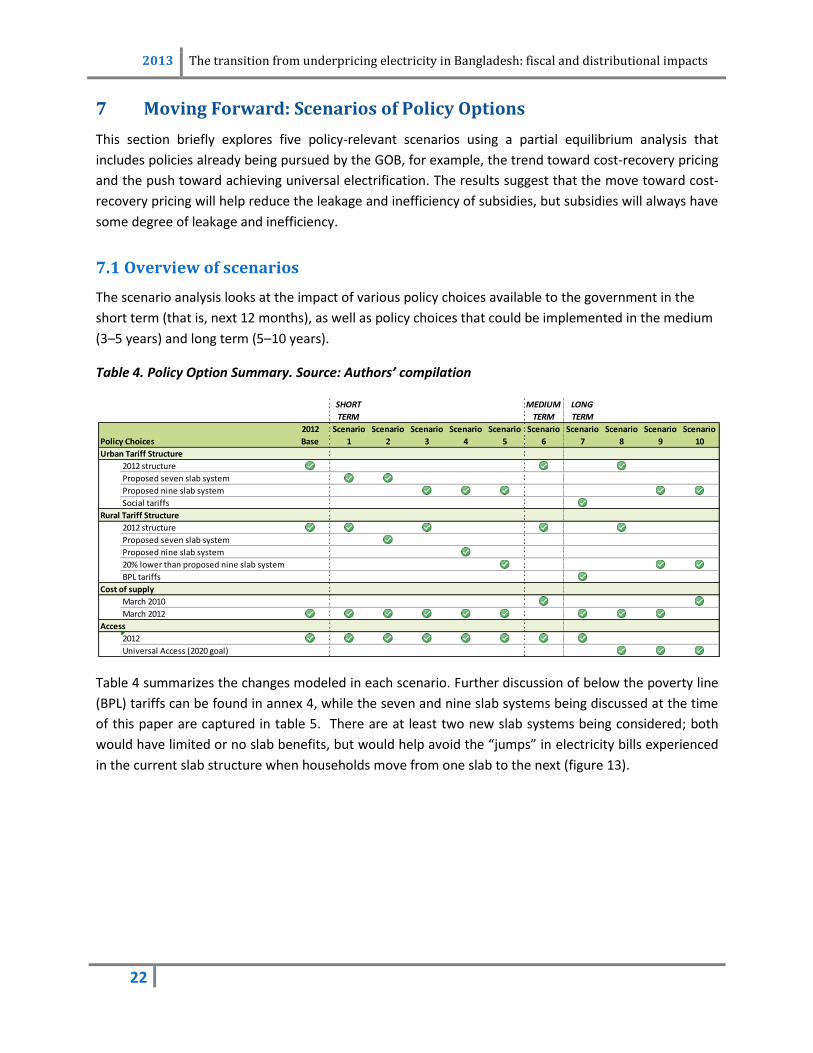
Table 4. Policy Option Summary. Source: Authors’ compilation
Table 4 summarizes the changes modeled in each scenario. Further discussion of below the poverty line
(BPL) tariffs can be found in annex 4, while the seven and nine slab systems being discussed at the time
of this paper are captured in table 5. There are at least two new slab systems being considered; both
would have limited or no slab benefits, but would help avoid the “jumps” in electricity bills experienced
in the current slab structure when households move from one slab to the next (figure 13).
SHORT
TERM
MEDIUM
TERM
LONG
TERM
Policy Choices
2012
Base
Scenario
1
Scenario
2
Scenario
3
Scenario
4
Scenario
5
Scenario
6
Scenario
7
Scenario
8
Scenario
9
Scenario
10
Urban Tariff Structure
2012 structure
Proposed seven slab system
Proposed nine slab system
Social tariffs
Rural Tariff Structure
2012 structure
Proposed seven slab system
Proposed nine slab system
20% lower than proposed nine slab system
BPL tariffs
Cost of supply
March 2010
March 2012
Access
2012
Universal Access (2020 goal)

The transition from underpricing electricity in Bangladesh: fiscal and distributional impacts 2013
23 23
Table 5. Comparison of Seven and Nine Slab Systems
Source: BERC
7.2 Scenario results
Table 6 summarizes the scenario results, with detailed output provided in annex 5.
Table 6. Summary of Scenarios. Source: Authors’ compilation
All scenarios would improve the targeting efficiency of subsidies provided that households in the
poorest quintile receive at least 10 percent of benefits. While these represent an improvement over
2012, most scenarios in the short run would still have significant leakage, although the fiscal burden
could be reduced significantly.
In the medium term, perhaps the most effective policy measure would be to reduce the cost of supply
to 2010 levels. While issues of generation cost and operational efficiency are outside the scope of this
Seven slab systemNo slab benefitsSlab Proposed Tariff0-75 3.6675-200 5.320-300 5.530-400 5.750-600 9.390-800 9.78>800 9.94
Nine slab systemSlab benefits only to 300 kWhSlab Proposed Tariff0-75 4.5676-200 5.16201-300 5.450-400 7.630-500 7.660-600 7.980-700 8.760-800 9.35>800 9.9
Scenario Description
Proportion of
benefits
received by
poorest quintile
Fiscal burden as
% of 2012
BASELINE 9% 100%
1 New slab system (seven) for urban only 14% 43%
2 New slab system (seven) for urban & rural 15% 22%
3 Nine slab schedule for urban only 14% 37%
4 Nine slab schedule for urban and rural 16% -2%
5 Nine slabs with rural tariffs 20% lower 15% 10%
6 2010 cost of supply 13% 35%
7 BPL tariffs / at least cost recover for all other households 52% -34%
8 Access 2020 (universal access) with current tariffs 15% 174%
9 Access 2020 - nine slab structure with rural 20% lower 25% 45%
10 Access 2020 scenario 9 with 2010 cost of supply 48% -56%
Richest Quintile

2013 The transition from underpricing electricity in Bangladesh: fiscal and distributional impacts
24
policy note, it is important for the government to explore these issues in depth to understand the extent
to which it can justify passing on cost of supply increases to households.
In the long term, scenario 8 (achieving universal access under the current tariff structure) illustrates the
need for the GOB to take action. Under this scenario, the fiscal burden would almost double its current
levels.
The only scenarios where leakage is significantly reduced are the long-term options of introducing a BPL
tariff, or achieving universal access while also reducing cost of supply to 2010 levels and introducing the
nine slab system currently being discussed. Both options (scenarios 7 and 9) would see the households
in the poorest quintile receive around 50 percent of subsidies provided. Further, the fiscal burden in
both scenarios would not only be cut completely, but a net fiscal gain would be generated through
cross-subsidies, meaning that additional resources could be available for infrastructure improvements.

The transition from underpricing electricity in Bangladesh: fiscal and distributional impacts 2013
25 25
8 Conclusions and Policy Recommendations
The electricity sector in Bangladesh faces unprecedented challenges, with severe capacity constraints
and sector subsidies, which quadrupled from 0.2 percent to 0.8 percent of GDP between 2010 and 2012,
driving the government’s fiscal deficit deeper. Subsidies provided to residential households are an
important component of broader electricity subsidies, which also include subsidies to the agriculture
sector.
There is significant leakage of residential electricity subsidies: households in the richest quintile received
seven times as much in electricity subsidies as households in the poorest quintile (42 percent of
subsidies versus 6 percent) in 2010. The three key factors contributing to this result are:
(i) access rates have remained low in Bangladesh (55 percent for all Bangladesh, only 20 percent
for rural poor);
(ii) consumption patterns—in 2010 almost 40 percent of electricity consumed was by households
consuming less than 100 kWh, where electricity was highly subsidized (over 30 percent of the
cost of electricity was subsidized); and
(iii) the threshold for cost-recovery pricing—the level of consumption above which consumers pay
at or above cost—is currently high in Bangladesh, only 1 percent of electricity consumption is
above the threshold, that is, 99 percent of electricity units are subsidized.
Leakage of subsidies improved between 2010 and 2012, mainly due to the removal of slab benefits for
higher levels of consumption, meaning households in the richest quintile provided cross-subsidies to
households in lower quintiles.
Meanwhile, the fiscal burden of subsidies increased 41 percent in real terms, mainly because of a 20
percent increase in consumption—the result of increased generation capacity and the ongoing rural
electrification program has increased access—and increases in the cost of supply, since the generation
increase has mostly come from expensive furnace oil rental power plants.
In the short term, any of the new slab structures being considered will help reduce the fiscal burden
significantly. In the medium term, reducing the cost of supply, by reducing generation costs through new
power plants, and improving operational efficiency, will reduce fiscal burden and subsidy leakage.
In the long term, achieving universal access would increase the fiscal burden further. The new tariff
structure, BPL tariffs like those found in many states in India, and reduced cost of supply are all policy
options for the GOB to consider to mitigate fiscal burden and leakage.
Athought this policy report carried out analysis on the technical dimension of electricity pricing and
subsidies, there remain several factors that are crucial for implementing the electricity subsidy reform.
First, it has not discussed the financial aspect of the electricity sector, inlcuding sector losses and fiscal
transfer mechanisms. These issues should be studied as part of a broader energy sector review, and
public expenditure review.

2013 The transition from underpricing electricity in Bangladesh: fiscal and distributional impacts
26
Second, perhaps the most difficult aspect of electricity tariff and subsidy reform is the political economy
of reform. Electricity tariffs affect a large proportion of the voting electorate, and often households with
a stronger political voice. Recent public outcry at tariff increases illustrates the tension that exists, and is
especially important when considering recent reports that the GOB is considering increasing tariffs a
further 50 percent.
A number of other factors are also important to be examined as part of a boarder package on pricing
and subsidy reform. First is the public communication dimension. Recent experiences of substantial
subsidy reform such as those seen in Iran15 provide a good example of placing a high emphasis on
managing public expectations and engaging in a highly visible communication and education program.
Second, the timing and sequencing of reforms is important. Recent tariff increases have been substantial
n Bangladesh and over a short period of time. Experiences of tariff reform in other countries16, for
example Laos, provide an example of a slow and steady approach to tariff reform. In the case of Laos
which chose to transition to cost recovery pricing in 2005, the government implemented the change
over a period of five to six years17. Tariff increases can be more palatable politically when introduced
steadily and gradually over time, and when households can see the benefits (for example, higher quality
supply, more households connected etc.). These factors should be included in a political economy
analysis of any further pricing and subsidy policy changes.
15
See Guillaume 2011 16
The case studies documented by the Global Subsidies Initiative may be useful in this regard. See http://www.iisd.org/gsi/fossil-fuel-subsidies 17
See page 64, World Bank 2006

The transition from underpricing electricity in Bangladesh: fiscal and distributional impacts 2013
27 27
References
Bangladesh Power Development Board. 2012. “Power Sector Road Map.” June, Dhaka, Bangladesh.
Government of Bangladesh. 2002. “Vision and Policy Statement.”
Guillaume, D; Zytek, R; Farzin, M; 2011 “Iran–The Chronicles of the Subsidy Reform”; IMF Working
Paper, Washington, DC.
Komives, K., V. Foster, J. Halpern, and Q. Wodon. 2005. “Water, Electricity, and the Poor: Who Benefits
from Utility Subsidies?” World Bank, Washington, DC.
Laderchi, C., A. Olivier, C. Trimble. 2011. “Cutting Subsidies, Protecting Affordability, and Investing in the
Energy Sector in Eastern Europe and Central Asia.” World Bank, Washington, DC.
Trimble, C., N. Yoshida, and S. Mohammed. 2011. “Rethinking Electricity Tariffs and Subsidies in
Pakistan.” World Bank, Washington, DC.
World Bank, 2006. “Lao PDR - Rural Electrification Phase I Project”; Project Appraisal Document, World
Bank, Washington, DC.
World Bank. 2010. “Electricity Tariffs and Protection of Vulnerable Households in Albania: An Overview
of Recent Reforms.” Washington, DC.
World Bank. 2011. “Electricity Reforms and Energy Affordability in Serbia.” World Bank, Washington, DC.
Zhang, F, 2009. “Distributional Impact Analysis of the Energy Price Reform in Turkey”. World Bank,
Washington DC.

2013 The transition from underpricing electricity in Bangladesh: fiscal and distributional impacts
28
Annexes
Annex 1 Structure of Power Sector
The power sector is organized under the Ministry of Power, Energy, and Mineral Resource (MoPEMR).
The ministry manages the Bangladesh Power Development Board (BPDP), the Dhaka Electricity Supply
Authority (DESA), and the Rural Electrification Board (REB). BPDP is by law responsible for generation
and transmission of power while distribution has the responsibility of different government
corporations. The government also allows private power generation. As part of the 1998 sector reforms,
new public entities such as Power Grid Company of Bangladesh (PGCB), and Dhaka Electric Supply Co.
Ltd (DESCO) as well as private sector IPPs have been constituted.
Key milestones
Figure A1
1977Until 1977, BPDB was
the sole agency responsible for
generation, transmission, and
distribution of electricity in the
country. Reforms in the sector started in
1977 through the creation of REB to
initiate rural electrification
1991No further reform took place until 1991, when the DESA was created
to take over the distribution system of
Dhaka from BPDB as part of the unbundling
process
1992Sector was opened to
private investment
1995Power Cell
was formed to design,
facilitate, and drive reform
measures
1996• The National Energy Policy was
adopted for the overall development of the sector
• To introduce competition, bring in foreign capital, and increase power supply, the Private Sector Power Generation Policy was adopted
• As part of the unbundling, PGCB was formed to take over the transmission business from BPDB
• DESCO was formed to take over part of the distribution business of Dhaka city from DESA
2003 Bangladesh Energy Regulatory Commission (BERC) through a legislative Act to regulate Gas, Electricity and Petroleum products. The mandate includes framing rules and regulation to ensure transparency in the management, operation and tariff determination in electricity, gas and petroleum sector; and to protect consumer and industry interest and promote a competitive market.

The transition from underpricing electricity in Bangladesh: fiscal and distributional impacts 2013
29 29
Figure A2
Power Distribution
Bangladesh Power Development Board (BPDB)
Responsible for distribution in urban areas except metropolitan area of Dhaka and its adjoining area. Dhaka is the commercial heart of Bangladesh with many large business corporations and large and small industries located here. There is a good mix of consumers like commercial, industrial and residential.
Dhaka Electricity Supply Authority (DESA)
Responsible for distribution in greater Dhaka area.
Dhaka Electric Supply Co. Ltd (DESCO)
Responsible for distribution in Mirpur area of Metro area of Dhaka in Greater Dhaka. It purchases power from DESA.
Dhaka Power Distribution Co. Ltd. (DPDC)
The largest power distribution company in the country, responsible for distribution in metropolitan areas.
Rural Electricity Board (REB)
Responsible for distribution in rural areas of Bangladesh through a system of cooperatives known as Palli Biddyut Samities (PBS). It purchases power from BPDB and DESA. Rural Bangladesh is primarily agricultural with some engaged in small scale industries thus, the consumer mix of REB is mostly agricultural in nature
Ministry of Power, Energy and Mineral Resources
Power CellElectrical Advisor and Chief
Electrical Inspector (EA and CEI)
BPDB IPP Small IPP
PGCB(an enterprise of BPDB)
BPDBREB / PBSs
DPDCDESCO WZPDC
Generation
Transmission
Distribution

2013 The transition from underpricing electricity in Bangladesh: fiscal and distributional impacts
30
West Zone Power Distribution Co. Ltd (WZPDCL)
Under BPDB, it is responsible for power distribution in Khulna and Barisal regions. Both Khulna and Barisal are predominantly agricultural areas with lot of jute and rice production in these areas. The demand for electricity is both for agriculture as well as for industrial especially in Khulna which has many large jute mills.
North West Zone Power Distribution Co. Ltd (NWZPDCL)
Under BPDB, it is responsible for power distribution in Rajshahi and Rangpur (formerly a part of Rajshahi) regions. Rajshahi has been regarded as the bread-basket of Bangladesh. With recent agricultural modernizations and agro-processing (which has an extremely bright future in this region of the country) there is a huge amount of agricultural demand for electricity here.
South Zone Power Distribution Company Ltd (SZPDCL)
Under BPDB, it is responsible for power distribution in Chittagong and Comilla regions. Around 40 percent of the heavy industrial activities of the country are located in Chittagong city and adjacent areas. Chittagong is the site of Bangladesh's busiest port which handles 80 percent of all Bangladeshi imports and exports. The strategic location of the port has allowed for interest by investors to help improve the city. Thus a major electricity demand comes from the industrial consumers.

The transition from underpricing electricity in Bangladesh: fiscal and distributional impacts 2013
31 31
Annex 2 Technical Notes on Benefits Analysis Methodology
We estimate the HH subsidy using electricity utility data (for example, tariff structure, cost of supply,
and others) and electricity consumption data in the 2010 Household Income Expenditure Survey (HIES).
This relies on making a number of assumptions, which are discussed in the following methodology.
First spatially adjusted quintiles are defined based on consumption levels. Second, the sample is
cleaned. The HIES survey includes 12,600. We remove 460 observations (3.7 percent) whose reported
electricity expenditure is not possible given the tariff structure. For example, with the minimum charge
of 100 taka in effect in March 2010, households with a valid connection couldn’t spend less than 100
taka. We assume these observations are due to either reporting error, or that they are illegal users (and
so shouldn’t be counted as part of a subsidy analysis).
Third, electricity consumption was estimated by applying the given tariff to the reported expenditure.
We estimate electricity consumption from expenditure data (as consumption is not reported). The
following procedure was carried out: First, from the tariff structures, we calculated ranges of electricity
expenditures that should belong to each slab18. For example, if an urban HH’s monthly electricity
expenditure in 2010 is Tk 100, their electricity consumption belongs to the first slab and the marginal
tariff is Tk 2.6 (table 1). Second, once we identify the slab that a HH belongs to, we apply the variable
tariff for each segment of electricity consumption. For example, if an urban HH’s monthly expenditure in
2010 is Tk 750, then this HH belongs to the second slab and the HH’s consumption is thus estimated as
(750–260)/3.3 + 100.
As a robustness check, consumption estimates were cross-checked against two sets of administrative
data. At a high level, we compared monthly household consumption to per capita consumption reported
by the International Energy Agency19 (box A1). Our estimates were comparable to IEA estimated. At a
more granular level, we compared our estimates to administrative records (table A1). The biggest issue
of under-reporting was for Urban Dhaka households. For example, we estimated 6 percent of total
electricity consumed by urban Dhaka households is by households consuming more than 400 kWh in
2010, while administrative data suggests this was 30 percent for 2010–11. This is likely due to under-
reporting for urban households in Dhaka within HIES (common to have issues with representative
samples in urban areas). We tested a number of different factors to apply to Dhaka households to make
an adjustment for under-reporting. A factor of 1.75 brought results to be comparable with
administrative data, which would imply an under-reporting of 57 percent. Applying this factor brings
consumption for Dhaka households >400 up to 24 percent, in line with administrative data (30 percent).
Table A3 details all consumption estimates compared to administrative records after applying the
adjustment factor. Better, the figure for the total consumption is much more consistent when taking this
adjustment into account (all consumption brackets are within +/- 20 percent), and total consumption is
in line with IEA estimates (of 250 kWh per capita per year).
18
Note for rural consumers, we selected the mid-point of range of tariffs for rural households selected as the effective tariff for the purposes of the analysis. 19
http://www.iea.org/stats/index.asp.

2013 The transition from underpricing electricity in Bangladesh: fiscal and distributional impacts
32
Figure A320
Fourth, we estimated the subsidy by subtracting the cost of electricity supply.
S = C – E
C = U * Q
Q = E / F
S = subsidy
C = cost of supply
E = electricity expenditure
U = unit cost of supply
Q = quantity of electricity consumed
F = tariff
20
Notes
• HIES is 2010, while BERC data is 2010–11. Given growth in consumption, we expect HIES to be lower than administrative records
• Comparisons for sub-group indicative only: • For Dhaka analysis, District 26 & urban used to identify Dhaka households in HIES; DPDC administrative data
used for comparison—will not match households exactly
• For Rural household analysis, “rural” identifier used for HIES, and REB administrative
ALL URBAN RURAL
HIES estimate (2010)
Administrative data (2010-11
HIES estimate (2010)
Administrative data (2010-11
HIES estimate (2009-10)
Administrative data (2010-11
0-100 38% 46% 21% 26% 0-100 65% 76%100-400 53% 41% 66% 57% 100-300 30% 18%
>400 9% 12% 13% 17% 300-500 4% 4%
>500 1% 1%
DHAKA
HIES estimate (2010)
Administrative data (2010-11
1% 3%75% 66%
24% 30%
Box A1
Robustness check: are HIES estimates consistent with IEA figures?
IEA is based on total power generated (that is, includes everything: residential, industry, and so forth)
divided by total population. IEA report a figure of 250 kWh per capital for 2009 in Bangladesh.
HIES suggests monthly consumption is 50 kWh per household (or 90 kWh per connected household).
HIES 50 kWh is almost exactly in line with the 250 kWh per capita per year figure from IEA. Why?
50 kWh per month = 600 kWh per year. The average household size in Bangladesh is 4.5 persons, so
600 kWh per household = ~133 kWh per capita. Residential consumption represents around 50
percent of total energy consumption, so total energy consumed per capita is around twice 133 i.e.
266 kWh per capita in 2010; on par with the 250 kWh per capita in 2009 from IEA, that is, after
considering growth in generation, access, and so forth.

The transition from underpricing electricity in Bangladesh: fiscal and distributional impacts 2013
33 33
Table A1. Domestic Consumption: 2010–11
Utility Slab % Total consumption in
each utility % of slab consumption DESCO 0-100 1.50 3.10 49,256,329,452
100-400 29.02 60.10 2,540,675,895
>400 17.76 36.80 4,149,310,361
Subtotal 48.28 100.00 1,526,946,213
DPDC 0-100 1.38 3.22 77,261,495
100-400 28.46 66.64 1,598,977,025
>400 12.87 30.14 723,186,788
Subtotal 42.71 100.00 2,399,425,308
PDB 0-100 21.09 47.41 1,515,200,299
100-400 22.18 49.85 1,593,181,500
>400 1.22 2.74 87,569,053
Subtotal 44.49 100.00 3,195,950,852
WZPDCL 0-100 22.38 48.00 396,392,331
100-400 23.31 50.00 412,908,678
>400 0.93 2.00 16,516,347
Subtotal 46.62 100.00 825,817,356
REB Min 2.10 4.08 219,474,071
0-100 37.49 72.89 3,922,937,338
101-300 9.36 18.19 979,199,149
301-500 1.95 3.79 204,091,537
Above 500 0.54 1.05 56,543,332
Subtotal 51.44 100.00 5,382,245,427
All Utilities
46.35 6,178,597,504
41.27 5,502,018,480
12.38 1,649,769,170
13,330,385,154 Source: BERC.

2013 The transition from underpricing electricity in Bangladesh: fiscal and distributional impacts
34
The 2012 simulations summarized in the main body of this note and in more detail below (Annex 5)
include consumption forecasts for 2012. These are based on observed overall trends in the energy
sector (20 percent increase in overall demand) and the rural electrification program. The following
process was applied. First, we assumed a ten percent increase in the number of rural households
receiving electricity (in line with administrative records). For each of the newly connected households,
we applied the average electricity consumption for rural households in 2010 (77 kWh). This resulted in
an overall increase in electricity consumption of 4 percent. To adjust for the 20 percent increase
observed at a macro level, we applied a 16 percent increase to all connected households (including the
newly connected rural households). Households were then re-categorized into their relevant
consumption slabs, and the relevant 2012 tariffs were applied for each simulation.

The transition from underpricing electricity in Bangladesh: fiscal and distributional impacts 2013
35 35
Annex 3 Detailed Consumption Analyses
Figure A4
83%
16%
1%
0%
10%
20%
30%
40%
50%
60%
70%
80%
90%
100%
0-100 kWh 100-400kWh >400kWh
Proportion of households in each quintile whose monthly consumption falls into each slab (2010, All
Households)
Poorest quintile
2
3
4
Richest quintile
ALL
38%
53%
9%
0%
10%
20%
30%
40%
50%
60%
70%
80%
90%
100%
0-100 kWh 100-400kWh >400kWh
Proportion of electricity consumed by households whose monthly consumption falls into each slab
(2010, All Households)
Poorest quintile
2
3
4
Richest quintile
ALL
ALL HOUSEHOLDS
RURAL HOUSEHOLDS
0%
94%
6%0%
0%
10%
20%
30%
40%
50%
60%
70%
80%
90%
100%
0-100 kWh 100-400kWh >400kWh
Proportion of households in each quintile whose monthly consumption falls into each slab (2010,
Rural Households)
Poorest quintile
2
3
4
Richest quintile
ALL
2%
65%
33%
2%
0%
10%
20%
30%
40%
50%
60%
70%
80%
90%
100%
0-100 kWh 100-400kWh >400kWh
Proportion of electricity consumed by households whose monthly consumption falls into each slab (2010, Rural
Households)
r_pcons
Poorest quintile
2
3
4
54%
43%
3%
0%
10%
20%
30%
40%
50%
60%
70%
80%
90%
100%
0-100 kWh 100-400kWh >400kWh
Proportion of households in each quintile whose monthly consumption falls into each slab (2010,
Urban Households)
Poorest quintile
2
3
4
Richest quintile
ALL 21%
66%
13%
0%
10%
20%
30%
40%
50%
60%
70%
80%
90%
100%
0-100 kWh 100-400kWh >400kWh
Proportion of electricity consumed by households whose monthly consumption falls into each slab
(2010, Urban Households)
r_pcons
Poorest quintile
2
3
4
Richest quintile
URBAN HOUSEHOLDS

2013 The transition from underpricing electricity in Bangladesh: fiscal and distributional impacts
36
19%14%
77%
10%
0%
10%
20%
30%
40%
50%
60%
70%
80%
90%
100%
0-100 kWh 100-400kWh >400kWh
Proportion of households in each quintile whose monthly consumption falls into each slab (2010,
Dhaka Households)
Poorest quintile
2
3
4
Richest quintile
ALL 22%
1%
75%
24%
0%
10%
20%
30%
40%
50%
60%
70%
80%
90%
100%
0-100 kWh 100-400kWh >400kWh
Proportion of electricity consumed by households whose monthly consumption falls into each slab
(2010, Dhaka Households)
ALL
r_pcons
Poorest quintile
2
3
URBAN HOUSEHOLDS IN DHAKA

The transition from underpricing electricity in Bangladesh: fiscal and distributional impacts 2013
37 37
Annex 4 BPL Tariffs in India
One option available to the Government of Bangladesh is below the poverty line (BPL) tariffs, which are
widespread in neighboring India. BPL tariffs are typically highly subsidized tariffs that are only available
to households below the poverty line. In India, implementation of BPL tariffs varies by state, but
generally BPL households need to provide supporting documentation to qualify for the lower electricity
tariffs. The lower tariff is also often contingent upon other household characteristics, such as total
electricity consumption or number of electricity connections. These are funded through a combination
of cross-subsidies from high consuming households, and transfers from the Ministry of Finance.
This annex provides a brief overview of BPL tariffs in India.
Prevalence of BPL tariffs
As of 2004–2005, 11 states of 19 surveyed21 had a separate tariff schedule for BPL consumers. There
were no “lifeline” tariffs (a special slab for any household with limited consumption). As of 2009–10, 17
states of 26 surveyed22 had a separate tariff schedule for BPL consumers (13 of the 19 surveyed
for2005). Two additional states (both included in the 2005 figure) had lifeline tariffs, and two states had
both with BPL and lifeline tariffs.
History of BPL tariffs
The government of India does not have a central policy mandating subsidized tariffs for BPL consumers;
however, it started encouraging such subsidies with the mid-2000s electricity reforms. The 2005
National Electricity Policy (NEP) encouraged cost recovery in tariffs yet allowed that BPL consumers may
receive subsidized tariffs. It suggests this subsidized consumption should be limited, potentially at 30
units per month, but does not mandate such limitations, and limits the tariffs to no less than 50 percent
of the average cost of supply.
In practice, the effective subsidization rate varies substantially, and most states have not chosen to
follow the 50 percent subsidization limit: 14 of the 2010 BPL tariffs were subsidized between 51 and 100
percent. The limits also vary: 6 of the 2010 BPL schedules were unlimited for all BPL consumers; another
6 were limited at the suggested 30 kWh per month; and the remaining ranged from limits of 25 to 200
kWh per month.
Prior to the NEP and other Acts, the Government of India does not appear to have had a stance on BPL
tariffs. From 1989 to 2005, it had the “Kutir Jyoti Program”, which provided single-point light
connections to all BPL consumers and gave a 100 percent grant for connection charges, but it did not
cover or appear to mention tariffs. Despite this, some states (for example, Karnataka) had BPL tariffs as
early as 1979.
21
Surveyed states are: Andhra Pradesh, Assam, Bihar, Chhattisgarh, Delhi, Gujarat, Haryana, Himachal Pradesh, Jharkhand, Karnataka, Madhya Pradesh, Maharashtra, Orissa, Punjab, Rajasthan, Tamil Nadu, Uttarakhand, Uttar Pradesh, and West Bengal. 22
Survey excluded Goa, Manipur, and Mizoram because their 2009–10 schedules were not available.

2013 The transition from underpricing electricity in Bangladesh: fiscal and distributional impacts
38
Annex 5 Detailed Scenario Results
Figure A5
43%
22%
14%23%
30%34%
-21%
-50%
-25%
0%
25%
50%
Poorest Quintile
2 3 4 Richest Quintile
Benefits Incidence - Scenario 1
15%
25%29% 31%
-48%
-50%
-25%
0%
25%
50%
Poorest Quintile
2 3 4 Richest Quintile
Benefits Incidence - Scenario 2
SHORT
TERM
Policy Choices
2012
Base
Scenario
1
Scenario
2
Urban Tariff Structure
2012 structure
Proposed seven slab system
Proposed nine slab system
Social tariffs
Rural Tariff Structure
2012 structure
Proposed seven slab system
Proposed nine slab system
20% lower than proposed nine slab system
BPL tariffs
Cost of supply
March 2010
March 2012
Access
2012
Universal Access (2020 goal)
37%
0%
14%
23%30% 33%
-19%
-50%
-25%
0%
25%
50%
Poorest Quintile
2 3 4 Richest Quintile
Benefits Incidence - Scenario 3
16%
28%32%
24%
-50%
-25%
0%
25%
50%
Poorest Quintile
2 3 4 Richest Quintile
Benefits Incidence - Scenario 4
-110%
SHORT
TERM
Policy Choices
2012
Base
Scenario
3
Scenario
4
Urban Tariff Structure
2012 structure
Proposed seven slab system
Proposed nine slab system
Social tariffs
Rural Tariff Structure
2012 structure
Proposed seven slab system
Proposed nine slab system
20% lower than proposed nine slab system
BPL tariffs
Cost of supply
March 2010
March 2012
Access
2012
Universal Access (2020 goal)
100%
Fiscal burden
9%16%
22%29%
24%
-50%
-25%
0%
25%
50%
Poorest Quintile
2 3 4 Richest Quintile
Benefits Incidence - Base (2012)

The transition from underpricing electricity in Bangladesh: fiscal and distributional impacts 2013
39 39
100%
Fiscal burden
9%16%
22%29%
24%
-50%
-25%
0%
25%
50%
Poorest Quintile
2 3 4 Richest Quintile
Benefits Incidence - Base (2012)
10%
15%
26% 29% 30%
-50%
-25%
0%
25%
50%
Poorest Quintile
2 3 4 Richest Quintile
Benefits Incidence - Scenario 5
-65%
SHORT
TERM
Policy Choices
2012
Base
Scenario
5
Urban Tariff Structure
2012 structure
Proposed seven slab system
Proposed nine slab system
Social tariffs
Rural Tariff Structure
2012 structure
Proposed seven slab system
Proposed nine slab system
20% lower than proposed nine slab system
BPL tariffs
Cost of supply
March 2010
March 2012
Access
2012
Universal Access (2020 goal)
35%
13%
23%29%
35%
-16%
-50%
-25%
0%
25%
50%
Poorest Quintile
2 3 4 Richest Quintile
Benefits Incidence - Scenario 6
MEDIUM
TERM
Policy Choices
2012
Base
Scenario
6
Urban Tariff Structure
2012 structure
Proposed seven slab system
Proposed nine slab system
Social tariffs
Rural Tariff Structure
2012 structure
Proposed seven slab system
Proposed nine slab system
20% lower than proposed nine slab system
BPL tariffs
Cost of supply
March 2010
March 2012
Access
2012
Universal Access (2020 goal)

2013 The transition from underpricing electricity in Bangladesh: fiscal and distributional impacts
40
100%
Fiscal burden
9%16%
22%29%
24%
-50%
-25%
0%
25%
50%
Poorest Quintile
2 3 4 Richest Quintile
Benefits Incidence - Base (2012)
48%
-22%
-50%
-25%
0%
25%
50%
Poorest Quintile
2 3 4 Richest Quintile
Benefits Incidence - Scenario 7
Net fiscal
contribution
equivalent to 33%
of the current
fiscal burden
LONG
TERM
Policy Choices
2012
Base
Scenario
7
Urban Tariff Structure
2012 structure
Proposed seven slab system
Proposed nine slab system
Social tariffs
Rural Tariff Structure
2012 structure
Proposed seven slab system
Proposed nine slab system
20% lower than proposed nine slab system
BPL tariffs
Cost of supply
March 2010
March 2012
Access
2012
Universal Access (2020 goal)
15% 19% 22% 25%19%
-50%
-25%
0%
25%
50%
Poorest Quintile
2 3 4 Richest Quintile
Benefits Incidence - Scenario 8
174%
LONG
TERM
Policy Choices
2012
Base
Scenario
8
Urban Tariff Structure
2012 structure
Proposed seven slab system
Proposed nine slab system
Social tariffs
Rural Tariff Structure
2012 structure
Proposed seven slab system
Proposed nine slab system
20% lower than proposed nine slab system
BPL tariffs
Cost of supply
March 2010
March 2012
Access
2012
Universal Access (2020 goal)

The transition from underpricing electricity in Bangladesh: fiscal and distributional impacts 2013
41 41
100%
Fiscal burden
9%16%
22%29%
24%
-50%
-25%
0%
25%
50%
Poorest Quintile
2 3 4 Richest Quintile
Benefits Incidence - Base (2012)
45%
25% 27% 26%21%
-38%-50%
-25%
0%
25%
50%
Poorest Quintile
2 3 4 Richest Quintile
Benefits Incidence - Scenario 9
48%40%
12%
-33%-50%
-25%
0%
25%
50%
Poorest Quintile
2 3 4 Richest Quintile
Benefits Incidence - Scenario 10
Net fiscal
contribution
equivalent to 55%
of the current
fiscal burden
LONG
TERM
Policy Choices
2012
Base
Scenario
9
Scenario
10
Urban Tariff Structure
2012 structure
Proposed seven slab system
Proposed nine slab system
Social tariffs
Rural Tariff Structure
2012 structure
Proposed seven slab system
Proposed nine slab system
20% lower than proposed nine slab system
BPL tariffs
Cost of supply
March 2010
March 2012
Access
2012
Universal Access (2020 goal)
Copyright © 2022 FDOKUMEN