Residential Programs Non-Residential Programs - IIS Windows Server
Upload
khangminh22Category
view
15download
0
Residential Electricity Consumption in India:What do we know?
Residential Electricity Consumption in India: What do we know?
Aditya Chunekar | Sapekshya Varshney | Shantanu Dixit
December 2016

About Prayas
Prayas (Initiatives in Health, Energy, Learning and Parenthood) is a non Governmental, non-profit organization based in Pune,
India. Members of Prayas are professionals working to protect and promote the public interest in general, and interests of
the disadvantaged sections of the society, in particular. Prayas (Energy Group) works on theoretical, conceptual regulatory
and policy issues in the energy and electricity sectors. Our activities cover research and intervention in policy and regulatory
areas, as well as training, awareness, and support to civil society groups. Prayas (Energy Group) has contributed in the energy
sector policy development as part of several official committees constituted by Ministries and Planning Commission. Prayas
is registered as SIRO (Scientific and Industrial Research Organization) with Department of Scientific and Industrial Research,
Ministry of Science and Technology, Government of India.
Prayas (Energy Group)Unit III A & III B, Devgiri,
Kothrud Industrial Area,
Joshi Railway Museum Lane, Kothrud
Pune 411 038. Maharashtra Phone: 020 - 2542 0720
E-mail: [email protected]; http://www.prayaspune.org/peg
Acknowledgements: This report has greatly benefited from the feedback received from various experts. We are especially
thankful to Stephane de la Rue du Can from Lawrence Berkeley National Laboratory (LBNL), Mahesh Patankar from MP
ENsystems Pvt. Ltd., and Shonali Pachauri from International Institute for Applied Systems Analysis (IIASA) for reviewing the
report and providing valuable feedback. We also thank our colleagues at Prayas, Energy Group particularly Ashok Sreenivas
and Ashwini Dabadge for their helpful comments. Our special thanks to Vishal Jagtap for the captivating photos that have
been used for the cover of the report. We also highly appreciate Shilpa Kelkar’s efforts in managing the entire publishing
process and getting the final report out.
Any shortcomings or weaknesses in the report are our own.
Suggested citation: Prayas (Energy Group), Residential Electricity Consumption in India: What do we know? December 2016
December 2016
For Private Circulation only
Copyright: Any part of this report can be reproduced for non-commercial use without prior permission, provided that Prayas
is clearly acknowledged, and a copy of the published document is sent to Prayas.
Printed by:Mudra
383, Narayan Peth, Pune.

iii
Summary
Residential electricity consumption (REC) has increased by 50 times since 1971 and now constitutes
about a quarter of India’s total electricity consumption, up from about 4% in 1971. It is expected to grow
further due to rapid electrification, increasing household incomes, and technology development. A better
understanding of REC patterns and the factors affecting it is essential for designing effective and credible
energy efficiency programmes, optimise planning of capacity addition, and better adaption to the rapidly
changing business models and technologies in the Power sector. In this report, we provide an overview of
the current understanding of REC in India by analysing data from various sources like the census, surveys,
and distribution companies (DISCOM) and reviewing the publicly available literature on the topic. There is a
need to collect and publish more data in reliable form and to conduct research across different disciplines to
enhance knowledge about REC in India. We make three recommendations to improve the quality of research
on REC in India. First, organisations like the Bureau of Energy Efficiency (BEE), Energy Efficiency Services
Ltd (EESL), regulators, and the distribution companies should make their REC related data public as much
as possible. Second, researchers both academic and non-academic should use the existing data or generate
data by conducting local surveys to carry out various disciplinary and inter-disciplinary studies on the REC.
Finally, we recommend conducting periodic nation-wide residential energy consumption surveys which
gather data on people’s energy (including electricity) usage patterns over the years. This data can be useful
to understand the change in usage patterns and track improvement in overall efficiency levels.

iv
Contents
1 Why this report? 1
2 What is residential electricity consumption? 3
3 Why is understanding residential electricity consumption important? 4
3.1 Better energy conservation and efficiency programmes 4
3.2 Better planning 4
3.3 Better adaptation to new technologies and business models 5
4 What do we know about residential electricity consumption in India? 7
4.1 How much electricity is used by households? 7
4.2 What is the electricity used for? 14
4.3 What is the appliance ownership? 16
4.4 How efficient are the appliances? 19
4.5 How are the appliances used? 20
4.6 What affects the electricity consumption? 23
4.7 How much electricity will be consumed in the future? 32
5 What next? 34
5.1 More data in public domain 34
5.2 More research 34
5.3 Residential Energy Consumption Survey 35
6 Conclusion 37

v
List of Figures
Figure 1: Sector wise electricity consumption of India in 2014 7
Figure 2: Trend in India’s residential electricity consumption (1971-2014) 8
Figure 3: Per-capita residential electricity consumption for different countries (2001 and 2014) 8
Figure 4: Residential electricity consumption’s share in total electricity consumption for different countries (2014) 9
Figure 5: Ranking of states based on their REC, per-capita REC and per-capita NSDP in 2010-11 10
Figure 6: REC growth trends in states 11
Figure 7: Distribution of households in India according to monthly consumption (in units) 12
Figure 8: Consumption (in units) of households across different states in India 12
Figure 9: Comparison of data from NSSO and DISCOM on monthly consumption of households (2012) 13
Figure 10: End-use contribution to total electricity consumption in India 15
Figure 11: End use distribution of energy in U.S.A. 16
Figure 12: Appliance ownership in metros 17
Figure 13: Trend in appliance ownership from different rounds of NSSO 18
Figure 14: Annual electricity consumption of different appliances for 1 star and 5 star models 19
Figure 15: Load curves for households in Gujarat for summer and winter 21
Figure 16: Load curves from feeder level analysis in Tamil Nadu 21
Figure 17: A load curve from BESCOM 22
Figure 18: Compilation of appliance usage hours from different studies 22
Figure 19: Appliance ownership in different fractiles of expenditure in urban Maharashtra 23
Figure 20: Ownership of appliances according to income in Gujarat in 2010 24
Figure 21: Refrigerator and Air-cooler ownership co-related with household expenditure in India 24
Figure 22: Monthly electricity bill for different states for different consumption levels 25
Figure 23: India’s climatic zones 26
Figure 24: Annual consumption versus floor area for different cities. 28
Figure 25: Energy saving potential of good building design and construction material 29
Figure 26: Projected trend in REC for India 33
Figure 27: Household Energy Consumption Indicators 36

vi
List of Tables
Table 1: Ownership of appliances from different surveys 16
Table 2: Climate Characteristics in India 27
Table 3: Heating Degree Days and Cooling Degree Days in different cities in India 27
List of Boxes
Box A: Central Electricity Authority (CEA) data 9
Box B: Census and Surveys 14
Box C: Residential Energy Consumption Survey (RECS), U.S.A. 15
List of Annexures
Annexure 1: Data Sources 41
Annexure 2: Census & Survey Questionnaires 44
Annexure 3: Load Research Studies 47

vii
List of Abbreviations
BEE Bureau of Energy Efficiency
BLY Bachat Lamp Yojana
CDD Cooling Degree Days
CDM Clean Development Mechanism
CEA Central Electricity Authority
DISCOM Distribution Company
DSM Demand Side Management
ECBC Energy Conservation Building Code
EESL Energy Efficiency Services Limited
EIA Energy Information Administration (USA)
EPS Electric Power Survey
ESCOs Energy Service Companies
HDD Heating Degree Days
IEA International Energy Agency
IESS India Energy Security Scenarios
IHDS Indian Human Development Survey
MNRE Ministry of New and Renewable Energy
MOSPI Ministry of Statistics and Programme Implementation
NITI National Institution for Transforming India
NSDP Net State Domestic Product
NSSO National Sample Survey Organisation
REC Residential Electricity Consumption
RECS Residential Energy Consumption Survey
RTI Right to Information
UJALA Unnat Jyoti by Affordable LEDs for All


1
1. Why this report?
Residential electricity consumption1 (REC) is the total electricity used by households to run appliances like ceiling fans, televisions, and refrigerators. It has increased about 50 times since 1971 and now constitutes about a quarter of India’s total electricity consumption. It may continue to increase in the future due to three main reasons. India is aiming to provide uninterrupted (24 X 7) electricity to all households by 2019, quarter of which currently do not have an electricity connection and the rest of which face frequent power cuts. Household incomes are increasing, which combined with reliable electricity supply, will mean that more households will buy high electricity consuming appliances like refrigerators (currently only 23% of households own refrigerator in India). Finally, technology is rapidly developing. New technology can be energy efficient but also makes usage of more appliances affordable resulting in higher ownership. Rapid electrification, increasing incomes, and technology development will result in people buying more appliances in the future and thus using more electricity to run them. Various studies have projected a five to six times increase in REC in India by 2030.
Understanding how households consume electricity and studying factors affecting them can be useful for realistic estimation of the future demand. Increasing generation of electricity to meet the rising demand is becoming more and more unsustainable. Building power plants involves significant social and environmental issues while running these plants based on fossil fuels causes greenhouse gas emissions leading to dangerous climate change. A realistic future demand, which accounts for potential savings from energy efficiency and conservation measures, can help in optimising the addition and management of the electricity generation sources. REC data over time can facilitate a better analysis of the savings achieved from energy efficiency and conservation measures increasing their credibility significantly. Knowledge of how people buy and use appliances can be used for designing effective programmes that promote market-wide adoption of energy efficient appliances and encourage people to inculcate conservation habits. Another key reason to focus on REC is the changing nature of the Power sector. New business models like open-access and net-metering, and technologies like smart appliances and roof-top solar generation are being adopted in India. With these models and technologies, a consumer can choose between distribution companies (or between different generation companies as well), generate electricity in her house, and manage its use optimally. This is different from the traditional model of electricity distribution where the consumer was mostly passive, using electricity in fairly predictable manner. Understanding consumers’ response to these new business models and technologies will be crucial for policy-makers, distribution companies, and other stake-holders to adapt effectively to these changes.
Considering the importance of REC in India, it is imperative that periodic data on REC is collected and systematic, rigorous, and interdisciplinary research is conducted to understand the situation better. However, there is limited focus on REC in India. Preliminary data on ownership of appliances and their usage in Indian households is collected through nation-wide surveys as part of a larger basket of goods and services. These surveys miss the finer details of ownership and usage which are essential to estimate the REC patterns. Annual aggregated data on size, type, and efficiency of appliances sold in the market which can be used to track the trends in appliance purchases and improvement in their efficiency is not available. Research on the REC has been limited to occasional papers studying one particular aspect of the REC such as efficiency of appliances or buildings. There is a serious lack of disciplinary as well as inter-disciplinary research adopting an integrated, comprehensive approach towards REC.
1. India’s electricity distribution companies (DISCOMs) and the Central Electricity Authority (CEA) use the term ‘domestic’ for the electricity consumption of households. However, we prefer to use ‘residential’ as it is unambiguous, intuitive, and used by most of the countries around the world.

2
The purpose of this report is twofold: (a) to highlight the importance of the REC in India’s energy future and make the case for periodically collecting data and conducting research; and (b) to act as a starting point for future discussions by providing an overview of the current understanding on the REC in India. The overview includes analysis of various data sources and a review of research literature publicly available on this topic in the Indian context. Recently, the U.S. Energy Information Administration (EIA) released a report (EIA, 2014) on electricity usage in India’s household sector to discuss key trends and provide an overview of available usage estimates from various sources of literature. The analysis was mostly limited to a review of macro studies carried out by the International Energy Agency (IEA), the World Bank, and the Lawrence Berkeley National Laboratory (LBNL) and some preliminary analysis of the National Sample Survey Organisation (NSSO) data2. Prayas, Energy Group (PEG, 2015) in its recent report identified the gaps in the public data available on household energy consumption. This was part of a broader exercise to report data gaps in India’s entire energy sector. In the present report, we provide a more detailed analysis by reviewing various data sources and literature on different aspects of the REC in the Indian context. The report is targeted at a wide audience including policy-makers, bureaucrats, distribution companies’ executives, academicians, members of civil society organizations, and consumers. Within academics, our target audience is across different areas like architecture, engineering, economics, anthropology, and design who can explore different aspects of REC.
We discuss different aspects related to REC in the following sections. Section 2 describes our definition of the residential electricity consumption. Section 3 briefly describes the three key reasons for focusing on REC and understanding it better. Section 4, the core of the report, provides an overview of the current understanding of REC in India. Section 5 provides brief recommendations to further data collection and research on REC in India while Section 6 concludes the report.
2. National Sample Survey Office data. (See Box B: page 14)

3
2. What is residential electricity consumption?
Residential electricity consumption (REC) is the total electricity used by households for different end-uses like cooking, refrigerating food, cooling rooms, and others. Sometimes people use a combination of energy sources for a particular end-use. For instance, people may use both induction stove (using electricity) and a cook-stove (using biomass) to cook food depending on availability of the source. People may also use both an electric water heater as well as solar water heater to heat water. In these cases, only the electricity component of the end-use is included in the REC. In most cases, the electricity is supplied by a local, publicly owned, electricity distribution company (DISCOM) using a country-wide electricity grid. For instance, the state owned Maharashtra State Electricity Distribution Company Ltd. (called MAHADISCOM or MSEDCL) provides electricity to the state of Maharashtra except for Mumbai.
In addition to the grid-connected electricity from the local DISCOM, many people install alternative sources of electricity such as rooftop solar panels or diesel generators. The consumption based on electricity generated from these alternative local sources is also included in the definition of REC. It should be noted that solar water heaters directly use solar energy to heat water whereas solar panels convert solar energy to electricity which can then be used to run different appliances. Hence the use of electricity generated by solar panels is included in REC whereas use of solar water heaters is not. Uninterrupted Power Supply (UPS) machines (also called inverters in India) store the grid-connected electricity and allow the owner to run appliances during power interruptions. Hence electricity consumed by appliances running on inverters is also accounted for in the REC. Very few households own an electric vehicle. Only about 0.1% of the total motor vehicles sold in India in 2014-15 were electric vehicles3. However, with government programmes like the National Electric Mobility Mission Plan (NEMMP) and Faster Adoption and Manufacturing of Electric Vehicles (FAME), more people may buy electric vehicles. The standard international practice is to measure the energy consumed for transport (both public and private) separately from the household energy consumption. Hence, the electricity used to charge the batteries of electric vehicles can be accounted separately. However, there is no strict rule and it can also be included in REC. Finally, some households use unauthorised electricity by sourcing it from the low tension wires on poles near to their houses. Ideally, while estimating the total REC in India, electricity consumption based on unauthorized electricity should also be accounted for as it represents the true demand. However, the data on such illegal consumption can be difficult to obtain. If it is available, it can be accounted for in the REC.
As we mentioned, households use a combination of energy sources for their daily needs. Although REC contributes to about a quarter of total electricity consumption in India, it still constitutes a small part of the total household energy consumption in India. Total household energy consumption includes all the sources of energy such as electricity, biomass, and oil based products used by a household for various end-use activities like cooking, and lighting. A majority of households still use biomass for cooking but its share is decreasing. According to IEA (IEA, 2015), the share of bioenergy in the total energy consumption of the buildings sector (which includes residential and services) has fallen from 75% in 2000 to about 66% in 2013. Electricity and oil products have seen a corresponding increase in their share mainly due to increased incomes as well as better access to electricity for running appliances and oil products like Liquefied Petroleum Gas (LPG) for cooking.
3. Society for Indian Automobile Manufacturers Link (http://siamindia.com/statistics.aspx?mpgid=8&pgidtrail=9) and Live Mint Article on Electric Vehicles (http://www.livemint.com/Industry/lBkrw7B4nyVbSYAlrak9CK/Indias-electric-vehicle-sales-grow-375-to-22000-units.html)

4
3. Why is understanding residential electricity consumption important?
Residential Energy Consumption (REC) forms a quarter of our total electricity consumption and is expected to significantly increase in the future due to rapid electrification, increasing incomes, and technology development enabling more appliances at affordable prices. A better understanding of the households’ consumption patterns and the factors affecting them can provide useful insights for designing policy and technological responses for managing and meeting the increasing demand. There are three major ways in which knowledge on the REC can prove useful.
3.1 Better energy conservation and efficiency programmes
The success of policies and programmes that urge people to conserve energy and buy energy efficient appliances depends on public response. Knowing the factors that affect people’s decisions of buying and using appliances can help in designing these programmes effectively. For instance, if it is found that a consumer buys a ceiling fan based on the local electrician’s advice, then the programme for promoting energy efficient ceiling fans can focus on the local electricians to be more effective. Knowledge of the seemingly irrational tendencies like procrastination and lack of self-control that people exhibit while making everyday decisions can also help in the design of so-called behavioural interventions (Rathi & Chunekar, 2015). These interventions nudge people to take positive actions based on their peculiar behavioural tendencies. For instance, a study (McCalley, 2006) found that energy consumption in a sample of washing machines reduced by 24% when the default water temperature was set to cold instead of hot as people are usually averse to change any default settings. Behavioural interventions are being implemented world-wide as they are cost-effective, and relatively easy to implement, and because their impact can be rigorously measured using scientific field testing (Allcott & Mullainathan, 2010).
Data on the consumption by households over time can be used to measure the actual savings achieved from energy efficiency (EE) programmes. A so-called deemed savings approach is regularly used to estimate energy savings from an EE programme. Under this approach, technical savings from energy efficiency measures under ideal conditions are calculated which are always higher than actual savings. Measurement of actual savings achieved can be extremely difficult and expensive. However, a more realistic estimation of the savings from EE programmes is possible if periodic data is collected on the appliance usage characteristics and overall consumption patterns. The data can also be used to estimate the scale of rebound effect; a term used to denote the increase in the use of appliances as their operating costs go down with increase in efficiency. For instance, people may use air-conditioners more if they become more efficient. A rebound effect reduces the savings that can be achieved from an energy efficiency programme. A realistic estimation of savings can increase the credibility of EE programmes significantly thereby increasing traction for them among various decision-makers including policy-makers, bureaucrats, and distribution company executives.
3.2 Better planning Traditionally, planning has forecasted future demand based on macro trends and then built power plants to meet this demand. However, this approach is becoming increasingly unsustainable. Building power plants involves displacing people and damaging the local environment. Running power plants results in the emission of greenhouse gases which causes dangerous climate change. Running the power plants also faces the additional constraint of limited reserves of fossil fuels. Renewable sources of generation like solar and wind do overcome these constraints but they are currently expensive and present challenges

5
arising out of their intermittency. The traditional approach to planning can also result in excess capacity (due to inaccurate estimation of demand) leading to higher energy costs. Various studies have estimated that efficient appliances can save about 15-20% of the future REC demand based on broad assumptions. A more accurate projection of future demand accounting for reliable estimation of savings from energy conservation and efficiency can be useful for planning optimised capacity addition.
A better understanding of consumption patterns can also help in estimating the energy required to provide a decent standard of living for all households in India. This normative aspect is a crucial component of energy planning as planning is not limited to meeting the demand forecast based on the previous trends. It should ensure that all households have access to adequate and reliable energy in a sustainable manner (See (Dharmadhikary & Bhalerao, 2015) for more discussion on this aspect).
Finally, a better prediction of the future demand from the residential sector can act as an important input for the various energy models developed for India. These models can be very useful towards broad energy sector planning. They can also be useful for evaluating and reviewing India’s mitigation component in the climate contribution (the Intended Nationally Determined Contributions (INDCs)) as a part of the on-going climate change negotiations. Energy is an important sector in India’s climate change mitigation efforts contributing to 77% of its greenhouse gas emissions. A better understanding of the future demand and savings from energy efficiency measures can lead to a better estimation of the reduction of greenhouse gas emissions (see (Dubash, Khosla, Rao, & Sharma, 2015) for more discussion on this aspect).
3.3 Better adaptation to new technologies and business models
The Power sector is undergoing rapid change. India’s grid connected renewable energy (RE) capacity has increased seven times to about 35 GW in the last decade. India has also set up an ambitious target of installing 175 GW of RE by 2022, which implies an addition of 3 MW of RE capacity for every 2 MW of conventional capacity added. RE is highly weather dependent making load management an important tool to increase its utility. Load management either includes reducing load (i.e. use of electricity) through conservation and efficiency, or shifting it to time periods when RE generation is high.
The first step in load management is to measure it. Understanding how and when the consumer uses electricity is crucial to reduce or shift the load. Technology is providing many more options to consumers in managing load. Batteries are getting more efficient and affordable in storing the electricity when not required. Small chips in air-conditioners can increase the temperature settings automatically consequently reducing the load during times of peak demand. New appliances can be monitored remotely through mobile apps and can also interact with each other for an optimised performance4. These technologies can make the load more flexible but would require a thorough understanding of consumer preferences in order to operate the grid.
In addition to load management, consumers can also generate electricity through rooftop solar panels. This can change the traditional unidirectional nature of the grid (from large-scale power plants to consumers) to a bi-directional network with a number of decentralised sources of generation. Understanding when consumers would opt to install solar panels and how that would affect their usage of electricity would be crucial to adapt to this complex nature of the grid.
Finally, new policies and business models are coming up in the Power sector to both adapt to the technological changes as well as to increase efficiency by bringing in more competition. These policies and business models require the consumer to be a key decision-maker unlike the traditional model where the consumer was mostly a passive actor. For instance, a net-metering policy where the distribution company
4. See for example https://nest.com/

6
pays the consumers for the electricity generated by solar panels on their roofs can significantly alter their usage patterns. Similarly, a dynamic pricing model where consumers pay different tariffs at different times of the day can change how they use their appliances.
Understanding how these changes can alter consumer behaviour is crucial for all the actors in the Power sector including policy-makers, bureaucrats, regulators, and distribution companies, to enable them to better adapt to these changes.

7
4. What do we know about residential electricity consumption in India?
The current understanding of the residential electricity consumption (REC) in India comes from three types of sources: (a) publicly available data from government agencies and local electricity distribution companies (DISCOMs), (b) nationwide household census and surveys, and (c) relevant research papers and reports. In this section, we have compiled and analysed this data to answer some broad questions related to the REC in India.
4.1 How much electricity is used by households?
4.1.1 National level
In 2014, households accounted for about 22% of the total 883 billion units5 of electricity consumed in India. The residential sector has the highest number of consumers among all the sectors and is second only to the industry in terms of consumption (See Figure 1).
Figure 1: Sector wise electricity consumption of India in 2014
5. 1 unit of electricity = 1 kWh, 1 TWh = 1 billion units
Source: (MOSPI, 2015)
The total electricity consumed by households in India is now more than 50 times that of 1971 due to increased number of households, rising incomes, and significant electrification (See Figure 2). The share of the REC in the total electricity consumption has also gone up from 4% in 1971 to 22% in 2014. One of the reasons for the exponential growth in the last four decades is the very low baseline in 1971. In the last decade the REC grew at an average rate of 8% annually. In the same decade, China’s REC grew at a rate of about 12% annually. More advanced economies with significant per capita REC like South Korea and USA showed a moderate rate of increase (5% and 1% respectively), while Germany has been able to keep its REC constant.
Commercial(9%)
Other(7%)
Industry(44%)
Agriculture(18%)
Residential(22%)
883 TWh

8
Source: (MOSPI, 2015), (CEA, 2011), (CEA, 2014) and older Annual General Reviews by CEA.
However, the total REC of the countries is only one part of the story. In per capita terms, India and China are way behind all the developed economies. U.S.A.’s per capita REC is about 30 times that of India while China’s per capita REC is 4 times that of India (See Figure 3). Also, the difference in per capita consumption between India and China has increased significantly between 2001 and 2013. This indicates that the increase in per capita consumption has been much more in China than in India.
Figure 3: Per-capita residential electricity consumption for different countries (2001 and 2014)
Figure 2: Trend in India’s residential electricity consumption (1971-2014)
Sources: (CEA, 2014), (CEA, 2001), (National Bureau of Statistics of China (NBSC), 2016), (Korea Energy Statistics Information System,
2016), (Eurostat, 2016), (Energy Information Administration (USA), 2016) and (World Bank, 2016)
1970 1980 1990 2000 2010
0
50
100
150
200
REC
(TW
h)
U.S.A.
India
China
South Korea
Germany
Residential Electricity Consumption (kWh)
1,269
1,694
783
2001
2014512
114
153
71
1,585
0 1,000 2,000 3,000 4,000 5,000
4,413
4,217

9
The share of REC in the total electricity consumption of the country depends on a number of factors including the structure of the economy, energy intensity, and productivity. In countries with significant manufacturing activities like China and South Korea, the share of REC is lower at 13% while in countries where services play a dominant role in the economy, the share is higher (27% in Germany and 37% in USA) (See Figure 4).
Figure 4: Residential electricity consumption’s share in total electricity consumption for different countries (2014)
Source: same as Figure 3
Box A: Central Electricity Authority (CEA) data
The data for India has been sourced from the Central Electricity Authority (CEA) of India. The CEA is a statutory organisation re-formulated under the Electricity Act, 2003 and advises the central government on technology, planning, and policy issues. Local electricity distribution companies (DISCOMs) record their annual electricity sales to different consumer categories including the residential category. The CEA compiles the sales data from all the DISCOMs and publishes it annually in a publication called Annual General Review (CEA, 2014). This data can be used to determine the current composition of aggregate electricity consumption and past trends. The CEA also uses the data to estimate future electricity demand using a mix of trend analysis, end-use assessment, as well as econometric modelling. The projection analysis is published every five years in a separate report called the Electrical Power Survey (EPS) (CEA, 2011). Three points should be noted related to the data on REC from this source: (a) this data does not include use of electricity generated from local sources such as diesel generators, solar rooftop and micro-grids; (b) this data also does not include use of unauthorized electricity by households; (c) in some cases the distinction between consumer categories may not be straightforward for instance, residential consumers on agricultural connections or small commercial establishments on residential connections. The magnitude of these components is expected to be small as compared to the total REC in India. However, they need to be investigated further to get a better estimate.
0% 5% 10% 15% 20% 25% 30% 35% 40%
37%
27%
22%
13%
13%
Share of REC (%)
U.S.A.
India
China
South Korea
Germany

10
Source: (CEA, 2012)
Notes: Only states with total annual REC more than 1 TWh are considered.
NSDP is Net State Domestic Product
Andhra Pradesh refers to the undivided state before Telangana was formed in 2014.
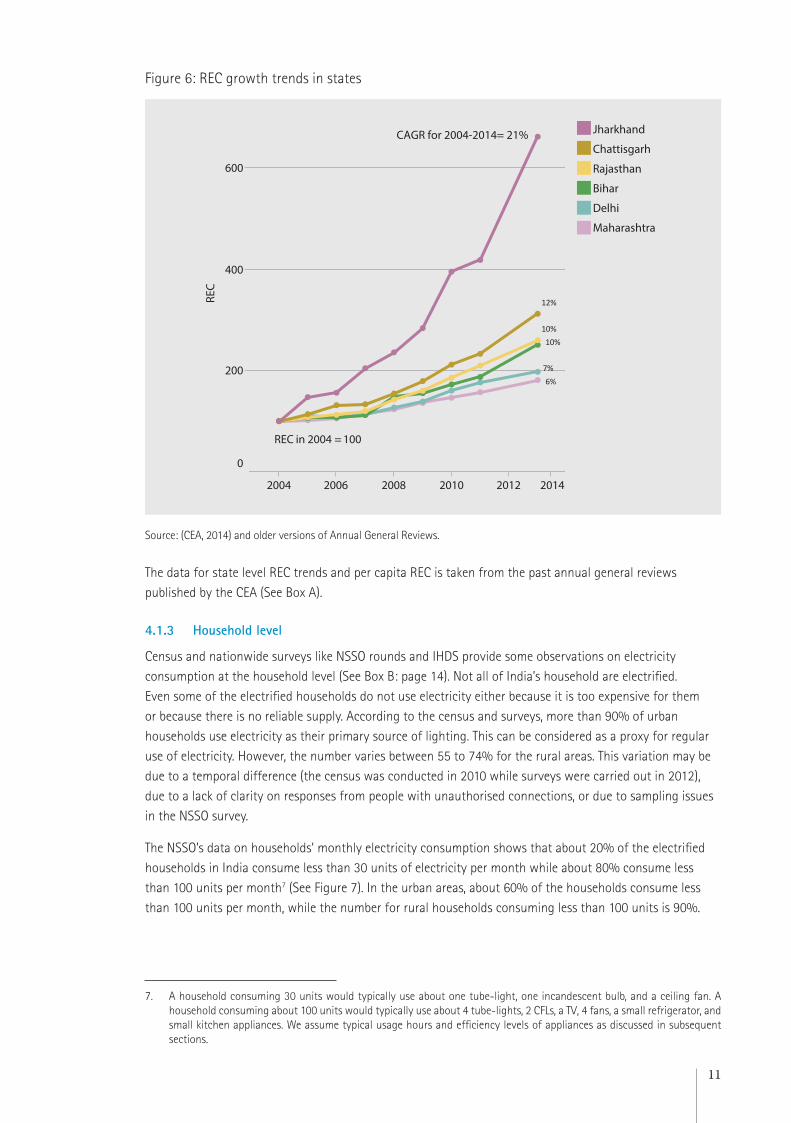
All states, irrespective of their current REC, show a significant growth trend in the decade from 2004 (see Figure 6). The annual growth rate for the states like Delhi, Punjab, and Maharashtra with higher per capita REC was in the range of 5-8%. The REC for states like Bihar, and Rajasthan with lower per capita REC, on the other hand, grew at a higher rate 10-12%. Jharkhand was an outlier showing a 21% annual growth for last 10 years.
4.1.2 State level
The REC varies across states depending on households’ incomes, rate of electrification, climate, and other factors. Larger states like Maharashtra, Uttar Pradesh, and Tamil Nadu rank high in terms of total REC (See Figure 5). On the basis of per capita REC states with relatively less incomes6 and low rates of electrification rank lower. Delhi, the state with the highest per capita REC consumes four times more per capita than India’s average and 25 times more than Bihar, one of India’s lower ranked states based on per capita REC. The total REC of Delhi is more than that of Gujarat, one of the richer states, with a population about three times that of Delhi.
Figure 5: Ranking of states based on their REC, per-capita REC and per-capita NSDP in 2010-11
MH UP TN AP DL GJ WB KA PB KL RJ MP HR OD CG JH BR UK AS HP JK
0
10
20
0
200
400
600
0
50
100
150
1420
10
16 1817 19 21
11 12
1513
4
687 9
1
2
5
3
1420
10161817 19
21
11 1215 13
4 687 9
1
2
53
14
10
2016 181719
11
21
12 1513
4 68 7 9
1
25 3
MH UP TN AP DL GJ WB KA PB KL RJ MP HR OD CG JH BR UK AS HP JK
0
10
20
0
200
400
600
0
50
100
150
1420
10
16 1817 19 21
11 12
1513
4
687 9
1
2
5
3
1420
10161817 19
21
11 1215 13
4 687 9
1
2
53
14
10
2016 181719
11
21
12 1513
4 68 7 9
1
25 3
Andhra Pradesh (AP)Assam (AS)Bihar (BR)Chhattisgarh (CG)Delhi (DL)Gujarat (GJ)
Haryana (HR)Himachal Pradesh (HP)Jammu and Kashmir (JK)Jharkhand (JH)Karnataka (KA)Kerala (KL)
Madhya Pradesh (MP)Maharashtra (MH)Orissa (OD)Punjab (PB)Rajasthan (RJ)Tamil Nadu (TN)
Uttar Pradesh (UP)Uttarakhand (UK)West Bengal (WB)
REC
(TW
h)Pe
r Cap
ita R
EC (k
Wh)
Per c
apita
NSD
P (0
00 ₹
)
6. We take NSDP as a proxy for income. NSDP is the net state domestic product. Source for NSDP data: http://niti.gov.in/content/capita-nsdp-current-prices-2004-05-2014-15
11
Source: (CEA, 2014) and older versions of Annual General Reviews.
The data for state level REC trends and per capita REC is taken from the past annual general reviews published by the CEA (See Box A).
4.1.3 Household level
Census and nationwide surveys like NSSO rounds and IHDS provide some observations on electricity consumption at the household level (See Box B: page 14). Not all of India’s household are electrified. Even some of the electrified households do not use electricity either because it is too expensive for them or because there is no reliable supply. According to the census and surveys, more than 90% of urban households use electricity as their primary source of lighting. This can be considered as a proxy for regular use of electricity. However, the number varies between 55 to 74% for the rural areas. This variation may be due to a temporal difference (the census was conducted in 2010 while surveys were carried out in 2012), due to a lack of clarity on responses from people with unauthorised connections, or due to sampling issues in the NSSO survey.
The NSSO’s data on households’ monthly electricity consumption shows that about 20% of the electrified households in India consume less than 30 units of electricity per month while about 80% consume less than 100 units per month7 (See Figure 7). In the urban areas, about 60% of the households consume less than 100 units per month, while the number for rural households consuming less than 100 units is 90%.
Figure 6: REC growth trends in states
7. A household consuming 30 units would typically use about one tube-light, one incandescent bulb, and a ceiling fan. A household consuming about 100 units would typically use about 4 tube-lights, 2 CFLs, a TV, 4 fans, a small refrigerator, and small kitchen appliances. We assume typical usage hours and efficiency levels of appliances as discussed in subsequent sections.
2004 2006 2008 2010 2012 2014
0
200
400
600
REC
REC in 2004 = 100
CAGR for 2004-2014= 21% Jharkhand
Chattisgarh
Rajasthan
Bihar
Delhi
Maharashtra
12%
10%10%
7%6%

12
Source: (NSSO, 2014)
This distribution of households in different consumption slabs varies across states (See Figure 8). In most states, about 15-20% of the households consume less than 30 units per month. However, in some states like West Bengal, Bihar, and Jharkhand the number is quite high at about 40%. In Delhi, the state with highest per capita REC, about 60% of the total households consume more than 100 units per month while the number is in the range of 25-30% for other states with high per capita REC such as Maharashtra, Tamil Nadu and Punjab.
Figure 8: Consumption (in units) of households across different states in India
Figure 7: Distribution of households in India according to monthly consumption (in units)
Source: (NSSO, 2014)
The data on household consumption from the NSSO can be compared with that collected and published by DISCOMs. Most DISCOMs in India have a different tariff for different monthly consumption levels i.e. a consumer using 30 units per month will pay less price per unit than a consumer using 100 units per month (See Figure 22). The DISCOMs are required by the regulatory processes to publish data on the number of consumers in particular tariff slabs. The consistency of this data can be checked by comparing with the NSSO data. For instance, we have compared the data from tariff petitions by DISCOMs in different states with the data from the NSSO (See Figure 9). We see some inconsistency between the two data sets for the three states. Some discrepancy is expected as the survey has been conducted at particular times of the year while the DISCOM data is most probably averaged over a year. The DISCOM data will generally be more reliable than the survey data. However, this needs to be explored.
1%
2%
4%
10%
18%
33%
32%
33%
30%
26%
16%
32%
22%
13%
28%
RuralUrban
All India
0-30 31-50 51-100 101-300 301-500 >500
Delhi
Punjab
Andhra Pradesh
Tamil Nadu
Kerala
Rajasthan
Gujarat
U ar Pradesh
Maharashtra
Bihar
Karnataka
West Bengal
19%
25%
11%
14%
16%
18%
23%
20%
21%
35%
38%
41% 25%
14%
25%
19%
20%
29%
24%
40%
24%
44%
34%
48%
34%
35%
32%
33%
28%
30%
19%
23%
22%
46%
37%
15%
30%
26%
19%
22%
23%
13%
11%
11%
9%
8%7%
9%
5%
3%
0-30 3 1-50 51-100 101-300 301-500 501-1000

13
Figure 9: Comparison of data from NSSO and DISCOM on monthly consumption of households (2012)
A. Delhi
Sources: (NSSO, 2014), (BRPL, 2011), (BYPL, 2011) and (TPDDL, 2012)
B. Madhya Pradesh
Sources: (NSSO, 2014), (MPPuKVVCL, 2013) & (MPPKVVCL, 2013)
C. Tamil Nadu
Sources: (NSSO, 2014) and (TANGEDCO, 2012)
DISCOM NSSO
15%
25%60%
24%
70%
6%
Slab 1 to 200 201 to 400 > 400
DISCOM NSSO
0.7%
15%
29%
53%
24%
66%
3%
Slab 1 to 50 51 to 100 101 to 300 > 300
9%
DISCOM NSSO
21%
25%
50%
28%
34%
33%
4% 5%
Slab 1 to 50 51 to 100 101 to 250 > 250

14
Box B: Census and Surveys
India conducts census every 10 years. The last census was conducted in 2010. People were asked about their primary source of lighting as well as ownership of couple of appliances. The National Sample Survey Organisation (NSSO) conducts a nationally representative survey every five years to estimate the household consumption of goods and services including appliances and electricity. The survey during 2011-12 was conducted on 101,651 households. In addition to appliance ownership, the respondents were asked about their electricity consumption in units for the last month. The survey was carried out only once for a household. Hence, it does not account for the seasonal variation of electricity consumption in a household. However, as it was carried out all over India over a year, it gives good indicators for electricity consumption at the household level. The Indian Human Development Survey (IHDS) is also a nationwide survey of about 41,554 households conducted by the University of Maryland and the National Council for Applied Economic Research (NCAER). It provides data on appliance ownership at the national and, state levels as well as some selected metros. However, it does not provide electricity consumption data. The list of questions related to the residential electricity consumption in these surveys has been compiled in Annexure 2.
4.2 What is the electricity used for?
People use electricity to light their homes, cool rooms, refrigerate food, and many other day-to-day activities. It is useful to understand how these end-uses of electricity contribute to the total REC. This can help in prioritising the efficiency and conservation measures on the end-uses that contribute the most to the REC. A time-series data of the end-use distribution of REC can also help to understand the patterns of change in household electricity consumption. This is useful to predict the future demand for electricity from households.
A nation-wide residential energy consumption survey (See Box C) is ideal for identifying different ways in which people use energy. Such a survey typically asks a representative sample of households about their energy usage patterns. The survey data is then analysed along with the billing data from energy providers and appliance efficiency data from manufacturers to estimate the distribution of total energy consumption (including electricity) into various end-uses like lighting, space cooling, and water heating.
India does not have a residential energy consumption survey. A few studies ((World Bank, 2008), (de la Rue du Can, McNeil, Zhou, Sathaye, & Letschert, 2009),(Boegle, Singh, & Sant, 2010), (NITI Aayog, 2016)) have estimated how different appliances contribute to the total annual REC in India. All the studies use a similar methodology with slightly different assumptions. The first step involves estimating the number of appliances in the households using the data from the census and the surveys. Then, efficiency levels of these appliances are estimated based on market data, data from the Bureau of Energy Efficiency (BEE), and inputs from industry experts. Finally, usage patterns of these appliances are assumed based on a few local studies. The results of these bottom-up studies (See Figure 10) depend on a number of assumptions made in the absence of on-field data. However, they can be used to make some broad observations.

15
Sources: (Boegle et al., 2010), (NITI Aayog, 2016) and (World Bank, 2008)
Households still use electricity for lighting more than anything else. The share of lighting may be decreasing because of the increased ownership of electricity intensive appliances like refrigerators and air-conditioners. A further division of share of lighting (not shown in Figure 10) in 2012 indicates that the share of tube-lights and Compact Fluorescent Lights (CFLs) is higher than that of the inefficient incandescent bulbs. This was probably due to the Bachat Lamp Yojana launched by the BEE in 2009 which promoted CFLs. Space cooling including air-conditioners, air-coolers and fans is the second highest consuming end-use with its share substantially increasing. Lights, AC, fans, air-coolers, refrigerators, televisions, and water-heaters account for about 90% of the total electricity consumption. There are quite a few assumptions involved in these studies which make these findings indicative at best. We will discuss some of them in subsequent sections. A periodic, rigorous, and nation-wide residential energy consumption survey can definitely enable a better analysis and estimation of REC distribution according to end-uses.
Box C: Residential Energy Consumption Survey (RECS), U.S.A.
Every four years, the Energy Information Administration (EIA) conducts a Residential Energy Consumption Survey (RECS) with a sample of occupants in single family homes, apartments and mobile homes across the United States. Trained interviewers meet with residents and record information on structural characteristics of the housing unit, energy consuming behaviour, appliances and equipment. Following the household survey, the EIA collects energy billing data for sampled households from their energy suppliers with a second survey. Complex statistical models allocate a household’s total consumption to specific end-uses such as heating, cooling and refrigeration. Interesting insights can be gathered from such surveys. For instance, the contribution of space conditioning (heating and cooling) has reduced to 48% of the total residential energy consumption in 2009 as compared to about 58% in 19938 (See Figure 11). This can be due to increased adoption of more efficient equipment, better insulation, and people’s shift to warmer climates. On the other hand, the contribution of appliances, electronics, and lighting grew from 24% to about 35%. Although, there have been some efficiency gains in this category, the increased number of such devices have offset these efficiency gains.
Figure 10: End-use contribution to total electricity consumption in India
8. End Use of USA EIA link (http://tinyurl.com/kr8zyh9)
37%
31%
21%
18%
17%
16%
14%
17%
11%
11%
11%
11% 16%
12%
12%
10%
13%
4%
6%
3%
5%
FansRefrigeratorTV
Air CoolersAC
Water heatersOthers
Lighting
Prayas (2008)World Bank (2006)
IESS (2012)

16
4.3 What is the appliance ownership?
The total REC depends on the number and type of appliances owned by the households; the more and bigger the appliances, the more the REC. Appliance ownership in Indian households is still low but growing fast. The data from census and surveys (See Box B) can be used to estimate the appliance ownership. About 70% of the households own a fan while 56% own a TV (See Table 1). The ownership of energy guzzling appliances is still very low; about 23% for refrigerators and 2% for air-conditioners. Also, the urban-rural divide in the ownership is very evident more so in the higher-end appliances; 82% of urban households own a TV, while only 42.6% own a colour TV in rural areas. Similarly, 43% of urban households own refrigerators while only 9% of rural households own one.
Table 1: Ownership of appliances from different surveys
IHDS-2 Survey (2012):
Appliance All India Urban Rural
Electricity Access 83% 97% 62%
Ceiling fans 72% 95% 61%
Televisions 60% 88% 48%
Refrigerators 23% 47% 12%
Air conditioners 2% 5% 0.4%
Air coolers 15% 31% 8%
Washing machines 7% 17% 3%
Microwave ovens 1% 4% 0.4%
Mixer grinders 31% 58% 18%
Figure 11: End use distribution of energy in U.S.A.
1993 2009
18%
53%
24%
17%
41%
34%
4% 6%
Air conditioning Space Heating
Water HeatingAppliances, Electronics & Lighting

17
Census (2010):
Appliance All India Urban Rural
Electricity as a main source of Lighting 67% 93% 55%
Televisions 60% 28% 32%
Radios/Transistors 20% 25% 17%
NSSO Survey (2012):
Appliance All India Urban Rural
Electricity as a main source of Lighting 81% 96% 74%
Fans 67% 92% 57%
TVs 53% 77% 43%
Refrigerators 17% 41% 7%
Coolers (including air-conditioners) 11% 24% 6%
Radios/Transistors 19% 17% 19%
The households in the metros like Mumbai and Delhi own many more appliances (see Figure 12). Almost all the households own a television and ceiling fans. About 50-70% of households own a refrigerator and about 12% own air-conditioner.
Figure 12: Appliance ownership in metros
Source: (Desai & Vanneman, 2015)9
9. According to data, 76% of households in Mumbai seems to own an air-cooler. However, this is doubtful as air-coolers are based on evaporative cooling technology which cools air by spraying water over it. This is ineffective for a humid climate like Mumbai where the water vapour content of air is already high. The data needs to be verified.
A/C Cooler Fan Refrigerator TV
0%
50%
100%
2%
15%
72%
23%
60%
Bang
alor
e
Chen
nai
Del
hi
Hyd
erab
ad
Kolk
ata
Mum
bai
Bang
alor
e
Chen
nai
Del
hi
Hyd
erab
ad
Kolk
ata
Mum
bai
Bang
alor
e
Chen
nai
Del
hi
Hyd
erab
ad
Kolk
ata
Mum
bai
Bang
alor
e
Chen
nai
Del
hi
Hyd
erab
ad
Kolk
ata
Mum
bai
Bang
alor
e
Chen
nai
Del
hi
Hyd
erab
ad
Kolk
ata
Mum
bai
The horizontal line shows average all India appliance ownership.
App
lianc
e ow
ners
hip
100%
50%
0%

18
Source: (NSSO, 2014)
Ownership of appliances is not sufficient to estimate the electricity consumption of a household. It requires a knowledge of the number of appliances owned per household (e.g. three ceiling fans in a house), the size of the appliance (e.g. a one-ton AC or a 1.5-ton AC), and finally, the type of the appliances (e.g. a window AC or a split AC). There is no pan-India survey to estimate the type of appliances owned by Indian households. Also, there is no public data on aggregated annual production and sales which can help estimate the trends of type, size, and efficiency of appliances sold every year. A study (Boegle et al., 2010) estimated the number of appliances per household based on the data available from one round of NSSO (the 55th round of year 1999-2000). This data has been absent in the newer rounds. Most of the households owned only one appliance of each category except for fans (1.78), air-conditioners (1.2), and air-coolers (1.2). Another study (Chunekar, Kadav, Singh, & Sant, 2016) estimated the typical size and type of common appliances sold based on market research reports and interactions with experts. For instance, about 30% of the refrigerators sold in 2009 were Frost Free (FF) type refrigerators while the rest were the Direct Cool (DC) refrigerators. The most common size of the FF refrigerators was about 250 litres while that of the DC refrigerators was about 180 litres. More recently, BEE and EESL have commissioned load research studies for all the public DISCOMs in India (See Annexure 3). In one such study for BESCOM in Karnataka, it was found that households that own ceiling fans and air-conditioners have two of them per household. It was also found that about 70% of the households owning refrigerators have a refrigerator larger than 300 litres.
The ownership of appliances has increased significantly in the recent past both in urban and rural areas (See Figure 13). The growth has been particularly high in the last 10 years. This trend is expected to continue.
Figure 13: Trend in appliance ownership from different rounds of NSSO
0%
20%
40%
60%
80%
Ow
ners
hip
perc
enta
ge
Rural households Urban households
Cooler* Fan Refrigerator RefrigeratorTV Fan TVCooler*
1994 2000 2005 2012

19
4.4 How efficient are the appliances?
Energy efficient appliances consume less electricity than inefficient appliances of the same size and type. For instance, an energy efficient 1.5 ton split air-conditioner (AC) can consume 30-40% less electricity than an inefficient 1.5 ton split AC used for the same amount of time. The total residential energy consumption can significantly reduce if households own more energy efficient appliances. A number of studies have estimated overall savings of 15-25% from the use of efficient appliances (See Section 4.7)
Most of the appliances sold in the market today come under the standards and labelling (S&L) programme. The Bureau of Energy Efficiency (BEE) started this programme in 2006 to prescribe a minimum efficiency standard for the appliances to be sold in the market as well as to rate the appliances based on their efficiency. The least efficient appliance gets a 1-star label while the most efficient gets a 5-star label. The programme is mandatory for four appliances including frost free refrigerators and air-conditioners. In this case, the manufacturers cannot sell models which consume more electricity than the 1-star label rating for these appliances. Every two years or so, the efficiency levels for each rating are increased to keep in sync with technology advances. The approximate annual electricity consumption10 of a few appliances for different star labels is shown in Figure 14.
Figure 14: Annual electricity consumption of different appliances for 1 star and 5 star models
10. We have assumed typical usage hours as discussed in section 4.5 to calculate the annual electricity consumption.
Source: (BEE Appliance Schedules, 2016)
Air-conditioners are the biggest electricity guzzlers. They consume much more than all the other appliances combined. Air-conditioners with split variable speed compressors are the most efficient. In India, star labelling is mandatory for window and split ACs with fixed speed compressors. A 5-star rated split AC with a fixed speed compressor consumes about 20% less than the 1-star rated AC of same type. A 5-star rated AC with a variable speed compressor is 22% more efficient than a 5-star rated AC with fixed speed compressor of the same tonnage. However, there is a significant scope for improving the standards as much more efficient options are available commercially in India as well as abroad (Phadke, Abhyankar, & Shah, 2014). A 5-star rated 180 litre Direct Cool (DC) refrigerator consumes 30% more than a 5-star rated 250 litre Frost
0
1,000
2,000
3,000
Refr
iger
ator
(180
L DC)
Refr
iger
ator
(250
L FF)
Split
AC
(1.5
ton)
Win
dow
AC
(1.5
ton)
Unit
Ener
gy C
onsu
mptio
n (k
Wh)
Ceili
ng F
an
CRT
TV (3
2")
LCD
TV (3
2")
LED
TV (3
2")
Rating 1 star 5 star

20
Free (FF) refrigerator even though it is smaller in size and the DC technology consumes less electricity than the FF technology. This is because BEE’s ratings for FF refrigerators are much more stringent than the DC refrigerators. The efficiency levels for FF refrigerators’ labels also have a further scope for improvement as comparable European ratings are 40% better than the Indian ones.
The BEE also collects the production data of different star labelled appliances from different manufacturers.
This can be a good indicator of the weighted efficiency level of all the models sold in a particular appliance
category in a particular year. For instance, BEE’s data (BEE, 2010) shows that about 45% of the labelled frost
free refrigerators sold in 2010 had 5-star labels. As labelling is mandatory for frost free refrigerators, this
represents all the frost free refrigerators sold in India. In case of ceiling fans, the 5-star labelled models were
about 60% of the total labelled ceiling fans sold. However, the labelling is voluntary for ceiling fans and
accounts for only 10% of the total fans sold in India. Hence, 5 star labelled models accounted for only about
6% of the total ceiling fans sold in India in 2010. Insights such as these based on the aggregated production
data from BEE can have significant policy implications. This data is available on the BEE website only for
three years till 2009-10. It should be regularly updated and made public.
4.5 How are the appliances used?
So far we have looked at the appliances owned by the household and their size, type, and efficiency. The
total residential electricity consumption depends on how people use these appliances. There are two
aspects of appliance usage: the duration of use and the time of use in a day. The total duration of appliance
use helps us to estimate the total electricity consumed by the appliance. The time of use of appliances is
important for the DISCOMs to determine the load curve so that they can plan accordingly. For instance, if
all the air-conditioners are being used on a particularly hot summer afternoon, then the DISCOMs will have
to buy additional power to meet that demand at that particular time.
Households’ use of appliances depends on a number of factors such as income, climate, and typical
behavioural tendencies. We will discuss these factors briefly in the Section 4.6. There has been no pan-India
study to understand how people use appliances. A few load research studies have attempted to identify
the appliance usage pattern based on household surveys. In these surveys, people are asked to recollect the
time of usage of appliances on a typical day and for different seasons. The responses are then analysed to
estimate the total duration and the time of use of appliances. The fundamental issue with these surveys is
that people may find it difficult to recollect their usage patterns, particularly in different seasons. In some
studies, aggregate data of households on a predominantly residential feeder line is analysed to establish
the load curves. A combination of feeder line analysis and survey of households on that feeder is a better
approach but has not been used so far. Nonetheless, these studies give some indicative picture of the
appliance usage.
A study (Murthy, Sumithra & Reddy, 2001) conducted a survey of about 1000 households in Karnataka to
estimate usage patterns for different appliance including lighting. In order to overcome the constraint that
the respondents might not be able to recollect their usage patterns, they adopted the so-called appliance
census approach where regression analysis was used to determine the contribution of various categories
of appliances to the total electricity consumption of all the households in the survey. Another study (Garg,
Maheshwari, & Upadhyay, 2010) constructed load curves based on responses from 400 households in
Gujarat across different income groups (See Figure 15). The load curves for the high income groups show a
peak in the afternoon and night mainly due to the air-conditioner load. The morning peak in demand in the
winters is mainly due to heating water. A feeder level analysis (S. Gupta, Malhotra, Krithika, Bhattacharya,
& Ramanathan, 2012) in Tamil Nadu shows a similar trend where the load curves in Chennai have higher
peaks than the rest of Tamil Nadu (See Figure 16).

21
Figure 15: Load curves for households in Gujarat for summer and winter
Image source: (Garg et al., 2010)
Figure 16: Load curves from feeder level analysis in Tamil Nadu
Image source: (S. Gupta et al., 2012)
The Bureau of Energy Efficiency (BEE) and the Energy Efficiency Services Ltd. (EESL) commissioned about 30 load research studies for public DISCOMs all over India (See Annexure 3). In these reports, load analysis of all the consumer categories (including residential) has been conducted. The methodology includes both feeder level analysis and a small consumer survey. However, these two components seem to have been conducted independently without any reconciliation of the outcomes between them. A typical summer load curve constructed from consumer surveys for BESCOM, a DISCOM in Karnataka, is shown in Figure 17.
2 4 6 8 10 12 14 16 18 20 22 24 2 4 6 8 10 12 14 16 18 20 22 24
0.00
0.50
1.00
1.50
HourHour
High income Medium income Low income
Summer Winter
kW/ h
ouse
hold
1 2 3 4 5 6 7 8 9 10 11 12 13 14 15 16 17 18 19 20 21 22 23 24 1 2 3 4 5 6 7 8 9 10 11 12 13 14 15 16 17 18 19 20 21 22 23 24
100
90
80
70
60
50
40
30
20
10
0
100
90
80
70
60
50
40
30
20
10
0
Load (Scale =100) Load (Scale =100)
April 2010 May 2010 December 2010 January 2011 April 2010 May 2010 December 2010 January 2011
Hours Hours

22
The macro studies estimating the national level end-use distribution (discussed in Section 4.2) have assumed uniform usage hours for each appliance category based on local load research studies such as those described above. The implicit assumption is that the variations in the usage over the seasons and across the regions will cancel out towards a more conservative number. The studies provide an approximate estimate of the end-use and then use it as a baseline to show the potential of energy efficiency. Hence, the assumptions are mostly on the conservative side. A compilation of usage hours from different studies is shown in Figure 18. BEE used to make some assumptions for the usage hours for estimating the savings from the Standards and Labelling programme. The basis for those numbers is not provided but they seem to be on the higher side as compared to the other studies.
Figure 18: Compilation of appliance usage hours from different studies
Figure 17: A load curve from BESCOM
Sources: (Boegle et al., 2010), (Murthy et al., 2001), (TERI, 2008), (World Bank, 2008), (NITI Aayog, 2016)
1:00
AM
2:00
AM
3:00
AM
4:00
AM
5:00
AM
6:00
AM
7:00
AM
8:00
AM
9:00
AM
10:0
0 A
M
11:0
0 A
M
12:0
0 PM
1:00
PM
2:00
PM
3:00
PM
4:00
PM
5:00
PM
6:00
PM
7:00
PM
8:00
PM
9:00
PM
10:0
0 PM
11:0
0 PM
12:0
0 PM
1200000
1000000
800000
600000
400000
200000
0
Air conditioning
Incandescent bulb
Refrigerator
Ceiling fan
CFL
Others
Tube lights
Electric water heaters
0
1,000
2,000
3,000
Annu
al a
pplia
nce
usag
e ho
urs
Air C
onditio
ners
Ceili
ng F
ans
Tele
visio
ns
Tube
Lig
ht
Geys
ers
Inca
ndes
cent
Bulb
s
Air C
oole
r
BEE IESS (2012) Murthy (2001) Prayas (2008) TERI (2008) World Bank (2008)

23
4.6 What affects the electricity consumption?
Decisions of households to buy and use appliances depend on a number of factors. Understanding these factors is important to estimate the future demand as well as to design effective energy efficiency and conservation programmes. We briefly describe some of the factors here along with the limited literature on them in the Indian context.
4.6.1 Income, Tariff, and Electricity Supply
People tend to buy more appliances if they are in higher income brackets and also use them more. For instance, in urban Maharashtra, households from almost all the income groups own a TV and fan (see Figure 19). A significant number of middle income households, whereas the ownership of air-conditioners is still limited only to households with higher incomes.
Figure 19: Appliance ownership in different fractiles of expenditure in urban Maharashtra
Image source: (NSSO, 2014)
This relationship is also observed in a study of about 400 households by IIM Ahmedabad where ownership of appliances like air-conditioner and refrigerators is limited to the high income households (See Figure 20).
0 2 4 6 8 10 12 0 2 4 6 8 10 12
0%
20%
40%
60%
80%
100%
Rural households
Computer/LaptopCooler or A/C
FanRefrigerator
TVWashing M/C
FractileFractile
Urban households
Appl
ianc
e ow
ners
hip
%

24
Source: (Garg et al., 2010)
A few studies (de la Rue du Can et al., 2009; World Bank, 2008) have co-related the appliance ownership with the household expenditure (a proxy for the household income) and used econometric models to predict future ownership based on increase in income. A co-relation of the refrigerator ownership (see Figure 21) to the household expenditure for different NSSO rounds (See Box B: Census and Surveys) shows a classic S-curve where the appliance ownership increases exponentially with the increase in expenditure of households and then hits a plateau (World Bank, 2008). The ownership level corresponding to the plateau has risen over the years (in different rounds) indicating the market-wide adoption of the appliances.
Figure 21: Refrigerator and Air-cooler ownership co-related with household expenditure in India
Figure 20: Ownership of appliances according to income in Gujarat in 2010
Image source: (World Bank, 2008)
0%
50%
100%
24%29
%
16%
58%
22%
10%
48%
30%
20%
70%
32%
16%
46%
60%66
%
82%
92%
84%
100%
96%
88%
100%
94%
90%
100%
100%
98%
Appl
ianc
e ow
ners
hip
%
Low income
Computer Electric Geyser Air Conditioner CFl Fridge TV Ceiling Fan
IncandescentLamp
Tubelight(Electronic
Choke)
Medium income High income
Note: household expenditures are in 2004 rupees
100
80
60
40
20
0
100
80
60
40
20
0
1000
4000
7000
1000
0
1300
0
1600
0
1900
0
2200
0
2500
0
1000
3000
5000
7000
9000
1100
0
1300
0
1500
0
1700
0
1900
0
2100
0
2300
0
2500
0
Fridge Urban: Ownership AC, Air Cooler Urban: Ownership
61st ownership50th ownership
55th ownership61st ownership50th ownership
55th ownership

25
People also tend to use more electricity with income, provided they are paying for the electricity. A study (Filippini & Pachauri, 2004) of the electricity consumption data from the NSSO round of 1994 year confirmed that households with high income use more electricity probably due to both higher ownership and higher usage. They also found that the demand is income inelastic across seasons i.e. the change in electricity demand across the seasons does not depend on income. However, a study (Indraganti, 2011) on thermal adaptation habits of about 45 households in Hyderabad concluded that higher income people are less tolerant to increases in temperature. They tend to switch from ceiling fans to air-conditioners at much lower temperature as compared to households with lower income.
Different DISCOMs have different tariffs for residential consumers. The tariff also varies according to the total electricity consumption. Households with higher consumption pay more per additional unit of electricity they consume. A household consuming 50 units per month may pay anything between Rs. 133 in Andhra Pradesh to Rs. 300 in Maharashtra11 (See Figure 21). Similarly, a household consuming 200 units per month needs to shell out anything between Rs. 800-1500 per month. A study (Filippini & Pachauri, 2004) found that the tariff does not have any impact on the electricity demand. The study concluded that future increases in electricity are likely to lead to only a small drop in residential electricity demand. This needs to be explored further as it has significant implications for tariff policy design.
Figure 22: Monthly electricity bill for different states for different consumption levels
11. Online electricity bill calculator for all states by bijlibachao.com (http://tinyurl.com/hra49gx)
12. http://www.watchyourpower.org/
Finally, the rate of electrification and supply quality is also expected to impact the electricity consumption of a household. The Government of India has an ambitious target of electrifying every village by 2018. The total REC will increase as more households get electricity connections. However, the actual quantum of increase in REC will depend upon a number of factors, the most important being the reliability of electricity provided. This relation between supply quality and appliance usage has not been studied so far. There is limited data on the quality of electricity being supplied in India. One source is the Electricity Supply Monitoring Initiative (ESMI) by the Prayas, Energy Group. Supply quality data from about 200 locations across India is publicly available on the ESMI website.12 This data can be used to explore the impact of supply quality on the electricity usage patterns of households.
0
500
1,000
1,500
Andhra Pradesh Tamil Nadu Kerala Karnataka Gujarat West Bengal Punjab Delhi Maharashtra Uttar Pradesh
Mon
thly
bill
(₹)
50 kWh 200 kWh

26
4.6.2 Climate
India has five different climatic zones based on the average temperature and humidity levels (See Figure 23). Climate characteristics significantly impact the ownership and usage of appliance: people use more fans and air-conditioners in hot climates while they use more water heaters and other space heating appliances in colder climates. The relation between climate and the energy required by the consumers is often quantified by cooling and heating degree days. Cooling Degree Days (CDD) are a measure of how much (in degrees), and for how long (in days), the outside air temperature was above a certain level (reference temperature). CDD are the average number of days when cooling would be required. Heating Degree Days is the corresponding measure for average number of days when heating would be required. An important parameter in the calculations of CDD and HDD is the reference temperature: a personal comfortable temperature where neither cooling nor heating is required. In a tropical country like India, CDDs are significantly more than the HDDs (See Table 3). Higher CDDs generally mean more electricity consumption. However, it should also be noted that the number of CDDs change drastically based on the reference temperature considered.
Figure 23: India’s climatic zones
Image source: Press Information Bureau Article (http://tinyurl.com/gnq32qj)
Hot & Dry
Warm-Humid
Composite
Temperate
Cold
LEGENDS
Climate Zone Map Of India
Source: National Building Code 2005

27
Table 2: Climate Characteristics in India
Climate Characteristics
Hot & Dry Summer: 20-45°C; Winter: 0-25°C
Relative humidity: 55%
Warm-Humid Summer: 25-35°C; Winter: 20-30°C
Relative humidity: 70-90%
Composite Summer: 27-43°C; Winter: 4-25°C
Relative Humidity: 20-25% (dry)
55-95% (wet)
Temperate Summer: 17-34°C; Winter: 16-33°C
Relative humidity: <75%
Cold Summer: 17-30°C; Winter: -3 to 8°C
Relative Humidity: 70-80%
Source: (Bureau of Energy Efficiency (BEE), 2014)
Table 3: Heating Degree Days and Cooling Degree Days in different cities in India
City HDD @ 18°C CDD @ 18°C CDD @ 25°C
Ahmedabad 120 3441 1738
Pune 148 2485 758
Mumbai 0 3567 1374
New Delhi 456 2928 1314
Source: (Rawal & Shukla, 2014); http://www.degreedays.net/
Gupta (E. Gupta, 2014) studied the impact of climate on electricity demand and its relationship with income using the daily electricity consumption data from the national grid operator in India. She found that every 1° Celsius increase in temperature in the summer increases expected daily electricity demand by 1.5% due to increased use of air-coolers, air-conditioners, and fans. She also found that the marginal effect of hotter climate is greater when incomes are higher particularly in countries like India where the penetration of air-conditioners is low. This effect can be observed in a survey (Rawal & Shukla, 2014) conducted on about 800 apartments distributed across major cities in different climate zones. The annual consumption of apartments of different sizes for different cities is shown in Figure 24. Delhi and Mumbai with higher temperatures and higher incomes have higher annual consumption than other cities as well as the national average. Interestingly, apartments in Pune show higher consumption than those in Ahmedabad even though the CDDs in Pune are half as compared to those in Ahmedabad. This shows a complex income link to the climate-electricity demand relationship which needs to be explored further.

28
Image source: (Rawal & Shukla, 2014)
4.6.3 Buildings
Building design and the construction materials significantly impact the heating/cooling and the lighting requirement. When sunlight is incident on a building, or on a particular face, it gradually heats up thereby transferring heat inside and trapping it. This increases the need for comfort conditioning which in turn increases the energy consumption. The location and design of windows, doors and other such openings can increase or decrease the heat trapped inside the building. Even the colour of paint on the exterior walls contributes to the inside temperature. For instance, white coloured roofs can reduce the electricity consumption of a single storied building by as much as 20% (Akbari, Levinson, Konopaki, & Rainer, 2004; Akbari, Pomerantz, & Taha, 2001). Every building material has specific levels of heat transfer through conduction, convection and radiation quantified in terms of U-value (W/K.m3). The lower the U-value is, the better the material is as a heat insulator. Building designs that provide good ventilation and lighting and good quality construction material with low U-values can reduce the energy consumption significantly.
A simulation study (Bureau of Energy Efficiency (BEE), 2014) conducted by the BEE and the Swiss Agency for Development and Co-operation (SDC) shows that good design and construction material can reduce the electricity consumption of building. They compared three different packages of energy efficiency (EE) with incremental saving in electricity consumption (See Figure 25). EE Package 1 had better quality of brick blocks, optimised ventilation, overhangs on windows, and light colour paint on external walls which reduced the cooling requirement of the building by 23%. External Window shutters in EE Package 2 contribute to a further 23% reduction in the cooling requirement. Finally, use of cavity bricks with insulation and glazed windows in EE package three save an additional 10%. The study also shows that orienting the shortest façade of the building in the direction of the sun decreases the solar radiation by nearly 50% than the longest façade. Decreased exposure to solar radiations decreases heat gains through the façades, decreasing the internal temperature and omitting the need for space cooling, thereby saving electricity.
Figure 24: Annual consumption versus floor area for different cities.
0 - 50 51-100 101-150 151-200 201-250 > 250
0
2,000
4,000
6,000
8,000
Annu
al c
onsu
mpt
on (k
Wh)
Ahmedabad
Delhi
Mumbai
Pune
All India
Floor area in sq. m.

29
Figure 25: Energy saving potential of good building design and construction material
Source: (Bureau of Energy Efficiency (BEE), 2014)
A pan-India study (Rawal & Shukla, 2014) done by the CEPT University predicts that, from 2005 to 2040, there will be a 400% increase in India’s constructed floor space. Of the increased floor space, residential buildings will account for about 85% of floor space in 2050 the rest being commercial. Their modelling exercise predicts an eight times increase in REC by 2050 under the business-as-usual (BAU) scenario. A 5% penetration of efficient buildings can result in a 7% reduction of total REC while an extremely aggressive 30% penetration of efficient buildings can reduce total REC by 12% in 2050.
The Bureau of Energy Efficiency introduced the Energy Conservation Building Code (ECBC) in 2007. This code mandates the basic efficiency levels of buildings. Currently ECBC is applicable only to commercial buildings, while code for the residential sector is still under study. Presently, there are green building rating systems such as Green Rating for Integrated Habitat Assessment (GRIHA) and Small Versatile Affordable GRIHA (SVAGRIHA) developed by TERI. India Green Buildings Council has a Green Home programme used by major real estate developers.
4.6.4 Policies and Programmes
Targeted policies and programmes run by the government or by the DISCOMs can result in consumers
buying more energy efficient appliances and adopting conservation measures. Most of these policies and
programmes focus on improving technology (e.g. government sponsored R&D), reducing price (e.g. subsidies
for energy efficient products), or providing information (e.g. energy labels and promotion). Some of the
new programmes use behavioural interventions to nudge people towards positive actions (more in the next
section). Energy Efficiency programmes in India have mostly focused on price and information.
The Bureau of Energy Efficiency (BEE) has been conducting the Standards and Labelling (S&L) programme
since 2006. Least efficient appliances are given a 1-star rating while most efficient are given a 5-star rating
(See Section 4.4). The programme is mandatory for some appliances like air-conditioners and refrigerators
while voluntary for others. Along with setting high levels of efficiency for standards and labels and enforcing
a strict compliance, it is important to ensure that people know about labels and use the information while
buying appliances. The number of star-labelled appliances has been increasing over the last few years
0
20
40
60
80
100
100% -23%
-23%
-10%
Base case EE package 2 (EEPackage 1 + external
shutters)
EE package 3 (EEPackage 2 + insulatedwalls, better window
insulation)
EE package 1 (Betterbricks, better
ventilation, sideextensions)
Ener
gy u
sage
(%)

30
(BEE, 2010). However, there are very few studies on awareness and ownership of star-labelled appliances.
CUTS conducted a survey (Chatterjee & Singh, 2012) of about 20,000 households across India in 2011 and
found that only 19% of them were aware of BEE’s S&L programme. The awareness was high in urban areas.
The northern and western regions of India were found to be much less aware of the programme than the
southern and the eastern regions. On the contrary, a survey (Roy, Roy, Dasgupta, & Chakravarty, 2011) of a
small sample of about 400 persons in 150 households in 2011 in West Bengal (located in the eastern region
of India) found about 40% of the respondents were aware about BEE’s S&L programme. A recent survey
(Dhingra, Walia, & Mukherjee, 2016) of 5000 respondents across India (with more urban participants than
rural) found that about 63% of the respondents were aware of the star rating programme.
Being aware about the S&L programme is not sufficient. People should understand the information on
the energy label and use it correctly to buy energy efficient appliances. For instance, the energy-label for
a room air-conditioner (AC) compares ACs of different efficiency levels based on a technical term named
Energy Efficiency Ratio (EER). Do people make the calculations of converting the EER into monetary savings
before buying a new AC? Most of the 5000 respondents in the recent survey (Dhingra et al., 2016) said that
the information on the label was too technical and information on monetary savings would be very useful.
Another example is related to people’s perception of energy-labels. A number of studies have observed
that people tend to compromise and settle for a middle option when presented with extreme choices
(Simonson & Tversky, 1992). Do people exhibit this behaviour and settle for 2-3 star-rated appliances rather
than buying the least efficient 1-star or the most efficient 5-star? Research on people’s knowledge and
perception of the energy-labels can be very important in evaluating the impact of the S&L programme as
well as designing it better.
There have been a few price-reduction programmes at both the local and national level. MSEDCL (a local
DISCOM in Maharashtra) conducted a pilot programme in 2005 to replace 3 lakh incandescent bulbs with
Compact Fluorescent Lamps (CFLs). The CFLs were available by payments in monthly instalments through
electricity bills with the first instalment being equivalent to the price of a cheap but inefficient incandescent
bulb. The programme saw a mixed outcome. While it received a good response from consumers there
were some issues in the quality of CFLs and in the effectiveness of different processes of the programme.
A detailed evaluation of the programme is available here (Singh, Sant, & Kadam, 2007). BEE conducted
a price-reduction programme for Compact Fluorescent Lamps (CFLs) in 2009 called the Bachat Lamp
Yojana (BLY). Under the programme, the price of CFLs was brought down ten times to match the price of
incandescent bulbs. The price difference was to be recovered through the Clean Development Mechanism
(CDM). Around 400 million incandescent bulbs were expected to be replaced under the programme.
However, it found few investors as the global carbon market crashed and the actual impact was significantly less. The programme has never been systematically evaluated to gather lessons for future programmes. UJALA (Unnat Jyoti BY Affordable LEDs for All) is the latest price-reduction programme launched in 2014 for LED lamps conducted by a public sector company, Energy Efficiency Services Ltd. (EESL). Under the programme, EESL has been able to reduce the price to a quarter of its market-price by buying them in bulk directly from the manufactures. More than 10 crore LED bulbs have been sold13. A systematic evaluation of the programme would help in estimating its actual impacts as well as in better designing of future programmes. Some small pilot programmes have been conducted by local utilities from Delhi and Mumbai for appliances like air-conditioners and ceiling fans14. However there has been no systematic evaluation. Evaluation of existing policies and programmes can provide crucial lessons in scaling up efficiency and conservation efforts.
13. http://www.ujala.gov.in/
14. For example, see https://cp.tatapower.com/irj/servlet/prt/portal/prtroot/com.tp~dsm.splitac and http://www.relianceenergy.in/html/5Star-SplitAC/index.html

31
4.6.5 Human Behaviour
Human behaviour is a key factor that affects a household’s decisions on buying and using appliances. Income, climate, policies and other external factors can elicit different responses from different people. Traditional economic models consider humans as rational agents who maximise their utility while making decisions. However, research has shown that people tend to act seemingly irrational while making everyday decisions. They are emotional, they procrastinate, they lack self-control, they value today differently from tomorrow, and behave in many other ways which a perfectly rational agent will not. The social and cultural attitudes and values also play a crucial role in the decisions people make. Understanding these behavioural tendencies can be useful to predict future consumption as well as inform policy interventions to curb it.
Research on behaviour affecting household use of energy (including electricity) in India is limited. The available literature on this topic includes occasional studies from different fields like human-computer interaction (HCI), design, anthropology, behavioural economics, and architecture. A few studies are described here.
HCI studies have focused on studying people’s use of energy to help in designing various energy-conserving technologies. A study (Shrinivasan et al., 2013) was conducted on energy usage habits of 11 households in Bangalore and Hyderabad. They observed that tradition and culture have deeply ingrained the values of conservation in their participants. People are already aware of their consumption and hence don’t feel the need for various home energy monitors. On the contrary, a team of researchers (Jain, Chhabra, Mankoff, & Singh, 2014) surveyed about 1700 residents around Delhi and did not observe the deeply imbibed culture of conservation. People practice conservation because of learned habits and the desire to save money. Comfort and convenience were major barriers. The participants were interested in home energy monitors and also did not mind sharing their energy data with others.
An architectural study (Indraganti, 2011) surveyed 45 apartments in Hyderabad to study how people adapt to increased temperatures in the summer. The study found that people adapt themselves to the heat by doing simple things like moving to airy places and drinking water. People find themselves comfortable between 26 to 32o C. This is much higher than the comfort temperatures considered in Indian building codes (23 to 26o C). It was also found that people frequently exposed to air-conditioned environments had very less tolerance levels.
Research in behavioural economics focuses on using different behavioural tendencies effectively to nudge people toward positive actions. One such study (Sudarshan, 2014) of 500 households around Delhi found that comparing a household’s monthly electricity bill with that of the neighbour’s results in a reduction of 8% in its electricity consumption. However, the reduction becomes ineffective when the electricity prices are higher and when such comparisons are combined with financial incentives. This suggests that behavioural interventions may interact in complicated ways with incentives and market prices.
Another interesting study comes from the field of anthropology. Harold Wilhite (Wilhite, 2008) used an ethnographic approach to study how consumption of various goods (including households’ appliances) and services, has increased in south India. He described the interesting and complex interactions between consumerism and India’s cultural practices. For instance, how the refrigeration technology overcame the traditional food ideology of stored food being bad and how the adoption of kitchen appliances increased when families started getting smaller and women started taking up jobs.
More such studies which draw insights on the human aspect of energy consumption are required. Also, we need an interdisciplinary approach which brings these insights together and build an integrated model of household energy consumption with clear implications for policy making.

32
4.7 How much electricity will be consumed in the future?
A good estimate of our future electricity consumption is crucial to plan addition of generation capacity. This requires a better understanding of past trends and the factors affecting our consumption (See Section 4.6). Two methods are generally employed to estimate the future consumption. In a top-down approach, past macro data is used to find a co-relation between the energy (including electricity) consumption and the GDP growth. The co-relation is then used to estimate the future energy consumption for an expected or targeted GDP growth rate. In a bottom-up approach, individual end-use categories are considered and the energy (including electricity) consumed in each of the categories is estimated to add up to the total consumption. Future consumption is then estimated either by projecting current trends or by setting normative benchmarks, or more often a combination of both for individual end-use categories. The bottom-up approach requires more inputs such as ownership of appliances, efficiency levels, and usage patterns. It is preferred over the top-down approach as it can be used to get a better picture of energy required to meet a typical standard of living. A recent study (Dharmadhikary & Bhalerao, 2015) provides an excellent summary of various studies which estimate the future energy requirements of India. Here, we briefly describe the studies predicting the residential electricity demand.
The Central Electricity Authority (CEA) (See Box A) conducts an elaborate study called Electric Power Survey (EPS) every five years to predict future electricity requirements. It uses a mix of methodologies including trends analysis, end-use analysis, and econometric modelling to predict sector wise electricity consumption. Additionally, there have been a few bottom-up studies (See Section 4.2 for details) to estimate the current composition of the REC and its future trend. Most of the studies have been conducted with the objective of estimating the saving potential from energy efficient appliances. A World Bank study (World Bank, 2008) used the historical NSSO data (See Box B) as well as data from their own survey to establish the co-relation between income and appliance ownership, and also predict a typical usage pattern. LBNL (de la Rue du Can et al., 2009) used a similar methodology but came up with different estimates. A recent exercise by the NITI Aayog (former Planning Commission) (NITI Aayog, 2016) to build different possible energy scenarios till 2047 included a scenario on residential electricity consumption. Future consumption levels from most of the individual end-use categories were based on a mix of past trends and some normative benchmarks. The space-conditioning (air-conditioner and fans) and water heating end-uses were modelled on building types and climate.
The variation in the future projections of REC (See Figure 25) from different studies is expected due to variations in methodologies, assumptions, and base-years. Base case scenarios from all the studies are shown. Almost all the studies predict REC to be in the range of 400-500 TWh past 2020. This is more than twice the REC in 2014. Similarly, the REC past 2030 would be somewhere around 5-6 times that of 2014. All the studies estimate that the REC can be brought down by 20-25% by adopting efficiency measures. Although, the numbers are useful to get a broad picture of REC, they should be taken with a pinch of salt. As we have seen in the previous sections, there is paucity of data on REC and our understanding of the factors affecting REC is limited.

33
Figure 26: Projected trend in REC for India
Sources: Base case scenarios from (CEA, 2011; de la Rue du Can et al., 2009; NITI Aayog, 2016; World Bank, 2008)
2005 2010 2015 2020 2025 2030
0
200
400
600
800
1,000
18th EPS (2011) IESS (2013) LBNL (2009) World bank (2008)
REC
(TW
h)

34
5 What next?
We have highlighted the importance of the Residential Electricity Consumption (REC) in India’s energy
future and provided an overview of the current understanding on the topic in the Indian context. In this
section, we briefly discuss three broad sets of recommendations in the order of increasing efforts required
to implement them.
5.1 More data in public domain
Government agencies and distribution companies should publish collected data related to the REC. The
Bureau of Energy Efficiency (BEE) collects annual data from different manufacturers on the number of
appliances sold under different star rating categories. Aggregated data on the national level that excludes
the commercial information related to individual manufacturers can be made public. This data can be useful
in tracking the success of the Standards and Labelling (S&L) in increasing the market adoption of star-
rated appliances. BEE used to publish this data on its website till 2010 but has discontinued this practice.
Additionally, BEE can also collect annual sales data on the type and size of appliances being sold, like frost-
free refrigerators with sizes between 200 to 220 litres. The complete data set can be used to estimate the
weighted efficiency of all the appliances sold under a particular category in a year. Such data is available in
other countries and is regularly used to evaluate the improvement in efficiency of appliances (Top Runner Programme, 2015).
Distribution companies (DISCOMs) also collect data which can be useful for better understanding of the
REC. Historical data on electricity bills of its residential consumers (after removing private information) can
be made available to researchers and the general public. Analysis of this data can provide insights on how
consumption patterns have changed across the nation as well as in specific geographic regions (such as
urban and rural). DISCOMs can also make their feeder level or distribution transformer (DT) level data public.
Electricity is distributed from substations via feeder lines to DTs and from there to our homes. Most of the
DISCOMs have installed meters on feeder lines as well as the DTs to record the load at regular intervals in
a day. In some states, regulators required DISCOMs to share the feeder level data. However, in many cases,
the quality of such data is not good. Collecting reliable data and making it public along with the details of
the type of consumers on the feeder line can be useful in identifying typical aggregated load curves. In a
recent exercise, BEE and EESL commissioned load research surveys for all the public utilities in the country
to understand load patterns of all the consumer categories including residential (See Annexure 3). These
surveys are not in the public domain.
5.2 More research
Researchers (both academic and non-academic) should conduct more disciplinary as well as interdisciplinary
research on exploring different aspects of REC. The data sources analysed in this report and the literature
reviewed can be a starting point for future research. Researchers can also collect more information
regarding people’s electricity consumption through their own localised surveys.
We highlight two aspects related to research on the REC. First, behavioural tendencies of electricity use
have received scant attention in India. Policy and programmatic interventions based on human behaviour
are easy to implement, relatively low cost, and can be measured scientifically (See Section 4.6.5 and (Rathi
& Chunekar, 2015)) for more discussion on behavioural research in India). The second aspect is to develop
an integrated approach to model household consumption and come up with specific policy actions based

35
on the model. As we discussed in Section 4.6, a number of factors affect household consumption and their
individual impact can be studied through various disciplinary approaches. However, an integrated model
needs to be developed to study their combined impact and predict future consumption more reliably. This
requires an inter-disciplinary approach towards the REC which needs to be the focus of future research
(Wilson & Dowlatabadi, 2007).
One avenue to pursue research on the REC can be IMPRINT India, a Ministry of Human Resources
Development (MHRD) supported pan IIT and IISc joint initiative to address India’s major science and
engineering challenges in selected domains (including energy) needed by the country15. A longer-term
recommendation is to set up a national energy efficiency research centre for residential consumption.
This can be similar to the autonomous national research centres for solar energy16 and wind energy17 set
up under the Ministry of New and Renewable Energy (MNRE), Government of India. This centre can be
established in collaboration with academic institutes, manufacturing associations as well as the energy
service companies (ESCOs).
5.3 Residential Energy Consumption Survey
A final recommendation is to develop and periodically conduct a Residential Energy Consumption Survey
(RECS) in India. The RECS can include surveys of households, appliance manufacturers, and DISCOMs to
collect data on energy use patterns of households. This data can play a crucial role in estimating the future
energy demand and also in assessing the improvement in appliance efficiency over the years (See Box C).
RECS can be conducted as one of the several periodic rounds of surveys conducted by the National Sample
Survey Organisation (NSSO) to gather data in several socio-economic areas like employment, household
consumption, and health. An earlier report by Prayas (Dukkipati, Iyer, & Sreenivas, 2014) identified
important indicators of residential energy consumption on which data can be collected (See Figure 27). The
development of survey would require in-depth knowledge of the energy sector which NSSO may lack as it is
a statistics agency. Hence, it can collaborate with other ministries like the Ministry of Power (MoP) as well as
academic institutions and other research organisations to develop a robust methodology.
15. http://imprint-india.org/
16. National Institute of Solar Energy http://nise.res.in/
17. National Institute of Wind Energy http://niwe.res.in/

36
Source: (Dukkipati et al., 2014)
Figure 27: Household Energy Consumption Indicators
Energy Use in Household
Fuels purchased/collected – Quantity & Expense
Electricity access, Hours of supply, consumption
& expense
Human & animal power
Services
Type and number of stoves, Fuel source, Hours of use
Type and number of lamps, Hours of use
List of appliances
Grid/ off-grid/ gensets
Wattage, Energy Rating and Hours of use for each appliance, Use of
external facilities
List of vehicles owned
Size, Capacity and Distances travelled for each vehicle, Use of
public/hired/non-motorized transport
Fuels used for lighting
xxx Good coverage
xxx Mixed coverage
xxx No coverage
Cooking
Lighting
Heating, Cooling,
Appliances
Transport
Supply

37
6 Conclusion
Residential Electricity consumption (REC) constitutes a quarter of India’s total electricity consumption and is expected to grow significantly. Better understanding of REC is required for designing effective energy conservation and efficiency programmes, optimised planning of capacity addition, and better adaptation to changing technology and business models in Power sector. In this report, we have provided an overview of REC in India by analysing data from various sources like census, surveys, and DISCOM data and reviewing the available literature on the topic. We also gave three broad sets of recommendations for further research on REC in India. First, government agencies like the BEE, EESL, Regulators, and DISCOMs should make their REC related data public as much as possible. Second, researchers (both academic and non-academic) should use the existing data or build data from local surveys to conduct various disciplinary and inter-disciplinary studies on the REC. Finally, we recommend to conduct a periodic nation-wide residential energy consumption survey which gathers data on people’s energy (including electricity) usage patterns over the years.

38
References
Akbari, H., Levinson, R., Konopaki, S., & Rainer, L. (2004). Monitoring the Energy-Use Effects of Cool Roofs on California Commercial Buildings. Energy and Building, 37(10), 1007–1016.
Akbari, H., Pomerantz, M., & Taha, H. (2001). Cool surfaces and shade trees to reduce energy use and improve air quality in urban areas. Solar Energy, 70(3), 295–310.
Allcott, H., & Mullainathan, S. (2010). Behavior and energy policy. Science, 327(5970), 1204–1205.
BEE. (2010). Verified Energy Savings with the Activities of “Bureau of Energy Efficiency” For the year 2009-10.
BEE Appliance Schedules. (2016). Retrieved from https://beestarlabel.com/
Boegle, A., Singh, D., & Sant, G. (2010). Energy Saving Potential in Indian Households from Improved Appliance Efficiency. Pune: Prayas (Energy Group). Retrieved from http://prayaspune.org/peg/publications/item/82.html
BRPL. True-up Petition for FY 2010-11 and ARR for FY 2012-13 to FY 2014-15 (December 2011). Retrieved from http://www.derc.gov.in/
Bureau of Energy Efficiency (BEE). (2014). Design Guidelines for Energy-Efficient Multi-Storey Residential Buildings (Composite & Hot-Dry Climate). India: Bureau of Energy Efficiency. Retrieved from http://www.beepindia.org/resource/Residential-Guidelines
BYPL. True-up Petition for FY 2010-11 and ARR for FY 2012-13 to FY 2014-15 (December 2011). Retrieved from http://www.derc.gov.in/
CEA. (2001). General Review 2001. New Delhi: Central Electricity Authority (CEA).
CEA. (2011). 18th Electric Power Survey of India (Volume 1). Delhi: Central Electricity Authority.
CEA. (2012). General Review 2012. New Delhi: Central Electricity Authority (CEA).
CEA. (2014). General Review 2014. New Delhi: Central Electricity Authority (CEA).
Chatterjee, B., & Singh, S. (2012). Energy Efficient Products and Indian Consumers. CUTS. Retrieved from http://www.cuts-citee.org/pdf/energy_efficient_products_and_indian_consumers.pdf
Chunekar, A., Kadav, K., Singh, D., & Sant, G. (2016, April 26). Potential Savings from Selected Super-Efficient Electric Appliances in India. Retrieved from http://prayaspune.org/peg/publications/item/155-potential-savings-from-selected-super-efficient-electric-appliances-in-india.html
de la Rue du Can, S., McNeil, M., Zhou, N., Sathaye, J., & Letschert, V. (2009). Residential and transport energy use in India: Past trend and future outlook. Retrieved from https://ies.lbl.gov/sites/all/files/lbnl-1753e.pdf
Desai, S., & Vanneman, R. (2015). India Human Development Survey-2 (IHDS-2) (India Human Development Survey No. 2). New Delhi: Ann Arbor, MI: Inter-university Consortium for Political and Social Research [distributor]. Retrieved from http://ihds.info/IHDS-II
Dharmadhikary, S., & Bhalerao, R. (2015, May). How Much Energy Do We Need? Retrieved from http://www.prayaspune.org/peg/publications/item/298-how-much-energy-do-we-need-towards-end-use-based-estimation-for-decent-living.html
Dhingra, N., Walia, A., & Mukherjee, P. (2016). Measuring the Impact of India’s Standard and Labelling programme. Presented at the International Energy Policies & Programmes Evaluation Conference, Amsterdam. Retrieved from http://www.ieppec.org/wp-content/uploads/2016/05/Paper-Dhingra-1.pdf
Dubash, N., Khosla, R., Rao, N., & Sharma, R. (2015). Informing India’s Energy and Climate Debate: Policy Lessons from Modelling Studies. Centre for Policy Research, Climate Initiative. Retrieved from http://www.cprindia.org/research/reports/informing-india%E2%80%99s-energy-and-climate-debate-policy-lessons-modelling-studies
Dukkipati, S., Iyer, R., & Sreenivas, A. (2014). An Assessment of Energy Data Management in India. Prayas (Energy Group). Retrieved from http://prayaspune.org/peg/publications/item/280.html
EIA. (2014). Issues in International Energy Consumption Analysis: Electricity Usage in India’s Housing Sector. U.S. Energy Information Administration (EIA). Retrieved from https://www.eia.gov/analysis/studies/international/

39
consumption/pdf/issues_itl_energyconsumptionanalysis.pdf
Energy Information Administration (USA). (2016). Electricity Consumption of USA. Retrieved from http://www.eia.gov/electricity/data/browser/#/topic/5?agg=0,1&geo=vvvvvvvvvvvvo&endsec=vg&linechart=ELEC.SALES.US-ALL.A&columnchart=ELEC.SALES.US-ALL.A&map=ELEC.SALES.US-ALL.A&freq=A&ctype=linechart<ype=pin&maptype=0&rse=0&pin=
Eurostat. (2016). Europe Electricity Consumption [Data Browser]. Retrieved from http://ec.europa.eu/eurostat/tgm/table.do?tab=table&init=1&language=en&pcode=tsdpc310&plugin=1
Filippini, M., & Pachauri, S. (2004). Elasticities of electricity demand in urban Indian households. Energy Policy, 32(3), 429–436.
Garg, A., Maheshwari, J., & Upadhyay, J. (2010). Load Research for Residential and Commercial Establishments in Gujarat. Indian Institute of Management (IIM), Ahmedabad. Retrieved from https://beeindia.gov.in/sites/default/files/ctools/Load%20Research%20Report%20for%20Gujarat-1024.pdf
Gupta, E. (2014). The Impact of Development on the Climate Sensitivity of Electricity Demand in India. Retrieved from http://www.isid.ac.in/~epu/wp-content/uploads/2014/09/dp14-08.pdf
Gupta, S., Malhotra, R., Krithika, P., Bhattacharya, T., & Ramanathan, K. (2012). DSM Action Plan for Tamil Nadu. The Energy and Research Institute (TERI). Retrieved from https://bookstore.teri.res.in/docs/books/DSM%20action%20plan%20for%20Tamil%20Nadu.pdf
IEA. (2015). India Energy Outlook. International Energy Agency. Retrieved from http://www.worldenergyoutlook.org/media/weowebsite/2015/IndiaEnergyOutlook_WEO2015.pdf
Indraganti, M. (2011). Thermal comfort in apartments in India: Adaptive use of environmental controls and hindrances. Renewable Energy, 36(4), 1182–1189. http://doi.org/10.1016/j.renene.2010.10.002
Jain, M., Chhabra, D., Mankoff, J., & Singh, A. (2014). Energy Usage Attitudes of Urban India. In ICT4S. Retrieved from http://www.atlantis-press.com/php/download_paper.php?id=13443
Korea Energy Statistics Information System. (2016). Electricity Consumption in South Korea [Data Browser]. Retrieved from http://www.kesis.net/flexapp/KesisFlexApp.jsp?menuId=Q0109&reportId=&chk=Y
McCalley, L. T. (2006). From motivation and cognition theories to everyday applications and back again: the case of product-integrated information and feedback. Energy Policy, 34(2), 129–137.
MOSPI. (2015). Energy Statistics 2015 (Vol. 22). New Delhi: Central Statistics Office, MOSPI.
MPPKVVCL. Tariff Petition (2013). Retrieved from http://www.mperc.nic.in/tariff-petition-page-old.htm
MPPuKVVCL. Tariff Petition (2013). Retrieved from http://www.mperc.nic.in/tariff-petition-page-old.htm
Murthy, K., Sumithra, G., & Reddy, A. (2001). End-uses of electricity in households of Karnataka state, India. Energy for Sustainable Development, V(3). Retrieved from http://repository.ias.ac.in/34363/1/34363.pdf
National Bureau of Statistics of China (NBSC). (2016). Electricity Consumption of China [Data Browser]. Retrieved from http://data.stats.gov.cn/english/easyquery.htm?cn=C01
NITI Aayog. (2016, January 22). India Energy Security Scenarios, 2047 User Guide: Residential Lighting and Appliances. Retrieved from http://indiaenergy.gov.in/docs/Residential-Lighting_Appliances-documentation.pdf
NSSO. (2014). Household Consumption of Various Goods and Services in India 2011-2012 (NSS 68th Round). National Sample Survey Office, Government of India. Retrieved from http://mospi.nic.in/Mospi_New/upload/Report_no558_rou68_30june14.pdf
PEG. (2015). Data Gaps in India’s Energy Sector. Prayas (Energy Group). Retrieved from http://prayaspune.org/peg/publications/item/313-data-gaps-in-india-s-energy-sector.html
Phadke, A., Abhyankar, N., & Shah, N. (2014). Avoiding 100 new power plants by increasing efficiency of room air conditioners in India: opportunities and challenges. Retrieved from https://escholarship.org/uc/item/5h9593bc.pdf
Rathi, S. S., & Chunekar, A. (2015). Not to buy or can be “nudged” to buy? Exploring behavioural interventions for energy policy in India. Energy Research & Social Science, 7, 78–83. http://doi.org/10.1016/j.erss.2015.03.006

40
Rawal, R., & Shukla, Y. (2014). Residential Buildings in India: Energy Use, Projections & Savings Potential (Technical Report) (p. 50). Ahmedabad: CEPT University. Retrieved from http://www.gbpn.org/sites/default/files/08.%20INDIA%20Baseline_TR_low_0.pdf
Roy, J., Roy, B., Dasgupta, S., & Chakravarty, D. (2011). Use of Electrical Appliances in Domestic Sector in West Bengal: A Baseline Study (p. Kolkata). Kolkata: Jadavpur University. Retrieved from http://eco3.org/wp-content/plugins/downloads-manager/upload/Report-1038-Bussiness%20Model%20for%20REEC.pdf
Shrinivasan, Y. B., Jain, M., Seetharam, D. P., Choudhary, A., Huang, E. M., Dillahunt, T., & Mankoff, J. (2013). Deep conservation in urban India and its implications for the design of conservation technologies. In Proceedings of the SIGCHI Conference on Human Factors in Computing Systems (pp. 1969–1978). Paris: ACM. Retrieved from http://dl.acm.org/citation.cfm?id=2466261
Simonson, I., & Tversky, A. (1992). Choice in Context: Trade-off Contrast and Extremeness Aversion. Journal of Marketing Research, 29(3), 281–295.
Singh, D., Sant, G., & Kadam, R. (2007). Review of Nashik Pilot CFL DSM program of MSEDCL. Prayas, Energy Group.
Sudarshan, A. (2014). Nudges in the marketplace: Using peer comparisons and incentives to reduce household electricity consumption. Harvard Kennedy School. Retrieved from http://www.anantsudarshan.com/uploads/1/0/2/6/10267789/nudges_sudarshan_2013.pdf
TANGEDCO. Tariff Petition (2012).
TERI. (2008). Interim Report on Energy End Use Study for Residential Electrical Equipments.pdf. The Energy and Research Institute (TERI). Retrieved from https://beeindia.gov.in/sites/default/files/Interim%20Report%20on%20Energy%20End%20Use%20Study%20for%20Residential%20Electrical%20Equipments.pdf
Top Runner Program. (2015). (Top Runner Program) (p. 96). Japan. Retrieved from http://www.enecho.meti.go.jp/category/saving_and_new/saving/data/toprunner2015e.pdf
TPDDL. True-up Petition for FY 2010-11 and ARR for FY 2012-13 to FY 2014-15 (2012). Retrieved from http://www.derc.gov.in/
Wilhite, H. (2008). Consumption and the Transformation of Everyday Life: A View from South India. Palgrave MacMillan.
Wilson, C., & Dowlatabadi, H. (2007). Models of Decision Making and Residential Energy Use. Annual Review of Environment and Resources, 32(1), 169–203. http://doi.org/10.1146/annurev.energy.32.053006.141137
World Bank. (2008). Residential Consumption of Electricity in India, Documentation of Data and Methodology. World Bank. Retrieved from http://www.moef.nic.in/downloads/public-information/Residentialpowerconsumption.pdf
World Bank. (2016). Population data (1960-2015) [Data Browser]. Retrieved from http://data.worldbank.org/indicator/SP.POP.TOTL

41
Annexure 1 : Data Sources
• All India Electricity Statistics General Review:
The Central Electricity Authority (CEA) publishes a General Review every year under the guidelines of the Electricity Act, 2003. It contains extensive data about the electricity sector for the previous year. The data is collected directly from utilities/non-utilities of the electricity sector, regulatory commissions, the erstwhile Planning Commission, Ministry of New and Renewable Energy Sources, and other sources. Figures related to generation, transmission, distribution, trading and consumption of electricity by different sectors in India are present. In our study, we have mainly used data about consumption, specifically in the residential sector. State-wise data is used to track the growth of the electricity sector in different states. Data regarding growth of sectors, installed capacity, electrification of states, number of consumers, connected load, power trading and transmission and distribution losses can also be found in other sections. The state-wise consumption details can be found under the section ‘Electricity Utilization’. The General review is not available online. A hard bound book has to be purchased from the CEA.
• 18th Electrical Power Survey (EPS):
‘Report on the Electrical Power Survey of India’ is a publication by the CEA that forecasts the electricity demand for India. The 18th EPS reviews national and state-wise summaries of previous five year plans and explains the methodology used for short, medium and long-term term forecasts for different sectors and states. The forecasts are used as guidelines by many utilities to plan their capacity addition and generation in advance. This report is very instrumental in envisaging the future of the electric sector of India.
In our report, we have compared the prediction of EPS with various other studies regarding electricity consumption forecasts. EPS is available only as a hard bound document and has to be purchased from the CEA’s website. It is accessible under their publications section.
• National Sample Survey Reports:
The National Sample Survey Organisation (NSSO) is an organisation under the Ministry of Statistics & Programme Implementation (MOSPI), Government of India. Established in 1950, it is the largest organisation in India conducting regular socio-economic surveys. The surveys are carried out in rounds and each round has different subjects including education, health, household assets, hygiene, employment etc. For our report, we have referred to the 68th round of NSSO, which gives information on ‘Household consumption of various goods and services in India’. It gives data on the ownership of appliances (fan, TV, refrigerator, cooler) and also the monthly per-capita expenditure (MPCE) on them in the rural as well as urban population. This report also presents data on ownership of appliances for different income fractiles for different states which is used in our report.
The NSSO Survey data and reports are available online and have to be purchased from the Ministry of Statistics and Programme Implementation (MOSPI) website.
• Power Finance Corporation Data:
The Power Finance Corporation Ltd. (PFC), an Indian financial institution, was established in 1986. It is the financial backbone of the Indian power sector. PFC provides financial assistance to power projects across India. PFC publishes a report on ‘The performance of State Utilities’ triennially which contains data from utilities of different states for the past three years. It presents the performance of utilities from a financial as well as physical point of view. Category-wise sales data of state utilities is also available in this report. This report is available in pdf format for download on PFC’s website.

42
• Planning Commission Data:
The Planning Commission (PC) of India was set up in March 1950 by a government resolution. The planning commission was primarily responsible for formulating the five year plans among other functions. Other functions included making assessments of all the resources in the country, augmenting deficient resources, formulating plans for the most effective and balanced utilisation of resources and determining priorities. The Planning Commission used to publish a report on ‘The working of State Electricity Boards & Electricity Department’ which contains the category-wise electricity sales report for each state utility. We have used the data from this report to compare with other sources. In 2015, the Planning Commission was replaced by the National Institution for Transforming India (NITI) Aayog.
• India Human Development Survey Data:
The India Human Development Survey (IHDS) has been jointly conducted by researchers from the University of Maryland and the National Council of Applied Economic Research (NCAER), New Delhi. IHDS is a national representative, multi-topic survey of 41,554 households in 1503 villages and 971 urban neighbourhoods across India. The first rounds of interviews were completed in 2004-05. During a second round of IHDS, most of these households were re-interviewed in 2011-12 (N=42,152). Data for both the studies are publicly available on the IHDS website. For our study, we have used data on the ownership of over 8 appliances. The data set of IHDS is vast and provides extensive information on state-wise appliance ownership as well as that for metro cities in the latest round. The data of both the IHDS studies are available online in SAS, SPSS, Stata and Excel format and is easily downloadable via a login.
• Census of India:
The census of India is the largest source of information on different aspects of India. Started around 130 years ago, a variety of data is presented through the census that is conducted every 10 years. It is one of the important tools to understand and study India. The latest census (2011) contains data on many subjects like demography, economics, anthropology, sociology, statistics and many other disciplines. For our study, we have used census data on households owning assets and amenities, provided for all-India, state-wise, district and village/ward level. The data answers questions about the source of lighting, fuel used for cooking and appliance ownership for households (radio, television, computer/laptop & telephone/mobile only).
Presently all the data is available in a downloadable excel format on the website www.censusindia.gov.in . Previous census data i.e. 2001 data is also available at the website under the archives section.
• BEE Schedules:
The Bureau of Energy Efficiency (BEE) is an agency under the Ministry of Power of the Government of India, created in the year 2002. One of the functions of BEE is to promote and develop programmes that aid in conservation and efficient use of energy. The BEE has launched a Standards & Labelling programme (BEE Star Label) that regulates the efficiency levels of appliances. The Indian standards for appliances are rated from 1 star (least efficient) to 5 star (most efficient). The efficiency corresponding to the star ratings of each appliance is determined by BEE and the minimum energy efficiency requirements are specified by the Bureau of Indian Standards. Of a total of 21 appliances, only four appliances are in the mandatory phase. The rest are in the voluntary phase, which means that the standards are not mandatory but recommended.
From the schedules, for a particular specification, the power rating and annual energy consumption of an appliance can be calculated for different star ratings. The schedules of appliances both mandatory and voluntary are available on BEE’s website.

43
• Tariff Orders:
Tariff schedules give us the different tariff slabs and the price for various types of connections including domestic, commercial, agriculture, and Industrial. Every state/utility has its own distribution/breakup of tariffs according to consumption in units (kWh). The price is mentioned in Rupees or Paise per kWh of electricity use. The tariff slabs are progressive, which means that as the consumption increases, the unit price also increases. The respective prices of the tariff slabs are determined by the tariff order given by the state regulatory commissions. From the tariff schedules, we estimated the charges for particular electricity consumption in different states.
The data for tariff schedules are available on the individual state utility websites or on the state regulatory commission’s website.

44
Annexure 2: Census and Survey Questionnaires
Census Questions:
1. What is your main source of Lighting?
a. Electricity
b. Kerosene
c. Solar energy
d. Other Oil
e. Any Other
f. No Lighting
2. What type of fuel do you use while cooking?
a. Fire-wood
b. Crop residue
c. Cow dung cake
d. Coal
e. Kerosene
f. LPG/CNG
g. Electricity
h. Biogas
i. Any other
j. No cooking
3. What assets do you own?
a. Radio/Transistor
b. Television
c. Computer/Laptop
d. Telephone/Mobile
India Human Development Survey (IHDS) Questionnaire:
1. How much in Rupees did you spend in the past 365 days on the following:
a. Electric Fan
b. AC
c. Sewing machine
d. Washing Machine
e. Pressure Cooker
f. Refrigerator
g. TV
h. Radio

45
i. Tape recorder
j. Musical Instruments
2. What appliances does your Household own?
a. Generator Set
b. Mixer/Grinder
c. B/W TV
d. Colour TV
e. Cooler
f. Electric Fan
g. Mobile Phone
h. Fridge
i. Cable/Dish TV
j. Air Conditioner
k. Washing machine
l. Computer
m. Laptop
n. Microwave Oven
3. Does the household have electricity? If yes, how many hours per day do you generally have power?
4. How do you pay for the electricity you use?
a. No bill/Government scheme
b. Electricity bill from state electricity board/company
c. Fee to neighbours
d. Part of rent
e. Own generators
f. Paid by employer/Office
g. Illegal Connection
h. Other means
5. How much do you typically pay for electricity in a 30-day period?
6. What do you use as main source of fuel/energy?
a. Electricity
b. Coal
c. Kerosene
d. Oil
e. Others

46
National Sample Survey Office (NSSO) Questions:
1. What is the primary source of energy for lighting?
a. Kerosene
b. Other oil
c. Gas
d. Candle
e. Electricity
f. Others
g. No lighting arrangement
2. What is the expenditure on the purchase (including repair and maintenance) of durable goods?
3. If it is purchased first hand or second hand or on EMI and the quantity of that appliance purchased for:
a. Radio, tape, 2 in 1
b. Television
c. VCR/ any CD player
d. Camera/Photographic instrument
e. Other good for recreation
f. Air conditioner/Air cooler
g. Inverter
h. Lantern/Lamp/Electric lampshade
i. Sewing machine
j. Washing machine
k. Stove/Gas burner
l. Pressure Cooker
m. Water purifier
n. Refrigerator
o. Electric iron, heater, toaster and other heating appliances
p. Other cooking or Household appliances
q. PC/Laptop/Others
r. Mobile
s. Telephone instrument
t. Other personal goods

47
Annexure 3 : Load Research Studies
The Bureau of Energy Efficiency (BEE) and the Energy Efficiency Services Ltd. (EESL) commissioned about 30 load research studies for public DISCOMs all over India. The objective of the studies was to build capacity among the DISCOMs to develop and implement Demand Side Management (DSM) programmes. Most of these studies have been completed. However, none of the reports are in public domain. We got a couple of the reports from respective DISCOMs through the Right to Information (RTI) act.
The methodology adopted by these studies is as follows. A feeder level analysis is conducted to determine aggregated load profiles for different consuming categories (including residential). Feeders predominantly serving a particular type of category are selected for this analysis. Reference load curves are derived based on the data from these feeders which are then used to derive aggregate sector curves. For instance, Figures A1 and Figure A2 show typical load curves in the residential sector for summer and winter for BESCOM, a DISCOM in Karnataka.
Figure A1: Load profile for summer
Figure A2: Load profile for winter
1:00
AM
2:00
AM
3:00
AM
4:00
AM
5:00
AM
6:00
AM
7:00
AM
8:00
AM
9:00
AM
10:0
0 A
M11
:00
AM
12:0
0 PM
1:00
PM
2:00
PM
3:00
PM
4:00
PM
5:00
PM
6:00
PM
7:00
PM
8:00
PM
9:00
PM
10:0
0 PM
11:0
0 PM
12:0
0 PM
0
0.05
0.1
0.15
0.2
0.25
KW of operating load per KW of sanctioned load
0.020
0.040.060.08
0.10.120.140.160.18
KW of operating load per KW of sanctioned load
1:00
AM
2:00
AM
3:00
AM
4:00
AM
5:00
AM
6:00
AM
7:00
AM
8:00
AM
9:00
AM
10:0
0 A
M
11:0
0 A
M
12:0
0 PM
1:00
PM
2:00
PM
3:00
PM
4:00
PM
5:00
PM
6:00
PM
7:00
PM
8:00
PM
9:00
PM
10:0
0 PM
11:0
0 PM
12:0
0 PM

48
The second component involves a market survey of consumers to determine various aspects of the electricity usage such as number of appliances, size, type, efficiency levels, and usage hours. A small sample of consumers is selected for different consumer categories and a survey is conducted. For instance, Figure A3 shows the ownership of appliances among 1000 households surveyed in the area covered by BESCOM.
Figure A3: Appliance ownership
The respondents are also asked to report their approximate usage time for different appliances and an approximate aggregate load curve is constructed. Figure A4 and A5 show such load curves for summer and winter respectively. However, the studies do not reconcile the feeder level analysis with the end-user estimated load curves.
Figure A4: End use load profile for summer
12.67%94%
1.73%0.48%0.58%
62.38%7.58%
0.96%4.32%
41.46%60.75%
0.48%12.09%
6.81%6.14%
16.31%12.38%
37.33%10.46%
Table fanCeiling fan
Air conditioner splitAir conditioner window mounted
Air coolerTube lights T12
T8 Tube lightT5 Tube light
LED Tube lightIncandescent bulb
CFLLED bulb
Electric geyserCoil / Rod type heaters
Solar water heaterWashing machine (Semi Automatic)Washing machine (Fully Automatic)
Refrigerator (< 300L)Refrigerator (>300L)
Appliance ownership (% of population)1:
00 A
M2:
00 A
M3:
00 A
M4:
00 A
M5:
00 A
M6:
00 A
M7:
00 A
M8:
00 A
M9:
00 A
M10
:00
AM
11:0
0 A
M12
:00
PM1:
00 P
M2:
00 P
M3:
00 P
M4:
00 P
M5:
00 P
M6:
00 P
M7:
00 P
M8:
00 P
M9:
00 P
M10
:00
PM11
:00
PM12
:00
PM
1200000
1000000
800000
600000
400000
200000
0
Air conditioningIncandescent bulbRefrigerator
Ceiling fanCFLOthers
Tube lightsElectric water heaters

49
Figure A5: End use load profile for winter
Finally, the consumer load curves and the data on appliance ownership are used to suggest different DSM programmes that can reduce or shift demand.
1:00
AM
2:00
AM
3:00
AM
4:00
AM
5:00
AM
6:00
AM
7:00
AM
8:00
AM
9:00
AM
10:0
0 A
M11
:00
AM
12:0
0 PM
1:00
PM
2:00
PM
3:00
PM
4:00
PM
5:00
PM
6:00
PM
7:00
PM
8:00
PM
9:00
PM
10:0
0 PM
11:0
0 PM
12:0
0 PM
0
200000
400000
600000
800000
1000000
1200000
1400000
1600000
Ceiling fan Tube lights Incandescent bulbCFL Electric water heaters RefrigeratorOthers

Related publications of Prayas (Energy Group)
1. How Much Energy Do We Need: Towards End-Use Based Estimation For Decent Living (2015) http://www.prayaspune.org/peg/publications/item/298
2. Data Gaps in India’s Energy Sector (2015) http://www.prayaspune.org/peg/publications/item/313
3. An Assessment of Energy Data Management in India (2014) http://www.prayaspune.org/peg/publications/item/280
4. Demand Side Management in India: An Overview of State Level Initiatives (2014) http://www.prayaspune.org/peg/publications/item/281
5. SEEP Guidebook (2013) http://www.prayaspune.org/peg/publications/item/241
6. To Buy or Not to Buy or Can be ‘Nudged’ to Buy (2012 ) http://www.prayaspune.org/peg/publications/item/180
7. Appliance Ownership in India: Evidence from NSSO Household Expenditure Surveys 2004-05 and 2009-10 (2012)
http://www.prayaspune.org/peg/publications/item/183
8. Improving Energy Efficiency In India: Need For A Targeted And Tailored Strategy (2012) http://www.prayaspune.org/peg/publications/item/268
9. Using national energy efficiency programs with upstream incentives to accelerate market transformation for super-efficient appliances in India (2011)
http://www.prayaspune.org/peg/publications/item/158
10. Ceiling Fans: The Overlooked Appliance (2010) http://www.prayaspune.org/peg/publications/item/81

The residential electricity
consumption (REC) has increased
by 50 times since 1971 and now
forms about a quarter of India’s
total electricity consumption,
up from about 4% in 1971. It is
expected to grow further due to
rapid electrification, increasing
household incomes, and
technology development. A better
understanding of REC patterns and
the factors affecting it is essential
for designing effective and credible
energy efficiency programs,
optimized planning of capacity
addition, and better adapting to
the rapidly changing business
models and technologies in the
Power sector. In this report, we
provide an overview of the current
understanding of REC in India
by analysing data from various
sources like census, surveys, and
distribution companies (DISCOM)
data and reviewing the available
literature on the topic.
Copyright © 2022 FDOKUMEN