Underpricing as compensation for the uncertainty ... - CORE
46
Underpricing as compensation for the uncertainty surrounding the IPO share value By Luís Flávio Costa Rodrigues Master in Finance Dissertation Supervised by: Miguel Augusto Gomes Sousa, Ph.D. Paulo Jorge Marques de Oliveira Ribeiro Pereira, Ph.D. 2016 brought to you by CORE View metadata, citation and similar papers at core.ac.uk provided by Open Repository of the University of Porto
-
Upload
khangminh22 -
Category
Documents
-
view
4 -
download
0
Transcript of Underpricing as compensation for the uncertainty ... - CORE
Underpricing as compensation for the
uncertainty surrounding the IPO share value
By
Luís Flávio Costa Rodrigues
Master in Finance Dissertation
Supervised by:
Miguel Augusto Gomes Sousa, Ph.D.
Paulo Jorge Marques de Oliveira Ribeiro Pereira, Ph.D.
2016
brought to you by COREView metadata, citation and similar papers at core.ac.uk
provided by Open Repository of the University of Porto
ii
About the author
Luís Flávio Costa Rodrigues was born in Monção, Portugal, on March the 5th of 1991.
He graduated in Management in 2013, from the School of Economics and Management
from the University of Porto.
In 2014 he started a Master in Finance degree, in the same school and finished the
curricular part of his Master in January of 2016, whose dissertation is now upon proposal.

iii
Acknowledgments
I would like to extend my sincere gratitude to all the people who helped and gave me
support, throughout my entire study. Without them, my dissertation would not be
possible.
First, I would like to thank my dissertation supervisors. Professor Miguel Sousa and
Professor Paulo Pereira that with their guidance, knowledge and support were essential
to the development of my study.
I must also express my gratitude to Professor Natércia Fortuna for her suggestions and
to Professor Nelson Areal, from the University of Minho, who helped me during the
methodological part.
Finally, I would like to thank to my family and friends for understanding all the time
I could not spend with them during the last year, and for their support. Two special thanks
are yet important to mention: to my friend Nuno as without his help this dissertation
would have been possible, and to my girlfriend Susana, for her never-ending support and
motivation.
iv
Abstract
Along the years, several authors have been trying to understand the IPO underpricing
puzzle. This study tests the relation between uncertainty and underpricing.
This study try to understand whether the uncertainty is a possible justification for
underpricing, using volatility of the shares’ price in the first trading day after the IPO as
a proxy for uncertainty.
Information about the intraday trading prices from the first day of trading after the IPO
was collected for a sample of 614 IPOs, registered in the New York Stock Exchange
(NYSE) occurred between 1st of January of 2000 and 31st of December of 2013 with gross
proceed higher than 100 million dollars.
The results confirm that the average initial return is positive (11.4%) and supports the
prediction of a positive relation between uncertainty and underpricing.
Key-words: Initial public offering; Underpricing; Ex ante uncertainty; Daily
volatility
JEL-Codes: G11; G15; G24.
v
Contents
1. Introduction ............................................................................................................... 1
2. Literature Review ...................................................................................................... 3
2.1 The IPO underpricing ......................................................................................... 3
2.2 IPO underpricing: asymmetric information ....................................................... 4
2.2.1 The winner’s curse ...................................................................................... 4
2.2.2 Information revelation theory ..................................................................... 7
2.2.3 Principal – agents models ........................................................................... 8
2.2.4 Underpricing as a signal of company quality ............................................. 9
3. Data .......................................................................................................................... 10
3.1 Sample creation and data sources .................................................................... 10
3.2 Intraday data scrubbing .................................................................................... 11
3.3 Variables’ description ...................................................................................... 11
3.4 Descriptive Statistics ........................................................................................ 13
4. Methodology ............................................................................................................ 15
5. Results ..................................................................................................................... 16
6. Conclusions ............................................................................................................. 18
7. References ............................................................................................................... 19
Appendix ......................................................................................................................... 22

vi
List of Tables
Table 1 Descriptive Statistics. Source: author’s calculation ........................................... 13
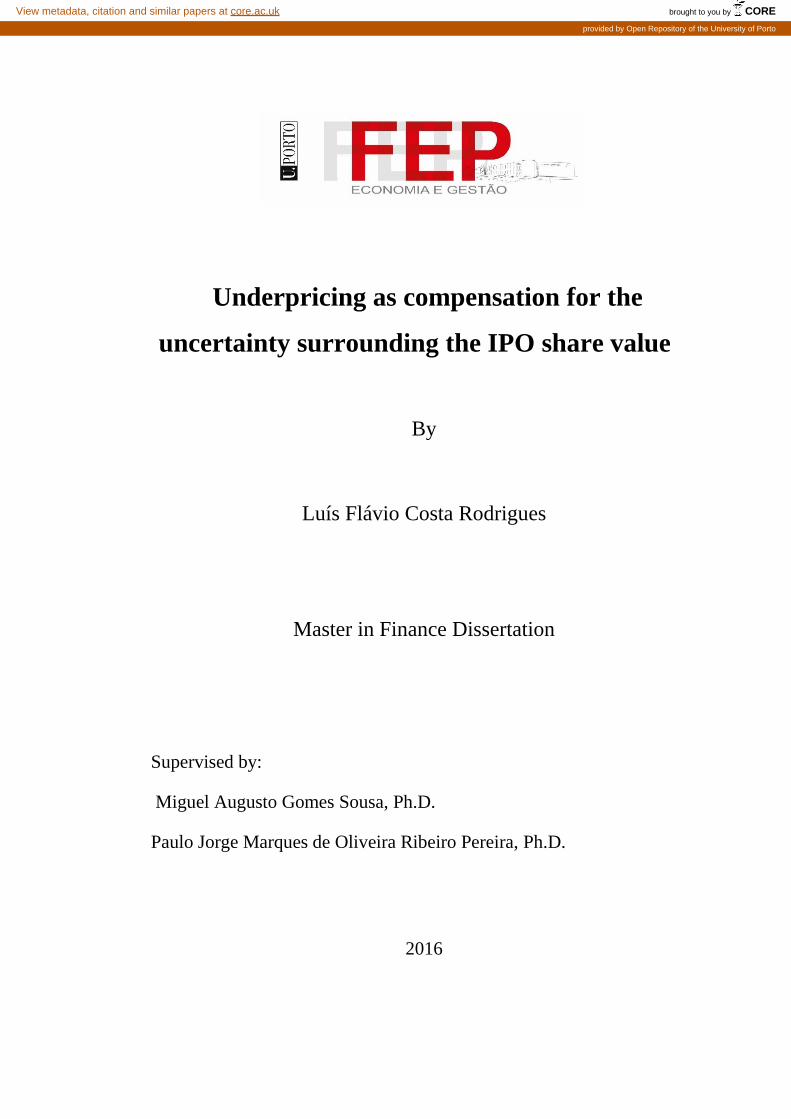
Table 2 – Regressions for a Sample of 614 NYSE IPOs from the Period 2000 – 2013.
Source: author’s calculation ........................................................................................... 16
1
1. Introduction
In the past few decades Initial Public Offerings (IPOs) has been study in every shape
and size, addressing several problems and studying several possible justifications for it,
not only in a daily basis in a professional environment but specially in the academic
research environment. Among all these problems, consistently positive initial returns in
the first day of trading, when compared to the offer price, i.e., underpricing, is the most
studied problem regarding IPOs, however this puzzle is still a big mystery. One of the
possible justifications to underpricing is the ex-ante uncertainty (Ritter, 1984)(Beatty and
Ritter, 1986), i.e., the uncertainty around the future price of the shares about to be issued,
or in other words, how hard it is to value the company.
As ex-ante uncertainty cannot be measured directly, it is necessary to find a proxy for
it in order to test their relation. This study uses as proxy the standard deviation of the first
day of trading after the IPO of the issued share. Similar choices were done in previous
studies, but using the standard deviation of the first twenty days of trading (Ritter, 1984),
first four days after the first day of trading (Miller & Reilly, 1987), fifty ninth days after
the first day of trading (Clarkson, 1994) and first 100 days of trading (Yu & Tse, 2006).
Other proxies were also uses, and some proved to be relevant, such as, the sales from the
twelve months prior to the issue (Ritter, 1984), the inverse of the gross proceeds obtained
in the issue ((Beatty & Ritter, 1986)(Miller & Reilly, 1987)), the age of the company and
the number of risks presented in the prospectus (Clarkson, 1994).
Even though many authors have focus on this theme, this dissertation differentiate
from previous studies by using a more recent sample of companies, and by using as a
proxy for uncertainty the realized daily volatility1 , giving more importance to the day
that the share starts to be traded.
A linear regression model using a sample of 614 companies’ IPOs from the NYSE
occurred between 2000 and 2013 was estimated.
1 The realized volatility is further explained based on Areal and Taylor (2002).

2
The rest of this report proceeds as follows. In section 2 the literature review of the
topic is presented. Section 3 presents the sample while in section 4 the methodology is
explained. The results are presented in section 5, and finally, section 6 concludes.
3
2. Literature Review
This sections starts with a brief description of some empirical literature regarding the
IPO underpricing, in order to provide background to the following studies. Then, a
revision of the main literature regarding the relation between underpricing and
uncertainty is made, giving special attention to studies that had as a proxy the standard
deviation of the aftermarket prices, but analysing all the proxies adopted by the authors.
2.1 The IPO underpricing
As previously mentioned, underpricing in IPOs is a problem with quite a long story.
The perseverance of this problem, and consequently it vast literature, is mainly due to
IPOs constant pricing problems.
A couple decades ago, Ibbotson (1975) studied the price performance of North-
American IPOs from 1960 to 1969 randomly choosing one IPO from each month from
all registered IPOs in the Securities and Exchange Commission (SEC). The author, using
risk-adjusted returns concluded that, on average, the price at the end of the first trading
day is 11.4% higher than the offer price. A few years later, Ibbotson upgrade his work
using a sample of over 5,000 IPOs, occurred between 1960 and 1982, and found an
average underpricing of 18.8%. Ritter (1984) using a sample of North-American IPOs
occurred between 1977 and 1982, found on average an initial return equal to 26.5%. The
sample included a hot issue period from January of 1980 to March of 1981, but even
without accounting for this period, the author found an average underpricing of 16.3%.
Ibbotson, Sindelar and Ritter (1994) gathered data from several studies to confirm the
presence of this phenomenon for 32 international IPO markets as Chinese, Australian,
Portuguese, British, German, Japanese, among others.
When analysing the IPO process, there is a time lapse between the release of the offer
price of the respective share and the beginning of trading on the market. This interval
could be one of the justifications for underpricing, but, as stated by Ljungqvist (2004), in
the US market “the offer price is set just days (or even more typically hours) before
4
trading on the stock market begins. This means that market movements between pricing
and trading are negligible and so usually ignored” (Ljungqvist, 2004, pp. 6).
2.2 IPO underpricing: asymmetric information
In our study, we focused our attention in one of the most studied justification for IPO
underpricing: asymmetric information. This justification explores the bias of information
among the agents in the process of the IPO. Based on this justification we addressed four
other that use asymmetric information as a groundwork.
2.2.1 The winner’s curse
Ljungqvist (2004) found several explanations for underpricing, from behavioural, to
asymmetric information models, passing through institutional or ownership and control,
all can be play a role in justifying the underpricing. Our study will focus on asymmetric
information models, more specific the winner’s curse justification. The premise of this
justification is the higher the uncertainty, the higher the underpricing, which will be
further explained.
Ibbotson and Jaffe (1975) mentioned that is not unusual for underwriters to know
beforehand that the possible demand is five times higher than the shares available. Rock
(1986) using this information stated that uninformed investors (investors that do not spend
any time and money to find out the value of a share, and that play a crucial role in IPOs,
once they are the one who guarantee the success of the majority of them) “receives none
of the underpriced issues due to the rationing brought on by the informed demand, and
all of the overpriced issues” (Rock, 1986, pp. 188), what will lead the uninformed
investors to revised downwards their valuation of new IPO shares, in order have a
nonnegative expected return. Rock would published his work concluding that “the
discount is a natural consequence of the present model, which incorporate asymmetric
information and rationing” (Rock, 1986, pp. 188). This model was the groundwork for
several others regarding this subject.
5
In the previous model, there was although a small hurdle as the rationing problem
could not be tested in the North-American IPO market as in most of the markets, since
the way the rationing is applied is not publicly disclosed. However, the same could not
be said about the Singaporean IPO market. Koh and Walter (1989) did a direct test of
Rock’s (1986) model and state that “rationing occurs more often for ‘good’ shares than
for ‘bad’ shares“(Koh and Walter, 1989, pp. 251). This study was unique since in the
Singaporean market, whenever the demand surpasses the number of shares to be offered,
it is public and “all applications of a particular size have an equal probability of being
accepted” (Koh and Walter, 1989, pp. 252). The authors concluded that rationing of new
issues explains the unseasoned new issues anomaly, that winner’s curse is strongly
evident and that there is a positive correlation between underpricing and oversubscription.
In the meanwhile, Ritter (1984) studied the 1980 “hot issues”, trying to find a
justification for it, by developing an implication of Rock’s (1986) model. He starts by
arguing that some IPOs are more underpriced than others, more precisely, IPOs with
higher risk are generally more underpriced than low-risk IPOs. In order to test it, Ritter
checked that “if high-risk offerings are an unusually large fraction of initial public
offerings in some periods, these periods should also have unusually high average initial
returns” (Ritter, 1984, pp. 216). Once risk is not something measurable, the author needed
to use a proxy to risk, which he used the sales from the most recent 12 months, and the
daily standard deviation of the first 20 daily initial returns of the aftermarket. Ritter
concluded that there is a positive relation between risk and initial returns (and its
heteroscedasticity), i.e., that the greater the uncertainty about the price of the new shares,
the greater the advantage of the informed investors, hence, the deeper the underpricing.
When the demand for the shares of one IPOs is bigger than the shares available, which
happens with the majority of IPOs, the issuing firm can no longer increase the number of
shares, then it has to be implemented a quantity rationing. Beatty and Ritter (1986), when
studying the IPO underpricing, argue that this rationing does not happen in a random way
across issues. They also stated that offers which prices rises are much more commonly
oversubscribed than the ones that prices fall and that an uninformed investor that
subscribe to all offerings, “is allocated shares in the offerings that go up less frequently
than in the offerings that decline in price” (Beatty and Ritter, 1986, pp. 215), what creates
a “winner’s curse” situation. The authors concluded that as the ex-ante uncertainty is
6
directly related to the degree of underpricing, and as it increases the “winner’s curse”
problem intensifies, “the greater the ex-ante uncertainty about the value of an issue, the
greater is the expected underpricing” (Beatty & Ritter, 1986, pp. 231). They proved it
using Rock’s (1986) model, having the inverse of the gross proceeds as a proxy to ex ante
uncertainty.
When analysing this problem, one important step is to find an appropriate proxy for
risk, once as previously mentioned, it is not a measurable concept. Miller and Reilly
(1987) on their study regarding mispricing, initial returns and uncertainty for IPOs
assessed the relation between the level of underpricing and a couple of different proxies
for risk, with a sample of IPO occurred between 1982 and 1983. The authors tested
proxies already used by other authors, such as the inverse of the gross proceeds (Beatty
and Ritter, 1986) reaching a value of 0.12, the standard deviation of returns (Ritter, 1984),
but in this proxy they changed from the first 20 days to the first 4 days after the first day
of trading, using in this case an ex-post measure and reaching a value of 0.32.
Miller and Reilly (1987) also analysed the difference between the standard deviation
of the returns for days two through five for the underpriced part of their sample, versus
the overpriced part of the sample, concluding that there is higher uncertainty for the
underpriced one. The authors also tested additional variables, highlighting the trading
volume, which also showed to be correlated to uncertainty.
The study of proxies for ex-ante uncertainty around IPOs was still not over. Clarkson
(1994) did further research on the relation between underpricing and ex-ante uncertainty,
stablishing a hierarchy among a group of 9 proxies, using a sample from 1976 until 1985,
and once again, the assumptions of Rock’s (1986) models.
After performing F-tests on all the proxies, the author highlighted 3 proxies: the age
of the firm going public, the number of risk factors present on the prospectus and the
standard deviation of daily returns measured over the first 59 days after the first day of
trading. When testing these models, the author concluded that only the age of the
company is statistically significant in all models, the number of risk factors is only in two
of four, and the standard deviation of the daily returns it is not in all of the four.
More recently Lowry et al. (2010) studied the variability of IPOs initial returns, using
a sample of IPOs occurred between 1965 and 2005. With a different approach from the
7
previously studies, the authors checked if when the initial returns were high, the
dispersion of that same returns were also high, but using information from the first 21
trading days for both of the calculations. The authors assumed that if the dispersion of the
initial returns is higher, then it is because the companies are harder to value. In their
process, the authors highlighted the age of the firm, being from a high-tech industry and
being quoted in NASDAQ instead of NYSE, as important variables to how hard it is to
value a company. They also provide evidences backing the relation between underpricing
and ex-ante uncertainty.
2.2.2 Information revelation theory
“If – as Rock assumes – some investors are better informed than either the company
or other investors, eliciting their information before setting the price becomes one of the
keys tasks for the investment bank taking the company public.” (Ljungqvist, 2004, pp.
19).
Due to this bias of information regarding the companies, previously stated by
Ljungqvist (2004), Bookbuilding started being more used as pricing mechanism to IPOs.
In this mechanism some investors (specifically institutional investors) can give their
opinion on the value of the share that is about to go public. However, is in the interest of
the investors to give misrepresentation of positive information about the company as it
decreases the issue price, and so they will further benefit from underpricing. It was then
a challenge to adapt this mechanism, into one where the investors benefit from revealing
their information truthfully.
Benveniste and Spindt (1989), Benveniste and Wilhelm (1990) and Spatt and
Srivastava (1991) presented the necessary changes to make this mechanism work. They
stated that not allocating any (or few) shares to the investors who bid conservatively
would make the investors that have positive information to bid aggressively, not only for
being assigned to the shares but also to do not miss the opportunity of keep on doing
businesses with the investment bank.
8
In order to this mechanism to work, i.e., to investors revealing the information, the
shares have to be underpriced, so it can ensure that their return is positive, and then keep
their interest in the present IPO, but also in the forthcoming ones.
Even leaving money on the table, the issuing company still benefits from this
mechanism, once it is able to set the higher issue price than if it did not have the positive
information from the investors.
2.2.3 Principal – agents models
Investment banks (as underwriters) have several decisions to make in the IPO process
that impacts the overall process. These decisions can sometimes create agency problems
with the issuer.
These problems arise since the underwriters have the power to influence the offer
price and to decide the shares allocation: to whom and how much share are allocated to
each investor.
Regarding the price settlement, the underwriters are hired to help choosing the highest
offer price that ensure the selling of all the shares. Even though, the banks face moral
hazard problems, since they can benefit from a higher offer price as the underwriting fees
are set as a percentage of the total proceeds. These should be an incentive to underwriters
to behave in the best interest of the issuer (higher gross proceeds means higher fees), but
it is conceivable that other benefits1 from setting a lower offer price exceed the loss in
underwriting fees.
Baron and Holmström (1980) and Baron (1982) presented screening models to analyse
the benefits of the underwriters from the underpricing. In those, they stated that in order
to the issuers to get the best of all the superior information possessed by the investment
bank, the investment bank should choose the offer price from a range of prices selected
by the issuers, which the bank will choose accordingly to the expected likely demand of
the shares from the IPO.
1 The benefits can arise from side-payments made by the investors to ensure they receive more
(underpriced) shares or from allocating shares to executives in exchange of further investment banking
business.
9
In this situation, in the presence of asymmetric information, the underwriter will a
price other than the optimal price (from the issuer point of view) under symmetric
information. The price chose by the underwriter, in equilibrium, will involve underpricing
due to the information advantage of the underwriter. One important conclusion drawn
from this mode is that the higher the uncertainty around the value of the company, the
higher will be the asymmetry of information and so the higher the underpricing.
2.2.4 Underpricing as a signal of company quality
This explanation changes the approach to the problem by assuming that the issuer has
the best information regarding it future cash-flows, and so, it value.
Allen and Faulhaber (1989) in their study concluded that good companies underprice
in order to evidence the company’s quality, once they know that they will be able to
recover the loss suffered through future issuings. Ibbotson (1975) was the first to suggest
that IPOs are underpriced to “’leave a good taste in investors’ mouths’” (Ibbotson, 1975,
pp. 264).
Allen and Faulhaber (1989) also mentioned that other signals could be used instead of
underpricing, for highlighting the company’s quality. However, underpricing, on the
contrary of other signals, has no monitoring costs, and it also reduces the litigation risk
and can even work as publicity, since there are several publications and news that
highlight the IPO winners.
10
3. Data
In order to answer the questions raised by this dissertation a sample of IPO occurred
between 2000 and 2013 was chosen and data collected from several sources. This process
will be further fully explained.
3.1 Sample selection and data sources
We started by collecting all 806 IPOs occurred between the 2000 and 2013, in the New
York Stock Exchange (NYSE) IPOs, a highly liquid IPO market. This will allow us to
analyse more recent IPOs, in contrast with most of previous studies that analysed periods
before the 2000. After remove all the trusts1 we end up with 786 companies that went
public in the NYSE between 2000 and 2013. Information about the intraday prices was
only available for 754. Then, all IPOs that had a gross proceed lower than 100 million
dollars were eliminated, to reduce the risk of having IPOs with misleading information
due to their size, which left us with 633 companies. Finally, the age of the company that
will be used as control variable, was only available to 614 companies that comprise our
final sample.
The list of all the companies that went public during the sample period, as well as the
issue price and the gross proceeds of each of the respective IPO were retrieved from the
NASDAQ website2. The intraday prices of all the transactions recorded on the first day
of trading, that allowed us to not only to calculate the underpricing but also, and more
important, to calculate the daily volatility, were collected from the Trade and Quotes
(TAQ) database3 along with the volume of each transactions. In order to have the age of
the each company we used the Capital IQ4 database for most of the companies, and the
Google website5 for the remaining ones, since the database did not had information about
all the companies.
1 Trusts’ value is dependent on the value of the assets that comprise the trust and so their price uncertainty
is very different from a normal IPO as depend on the uncertainty regarding the price of its assets. 2 www.nasdaq.com 3 http://www.nyxdata.com/Data-Products/Daily-TAQ 4 www.capitaliq.com 5 www.google.com
11
3.2 Intraday data scrubbing
The most decisive data to this study is the intraday prices as it is used as proxy to the
ex-ante uncertainty and the major factor that differentiate our dissertation from previous
studies. After downloaded all the intraday transactions that occurred in the first day after
the IPO for each share, it was needed to scrub all the data since the data auto-recorded
(normally called as dirty data) by computers includes a lot of inaccurate data as it records
dozens of hundreds of values for the same day. In order to clean the data, all extreme
values (outliers) were deleted. So when a tick change (that can happen in a matter of
seconds, or even during the same second) was higher than 5% or higher than 1€ that
specify data point was deleted. This was an extremely time consuming process since it
was necessary to assess the trend of the price, every time an outlier was found.
After removing all the dirty data, we were able to proceed with the treatment of the
data, assembling all the transactions into 5-minutes transactions blocks. We assumed that
for all offerings, the first transaction that occurred after the market opens would be the
first value for the first 5-minutes block. Then, we used the transactions nearest to each 5-
minutes block, finishing at the 16.00 block, or the last value available when the share was
not traded until 16.006.
In the case of the volume of shares traded all transactions were considered since using
only the 5-minutes blocks would ignore most of the transactions that happened that day
3.3 Variables’ description
The model, which will be explained in the next Section, includes de following
variables:
Underpricing (UND) measured as the percentage change from the issue price of an
initial public offering and the closing price of the first day of trading in the secondary
market, using the price of the last 5-minutes block.
6Companies that trade started after 12.00 or were not traded after 14.00, were classified as companies
without proper data, and so were removed from our sample (this included a total of XXX companies).
12
Volatility (VOLA) measured as the standard deviation of the daily logarithmic returns
measured in the first day of trading using prices from the 5-minutes blocks (Areal and
Taylor, 2002)
Gross proceed (GROSS) measured as the total amount obtained from the IPO (gross
proceeds) (Beatty and Ritter, 1986)
Volume (VOLU) measured as the percentage of the total shares issued in the public
offering shares traded at the first day of trading (Miller and Reilly, 1987)
Age (AGE) as the number of years since the company was founded (Ritter, 1984)
The calculation of the realized daily volatility, based on Areal and Taylor (2002) as
previously mentioned, followed the following formula:
𝜎2 = ∑ 𝑤𝑗 ∗ 𝑟𝑗
2
𝑛
𝑗=0
(3.1)
Where:
𝑤𝑗 is the weight of each 5-minutes return during the day. In this study is assumed to
be equal for every return. Their sum is equal to 1;
𝑟𝑗2 is the square of the logarithmic returns for each of the 5-minutes.
From the values computed from the previous formula, we calculated their square root
in order to reach the standard deviation, the proxy used for the ex-ante uncertainty.
For the purpose of this study, the variables GROSS and AGE were transformed.
GROSS into the inverse of GROSS while AGE into the log (1+AGE). This transformation
was done in the line of previous studies7.
7 The transformation done on GROSS was done by Beatty and Ritter (1986) and the one done on AGE was
done by Ritter (1984).
13
3.4 Descriptive Statistics
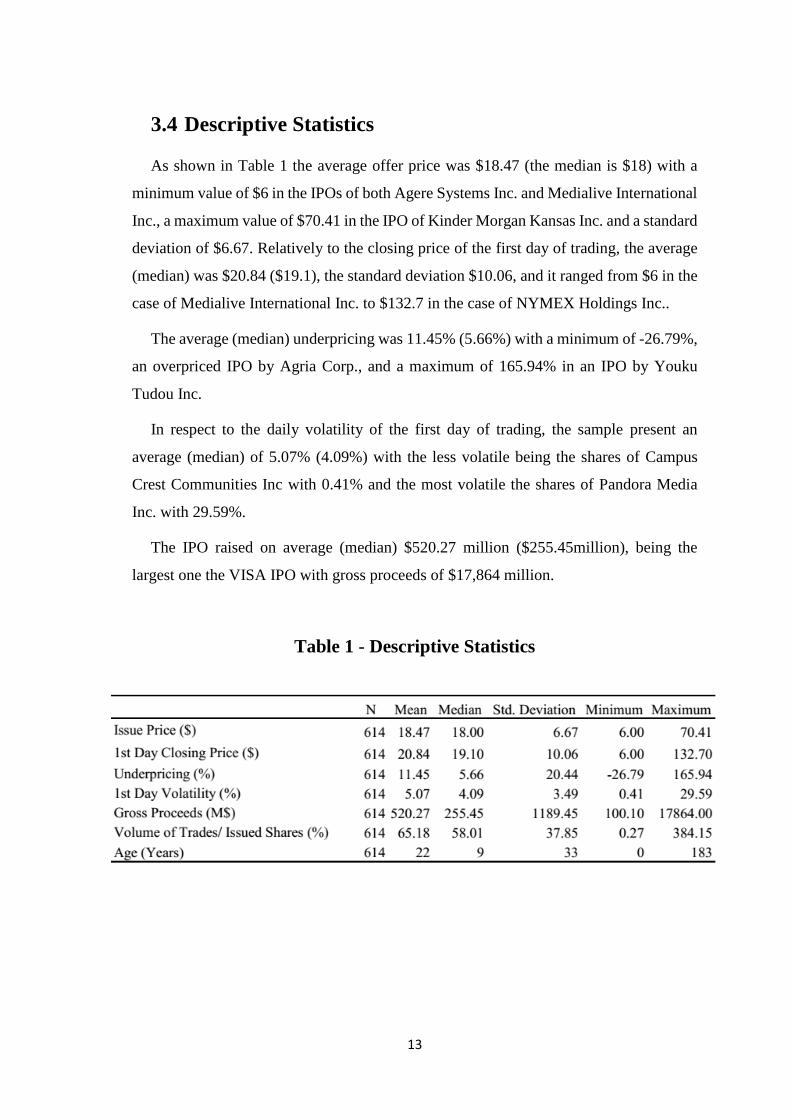
As shown in Table 1 the average offer price was $18.47 (the median is $18) with a
minimum value of $6 in the IPOs of both Agere Systems Inc. and Medialive International
Inc., a maximum value of $70.41 in the IPO of Kinder Morgan Kansas Inc. and a standard
deviation of $6.67. Relatively to the closing price of the first day of trading, the average
(median) was $20.84 ($19.1), the standard deviation $10.06, and it ranged from $6 in the
case of Medialive International Inc. to $132.7 in the case of NYMEX Holdings Inc..
The average (median) underpricing was 11.45% (5.66%) with a minimum of -26.79%,
an overpriced IPO by Agria Corp., and a maximum of 165.94% in an IPO by Youku
Tudou Inc.
In respect to the daily volatility of the first day of trading, the sample present an
average (median) of 5.07% (4.09%) with the less volatile being the shares of Campus
Crest Communities Inc with 0.41% and the most volatile the shares of Pandora Media
Inc. with 29.59%.
The IPO raised on average (median) $520.27 million ($255.45million), being the
largest one the VISA IPO with gross proceeds of $17,864 million.
Table 1 - Descriptive Statistics
14
During the first day of trading after the IPO an average (median) of 65.18% (58.01%)
of the shares offered in the IPI were traded. In the case of LinkedIn Corp. the number of
shares traded were 3.84 times the total number of shares offered.
Finally, the companies that went public were founded, on average (median) 22 years
(9 years) before. It’s important to mention that 71 companies went public in the same year
that they were founded and one of the companies (Bunge LTD) did its IPO 183 years
after it was founded.
15
4. Methodology
Before we present our model, it is important to mention that when testing it we are
facing a joint hypothesis problem as we are assuming that the daily volatility is a good
proxy for uncertainty regarding the true value of the shares offered in the IPO.
Several justifications have been tested to try to solve the IPO underpricing puzzle and
this study pretend to test the asymmetric information justification that, as first proposed
by Beatty and Ritter (1986). According to these authors, the asymmetric information
creates a winner’s curse situation, which, as previously mentioned, happens due to
uncertainty around the pricing of the company going public. As the offer price is partially
supported in the fact that uninformed investor tend to evaluate the IPO shares downwards,
what leads the company to apply a discount in the price of the share in order to guarantee
the success of the offering.
In order to test this justification we propose the following linear regression model:
𝑈𝑁𝐷 = 𝛽1 + 𝛽2 ∗ 𝑉𝑂𝐿𝐴 + 𝛽3 ∗
1
𝐺𝑅𝑂𝑆𝑆+ 𝛽4 ∗ 𝑉𝑂𝐿𝑈 + 𝛽5 ∗ log (1 + 𝐴𝐺𝐸) (4.1)
In this model, the underpricing (UND) is our dependent variable, the daily volatility
(VOLA) is our explanatory variable, as previously mentioned, and the three remaining
variables are control variables that were shown can influence the underpricing by
previous studies, being: the inverse of the gross proceeds obtained from the offering,
suggested by Beatty and Ritter (1986); the percentage of shares trade in the first day when
compared to the total amount of shares issued in the offering, suggested by Miller and
Reilly (1987); and finally the logarithmic of 1 plus the age of the company when it went
public. We expected that the signal of VOLA, of VOLU and of AGE (and of it
transformation) to be positive, expecting a positive relation between them and the
underpricing (UND). Regarding the GROSS, once we transformed the variable into the
inverse of GROSS, we expect the signal to be negative, but the relation between GROSS
and underpricing (UND) to be positive.
16
5. Results
Since we checked that there is heteroscedasticity in the ordinary least squares (OLS)
regression, we proceed to validate the statistical inference using the White’s consistent
estimators of the variance and covariance matrix from the OLS estimators of the
regression coefficients.
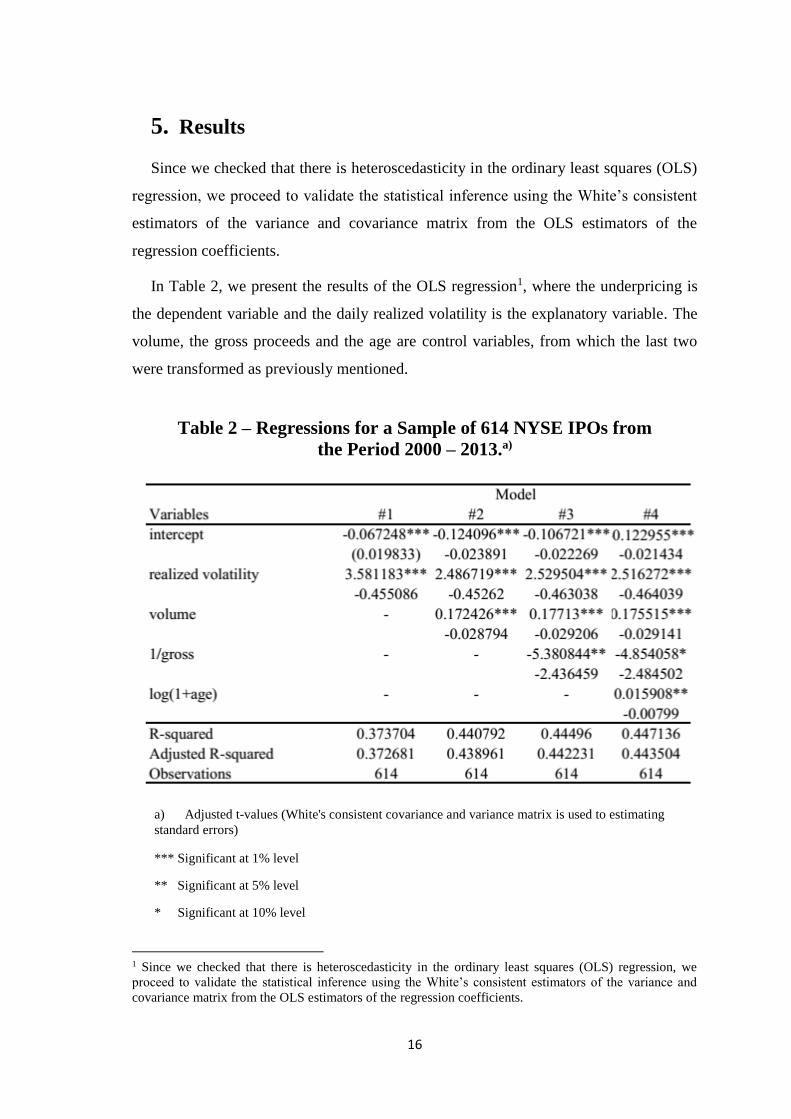
In Table 2, we present the results of the OLS regression1, where the underpricing is
the dependent variable and the daily realized volatility is the explanatory variable. The
volume, the gross proceeds and the age are control variables, from which the last two
were transformed as previously mentioned.
1 Since we checked that there is heteroscedasticity in the ordinary least squares (OLS) regression, we
proceed to validate the statistical inference using the White’s consistent estimators of the variance and
covariance matrix from the OLS estimators of the regression coefficients.
Table 2 – Regressions for a Sample of 614 NYSE IPOs from
the Period 2000 – 2013.a)
a) Adjusted t-values (White's consistent covariance and variance matrix is used to estimating
standard errors)
*** Significant at 1% level
** Significant at 5% level
* Significant at 10% level
17
The positive coefficient on the realized volatility are consistent with Rock’s (1986)
prepositions, which predicted that the ex-ante uncertainty is positively correlated with the
underpricing, being in this case the daily realized volatility the proxy for ex-ante
uncertainty. Regarding the control variables, the volume and the age have a positive
correlation with the dependent variable, and the inverse of the gross proceed has a
negative correlation, what means that the gross proceeds itself has a positive correlation
also.
Related to the statistical significance, the volatility and the volume are significant at
1% level in all models. Regarding the inverse of gross proceeds and the logarithm
transformation of the age of the companies, the first is statistically significant at 5% and
10% level in model 3 and 4, respectively; while the second is statistically significant at
5% in model 4.
It is important to state that the adjusted R-squared is quite high (0.373), even for model
1, where it is only present the explanatory variable, the daily realized volatility. When
comparing to other similar studies, namely Miller and Reilly (1987), we found higher
explanatory power to the standard deviation, but we have calculated the volatility in the
first day only, while Miller and Reilly used the first 4 days after the IPO. Clarkson (1994),
conclude that the standard deviation had no statistical significance in his study, but again,
he used the standard deviation during the first 60 days of trading after the IPO.
18
6. Conclusions
Although there is a vast number of studies regarding the IPO underpricing, the number
of studies about the uncertainty, more specifically about the winner’s curse, as a motive
for the underpricing is relatively scarce. This study tries to fill this gap by using a different
proxy for uncertainty, the volatility during the first day of trading after the IPO (daily
standard deviation) and by using a more recent sample that starts in 2000 and ends in
2013.
The first result of our study is consistent with previous studies as it shows an average
underpricing of 11.45%.
Regarding uncertainty as a justification for underpricing, our results, show a positive
relationship between underpricing and uncertainty. This results is consistent with other
studies (Ritter (1984); Miller and Reilly (1987)) that although using different periods of
time to calculate the standard deviation (first twenty days after the IPO and from the
second to fifth day after the IPO) found similar results. Clarkson (1994) using as a proxy
for uncertainty the standard deviation from the second to the sixtieth day after the IPO
found slightly different results which may be justified by the difference in the number of
days used to calculate the standard deviation.
Although our sample was very large (614 companies) it is important to mention that
only includes IPO occurred in NYSE and so misses a large number of offerings from two
other very important stock exchanges: the NASDAQ and the AMEX. The inclusion of
the IPOs occurred in theses stock exchanges would allow us to extend our conclusions to
the entire north-American IPO market. Another limitation of our study is the joint
hypothesis problem since we assume that the daily volatility is a good proxy for value
uncertainty.
One possibility to extend the sample is to include earlier years and analyse the
differences between different and more crucial periods, e.g., the dot-com bubble and even
the recent economic crisis.
19
7. References
Allen, F. & Faulhaber, G. R. (1989), "Signalling by underpricing in the IPO market",
Journal of Financial Economics, Vol. 23, No. 2, pp. 303-323.
Areal, N. M. P. C. & Taylor, S. J. (2002), "The realized volatility of FTSE-100 futures
prices", Journal of Futures Markets, Vol. 22, No. 7, pp. 627-648.
Baron, D. P. (1982), "A Model of the Demand for Investment Banking Advising and
Distribution Services for New Issues", The Journal of Finance, Vol. 37, No. 4, pp. 955-
976.
Baron, D. P. & HolmstrÖM, B. (1980), "The Investment Banking Contract For New
Issues Under Asymmetric Information: Delegation And The Incentive Problem", The
Journal of Finance, Vol. 35, No. 5, pp. 1115-1138.
Beatty, R. P. & Ritter, J. R. (1986), "Investment banking, reputation, and the underpricing
of initial public offerings", Journal of Financial Economics, Vol. 15, No. 1–2, pp. 213-
232.
Benveniste, L. M. & Spindt, P. A. (1989), "How investment bankers determine the offer
price and allocation of new issues", Journal of Financial Economics, Vol. 24, No. 2, pp.
343-361.
Benveniste, L. M. & Wilhelm, W. J. (1990), "A comparative analysis of IPO proceeds
under alternative regulatory environments", Journal of Financial Economics, Vol. 28,
No. 1, pp. 173-207.
Clarkson, P. M. (1994), "The underpricing of initial public offerings, ex ante uncertainty,
and proxy selection", Accounting & Finance, Vol. 34, No. 2, pp. 67-78.
20
Ibbotson, R. G. (1975), "Price performance of common stock new issues", Journal of
Financial Economics, Vol. 2, No. 3, pp. 235-272.
Ibbotson, R. G. & Jaffe, J. F. (1975), "“Hot issue” markets", The Journal of Finance, Vol.
30, No. 4, pp. 1027-1042.
Ibbotson, R. G., Sindelar, J. L. & Ritter, J. R. (1994), "The market’s problems with the
pricing of initial public offerings", Journal of Applied Corporate Finance, Vol. 7, No. 1,
pp. 66-74.
Koh, F. & Walter, T. (1989), "A direct test of Rock's model of the pricing of unseasoned
issues", Journal of Financial Economics, Vol. 23, No. 2, pp. 251-272.
Ljungqvist, A. (2004), "IPO underpricing", in Empirical Corporate Finance, Eckbo, B.
E. (ed.) Handbook in Corporate Finance, Vol. 1, pp. 375-422, North-Holland.
Lowry, M., Officer, M. S. & Schwert, G. W. (2010), "The Variability of IPO Initial
Returns", The Journal of Finance, Vol. 65, No. 2, pp. 425-465.
Miller, R. E. & Reilly, F. K. (1987), "An Examination of Mispricing, Returns, and
Uncertainty for Initial Public Offerings", Financial Management, Vol. 16, No. 2, pp. 33-
38.
Ritter, J. R. (1984), "The "Hot Issue" Market of 1980", The Journal of Business, Vol. 57,
No. 2, pp. 215-240.
Ritter, J. R. (2011), "Equilibrium in the Initial Public Offerings Market", Annual Review
of Financial Economics, Vol. 3, No. 1, pp. 347-374.
Rock, K. (1986), "Why new issues are underpriced", Journal of Financial Economics,
Vol. 15, No. 1, pp. 187-212.

21
Spatt, C. & Srivastava, S. (1991), "Preplay Communication, Participation Restrictions,
and Efficiency in Initial Public Offerings", Review of Financial Studies, Vol. 4, No. 4,
pp. 709-726.
22
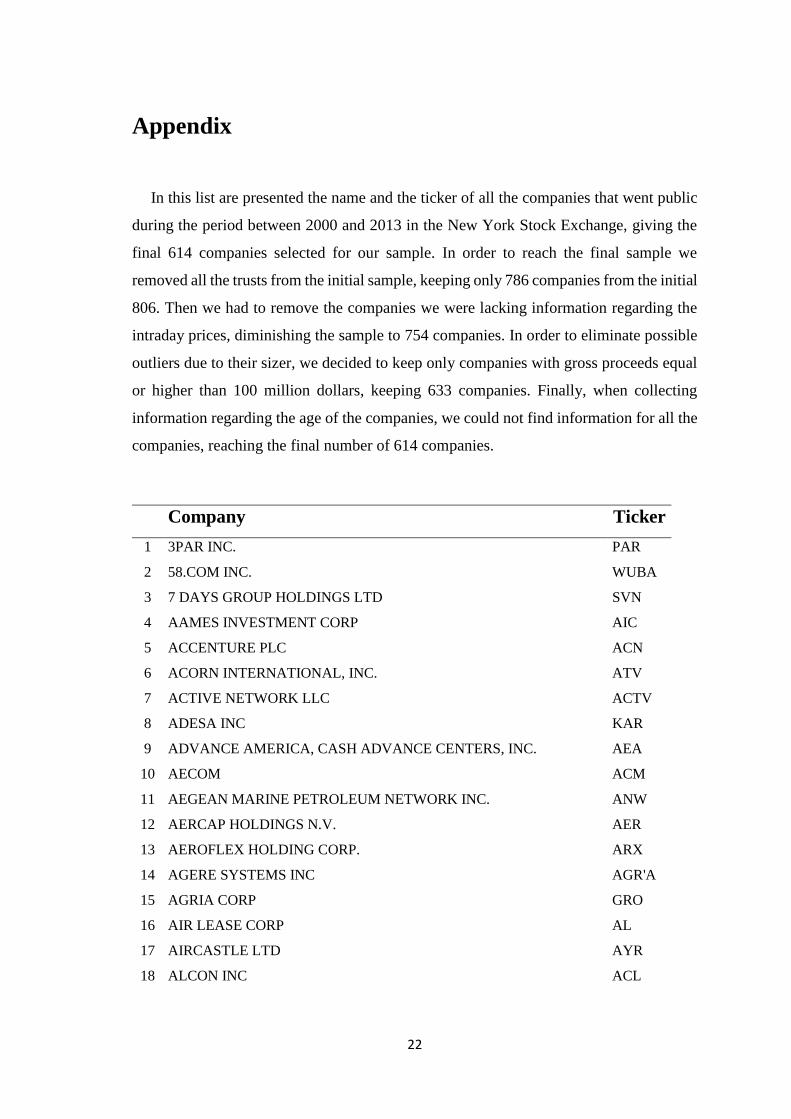
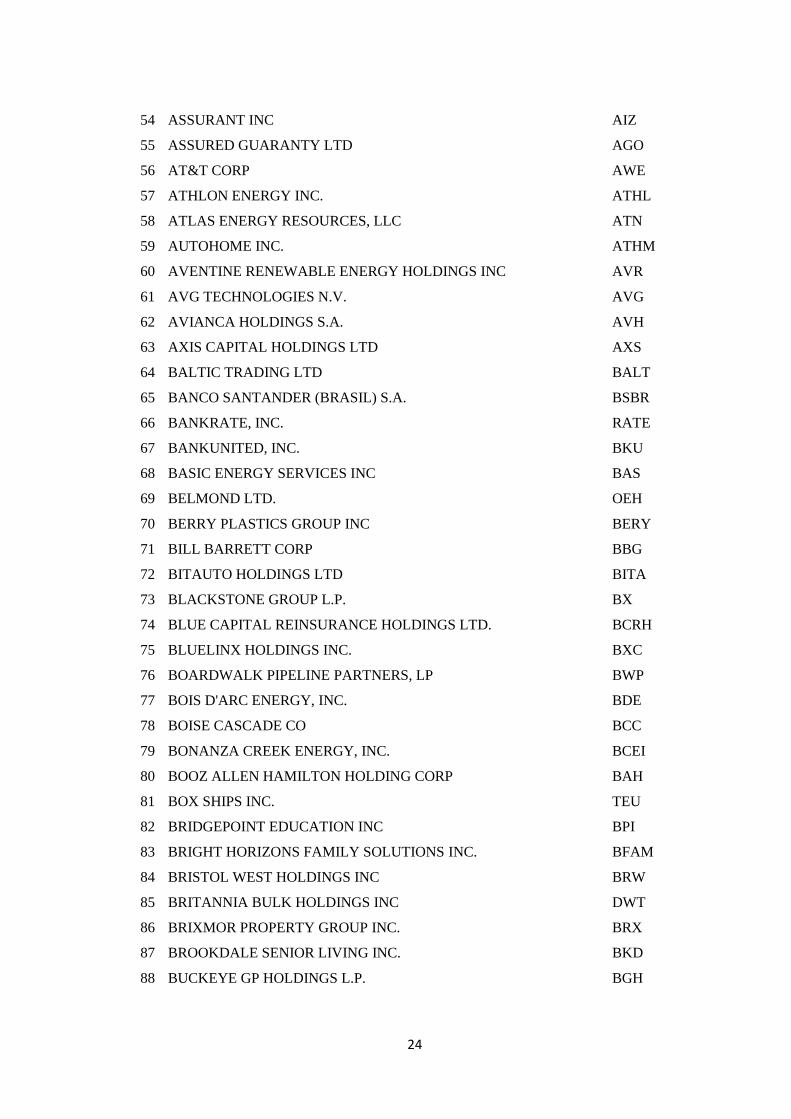
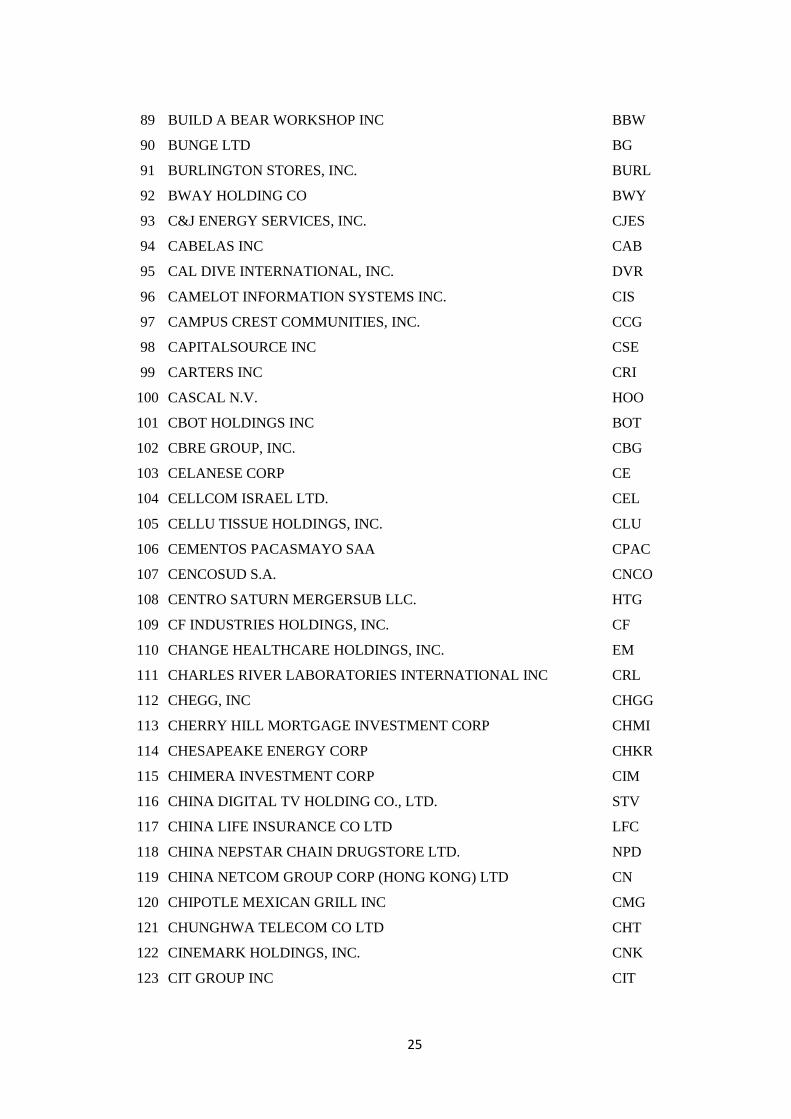
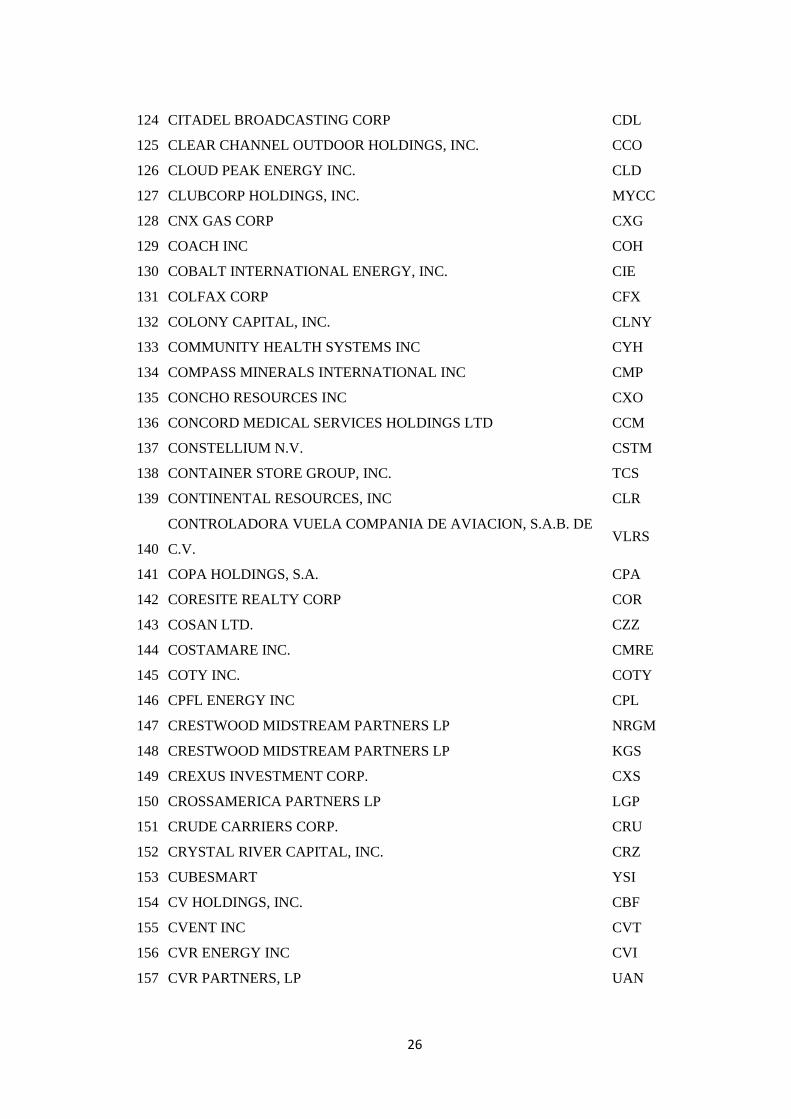
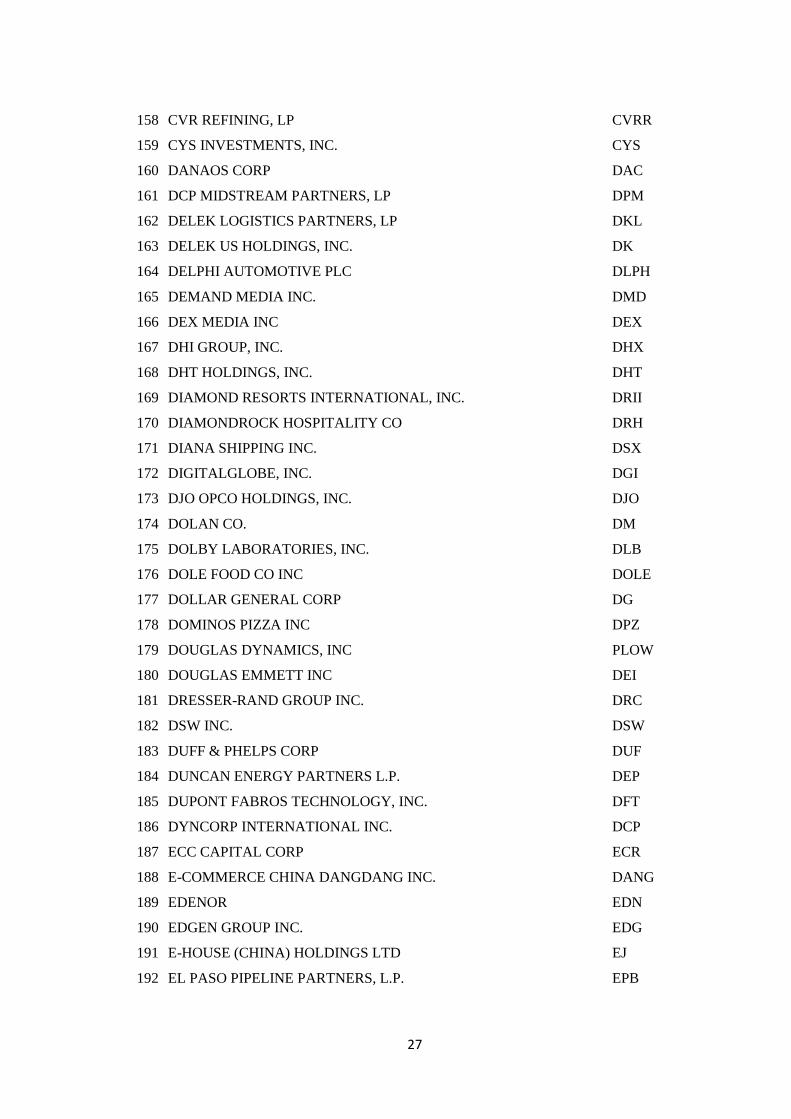
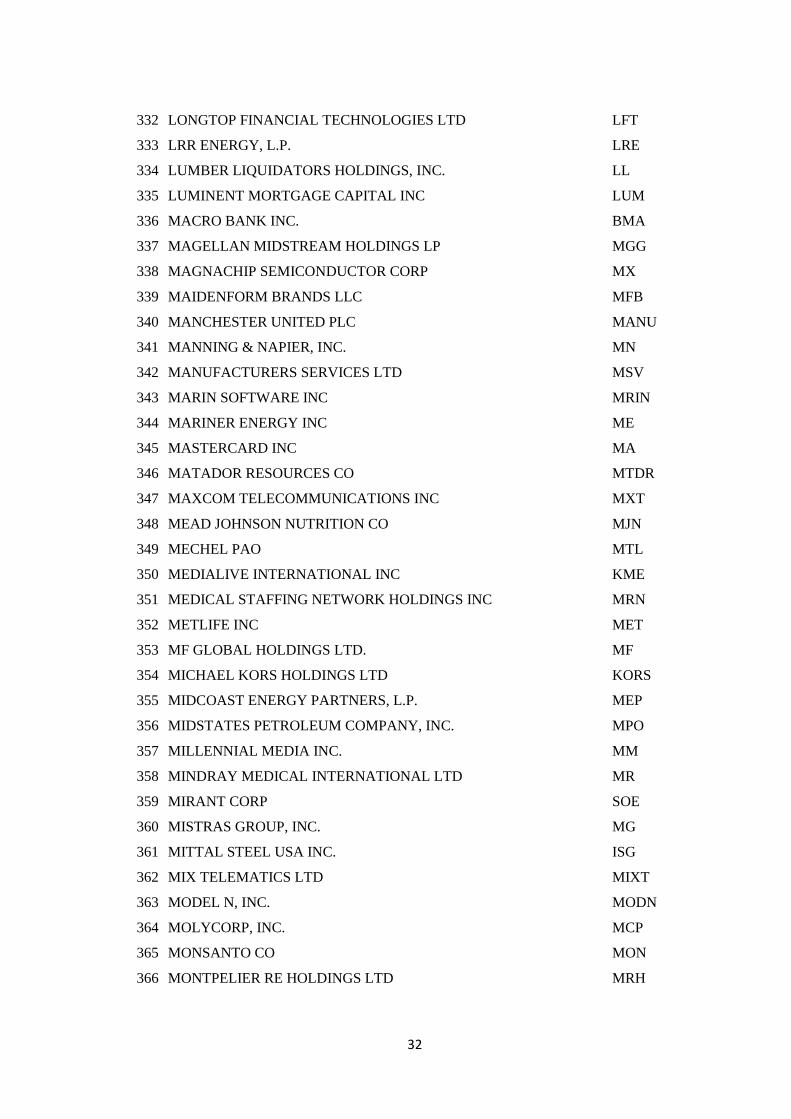
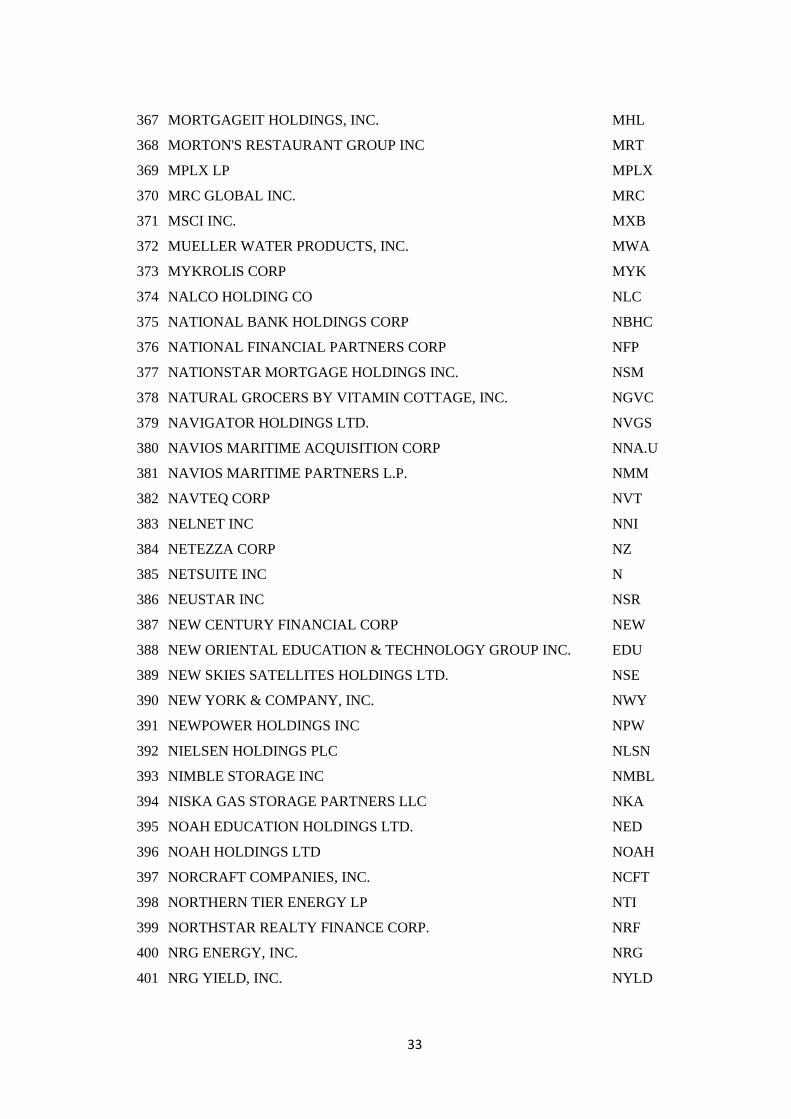
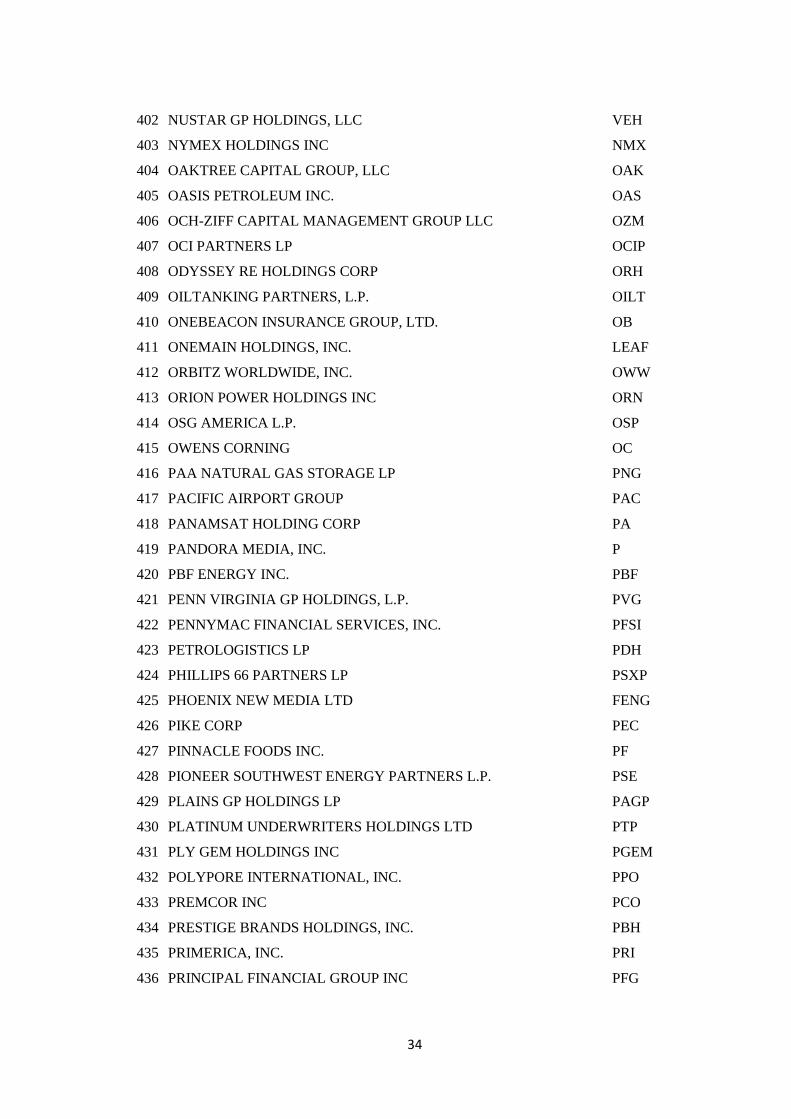
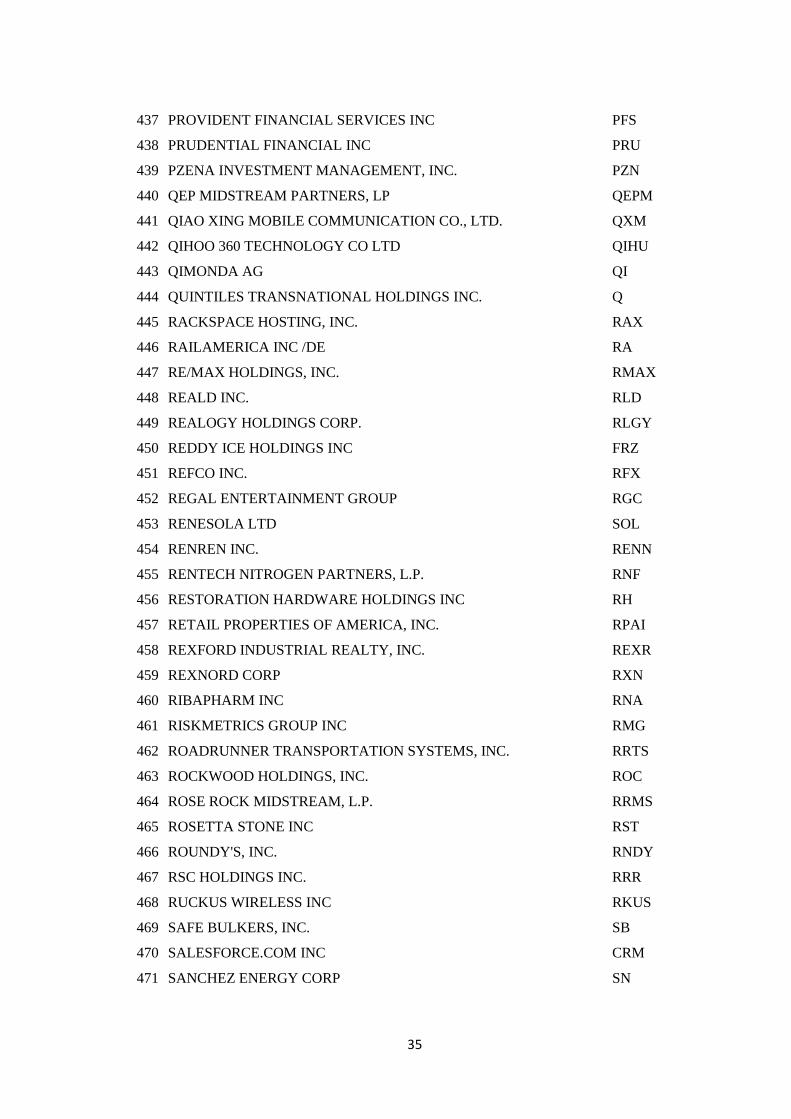
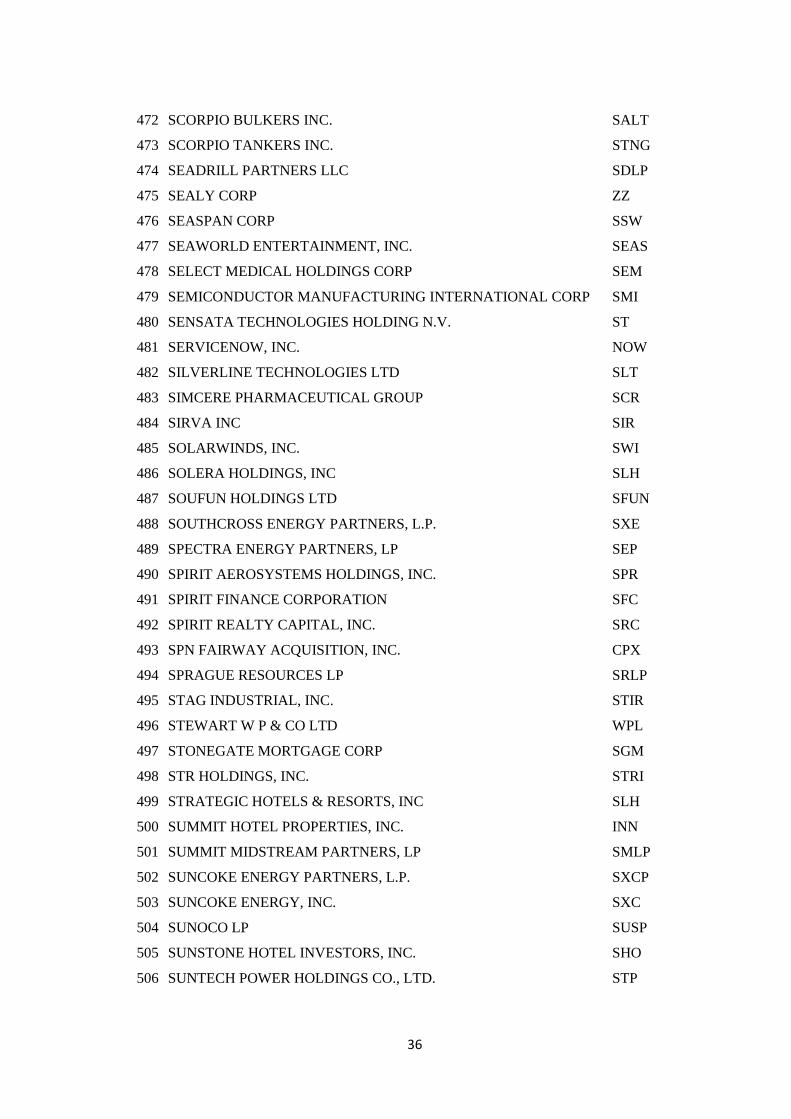
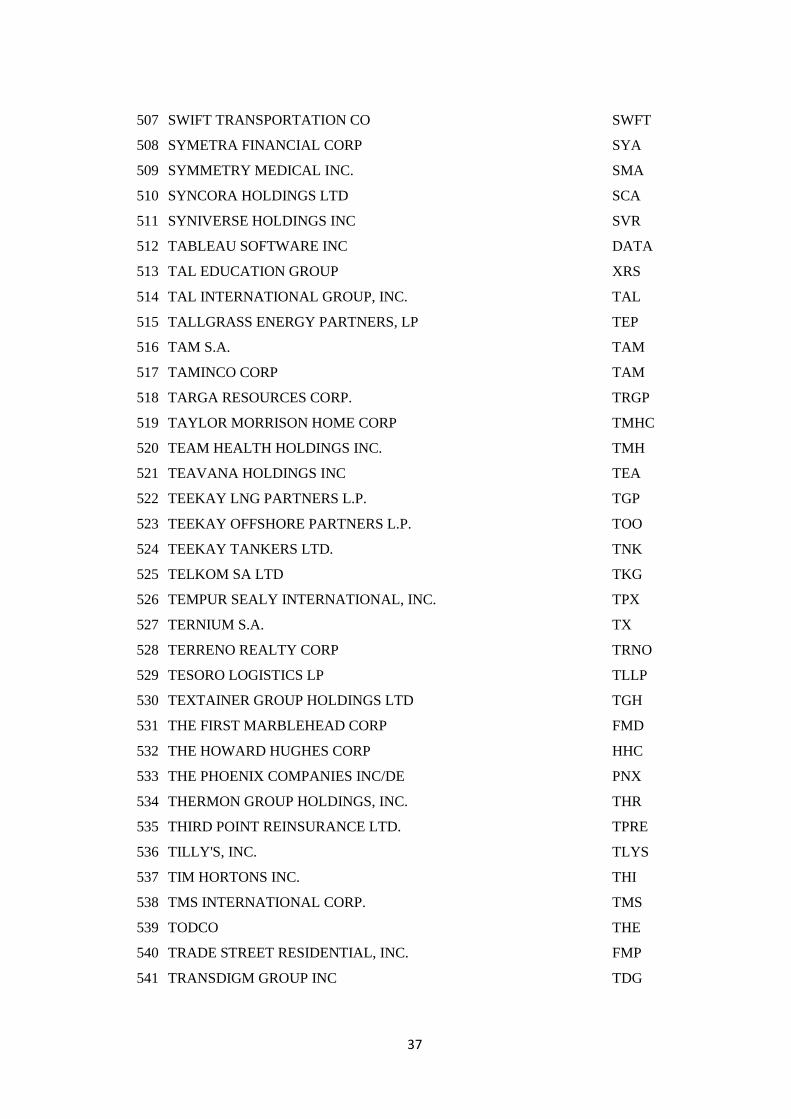
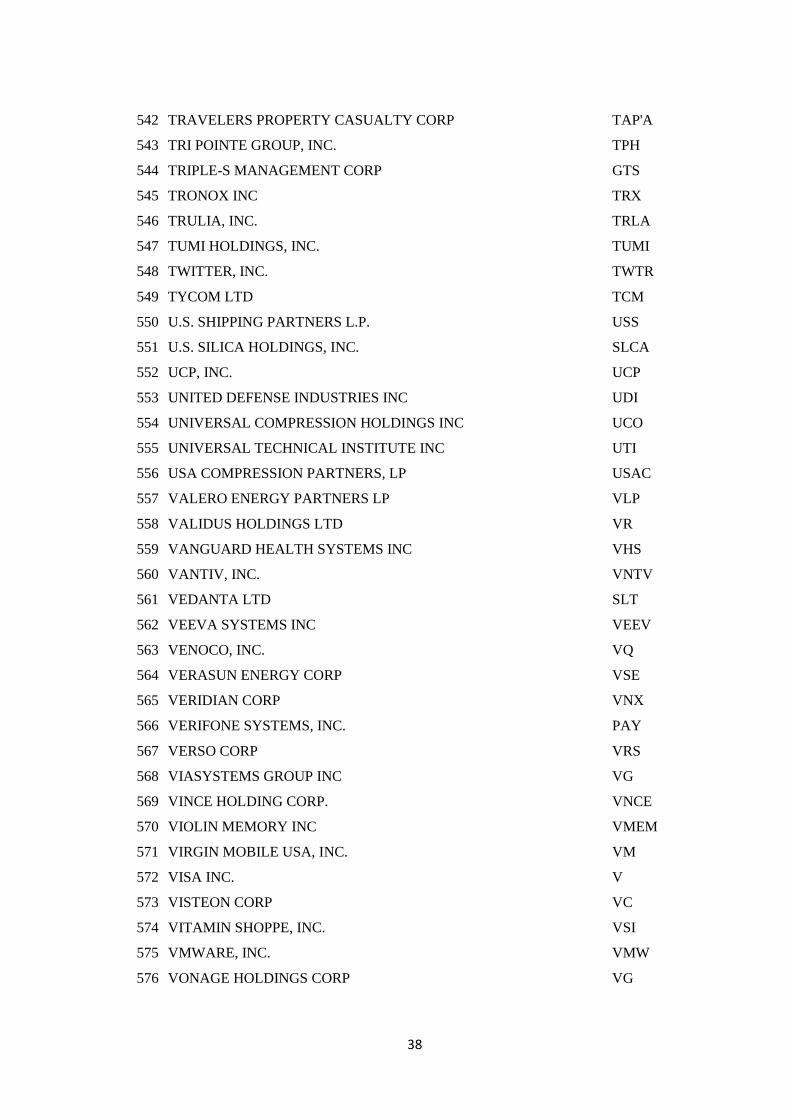
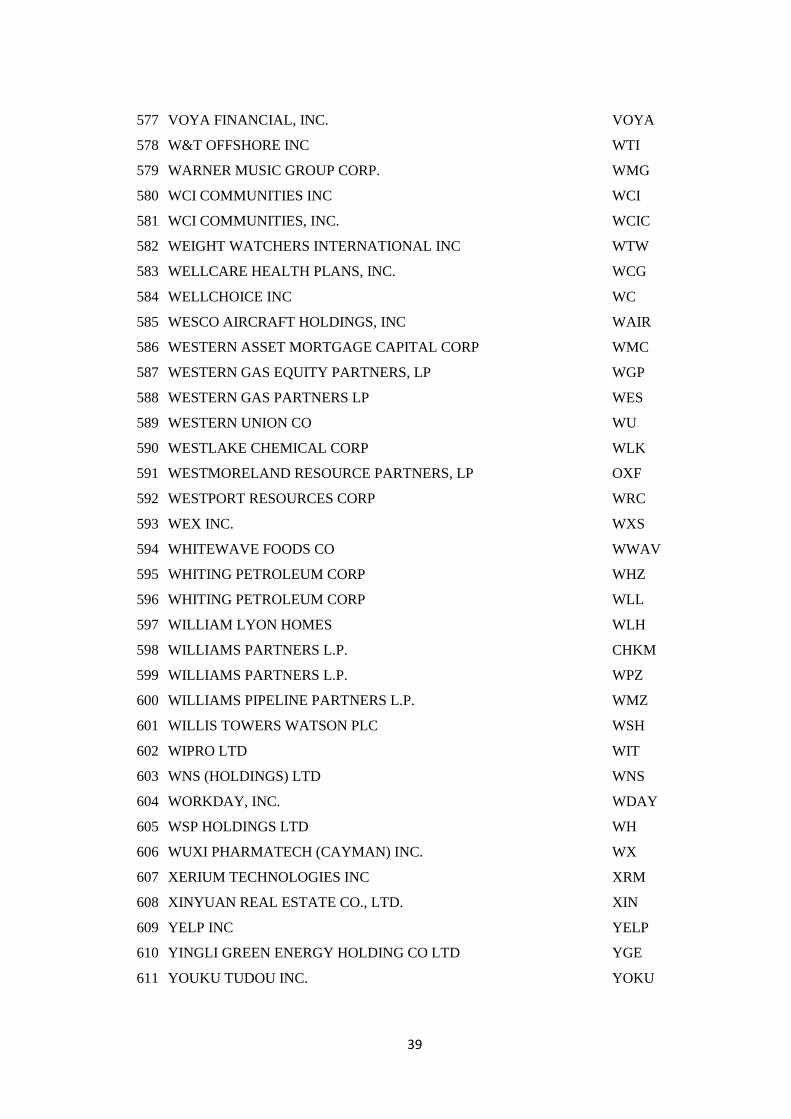
Appendix
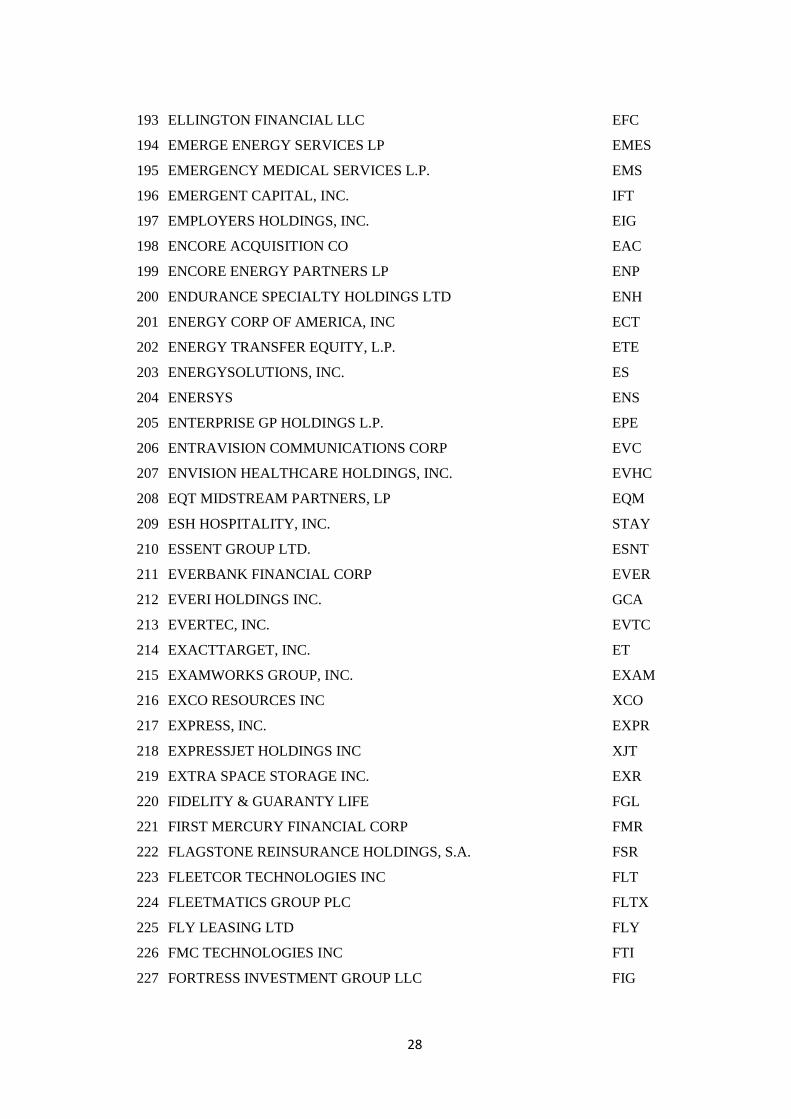
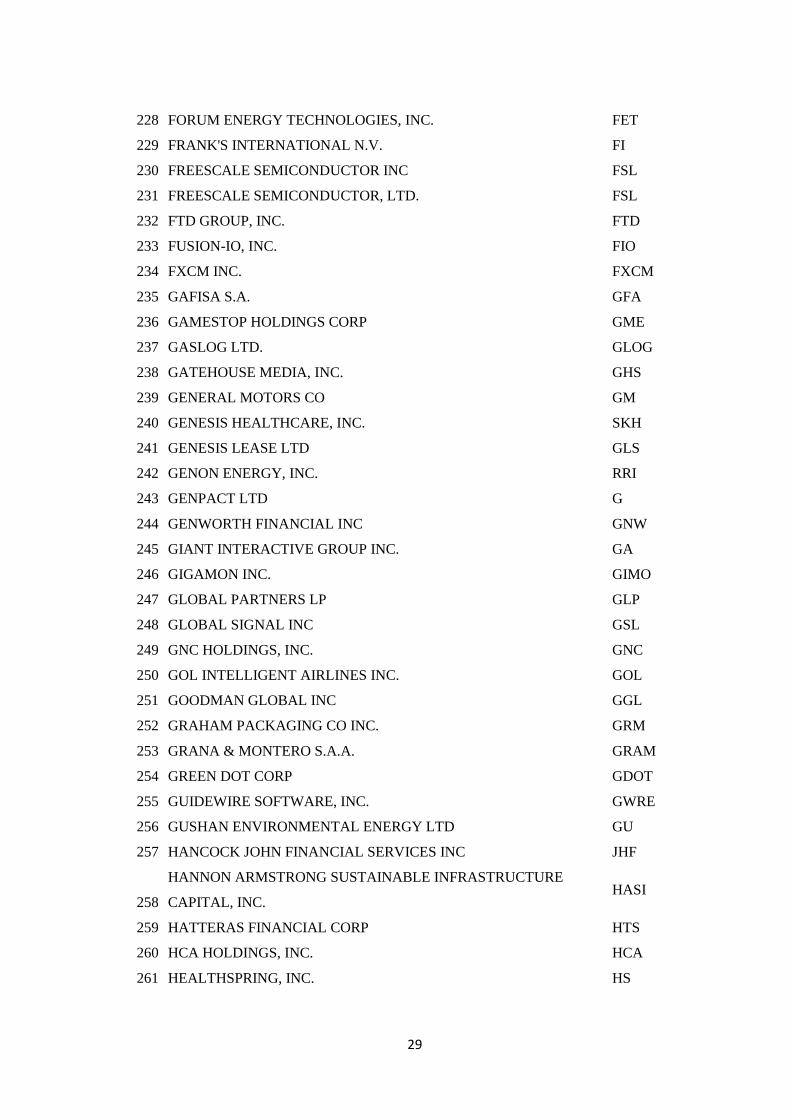
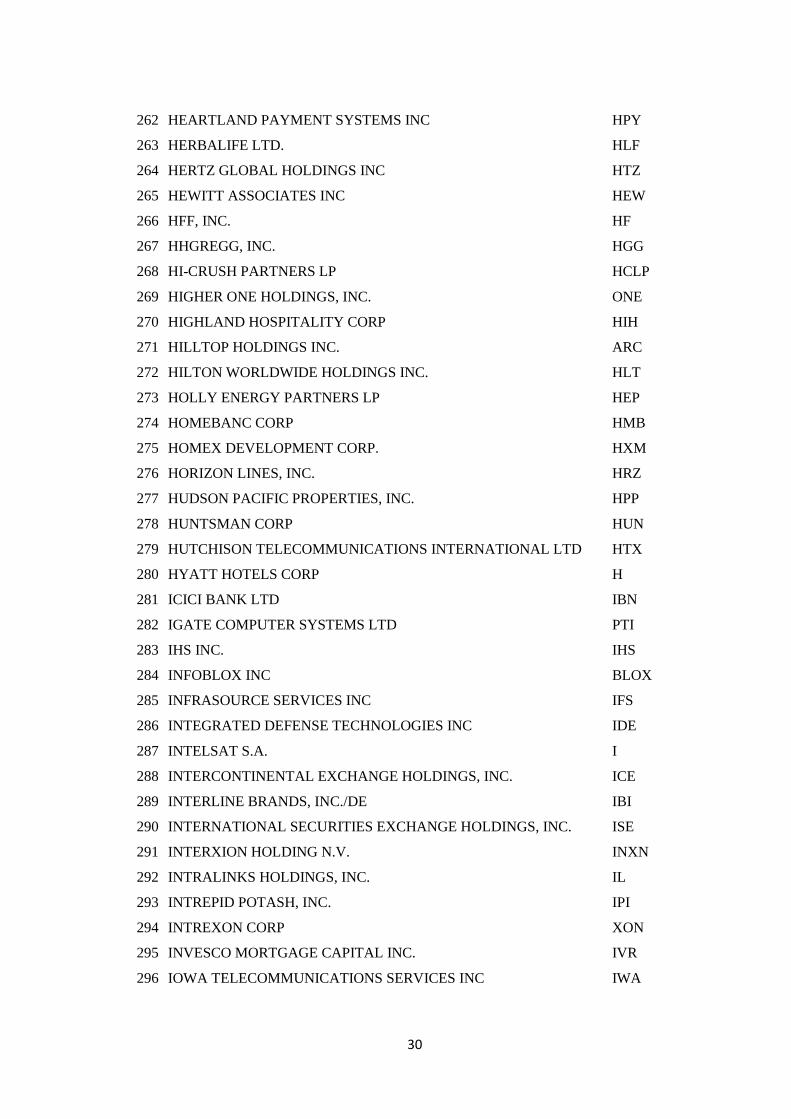
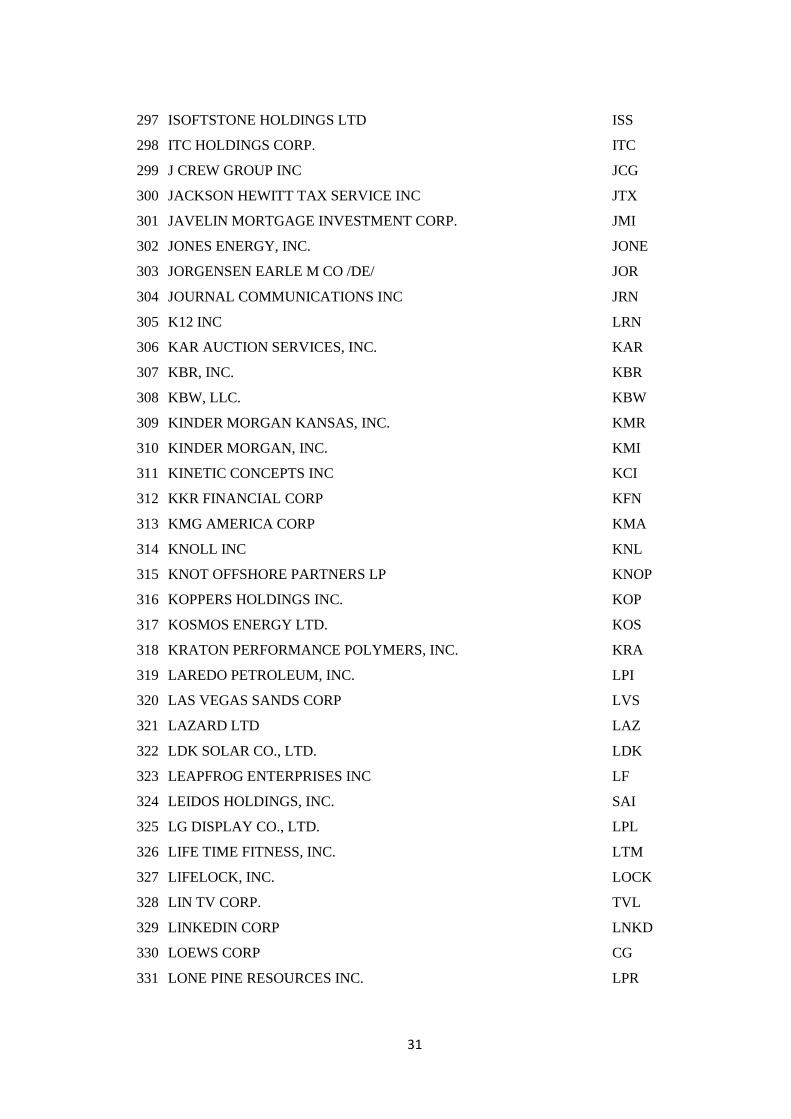
In this list are presented the name and the ticker of all the companies that went public
during the period between 2000 and 2013 in the New York Stock Exchange, giving the
final 614 companies selected for our sample. In order to reach the final sample we
removed all the trusts from the initial sample, keeping only 786 companies from the initial
806. Then we had to remove the companies we were lacking information regarding the
intraday prices, diminishing the sample to 754 companies. In order to eliminate possible
outliers due to their sizer, we decided to keep only companies with gross proceeds equal
or higher than 100 million dollars, keeping 633 companies. Finally, when collecting
information regarding the age of the companies, we could not find information for all the
companies, reaching the final number of 614 companies.
Company Ticker
1 3PAR INC. PAR
2 58.COM INC. WUBA
3 7 DAYS GROUP HOLDINGS LTD SVN
4 AAMES INVESTMENT CORP AIC
5 ACCENTURE PLC ACN
6 ACORN INTERNATIONAL, INC. ATV
7 ACTIVE NETWORK LLC ACTV
8 ADESA INC KAR
9 ADVANCE AMERICA, CASH ADVANCE CENTERS, INC. AEA
10 AECOM ACM
11 AEGEAN MARINE PETROLEUM NETWORK INC. ANW
12 AERCAP HOLDINGS N.V. AER
13 AEROFLEX HOLDING CORP. ARX
14 AGERE SYSTEMS INC AGR'A
15 AGRIA CORP GRO
16 AIR LEASE CORP AL
17 AIRCASTLE LTD AYR
18 ALCON INC ACL
23
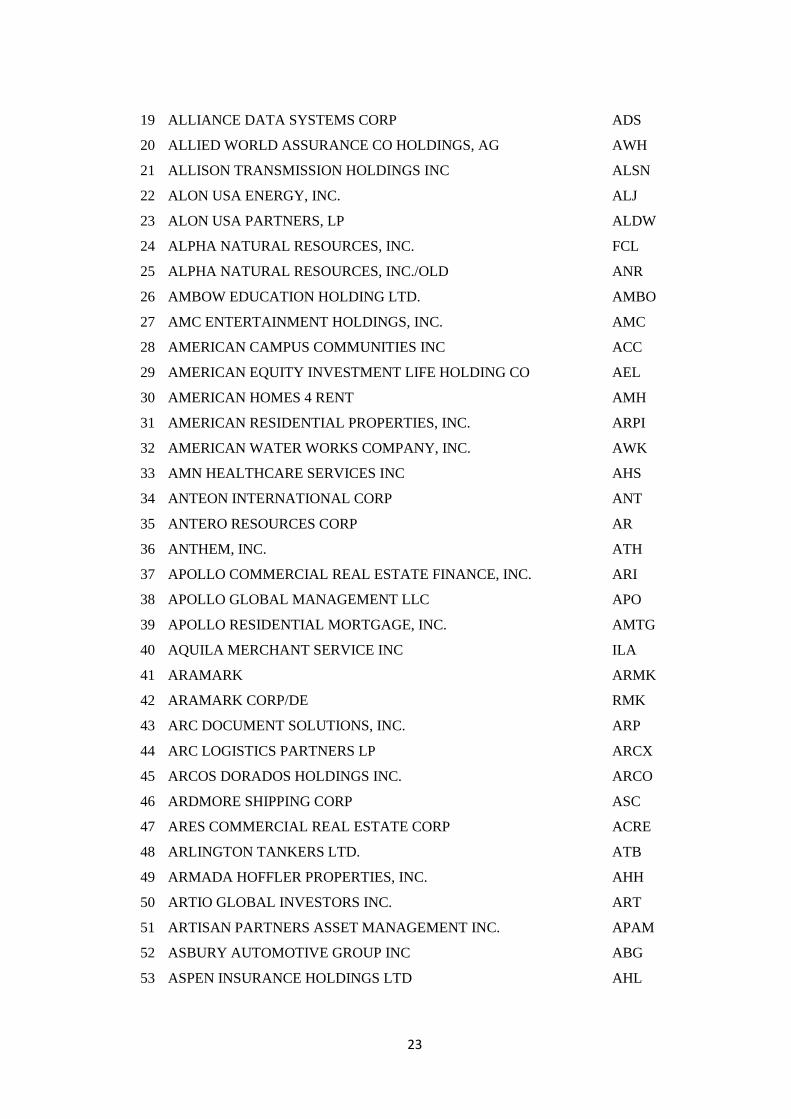
19 ALLIANCE DATA SYSTEMS CORP ADS
20 ALLIED WORLD ASSURANCE CO HOLDINGS, AG AWH
21 ALLISON TRANSMISSION HOLDINGS INC ALSN
22 ALON USA ENERGY, INC. ALJ
23 ALON USA PARTNERS, LP ALDW
24 ALPHA NATURAL RESOURCES, INC. FCL
25 ALPHA NATURAL RESOURCES, INC./OLD ANR
26 AMBOW EDUCATION HOLDING LTD. AMBO
27 AMC ENTERTAINMENT HOLDINGS, INC. AMC
28 AMERICAN CAMPUS COMMUNITIES INC ACC
29 AMERICAN EQUITY INVESTMENT LIFE HOLDING CO AEL
30 AMERICAN HOMES 4 RENT AMH
31 AMERICAN RESIDENTIAL PROPERTIES, INC. ARPI
32 AMERICAN WATER WORKS COMPANY, INC. AWK
33 AMN HEALTHCARE SERVICES INC AHS
34 ANTEON INTERNATIONAL CORP ANT
35 ANTERO RESOURCES CORP AR
36 ANTHEM, INC. ATH
37 APOLLO COMMERCIAL REAL ESTATE FINANCE, INC. ARI
38 APOLLO GLOBAL MANAGEMENT LLC APO
39 APOLLO RESIDENTIAL MORTGAGE, INC. AMTG
40 AQUILA MERCHANT SERVICE INC ILA
41 ARAMARK ARMK
42 ARAMARK CORP/DE RMK
43 ARC DOCUMENT SOLUTIONS, INC. ARP
44 ARC LOGISTICS PARTNERS LP ARCX
45 ARCOS DORADOS HOLDINGS INC. ARCO
46 ARDMORE SHIPPING CORP ASC
47 ARES COMMERCIAL REAL ESTATE CORP ACRE
48 ARLINGTON TANKERS LTD. ATB
49 ARMADA HOFFLER PROPERTIES, INC. AHH
50 ARTIO GLOBAL INVESTORS INC. ART
51 ARTISAN PARTNERS ASSET MANAGEMENT INC. APAM
52 ASBURY AUTOMOTIVE GROUP INC ABG
53 ASPEN INSURANCE HOLDINGS LTD AHL
24
54 ASSURANT INC AIZ
55 ASSURED GUARANTY LTD AGO
56 AT&T CORP AWE
57 ATHLON ENERGY INC. ATHL
58 ATLAS ENERGY RESOURCES, LLC ATN
59 AUTOHOME INC. ATHM
60 AVENTINE RENEWABLE ENERGY HOLDINGS INC AVR
61 AVG TECHNOLOGIES N.V. AVG
62 AVIANCA HOLDINGS S.A. AVH
63 AXIS CAPITAL HOLDINGS LTD AXS
64 BALTIC TRADING LTD BALT
65 BANCO SANTANDER (BRASIL) S.A. BSBR
66 BANKRATE, INC. RATE
67 BANKUNITED, INC. BKU
68 BASIC ENERGY SERVICES INC BAS
69 BELMOND LTD. OEH
70 BERRY PLASTICS GROUP INC BERY
71 BILL BARRETT CORP BBG
72 BITAUTO HOLDINGS LTD BITA
73 BLACKSTONE GROUP L.P. BX
74 BLUE CAPITAL REINSURANCE HOLDINGS LTD. BCRH
75 BLUELINX HOLDINGS INC. BXC
76 BOARDWALK PIPELINE PARTNERS, LP BWP
77 BOIS D'ARC ENERGY, INC. BDE
78 BOISE CASCADE CO BCC
79 BONANZA CREEK ENERGY, INC. BCEI
80 BOOZ ALLEN HAMILTON HOLDING CORP BAH
81 BOX SHIPS INC. TEU
82 BRIDGEPOINT EDUCATION INC BPI
83 BRIGHT HORIZONS FAMILY SOLUTIONS INC. BFAM
84 BRISTOL WEST HOLDINGS INC BRW
85 BRITANNIA BULK HOLDINGS INC DWT
86 BRIXMOR PROPERTY GROUP INC. BRX
87 BROOKDALE SENIOR LIVING INC. BKD
88 BUCKEYE GP HOLDINGS L.P. BGH
25
89 BUILD A BEAR WORKSHOP INC BBW
90 BUNGE LTD BG
91 BURLINGTON STORES, INC. BURL
92 BWAY HOLDING CO BWY
93 C&J ENERGY SERVICES, INC. CJES
94 CABELAS INC CAB
95 CAL DIVE INTERNATIONAL, INC. DVR
96 CAMELOT INFORMATION SYSTEMS INC. CIS
97 CAMPUS CREST COMMUNITIES, INC. CCG
98 CAPITALSOURCE INC CSE
99 CARTERS INC CRI
100 CASCAL N.V. HOO
101 CBOT HOLDINGS INC BOT
102 CBRE GROUP, INC. CBG
103 CELANESE CORP CE
104 CELLCOM ISRAEL LTD. CEL
105 CELLU TISSUE HOLDINGS, INC. CLU
106 CEMENTOS PACASMAYO SAA CPAC
107 CENCOSUD S.A. CNCO
108 CENTRO SATURN MERGERSUB LLC. HTG
109 CF INDUSTRIES HOLDINGS, INC. CF
110 CHANGE HEALTHCARE HOLDINGS, INC. EM
111 CHARLES RIVER LABORATORIES INTERNATIONAL INC CRL
112 CHEGG, INC CHGG
113 CHERRY HILL MORTGAGE INVESTMENT CORP CHMI
114 CHESAPEAKE ENERGY CORP CHKR
115 CHIMERA INVESTMENT CORP CIM
116 CHINA DIGITAL TV HOLDING CO., LTD. STV
117 CHINA LIFE INSURANCE CO LTD LFC
118 CHINA NEPSTAR CHAIN DRUGSTORE LTD. NPD
119 CHINA NETCOM GROUP CORP (HONG KONG) LTD CN
120 CHIPOTLE MEXICAN GRILL INC CMG
121 CHUNGHWA TELECOM CO LTD CHT
122 CINEMARK HOLDINGS, INC. CNK
123 CIT GROUP INC CIT
26
124 CITADEL BROADCASTING CORP CDL
125 CLEAR CHANNEL OUTDOOR HOLDINGS, INC. CCO
126 CLOUD PEAK ENERGY INC. CLD
127 CLUBCORP HOLDINGS, INC. MYCC
128 CNX GAS CORP CXG
129 COACH INC COH
130 COBALT INTERNATIONAL ENERGY, INC. CIE
131 COLFAX CORP CFX
132 COLONY CAPITAL, INC. CLNY
133 COMMUNITY HEALTH SYSTEMS INC CYH
134 COMPASS MINERALS INTERNATIONAL INC CMP
135 CONCHO RESOURCES INC CXO
136 CONCORD MEDICAL SERVICES HOLDINGS LTD CCM
137 CONSTELLIUM N.V. CSTM
138 CONTAINER STORE GROUP, INC. TCS
139 CONTINENTAL RESOURCES, INC CLR
140
CONTROLADORA VUELA COMPANIA DE AVIACION, S.A.B. DE
C.V. VLRS
141 COPA HOLDINGS, S.A. CPA
142 CORESITE REALTY CORP COR
143 COSAN LTD. CZZ
144 COSTAMARE INC. CMRE
145 COTY INC. COTY
146 CPFL ENERGY INC CPL
147 CRESTWOOD MIDSTREAM PARTNERS LP NRGM
148 CRESTWOOD MIDSTREAM PARTNERS LP KGS
149 CREXUS INVESTMENT CORP. CXS
150 CROSSAMERICA PARTNERS LP LGP
151 CRUDE CARRIERS CORP. CRU
152 CRYSTAL RIVER CAPITAL, INC. CRZ
153 CUBESMART YSI
154 CV HOLDINGS, INC. CBF
155 CVENT INC CVT
156 CVR ENERGY INC CVI
157 CVR PARTNERS, LP UAN
27
158 CVR REFINING, LP CVRR
159 CYS INVESTMENTS, INC. CYS
160 DANAOS CORP DAC
161 DCP MIDSTREAM PARTNERS, LP DPM
162 DELEK LOGISTICS PARTNERS, LP DKL
163 DELEK US HOLDINGS, INC. DK
164 DELPHI AUTOMOTIVE PLC DLPH
165 DEMAND MEDIA INC. DMD
166 DEX MEDIA INC DEX
167 DHI GROUP, INC. DHX
168 DHT HOLDINGS, INC. DHT
169 DIAMOND RESORTS INTERNATIONAL, INC. DRII
170 DIAMONDROCK HOSPITALITY CO DRH
171 DIANA SHIPPING INC. DSX
172 DIGITALGLOBE, INC. DGI
173 DJO OPCO HOLDINGS, INC. DJO
174 DOLAN CO. DM
175 DOLBY LABORATORIES, INC. DLB
176 DOLE FOOD CO INC DOLE
177 DOLLAR GENERAL CORP DG
178 DOMINOS PIZZA INC DPZ
179 DOUGLAS DYNAMICS, INC PLOW
180 DOUGLAS EMMETT INC DEI
181 DRESSER-RAND GROUP INC. DRC
182 DSW INC. DSW
183 DUFF & PHELPS CORP DUF
184 DUNCAN ENERGY PARTNERS L.P. DEP
185 DUPONT FABROS TECHNOLOGY, INC. DFT
186 DYNCORP INTERNATIONAL INC. DCP
187 ECC CAPITAL CORP ECR
188 E-COMMERCE CHINA DANGDANG INC. DANG
189 EDENOR EDN
190 EDGEN GROUP INC. EDG
191 E-HOUSE (CHINA) HOLDINGS LTD EJ
192 EL PASO PIPELINE PARTNERS, L.P. EPB
28
193 ELLINGTON FINANCIAL LLC EFC
194 EMERGE ENERGY SERVICES LP EMES
195 EMERGENCY MEDICAL SERVICES L.P. EMS
196 EMERGENT CAPITAL, INC. IFT
197 EMPLOYERS HOLDINGS, INC. EIG
198 ENCORE ACQUISITION CO EAC
199 ENCORE ENERGY PARTNERS LP ENP
200 ENDURANCE SPECIALTY HOLDINGS LTD ENH
201 ENERGY CORP OF AMERICA, INC ECT
202 ENERGY TRANSFER EQUITY, L.P. ETE
203 ENERGYSOLUTIONS, INC. ES
204 ENERSYS ENS
205 ENTERPRISE GP HOLDINGS L.P. EPE
206 ENTRAVISION COMMUNICATIONS CORP EVC
207 ENVISION HEALTHCARE HOLDINGS, INC. EVHC
208 EQT MIDSTREAM PARTNERS, LP EQM
209 ESH HOSPITALITY, INC. STAY
210 ESSENT GROUP LTD. ESNT
211 EVERBANK FINANCIAL CORP EVER
212 EVERI HOLDINGS INC. GCA
213 EVERTEC, INC. EVTC
214 EXACTTARGET, INC. ET
215 EXAMWORKS GROUP, INC. EXAM
216 EXCO RESOURCES INC XCO
217 EXPRESS, INC. EXPR
218 EXPRESSJET HOLDINGS INC XJT
219 EXTRA SPACE STORAGE INC. EXR
220 FIDELITY & GUARANTY LIFE FGL
221 FIRST MERCURY FINANCIAL CORP FMR
222 FLAGSTONE REINSURANCE HOLDINGS, S.A. FSR
223 FLEETCOR TECHNOLOGIES INC FLT
224 FLEETMATICS GROUP PLC FLTX
225 FLY LEASING LTD FLY
226 FMC TECHNOLOGIES INC FTI
227 FORTRESS INVESTMENT GROUP LLC FIG
29
228 FORUM ENERGY TECHNOLOGIES, INC. FET
229 FRANK'S INTERNATIONAL N.V. FI
230 FREESCALE SEMICONDUCTOR INC FSL
231 FREESCALE SEMICONDUCTOR, LTD. FSL
232 FTD GROUP, INC. FTD
233 FUSION-IO, INC. FIO
234 FXCM INC. FXCM
235 GAFISA S.A. GFA
236 GAMESTOP HOLDINGS CORP GME
237 GASLOG LTD. GLOG
238 GATEHOUSE MEDIA, INC. GHS
239 GENERAL MOTORS CO GM
240 GENESIS HEALTHCARE, INC. SKH
241 GENESIS LEASE LTD GLS
242 GENON ENERGY, INC. RRI
243 GENPACT LTD G
244 GENWORTH FINANCIAL INC GNW
245 GIANT INTERACTIVE GROUP INC. GA
246 GIGAMON INC. GIMO
247 GLOBAL PARTNERS LP GLP
248 GLOBAL SIGNAL INC GSL
249 GNC HOLDINGS, INC. GNC
250 GOL INTELLIGENT AIRLINES INC. GOL
251 GOODMAN GLOBAL INC GGL
252 GRAHAM PACKAGING CO INC. GRM
253 GRANA & MONTERO S.A.A. GRAM
254 GREEN DOT CORP GDOT
255 GUIDEWIRE SOFTWARE, INC. GWRE
256 GUSHAN ENVIRONMENTAL ENERGY LTD GU
257 HANCOCK JOHN FINANCIAL SERVICES INC JHF
258
HANNON ARMSTRONG SUSTAINABLE INFRASTRUCTURE
CAPITAL, INC. HASI
259 HATTERAS FINANCIAL CORP HTS
260 HCA HOLDINGS, INC. HCA
261 HEALTHSPRING, INC. HS
30
262 HEARTLAND PAYMENT SYSTEMS INC HPY
263 HERBALIFE LTD. HLF
264 HERTZ GLOBAL HOLDINGS INC HTZ
265 HEWITT ASSOCIATES INC HEW
266 HFF, INC. HF
267 HHGREGG, INC. HGG
268 HI-CRUSH PARTNERS LP HCLP
269 HIGHER ONE HOLDINGS, INC. ONE
270 HIGHLAND HOSPITALITY CORP HIH
271 HILLTOP HOLDINGS INC. ARC
272 HILTON WORLDWIDE HOLDINGS INC. HLT
273 HOLLY ENERGY PARTNERS LP HEP
274 HOMEBANC CORP HMB
275 HOMEX DEVELOPMENT CORP. HXM
276 HORIZON LINES, INC. HRZ
277 HUDSON PACIFIC PROPERTIES, INC. HPP
278 HUNTSMAN CORP HUN
279 HUTCHISON TELECOMMUNICATIONS INTERNATIONAL LTD HTX
280 HYATT HOTELS CORP H
281 ICICI BANK LTD IBN
282 IGATE COMPUTER SYSTEMS LTD PTI
283 IHS INC. IHS
284 INFOBLOX INC BLOX
285 INFRASOURCE SERVICES INC IFS
286 INTEGRATED DEFENSE TECHNOLOGIES INC IDE
287 INTELSAT S.A. I
288 INTERCONTINENTAL EXCHANGE HOLDINGS, INC. ICE
289 INTERLINE BRANDS, INC./DE IBI
290 INTERNATIONAL SECURITIES EXCHANGE HOLDINGS, INC. ISE
291 INTERXION HOLDING N.V. INXN
292 INTRALINKS HOLDINGS, INC. IL
293 INTREPID POTASH, INC. IPI
294 INTREXON CORP XON
295 INVESCO MORTGAGE CAPITAL INC. IVR
296 IOWA TELECOMMUNICATIONS SERVICES INC IWA
31
297 ISOFTSTONE HOLDINGS LTD ISS
298 ITC HOLDINGS CORP. ITC
299 J CREW GROUP INC JCG
300 JACKSON HEWITT TAX SERVICE INC JTX
301 JAVELIN MORTGAGE INVESTMENT CORP. JMI
302 JONES ENERGY, INC. JONE
303 JORGENSEN EARLE M CO /DE/ JOR
304 JOURNAL COMMUNICATIONS INC JRN
305 K12 INC LRN
306 KAR AUCTION SERVICES, INC. KAR
307 KBR, INC. KBR
308 KBW, LLC. KBW
309 KINDER MORGAN KANSAS, INC. KMR
310 KINDER MORGAN, INC. KMI
311 KINETIC CONCEPTS INC KCI
312 KKR FINANCIAL CORP KFN
313 KMG AMERICA CORP KMA
314 KNOLL INC KNL
315 KNOT OFFSHORE PARTNERS LP KNOP
316 KOPPERS HOLDINGS INC. KOP
317 KOSMOS ENERGY LTD. KOS
318 KRATON PERFORMANCE POLYMERS, INC. KRA
319 LAREDO PETROLEUM, INC. LPI
320 LAS VEGAS SANDS CORP LVS
321 LAZARD LTD LAZ
322 LDK SOLAR CO., LTD. LDK
323 LEAPFROG ENTERPRISES INC LF
324 LEIDOS HOLDINGS, INC. SAI
325 LG DISPLAY CO., LTD. LPL
326 LIFE TIME FITNESS, INC. LTM
327 LIFELOCK, INC. LOCK
328 LIN TV CORP. TVL
329 LINKEDIN CORP LNKD
330 LOEWS CORP CG
331 LONE PINE RESOURCES INC. LPR
32
332 LONGTOP FINANCIAL TECHNOLOGIES LTD LFT
333 LRR ENERGY, L.P. LRE
334 LUMBER LIQUIDATORS HOLDINGS, INC. LL
335 LUMINENT MORTGAGE CAPITAL INC LUM
336 MACRO BANK INC. BMA
337 MAGELLAN MIDSTREAM HOLDINGS LP MGG
338 MAGNACHIP SEMICONDUCTOR CORP MX
339 MAIDENFORM BRANDS LLC MFB
340 MANCHESTER UNITED PLC MANU
341 MANNING & NAPIER, INC. MN
342 MANUFACTURERS SERVICES LTD MSV
343 MARIN SOFTWARE INC MRIN
344 MARINER ENERGY INC ME
345 MASTERCARD INC MA
346 MATADOR RESOURCES CO MTDR
347 MAXCOM TELECOMMUNICATIONS INC MXT
348 MEAD JOHNSON NUTRITION CO MJN
349 MECHEL PAO MTL
350 MEDIALIVE INTERNATIONAL INC KME
351 MEDICAL STAFFING NETWORK HOLDINGS INC MRN
352 METLIFE INC MET
353 MF GLOBAL HOLDINGS LTD. MF
354 MICHAEL KORS HOLDINGS LTD KORS
355 MIDCOAST ENERGY PARTNERS, L.P. MEP
356 MIDSTATES PETROLEUM COMPANY, INC. MPO
357 MILLENNIAL MEDIA INC. MM
358 MINDRAY MEDICAL INTERNATIONAL LTD MR
359 MIRANT CORP SOE
360 MISTRAS GROUP, INC. MG
361 MITTAL STEEL USA INC. ISG
362 MIX TELEMATICS LTD MIXT
363 MODEL N, INC. MODN
364 MOLYCORP, INC. MCP
365 MONSANTO CO MON
366 MONTPELIER RE HOLDINGS LTD MRH
33
367 MORTGAGEIT HOLDINGS, INC. MHL
368 MORTON'S RESTAURANT GROUP INC MRT
369 MPLX LP MPLX
370 MRC GLOBAL INC. MRC
371 MSCI INC. MXB
372 MUELLER WATER PRODUCTS, INC. MWA
373 MYKROLIS CORP MYK
374 NALCO HOLDING CO NLC
375 NATIONAL BANK HOLDINGS CORP NBHC
376 NATIONAL FINANCIAL PARTNERS CORP NFP
377 NATIONSTAR MORTGAGE HOLDINGS INC. NSM
378 NATURAL GROCERS BY VITAMIN COTTAGE, INC. NGVC
379 NAVIGATOR HOLDINGS LTD. NVGS
380 NAVIOS MARITIME ACQUISITION CORP NNA.U
381 NAVIOS MARITIME PARTNERS L.P. NMM
382 NAVTEQ CORP NVT
383 NELNET INC NNI
384 NETEZZA CORP NZ
385 NETSUITE INC N
386 NEUSTAR INC NSR
387 NEW CENTURY FINANCIAL CORP NEW
388 NEW ORIENTAL EDUCATION & TECHNOLOGY GROUP INC. EDU
389 NEW SKIES SATELLITES HOLDINGS LTD. NSE
390 NEW YORK & COMPANY, INC. NWY
391 NEWPOWER HOLDINGS INC NPW
392 NIELSEN HOLDINGS PLC NLSN
393 NIMBLE STORAGE INC NMBL
394 NISKA GAS STORAGE PARTNERS LLC NKA
395 NOAH EDUCATION HOLDINGS LTD. NED
396 NOAH HOLDINGS LTD NOAH
397 NORCRAFT COMPANIES, INC. NCFT
398 NORTHERN TIER ENERGY LP NTI
399 NORTHSTAR REALTY FINANCE CORP. NRF
400 NRG ENERGY, INC. NRG
401 NRG YIELD, INC. NYLD
34
402 NUSTAR GP HOLDINGS, LLC VEH
403 NYMEX HOLDINGS INC NMX
404 OAKTREE CAPITAL GROUP, LLC OAK
405 OASIS PETROLEUM INC. OAS
406 OCH-ZIFF CAPITAL MANAGEMENT GROUP LLC OZM
407 OCI PARTNERS LP OCIP
408 ODYSSEY RE HOLDINGS CORP ORH
409 OILTANKING PARTNERS, L.P. OILT
410 ONEBEACON INSURANCE GROUP, LTD. OB
411 ONEMAIN HOLDINGS, INC. LEAF
412 ORBITZ WORLDWIDE, INC. OWW
413 ORION POWER HOLDINGS INC ORN
414 OSG AMERICA L.P. OSP
415 OWENS CORNING OC
416 PAA NATURAL GAS STORAGE LP PNG
417 PACIFIC AIRPORT GROUP PAC
418 PANAMSAT HOLDING CORP PA
419 PANDORA MEDIA, INC. P
420 PBF ENERGY INC. PBF
421 PENN VIRGINIA GP HOLDINGS, L.P. PVG
422 PENNYMAC FINANCIAL SERVICES, INC. PFSI
423 PETROLOGISTICS LP PDH
424 PHILLIPS 66 PARTNERS LP PSXP
425 PHOENIX NEW MEDIA LTD FENG
426 PIKE CORP PEC
427 PINNACLE FOODS INC. PF
428 PIONEER SOUTHWEST ENERGY PARTNERS L.P. PSE
429 PLAINS GP HOLDINGS LP PAGP
430 PLATINUM UNDERWRITERS HOLDINGS LTD PTP
431 PLY GEM HOLDINGS INC PGEM
432 POLYPORE INTERNATIONAL, INC. PPO
433 PREMCOR INC PCO
434 PRESTIGE BRANDS HOLDINGS, INC. PBH
435 PRIMERICA, INC. PRI
436 PRINCIPAL FINANCIAL GROUP INC PFG
35
437 PROVIDENT FINANCIAL SERVICES INC PFS
438 PRUDENTIAL FINANCIAL INC PRU
439 PZENA INVESTMENT MANAGEMENT, INC. PZN
440 QEP MIDSTREAM PARTNERS, LP QEPM
441 QIAO XING MOBILE COMMUNICATION CO., LTD. QXM
442 QIHOO 360 TECHNOLOGY CO LTD QIHU
443 QIMONDA AG QI
444 QUINTILES TRANSNATIONAL HOLDINGS INC. Q
445 RACKSPACE HOSTING, INC. RAX
446 RAILAMERICA INC /DE RA
447 RE/MAX HOLDINGS, INC. RMAX
448 REALD INC. RLD
449 REALOGY HOLDINGS CORP. RLGY
450 REDDY ICE HOLDINGS INC FRZ
451 REFCO INC. RFX
452 REGAL ENTERTAINMENT GROUP RGC
453 RENESOLA LTD SOL
454 RENREN INC. RENN
455 RENTECH NITROGEN PARTNERS, L.P. RNF
456 RESTORATION HARDWARE HOLDINGS INC RH
457 RETAIL PROPERTIES OF AMERICA, INC. RPAI
458 REXFORD INDUSTRIAL REALTY, INC. REXR
459 REXNORD CORP RXN
460 RIBAPHARM INC RNA
461 RISKMETRICS GROUP INC RMG
462 ROADRUNNER TRANSPORTATION SYSTEMS, INC. RRTS
463 ROCKWOOD HOLDINGS, INC. ROC
464 ROSE ROCK MIDSTREAM, L.P. RRMS
465 ROSETTA STONE INC RST
466 ROUNDY'S, INC. RNDY
467 RSC HOLDINGS INC. RRR
468 RUCKUS WIRELESS INC RKUS
469 SAFE BULKERS, INC. SB
470 SALESFORCE.COM INC CRM
471 SANCHEZ ENERGY CORP SN
36
472 SCORPIO BULKERS INC. SALT
473 SCORPIO TANKERS INC. STNG
474 SEADRILL PARTNERS LLC SDLP
475 SEALY CORP ZZ
476 SEASPAN CORP SSW
477 SEAWORLD ENTERTAINMENT, INC. SEAS
478 SELECT MEDICAL HOLDINGS CORP SEM
479 SEMICONDUCTOR MANUFACTURING INTERNATIONAL CORP SMI
480 SENSATA TECHNOLOGIES HOLDING N.V. ST
481 SERVICENOW, INC. NOW
482 SILVERLINE TECHNOLOGIES LTD SLT
483 SIMCERE PHARMACEUTICAL GROUP SCR
484 SIRVA INC SIR
485 SOLARWINDS, INC. SWI
486 SOLERA HOLDINGS, INC SLH
487 SOUFUN HOLDINGS LTD SFUN
488 SOUTHCROSS ENERGY PARTNERS, L.P. SXE
489 SPECTRA ENERGY PARTNERS, LP SEP
490 SPIRIT AEROSYSTEMS HOLDINGS, INC. SPR
491 SPIRIT FINANCE CORPORATION SFC
492 SPIRIT REALTY CAPITAL, INC. SRC
493 SPN FAIRWAY ACQUISITION, INC. CPX
494 SPRAGUE RESOURCES LP SRLP
495 STAG INDUSTRIAL, INC. STIR
496 STEWART W P & CO LTD WPL
497 STONEGATE MORTGAGE CORP SGM
498 STR HOLDINGS, INC. STRI
499 STRATEGIC HOTELS & RESORTS, INC SLH
500 SUMMIT HOTEL PROPERTIES, INC. INN
501 SUMMIT MIDSTREAM PARTNERS, LP SMLP
502 SUNCOKE ENERGY PARTNERS, L.P. SXCP
503 SUNCOKE ENERGY, INC. SXC
504 SUNOCO LP SUSP
505 SUNSTONE HOTEL INVESTORS, INC. SHO
506 SUNTECH POWER HOLDINGS CO., LTD. STP
37
507 SWIFT TRANSPORTATION CO SWFT
508 SYMETRA FINANCIAL CORP SYA
509 SYMMETRY MEDICAL INC. SMA
510 SYNCORA HOLDINGS LTD SCA
511 SYNIVERSE HOLDINGS INC SVR
512 TABLEAU SOFTWARE INC DATA
513 TAL EDUCATION GROUP XRS
514 TAL INTERNATIONAL GROUP, INC. TAL
515 TALLGRASS ENERGY PARTNERS, LP TEP
516 TAM S.A. TAM
517 TAMINCO CORP TAM
518 TARGA RESOURCES CORP. TRGP
519 TAYLOR MORRISON HOME CORP TMHC
520 TEAM HEALTH HOLDINGS INC. TMH
521 TEAVANA HOLDINGS INC TEA
522 TEEKAY LNG PARTNERS L.P. TGP
523 TEEKAY OFFSHORE PARTNERS L.P. TOO
524 TEEKAY TANKERS LTD. TNK
525 TELKOM SA LTD TKG
526 TEMPUR SEALY INTERNATIONAL, INC. TPX
527 TERNIUM S.A. TX
528 TERRENO REALTY CORP TRNO
529 TESORO LOGISTICS LP TLLP
530 TEXTAINER GROUP HOLDINGS LTD TGH
531 THE FIRST MARBLEHEAD CORP FMD
532 THE HOWARD HUGHES CORP HHC
533 THE PHOENIX COMPANIES INC/DE PNX
534 THERMON GROUP HOLDINGS, INC. THR
535 THIRD POINT REINSURANCE LTD. TPRE
536 TILLY'S, INC. TLYS
537 TIM HORTONS INC. THI
538 TMS INTERNATIONAL CORP. TMS
539 TODCO THE
540 TRADE STREET RESIDENTIAL, INC. FMP
541 TRANSDIGM GROUP INC TDG
38
542 TRAVELERS PROPERTY CASUALTY CORP TAP'A
543 TRI POINTE GROUP, INC. TPH
544 TRIPLE-S MANAGEMENT CORP GTS
545 TRONOX INC TRX
546 TRULIA, INC. TRLA
547 TUMI HOLDINGS, INC. TUMI
548 TWITTER, INC. TWTR
549 TYCOM LTD TCM
550 U.S. SHIPPING PARTNERS L.P. USS
551 U.S. SILICA HOLDINGS, INC. SLCA
552 UCP, INC. UCP
553 UNITED DEFENSE INDUSTRIES INC UDI
554 UNIVERSAL COMPRESSION HOLDINGS INC UCO
555 UNIVERSAL TECHNICAL INSTITUTE INC UTI
556 USA COMPRESSION PARTNERS, LP USAC
557 VALERO ENERGY PARTNERS LP VLP
558 VALIDUS HOLDINGS LTD VR
559 VANGUARD HEALTH SYSTEMS INC VHS
560 VANTIV, INC. VNTV
561 VEDANTA LTD SLT
562 VEEVA SYSTEMS INC VEEV
563 VENOCO, INC. VQ
564 VERASUN ENERGY CORP VSE
565 VERIDIAN CORP VNX
566 VERIFONE SYSTEMS, INC. PAY
567 VERSO CORP VRS
568 VIASYSTEMS GROUP INC VG
569 VINCE HOLDING CORP. VNCE
570 VIOLIN MEMORY INC VMEM
571 VIRGIN MOBILE USA, INC. VM
572 VISA INC. V
573 VISTEON CORP VC
574 VITAMIN SHOPPE, INC. VSI
575 VMWARE, INC. VMW
576 VONAGE HOLDINGS CORP VG
39
577 VOYA FINANCIAL, INC. VOYA
578 W&T OFFSHORE INC WTI
579 WARNER MUSIC GROUP CORP. WMG
580 WCI COMMUNITIES INC WCI
581 WCI COMMUNITIES, INC. WCIC
582 WEIGHT WATCHERS INTERNATIONAL INC WTW
583 WELLCARE HEALTH PLANS, INC. WCG
584 WELLCHOICE INC WC
585 WESCO AIRCRAFT HOLDINGS, INC WAIR
586 WESTERN ASSET MORTGAGE CAPITAL CORP WMC
587 WESTERN GAS EQUITY PARTNERS, LP WGP
588 WESTERN GAS PARTNERS LP WES
589 WESTERN UNION CO WU
590 WESTLAKE CHEMICAL CORP WLK
591 WESTMORELAND RESOURCE PARTNERS, LP OXF
592 WESTPORT RESOURCES CORP WRC
593 WEX INC. WXS
594 WHITEWAVE FOODS CO WWAV
595 WHITING PETROLEUM CORP WHZ
596 WHITING PETROLEUM CORP WLL
597 WILLIAM LYON HOMES WLH
598 WILLIAMS PARTNERS L.P. CHKM
599 WILLIAMS PARTNERS L.P. WPZ
600 WILLIAMS PIPELINE PARTNERS L.P. WMZ
601 WILLIS TOWERS WATSON PLC WSH
602 WIPRO LTD WIT
603 WNS (HOLDINGS) LTD WNS
604 WORKDAY, INC. WDAY
605 WSP HOLDINGS LTD WH
606 WUXI PHARMATECH (CAYMAN) INC. WX
607 XERIUM TECHNOLOGIES INC XRM
608 XINYUAN REAL ESTATE CO., LTD. XIN
609 YELP INC YELP
610 YINGLI GREEN ENERGY HOLDING CO LTD YGE
611 YOUKU TUDOU INC. YOKU

40
612 ZAIS FINANCIAL CORP. ZFC
613 ZF TRW AUTOMOTIVE HOLDINGS CORP TRW
614 ZOETIS INC. ZTS