Nutrient losses through prescribed burning of aboveground litter and understorey in dry dipterocarp...
12
Nutrient losses through prescribed burning of aboveground litter and understorey in dry dipterocarp forests of different fire history Kobsak Wanthongchai a, ⁎ , Jürgen Bauhus a , Johann G. Goldammer b a Institute of Silviculture, University of Freiburg. Tennenbacherstr 4, 79085 Freiburg, Germany b Global Fire Monitoring Center, Fire Ecology Research Group, c/o University of Freiburg / United Nations University, Georges-Koehler-Allee 75, 79110 Freiburg, Germany Received 10 June 2007; received in revised form 21 October 2007; accepted 29 January 2008 Abstract Anthropogenic burning in dry dipterocarp forests has become a common practice throughout Thailand. It is feared, that too frequent fires may result in a loss of soil fertility and thus ecosystem productivity. The aim of this study was to quantify aboveground nutrient pools in fine fuels and nutrient losses during prescribed fires applied to plots of different fire frequency histories in the Huay Kha Khaeng Wildlife Sanctuary, Thailand. Fire frequency was determined from satellite images and ranged from frequent, infrequent, rare and unburned with fire occurrences of 7, 2, 1 and 0 out of the past 10 years, respectively. Element losses were calculated as the difference between nutrient pools in the fuel before burning and the post-burning residues comprising ash, charcoal, and unburned matter, which were recovered quantitatively using aluminium trays. The percent nutrient loss was highest at sites that had undergone frequent burning in the past and was lowest at infrequently burned sites. When viewed over a ten-year period, nutrient losses from a fire regime with one fire per decade had much lower losses than the more frequent fire occurrences. Frequent fires in these forests promoted a grassy understorey, and there appeared to be a positive feedback of fire frequency on nutrient losses, because the fine fuel consumption through fire was higher in the grassy understorey than in previously less frequently burned understoreys. A comparison between estimates of ecosystem nutrient inputs and fire-related losses of N, P, Ca, and K associated with burning regimes representing 7, 3, and 1 fire per decade showed that the frequent recurrence of fire will lead to a long-term depletion of P, Ca, and K, and probably also N. Owing to the relatively low fine fuel accumulation following fire, which reached a maximum of ca. 12 t ha - 1 after ca. 10 years, prescribed fires can be carried out at longer intervals such as once per decade in a safe manner to conserve nutrients on site. © 2008 Elsevier B.V. All rights reserved. Keywords: Nutrient losses; Fire frequency; Dry dipterocarp forest; Fuel loads 1. Introduction Fire is an important factor shaping many forest ecosystems around the world (Chandler et al., 1983; Brown, 2000). With the increase in human population, anthropogenic fire regimes have replaced natural fire regimes in many regions. If the frequency of fire increases, nutrient losses and shorter periods for recovery may lead to reduction in site productivity and degradation of the ecosystem. Conversely, long interval between fires or fire exclusion may result in structural and compositional changes of ecosystems and possibly an increased risk of high-intensity wildfires (Mueller-Dombois and Goldammer, 1990; DeBano et al., 1998). With regard to nutrient dynamics, nutrients can increase or decrease in response to fire, depending on the nature of each element, the burning conditions and weather conditions after burning (Raison et al., 1985a). This raises the question of how ecosystem nutrient pools are maintained and balanced in relation to different fire regimes over long periods of time. These processes are poorly understood and therefore models to predict the effects of fires on ecosystem nutrient cycles do not exist in most cases. Available online at www.sciencedirect.com Catena 74 (2008) 321 – 332 www.elsevier.com/locate/catena ⁎ Corresponding author. Tel.: +49 761 2033675; fax: +49 761 2033781. E-mail address: [email protected] (K. Wanthongchai). 0341-8162/$ - see front matter © 2008 Elsevier B.V. All rights reserved. doi:10.1016/j.catena.2008.01.003
-
Upload
uni-freiburg -
Category
Documents
-
view
1 -
download
0
Transcript of Nutrient losses through prescribed burning of aboveground litter and understorey in dry dipterocarp...
Available online at www.sciencedirect.com
321–332www.elsevier.com/locate/catena
Catena 74 (2008)
Nutrient losses through prescribed burning of aboveground litter andunderstorey in dry dipterocarp forests of different fire history
Kobsak Wanthongchai a,⁎, Jürgen Bauhus a, Johann G. Goldammer b
a Institute of Silviculture, University of Freiburg. Tennenbacherstr 4, 79085 Freiburg, Germanyb Global Fire Monitoring Center, Fire Ecology Research Group, c/o University of Freiburg / United Nations University, Georges-Koehler-Allee 75,
79110 Freiburg, Germany
Received 10 June 2007; received in revised form 21 October 2007; accepted 29 January 2008
Abstract
Anthropogenic burning in dry dipterocarp forests has become a common practice throughout Thailand. It is feared, that too frequent fires mayresult in a loss of soil fertility and thus ecosystem productivity. The aim of this study was to quantify aboveground nutrient pools in fine fuels andnutrient losses during prescribed fires applied to plots of different fire frequency histories in the Huay Kha Khaeng Wildlife Sanctuary, Thailand.Fire frequency was determined from satellite images and ranged from frequent, infrequent, rare and unburned with fire occurrences of 7, 2, 1 and 0out of the past 10 years, respectively. Element losses were calculated as the difference between nutrient pools in the fuel before burning and thepost-burning residues comprising ash, charcoal, and unburned matter, which were recovered quantitatively using aluminium trays. The percentnutrient loss was highest at sites that had undergone frequent burning in the past and was lowest at infrequently burned sites. When viewed over aten-year period, nutrient losses from a fire regime with one fire per decade had much lower losses than the more frequent fire occurrences.Frequent fires in these forests promoted a grassy understorey, and there appeared to be a positive feedback of fire frequency on nutrient losses,because the fine fuel consumption through fire was higher in the grassy understorey than in previously less frequently burned understoreys. Acomparison between estimates of ecosystem nutrient inputs and fire-related losses of N, P, Ca, and K associated with burning regimes representing7, 3, and 1 fire per decade showed that the frequent recurrence of fire will lead to a long-term depletion of P, Ca, and K, and probably also N.Owing to the relatively low fine fuel accumulation following fire, which reached a maximum of ca. 12 t ha−1 after ca. 10 years, prescribed firescan be carried out at longer intervals such as once per decade in a safe manner to conserve nutrients on site.© 2008 Elsevier B.V. All rights reserved.
Keywords: Nutrient losses; Fire frequency; Dry dipterocarp forest; Fuel loads
1. Introduction
Fire is an important factor shaping many forest ecosystemsaround the world (Chandler et al., 1983; Brown, 2000). With theincrease in human population, anthropogenic fire regimes havereplaced natural fire regimes in many regions. If the frequencyof fire increases, nutrient losses and shorter periods for recoverymay lead to reduction in site productivity and degradation of the
⁎ Corresponding author. Tel.: +49 761 2033675; fax: +49 761 2033781.E-mail address: [email protected]
(K. Wanthongchai).
0341-8162/$ - see front matter © 2008 Elsevier B.V. All rights reserved.doi:10.1016/j.catena.2008.01.003
ecosystem. Conversely, long interval between fires or fireexclusion may result in structural and compositional changes ofecosystems and possibly an increased risk of high-intensitywildfires (Mueller-Dombois and Goldammer, 1990; DeBanoet al., 1998). With regard to nutrient dynamics, nutrients canincrease or decrease in response to fire, depending on the natureof each element, the burning conditions and weather conditionsafter burning (Raison et al., 1985a). This raises the question ofhow ecosystem nutrient pools are maintained and balanced inrelation to different fire regimes over long periods of time.These processes are poorly understood and therefore models topredict the effects of fires on ecosystem nutrient cycles do notexist in most cases.
322 K. Wanthongchai et al. / Catena 74 (2008) 321–332
Fire influences both aboveground and belowground ecosys-tem nutrient cycles and processes by burning some of thevegetation layer, litter and duff, and thereby losing some nu-trients held in these ecosystem compartments (Raison, 1979;DeBano et al., 1998; Neary et al., 1999). The magnitude ofnutrient losses during and immediately after burning is depen-dent upon the interaction of fuel consumption, fire behaviour,microclimate, vegetation composition and structure, fire se-verity, fuel moisture content and fuel compactness (Raison,1979; Macadam, 1989; Kauffman et al., 1994; Neary et al.,1999). Owing to the variations in chemical properties of dif-ferent fuel types, there may be positive or negative feedbacksrelated to fire-induced vegetation changes; e.g. nutrient losseswill increase disproportionally if frequent fire leads to vege-tation with higher nutrient concentrations.
During burning, nutrients can be lost to the atmospherethrough volatilisation (gaseous form) and particulate transport(solid form). While particulates may be re-deposited on theburned site or in adjacent areas, either as dry fallout or rainfall,non-particulate losses through volatilisation are more likely torepresent permanent losses from the site (Raison et al., 1985a).After the fire, nutrients are deposited on the soil surface in ash,which may then be lost by wind or water erosion or leached intothe soil. Nutrients in the soil may also be lost through erosionor through leaching beyond the rooting zone of vegetation.Nutrients also remain in the unburned surface debris and in thesoil (Raison et al., 1985a,b; Kauffman et al., 1993; Carter andFoster, 2004). Of all nutrient loss pathways associated with fire,the atmospheric losses appear to account for the largest portion(Raison et al., 1985a). Therefore, to estimate ecosystem nutrientlosses associated with fire, it is particularly important to accountfor the losses to the atmosphere.
The effects of fire on nutrient dynamics have been ex-tensively investigated in both natural and plantation forests inboreal and temperate regions, as well as for slash-and-burnagriculture in tropical forest (Hough, 1981a; Feller, 1988;DeBano, 1990; Kauffman et al., 1993; Kauffman et al., 1994;Hughes et al., 2000; Carter and Foster, 2004; Geldenhuys andVan Wilgen, 2004; Morley et al., 2004). Losses of C, N, and Scan be relatively large due to their low volatilisation temper-atures, whereas high volatilisation temperatures for P and basecations result in their accumulation in ash (Kauffman et al.,1994). For example, Hough (1981b) found that the correlationbetween fuel consumption and element loss was high for C, N,P, S and Mg, and weaker but still significant for K, Ca and Mn.
Thailand's dry dipterocarp forests (DDF) are fire-dependentecosystems (Sabhasri et al., 1968; Kutintara, 1975) andfrequent, often annual, low-intensity fires of human origin,are common in the DDF throughout Thailand (Akaakara, 2000).Fires are commonly ignited to facilitate land clearing, huntingand gathering of non-timber forest products etc. Burningusually occurs during the dry season (January to April) afterthe deciduous overstorey has shed its leaves and the grasses andother understorey vegetation have desiccated. Fine fuel loads inDDF range from 5 to 10 Mg ha−1 (Goldammer, 1991) andcontain substantial amounts of nutrients, in particular in leavelitter (Sahunalu et al., 1984). However, some of Thailand's
DDFs are in national parks and wildlife sanctuaries, where fireis commonly suppressed or excluded. In addition, publicconcern over air quality has led to an increase in fire preventionand suppression programs in all forests including DDFs.Natural fire regimes in DDF have thus been highly modifiedby human activity, possibly leading to both, too frequent and tooinfrequent fires in different parts of the landscape.
While frequent burning may deplete nutrient pools and re-duce productivity, infrequent burning or fire exclusion increasesthe risk of high-intensity wildfire and promotes the gradualreplacement of the DDF ecosystem by a more aggressive, lessfire-tolerant, and often less desirable ecosystem. An appropriateburning frequency is necessary to maintain species composi-tion and ecological functions in the DDF. However, to date, noattempt has been made to develop and apply appropriate burningpractices or to develop a knowledge base to develop suchpractices. In addition, aboveground nutrient dynamics in DDF inrelation to past burning regimes and hence different fine fuelloads and types have not been investigated in Thailand. In thispaper, we quantified aboveground nutrient pools and lossesduring and after prescribed fires applied to plots that haveexperienced in the past 10 years different fire frequencies inDDF at Huay Kha KhaengWildlife Sanctuary (HKK), Thailand.Specifically, our hypotheses were:
1. Fire intensity and associated nutrient losses during pre-scribed burning increase with the time since the last fire.
2. Relative nutrient losses from fine fuels are influenced by thetype of fine fuel. Therefore there may be interactions be-tween the fire frequency and the percent of nutrients lostfrom fine fuels, if the past fire frequency influences vege-tation composition.
3. The short- to medium-term post-fire accumulation of finefuel mass and nutrients decreases with time. Therefore, overthe same time, frequent fires lead to higher nutrient lossesthan rare fires, even if the latter are of higher intensity.
Addressing these hypotheses, we aimed to determine aninterval length between fires that would provide a compromisebetween the aim to maintain low levels of fine fuels that will notsupport high severity fires and potential nutrient losses asso-ciated with burning.
2. Material and methods
2.1. Study area
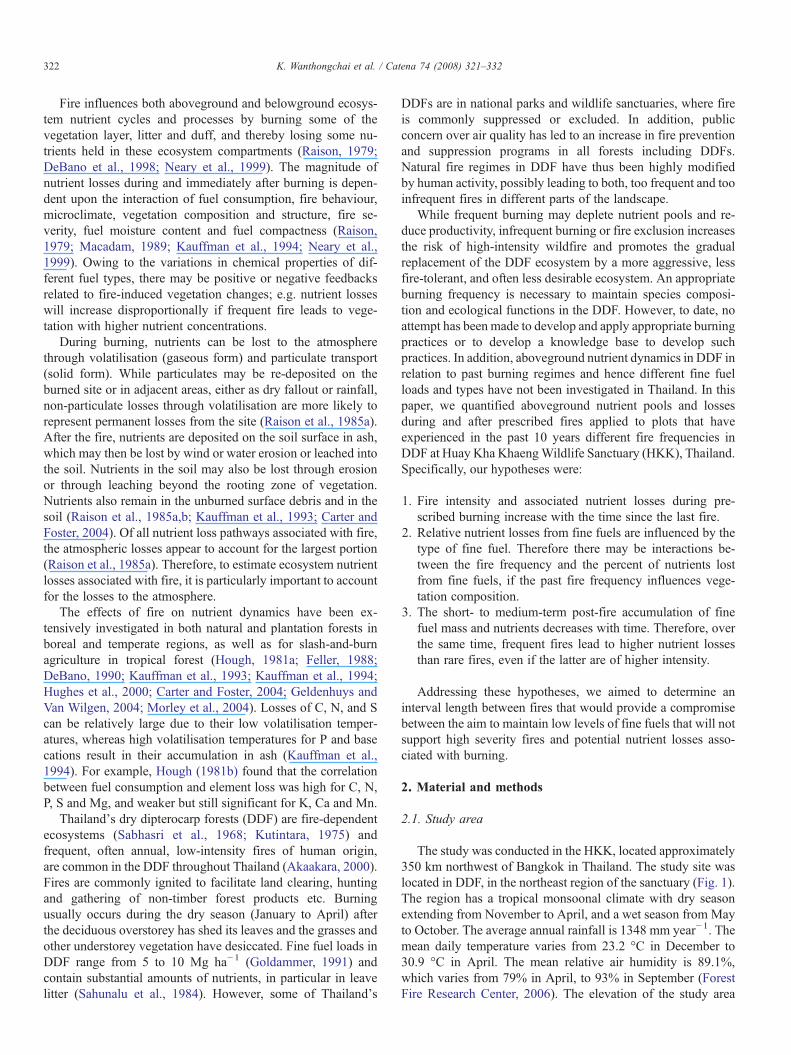
The study was conducted in the HKK, located approximately350 km northwest of Bangkok in Thailand. The study site waslocated in DDF, in the northeast region of the sanctuary (Fig. 1).The region has a tropical monsoonal climate with dry seasonextending from November to April, and a wet season from Mayto October. The average annual rainfall is 1348 mm year−1. Themean daily temperature varies from 23.2 °C in December to30.9 °C in April. The mean relative air humidity is 89.1%,which varies from 79% in April, to 93% in September (ForestFire Research Center, 2006). The elevation of the study area
Fig. 1. Location of the Huay Kha Khaeng Wildlife Sanctuary (HKK) in Thailand.
323K. Wanthongchai et al. / Catena 74 (2008) 321–332
ranges from 300–400 m a.s.l. The DDF is dominated by thedeciduous tree species belonging to the Dipterocarpaceae, suchas Shorea obtusa, S. siamensis, Dipterocarpus tuberculatus,and to the Leguminosae, such as Xylia kerrii and Sindorasiamensis. The understorey consists mainly of a grass layerdominated by Heteropogon contortus and Imperata cylindricaas well as other shrubs, herbs, and saplings and seedlings ofoverstorey tree species (Forest Research Center, 1997).
2.2. Fire history reconstruction
The past burning regime (burning history) was reconstructedfor the study area by mapping burned areas using fire re-ports from the National Park, Wildlife and Plant ConservationDepartment, and a series of satellite images spanning a 10-yearperiod from 1995 to 2004. As a result, 4 different burninghistories were identified. These included fire frequencies of 7, 2,1 and 0 fires over the past 10 years, which are subsequentlyreferred to as frequent (FB), infrequent (IB), rare (RB) andunburned (CB) respectively. The times since last fire in relationto these burning regimes were 1, 3, 7, and 10 years for FB, IB,RB, and CB respectively.
For experimental purposes, three replicate plots were estab-lished for each burning regime. It was not possible to replicatepatches of the same fire frequency and time since last fire in thelandscape, so that treatments were not interspersed in space.Therefore the plots represent pseudoreplications (Hurlbert,1984) of the same fire event and history. However, withineach treatment, plots were approximately 300–500 m apart.Within the mapped areas of different fire frequencies, all plotswere selected to represent the same geologic parent material,soil unit, and forest type. They were also located at similarelevation and topography.
2.3. Experimental burning
Prior to burning, 3 experimental plots of 50×50 m, con-taining an inner 30×30 m plot for measurements were set up ineach treatment. Fuel breaks were set up outside the 50×50 mplot and forest fire control equipment was prepared by theForest Fire Research Center staff to prevent an accidental forestfire. With the exception of the unburned area (CB), experi-mental burning was carried out in nine plots during the periodfrom 28th December 2004 to 9th January 2005, which wasearlier than the normal peak of the dry season. However, theunusually dry conditions during the year 2004 resulted in anearlier beginning of the dry season. The total rainfall in the year2004 was only 996.4 mm compared to 1332.9 and 1453.7 mmfor the years 2003 and 2005 respectively (Forest Fire ResearchCenter, 2006). In addition, the vegetation had shed its leaves,and the litter was dry enough to sustain a fire. Burning experi-ments took place between 1 and 6 p.m., when air humidity waslowest, using a three-strip (3 strips of ca. 16 m width) burningtechnique. To assure an even fire front, four people ignited thefire simultaneously in each strip.
Prior to burning, one set of 2 m tall iron stakes with heightsmarked at 0.5 m intervals were placed at 5 m distance andperpendicular to the fire front to estimate the rate of fire spreadand flame height (Fig. 2). The rate of fire spread was estimatedas the average time of fire progress between iron stakes asdescribed by Rothermel and Deeming (1980). Flame height wasrecorded by taking photographs. Fire temperature at 20 and50 cm height above ground was measured at 5 locations foreach strip using a Spot Infrared Thermometer (MINOLTA TA-510). Ambient soil temperature of four different depths (1, 2, 5,and 10 cm below the surface) was recorded for 15 points perplot (5 points per strip) using thermometers (TESTO-926) 5 min
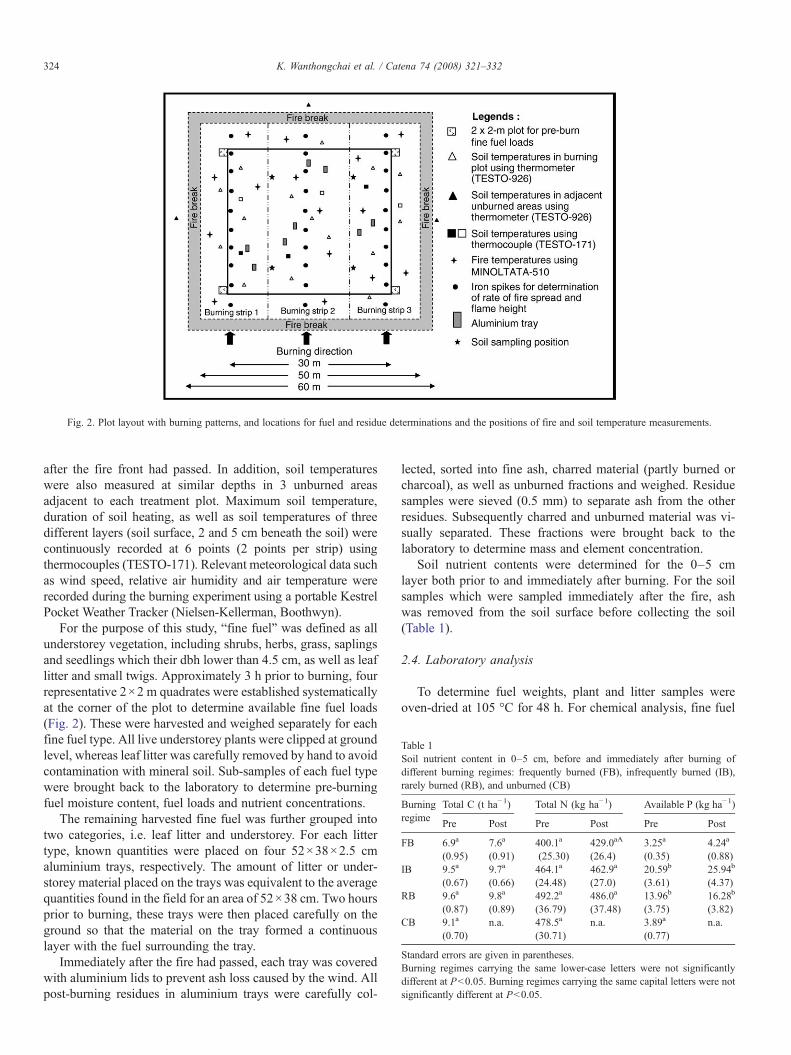
Table 1Soil nutrient content in 0–5 cm, before and immediately after burning ofdifferent burning regimes: frequently burned (FB), infrequently burned (IB),rarely burned (RB), and unburned (CB)
Burningregime
Total C (t ha−1) Total N (kg ha−1) Available P (kg ha−1)
Pre Post Pre Post Pre Post
FB 6.9a
(0.95)7.6a
(0.91)400.1a
(25.30)429.0aA
(26.4)3.25a
(0.35)4.24a
(0.88)IB 9.5a
(0.67)9.7a
(0.66)464.1a
(24.48)462.9a
(27.0)20.59b
(3.61)25.94b
(4.37)RB 9.6a
(0.87)9.8a
(0.89)492.2a
(36.79)486.0a
(37.48)13.96b
(3.75)16.28b
(3.82)CB 9.1a
(0.70)n.a. 478.5a
(30.71)n.a. 3.89a
(0.77)n.a.
Standard errors are given in parentheses.Burning regimes carrying the same lower-case letters were not significantlydifferent at Pb0.05. Burning regimes carrying the same capital letters were notsignificantly different at Pb0.05.
Fig. 2. Plot layout with burning patterns, and locations for fuel and residue determinations and the positions of fire and soil temperature measurements.
324 K. Wanthongchai et al. / Catena 74 (2008) 321–332
after the fire front had passed. In addition, soil temperatureswere also measured at similar depths in 3 unburned areasadjacent to each treatment plot. Maximum soil temperature,duration of soil heating, as well as soil temperatures of threedifferent layers (soil surface, 2 and 5 cm beneath the soil) werecontinuously recorded at 6 points (2 points per strip) usingthermocouples (TESTO-171). Relevant meteorological data suchas wind speed, relative air humidity and air temperature wererecorded during the burning experiment using a portable KestrelPocket Weather Tracker (Nielsen-Kellerman, Boothwyn).
For the purpose of this study, “fine fuel” was defined as allunderstorey vegetation, including shrubs, herbs, grass, saplingsand seedlings which their dbh lower than 4.5 cm, as well as leaflitter and small twigs. Approximately 3 h prior to burning, fourrepresentative 2×2 m quadrates were established systematicallyat the corner of the plot to determine available fine fuel loads(Fig. 2). These were harvested and weighed separately for eachfine fuel type. All live understorey plants were clipped at groundlevel, whereas leaf litter was carefully removed by hand to avoidcontamination with mineral soil. Sub-samples of each fuel typewere brought back to the laboratory to determine pre-burningfuel moisture content, fuel loads and nutrient concentrations.
The remaining harvested fine fuel was further grouped intotwo categories, i.e. leaf litter and understorey. For each littertype, known quantities were placed on four 52×38×2.5 cmaluminium trays, respectively. The amount of litter or under-storey material placed on the trays was equivalent to the averagequantities found in the field for an area of 52×38 cm. Two hoursprior to burning, these trays were then placed carefully on theground so that the material on the tray formed a continuouslayer with the fuel surrounding the tray.
Immediately after the fire had passed, each tray was coveredwith aluminium lids to prevent ash loss caused by the wind. Allpost-burning residues in aluminium trays were carefully col-
lected, sorted into fine ash, charred material (partly burned orcharcoal), as well as unburned fractions and weighed. Residuesamples were sieved (0.5 mm) to separate ash from the otherresidues. Subsequently charred and unburned material was vi-sually separated. These fractions were brought back to thelaboratory to determine mass and element concentration.
Soil nutrient contents were determined for the 0–5 cmlayer both prior to and immediately after burning. For the soilsamples which were sampled immediately after the fire, ashwas removed from the soil surface before collecting the soil(Table 1).
2.4. Laboratory analysis
To determine fuel weights, plant and litter samples wereoven-dried at 105 °C for 48 h. For chemical analysis, fine fuel
Table 2Pre-burning fuel loads and fuel consumption at frequently burned (FB),infrequently burned (IB), rarely burned (RB), and unburned (CB) sites
Fuel category Burning regime
FB IB RB CB
Saplings (kg ha−1) 92.6a
(72.0)1312.8b
(466.6)2282.5b,c
(709.3)2974.7c
(566.7)Seedlings (kg ha−1) 214.2a
(49.7)238.2a
(96.8)154.3a
(69.1)381.7a
(87.3)Shrubs (kg ha−1) 21.1a
(13.6)204.9b
(66.4)90.9b
(30.7)289.8b
(129.8)Herbs (kg ha−1) 173.7a
(47.4)147.1a
(34.7)564.3a
(279.3)71.3b
(48.9)Grass (kg ha−1) 947.2a
(135.2)323.3b
(54.3)236.0b
(61.3)85.9c
(11.5)Litter (kg ha−1) 3622.3a
(317.0)6689.4b
(631.4)8237.8b,c
(699.5)8442.8c
(569.7)Total fuel loading (t ha−1) 5.1a
(0.4)8.9b
(1.0)11.6c
(0.9)12.2c
(0.9)Fuel consumption (%) 84 65 70 n.a.
Litter 87 78 84Understorey 81 51 57
Standard errors are given in parentheses.Different letters (a, b, c) indicate significant differences between burningregimes for a given fuel category; ANOVA, Pb0.05, followed by Duncan'smultiple range test.
325K. Wanthongchai et al. / Catena 74 (2008) 321–332
and post-burning residue samples were oven-dried at 60 °C for24 h. Samples were finely ground and analysed for total N, P, K,Ca, Mg, S, C and Mn. Total C and N were determined by drycombustion using an automated C/N-analyzer (Truspec CN,LECO). The other elements were determined by InductivelyCoupled Plasma spectrometer (ICP) following a wet digestion(pressurized digestion with HNO3) of the organic material. Fordigestion 100–200 mg of the sample was mixed with 2 ml of65% HNO3 in Teflon vessels, which were subsequently placedinto an aluminium chamber. These chambers were then placed
Table 3Element concentrations in each fine fuel type in pre-burning samples
Fuel type Element concentration
C(mg g−1)
N(mg g−1)
Ca(mg g−1)
K(mg g−
Grass 46.6a
(0.2)0.4a
(0.0)2.5a
(0.2)13.2c
(0.7)Herbs 46.8a
(0.2)0.8cd
(0.1)8.0b
(0.6)11.5c
(1.0)Litter 48.3bc
(0.6)0.6bc
(0.0)13.1d
(1.0)4.8a
(0.5)Saplings 47.0ab
(0.4)0.6ab
(0.0)10.7c
(0.8)7.7b
(0.8)Seedlings 47.9abc
(0.5)0.7bc
(0.1)10.1c
(0.9)6.1ab
(0.9)Shrubs 49.0c
(0.4)0.9d
(0.1)7.3b
(0.5)6.8ab
(1.3)df 5 5 5 5F 5.198 9.744 26.838 13.028P-value 0.001 0.000 0.000 0.000
Standard errors are given in parentheses.Different letters (a, b, c) within columns indicate significant differences between fuerange test.
in the oven at 190 °C overnight. The digested solution wasfiltered, and the residue left over on the filter paper was furthercombusted at 850 °C for 4 h in a furnace to determine silicamass.
2.5. Calculations and statistics
The transfer of elements to the atmosphere during burningwas calculated as the difference between the quantities ofelements initially contained in the litter and undergrowth (pre-burned) and the quantities recovered in the post-burnedresidues. Analysis of variance (ANOVA) followed by Duncan'smultiple range test were used to test for significant differencesin nutrient concentrations and pools among different burningregimes. In addition, paired-sample T-tests were used toascertain the effect of burning on nutrient losses within eachburning regime. Relationships between nutrient concentrations,pools and losses with selected fire behaviour parameters, andsoil temperature were investigated using Pearson's correlationcoefficient. All statistical computations were carried out usingSPSS® 13.0 for Windows (SPSS Inc., 2005).
3. Results
3.1. Pre-burning fine fuel loads and post-burning residues
Total fuel loads differed significantly between the sitescharacterised by four different fire regimes. The total fuel loadswere similarly high in the rarely burned (RB) (11.6 t ha−1) andcontrol (CB) (12.2 t ha−1) sites, whereas they were substantiallylower at the infrequently (IB) and frequently burned (FB) sites,reaching 8.9 and 5.1 t ha−1 respectively (Table 2). The sites withdifferent burning histories differed also in the composition offine fuels. At frequently burned sites, grass contributed 947 kgha−1 to the fine fuel load, while it amounted to only 236 and
1)Mg(mg g−1)
Mn(mg g−1)
P(mg g−1)
S(mg g−1)
1.3a
(0.0)0.1a
(0.0)1.0a
(0.1)0.4a
(0.0)2.6b
(0.1)0.1a
(0.0)1.3a
(0.2)0.7b
(0.1)2.7b
(0.2)0.3b
(0.0)0.9a
(0.2)0.6b
(0.0)2.3b
(0.3)0.1a
(0.0)1.0a
(0.2)0.6b
(0.1)2.4b
(0.2)0.1a
(0.0)1.2a
(0.2)0.7b
(0.0)1.6a
(0.2)0.1a
(0.0)0.8a
(0.1)0.6ab
(0.1)5 5 5 510.502 10.346 1.079 2.6860.000 0.000 0.384 0.032
l types for a given element; ANOVA, Pb0.05, followed by Duncan's multiple
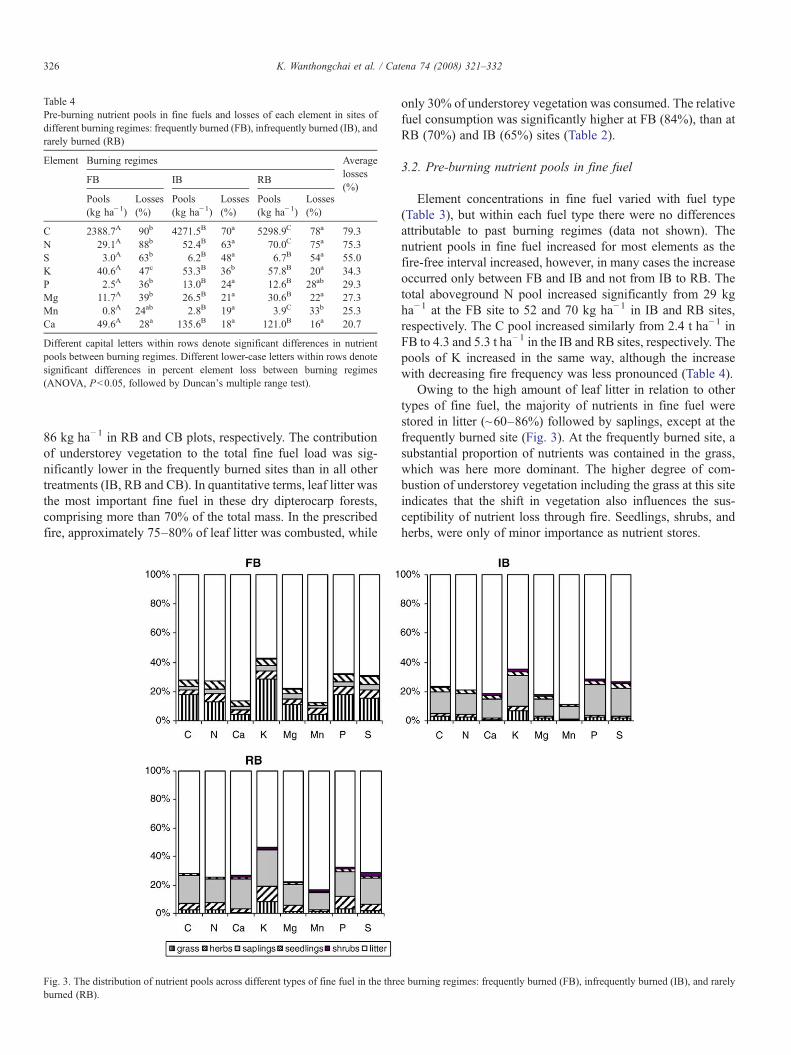
Table 4Pre-burning nutrient pools in fine fuels and losses of each element in sites ofdifferent burning regimes: frequently burned (FB), infrequently burned (IB), andrarely burned (RB)
Element Burning regimes Averagelosses(%)
FB IB RB
Pools(kg ha−1)
Losses(%)
Pools(kg ha−1)
Losses(%)
Pools(kg ha−1)
Losses(%)
C 2388.7A 90b 4271.5B 70a 5298.9C 78a 79.3N 29.1A 88b 52.4B 63a 70.0C 75a 75.3S 3.0A 63b 6.2B 48a 6.7B 54a 55.0K 40.6A 47c 53.3B 36b 57.8B 20a 34.3P 2.5A 36b 13.0B 24a 12.6B 28ab 29.3Mg 11.7A 39b 26.5B 21a 30.6B 22a 27.3Mn 0.8A 24ab 2.8B 19a 3.9C 33b 25.3Ca 49.6A 28a 135.6B 18a 121.0B 16a 20.7
Different capital letters within rows denote significant differences in nutrientpools between burning regimes. Different lower-case letters within rows denotesignificant differences in percent element loss between burning regimes(ANOVA, Pb0.05, followed by Duncan's multiple range test).
326 K. Wanthongchai et al. / Catena 74 (2008) 321–332
86 kg ha−1 in RB and CB plots, respectively. The contributionof understorey vegetation to the total fine fuel load was sig-nificantly lower in the frequently burned sites than in all othertreatments (IB, RB and CB). In quantitative terms, leaf litter wasthe most important fine fuel in these dry dipterocarp forests,comprising more than 70% of the total mass. In the prescribedfire, approximately 75–80% of leaf litter was combusted, while
Fig. 3. The distribution of nutrient pools across different types of fine fuel in the threburned (RB).
only 30% of understorey vegetation was consumed. The relativefuel consumption was significantly higher at FB (84%), than atRB (70%) and IB (65%) sites (Table 2).
3.2. Pre-burning nutrient pools in fine fuel
Element concentrations in fine fuel varied with fuel type(Table 3), but within each fuel type there were no differencesattributable to past burning regimes (data not shown). Thenutrient pools in fine fuel increased for most elements as thefire-free interval increased, however, in many cases the increaseoccurred only between FB and IB and not from IB to RB. Thetotal aboveground N pool increased significantly from 29 kgha−1 at the FB site to 52 and 70 kg ha−1 in IB and RB sites,respectively. The C pool increased similarly from 2.4 t ha−1 inFB to 4.3 and 5.3 t ha−1 in the IB and RB sites, respectively. Thepools of K increased in the same way, although the increasewith decreasing fire frequency was less pronounced (Table 4).
Owing to the high amount of leaf litter in relation to othertypes of fine fuel, the majority of nutrients in fine fuel werestored in litter (~60–86%) followed by saplings, except at thefrequently burned site (Fig. 3). At the frequently burned site, asubstantial proportion of nutrients was contained in the grass,which was here more dominant. The higher degree of com-bustion of understorey vegetation including the grass at this siteindicates that the shift in vegetation also influences the sus-ceptibility of nutrient loss through fire. Seedlings, shrubs, andherbs, were only of minor importance as nutrient stores.
e burning regimes: frequently burned (FB), infrequently burned (IB), and rarely
Table 6Average resident time (min) of different heat levels from thermocouple data atdifferent soil locations in each burning regime; frequently burned (FB),infrequently burned (IB), and rarely burned (RB)
Heatlevels
Measurementlocation
Burning regime
FB (min) IB (min) RB (min)
N60 °C Ground level 8a 12a,b 14b
2-cm belowground 1a 1a b1a
N80 °C Ground level 4a 7b 7b
2-cm belowground b1a b1a 0a
N100 °C Ground level 3a 5b 5b
2-cm belowground 0a b1a 0a
Standard errors are given in parentheses.Burning regimes carrying the same lower-case letters were not significantlydifferent at Pb0.05.
327K. Wanthongchai et al. / Catena 74 (2008) 321–332
3.3. Fire intensity, fire and soil temperature during prescribedburning
Fuel moisture content of each fine fuel type at 3 h beforeburning was lowest for leaf litter (~15%), followed by grass(~22%), shrubs (~45%), herbs (~51%), saplings (~85%), and itwas highest for seedlings (~93%). Fire temperatures increasedsignificantly (Pb0.01) with the length of the fire-free interval ofthe site (Table 5). Fire behaviour descriptors such as the rate ofspread, flame height, and fireline intensity were not signifi-cantly different between past burning regimes, although theytended to be highest at IB plots. Also maximum soil tem-peratures at ground level, and at 2 and 5 cm soil depths were notsignificantly different between past burning regimes and neverexceeded 400 °C. The duration of heating N60 °C at groundlevel was obviously the longest (Pb0.05) for the RB site(~14 min), followed by the IB site (~12 min), and the FB site(~8 min) (Table 6). However, the duration of heating above anygiven critical temperature threshold at 2 and 5 cm soil depthswere generally less than 1 min.
3.4. Nutrients retained in post-burning fine fuel residues
To characterise the residues following burning, the initialclassification of fine fuel types needed to be expanded. Residueswere further classified into ash, charred material and unburnedmaterial. The element concentrations in residues differed be-tween sites of different burning regimes. Concentrations of mostnutrients in the ash and charred material, in particular of N,Mn, and P, were significantly lower at FB than at less fre-quently burned sites (IB and RB). In contrast, K concentrationsin charred material were significantly lower at less frequentlythan at frequently burned sites.
Regardless of the origin of fuel type and burning regime, Cand N contents in ash were significantly lower than in the otherresidue types (Table 7). The concentrations of Ca, K, Mg, Mn, P
Table 5Quantitative fire behaviour characteristics, and fire and soil temperaturesrecorded from experimental fires applied to different burning regimes:frequently burned (FB), infrequently burned (IB), and rarely burned (RB)
Fire behaviour descriptorsand maximum fire and soiltemperature
Burning regime
FB IB RB
Rate of spread (m min−1) 2.7a (1.0) 2.6a (0.3) 1.3b (0.2)Flame height (m) 1.2a (0.1) 1.5a (0.7) 1.2a (0.1)Fireline intensity (kW m−1) 361.1a (149.9) 466.8a (61.5) 291.2a (43.1)Fire temperature at 20-cm
aboveground (°C)423a (20.9) 593b (12.2) 671c (10.6)
Soil temperature at groundlevel (°C)
329.5a (26.8) 261.2a (30.5) 279.9a (31.0)
Soil temperature at 2-cmbelowground (°C)
50.1a (3.9) 52.8a (6.6) 47.2a (1.6)
Soil temperature at 5-cmbelowground (°C)
38.7a (1.2) 38.9a (1.3) 38.3a (1.0)
Standard errors are given in parentheses.Burning regimes carrying the same lower-case letters were not significantlydifferent at Pb0.05.
and S dramatically increased in the ash, where they were 2–12times higher than in charred and unburned material (data notshown). As a result, the highest content of these elements inthe residues was found in ash. Owing to the increase in ele-ment concentrations in ash and charred material, nutrients losseswere disproportionably low when compared to the percent fuelconsumption.
3.5. Nutrient losses
Burning resulted in a significant reduction in the pools ofall nutrients, however, the degree of loss varied between pastburning regimes, largely owing to the differences in fuel typesthat had developed under different past fire frequencies. Themost substantial reductions in element pools occurred for C andN, which were on average 79 and 75%, respectively (Table 4).After burning, most of the Ca, K, Mg, Mn, P and S in residueswere contained in ash, while most C and N was found in charredand unburned material (Table 7).
The total amounts of nutrients lost through burning increasedwith the length of the fire-free interval before burning, exceptfor Ca and K. However, with the exception of Mn, the relativeloss of elements was always highest at the sites that had un-dergone frequent burning in the past (Table 4). The magnitudeof relative nutrients losses was related to the relative fuel con-sumption, which increased in the following order: FBNRBN IB.Owing to the dominance of litter in the fine fuel, losses of mostnutrients were largely caused by combustion of litter rather thanunderstorey vegetation. Regardless of fuel type and burningregime, the magnitude of element losses in this study followedthe order: CNNNSNKNPNMgNMnNCa.
Positive linear correlations between relative fuel consump-tion and relative element losses were particularly close for C(r=0.946, Pb0.01), N (r=0.913, Pb0.01) and S (r=0.736,Pb0.01) (Table 8). This suggests that percent loss of C, N,and S can be estimated from the percent fuel combustion.Further, we detected positive correlations between fire tem-perature and element losses, in particularly for C (r=0.762,Pb0.01), N (r=0.697, Pb0.01), S (r=0.612, Pb0.01) and P(r=0.556, Pb0.01). In contrast, fire behaviour descriptors such
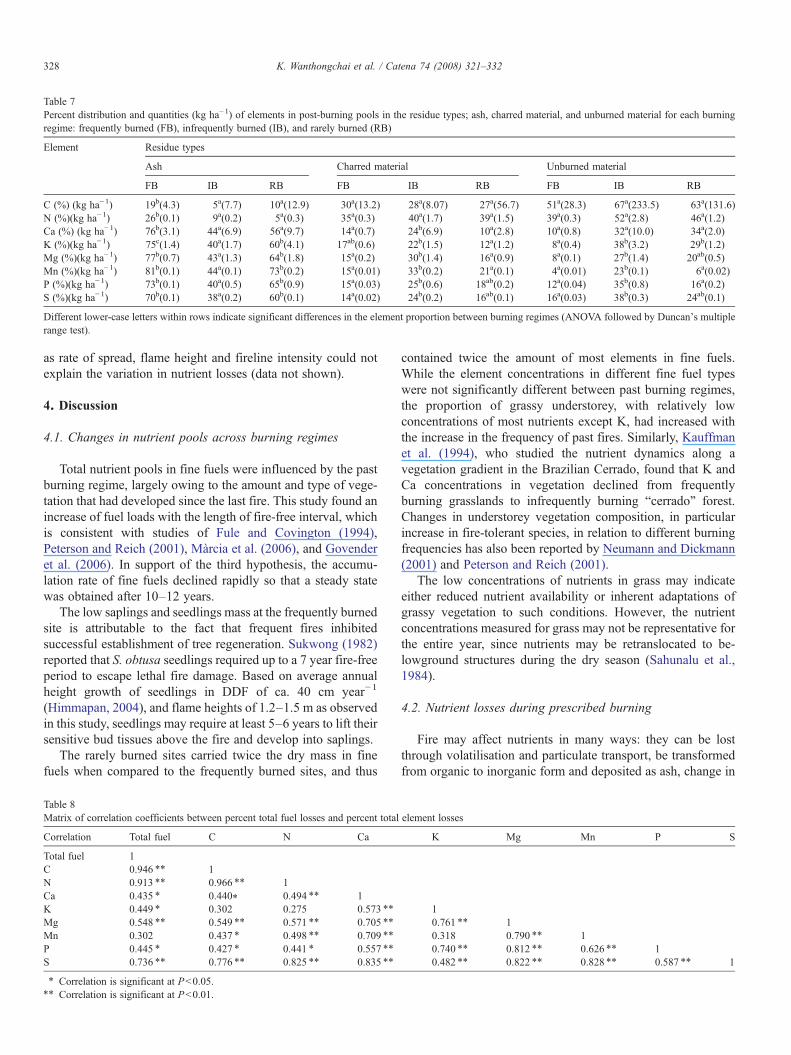
Table 7Percent distribution and quantities (kg ha−1) of elements in post-burning pools in the residue types; ash, charred material, and unburned material for each burningregime: frequently burned (FB), infrequently burned (IB), and rarely burned (RB)
Element Residue types
Ash Charred material Unburned material
FB IB RB FB IB RB FB IB RB
C (%) (kg ha−1) 19b(4.3) 5a(7.7) 10a(12.9) 30a(13.2) 28a(8.07) 27a(56.7) 51a(28.3) 67a(233.5) 63a(131.6)N (%)(kg ha−1) 26b(0.1) 9a(0.2) 5a(0.3) 35a(0.3) 40a(1.7) 39a(1.5) 39a(0.3) 52a(2.8) 46a(1.2)Ca (%) (kg ha−1) 76b(3.1) 44a(6.9) 56a(9.7) 14a(0.7) 24b(6.9) 10a(2.8) 10a(0.8) 32a(10.0) 34a(2.0)K (%)(kg ha−1) 75c(1.4) 40a(1.7) 60b(4.1) 17ab(0.6) 22b(1.5) 12a(1.2) 8a(0.4) 38b(3.2) 29b(1.2)Mg (%)(kg ha−1) 77b(0.7) 43a(1.3) 64b(1.8) 15a(0.2) 30b(1.4) 16a(0.9) 8a(0.1) 27b(1.4) 20ab(0.5)Mn (%)(kg ha−1) 81b(0.1) 44a(0.1) 73b(0.2) 15a(0.01) 33b(0.2) 21a(0.1) 4a(0.01) 23b(0.1) 6a(0.02)P (%)(kg ha−1) 73b(0.1) 40a(0.5) 65b(0.9) 15a(0.03) 25b(0.6) 18ab(0.2) 12a(0.04) 35b(0.8) 16a(0.2)S (%)(kg ha−1) 70b(0.1) 38a(0.2) 60b(0.1) 14a(0.02) 24b(0.2) 16ab(0.1) 16a(0.03) 38b(0.3) 24ab(0.1)
Different lower-case letters within rows indicate significant differences in the element proportion between burning regimes (ANOVA followed by Duncan's multiplerange test).
328 K. Wanthongchai et al. / Catena 74 (2008) 321–332
as rate of spread, flame height and fireline intensity could notexplain the variation in nutrient losses (data not shown).
4. Discussion
4.1. Changes in nutrient pools across burning regimes
Total nutrient pools in fine fuels were influenced by the pastburning regime, largely owing to the amount and type of vege-tation that had developed since the last fire. This study found anincrease of fuel loads with the length of fire-free interval, whichis consistent with studies of Fule and Covington (1994),Peterson and Reich (2001), Màrcia et al. (2006), and Govenderet al. (2006). In support of the third hypothesis, the accumu-lation rate of fine fuels declined rapidly so that a steady statewas obtained after 10–12 years.
The low saplings and seedlings mass at the frequently burnedsite is attributable to the fact that frequent fires inhibitedsuccessful establishment of tree regeneration. Sukwong (1982)reported that S. obtusa seedlings required up to a 7 year fire-freeperiod to escape lethal fire damage. Based on average annualheight growth of seedlings in DDF of ca. 40 cm year−1
(Himmapan, 2004), and flame heights of 1.2–1.5 m as observedin this study, seedlings may require at least 5–6 years to lift theirsensitive bud tissues above the fire and develop into saplings.
The rarely burned sites carried twice the dry mass in finefuels when compared to the frequently burned sites, and thus
Table 8Matrix of correlation coefficients between percent total fuel losses and percent total
Correlation Total fuel C N Ca
Total fuel 1C 0.946 ⁎⁎ 1N 0.913 ⁎⁎ 0.966 ⁎⁎ 1Ca 0.435 ⁎ 0.440⁎ 0.494 ⁎⁎ 1K 0.449 ⁎ 0.302 0.275 0.573 ⁎⁎
Mg 0.548 ⁎⁎ 0.549 ⁎⁎ 0.571 ⁎⁎ 0.705 ⁎⁎
Mn 0.302 0.437 ⁎ 0.498 ⁎⁎ 0.709 ⁎⁎
P 0.445 ⁎ 0.427 ⁎ 0.441 ⁎ 0.557 ⁎⁎
S 0.736 ⁎⁎ 0.776 ⁎⁎ 0.825 ⁎⁎ 0.835 ⁎⁎
⁎ Correlation is significant at Pb0.05.⁎⁎ Correlation is significant at Pb0.01.
contained twice the amount of most elements in fine fuels.While the element concentrations in different fine fuel typeswere not significantly different between past burning regimes,the proportion of grassy understorey, with relatively lowconcentrations of most nutrients except K, had increased withthe increase in the frequency of past fires. Similarly, Kauffmanet al. (1994), who studied the nutrient dynamics along avegetation gradient in the Brazilian Cerrado, found that K andCa concentrations in vegetation declined from frequentlyburning grasslands to infrequently burning “cerrado” forest.Changes in understorey vegetation composition, in particularincrease in fire-tolerant species, in relation to different burningfrequencies has also been reported by Neumann and Dickmann(2001) and Peterson and Reich (2001).
The low concentrations of nutrients in grass may indicateeither reduced nutrient availability or inherent adaptations ofgrassy vegetation to such conditions. However, the nutrientconcentrations measured for grass may not be representative forthe entire year, since nutrients may be retranslocated to be-lowground structures during the dry season (Sahunalu et al.,1984).
4.2. Nutrient losses during prescribed burning
Fire may affect nutrients in many ways: they can be lostthrough volatilisation and particulate transport, be transformedfrom organic to inorganic form and deposited as ash, change in
element losses
K Mg Mn P S
10.761 ⁎⁎ 10.318 0.790 ⁎⁎ 10.740 ⁎⁎ 0.812 ⁎⁎ 0.626 ⁎⁎ 10.482 ⁎⁎ 0.822 ⁎⁎ 0.828 ⁎⁎ 0.587 ⁎⁎ 1
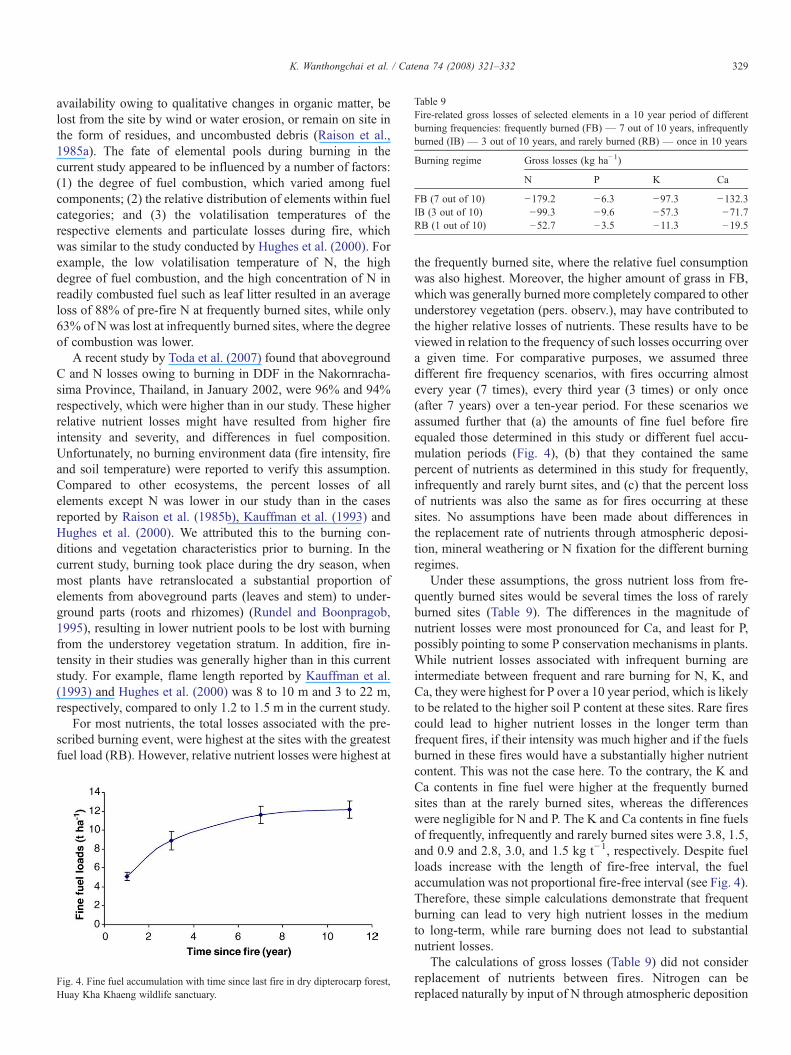
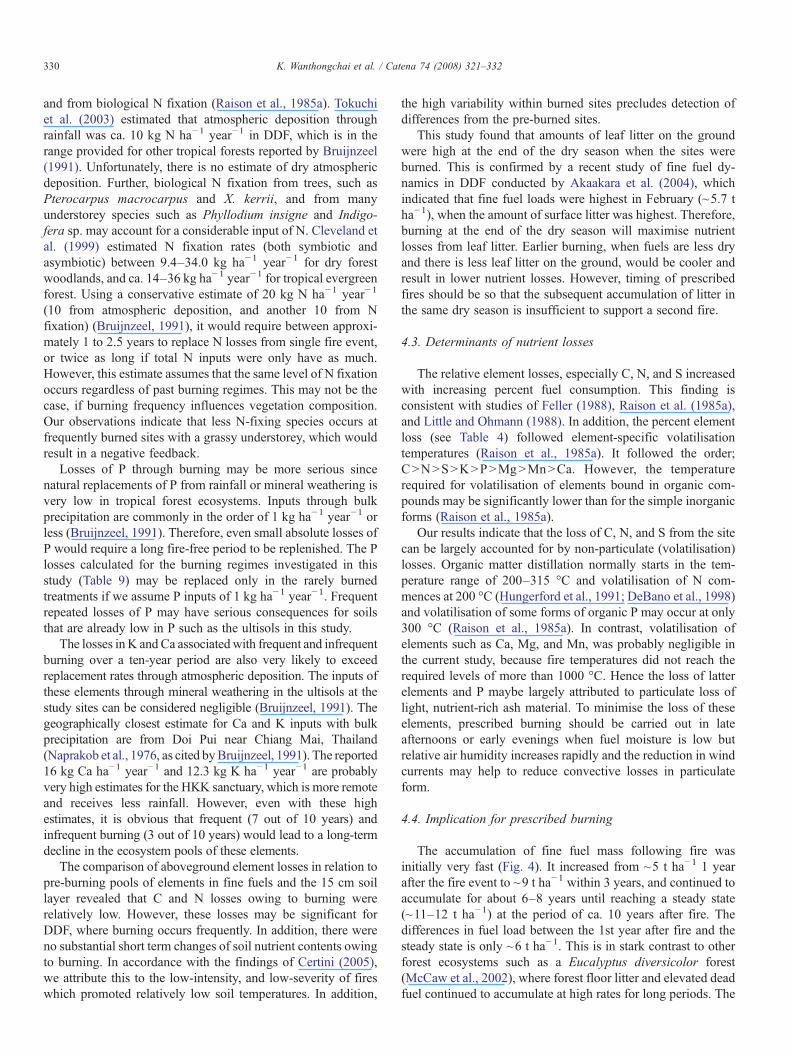
Table 9Fire-related gross losses of selected elements in a 10 year period of differentburning frequencies: frequently burned (FB) — 7 out of 10 years, infrequentlyburned (IB) — 3 out of 10 years, and rarely burned (RB) — once in 10 years
Burning regime Gross losses (kg ha−1)
N P K Ca
FB (7 out of 10) −179.2 −6.3 −97.3 −132.3IB (3 out of 10) −99.3 −9.6 −57.3 −71.7RB (1 out of 10) −52.7 −3.5 −11.3 −19.5
329K. Wanthongchai et al. / Catena 74 (2008) 321–332
availability owing to qualitative changes in organic matter, belost from the site by wind or water erosion, or remain on site inthe form of residues, and uncombusted debris (Raison et al.,1985a). The fate of elemental pools during burning in thecurrent study appeared to be influenced by a number of factors:(1) the degree of fuel combustion, which varied among fuelcomponents; (2) the relative distribution of elements within fuelcategories; and (3) the volatilisation temperatures of therespective elements and particulate losses during fire, whichwas similar to the study conducted by Hughes et al. (2000). Forexample, the low volatilisation temperature of N, the highdegree of fuel combustion, and the high concentration of N inreadily combusted fuel such as leaf litter resulted in an averageloss of 88% of pre-fire N at frequently burned sites, while only63% of N was lost at infrequently burned sites, where the degreeof combustion was lower.
A recent study by Toda et al. (2007) found that abovegroundC and N losses owing to burning in DDF in the Nakornracha-sima Province, Thailand, in January 2002, were 96% and 94%respectively, which were higher than in our study. These higherrelative nutrient losses might have resulted from higher fireintensity and severity, and differences in fuel composition.Unfortunately, no burning environment data (fire intensity, fireand soil temperature) were reported to verify this assumption.Compared to other ecosystems, the percent losses of allelements except N was lower in our study than in the casesreported by Raison et al. (1985b), Kauffman et al. (1993) andHughes et al. (2000). We attributed this to the burning con-ditions and vegetation characteristics prior to burning. In thecurrent study, burning took place during the dry season, whenmost plants have retranslocated a substantial proportion ofelements from aboveground parts (leaves and stem) to under-ground parts (roots and rhizomes) (Rundel and Boonpragob,1995), resulting in lower nutrient pools to be lost with burningfrom the understorey vegetation stratum. In addition, fire in-tensity in their studies was generally higher than in this currentstudy. For example, flame length reported by Kauffman et al.(1993) and Hughes et al. (2000) was 8 to 10 m and 3 to 22 m,respectively, compared to only 1.2 to 1.5 m in the current study.
For most nutrients, the total losses associated with the pre-scribed burning event, were highest at the sites with the greatestfuel load (RB). However, relative nutrient losses were highest at
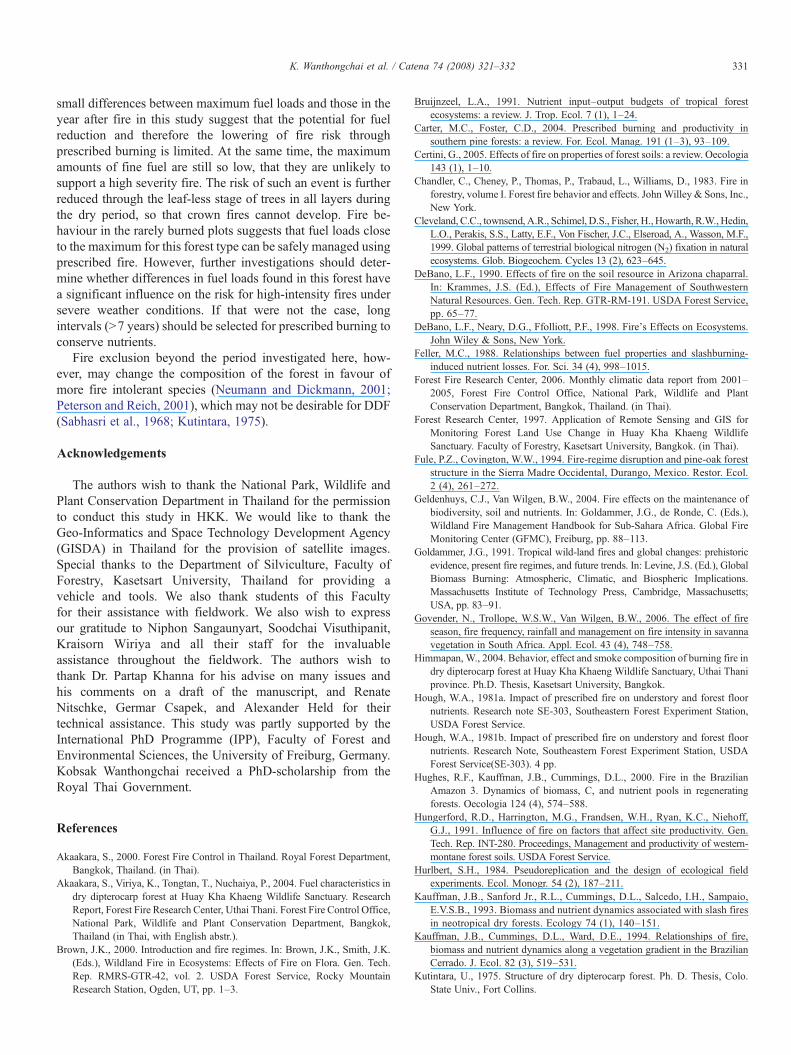
Fig. 4. Fine fuel accumulation with time since last fire in dry dipterocarp forest,Huay Kha Khaeng wildlife sanctuary.
the frequently burned site, where the relative fuel consumptionwas also highest. Moreover, the higher amount of grass in FB,which was generally burned more completely compared to otherunderstorey vegetation (pers. observ.), may have contributed tothe higher relative losses of nutrients. These results have to beviewed in relation to the frequency of such losses occurring overa given time. For comparative purposes, we assumed threedifferent fire frequency scenarios, with fires occurring almostevery year (7 times), every third year (3 times) or only once(after 7 years) over a ten-year period. For these scenarios weassumed further that (a) the amounts of fine fuel before fireequaled those determined in this study or different fuel accu-mulation periods (Fig. 4), (b) that they contained the samepercent of nutrients as determined in this study for frequently,infrequently and rarely burnt sites, and (c) that the percent lossof nutrients was also the same as for fires occurring at thesesites. No assumptions have been made about differences inthe replacement rate of nutrients through atmospheric deposi-tion, mineral weathering or N fixation for the different burningregimes.
Under these assumptions, the gross nutrient loss from fre-quently burned sites would be several times the loss of rarelyburned sites (Table 9). The differences in the magnitude ofnutrient losses were most pronounced for Ca, and least for P,possibly pointing to some P conservation mechanisms in plants.While nutrient losses associated with infrequent burning areintermediate between frequent and rare burning for N, K, andCa, they were highest for P over a 10 year period, which is likelyto be related to the higher soil P content at these sites. Rare firescould lead to higher nutrient losses in the longer term thanfrequent fires, if their intensity was much higher and if the fuelsburned in these fires would have a substantially higher nutrientcontent. This was not the case here. To the contrary, the K andCa contents in fine fuel were higher at the frequently burnedsites than at the rarely burned sites, whereas the differenceswere negligible for N and P. The K and Ca contents in fine fuelsof frequently, infrequently and rarely burned sites were 3.8, 1.5,and 0.9 and 2.8, 3.0, and 1.5 kg t−1, respectively. Despite fuelloads increase with the length of fire-free interval, the fuelaccumulation was not proportional fire-free interval (see Fig. 4).Therefore, these simple calculations demonstrate that frequentburning can lead to very high nutrient losses in the mediumto long-term, while rare burning does not lead to substantialnutrient losses.
The calculations of gross losses (Table 9) did not considerreplacement of nutrients between fires. Nitrogen can bereplaced naturally by input of N through atmospheric deposition
330 K. Wanthongchai et al. / Catena 74 (2008) 321–332
and from biological N fixation (Raison et al., 1985a). Tokuchiet al. (2003) estimated that atmospheric deposition throughrainfall was ca. 10 kg N ha−1 year−1 in DDF, which is in therange provided for other tropical forests reported by Bruijnzeel(1991). Unfortunately, there is no estimate of dry atmosphericdeposition. Further, biological N fixation from trees, such asPterocarpus macrocarpus and X. kerrii, and from manyunderstorey species such as Phyllodium insigne and Indigo-fera sp. may account for a considerable input of N. Cleveland etal. (1999) estimated N fixation rates (both symbiotic andasymbiotic) between 9.4–34.0 kg ha−1 year−1 for dry forestwoodlands, and ca. 14–36 kg ha−1 year−1 for tropical evergreenforest. Using a conservative estimate of 20 kg N ha−1 year−1
(10 from atmospheric deposition, and another 10 from Nfixation) (Bruijnzeel, 1991), it would require between approxi-mately 1 to 2.5 years to replace N losses from single fire event,or twice as long if total N inputs were only have as much.However, this estimate assumes that the same level of N fixationoccurs regardless of past burning regimes. This may not be thecase, if burning frequency influences vegetation composition.Our observations indicate that less N-fixing species occurs atfrequently burned sites with a grassy understorey, which wouldresult in a negative feedback.
Losses of P through burning may be more serious sincenatural replacements of P from rainfall or mineral weathering isvery low in tropical forest ecosystems. Inputs through bulkprecipitation are commonly in the order of 1 kg ha−1 year−1 orless (Bruijnzeel, 1991). Therefore, even small absolute losses ofP would require a long fire-free period to be replenished. The Plosses calculated for the burning regimes investigated in thisstudy (Table 9) may be replaced only in the rarely burnedtreatments if we assume P inputs of 1 kg ha−1 year−1. Frequentrepeated losses of P may have serious consequences for soilsthat are already low in P such as the ultisols in this study.
The losses inK and Ca associatedwith frequent and infrequentburning over a ten-year period are also very likely to exceedreplacement rates through atmospheric deposition. The inputs ofthese elements through mineral weathering in the ultisols at thestudy sites can be considered negligible (Bruijnzeel, 1991). Thegeographically closest estimate for Ca and K inputs with bulkprecipitation are from Doi Pui near Chiang Mai, Thailand(Naprakob et al., 1976, as cited byBruijnzeel, 1991). The reported16 kg Ca ha−1 year−1 and 12.3 kg K ha−1 year−1 are probablyvery high estimates for the HKK sanctuary, which is more remoteand receives less rainfall. However, even with these highestimates, it is obvious that frequent (7 out of 10 years) andinfrequent burning (3 out of 10 years) would lead to a long-termdecline in the ecosystem pools of these elements.
The comparison of aboveground element losses in relation topre-burning pools of elements in fine fuels and the 15 cm soillayer revealed that C and N losses owing to burning wererelatively low. However, these losses may be significant forDDF, where burning occurs frequently. In addition, there wereno substantial short term changes of soil nutrient contents owingto burning. In accordance with the findings of Certini (2005),we attribute this to the low-intensity, and low-severity of fireswhich promoted relatively low soil temperatures. In addition,
the high variability within burned sites precludes detection ofdifferences from the pre-burned sites.
This study found that amounts of leaf litter on the groundwere high at the end of the dry season when the sites wereburned. This is confirmed by a recent study of fine fuel dy-namics in DDF conducted by Akaakara et al. (2004), whichindicated that fine fuel loads were highest in February (~5.7 tha−1), when the amount of surface litter was highest. Therefore,burning at the end of the dry season will maximise nutrientlosses from leaf litter. Earlier burning, when fuels are less dryand there is less leaf litter on the ground, would be cooler andresult in lower nutrient losses. However, timing of prescribedfires should be so that the subsequent accumulation of litter inthe same dry season is insufficient to support a second fire.
4.3. Determinants of nutrient losses
The relative element losses, especially C, N, and S increasedwith increasing percent fuel consumption. This finding isconsistent with studies of Feller (1988), Raison et al. (1985a),and Little and Ohmann (1988). In addition, the percent elementloss (see Table 4) followed element-specific volatilisationtemperatures (Raison et al., 1985a). It followed the order;CNNNSNKNPNMgNMnNCa. However, the temperaturerequired for volatilisation of elements bound in organic com-pounds may be significantly lower than for the simple inorganicforms (Raison et al., 1985a).
Our results indicate that the loss of C, N, and S from the sitecan be largely accounted for by non-particulate (volatilisation)losses. Organic matter distillation normally starts in the tem-perature range of 200–315 °C and volatilisation of N com-mences at 200 °C (Hungerford et al., 1991; DeBano et al., 1998)and volatilisation of some forms of organic P may occur at only300 °C (Raison et al., 1985a). In contrast, volatilisation ofelements such as Ca, Mg, and Mn, was probably negligible inthe current study, because fire temperatures did not reach therequired levels of more than 1000 °C. Hence the loss of latterelements and P maybe largely attributed to particulate loss oflight, nutrient-rich ash material. To minimise the loss of theseelements, prescribed burning should be carried out in lateafternoons or early evenings when fuel moisture is low butrelative air humidity increases rapidly and the reduction in windcurrents may help to reduce convective losses in particulateform.
4.4. Implication for prescribed burning
The accumulation of fine fuel mass following fire wasinitially very fast (Fig. 4). It increased from ~5 t ha−1 1 yearafter the fire event to ~9 t ha−1 within 3 years, and continued toaccumulate for about 6–8 years until reaching a steady state(~11–12 t ha−1) at the period of ca. 10 years after fire. Thedifferences in fuel load between the 1st year after fire and thesteady state is only ~6 t ha−1. This is in stark contrast to otherforest ecosystems such as a Eucalyptus diversicolor forest(McCaw et al., 2002), where forest floor litter and elevated deadfuel continued to accumulate at high rates for long periods. The
331K. Wanthongchai et al. / Catena 74 (2008) 321–332
small differences between maximum fuel loads and those in theyear after fire in this study suggest that the potential for fuelreduction and therefore the lowering of fire risk throughprescribed burning is limited. At the same time, the maximumamounts of fine fuel are still so low, that they are unlikely tosupport a high severity fire. The risk of such an event is furtherreduced through the leaf-less stage of trees in all layers duringthe dry period, so that crown fires cannot develop. Fire be-haviour in the rarely burned plots suggests that fuel loads closeto the maximum for this forest type can be safely managed usingprescribed fire. However, further investigations should deter-mine whether differences in fuel loads found in this forest havea significant influence on the risk for high-intensity fires undersevere weather conditions. If that were not the case, longintervals (N7 years) should be selected for prescribed burning toconserve nutrients.
Fire exclusion beyond the period investigated here, how-ever, may change the composition of the forest in favour ofmore fire intolerant species (Neumann and Dickmann, 2001;Peterson and Reich, 2001), which may not be desirable for DDF(Sabhasri et al., 1968; Kutintara, 1975).
Acknowledgements
The authors wish to thank the National Park, Wildlife andPlant Conservation Department in Thailand for the permissionto conduct this study in HKK. We would like to thank theGeo-Informatics and Space Technology Development Agency(GISDA) in Thailand for the provision of satellite images.Special thanks to the Department of Silviculture, Faculty ofForestry, Kasetsart University, Thailand for providing avehicle and tools. We also thank students of this Facultyfor their assistance with fieldwork. We also wish to expressour gratitude to Niphon Sangaunyart, Soodchai Visuthipanit,Kraisorn Wiriya and all their staff for the invaluableassistance throughout the fieldwork. The authors wish tothank Dr. Partap Khanna for his advise on many issues andhis comments on a draft of the manuscript, and RenateNitschke, Germar Csapek, and Alexander Held for theirtechnical assistance. This study was partly supported by theInternational PhD Programme (IPP), Faculty of Forest andEnvironmental Sciences, the University of Freiburg, Germany.Kobsak Wanthongchai received a PhD-scholarship from theRoyal Thai Government.
References
Akaakara, S., 2000. Forest Fire Control in Thailand. Royal Forest Department,Bangkok, Thailand. (in Thai).
Akaakara, S., Viriya, K., Tongtan, T., Nuchaiya, P., 2004. Fuel characteristics indry dipterocarp forest at Huay Kha Khaeng Wildlife Sanctuary. ResearchReport, Forest Fire Research Center, Uthai Thani. Forest Fire Control Office,National Park, Wildlife and Plant Conservation Department, Bangkok,Thailand (in Thai, with English abstr.).
Brown, J.K., 2000. Introduction and fire regimes. In: Brown, J.K., Smith, J.K.(Eds.), Wildland Fire in Ecosystems: Effects of Fire on Flora. Gen. Tech.Rep. RMRS-GTR-42, vol. 2. USDA Forest Service, Rocky MountainResearch Station, Ogden, UT, pp. 1–3.
Bruijnzeel, L.A., 1991. Nutrient input–output budgets of tropical forestecosystems: a review. J. Trop. Ecol. 7 (1), 1–24.
Carter, M.C., Foster, C.D., 2004. Prescribed burning and productivity insouthern pine forests: a review. For. Ecol. Manag. 191 (1–3), 93–109.
Certini, G., 2005. Effects of fire on properties of forest soils: a review. Oecologia143 (1), 1–10.
Chandler, C., Cheney, P., Thomas, P., Trabaud, L., Williams, D., 1983. Fire inforestry, volume I. Forest fire behavior and effects. JohnWilley & Sons, Inc.,New York.
Cleveland, C.C., townsend,A.R., Schimel, D.S., Fisher, H.,Howarth, R.W.,Hedin,L.O., Perakis, S.S., Latty, E.F., Von Fischer, J.C., Elseroad, A., Wasson, M.F.,1999. Global patterns of terrestrial biological nitrogen (N2) fixation in naturalecosystems. Glob. Biogeochem. Cycles 13 (2), 623–645.
DeBano, L.F., 1990. Effects of fire on the soil resource in Arizona chaparral.In: Krammes, J.S. (Ed.), Effects of Fire Management of SouthwesternNatural Resources. Gen. Tech. Rep. GTR-RM-191. USDA Forest Service,pp. 65–77.
DeBano, L.F., Neary, D.G., Ffolliott, P.F., 1998. Fire's Effects on Ecosystems.John Wiley & Sons, New York.
Feller, M.C., 1988. Relationships between fuel properties and slashburning-induced nutrient losses. For. Sci. 34 (4), 998–1015.
Forest Fire Research Center, 2006. Monthly climatic data report from 2001–2005, Forest Fire Control Office, National Park, Wildlife and PlantConservation Department, Bangkok, Thailand. (in Thai).
Forest Research Center, 1997. Application of Remote Sensing and GIS forMonitoring Forest Land Use Change in Huay Kha Khaeng WildlifeSanctuary. Faculty of Forestry, Kasetsart University, Bangkok. (in Thai).
Fule, P.Z., Covington, W.W., 1994. Fire-regime disruption and pine-oak foreststructure in the Sierra Madre Occidental, Durango, Mexico. Restor. Ecol.2 (4), 261–272.
Geldenhuys, C.J., Van Wilgen, B.W., 2004. Fire effects on the maintenance ofbiodiversity, soil and nutrients. In: Goldammer, J.G., de Ronde, C. (Eds.),Wildland Fire Management Handbook for Sub-Sahara Africa. Global FireMonitoring Center (GFMC), Freiburg, pp. 88–113.
Goldammer, J.G., 1991. Tropical wild-land fires and global changes: prehistoricevidence, present fire regimes, and future trends. In: Levine, J.S. (Ed.), GlobalBiomass Burning: Atmospheric, Climatic, and Biospheric Implications.Massachusetts Institute of Technology Press, Cambridge, Massachusetts;USA, pp. 83–91.
Govender, N., Trollope, W.S.W., Van Wilgen, B.W., 2006. The effect of fireseason, fire frequency, rainfall and management on fire intensity in savannavegetation in South Africa. Appl. Ecol. 43 (4), 748–758.
Himmapan, W., 2004. Behavior, effect and smoke composition of burning fire indry dipterocarp forest at Huay Kha Khaeng Wildlife Sanctuary, Uthai Thaniprovince. Ph.D. Thesis, Kasetsart University, Bangkok.
Hough, W.A., 1981a. Impact of prescribed fire on understory and forest floornutrients. Research note SE-303, Southeastern Forest Experiment Station,USDA Forest Service.
Hough, W.A., 1981b. Impact of prescribed fire on understory and forest floornutrients. Research Note, Southeastern Forest Experiment Station, USDAForest Service(SE-303). 4 pp.
Hughes, R.F., Kauffman, J.B., Cummings, D.L., 2000. Fire in the BrazilianAmazon 3. Dynamics of biomass, C, and nutrient pools in regeneratingforests. Oecologia 124 (4), 574–588.
Hungerford, R.D., Harrington, M.G., Frandsen, W.H., Ryan, K.C., Niehoff,G.J., 1991. Influence of fire on factors that affect site productivity. Gen.Tech. Rep. INT-280. Proceedings, Management and productivity of western-montane forest soils. USDA Forest Service.
Hurlbert, S.H., 1984. Pseudoreplication and the design of ecological fieldexperiments. Ecol. Monogr. 54 (2), 187–211.
Kauffman, J.B., Sanford Jr., R.L., Cummings, D.L., Salcedo, I.H., Sampaio,E.V.S.B., 1993. Biomass and nutrient dynamics associated with slash firesin neotropical dry forests. Ecology 74 (1), 140–151.
Kauffman, J.B., Cummings, D.L., Ward, D.E., 1994. Relationships of fire,biomass and nutrient dynamics along a vegetation gradient in the BrazilianCerrado. J. Ecol. 82 (3), 519–531.
Kutintara, U., 1975. Structure of dry dipterocarp forest. Ph. D. Thesis, Colo.State Univ., Fort Collins.
332 K. Wanthongchai et al. / Catena 74 (2008) 321–332
Little, S.N., Ohmann, J.L., 1988. Estimating nitrogen lost from forest floorduring prescribed fires in douglas-fir/western hemlock clearcuts. For. Sci.34, 152–164.
Macadam, A., 1989. Effects of prescribed fire on forest soils. ATraining ManualPrepared for the Protection Section, Prince Rupert Forest Region. Ministryof Forests, Smithers, B.C.
Màrcia, E., Iraima, V., Francisco, L., Maria, E.J., 2006. Recruitment and growthdecline in Pinus halepensis populations after recurrent wildfires in Catalonia(NE Iberian Peninsula). For. Ecol. Manag. 231 (1–3), 47–54.
McCaw, W.L., Neal, J.E., Smith, R.H., 2002. Stand characteristics and fuelaccumulation in a sequence of even-aged karri (Eucalyptus diversicolor) standsin south-west Western Australia. For. Ecol. Manag. 158 (1–3), 263–271.
Morley, S., Grant, C., Hobbs, R., Cramer, V., 2004. Long-term impact ofprescribed burning on the nutrient status and fuel loads of rehabilitatedbauxite mines in Western Australia. For. Ecol. Manag. 190 (2–3), 227–239.
Mueller-Dombois, D., Goldammer, J.G., 1990. Fire in tropical ecosystems andglobal environmental change: an introduction. In: Goldammer, J.G. (Ed.),Fire in the Tropical Biota: Ecosystem Process and Global Challenges.Ecological studies, vol. 84. Springer-Verlag, Berlin, pp. 1–10.
Naprakob, B., Chunkao, K., Panburana, N., 1976. Nutrient budgets of small hillevergreen forest watershed at Doi Pui, Chiengmai. Kog-Ma Watershed Bull.Kasetsart University, Bangkok, p. 27 (in Thai with English abstr.).
Neary, D.G., Klopatek, C.C., DeBano, L.F., Ffolliott, P.F., 1999. Fire effectson belowground sustainability: a review and synthesis. For. Ecol. Manag.122 (1–2), 51–71.
Neumann, D.D., Dickmann, D.I., 2001. Surface burning in a mature stand ofPinus resinosa and Pinus strobus in Michigan: effects on understoryvegetation. Int. J. Wildland Fire 10, 91–101.
Peterson, D.W., Reich, P.B., 2001. Prescribed fire in oak savanna: fire frequencyeffects on stand structure and dynamics. Ecol. Appl. 11 (3), 914–927.
Raison, R., 1979. Modification of the soil environment by vegetation fires, withparticular reference to nitrogen transformations: a review. Plant Soil 51 (1),73–108.
Raison, R.J., Khanna, P.K., Woods, P.V., 1985a. Mechanisms of element transferto the atmosphere during vegetation fires. Can. J. For. Res. 5, 132–140.
Raison, R.J., Khanna, P.K., Woods, P.V., 1985b. Transfer of elements to theatmosphere during low-intensity prescribed fires in three Australiansubalpine eucalypt forests. Can. J. For. Res. 15, 657–664.
Rothermel, R.C., Deeming, J.E., 1980. Measuring and interpreting fire behaviorfor correlation with fire effects. Gen. Tech. Rep. INT-93. USDA ForestService. Intermountain Forest and Range Experiment Station.
Rundel, P.W., Boonpragob, K., 1995. Dry forest ecosystems of Thailand. In:Bulloock, S.H., Mooney, H., Medina, E. (Eds.), Seasonally Dry TropicalForests. Cambridge University Press, New York, pp. 93–123.
Sabhasri, S., Boonnitte, A., Khemnark, C., Aksornkoae, S., 1968. Structure andfloristic composition of forest vegetation at Sakaerat, Pak Thong Chai,Nakorn-Ratchasima: I Variation of floristic composition along transectthrough dry evergreen and dry dipterocarp forests. Appl. Sci. Res. Corp.,Bangkok, Thailand.
Sahunalu, P., Thaiutsa, B., Sukwong, S., Aksornkoae, S., Kaitpraneet, S., 1984.Nutrient Cycling of the Dry Dipterocarp Forest at Sakaerat. KasetsartUniversity, Bangkok. (in Thai, with English Abstr.).
SPSS Inc., 2005. SPSS Base 13.0 for Windows User's Guide. SPSS Inc,Chicago IL.
Sukwong, S., 1982.Growth of dry dipterocarp forest tree species. Thai J. For. 1, 1–13.Toda, T., Takeda, H., Tokuchi, N., Wacharinrat, C., Kaitpraneet, S., 2007.
Effects of forest fire on the nitrogen cycle in a dry dipterocarp forest,Thailand. Tropics 16 (1), 41–45.
Tokuchi, N., Nakanishi, A., Wacharinrat, C., Takeda, H., 2003. Comparison ofN dynamics in soil between dry dipterocarp forest and dry evergreen forestin central Thailand. In: Takeda, H., Khamyong, S., Wiwatiwitaya, D. (Eds.),Decomposition and Nutrient Cycling Processes in Tropical Seasonal Forestsin Thailand. Faculty of Forestry, Kasetsart University, Bangkok, Thailand,pp. 69–92.