Aboveground Biomass in Humid Tropical Wetland Forests of the Republic of Congo, Congo Basin
11
[Ifo, 3(10): October, 2014] ISSN: 2277-9655 Scientific Journal Impact Factor: 3.449 (ISRA), Impact Factor: 2.114 http: // www.ijesrt.com (C)International Journal of Engineering Sciences & Research Technology [1] IJESRT INTERNATIONAL JOURNAL OF ENGINEERING SCIENCES & RESEARCH TECHNOLOGY Aboveground Biomass in Humid Tropical Wetland Forests of the Republic of Congo, Congo Basin Ifo Suspense Averti1 *1 , Koubouana Felix 2 , Bocko Yannick 2 * 1 Département des Sciences Naturelles, Ecole Normale Supérieure, Université Marien Ngouabi, BP 237 Brazzaville, Republic of Congo 2 Ecole Nationale Supérieure d'Agronomie et de Foresterie, B.P. 69 Université Marien Ngouabi. 3 Laboratoire d’Ecologie Végétale. Faculté des Sciences et Techniques, Université Marien, Ngouabi, BP69 Brazzaville, Republic of Congo Abstracts Tree aboveground biomass (AGB) distribution and carbon storage in different DBH (diameter at breast height) classes were calculated and compared between three different humid forest of the north of Congo (peat land’s forest, seasonally flooded forest, and terra ferma forest) mainly in the forest of Likouala. AGB carbon stock varies in this study from 82 MgC.ha -1 to 404 MgC.ha -1 across the five sites where data were recorded (68 plots) with an average AGB of 223 MgC.ha -1 . The AGB in the peat land forest was slightly low compared to the other two forest types. Trees ≥ 60 cm in diameter coupled with over high wood density of 0.70 g.m- 3 explained 91% of the variability among plots in aboveground biomass obtained in this study. These trees represent less than 20% of the total trees sampled. This study revealed a complex relationship between biodiversity of forest trees in this area and aboveground biomass. Keywords: aboveground biomass, humid tropical forest, REED+, Congo RC, Carbon. Introduction Estimates of carbon stocks in tropical ecosystems are of high relevance for understanding the global carbon cycle, the formulation and evaluation of global initiatives to reduce global warming (Sierra et al. 2007). The interest to preserve these forests has increased in recent years within the framework of climate change and could play a crucial role in the mitigation of their effects, through carbon sequestration, and also by the reduction of CO 2 emissions due to deforestation and forest degradation (Malhi & Grace 2000, Gibbs et al. 2007). Recording data on the stock of carbon and understanding of the factors explains his variability are very important because of the link with the emissions from deforestation and degradation (Houghton, 2005). In addition, considering the global climate changes, efforts are being invested to reduce global greenhouse gas emissions. One example of such a climate change mitigation mechanism is REDD+ which aims at reducing emissions from deforestation, forest degradation and making an accent on the role of conservation, sustainable management of forests and enhancement of forest carbon stocks (Campbell & Copenhagen 2009). Many studies have been carried out in different rainforests of the world to estimate the carbon stock in their different pools. Two basic approaches exist to quantify carbon stocks, namely direct method (sampling or destructive method) and indirect methods (non destructive methods). Because the direct sampling is laborious and time consuming and also because it destructive, several studies used indirect methods for carbon quantification. Allometric equations constitute now days the most common method to estimate the aboveground biomass methods (Chave et al. 2005; Henri et al. 2010; Vieilledent et al. 2012; Fayolle et al. 2013) as an indirect approach to estimate carbon stocks. Some studies (Baccini et al. 2008; Saatchi et al. 2011) have used remote sensing to estimate the stock of carbon on the ground. Others have attempted a combination of field measurements, remotely sensed data, and physiological models to produce world map of Net Primary Productivity (NPP); however, these estimates are with considerable amount of uncertainties in the tropics (Field et al. 1998, Turner et al 2005).
Transcript of Aboveground Biomass in Humid Tropical Wetland Forests of the Republic of Congo, Congo Basin
[Ifo, 3(10): October, 2014] ISSN: 2277-9655 Scientific Journal Impact Factor: 3.449
(ISRA), Impact Factor: 2.114
http: // www.ijesrt.com (C)International Journal of Engineering Sciences & Research Technology [1]
IJESRT INTERNATIONAL JOURNAL OF ENGINEERING SCIENCES & RESEARCH
TECHNOLOGY
Aboveground Biomass in Humid Tropical Wetland Forests of the Republic of Congo,
Congo Basin
Ifo Suspense Averti1*1, Koubouana Felix2, Bocko Yannick2 * 1 Département des Sciences Naturelles, Ecole Normale Supérieure, Université Marien Ngouabi,
BP 237 Brazzaville, Republic of Congo 2 Ecole Nationale Supérieure d'Agronomie et de Foresterie, B.P. 69 Université Marien Ngouabi.
3Laboratoire d’Ecologie Végétale. Faculté des Sciences et Techniques, Université Marien,
Ngouabi, BP69 Brazzaville, Republic of Congo
Abstracts Tree aboveground biomass (AGB) distribution and carbon storage in different DBH (diameter at breast
height) classes were calculated and compared between three different humid forest of the north of Congo (peat land’s
forest, seasonally flooded forest, and terra ferma forest) mainly in the forest of Likouala. AGB carbon stock varies in
this study from 82 MgC.ha -1 to 404 MgC.ha -1 across the five sites where data were recorded (68 plots) with an
average AGB of 223 MgC.ha -1. The AGB in the peat land forest was slightly low compared to the other two forest
types. Trees ≥ 60 cm in diameter coupled with over high wood density of 0.70 g.m-3 explained 91% of the variability
among plots in aboveground biomass obtained in this study. These trees represent less than 20% of the total trees
sampled. This study revealed a complex relationship between biodiversity of forest trees in this area and aboveground
biomass.
Keywords: aboveground biomass, humid tropical forest, REED+, Congo RC, Carbon.
Introduction Estimates of carbon stocks in tropical
ecosystems are of high relevance for understanding the
global carbon cycle, the formulation and evaluation of
global initiatives to reduce global warming (Sierra et
al. 2007). The interest to preserve these forests has
increased in recent years within the framework of
climate change and could play a crucial role in the
mitigation of their effects, through carbon
sequestration, and also by the reduction of CO2
emissions due to deforestation and forest degradation
(Malhi & Grace 2000, Gibbs et al. 2007). Recording
data on the stock of carbon and understanding of the
factors explains his variability are very important
because of the link with the emissions from
deforestation and degradation (Houghton, 2005). In
addition, considering the global climate changes,
efforts are being invested to reduce global greenhouse
gas emissions. One example of such a climate change
mitigation mechanism is REDD+ which aims at
reducing emissions from deforestation, forest
degradation and making an accent on the role of
conservation, sustainable management of forests and
enhancement of forest carbon stocks (Campbell &
Copenhagen 2009).
Many studies have been carried out in different
rainforests of the world to estimate the carbon
stock in their different pools. Two basic
approaches exist to quantify carbon stocks,
namely direct method (sampling or destructive
method) and indirect methods (non destructive
methods). Because the direct sampling is
laborious and time consuming and also because it
destructive, several studies used indirect methods
for carbon quantification. Allometric equations
constitute now days the most common method to
estimate the aboveground biomass methods
(Chave et al. 2005; Henri et al. 2010; Vieilledent
et al. 2012; Fayolle et al. 2013) as an indirect
approach to estimate carbon stocks.
Some studies (Baccini et al. 2008; Saatchi et al.
2011) have used remote sensing to estimate the
stock of carbon on the ground. Others have
attempted a combination of field measurements,
remotely sensed data, and physiological models to
produce world map of Net Primary Productivity
(NPP); however, these estimates are with
considerable amount of uncertainties in the
tropics (Field et al. 1998, Turner et al 2005).

[Ifo, 3(10): October, 2014] ISSN: 2277-9655 Scientific Journal Impact Factor: 3.449
(ISRA), Impact Factor: 2.114
http: // www.ijesrt.com (C)International Journal of Engineering Sciences & Research Technology [2]
Carbon amount in tropical forest varies widely
among studies, and this variation contributes
immensely to the uncertainty in estimations of
carbon fluxes (Chave et al. 2008). Even though a
number of forest inventories have been carried out
in tropical forests, there remain large areas where
such inventories are out of date, incomplete, or
entirely lacking (Houghton 2005). Many
individual plots have been sampled and analyzed;
however, extrapolating the results to an entire
region is problematic. Pending the validation of a
method that would allow quantification of carbon
with excellent accuracy, sampling of carbon by
forest inventory will remain the only way to allow
the countries engaged in REDD+ to calculate the
baseline forest carbon.
Very few studies reported the data of the
aboveground biomass of humid tropical forest of
the north of Congo RC (Simon et al. 2013).
A number of abiotic and biotic factors: wood
density, bioclimatic parameters, endemism, tree
diameter, soil fertilities, effects of soil and
topography, tree height are among the factors that
explains the spatial variability of the above- and
belowground biomass of trees in tropical forests
(Chave et al. 2005; Chave et al. 2006; Djomo et
al. 2010; Fayolle et al. 2013; Baker et al. 2004;
Ter Steege et al. 2006).
In the Republic of Congo, the forest cover
approximately 2/3 of the total land with a low rate
of deforestation 0.07% gross deforestation and an
annual rate of only 0.02% net deforestation
(Duveiller et al. 2008). Likouala’s department is
covered by 95% by the tropical evergreen
rainforest. The forest cover net changes for the
periods 1990-2000 and 2000-2010 was of 0.30%
and 0.10% respectively. These forest areas are in
the focus of REDD+ projects, which require an
accurate monitoring of their carbon stocks or
aboveground biomass (AGB).
Congo’s tropical forests are characterized by a
very high biological diversity per hectare
(Moutsabote 2011, Kimpouni et al. 2013), and
play many environmental ecosystem services.
Our study takes place in a dense humid tropical
forest of Likouala. The area is characterized by
the fact that a part of the forest is growing in a
swamp area (area flooded a part of the year), a
transition zone between Earth farm and area
seasonally flooded.
It should be noted that in Congo Brazzaville,
flooded forests occupy approximately 38% of
Congolese forests. In this study, we want to test
the following hypothesis: (i) - Do means of carbon
stock varies in the three zones where plots were
installed? (ii) How vary plant biodiversity as well
as distribution of trees density per hectare in these
typical rain forests
Our objectives were to: (i) estimate the
aboveground biomass in the tropical rain forest of
the North of Congo using Pantropical allometric
equation published by Chave et al. (2005); (ii)
show the variability of aboveground biomass
along different transect; (iii) study the influence
of trees diversity on the carbon stock.
Materials and methods Study site
Our study was carried out in the forest of
Likouala (North of the Republic of Congo). In this
forest, five transects were established in the
localities of Bondoki, Bondzale, Ekolongo,
Itanga, Mabla (Figure 1). Experimental plots were
established outside the logging concession. This
area has one of the very low density of human
population (0.93 km-2) of the Republic of Congo.
The forest of Likouala contains a high diversity of
trees and plants (Moutsambote 2011). Rainfall is
1760 mm y-1, with a dry season from December to
January, and a long wet season from March to
November. Tree canopy closure of the forest
varies from 93% to 100% while the tree height
from 30 to above 45 meter (own data).
[Ifo, 3(10): October, 2014] ISSN: 2277-9655 Scientific Journal Impact Factor: 3.449
(ISRA), Impact Factor: 2.114
http: // www.ijesrt.com (C)International Journal of Engineering Sciences & Research Technology [3]
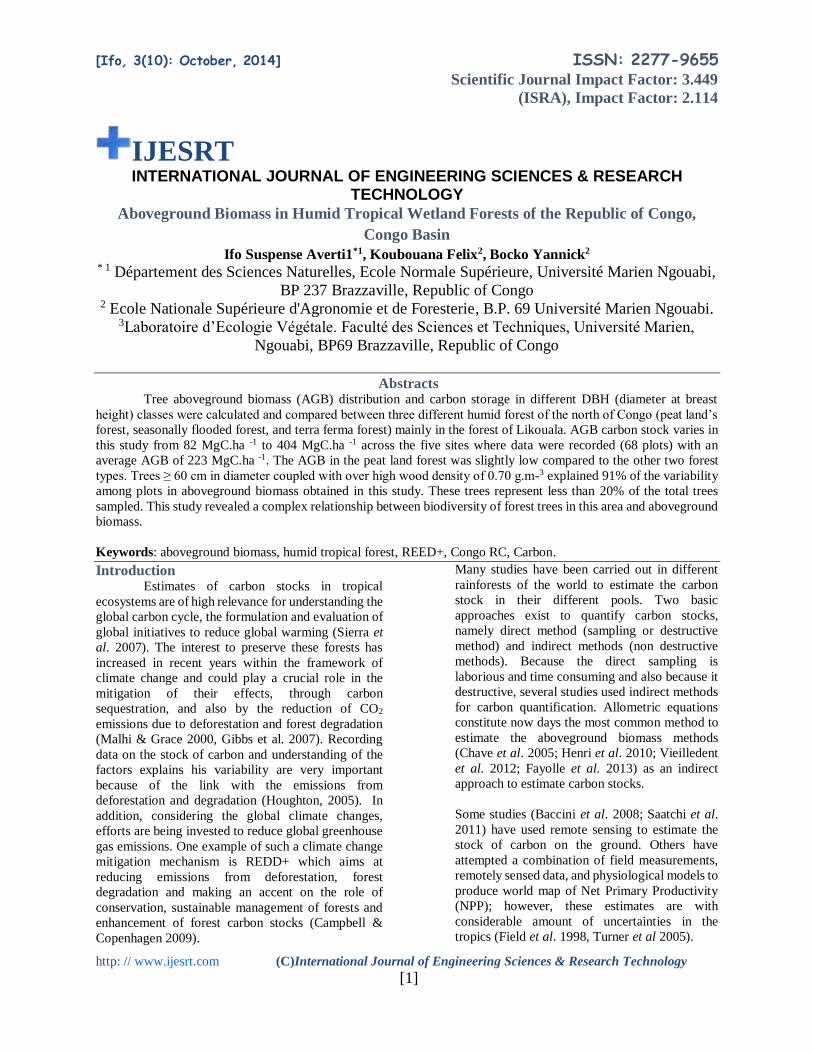
Figure 1: Locations of the fives transects
Plot establishment
To conduct inventories of total aboveground
biomass, we sampled 88 plots distributed into five
transects (Table 1) as presented in study site section.
The transects were randomly place in different sites in
the western direction – and inside them, all 300 meters
a plot has been installed following the protocol
developed below.
In each transect, plots were installed in three areas or
zone along the transect: forest in seasonally flooded
areas (FSF), forest in terra ferma land area (FTF),
which is not flooded throughout the year forests
flooded throughout the year (FF), in areas of peat
lands. It is important to note that these tree type of
forests do not refer to a typical existing forest.
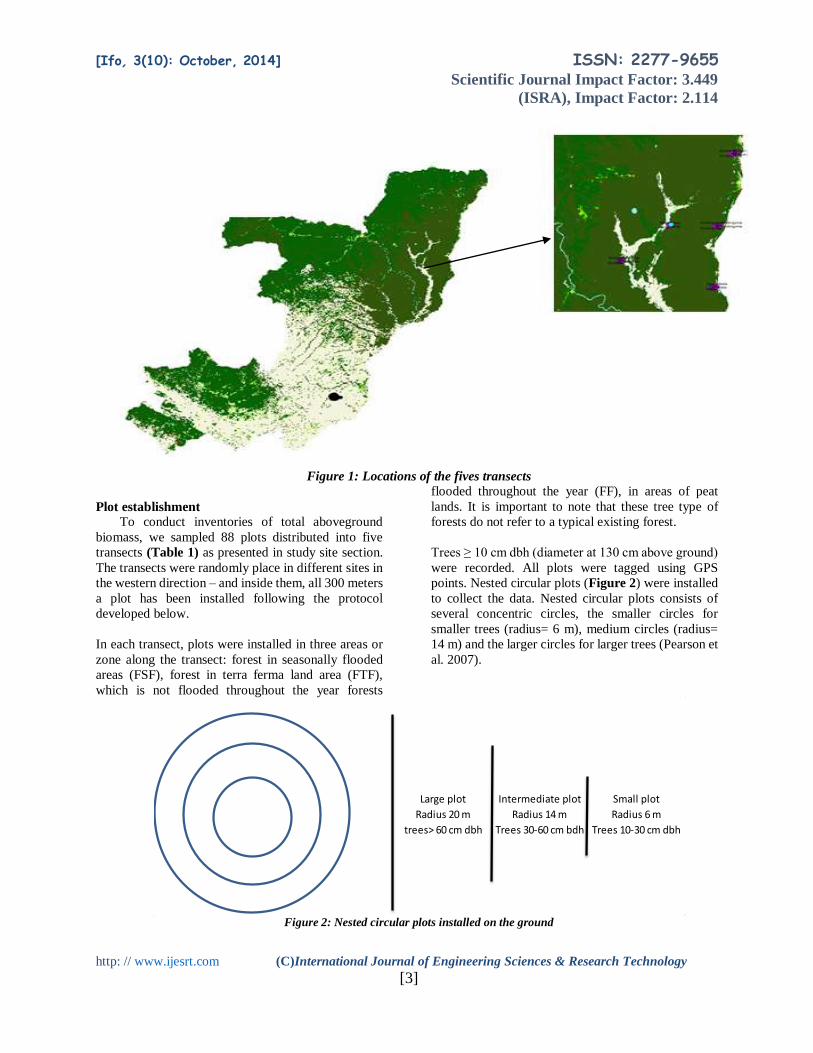
Trees ≥ 10 cm dbh (diameter at 130 cm above ground)
were recorded. All plots were tagged using GPS
points. Nested circular plots (Figure 2) were installed
to collect the data. Nested circular plots consists of
several concentric circles, the smaller circles for
smaller trees (radius= 6 m), medium circles (radius=
14 m) and the larger circles for larger trees (Pearson et
al. 2007).
Figure 2: Nested circular plots installed on the ground
Small plot
Radius 6 m
Trees 10-30 cm dbh
Large plot
Radius 20 m
trees> 60 cm dbh
Intermediate plot
Radius 14 m
Trees 30-60 cm bdh

[Ifo, 3(10): October, 2014] ISSN: 2277-9655 Scientific Journal Impact Factor: 3.449
(ISRA), Impact Factor: 2.114
http: // www.ijesrt.com (C)International Journal of Engineering Sciences & Research Technology [548]
It is good practice to design fixed size circular plots
since they are easy to establish, preferably with
distance measuring equipment (DME). With DME the
boundary of the plot does not need to be marked.
Nested plots are cost efficient and scientifically robust
for most vegetation types with trees (Walker et al.
2012).
Large tree palms (≥ 10 cm DBH) palms were not
included in this inventory as well as lianas, small trees
(< 10 cm DBH). The others pools of carbon (Dead
wood debris, below ground, herbaceous) were not
measured in this forest ecosystem.
Calculating carbon stock in above-ground trees
from allometric equations
The calculation of aboveground biomass was
done using the pan tropical equation developed by
Chave et al. (2005) for moist forests. This equation
was calibrated on an extensive dataset of 2410 trees ≥
5 cm diameter from 27 study sites across the tropic but
none in Africa. In their study in central Africa, Fayolle
et al. (2013) conclude that the pan tropical multi-
species allometric equation can be used to produce
accurate estimates of biomass and carbon stocks from
diameter measurements in the forest inventory data
and from external information on wood specific
gravity at species level.
𝐵 = 𝜌. 𝑒𝑥𝑝(−1.499 + 2.148 ln(𝐷) + 0.207(ln(𝐷))2
− 0.0281 (ln(𝐷))^3)
B= dry biomass (in kg),
D is dbh (in cm),
ρ is wood density (in g.cm-3)
Carbon stock (tC.ha-1) was obtained by multiplying
dry biomass (in kg) with 0.47 (GIEC, 2003).
Woody density of each species was obtained on the
website
http://datadryad.org/repo/handle/10255/dryad.235.
During the data treatment, we considered the default
woody densities of 0.60 g.cm-3 for species for which
there was no published data of wood density (Henry et
al. 2010). And to obtain the stock of carbon per
hectare, we divided the sum carbon stock per tree by
the plot area (m2) converted into hectare.
Relationship between type of forest, species and
aboveground biomass
Cette étude a été faite on ne considérant que tous
les arbres de diamètres > 60 cm enregistrés dans la
parcelle circulaire de rayon 20 m. Nous avons
considéré ce diamètre, parce que les arbres ayant ce
diamètre sont ceux qui participent le plus a la biomasse
aérienne. Le tableau croisé dynamique d’excel a été
utilisé afin de suivre la relation entre le nombre
d’espèce végétale par zone ou type de foret, leur
nombre ainsi que la contribution de chaque espèce
dans la biomasse totale aérienne. Ensuite les espèces
sont discriminées suivant leur appartenance à tel ou tel
type de foret. Les arbres de diamètres > 60 cm ont été
repartis suivant leurs espèces et le nombre d’individus
par espèces à leur contribution en termes de biomasse.
Results Variability of the AGB along the transect
Aboveground carbon stock highly varies in this
study from 82 MgC.ha -1 to 409.6 MgC.ha-1
considering the five transects where we established
plots with an average of 223 MgC.ha-1 (Table 2).
Inside each transects (Bondoki, Bondzale,
Ekolongoma, Itanga, Mbala), we have noticed a high
variability of the AGB. In certain plots like in Mbala,
Bondzale, Bandoki). The stock of carbon could vary
from simple to double or more (Figures 3).
Figure 3: Trends of aboveground biomass along the transect.
0
50
100
150
200
250
300
350
400
450
PEB
11B
PEB
14B
PEB
12B
d
PEB
05E
PEB
08E
PEB
09I
PEB
02M
b
PEB
05M
b
PEB
02I
PEB
05I
PEB
10E
PEB
13E
PEB
02B
d
PEB
05B
d
PEB
02B
PEB
05B
PEB
08B
PEB
07B
d
PEB
14B
d
PEB
03E
PEB
13I
PEB
09M
b
PEB
14B
d
MgC
.ha-
1
plots
AGB

[Ifo, 3(10): October, 2014] ISSN: 2277-9655 Scientific Journal Impact Factor: 3.449
(ISRA), Impact Factor: 2.114
http: // www.ijesrt.com (C)International Journal of Engineering Sciences & Research Technology [547]
We found also that the above ground biomass varies
greatly between the different types of forest
The test of multiple comparisons of means of Turkey
shows that there is a significant difference between the
seasonally flooded forest carbon stock and the forest
on terra firma. A difference of 8.61 MgC.ha-1 was
noted between these two forests. We obtained also a
significant difference of Cstock of 51.80 MgC.ha-1
between FTF and FF between FSF and FF there is a
significant difference of 60.42 MgC.ha-1. But there is
no significant difference between seasonally flooded
forests and flooded forests.
Influence of the class of diameter on the
aboveground biomass
Analysis of the data indicates the existence of a
fairly wide range of diameter class in this study area.
Indeed it varies from the class [10 - 19.99] to the
diameter class [140 - 149.9].
The results obtained in our study showedlarge trees,
through less abundant than small trees, stored a greater
proportion of the plot biomass than small trees. The
tree population with diameter ≤ 60 cm was more
important (79 % of total tree censed) than the tree
population above that diameter (Figure 3). However,
trees with DBH > 60 cm represented 91 % of the mean
of AGB in the five transects censed. Considering trees
with d.b.h ≥ 60 cm, the most important stock of carbon
has been recorded in the FFFTF with 103 MgC.ha-1. In
the two others forest we obtained respectively 73 and
67 MgC.ha-1 in the FSF and FF.
Relationship between species and aboveground
biomass
Linear regressions were made to check the link
between the number of species and the amount of
aboveground biomass in different plots (figure 4). It
notes that there are linear regressions between these
two parameters, but the correlation is weak (r2 = 0.25,
FSF; r2 = 0.39, FF; r2 = 0.24, FFF) (figure 5).
Also if we consider trees with diameters ≥ 60 cm, the
relationship indicates a better correlation (r2 = 0.65).
Figure 4: Relationship between number of species and aboveground biomass
Otherwise, if we consider all tree recorded, in the
forest of FTF there are 116 individuals trees for a
Cstock of 2179 MgC.ha- 1 against 285 trees with
diameter ≥10 cm for a total biomass of 3399 MgC.ha-
1 for the FF. We obtained for the FSF a total biomass
of 2713 MgC.ha- 1 for 104 trees. Considering trees with
dbh ≥ 60 cm-diameter trees, there is great variability
in terms of representation of the number of species
with more than three trees higher than 60 cm. In the
FSF forest we note 6 species, while in two other types
of forests there was 8 and 10 species respectively in
FF-FFF forests. This result reveals that in the tropical
rainforests of Likouala very few plant species are
involved in the biomass of these forests. In addition,
there are specific to each type of forest plant
associations. Six forest species contribute to almost
50% a total biomass of the trees of diameter above 60
cm in the forest FSF, 66% in forests FFF and 61% for
the FF (table 1) forests.
y = 33.77x + 4.6982R² = 0.65
0
50
100
150
200
250
300
350
400
0 2 4 6 8 10 12

[Ifo, 3(10): October, 2014] ISSN: 2277-9655 Scientific Journal Impact Factor: 3.449
(ISRA), Impact Factor: 2.114
http: // www.ijesrt.com (C)International Journal of Engineering Sciences & Research Technology [547]
Tableau 1: Relationship between species and aboveground biomass
type of
forest
n (d > 60
cm)
d>60 cm
AGBtot
Species
with
n<2
Species with
n>2
AGBtot Species for
n>2
FSF 61 2176 25 6 1013
FF 71 1753 18 8 1076
FFF 77 3281 22 10 2164
y = 10.978x + 97.269R² = 0.2584
0
50
100
150
200
250
300
350
400
450
0 5 10 15 20 25
AG
B (M
gC.h
a-1
)
number of species
ZSI
y = 8.8152x + 50.29R² = 0.3981
0
50
100
150
200
250
300
350
400
450
0 5 10 15 20 25
AG
B (M
gC.h
a-1
)
ZT

[Ifo, 3(10): October, 2014] ISSN: 2277-9655 Scientific Journal Impact Factor: 3.449
(ISRA), Impact Factor: 2.114
http: // www.ijesrt.com (C)International Journal of Engineering Sciences & Research Technology [547]
Figure 5: relation between number of species and aboveground biomass for trees above> 60 cm.
Discussion Variability of the aboveground biomass
The means values of biomass obtained in the
different forest in this study was higher than the mean
value published by the report of GIEC (2003) for
dense tropical forest for Africa (310 tMS.ha-1 or 138
MgC.ha-1.). However, the results obtained in this study
are closed to those obtained by others authors (Table
7) and were below in comparison with those published
by Nascimento et al (2002) and Brown et al. (2004).
Indeed Brown et al. (2004). in their study on the
impact of selective logging on the carbon stocks of
tropical forests in Republic of Congo from 10 plots in
mature unlogged forest with the same protocol as used
in our study, their found a mean stock of carbon of
276.7 MgC. ha-1± 103.9 (n = 10, mean ± 95 %
confidence interval). Many factors could explain the
high variability of aboveground biomass (soil fertility,
big trees density, wood density, high diameter, etc).
According to results obtained, we noted high
variability of AGB inside each type of forest as noted
we have swamp forest, terra firma forest and
seasonally flooded forest. The lowest biomass in the
flooded forest could be explained by the presence of
water that does not facilitate the growing of trees.
Influence of type of forest on AGB
Guitet et al. (2005) noted in French Guiana forest
that the biomass varied significantly between primary
forest and swamp forest. Aboveground biomass was
lower in the swampy forest than in the terra ferma with
290 ± 30 tMS.ha-1 against 350 ± 25 tMS.ha-1
respectively.
Brown et al (1997) argue that in the old tropical forest
aboveground biomass of trees range from 220-260
MgC.ha-1 with trees > 70 cm in diameter accounting
for 30% of the AGB. But Baishyal et al. (2009) found
in their study that about 49% of the AGB was explains
by trees with DBH> 60 cm, while Serura & Kanninen
(2005) discovered in the forest of Northern Costa Rica
that DBH ≥ 60 cm, represented, 41 and 50 percent of
the AGB. Brandeis et al. (2006) stated that even in the
dry tropical forest, the large diameter influences
greatly the value of the aerial biomass of trees.
Terakunpisut et al. (2007) reported that the potential
of forests to sequester carbon depends on the forest
type and size of forest age class of trees. Regarding the
age, no data could allow us to determine the age of the
trees in the area where our data were collected. But
following results obtained in terms of the proportion
of trees in relation to their diameter classes, classes
with diameters less than 60 cm are most important.
The number of large trees per unit area is an important
indication that this forest is an old forest or not. Low
representation of individual large diameters could be
explained by soil nutrient concentration, understory
vegetation, but also by dynamic growth of tropical
forest (Holl and Zahawi, 2014).
Our results showed that the number of large tree
decrease swiftly from 60 cm of diameter to 100 cm of
diameter. We recorded 71 trees with diameter above
60 cm against 3 trees with diameter above 100 cm,
while in the two others type of forest, we noted in the
y = 17.172x + 62.258R² = 0.2494
0
50
100
150
200
250
300
350
400
450
0 5 10 15 20 25
AG
B (M
gC.h
a-1
)
Number of species
ZTF

[Ifo, 3(10): October, 2014] ISSN: 2277-9655 Scientific Journal Impact Factor: 3.449
(ISRA), Impact Factor: 2.114
http: // www.ijesrt.com (C)International Journal of Engineering Sciences & Research Technology [2]
terra firma forest we had 77 trees with diameter above
60 cm against 15 trees with diameter above 100 cm
Lutz et al. (2012) reported that large-diameter trees
contribute disproportionately to reproduction, and
influence the rate and pattern of tree regeneration and
forest succession. However large tree density
(DBH≥70 cm) accounted for 69.8% of pan-tropical
variation but also explain the great difference we
observe between Neotropical and pantrocical forest
(Silk et al. 2013). The impact of big trees on AGB also
follows from the fact that they stored on average 25.1,
39.1 and 44.5% of AGB in South America, Southeast
Asia and Africa, respectively, but represented only
1.5, 2.4 and 3.8% of stems larger than 10 cm DBH in
these three respective regions (Slik et al. 2013). In our
study DBH up to 70 cm represent site by site from 0,36
% to 1,57 % of the tree population.
Biomass and woody density
Although the wood density it is an important
parameter, this cannot explain itself trends of mean
AGB observes in the study site. Wood density is with
the diameter the most important parameters used to
calculate aboveground biomass. Between the two
parameters, diameter revealed to be the most
important factor with a correlation R2 = 0.82. We
noted that woody density do not contributed a lot to
the prediction of aboveground biomass.
This result confirm the fact that diameter is the most
important parameter to estimate AGB of this forest.
Although the biomass of a forest is affected by variety
of factors such as age of standing trees, species
composition, topography, environmental
heterogeneity, and natural and anthropogenic
disturbance (Chave et al. 2005). This author attested
that wood density, diameter at breast height (DBH or
D) and plant height (H) are the common exogenous
variables that individually or in combination explain
biomass with deviations greater than 16 % of the
average measured tree aboveground.
The analyses of the results of woody densities
obtained indicate an average density of wood of 0.66
g.cm-3 on all of the sites studied. However this woody
density ranges from 0.23 g.m-3 to 1.01 g.m-3. The
variation of woody density varies from site to sites
across the tropical forest of this studying area. In
south-eastern of Cameroon, Falloye et al. (2013) finds
that woody density range from 0.284 to 1.152 g.cm-3
for the tree with a highest and densest wood based on
sampled of 138 trees with diameter between from 5.30
to 192.50 cm.
In our study we censured 828 trees. It is important to
note that the range of variation of the wood density
values in tropical forests is a very important aspect
which can also help us to learn more about the
structure of the humid forest, the dynamics of these
forests, and may also learn about the pedo-climate
parameters which appears during the development of
these forests.
Stegen et al. (2009) affirm that when forest biomass is
dominated by low wood density species, total basal
area declines with community. It seems that with the
age, tree woody density increase as well. In this way,
Zimmerman et al. (1994) in Stegen et al. (2009) found
that high wood density species preferentially survived
the 1989 hurricane that disturbed the Luquillo forest,
which should have resulted in above-ground biomass
being primarily held in high wood density trees. Wood
density, and if this relationship is steep enough forest
biomass will also decline with community wood
density. The department of Likouala where our data
was collected is characterized by a very high rainfall
and strong winds during the season of heavy rains. All
these phenomena do not cause the destruction of
tropical forests in this region. Indeed we have not
noted a lot dead wood debris on the ground of these
forests (Ifo et al. in preparation).
Conclusion Humid tropical forest in the North of Congo
Brazzaville contains a high value of above ground
biomass with significant variability between plots
using the pan tropical equation. This study
demonstrates the importance of large trees in the
structure of this humid tropical forest but also the
influence in the estimation of aboveground biomass.
Diameter up to 90 cm explains about 89% of AGB.
AGB was different in the tree types of forest identified
in the study area and present a slightly different with
the lower value obtained in the peat land forest. Our
results revealed the importance to collect ground data
in the context of REDD+ in which Congo RC is
committed.
Acknowledgements We express our sincere gratitude to all
smallholders involved in this study. We thank the
staffs of University of Marien Ngouabi, University of
Maryland and IFS which are funding the research time
in College Park, US. We thank also Royal society of
London for funding trip on the ground.
[Ifo, 3(10): October, 2014] ISSN: 2277-9655 Scientific Journal Impact Factor: 3.449
(ISRA), Impact Factor: 2.114
http: // www.ijesrt.com (C)International Journal of Engineering Sciences & Research Technology [3]
References 1. BACCINI A, LAPPORTE N, GOETZ SJ,
SUN M, & DONG H. 2008. A first map of
tropical Africa’s above-ground biomass
derived from satellite imagery.
Environmental Research Letters (3) 045011
doi: 10.1088/1748-9326/3/4/045011
2. BAISHYAl B R, BARI SK; UPADHAYA K.
2009. Distribution pattern of aboveground
biomass in natural and plantation forests of
humid tropics in northeast India. Tropical
Ecology 50(2): 295-304.
3. BROWN S, PEARSON T, MOORE N,
PARVEEN A, STEPHEN AMBAGIS &
SHOCH D. 2004. Impact of selective logging
on the carbon stocks of tropical forests:
Republic of Congo as a case study.
Deliverable 6: Logging impacts on carbon
stocks. Winrock International. Agency for
International Development Cooperative
Agreement No. EEM-A-00-03-00006-00.
4. CAMPBELL B & BEYOND M, 2009.
COPENHAGEN: REDD+ agriculture,
adaptation strategies and poverty. Glob.
Environ. Chang. 19: 397–399.
5. CHAVE J, OLIVIER J, BONGERS F,
CHATELET P, FORGET PM, MEER PV-D,
NORDEN N, RIERA B, & CHARLES-
DOMINIQUE P. 2008. Above-ground
biomass and productivity in a rain forest of
eastern South America. Journal of Tropical
Ecology 24:355–366.
6. DJOMO, A.N., IBRAHIMA, A.,
SABOROWSKI, J., GRAVENHORST, G.,
2010. Allometric equations for biomass
estimations in Cameroon and pan moist
tropical equations including biomass data
from Africa. Forest Ecol. Manage. 260,
1873–1885
7. BAKER, T.R., PHILLIPS, O.L., MALHI, Y.,
ALMEIDA, S., ARROYO, L., DI FIORE,
A., ERWIN, T., KILLEEN, T.J.,
LAURANCE, S.G., LAURANCE, W.F.,
2004. Variation in wood density determines
spatial patterns in Amazonian forest biomass.
Global Change Biol. 10, 545–562.
8. FAYOLLE AD, DOUCET JL, GILLET JF,
NILS BOURLAND, PHILIPPE LEJEUNE.
2013. Tree allometry in Central Africa:
testing the validity of pantropical multi-
species allometric equations for estimating
biomass and carbon stocks. Forest Ecology
and Management. 305: 29–37.
9. GIBBS H, BROWN S, NILES J, & FOLEY
J. 2007. Monitoring and estimating tropical
forest carbon stocks: making REDD a reality.
Environmental Research Letters 2:045023.
10. GIEC. 2006. Lignes directrices 2006 du
GIEC pour les inventaires nationaux de gaz à
effet de serre.
11. KIMPOUNI V, APANI Å & MOTOM M.
2013. Analyse phytoécologique de la flore
ligneuse de la Haute Sangha (République du
Congo). Adansonia, sér. 3, 35 (1): 107–134.
12. MOUTSAMBOTE 2011. Etude écologique,
phytogéographique et phytosociologique du
Congo septentrional (Plateaux, Cuvettes,
Likouala, Sangha). République du Congo.
Thèse d’Etat. Université Marien Ngouabi.
13. LUTZ JA., LARSON AJ., SWANSON M.E.,
FREUND JA. 2012. Ecological Importance
of Large-Diameter Trees in a temperate
mixed-Conifer Forest. PLoS ONE vol 7 (5).
14. VIEILLEDENT, G., VAUDRY, R.,
ANDRIAMANOHISOA, S.F.,
RAKOTONARIVO, S.O.,
RANDRIANASOLO, Z.H.,
RAZAFINDRABE, H.N., BIDAUD
RAKOTOARIVONY, C., EBELING, J.,
RASAMOELINA, M., 2012. A universal
approach to estimate biomass and carbon
stock in tropical forests using generic
allometric models. Ecol. Appl. 22, 572–583.
15. MALHI Y, & GRACE J. 2000. Tropical
forests and atmospheric carbon dioxide.
Trends in Ecology and Evolution 15:332–
337.
16. DUVEILLER G., DEFOURNY P.,
DESCLEE B., MAYAUX P. (2008).
Deforestation in Central Africa: Estimates at
regional, national and landscape levels by
advanced processing of systematically -
distributed Landsat extracts. Remote Sensing
of Environment, 112 (5), pp. 1969 – 1981 In
OFAC.
17. SEGURA M, KANNINEN M. 2005.
Allometric Models for Tree volume and total
Aboveground Biomass in a Tropical Humid
Forest in Costa Rica1BIOTROPICA 37(1):
2–8
18. SLIK F.J.W., GARY PAOLI, KRISTA
MCGUIRE, IEDA AMARAL, JORCELY
BARROSO, MEREDITH BASTIAN,
LILIAN BLANC, FRANS BONGERS,
PATRICK BOUNDJA, CONNIE CLARK,
MURRAY COLLINS, GILLES DAUBY, YI
DING, JEAN-LOUIS DOUCET,

[Ifo, 3(10): October, 2014] ISSN: 2277-9655 Scientific Journal Impact Factor: 3.449
(ISRA), Impact Factor: 2.114
http: // www.ijesrt.com (C)International Journal of Engineering Sciences & Research Technology [4]
EDUARDO ELER, LEANDRO
FERREIRA, OLLE FORSHED,
GABRIELLA FREDRIKSSON, JEAN-
FRANCOIS GILLET, DAVID HARRIS,
MIGUEL LEAL, YVES LAUMONIER,
YADVINDER MALHI, ASYRAF
MANSOR, EMANUEL MARTIN,
KAZUKI MIYAMOTO, ALEJANDRO
ARAUJO-MURAKAMI, HIDETOSHI
NAGAMASU, REUBEN NILUS, EDDY
NURTJAHYA, ÁTILA OLIVEIRA ,
ONRIZAL ONRIZAL, ALEXANDER
PARADA-GUTIERREZ, ANDREA
PERMANA, LOURENS POORTER, JOHN
POULSEN, HIRMA RAMIREZ-ANGULO,
JAN REITSMA, FRANCESCO ROVERO,
ANDES ROZAK, DOUGLAS SHEIL,
JAVIER SILVA-ESPEJO, MARCOS
SILVEIRA, WILSON SPIRONELO, HANS
TER STEEGE, TARIQ STEVART,
GILBERTO ENRIQUE NAVARRO-
AGUILAR, TERRY SUNDERLAND, EIZI
SUZUKI, JIANWEI TANG, IDA
THEILADE, GEERTJE VAN DER
HEIJDEN, JOHAN VAN VALKENBURG,
TRAN VAN DO, EMILIO VILANOVA,
VINCENT VOS, SERGE WICH,
HANNSJOERG WÖLL, TSUYOSHI
YONEDA, RUNGUO ZANG, MING-
GANG ZHANG AND NICOLE ZWEIFEL
(2013). Large trees drive forest aboveground
biomass variation in moist lowland forests
across the tropics. Global Ecology and
Biogeography, (Global Ecol.
19. HOUGHTON, R.A., 2005. Aboveground
forest biomass and the global carbon balance.
Global Change Biol. 11, 945–958.
20. HENRY, M., BESNARD, A., ASANTE,
W.A., ESHUN, J., ADU-BREDU, S.,
VALENTINI, R., BERNOUX, M., SAINT-
ANDRE, L., 2010. Wood density, phytomass
variations within and among trees, and
allometric equations in a tropical rainforest of
Africa. Forest Ecol. Manage. 260, 1375–
1388.
21. CHAVE, J., ANDALO, C., BROWN, S.,
CAIRNS, M., CHAMBERS, J., EAMUS, D.,
FÖLSTER, H., FROMARD, F., HIGUCHI,
N., KIRA, T., OTHERS, 2005. Tree
allometry and improved estimation of carbon
stocks and balance in tropical forests.
Oecologia 145, 87–99.
22. ZIMMERMAN, J.K., EVERHAM, E.M.,
WAIDE, R.B., LODGE, D.J., TAYLOR,
C.M. & BROKAW, N.V.L. (1994)
Responses of tree species to hurricane winds
in subtropical wet forest in Puerto-Rico:
Implications for tropical tree life-histories.
Journal of Ecology, 82, 911–922
23. HOLL K.D., ZAHAWI A. R., 2014. Factors
explaining variability in woody above-
ground biomass accumulation in restored
tropical forest. Forest Ecology and
Management 319 (2014) 36–43.
24. SAATCHI, S. S., HARRIS, N. L., BROWN,
S., LEFSKY, M., MITCHARD, E. T. A.,
SALAS, W., ZUTTA, B. R., BUERMANN,
W., LEWIS, S. L., HAGEN, S., PETROVA,
S., WHITE, L., SILMAN, M. & MOREL, A.
2011 In : Proceedings of the National
Academy of Sciences of the United States of
America - PNAS.108, 24, p. 9899-9904 6 p.
25. CHAVE, J., MULLER-LANDAU, H.C.,
BAKER, T.R., EASDALE, T.A., TER
STEEGE, H., WEBB, C.O., 2006. Regional
and phylogenetic variation of wood density
across 2,456 neotropical tree species.
Ecological Applications 16, 2356–2367.
26. SIERRA, C.A., DEL VALLE, J.I.,
ORREGO, S.A., MORENO, F.H.,
HARMON, M.E., ZAPATA, M.,
COLORADO, G.J., HERRERA, M.A.,
LARA, W., RESTREPO, D.E.,
BERROUET, L.M., LOAIZA, L.M.,
BENJUMEA, J.F., 2007. Total carbon stocks
in a tropical forest landscape of the Porce
region, Colombia. Forest Ecology and
Management 243, 209–309.
27. CAROLINA V. DE CASTILHO, WILLIAM
E. MAGNUSSON, R. NAZARE´ O. DE
ARAU´JO, REGINA C.C. LUIZA,
FLA´VIO J. LUIZA˜O, ALBERTINA P.
LIMA, NIRO HIGUCHI. 2006. Variation in
aboveground tree live biomass in a central
Amazonian Forest: Effects of soil and
topography. Forest Ecology and
Management 234: 85–96.
28. NASCIMENTO, H.E.M. & LAURANCE,
W.F. 2002. Total aboveground biomass in
central Amazonian rainforests: a landscape-
scale study. Forest Ecology and Management
168: 311–321
29. SIMON L. L., SONKÉ B., TERRY
SUNDERLAND et al. (2013). Above-ground
biomass and structure of 260 African tropical
forests. Philosophical Transactions of the
Royal Society B: Biological cal Sciences,
368, 20120295. doi: 10.1098/rstb.2012.0295

[Ifo, 3(10): October, 2014] ISSN: 2277-9655 Scientific Journal Impact Factor: 3.449
(ISRA), Impact Factor: 2.114
http: // www.ijesrt.com (C)International Journal of Engineering Sciences & Research Technology [5]
30. LUTZ J.A, ANDREW J. L, SWANSON
M.E., FREUND J.A. Ecological Importance
of Large-Diameter Trees in a Temperate
Mixed-Conifer Forest. Published: May 02,
2012. DOI: 10.1371/journal.pone.0036131
31. PEARSON T.R.H., BROWN S.L, BIRDSEY
R.A 2007. Measurement Guidelines for the
Sequestration of Forest Carbon. United
States Department of Agriculture. Forest
Service. 2007.
32. BROWN, S., SCHROEDER P. & BIRDSEY
R. 1997. Above ground biomass distribution
of US eastern hardwood forests and the use
of large trees as an indicator of forest
development. Forest ecology and
Management 96: 37-47.
33. TURNER, D., et al. (2005), Site‐level
evaluation of satellite‐based global terrestrial
gross primary production and net primary
production monitoring, Global Change Biol.,
11(4), 666–684. ter Steege, H., Pitman,
N.C.A., Phillips, O.L., Chave, J., Sabatier,
D., Duque, A., Molino, J.F., Pr´evost, M.F.,
Spichiger, R., Castellanos, H., von
Hildebrand, P., Vásquez, R., 2006.
Continental-scale patterns of canopy tree
composition and function across Amazonia.
Nature 443, 444–447.
34. F i e l d , C . B . , M . J . B e h r e n f e l
d , J . T . R a n d e r s o n , a n d P . F a l
k o w s k i . 1 9 9 8 . P r i ma r y p r o d u c t io
n o f t h e b io s p h e r e : integrating
terrestrial and oceanic components. Science
281:237–240.