Evaluation of ALOS/PALSAR L-band data for the estimation of Eucalyptus plantations aboveground...
12
Evaluation of ALOS/PALSAR L-band data for the estimation of Eucalyptus plantations aboveground biomass in Brazil Nicolas Baghdadi 1 , Guerric le Maire 2 , Jean-Stéphane Bailly 3 , Kenji Osé 1 , Yann Nouvellon 2 , Mehrez Zribi 4 , Cristiane Lemos 5 , Rodrigo Hakamada 5 1 IRSTEA, UMR TETIS, 34093 Montpellier Cedex 5, France 2 CIRAD, UMR Eco&Sols, 34060 Montpellier, France 3 AgroParisTech, UMR TETIS - LISAH, 34093 Montpellier Cedex 5, France 4 CESBIO, 31401 Toulouse Cedex 9, France 5 International Paper do Brasil, Rodovia SP 340, 13.840-970, Mogi Guaçu, SP, Brazil Abstract- The Phased Array L-band Synthetic Aperture Radar (PALSAR-1) has provided very useful images dataset for several applications such as forestry. L-band radar measurements have been widely used but with somewhat contradictory conclusions on the potential of this radar wavelength to estimate the aboveground biomass. The first objective of this study was to analyze the L-band SAR backscatter sensitivity to forest biomass for Eucalyptus plantations. The results showed that the radar signal is highly dependent on biomass only for values lower than 50 t/ha, which corresponds to plantations of approximately three years of age. Next, Random Forest regressions were performed to evaluate the potential of PALSAR data to predict the Eucalyptus biomass. Regressions were constructed to link the biomass to both radar signal and age of plantations. Results showed that the age was the variable that best explained the biomass followed by the PALSAR HV polarized signal. For biomasses lower than 50 t/ha, HV signal and plantation age were found to have the same level of importance in predicting biomass. For biomasses higher than 50 t/ha, plantation age was the main variable in the random forest models. The use of PALSAR signal alone did not correctly predict the biomass of Eucalyptus plantations (R² lower than 0.5 and RMSE higher than 46.7 t/ha). The use of plantation age in addition to the PALSAR signal improved slightly the prediction results (R² increased from 0.88 to 0.92 and RMSE decreased from 22.7 to 18.9 t/ha). PALSAR imagery does not allow a direct estimation of the planting date of Eucalyptus stands but can follow efficiently the occurrence of clear-cuts if images are acquired sequentially, therefore allowing a rough estimate of the following plantation date because a stand of Eucalyptus is generally re-planted 2 to 4 months after cutting. With a time series of radar images, it could be therefore possible to estimate the plantation age, and therefore improving the estimates of plantation biomass. Index Terms— L-band ALOS/PALSAR, Aboveground biomass, fast-growing plantations, short-rotation plantations, Eucalyptus, Brazil. I. INTRODUCTION orests aboveground biomass represents a major biospheric carbon pool [1]. Changes in this pool through deforestation/reforestation activities, forest degradation or regrowth lead to large CO 2 fluxes (emissions and uptake) that strongly influence the global C cycle and climate system [1],[2]. Forest biomass is also an important economic product, providing materials and energy for humans, and its spatial distribution influences some important ecosystem services such as conservation of biodiversity [3]. For all these reasons, and also for forest management and the implementation of REDD+ mechanisms, accurate and effective observation systems are required to map and monitor forest aboveground biomass stocks [4],[5]. Satellite-based estimation of carbon biomass is a promising solution in terms of i) cost- and time- effectiveness compared to large-scale field inventories, and 2) spatial coverage and temporal repetitivity. From the two last decades, a number of studies have examined the dependence of microwave backscatter on total aboveground biomass (AGB) using airborne and spaceborne Synthetic Aperture Radar (SAR). According to some reports focused on the potential of multifrequency (C-, L- and P- bands) and multipolarization data, the longer wavelengths (L- and P-bands) at a single polarization are sensitive to variations of AGB up to a certain biomass level at which the radar signal saturates [6],[7],[8],[9],[10],[11],[12],[13],[14],[15]. However, only L-band SAR is currently onboard satellites such as the PALSAR/ALOS. Spaceborne P-band is not yet available. Statistical analyses performed to evaluate the correlation between backscattering coefficient (σ 0 ) and AGB use mainly polynomial, logarithmic or sigmoid functions. For L-band, the dynamic range of the cross-polarized HV response is often larger than co-polarized HH or VV channels ([6],[7],[16],[20]). Previous studies have shown that the most F
-
Upload
independent -
Category
Documents
-
view
3 -
download
0
Transcript of Evaluation of ALOS/PALSAR L-band data for the estimation of Eucalyptus plantations aboveground...

Evaluation of ALOS/PALSAR L-band data for the estimation of
Eucalyptus plantations aboveground biomass in Brazil
Nicolas Baghdadi
1, Guerric le Maire
2, Jean-Stéphane Bailly
3, Kenji Osé
1, Yann Nouvellon
2, Mehrez Zribi
4,
Cristiane Lemos5, Rodrigo Hakamada
5
1IRSTEA, UMR TETIS, 34093 Montpellier Cedex 5, France
2CIRAD, UMR Eco&Sols, 34060 Montpellier, France
3AgroParisTech, UMR TETIS - LISAH, 34093 Montpellier Cedex 5, France
4CESBIO, 31401 Toulouse Cedex 9, France
5International Paper do Brasil, Rodovia SP 340, 13.840-970, Mogi Guaçu, SP, Brazil
Abstract- The Phased Array L-band Synthetic Aperture Radar (PALSAR-1) has provided very useful images dataset for
several applications such as forestry. L-band radar measurements have been widely used but with somewhat
contradictory conclusions on the potential of this radar wavelength to estimate the aboveground biomass. The first
objective of this study was to analyze the L-band SAR backscatter sensitivity to forest biomass for Eucalyptus plantations.
The results showed that the radar signal is highly dependent on biomass only for values lower than 50 t/ha, which
corresponds to plantations of approximately three years of age. Next, Random Forest regressions were performed to
evaluate the potential of PALSAR data to predict the Eucalyptus biomass. Regressions were constructed to link the
biomass to both radar signal and age of plantations. Results showed that the age was the variable that best explained the
biomass followed by the PALSAR HV polarized signal. For biomasses lower than 50 t/ha, HV signal and plantation age
were found to have the same level of importance in predicting biomass. For biomasses higher than 50 t/ha, plantation age
was the main variable in the random forest models. The use of PALSAR signal alone did not correctly predict the
biomass of Eucalyptus plantations (R² lower than 0.5 and RMSE higher than 46.7 t/ha). The use of plantation age in
addition to the PALSAR signal improved slightly the prediction results (R² increased from 0.88 to 0.92 and RMSE
decreased from 22.7 to 18.9 t/ha). PALSAR imagery does not allow a direct estimation of the planting date of Eucalyptus
stands but can follow efficiently the occurrence of clear-cuts if images are acquired sequentially, therefore allowing a
rough estimate of the following plantation date because a stand of Eucalyptus is generally re-planted 2 to 4 months after
cutting. With a time series of radar images, it could be therefore possible to estimate the plantation age, and therefore
improving the estimates of plantation biomass.
Index Terms— L-band ALOS/PALSAR, Aboveground biomass, fast-growing plantations, short-rotation plantations, Eucalyptus,
Brazil.
I. INTRODUCTION
orests aboveground biomass represents a major
biospheric carbon pool [1]. Changes in this pool through
deforestation/reforestation activities, forest degradation or
regrowth lead to large CO2 fluxes (emissions and uptake) that
strongly influence the global C cycle and climate system
[1],[2]. Forest biomass is also an important economic product,
providing materials and energy for humans, and its spatial
distribution influences some important ecosystem services
such as conservation of biodiversity [3]. For all these reasons,
and also for forest management and the implementation of
REDD+ mechanisms, accurate and effective observation
systems are required to map and monitor forest aboveground
biomass stocks [4],[5]. Satellite-based estimation of carbon
biomass is a promising solution in terms of i) cost- and time-
effectiveness compared to large-scale field inventories, and 2)
spatial coverage and temporal repetitivity.
From the two last decades, a number of studies have
examined the dependence of microwave backscatter on total
aboveground biomass (AGB) using airborne and spaceborne
Synthetic Aperture Radar (SAR). According to some reports
focused on the potential of multifrequency (C-, L- and P-
bands) and multipolarization data, the longer wavelengths (L-
and P-bands) at a single polarization are sensitive to variations
of AGB up to a certain biomass level at which the radar signal
saturates [6],[7],[8],[9],[10],[11],[12],[13],[14],[15]. However,
only L-band SAR is currently onboard satellites such as the
PALSAR/ALOS. Spaceborne P-band is not yet available.
Statistical analyses performed to evaluate the correlation
between backscattering coefficient (σ0) and AGB use mainly
polynomial, logarithmic or sigmoid functions. For L-band, the
dynamic range of the cross-polarized HV response is often
larger than co-polarized HH or VV channels
([6],[7],[16],[20]). Previous studies have shown that the most
F

suitable SAR incidence angle in biomass retrieval is in the
range 30°-45° ([17],[18],[19]). Observations at lower
incidence angles (20°–30°) will allow higher penetration into
the forest canopy and potentially larger sensitivity to biomass.
However, at these incidence angles, the contribution of the
ground increases, in particular for low biomasses, hence
increasing the error on the biomass estimates. The level of
signal saturation occurs when AGB exceeds approximately
60-100 t/ha. On the L-band SAR, various forest types have
been investigated. Le Toan et al. [16], Wu et al. [21], and
Dobson et al. [8] reported in coniferous forests (maritime pine
and loblolly pine) a backscatter saturation aboveground
biomass levels of 100 t/ha. According to Imhoff [22], the
practical saturation thresholds occur before the regression
maxima due to the large residuals near the point of inflection
and beyond it and the biomass saturation levels would be
rather close to 40 t/ha. Rignot et al. [6], Ranson et al. [9] and
Sandberg et al. [23] observed in boreal forests (conifer and
deciduous trees) that the backscatter intensity increases with
biomass up to 100-150 t/ha. In tropical forests (broadleaf
evergreen trees), Luckmann et al. [7],[24], who has
investigated regenerating forests in the Central Amazon basin,
reported a saturation point around 60 t/ha. The results
presented in that study focused on mono-specific and even-
aged forests with a relatively flat topography. Some studies
applied on mixed-species forests without species-
discrimination, obtained similar saturation levels.
As argued by Woodhouse et al. [25], the radar backscatter is
not a ‘direct measure’ of forest biomass. It may be strongly
affected by the forest structure ([10],[11],[26],[27],[28]) as
well as its spatial variability [12]. Hence, the backscatter
saturation depends on stand characteristics related to biomass
such as the size, density, and spatial distribution of the stems,
branches and leaves.
Regardless of slope and surface roughness characteristics,
the backscatter signal may also be affected by surface and
vegetation moisture conditions. Few studies investigated this
issue and there is no consensus among scientists [20],[29].
Nevertheless, Lucas et al. [20] demonstrated the greater
sensitivity of L-band HH to surface moisture. While the forest
AGB at backscatter saturation level remains similar for L-
band HV under conditions of relative maximum surface
moisture, it is reduced for L-band HH. An analysis of the radar
backscatter from Eucalyptus plantations in Congo showed that
the L-HH signal was strongly influenced by the ground
surface [29]. This direct contribution of the ground surface
depended mainly on the soil moisture and roughness.
Luckman et al. [24] observed a variation of dynamic range
and saturation in backscatter (L-band HH, JERS-1) within
seasonal cycle. For Harrell et al. [13], the presence of wet soils
introduces an additional source of variability that increases the
RMS error of the predictive biomass equations. In of these
studies, the dry season was found to be the most suitable
acquisition period for biomass retrieval purpose.
More complex approaches were presented in studies dealing
with the use of SAR data for biomass estimation ([30],[31]):
the synergistic use of multiple-channel radar imagery (for
instance the use of HV backscattering from two channels, a
longer wavelength (P- or L- band) and a shorter wavelength
(C-band or X-band)) ([9],[32]), the use of different
polarizations ([6],[14]) and the use of multiple-step
approaches ([11],[13],[33]) that take into account separate
layers of forest and finally determine total aboveground
biomass. Those methods would allow higher biomass
estimation (up to 200-600 t/ha according to forest stands) with
a better precision than correlations between total biomass and
radar backscatter from a single frequency/polarization system.
Whatever the method applied, it is necessary to stratify the
forests into categories following their characteristics
(structure, specie, moisture conditions) before applying SAR
backscatter-based biomass estimation models.
The objective of this study was to assess the potential of
PALSAR L-band data for the estimation of the Eucalyptus
plantation aboveground biomass in Brazil. Recently, Gama et
al. [34] used airborne interferometric and polarimetric SAR
data in X and P bands to estimate Eucalyptus Biomass in the
southeast region of Brazil. A Eucalyptus biomass model was
obtained with a prediction error of around 10% on the retrieval
of Eucalyptus biomass. It used the canopy scattering index
calculated from the P band backscatter magnitude data and the
interferometric height defined by the difference between
interferometric digital elevation model in X and P bands. Le
Maire et al. [35] proposed an efficient method based on the
use of MODIS NDVI time-series, bioclimatic data and soil
type for estimating Eucalyptus plantation biomass: the age of
the plantation and the NDVI integrated over the first two years
of plantation growth were used to estimate wood biomass with
an accuracy of about 25 m3/ha, corresponding to about 13 t/ha.
Baghdadi et al. [36] tested the use of ICESat/GLAS satellite
LiDAR data for estimating aboveground biomass in the same
Eucalyptus plantations. First, the height of planted Eucalyptus
forest stands was estimated from GLAS waveform metrics.
Next, the aboveground biomass was estimated using a power
law model between the biomass and the GLAS-derived height,
giving a final accuracy of 16.1 t/ha for biomass values up to
170 t/ha.
In this study, the Random Forest regression method was
used to assess the possibility of estimating accurately
Eucalyptus stand biomass from the radar signal only, or from
the radar signal plus the plantation age. A description of study
area, SAR images and in situ measurements is given in
Section II, followed by the sensitivity analysis of PALSAR
signal to aboveground biomass. The potential of PALSAR
images for the detection of plantation harvest is discussed in
section III. Finally, the results obtained for the estimation of
the biomass using PALSAR images and the Random Forest
method are presented and discussed in Section IV.
II. DATASETS DESCRIPTION
A. Study area
The study area was located in the state of São Paulo, Brazil,
ranging from 46°49’ to 48°10’ longitude West and from
20°30’ to 22°34’ latitude South (Figure 1). The study is
focused on industrial fast-growing Eucalyptus plantations
managed to produce pulpwood for paper production by the

International Paper do Brasil company. They were planted
with seedlings or clones of E. grandis (W. Hill ex Maiden) x
E. urophylla (S.T. Blake) hybrids, arranged in rows at a
density of approximately 1300 trees/ha. Tree mortality after
planting is very low (less than 7%; [37]). They are harvested
(plantation clear-cutting) every six to seven years.. The annual
increment varied according to the growth stage, soil type
management practices (clone, fertilization) and climatic
conditions but was generally higher than 30 m3/ha/year,
sometimes reaching values as high as 60 m3/ha/year, thus
leading to harvested volume of 250-300 m3/ha. These
plantations were managed locally by stand units of variable
area (~50 hectares on average for studied stands).
Management practices were uniform within each stand (e.g.
harvesting and weeding dates, genetic material, soil
preparation and fertilization). Chemical weeding was carried
out during the first two years after planting, resulting in a very
sparse understory and herbaceous strata in these plantations.
The stands were rather simply structured with a crown layer of
3 to 10 m in width above a dense “trunk layer” ranging from 0
(in the first months) up to more than 20 m in height with very
few understories (Figure 2). Branches biomass is almost
constant during the plantation growth, with approximately 2
t/ha of living branches and 2 t/ha of dead branches. It can
represent a significant amount of the total carbon content of
the stand at the beginning of the rotation (< 1 year), but at the
end of the rotation it account for less than 10% [38]. Branches
are generally thin and oriented upward.
In the study area, the stands were established in a low to
moderate topographic relief (slope under 7°).
Figure 1: Study site, Eucalyptus stands, and the coverage of PALSAR images.
One year old
Two years old
Four years old
During harvest
Figure 2: Photos illustrating the Eucalyptus plantations at different ages: one
year, two years, four years, and during harvest (seven years).
B. ALOS/PALSAR data
Twelve radar images acquired by the Advanced Land
Observing Satellite’s Phased Array-type L-band Synthetic
Aperture Radar (ALOS/PALSAR) were used in this study
(Table 1). These images were acquired between July 2007 and
August 2009 with dual polarization (HH and HV), incidence
angles of 34.3°, and 12.5 m x 12.5 m pixel size. Radiometric
calibration of PALSAR images were performed for obtaining
the backscattering coefficients (°).
Before calculating the mean backscattering coefficient of
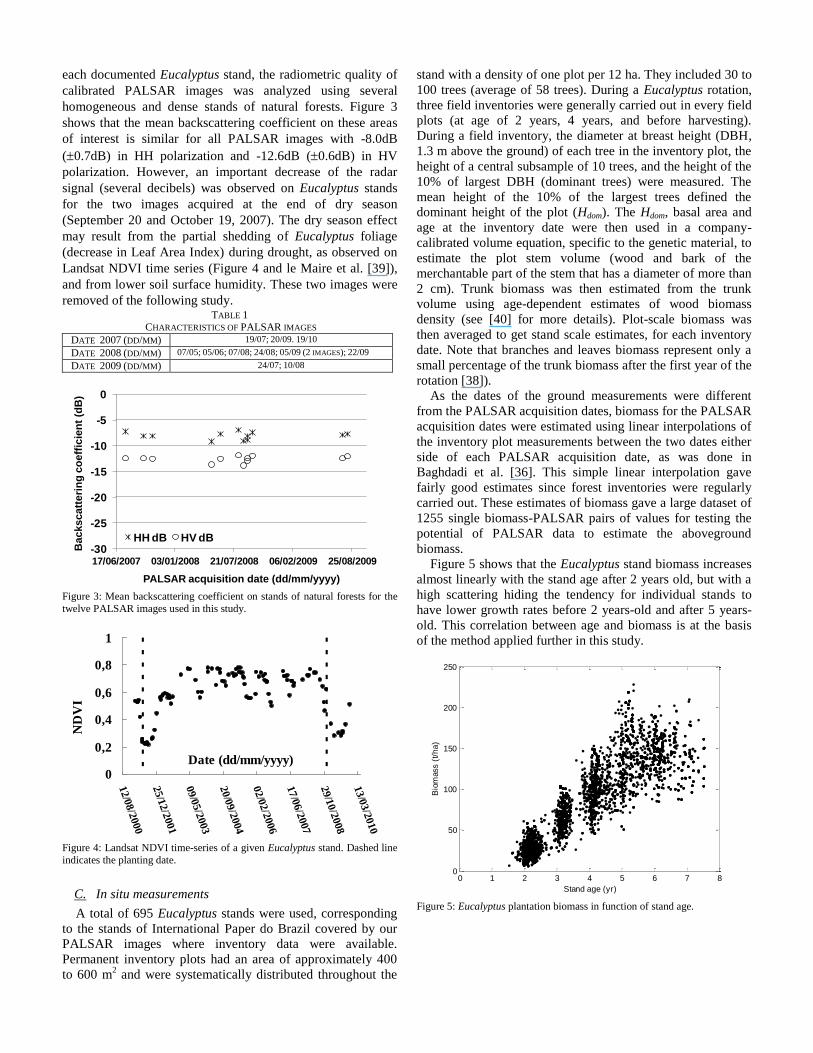
each documented Eucalyptus stand, the radiometric quality of
calibrated PALSAR images was analyzed using several
homogeneous and dense stands of natural forests. Figure 3
shows that the mean backscattering coefficient on these areas
of interest is similar for all PALSAR images with -8.0dB
(0.7dB) in HH polarization and -12.6dB (0.6dB) in HV
polarization. However, an important decrease of the radar
signal (several decibels) was observed on Eucalyptus stands
for the two images acquired at the end of dry season
(September 20 and October 19, 2007). The dry season effect
may result from the partial shedding of Eucalyptus foliage
(decrease in Leaf Area Index) during drought, as observed on
Landsat NDVI time series (Figure 4 and le Maire et al. [39]),
and from lower soil surface humidity. These two images were
removed of the following study. TABLE 1
CHARACTERISTICS OF PALSAR IMAGES
DATE 2007 (DD/MM) 19/07; 20/09. 19/10
DATE 2008 (DD/MM) 07/05; 05/06; 07/08; 24/08; 05/09 (2 IMAGES); 22/09
DATE 2009 (DD/MM) 24/07; 10/08
-30
-25
-20
-15
-10
-5
0
17/06/2007 03/01/2008 21/07/2008 06/02/2009 25/08/2009
Backscatt
eri
ng
co
eff
icie
nt
(dB
)
PALSAR acquisition date (dd/mm/yyyy)
HH dB HV dB
Figure 3: Mean backscattering coefficient on stands of natural forests for the
twelve PALSAR images used in this study.
0
0,2
0,4
0,6
0,8
1
12/0
8/2
000
25/1
2/2
001
09/0
5/2
003
20/0
9/2
004
02/0
2/2
006
17/0
6/2
007
29/1
0/2
008
13/0
3/2
010
Date (dd/mm/yyyy)
ND
VI
Figure 4: Landsat NDVI time-series of a given Eucalyptus stand. Dashed line
indicates the planting date.
C. In situ measurements
A total of 695 Eucalyptus stands were used, corresponding
to the stands of International Paper do Brazil covered by our
PALSAR images where inventory data were available.
Permanent inventory plots had an area of approximately 400
to 600 m2 and were systematically distributed throughout the
stand with a density of one plot per 12 ha. They included 30 to
100 trees (average of 58 trees). During a Eucalyptus rotation,
three field inventories were generally carried out in every field
plots (at age of 2 years, 4 years, and before harvesting).
During a field inventory, the diameter at breast height (DBH,
1.3 m above the ground) of each tree in the inventory plot, the
height of a central subsample of 10 trees, and the height of the
10% of largest DBH (dominant trees) were measured. The
mean height of the 10% of the largest trees defined the
dominant height of the plot (Hdom). The Hdom, basal area and
age at the inventory date were then used in a company-
calibrated volume equation, specific to the genetic material, to
estimate the plot stem volume (wood and bark of the
merchantable part of the stem that has a diameter of more than
2 cm). Trunk biomass was then estimated from the trunk
volume using age-dependent estimates of wood biomass
density (see [40] for more details). Plot-scale biomass was
then averaged to get stand scale estimates, for each inventory
date. Note that branches and leaves biomass represent only a
small percentage of the trunk biomass after the first year of the
rotation [38]).
As the dates of the ground measurements were different
from the PALSAR acquisition dates, biomass for the PALSAR
acquisition dates were estimated using linear interpolations of
the inventory plot measurements between the two dates either
side of each PALSAR acquisition date, as was done in
Baghdadi et al. [36]. This simple linear interpolation gave
fairly good estimates since forest inventories were regularly
carried out. These estimates of biomass gave a large dataset of
1255 single biomass-PALSAR pairs of values for testing the
potential of PALSAR data to estimate the aboveground
biomass.
Figure 5 shows that the Eucalyptus stand biomass increases
almost linearly with the stand age after 2 years old, but with a
high scattering hiding the tendency for individual stands to
have lower growth rates before 2 years-old and after 5 years-
old. This correlation between age and biomass is at the basis
of the method applied further in this study.
0 1 2 3 4 5 6 7 80
50
100
150
200
250
Stand age (yr)
Bio
mass (
t/h
a)
Figure 5: Eucalyptus plantation biomass in function of stand age.

III. METHODOLOGY
This study will analyze first the sensitivity of PALSAR L-
band SAR signal on the aboveground biomass of Eucalyptus
plantations. As shown in the literature, the estimate of the
biomass is usually possible with SAR signal for a certain
range of biomass values, and beyond a given threshold the
radar signal becomes insensitive to the biomass
([6],[7],[8],[9],[10],[11],[12],[13],[14],[15]). The L-band radar
signal saturation threshold is very different from one study to
another due in particular to the characteristics of the
vegetation (thresholds between 40 to 150 t/ha, e.g. [41]). This
analysis of the radar signal on Eucalyptus stands will allow us
to determine the range of biomass values for which the radar
signal may be used alone to estimate biomass with acceptable
accuracy. This PALSAR saturation threshold will be
determined according to HH and HV polarizations.
The second part of this study analyzes the accuracy of
aboveground biomass estimates obtained from the PALSAR
signal alone, or from the PALSAR signal and the plantation
age as a additional information. Then, the potential of
PALSAR images for estimating the plantation age will be
evaluated. Finally, nonlinear nonparametric regressions will
be performed in order to estimate wood biomass as accurately
as possible.
IV. PALSAR BEHAVIOUR ANALYSIS
The mean backscattering coefficient was computed for each
reference stand and each polarization. Figure 6 shows that the
PALSAR signal increases with the aboveground biomass until
a saturation threshold. For biomasses below 30-50 t/ha, the
radar signal showed a high sensitivity to biomass values. After
this threshold, the radar signal saturated. This threshold value
of the biomass was relatively low when compared to the
biomass of our Eucalyptus stands after 3 years of age. Results
also showed that the HV polarization (σ°HV) produced better
correlation (R²=0.85) with the biomass than the HH
polarization (σ°HH) (R²=0.71). This better correlation
between σ°HV and the biomass is mainly due to volume
scattering which enhances the cross-polarization returns with
the increase in biomass (e.g. [14],[18],[27],[42],[43]).
The relationship between the PALSAR signal in HH
polarization and biomass is noisier than in HV band. Mitchard
et al. [28] also observed in HH high fluctuations for PALSAR
data acquired in the wet season and low fluctuations for JERS
data acquired during the dry season. They explained that the
soil moisture effect during the wet season could be responsible
of the observed high fluctuation in the radar signal at HH
polarization as well as structural variation within a stand.
Collins et al. [43] argued that σoHV is less influenced by soil
and vegetation moisture than σoHH.
The scattering mechanisms contributing to the total
backscatter depends on forest structure (characteristics of
leaves, branches and trunks). Several results of SAR modeling
based on the simulation model of Karam ([44]) indicated that
for Mangrove forests ([45],[46]) the return signal was mainly
dominated in HV polarization by the volume scattering (crown
layer: leaves and branches) for forests with high biomass
values (>30-50 t/ha). For biomass values lower than 30-50
t/ha, the volume scattering and the interactions between the
tree components and the ground contribute equally to L-HV.
For the HH polarization, the total backscatter was dominated
for biomasses lower than 200 t/ha by the interactions between
the larger branches and trunks and also ground surface. At L-
HH and biomass values higher than 200 t/ha, the volume
scattering increased and the ground-vegetation interactions
decreased with the increase of biomass.
According to the structure of Eucalyptus forests, we
suppose that the contributing scattering mechanisms on the
total backscatter are the same for both Eucalyptus and
Mangrove forests with probably different magnitudes because
Mangrove forests contains higher trees with bigger branches
in comparison to Eucalyptus forests.
Imhoff [10], based on simulations using the Michigan
Microwave Canopy Scattering model (MIMICS), showed that
the effect of forest structure on SAR backscatter can be
significant for forests with equivalent aboveground biomass.
These results explain the different biomass saturation limits
observed in numerous studies, and the difficulty to propose a
universal SAR biomass equation for Globe’s forest.
The increase of radar backscatter (σ°) against aboveground
biomass (B) followed a logarithmic or exponential behavior
(e.g. [28],[47],[48]). The best fitting relationship between
PALSAR signal and the biomass was found in using an
exponential model:
σ° = α + β (1 – e-µB
) (1)
where σ° and B are expressed in dB and t/ha respectively.
The coefficients α, β and µ were fitted using a least squares
fitting method. For HH polarization, α= -15.36, β= 7.28 and
µ= 0.08 with R²= 0.71. For HV, the following values were
found: α= -24.11, β= 9.11 and µ= 0.09 with R²= 0.88.
Imhoff [22] analyzed the effect of forest structure on the
radar signal for several forest stands (natural forest and
plantations including Eucalyptus). He showed that the radar
signal was mainly correlated with the surface area (SA) to
vegetation volume (V) (i.e Biomass/wood density) ratio, rather
than the volume only. For a same aboveground biomass,
Eucalyptus stands have the lower values of SA/V ratio than
natural forests. He showed that for both low and high
biomasses (between 50 and 300 t/ha), σ°HV in L-band
decreased when SA/V decreased. For low values of biomass
(50 t/ha), the decrease of σ°HV was about 3dB when SA/V
decreased from 617 m-1
(one year old regenerating tropical
forest) to 90 m-1
(Eucalyptus plantations aged 5 years old and
more). For high biomass (300 t/ha), σ°HV decreased by about
9dB for a decrease of SA/V from 254 m-1
(tropical evergreen
rain forest) to 84 m-1
(Tropical evergreen and tropical
deciduous plantations). In our data, the trunk SA/V values
(under the realistic hypothesis that branches have a very low
volume and surface compared to the trunk) are comprised
between 100 m-1
at 2 years of age and 60 m-1
at 6 years of age,
therefore a rather low amplitude. This result explains the
observed low dynamic of radar signal for our Eucalyptus

stands (low SA/V) in comparison to other forest types where
SA/V is generally higher.
(a)
-20
-15
-10
-5
0
0 25 50 75 100 125 150 175 200 225 250 275 300
HH
Ba
ckca
tter
(d
B)
Biomass (Mg/ha)
19/07/2007 07/05/2008 05/06/2008 07/08/2008
24/08/2008 05/09/2008(1) 05/09/2008(2) 22/09/2008
24/07/2009 10/08/2009
(b)
-30
-25
-20
-15
-10
0 25 50 75 100 125 150 175 200 225 250 275 300
HV
Ba
ckca
tter
(d
B)
Biomass (Mg/ha)
19/07/2007 07/05/2008 05/06/2008 07/08/2008
24/08/2008 05/09/2008(1) 05/09/2008(2) 22/09/2008
24/07/2009 10/08/2009
Figure 6: Relationships between PALSAR signal and aboveground biomass:
(a) HH polarization and (b) HV polarization.
V. HARVEST DETECTION FROM PALSAR
In general, Eucalyptus stands are re-planted 2 to 4 months
after clear-cutting. Radar imagery does not allow to estimate
directly the planting date but can provide an approximation of
it through the accurate estimate of the clear-cut date if the
temporal resolution of images is high. In this section, the
opportunity to detect the clearcuts using PALSAR images will
be analyzed at HH and HV polarizations. This harvesting date
retrieval is possible with optical satellite images ([35]), but
radar images can be very effective in areas with dense cloud
covers.
Figure 7 shows that the PALSAR images are suitable to
monitor the Eucalyptus harvest. The radar signal decreases
after the clearcut by about -7dB in HV (decreases from -16dB
for mature Eucalyptus to -23dB for recently harvested
Eucalyptus.) and -5.5dB in HH (decreases from -10dB for
mature Eucalyptus to -15.5dB after the cut.) (Figs 7a and 7b,
plot A). The clearcut remains easily detectable on PALSAR
images for data acquired less than one year after the harvest,
with 3dB difference in radar signal between harvested plots
and mature Eucalyptus plots (Figs 7c and 7d, plot B harvested
in October 2006). After 18 months, the difference in radar
signal becomes negligible (<1dB) (Figs 7c and 7d, plot B,
June 2008).
-27
-24
-21
-18
-15
-12
HV
backscatt
er
(dB
)
Date (dd/mm/yyyy)
Plot A: Harvest date
(a)
-18
-15
-12
-9
-6
-3
HH
ba
cks
catt
er
(dB
)
Date (dd/mm/yyyy)
Plot A: Harvest date
(b)
-27
-24
-21
-18
-15
-12
HV
ba
ck
sc
att
er
(dB
)
Date (dd/mm/yyyy)
Plot B: Harvest date
(c)
-18
-15
-12
-9
-6
-3
HH
backscatt
er
(dB
)
Date (dd/mm/yyyy)
Plot B: Harvest date
(d)
Figure 7: Time sequences of PALSAR backscatter signal at HV and HH
polarizations for two Eucalyptus reference plots (A and B). According to the inventories, plot A was harvested in January 2009 while plot A was harvested
in October 2006.
VI. BIOMASS ESTIMATION
Random Forest (RF) models [49] were used to evaluate the
potential of PALSAR data to predict the Eucalyptus biomass.
This non-parametric ensemble learning technic, based on the
vote ensemble of a forest of randomized regression trees, has
been proved to outperform other regression technics in
forested biophysical parameters estimation from optical
([35],[50]), radar [51] or lidar data [52]. RF have tremendous
analytical and operational flexibility, it can deal with problems
of unbalanced and small sized training datasets. Moreover, it
is robust to overfitting [49],[53]. Several recent studies have
demonstrated the utility of RF for the prediction of forest
structure attributes [53].
The dataset were randomly divided into 90% training and
10% validation data samples (1130 and 125, respectively).
The prediction error based on a 10-fold cross-validation was
estimated for each configuration in order to validate the
predictive performance of the Random Forest.
Regressions were constructed to link the biomass to both
radar signal and plantation age. Several configurations were
tested and the performance of the Random Forest algorithm on
the PALSAR data was investigated using: (1) σ°HH alone; (2)
σ°HV alone; (3) σ°HH and σ°HV; (4) Age alone; (5) σ°HH
and Age; (6) σ°HV and Age; and (7) σ°HH and σ°HV and
Age.
The performance of the Random Forest regression for each
studied configuration was analyzed from the comparison
between measured and predicted biomasses, using the
coefficient of determination R² and the root mean squared
error (RMSE). First, the relative importance of different
variables used in the various random forest models was
investigated. Results showed that the plantation age was the
variable which best explained the biomass followed by the
PALSAR HV polarized signal. Better results were obtained
with PALSAR signal in HV than in HH, as was already seen
from the exponential fit of Equation 1.
The analyses of PALSAR signal according to biomass
showed that the dynamic of the signal was very strong for
biomasses lower than 50 t/ha (i.e. for plantation age < 3 yrs)
(Figure 6). Thus, the importance of different variables (age,
HV and HH) in the models was analyzed separately for
biomasses lower than 50 t/ha and higher than 50 t/ha. For
biomasses lower than 50 t/ha, results showed that the HV
signal and the age of plantation have the same level of
importance in predicting the biomass and that the importance
of HH signal is slightly lower. For biomasses higher than 50
t/ha, the age of plantation is the relevant variable.
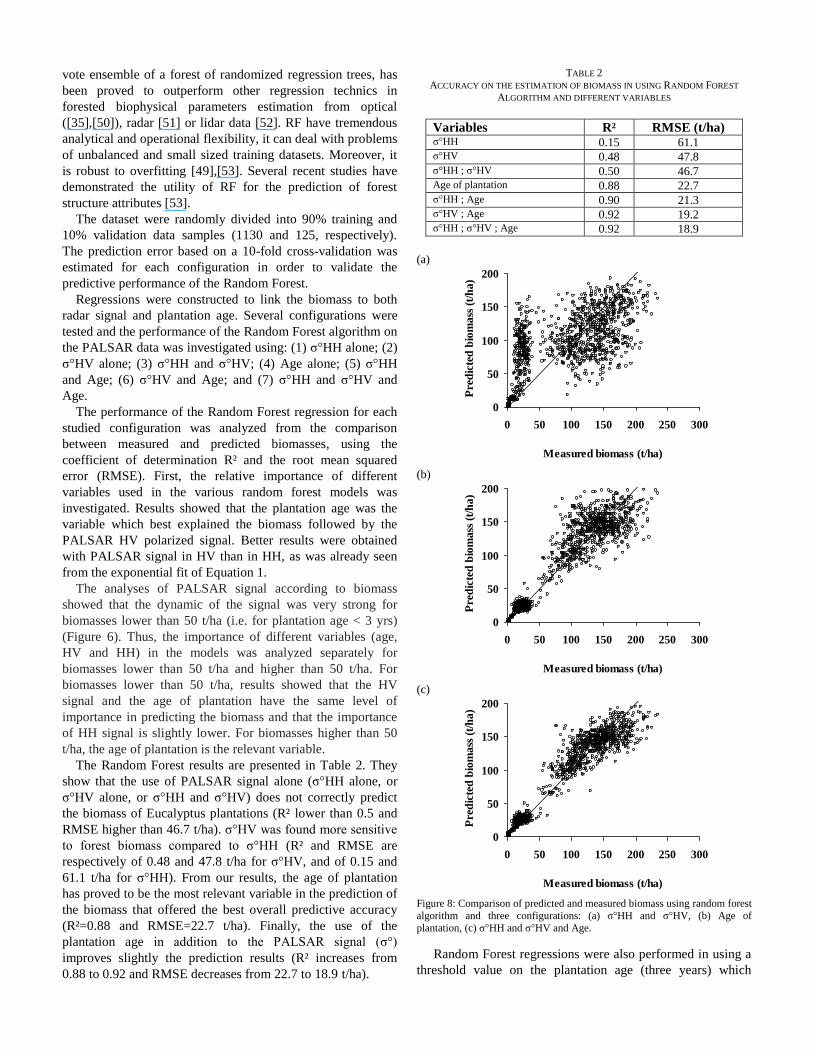
The Random Forest results are presented in Table 2. They
show that the use of PALSAR signal alone (σ°HH alone, or
σ°HV alone, or σ°HH and σ°HV) does not correctly predict
the biomass of Eucalyptus plantations (R² lower than 0.5 and
RMSE higher than 46.7 t/ha). σ°HV was found more sensitive
to forest biomass compared to σ°HH (R² and RMSE are
respectively of 0.48 and 47.8 t/ha for σ°HV, and of 0.15 and
61.1 t/ha for σ°HH). From our results, the age of plantation
has proved to be the most relevant variable in the prediction of
the biomass that offered the best overall predictive accuracy
(R²=0.88 and RMSE=22.7 t/ha). Finally, the use of the
plantation age in addition to the PALSAR signal (σ°)
improves slightly the prediction results (R² increases from
0.88 to 0.92 and RMSE decreases from 22.7 to 18.9 t/ha).
TABLE 2
ACCURACY ON THE ESTIMATION OF BIOMASS IN USING RANDOM FOREST
ALGORITHM AND DIFFERENT VARIABLES
Variables R² RMSE (t/ha) σ°HH 0.15 61.1 σ°HV 0.48 47.8 σ°HH ; σ°HV 0.50 46.7 Age of plantation 0.88 22.7 σ°HH ; Age 0.90 21.3 σ°HV ; Age 0.92 19.2 σ°HH ; σ°HV ; Age 0.92 18.9
(a)
0
50
100
150
200
0 50 100 150 200 250 300
Measured biomass (t/ha)
Pre
dic
ted
bio
ma
ss (
t/h
a)
(b)
0
50
100
150
200
0 50 100 150 200 250 300
Measured biomass (t/ha)
Pre
dic
ted
bio
ma
ss (
t/h
a)
(c)
0
50
100
150
200
0 50 100 150 200 250 300
Measured biomass (t/ha)
Pre
dic
ted
bio
ma
ss (
t/h
a)
Figure 8: Comparison of predicted and measured biomass using random forest
algorithm and three configurations: (a) σ°HH and σ°HV, (b) Age of
plantation, (c) σ°HH and σ°HV and Age.
Random Forest regressions were also performed in using a
threshold value on the plantation age (three years) which

corresponds to the saturation limit of the radar signal with the
biomass. Regressions were constructed to link the biomass to
both radar signal and plantation age, using separately stands
with plantation age lower and higher than three years: (1)
σ°HH and σ°HV and Age with Age < 3 years, and (2) σ°HH
and σ°HV and Age with Age > 3 years. Estimated biomass
accuracy were 5.0 t/ha and 23.4 t/ha for plantation age lower
and higher than three years, respectively. The higher accuracy
until 3 years could be an opportunity to apply these results,
using PALSAR as a tool to capture the quality of silviculture
activities, once it affects the initial growth of the stand [54].
The overall accuracy (RMSE=18.4 t/ha) is close to the
accuracy obtained by the regression without threshold on the
plantation age (RMSE=18.9 t/ha).
Figure 8 shows examples of comparisons between
measured and predicted biomasses, obtained from a selection
of variables in the random forest algorithm. Without the use of
the age of plantation, random forest tended to over-estimate
biomass below 50 t/ha and under-estimate biomass above 50
t/ha (Figure 8a). Using plantation age in the regressions
provided much better results (Figures 8b and 8c).
VII. CONCLUSION
This study aimed to examine the potential of L-band SAR
images to estimate biomass in Eucalyptus plantations.
Random Forest regressions were performed and evaluated for
biomass estimation. As in some previous studies, a rapid
saturation of PALSAR signal with increasing biomass was
observed (threshold of about 50 t/ha). Some other studies
found a much higher threshold with saturation occurring for
biomass levels of about 150-200 t/ha [27],[32],[43]).The large
range of L-band saturation thresholds reported in the literature
(i.e from 30 to 200 t/ha) was mainly ascribed to the variability
in vegetation structure across forest ecosystems ([25]).
Our results suggest that for fast-growing Eucalyptus
plantations, it might be necessary to combine the
backscattered signal with other data sources, such as the
plantation age, that is accessible from SAR imagery itself, in
order to obtain accurate biomass estimates, especially for high
biomass levels. The overall accuracy for the Random Forest
regression using the plantation age and the PALSAR
backscattered signals in HH and HV polarizations was 18.9
t/ha, a much better result than those obtained with regressions
based only on the backscattered signals (RMSE=46.7 t/ha).
Furthermore, for high biomass levels, the Random Forest
regression tended to underestimate the biomass.
With the upcoming launch of ALOS-2 sensor, the L-band
radar data could be used to provide good estimates of the
biomass of Eucalyptus. The probable arrival of BIOMASS P-
band sensor (planned by the European Space Agency; [55])
should allow improved estimates of biomass with higher
dynamic of the radar signal according to biomass (saturation
of radar signal for biomass higher in P-band than in L-band).
Results of this study showed that the acquisition of SAR
images in the same season is necessary for biomass
estimation. Indeed, important differences in the radar signal
were observed between images acquired in different seasons
(water stress in the dry season), which makes the estimation of
biomass inaccurate from SAR images acquired at different
seasons.
ACKNOWLEDGMENT
This research was supported by the French Space Study
Center (CNES, DAR 2014 TOSCA). The authors wish to
thank the European Space Agency (ESA) and the Japan
Aerospace Exploration Agency (JAXA) for the distribution of
PALSAR/ALOS images (project AOALO 3610).
The authors acknowledge International Paper do Brasil, and
in particular José Mario Ferreira and Sebastiaõ Oliveira, for
providing data and technical help. We also extend our thanks
to Claire Marsden (International Centre for Higher Education
in Agricultural Sciences, SupAgro, Montpellier, France) for
her participation in the inventory data preparation.
REFERENCES
[1] Y. Pan, R.A. Birdsey, J. Fang, R. Houghton, P.E. Kauppi, W.A. Kurz, O.L. Phillips, A. Shvidenko, S.L. Lewis, J.G. Canadell, P. Ciais, R.B.
Jackson, S.W. Pacala, A.D. McGuire, S. Piao, A. Rautiainen, S. Sitch,
and D. Hayes", A large and persistent carbon sink in the world's forests", Science, 333 (6045), 988-993, 2011.
[2] R.A. Houghton, J.I. House, J. Pongratz, G.R. Van Der Werf, R.S.
Defries, M.C. Hansen, C. Le Quéré, and N. Ramankutty, "Carbon emissions from land use and land-cover change", Biogeosciences, 9,
5125-5142, 2012.
[3] T. Le Toan, S. Quegan, M.W.J. Davidson, H. Balzter, P. Paillou, K. Papathanassiou, S. Plummer, F. Rocca, S. Saatchi, H. Shugart, and L.
Ulander, "The BIOMASS mission: Mapping global forest biomass to
better understand the terrestrial carbon cycle", Remote Sensing of Environment, vol. 115, 2850-2860, 2011.
[4] R. Birdsey, Y. Pan, and R.A. Houghton, "Sustainable landscapes in a
world of change: tropical forests, land use and implementation of REDD+: Part I", Carbon Management, 4, 465-468, 2013.
[5] R.A. Houghton, "The emissions of carbon from deforestation and
degradation in the tropics: past trends and future potential", Carbon Management, 4, 539-546, 2013.
[6] E. Rignot, J. Way, C. Williams, and L. Viereck, "Radar estimates of aboveground biomass in boreal forests of interior Alaska", IEEE
Transactions on Geoscience and Remote Sensing, vol. 32, 1117–
1124, 1994. [7] A. Luckman, J. Baker, T.M. Kuplich, C. da Costa Freitas Yanasse,
and A.C. Frery, "A study of the relationship between radar
backscatter and regenerating tropical forest biomass for spaceborne SAR instruments", Remote Sensing of Environment, vol. 60, 1–13,
1997.
[8] M.C. Dobson, F.T. Ulaby, T. LeToan, A. Beaudoin, E.S. Kasischke, and N. Christensen, N., "Dependence of radar backscatter on
coniferous forest biomass", IEEE Transactions on Geoscience and
Remote Sensing, vol. 30, 412–415, 1992. [9] K. Ranson, and G. Sun, "Mapping biomass of a northern forest using
multifrequency SAR data", IEEE Transactions on Geoscience and
Remote Sensing, vol. 32, 388–396, 1994. [10] M.L. Imhoff, "Radar backscatter and biomass saturation:
ramifications for global biomass inventory", IEEE Transactions on
Geoscience and Remote Sensing, vol. 33, 511–518, 1995. [11] E.S. Kasischke, N.L. Christensen, and L.L., Bourgeau-Chavez,
"Correlating radar backscatter with components of biomass in loblolly
pine forests", IEEE Transactions on Geoscience and Remote Sensing, vol. 33, 643–659, 1995.
[12] S. Saatchi, M. Marlier, R.L. Chazdon, D.B. Clark, and A.E. Russell,
"Impact of spatial variability of tropical forest structure on radar estimation of aboveground biomass", Remote Sensing of
Environment, vol. 115, 2836–2849, 2011.
[13] P.A. Harrell, E.S. Kasischke, L.L. Bourgeau-Chavez, E.M. Haney,
and N.L. Christensen, "Evaluation of approaches to estimating aboveground biomass in southern pine forests using SIR-C data",
Remote Sensing of Environment, vol. 59, 223–233, 1997.
[14] P.A. Harrell, L.L. Bourgeau-Chavez, E.S. Kasischke, N.H.F. French,
and N.L., Christensen, " Sensitivity of ERS-1 and JERS-1 radar data to biomass and stand structure in Alaskan boreal forest", Remote
Sensing of Environment, vol. 54, 247–253, 1995. [15] S. Englhart, V. Keuck, and F. Siegert, F. , "Modelling aboveground
biomass in tropical forests using multi-frequency SAR Data – A
comparison of methods",IEEE Journal of Selected Topics in Applied
Earth Observations and Remote Sensing, vol. 5, Issue 1,298 – 306, 2012.
[16] T. Le Toan, A. Beaudoin, J. Riom, and D. Guyon, "Relating forest
biomass to SAR data", IEEE Transactions on Geoscience and Remote Sensing, vol. 30, 403–411, 1992.
[17] T. Le Toan, S. Quegan, M.W.J. Davidson, H. Balzter, P. Paillou, S.
Plummer, K. Papathanassiou, F. Rocca, S. Saatchi, H. Shugart, and L. Ulander, "The BIOMASS mission: mapping global forest biomass to
better understand the terrestrial carbon cycle", Remote Sensing of Environment, 115 (11), 2850-2860, 2011.
[18] P. Dubois-Fernandez, I. Champion, D. Guyon, H. Cantalloube, F.
Garestier, X. Dupuis, and G. Bonin, "Forest biomass estimation from P-band high incidence angle data", In: Proceedings of POLINSAR
2005 Workshop, Frascati, Italie. Noordwijk, NLD : ESA Publications.
http://earth.esa.int/workshops/polinsar2005/participants/88/paper_Biomass_estimation_from_Pband.PDF
[19] C. Robinson, S. Saatchi, M. Neumann, and T. Gillespie, "Impacts of
Spatial Variability on Aboveground Biomass Estimation from L-Band Radar in a Temperate Forest", Remote Sensing, 5 (3), 1001-
1023, 2013.
[20] R. Lucas, J. Armston, R. Fairfax, R. Fensham, A. Accad, J. Carreiras, J. Kelley, P. Bunting, D. Clewley, S. Bray, D. Metcalfe, J. Dwyer, M.
Bowen, T. Eyre, M. Laidlaw, and M. Shimada, "An Evaluation of the
ALOS PALSAR L-Band Backscatter-Above Ground Biomass Relationship Queensland, Australia: Impacts of Surface Moisture
Condition and Vegetation Structure". IEEE Journal of Selected
Topics in Applied Earth Observations and Remote Sensing, vol. 3, 576–593, 2010.
[21] S.T. Wu, "Potential application of multipolarization SAR for pine-
plantation biomass estimation, IEEE Transactions on Geoscience and Remote Sensing, 403–409, 1997.
[22] M.L. Imhoff, "A theoretical analysis of the effect of forest structure
on synthetic aperture radar backscatter and the remote sensing of biomass", IEEE Transactions on Geoscience and Remote Sensing,
vol. 33, 341–352, 1995.
[23] G. Sandberg, L.M.H. Ulander, J.E.S. Fransson, J. Holmgren, and T. Le Toan, "L- and P-band backscatter intensity for biomass retrieval in
hemiboreal forest", Remote Sensing of Environment, vol. 115, 2874–
2886, 2011. [24] A. Luckman, J. Baker, M. Honzák, and R. Lucas, "Tropical forest
biomass density estimation using JERS-1 SAR: Seasonal variation,
confidence limits, and application to image mosaics", Remote Sensing of Environment, vol. 63, 126–139, 1998.
[25] I.H. Woodhouse, E.T.A. Mitchard, and C.M. Ryan, "Radar
basckscatter is not a “direct measure” of forest biomass". Nature climate change, vol. 2, 556-557, 2012.
[26] T. Castel, F. Guerra, Y. Caraglio, and F. Houllier, F., "Retrieval
biomass of a large Venezuelan pine plantation using JERS-1 SAR data. Analysis of forest structure impact on radar signature", Remote
Sensing of Environment, vol. 79, 30–41, 2002.
[27] E.T.A. Mitchard, S.S. Saatchi, I.H. Woodhouse, G. Nangendo, N.S. Ribeiro, M. Williams, C.M. Ryan, S.L. Lewis, T.R. Feldpausch, and
P. Meir, "Using satellite radar backscatter to predict above-ground
woody biomass: A consistent relationship across four different African landscapes", Geophysical Research Letters, vol., 36, L23401,
doi:23410.21029/22009GL040692, 2009.
[28] E.T.A. Mitchard, S.S. Saatchi, S.L. Lewis, T.R. Feldpausch, I.H. Woodhouse, B. Sonké, C. Rowland, and P. Meir, "Measuring
biomass changes due to woody encroachment and
deforestation/degradation in a forest–savanna boundary region of central Africa using multi-temporal L-band radar backscatter",
Remote Sensing of Environment, vol. 115, 2861–2873, 2011. [29] N. Floury, T. Le Toan, H. Jeanjean, A. Beaudoin, and O. Hamel, " L
and C-band multipolarized backscatter responses of eucalyptus
plantations in Congo", Geoscience and Remote Sensing Symposium
(IGARSS'95), vol. 1, 728 – 730, DOI: 10.1109/IGARSS.1995.520569, 1995.
[30] E.S. Kasischke, J.M. Melack, and M. Dobson, "The use of imaging
radars for ecological applications—a review", Remote Sensing of Environment, vol. 59, 141–156, 1997.
[31] R.M. Lucas, and A.K. Milne, "Synthetic aperture radar for woodland
biomass estimation in Australia: an overview", IEEE International Geoscience and Remote Sensing Symposium, IGARSS’01, 1421-
1423, 2001.
[32] S. Englhart, V. Keuck, and F. Siegert, F., "Aboveground biomass retrieval in tropical forests — The potential of combined X- and L-
band SAR data use", Remote Sensing of Environment, vol. 115,
1260–1271, 2011. [33] M.C. Dobson, F.T. Ulaby, L.E. Pierce, T.L. Sharik, K.M. Bergen, J.
Kellndorfer, J.R. Kendra, E. Li, Y.C. Lin, and A. Nashashibi,
"Estimation of forest biophysical characteristics in northern Michigan with SIR-C/X-SAR", IEEE Transactions on Geoscience and Remote
Sensing, vol. 33, 877–895, 1995.
[34] F.F. Gama, J.R. Dos Santos, ad J.C. Mura, "Eucalyptus biomass and volume estimation using interferometric and polarimetric SAR data",
Remote Sensing, 2, 939-956, doi:10.3390/rs2040939, 2010.
[35] G. Le Maire, C. Marsden, Y. Nouvellon, C. Grinand, R. Hakamada, J.-L. Stape, and J.-P. Laclau, "MODIS NDVI time-series allow the
monitoring of Eucalyptus plantation biomass", Remote Sensing of
Environment, vol. 115, no. 10, 2613–2625, 2011. [36] N. Baghdadi, G. Le Maire, I. Fayad, J.S. Bailly, Y. Nouvellon, C.
Lemos, and R. Hakamada, "Testing different methods of forest height and aboveground biomass estimations from ICESat/GLAS data on
Eucalyptus plantations in Brazil", IEEE Journal of Selected Topics in Applied
Earth Observations and Remote Sensing, vol. xxx, no. xxx, xxxx-xxxx, DOI: 10.1109/JSTARS.2013.2261978, 2013.
[37] J. Zhou, C. Proisy, X. Descombes, G. le Maire, Y. Nouvellon, J.L.
Stape, G. Viennois, J. Zerubia, and P. Couteron, "Mapping local density of young Eucalyptus plantations by individual tree detection
in high spatial resolution satellite images", Forest Ecology and
Management, vol. 301, 129-141, 2013. [38] C. Marsden, C. Nouvellon, J-P. Laclau, M. Corbeels, R.E.
McMurtrie, J-L. Stape, D.G. Epron, and G. Le Maire, "Modifying the
G’DAY process-based model to simulate the spatial variability of Eucalyptus plantation growth on deep tropical soils", Forest Ecology
and Management, vol. 301, 112–128, 2013.
[39] G. le Maire, C. Marsden, W. Verhoef, F.J. Ponzoni, D. Lo Seen, A. Bégué, J-L. Stape, and A. Nouvellon, "Leaf area index estimation
with MODIS reflectance time series and model inversion during full
rotations of Eucalyptus plantations", Remote Sensing of Environment, vol. 115, 586-599, 2011.
[40] C. Marsden, G. Le Maire, J.-L. Stape, D.L. Seen, O. Roupsard, O.
Cabral, D. Epron, A.M.N. Lima, and Y. Nouvellon, Y. Relating, "MODIS vegetation index time-series with structure, light absorption
and stem production of fast-growing Eucalyptus plantations", Forest
Ecology and Management, vol. 259, no. 9, 1741-1753, 2010. [41] A. Peregon, and Y. Yamagata, Y., "The use of ALOS/PALSAR
backscatter to estimate above-ground forest biomass: A case study in
Western Siberia", Remote Sensing of Environment, vol. 137, 139-146, 2013.
[42] R. Avtar, R. Suzuki, W. Takeuchi, and H. Sawada, "PALSAR 50 m
Mosaic Data Basel National Level Biomass Estimation in Cambodia for implementation of REDD+ Mechanism", PLOS ONE 8, e74807,
2013.
[43] J.N. Collins, L.B. Hutley, R.J. Williams, G. Boggs, D. Bell, et al., "Estimating land-scape vegetation carbon stocks using airborne multi-
frequency polarimetric synthetic aperture radar (SAR) in the
savannahs of north Australia", International Journal of Remote Sensing, vol. 30, no. 5, 1141–1159, 2009.
[44] M.A. Karam, F. Amar, A.K. Fung, E. Mougin, A. Lopes, D.M. Le
vine, and A. Beaudoin, "A microwave polarimetric scattering model for forest canopies based on vector radiative transfer theory", Remote
Sensing of Environment, vol. 53, 16-30, 1995.
[45] C. Proisy, E. Mougin, F. Fromard, and M.A. Karam, "Interpretation of polarimetric radar signatures of mangrove forests", Remote Sensing
of Environment, vol. 71, 56-66, 2000.
[46] C. Proisy, E. Mougin, F. Fromard, V. Trichon, and M.A. Karam, "On the influence of canopy structure on the radar backscattering of

mangrove forests", International Journal of Remote Sensing, vol. 23,
no. 20, 4197-4210, 2002. [47] A. J. Luckman, J. Baker, R. Lucas, and T.M. Kuplich, "Retrieval of
the biomass of regenerating tropical forest in Amazonia using
spaceborne SAR data", Proceedings of the International Symposium on Retrieval of Bio- and Geophysical Parameters from SAR Data for
L and Applications, Toulouse, France, October 1995, ESA SP-441
(Noordwijk, The Netherlands: ESA), pp. 107–118, 1996. [48] J. R. Santos , M. S. Pardi Lacruz, L. S. Araujo, and M. Keil, "Savanna
and tropical rainforest biomass estimation and spatialization using
JERS-1 data", International Journal of Remote Sensing, 23:7, 1217-1229, 2002.
[49] L. Breiman, "Random forests". Machine learning 45 (1), 5-32,
doi:10.1023/A:1010933404324, 2001. [50] V. Rodriguez-Galiano, B. Ghimire, J. Rogan, M. Chica-Olmo, and J.
Rigol-Sanchez, "An assessment of the effectiveness of a random
forest classifier for land-cover classification", ISPRS Journal of Photogrammetry and Remote Sensing, 67, 93-104, 2012.
[51] M.A. Tanase, R. Panciera, K. Lowell, S. Tian, J.M. Hacker, and J.P.
Walker, "Airborne multi-temporal L-Band polarimetric SAR data for biomass estimation in semi-arid forests", Remote Sensing of
Environment, 145, 93-104, 2014.
[52] A.T. Hudak, E.K. Strand, L.A. Vierling, J.C. Byrne, J.U. Eitel, S. Martinuzzi, and M.J. Falkowski, "Quantifying aboveground forest
carbon pools and fluxes from repeat LiDAR surveys", Remote
Sensing of Environment, 123, 25-40, 2012. [53] J. Mascaro, G.P. Asner, D.E. Knapp, T. Kennedy-Bowdoin, R.E.
Martin, C. Anderson, M. Higgins, and K.D. Chadwick, "A tale of two “Forests”: Random Forest machine learning aids tropical forest
carbon mapping. PLoS ONE, 9(1): e85993, 2014.
[54] J.L. Stape, D. Binkley, M.G. Ryan, S. Fonseca, R. Loos, E.N. Takahashi, C.R. Silva, S. Silva, R.E. Hakamada, J.M. Ferreira, A.M.
Lima, J.L. Gava, F.P. Leite, G. Silva, H. Andrade, and J.M. Alves,
"The Brazil Eucalyptus potential productivity project: influence of water, nutrients and stand uniformity on wood production", Forest
Ecology and Management, vol. 259, 1686–1694, 2010.
[55] T. Le Toan, S. Quegan, M.W.J. Davidson, H. Balzter, P. Paillou, K. Papathanassiou, S. Plummer, F. Rocca, S. Saatchi, H. Shugart, and L.
Ulander, "The BIOMASS mission: Mapping global forest biomass to
better understand the terrestrial carbon cycle", Remote Sensing of Environment, vol. 115, 2850-2860, 2011.

Nicolas N. Baghdadi received the
Ph.D. degrees from the University of
Toulon, France in 1994. From 1995 to
1997, he was postdoctoral research at
INRS ETE – Water Earth Environment
Research Centre, Quebec University,
Canada. From 1998 to 2008, he was
with French geological Survey
(BRGM), Orléans, France. Since 2008,
he is a Senior Scientist with the
National Research Institute of Science
and Technology for Environment and
Agriculture (IRSTEA), Montpellier,
France.
His research activities involve in the
areas of microwave remote sensing,
image processing, and analysis for
satellite and airborne remote sensing
data. His main field of interest is the
analysis of SAR data and the retrieval
of soil parameters (surface roughness
and moisture content).
Guerric le Maire, Guerric le Maire
received the M. Sc degree in
agronomy, specialized in ecology,
from the National Institute of
Agronomy (INA P-G), Paris, France in
2002, and the Ph. D. degree in plant
ecophysiology from the Paris XI
University, Orsay, France in 2005. The
subject of his thesis was on the link
between multispectral and
hyperspectral remote-sensing and
process-based forest growth models.
He did a post-doc with the Laboratoire
des Sciences du Climat et de
l'Environnement, Saclay, France in
2006-2007 on regional modelling of
forest growth. He joined the Cirad (
French Agricultural Research Centre
for International Development),
Montpellier, France in 2008. His
research activities are in the area of
remote-sensing image
processing/analysis and process-based
forest models development applied to
tropical forest plantations.
Jean-Stéphane Bailly received an
engineer degree in agronomy, a master
of science in Biostatistics and a Ph.D
in Hydrology. He is member of the
French civil corps of Water and
Forestry engineers since 1991. He is
senior lecturer and scientist in physical
geography at AgroParisTech,
Montpellier. His research is devoted to
spatial observations and
parametrisations for hydrological
modeling
(http://www.researcherid.com/rid/C-
2391-2011).
Kenji Ose is a GIS and remote sensing
engineer in UMR Tetis at IRSTEA,
Montpellier, France. Research interests
include responsible agriculture and
territories sustainable planning using
optical satellite imagery. He also
contributes to Equipex GeoSud, a
project dedicated to the acquisition and
provision of satellite coverage of the
entire French territory (images at
different times with different sensors)
with special attention given to urban
areas.
Yann Nouvellon received a M. Sc
degree in agronomy from ENSAIA
(Nancy, France) in 1994, and the Ph.
D. degree in Agronomy from the
National Institute of Agronomy (INA
P-G; Paris, France) in 1999. During
his thesis he developed and validated a
process-based model simulating plant
growth, CO2, latent and sensible heat
fluxes and canopy reflectance over
semi-arid grasslands. He did a post-
doc at USDA-ARS SWRC (Tucson,
Arizona, US) in 1999-2000 to apply a
spatially-explicit, hydro-ecological
model over a semi-arid grassland
watershed using remotely sensed data
(Landsat imagery) and other spatially-
distributed data (soil maps,
meteorological data). He joined the
Cirad ( French Agricultural Research
Centre for International Development;
Montpellier, France) in 2000. His
research activities focuses on the
carbon and water cycles and the
ecophysiology of fast growing
eucalypt plantations.
Mehrez Zribi received the
engineering degree in signal
processing from the Ecole Nationale
Supérieure d’Ingénieurs en
Constructions Aéronautiques
(ENSICA), Toulouse, France, and the
Ph.D. degree from the Université Paul
Sabatier, Toulouse, France. In 1995,
he joined the CETP laboratory
(IPSL/CNRS), Vélizy, France. He is
employed by CNRS (Centre National
de Recherche Scientifique) since 2001.
In October 2008, he joined CESBIO
laboratory. His research interests
include microwave remote sensing
applied to hydrology and microwave
modeling and instrumentations.

Cristiane Lemos received her Ph.D.
degree in science forestry from the
University of São Paulo, Brazil, in
2012, which focused on the
improvement of an ecophysiological
model through testing and application.
She is a Forestry Researcher at
International Paper since 2010. There
she has been working with empirical
and ecophysiological modeling,
remote sensing, silviculture, and
management of Eucalyptus
plantations. Her challenge is to
monitor quality and productivity of
Eucalyptus plantations using remote
sensing techniques.
Rodrigo Hakamada was born in São
Paulo state, Brazil, in 1981. He is
currently a Ph.D. student at the
University of São Paulo studying
water relationships in Eucalyptus
plantations. He has worked with forest
researches since 2005, when he
finished his undergraduate in Forest
Engineering at the São Paulo
university. The focus of his master
thesis was to monitor forest plantations
and silviculture operations using
inventory data. This issue continues to
be his main interest area, which is
related with the integration of
silviculture, ecophisiology and remote
sensing techniques in forest
plantations.