Long-term benefits, risks and adverse events after intended ...

This article was downloaded by: [Athos Agapiou]On: 04 April 2012, At: 01:47Publisher: Taylor & FrancisInforma Ltd Registered in England and Wales Registered Number: 1072954 Registeredoffice: Mortimer House, 37-41 Mortimer Street, London W1T 3JH, UK
International Journal of Digital EarthPublication details, including instructions for authors andsubscription information:http://www.tandfonline.com/loi/tjde20
Spectral sensitivity of ALOS, ASTER,IKONOS, LANDSAT and SPOT satelliteimagery intended for the detection ofarchaeological crop marksAthos Agapiou a , Dimitrios D. Alexakis a & Diofantos G.Hadjimitsis aa Department of Civil Engineering and Geomatics, CyprusUniversity of Technology, Limassol, Cyprus
Available online: 04 Apr 2012
To cite this article: Athos Agapiou, Dimitrios D. Alexakis & Diofantos G. Hadjimitsis (2012):Spectral sensitivity of ALOS, ASTER, IKONOS, LANDSAT and SPOT satellite imagery intendedfor the detection of archaeological crop marks, International Journal of Digital Earth,DOI:10.1080/17538947.2012.674159
To link to this article: http://dx.doi.org/10.1080/17538947.2012.674159
PLEASE SCROLL DOWN FOR ARTICLE
Full terms and conditions of use: http://www.tandfonline.com/page/terms-and-conditions
This article may be used for research, teaching, and private study purposes. Anysubstantial or systematic reproduction, redistribution, reselling, loan, sub-licensing,systematic supply, or distribution in any form to anyone is expressly forbidden.
The publisher does not give any warranty express or implied or make any representationthat the contents will be complete or accurate or up to date. The accuracy of anyinstructions, formulae, and drug doses should be independently verified with primarysources. The publisher shall not be liable for any loss, actions, claims, proceedings,demand, or costs or damages whatsoever or howsoever caused arising directly orindirectly in connection with or arising out of the use of this material.
Spectral sensitivity of ALOS, ASTER, IKONOS, LANDSATand SPOT satellite imagery intended for the detection of archaeological
crop marks
Athos Agapiou*, Dimitrios D. Alexakis and Diofantos G. Hadjimitsis
Department of Civil Engineering and Geomatics, Cyprus University of Technology,Limassol, Cyprus
(Received 13 November 2011; final version received 6 March 2012)
This study compares the spectral sensitivity of remotely sensed satellite images, usedfor the detection of archaeological remains. This comparison was based on therelative spectral response (RSR) Filters of each sensor. Spectral signatures profileswere obtained using the GER-1500 field spectroradiometer under clear skyconditions for eight different targets. These field spectral signature curves weresimulated to ALOS, ASTER, IKONOS, Landsat 7-ETM�, Landsat 4-TM,Landsat 5-TM and SPOT 5. Red and near infrared (NIR) bandwidth reflectancewere re-calculated to each one of these sensors using appropriate RSR Filters.Moreover, the normalised difference vegetation index (NDVI) and simple ratio (SR)vegetation profiles were analysed in order to evaluate their sensitivity to sensorsspectral filters. The results have shown that IKONOS RSR filters can betterdistinguish buried archaeological remains as a result of difference in healthy andstress vegetation (approximately 1�8% difference in reflectance of the red and NIRband and nearly 0.07 to the NDVI profile). In comparison, all the other sensorsshowed similar results and sensitivities. This difference of IKONOS sensor might bea result of its spectral characteristics (bandwidths and RSR filters) since they aredifferent from the rest of sensors compared in this study.
Keywords: RSR filters; spectral sensitivity; archaeological remains; crop markdetection; spectroscopy
1. Introduction
1.1. Crop marks
Vegetation crop marks may be formed in areas where vegetation overlay near-surface
archaeological remains. These features retain soil moisture with different percentage
of moisture compared to the rest of the crops of an area. Depending of the type of
feature, crop vigour may be enhanced or reduced by buried archaeological features
(Winton and Horne 2010).
For instance, if vegetation grows above buried ditches or moat, then the crop
growth is likely to be enhanced. This is due to the topsoil which holds more moisture
than in the surrounding context (especially during periods when water stress
develops). This phenomenon can be recorded from any airborne and spaceborne
platform and is referred to as a positive crop mark (Stanjek and Fabinder 1995,
*Corresponding author. Email: [email protected]
International Journal of Digital Earth,
2012, 1�22, iFirst article
ISSN 1753-8947 print/ISSN 1753-8955 online
# 2012 Taylor & Francis
http://dx.doi.org/10.1080/17538947.2012.674159
http://www.tandfonline.com
Dow
nloa
ded
by [
Ath
os A
gapi
ou]
at 0
1:47
04
Apr
il 20
12
Sharpe 2004, Jonson 2006, Lasaponara and Masini 2007). However, in cases
where there is not enough moisture in the retentive soil and there is lack of available
water for evapotransporation (e.g. vegetation grown above building remains or
compacted ground), the developed marks are characterised as negative crop marks.These are less common than the positive ones (Riley 1979, Sharpe 2004, Jonson
2006, Lasaponara and Masini 2007). Comparing the two different kinds of marks,
the positives are normally taller with darker green and healthy foliage than the
negative crop marks. On the other hand, the negative crop marks tend to be paler
green with lighter coloured appearance when monitored from the air (Sharpe 2004,
Jonson 2006).
Furthermore, recent studies argue that there are many complex factors involved
in the capturing of crop marks. Several researches (Mills and Palmer 2007, Wintonand Horne 2010), have found that the evolution of crop mark can be a combination
of different factors and parameters such as moisture availability, the availability of
dissolved nutrients to the crops (at crucial growing times and periods for the plant),
the crop, the soil type itself and finally the soil depth.
For example, Sharpe (2004) argues that archaeological crop marks in England are
recorded in cereal crops especially during warm and dry summer months while
Ciminale et al. (2009) mentions that for the Mediterranean region, crop marks are
better visible from the beginning of spring up to the half or end of May.
1.2. Remote sensing in archaeology
Several researchers, over the last decades, showed that multispectral images can be used
in different archaeological environments in order to detect subsurface remains (Bewley
2003, Altaweel 2005, Beck 2007, Alexakis et al. 2009, 2011) or even to monitor
archaeological sites (Agapiou and Hadjimitsis 2011; Hadjimitsis et al. 2011, 2009).
Bewley (2003) reported that more than 50% of all known archaeological sites in the UKwere revealed from airborne platforms. Both high and very high resolution satellite
sensors give the opportunity to examine and study crop marks related to sub-surfaces
anomalies, using different spectral and spatial characteristics (Lasaponara and Masini
2001, Parcak 2009). For example, very high resolution satellite imagery (B 4 m spatial
resolution) such as IKONOS and QuickBird have been used in the past for the detection
of archaeological remains based on vegetation marks as shown by Lasaponara and
Masini (2005, 2006, 2007) and Altaweel (2005). Masini and Lasaponara (2007) used
multispectral Quickbird images for the detection of archaeological remains in Italy. Beck(2007) used IKONOS satellite images for the case of Homs in Syria, while Laet et al.
(2007) have extracted archaeological features using the same satellite sensor for a case
study in Turkey. In addition to the aforementioned, data based on low spectral and
spatial resolution imagery has also been used from Clark et al. (1998), Sarris and Jones
(2000) and Tripathi (2000).
Although very high imagery data-set provide many advantages to researchers
compared to high resolution imagery (B 30 m spatial resolution), sometimes the
high cost can be prohibitive to be used for archaeological research. Indeed,multispectral high resolution satellite imagery has been used for the detection of
sub-surface archaeological remains in many case studies. Altaweel (2005) has
employed ASTER satellite images in the archaeological context of Mesopotamia.
Alexakis et al. (2009, 2011) used both high and very high resolution satellite images
2 A. Agapiou et al.
Dow
nloa
ded
by [
Ath
os A
gapi
ou]
at 0
1:47
04
Apr
il 20
12
(ASTER, Landsat TM and IKONOS) for the detection of archaeological remains in
the Thessalian plain in Greece. Finally, Agapiou and Hadjimitsis (2011) used freely
distributed Landsat TM/ETM� satellite imagery and ground spectroradiometric
measurements for monitoring phenological cycle of barley crops over the archae-ological area of Palaepaphos, in Cyprus.
1.3. Ground spectroscopy
Field spectroradiometric measurements have been used in many of remote sensing
applications including, vegetation canopy reflectance modelling, spectral mixture
analysis, classification techniques and predictive modelling (Peddle et al. 2001). Field
spectroradiometers may be used in order to record the reflectance amount of crops
over archaeological areas as shown by Agapiou et al. (2010, 2012) and Agapiou and
Hadjimitsis (2011). Spectroradiometers can measure the amount of energy (radiance)
reflected from a ground area (e.g. crops) and then converted to reflectance using
calibration panels (Peddle et al. 2001).Field spectroradiometers can be used to give calibrated measurements since such
instruments are often accompanied by calibrated Lambertian surface panel. Milton
et al. (2009) emphasises that a critical factor for reliable results is the calibration of the
panel. Indeed, as Milton and Rollin (2006) mentioned, in cases where ‘single-beam’
measurements are taken within one minute, the radiation is actually unchanged. The
radiation is also affected by the zenith angle of the sun and the coordinates of the area
of interest (Milton 1987). One way to eliminate these errors is to measure the before
and after of the special calibration target. This may be true in most cases but inthe presence of cloud cover or a sudden change of the weather this can be incorrect (see
Milton 1987). Such considerations have been already taken into account for the
purpose of this study.
1.4. Spectral sensitivity of satellite sensors
Chander et al. (2009) mentioned that the detection and quantification of change (e.g.
crop marks) in the earth’s environment, depends on the satellite’s characteristics
(mainly spectral and spatial). Teillet et al. (2007) highlighted that data from the
various imaging sensor systems must be on a consistent radiometric calibration scale
and hence, sensor radiometric calibration is of critical importance. The methods and
measurements involved in sensor radiometric calibration can be grouped into threedomains (Teillet et al. 2007):
� on the ground prior to launch, onboard the spacecraft post-launch, including
reference to lamp sources and/or solar illumination (e.g. Markham et al. 1997)
or
� lunar illumination using radiative codes to simulate Top of Atmosphere signal
(e.g. Trishchenko et al. 2002) and
� approaches using earth scenes images captured in-flight (e.g. Teillet et al. 2007).
However, as Trishchenko et al. (2002) stated, the total relative uncertainties of
calibration are within 5% for satellite sensors. Although spectral uncertainties have
been examined elsewhere (Trishchenko et al. 2002, Teillet et al. 2007, Trishchenko
International Journal of Digital Earth 3
Dow
nloa
ded
by [
Ath
os A
gapi
ou]
at 0
1:47
04
Apr
il 20
12

2009), there is a lack of literature regarding the different spectral profiles provided
from multispectral satellite sensors used for the detection of sub-surfaces anomalies.
The detection of buried archaeological remains is based mostly on examining
the response of Red and near infrared (NIR) part of spectrum and the use of
vegetation indices (such as normalised difference vegetation index [NDVI] and
simple ratio [SR]).
Further, such spectral uncertainties satellite images need to be atmospherically
and geometrically corrected, before being subjected to any post-processing
techniques (Agapiou et al. 2011a, Lillesand et al. 2004). Other corrections that
must be taken into account are, sun elevation, elevation of the area of interest, etc.
(Campbell 2002).
The overall aim of this study is to examine the spectral characteristics of seven
different satellite sensors using field spectroradiometric data (spectral signatures
profiles) derived from different field campaigns over a ‘test field’ simulating an
archaeological environment. This study does not intend to study the calibration
procedures of each sensor itself but to evaluate the sensitivity of these sensors in the
context of crop marks detection. Finally, in this study vegetation indices were used to
illustrate the potential of each sensor for detecting subsurface archaeological
remains.
The direct comparison of reflectance measurements acquired from fine resolution
sensors such as field spectroradiometers with other sensors of very high or high
resolution such as those mentioned in this study, has been discussed by other
researchers (Curran and Williamson 1986, Milton et al. 2009, Wu and Liang Li 2009).
Indeed, different scaling techniques (i.e. transfer of data content from one scale to
another one) have been extensively reported by Malenovsky et al. (2007). The bottom�up approach, up-scales information from smaller to larger observational scales (e.g.
from spectroradiometer to high resolution pixel size). Nevertheless, Jarvis (1995)
mentions that scaling represents a scientific challenge, due to the non-linear nature
between processes and variables, and heterogeneity of characteristics determining the
rates of processes. Nevertheless, many researches apply simple models in order to
evaluate scale differences (Marceau et al. 1994, Tran et al. 2011)
The choice of the resampling algorithm was based on the following considerations.
The goal of the study is not to simulate all conditions involved in data acquisition using
satellite sensors, but to investigate the spectral sensitivity of the sensors. Therefore, a
simple model can be used, taking into consideration the relative response filters of
each sensor. Such approach has also been presented for vegetation studies by
Papadavid et al. (2011) and Agapiou and Hadjimitsis (2011).
2. Sensors overview
2.1. General characteristics
This study included the evaluation of both high and very high resolution multispectral
satellite sensors. Satellite images acquired from these sensors are used for the detection
of archaeological remains using mainly the red and NIR part of spectrum. Table 1
indicates the spectral and spatial characteristics of the satellites sensors used in this
study (ALOS-AVNIR-2, EO-ASTER, IKONOS, Landsat 4 and 5 TM/ 7 ETM� and
SPOT 5 -HRV):
4 A. Agapiou et al.
Dow
nloa
ded
by [
Ath
os A
gapi
ou]
at 0
1:47
04
Apr
il 20
12

Figure 1 shows the spectral bandwidth of the sensors, mentioned in this
study, compared to a typical spectral signature of vegetation. It is interesting to
note the bandwidth of the sensors especially for the NIR bands: IKONOS sensor
has a bandwidth of approximately 0.096 mm in contrast to 0.100�0.150 mm of theother sensors. However, as it is indicated, all sensors have similar but not identical
spectral resolutions (except from the Landsat sensors).
This observation has prompted to investigate, if the capability of the sensor to
‘capture’ information regarding vegetation might affect the interpretation results
regarding crop marks, over archaeological areas using vegetation indices.
Even though spatial resolution has not been examined in this study, it is also a
key parameter for the detection or not of buried archaeological remains due to the
fact that the use of high spatial resolution images, at a resolution close to the actualspatial pattern of remains, reduces the possibility of the impact of mixed pixels
(Rowlands and Sarris 2007).
2.2. Relative spectral response (RSR) filters
Trishchenko et al. (2002) have mentioned that the total relative uncertainties of
calibration are within 5% for satellite sensors. An essential part of this uncertainty
is related to the effect of RSR filters which describes the relative sensitivity ofsensors to energy of different wavelength. These filters have a value of 0�1 and
have no units since they are relative to the peak response. They describe the
instrument’s relative sensitivity to radiance at various part of the electromagnetic
spectrum (Wu et al. 2010).
Table 1. Satellite characteristics used in this study.
Spectral resolution
Satellite sensor Bands Wavelength Spatial resolution
ALOS-AVNIR-2 1 Blue 0.42�0.50 (mm) 10 m
2 Green 0.52�0.60 (mm)
3 Red 0.61�0.69 (mm)
4 NIR 0.76�0.89 (mm)
EO-ASTER 1 Green 0.52�0.60 (mm) 15 m
2 Red 0.63�0.69 (mm)
3 NIR 0.76�0.86 (mm)
IKONOS 1 Blue 0.445�0.516 (mm) 4 m
2 Green 0.506�0.595 (mm)
3 Red 0.632�0.698 (mm)
4 NIR 0.757�0.853 (mm)
Landsat 4 TM 1 Blue 0.45�0.52 (mm) 30 m
Landsat 5 TM 2 Green 0.52�0.60 (mm)
Landsat 7 ETM� 3 Red 0.63�0.69 (mm)
4 NIR 0.75�0.90 (mm)
SPOT 5 -HRV 1 green 0.50�0.59 (mm) 10 m
2 red 0.61�0.68 (mm)
3 NIR 0.78�0.89 (mm)
NIR, near infrared.
International Journal of Digital Earth 5
Dow
nloa
ded
by [
Ath
os A
gapi
ou]
at 0
1:47
04
Apr
il 20
12

Such kinds of filters are used for any satellite or aerial sensor. For example, in
Landsat 5 TM, each reflective band is sensed by an array of 16 detectors and the signal
from an individual detector is referred to as a channel. Although there are multiple
detectors per band, there is only one filter (Markham and Barker 1985). The use of
such filters is, to produce individual colour, utilising the filters on the sensors, to
subdivide the light received into wavelength intervals (the bands).
Bandpass filters are used in the same way in spectroradiometers in order to
transmit a certain wavelength band and block others. The reflectance from the
spectroradiometer was calculated based on the wavelength of each sensor and the
RSR filter as follows:
Rbandi¼X
ðRi�RSRiÞ=X
RSRi (1)
Where: Rbandi�reflectance at a range of wavelength (e.g. Band 1); Ri�reflectance
at a specific wavelength (e.g R 0.450 mm); RSRi�relative response value at the
specific wavelength.
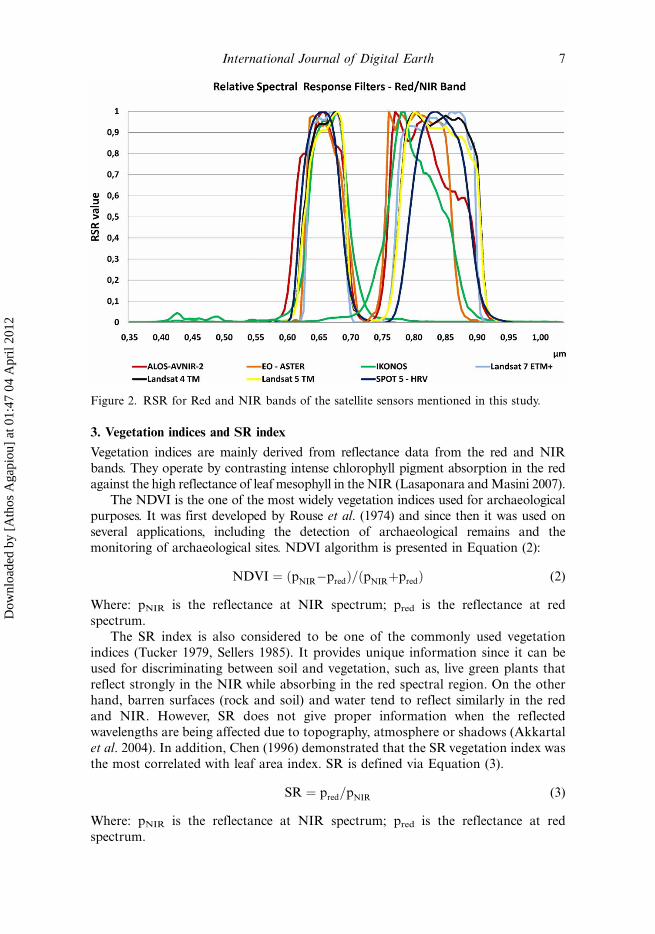
Figure 2 shows the RSR filters diagrams for ALOS-AVNIR-2, EO-ASTER,
IKONOS, Landsat 4 and 5 TM/ 7 ETM� and SPOT 5 -HRV sensors for red and
NIR part of spectrum. These RSR filters cover a spectral range from approximately
0.550 up to 0.950 mm. In the literature, red and NIR bands are described for different
sensors with the same name although there is a difference in the sensitivity of each
band in each sensor as it is clearly shown in Figures 1 and 2.
Figure 1. Red and NIR bandwidths of the different sensors mentioned in this study in
comparison with a typical vegetation spectral profile.
6 A. Agapiou et al.
Dow
nloa
ded
by [
Ath
os A
gapi
ou]
at 0
1:47
04
Apr
il 20
12
3. Vegetation indices and SR index
Vegetation indices are mainly derived from reflectance data from the red and NIR
bands. They operate by contrasting intense chlorophyll pigment absorption in the red
against the high reflectance of leaf mesophyll in the NIR (Lasaponara and Masini 2007).
The NDVI is the one of the most widely vegetation indices used for archaeologicalpurposes. It was first developed by Rouse et al. (1974) and since then it was used on
several applications, including the detection of archaeological remains and the
monitoring of archaeological sites. NDVI algorithm is presented in Equation (2):
NDVI ¼ ðpNIR�predÞ=ðpNIRþpredÞ (2)
Where: pNIR is the reflectance at NIR spectrum; pred is the reflectance at red
spectrum.
The SR index is also considered to be one of the commonly used vegetation
indices (Tucker 1979, Sellers 1985). It provides unique information since it can be
used for discriminating between soil and vegetation, such as, live green plants that
reflect strongly in the NIR while absorbing in the red spectral region. On the otherhand, barren surfaces (rock and soil) and water tend to reflect similarly in the red
and NIR. However, SR does not give proper information when the reflected
wavelengths are being affected due to topography, atmosphere or shadows (Akkartal
et al. 2004). In addition, Chen (1996) demonstrated that the SR vegetation index was
the most correlated with leaf area index. SR is defined via Equation (3).
SR ¼ pred=pNIR (3)
Where: pNIR is the reflectance at NIR spectrum; pred is the reflectance at red
spectrum.
Figure 2. RSR for Red and NIR bands of the satellite sensors mentioned in this study.
International Journal of Digital Earth 7
Dow
nloa
ded
by [
Ath
os A
gapi
ou]
at 0
1:47
04
Apr
il 20
12
4. Overall methodology
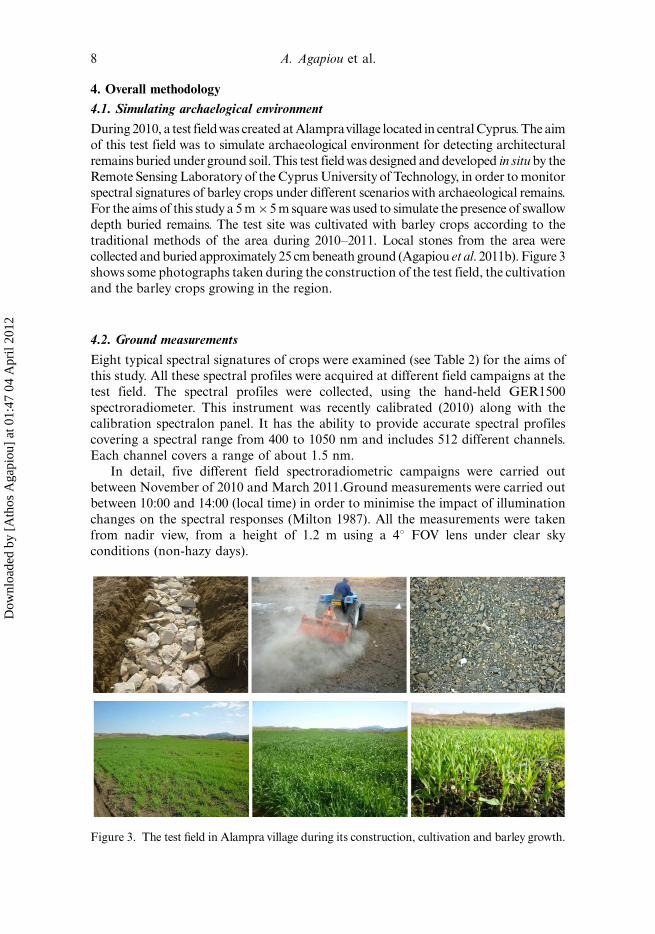
4.1. Simulating archaelogical environment
During 2010, a test fieldwas created at Alampravillage located in central Cyprus. The aim
of this test field was to simulate archaeological environment for detecting architectural
remains buried under ground soil. This test fieldwas designed and developed in situ by the
Remote Sensing Laboratory of the Cyprus University of Technology, in order to monitor
spectral signatures of barley crops under different scenarios with archaeological remains.
For the aims of this study a 5 m�5 m square was used to simulate the presence of swallow
depth buried remains. The test site was cultivated with barley crops according to the
traditional methods of the area during 2010�2011. Local stones from the area were
collected and buried approximately 25 cm beneath ground (Agapiou et al. 2011b). Figure 3
shows some photographs taken during the construction of the test field, the cultivation
and the barley crops growing in the region.
4.2. Ground measurements
Eight typical spectral signatures of crops were examined (see Table 2) for the aims of
this study. All these spectral profiles were acquired at different field campaigns at the
test field. The spectral profiles were collected, using the hand-held GER1500
spectroradiometer. This instrument was recently calibrated (2010) along with the
calibration spectralon panel. It has the ability to provide accurate spectral profiles
covering a spectral range from 400 to 1050 nm and includes 512 different channels.
Each channel covers a range of about 1.5 nm.
In detail, five different field spectroradiometric campaigns were carried out
between November of 2010 and March 2011.Ground measurements were carried out
between 10:00 and 14:00 (local time) in order to minimise the impact of illumination
changes on the spectral responses (Milton 1987). All the measurements were taken
from nadir view, from a height of 1.2 m using a 48 FOV lens under clear sky
conditions (non-hazy days).
Figure 3. The test field in Alampra village during its construction, cultivation and barley growth.
8 A. Agapiou et al.
Dow
nloa
ded
by [
Ath
os A
gapi
ou]
at 0
1:47
04
Apr
il 20
12
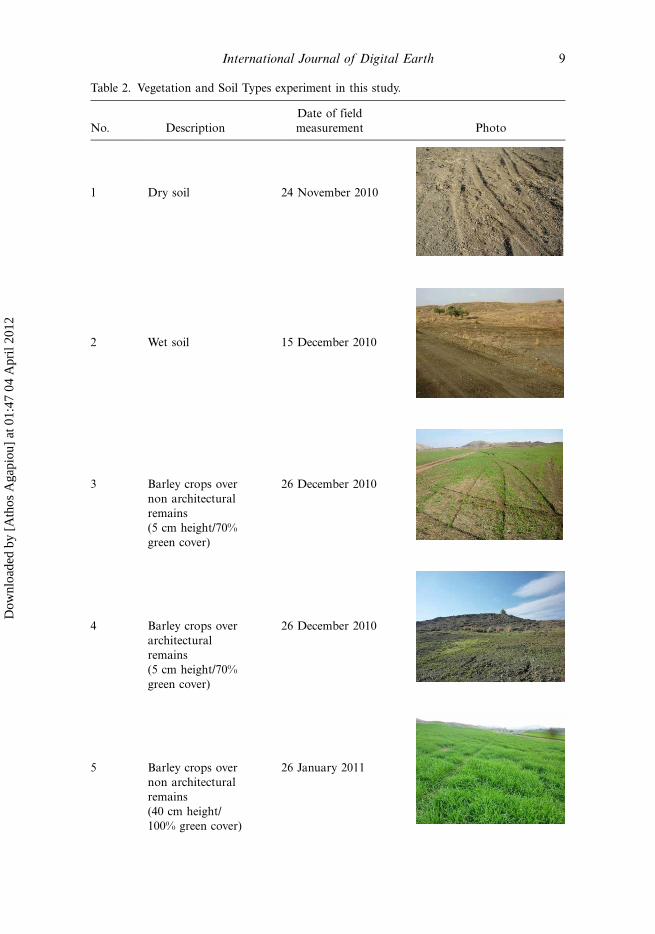
Table 2. Vegetation and Soil Types experiment in this study.
No. Description
Date of field
measurement Photo
1 Dry soil 24 November 2010
2 Wet soil 15 December 2010
3 Barley crops over
non architectural
remains
(5 cm height/70%
green cover)
26 December 2010
4 Barley crops over
architectural
remains
(5 cm height/70%
green cover)
26 December 2010
5 Barley crops over
non architectural
remains
(40 cm height/
100% green cover)
26 January 2011
International Journal of Digital Earth 9
Dow
nloa
ded
by [
Ath
os A
gapi
ou]
at 0
1:47
04
Apr
il 20
12

The profile of each target (Figure 4) denotes the classic spectral characteristics of
vegetation with a reflectance peak in green, minimal at blue and red part of spectrum
(due to chlorophyll absorption) and high reflectance response in the NIR (due to
internal leaf anatomy and scattering). On the other hand, the spectral signatures of
soil show general similarities with the non-photosynthetic vegetation targets in
visible and NIR parts of the spectrum (Herold et al. 2004).
4.3. The method
The method followed in this study for comparing spectral sensitivity of varying
satellite sensors is shown in Figure 5 and is briefly described as follows:-
� Ground measurements collection;
� Scaling Up based on RSR filters and
� Evaluation of spectral signatures/vegetation indices between the different
sensors.
Table 2 (Continued )
No. Description
Date of field
measurement Photo
6 Barley crops over
architectural
remains
(40 cm height/
100% green cover)
26 January 2011
7 Barley crops over
non architectural
remains
(60 cm height/
100% green cover)
13 March 2011
8 Barley crops over
architectural
remains
(60 cm height/
100% green cover)
13 March 2011
10 A. Agapiou et al.
Dow
nloa
ded
by [
Ath
os A
gapi
ou]
at 0
1:47
04
Apr
il 20
12

After the spectral signatures were acquired, red and NIR bands of different sensors
(ALOS-AVNIR-2, EO-ASTER, IKONOS, Landsat 4 and 5 TM/ 7 ETM� and
SPOT 5 -HRV) were calculated using the RSR filters. Therefore, satellite images
could be simulated based on ground spectral profiles. In this way, narrow wavelength
bands were re-calculated in order to simulate satellite imagery bands, often used for
archaeological detection.
Figure 4. Spectral signatures profiles of the vegetation types and soil examined in the study
(see Table 1 for description).
Figure 5. Methodological diagram.
International Journal of Digital Earth 11
Dow
nloa
ded
by [
Ath
os A
gapi
ou]
at 0
1:47
04
Apr
il 20
12
The red and NIR bands of each sensor were compared in pairs of vegetation
(e.g. healthy vegetation No. 3 and stress vegetation No. 4, Table 2). In this way,
statistical analysis could be performed in order to identify any significant difference
between the sensors. Additionally, vegetation indices (NDVI and SR) werecalculated using the broadband of each sensor. Again the results were compared
in pairs of vegetation.
5. Results
The comparison of the bandwidth signatures for all sensors, mentioned in this study,
is presented in the first part of this chapter. The second part is focused on the
evaluation of the sensors regarding vegetation indices (NDVI, SR).
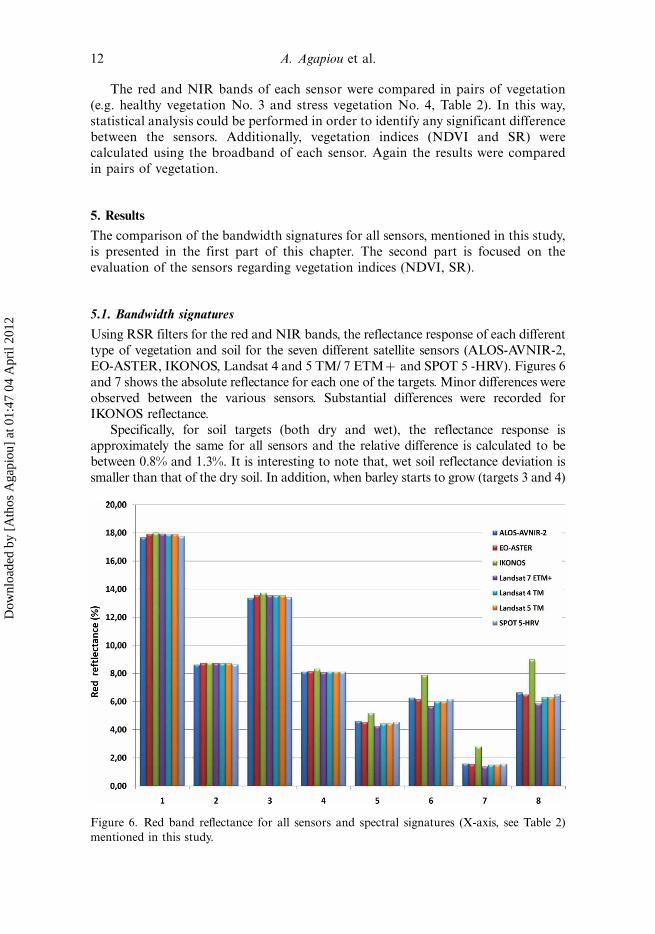
5.1. Bandwidth signatures
Using RSR filters for the red and NIR bands, the reflectance response of each different
type of vegetation and soil for the seven different satellite sensors (ALOS-AVNIR-2,
EO-ASTER, IKONOS, Landsat 4 and 5 TM/ 7 ETM� and SPOT 5 -HRV). Figures 6
and 7 shows the absolute reflectance for each one of the targets. Minor differences were
observed between the various sensors. Substantial differences were recorded for
IKONOS reflectance.
Specifically, for soil targets (both dry and wet), the reflectance response isapproximately the same for all sensors and the relative difference is calculated to be
between 0.8% and 1.3%. It is interesting to note that, wet soil reflectance deviation is
smaller than that of the dry soil. In addition, when barley starts to grow (targets 3 and 4)
Figure 6. Red band reflectance for all sensors and spectral signatures (X-axis, see Table 2)
mentioned in this study.
12 A. Agapiou et al.
Dow
nloa
ded
by [
Ath
os A
gapi
ou]
at 0
1:47
04
Apr
il 20
12
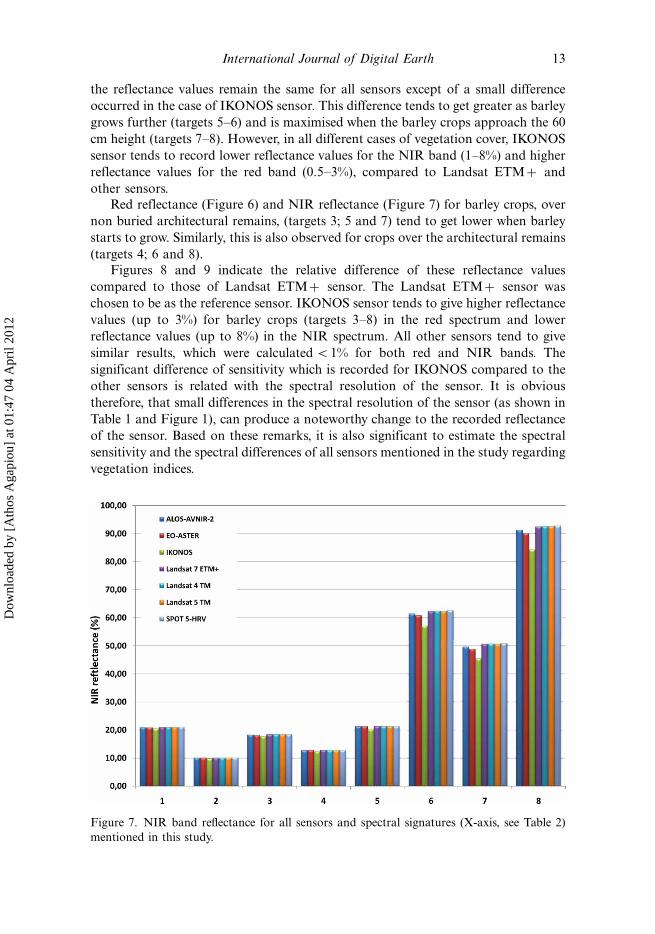
the reflectance values remain the same for all sensors except of a small difference
occurred in the case of IKONOS sensor. This difference tends to get greater as barley
grows further (targets 5�6) and is maximised when the barley crops approach the 60
cm height (targets 7�8). However, in all different cases of vegetation cover, IKONOS
sensor tends to record lower reflectance values for the NIR band (1�8%) and higher
reflectance values for the red band (0.5�3%), compared to Landsat ETM� and
other sensors.
Red reflectance (Figure 6) and NIR reflectance (Figure 7) for barley crops, over
non buried architectural remains, (targets 3; 5 and 7) tend to get lower when barley
starts to grow. Similarly, this is also observed for crops over the architectural remains
(targets 4; 6 and 8).
Figures 8 and 9 indicate the relative difference of these reflectance values
compared to those of Landsat ETM� sensor. The Landsat ETM� sensor was
chosen to be as the reference sensor. IKONOS sensor tends to give higher reflectance
values (up to 3%) for barley crops (targets 3�8) in the red spectrum and lower
reflectance values (up to 8%) in the NIR spectrum. All other sensors tend to give
similar results, which were calculated B1% for both red and NIR bands. The
significant difference of sensitivity which is recorded for IKONOS compared to the
other sensors is related with the spectral resolution of the sensor. It is obvious
therefore, that small differences in the spectral resolution of the sensor (as shown in
Table 1 and Figure 1), can produce a noteworthy change to the recorded reflectance
of the sensor. Based on these remarks, it is also significant to estimate the spectral
sensitivity and the spectral differences of all sensors mentioned in the study regarding
vegetation indices.
Figure 7. NIR band reflectance for all sensors and spectral signatures (X-axis, see Table 2)
mentioned in this study.
International Journal of Digital Earth 13
Dow
nloa
ded
by [
Ath
os A
gapi
ou]
at 0
1:47
04
Apr
il 20
12
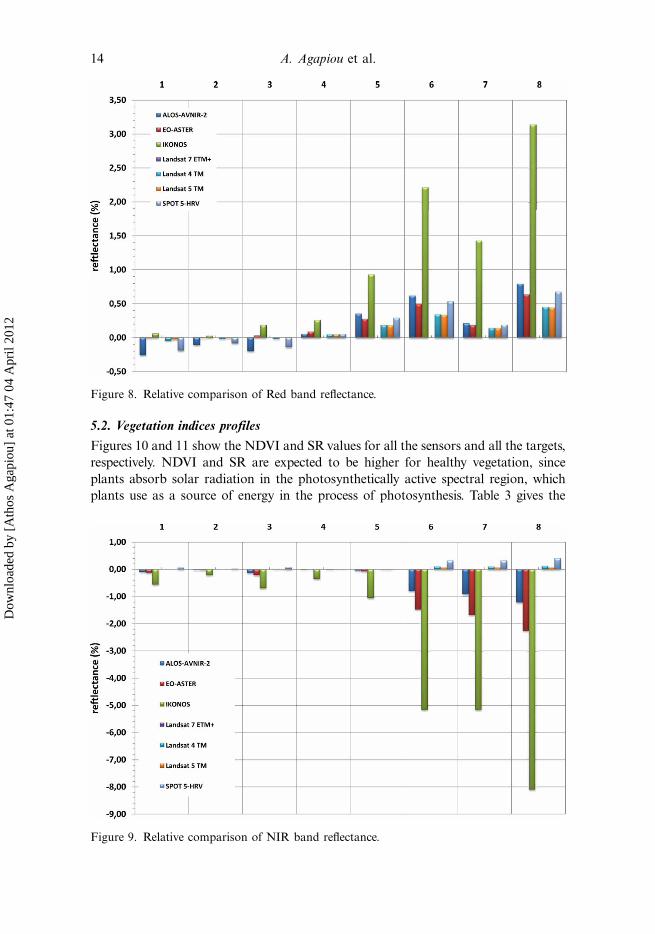
5.2. Vegetation indices profiles
Figures 10 and 11 show the NDVI and SR values for all the sensors and all the targets,
respectively. NDVI and SR are expected to be higher for healthy vegetation, since
plants absorb solar radiation in the photosynthetically active spectral region, which
plants use as a source of energy in the process of photosynthesis. Table 3 gives the
Figure 8. Relative comparison of Red band reflectance.
Figure 9. Relative comparison of NIR band reflectance.
14 A. Agapiou et al.
Dow
nloa
ded
by [
Ath
os A
gapi
ou]
at 0
1:47
04
Apr
il 20
12

absolute value of the NDVI, while Table 4 gives the absolute values of the SR index.
Concerning these statistics, targets 1�4 do not show any significant difference between
the sensors. In contrast, IKONOS values seem to give steady lower response. However,
for the more vegetated targets 5�8, IKONOS sensor continues to give smaller NDVI
Figure 10. NDVI as calculated for the satellite sensors for all spectral signatures.
Figure 11. SR as calculated for the satellite sensors for all spectral signatures.
International Journal of Digital Earth 15
Dow
nloa
ded
by [
Ath
os A
gapi
ou]
at 0
1:47
04
Apr
il 20
12

and SR values compared to the other satellites. Quantitatively, the difference of NDVI
values for IKONOS is approximately 0.06�0.07 (6�7%) less than other sensors.
Moreover, Landsat sensors (TM/ETM�) seem to give very similar results with a
small variation (9 0.01 NDVI or 1% difference) and therefore one can argue that if
pre-processing steps are performed for archive and new overpass satellite Landsat
images then these images can be used as a standard for direct comparison of vegetation
using the NDVI algorithm. However, for SR index the relative values between different
sensors can be very high since SR index is not normalised as NDVI. Moreover,
considering SR index, it is important to mention the substantial difference that is
recorded between the healthy and stress measurements of barley crops during springperiod. This interval in the values highlights the potential of the specific index in
archaeological prospection studies, in the case of buried remains, under barley crops,
because of the corresponding contrast in the values between the area of archaeological
context and the surroundings. This can also be stated for NDVI, but in a much smaller
grade concerning barley crops of 40 cm height (period of January).
Percentage difference between NDVI values for targets 3�4; 5�6 and 7�8 was also
examined. Larger variation between archaeological and in non archaeological areas
can result in better interpretations of images for the detection and identification of
crops marks. As it was found, IKONOS shows the highest difference of the NDVIvalue for all pair of crops. This difference tends to get smaller while the crop is
growing. However, for crops not taller than 40 cm, the NDVI difference can be
reached up to 8% (ALOS-AVNIR-2).Similarly, a significant difference is recorded for
the SR index (15% higher difference for targets 7�8) as well.
Table 3. NDVI values as calculated for all sensors and spectral signatures.
NDVI values for all vegetation and soil types
Sensor 1 2 3 4 5 6 7 8
ALOS-AVNIR-2 0.08 0.07 0.16 0.22 0.64 0.82 0.94 0.86
EO-ASTER 0.08 0.07 0.14 0.22 0.65 0.82 0.94 0.87
IKONOS 0.06 0.06 0.13 0.20 0.59 0.76 0.88 0.81
Landsat 7 ETM� 0.08 0.07 0.15 0.22 0.67 0.83 0.95 0.88
Landsat 4 TM 0.08 0.07 0.15 0.22 0.66 0.82 0.94 0.87
Landsat 5 TM 0.08 0.07 0.15 0.22 0.66 0.82 0.94 0.87
SPOT 5-HRV 0.09 0.07 0.16 0.22 0.65 0.82 0.94 0.87
Table 4. SR values as calculated for all sensors and spectral signatures.
SR values for all vegetation and soil types
Sensor 1 2 3 4 5 6 7 8
ALOS-AVNIR-2 1.18 1.16 1.37 1.57 4.62 9.82 31.52 13.75
EO-ASTER 1.16 1.14 1.34 1.56 4.69 9.90 31.61 13.92
IKONOS 1.14 1.12 1.29 1.49 3.91 7.27 16.24 9.39
Landsat 7 ETM� 1.17 1.15 1.36 1.58 5.01 11.03 37.04 15.82
Landsat 4 TM 1.17 1.15 1.36 1.57 4.80 10.42 33.70 14.71
Landsat 5 TM 1.17 1.15 1.36 1.57 4.80 10.43 33.67 14.72
SPOT 5-HRV 1.19 1.16 1.38 1.57 4.69 10.13 32.72 14.25
16 A. Agapiou et al.
Dow
nloa
ded
by [
Ath
os A
gapi
ou]
at 0
1:47
04
Apr
il 20
12
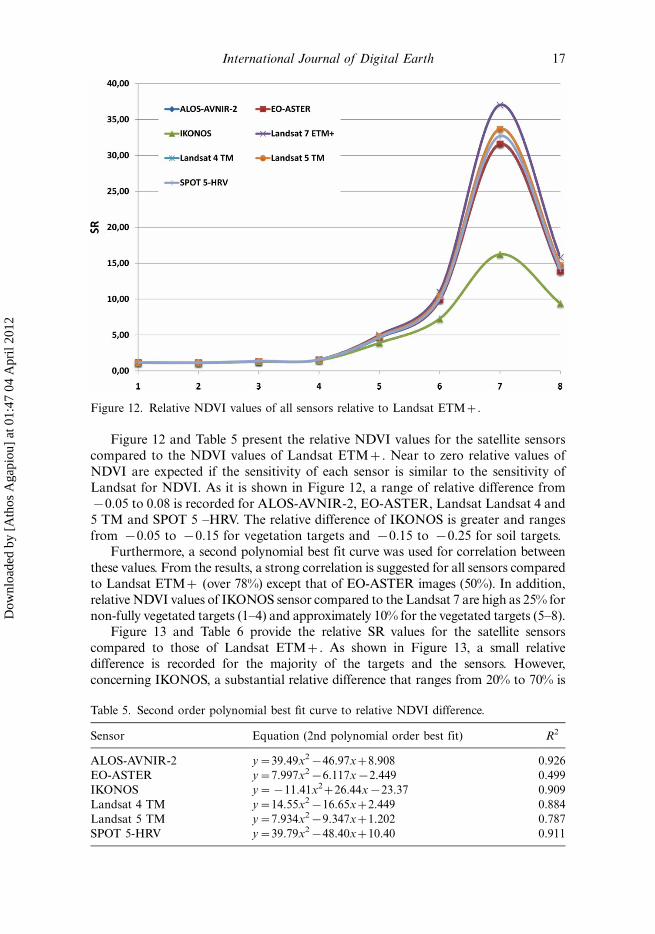
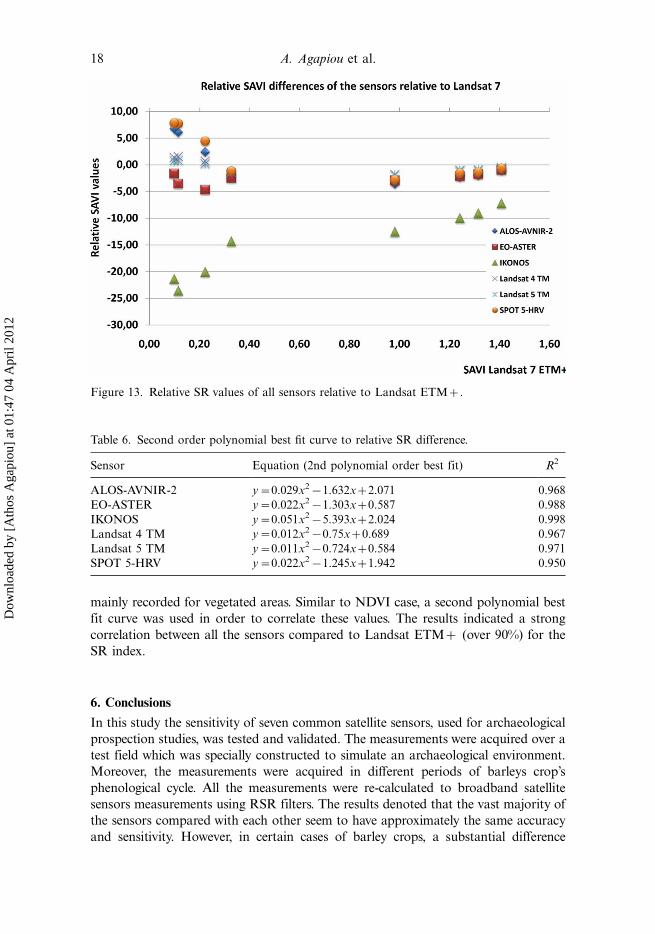
Figure 12 and Table 5 present the relative NDVI values for the satellite sensors
compared to the NDVI values of Landsat ETM�. Near to zero relative values of
NDVI are expected if the sensitivity of each sensor is similar to the sensitivity of
Landsat for NDVI. As it is shown in Figure 12, a range of relative difference from
�0.05 to 0.08 is recorded for ALOS-AVNIR-2, EO-ASTER, Landsat Landsat 4 and
5 TM and SPOT 5 �HRV. The relative difference of IKONOS is greater and ranges
from �0.05 to �0.15 for vegetation targets and �0.15 to �0.25 for soil targets.
Furthermore, a second polynomial best fit curve was used for correlation between
these values. From the results, a strong correlation is suggested for all sensors compared
to Landsat ETM� (over 78%) except that of EO-ASTER images (50%). In addition,
relative NDVI values of IKONOS sensor compared to the Landsat 7 are high as 25% for
non-fully vegetated targets (1�4) and approximately 10% for the vegetated targets (5�8).
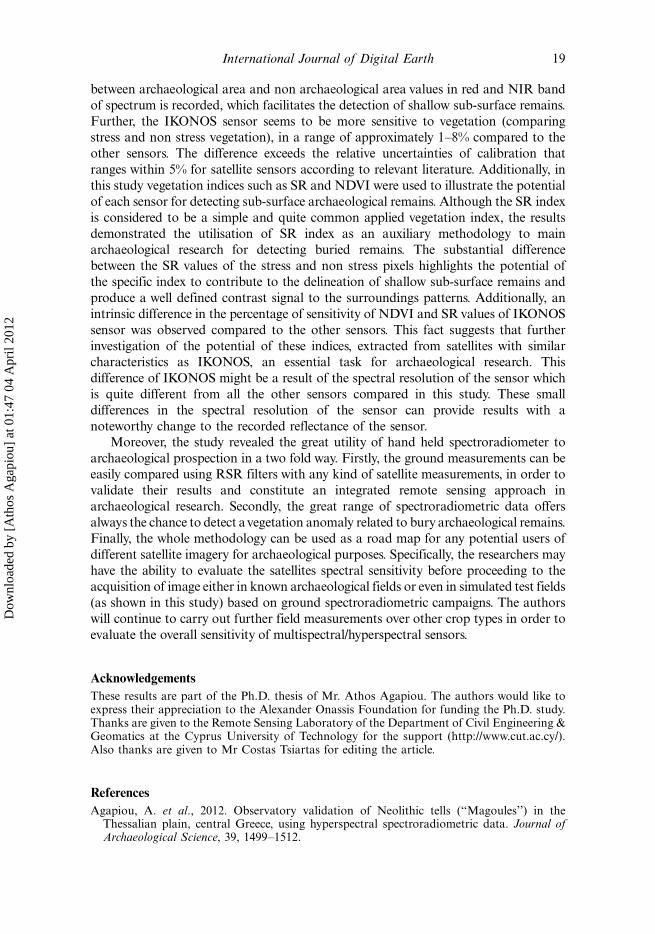
Figure 13 and Table 6 provide the relative SR values for the satellite sensors
compared to those of Landsat ETM�. As shown in Figure 13, a small relative
difference is recorded for the majority of the targets and the sensors. However,
concerning IKONOS, a substantial relative difference that ranges from 20% to 70% is
Figure 12. Relative NDVI values of all sensors relative to Landsat ETM�.
Table 5. Second order polynomial best fit curve to relative NDVI difference.
Sensor Equation (2nd polynomial order best fit) R2
ALOS-AVNIR-2 y�39.49x2�46.97x�8.908 0.926
EO-ASTER y�7.997x2�6.117x�2.449 0.499
IKONOS y��11.41x2�26.44x�23.37 0.909
Landsat 4 TM y�14.55x2�16.65x�2.449 0.884
Landsat 5 TM y�7.934x2�9.347x�1.202 0.787
SPOT 5-HRV y�39.79x2�48.40x�10.40 0.911
International Journal of Digital Earth 17
Dow
nloa
ded
by [
Ath
os A
gapi
ou]
at 0
1:47
04
Apr
il 20
12
mainly recorded for vegetated areas. Similar to NDVI case, a second polynomial best
fit curve was used in order to correlate these values. The results indicated a strong
correlation between all the sensors compared to Landsat ETM� (over 90%) for the
SR index.
6. Conclusions
In this study the sensitivity of seven common satellite sensors, used for archaeological
prospection studies, was tested and validated. The measurements were acquired over a
test field which was specially constructed to simulate an archaeological environment.
Moreover, the measurements were acquired in different periods of barleys crop’s
phenological cycle. All the measurements were re-calculated to broadband satellite
sensors measurements using RSR filters. The results denoted that the vast majority of
the sensors compared with each other seem to have approximately the same accuracy
and sensitivity. However, in certain cases of barley crops, a substantial difference
Figure 13. Relative SR values of all sensors relative to Landsat ETM�.
Table 6. Second order polynomial best fit curve to relative SR difference.
Sensor Equation (2nd polynomial order best fit) R2
ALOS-AVNIR-2 y�0.029x2�1.632x�2.071 0.968
EO-ASTER y�0.022x2�1.303x�0.587 0.988
IKONOS y�0.051x2�5.393x�2.024 0.998
Landsat 4 TM y�0.012x2�0.75x�0.689 0.967
Landsat 5 TM y�0.011x2�0.724x�0.584 0.971
SPOT 5-HRV y�0.022x2�1.245x�1.942 0.950
18 A. Agapiou et al.
Dow
nloa
ded
by [
Ath
os A
gapi
ou]
at 0
1:47
04
Apr
il 20
12
between archaeological area and non archaeological area values in red and NIR band
of spectrum is recorded, which facilitates the detection of shallow sub-surface remains.
Further, the IKONOS sensor seems to be more sensitive to vegetation (comparing
stress and non stress vegetation), in a range of approximately 1�8% compared to the
other sensors. The difference exceeds the relative uncertainties of calibration that
ranges within 5% for satellite sensors according to relevant literature. Additionally, in
this study vegetation indices such as SR and NDVI were used to illustrate the potential
of each sensor for detecting sub-surface archaeological remains. Although the SR index
is considered to be a simple and quite common applied vegetation index, the results
demonstrated the utilisation of SR index as an auxiliary methodology to main
archaeological research for detecting buried remains. The substantial difference
between the SR values of the stress and non stress pixels highlights the potential of
the specific index to contribute to the delineation of shallow sub-surface remains and
produce a well defined contrast signal to the surroundings patterns. Additionally, an
intrinsic difference in the percentage of sensitivity of NDVI and SR values of IKONOS
sensor was observed compared to the other sensors. This fact suggests that further
investigation of the potential of these indices, extracted from satellites with similar
characteristics as IKONOS, an essential task for archaeological research. This
difference of IKONOS might be a result of the spectral resolution of the sensor which
is quite different from all the other sensors compared in this study. These small
differences in the spectral resolution of the sensor can provide results with a
noteworthy change to the recorded reflectance of the sensor.
Moreover, the study revealed the great utility of hand held spectroradiometer to
archaeological prospection in a two fold way. Firstly, the ground measurements can be
easily compared using RSR filters with any kind of satellite measurements, in order to
validate their results and constitute an integrated remote sensing approach in
archaeological research. Secondly, the great range of spectroradiometric data offers
always the chance to detect avegetation anomaly related to bury archaeological remains.
Finally, the whole methodology can be used as a road map for any potential users of
different satellite imagery for archaeological purposes. Specifically, the researchers may
have the ability to evaluate the satellites spectral sensitivity before proceeding to the
acquisition of image either in known archaeological fields or even in simulated test fields
(as shown in this study) based on ground spectroradiometric campaigns. The authors
will continue to carry out further field measurements over other crop types in order to
evaluate the overall sensitivity of multispectral/hyperspectral sensors.
Acknowledgements
These results are part of the Ph.D. thesis of Mr. Athos Agapiou. The authors would like toexpress their appreciation to the Alexander Onassis Foundation for funding the Ph.D. study.Thanks are given to the Remote Sensing Laboratory of the Department of Civil Engineering &Geomatics at the Cyprus University of Technology for the support (http://www.cut.ac.cy/).Also thanks are given to Mr Costas Tsiartas for editing the article.
References
Agapiou, A. et al., 2012. Observatory validation of Neolithic tells (‘‘Magoules’’) in theThessalian plain, central Greece, using hyperspectral spectroradiometric data. Journal ofArchaeological Science, 39, 1499�1512.
International Journal of Digital Earth 19
Dow
nloa
ded
by [
Ath
os A
gapi
ou]
at 0
1:47
04
Apr
il 20
12

Agapiou, A. et al., 2011a. The importance of accounting for atmospheric effects in theapplication of NDVI and interpretation of satellite imagery supporting archaeologicalresearch: the case studies of Palaepaphos and Nea Paphos sites in Cyprus. Remote Sensing,3 (12), 2605�2629.
Agapiou, A. et al., 2011b. Exploring ground spectroscopy for the detection of sub-surfacesarchitectural remains: the methodological context. In Proceedings XVI Congress of theUISPP (International Union for Prehistoric and Protohistoric Sciences), 4�10 September,Florianopolil, Brazil (in press).
Agapiou, A. and Hadjimitsis, D.G. 2011. Vegetation indices and field spectroradiometricmeasurements for validation of buried architectural remains: verification under areasurveyed with geophysical campaigns. Journal of Applied Remote Sensing, 5, 05355.DOI:10.1117/1.3645590
Agapiou, A., et al., 2010. Hyperspectral ground truth data for the detection of buriedarchitectural remains. Lecture Notes of Computer Science, 6436, 318�331.
Akkartal, A., Turudu, O., and Erbek, F.S. 2004. Analysis of changes in vegetation biomassusing multisensor satellite data. Proceedings of the ISPRS Congress-Youth Forum, XXXV,181�185.
Alexakis, A., et al., 2011. Integrated GIS, remote sensing and geomorphologic approaches forthe reconstruction of the landscape habitation of Thessaly during the neolithic period.Journal of Archaeological Science, 38, 89�100.
Alexakis, D., et al., 2009. Detection of neolithic settlements in Thessaly (Greece) throughmultispectral and hyperspectral satellite imagery. Sensors, 9, 1167�1187.
Altaweel, M., 2005. The use of ASTER satellite imagery in archaeological contexts.Archaeological Prospection, 12, 151�166.
Beck, A., 2007. Archaeological site detection: the importance of contrast. In Proceedings ofthe Annual Conference of the Remote Sensing and Photogrammetry Society, 11�14September, Newcastle Upon Tyne, Newcastle University.
Bewley, R.H., 2003. Aerial Survey for Archaeology. The Photogrammetric Record, 18 (104),273�292.
Campbell, J.B. 2002. Introduction to remote sensing. London and New York: Guilford Press.Chander, G., Markham, L.B., and Helder, L.D., 2009. Summary of current radiometric
calibration coefficients for Landsat MSS, TM, ETM�, and EO-1 ALI sensors. RemoteSensing of Environment, 113, 893�903.
Chen, J., 1996. Evaluation of vegetation indices and modified simple ratio for borealapplications. Canadian Journal of Remote Sensing, 22, 229�242.
Ciminale, M. et al., 2009. A multiscale approach for reconstructing archaeological landscapes:applications in Northern Apulia (Italy). Archaeological Prospection, 16, 143�153. DOI:10.1002/arp.356
Clark, C.D., Garrod, S.M., and Pearson, M.P., 1998. Landscape archaeology and remote sensingin southern Madagascar. International Journal of Remote Sensing, 19 (8), 1461�1477.
Curran, P.J. and Williamson, H.D., 1986. Sample size for ground and remotely sensed data.Remote Sensing of Environment, 20, 31�41.
Hadjimitsis, D.G. et al., 2011. Exploring natural and anthropogenic risk for cultural heritagein Cyprus using remote sensing and GIS. International Journal of Digital Earth.DOI:10.1080/17538947.2011.602119
Hadjimitsis, D.G. et al., 2009. Multi-temporal study of archaeological sites in Cyprus usingatmospheric corrected satellite remotely sensed data. International Journal of ArchitecturalComputing, 7 (1), 121�138 (18). DOI: 10.1260/147807709788549376
Herold, M., et al., 2004. Spectrometry for urban area remote sensing: development andanalysis of a spectral library from 350 to 2400 nm. Remote Sensing of Environment, 91 (3�4),30, 304�319. ISSN 0034-4257, DOI: 10.1016/j.rse.2004.02.013
Jarvis, P.G., 1995. Scaling processes and problems. Plant Cell & Enviroment, 18, 1079�1089.Jonson, K.J., 2006. Remote sensing in archaeology. An explicitly North America perspective.
Tuscaloosa, AL: The University of Alabama Press.Laet, V., Paulissen, E., and Waelkens, M., 2007. Methods for the extraction of archaeological
features from very high-resolution Ikonos-2 remote sensing imagery, Hisar (southwestTurkey). Journal of Archaeological Science, 34, 830�841.
20 A. Agapiou et al.
Dow
nloa
ded
by [
Ath
os A
gapi
ou]
at 0
1:47
04
Apr
il 20
12
Lasaponara, R. and Masini, N. 2001. Satellite remote sensing in archaeology: past, presentand future perspectives. Journal of Archaeological Science, 38 (9), 995�2002. DOI:10.1016/j.jas.2011.02.002
Lasaponara, R. and Masini, N., 2005. QuickBird-based analysis for the spatial characteriza-tion of archaeological sites: case study of the Monte Serico Medioeval village. GeophysicalResearch Letter, 32 (12), L12313.
Lasaponara, R. and Masini, N., 2006. Identification of archaeological buried remains basedon Normalized Difference Vegetation Index (NDVI) from Quickbird satellite data. IEEEGeoscience and Remote Sensing Letters, 3 (3), 325�328.
Lasaponara, R. and Masini, N., 2007. Detection of archaeological crop marks by usingsatellite QuickBird multispectral imagery. Journal of Archaeological Science, 34, 214�221.
Lillesand, M., Kiefer, T., and Chipman, J.W., 2004. Remote sensing and image interpretation.New York, NY: Wiley International Edition.
Malenovsky, Z., et al., 2007. Scaling dimensions in spectroscopy of soil and vegetation.International Journal of Applied Earth Observation and Geoinformation, 9 (2), 137�164.
Marceau, J.D., et al., 1994. Remote sensing and the measurement of geographical entities in aforested environment. 2. The optimal spatial resolution. Remote Sensing of Environment, 49(2), 105�117.
Markham, B.L. and Barker, J.L., 1985. Spectral characterization of the LANDSAT ThematicMapper sensors. International Journal of Remote Sensing, 6 (5), 697�716.
Markham, B.L., et al., 1997. Landsat-7 enhanced Thematic Mapper plus radiometriccalibration. Canadian Journal of Remote Sensing, 23 (4), 318�332.
Masini, N. and Lasaponara, R., 2007. Investigating the spectral capability of QuickBird datato detect archaeological remains buried under vegetated and not vegetated areas. Journal ofCultural Heritage, 8, 53�60.
Mills, J. and Palmer, R., 2007. Populating clay landscapes. Stroud, UK: Tempus.Milton, J., 1987. Principles of field spectroscopy. Remote Sensing of Environment, 8 (12),
1807�1827.Milton, E.J. and Rollin, E.M. 2006. Estimating the irradiance spectrum from measurements in
a limited number of spectral bands. Remote Sensing of Environment, 100 (3), 348�355.DOI:10.1016/j.rse.2005.10.016
Milton, E.J., et al., 2009. Progress in field spectroscopy. Remote Sensing of Environment, 113,92�109.
Papadavid, G. et al., 2011. Mapping potato crop height and leaf area index through vegetationindices using remote sensing in Cyprus. Journal of Applied Remote Sensing, 5, 053526.DOI:10.1117/1.3596388
Parcak, S.H., 2009. Satellite remote sensing for archaeology. London and New York: RoutledgeTaylor and Francis Group.
Peddle, D.R., et al., 2001. Reflectance processing of remote sensing spectroradiometer data.Computers & Geosciences, 27, 203�213.
Riley, D.N., 1979. Factors in the development of crop marks. Aerial Archaeology, 4, 28�32.Rouse, J.W. et al., 1974. Monitoring the vernal advancements and retrogradation (greenwave
effect) of nature vegetation, NASA/GSFC Final Report. Greenbelt, MD: Texas A & MUniversity, Remote Sensing Center College Station.
Rowlands, A. and Sarris, A., 2007. Detection of exposed and subsurface archaeologicalremains using multi-sensor remote sensing. Journal of Archaeological Science, 34, 795�803.
Sarris, A. and Jones, R., 2000. Geophysical and related techniques applied to archaeologicalsurvey in the Mediterranean: a review. Journal of Mediterranean Archaeology, 13 (1), 3�75.
Sellers, P.J., 1985. Canopy reflectance, photosynthesis and transpiration. International Journalof Remote Sensing, 6, 1335�1372.
Sharpe, L., 2004. Geophysical, geochemical and arable crop responses to archaeological sites inthe Upper Clyde Valley, Scotland. Thesis (PhD). University of Glasgow.
Stanjek, H. and Fabinder, J.W.E., 1995. Soil aspects affecting archaeological details in aerialphotographs. Archaeological Prospection, 2 (1), 91�101.
Teillet, P.M., et al., 2007. Impacts of spectral band difference effects on radiometric cross-calibration between satellite sensors in the solar-reflective spectral domain. Remote Sensingof Environment, 110 (3), 393�409. ISSN 0034-4257, DOI: 10.1016/j.rse.2007.03.00
International Journal of Digital Earth 21
Dow
nloa
ded
by [
Ath
os A
gapi
ou]
at 0
1:47
04
Apr
il 20
12
Tran, D.-B.T. et al., 2011. Optimizing spatial resolution of imagery for urban form detection*the cases of France and Vietnam. Remote Sensing, 3, 2128�2147. DOI:10.3390/rs3102128
Tripathi, A., 2000. Remote sensing and archaeology. New Delhi: Sundeep Prakashan.Trishchenko, P.A., 2009. Effects of spectral response function on surface reflectance and
NDVI measured with moderate resolution satellite sensors: extension to AVHRR NOAA-17, 18 and METOP-A. Remote Sensing of Environment, 113 (2), 335�341. ISSN 0034-4257,DOI: 10.1016/j.rse.2008.10.002
Trishchenko, P.A., Cihlar, J., and Zhanqing, L., 2002. Effects of spectral response functionon surface reflectance and NDVI measured with moderate resolution satellite sensors.Remote Sensing of Environment, 81 (1), 1�18. ISSN 0034-4257, DOI: 10.1016/S0034-4257(01)00328-5
Tucker, C.J., 1979. Red and photographic infrared linear combinations for monitoringvegetation. Remote Sensing of Environment, 8 (2), 127�150.
Winton, H. and Horne, P. 2010. National archives for national survey programmes: NMP andthe English heritage aerial photograph collection. In Landscapes through the Lens. AerialPhotographs and Historic Enviroment. Aerial Archaeology Research Group No. 2, 7�18.
Wu, H. and Liang Li, Z. 2009. Scale issues in remote sensing: a review on analysis, processingand modeling. Sensors, 9, 1768�1793. DOI:10.3390/s90301768
Wu, X., Sullivan, T.J., and Heidinger, K.A., 2010. Operational calibration of the advancedvery high resolution radiometer (AVHRR) visible and near-infrared channels. CanadianJournal of Remote Sesning, 36 (5), 602�616.
22 A. Agapiou et al.
Dow
nloa
ded
by [
Ath
os A
gapi
ou]
at 0
1:47
04
Apr
il 20
12
Copyright © 2022 FDOKUMEN