Relationships among remotely sensed soil moisture, precipitation and landslide events
Upload
independentCategory
view
5download
0
www.elsevier.com/locate/jag
International Journal of Applied Earth Observation
and Geoinformation 9 (2007) 225–234
Remotely sensed characterization of forest fuel types
by using satellite ASTER data
Rosa Lasaponara *, Antonio Lanorte
National Research Council, Institute of Methodologies of Environmental Analysis, C. da S. Loja, Tito Scalo, Potenza 85050, Italy
Received 9 January 2006; accepted 11 August 2006
Abstract
The characterization of fuel types is very important for computing spatial fire hazard and risk and simulating fire growth and
intensity across a landscape. However, due to the complex nature of fuel characteristic a fuel map is considered one of the most
difficult thematic layers to build up. The advent of sensors with increased spatial resolution may improve the accuracy and reduce
the cost of fuels mapping. The objective of this research is to evaluate the accuracy and utility of imagery from the Advanced
Spaceborne Thermal Emission and Reflection Radiometer (ASTER) satellite imagery. In order to ascertain how well ASTER data
can provide an exhaustive classification of fuel properties a sample area characterized by mixed vegetation covers was analysed.
The selected sample areas has an extension at around 60 km2 and is located inside the Sila plateau in the Calabria Region (South of
Italy). Fieldwork fuel type recognitions, performed before, after and during the acquisition of remote sensing ASTER data, were
used as ground-truth dataset to assess the results obtained for the considered test area. The method comprised the following three
steps: (I) adaptation of Prometheus fuel types for obtaining a standardization system useful for remotely sensed classification of fuel
types and properties in the considered Mediterranean ecosystems; (II) model construction for the spectral characterization and
mapping of fuel types based on a maximum likelihood (ML) classification algorithm; (III) accuracy assessment for the performance
evaluation based on the comparison of ASTER-based results with ground-truth. Results from our analysis showed that the use
ASTER data provided a valuable characterization and mapping of fuel types being that the achieved classification accuracy was
higher than 90%.
# 2006 Elsevier B.V. All rights reserved.
Keywords: Fire; Fuel type; ASTER data
1. Introduction
Wildland fires are considered one of the most
important disturbance factors in natural ecosystems of
the Mediterranean regions, where every year, around
45,000 forest fires break out causing the destruction of
about 2.6 million ha (FAO, 2001). Several studies (see,
for example, Vila et al., 2001) dealing with the effects of
* Corresponding author.
E-mail address: [email protected] (R. Lasaponara).
0303-2434/$ – see front matter # 2006 Elsevier B.V. All rights reserved.
doi:10.1016/j.jag.2006.08.001
fires on the vegetation within the Mediterranean basin
found that fires induce significant alterations in short as
well as long-term vegetation dynamics.
Prevention measures, together with early warning
and fast extinction, are the only methods available that
can support fire fighting and limit damages caused by
fires especially in regions with high ecological value,
dense populations, etc. In order to limit fire damage, fire
agencies need to have effective decision support tools
that are able to provide timely information for
quantifying fire risk. In particular, fire managers need
information concerning the distribution, amount and
R. Lasaponara, A. Lanorte / International Journal of Applied Earth Observation and Geoinformation 9 (2007) 225–234226
condition of fuels in order to improve fire prevention
and modelling fire spreading and intensity. Geographic
information systems (GIS) and remote sensing (RS) are
considered useful tools to support different phase of fire
monitoring, prevention, detection and post-fire damage
evaluation. In particular, satellite remote sensing can
successfully cope with different aspects of fire
management problems, such as danger estimation
(see, for example, review in Lasaponara, in press), fire
detection (see, for example reviews performed by
Cuomo et al., 2001; Lasaponara et al., 2003) burned
area mapping (Lasaponara, 2006, papers therein
quoted) and post-fire vegetation recovery (Telesca
and Lasaponara, 2006-a,b,c; Telesca and Lasaponara,
2005; Telesca et al., 2006-d).
In particular, remote sensing can provide valuable
data on type (namely distribution and amount of fuels)
and status of vegetation in a consistent way at different
spatial and temporal scales, see, for example, (Lasa-
ponara and Lanorte, 2006a,b,c). Since the description of
fuel proprieties is usually very complex, fire managers
have tried to summarize the physical parameters and
spatial distribution of fuel in different classes also
known as ‘‘fuel models’’ (Anderson, 1982; Burgan and
Rothermal, 1984). More specifically, a fuel model has
been defined as ‘‘an identifiable association of fuel
elements of distinctive species, form, size, arrangement,
and continuity that will exhibit characteristic fire
behaviour under defined burning conditions’’ (Merrill
and Alexander, 1987). The spatial distribution of the
fuel characteristics can be displayed as fuel type maps.
Northern Forest Fire Laboratory (NFFL) system
(Albini, 1976) is the most common and well-know fuel
model that was developed taking the vegetation
structure and characteristic of the North-American
floras in to account. Recently, in the framework of the
Prometheus project (1999), a new fuel type classifica-
tion system was specifically developed to better
represent the fuel characteristic of the Mediterranean
ecosystems (http://kentauros.rtd.algo.com.gr/promet/
index.htm, Algosystems SA, Greece). This classifica-
tion is principally based on the height and density of
fuel, which directly influence the intensity and
propagation of wildfire.
Due to the complex nature of fuel characteristic a
fuel map is considered one of the most difficult thematic
layers to build up (Keane et al., 2000) especially for
large areas. Aerial photos have been the most common
remote sensing data source traditionally used (Morris,
1970; Muraro, 1970; Oswald et al., 1999) for mapping
fuel types distribution. Nevertheless, remote sensing
data can be an effective data source available at different
temporal and spatial scales. For example, Lidar and
have been successfully used for estimating forest
canopy fuel parameters (Andersen et al., 2005).
Airborne hyperspectral sensors, such as multispectral
infrared and visible imaging spectrometer (MIVIS) and
airborne visible/infrared imaging spectrometer
(AVIRIS), demonstrated high reliability for fuel typing.
Several studies have been performed for assessing
spatial pattern of forest fuel using AVIRIS imagery by
Jia et al. (2006), Boardman (1998) and Boardman et al.
(1995). High accuracy levels (higher than 90%) were
obtained from MIVIS even for extremely heteroge-
neous areas (see, Lasaponara et al., 2006-a,b; Lasapo-
nara et al., in press).
Satellite multispectral data can be fruitfully adopted
for building up fuel type maps from global, region down
to local scale. For this purpose, up to now, several
satellite sensors have been used in last decades. For
example, NOAA-AVHRR (Advanced Very High Reso-
lution Radiometer) data were used by Mckinley et al.
(1985) for mapping fuel types in Western United States.
Landsat Thematic Mapper data were used for mapping
fuels models in Yosemite National Park, USA (Van
Wagtendonk and Root, 2003); and in Spain (Cohen,
1989 in California; Riano et al., 2002; Salas and
Chuvieco, 1994). A multisensor approach based on Spot
and Landsat imager was adopted by Castro and
Chuvieco (1998) to perform a classification of fuel
types for Chile by using an adapted version of
Anderson’s system.
The accuracies obtained from these researches
generally ranged from 65% to 90% (Chuvieco, 1999;
Lasaponara and Lanorte, 2006a,b,c). The higher
accuracy values were obtained using airborne hyper-
spectral MIVIS data (Lasaponara, 2006). The accuracy
level is strongly related with fuel presence and spatial
distribution (how many and where) and with specific
environmental conditions (topography, land cover
heterogeneity, etc.). The importance of using multi-
sensor data source to map fuel model was emphasised
by many authors (see, for example, Keane et al., 2001).
Although the recognized feasibility of satellite
sensors traditionally used for the remote characteriza-
tion of fuel types, the advent of new sensors with
improved spatial and spectral resolutions may improve
the accuracy (Chuvieco and Congalton, 1989) and
reduce the cost (Zhu and Blumberg, 2001) of forest fire
fuel mapping. Up to now, fire researchers did not paid
enough attention to the potentiality of using remote
sensing ASTER (Advanced Spaceborne Thermal
Emission and Reflection Radiometer) data to map fuel
types and properties.
R. Lasaponara, A. Lanorte / International Journal of Applied Earth Observation and Geoinformation 9 (2007) 225–234 227
This research aims to investigate the usefulness of
ASTER data to characterize and map fuel types in
fragmented ecosystems, such as those found in the
Mediterranean basin. This objective is achieved by
using Prometheus model coupled with ASTER data that
were analysed by using maximum likelihood (ML)
classifier for a test case (located in the south of Italy)
that is highly representative of Mediterranean like
ecosystems.
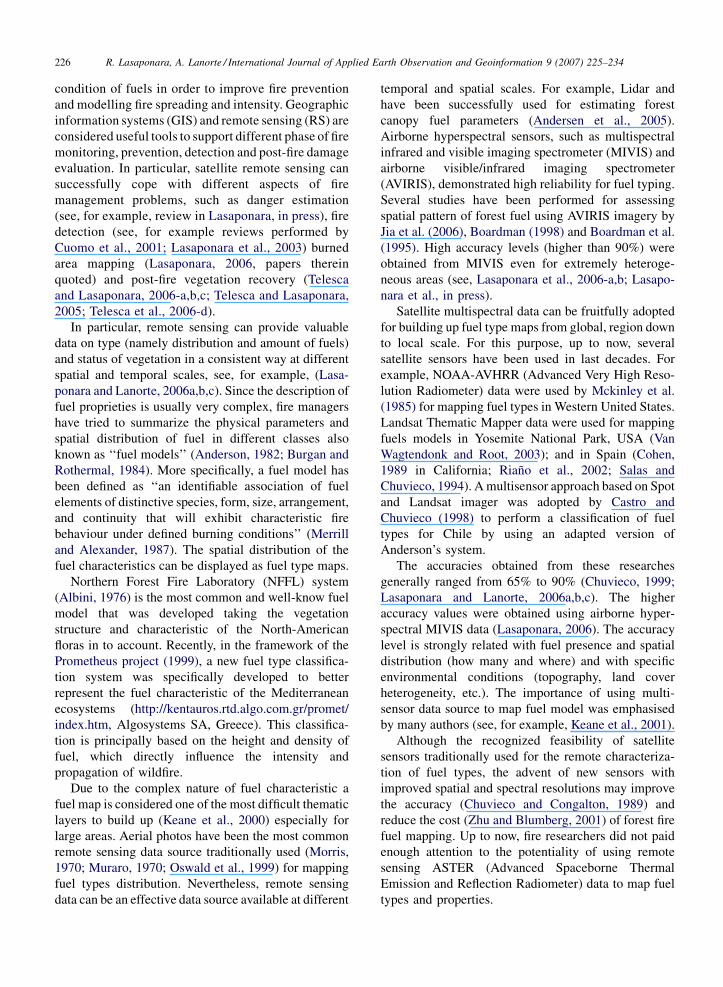
2. Study area
The study area has an extension of about 6.400 ha
and it is located inside the Sila plateau in the central part
of the Calabria Region. Fig. 1 shows the ASTER picture
for the study area.
The altitude of the study area is ranging from 1000 to
1600 m above sea level (a.s.l.). The site faces the
watershed between the basins of the Arco river and its
affluent. From a geological point of view the study area
Fig. 1. ASTER picture
is within the Monte Garigliano unit made up of high
grade metamorphic rocks, such as graniodiorites and
magmatites. The soils are mainly composed of siliceous
sands, products of the chemical and mechanical
alteration of acid igneous rocks, with a minor part of
clays made up of kaolins and vermiculites.
The more diffuse and important especially is the
Calabrian Laricio pine (Pinus Nigra Var. Calabrica) that
is to form pure woods and seldom mixture with other
especially, caducous leaves oaks (Quercus pubescens in
lower areas and Quercus cerris and Quercus frainetto in
higher areas up to 1000–1200), black and Neapolitan
Ontano (Alnus glutinosa, Alnus cordata) to altitudes he
understood between 1000 and the 1400 m of share. In
the highest altitudinal strip, above the 1400 m, they are
present mixed woods of oaks and beech (Fagus
sylvatica). Evident degradation forms are present, in
the form of xerophytic prairies and substitution bushes.
The deforested areas in this strip are generally engaged
by mesophytic prairies used for pasture.
for the study area.
R. Lasaponara, A. Lanorte / International Journal of Applied Earth Observation and Geoinformation 9 (2007) 225–234228
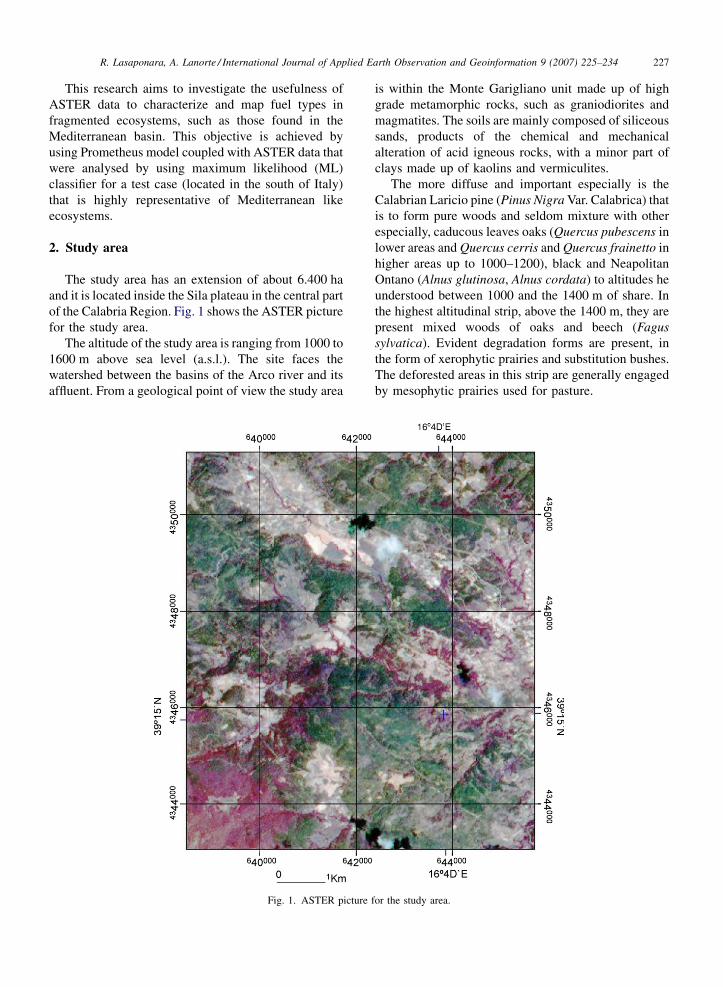
Table 1
Characteristic of the ASTER spectral bands
Bands Lower edge (mm) Upper edge (mm)
1 0.52 0.60
2 0.63 0.69
3N 0.76 0.86
3B 0.76 0.86
4 1.60 1.70
5 2.145 2.185
6 2.185 2.225
7 2.235 2.285
8 2.295 2.365
9 2.36 2.43
10 8.125 8.475
11 8.475 8.825
12 8.925 9.275
13 10.25 10.95
14 10.95 11.65
3. Data analysis
3.1. Dataset
ASTER is a high resolution imaging instrument that
is flying on the earth observing system (EOS) Terra
satellite. It has the highest spatial resolution of all five
sensors on Terra and collects data in the visible/near
infrared (VNIR), short wave infrared (SWIR), and
thermal infrared bands (TIR). Each subsystem is
pointable in the crosstrack direction. The VNIR
subsystem of ASTER is quite unique. One telescope
of the VNIR system is nadir looking and two are
backward looking, allowing for the construction of
three-dimensional digital elevation models (DEM) due
to the stereo capability of the different look angles.
ASTER has a revisit period of 16 days, to any one
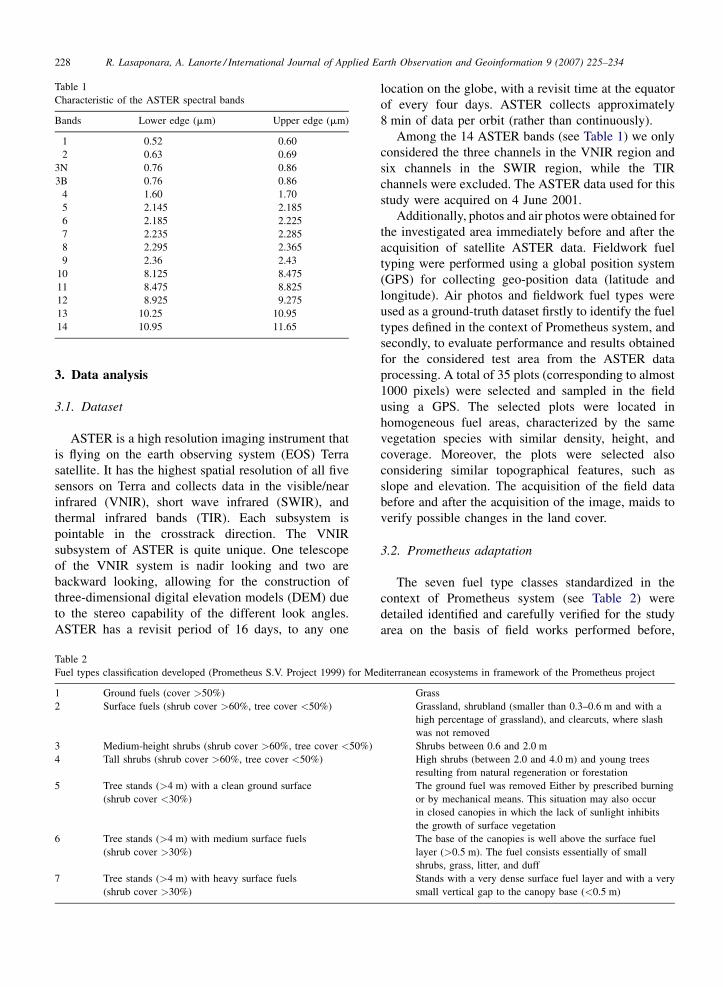
Table 2
Fuel types classification developed (Prometheus S.V. Project 1999) for Me
1 Ground fuels (cover >50%)
2 Surface fuels (shrub cover >60%, tree cover <50%)
3 Medium-height shrubs (shrub cover >60%, tree cover <50%)
4 Tall shrubs (shrub cover >60%, tree cover <50%)
5 Tree stands (>4 m) with a clean ground surface
(shrub cover <30%)
6 Tree stands (>4 m) with medium surface fuels
(shrub cover >30%)
7 Tree stands (>4 m) with heavy surface fuels
(shrub cover >30%)
location on the globe, with a revisit time at the equator
of every four days. ASTER collects approximately
8 min of data per orbit (rather than continuously).
Among the 14 ASTER bands (see Table 1) we only
considered the three channels in the VNIR region and
six channels in the SWIR region, while the TIR
channels were excluded. The ASTER data used for this
study were acquired on 4 June 2001.
Additionally, photos and air photos were obtained for
the investigated area immediately before and after the
acquisition of satellite ASTER data. Fieldwork fuel
typing were performed using a global position system
(GPS) for collecting geo-position data (latitude and
longitude). Air photos and fieldwork fuel types were
used as a ground-truth dataset firstly to identify the fuel
types defined in the context of Prometheus system, and
secondly, to evaluate performance and results obtained
for the considered test area from the ASTER data
processing. A total of 35 plots (corresponding to almost
1000 pixels) were selected and sampled in the field
using a GPS. The selected plots were located in
homogeneous fuel areas, characterized by the same
vegetation species with similar density, height, and
coverage. Moreover, the plots were selected also
considering similar topographical features, such as
slope and elevation. The acquisition of the field data
before and after the acquisition of the image, maids to
verify possible changes in the land cover.
3.2. Prometheus adaptation
The seven fuel type classes standardized in the
context of Prometheus system (see Table 2) were
detailed identified and carefully verified for the study
area on the basis of field works performed before,
diterranean ecosystems in framework of the Prometheus project
Grass
Grassland, shrubland (smaller than 0.3–0.6 m and with a
high percentage of grassland), and clearcuts, where slash
was not removed
Shrubs between 0.6 and 2.0 m
High shrubs (between 2.0 and 4.0 m) and young trees
resulting from natural regeneration or forestation
The ground fuel was removed Either by prescribed burning
or by mechanical means. This situation may also occur
in closed canopies in which the lack of sunlight inhibits
the growth of surface vegetation
The base of the canopies is well above the surface fuel
layer (>0.5 m). The fuel consists essentially of small
shrubs, grass, litter, and duff
Stands with a very dense surface fuel layer and with a very
small vertical gap to the canopy base (<0.5 m)
R. Lasaponara, A. Lanorte / International Journal of Applied Earth Observation and Geoinformation 9 (2007) 225–234 229
during and after the acquisition of ASTER remote
sensing data. In particular, photos and air photos, taken
for the investigated region before, after and during the
acquisition of ASTER data, along with the fuel types
recognized in the field were used for this purpose.
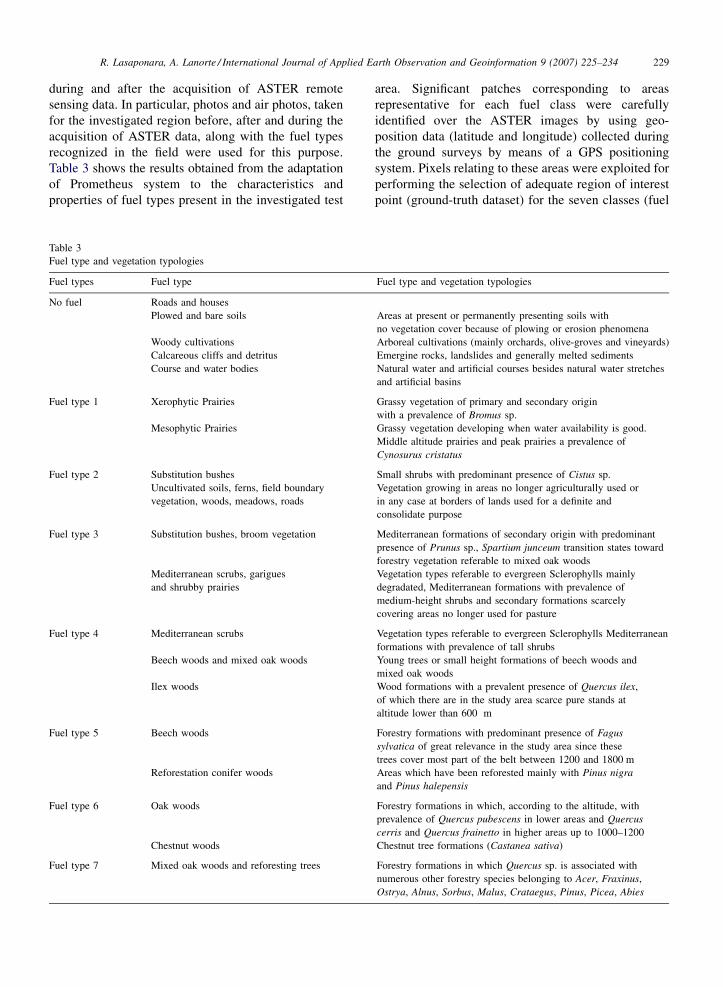
Table 3 shows the results obtained from the adaptation
of Prometheus system to the characteristics and
properties of fuel types present in the investigated test
Table 3
Fuel type and vegetation typologies
Fuel types Fuel type
No fuel Roads and houses
Plowed and bare soils
Woody cultivations
Calcareous cliffs and detritus
Course and water bodies
Fuel type 1 Xerophytic Prairies
Mesophytic Prairies
Fuel type 2 Substitution bushes
Uncultivated soils, ferns, field boundary
vegetation, woods, meadows, roads
Fuel type 3 Substitution bushes, broom vegetation
Mediterranean scrubs, garigues
and shrubby prairies
Fuel type 4 Mediterranean scrubs
Beech woods and mixed oak woods
Ilex woods
Fuel type 5 Beech woods
Reforestation conifer woods
Fuel type 6 Oak woods
Chestnut woods
Fuel type 7 Mixed oak woods and reforesting trees
area. Significant patches corresponding to areas
representative for each fuel class were carefully
identified over the ASTER images by using geo-
position data (latitude and longitude) collected during
the ground surveys by means of a GPS positioning
system. Pixels relating to these areas were exploited for
performing the selection of adequate region of interest
point (ground-truth dataset) for the seven classes (fuel
Fuel type and vegetation typologies
Areas at present or permanently presenting soils with
no vegetation cover because of plowing or erosion phenomena
Arboreal cultivations (mainly orchards, olive-groves and vineyards)
Emergine rocks, landslides and generally melted sediments
Natural water and artificial courses besides natural water stretches
and artificial basins
Grassy vegetation of primary and secondary origin
with a prevalence of Bromus sp.
Grassy vegetation developing when water availability is good.
Middle altitude prairies and peak prairies a prevalence of
Cynosurus cristatus
Small shrubs with predominant presence of Cistus sp.
Vegetation growing in areas no longer agriculturally used or
in any case at borders of lands used for a definite and
consolidate purpose
Mediterranean formations of secondary origin with predominant
presence of Prunus sp., Spartium junceum transition states toward
forestry vegetation referable to mixed oak woods
Vegetation types referable to evergreen Sclerophylls mainly
degradated, Mediterranean formations with prevalence of
medium-height shrubs and secondary formations scarcely
covering areas no longer used for pasture
Vegetation types referable to evergreen Sclerophylls Mediterranean
formations with prevalence of tall shrubs
Young trees or small height formations of beech woods and
mixed oak woods
Wood formations with a prevalent presence of Quercus ilex,
of which there are in the study area scarce pure stands at
altitude lower than 600 m
Forestry formations with predominant presence of Fagus
sylvatica of great relevance in the study area since these
trees cover most part of the belt between 1200 and 1800 m
Areas which have been reforested mainly with Pinus nigra
and Pinus halepensis
Forestry formations in which, according to the altitude, with
prevalence of Quercus pubescens in lower areas and Quercus
cerris and Quercus frainetto in higher areas up to 1000–1200
Chestnut tree formations (Castanea sativa)
Forestry formations in which Quercus sp. is associated with
numerous other forestry species belonging to Acer, Fraxinus,
Ostrya, Alnus, Sorbus, Malus, Crataegus, Pinus, Picea, Abies
R. Lasaponara, A. Lanorte / International Journal of Applied Earth Observation and Geoinformation 9 (2007) 225–234230
type) with the addition of one class concerning areas
having no fuel and fuel type 1 class concerning areas
having unclassified pixels. The sample points of
ground-truth dataset were selected in the same areas
subject to direct check on field in order to be used firstly
to identify the fuel types defined in the context of
Prometheus system, and secondly, to evaluate perfor-
mance and results obtained for the considered test area
from the ASTER data processing. For this reason, pixels
corresponding to the given ground-truth areas were
subdivided in to testing data and training data through
randomization of the pixels to 50% for every class.
3.3. Model construction and comparison
The mapping of fuel types was obtained by using a
supervised classification based on maximum likelihood
(ML) algorithm. The ML classifier is considered one of
the most important and well-known image classification
methods due to its robustness and simplicity. It is wide
used in vegetation and land cover mapping. Moreover, it
was also tested for fuel model distribution (Riano and
Chuvieco, 2002). The ML method quantitatively
evaluates the variance and covariance of the spectral
signatures when classifying an unknown pixel assuming
at the same time a Gaussian distribution of points
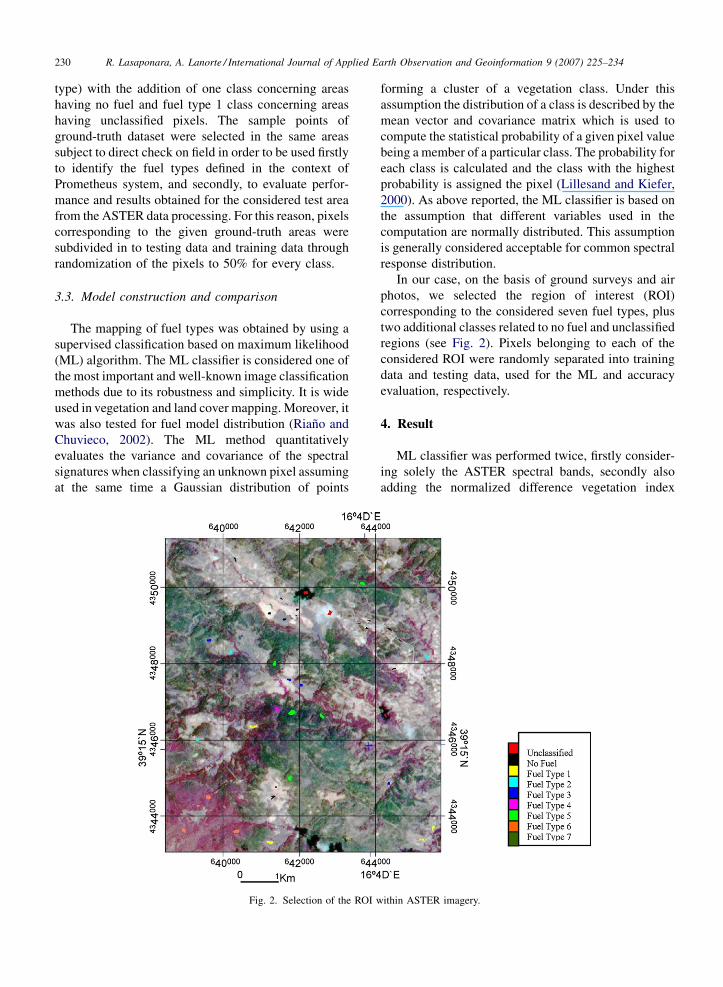
Fig. 2. Selection of the ROI w
forming a cluster of a vegetation class. Under this
assumption the distribution of a class is described by the
mean vector and covariance matrix which is used to
compute the statistical probability of a given pixel value
being a member of a particular class. The probability for
each class is calculated and the class with the highest
probability is assigned the pixel (Lillesand and Kiefer,
2000). As above reported, the ML classifier is based on
the assumption that different variables used in the
computation are normally distributed. This assumption
is generally considered acceptable for common spectral
response distribution.
In our case, on the basis of ground surveys and air
photos, we selected the region of interest (ROI)
corresponding to the considered seven fuel types, plus
two additional classes related to no fuel and unclassified
regions (see Fig. 2). Pixels belonging to each of the
considered ROI were randomly separated into training
data and testing data, used for the ML and accuracy
evaluation, respectively.
4. Result
ML classifier was performed twice, firstly consider-
ing solely the ASTER spectral bands, secondly also
adding the normalized difference vegetation index
ithin ASTER imagery.
R. Lasaponara, A. Lanorte / International Journal of Applied Earth Observation and Geoinformation 9 (2007) 225–234 231
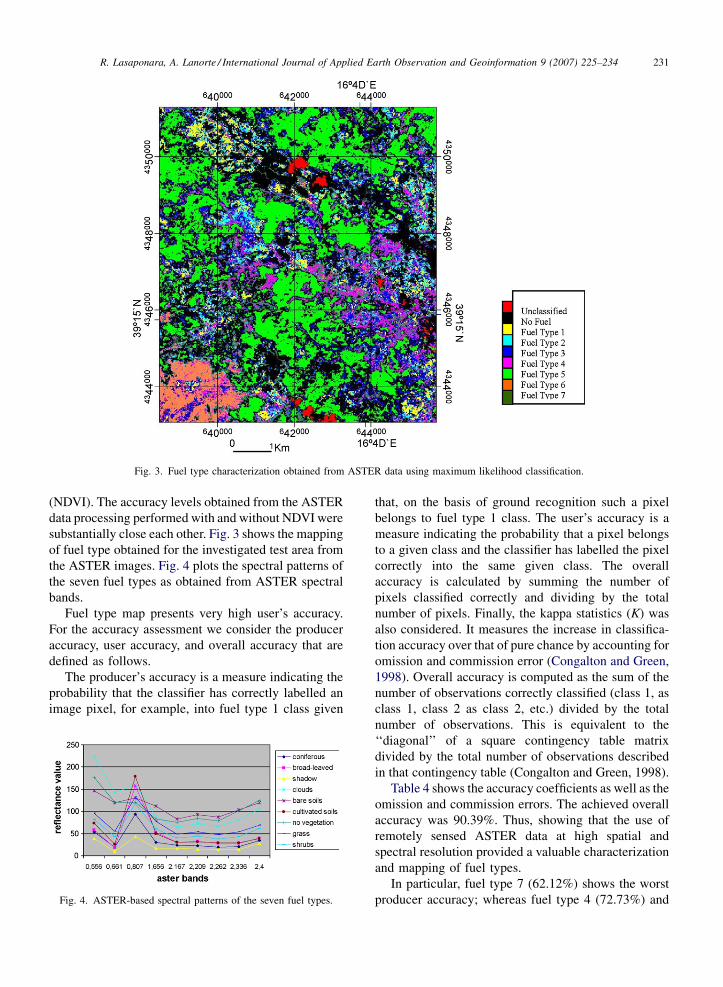
Fig. 3. Fuel type characterization obtained from ASTER data using maximum likelihood classification.
(NDVI). The accuracy levels obtained from the ASTER
data processing performed with and without NDVI were
substantially close each other. Fig. 3 shows the mapping
of fuel type obtained for the investigated test area from
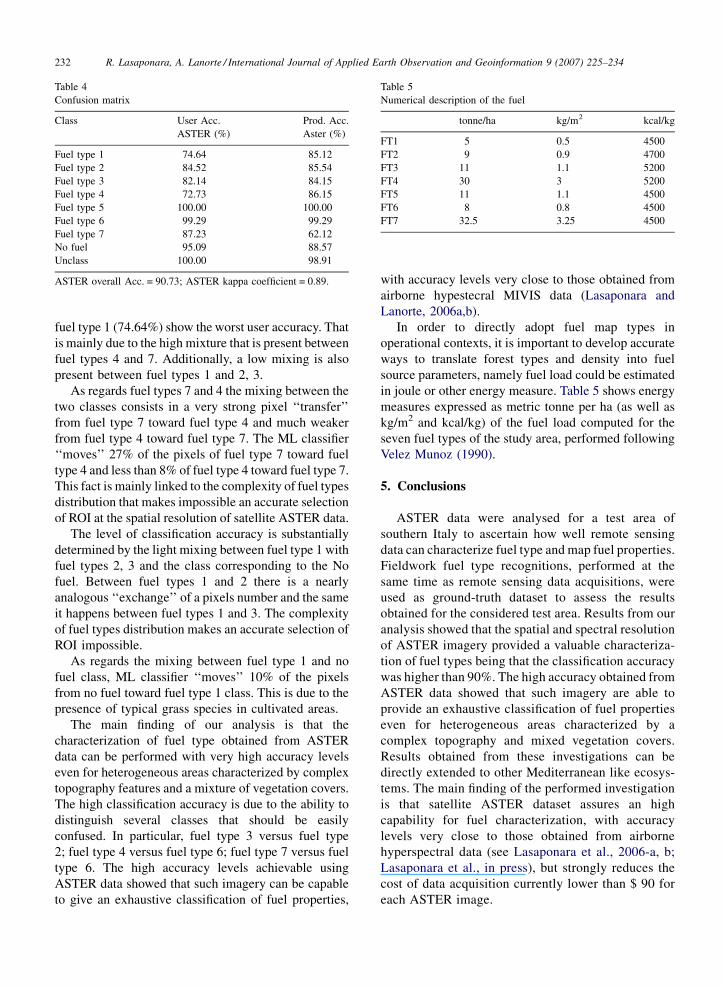
the ASTER images. Fig. 4 plots the spectral patterns of
the seven fuel types as obtained from ASTER spectral
bands.
Fuel type map presents very high user’s accuracy.
For the accuracy assessment we consider the producer
accuracy, user accuracy, and overall accuracy that are
defined as follows.
The producer’s accuracy is a measure indicating the
probability that the classifier has correctly labelled an
image pixel, for example, into fuel type 1 class given
Fig. 4. ASTER-based spectral patterns of the seven fuel types.
that, on the basis of ground recognition such a pixel
belongs to fuel type 1 class. The user’s accuracy is a
measure indicating the probability that a pixel belongs
to a given class and the classifier has labelled the pixel
correctly into the same given class. The overall
accuracy is calculated by summing the number of
pixels classified correctly and dividing by the total
number of pixels. Finally, the kappa statistics (K) was
also considered. It measures the increase in classifica-
tion accuracy over that of pure chance by accounting for
omission and commission error (Congalton and Green,
1998). Overall accuracy is computed as the sum of the
number of observations correctly classified (class 1, as
class 1, class 2 as class 2, etc.) divided by the total
number of observations. This is equivalent to the
‘‘diagonal’’ of a square contingency table matrix
divided by the total number of observations described
in that contingency table (Congalton and Green, 1998).
Table 4 shows the accuracy coefficients as well as the
omission and commission errors. The achieved overall
accuracy was 90.39%. Thus, showing that the use of
remotely sensed ASTER data at high spatial and
spectral resolution provided a valuable characterization
and mapping of fuel types.
In particular, fuel type 7 (62.12%) shows the worst
producer accuracy; whereas fuel type 4 (72.73%) and
R. Lasaponara, A. Lanorte / International Journal of Applied Earth Observation and Geoinformation 9 (2007) 225–234232
Table 4
Confusion matrix
Class User Acc.
ASTER (%)
Prod. Acc.
Aster (%)
Fuel type 1 74.64 85.12
Fuel type 2 84.52 85.54
Fuel type 3 82.14 84.15
Fuel type 4 72.73 86.15
Fuel type 5 100.00 100.00
Fuel type 6 99.29 99.29
Fuel type 7 87.23 62.12
No fuel 95.09 88.57
Unclass 100.00 98.91
ASTER overall Acc. = 90.73; ASTER kappa coefficient = 0.89.
Table 5
Numerical description of the fuel
tonne/ha kg/m2 kcal/kg
FT1 5 0.5 4500
FT2 9 0.9 4700
FT3 11 1.1 5200
FT4 30 3 5200
FT5 11 1.1 4500
FT6 8 0.8 4500
FT7 32.5 3.25 4500
fuel type 1 (74.64%) show the worst user accuracy. That
is mainly due to the high mixture that is present between
fuel types 4 and 7. Additionally, a low mixing is also
present between fuel types 1 and 2, 3.
As regards fuel types 7 and 4 the mixing between the
two classes consists in a very strong pixel ‘‘transfer’’
from fuel type 7 toward fuel type 4 and much weaker
from fuel type 4 toward fuel type 7. The ML classifier
‘‘moves’’ 27% of the pixels of fuel type 7 toward fuel
type 4 and less than 8% of fuel type 4 toward fuel type 7.
This fact is mainly linked to the complexity of fuel types
distribution that makes impossible an accurate selection
of ROI at the spatial resolution of satellite ASTER data.
The level of classification accuracy is substantially
determined by the light mixing between fuel type 1 with
fuel types 2, 3 and the class corresponding to the No
fuel. Between fuel types 1 and 2 there is a nearly
analogous ‘‘exchange’’ of a pixels number and the same
it happens between fuel types 1 and 3. The complexity
of fuel types distribution makes an accurate selection of
ROI impossible.
As regards the mixing between fuel type 1 and no
fuel class, ML classifier ‘‘moves’’ 10% of the pixels
from no fuel toward fuel type 1 class. This is due to the
presence of typical grass species in cultivated areas.
The main finding of our analysis is that the
characterization of fuel type obtained from ASTER
data can be performed with very high accuracy levels
even for heterogeneous areas characterized by complex
topography features and a mixture of vegetation covers.
The high classification accuracy is due to the ability to
distinguish several classes that should be easily
confused. In particular, fuel type 3 versus fuel type
2; fuel type 4 versus fuel type 6; fuel type 7 versus fuel
type 6. The high accuracy levels achievable using
ASTER data showed that such imagery can be capable
to give an exhaustive classification of fuel properties,
with accuracy levels very close to those obtained from
airborne hypestecral MIVIS data (Lasaponara and
Lanorte, 2006a,b).
In order to directly adopt fuel map types in
operational contexts, it is important to develop accurate
ways to translate forest types and density into fuel
source parameters, namely fuel load could be estimated
in joule or other energy measure. Table 5 shows energy
measures expressed as metric tonne per ha (as well as
kg/m2 and kcal/kg) of the fuel load computed for the
seven fuel types of the study area, performed following
Velez Munoz (1990).
5. Conclusions
ASTER data were analysed for a test area of
southern Italy to ascertain how well remote sensing
data can characterize fuel type and map fuel properties.
Fieldwork fuel type recognitions, performed at the
same time as remote sensing data acquisitions, were
used as ground-truth dataset to assess the results
obtained for the considered test area. Results from our
analysis showed that the spatial and spectral resolution
of ASTER imagery provided a valuable characteriza-
tion of fuel types being that the classification accuracy
was higher than 90%. The high accuracy obtained from
ASTER data showed that such imagery are able to
provide an exhaustive classification of fuel properties
even for heterogeneous areas characterized by a
complex topography and mixed vegetation covers.
Results obtained from these investigations can be
directly extended to other Mediterranean like ecosys-
tems. The main finding of the performed investigation
is that satellite ASTER dataset assures an high
capability for fuel characterization, with accuracy
levels very close to those obtained from airborne
hyperspectral data (see Lasaponara et al., 2006-a, b;
Lasaponara et al., in press), but strongly reduces the
cost of data acquisition currently lower than $ 90 for
each ASTER image.
R. Lasaponara, A. Lanorte / International Journal of Applied Earth Observation and Geoinformation 9 (2007) 225–234 233
References
Albini, F.A., 1976. Estimating wildfire behaviour and effects. General
Technical Report. USDA Forest Service, Intermountain Forest and
Range Experiment Station INT-30. Ogden, UT, pp. 1–92.
Andersen, H.E., McGaughey, R.J., Robert, J., Reutebuch, S.E., 2005.
Estimating forest canopy fuel parameters using Lidar data.
Remote Sens. Environ. 4, 441–449.
Anderson, H.E., 1982. Aids to determining fuels models for estimat-
ing fire behaviour. USDA Forest Service, Intermountain Forest
and Range Experiment Station General Technical Report INT-122.
Ogden, UT, 22 pp.
Boardman, J.W., 1998. Leveraging the high dimensionality of AVIRIS
data for improved sub-pixel target unmixing and rejection of false
positives: mixture tuned matched filtering. Summaries of the
Seventh JPL Airborne Geoscience Workshop, JPL Publication
97-1. NASA Jet Propulsion Lab., Pasadena, CA, pp. 55–56.
Boardman, J.W., Kruse, F.A., Green, R.O., 1995. Mapping target
signatures via partial unmixing of AVIRIS data. Summaries of the
Fifth JPL Airborne Geoscience Workshop, JPL Publication 95-1.
NASA Jet Propulsion Lab., Pasadena, CA, pp. 23–26.
Burgan, R., Rothermal, R.C., 1984. BEHAVE: fire behaviour predic-
tion and fuel modelling system-FUEL subsystem. USDA Forest
Service General Technical Report INT-167, 126 pp.
Castro, R., Chuvieco, E., 1998. Modelling forest fire danger from
geographic information system. Geocarto Int. 13, 15–23.
Chuvieco, E., Congalton, R.G., 1989. Application of remote sensing
and geographic information systems to forest fire hazard mapping.
Remote Sens. Environ. 29, 147–159.
Chuvieco, E., 1999. Remote Sensing of Large Wildfires in European
Mediterranean Basin. Springer-Verlag, Berlin, p. 122.
Cohen, W.B., 1989. Potential utility of the TM tasseled cap multi-
spectral data transformation for crown fire hazard assessment. In:
ASPRS/ACSM Annual Convention Proceedings: Agenda for the
90s, vol. 3, Baltimore, MA, pp. 118–127.
Congalton, R.G., Green, K., 1998. Assessing the accuracy of remotely
sensed data. CRC Press, Lewis Publishers, Boca Raton, Florida,
USA.
Cuomo, V., Lasaponara, R., Tramutoli, V., 2001. Evaluation of a new
satellite-based method for forest fire detection. Int. J. Remote
Sens. 22 (9), 1799–1826.
FAO, 2001. Global forest fire assessment 1990–2000. Forest
Resources Assessment Programme, Working Paper No. 55,
http://www.fao.org/forestry/fo/fra/docs/Wp55_eng.pdf.
Jia, G.J., Ingrid, I.C., Goetz, A.F.H., Kaufmann, M.R., Kindel, B.C.,
2006. Assessing spatial patterns of forest fuel using AVIRIS data.
Remote Sens. Environ. 3/4, 318–327.
Keane, R.E., Mincemoyer, S.A., Schmidt, K.A., Long, D.G., Garner,
J.L., 2000. Mapping vegetation and fuel for fire management on
the Gila National Forest Complex. USDA Forest Service General
Technical Report RMRS-GTR-46-CD, New Mexico.
Keane, R.E., Burgan, R., Van Wagtendonk, J., 2001. Mapping wild-
land fuels for fire management across multiple scales: integrating
remote sensing, GIS, and biophysical modelling. Int. J. Wildl. Fire
10 (3/4), 301–319.
Lasaponara, R., in press. Inter-comparison of AVHRR-based fire
danger estimation methods. International J. Remote Sens. 26
(5), 853–870.
Lasaponara, R., 2006. Estimating Spectral separability of satellite
derived parameters for burned areas mapping in the Calabria
Region by using SPOT-vegetation data. Ecol. Model. 196, 265–
270.
Lasaponara, R., Lanorte, A. 2006a Multiscale fuel type characteriza-
tion by using multisensor remote sensing data for the Mediterra-
nean ecosystems of Southern Italy. IEMSS conference July, 9–13,
Burlington, Vermont USA, in press.
Lasaponara R., Lanorte, A. 2006b Remote characterization of fuel
type using satellite data, SPIE conference, Stoccolma-12–14
September, in press.
Lasaponara R, A Lanorte 2006b Multispectral fuel type characteriza-
tion based on remote sensing data and Prometheous model ICFFR
Conference, Coimbra, November 2006.
Lasaponara, R., Lanorte, A., Pignatti, S., 2006-a. Characterization and
mapping of fuel types for the Mediterranean ecosystems of Pollino
National Park in the Southern Italy by using Hyperspectral MIVIS
data. Earth Interactions 10, 1–11.
Lasaponara, R., Lanorte, A., Pignatti, S., 2006-b. Multiscale fuel type
mapping in fragmented ecosystems: preliminary results from
Hyperspectral MIVIS and Multispectral Landsat TM data. Int.
J. Remote Sens. 27 (3), 587–593.
Lasaponara R., Lanorte, A., Pignatti, S., in press. Hyperspectral
analysis of fuel types for Mediterranean ecosystems, Bull. Am.
Meteorol. Soc.
Lasaponara, R., Cuomo, V., Macchiato, M.F., Simoniello, T., 2003. A
self-adaptive algorithm based on AVHRR multitemporal data
analysis for small active fire detection. Int. J. Remote Sens. 24
(8), 1723–1749.
Lillesand, T.M., Kiefer, R.W., 2000. Remote Sensing and Image
Interpretation. Wiley, New York.
Mckinley, R.A., Chine, E.P., Werth, L.F., 1985. Operational Fire
Fuels Mapping with NOAA-AVHRR data. American Society for
Photogrammetry and Remote Sensing, Falls Church, VA, pp.
295–304.
Merrill, D.F., Alexander, M.E., 1987. Glossary of Forest Fire Manage-
ment Terms. National Research Council of Canada, Committee for
Forest Fire Management, Ottawa.
Morris, W.G., 1970. Photo inventory of fine logging slash. Photo-
grammet. Eng. 36, 1252–1256.
Muraro, S.J., 1970. Slash Fuel Inventories from 70 mm Low-level
Photography. Canadian Forest Service, Ottawa, Ontario, p. 63.
Oswald, B.P., Fancher, J.T., Kulhavy, D.L., Reeves, H.C., 1999.
Classifying fuels with aerial photography in East Texas. Int. J.
Wildl. Fire 9 (2), 301–319.
Prometheus, S.V., Project, 1999. Management techniques for optimi-
sation of suppression and minimization of wildfire effects. System
Validation. European Commission, contract number ENV4-CT98-
0716.
Riano, D., Chuvieco, E., 2002. Generation of fuel type maps from
Landsat-TM images and auxiliary data in Mediterranean ecosys-
tem. Department of Geography, Alcala de Henares University,
Alcala de Henares, Spain.
Riano, D., Chuvieco, E., Salas, J., Palacios-Orueta, A., Bastarrika, A.,
2002. Generation of fuel type maps from Landsat TM images and
ancillary data in Mediterranean ecosystems. Canadian Journal of
Forest Resources 32, 1301–1315.
Salas, J., Chuvieco, E., 1994. Geographic information system for
wildland fire risk mapping. Wildfire 3 (2), 7–13.
Telesca, L., Lasaponara, R., 2005. Discriminating dynamical patterns
in burned and unburned vegetational covers by using SPOT-VGT
NDVI data. Geophys. Res. Lett. 32, L21401 2005, doi:10.1029/
2005GL024391.
Telesca, L., Lasaponara, R., 2006-a. Pre-and post-fire behavioural
trends revealed in satellite NDVI time series. Geophys. Res. Lett.,
33, L14401 2006, doi:10.1029/2006GL026630

R. Lasaponara, A. Lanorte / International Journal of Applied Earth Observation and Geoinformation 9 (2007) 225–234234
Telesca, L., Lasaponara, R., 2006-b. Vegetational patterns in burned
and unburned areas investigated by using the detrended fluctuation
analysis. Physic. A. 368, 531–535.
Telesca, L., Lasaponara, R., 2006-c. Fire-induced variability in satel-
lite SPOT-VGT NDVI vegetational data. Int. J. Remote Sens. 27,
3087–3095.
Telesca, L., Lasaponara, R., Lanorte, A., 2006-d. Discrimination of
vegetational patterns in burned and unburned areas. Int. J. Non-
linear Sci. Numer. Simul. 7 (3), 279–284.
Van Wagtendonk, J.W., Root, R.R., 2003. The USE of multitemporal
Landsat normalized difference vegetation index (NDVI) data for
mapping fuels models in Yosemite National Par k, USA. Int. J.
Remote Sens. 24, 1639–1651.
Velez Munoz, R., 1990. Algunas observaciones para una selvicoltura
preventive de incendios forestales. Ecologia, Fuera de Serie 1,
561–571.
Vila, M., Lloret, F., Ogheri, E., Terradas, J., 2001. Positive fire–grass
feedback in Mediterranean basin shrubland. For. Ecol. Manage.
147, 3–14.
Zhu, G., Blumberg, D.G., 2001. Classification using ASTER data and
SVM algorithms; the case study of Beer Sheva, Israel. Remote
Sens. Environ. 80, 233–240.
Copyright © 2022 FDOKUMEN