Water exploration using Magnetotelluric and gravity data analysis; Wadi Nisah, Riyadh, Saudi Arabia

Egypt. J. Remote Sensing & Space Sci., V.12, pp. 101-126 (2009)
101
MAPPING GEOLOGICAL STRUCTURES IN WADI GHOWEIBA AREA, NORTHWEST GULF OF SUEZ, EGYPT, USING ASTER-SPOT DATA FUSION AND ASTER DEM
M. M. Abdeen1; Y. A. H. A. EL-Kazzaz2; G. M. Attia2; M. A. Yehia3 and S. M. Hassan1
1- National Authority for Remote Sensing and Space Sciences (NARSS), Cairo, Egypt
2- Geology Dept., Faculty of Science, Helwan Univ., Helwan, Egypt3- Geology Dept., Faculty of Science, Ain Shams Univ., Cairo, Egypt
ABSTRACT
Practical and economical constraints prompt the need of obtaining lithological and structural information for development of desert areas with reduced field effort. The fusion of multi-sensor satellite data is an effective mean of exploiting the complimentary nature of different data types. This technique allows fusion of spectral-spectral information of multi-source data with high accuracy.In the present study, fusion of SPOT and ASTER data was applied to test the potentiality of this technique in mapping geological formations and structural lineaments in Wadi Ghoweiba area, to the west of the northwestern tip of the Gulf of Suez, Egypt. ASTER data is characterized by a wide range of spectral bands (14 bands), while SPOT panchromatic data is characterized by high (10 meters) spatial resolution.Based on spectral characteristic analysis (SCA) of the 3 VNIR and the 6 SWIR bands of ASTER data, two false-color band-ratio images (1/3, 2/5, and 4/9) and (1/5, 8/9, and 4/6) in R, G, B were produced for better lithological discrimination. SPOT panchromatic image data was fused with ASTER band-ratio images data using principal component (PC) and color normalization or Brovey transformation techniques. The fused images proved to be excellent for lithological discrimination.ASTER data includes bands 3N (Nadir) and 3B (Backward) that are acquired in the spectral range of near infrared region (from 0.78 to 0.86 microns) allowing extraction of digital elevation model (DEM). Three-dimensional perspective views were generated by draping SPOT-ASTER ratio fused images over ASTER DEM. This technique was used to enhance morphologically-defined structures.The fused images and the 3D perspective views were interpreted to produce a photogeological-structural map that was verified using the available geological maps and subsequent field check. The produced photogeological map indicates that fusion of SPOT and ASTER ratio image’s data is a reliable technique for geological mapping especially in remote and inaccessible areas.
Keywords: lithology, structure, ASTER, SPOT, principal component, band-ratio data fusion.

M. M. Abdeen et al.
102
INTRODUCTION
The study area of Wadi Ghoweiba lies in the easternmost part of the northern Eastern Desert of Egypt, bordering the northwestern tip of the Gulf of Suez (Fig. 1). It occupies the area between the northern scarp of El-Galala El-Bahariya to the south and Gebel Abu-Treifa to the north. It is bounded by longitudes 31º 44’ and 32º 24’ E and latitudes 29º 31’ and 30º 00’ N covering an area of about 2897 km². The area is drained by Wadi Ghoweiba and its tributaries, which debouch their water into the Gulf of Suez. Stratigraphically, the area is covered by several lithological units ranging in age from Jurassic to Quaternary, and structurally it falls in two overlapping structural provinces; namely the Syrian arc fold and fault system and the Gulf of Suez rift. Therefore, the area is lithologically and structurally complex.The main objective of this work is to examine the potential of data fusion of the spectral-spectral information of multi-source remote sensing data in mapping geological formations and structures in the area lies to the west of the northwestern tip of the Gulf of Suez. In the present study, optical remote sensing data including ASTER and SPOT-4 were used.
Figure 1: Location map of the study area.

Mapping Geological Structures in Wadi Ghoweiba,...
103
GEOLOGY OF THE STUDIED AREA
LithostratigraphyThe study area was included in some previous mapping projects (e.g. Sadek, 1926; Said, 1962; EGSMA, 1981; Klitzsch and Linke, 1983; Klitzsch et al., 1987; and Abd-Allah, 1993). In the study area, 19 rock units were identified by these mapping projects (Table 1). They range in age from Jurassic to Quaternary. The lithostratigraphic classification of the exposed rocks is adapted following these mapping projects and the references therein. The Jurassic rocks are represented by a clastic section. The Cretaceous rocks are distinguished into three rock units, which are (from base to top) the Malha Formation, the Galala Formation and the chalky limestone and dolomites unit. The Paleocene rocks are represented by the Esna Shale. The Eocene succession is subdivided into eight formations; Farafra, Thebes, Muweilih, Mokattam, Observatory, Qurn, Wadi Garawi and Wadi Hof Formations. The Oligocene rocks are divided into two rock units; the Oligocene sands and gravels (Gebel Ahmar Formation) at the base and the basaltic sheet at the top. The Miocene rocks are distinguished into the marine Miocene unit at the base and the non-marine Miocene unit at the top. The Pliocene is represented by unlithified sands and gravels. The Pleistocene is represented by alluvial deposits. The exposed rocks in the study area are more than 1100 meters thick (according to Abd-Allah, 1993). Most of the rock exposures are of Eocene, Oligocene and Miocene ages, whereas outcrops of Jurassic, Cretaceous and Paleocene are not widespread. In Table (1), a brief description of each of these rock units is dealt with. Only 11 widely exposed rock units were considered for lithological discrimination using remote sensing image processing techniques.
Structural Setting
Comprehensive structural study of the area by Abd-Allah (1993) and the present photogeological investigation indicate that the area is dominated by three sets of macroscopic faults. These, arranged according to the degree of predominance and magnitude of throws, are the E-W, NW and NNW sets. The E-W oriented faults are characterized by their short to intermediate lengths that range from 2 km to less than 10 km. They have fault planes dipping between 70º and 80º and fault throws between 100 and 300 m. The NW oriented faults are characterized by their long lengths that exceed 20 km. They have fault planes dipping at angles between 70º and 80º and throws between 25 and 150 m. The NNW faults are relatively short where their lengths are less than 2 km. They have fault planes dipping at angles between 70º and 80º and throws less than 25 m. The faults of the E-W set and some of the NW set form six E-W elongated, left-stepped en-echelon, normal fault belts while some of the NW and NNW oriented faults form a NNW elongated, right-stepped en-echelon, normal fault belt (Abd-Allah, 1993). Normal fault ramps exist between the overlapping ends of the en-echelon faults. Several NW and NNW oriented grabens exist in the areas between these en-echelon fault belts. All these grabens terminate against the fault belts. Several folds are associated with the E-W and NW oriented faults.

M. M. Abdeen et al.
104
Table 1: Lithostratigraphic units used in the present study, modified after Abd-Allah (1993).
Age Rock units Lithology Thickness in meters
Qua
tern
ary
Pleistocene Sands and gravels Sands and gravels of alluvial origin Varies from place to another
Tert
iary
Pliocene Sands, gravels, clays and limestone Sands, gravels, clays and limestones
Miocene
Non-marine sediments
Sandstones, gravels, chalky limestones and clays 40
Marine sediments Bioturbated marls, shales, sandstones and marly limestones 60-270
Oligo-Miocene Basalt Basalt and dolerite40-100
Oligocene Gebel Ahmar Formation
Varicolored, unstratified sands, gravels, and sedimentary quartzites
Eoc
ene
Lat
e Wadi Hof Formation
Marly and sandy limestones, marls, shales, sandy and dolomitic limestones, and sandstones
52
Mid
dle
Wadi Garawi Formation
Thick light green marl bed (in the western part) changes eastward to an orange marl bed. Its upper part is composed of bioturbated yellow to orange marls and marly limestones
7 - 18
Qurn Formation
The Iower part is made up of highly fossiliferous, soft, yellow marly limestones and marls. The upper part is built up of chalky limestones
40
Observatory Formation
Biogenic and bioclastic, frequently cross-bedded, white and chalky limestones with some dolomitic ledges
203
Mokattam Formation Biostromal limestones 137
Muwellih Formation Interbedded marl and limestone 34
Ear
ly Thebes Formation Massive and nummulitic limestones with chert bands and nodules 195
Farafra Formation Hard alveolinid limestones -
Paleocene Esna Shale Gray shales with chalky 1imestone band in the middle part 50
Cre
tace
ous Late
Chalky limestones and dolomites Chalky 1imestones and dolomites 150
Galala Formation Green shales and marls with do1omitic ledges 100
Early Malha Formation Varicolored sandstone beds with thin clay and marl bands 70
Jurassic Clastic sediments Cross-bedded sandstones with thin bands of marls and clays 179

Mapping Geological Structures in Wadi Ghoweiba,...
105
The E-W elongated, left-stepped en-echelon normal fault belts in the study area are interpreted by Abd-Allah (1993) to overlie E-W oriented, deep-seated faults that were rejuvenated by right-lateral divergent wrenching related to the regional stress that opened the Suez rift, while the NNW elongated, right-stepped en- echelon fault belt was formed as a result of a left-lateral strike-slip movement on a deep-seated fault that is considered as a conjugate Riedel fracture to the major E-W oriented right-lateral wrenching.The NW and E-W oriented faults form a zigzag fault pattern. The E-W elongated, en-echelon fault belts act as transfer zones, which transfer the throw from the NW oriented faults to another.According to Abd-Allah (1993) the structural deformation of the study area took place in four tectonic events. These are; from old to young; Early Oligocene event, Late Oligocene-Early Miocene event, Late Miocene event, and post -Miocene event. The first two events were of more drastic deformations than the other two and were responsible for the formation of the main structural and topographic features of the study area.
Morpho-Structural Features
The topographic features expressed in the study area are highly manifested and controlled by both the lithologies and structures. The topographic highs are also structural highs, mostly made up of hard Eocene limestone beds. The topographic lows are also structural lows and are occupied by soft rocks ranging in age from Late Eocene to Recent. The drainage lines in the study area have taken most of their present shape in post-Miocene time (Abd-Allah, 1993) and follow, in most cases, major faults.According to Sadek (1926) and Abd-Allah (1993), the study area includes six major geomorphic units (Fig. 2) namely, Gulf of Suez coastal plain, Wadi Ghoweiba structural plain, El-Galala El-Bahariya, Akheider, Gebel Ataqa and Kehaliya-Um Zeita structural plateaux.
Gulf of Suez coastal plain
The Gulf of Suez coastal plain is a narrow strip bordering the gulf coast from west and covered by sands, gravels, salt marshes, playas and sabkhas of Quaternary age. This plain is crossed by several wadis that allow the formation of local embayments of the gulf. The surface of this plain is characterized by several raised beaches, sabkhas, and the natural Ain Sukhna spring associated with travertine deposits and salt-tolerant vegetation (Fig. 2).
Wadi Ghoweiba plain
The Wadi Ghoweiba plain (Fig. 2) occupies the central part of the study area. It is covered with rocks ranging in age from Late Eocene to Recent. It has an eastward sloping surface. This plain has two subunits which are;

M. M. Abdeen et al.
106
1. The hummocky subunit, occupied by low hills rising about 10-30 m above the floor of the Wadi Ghoweiba structural plain and comprises mesas, cuestas, isolated hills and tablelands.
2. The alluvial subunit that exists at the foot-slope of the northern scarp of the El-Galala El-Bahariya plateau. The alluvial terraces and fans are developed in the Pliocene and Quaternary times.
El-Galala El-Bahariya plateau
The El-Galala El-Bahariya structural plateau (Fig. 2) represents the southern part of the study area. This plateau is capped by hard Eocene limestone beds that are characterized by karstified and sink holes features. The northern part of the plateau is controlled by E-W oriented major faults, while the Eastern scarp is controlled by a NW-SE oriented major fault. The northern scarp of this plateau decreases in elevation westwards and branches into two other smaller scarps of NW and E-W orientation.
Akheider plateau
The Akheider plateau (Fig. 2) represents the middle part of the study area, having a rhomboidal shape. It is consisted of three blocks namely, Wadi El Abraq block, Wadi Akheider block and El Ramliya block (Abd-Allah 1993). All these blocks are capped by hard Middle Eocene limestone beds and Oligocene sedimentary quartzite layers. Wadi Akheider and El Ramliya blocks are separated by Wadi Eseimer topographic low that occupies a NNW oriented graben. The surface of the blocks is characterized by several highs and tablelands separated by E-W oriented faults.
Gebel Ataqa plateau
The Gebel Ataqa plateau (Fig. 2) lies to the north of the present study area whereas its south-western scarp, is the northern limit of the present study area which is composed of horizontal strata of Cretaceous limestones and marls and Eocene limestones. The southwestern edge of the Gebel Ataqa scarp, is not a well-defind fracture line as on the east and north, but it is a fault-zone having the nature of complicated step-faults running in a NW direction (Sadek, 1926).
Kehaliya-Um Zeita plateau
The Kehaliya-Um Zeita plateau (Fig. 2) resembles the Ataqa massif in having its northeastern edge bounded by a definite fracture line, which gives rise to a sharp vertical cliff, while the southern edge manifests the “saw-edge”, produced from the interference of the NNW with E-W faults. The eastern fault bordering the plateau on the Hagul side starts at the Um Zeita snout as a NW line which is deflected westwards bordering the escarpment of Gebel Kehaliya. On the up-thrown-side the rocks are limestone of Middle Eocene age, while the down-thrown-side is made up of upper Eocene, Oligocene and Miocene rocks (Sadek 1926 and Abd-Allah, 1993).

Mapping Geological Structures in Wadi Ghoweiba,...
107
REMOTE SENSING DATA
ASTER Data
Advanced Space-borne Thermal Emission and Reflection Radiometer (ASTER) on board the Earth Observing System (EOS) TERRA platform is a multispectral imaging system. Each ASTER scene covers 60X60 km area. ASTER data covers a wide spectral range with 14 bands from visible and near infrared (VNIR) to the shortwave (SWIR) and thermal infrared (TIR) bands (Table 2). The VNIR wavelength region provides information about iron oxides (hematite, goethite, jarosite) and REEs (Hunt, 1977). The SWIR wavelength region assesses clay-bearing minerals (clays, phyllosilicates, etc.) (Hunt, 1979) and the TIR wavelength region permits to distinguish silicates and carbonates (Salisbury et al., 1987). ASTER data can be used to produce a Digital Elevation Model (DEM) with a spatial resolution of 15 m generated from a pair of Level 1B ASTER bands 3N (Nadir) and 3B (Backward) from the near infra-red telescope’s along-track stereo-data that is acquired in the spectral range of 0.78 to 0.86 microns.Several geological studies have realized the potential of ASTER multispectral data in lithological discrimination e.g. (Rowan and Mars, 2001 and 2003; Abdeen et al., 2002; Cudahy and Hewson 2002; Hewson et al., 2002; Qui et al., 2006; Gad and Kusky, 2007 and Hassan et al., 2008).
Figure 2: 3D perspective view showing the morpho-structural features of the study area.

M. M. Abdeen et al.
108
In the present study, two cloud-free level 1B ASTER scenes acquired on 30 May 2001 and corrected from instrumental and geometric errors were used. The characteristics of these scenes as well as SPOT - 4 scenes are summarized in Table (2).
Table 2: Characteristics of ASTER and SPOT-4 data used in the present study.
CharacteristicsOptical Imaging Systems
ASTER SPOT-4Launch date December 1999 March 1998Acquisition date May 2001 July and August 2006Nationality USA/Japan FranceSwath width 60 km 60 kmAltitude 750 km 810 km
Spectral resolution(number of bands and
band width)
VNIR
1 = 0.52-0.60 µm2 =0.63-0.69 µm3 N =0.76-0.86 µm3 B =0.76-0.86 µm
Green Band 1: 0.5-0.59 µmRed Band 2: 0.61-0.68 µmNIR Band 3: 0.78-0.89 µmPanchromatic Band: 0.61-0.68 µm
SWIR
4 = 1.600-1.700 µm5 = 2.145-2.185 µm6 = 2.185-2.225 µm7 = 2.235-2.285 µm8 = 2.295-2.365 µm9 = 2.360-2.430 µm SWIR B4: 1.58-1.75 µm
TIR
10 = 8.125-8.475 µm11 = 8.475-8.825 µm12 = 8.925-9.275 µm13 = 10.25-10.95 µm14 = 10.95-11.60 µm
Spatial resolutionVNIR bands: 15 m VNIR and SWIR bands: 20 mSWIR bands: 30 m
Panchromatic band: 10 mTIR bands: 90 m
SPOT Data
SPOT-4 is a French earth observation satellite that was launched in March 1998 at an altitude of 810 km. SPOT scenes are typically 60 by 60 km (vertical viewing) or 60 km by up to 80 km for oblique viewing. SPOT-4 is characterized by multispectral data represented by 4 bands covering green, red, near infrared and shortwave infrared portions of spectrum with 20 m spatial resolution, in addition to a single panchromatic band acquired in the wavelength region from 0.61 to 0.68 µm with 10 meter spatial resolution (Table 2). The optical imaging instruments (HRVs) on board SPOT-4 satellite are steerable to either side of the ground track by up to 30 degrees. Stereo-images can therefore be acquired, which are ideal for topographic mapping. The study area is covered by three SPOT scenes acquired on July and August 2006 and designated by path and row numbers as follows: K114/J290, K114/J291 and K113/J290. Only the panchromatic bands (0.61-0.68 µm) of the three SPOT scenes were used in the present study.

Mapping Geological Structures in Wadi Ghoweiba,...
109
DIGITAL IMAGE PROCESSING
Both ASTER and SPOT data were subjected to a pre-processing step (ERSDAC, 2000). They were georeferenced to UTM Zone 36 North projection with WGS-84 datum and were radiometrically enhanced to insure radiometric balance between individual scenes before being mosaiced and clipped to the study area. The two ASTER scenes were resampled so that all the 3 VNIR and the 6 SWIR bands have 15 x 15 m pixel size. The digital image processing techniques used in the present work were achieved using ERDAS Imagine 8.7 software and are illustrated in figure (3). They include eight steps as follows:1. achievement of geometric correction and radiometric balancing then
mosaicing of ASTER and SPOT scenes,2. investigating spectral reflectance characteristics of the 3 VNIR and 6 SWIR
ASTER bands to select the appropriate bands for the ratio-images,3. applying the band-ratio techniques to improve discrimination of the exposed
rock units in the study area,4. applying histogram stretch enhancement for the SPOT image, in order to
produce an interpretable image with better contrast,5. histogram matching of SPOT panchromatic and ASTER band-ratio images,
which is a preparatory step for the data fusion step,6. fusion of ASTER-ratio image with SPOT panchromatic data in order to
enhance the spatial resolution of the multispectral output image to 10 m spatial resolution useful for lithological discrimination,
7. extraction of digital elevation model (DEM) from ASTER data, then draping the SPOT-ASTER fused image over the DEM to generate three-dimensional perspective views to enhance the morphologically-defined structuresُ and
8. interpretation of SPOT-ASTER fused image and the perspective views to produce a photogeological-structural map.
Processing of ASTER Data
Two digital image processing techniques have been applied to the ASTER data covering the study area. The first is spectral characteristic analysis (SCA) for the 11 widely exposed rock units. The spectral curve for each rock unit was extracted from the 3 VNIR and the 6 SWIR ASTER bands. The second image processing technique applies band-ratio method by dividing the digital number (DN) values of one band by the corresponding DN values of another band and displaying the new DN values as a grayscale image (Sabins, 1987). The band-ratio technique emphasizes the differences between spectral features while at the same time neglects common features. Band-ratio technique helps also in removing shadows and illumination contrasts caused by feature slope (Sabins, 1987). The selection of bands to be used in band-ratio technique depends on the spectral characteristic analysis of the exposed rock units (Table 3 and Fig. 4).

M. M. Abdeen et al.
110
Figure 3: Flowchart showing the remote sensing image processing techniques followed in the present work.

Mapping Geological Structures in Wadi Ghoweiba,...
111
1. Spectral Characteristic Analysis (SCA) of ASTER data
The spectral profile viewer of the image processing software (ERDAS Imagine 8.7) allows user to visualize the reflectance spectrum of a single pixel through-out many bands (ERDAS, 1999). This technique is particularly useful for multispectral data that have several layers. It allows estimating the mineralogical composition of the material in the pixel. In the present study area, 11 widely exposed rock units are considered for spectral analysis. For each rock unit, spectral reflectance values were extracted for different locations (different pixels) and the average was then defined (Hassan et al., 2008). The average spectral reflectance values (Table 3) and corresponding curves of each of the 11 widely exposed rock units (Fig. 4) were subsequently compared. It has been found that:1. All the 11 widely-exposed rocks have mostly equal high spectral reflectance
values at the visible wavelength region corresponding to ASTER bands 1 and 2, which make no discrimination of the exposed rock units at this region. However, all these rocks have low but significantly varying spectral reflectance (DN) values at the SWIR wavelength region (1.6 to 2.4 µm) corresponding to ASTER bands 4, 6, 7, 8 and 9 (Table 3 and Fig. 4). A good discrimination of these rock units can be achieved through the application of the ASTER band-ratios 1/3, 2/5, and 4/9 (Fig. 5).
2. The Oligocene basalt has a different DN values from the surrounding rock units, so it can be easily discriminated using raw ASTER data. Oligocene sands and gravels can be discriminated using Principal Components (PC) analysis technique (Hassan et al., 2008).
3. The marine Miocene sediments, non-marine Miocene sediments, Wadi Garawi Formation, Wadi Hof Formation, Malha Formation and Pliocene sands and gravels have almost the same DN values at ASTER bands 4 and 6, while Mokattam, Qurn, and Observatory Formations have different DN values at the same ASTER bands (Table 3 and Fig. 4). Applying band-ratio 4/6 on ASTER data, allows discrimination of Mokattam, Qurn, and Observatory Formations (Fig. 5).
4. Marine and non-marine Miocene sediments have lower reflectance at ASTER band 9 than at band 8, while Wadi Garawi Formation and the Pliocene sands and gravels have higher reflectance at ASTER band 9 than at band 8, therefore discrimination between these formations can be achieved through ASTER band-ratio 8/9 (Fig. 5).
5. Wadi Garawi and Wadi Hof Formations have the same DN values at ASTER band 5, while they have different DN values at band 1, so discrimination between these formations can be achieved using ASTER band ratio 1/5 (Fig. 5).

M. M. Abdeen et al.
112
6. From points 3, 4 and 5, a false-color ASTER-ratio image (1/5, 8/9, 4/6 in RGB) will be useful for discrimination of Mokattam, Qurn, Observatory, Wadi Garawi, Wadi Hof Formations and the Pliocene sands and gravels (Fig. 5).
2. Band-ratio enhancement of ASTER data
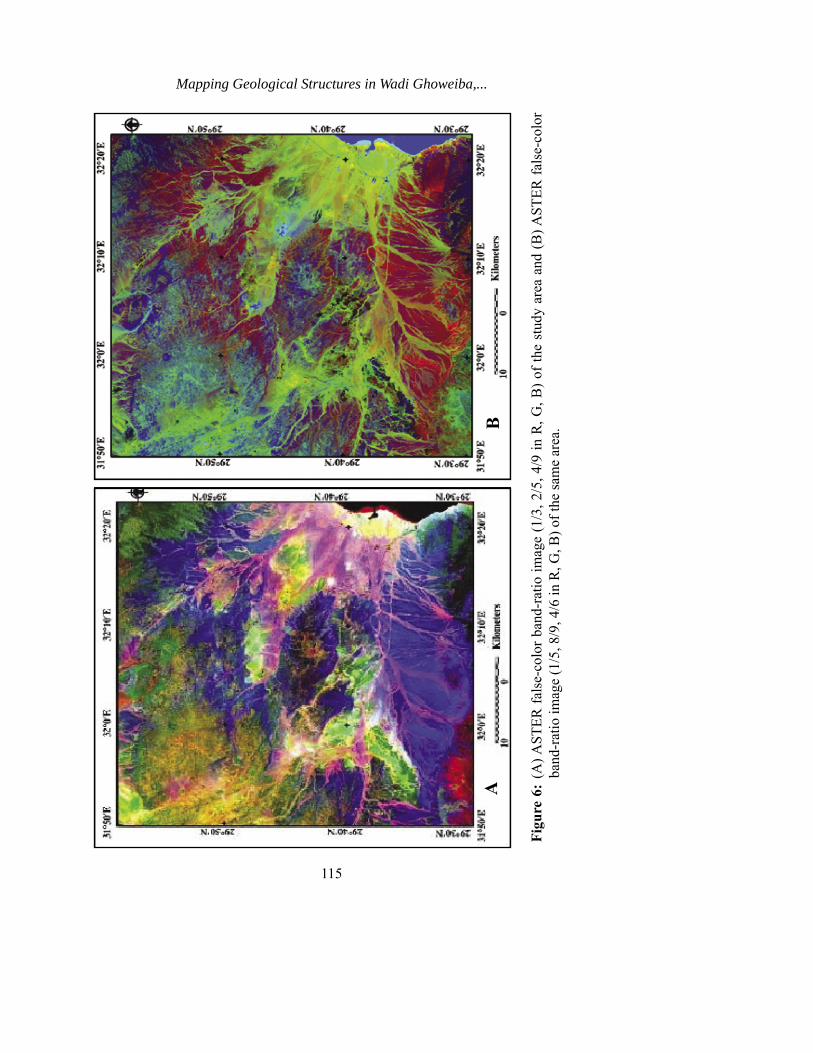
Spectral reflectance curves (Fig. 5) of the proposed six ASTER band-ratios (1/5, 8/9, 4/6, 1/3, 2/5, and 4/9) show negative or poor correlation (different behaviors) compared to the spectral reflectance curves of the raw ASTER data (Fig. 4). Two false-color band-ratio images (1/3, 2/5, 4/9 in RGB) and (1/5, 8/9, 4/6 in RGB) were produced (Fig. 6, A and B, respectively) and were subsequently compared with the published geological maps. Comparison shows perfect match between mapped rock units and the characteristic color of each rock unit on the images. The characteristic colors of each rock unit are illustrated in Table (4).
Table 3: Average ASTER DN values for the 11 widely-exposed rock units in the study area.
Digital numbers of the spectral reflectance of each of the nine ASTER bands corresponding to the 11 widely-exposed rock units
Plio
cene
San
ds a
nd
Gra
vels
Mal
ha F
orm
atio
n
Mok
atta
m F
orm
atio
n
Wad
i Hof
For
mat
ion
Wad
i Gar
awi
Form
atio
n
Non
-mar
ine
Mio
cene
se
dim
ents
Mar
ine
Mio
cene
se
dim
ents
Qur
n Fo
rmat
ion
Obs
erva
tory
Form
atio
n
Bas
alt
Olig
ocen
e Sa
nds a
nd
Gra
vels
AST
ER
ban
ds
214 198 207 207 198 255 241 236 223 163 195 1
209 195 203 189 186 255 232 229 218 146 199 2
150 144 150 134 134 184 159 159 157 104 138 3
185 173 187 162 163 187 172 181 186 128 160 4
176 166 167 160 160 179 168 178 179 132 151 5
185 173 174 162 164 187 172 189 190 131 152 6
154 149 140 144 146 172 161 169 161 125 149 7
133 145 117 139 134 167 153 156 138 126 146 8
144 145 136 135 137 146 138 153 146 117 132 9

Mapping Geological Structures in Wadi Ghoweiba,...
113
Figure 4: Spectral characteristic curves for the 11 widely-exposed rock units in the study area, (modified after Hassan et al., 2008).
Figure 5: Spectral characteristic curves using the proposed six band-ratios (1/3, 2/5, 4/9, 1/5, 8/9, and 6/4) showing more discrimination of the different rock units in the study area.

M. M. Abdeen et al.
114
Table 4: Characteristic colors of the 11 widely exposed rock units appeared on the proposed ASTER band-ratio images.
Rock unitsCharacteristic colors appear on ASTER band-ratio 1/3, 2/5, 4/9
image in R G B of Fig. 6-A
Characteristic colors appear on ASTER band-ratio 1/5, 8/9, 4/6
image in R G B of Fig. 6-BPliocene sands, gravels,
clays and limestone Dark blue Dark red
Non-marine Miocene sediments Cyan bright light orange
Marine Miocene sediments Green with fine texture Spots of purple, blue and red colorBasalt Black Black
Gebel Ahmar Formation Green Dark blue for coarse gravels, brown
and brownish red for fine sandsWadi Hof Formation Earthy blue Very dark red
Wadi Garawi Formation Green Very light blue
Qurn Formation Orange Dusty bluish greenObservatory Formation Blue RedMokattam Formation Bright light blue Bright light red
Malha Formation Earthy green Dusty dark red
Processing of SPOT Data The SPOT panchromatic image data was spectrally enhanced using histogram stretch to ensure better contrast.
SPOT-ASTER Data FusionData integration is applied to the remote sensing data with various techniques (Bretschneider and Kao, 2000). In the present study two methods of data fusion were used; the color normalization transformation (CNT) or Brovey transformation, and the principal component (PC) transformation.In the present work, SPOT panchromatic image data was fused with ASTER band-ratio (1/5, 8/9, 4/6 in R, G, B) image data. SPOT-ASTER band-ratio fused image preserves a perfect spatial resolution (10 m) and the best spectral discrimination of the exposed rock units in the study area. Fig. (7) shows a raw SPOT image with 10 m spatial resolution (A), a false color composite image 1, 3, 5 in RGB of raw ASTER image (with 15 and 30 m spatial resolution) (B), an ASTER band-ratio 1/5, 8/9, 4/6 in RGB (C) and a SPOT-ASTER band-ratio fused image (D) of Gebel Abu Treifa as a part of the study area.1. Principal components(PC) transformationBecause a major goal of this merge is to retain the spectral information of the ASTER band-ratio image (1/5, 8/9, and 2/9) and the high spatial resolution of the SPOT image, this algorithm is mathematically effective. This method calculates principal components (PC), remaps the high resolution image (SPOT panchromatic with 10 m spatial resolution) into the data range of PC-1 (PC-1 contains only overall scene luminance; all interband variation is contained in the other 2 PCs) and substitutes it for PC-1, then applies an inverse principal components transformation. This remapping is done so that the mathematics of the reverse transform does not distort the thematic information (Chavez et al., 1991).
Mapping Geological Structures in Wadi Ghoweiba,...
115
Figu
re 6
: (A
) AST
ER fa
lse-
colo
r ban
d-ra
tio im
age
(1/3
, 2/5
, 4/9
in R
, G, B
) of t
he s
tudy
are
a an
d (B
) AST
ER fa
lse-
colo
r ba
nd-r
atio
imag
e (1
/5, 8
/9, 4
/6 in
R, G
, B) o
f the
sam
e ar
ea.
AB

M. M. Abdeen et al.
116
Figure 7: Different processing techniques applied on Gebel Abu Treifa images:(A) A raw panchromatic SPOT image (10 m spatial resolution), (B) A false-color composite ASTER image 1, 3, 5 in R G B (15 and 30 m spatial resolution), (C) An ASTER band-ratio image 1/5, 8/9, 4/6 in RGB showing better discrimination of the lithological units and (D) A SPOT-ASTER band-ratio fused image showing the best spatial and spectral information as a result of the Brovey fusion technique.

Mapping Geological Structures in Wadi Ghoweiba,...
117
The principal component method is best used in applications that require the original scene radiometry (color balance) of the input multispectral image (ASTER- ratio image) to be maintained as closely as possible in the output file (SPOT-ASTER ratio fused image). As this method scales the high resolution data set to the same data range as principal component 1 (PC-1), the band histograms of the output file closely resemble those of the input multispectral image, and then the inverse principal component calculation is applied. PC transformation technique is a powerful tool to improve and to emphasize lithological boundary in the study area and hence allows lineaments extraction (Fig. 8, A & B).
2. Color normalization transformation (CNT)
The color normalization transformation (CNT), or Brovey transformation, has been applied to fuse ASTER-ratio image with SPOT panchromatic data. This transformation technique applies a ratio algorithm to combine the images, by dividing the DN value of each pixel in each band by the sum of the DN values of the three bands in the multi-spectral (ASTER-ratio) image and then multiplying the result by the DN value of the high spatial resolution gray scale (SPOT panchromatic) image, according to the following equations (Vrabel, 1996):[DNB1 / DNB1 + DNB2 + DNBn] x [DN high res. image] = DNB1 (new)[DNB2 / DNB1 + DNB2 + DNBn] x [DN high res. image] = DNB2 (new)[DNB3 / DNB1 + DNB2 + DNBn] x [DN high res. image] = DNB3 (new)where B = band, DN= digital number and n= number of bandsSPOT-ASTER band-ratio fused image using CNT technique improves the lithological mapping due to the high spatial resolution (10 m of SPOT image) and the high spectral resolution (multispectral bands of ASTER band-ratio image) (Fig. 8, C & D).
Digital Elevation Model (DEM)
A Digital Elevation Model (DEM) is a raster grid of elevation values that represents a surface in the three dimensions. DEM is often used to create perspective maps and for various types of geological interpretation. The DEM extraction module of the ERDAS Imagine 8.7 software allows a person to extract DEM from push broom stereo-images, such as those coming with ASTER data. Along track stereo-images are acquired on the same orbital pass by a satellite which usually has more than one sensor looking at the Earth from different angles.ASTER data can be used to produce DEM with a spatial resolution of 15 m (Lang and Welch, 1999). ASTER DEM is a product that is generated from a pair of ASTER Level 1B images, which include bands 3N (Nadir) and 3B (Backward) from the near infra-red telescope’s along-track stereo-data that is acquired in the spectral range of 0.78 to 0.86 microns. ASTER DEM can be generated either with or without ground control points (GCPs). In the present study, an absolute DEM is created with GCPs, which have been taken from topographic maps at scale of 1:50,000. This DEM has an absolute horizontal

M. M. Abdeen et al.
118
Figure 8: Lineaments extraction from SPOT-ASTER band-ratio fused images covering a part of the study area, using PC (A & B) and CNT (C & D) techniques, respectively.
and vertical accuracy of 10-15 meters with appropriate GCPs, which is good enough for 30 meter contour line generation. ASTER DEM is expected to meet map accuracy standards for scales from 1:50,000 to 1:250,000. Three dimensions (3D) perspective views of parts of the study area were prepared by draping SPOT-ASTER ratio fused image over ASTER DEM (Fig. 9). Combining spectral data with 3D DEM improves and significantly contributes to mapping of morphologically-defined structures (Bedell, 2001; Lang and Abdelsalam, 2002; Rowan and Mars, 2003; Gani and Abdelsalam, 2005).

Mapping Geological Structures in Wadi Ghoweiba,...
119
RESULTS AND DISCUSSION
- All the 11 widely exposed rock units in the study area have approximately equal high reflectance at the visible wavelength region corresponding to ASTER bands 1 and 2, which make no discrimination of these rock units at these bands, while all these rocks have varying low reflectance values at the SWIR wavelength region (from 1.6 to 2.4 µm) corresponding to ASTER bands 4, 6, 7, 8 and 9 (Table 3 and Fig. 4).
- Oligocene basalt has clear lower DN values compared to the surrounded rock units, so it is readily discriminated from the raw ASTER data due to its dark tone. Oligocene sands and gravels can be discriminated using principal components analysis (PCA) technique (Hassan et al., 2008).
- Marine and non-marine Miocene sediments, Wadi Garawi Formation, Wadi Hof Formation, Malha Formation and Pliocene sands and gravels have the same DN values at ASTER bands (4 & 6), while Mokattam, Qurn, and Observatory formations have different DN values at the same ASTER bands. By dividing DN values of band 4 by the DN values of band 6, discrimination between Mokattam, Qurn, and Observatory Formations can be achieved using band-ratio 4/6.
- Marine and non-marine Miocene sediments have lower reflectance at the ASTER band 9 than ASTER band 8, while Wadi Garawi and Pliocene sands and gravels formations have higher reflectance at the ASTER band 9 than ASTER band 8, therefore discrimination between these formations can be achieved by dividing the DN of band 8 by the DN of band 9 (i.e. using band ratio 8/9).
High spectral reflectance values occur at ASTER bands 1, 2, 4 and 6 while spectral absorption values occur at bands 3, 5, 7, 8 and 9 (Fig. 4). Therefore two band-ratio images (1/5, 8/9, 2/9) and (1/3, 2/5, 4/9) were used in the present study to help in the lithological discrimination of the exposed rock units (Figs. 5 and 6) and hence to produce a photo-geological map (Fig. 10).Comparison of the produced photo-geological map with the available geological maps followed by field check indicates that the proposed ASTER band-ratio images can be used for precise lithological mapping in unmapped areas, verifying and/or updating the existing geological maps.Fusion of SPOT panchromatic data, of 10 m spatial resolution, with ASTER band-ratio image data using both CNT and PC transformation techniques (in order to preserve all spatial and spectral information) is a powerful tool to enhance lithological and structural features. Draping SPOT-ASTER-ratio fused image over ASTER DEM to produce three dimensional (3D) perspective views was used to detect faults, lineaments, truncation of bedding, and cross-cutting relationship (Figs. 9 and 10).

M. M. Abdeen et al.
120
Figure 9: Different criteria for lineaments extraction using SPOT-ASTER ratio fused image draped on ASTER DEM showing (A) El-Galala El-Bahariya structural plateau capped by a hard limestone bed that is bounded by two step faults, (B) a structural plateau that is bounded by two en echelon faults, (C) truncation and off-set of bedding. (D) El-Galala El-Bahariya plateau separated from Ramliya-Akheider plateau by a fault occupying Wadi Ghoweiba, and (E) structural plateau with truncated hanging wadis indicating young age of faulting.

Mapping Geological Structures in Wadi Ghoweiba,...
121
Figure 10 (A): Legend of the photogeological map of Fig. 10-B showing the colors designated for the rock units.

M. M. Abdeen et al.
122
Figu
re 1
0 (B
): D
etai
led
phot
ogeo
logi
cal m
ap o
f Wad
i Gho
wei
ba a
rea,
nor
thw
est G
ulf o
f Sue
z in
terp
rete
d fr
om S
POT-
AST
ER
ratio
fuse
d im
age
and
the
3D v
iew
s, w
hich
wer
e de
rived
from
AST
ER D
EM a
nd su
bseq
uent
fiel
d ve
rific
atio
n, fo
r ro
ck u
nits
col
ors r
efer
to F
ig. 1
0 (A
).

Mapping Geological Structures in Wadi Ghoweiba,...
123
CONCLUSION
In the present study area of Wadi Ghoweiba, 19 rock units were identified by previous studies. They range in age from Jurassic to Quaternary. Out of these rock units, only 11 units are widely exposed showing distinctive spectral reflectance characteristics. Fusion of multi-source remote sensing data and production of 3D perspective views increased lithological discrimination and structural delineation that reduced field efforts for generating detailed geological-structural maps (Fig. 10). Band-ratio technique of the nine ASTER (3 VNIR and 6 SWIR) bands, were used to enhance spectral discrimination of the 11 rock units, while fusion with SPOT panchromatic image was used to enhance spatial resolution. Draping of SPOT-ASTER band-ratio image on the ASTER DEM produced 3D perspective views that facilitated delineation of structural lineaments. The average spectral reflectance characteristic curves (Fig. 4) for each of the 11 widely exposed rock units were extracted from the 3 VNIR and the 6 SWIR ASTER bands to select the best band-ratio for enhancing lithological discrimination.ASTER band ratio image 1/5, 8/9 and 4/6 in RGB (Fig. 6) was found to be very useful in extracting different lithological units in study area.Fusion of ASTER band-ratio image with SPOT panchromatic image using PC and CNT techniques proved to be significantly useful for lithological mapping due to perfect spatial and spectral information. SPOT-ASTER-ratio fused image gave the best results for extracting the lithological units.Draping of the fused SPOT-ASTER ratio image over ASTER DEM to generate 3D perspective views enhanced the structurally-controlled morphology and hence improved geological mapping and extraction of structural lineaments in the study area (Fig. 10).We conclude that application of the fusion technique of SPOT and ASTER spectral data together with the 3D perspective views derived from ASTER DEM is significantly useful in preparing reliable photogeological-structural maps.
ACKNOWLEDGEMENTS
We would like to thank Professor S. M. Arafat for providing ASTER data. Discussion with and supports from colleagues at the National Authority for Remote Sensing and Space Sciences (NARSS) have enriched our information and knowledge. Critical review and comments by Professors I. A. El-Kassas and M. M. El-Malky have improved the quality of the paper.

M. M. Abdeen et al.
124
REFERENCES
Abd-Allah, A. M. A., 1993. Structural geology of the area between El-Galala El-Bahariya and Gebel Okheider, Ph.D. Thesis, Faculty of Science, Ain Shams University, Cairo, Egypt, 199 p.Abdeen, M. M.; Thurmond, A. K.; Abdelsalam, M. G. and Stern, R. J., 2002. Use of TERRA ASTER band-ratio images for geological mapping in arid regions: The Neoproterozoic Allaqi suture, Egypt. Egypt. J. Remote Sensing and Space Sci., Vol. 5, pp. 19-40.Bedell, R. L., 2001. ASTER Satellite remote sensing; a significant leap in factual geologic mapping. Abstracts with programs. Geological Society of America, Vol. 33, p. 348.Bretschneider, T. and Kao, O., 2000. Image fusion in remote sensing. Proceedings of the 1st. Online Symposium of Electronic Engineers. CD-Rom.Chavez, P. S.; Sides, S. C. and Anderson, J. A., 1991. Comparison of three different methods to merge multiresolution and multispectral data, Landsat TM and SPOT panchromatic, “Photogrammetric Engineering and Remote Sensing, Vol. 3, pp. 295-303.Cudahy, T. H. and Hewson, R., 2002. ASTER geological case histories: Porphyry-skarn-epithermal, iron oxide, Cu-Au and Broken Hill Pb-Zn-Ag. Communication in the Workshop Mapping the Earth with ASTER, London.EGSMA, 1981. Geological Map of Egypt at scale of 1; 2000,000, Egyptian Geological Survey and Mining Authority, Abbasiya, Cairo, Egypt. ERDAS, 1999. ERDAS Field Guide, 5th Edition, ERDAS Inc., Atlanta, Georgia, USA.ERSDAC (Earth Remote Sensing Data Analysis Center), 2000. Advanced Spaceborne Thermal Emission and Reflec tion Radiometer, Available from: <http://www.ASTERweb.gov/>.Gad, S. and Kusky, T., 2007. ASTER spectral ratioing for lithological mapping in the Arabian-Nubian Shield, the Neoproterozoic Wadi Kid area, Sinai, Egypt. Gondwana Research. 11, pp. 326-335.Gani, N. D. and Abdelsalam, M. G., 2005. Remote sensing analysis of Gorge of the Nile, Ethiopia with emphasis on Dejen – Gohatsion region, Journal of African Earth Sciences, Vol. 40, pp. 326-335.Hassan, S. M.; Abdeen, M. M.; EL-Kazzaz, Y. A. H. A.; Yehia, M. A. and Attia, G. M. 2008. Characterization of Oligocene sands and gravels, Wadi Ghoweiba, northwest Gulf of Suez, Egypt, using spectral signature and principal component analysis, of Terra ASTER images. Egypt. J. Remote Sensing and Space Sci., V. 11, pp. 73-92.Hewson, R.; Koch, C.; Buchanan, A. and Sanders, A., 2002. Detailed geological and regolith mapping in the Bangemall Basin, WA, using ASTER multi-spectral satellite-borne data, Communi cation in the Workshop Mapping the Earth with ASTER, London.Hunt, G. R., 1977. Spectral signatures of particular minerals in the visible and near infrared, Geophysics, Vol. 42, pp. 501-513.

Mapping Geological Structures in Wadi Ghoweiba,...
125
Hunt, G. R., 1979. Near infrared (1.3-2.4 µm) spectra of alteration minerals-potential for use in remote sensing, Geophysics, Vol. 44, pp. 1974-1986.Klitzsch, E. and Linke, H. W., 1983. Gulf of Suez photogeological map at 1: 100,000 scale, prepared for CONOCO Coral Inc., Cairo, Egypt, Sheet 1, Berlin – Frankfurt, Germany.Klitzsch, E.; List, F. K. and Polman, G., 1987. Geological map of Egypt at a scale of 1: 500,000, prepared for CONOCO Coral Inc. and EGPC, Cairo, Egypt, sheet NH 36 SW Beni Suef, Institute für Angewandte Geologie, Berlin, Germany.Lang, H. and Welch, R., 1999. ATBD-AST-08 Algorithm theoretical basis document for ASTER digital elevation models (standard product AST14). Version 3.0, University of Georgia, Georgia, Atlanta, 69 p.Lang, H. and Abdelsalam, M. G., 2002. Geologic mapping in arid regions with ASTER data, an example from NW Arizona. Abstracts with Programs. Geological Society of America, Vol. 34, 4 p.Qui, F.; Abdelsalam, M. G. and Thakkar, P., 2006. Spectral analysis of ASTER data covering part of the Neoproterozoic Allaqi-Heiani suture, southern Egypt, Journal of African Earth Sciences, Vol. 44, pp. 169-180.Rowan, L. C. and Mars, J. C., 2001. Advances in lithologic mapping by using optical remote sensing measurements. Abstracts with programs. Geological society of America Vol. 33, p 347.Rowan, L. C. and Mars, J. C., 2003. Lithologic mapping in the Mountain Pass area, California using Advanced Spaceborne Thermal Emission and Reflection Radiometer (ASTER) data, Remote Sensing of Environment Vol. 84 (3), pp. 350-366.Sabins, F., 1987. Remote Sensing Principles and Interpretations. First edition, W.H. Freeham and Co., New York.Sadek, M., 1926. The geography and geology of the district between Gebel Ataqa and El-Galala El-Baharyia (Gulf of Suez). Geol. Surv. Egypt, Paper No. 40, 120 p.Said, R., 1962. The Geology of Egypt, Elsevier Pub. Co., Amsterdam, 377 p.Salisbury, J. W.; Walter, L. S. and Verge, N., 1987. Mid-infrared (2.1-25 µm) Spectra of Minerals, First Ed. United States Geological Survey, Open File Report, USGS, Washington, D. C., pp. 87-263.Vrabel, J., 1996. Multispectral imagery band sharpening method. Photogrametry Enginering and Remote Sensing Vol. 62, pp. 1075-1083.
Received August 23, 2007, Revised August 27, 2007.

M. M. Abdeen et al.
126
تقنية باستخدام مصر السويس، خليج غرب شمال غويبة، وادي بمنطقة الجيولوجية التراكيب تخريط األستر لمرئيات الرقمي االرتفاعات ونموذج وسبوت أستر نوعية الفضائية المرئيات بيانات دمج
يحيى3، عادل محمد عطية2، محمد جمال القزاز2، عبداهللا حامد عباس يحيى عابدين1، محمود ممدوح وصفاء محمد حسن1
1. الهيئة القومية لالستشعار من البعد وعلوم الفضاء، القاهرة، مصر2. قسم الجيولوجيا، كلية العلوم، جامعة حلوان، حلوان، مصر
3. قسم الجيولوجيا، كلية العلوم، جامعة عين شمس، القاهرة، مصر
لقد فرضت علينا المحددات العملية واإلقتصادية تقليل الجهود المبذولة في العمل الحقلي للتعرف على الوحدات الصخرية والتراكيب الجيولوجية بغرض تنمية المناطق الصحراوية. ويعتبر دمج األنواع المختلفة. البيانات ألنواع التكاملية الطبيعة من لالستفادة فاعلة وسيلة الصناعية األقمار لبيانات المختلفة
وتسمح هذه الطريقة بدمج البيانات الطيفية لمصادر متعددة بدقة عالية.األستر بهدف اختبار ولقد قمنا في الدراسة الحالية بدمج بيانات القمر الصناعي سبوت وبيانات قدرة هذه الطريقة في تخريط التكوينات والتراكيب الجيولوجية بمنطقة وادي غويبة إلى الغرب من الطرف الشمالي الغربي لخليج السويس بمصر. وتتميز بيانات األستر بنطاق واسع من الحزم الطيفية (14 حزمة)،
بينما تتميز البيانات أحادية اللون للقمر الصناعي سبوت بقوة تحليل أرضية 10 متر.المرئية األشعة نطاق تغطي التي الثالثة األطياف من لكل الطيفية الخصائص تحليل على وبناًء والتحت حمراء القريبة واألطياف الستة التي تغطي نطاق األشعة التحت الحمراء القصيرة لبيانات األستر،
فقد تم انتاج مرئيتـان فضـائيتان ذات النســــــــب (1/5, 8/9, 4/6 in R, G, B) , (1/3, 2/5, 4/9 in RGB)
وذلك لفصل الوحدات الصخرية بشكل أفضل. وبعد ذلك تم دمج تلك المرئيات ذات النسب المستنبطة من بيانات األستر مع بيانات القمر الصناعي سبوت أحادية اللون باستخدام تقنية المركبة األساسية ومعادلة األلوان أو مايطلق عليها طريقة "بروفي" للتحويل. ولقد أثبتت المرئيات المدمجة قدرة ممتازة على تمييز
الوحدات الصخرية.التقاطهما تم واللتان (3B) ورقم 3N رقم الطيفيتين الحزمتين على األستر بيانات تشتمل كما في نطاق األشعة التحت الحمراء القريبة (من 0٫78 – 0٫86 ميكرون) وهما يسمحان باستخراج نموذج اإلرتفاعات الرقمي. ولقد تم عمل مجسمات ثالثية األبعاد وذلك بإسقاط المرئيات التي تم إنتاجها من دمج بيانات القمر الصناعي سبوت مع بيانات مرئيات النسب المستنبطة من بيانات األستر على نموذج اإلرتفاعات
الرقمى. ولقد استخدمت هذه المجسمات في تحسين منظر التراكيب الجيولوجية ذات التضاريس المحددة.ولقد تم تفسير المرئيات المدمجة والمجسمات ثالثية األبعاد إلنتاج خريطة فوتوجيولوجية – تركيبية، تم التحقق من صحتها باستخدام عدد من الخرائط المنشورة والمتاحة باإلضافة إلى التحقق الحقلي. واتضح من ذلك أن هذه التقنية المستخدمة لدمج بيانات القمر الصناعي سبوت وبيانات األستر ذات فعالية عالية في
التخريط الجيولوجي وباألخص في المناطق البعيدة والوعرة.
Copyright © 2022 FDOKUMEN