The Total Economic Impact™ Of Teradata Aster Discovery ...
19
A Forrester Total Economic Impact™ Study Commissioned By Teradata Project Director: Anish Shah October 2014 The Total Economic Impact™ Of Teradata Aster Discovery Platform Cost Savings And Business Benefits Enabled By Implementing Teradata’s Aster Discovery Platform
-
Upload
khangminh22 -
Category
Documents
-
view
0 -
download
0
Transcript of The Total Economic Impact™ Of Teradata Aster Discovery ...

A Forrester Total Economic
Impact™ Study
Commissioned By
Teradata
Project Director:
Anish Shah
October 2014
The Total Economic
Impact™ Of Teradata
Aster Discovery Platform Cost Savings And Business Benefits Enabled By Implementing Teradata’s Aster Discovery Platform

Table Of Contents
Executive Summary .................................................................................... 1
Disclosures .................................................................................................. 2
TEI Framework And Methodology ............................................................ 3
Analysis ........................................................................................................ 4
Financial Summary ................................................................................... 12
Appendix A: Interviewed Organization Description ............................. 15
Appendix B: Total Economic Impact™ Overview ................................. 16
Appendix C: Glossary ............................................................................... 17
ABOUT FORRESTER CONSULTING
Forrester Consulting provides independent and objective research-based
consulting to help leaders succeed in their organizations. Ranging in scope from a
short strategy session to custom projects, Forrester’s Consulting services connect
you directly with research analysts who apply expert insight to your specific
business challenges. For more information, visit forrester.com/consulting.
© 2014, Forrester Research, Inc. All rights reserved. Unauthorized reproduction is strictly prohibited.
Information is based on best available resources. Opinions reflect judgment at the time and are subject to
change. Forrester®, Technographics
®, Forrester Wave, RoleView, TechRadar, and Total Economic Impact
are trademarks of Forrester Research, Inc. All other trademarks are the property of their respective
companies. For additional information, go to www.forrester.com.

1
Executive Summary
Teradata commissioned Forrester Consulting to conduct a
Total Economic Impact™ (TEI) study and examine the
potential return on investment (ROI) enterprises may
realize by implementing Teradata Aster Discovery
Platform. The purpose of this study is to provide readers
with a framework to evaluate the potential financial impact
of the Aster Discovery Platform on their organizations.
To better understand the benefits, costs, and risks
associated with an Aster Discovery Platform
implementation, Forrester conducted an in-depth
interview with a long-term customer using Teradata’s
Aster Discovery Platform. This customer had over five
years of experience using the Aster Discovery Platform to
help implement a big data analytics and discovery
solution. The platform enabled the organization to
streamline fragmented data, reduce costs of hiring
technical resources, increase the time to business
insights, integrate with its other systems, and align with its
cloud strategy.
Prior to implementing the Aster Discovery Platform, the
customer was using a third-party website for all its
reporting, analytics, and operational needs. The
organization was collecting significant clickstream logs about interactions on its website. However, it did not have the
capability to process it and derive insights to make its business model more efficient. It also was quickly finding out that
writing MapReduce code for every business query was not really going to provide the scalability it required. With a limited IT
support staff to meet the demands of the business, the organization started looking for a platform to provide it with big data
analytics and discovery capabilities to analyze compiled customer data. In looking for the right vendor, the company chose
the Aster Discovery Platform for the following reasons:
• It has the ability to data model, warehouse, and work with unstructured data.
• It can reduce labor costs through more readily available skill sets that can manage the platform.
• It has visual tools to help drive key business insights and improve marketing efficiency.
ASTER DISCOVERY PLATFORM GENERATES SALES, PRODUCTIVITY, AND MARKETING EFFICIENCY INCREASES
Our interview with a large online retailer and subsequent financial analysis found that the organization experienced the risk-
adjusted ROI, benefits, and costs shown in Figure 1. (See Appendix A for a description of the organization.)Figure 1
Financial Summary Showing Three-Year Risk-Adjusted Results
ROI: 106%
Total 3 Year NPV: $3.1 million
Payback: 13.9 months
Total 3 Year benefits: $6.1 million
Source: Forrester Research, Inc.
Teradata Aster Discovery Platform is a big data
analytics and discovery solution that allows
companies to derive high-impact insights from big
data through an integrated solution. The interviewed
organization benefited from an increase in prospect
conversion, an increase in both IT and end-user
productivity, and an increase in marketing efficiency.
The Total Economic Impact study highlighted the
following costs and benefits for the interviewed
organization:
Three-year total benefits: $6.1 million.
Hardware and software license costs: $1 million
initial and $200,000 per year ongoing.
Annual data engineer, IT, and business analyst
support costs of $495,000 in Year 1 and
$765,000 ongoing.
Three-year NPV: $3.1 million.

2
› Benefits. The interviewed organization experienced the following risk-adjusted benefits:
• Increase in prospect conversion resulting in direct impact to bottom line profits. The interviewed organization
can directly attribute an increase in prospect conversion and an increase in net profit margin from the insights that
are generated from its investment in the Aster Discovery Platform. For the interviewed organization, the percentage
lift on its net profit margin happens gradually with a 1% lift in Year 1 and going up to a 3% lift by Year 3.
• Increase in IT and end user productivity. The interviewed organization estimated 20% of its total employees (IT
and business) have a direct benefit resulting from the implementation of the Aster Discovery Platform. These 20% of
employees see a gradual increase in their productivity from Year 1 to Year 3 due to how quickly insights can be
generated and the business optimized.
• Increase in marketing efficiency. The interviewed organization has been able to positively influence its use of its
marketing dollars due to the analysis and insights generated through the implementation of the Aster Discovery
Platform in its environment.
› Costs. The interviewed organization experienced the following risk-adjusted costs:
• Hardware and software costs include initial implementation cost of $1 million and ongoing costs of
$200,000 per year. These are the initial one-time fees paid to Teradata for purchasing the hardware and software to
host the Aster Discovery Platform in its environment as well as the ongoing cost of maintaining and supporting the
Aster Discovery Platform that has been incurred by the interviewed organization.
• Full-time equivalent (FTE) costs to support the Aster Discovery Platform are $465,000 in Year 1 and
$765,000 per year after Year 1. Once the interviewed organization implemented the Aster Discovery Platform, it
had to hire one full-time data scientist, two full-time technology resources, and two full-time business analysts
beginning in Year 2 to achieve its benefits from its investment.
Disclosures
The reader should be aware of the following:
› The study is commissioned by Teradata and delivered by Forrester Consulting. It is not meant to be used as a competitive
analysis.
› Forrester makes no assumptions as to the potential ROI that other organizations will receive. Forrester strongly advises
that readers use their own estimates within the framework provided in the report to determine the appropriateness of an
investment in Teradata Aster Discovery Platform.
› Teradata reviewed and provided feedback to Forrester, but Forrester maintains editorial control over the study and its
findings and does not accept changes to the study that contradict Forrester’s findings or obscure the meaning of the study.
› Teradata provided the customer name for the interview but did not participate in the interview.

3
TEI Framework And Methodology
INTRODUCTION
From the information provided in the interview, Forrester has constructed a Total Economic Impact (TEI) framework for those
organizations considering implementing Teradata Aster Discovery Platform. The objective of the framework is to identify the
cost, benefit, flexibility, and risk factors that affect the investment decision.
APPROACH AND METHODOLOGY
Forrester took a multistep approach to evaluate the impact that Teradata Aster Discovery Platform can have on an
organization (see Figure 2). Specifically, we:
› Interviewed Teradata marketing, sales, and IT personnel, along with Forrester analysts, to gather data relative to the Aster
Discovery Platform and the marketplace for Aster Discovery Platform.
› Interviewed one organization currently using Teradata’s Aster Discovery Platform to obtain data with respect to costs,
benefits, and risks.
› Constructed a financial model representative of the interview using the TEI methodology. The financial model is populated
with the cost and benefit data obtained from the interview.
› Risk-adjusted the financial model based on issues and concerns the interviewed organization highlighted in interview. Risk
adjustment is a key part of the TEI methodology. While interviewed organizations provided cost and benefit estimates,
some categories included a broad range of responses or had a number of outside forces that might have affected the
results. For that reason, some cost and benefit totals have been risk-adjusted and are detailed in each relevant section.
Forrester employed four fundamental elements of TEI in modeling Teradata Aster Discovery Platform’s service: benefits,
costs, flexibility, and risks.
Given the increasing sophistication that enterprises have regarding ROI analyses related to IT investments, Forrester’s TEI
methodology serves to provide a complete picture of the total economic impact of purchase decisions. Please see Appendix
B for additional information on the TEI methodology.
FIGURE 2
TEI Approach
Source: Forrester Research, Inc.
Perform due diligence
Conduct customer interview
Profile customer
organization
Construct financial
model using TEI framework
Write case study

4
Analysis
INTERVIEWED ORGANIZATION
For this study, Forrester conducted an in-depth interview with the director of data engineering whose organization
implemented Teradata’s Aster Discovery Platform. The interviewed organization has the following profile:
› It is a privately held organization with over 1,000 employees.
› It is an online eCommerce retailer for high-end branded merchandise with over $600 million in annual revenue.
› It is headquartered in the Northeast United States with employees across multiple countries. Eighty-five percent of the
employees are based in the United States, and many of them work remotely.
› Some countries have their own country-specific website that is treated as a separate entity. The director of data
engineering is responsible for managing all the different eCommerce platforms.
› Information technology resources for the organization are split between the United States and Ireland.
Based on this interview, Forrester constructed a TEI framework and an associated ROI analysis that illustrates the areas the
organization identified as having the greatest financial impact and developed a model of costs and benefits.
INTERVIEW HIGHLIGHTS
Situation
In 2009, the interviewed organization was using a third-party website
platform to support its analytics needs. The company was collecting
clickstream logs about customer behavior and website interaction,
and it had no meaningful way to process and act on the data it was
collecting. With the third-party website, the organization started using
Elastic MapReduce to understand its data, and it quickly found out
that writing MapReduce code for every single question that the
business needed to answer was not going to provide the scalability
that it needed. This is when the organization started looking for a
platform to provide big data analytics and discovery capabilities and
allow it to more efficiently analyze all the data it was collecting. The
interviewed organization had discussions and sent out request for
proposals (RFPs) to assess the right data warehouse platform for
them.
Solution
After evaluating multiple vendors, the interviewed organization selected Teradata’s Aster Discovery Platform for its flexibility
and its strength in housing and analyzing both structured and unstructured data. Furthermore, the decision to go with Aster
Discovery Platform was because of its ability to interact with many other systems in the organization’s environment. The
organization wanted a platform to work in conjunction with Cognos, Tibco Spotfire, and complement Apache Hadoop.
The interview revealed that:
› It took the organization between two years before experiencing the full benefits of Aster Discovery Platform. It
took the organization two years to fully achieve all three of the quantifiable benefits linked to its Aster Discovery Platform
“We have a lot of test cases
and product changes that we
have been able to make
internally as a result of the
analytics that is taking place
on the platform.”
~Director of data engineering, online retailer

5
investment (increase in prospect conversion, increase in employee productivity, and increase in marketing efficiency). Both
employees and processes needed to adapt to the learnings and the insights that could be generated through this platform.
› The organization wanted to invest in a platform that would complement Apache Hadoop. It was important for the
interviewed organization to choose a big data analytics and discovery platform that complemented Apache Hadoop, which
was already used in its environment. For example, the interviewee said, “If I need to answer a very small question quickly,
that is not going to happen on Hadoop. If I need to answer a very large question on unstructured data, we may need to use
Hadoop.” The interviewed organization also mentioned that if it wants to store a lot of data that it will be infrequently
accessing, then economically Hadoop makes more sense than the Aster Discovery Platform.
› The organization’s performance improved dramatically after implementing the Aster Discovery Platform. The Aster
Discovery Platform performed a lot better than Elastic
MapReduce, which the organization was using before. In the
Elastic MapReduce world, the data engineering team would have
to write a Java program that could answer a query, deploy the
Java group program, and then run Elastic MapReduce to mine
the data set and get answers out. With the Aster Discovery
Platform, the organization could just type in a SQL query.
› The interviewed organization’s planning process has
become much better. With the Aster Discovery Platform, the
organization’s planning process has become more efficient. The
director of data engineering expressed, “If we can predict what
products are going to arrive late then that can help us more
efficiently plan our sale calendar and more efficiently plan our
shops.” Being able to better forecast and predict through
predictive insights allowed the organization to become more
efficient within the product life cycle.
› The organization found it easier to find the skill set to
generate insights through the Aster Discovery Platform. The
interviewed organization claimed that because of the platform’s
ready-to-use big data functionality, acquiring data, performing
analysis, and presenting output can be done by a wide variety of
IT skills sets and resources. The organization does not need a full team of expensive data scientists and engineers to
manipulate and use data.
BENEFITS
The interviewed organization experienced a number of quantified benefits in this case study:
› Additional net profit from increasing prospect conversation rate.
› Increased savings from IT and end user productivity.
› Lift in sales from increased marketing efficiency.
Another important benefit mentioned by the interviewed organization was the ease of deploying the system into its
environment. While implementation time depends on a number of factors, the organization regarded the ease of working with
Teradata’s implementation team to install the Aster Discovery Platform into its environment and realize an accelerated
payback for its investment.
“For us, it has been relatively
easy to monetize and justify
our investment in Aster
Discovery Platform; the
changes that have resulted
from the product have offered
us much increase in revenue.”
~Director of data engineering, online retailer

6
Additional Net Profit From Increasing Prospect Conversion Rate
The interviewed organization noted that the use of Teradata’s Aster Discovery Platform allowed it to better analyze and
process large volumes of website engagement data. The organization could then apply this analysis to make adjustments to
its sales process, ultimately leading to an increase in the prospect conversion rate. The director of data engineering said:
“Within three years our business was able to enhance our acquisition process and customer experience through the insights
delivered by the Aster Discovery Platform [so] that we could see material impact to our bottom line.” The Aster Discovery
Platform allows business users to gain access to customized reports and dashboards and develop ad hoc queries to deliver
real-time intelligence to enhance their customer experience. The ability to handle thousands of queries through a simplified
system management process allows the interviewed organization to provide a more targeted customer experience that
directly leads to sales.
The interviewed organization had approximately $600 million in revenue in Year 1, with an average net profit margin of 8% or
$48 million. Upon implementing the Aster Discovery Platform, the interviewed organization could attribute a lift in 1% in net
profit in Year 1, which resulted in a total three-year risk adjusted benefit amount of over $2.9 million (see Table 1). The
interviewed organization conducted extensive tests to understand how many additional prospects converted once new data-
driven insights on prospect behavior were implemented. The interviewed organization also expressed that there was a
learning curve for it to understand and operationalize the insights from the Aster Discovery Platform. The director of data
engineering stated, “It took us about three years to realize the full benefits and come to a steady state from our purchase of
this big data analytics and discovery platform.”
TABLE 1
Additional Net Profit From Increasing Prospect Conversion Rate
Source: Forrester Research, Inc.
Increased Savings From IT And End User Productivity
For the interviewed organization, the Aster Discovery Platform became the central place where data is aggregated and is the
source of information the business uses to make decisions on a daily basis within the organization. Noted benefits included
ease of data aggregation, reduced time of writing queries, interaction with other internal systems, and web-based reporting
that allows the business to gain access to real-time actionable insights. The director of data engineering stated: “My data
scientists and DBAs now are much more efficient, and my end users have quicker access to information and reporting that
they can access themselves using the Aster Discovery Platform’s simplified web interface.”
Ref. Calculation Initial Year 1 Year 2 Year 3 Total
Present
Value
A1 $600,000,000 $630,000,000 $661,500,000
A2 8% 8% 8%
A3 A1*A2 $0 $48,000,000 $50,400,000 $52,920,000
A4 1% 2% 3%
95%
Atr $0 $456,000 $957,600 $1,508,220 $2,921,820 $2,339,098
Net profit margin
Metric
Gross revenue estimates
Additional profit impact
from customer conversion
Percent lift directly attributed to
better customer experience
from Aster Discovery Platform
Net profit
Risk adjustment

7
The interviewed organization has 1,000 employees, of which 20% directly rely on the Aster Discover Platform for their daily
activities. During the first year, the interviewed organization estimated about a 1% lift in both IT and end user employee
productivity, which increased to 4% by Year 3. At an average fully burdened cost per FTE of $175,000, the interviewed
organization realized a three-year risk-adjusted net benefit of over $2.3 million (see Table 2).
TABLE 2
Increased Savings From IT And End User Productivity
Source: Forrester Research, Inc.
Lift In Sales From Increased Marketing Efficiency
Prior to implementing the Aster Discovery Platform, the interviewed organization was having a hard time navigating through
large volumes of data to identify and engage with its customers. There was an increased amount of pressure to enhance the
return on the approximate 15% of top-line revenue that the interviewed organization was allocating for its annual marketing
budget. A key objective of the IT organization was to assist in analyzing its data and optimize its go-to-market approach to
identify and retain customers. After its implementation of the Aster Discovery Platform, the interviewed organization saw
efficiencies across its marketing efforts. It was able to optimize targeted marketing campaigns, improve its communication
strategy, optimize its website and product mix, and influence its pricing strategy, as well as target customers with a relevant
and well-timed offer strategy.
The interviewed organization spends about 15% of its top-line revenue on marketing to win and retain its customers. After its
implementation of the Aster Discovery Platform, the interviewed organization claimed that the direct efficiency gain was 0.5%
in Year 1, which increased to a 1% efficiency gain in years 2 and 3 (see Table 3).
Ref. Calculation Initial Year 1 Year 2 Year 3 Total
Present
Value
B1 1,000 1,000 1,000
B2 20% 20% 20%
B3 $175,000 $175,000 $175,000
B4 1% 2% 4%
Bt B1*B2*B3*B4 $0 $350,000 $700,000 $1,400,000
95%
Btr $0 $332,500 $665,000 $1,330,000 $2,327,500 $1,851,108
Metric
Number of employees
Increase in employee
productivity directly due to
Aster Discovery Platform
Risk adjustment
Increase in employee
productivity directly due to
Aster Discovery Platform
Percent of employees whose
productivity increases directly
from insights gained from Aster
Discovery Platform
Average burden rate of
employee
Percent increase in productivity

8
TABLE 3
Lift In Sales From Marketing Efficiencies
Source: Forrester Research, Inc.
Total Benefits
Table 4 shows the total of all benefits across the three areas listed above, as well as present values (PVs) discounted at
10%. Over three years, the interviewed organization expects risk-adjusted total benefits to be a PV of approximately $6.1
million.
TABLE 4
Total Benefit Cash Flows (Risk-Adjusted Estimates)
Source: Forrester Research, Inc.
Ref. Calculation Initial Year 1 Year 2 Year 3 Total
Present
Value
C1 $600,000,000 $630,000,000 $661,500,000
C2 15% 15% 15%
C3 0.5% 1% 1%
Ct C1*C2*C3*C4 $0 $450,000 $945,000 $992,250
100%
Ctr $0 $450,000 $945,000 $992,250 $2,387,250 $1,935,575
Risk adjustment
Increase in efficiency of
marketing directly
attributed to Aster Discovery
Marketing budget percent of
gross revenue
Increase in efficiency of
marketing directly attributed to
Aster Discovery Platform
Metric
Gross revenue estimates
Increase in efficiency of
marketing directly attributed to
Aster Discovery Platform
Ref. Initial Year 1 Year 2 Year 3 Total
Present
Value
Atr $0 $456,000 $957,600 $1,508,220 $2,921,820 $2,339,098
Btr $0 $332,500 $665,000 $1,330,000 $2,327,500 $1,851,108
Ctr $0 $450,000 $945,000 $992,250 $2,387,250 $1,935,575
$0 $1,238,500 $2,567,600 $3,830,470 $7,636,570 $6,125,781
Benefit Category
Increased prospect conversion rate through better
customer experience results in increase in profit
Total benefits (risk-adjusted)
Increase in employee productivity due to Aster
Discovery Platform leads to fewer FTE
requirements
Increase marketing efficiency

9
COSTS
The interviewed organization experienced two primary investment costs associated with the Aster Discovery Platform
solution:
› Initial hardware, software, and integration costs.
› Internal data scientist and support costs.
These represent the mix of internal and external costs experienced by the organization for initial planning, implementation,
and ongoing software maintenance associated with the solution.
Initial Hardware, Software, And Integration Costs
The initial hardware and software purchase price and implementation cost for the Aster Discovery Platform is $1 million,
which is reflective of the market rate for organizations with a similar profile to our interviewed organization. While the
interviewed organization leases its hardware for the Aster Discovery Platform, Forrester chose a costing model that is more
reflective of the majority of Teradata customers. This price is for a clustered system with multiple nodes. The nodes store the
distributed data and also work in parallel for all processing and analytic computations. The interviewed organization is
charged a $200,000 yearly maintenance fee from Teradata to manage and support its Aster Discovery Platform (see Table
5).
TABLE 5
Initial Hardware, Software, And Integration Costs
Source: Forrester Research, Inc.
Internal Data Scientist And Support Costs
The largest cost category for the interviewed organization was the internal effort and resources to ensure the success of
supporting the Aster Discovery Platform. The interviewed organization hired a full-time data scientist with a fully burdened
cost of $250,000 per year once it implemented Teradata’s Aster Discovery Platform. The data scientist is highly proficient in
SQL and is responsible for developing and executing statistical and mathematical modeling to assist the business in its data
mining efforts. The interviewed organization also hired two additional Aster Discovery Platform IT support staff at a fully
burdened cost of $150,000 per year. The goal of the IT support staff is to manage both the Aster Discovery Platform
hardware and software, including performing maintenance and enhancing the interface based on business requirements.
In addition to technical support, the interviewed organization hired two business analysts starting in Year 2 to assist in
working with the business to really get the value of its investment in the Aster Discovery Platform. The business analysts
Ref. Initial Year 1 Year 2 Year 3 Total
Present
value
D1 $1,000,000 $0 $0 $0
Dt $0 $0 $200,000 $200,000
100%
Dtr $1,000,000 $0 $200,000 $200,000 $1,400,000 $1,315,552
Metric
Aster Discovery Platform —
hardware purchase
Yearly ongoing hardware
maintenance
Risk adjustment
Yearly ongoing hardware
maintenance (risk-adjusted)
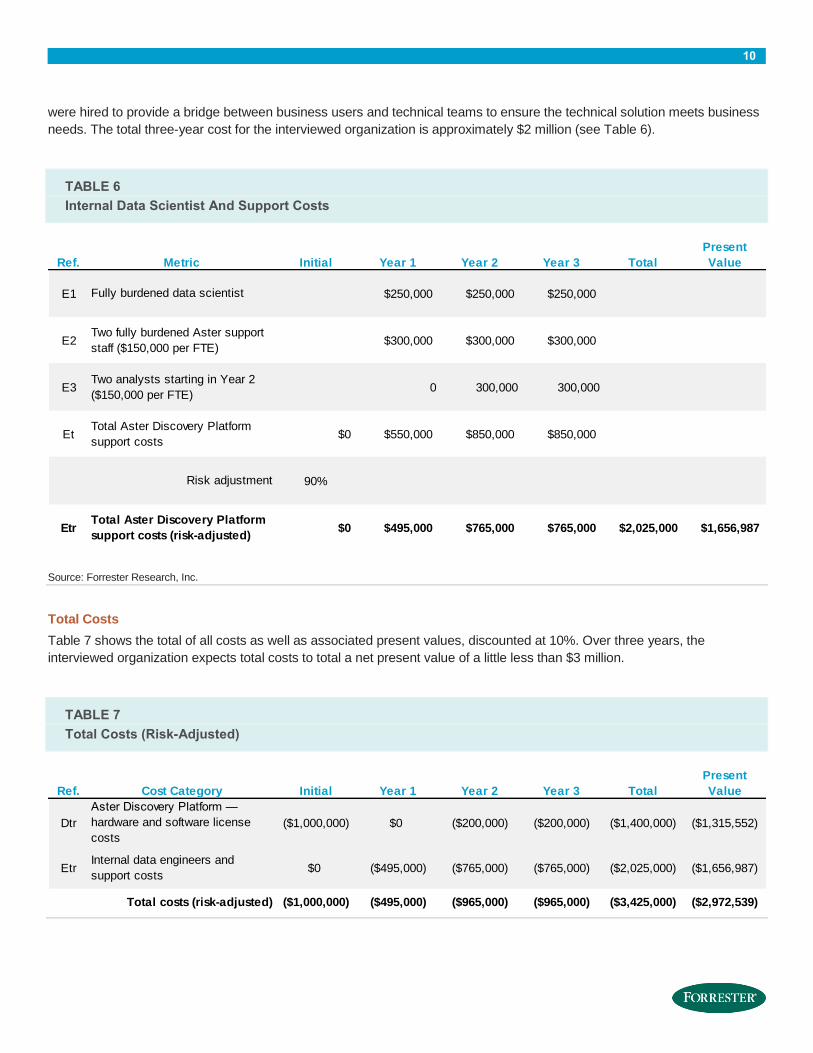
10
were hired to provide a bridge between business users and technical teams to ensure the technical solution meets business
needs. The total three-year cost for the interviewed organization is approximately $2 million (see Table 6).
TABLE 6
Internal Data Scientist And Support Costs
Source: Forrester Research, Inc.
Total Costs
Table 7 shows the total of all costs as well as associated present values, discounted at 10%. Over three years, the
interviewed organization expects total costs to total a net present value of a little less than $3 million.
TABLE 7
Total Costs (Risk-Adjusted)
Ref. Initial Year 1 Year 2 Year 3 Total
Present
Value
E1 250,000$ 250,000$ 250,000$
E2 300,000$ 300,000$ 300,000$
E3 0 300,000 300,000
Et $0 $550,000 $850,000 $850,000
90%
Etr $0 $495,000 $765,000 $765,000 $2,025,000 $1,656,987
Metric
Fully burdened data scientist
Total Aster Discovery Platform
support costs
Risk adjustment
Total Aster Discovery Platform
support costs (risk-adjusted)
Two fully burdened Aster support
staff ($150,000 per FTE)
Two analysts starting in Year 2
($150,000 per FTE)
Ref. Initial Year 1 Year 2 Year 3 Total
Present
Value
Dtr ($1,000,000) $0 ($200,000) ($200,000) ($1,400,000) ($1,315,552)
Etr $0 ($495,000) ($765,000) ($765,000) ($2,025,000) ($1,656,987)
($1,000,000) ($495,000) ($965,000) ($965,000) ($3,425,000) ($2,972,539)
Cost Category
Aster Discovery Platform —
hardware and software license
costs
Internal data engineers and
support costs
Total costs (risk-adjusted)

11
FLEXIBILITY
Flexibility, as defined by TEI, represents an investment in additional capacity or capability that could be turned into business
benefit for some future additional investment. This provides an organization with the “right” or the ability to engage in future
initiatives but not the obligation to do so.
The Aster Discovery Platform is unique because it combines system designs along with built-in expertise and integrates
them into complete, optimized data analytics solutions for organizations. This fully integrated platform is not limited by
system memory and is scalable and can process large-scale queries across different business applications, including
customer churn, product affinity, fraud detection, and supply chain optimization.
The Aster Discovery Platform allows organizations to accelerate the speed at which organizations can access and gain
insights from their data while providing a simplified interface that can be used by many parts of an organization.
RISKS
Forrester defines two types of risk associated with this analysis: “implementation risk” and “impact risk.” Implementation risk
is the risk that a proposed investment in the Aster Discovery Platform may deviate from the original or expected
requirements, resulting in higher costs than anticipated. Impact risk refers to the risk that the business or technology needs
of the organization may not be met by the investment in the Aster Discovery Platform, resulting in lower overall total benefits.
The greater the uncertainty, the wider the potential range of outcomes for cost and benefit estimates. Table 8 shows the
variability in the benefit outcomes that customers similar to the interviewed organization may achieve from implementing
Teradata’s Aster Discovery Platform.
TABLE 8
Benefit And Cost Risk Adjustments
Benefits Adjustment
Additional net profit from increasing prospect conversation rate 5%
Increased savings from IT and end user productivity 5%
Costs Adjustment
Internal data scientist and support costs 10%
Source: Forrester Research, Inc.

12
Financial Summary
The financial results calculated in the Benefits and Costs sections can be used to determine the ROI, NPV, and payback
period for the organization’s investment in the Aster Discovery Platform.
Tables 9 and 10 show the risk-adjusted ROI, NPV, and payback period values. These values are determined by applying the
risk-adjustment values from Table 8 in the Risks section to the unadjusted results in each relevant Cost and Benefit section.
TABLE 9
Cash Flow Chart (Risk-Adjusted)
Source: Forrester Research, Inc.
TABLE 10
Cash Flow (Risk-Adjusted)
Source: Forrester Research, Inc.
($2,000,000)
($1,000,000)
$0
$1,000,000
$2,000,000
$3,000,000
$4,000,000
$5,000,000
Initial Year 1 Year 2 Year 3
Ca
sh
Flo
ws
Financial Analysis (risk-adjusted)
Total Costs Total Benefits Cumulative Total
Initial Year 1 Year 2 Year 3 Total
Present
value
Total costs ($1,000,000) ($495,000) ($965,000) ($965,000) ($3,425,000) ($2,972,539)
$0 $1,238,500 $2,567,600 $3,830,470 $7,636,570 $6,125,781
($1,000,000) $743,500 $1,602,600 $2,865,470 $4,211,570 $3,153,242
106%
13.9
ROI
Payback period (months)
Summary
Total benefits
Total

13
Teradata Aster Discovery Platform: Overview
NEXT-GENERATION ANALYTICS ON ALL DATA INTEGRATED WITH SQL
The Teradata Aster Discovery Platform is the industry’s first next-generation, integrated discovery platform that provides
powerful, high-impact insights from big data through an integrated solution optimized for multiple analytics on all data with
speed and minimal effort. Using the Aster Discovery Platform, organizations attain unmatched competitive advantage and
drive pervasive adoption of big data analytics by every user based on their skills and preferences.
NEXT-GENERATION ANALYTICS FOR NEW INSIGHTS
The Teradata Aster Discovery Platform features SQL, SQL-MapReduce, SQL-GR graph analytic engine, and the open
source R engine that makes it easy to perform powerful and complex analyses across big data sets. Using these next-
generation engines, organizations can easily solve complex business problems such as path or pattern analysis, statistical
analysis, text analysis, social network and influencer analysis, fraud detection, supply chain management, network analysis,
and threat detection. The analytic engines integrate tightly together and can be invoked through a single SQL interface,
empowering analysts and data scientists to discover high-impact insights and reduce the complexity of big data analytics.
QUICKLY INGEST MULTISTRUCTURED DATA FOR ANALYTICS
The Teradata Aster Discovery Platform comes with new storage architecture that is optimized for discovery on all data,
leading to novel insights with the least amount of IT effort. The platform comes with Teradata Aster File Store, which enables
quick and easy ingestion of multistructured data (such as weblogs, sensor data, machine log data, etc.) for analysis without
any loss of fidelity or upfront schema definition effort. Applications that are built for HDFS can easily be run on data stored in
Aster File Store since it is fully compatible.
In addition to Aster File Store, the Aster Discovery Platform provides row and column store for storing relational data.
TERADATA ASTER SNAP FRAMEWORK FOR DISCOVERY
The Teradata Aster Discovery Platform features the unique Teradata Aster Seamless Network Analytics Processing (SNAP)
Framework for discovery that is designed to be standards-based and extensible and seamlessly integrates with existing IT

14
infrastructures. Teradata’s revolutionary SNAP Framework enables users to snap together multiple analytic engines and file
stores with ease, providing them with unmatched power and speed to delve deeply into data.
The SNAP Framework includes the following:
• Using the unified SQL interface, analysts and data scientists can invoke and combine various types of analytics
(such as graph, path/pattern, text, SQL, and statistical predictive analysis) in a single SQL statement.
• Integrated Optimizer takes the query with multiple analytics and parses it into multiple subqueries to be executed by
workload-specific execution engines like SQL-GR and SQL-MapReduce. The Integrated Optimizer features powerful
advanced optimizations like global collaborative planning and adaptive optimization that result in order of magnitude
gains in performance, such as eliminating redundant operations. Integrated Executor orchestrates the execution of
query and iterative phases across the multiple engines. It passes parameters and results across engines and
performs common workload management and monitoring across engines.
• Common Storage System and Services provide a unified data storage architecture that eliminates wasteful and
redundant effort. It is a plug-and-play system designed for typed data stores and provides common services such as
fault tolerance, replication, and security across the data stores.
DRIVE PERVASIVE ADOPTION OF BIG DATA
Insightful, interactive visualizations and an extensive portfolio of prebuilt functions applied from a familiar SQL interface
enable all users to participate in the discovery of insights using existing skills. The Teradata Aster Discovery Platform
features the Teradata Aster Discovery Portfolio, which provides a suite of ready-to-use functions that lead to high-value
insights for a wide variety of business use cases such as social network or influencer analysis, customer churn, behavioral
analysis, path to purchase, fraud, financial analysis, and personalized recommendations.
Teradata Aster Discovery Portfolio provides modules of functions for each of four steps in the discovery process: data
acquisition module, data preparation module, analytics module, and visualization module.
Teradata Aster Discovery Platform provides Teradata Aster Lens, which is an interactive web application for business users
and analysts to explore the results of analysis through interactive visualizations in a web browser. Teradata Aster Discovery
Platform integrates with several leading business intelligence and reporting tools, such as Tableau, MicroStrategy, Tibco
Spotfire, IBM Cognos, and SAP BusinessObjects.

15
Appendix A: Interviewed Organization Description
For this TEI study, Forrester has interviewed an organization that has implemented the Aster Discovery Platform to illustrate
the quantifiable benefits and costs of implementing Teradata’s Aster Discovery Platform.
The interviewed organization has the following characteristics:
› It is a privately held organization with over 1,000 employees.
› It is an online eCommerce retailer for high-end branded merchandise with over $600 million in annual revenue.
› It is headquartered in the Northeast United States with employees across multiple countries. Eighty-five percent of the
employees are based in the United States, and many of them work remotely.
› The organization spends approximately 15% of its top-line revenue in marketing-related activities.
› Some countries have their own country-specific website that is treated as a separate entity. The director of data
engineering is responsible managing all the different eCommerce platforms.
› Information technology resources for the organization are split between the United States and Ireland.
FRAMEWORK ASSUMPTIONS
Table 11 provides the model assumptions that Forrester used in this analysis.
The discount rate used in the PV and NPV calculations is 10%, and the time horizon used for the financial modeling is three
years. Organizations typically use discount rates between 8% and 16% based on their current environment. Readers are
urged to consult with their respective company’s finance department to determine the most appropriate discount rate to use
within their own organizations.
TABLE 11
Model Assumptions
Ref. Metric Calculation Value
C1 Cost per fully burdened data scientist $250,000
C2 Cost per fully burdened IT support staff $150,000
C3 Cost per fully burdened business analyst staff $150,000
Source: Forrester Research, Inc.

16
Appendix B: Total Economic Impact™ Overview
Total Economic Impact is a methodology developed by Forrester Research that enhances a company’s technology decision-
making processes and assists vendors in communicating the value proposition of their products and services to clients. The
TEI methodology helps companies demonstrate, justify, and realize the tangible value of IT initiatives to both senior
management and other key business stakeholders.
The TEI methodology consists of four components to evaluate investment value: benefits, costs, flexibility, and risks.
BENEFITS
Benefits represent the value delivered to the user organization — IT and/or business units — by the proposed product or
project. Often, product or project justification exercises focus just on IT cost and cost reduction, leaving little room to analyze
the effect of the technology on the entire organization. The TEI methodology and the resulting financial model place equal
weight on the measure of benefits and the measure of costs, allowing for a full examination of the effect of the technology on
the entire organization. Calculation of benefit estimates involves a clear dialogue with the user organization to understand
the specific value that is created. In addition, Forrester also requires that there be a clear line of accountability established
between the measurement and justification of benefit estimates after the project has been completed. This ensures that
benefit estimates tie back directly to the bottom line.
COSTS
Costs represent the investment necessary to capture the value, or benefits, of the proposed project. IT or the business units
may incur costs in the form of fully burdened labor, subcontractors, or materials. Costs consider all the investments and
expenses necessary to deliver the proposed value. In addition, the cost category within TEI captures any incremental costs
over the existing environment for ongoing costs associated with the solution. All costs must be tied to the benefits that are
created.
FLEXIBILITY
Within the TEI methodology, direct benefits represent one part of the investment value. While direct benefits can typically be
the primary way to justify a project, Forrester believes that organizations should be able to measure the strategic value of an
investment. Flexibility represents the value that can be obtained for some future additional investment building on top of the
initial investment already made. For instance, an investment in an enterprise wide upgrade of an office productivity suite can
potentially increase standardization (to increase efficiency) and reduce licensing costs. However, an embedded collaboration
feature may translate to greater worker productivity if activated. The collaboration can only be used with additional
investment in training at some future point. However, having the ability to capture that benefit has a PV that can be
estimated. The flexibility component of TEI captures that value.
RISKS
Risks measure the uncertainty of benefit and cost estimates contained within the investment. Uncertainty is measured in two
ways: 1) the likelihood that the cost and benefit estimates will meet the original projections and 2) the likelihood that the
estimates will be measured and tracked over time. TEI applies a probability density function known as “triangular distribution”
to the values entered. At a minimum, three values are calculated to estimate the underlying range around each cost and
benefit.

17
Appendix C: Glossary
Discount rate: The interest rate used in cash flow analysis to take into account the time value of money. Companies set
their own discount rate based on their business and investment environment. Forrester assumes a yearly discount rate of
10% for this analysis. Organizations typically use discount rates between 8% and 16% based on their current environment.
Readers are urged to consult their respective organizations to determine the most appropriate discount rate to use in their
own environment.
Net present value (NPV): The present or current value of (discounted) future net cash flows given an interest rate (the
discount rate). A positive project NPV normally indicates that the investment should be made, unless other projects have
higher NPVs.
Present value (PV): The present or current value of (discounted) cost and benefit estimates given at an interest rate (the
discount rate). The PV of costs and benefits feed into the total NPV of cash flows.
Payback period: The breakeven point for an investment. This is the point in time at which net benefits (benefits minus costs)
equal initial investment or cost.
Return on investment (ROI): A measure of a project’s expected return in percentage terms. ROI is calculated by dividing
net benefits (benefits minus costs) by costs.
A NOTE ON CASH FLOW TABLES
The following is a note on the cash flow tables used in this study (see the example table below). The initial investment
column contains costs incurred at “time 0” or at the beginning of Year 1. Those costs are not discounted. All other cash flows
in years 1 through 3 are discounted using the discount rate (shown in the Framework Assumptions section) at the end of the
year. PV calculations are calculated for each total cost and benefit estimate. NPV calculations are not calculated until the
summary tables are the sum of the initial investment and the discounted cash flows in each year.