new fluorite index using aster data of gabal abu diyab area ...
9
Al-Azhar Bulletin of Science: Section D, Vol. 32, No. 2, (December) 2021, pp.13-21 http://doi. 10.21608/absb.2021.94705.1136 Al-Azhar Bulletin of Science: Section D Available at Egyptian Knowledge Bank (EKP) Journal Homepage: https://absb.journals.ekb NEW FLUORITE INDEX USING ASTER DATA OF GABAL ABU DIYAB AREA, CENTRAL EASTERN DESERT, EGYPT Mahmoud Hafez a, *, Ibrahim Abu El-Leil a , Nehal Soliman b , Mostafa Abu Bakr a a Geology Department, Faculty of Sciences, Al-Azhar University, Nasr City, Cairo, Egypt. b Geology Department, National Authority for Remote Sensing and Space Sciences, Cairo, Egypt. *Corresponding author, Email: [email protected] Received: 09 Sep 2021; Revised: 17 Sep 2021; Accepted: 03 Oct 2021; Published: 01 Dec 2021 ABSTRACT Remote sensing represents a significant function in the exploration of minerals. Extraction and identification of mineral occurrences in semi-arid to arid regions are some of the remote sensing confirmed uses. The Advanced Spaceborne Thermal Emission and Reflection Radiometer (ASTER) images have been combined with band ratio processing technique for detecting the fluorite mineral occurrences in the area around Gabal Abu Diyab, Central Eastern Desert, Egypt. The proposed band ratio derived from ASTER images Spectra [(b8/b6) * (b5/b3)] can be considered to represent the new Fluorite Index (FI). The USGS Spectral libraries are used to extract the new index and validated it by using the field study. According to the given new Fluorite Index (FI) combined with the field observations, two occurrences of fluorite mineralization at Gabal Homrit Waggat and Gabal Ineigi have been identified. This study provides the proposed FI as a beneficial tool for fluorite exploration that could be applicable along with Arabian Nubian Shield and similar arid and semi-arid environments. Keywords: ASTER; Band Ratio; Fluorite Index; FI; Gabal Abu Diyab 1. INTRODUCTION Since the early 1940s, remote sensing has been used in mineral prospecting, with handheld cameras fixed on plane windows [1]. This technique had been advanced to use the gray shaded color through aerial photos in geological mapping in 1952, however, the more developed space technology of satellite and airborne multispectral and hyperspectral digital imaging systems had been used. Many authors used different satellite images methodologies for the mapping of hydrothermal mineralized zones of the Precambrian rocks in the Arabian- Nubian Shield, e.g., [2-8]. Moreover, the studying of mineral exploration using different image processing techniques such as constrained energy minimization (CEM), principal component analysis (PCA) and band rationing had been taken into consideration., e.g., [9-13]. On the other hand, for lithological mapping ASTER data outperforms other sensors as it has more spectral bands that provide a better understanding of the geology of the earth’s surface, [14-16]. In this study, we used ASTER imagery and Spectra of USGS spectral libraries for defining the occurrence of fluorite mineralization in the study area. We proposed a new FI that shows a more advanced and suitable tool for prospecting fluorite mineralization. The given results are validated and confirmed by field studies, as well as the metallogenic map is given by [17]. 2. STUDY AREA AND GEOLOGICAL SETTING. The area of study locates around Gabal Abu Diyab, Central Eastern Desert, (Fig.1).
-
Upload
khangminh22 -
Category
Documents
-
view
0 -
download
0
Transcript of new fluorite index using aster data of gabal abu diyab area ...
Al-Azhar Bulletin of Science: Section D, Vol. 32, No. 2, (December) 2021, pp.13-21
http://doi. 10.21608/absb.2021.94705.1136
Al-Azhar Bulletin of Science: Section D
Available at Egyptian Knowledge Bank (EKP) Journal Homepage: https://absb.journals.ekb
NEW FLUORITE INDEX USING ASTER DATA OF GABAL ABU DIYAB AREA,
CENTRAL EASTERN DESERT, EGYPT
Mahmoud Hafez a,*, Ibrahim Abu El-Leil a, Nehal Soliman b, Mostafa Abu Bakr a
a Geology Department, Faculty of Sciences, Al-Azhar University, Nasr City, Cairo, Egypt. b Geology Department, National Authority for Remote Sensing and Space Sciences, Cairo, Egypt.
*Corresponding author, Email: [email protected]
Received: 09 Sep 2021; Revised: 17 Sep 2021; Accepted: 03 Oct 2021; Published: 01 Dec 2021
ABSTRACT
Remote sensing represents a significant function in the exploration of minerals. Extraction and
identification of mineral occurrences in semi-arid to arid regions are some of the remote sensing confirmed uses.
The Advanced Spaceborne Thermal Emission and Reflection Radiometer (ASTER) images have been combined
with band ratio processing technique for detecting the fluorite mineral occurrences in the area around Gabal Abu
Diyab, Central Eastern Desert, Egypt. The proposed band ratio derived from ASTER images Spectra [(b8/b6) *
(b5/b3)] can be considered to represent the new Fluorite Index (FI). The USGS Spectral libraries are used to
extract the new index and validated it by using the field study. According to the given new Fluorite Index (FI)
combined with the field observations, two occurrences of fluorite mineralization at Gabal Homrit Waggat and
Gabal Ineigi have been identified. This study provides the proposed FI as a beneficial tool for fluorite
exploration that could be applicable along with Arabian Nubian Shield and similar arid and semi-arid
environments.
Keywords: ASTER; Band Ratio; Fluorite Index; FI; Gabal Abu Diyab
1. INTRODUCTION
Since the early 1940s, remote sensing has
been used in mineral prospecting, with
handheld cameras fixed on plane windows [1].
This technique had been advanced to use the
gray shaded color through aerial photos in
geological mapping in 1952, however, the more
developed space technology of satellite and
airborne multispectral and hyperspectral digital
imaging systems had been used. Many authors
used different satellite images methodologies
for the mapping of hydrothermal mineralized
zones of the Precambrian rocks in the Arabian-
Nubian Shield, e.g., [2-8]. Moreover, the
studying of mineral exploration using different
image processing techniques such as
constrained energy minimization (CEM),
principal component analysis (PCA) and band
rationing had been taken into consideration.,
e.g., [9-13]. On the other hand, for lithological
mapping ASTER data outperforms other
sensors as it has more spectral bands that
provide a better understanding of the geology
of the earth’s surface, [14-16]. In this study, we
used ASTER imagery and Spectra of USGS
spectral libraries for defining the occurrence of
fluorite mineralization in the study area. We
proposed a new FI that shows a more advanced
and suitable tool for prospecting fluorite
mineralization. The given results are validated
and confirmed by field studies, as well as the
metallogenic map is given by [17].
2. STUDY AREA AND GEOLOGICAL
SETTING.
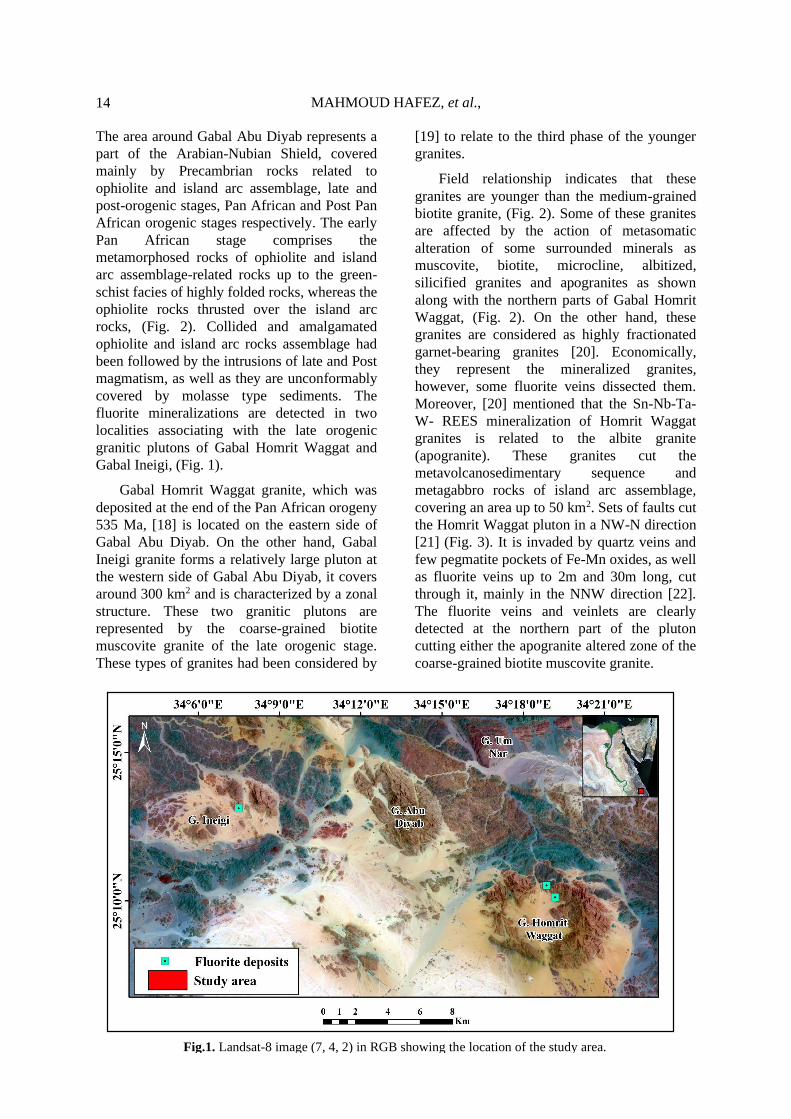
The area of study locates around Gabal
Abu Diyab, Central Eastern Desert, (Fig.1).
MAHMOUD HAFEZ, et al.,
14
The area around Gabal Abu Diyab represents a
part of the Arabian-Nubian Shield, covered
mainly by Precambrian rocks related to
ophiolite and island arc assemblage, late and
post-orogenic stages, Pan African and Post Pan
African orogenic stages respectively. The early
Pan African stage comprises the
metamorphosed rocks of ophiolite and island
arc assemblage-related rocks up to the green-
schist facies of highly folded rocks, whereas the
ophiolite rocks thrusted over the island arc
rocks, (Fig. 2). Collided and amalgamated
ophiolite and island arc rocks assemblage had
been followed by the intrusions of late and Post
magmatism, as well as they are unconformably
covered by molasse type sediments. The
fluorite mineralizations are detected in two
localities associating with the late orogenic
granitic plutons of Gabal Homrit Waggat and
Gabal Ineigi, (Fig. 1).
Gabal Homrit Waggat granite, which was
deposited at the end of the Pan African orogeny
535 Ma, [18] is located on the eastern side of
Gabal Abu Diyab. On the other hand, Gabal
Ineigi granite forms a relatively large pluton at
the western side of Gabal Abu Diyab, it covers
around 300 km2 and is characterized by a zonal
structure. These two granitic plutons are
represented by the coarse-grained biotite
muscovite granite of the late orogenic stage.
These types of granites had been considered by
[19] to relate to the third phase of the younger
granites.
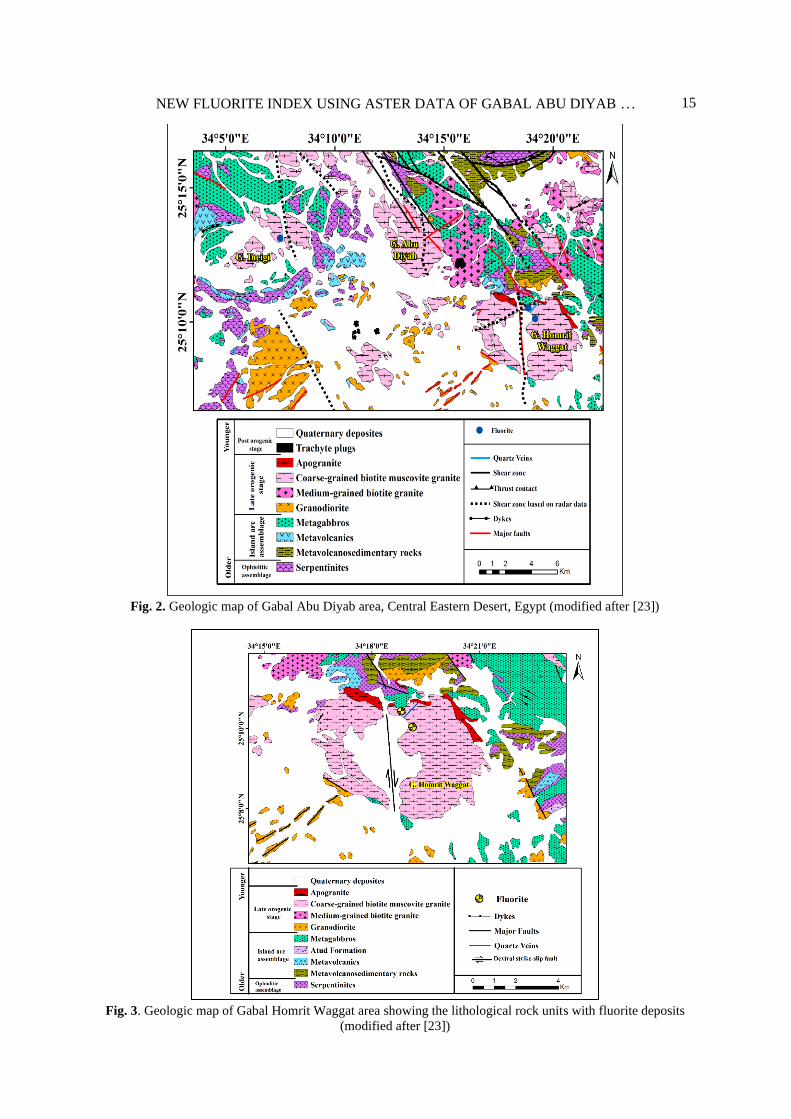
Field relationship indicates that these
granites are younger than the medium-grained
biotite granite, (Fig. 2). Some of these granites
are affected by the action of metasomatic
alteration of some surrounded minerals as
muscovite, biotite, microcline, albitized,
silicified granites and apogranites as shown
along with the northern parts of Gabal Homrit
Waggat, (Fig. 2). On the other hand, these
granites are considered as highly fractionated
garnet-bearing granites [20]. Economically,
they represent the mineralized granites,
however, some fluorite veins dissected them.
Moreover, [20] mentioned that the Sn-Nb-Ta-
W- REES mineralization of Homrit Waggat
granites is related to the albite granite
(apogranite). These granites cut the
metavolcanosedimentary sequence and
metagabbro rocks of island arc assemblage,
covering an area up to 50 km2. Sets of faults cut
the Homrit Waggat pluton in a NW-N direction
[21] (Fig. 3). It is invaded by quartz veins and
few pegmatite pockets of Fe-Mn oxides, as well
as fluorite veins up to 2m and 30m long, cut
through it, mainly in the NNW direction [22].
The fluorite veins and veinlets are clearly
detected at the northern part of the pluton
cutting either the apogranite altered zone of the
coarse-grained biotite muscovite granite.
Fig.1. Landsat-8 image (7, 4, 2) in RGB showing the location of the study area.
Fig.1. Landsat-8 image (7, 4, 2) in RGB showing the location of the study area.
NEW FLUORITE INDEX USING ASTER DATA OF GABAL ABU DIYAB …
15
Fig. 2. Geologic map of Gabal Abu Diyab area, Central Eastern Desert, Egypt (modified
after [23])
Fig. 2. Geologic map of Gabal Abu Diyab area, Central Eastern Desert, Egypt (modified after [23])
Fig. 3. Geologic map of Gabal Homrit Waggat area showing the lithological rock units with fluorite deposits
(modified after [23])

MAHMOUD HAFEZ, et al.,
16
The fluorite veins are associated with
quartz and pegmatite veins (Fig. 4A) indicating
that they have been related to the formation of
the metasomatic processes affecting the area
(Fig. 3). The granitic pluton of Gabal Ineigi is
also associated with some pegmatites, as well
as fluorite veins. The pluton intrudes the
serpentinites and metagabbros (Fig. 5). It is
revealed that the fluorite mineralizations are
often associated with quartz veins, however,
pure fluorite veins are rare, [20]. These veins
are fillers for open large and small cracks that
have formed along with fault plans. Fluorite
veins are mostly found in the pluton's southern
side. Usually, these veins are varying in
thickness from 0.5m to 5m and in length from
20m to over 300m and with trend mainly N 70
E with 88o dip to NW or SE [20]. The fluorite
veins have been examined by several authors
e.g, [24-29]. [20] considered that the fluorite–
quartz veins had been created as filling of
fissures and fractures during cooling of plutons
which dissecting by some parallel fractures
(Fig. 4B), after that, magmatic fluids rich in
fluorite from crystallization granitic melt were
injected into the fractured zones at moderate
temperatures and salinity. Quartz veins with
lower temperatures and salinities had
developed during the late stages of magmatic
fluids.
B
BMG
A
QV
BMG BMG
Fig. 4. (A) Photograph showing the quartz vein (QV) cutting the coarse-grained biotite muscovite granite
(BMG) of Gabal Homrit Waggat. (B) Photograph showing some parallel deep fractures dissecting the
coarse-grained biotite muscovite granite of Gabal Ineigi.
Fig. 5. Geologic map of Gabal Ineigi area showing the lithological rock units with fluorite deposits
(modified after [23]).
Fig. 5. Geologic map of Gabal Ineigi area showing the lithological rock units with fluorite deposits
(modified after [23]).
NEW FLUORITE INDEX USING ASTER DATA OF GABAL ABU DIYAB …
17
3. DATA AND METHODS
3.1. Data Characteristics
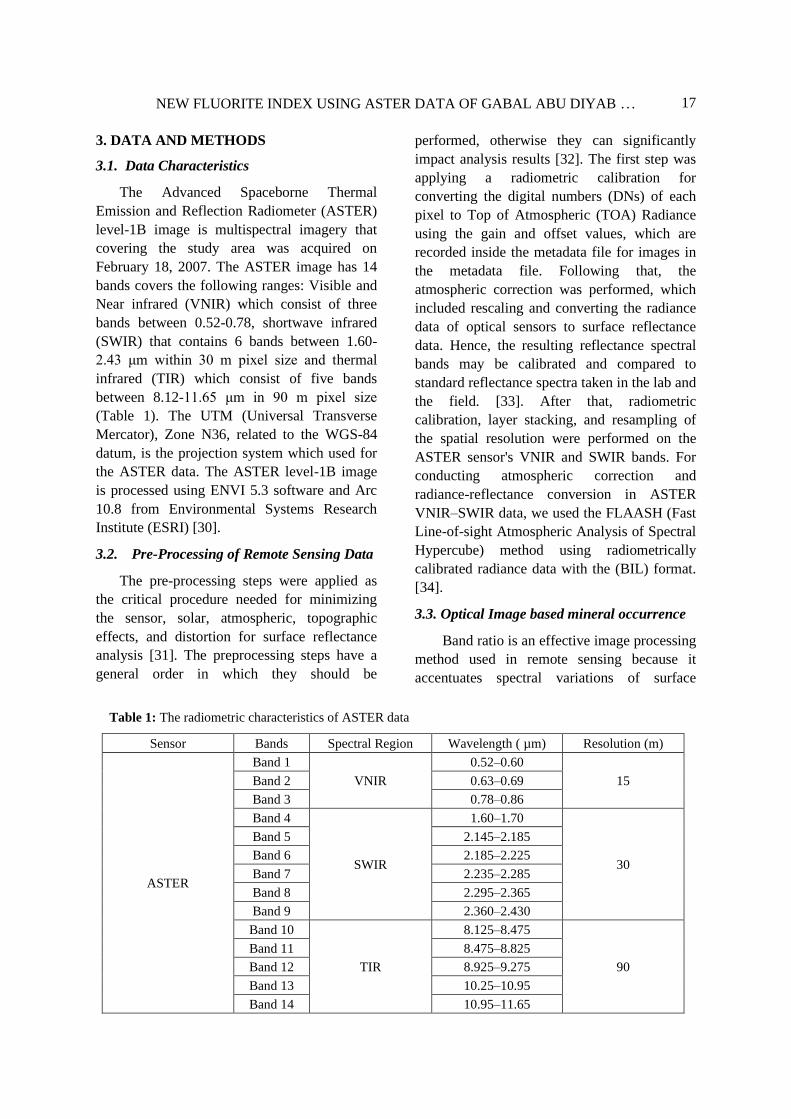
The Advanced Spaceborne Thermal
Emission and Reflection Radiometer (ASTER)
level-1B image is multispectral imagery that
covering the study area was acquired on
February 18, 2007. The ASTER image has 14
bands covers the following ranges: Visible and
Near infrared (VNIR) which consist of three
bands between 0.52-0.78, shortwave infrared
(SWIR) that contains 6 bands between 1.60-
2.43 μm within 30 m pixel size and thermal
infrared (TIR) which consist of five bands
between 8.12-11.65 μm in 90 m pixel size
(Table 1). The UTM (Universal Transverse
Mercator), Zone N36, related to the WGS-84
datum, is the projection system which used for
the ASTER data. The ASTER level-1B image
is processed using ENVI 5.3 software and Arc
10.8 from Environmental Systems Research
Institute (ESRI) [30].
3.2. Pre-Processing of Remote Sensing Data
The pre-processing steps were applied as
the critical procedure needed for minimizing
the sensor, solar, atmospheric, topographic
effects, and distortion for surface reflectance
analysis [31]. The preprocessing steps have a
general order in which they should be
performed, otherwise they can significantly
impact analysis results [32]. The first step was
applying a radiometric calibration for
converting the digital numbers (DNs) of each
pixel to Top of Atmospheric (TOA) Radiance
using the gain and offset values, which are
recorded inside the metadata file for images in
the metadata file. Following that, the
atmospheric correction was performed, which
included rescaling and converting the radiance
data of optical sensors to surface reflectance
data. Hence, the resulting reflectance spectral
bands may be calibrated and compared to
standard reflectance spectra taken in the lab and
the field. [33]. After that, radiometric
calibration, layer stacking, and resampling of
the spatial resolution were performed on the
ASTER sensor's VNIR and SWIR bands. For
conducting atmospheric correction and
radiance-reflectance conversion in ASTER
VNIR–SWIR data, we used the FLAASH (Fast
Line-of-sight Atmospheric Analysis of Spectral
Hypercube) method using radiometrically
calibrated radiance data with the (BIL) format.
[34].
3.3. Optical Image based mineral occurrence
Band ratio is an effective image processing
method used in remote sensing because it
accentuates spectral variations of surface
Table 1: The radiometric characteristics of ASTER data
Sensor Bands Spectral Region Wavelength ( µm) Resolution (m)
ASTER
Band 1
VNIR
0.52–0.60
15 Band 2 0.63–0.69
Band 3 0.78–0.86
Band 4
SWIR
1.60–1.70
30
Band 5 2.145–2.185
Band 6 2.185–2.225
Band 7 2.235–2.285
Band 8 2.295–2.365
Band 9 2.360–2.430
Band 10
TIR
8.125–8.475
90
Band 11 8.475–8.825
Band 12 8.925–9.275
Band 13 10.25–10.95
Band 14 10.95–11.65
MAHMOUD HAFEZ, et al.,
18
materials and exposes anomalies, while
suppresses other information like scene
illumination variances. [4]. Ratio images are
mathematical adjustments for improvements
obtained by dividing DN values in one spectral
band by corresponding values in another.
Consequently, this technique was utilized in the
present study to enhance the discrimination
between rock unites since ratioed images
describe the variations in the slopes of the
spectral reflectance curves between two bands
included, regardless of the absolute reflectance
values seen in the bands [35]. Band rationing
was applied on multispectral bands of both
ASTER and OLI sensors for detecting the
mineral occurrence in the study area.
4. RESULTS AND DISCUSSIONS
ASTER band ratio [(b8/b6) * (b5/b3)] is
used in this study and proved to be an effective
tool in detecting the occurrence of fluorite
minerals in the study area. The spectral library
of the United States Geological Survey (USGS)
contains reference spectra for around 200
minerals [36]. In the present study, the USGS
reference spectral libraries are used as a
reference spectrum of the fluorite mineral. The
wavelengths range of the fluorite minerals is
between 0.35 to 2.97 μm with sample ID
(WS416) of USGS spectral libraries. By
dividing one reflectance band by another, this
band ratio has been extracted by tracing the
fluorite mineral curves to identify the
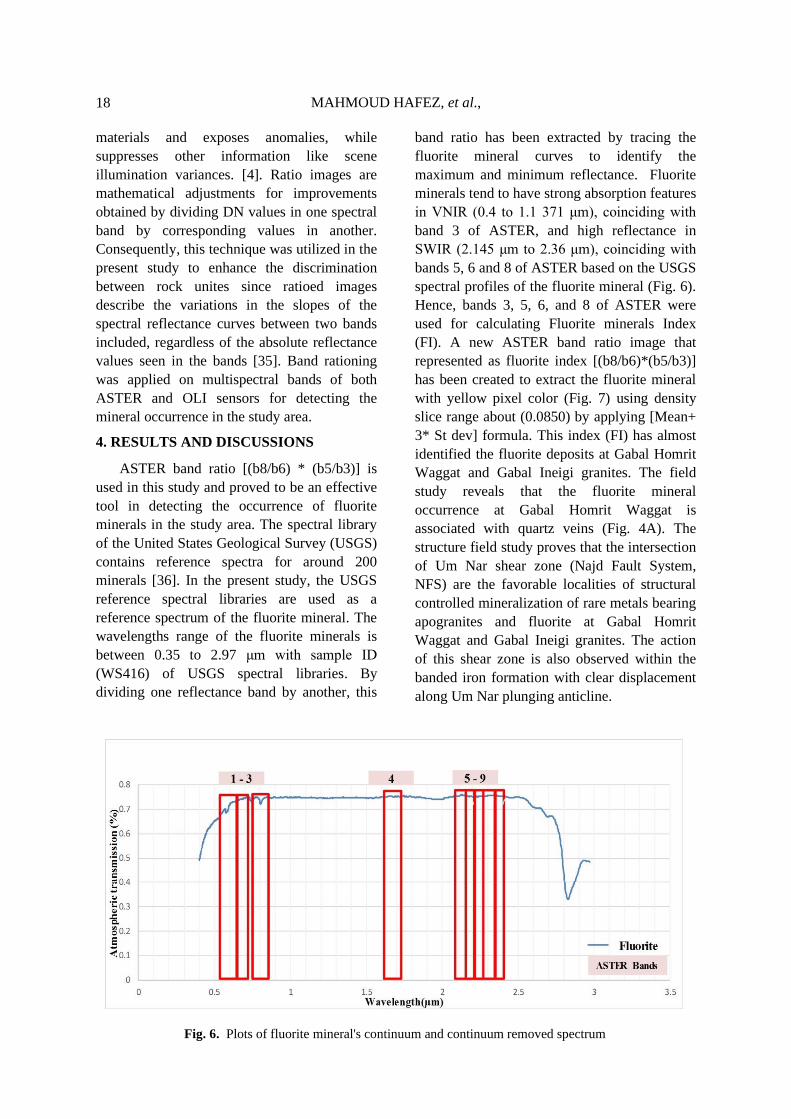
maximum and minimum reflectance. Fluorite
minerals tend to have strong absorption features
in VNIR (0.4 to 1.1 371 μm), coinciding with
band 3 of ASTER, and high reflectance in
SWIR (2.145 μm to 2.36 μm), coinciding with
bands 5, 6 and 8 of ASTER based on the USGS
spectral profiles of the fluorite mineral (Fig. 6).
Hence, bands 3, 5, 6, and 8 of ASTER were
used for calculating Fluorite minerals Index
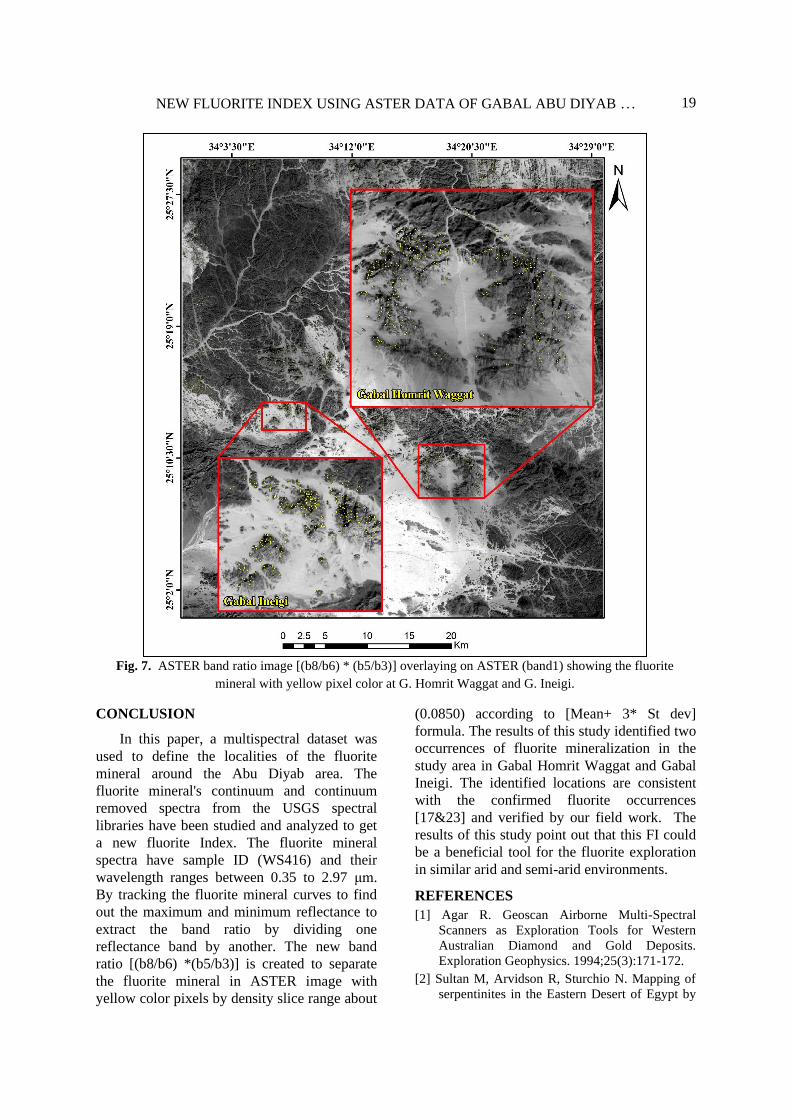
(FI). A new ASTER band ratio image that
represented as fluorite index [(b8/b6)*(b5/b3)]
has been created to extract the fluorite mineral
with yellow pixel color (Fig. 7) using density
slice range about (0.0850) by applying [Mean+
3* St dev] formula. This index (FI) has almost
identified the fluorite deposits at Gabal Homrit
Waggat and Gabal Ineigi granites. The field
study reveals that the fluorite mineral
occurrence at Gabal Homrit Waggat is
associated with quartz veins (Fig. 4A). The
structure field study proves that the intersection
of Um Nar shear zone (Najd Fault System,
NFS) are the favorable localities of structural
controlled mineralization of rare metals bearing
apogranites and fluorite at Gabal Homrit
Waggat and Gabal Ineigi granites. The action
of this shear zone is also observed within the
banded iron formation with clear displacement
along Um Nar plunging anticline.
Fig. 6. Plots of fluorite mineral's continuum and continuum removed spectrum
NEW FLUORITE INDEX USING ASTER DATA OF GABAL ABU DIYAB …
19
CONCLUSION
In this paper, a multispectral dataset was
used to define the localities of the fluorite
mineral around the Abu Diyab area. The
fluorite mineral's continuum and continuum
removed spectra from the USGS spectral
libraries have been studied and analyzed to get
a new fluorite Index. The fluorite mineral
spectra have sample ID (WS416) and their
wavelength ranges between 0.35 to 2.97 μm.
By tracking the fluorite mineral curves to find
out the maximum and minimum reflectance to
extract the band ratio by dividing one
reflectance band by another. The new band
ratio [(b8/b6) *(b5/b3)] is created to separate
the fluorite mineral in ASTER image with
yellow color pixels by density slice range about
(0.0850) according to [Mean+ 3* St dev]
formula. The results of this study identified two
occurrences of fluorite mineralization in the
study area in Gabal Homrit Waggat and Gabal
Ineigi. The identified locations are consistent
with the confirmed fluorite occurrences
[17&23] and verified by our field work. The
results of this study point out that this FI could
be a beneficial tool for the fluorite exploration
in similar arid and semi-arid environments.
REFERENCES
[1] Agar R. Geoscan Airborne Multi-Spectral
Scanners as Exploration Tools for Western
Australian Diamond and Gold Deposits.
Exploration Geophysics. 1994;25(3):171-172.
[2] Sultan M, Arvidson R, Sturchio N. Mapping of
serpentinites in the Eastern Desert of Egypt by
Fig. 7. ASTER band ratio image [(b8/b6) * (b5/b3)] overlaying on ASTER (band1) showing the fluorite
mineral with yellow pixel color at G. Homrit Waggat and G. Ineigi.
MAHMOUD HAFEZ, et al.,
20
using Landsat thematic mapper data. Geology.
1986;14(12):995.
[3] Oppenheimer C. SABINS, F. F. 1997. Remote
Sensing. Principles and Interpretation, 3rd ed.
xiii + 494 pp. New York: W. H. Freeman & Co.
Price £32.95 (hard covers). ISBN 0 7167 2442
1. Geological Magazine. 1998;135(1):143-158.
[4] Sabins F. Remote sensing for mineral
exploration. Ore Geology Reviews. 1999;14(3-
4):157-183.
[5] Abdelsalam M, Stern R, Berhane W. Mapping
gossans in arid regions with Landsat TM and
SIR-C images: the Beddaho Alteration Zone in
northern Eritrea. Journal of African Earth
Sciences. 2000;30(4):903-916.
[6] Ramadan T, Abdelsalam M, Stern R, Mapping
gold-bearing massive sulfide deposits in the
Neoproterozoic Allaqi suture, SE Egypt with
Landsat TM and SIR-C/X-SAR images. Journal
of Photogrammetric Engineering and Remote
Sensing. 2001;67(2): 491–497.
[7] Kusky T, Ramadan T. Structural controls on
Neoproterozoic mineralization in the South
Eastern Desert, Egypt: an integrated field,
Landsat TM, and SIR-C/X SAR approach.
Journal of African Earth Sciences.
2002;35(1):107-121.
[8] LIU F, WU X, SUN H, GUO Y. Alteration
Information Extraction by Applying Synthesis
Processing Techniques to Landsat ETM+ Data:
Case Study of Zhaoyuan Gold Mines, Shandong
Province, China. Journal of China University of
Geosciences. 2007;18(1):72-76.
[9] Crósta A, Moore M. Enhancement of Landsat
Thematic Mapper imagery for residual soil
mapping in SW Minas Gerais State Brazil: a
prospecting case history in greenstone belt
terrain. 9th Thematic Conference on Remote
Sensing for Exploration Geology,
Environmental Research Institute of Michigan,
Ann Arbor. 1989;1173–1187.
[10] Loughlin W. Principal component analysis for
alteration mapping. Photogrammetric
Engineering and Remote Sensing. 1991;57(3),
1163–1169.
[11] Rokos D, Argialas D, Mavrantza R, Seymour
K, Vamvoukakis C, Kouli M, Lamera S,
Paraskevas H, Karfakis I, Denes G. Structural
mapping and analysis for a preliminary
investigation of possible gold mineralization by
using remote sensing and geochemical
techniques in a GIS environment: study area:
island of Lesvos, Aegean Sea, Hellas. Natural
Resources Research. 2000; 9(1), 277–293.
[12] Ferrier G, White K, Griffiths G, Bryant R. The
mapping of hydrothermal alteration zones on
the island of Lesvos, Greece using an integrated
remote sensing dataset. International Journal of
Remote Sensing. 2002; 23(2), 341–356.
[13] Crósta A, De Souza Filho C, Azevedo F,
Brodie C. Targeting key alteration minerals in
epithermal deposits in Patagonia, Argentina,
using ASTER imagery and principal component
analysis. International Journal of Remote
Sensing. 2003;24(21):4233-4240.
[14] Ninomiya Y, Fu B, Cudahy T. Detecting
lithology with Advanced Spaceborne Thermal
Emission and Reflection Radiometer (ASTER)
multispectral thermal infrared “radiance-at-
sensor” data. Remote Sensing of Environment.
2005;99(1-2):127-139.
[15] Gad S, Kusky T. Lithological mapping in the
Eastern Desert of Egypt, the Barramiya area,
using Landsat thematic mapper (TM). Journal
of African Earth Sciences. 2006;44(2):196-202.
[16] Gad S, Kusky T. ASTER spectral ratioing for
lithological mapping in the Arabian–Nubian
shield, the Neoproterozoic Wadi Kid area,
Sinai, Egypt. Gondwana Research.
2007;11(3):326-335.
[17] Shalaby I, Rossman D, Tabarak D, Emam I.
Geologic map of Aswan quadrangle, Egypt.
Egyptian Geological Survey and Mining
Authority. 1983.
[18] El-Manharawy M. Geochronological
investigations of some basement rocks in the
Central Eastern Desert, Egypt, between
latitudes 25”-26” N. Ph.D. dissertation, Cairo
University, Cairo, Egypt. 1977:220.
[19] Sabet A, Tsogoev V, Baburin L, Raid A,
Zakhari A, Armanius L. Geologic structure and
laws of localization of tantalum mineral
zonation at the Nuweibi deposit. Ann Geol Surv
Egypt VI. 1976; 69(1):119–156.
[20] Salem I, Abdel-Moneum A, Shazly A, El-
Shibiny N. Mineralogy and geochemistry of
Gabal El-Ineigi Granite and associated fluorite
veins, Central Eastern Desert, Egypt:
application of fluid inclusions to fluorite
genesis. Journal of African Earth Sciences.
2001;32(1):29-45.
[21] Mohamed F, El-Sayed M. Post-orogenic and
anorogenic A-type fluorite-bearing granitoids,
Eastern Desert, Egypt: Petrogenetic and
geotectonic implications. Geochemistry.
2008;68(4):431-450.
[22] Moghazi A. Magma source and evolution of
Late Neoproterozoic granitoids in the Gabal El-
Urf area, Eastern Desert, Egypt: geochemical
and Sr–Nd isotopic constraints. Geological
Magazine. 1999;136(3):285-300.

NEW FLUORITE INDEX USING ASTER DATA OF GABAL ABU DIYAB …
21
[23] Abd EL Nabi A, Abd El Karim R, Abu El Leil
I, Awad G, Babourin L, Bagadaev E,
Bessonenko V, El-Badri H, El Kadi M, Gabra
S, Khalaf I, Kosa M, Kouznetsov D,
Kouznetsov V, Semyonov V, Spiridenov V,
Vitkovsky I, Zalata A, Zhukov M. Geologic
map of the basement rocks of Jabal Um Ghayj
quadrangle, Egypt. 1989.
[24] Moustafa G, Kabesh M, Abdalla A. Geology of
Gebel El-lneigi District. Geological Survey,
Cairo, Egypt. 1954; 40(1):39-43.
[25] Moharram O, El-Ramly M, Amer A,
Gachechiladze D, Ivanov S. Studies on some
mineral deposits of Egypt. Annals Egyptian
Geological Survey. 1970: 260.
[26] Heikal M. Petrographical and petrochemical
studies of G. El-lneigi granitic rocks. Ph.D.
dissertation, Faculty of Science, Cairo
University, Egypt. 1973: 176.
[27] Fasfous B, Awad N. Mineralization and
petrochemical features of El-lneigi fluorite
deposit, Eastern Desert, Egypt. Bulletin
National Research Center Egypt. 1985;
10(2):299-313.
[28] Yonan A. Mineralogical, petrochemical and
geochemical studies on granites hosting fluorite
mineralization in the Eastern Desert of Egypt.
Ph.D. dissertation, Ain Shams University,
Cairo, Egypt. 1990:246.
[29] El-Shibiny N. Petrological and geochemical
studies on the mineralization in selected granitic
plutons in the Idfu-Mersa Alam District,
Eastern Desert, Egypt. Ph.D. dissertation, Tanta
University, Tanta, Egypt. 1995:376.
[30] Plimmer F. Land Administration for
Sustainable Development20111Ian Williamson,
Stig Enemark, Jude Wallace and Abbas
Rajabifard. Land Administration for Sustainable
Development. Redlands, CA: ESRI Press
Academic, ISBN: 978-1-58948-041-4. Property
Management. 2011;29(3):324-324.
[31] Young N, Anderson R, Chignell S, Vorster A,
Lawrence R, Evangelista P. A survival guide to
Landsat preprocessing. Ecology.
2017;98(4):920-932.
[32] Sundaresan S, Fischhoff I, Dushoff J,
Rubenstein D. Network metrics reveal
differences in social organization between two
fission–fusion species, Grevy’s zebra and
onager. Oecologia. 2006;151(1):140-149.
[33] Zoheir B, Emam A, Abd El-Wahed M, Soliman
N. Gold endowment in the evolution of the
Allaqi-Heiani suture, Egypt: A synthesis of
geological, structural, and space-borne imagery
data. Ore Geology Reviews. 2019; 110:102938.
[34] Cooley T, Anderson G, Felde G, Hoke M,
Ratkowski A, Chetwynd J, Gardner J, Adler-
Golden S, Matthew M, Berk A, Bernstein L,
Acharya P, Miller D, Lewis P. FLAASH, a
MODTRAN4-based atmospheric correction
algorithm, its application and validation. IEEE
International Geoscience and Remote Sensing
Symposium. 2002; 3(1):1414-1418.
[35] Denniss A. T. M. Lillesand, & R. W. Kiefer,
1994. Remote Sensing and Image
Interpretation, 3rd ed. xvi + 750 pp. New York,
Chichester, Brisbane, Toronto, Singapore: John
Wiley & Sons. Price £67.00 (hard covers),
£19.95 (paperback). ISBN 0 471 30575 8 (pb).
Geological Magazine. 1995;132(2):248-249.
[36] Clark R, Swayze G, Wise R, Livo E, Hoefen T,
Kokaly R, Sutley S. USGS digital spectral
library splib06a: U.S. Geological Survey,
Digital Data Series. 2007; 231.
جديد الستكشاف الفلوريت باستخدام مؤشر معادن
بيانات األستر لمنطقة جبل أبو دياب ، وسط
الصحراء الشرقية ، مصر
، (2)، نهال سليمان (1)، إبراهيم أبو الليل (1) محمود حافظ
( 1) مصطفى أبو بكر
القاهرة –جامعة االزهر – العلوم كلية –. قسم الجيولوجيا 1
مصر –
الهيئة القومية لالستشعار من البعد –. قسم الجيولوجيا 2
مصر -القاهرة –وعلوم الفضاء
: الملخصاستكشاف في جدا هام دور يلعب بعد عن االستشعار
المعادن. أحد تطبيقاته المؤكدة هو استخراج وتحديد تواجد
الق المناطق شبه إلىالمعادن في القاحلة. تم استخدام احلة
الحراري واالنبعاث االنعكاسي اإلشعاع مقياس صور
األستر ) الفضاء في معالجة ASTERالمتقدم تقنية مع )
حول الفلوريت معدن وجود عن للكشف النطاق نسبة
منطقة جبل أبو دياب ، وسط الصحراء الشرقية ، مصر.
المشتقة المقترحة النطاق نسبة اعتبار صور يمكن من
مؤشر [(b5 / b3) * (b8 / b6)]ستر ألا لتمثيل
( الجديد المساحة FIالفلوريت هيئة مكتبة استخدام تم .)
المعادن (USGS Spectral) االمريكية لطيف
باستخدام صحته من والتحقق الجديد المؤشر الستخراج
( جنبًا FIالدراسة الميدانية. وفقًا لمؤشر الفلوريت الجديد )
المالحظات مع جنب تح إلى تم ، تواجدين الميدانية ديد
لتمعدن الفلوريت في جبل حمريت واجات وجبل عنيجى.
كأداة المقترح الجديد الفلوريت مؤشر الدراسة هذه تقدم
الفلوريت التي يمكن تطبيقها على طول مفيدة الستكشاف
القاحلة وشبه القاحلة والبيئات النوبي العربي الدرع
المماثلة.