Effect of modified starch on separation of fluorite from barite ...
10
http://dx.doi.org/10.5277/ppmp1806 Physicochem. Probl. Miner. Process., 54(2), 2018, 228-237 Physicochemical Problems of Mineral Processing http://www.journalssystem.com/ppmp ISSN 1643-1049 © Wroclaw University of Science and Technology Received March 28, 2017; reviewed; accepted June 03, 2017 Effect of modified starch on separation of fluorite from barite using sodium oleate Zhijie Chen 1 , Zijie Ren 1, 2 , Huimin Gao 1, 2 , Yupeng Qian 1, 2 , Renji Zheng 1 1 Wuhan University of Technology, School of Resources and Environmental Engineering, Wuhan 430070, China 2 Hubei Key Laboratory of Mineral Resources Processing & Environment, Wuhan 430070, China Corresponding author: [email protected] (Zijie Ren) Abstract: In this study, a modified starch was utilized to selectively separate barite from fluorite. The results of flotation tests showed that highly selective separation of fluorite from barite was obtained when 250 mg/dm 3 of modified starch and 13.16×10 −5 mol/dm 3 sodium oleate was used in neutral solutions. FTIR spectra results showed that the modified starch can adsorb on the fluorite and barite surfaces. Zeta potential analyses indicated that the modified starch had little effect on adsorption of sodium oleate on the fluorite surface, although it interfered with the adsorption of sodium oleate on the barite surface. Contact angle measurements results corresponded well with the flotation results. Keywords: fluorite, barite, modified starch, flotation 1. Introduction Fluorite is in high demand nowadays as the primary resource of fluorine in chemical manufacturing, glass industry and ceramic industry (Gao et al., 2016). In addition, most of fluorite ore deposits are composed of multiple substances and are hard to treat. Thus, achieving fluorite of high-grade purity is an urgent task in mineral processing. Fluorite mineral is closely associated with barite, and needs to be distinguished from barite through beneficiation. Separation of fluorite from barite has been extensively explored over the past years in China (Bi et al., 2015; Yu, 2015), with the results having suggested that flotation is the most efficient means. However, separation by flotation is problematic, because of their similar responses to collectors (Hu et al., 2003), which makes it imperative to find a suitable inhibitor scheme. Among common inhibitors, starch distinguishes itself primarily for its high abundance, ready availability, low cost and environmental friendliness (Li et al., 2010). Nevertheless, starch cannot selectively depress barite in the presence of fluorite, according to the preceding flotation results (Hanna, 1974; Bi at al., 2015). Hence, it is worth further developing starch to improve its separation efficiency. It was noted that ferric salt (Fe 3+ ) can heighten the floatability of fluorite (Zhang et al., 2015) and barite (Lu, 2010) using sodium oleate as a collector. Zhang et al. (2015) examined the activation mechanism of Fe 3+ in fluorite flotation and the results showed that iron hydroxide (Fe(OH)3) was the major active component in flotation in the appropriate pH range (pH 6-8). Lu (2010) found that Fe 3+ activated barite through generation of hydroxylated complex or hydroxide sediments on the barite surface. However, the regulation degree of ferric salt on the floatability of fluorite and barite is different (Yu, 2015). From this perspective, ferric salt may be a selective activator in separation of fluorite and barite. In this study, starch was modified with a ferric salt, with the subsequent modified starch (MS), and then evaluated with single mineral flotation tests and binary mixed mineral flotation tests. The depression mechanism has been investigated by FTIR spectra analyses, zeta potential measurements and contact angle measurements.
-
Upload
khangminh22 -
Category
Documents
-
view
0 -
download
0
Transcript of Effect of modified starch on separation of fluorite from barite ...
http://dx.doi.org/10.5277/ppmp1806
Physicochem. Probl. Miner. Process., 54(2), 2018, 228-237 Physicochemical Problems of Mineral Processing
http://www.journalssystem.com/ppmp ISSN 1643-1049
© Wroclaw University of Science and Technology
Received March 28, 2017; reviewed; accepted June 03, 2017
Effect of modified starch on separation of fluorite from barite using sodium oleate
Zhijie Chen 1, Zijie Ren 1, 2, Huimin Gao 1, 2, Yupeng Qian 1, 2, Renji Zheng 1
1 Wuhan University of Technology, School of Resources and Environmental Engineering, Wuhan 430070, China
2 Hubei Key Laboratory of Mineral Resources Processing & Environment, Wuhan 430070, China
Corresponding author: [email protected] (Zijie Ren)
Abstract: In this study, a modified starch was utilized to selectively separate barite from fluorite. The
results of flotation tests showed that highly selective separation of fluorite from barite was obtained
when 250 mg/dm3 of modified starch and 13.16×10⁻⁵ mol/dm3 sodium oleate was used in neutral
solutions. FTIR spectra results showed that the modified starch can adsorb on the fluorite and barite
surfaces. Zeta potential analyses indicated that the modified starch had little effect on adsorption of
sodium oleate on the fluorite surface, although it interfered with the adsorption of sodium oleate on
the barite surface. Contact angle measurements results corresponded well with the flotation results.
Keywords: fluorite, barite, modified starch, flotation
1. Introduction
Fluorite is in high demand nowadays as the primary resource of fluorine in chemical manufacturing,
glass industry and ceramic industry (Gao et al., 2016). In addition, most of fluorite ore deposits are
composed of multiple substances and are hard to treat. Thus, achieving fluorite of high-grade purity is
an urgent task in mineral processing.
Fluorite mineral is closely associated with barite, and needs to be distinguished from barite
through beneficiation. Separation of fluorite from barite has been extensively explored over the past
years in China (Bi et al., 2015; Yu, 2015), with the results having suggested that flotation is the most
efficient means. However, separation by flotation is problematic, because of their similar responses to
collectors (Hu et al., 2003), which makes it imperative to find a suitable inhibitor scheme. Among
common inhibitors, starch distinguishes itself primarily for its high abundance, ready availability, low
cost and environmental friendliness (Li et al., 2010). Nevertheless, starch cannot selectively depress
barite in the presence of fluorite, according to the preceding flotation results (Hanna, 1974; Bi at al.,
2015). Hence, it is worth further developing starch to improve its separation efficiency.
It was noted that ferric salt (Fe3+) can heighten the floatability of fluorite (Zhang et al., 2015) and
barite (Lu, 2010) using sodium oleate as a collector. Zhang et al. (2015) examined the activation
mechanism of Fe3+ in fluorite flotation and the results showed that iron hydroxide (Fe(OH)3) was the
major active component in flotation in the appropriate pH range (pH 6-8). Lu (2010) found that Fe3+
activated barite through generation of hydroxylated complex or hydroxide sediments on the barite
surface. However, the regulation degree of ferric salt on the floatability of fluorite and barite is
different (Yu, 2015). From this perspective, ferric salt may be a selective activator in separation of
fluorite and barite.
In this study, starch was modified with a ferric salt, with the subsequent modified starch (MS), and
then evaluated with single mineral flotation tests and binary mixed mineral flotation tests. The
depression mechanism has been investigated by FTIR spectra analyses, zeta potential measurements
and contact angle measurements.
Physicochem. Probl. Miner. Process., 54(2), 2018, 228-237 229
2. Experimental
2.1 Minerals and reagents
Hand-picked fluorite and barite samples were collected from Chongqing, China. The purities of
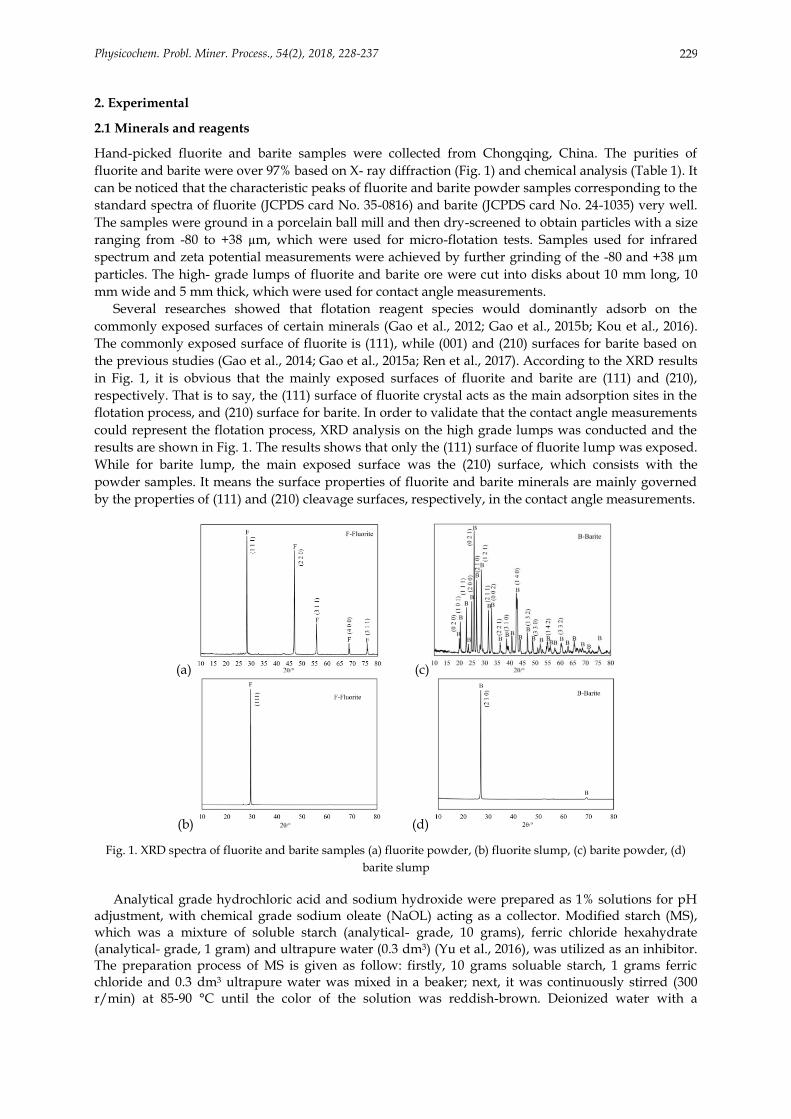
fluorite and barite were over 97% based on X- ray diffraction (Fig. 1) and chemical analysis (Table 1). It
can be noticed that the characteristic peaks of fluorite and barite powder samples corresponding to the
standard spectra of fluorite (JCPDS card No. 35-0816) and barite (JCPDS card No. 24-1035) very well.
The samples were ground in a porcelain ball mill and then dry-screened to obtain particles with a size
ranging from -80 to +38 µm, which were used for micro-flotation tests. Samples used for infrared
spectrum and zeta potential measurements were achieved by further grinding of the -80 and +38 µm
particles. The high- grade lumps of fluorite and barite ore were cut into disks about 10 mm long, 10
mm wide and 5 mm thick, which were used for contact angle measurements.
Several researches showed that flotation reagent species would dominantly adsorb on the
commonly exposed surfaces of certain minerals (Gao et al., 2012; Gao et al., 2015b; Kou et al., 2016).
The commonly exposed surface of fluorite is (111), while (001) and (210) surfaces for barite based on
the previous studies (Gao et al., 2014; Gao et al., 2015a; Ren et al., 2017). According to the XRD results
in Fig. 1, it is obvious that the mainly exposed surfaces of fluorite and barite are (111) and (210),
respectively. That is to say, the (111) surface of fluorite crystal acts as the main adsorption sites in the
flotation process, and (210) surface for barite. In order to validate that the contact angle measurements
could represent the flotation process, XRD analysis on the high grade lumps was conducted and the
results are shown in Fig. 1. The results shows that only the (111) surface of fluorite lump was exposed.
While for barite lump, the main exposed surface was the (210) surface, which consists with the
powder samples. It means the surface properties of fluorite and barite minerals are mainly governed
by the properties of (111) and (210) cleavage surfaces, respectively, in the contact angle measurements.
(a) (c)
(b) (d)
Fig. 1. XRD spectra of fluorite and barite samples (a) fluorite powder, (b) fluorite slump, (c) barite powder, (d)
barite slump
Analytical grade hydrochloric acid and sodium hydroxide were prepared as 1% solutions for pH adjustment, with chemical grade sodium oleate (NaOL) acting as a collector. Modified starch (MS), which was a mixture of soluble starch (analytical- grade, 10 grams), ferric chloride hexahydrate (analytical- grade, 1 gram) and ultrapure water (0.3 dm3) (Yu et al., 2016), was utilized as an inhibitor. The preparation process of MS is given as follow: firstly, 10 grams soluable starch, 1 grams ferric chloride and 0.3 dm3 ultrapure water was mixed in a beaker; next, it was continuously stirred (300 r/min) at 85-90 °C until the color of the solution was reddish-brown. Deionized water with a

Physicochem. Probl. Miner. Process., 54(2), 2018, 228-237 230
resistivity value of 18.25 MΩ·cm was used throughout the experiments and spectroscopic-grade KBr was applied in FTIR spectra measurement.
Table 1. Chemical composition of fluorite and barite powder samples (%)
Mineral SO3 CaO Cl BaO MgO Al2O3 SiO2 CeO F Na2O LOI
Fluorite 0.19 50.78 0.09 0.24 0.04 0.01 0.22 0.05 47.59 - 0.79
Barite 33.63 1.34 0.02 64.18 0.13 0.01 0.19 - 0.02 0.18 0.30
*Loss-on-ignition
2.2 Microflotation tests
The microflotation tests were conducted with a RK/ FGC- 35 flotation machine. The particles (2.0
g) were placed into a Plexiglas cell, which was then filled with a certain amount of deionized water.
The pulp was continuously stirred at 1600 rpm for 2 min using a pH regulator and 2 min with the
depressant, before the collector was introduced and the pulp was conditioned for 2 min. During these
steps, temperature was controlled to be about 20 ± 2 °C. The pH of the slurry was monitored before
flotation, followed by flotation for 5 min. For single mineral flotation, the floated and tailing fractions
were collected separately and dried, before being weighed for calculation. For artificially mixed
minerals flotation, the concentrates and tailings were assayed (Chinese standards GB/T 5195.1-2006)
to acquire the grades of fluorite and barite, before calculated the recovered amount.
2.3 FT-IR spectra
The infrared spectra were recorded by NEXUS Fourier transform infrared spectrometer of Thermo
Nicolet Company in the 4000- 500 cm−l region through KBr disks. 2.0 g of mineral samples were mixed
with a certain amount of deionized water and reagents corresponding to the flotation test. After that,
the suspension was stirred for 10 min, and then settled for 10 min. Later, the solution was filtered. The
treated sample was first dried in a vacuum desiccator at room temperature, before a tiny amount of
the dried powder was used for FTIR measurement.
2.4 Zeta potential measurements
Zeta potential were measured by 90 Plus Zeta Size Analyzer (Brookhaven Instruments Corporation,
USA). The particle size of the ground powder was finer than 2 μm (D98=1.864 μm, detected by BT-
9300S laser particle size distribution instrument) for zeta potential measurement tests. The
suspensions (0.1% mass fraction) with 1.00× 10⁻³ mol/dm3 KCl solution were dispersed in a beaker,
before being magnetically stirred for 10 min with and without flotation reagents at various pH values.
After 5 min, the supernatant was obtained for zeta potential measurements. Each sample was
measured three times and the mean values were reported.
2.5 Contact angle measurements
Contact angles were measured by a JC2000C1 contact angle goniometer (Shanghai Powereach Digital
Technology Equipment Co. Ltd.) using the sessile drop method. Before every single measurement, the
mineral disks were polished by metallographic sandpaper, and then washed with deionized water.
The prepared mineral blocks were conditioned with the same flotation reagent regime as the flotation
tests. After this, they were air-dried and tested. For each sample, five drops were measured and the
average value was determined.
3. Results and discussion
3.1 Flotation results of single mineral
3.1.1 Flotation of fluorite and barite without MS
The effect of pH on the flotation behavior of fluorite and barite is illustrated in Fig. 2. The results
stated that the recoveries of both fluorite and barite increased drastically when pH was increased from
3 to 5, with there still being relatively high levels in recoveries of two minerals in the pH range of 7-
11. Beyond this pH range, recovery curves of both fluorite and barite decreased slightly. The

Physicochem. Probl. Miner. Process., 54(2), 2018, 228-237 231
maximum recovery of fluorite (92.35%) was reached at a pH of 8, while that of barite (91.94%)
occurred at a pH of 9. As observed, fluorite showed a similar flotation response to barite in the pH
range of 5- 13.
The flotation response of fluorite and barite as a function of sodium oleate dosage is plotted in Fig.
3. An increase in the sodium oleate concentration had a positive influence on the recoveries of both
fluorite and barite when the pH was fixed at 7. The recoveries of both fluorite and barite increased
rapidly when the sodium oleate concentration was increased from 3.29×10⁻⁵ to 13.16×10⁻⁵ mol/dm3,
reaching the maximum of 94.32 and 91.14%, respectively. With a further increase in the sodium oleate
dosage, the recoveries of both fluorite and barite remained stable.
Fig. 2. Effect of pH on recovery of fluorite and barite in
the absence of MS (cNaOL= 1×10⁻⁴ mol/dm3)
Fig. 3. Effect of NaOL dosage on recovery of fluorite
and barite in the absence of MS (pH= 7)
According to the above results, it is apparent that the flotation recovery curves of fluorite and
barite seem to be parallel in most cases. Thus, it is hard to separate fluorite from barite using sodium
oleate as a collector without an inhibitor.
3.1.2 Flotation of fluorite and barite with MS
The flotation response of fluorite and barite in the presence of MS with different concentrations was
considered, and the results are presented in Fig. 4. Fig. 4 clearly illustrates that the usage of MS had a
marked inhibition on barite while having negligible effect on the fluorite recovery.
(a) (b)
Fig. 4 Effect of MS on flotation recovery of fluorite (a) and barite (b) with different concentration (cNaOL=
13.16×10⁻⁵ mol/dm3)
For fluorite (Fig. 4a), the flotation recovery decreased slightly as the concentration of MS increased
from 0 to 250.0 mg/dm3, whereas in the case of barite (Fig. 4b), there was a noticeable reduction. MS
was able to reduce the recovery of barite dramatically in the pH range of 3- 11, especially when the
consumption exceeded 50.0 mg/dm3. The recovery of barite was less than 10% with 250.0 mg/dm3 of
MS in the pH region of 5 to 11. In the presence of 250 mg/dm3 of MS at a pH of 7, the recoveries of
fluorite and barite were 88.59 and 4.92%, respectively. It may be a suitable strategy to separate fluorite
from barite.
Physicochem. Probl. Miner. Process., 54(2), 2018, 228-237 232
3.2 Flotation of artificial mixed minerals
Flotation tests on artificially mixed minerals of fluorite (1.0 g) and barite (1.0 g) were conducted to test
MS and the results are summarized in Table 2. It was clearly seen that the concentrate contained
89.07% fluorite with a low barite contaminations, with the recovery of fluorite being 84.62% while that
of barite was 10.38%. In the tailing, the recovery of barite was 89.62% with a grade of 85.35%.
Obviously, the effectual separation of fluorite from barite is possible using MS as a depressant.
Table 2. Flotation results on artificial mixed minerals with the reagent scheme of MS (250 mg/dm3) + NaOL
(13.16×10⁻⁵ mol/dm3) at pH 7
Product Yield, % Grade, % Recovery, %
Fluorite Barite Fluorite Barite
Concentrate 47.5 89.07 10.93 84.62 10.38
Tailing 52.5 14.65 85.35 15.38 89.62
Total 100.00 50.00 50.00 100.00 100.00
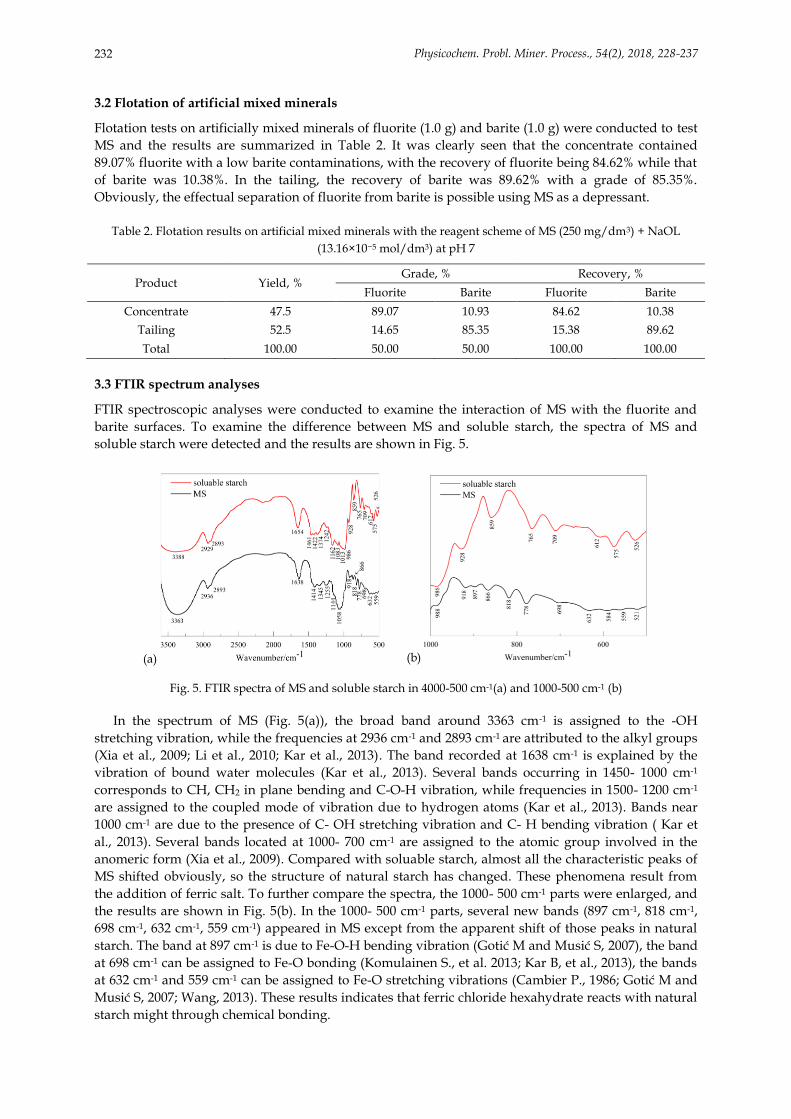
3.3 FTIR spectrum analyses
FTIR spectroscopic analyses were conducted to examine the interaction of MS with the fluorite and
barite surfaces. To examine the difference between MS and soluble starch, the spectra of MS and
soluble starch were detected and the results are shown in Fig. 5.
(a) (b)
Fig. 5. FTIR spectra of MS and soluble starch in 4000-500 cm-1(a) and 1000-500 cm-1 (b)
In the spectrum of MS (Fig. 5(a)), the broad band around 3363 cm-1 is assigned to the -OH
stretching vibration, while the frequencies at 2936 cm-1 and 2893 cm-1 are attributed to the alkyl groups
(Xia et al., 2009; Li et al., 2010; Kar et al., 2013). The band recorded at 1638 cm-1 is explained by the
vibration of bound water molecules (Kar et al., 2013). Several bands occurring in 1450- 1000 cm-1
corresponds to CH, CH2 in plane bending and C-O-H vibration, while frequencies in 1500- 1200 cm-1
are assigned to the coupled mode of vibration due to hydrogen atoms (Kar et al., 2013). Bands near
1000 cm-1 are due to the presence of C- OH stretching vibration and C- H bending vibration ( Kar et
al., 2013). Several bands located at 1000- 700 cm-1 are assigned to the atomic group involved in the
anomeric form (Xia et al., 2009). Compared with soluable starch, almost all the characteristic peaks of
MS shifted obviously, so the structure of natural starch has changed. These phenomena result from
the addition of ferric salt. To further compare the spectra, the 1000- 500 cm-1 parts were enlarged, and
the results are shown in Fig. 5(b). In the 1000- 500 cm-1 parts, several new bands (897 cm-1, 818 cm-1,
698 cm-1, 632 cm-1, 559 cm-1) appeared in MS except from the apparent shift of those peaks in natural
starch. The band at 897 cm-1 is due to Fe-O-H bending vibration (Gotić M and Musić S, 2007), the band
at 698 cm-1 can be assigned to Fe-O bonding (Komulainen S., et al. 2013; Kar B, et al., 2013), the bands
at 632 cm-1 and 559 cm-1 can be assigned to Fe-O stretching vibrations (Cambier P., 1986; Gotić M and
Musić S, 2007; Wang, 2013). These results indicates that ferric chloride hexahydrate reacts with natural
starch might through chemical bonding.

Physicochem. Probl. Miner. Process., 54(2), 2018, 228-237 233
The spectra of MS, fluorite and fluorite treated with MS are shown in Fig. 6. After treated with MS,
several new peaks occurred compared with the pure fluorite spectrum. The frequencies at 2925 cm-1,
2844 cm-1, 1385 cm-1 and 930 cm-1 are assigned to alkyl groups in MS, while the peak located at 1025
cm-1 is caused by the presence of C-OH stretching vibration (Kar et al., 2013). The intensity at 1654 cm-
1 is increased and the peak value shifts to 1641 cm-1, demonstrating that MS has strong adsorption on
the fluorite surface. The bands that are due to the -OH characteristic stretching of MS (1345 cm-1, 1638
cm-1 and 3363 cm-1) undergo an obvious shift, revealing the MS-fluorite interaction may occur through
their hydroxyl groups, possibly by forming hydrogen bonds (Li et al., 2010). The frequencies located at
1058 cm-1 (C-H stretching vibration), 1144 cm-1 (C-O, C-H stretching vibration), 1414 cm-1 (CH2
bending vibration, C-O-O stretching vibration), 2893 cm-1 and 2936 cm-1 (CH2, CH3 stretching
vibration) in MS have shifted to 1083 cm-1, 1152 cm-1, 1431 cm-1, 2844 cm-1 and 2925 cm-1, respectively.
This indicates that MS was adsorbed on fluorite surface through chemical bonding (Xu et al., 2013; Xu
et al., 2016). To summarize, the adsorption of MS on fluorite surface occurs via the formation
ofhydrogen bonds and chemical bonding.
Fig. 6. Infrared spectra of fluorite (a), fluorite after
being treated by MS (b) and MS (c)
Fig. 7. Infrared spectra of barite (a), barite after
being treated by MS (b) and MS (c)
The spectra of MS, barite and barite treated with MS are shown in Fig. 7. The characteristic bands
of barite occur at 1181 cm-1, 1084 cm-1, 982 cm-1 and 630 cm-1 and 610 cm-1. Frequencies at 1181 cm-1 and
1084 cm-1 are assigned to the asymmetric stretch vibration of SO42–. Frequency at 982 cm-1 is due to the
symmetric stretch vibration of SO42–. In contrast, frequencies at 632 cm-1 and 610 cm-1 are from the
bending vibrations of SO42– (Wen, 1989). With the adsorption of MS, new bands are observed at 2933
cm-1 and 2883 cm-1, which might be attributedto the alkyl groups in MS, illustrating that MS has
adsorbed on the barite surface. Moreover, several bands in Fig. 7b due to the vibration of OH have an
obvious shift compared with MS, which may be due to the formation of hydrogen bonds between
barite and MS. Similar to Fig. 6, it can be conferred from Fig. 7 that the interaction between MS and
barite surface occurs via the formation of hydrogen bonds and chemical bonding.
3.4 Zeta potential measurements results
To further uncover the selective depression mechanism of MS, zeta potentials of fluorite and barite in
the absence and presence of flotation reagents were measured and the results are depicted in Fig. 8.
Fig. 8 shows that the IEPs (iso-electric points) of pH of 9.7 and pH of 4.6 were obtained for fluorite
and barite, which are in the range of previous reports ( Lu, 2008; Ucar A, 2013; Gao et al., 2015 (a); Gao
et al., 2016; Wang et al., 2016; Ren et al., 2017; Chen et al., 2017). Moreover, both fluorite and barite
exhibited positive potentials at pH values below the IEPs and negative potentials above the IEPs. It
can be seen that NaOL has an obvious effect on the fluorite and barite surfaces. At a pH of 7, a greater
decrease of 52 mV can be observed in Fig. 8a, compared with 31 mV for barite in Fig. 8b. The results
implied that NaOL can have stronger interactions with the fluorite surface than barite surface at a pH
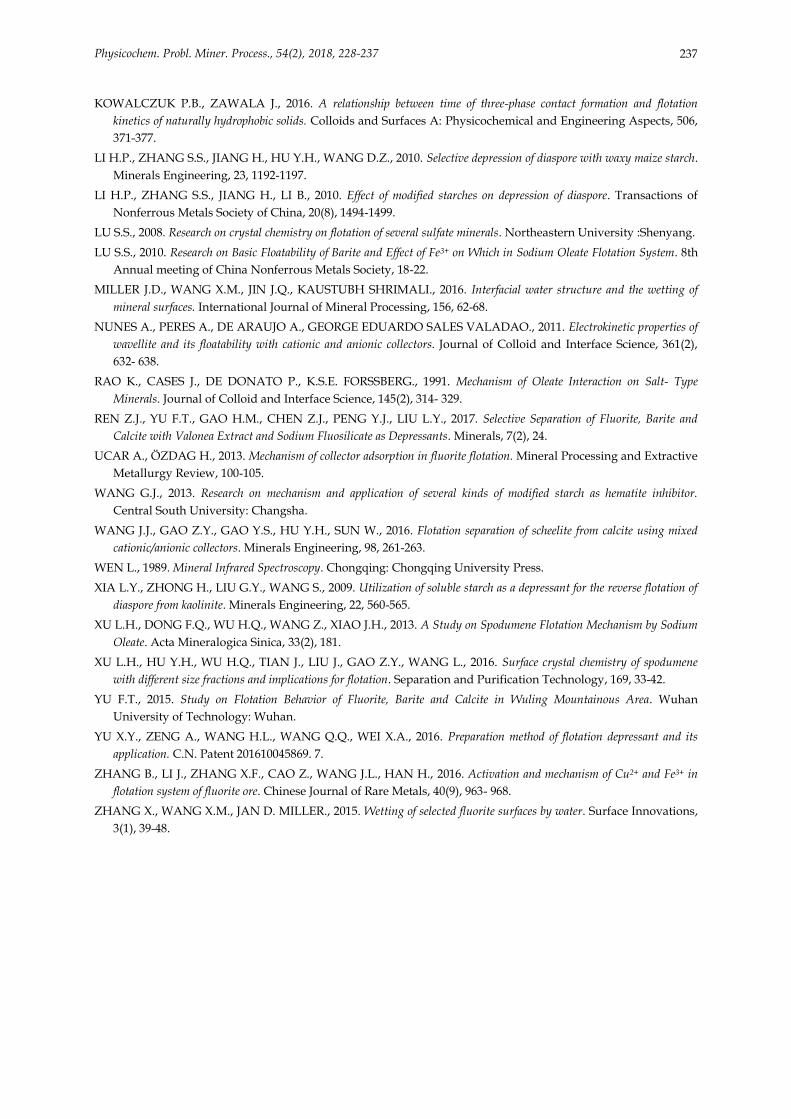
of 7, which is consistent with the flotation results in Fig. 3. The species distribution diagram of oleate
ions is portrayed in Fig. 9. It can be seen that RCOOH(l) is the main component in the pH range 0-8.40.
When the pH is above 8.4, the negatively charged RCOO- and (RCOO)22- are the dominant species.
Physicochem. Probl. Miner. Process., 54(2), 2018, 228-237 234
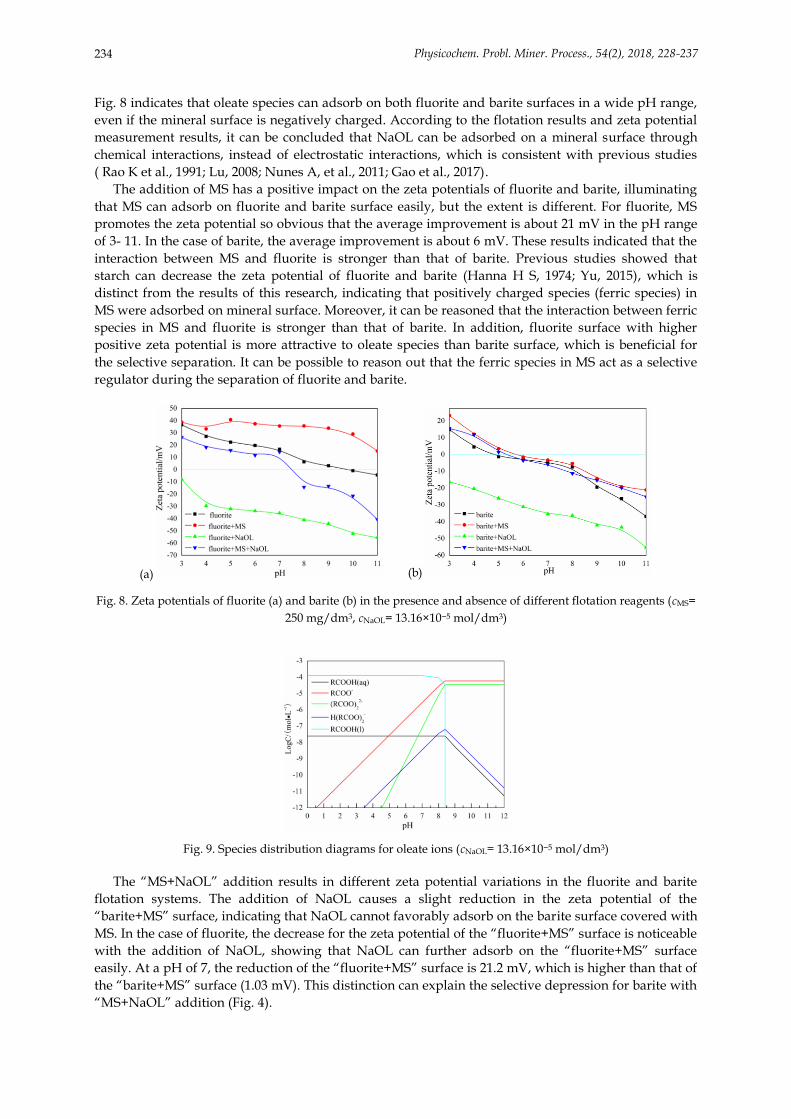
Fig. 8 indicates that oleate species can adsorb on both fluorite and barite surfaces in a wide pH range,
even if the mineral surface is negatively charged. According to the flotation results and zeta potential
measurement results, it can be concluded that NaOL can be adsorbed on a mineral surface through
chemical interactions, instead of electrostatic interactions, which is consistent with previous studies
( Rao K et al., 1991; Lu, 2008; Nunes A, et al., 2011; Gao et al., 2017).
The addition of MS has a positive impact on the zeta potentials of fluorite and barite, illuminating
that MS can adsorb on fluorite and barite surface easily, but the extent is different. For fluorite, MS
promotes the zeta potential so obvious that the average improvement is about 21 mV in the pH range
of 3- 11. In the case of barite, the average improvement is about 6 mV. These results indicated that the
interaction between MS and fluorite is stronger than that of barite. Previous studies showed that
starch can decrease the zeta potential of fluorite and barite (Hanna H S, 1974; Yu, 2015), which is
distinct from the results of this research, indicating that positively charged species (ferric species) in
MS were adsorbed on mineral surface. Moreover, it can be reasoned that the interaction between ferric
species in MS and fluorite is stronger than that of barite. In addition, fluorite surface with higher
positive zeta potential is more attractive to oleate species than barite surface, which is beneficial for
the selective separation. It can be possible to reason out that the ferric species in MS act as a selective
regulator during the separation of fluorite and barite.
(a) (b)
Fig. 8. Zeta potentials of fluorite (a) and barite (b) in the presence and absence of different flotation reagents (cMS=
250 mg/dm3, cNaOL= 13.16×10⁻⁵ mol/dm3)
Fig. 9. Species distribution diagrams for oleate ions (cNaOL= 13.16×10⁻⁵ mol/dm3)
The “MS+NaOL” addition results in different zeta potential variations in the fluorite and barite
flotation systems. The addition of NaOL causes a slight reduction in the zeta potential of the
“barite+MS” surface, indicating that NaOL cannot favorably adsorb on the barite surface covered with
MS. In the case of fluorite, the decrease for the zeta potential of the “fluorite+MS” surface is noticeable
with the addition of NaOL, showing that NaOL can further adsorb on the “fluorite+MS” surface
easily. At a pH of 7, the reduction of the “fluorite+MS” surface is 21.2 mV, which is higher than that of
the “barite+MS” surface (1.03 mV). This distinction can explain the selective depression for barite with
“MS+NaOL” addition (Fig. 4).

Physicochem. Probl. Miner. Process., 54(2), 2018, 228-237 235
To further investige the behaviors of MS, the addition order of MS and collector in the flotation
tests has been changed, and the results are shown in Table 3. It can be noticed that the addition order
of MS and NaOL has little effect on the flotation recovery of fluorite. While for barite, the results are
quite different, adding sodium oleate first followed by MS can lead to a much higher flotation
recovery. The results indicate that MS and NaOL may compete for adsorption on the barite surface.
When MS was added first at pH 7, the inhibitor can adsorb on the negative barite surface (Fig. 8(b)),
leading to exposing abundant hydroxyl on barite surface and hindering the oleate adsorption. The
results also shows that prevent the adsorption of sodium oleate on barite surface is not the only reason
for the selective depression of MS.
Table 3. Flotation results of different reagents order tests. (MS: 250 mg/dm3, NaOL: 13.16×10⁻⁵ mol/dm3 at pH 7)
Reagent schedule Recovery, %
Fluorite + NaOL 92.52
Fluorite + MS + NaOL 88.64
Fluorite + NaOL + MS 89.35
Barite + NaOL 91.16
Barite + MS + NaOL 4.36
Barite + NaOL + MS 52.76
3.5 Contact angle
To further explain the flotation responses of fluorite and barite with MS as a depressant, the wetting
behaviors of sodium oleate and MS on the two mineral surfaces were investigated.
The contact angles were measured and the results are presented in Fig. 10. As shown schematically
in Fig. 10, the contact angles of fluorite and barite were 43° and 38°, respectively, without flotation
reagents. In the presence of 13.16×10⁻⁵ mol/dm3 of sodium oleate, both fluorite and barite showed
strong hydrophobic interactions, with the contact angles of the minerals being 106° and 100°,
respectively. The results are consistent with references (Gao et al., 2012; Zhang et al., 2015; Kowalczuk
and Zawala, 2016; Miller et al., 2016; Kowalczuk et al., 2017). The addition of 250 mg/dm3 of MS
resulted in different surface wettability for fluorite and barite. For fluorite, the influence of MS is
negligible, as the contact angle decreased from 106° to 102°. The result indicated that MS could slightly
reduce the hydrophobicity of fluorite surface. On the other hand, the contact angle of barite decreased
from 100° to 57° in the presence of MS, indicating the barite surface hydrophobicity is significantly
reduced when MS is added in the flotation system. The contact angle measurement results are
consistent with the flotation phenomenon.
Fig. 10. Contact angle of mineral samples at pH 7
4. Conclusions
The modified starch served as a selective depressant in the separation of fluorite from barite. Flotation
tests on a single mineral showed that the modified starch can depress barite selectively. Flotation

Physicochem. Probl. Miner. Process., 54(2), 2018, 228-237 236
results of artificially mixed minerals indicated that the reagent scheme of 250 mg/dm3 of modified
starch and 13.16×10⁻⁵ mol/dm3 of sodium oleate at a pH of 7 could obtain selective separation of
fluorite from barite. The FTIR spectrum study implied that the modified starch might interact with
minerals through forming hydrogen bonds and chemical bonding. Zeta potential analyses revealed
that treating the fluorite and barite with modified starch does not preclude sodium oleate from
absorbing onto the fluorite surface, although it prevents sodium oleate from adsorbing on the barite
surface. The contact angle measurement results are coherent with the flotation results. Therefore, it
can be stated that the modified starch is an appropriate depressant in the selective separation of
fluorite from barite using sodium oleate as a collector.
Acknowledgements
The authors would like to acknowledge the financial support by the National Natural Science Foundation of
China (51504173) and the Fundamental Research Funds for the Central Universities (WUT: 2016IVA048).
References
BI K.J., FANG J.J., JIANG T.G., LI G.D., 2015. Research Status on Flotation Reagents of Barite. Conservation and
Utilization of Mineral Resourses, 4, 57- 61.
CAMBIER P., 1986. Infrared study of goethites of varying crystallinity and particle size: i. interpretation of oh and lattice
vibration frequencies. Clay Minerals, 21(2), 191-200.
CHEN T.X., ZHAO Y.L., SONG S.X., 2017. Electrophoretic mobility study for heterocoagulation of montmorillonite with
fluorite in aqueous solutions. Powder Technology, 309, 61-67.
GAO Z.Y., BAI D., SUN W., CAO X.F., HU Y.H., 2015 (a). Selective flotation of scheelite from calcite and fluorite using a
collector mixture. Minerals Engineering, 72, 23-26.
GAO Z.Y., GAO Y.S., ZHU Y.Y., HU Y.H., SUN W., 2016. Selective Flotation of Calcite from Fluorite: A Novel Reagent
Schedule. Minerals, 6(4), 114.
GAO Z.Y., LI C.W., SUN W., HU Y.H., 2017. Anisotropic surface properties of calcite: A consideration of surface broken
bonds. Colloids and Surfaces A: Physicochemical and Engineering Aspects, 520, 53-61.
GAO Z.Y., SUN W., HU Y.H., 2014. Mineral cleavage nature and surface energy: anisotropic surface broken bonds
consideration. Transactions of Nonferrous Metals Society of China, 24(9), 2930-2937.
GAO Z.Y., SUN W., HU Y.H., 2015 (b). New insights into the dodecylamine adsorption on scheelite and calcite: an
adsorption model. Minerals Engineering, 79, 54-61.
GAO Z.Y., SUN W., HU Y.H., LIU X.W., 2012. Anisotropic surface broken bond properties and wettability of calcite and
fluorite crystals. Transactions of Nonferrous Metals Society of China, 22(5), 1203-1208.
GOTIć M., MUSIć S., 2007. Mössbauer, FT-IR and FE SEM investigation of iron oxides precipitated from FeSO4 solutions.
Journal of Molecular Structure, 834, 445-453.
HANNA H.S., 1974. Adsorption of some starches on spar minerals. In Recent Advances in Science and Technology of
Materials: Springer US, 365- 374.
HU Y.H., CHI R., XU Z.H., 2003. Solution Chemistry Study of Salt- type Mineral Flotation Systems: Role of Inorganic
Dispersants. Industrial & Engineering Chemistry Research, 42, 1641-1647.
KAR B., SAHOO H., RATH S.S., DAS B., 2013. Investigations on different starches as depressants for iron ore flotation.
Minerals Engineering, 49, 1-6.
KOMULAINEN S., PURSIAINEN, J., PERÄMÄKI P., LAJUNEN M., 2013. Complexation of Fe (III) with water-soluble
oxidized starch. Starch-Stärke, 65(3‐4), 338-345.
KOU J., XU S.H., SUN T., SUN C.B., GUO Y., WANG C., 2016. A study of sodium oleate adsorption on Ca2+ activated
quartz surface using quartz crystal microbalance with dissipation. International Journal of Mineral Processing, 154,
24-34.
KOWALCZUK P.B., AKKAYA C., ERGUN M., JANICKI M.J., SAHBAZ O., DRZYMALA J., 2017. Water contact
angle on corresponding surfaces of freshly fractured fluorite, calcite and mica. Physicochem. Probl. Miner. Process,
53(1), 192-201.
Physicochem. Probl. Miner. Process., 54(2), 2018, 228-237 237
KOWALCZUK P.B., ZAWALA J., 2016. A relationship between time of three-phase contact formation and flotation
kinetics of naturally hydrophobic solids. Colloids and Surfaces A: Physicochemical and Engineering Aspects, 506,
371-377.
LI H.P., ZHANG S.S., JIANG H., HU Y.H., WANG D.Z., 2010. Selective depression of diaspore with waxy maize starch.
Minerals Engineering, 23, 1192-1197.
LI H.P., ZHANG S.S., JIANG H., LI B., 2010. Effect of modified starches on depression of diaspore. Transactions of
Nonferrous Metals Society of China, 20(8), 1494-1499.
LU S.S., 2008. Research on crystal chemistry on flotation of several sulfate minerals. Northeastern University :Shenyang.
LU S.S., 2010. Research on Basic Floatability of Barite and Effect of Fe3+ on Which in Sodium Oleate Flotation System. 8th
Annual meeting of China Nonferrous Metals Society, 18-22.
MILLER J.D., WANG X.M., JIN J.Q., KAUSTUBH SHRIMALI., 2016. Interfacial water structure and the wetting of
mineral surfaces. International Journal of Mineral Processing, 156, 62-68.
NUNES A., PERES A., DE ARAUJO A., GEORGE EDUARDO SALES VALADAO., 2011. Electrokinetic properties of
wavellite and its floatability with cationic and anionic collectors. Journal of Colloid and Interface Science, 361(2),
632- 638.
RAO K., CASES J., DE DONATO P., K.S.E. FORSSBERG., 1991. Mechanism of Oleate Interaction on Salt- Type
Minerals. Journal of Colloid and Interface Science, 145(2), 314- 329.
REN Z.J., YU F.T., GAO H.M., CHEN Z.J., PENG Y.J., LIU L.Y., 2017. Selective Separation of Fluorite, Barite and
Calcite with Valonea Extract and Sodium Fluosilicate as Depressants. Minerals, 7(2), 24.
UCAR A., ÖZDAG H., 2013. Mechanism of collector adsorption in fluorite flotation. Mineral Processing and Extractive
Metallurgy Review, 100-105.
WANG G.J., 2013. Research on mechanism and application of several kinds of modified starch as hematite inhibitor.
Central South University: Changsha.
WANG J.J., GAO Z.Y., GAO Y.S., HU Y.H., SUN W., 2016. Flotation separation of scheelite from calcite using mixed
cationic/anionic collectors. Minerals Engineering, 98, 261-263.
WEN L., 1989. Mineral Infrared Spectroscopy. Chongqing: Chongqing University Press.
XIA L.Y., ZHONG H., LIU G.Y., WANG S., 2009. Utilization of soluble starch as a depressant for the reverse flotation of
diaspore from kaolinite. Minerals Engineering, 22, 560-565.
XU L.H., DONG F.Q., WU H.Q., WANG Z., XIAO J.H., 2013. A Study on Spodumene Flotation Mechanism by Sodium
Oleate. Acta Mineralogica Sinica, 33(2), 181.
XU L.H., HU Y.H., WU H.Q., TIAN J., LIU J., GAO Z.Y., WANG L., 2016. Surface crystal chemistry of spodumene
with different size fractions and implications for flotation. Separation and Purification Technology, 169, 33-42.
YU F.T., 2015. Study on Flotation Behavior of Fluorite, Barite and Calcite in Wuling Mountainous Area. Wuhan
University of Technology: Wuhan.
YU X.Y., ZENG A., WANG H.L., WANG Q.Q., WEI X.A., 2016. Preparation method of flotation depressant and its
application. C.N. Patent 201610045869. 7.
ZHANG B., LI J., ZHANG X.F., CAO Z., WANG J.L., HAN H., 2016. Activation and mechanism of Cu2+ and Fe3+ in
flotation system of fluorite ore. Chinese Journal of Rare Metals, 40(9), 963- 968.
ZHANG X., WANG X.M., JAN D. MILLER., 2015. Wetting of selected fluorite surfaces by water. Surface Innovations,
3(1), 39-48.