new fluorite index using aster data of gabal abu diyab area ...

at SciVerse ScienceDirect
Radiation Measurements xxx (2012) 1e7
Contents lists available
Radiation Measurements
journal homepage: www.elsevier .com/locate/radmeas
Effects of annealing and high radiation dose on the thermoluminescencecharacteristics of natural fluorite
Z. Yegingil a,*, N. Nur b, T. Dogan c, N. Yazici d, M. Topaksu e
aCukurova University, ArteSciences Faculty, Physics Department, 01330 Adana, TurkeybAdiyaman University, Vocational School of Adiyaman, 02300 Adiyaman, TurkeycCukurova University, Vocational School of Imamoglu, Department of Computer Technologies, Adana, TurkeydUniversity of Gaziantep, Faculty of Engineering, Department of Engineering Physics, 27310 Gaziantep, TurkeyeAdiyaman University, ArteSciences Faculty, Physics Department, 02040 Adiyaman, Turkey
a r t i c l e i n f o
Article history:Received 31 October 2009Received in revised form4 August 2012Accepted 9 August 2012
Keywords:Thermoluminescence dosimetersNatural CaF2AnnealingSensitivity changeReproducibilityFading
* Corresponding author. Tel.: þ90 5332661635; faxE-mail address: [email protected] (Z. Yegingil).
1350-4487/$ e see front matter � 2012 Elsevier Ltd.http://dx.doi.org/10.1016/j.radmeas.2012.08.001
Please cite this article in press as: Yegingil, Znatural fluorite, Radiation Measurements (2
a b s t r a c t
In this study, the various dosimetric properties of the thermoluminescent (TL) phosphor of CaF2:naturalincluding response characteristics, sensitivity to thermal annealing and decay of stored energy wereinvestigated in detail. The analysis of the peak temperature values and the half widths of the resolvedcomponents in the glow curves, by using the Computerized Glow Curve Deconvolution (CGCD) Method,resulted in the activation energy (E) of 0.85e1.83 eV and frequency factor (s) of 6.17Eþ9e2.90Eþ15 s�1.The effects of pre-irradiation thermal annealing on the radiation-induced sensitization of the thermo-luminescent response of CaF2:natural were presented. An enhancement of sensitivity after being sub-jected to a high beta particle exposure was clarified. The effect was complicated by the influence of heattreatments before the exposure to radiation. Replicate runs on CaF2:natural after irradiation with 1 Gyabsorbed dose indicated good reproducibility of peak temperatures and intensities; they can be re-usedfor repeated measurements. It appeared that the main dosimetric peak at 280 �C exhibits negligiblefading over 4 weeks and may be used for dosimetry. This study has demonstrated that the potentialexists for the use of CaF2:natural for TL radiation dosimetry.
� 2012 Elsevier Ltd. All rights reserved.
1. Introduction
Various natural minerals demonstrate the thermoluminescencephenomenon, however only a small fraction satisfy the require-ments for use as thermoluminescence dosimeters (TLDs)(McKeever, 1985). Natural calcium fluoride (CaF2; fluorite,commercially fluoraspar) with a large variety of colors such aswhite, pink, green, violet, etc., is a common mineral in nature andone of the most sensitive thermoluminescent materials for radia-tion dose monitoring. Since the mineral fluorite is abundantlyavailable in the Earth’s crust and thus can be obtained easily, manystudies have been done exploring the possibility of using it forpersonal and/or environmental dosimetry as well as identifying itsTL mechanisms (Sunta, 1970, 1971, 1983; Calderon et al., 1992).A significant amount of these studies are closely connectedwith themain TL characteristics of natural fluorite as-sourced and whendoped with rare-earth minerals (Cameron et al., 1968; Ganguly and
: þ90 3223386070.
All rights reserved.
., et al., Effects of annealing a012), http://dx.doi.org/10.101
Kaul, 1984; Balogun et al., 1999; Ogundare et al., 2004; Bakshi et al.,2009). Natural fluorite contains many activators, which arepredominantly rare earth ions.
Annealing is used with TL materials to establish the background(i.e., the thermoluminescence signal at zero radiation dose) and thesensitivity (i.e. the TL signal per unit radiation dose) of the material,and to maintain the stability of these parameters (Driscoll et al.,1986; Jassemnejad and McKeever, 1987; Brovetto et al., 1990).Horowitz (1984) has stated that a high temperature pre-irradiationanneal restores and standardizes the TLD characteristics by erasingaccumulated radiation damage and dispersing the impurity ions totheir original states, and low temperature anneal reduces the lowtemperature peaks to a negligible level compared with the stabledosimetric peaks. Early studies reported that the TL properties ofnatural CaF2 do not change with low temperature annealing. Athigher temperatures the sensitivity begins to decrease, and above500e600 �C the sensitivity of all natural CaF2 samples rapidlydecreases (Schayes et al., 1967). Cameron et al. (1968) showed fornatural CaF2 that a “standard” post-irradiation annealing toincrease sensitivity is annealing for 30 min at 450 �C. Apart fromstudies on the effects of heat treatment on the characteristics of
nd high radiation dose on the thermoluminescence characteristics of6/j.radmeas.2012.08.001
5
8.0x10⁵
1.0x10⁶
1.2x10⁶
5
8.0x10⁵
1.0x10⁶
1.2x10⁶
(a.u
.)
1 Gy 2 Gy 4 Gy 10 Gy
Z. Yegingil et al. / Radiation Measurements xxx (2012) 1e72
natural fluorite, kinetic analysis of its growth peaks, dose responseand other studies on TL signal fading have also been reported.Balogun et al. (1999) and Sohrabi et al. (1999) have studiedextensively the fading characteristics of natural CaF2 crystals atroom temperature storage. Topaksu and Yazici (2007) have shownthat the TL glow curve of natural fluorite can have both first andgeneral-order glow peaks.
In this study, we have developed and optimized the conditionsnecessary to erase the effects of the natural dosewith a natural CaF2sample to establish the background and sensitivity with an initialhigh temperature thermal treatment followed by low temperatureannealing. The glow curve obtained with the sample irradiatedwith a 90Sr/90Y beta source at a dose of 2 Gy is presented and thekinetic parameters of the peaks appearing in the glow curve arecalculated. The effects of high temperature annealing and very highbeta dose are clarified, and the reusability of the dosimetric peak isexamined. The fading characteristics of some of the peaks in theglow curve of the phosphor are analyzed.
2. Materials and methods
The natural calcium fluoride sample used in this study was ob-tained from the Akcakent region of Turkey, supplied by the Depart-ment of Geology Engineering, University of Cukurova in Adana. Theselected natural crystal was light green in color and fluorite sampleswere analyzed in both powder and crystal forms. The crystals werepulverized using an agatemortar and sieved to obtain a powderwithgrain size between 90 and 140 m. To ensure good thermal contact,approximately 3 mg of a sample was fixed by silicone spray on analuminum disc of 10 mm, within a diameter of 3 mm.
The impurity content and crystal structure of the fluorite wereanalyzed using a D8 Advanced (Bruker AXS) X-ray diffractometerand an Axios Advanced X-ray fluorescence apparatus (Pan Analyt-ical), respectively. The operating voltage and currentwere 40 kV and40 mA, respectively. The Mo tube wavelength was 0.70930 �A, andthe corresponding current was 40 mA. The calcium fluoride contentin the sample was found to be 99.67% while Si, Cu, Fe, Mg and Sappeared as the major trace elements in the sample (see Table 1).
For the sample annealing, a Nabertherm GmbHmodel electricaloven and a LABART model incubator with digital screen were used.The temperature was controlled to within 1 or 2 �C. All customarymeasurements starting with room temperature (RT) (30 �C) up to450 �C were carried out at a heating rate of 2 �C s�1. A RISO TL/OSL-DA-20 reader with a bialkali PM-tube (EMI925QA) and Hoya U-340filters (290e370 nm) was used. The reader was interfaced to a PCwhere the signals were stored and analyzed. All irradiations weredone at room temperature using beta rays from a 90Sr/90Y sourcewith an activity of 1.48 GBq (40 mCi) which emits beta particleswith amaximum energy of 2.27MeV. The dose rate from the sourcewas 6.689 Gy min�1 at the time of irradiation.
Each sample weighed approximately 3 mg and all the experi-ments were carried out in the dark to prevent possible decrease inluminescence that can occur from exposure to light.
Table 1The results of XRF analysis of fluorite sample.
Name Content (%) Error (%)
Ca 82.8585 0.2F 16.7998 0.4Si 0.1477 0.009Cu 0.0716 0.003Fe 0.0637 0.003S 0.0352 0.002Mg 0.0235 0.002
Please cite this article in press as: Yegingil, Z., et al., Effects of annealing anatural fluorite, Radiation Measurements (2012), http://dx.doi.org/10.101
3. Results and discussion
3.1. Glow curves of CaF2:natural
The glow curve is characteristic of the different trap levels thatlie in the band gap of the material. A reliable dosimetric study ofa thermoluminescent material should be based on a good knowl-edge of its kinetic parameters that include trap depth (E), order ofkinetics (b) and frequency factor (s). The study of relatively deeptrapping defect-states in various phosphors, as well as TL dating ofsolid state materials, is closely related to the position of the trap-ping levels within the forbidden gap. Although there are variousmethods to obtain the number of glow peaks in the complex glowcurves and their kinetic parameters that best describe the peaks(McKeever, 1985), among them the computerized glow curvedeconvolution (CGCD) method has become very popular. Thismethod has great advantages over the methods derived empiri-cally, owing to simultaneous determination of kinetic parametersof all peaks without additional thermal treatments and experi-mental repetitions. It uses all data points in the whole glow curverather than just a few points during the curve fitting procedures. Itis apparent that if the number of data points used in the evaluationincreases, the potential for obtaining accurate results rises.
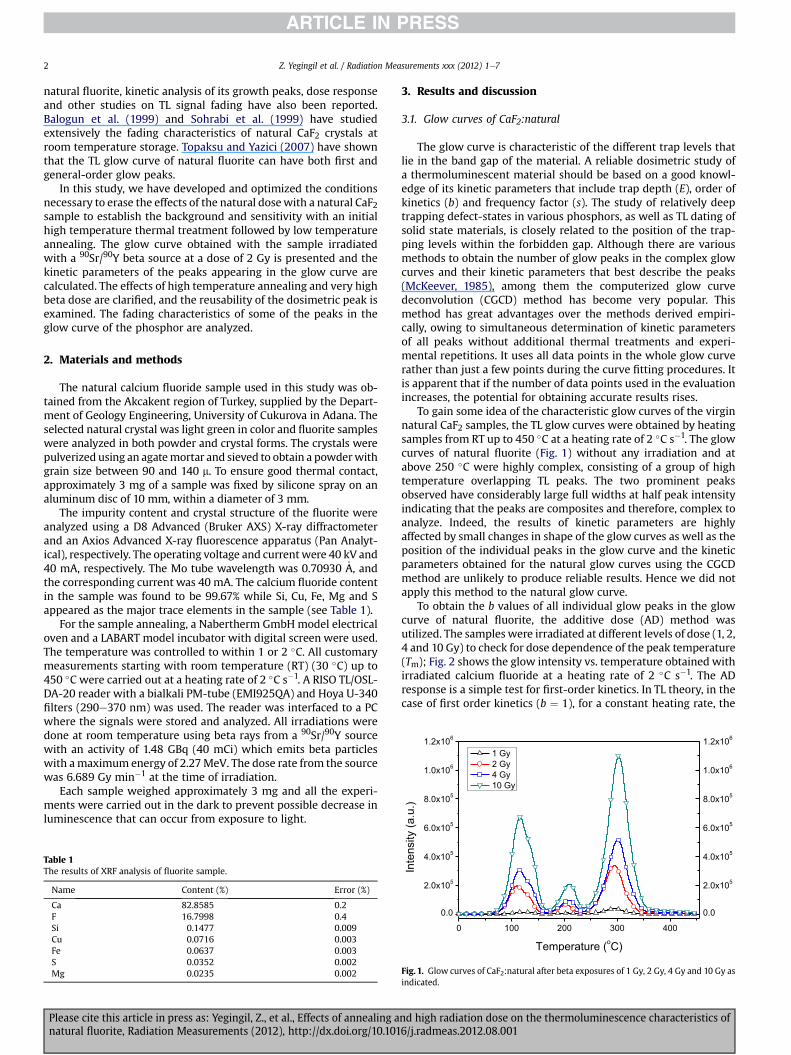
To gain some idea of the characteristic glow curves of the virginnatural CaF2 samples, the TL glow curves were obtained by heatingsamples from RT up to 450 �C at a heating rate of 2 �C s�1. The glowcurves of natural fluorite (Fig. 1) without any irradiation and atabove 250 �C were highly complex, consisting of a group of hightemperature overlapping TL peaks. The two prominent peaksobserved have considerably large full widths at half peak intensityindicating that the peaks are composites and therefore, complex toanalyze. Indeed, the results of kinetic parameters are highlyaffected by small changes in shape of the glow curves as well as theposition of the individual peaks in the glow curve and the kineticparameters obtained for the natural glow curves using the CGCDmethod are unlikely to produce reliable results. Hence we did notapply this method to the natural glow curve.
To obtain the b values of all individual glow peaks in the glowcurve of natural fluorite, the additive dose (AD) method wasutilized. The samples were irradiated at different levels of dose (1, 2,4 and 10 Gy) to check for dose dependence of the peak temperature(Tm); Fig. 2 shows the glow intensity vs. temperature obtained withirradiated calcium fluoride at a heating rate of 2 �C s�1. The ADresponse is a simple test for first-order kinetics. In TL theory, in thecase of first order kinetics (b ¼ 1), for a constant heating rate, the
0 100 200 300 400
0.0
2.0x10⁵
4.0x10⁵
6.0x10
0.0
2.0x10⁵
4.0x10⁵
6.0x10
Inte
nsity
Temperature (oC)
Fig. 1. Glow curves of CaF2:natural after beta exposures of 1 Gy, 2 Gy, 4 Gy and 10 Gy asindicated.
nd high radiation dose on the thermoluminescence characteristics of6/j.radmeas.2012.08.001
100 200 300 400
0
1x10⁵
2x10⁵
3x10⁵
0
1x10⁵
2x10⁵
3x10⁵
P5
P4
P3
P2P1
Temperature (oC)
TL In
tens
ity (a
.u.)
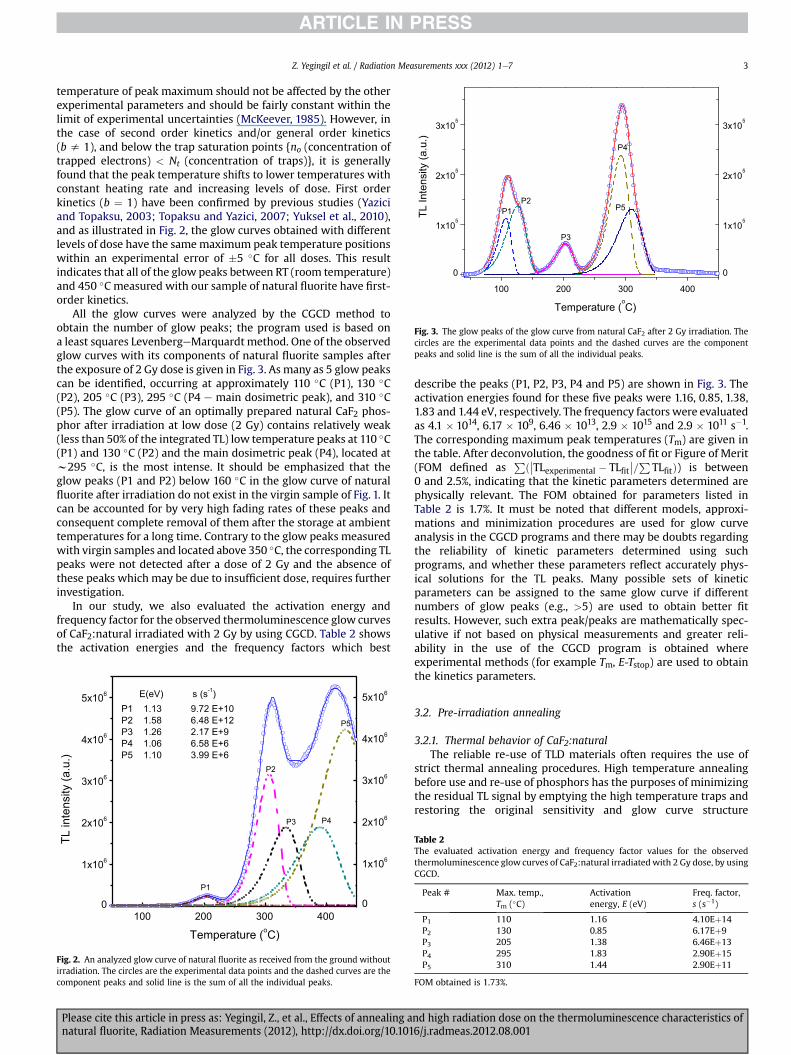
Fig. 3. The glow peaks of the glow curve from natural CaF2 after 2 Gy irradiation. Thecircles are the experimental data points and the dashed curves are the componentpeaks and solid line is the sum of all the individual peaks.
Z. Yegingil et al. / Radiation Measurements xxx (2012) 1e7 3
temperature of peak maximum should not be affected by the otherexperimental parameters and should be fairly constant within thelimit of experimental uncertainties (McKeever, 1985). However, inthe case of second order kinetics and/or general order kinetics(b s 1), and below the trap saturation points {no (concentration oftrapped electrons) < Nt (concentration of traps)}, it is generallyfound that the peak temperature shifts to lower temperatures withconstant heating rate and increasing levels of dose. First orderkinetics (b ¼ 1) have been confirmed by previous studies (Yaziciand Topaksu, 2003; Topaksu and Yazici, 2007; Yuksel et al., 2010),and as illustrated in Fig. 2, the glow curves obtained with differentlevels of dose have the samemaximum peak temperature positionswithin an experimental error of �5 �C for all doses. This resultindicates that all of the glow peaks between RT (room temperature)and 450 �C measured with our sample of natural fluorite have first-order kinetics.
All the glow curves were analyzed by the CGCD method toobtain the number of glow peaks; the program used is based ona least squares LevenbergeMarquardt method. One of the observedglow curves with its components of natural fluorite samples afterthe exposure of 2 Gy dose is given in Fig. 3. As many as 5 glow peakscan be identified, occurring at approximately 110 �C (P1), 130 �C(P2), 205 �C (P3), 295 �C (P4 e main dosimetric peak), and 310 �C(P5). The glow curve of an optimally prepared natural CaF2 phos-phor after irradiation at low dose (2 Gy) contains relatively weak(less than 50% of the integrated TL) low temperature peaks at 110 �C(P1) and 130 �C (P2) and the main dosimetric peak (P4), located atw295 �C, is the most intense. It should be emphasized that theglow peaks (P1 and P2) below 160 �C in the glow curve of naturalfluorite after irradiation do not exist in the virgin sample of Fig. 1. Itcan be accounted for by very high fading rates of these peaks andconsequent complete removal of them after the storage at ambienttemperatures for a long time. Contrary to the glow peaks measuredwith virgin samples and located above 350 �C, the corresponding TLpeaks were not detected after a dose of 2 Gy and the absence ofthese peaks which may be due to insufficient dose, requires furtherinvestigation.
In our study, we also evaluated the activation energy andfrequency factor for the observed thermoluminescence glow curvesof CaF2:natural irradiated with 2 Gy by using CGCD. Table 2 showsthe activation energies and the frequency factors which best
100 200 300 4000
1x10⁶
2x10⁶
3x10⁶
4x10⁶
5x10⁶
0
1x10⁶
2x10⁶
3x10⁶
4x10⁶
5x10⁶
P5
P4P3
P2
P1
TL in
tens
ity (a
.u.)
Temperature (oC)
E(eV) s (s-1)P1 1.13 9.72 E+10P2 1.58 6.48 E+12P3 1.26 2.17 E+9P4 1.06 6.58 E+6P5 1.10 3.99 E+6
Fig. 2. An analyzed glow curve of natural fluorite as received from the ground withoutirradiation. The circles are the experimental data points and the dashed curves are thecomponent peaks and solid line is the sum of all the individual peaks.
Please cite this article in press as: Yegingil, Z., et al., Effects of annealing anatural fluorite, Radiation Measurements (2012), http://dx.doi.org/10.101
describe the peaks (P1, P2, P3, P4 and P5) are shown in Fig. 3. Theactivation energies found for these five peaks were 1.16, 0.85, 1.38,1.83 and 1.44 eV, respectively. The frequency factors were evaluatedas 4.1 � 1014, 6.17 � 109, 6.46 � 1013, 2.9 � 1015 and 2.9 � 1011 s�1.The corresponding maximum peak temperatures (Tm) are given inthe table. After deconvolution, the goodness of fit or Figure of Merit(FOM defined as
Pð��TLexperimental � TLfit��=P
TLfitÞ) is between0 and 2.5%, indicating that the kinetic parameters determined arephysically relevant. The FOM obtained for parameters listed inTable 2 is 1.7%. It must be noted that different models, approxi-mations and minimization procedures are used for glow curveanalysis in the CGCD programs and there may be doubts regardingthe reliability of kinetic parameters determined using suchprograms, and whether these parameters reflect accurately phys-ical solutions for the TL peaks. Many possible sets of kineticparameters can be assigned to the same glow curve if differentnumbers of glow peaks (e.g., >5) are used to obtain better fitresults. However, such extra peak/peaks are mathematically spec-ulative if not based on physical measurements and greater reli-ability in the use of the CGCD program is obtained whereexperimental methods (for example Tm, E-Tstop) are used to obtainthe kinetics parameters.
3.2. Pre-irradiation annealing
3.2.1. Thermal behavior of CaF2:naturalThe reliable re-use of TLD materials often requires the use of
strict thermal annealing procedures. High temperature annealingbefore use and re-use of phosphors has the purposes of minimizingthe residual TL signal by emptying the high temperature traps andrestoring the original sensitivity and glow curve structure
Table 2The evaluated activation energy and frequency factor values for the observedthermoluminescence glow curves of CaF2:natural irradiatedwith 2 Gy dose, by usingCGCD.
Peak # Max. temp.,Tm (�C)
Activationenergy, E (eV)
Freq. factor,s (s�1)
P1 110 1.16 4.10Eþ14P2 130 0.85 6.17Eþ9P3 205 1.38 6.46Eþ13P4 295 1.83 2.90Eþ15P5 310 1.44 2.90Eþ11
FOM obtained is 1.73%.
nd high radiation dose on the thermoluminescence characteristics of6/j.radmeas.2012.08.001
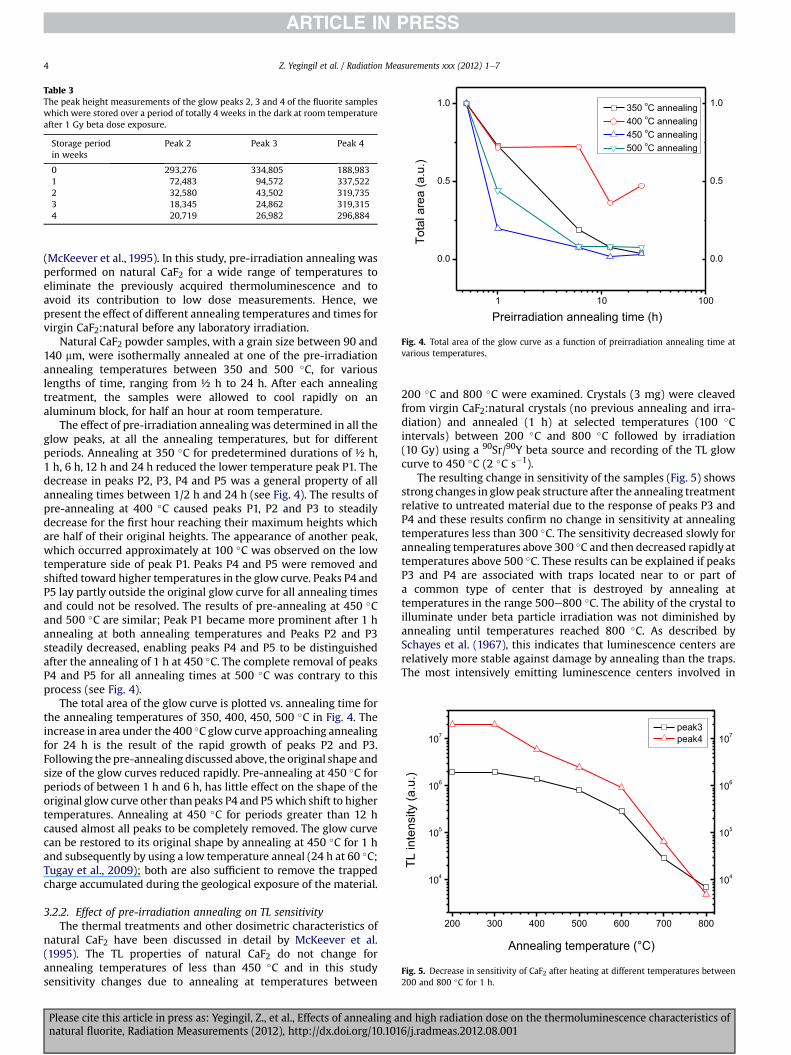
Table 3The peak height measurements of the glow peaks 2, 3 and 4 of the fluorite sampleswhich were stored over a period of totally 4 weeks in the dark at room temperatureafter 1 Gy beta dose exposure.
Storage periodin weeks
Peak 2 Peak 3 Peak 4
0 293,276 334,805 188,9831 72,483 94,572 337,5222 32,580 43,502 319,7353 18,345 24,862 319,3154 20,719 26,982 296,884
1 10 100
0.0
0.5
1.0
0.0
0.5
1.0 350 oC annealing 400 oC annealing 450 oC annealing 500 oC annealing
Preirradiation annealing time (h)
Tota
l are
a (a
.u.)
Fig. 4. Total area of the glow curve as a function of preirradiation annealing time atvarious temperatures.
200 300 400 500 600 700 800
104
105
106
107
104
105
106
107
TL in
tens
ity (a
.u.)
Annealing temperature (°C)
peak3 peak4
Fig. 5. Decrease in sensitivity of CaF2 after heating at different temperatures between200 and 800 �C for 1 h.
Z. Yegingil et al. / Radiation Measurements xxx (2012) 1e74
(McKeever et al., 1995). In this study, pre-irradiation annealing wasperformed on natural CaF2 for a wide range of temperatures toeliminate the previously acquired thermoluminescence and toavoid its contribution to low dose measurements. Hence, wepresent the effect of different annealing temperatures and times forvirgin CaF2:natural before any laboratory irradiation.
Natural CaF2 powder samples, with a grain size between 90 and140 mm, were isothermally annealed at one of the pre-irradiationannealing temperatures between 350 and 500 �C, for variouslengths of time, ranging from ½ h to 24 h. After each annealingtreatment, the samples were allowed to cool rapidly on analuminum block, for half an hour at room temperature.
The effect of pre-irradiation annealing was determined in all theglow peaks, at all the annealing temperatures, but for differentperiods. Annealing at 350 �C for predetermined durations of ½ h,1 h, 6 h, 12 h and 24 h reduced the lower temperature peak P1. Thedecrease in peaks P2, P3, P4 and P5 was a general property of allannealing times between 1/2 h and 24 h (see Fig. 4). The results ofpre-annealing at 400 �C caused peaks P1, P2 and P3 to steadilydecrease for the first hour reaching their maximum heights whichare half of their original heights. The appearance of another peak,which occurred approximately at 100 �C was observed on the lowtemperature side of peak P1. Peaks P4 and P5 were removed andshifted toward higher temperatures in the glow curve. Peaks P4 andP5 lay partly outside the original glow curve for all annealing timesand could not be resolved. The results of pre-annealing at 450 �Cand 500 �C are similar; Peak P1 became more prominent after 1 hannealing at both annealing temperatures and Peaks P2 and P3steadily decreased, enabling peaks P4 and P5 to be distinguishedafter the annealing of 1 h at 450 �C. The complete removal of peaksP4 and P5 for all annealing times at 500 �C was contrary to thisprocess (see Fig. 4).
The total area of the glow curve is plotted vs. annealing time forthe annealing temperatures of 350, 400, 450, 500 �C in Fig. 4. Theincrease in area under the 400 �C glow curve approaching annealingfor 24 h is the result of the rapid growth of peaks P2 and P3.Following the pre-annealing discussed above, the original shape andsize of the glow curves reduced rapidly. Pre-annealing at 450 �C forperiods of between 1 h and 6 h, has little effect on the shape of theoriginal glow curve other thanpeaks P4 and P5which shift to highertemperatures. Annealing at 450 �C for periods greater than 12 hcaused almost all peaks to be completely removed. The glow curvecan be restored to its original shape by annealing at 450 �C for 1 hand subsequently by using a low temperature anneal (24 h at 60 �C;Tugay et al., 2009); both are also sufficient to remove the trappedcharge accumulated during the geological exposure of the material.
3.2.2. Effect of pre-irradiation annealing on TL sensitivityThe thermal treatments and other dosimetric characteristics of
natural CaF2 have been discussed in detail by McKeever et al.(1995). The TL properties of natural CaF2 do not change forannealing temperatures of less than 450 �C and in this studysensitivity changes due to annealing at temperatures between
Please cite this article in press as: Yegingil, Z., et al., Effects of annealing anatural fluorite, Radiation Measurements (2012), http://dx.doi.org/10.101
200 �C and 800 �C were examined. Crystals (3 mg) were cleavedfrom virgin CaF2:natural crystals (no previous annealing and irra-diation) and annealed (1 h) at selected temperatures (100 �Cintervals) between 200 �C and 800 �C followed by irradiation(10 Gy) using a 90Sr/90Y beta source and recording of the TL glowcurve to 450 �C (2 �C s�1).
The resulting change in sensitivity of the samples (Fig. 5) showsstrong changes in glowpeak structure after the annealing treatmentrelative to untreated material due to the response of peaks P3 andP4 and these results confirm no change in sensitivity at annealingtemperatures less than 300 �C. The sensitivity decreased slowly forannealing temperatures above 300 �C and then decreased rapidly attemperatures above 500 �C. These results can be explained if peaksP3 and P4 are associated with traps located near to or part ofa common type of center that is destroyed by annealing attemperatures in the range 500e800 �C. The ability of the crystal toilluminate under beta particle irradiation was not diminished byannealing until temperatures reached 800 �C. As described bySchayes et al. (1967), this indicates that luminescence centers arerelatively more stable against damage by annealing than the traps.The most intensively emitting luminescence centers involved in
nd high radiation dose on the thermoluminescence characteristics of6/j.radmeas.2012.08.001

Z. Yegingil et al. / Radiation Measurements xxx (2012) 1e7 5
illumination and thermoluminescence seem to be common to both.In our study, 700 and 800 �C annealing resulted in very low peakintensities for peaks P3 and P4. This means that annealing at 800 �Cfor 1 h destroyed the traps and could not be restored by additionalannealing. Hence, annealing at 800 �C for 1 h causes a permanentreduction in sensitivity of peaks P3 and P4 and CaF2:natural isevidently more stable after annealing at T ¼ 450 �C and this isconsistent with the previously determined heating treatments forvirgin fluorite.
3.3. Modification of sensitivity by large beta exposures
3.3.1. Large beta dose exposure followed by annealingA 500 Gy b dosewas delivered to a group of samples which were
then subjected to various post exposure annealing procedures. Bydelivering the samples a 0.5 Gy dose and reading out the glowcurve, the virgin phosphor response to beta particles had beendetermined beforehand. The effect of the 500 Gy dose and chosenpost exposure annealing conditions on the dose response of thesamples was measured afterward by repeating the 0.5 Gy dose andreadout. We carried out the post exposure annealing at 400, 450and 500 �C. The ratio of the heights of peak P4 (at w280 �C) ob-tained from the glow curves of final readout and that obtainedoriginally was plotted as a function of annealing time at 400, 450and 500 �C. As shown in Fig. 6, at each annealing temperaturea maximum is reached after which the sensitivity decreasedbecause the phosphor was damaged by heat. It means if we take theglow peak immediately after the 500 Gy dose without any postexposure annealing, the height of peak P4 is found to be less thanproportional to the P4 peak obtained with much smaller exposures,i.e. the onset of saturation effects.
The sensitivity of a particular TLD material is defined as the TLsignal (peak height or TL intensity integrated over a certaintemperature region) per unit absorbed dose and per unit mass. Themaximum sensitivity occurs for a particular annealing tempera-ture and cooling rate which maximizes the concentration of thedefects responsible for the dosimetric peaks. The behavior ofthe curves in Fig. 6 describes the sensitivity enhancing effect of the500 Gy exposure, which evidently requires annealing to develop it.This is consistent with the finding that if a CaF2 dosimeter,previously strongly irradiated, is used repetitively the measure-ments of small exposures will show a progressive increase insensitivity because each heating applied to measure the TL
0.5 1.0 1.5 2.0
0.8
1.2
1.6
2.0
2.4
0.8
1.2
1.6
2.0
2.4
Rat
io o
f glo
w p
eak
heig
hts
Annealing time (h)
400 oC 450 oC 500 oC
Fig. 6. The change of sensitivity of CaF2 due to the post-exposure annealing afterstrong beta irradiation (500 Gy).
Please cite this article in press as: Yegingil, Z., et al., Effects of annealing anatural fluorite, Radiation Measurements (2012), http://dx.doi.org/10.101
response will act as a partial post exposure annealing. From thefinal readout observations of the glow curves obtained fromb irradiations for doses of 0.5 Gy to that observed originally(see Fig. 6), a consistent ratio of approximately 1.5 is obtainedbetween the peak P4 heights at w280 �C with the annealingtemperature of 450 �C and an annealing time of 1 h. Based onthese results, we recommend 450 �C for 1 h as a standard post-exposure high temperature heat treatment.
3.4. Reproducibility of response
For some of TLmaterials, repeated reuse (i.e. cycles of irradiationand readout) might cause change to the deep, competing traps, andthis change accumulates with each reuse causing the TL sensitivityto change over the usage period. To ensure a constant sensitivityduring reuse of TL material, repeated cycles of thermal annealingplus irradiation exposure followed by TL readout were performed.
About 3 mg of CaF2:natural powder was deposited withina w3 mm diameter onto aluminum discs (10 mm dia. 0.25 mmthickness), previously sprayed with a silicone oil. The powder in thediscs was annealed in the usual way: 450 �C for 1 h and 60 �C for24 h. To check the sensitization of the fluorite sample and itsreusability, the samples were annealed, irradiated and read outeight times. The crystals were exposed to radiation (1 Gy) betweencycles. All TL dosimeters were weighed and the TL signal normal-ized by aliquot weight. In each cycle, the sensitivity (TL per absor-bed dose) of three aliquots was determined. Peaks P4 and P5 of themeasured glow curves were highly overlapped and deconvolutionof this region into its component peaks was difficult and forcalculating the reusability we integrated the glow curve under bothpeaks P4 and P5.
Fig. 7 shows the change of the number of photon counts per unitweight vs. to number of cycles. In Fig. 7, every point is the average ofthe three values. It can be seen that after the first cycle the decreasein relative sensitivity is very small, only 0.3%. Following this slightreduction in sensitivity, between the third and seventh cycles, thefluctuation of readout values toward the lower and upper limits of�4% can be seen. In the last round of annealing, irradiation andreading (8th cycle), the TL signal from the material had beenrecorded with a maximum deviation from the first response of�5.72%. The mean of the responses was calculated from sevenexposures except the last one, as 3.15% and standard deviation ofdeviations in measurements was 1.34%.
0 1 2 3 4 5 6 7 80.7
0.8
0.9
1.0
1.1
1.2
1.3
Rel
ativ
e gl
ow p
eak
inte
nsity
(a.u
.)
Number of sequences
±%5
Fig. 7. TL response of the fluorite samples during 8 cycles of an initialization annealingfollowed by beta irradiation of 1 Gy and TL readout.
nd high radiation dose on the thermoluminescence characteristics of6/j.radmeas.2012.08.001
Z. Yegingil et al. / Radiation Measurements xxx (2012) 1e76
3.5. Fading effect
An important consideration in the choice of a TLD detector is thestability of the TL signal in the environment inwhich the dosimeteris operated. Thus it becomes necessary to assess if the trappedcharge within the material can be lost (post-irradiation) by heat(at ambient room temperature 25 �C) followed by storage. TheCaF2:natural phosphors show no fading over long periods. Ingeneral, the low temperature peaks that occur slightly above roomtemperature decay in only a few hours. The peaks that occur in therange of 175 �C are relatively stable and can be used for dosimetry.The peaks located in the range 250e300 �C are the most stable anddo not show measurable fading (Schulman, 1967; McKeever et al.,1995).
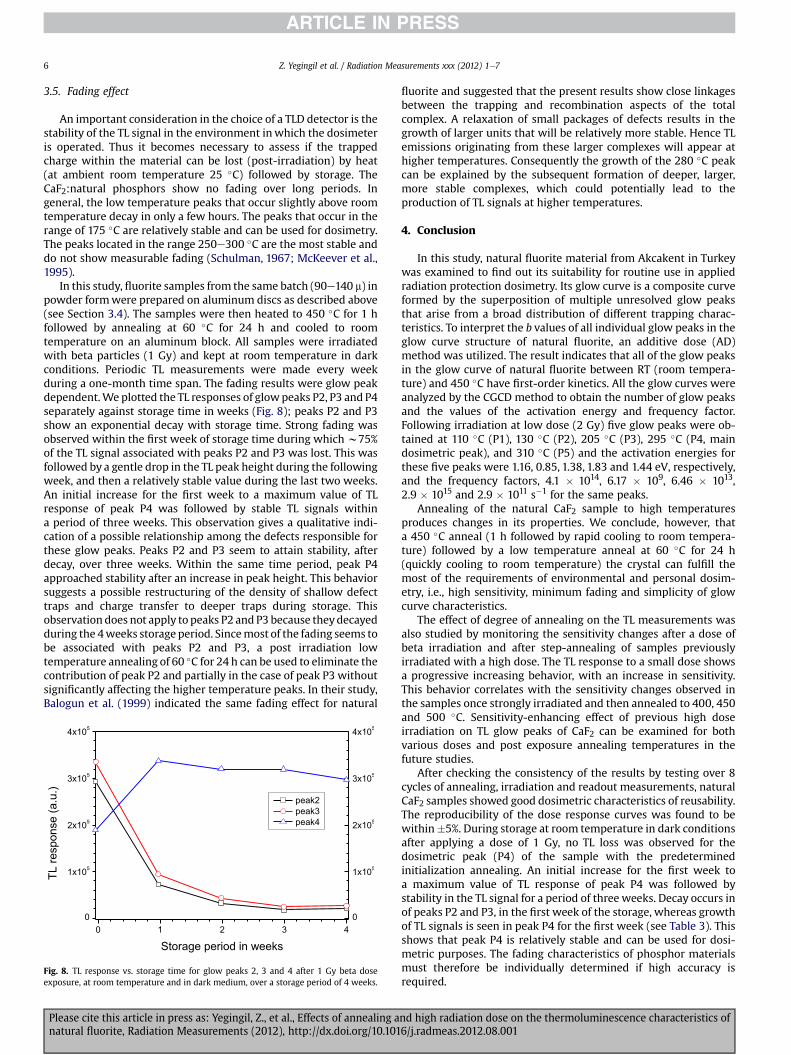
In this study, fluorite samples from the same batch (90e140 m) inpowder formwere prepared on aluminum discs as described above(see Section 3.4). The samples were then heated to 450 �C for 1 hfollowed by annealing at 60 �C for 24 h and cooled to roomtemperature on an aluminum block. All samples were irradiatedwith beta particles (1 Gy) and kept at room temperature in darkconditions. Periodic TL measurements were made every weekduring a one-month time span. The fading results were glow peakdependent.We plotted the TL responses of glowpeaks P2, P3 and P4separately against storage time in weeks (Fig. 8); peaks P2 and P3show an exponential decay with storage time. Strong fading wasobserved within the first week of storage time during which w75%of the TL signal associated with peaks P2 and P3 was lost. This wasfollowed by a gentle drop in the TL peak height during the followingweek, and then a relatively stable value during the last two weeks.An initial increase for the first week to a maximum value of TLresponse of peak P4 was followed by stable TL signals withina period of three weeks. This observation gives a qualitative indi-cation of a possible relationship among the defects responsible forthese glow peaks. Peaks P2 and P3 seem to attain stability, afterdecay, over three weeks. Within the same time period, peak P4approached stability after an increase in peak height. This behaviorsuggests a possible restructuring of the density of shallow defecttraps and charge transfer to deeper traps during storage. Thisobservation does not apply to peaks P2 and P3 because theydecayedduring the 4weeks storage period. Sincemost of the fading seems tobe associated with peaks P2 and P3, a post irradiation lowtemperature annealing of 60 �C for 24 h can be used to eliminate thecontribution of peak P2 and partially in the case of peak P3 withoutsignificantly affecting the higher temperature peaks. In their study,Balogun et al. (1999) indicated the same fading effect for natural
0 1 2 3 40
1x10
2x10
3x10
4x10
0
1x10
2x10
3x10
4x10
TL re
spon
se (a
.u.)
Storage period in weeks
peak2 peak3 peak4
Fig. 8. TL response vs. storage time for glow peaks 2, 3 and 4 after 1 Gy beta doseexposure, at room temperature and in dark medium, over a storage period of 4 weeks.
Please cite this article in press as: Yegingil, Z., et al., Effects of annealing anatural fluorite, Radiation Measurements (2012), http://dx.doi.org/10.101
fluorite and suggested that the present results show close linkagesbetween the trapping and recombination aspects of the totalcomplex. A relaxation of small packages of defects results in thegrowth of larger units that will be relatively more stable. Hence TLemissions originating from these larger complexes will appear athigher temperatures. Consequently the growth of the 280 �C peakcan be explained by the subsequent formation of deeper, larger,more stable complexes, which could potentially lead to theproduction of TL signals at higher temperatures.
4. Conclusion
In this study, natural fluorite material from Akcakent in Turkeywas examined to find out its suitability for routine use in appliedradiation protection dosimetry. Its glow curve is a composite curveformed by the superposition of multiple unresolved glow peaksthat arise from a broad distribution of different trapping charac-teristics. To interpret the b values of all individual glow peaks in theglow curve structure of natural fluorite, an additive dose (AD)method was utilized. The result indicates that all of the glow peaksin the glow curve of natural fluorite between RT (room tempera-ture) and 450 �C have first-order kinetics. All the glow curves wereanalyzed by the CGCD method to obtain the number of glow peaksand the values of the activation energy and frequency factor.Following irradiation at low dose (2 Gy) five glow peaks were ob-tained at 110 �C (P1), 130 �C (P2), 205 �C (P3), 295 �C (P4, maindosimetric peak), and 310 �C (P5) and the activation energies forthese five peaks were 1.16, 0.85, 1.38, 1.83 and 1.44 eV, respectively,and the frequency factors, 4.1 � 1014, 6.17 � 109, 6.46 � 1013,2.9 � 1015 and 2.9 � 1011 s�1 for the same peaks.
Annealing of the natural CaF2 sample to high temperaturesproduces changes in its properties. We conclude, however, thata 450 �C anneal (1 h followed by rapid cooling to room tempera-ture) followed by a low temperature anneal at 60 �C for 24 h(quickly cooling to room temperature) the crystal can fulfill themost of the requirements of environmental and personal dosim-etry, i.e., high sensitivity, minimum fading and simplicity of glowcurve characteristics.
The effect of degree of annealing on the TL measurements wasalso studied by monitoring the sensitivity changes after a dose ofbeta irradiation and after step-annealing of samples previouslyirradiated with a high dose. The TL response to a small dose showsa progressive increasing behavior, with an increase in sensitivity.This behavior correlates with the sensitivity changes observed inthe samples once strongly irradiated and then annealed to 400, 450and 500 �C. Sensitivity-enhancing effect of previous high doseirradiation on TL glow peaks of CaF2 can be examined for bothvarious doses and post exposure annealing temperatures in thefuture studies.
After checking the consistency of the results by testing over 8cycles of annealing, irradiation and readout measurements, naturalCaF2 samples showed good dosimetric characteristics of reusability.The reproducibility of the dose response curves was found to bewithin�5%. During storage at room temperature in dark conditionsafter applying a dose of 1 Gy, no TL loss was observed for thedosimetric peak (P4) of the sample with the predeterminedinitialization annealing. An initial increase for the first week toa maximum value of TL response of peak P4 was followed bystability in the TL signal for a period of three weeks. Decay occurs inof peaks P2 and P3, in the first week of the storage, whereas growthof TL signals is seen in peak P4 for the first week (see Table 3). Thisshows that peak P4 is relatively stable and can be used for dosi-metric purposes. The fading characteristics of phosphor materialsmust therefore be individually determined if high accuracy isrequired.
nd high radiation dose on the thermoluminescence characteristics of6/j.radmeas.2012.08.001
Z. Yegingil et al. / Radiation Measurements xxx (2012) 1e7 7
Based on these results, CaF2:natural has the potential as a dosi-metric material but more research is required to obtain a betterunderstanding and improvement of the material characteristics ofdifferent types of CaF2:natural as well as develop this phosphor asa dosimeter with applications in areas such as personnel, envi-ronmental and clinical dosimetry.
Acknowledgments
This study was carried out at the Cukurova University, Depart-ment of Physics. We are grateful to TUBITAK (Turkish Scientific andTechnology Research Council) for its financial support under thecontract number 105Y349 to purchase RISO TL/OSL DA-20 equip-ment. We would like to acknowledge the Cukurova UniversityRectorate Scientific Research Unit for providing the financialsupport for the graduate study under the contract numberFEF2006D11 and for the BAP project under the contract numberFEF2008BAP10.
References
Bakshi, A.K., Dhabekar, B., Rawat, N.S., Singh, S.G., Joshi, V.J., Kumar, V., 2009. Studyon TL and OSL characteristics of indigenously developed CaF2:Mn phospor. Nucl.Instrum. Meth. Phys. Res. B 267, 548e553.
Balogun, F.A., Ojo, J.O., Ogundare, F.O., Fasasi, M.K., Hussein, L.A., 1999. TL responseof natural fluorite. Radiat. Meas. 30, 759e763.
Brovetto, P., Delunas, A., Floris, A., Maxia, V., Murgia, M., Spano, G., 1990.Investigation on CaF2 lattice defects by thermoluminescence experiments.12, 1651e1665.
Calderon, T., Khanlary, M.R., Rendell, H.M., Townsend, P.D., 1992. Luminescencefrom natural fluorite crystals. Int. J. Radiat. Appl. Instrum. Part D. Nucl. TrackRadiat. Meas. 20, 475e485.
Cameron, J.R., Suntharalingam, N., Kenney, G.N., 1968. ThermoluminescentDosimetry. University of Wisconsin Press, Madison, WI.
Please cite this article in press as: Yegingil, Z., et al., Effects of annealing anatural fluorite, Radiation Measurements (2012), http://dx.doi.org/10.101
Driscoll, C.M.H., Barthe, J.R., Oberhofer, M., Busuoli, G., Hickman, C., 1986. Annealingprocedures for commonly used radiothermoluminescent materials. Radiat. Prot.Dosim. 14, 17e32.
Ganguly, S., Kaul, I.K., 1984. Analysis of thermoluminescence glow peaks fromnatural calcium fluoride. Mod. Geol. 8, 155e162.
Horowitz, Y., 1984. Thermoluminescence and Thermoluminescent Dosimetry, vol. I.CRC Press Inc., Boca, Raton, Florida.
Jassemnejad, B., McKeever, S.W.S., 1987. Dipole-relaxation parameters for Ce3þeFint�
complexes in CaF2:Ce and CaF2:Ce, Mn. J. Phys. D: Appl. Phys. 36, 9769e9775.McKeever, S.W.S., 1985. Thermoluminescence of Solids. Cambridge University
Press, USA.McKeever, S.W.S., Moscovitch, M., Townsend, P.O., 1995. Thermoluminescence
Dosimetry Materials: Properties and Uses. Nuclear Technology PublishingAshford, Kent, TN23 IYW England.
Ogundare, F.O., Balogun, F.A., Hussain, L.A., 2004. Kinetic characterization of thethermoluminescence of natural fluorite. Radiat. Meas. 38, 281e286.
Schayes, R., Brooke, C., Kozlowitz, I., 1967. Thermoluminescent properties of naturalcalcium fluoride. In: Proceedings of Int. Conf. on Luminescence Dosimetry,Stanford University, Stanford, California, June 21e23. USAEC. CONF-650637.
Schulman, J.H., 1967. In: Proceedings of Int. Conf. on Luminescence Dosimetry,Stanford University, Stanford, California, June 21e23, 1965. USAEC. CONF-650637.
Sohrabi, M., Abbasisiar, F., Jafarizadeh, M., 1999. Dosimetric characteristics ofnatural calcium fluoride of Iran. Radiat. Prot. Dosim. 84, 277e280.
Sunta, C.M., 1970. Thermoluminescence spectrum of gamma-irradiated naturalcalcium fluoride. J. Phys. C: Solid State Phys. 3, 1978e1983.
Sunta, C.M., 1971. Thermoluminescence of natural CaF2 and its applications in:natural fluorite crystals. In: Proceedings of the Third International Conferenceon Luminescence Dosimetry Held at Riso, vol. 1. Danish AEC Research Estab-lishment, pp. 380e391.
Sunta, C.M., 1983. Irradiation effects on Ceþ3 thermoluminescence centres ofmineral CaF2. Radiat. Effects 79, 149e158.
Topaksu, M., Yazici, N., 2007. The thermoluminescence properties of natural CaF2after b irradiation. Nucl. Instrum. Meth. Phys. Res. B. 264, 293e301.
Tugay, H., Yegingil, Z., Dogan, T., Nur, N., Yazici, N., 2009. The thermoluminescenceproperties of natural calcium fluoride for radiation dosimetry. Nucl. Meas.Meth. Phys. Res. B 267, 3640e3651.
Yazici, A.N., Topaksu, M., 2003. The analysis of thermoluminescence glow peaks ofunannealed synthetic quartz. J. Phys. D: Appl. Phys. 36 (6), 620e627.
Yuksel, M., Topaksu, M., Yazici, A.N., Yegingil, Z., Dogan, T., 2010. The effects ofpreirradiation heat treatment and heating rates on the thermoluminescenceglow peaks of natural CaF2. Radiat. Effects. Def. Solids 165 (5), 396e402.
nd high radiation dose on the thermoluminescence characteristics of6/j.radmeas.2012.08.001
Copyright © 2022 FDOKUMEN