Large trees drive forest aboveground biomass variation in moist lowland forests across the tropics
Upload
uni-giessenCategory
view
0download
0
ORIGINALARTICLE
Forest aboveground biomass along anelevational transect in Sulawesi,Indonesia, and the role of Fagaceae intropical montane rain forests
Heike Culmsee1*, Christoph Leuschner2, Gerald Moser2 and
Ramadhanil Pitopang3
1Department of Vegetation and Phytodiversity
Analysis, Albrecht-von-Haller Institute for
Plant Sciences, University of Gottingen, Untere
Karspule 2, 37073 Gottingen, Germany,2Department of Plant Ecology and Ecosystems
Research, Albrecht-von-Haller Institute for
Plant Sciences, University of Gottingen, Untere
Karspule 2, 37073 Gottingen, Germany,3Department of Biology, Faculty of
Mathematics and Natural Sciences, Tadulako
University, Palu, Sulawesi Tengah 94118,
Indonesia
*Correspondence: Heike Culmsee, Department
of Vegetation and Phytodiversity Analysis,
Albrecht-von-Haller Institute for Plant Sciences,
University of Gottingen, Untere Karspule 2,
37073 Gottingen, Germany.
E-mail: [email protected]
ABSTRACT
Aim This study investigates how estimated tree aboveground biomass (AGB) of
tropical montane rain forests varies with elevation, and how this variation is
related to elevational change in floristic composition, phylogenetic community
structure and the biogeography of the dominant tree taxa.
Location Lore Lindu National Park, Sulawesi, Indonesia.
Methods Floristic inventories and stand structural analyses were conducted on
13 plots (each 0.24 ha) in four old-growth forest stands at 1050, 1400, 1800 and
2400 m a.s.l. (submontane to upper montane elevations). Tree AGB estimates
were based on d.b.h., height and wood specific gravity. Phylogenetic diversity and
biogeographical patterns were analysed based on tree family composition
weighted by AGB. Elevational trends in AGB were compared with other
Southeast Asian and Neotropical transect studies (n = 7).
Results AGB was invariant from sub- to mid-montane elevation (309–
301 Mg ha)1) and increased slightly to 323 Mg ha)1 at upper montane elevation.
While tree and canopy height decreased, wood specific gravity increased.
Magnoliids accounted for most of the AGB at submontane elevations, while
eurosids I (including Fagaceae) contributed substantially to AGB at all elevations.
Phylogenetic diversity was highest at upper montane elevations, with co-dominance
of tree ferns, Podocarpaceae, Trimeniaceae and asterids/euasterids II, and was
lowest at lower/mid-montane elevations, where Fagaceae contributed > 50% of
AGB. Biogeographical patterns showed a progression from dominant tropical
families at submontane to tropical Fagaceae (Castanopsis, Lithocarpus) at lower/
mid-montane, and to conifers and Australasian endemics at upper montane
elevations. Cross-continental comparisons revealed an elevational AGB decrease in
transects with low/no presence of Fagaceae, but relatively high AGB in montane
forests with moderate to high abundance of this family.
Main conclusions AGB is determined by both changes in forest structure and
shifts in species composition. In our study, these two factors traded off so that
there was no net change in AGB, even though there were large changes in forest
structure and composition along the elevational gradient. Southeast Asian
montane rain forests dominated by Fagaceae constitute important carbon stocks.
The importance of biogeography and species traits for biomass estimation should
be considered by initiatives to reduce emissions from deforestation and forest
degradation (REDD) and in taxon choice in reforestation for carbon offsetting.
Keywords
Aboveground biomass, biogeography, Celebes, elevation, Fagaceae, phylogenetic
diversity, REDD, Sulawesi, tropical montane forest.
Journal of Biogeography (J. Biogeogr.) (2010) 37, 960–974
960 www.blackwellpublishing.com/jbi ª 2010 Blackwell Publishing Ltddoi:10.1111/j.1365-2699.2009.02269.x

INTRODUCTION
Tropical forest biomass plays an important role in the global
carbon cycle, but the magnitude of this pool and its regional
variation are not well understood (Dixon et al., 1994; Clark
et al., 2001; Clark, 2004; Malhi & Phillips, 2004; Chave et al.,
2005). Recently published syntheses on aboveground biomass
(AGB) in Amazonian forests (Baker et al., 2004; Malhi et al.,
2006; Saatchi et al., 2007) have greatly increased our under-
standing of old-growth forest AGB variation across environ-
mental gradients in the lowlands. However, much less is
known about the biomass of tropical montane rain forests and
changes in tree biomass carbon pools along elevational
gradients. Increasing elevation may affect tree growth rates
and stand structure because of reduced air and soil temper-
atures, often increased rainfall, and alterations in nutrient
availability and soil chemistry (Coomes & Allen, 2007; Korner,
2007). Previous studies along tropical mountain slopes have
detected a decrease in tree height (Lieberman et al., 1996; Aiba
& Kitayama, 1999; Moser et al., 2008) and an increase in stem
density with increasing elevation (Aiba & Kitayama, 1999;
Moser et al., 2008). However, the existing information indi-
cates that the pattern in AGB varies significantly between
different tropical mountain ranges (Weaver & Murphy, 1990;
Lieberman et al., 1996; Raich et al., 1997; Kitayama & Aiba,
2002; Wang et al., 2003; Moser et al., 2008).
A better understanding of elevational changes in tropical
forest AGB and the underlying causes is important in the
context of reducing emissions from deforestation and forest
degradation (REDD) initiatives (UNFCCC, 2007). Such
knowledge is helpful for the selection of taxa in reforestation,
particularly for the purposes of carbon offsetting, and it could
improve our ability to predict the future changes in tropical
forest AGB that may result from increasing temperatures in the
tropics under global change (Clark, 2004; Lewis et al., 2004;
Malhi & Phillips, 2004).
Both phylogeny and biogeography may have a profound
influence on the structure, composition and functioning of
tropical forests. It has been suggested that over evolutionary
timescales, lowland forests served as speciation centres and
maintained tree diversity in tropical montane floras (Slik et al.,
2009), whilst tropical montane regions have acted as refugia
for many taxa during times of palaeo-climatic change (Malhi &
Phillips, 2004; Mayle et al., 2004; VanDerWal et al., 2009).
We therefore expect steep elevational gradients in floristic
and phylogenetic tree community composition. The AGB in
Amazonian lowland rain forests has been found to be
determined largely by wood specific gravity (Baker et al.,
2004; Malhi et al., 2006), a trait that is itself highly dependent
on phylogeny (Baker et al., 2004; Slik, 2006). Therefore, if
more general patterns are to be recognized, analyses of changes
in AGB with elevation must consider profound changes in
forest community composition and their related traits, in
addition to changes in forest structure.
This paper reports on an elevational transect study in
Central Sulawesi, Indonesia, covering an elevational range of
about 1400 m from the submontane to the upper montane
belt. Sulawesi is part of the biogeographical region Wallacea,
one of the major biodiversity hotspots in the Palaeotropics
(Myers et al., 2000; Sodhi et al., 2004), but also one of the
most poorly known ecoregions of Southeast Asia (Cannon
et al., 2007). Because tropical taxa of the Fagaceae are
abundant in many Southeast Asian tropical montane rain
forests (Ashton, 1988, 2003; Ohsawa, 1993; Corlett, 2007), we
expect that this is also the case in Sulawesi.
The study is based on a thorough floristic tree inventory of
four mountain forest sites. The aim was to understand how the
AGB of these forests varied with elevation, and how this
variation was related to changes in tree community compo-
sition. We hypothesized that (1) there would be a directional
change in AGB with increasing elevation because of forest
structural changes (tree height, basal area and stem density),
and (2) changes in tree family composition, reflecting the
phylogenetic and biogeographical community structure, would
have a secondary effect on forest AGB. We conclude by
comparing elevational patterns in AGB found in this study
with those found in other Southeast Asian and Neotropical
mountain forest transects.
MATERIALS AND METHODS
Study region
The study was conducted in submontane to upper montane
tropical rain forests of Lore Lindu National Park, Central
Sulawesi, Indonesia, 120�03¢ E to 120�18¢ E latitude, and
01�14¢ S to 01�39¢ S longitude (Fig. 1). With an area of about
2180 km2, Lore Lindu National Park is one of the last
remaining large, contiguous blocks of intact forest in Sulawesi.
Four study sites, at 1050, 1400, 1800 and 2400 m a.s.l., were
selected in forests on level or gently sloping terrain that showed
no sign of recent human impact (Table 1). According to the
regional classification system of Cannon et al. (2007), the
condition of the forests is characterized as ‘good’ or ‘old-
growth’. Mean annual precipitation ranges between 1891 and
2131 mm (Hijmans et al., 2005; WorldClim, 2006), mean
annual temperature decreases by about 5.3 K per 1000 m
elevation from 21.3�C at 1050 m to 14.1�C at 2400 m. The
climate is perhumid, with at most 2 months a year receiving
< 100 mm rainfall on average. The soils are Ferralsols or
Nitisols at submontane to lower montane elevations and Histic
Cambisols at mid- and upper montane elevations (FAO
classification; FAO, 2006). The bedrock consists of granite or
various types of metamorphic rock.
Situated east of Wallace’s Line in the Wallacea biogeo-
graphical region, the forests of the study region represent
species-rich tropical montane forests composed of predomi-
nantly tropical taxa with > 100 species ha)1 at submontane
elevations (Culmsee & Pitopang, 2009). Tree species richness
and importance of lowland tropical tree families decrease
above 1000 m a.s.l. In total, we surveyed 13 plots of 60 · 40 m
over four study sites, covering in total a forest area of 3.12 ha
Elevational trends in tropical forest aboveground biomass
Journal of Biogeography 37, 960–974 961ª 2010 Blackwell Publishing Ltd

and containing more than 3400 tree individuals of 236 species
in 62 families.
Stand structural inventories
Stand structural inventories were carried out in the periods
from July to September 2006 and August to September 2007.
At each of the four study sites, two to six 0.24-ha plots were
selected in stand areas that met the following criteria: (1)
mature forests, (2) level or gently sloping terrain, (3) well
drained soils lacking depressions with seasonal waterlogging,
and (4) a mean canopy height that was representative of the
forest types. The stands contained small tree-fall gaps, as is
typical for natural forests, but no large gaps. A 10 · 10-m grid
was placed on the 40 · 60-m plots and all trees (including
palms, tree ferns and tree-like stranglers) ‡ 10 cm d.b.h. (at
1.3 m) were tagged, their plot coordinates were determined,
d.b.h. was measured with a measuring tape (Richter Measuring
Tools, Speichersdorf, Germany), and tree height was recorded
using a Vertex III height meter equipped with a T3/60�transponder (Haglof, Langsele, Sweden). Where stilt roots
were present, d.b.h. was measured above them following the
recommendations of Clark et al. (2001) and Phillips et al.
(2002). To survey understorey trees of 2–9.9 cm d.b.h., one
5 · 5-m subplot was installed in each of the 24 10 · 10-m
plots and was surveyed as described for the larger trees.
Tree species identification
Tree species identification was based on about 3000 specimens
collected from tagged trees and supplementary trees inspected
in flower or fruit. Specimens have been deposited at the
Figure 1 Location of the four study sites in
Lore Lindu National Park, Central Sulawesi,
Indonesia (Universal Transverse Mercator
projection 51 south).
Table 1 Location and characteristics of the four study sites in Lore Lindu National Park, Sulawesi, Indonesia.
Forest type
Elevation
(m a.s.l.) Location
Coordinates
GC-WGS 84 Slope, position
Soils and
bedrock
Rainfall
(mm yr)1)
Temperature
(�C)
No.
plots
Total
area (ha)
Submontane
forest
1050 Pono Valley 01�29.6¢ S
120�03.4¢ E
Level terrain on
mid-slope terrace
Ferralsol on
metamorphic
rocks
1894 21.3 6 1.44
Lower montane
forest
1400 Bariri Forest 01�39.5¢ S
120�10.4¢ E
Level terrain on
fluvio-lacustrine
terrace
Nitisol on
metamorphic
rocks
1975 19.1 3 0.72
Mid-montane
forest
1800 Mt Nokilalaki 01�14.6¢ S
120�09.2¢ E
Level terrain on
a mid-slope
terrace
Histic Cambisol
on granite
1891 17.9 2 0.48
Upper montane
forest
2400 Mt Rorekautimbu 01�16.8¢ S
120�18.5¢ E
Gently sloping
ridge
Histic Cambisol
on granite
2131 14.1 2 0.48
H. Culmsee et al.
962 Journal of Biogeography 37, 960–974ª 2010 Blackwell Publishing Ltd
herbaria at Leiden (L), Gottingen (GOET), Palu (CEB) and
London (K). Tree species were identified by H.C. and by
specialists for Elaeocarpaceae (M.J.E. Coode, K), Moraceae
(C.C. Berg, L) and Myristicaceae (W.J. de Wilde, L). Taxa that
were difficult to identify to species level, especially in the
Myrtaceae, were distinguished as separate species based on
morphology of vegetative characters (leaves, twigs and bark).
Of 3408 tree individuals in total, 3197 trees were identified to
the species level (including 12 morpho-species of the Myrta-
ceae), 165 trees to genus and 20 trees to family level. Only 26
individuals (< 1%) remained unidentified. So far, one new
species has been described (Culmsee, 2008). Species were
assigned to families according to IPNI (2008), with the
exception of the species of Quintinia A.DC. and Sphenostemon
Baill., which were included in the Southeast Asian endemic
family of the Paracryphiaceae following Stevens (2001
onwards). The complete species list for the sites at 1050 and
1400 m elevation is given in Culmsee & Pitopang (2009).
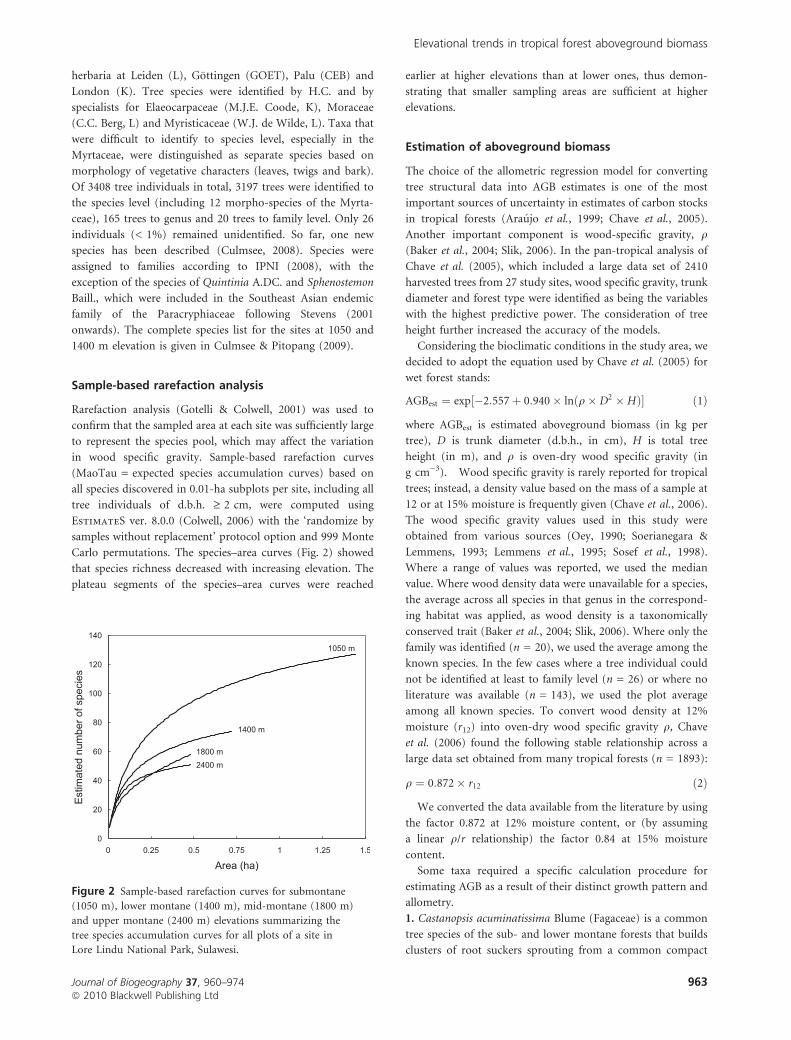
Sample-based rarefaction analysis
Rarefaction analysis (Gotelli & Colwell, 2001) was used to
confirm that the sampled area at each site was sufficiently large
to represent the species pool, which may affect the variation
in wood specific gravity. Sample-based rarefaction curves
(MaoTau = expected species accumulation curves) based on
all species discovered in 0.01-ha subplots per site, including all
tree individuals of d.b.h. ‡ 2 cm, were computed using
EstimateS ver. 8.0.0 (Colwell, 2006) with the ‘randomize by
samples without replacement’ protocol option and 999 Monte
Carlo permutations. The species–area curves (Fig. 2) showed
that species richness decreased with increasing elevation. The
plateau segments of the species–area curves were reached
earlier at higher elevations than at lower ones, thus demon-
strating that smaller sampling areas are sufficient at higher
elevations.
Estimation of aboveground biomass
The choice of the allometric regression model for converting
tree structural data into AGB estimates is one of the most
important sources of uncertainty in estimates of carbon stocks
in tropical forests (Araujo et al., 1999; Chave et al., 2005).
Another important component is wood-specific gravity, q(Baker et al., 2004; Slik, 2006). In the pan-tropical analysis of
Chave et al. (2005), which included a large data set of 2410
harvested trees from 27 study sites, wood specific gravity, trunk
diameter and forest type were identified as being the variables
with the highest predictive power. The consideration of tree
height further increased the accuracy of the models.
Considering the bioclimatic conditions in the study area, we
decided to adopt the equation used by Chave et al. (2005) for
wet forest stands:
AGBest ¼ exp½�2:557þ 0:940� lnðq� D2 �HÞ� ð1Þ
where AGBest is estimated aboveground biomass (in kg per
tree), D is trunk diameter (d.b.h., in cm), H is total tree
height (in m), and q is oven-dry wood specific gravity (in
g cm)3). Wood specific gravity is rarely reported for tropical
trees; instead, a density value based on the mass of a sample at
12 or at 15% moisture is frequently given (Chave et al., 2006).
The wood specific gravity values used in this study were
obtained from various sources (Oey, 1990; Soerianegara &
Lemmens, 1993; Lemmens et al., 1995; Sosef et al., 1998).
Where a range of values was reported, we used the median
value. Where wood density data were unavailable for a species,
the average across all species in that genus in the correspond-
ing habitat was applied, as wood density is a taxonomically
conserved trait (Baker et al., 2004; Slik, 2006). Where only the
family was identified (n = 20), we used the average among the
known species. In the few cases where a tree individual could
not be identified at least to family level (n = 26) or where no
literature was available (n = 143), we used the plot average
among all known species. To convert wood density at 12%
moisture (r12) into oven-dry wood specific gravity q, Chave
et al. (2006) found the following stable relationship across a
large data set obtained from many tropical forests (n = 1893):
q ¼ 0:872� r12 ð2Þ
We converted the data available from the literature by using
the factor 0.872 at 12% moisture content, or (by assuming
a linear q/r relationship) the factor 0.84 at 15% moisture
content.
Some taxa required a specific calculation procedure for
estimating AGB as a result of their distinct growth pattern and
allometry.
1. Castanopsis acuminatissima Blume (Fagaceae) is a common
tree species of the sub- and lower montane forests that builds
clusters of root suckers sprouting from a common compact
Figure 2 Sample-based rarefaction curves for submontane
(1050 m), lower montane (1400 m), mid-montane (1800 m)
and upper montane (2400 m) elevations summarizing the
tree species accumulation curves for all plots of a site in
Lore Lindu National Park, Sulawesi.
Elevational trends in tropical forest aboveground biomass
Journal of Biogeography 37, 960–974 963ª 2010 Blackwell Publishing Ltd

base of up to 2 m tall (Soepadmo, 1972). Each stem of ‡ 2 cm
d.b.h. was measured above the common base and AGBest was
calculated separately for each stem.
2. Stranglers of the genus Ficus L. (Moraceae, n = 5 at the site
at 1050 m a.s.l.) that have developed into a free-standing, tree-
like structure are characterized by a large central cavity that
was originally filled by the trunk of the host tree. For an
approximation of the hollow space, d.b.h. of the original tree
was recalculated (Dest) using the logarithmic equation derived
from the tree height – d.b.h. regression model of all trees
occurring at the study site at 1050 m a.s.l. (excluding C.
acuminatissima and Ficus species) that has the form:
y ¼ 13:759� lnðxÞ � 19:622 ð3Þ
where y is the tree height and x is the estimated trunk diameter
Dest (R2 = 0.68, P £ 0.001). Based on the growth pattern of
stranglers of Ficus species as outlined by Halle et al. (1978), we
assumed the total height of the host tree to be equivalent to the
mean of the total height H and trunk height T of the strangler
tree. AGBest was calculated for both the strangler and the
hollow space based on equation 1, and subsequently the latter
was subtracted from the former:
AGBest ¼ exp½�2:557þ 0:940� lnðqFicus sp�D2�HÞ�� expf�2:557þ 0:940� ln½qFicus sp�Destðeqn3Þ
2
�meanðH;TÞ�gð4Þ
Statistical analyses
Stand structural patterns were analysed for (1) large trees
(‡ 10 cm d.b.h.), and (2) all trees (‡ 2 cm d.b.h.). In analyses
referring to stem density, only the biggest stem of a cluster was
counted in species with a sprouting growth habit, such as C.
acuminatissima (Fagaceae), Elaeocarpus steupii Coode (Elaeo-
carpaceae), Rapanea minutifolia J.Knoester, M.Wijn & Sleumer
(Myrsinaceae), Trimenia papuana Ridl. (Trimeniaceae), and
several morpho-species of the Myrtaceae.
Significant differences in individual-based traits (tree
height, d.b.h., wood specific gravity) between the four sites
were tested with the nonparametric Behrens–Fisher test for
multiple comparisons (Munzel & Hothorn, 2001) using
the R package (R ver. 2.8.1, with the lawstat and npmc
add-on packages).
Community structural similarity in terms of family com-
position along the elevational gradient was analysed by indirect
gradient analysis (detrended correspondence analysis, DCA)
using the canoco 4.5 package (ter Braak & Smilauer, 2002).
Phylogenetic and non-phylogenetic diversity analyses
Phylogenetic community structure was analysed based on
community tree family composition weighted by absolute AGB
estimates instead of abundance data. A basic Newick phylog-
eny file was produced using phylomatic (Webb et al., 2008a)
with the mega-tree version R20080417 based on the angio-
sperm consensus tree (Davies et al., 2004). Phylogenetic
diversity (Rao’s quadratic entropy index, PDQ; Rao, 1982),
non-phylogenetic diversity (Simpson’s index, 1)D; Magurran,
2004) and inter-sample phylogenetic distance (Comdistnn,
nearest taxon method; Webb et al., 2008b) were calculated
with phylocom (Webb et al., 2008a). Non-metric multi-
dimensional scaling (NMDS) based on the inter-sample
phylogenetic distance was performed with WinKyst 1.0
(Smilauer, 2002–2003).
Biogeographical pattern analysis
Each tree family was assigned to a biogeographical or
functional group. Angiosperm families were classified based
on biogeographical criteria that followed the families’ main
geographical distribution patterns and richness centres, as
described by Heywood et al. (2007), where (1) ‘tropical’
families are restricted to tropical regions; (2) ‘centred in
tropics’ means the family has experienced its greatest radiation
in tropical regions but may also occur in subtropical and
temperate regions, albeit with a considerably smaller number
of species; (3) ‘endemic to Malesia’ are families that are
restricted mostly to Southeast Asia while a few species may
reach East Asia or Australasia; (4) ‘tropical montane’ families
are restricted to, or are found primarily in, the montane
elevational belt of tropical regions; (5) ‘centred temperate’
includes families that occur in the tropics but have a clear
species density centre in the southern and/or northern
temperate regions; (6) the ‘Fagaceae’ show a unique distribu-
tion pattern, being a dominant family in the temperate broad-
leaved forests of Eurasia and North America, but also being
important in the evergreen tropical montane rain forests of
Southeast Asia, where the genera Lithocarpus Blume and
Castanopsis have their evolutionary and richness centres. Other
vascular plant families are included in the groups: (7) ‘conifers’
referring to Southern Hemisphere or tropical conifers; and (8)
‘tree ferns’ referring to pteridophytes with a d.b.h. ‡ 2 cm.
‘Others’ (9) include all vascular plant families that are cosmo-
politan or cannot be classified under (1)–(8). Based on this
classification, patterns across the four sites were analysed
according to (i) the total AGB (Mg ha)1) including all trees
‡ 2 cm d.b.h., and (ii) the number of trees ‡ 10 cm d.b.h.
(n ha)1). In species with a sprouting growth habit, the stems of
each cluster were combined to give one count for the individual.
RESULTS
Elevational changes in stand structure and biomass
Both individual trees and height of the forest canopy grew
steadily shorter with increasing elevation (Table 2). There was
no elevational trend in mean stem diameter in large trees
(‡ 10 cm d.b.h.); however, the submontane forest plots con-
tained several very high and large diameter trees (‡ 100 cm
d.b.h.) that were absent at higher elevations. These trees were
primarily hollow-stemmed Ficus stranglers, which greatly
reduced the impact of the large d.b.h. classes on aboveground
H. Culmsee et al.
964 Journal of Biogeography 37, 960–974ª 2010 Blackwell Publishing Ltd

biomass (AGB = 38.5 Mg ha)1, i.e. 46.7)8.2 Mg ha)1 cavity).
Mean wood specific gravity, q, was lowest at submontane and
highest at mid-montane elevation. This is mainly as a result of
the dominance of Lithocarpus (Fagaceae) species, which, with an
average genus q = 0.672 g cm)3, yielded the highest mean wood
specific gravity of all genera present. Stand basal area was more
than 10 m2 ha)1 higher in the upper montane forest than in
lower elevations.
Stem density rose continuously with increasing elevation. In
all forests, the smallest diameter class (< 5 cm d.b.h.) was the
most numerous, and the number of stems decreased in an
inverse J-shaped curve towards bigger tree diameter classes
(Fig. 3). In contrast, estimated tree AGB decreased marginally
from submontane to mid-montane elevations before increas-
ing again at upper montane elevations, where the highest AGB
values for both large trees and all trees were found. In all
forests, trees ‡ 30 cm d.b.h. contributed 3–5% of all stems
(i.e. of the stems ‡ 2 cm d.b.h.) and 18–20% of large tree stems
(i.e. of the stems ‡ 10 cm d.b.h.), but constituted the major
part of estimated AGB fractions: 65–77% of the AGB of all
trees and 68–80% of the AGB of large trees.
Tree family distribution and dominance patterns
along the elevational gradient
The montane forests were highly species-rich, with 236 tree
species in 62 families (Table 3). The submontane forest
contained the largest number of families (42), with family
number decreasing progressively with increasing elevation to a
minimum of 26 in the upper montane forest. Tree family
composition and dominance patterns changed steadily along
the elevational gradient, with only the Fagaceae and Myrtaceae
contributing an important AGB fraction over the whole range.
The tree family assemblage of the submontane forest was most
even (Simpson’s index) with the Fagaceae and Sapotaceae co-
dominant and, together with 13 additional families, contrib-
uting 90% of the estimated stand AGB. Simpson’s diversity
was lowest at lower and mid-montane elevations, where the
Fagaceae contributed more than half of the stand AGB, but
increased again in the upper montane forest. There, the
Podocarpaceae became the most important family, contribut-
ing about a third of the stand AGB followed by the co-
dominating Myrtaceae and Fagaceae.
Phylogenetic community structure and elevational
forest transition
Phylogenetic community structure changed directionally along
the elevational gradient (Fig. 4); however, all elevations were
greatly influenced by the Fagaceae and numerous other
families in the eurosids I. Families included in the eurosids
II and the euasterids I dominated the submontane and lower
montane forests in terms of AGB. Magnoliids contributed
substantially to AGB of submontane and lower montane
forests, but were gradually replaced by asterids as the most
prominent family at higher elevations. Rao’s entropy indexTab
le2
Ab
ove
gro
un
dst
and
stru
ctu
ral
char
acte
rist
ics
of
the
fou
rst
ud
ysi
tes
inL
ore
Lin
du
Nat
ion
alP
ark,
Sula
wes
i,gi
vin
gm
ean
s±
SE.
Up
per
can
op
y
hei
ght
(m)
Mea
ntr
ee
hei
ght,
tree
s‡
10cm
d.b
.h.
(m)
Max
.
tree
hei
ght
(m)
Mea
nd
.b.h
.,
tree
s‡
10cm
d.b
.h.
(cm
)
Max
.
d.b
.h
(cm
)
Bas
alar
ea,
tree
s‡
10cm
d.b
.h.
(m2
ha)
1)
Bas
alar
ea,
tree
s‡
2cm
d.b
.h.
(m2
ha)
1)
Wo
od
spec
ific
grav
ity,
q,
at
MC
0%,
tree
s‡
10cm
d.b
.h.
(gcm
)3)
Stem
s‡
10cm
d.b
.h.
(nh
a)1)
AG
Bes
t,
tree
s‡
10cm
d.b
.h.
(Mg
ha)
1)
AG
Bes
t,
tree
s‡
2cm
d.b
.h.
(Mg
ha)
1)
Sub
mo
nta
ne
fore
st(1
050
m)
29.2
±0.
520
.9±
0.4a
47.9
±1.
123
.5±
0.7a
149.
0±
14.9
35.4
±2.
538
.8±
2.6
0.52
1±
0.00
4a47
6±
2129
9.1
±18
.730
8.7
±18
.8
Lo
wer
mo
nta
ne
fore
st(1
400
m)
24.6
±0.
818
.2±
0.3b
37.4
±1.
422
.7±
0.9a
94.9
±2.
737
.1±
0.9
40.9
±0.
70.
535
±0.
005ac
508
±22
293.
4±
13.0
304.
6±
12.6
Mid
-mo
nta
ne
fore
st(1
800
m)
22.3
±0.
117
.6±
0.3b
39.7
±6.
921
.9±
0.7a
91.9
±4.
936
.0±
2.6
40.5
±2.
50.
606
±0.
005b
697
±11
028
6.5
±10
.230
1.4
±9.
5
Up
per
mo
nta
ne
fore
st(2
400
m)
19.8
±2.
415
.8±
0.3c
37.4
±2.
322
.2±
0.6a
98.9
±0.
846
.5±
4.3
51.4
±3.
90.
559
±0.
004c
879
±14
630
6.9
±9.
532
2.6
±6.
5
Dif
fere
nt
sup
ersc
rip
ted
lett
ers
ind
icat
esi
gnifi
can
td
iffe
ren
ces
inin
div
idu
al-b
ased
trai
tsb
etw
een
the
site
s(P
£0.
05,
no
n-p
aram
etri
cB
ehre
ns–
Fis
her
test
for
mu
ltip
leco
mp
aris
on
s).
Site
-bas
edch
arac
teri
stic
s
take
into
acco
un
tth
eva
riat
ion
bet
wee
n0.
24-h
ap
lots
atea
chsi
te.
MC
,w
oo
dm
ois
ture
con
ten
t.A
GB
est,
esti
mat
edab
ove
gro
un
db
iom
ass.
Elevational trends in tropical forest aboveground biomass
Journal of Biogeography 37, 960–974 965ª 2010 Blackwell Publishing Ltd

indicated that the upper montane tree community held the
highest overall phylogenetic diversity (Table 3). However,
when considering only angiosperm families, phylogenetic
diversity was highest at submontane elevations. At upper
montane elevations, phylogenetic diversity was strongly deter-
mined by gymnosperms and tree ferns. Together with the basal
angiosperm family of the Trimeniaceae (Austrobaileyales),
they were highly contrasting to the prominent young groups of
the asterids (Ericaceae, Theaceae) and euasterids II (Paracry-
phiaceae).
Elevational changes in biogeographical patterns
Biogeographical patterns altered significantly with elevation
(Fig. 5). Strictly tropical families provided about a third of
both the number of stems and AGB in the submontane forest,
but became less important at higher elevations. The Sapota-
ceae, in particular, contributed a substantial fraction of the
AGB in the submontane forest (Table 3). Tree families with a
distribution centre in the tropics showed the most constant
elevational distribution pattern, comprising 20–45% of AGB
and stems at all elevations. Of these families, the Myrtaceae
were the most important in terms of AGB at all elevations, but
particularly in the mid-montane and upper montane forests.
In contrast to the other families, the Fagaceae with their
tropical genera Castanopsis and Lithocarpus exhibited major
differences between AGB and stem numbers. They were
abundant at all elevations, accounting for more than half of
the AGB in lower and mid-montane forests and nearly a
quarter of the AGB in the submontane and upper montane
forests. At mid-montane elevations, however, they reached the
highest density, comprising up to a third of the stems. With
the increase in Hamamelidaceae and Magnoliaceae at mid-
montane elevations, tree families with a species density centre
in temperate regions then gained significance. The upper
montane forest was inhabited by a distinct assemblage of
biogeographical elements. The Trimeniaceae and Paracryphi-
aceae, endemic to Australasia (Eastern Wallacean distribution),
made up 7% of the AGB and 19% of the stems. The
Podocarpaceae abruptly increased in significance here and
made up about a third of both AGB and stems.
DISCUSSION
Forest AGB in relation to elevational trends in stand
structure
Forest AGB is a function of attributes that vary between tree
species and with community composition, and that may
change depending on elevation. Baker et al. (2004) pointed out
that for regionally comparable estimates of AGB, an equation
is required that incorporates those aspects of forest structure
that vary significantly at regional scales. Our study shows that:
(1) stem and canopy height decrease progressively with
Figure 3 Stem density (n ha)1) and above-
ground biomass (Mg ha)1) for the four study
sites in Lore Lindu National Park, Sulawesi,
given separately for seven different tree
diameter classes (thresholds at 5, 10, 20, 30,
60 and 100 cm d.b.h.).
H. Culmsee et al.
966 Journal of Biogeography 37, 960–974ª 2010 Blackwell Publishing Ltd

Table 3 Aboveground biomass (AGB) per tree family at the four study sites in Lore Lindu National Park, Sulawesi, as estimated from stem
numbers and basal area (all stems ‡ 2 cm d.b.h.), tree height and wood specific gravity with the allometric wet forest equation given by
Chave et al. (2005) (in Mg ha)1).
Family Biogeography
Submontane
forest
(1050 m)
Lower
montane
forest
(1400 m)
Mid-
montane
forest
(1800 m)
Upper
montane
forest
(2400 m)
DCA
scores
Annonaceae TROP 4.7 )1.028
Arecaceae cTROP 0.4 )1.028
Chrysobalanaceae TROP < 0.1 )1.028
Dracaenaceae TROP 1.4 )1.028
Gesneriaceae cTROP < 0.1 )1.028
Leguminosae others 1.2 )1.028
Pandanaceae TROP 0.5 )1.028
Rhizophoraceae TROP 0.1 )1.028
Verbenaceae cTROP < 0.1 )1.028
Meliaceae cTROP 11.0 0.3 )0.998
Asteraceae others 3.9 0.2 )0.957
Moraceae cTROP 39.2 2.9 < 0.1 )0.946
Sterculiaceae TROP 0.2 < 0.1 )0.930
Sapindaceae cTROP 2.1 0.3 )0.897
Staphyleaceae others 0.5 < 0.1 )0.881
Sapotaceae TROP 62.5 18.5 0.5 )0.745
Cyatheaceae FERN 0.8 0.1 )0.714
Myristicaceae TROP 4.9 1.8 )0.712
Monimiaceae cTROP 0.6 0.3 )0.647
Aceraceae cTEMP 1.8 1.1 )0.581
Euphorbiaceae cTROP 10.5 2.0 1.6 0.1 )0.560
Icacinaceae TROP 7.0 4.8 < 0.1 )0.543
Rutaceae others 2.2 0.5 < 0.1 0.3 )0.316
Meliosmaceae cTROP 0.4 0.2 )0.316
Burseraceae TROP 7.3 29.3 )0.081
Himantandraceae ENDM 0.3 1.3 )0.068
Clusiaceae cTROP 6.2 9.9 4.1 0.005
Lauraceae cTROP 25.8 9.7 0.7 5.2 0.008
Araliaceae cTROP < 0.1 0.6 0.100
Melastomataceae TROP 1.9 < 0.1 2.0 0.104
Ebenaceae others 3.1 0.157
Oleaceae others 0.4 9.8 0.5 0.163
Juglandaceae cTEMP 2.3 1.4 4.6 0.428
Rubiaceae cTROP 3.0 1.3 0.8 1.0 0.470
Apocynaceae others 0.4 0.8 0.541
Caprifoliaceae cTEMP 0.1 0.1 0.692
Elaeocarpaceae cTROP 7.1 10.3 5.0 0.874
Fagaceae FAG 72.7 164.5 166.1 54.5 1.008
Magnoliaceae cTEMP 2.0 3.1 20.5 1.022
Hamamelidaceae cTEMP 1.2 5.2 1.177
Styracaceae others 8.4 1.456
Thymelaeaceae others < 0.1 1.456
Proteaceae cTROP 1.9 0.8 0.6 1.525
Rosaceae cTEMP 3.5 0.3 1.6 2.4 1.545
Escalloniaceae cTROP 1.3 0.6 2.9 1.6 1.963
Myrtaceae cTROP 13.1 22.3 61.9 65.6 2.530
Theaceae others 0.1 0.6 12.0 9.2 2.654
Symplocaceae tMONT 2.0 1.8 2.742
Aquifoliaceae cTROP < 0.1 0.1 2.820
Daphniphyllaceae ENDM 0.3 1.9 3.147
Myrsinaceae others < 0.1 0.1 0.1 2.7 3.274
Winteraceae tMONT 0.1 0.8 3.294
Elevational trends in tropical forest aboveground biomass
Journal of Biogeography 37, 960–974 967ª 2010 Blackwell Publishing Ltd
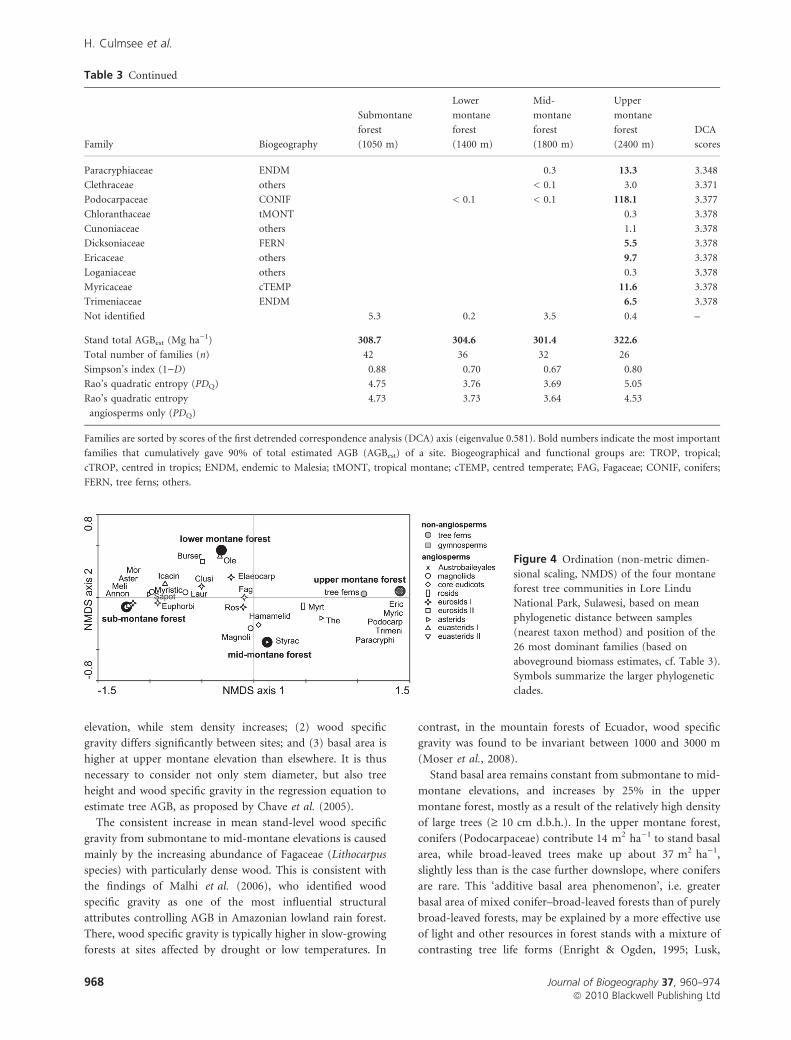
elevation, while stem density increases; (2) wood specific
gravity differs significantly between sites; and (3) basal area is
higher at upper montane elevation than elsewhere. It is thus
necessary to consider not only stem diameter, but also tree
height and wood specific gravity in the regression equation to
estimate tree AGB, as proposed by Chave et al. (2005).
The consistent increase in mean stand-level wood specific
gravity from submontane to mid-montane elevations is caused
mainly by the increasing abundance of Fagaceae (Lithocarpus
species) with particularly dense wood. This is consistent with
the findings of Malhi et al. (2006), who identified wood
specific gravity as one of the most influential structural
attributes controlling AGB in Amazonian lowland rain forest.
There, wood specific gravity is typically higher in slow-growing
forests at sites affected by drought or low temperatures. In
contrast, in the mountain forests of Ecuador, wood specific
gravity was found to be invariant between 1000 and 3000 m
(Moser et al., 2008).
Stand basal area remains constant from submontane to mid-
montane elevations, and increases by 25% in the upper
montane forest, mostly as a result of the relatively high density
of large trees (‡ 10 cm d.b.h.). In the upper montane forest,
conifers (Podocarpaceae) contribute 14 m2 ha)1 to stand basal
area, while broad-leaved trees make up about 37 m2 ha)1,
slightly less than is the case further downslope, where conifers
are rare. This ‘additive basal area phenomenon’, i.e. greater
basal area of mixed conifer–broad-leaved forests than of purely
broad-leaved forests, may be explained by a more effective use
of light and other resources in forest stands with a mixture of
contrasting tree life forms (Enright & Ogden, 1995; Lusk,
Table 3 Continued
Family Biogeography
Submontane
forest
(1050 m)
Lower
montane
forest
(1400 m)
Mid-
montane
forest
(1800 m)
Upper
montane
forest
(2400 m)
DCA
scores
Paracryphiaceae ENDM 0.3 13.3 3.348
Clethraceae others < 0.1 3.0 3.371
Podocarpaceae CONIF < 0.1 < 0.1 118.1 3.377
Chloranthaceae tMONT 0.3 3.378
Cunoniaceae others 1.1 3.378
Dicksoniaceae FERN 5.5 3.378
Ericaceae others 9.7 3.378
Loganiaceae others 0.3 3.378
Myricaceae cTEMP 11.6 3.378
Trimeniaceae ENDM 6.5 3.378
Not identified 5.3 0.2 3.5 0.4 –
Stand total AGBest (Mg ha)1) 308.7 304.6 301.4 322.6
Total number of families (n) 42 36 32 26
Simpson’s index (1)D) 0.88 0.70 0.67 0.80
Rao’s quadratic entropy (PDQ) 4.75 3.76 3.69 5.05
Rao’s quadratic entropy
angiosperms only (PDQ)
4.73 3.73 3.64 4.53
Families are sorted by scores of the first detrended correspondence analysis (DCA) axis (eigenvalue 0.581). Bold numbers indicate the most important
families that cumulatively gave 90% of total estimated AGB (AGBest) of a site. Biogeographical and functional groups are: TROP, tropical;
cTROP, centred in tropics; ENDM, endemic to Malesia; tMONT, tropical montane; cTEMP, centred temperate; FAG, Fagaceae; CONIF, conifers;
FERN, tree ferns; others.
Figure 4 Ordination (non-metric dimen-
sional scaling, NMDS) of the four montane
forest tree communities in Lore Lindu
National Park, Sulawesi, based on mean
phylogenetic distance between samples
(nearest taxon method) and position of the
26 most dominant families (based on
aboveground biomass estimates, cf. Table 3).
Symbols summarize the larger phylogenetic
clades.
H. Culmsee et al.
968 Journal of Biogeography 37, 960–974ª 2010 Blackwell Publishing Ltd

2002). Our study supports this, finding that large conifer trees
were, on average, 4.2 m taller than broad-leaved trees. In
contrast, Aiba et al. (2007) did not find additive basal area in
the conifer-rich, single-storey montane forests of Mt Kinabalu,
Malaysia, and suggested that the additive basal area phenom-
enon might be linked to the occupation of different canopy
layers.
Elevational transects may include significant alterations in
tree form, which typically changes from a tall, slender growth
habit at lower elevation to a stunted, often multi-stemmed
form higher up. As in our study, a progressive increase in stem
density with elevation has been observed along several tropical
mountain transects in Malaysia and Ecuador (Aiba & Kitay-
ama, 1999; Moser et al., 2008), but not in Costa Rica
(Lieberman et al., 1996). High proportions of sprouting stems
(up to 10.5%) were also reported from high elevations on Mt
Kinabalu (Aiba & Kitayama, 1999). In our study, the most
prominent sprouter is C. acuminatissima. Multi-stemmed trees
are a common component of tropical montane rain forests,
and may be more frequent on soils with low nutrient supply
(Bellingham & Sparrow, 2009).
We found that tree height decreased continuously with
increasing elevation (in total by about 25%). Data from
Ecuadorian mountain forests suggested that this effect is
related to a progressive shift in carbon allocation from
aboveground to belowground tree organs (Leuschner et al.,
2007). However, our results suggest that this is not an
important factor in Central Sulawesi, as wood density
remained constant with elevation. Here, it appears that the
increase in wood specific gravity at higher elevations compen-
sates the decrease in stem height, resulting in more or less
invariant AGB.
Elevational changes in phylogenetic and
biogeographical tree community structure
In tropical mountain forests, species composition and the
biogeographical affinity of the flora are often variable with
elevation (Kessler, 2002; Ashton, 2003). Our study supports
this finding, showing marked elevational changes in the
composition of the tree floras in terms of phylogeny and
biogeography from submontane to upper montane elevations
in Sulawesi.
In the submontane forest, tropical elements are still the most
abundant group, but they decline rapidly towards higher
elevations. In contrast to western Malesia, where members of
the Dipterocarpaceae often dominate the lowland and sub-
montane forests and reach elevations of up to 1600 m
(Hamann et al., 1999; Ashton, 2003), the family thins out in
Sulawesi, where only seven of the 386 Malesian dipterocarp
tree species are present (Ashton, 1982), none reaching
elevations higher than 500 m (Kessler et al., 2002). It seems
that the niches filled by the Dipterocarpaceae in western
Malesia are, in Sulawesi, mostly occupied by other Gondwanan
elements with a strictly tropical distribution, among them
many magnoliids. The submontane forest of Sulawesi resem-
bles a submontane forest (900 m) in Papua New Guinea,
where the Lauraceae play a pronounced role (Wright et al.,
1997). Phylogenetic diversity analysis supports these findings
by showing that it is highest at submontane elevation when
Figure 5 (a) Number of trees with d.b.h. ‡ 10 cm (n ha)1) and (b) estimated aboveground biomass of all trees with d.b.h. ‡ 2 cm
(Mg ha)1) in relation to the biogeography of vascular plant families along the elevational transect in Sulawesi. 1, Centred temperate; 2,
tropical montane; 3, endemic to Malesia; 4, tree ferns.
Elevational trends in tropical forest aboveground biomass
Journal of Biogeography 37, 960–974 969ª 2010 Blackwell Publishing Ltd

considering angiosperms only (Table 3). In contrast, Slik et al.
(2009) showed that, in Borneo, angiosperm phylogenetic
diversity is highest at high elevations, indicating that basal
angiosperm lineages become more common, whereas at lower
elevations phylogenetically more homogeneous groups dom-
inate, namely members of the Dipterocarpaceae (rosids II).
The largely tropical genera Castanopsis and Lithocarpus
(Fagaceae) are community-dominant in the Sulawesi plots,
occurring along the entire transect with greatest presence at
mid-elevations. Both genera emerged at least 40 Ma in the
Southeast Asian wet tropics, where today they have their
species density centres and where tropical rain forests have
since been continuously present (Manos & Stanford, 2001;
Cannon & Manos, 2003; Manos et al., 2008). In western
Malesia, the Dipterocarpaceae became dominant and experi-
enced their major radiation in Asian everwet forests about
25 Ma. Subsequently in the Miocene, the Fagaceae evolved to
become the most species-rich family in the tropical uplands
(Morley, 2000). Tropical beech family members often produce
remarkably high AGB at mid- to upper montane elevations,
even though they are not always dominant, as for example on
Tertiary sedimentary rocks at Mt Kinabalu, Malaysia (Aiba &
Kitayama, 1999). In New Guinea, C. acuminatissima and other
Fagaceae are important in lower and mid-montane forests,
locally forming pure stands (Soepadmo, 1972; Johns et al.,
2007). Thus Ashton’s assumption (Ashton, 1988; Corlett,
2007) that both the Dipterocarpaceae and the Fagaceae thin
out east of Wallace’s Line holds true for the Dipterocarpaceae.
However, the situation is different for the Fagaceae, which
occur with relatively few species in Wallacea (Soepadmo,
1972), but are nonetheless very important in terms of AGB in
Eastern Malesian montane forests.
A major shift in species composition and floristic affinity
occurs between mid- and upper montane elevations along the
Sulawesi transect, where phylogenetic diversity (considering
angiosperms, tree ferns and conifers) is highest because ‘old’ tree
families intermingle with ‘young’ tree families. Higher up,
tropical southern hemispheric conifers, together with tree ferns
and families endemic to Australasia (Trimeniaceae, Paracryphi-
aceae), gain dominance. The community dominance of conifers
in the upper montane forest of Sulawesi reflects the situation in
other high mountains of tropical Southeast Asia (Grubb &
Stevens, 1985; Aiba & Kitayama, 1999; Johns et al., 2007). But
with respect to elevational change in phylogenetic diversity,
Sulawesi seems to differ from other tropical mountains, for
example in Borneo (Slik et al., 2009) and East Africa (Tallents
et al., 2005), where a linear increase in phylogenetic diversity
was reported. In Sulawesi, phylogenetic diversity is lowest at
mid-elevations, largely determined by the high abundance of
Fagaceae, and highest at upper montane elevations.
Regional variability and elevational trends in the AGB
of tropical moist forests
Plotting the AGB of seven tropical old-growth mountain forest
transects against elevation up to 3000 m reveals a pronounced
elevational AGB decrease in the majority of cases (Fig. 6). At
low elevations, AGB reported from moist forests at the base of
Mt Kinabalu, Malaysia, exceeds the corresponding values both
of montane forests in this region (Kitayama & Aiba, 2002) and
of lowland rain forests in the Neotropics (Weaver & Murphy,
1990; Lieberman et al., 1996; Raich et al., 1997; Wang et al.,
2003; Malhi et al., 2006). This discrepancy may be explained
by the fact that Southeast Asian lowland forests dominated by
ectomycorrhizal Dipterocarpaceae are generally taller than rain
forests elsewhere (de Gouvenain & Silander, 2003), and that
the type of mycorrhiza (ectomycorrhiza versus arbuscular
mycorrhiza) might be important for biomass accumulation.
The transects in Puerto Rico and Hawai’i are unique in the
sense that they refer to island forests with an oceanic climate
and a comparatively small ‘Massenerhebung’ effect (Grubb,
1971), which lowers the alpine timberline. Raich et al. (1997)
also relate low AGB values at Hawai’ian old-growth forest sites
to high rainfall together with a slow rate of soil development.
Figure 6 Comparison of estimated aboveground tree biomass
(Mg ha)1) in relation to elevation (m a.s.l.) in Southeast Asian and
Neotropical forests. Data points from transect studies are con-
nected by lines. Filled symbols indicate major (> 15 m2 ha)1),
half-filled symbols minor (5–7 m2 ha)1), and empty symbols no
contribution of the Fagaceae to the stand basal area. Sulawesi
(circles): this study. Ecuador (squares): Moser et al. (2008).
Malaysia (up-triangles): S (sediments) and U (ultra-basics), Aiba
& Kitayama (1999) and Kitayama & Aiba (2002). Puerto Rico
(boxes): Weaver & Murphy (1990) and Wang et al. (2003).
Hawai’i (right-triangles): old flows > 3400 years, Raich et al.
(1997). Costa Rica (diamonds): L, Lieberman et al. (1996), cal-
culated from stand volume data and mean wood specific gravity of
species composition; B, Blaser (1987), calculated from species
volume data and wood specific gravity, the forests close to the
timber line are dominated at a level of 95% and 98%, respectively,
by Quercus species (Fagaceae).
H. Culmsee et al.
970 Journal of Biogeography 37, 960–974ª 2010 Blackwell Publishing Ltd
Thus multiple factors, including tree species functional traits,
the biogeography of species, and climatic and edaphic
differences, might be responsible for the observed considerable
AGB variability both between regions and along elevational
gradients.
However, there are notable exceptions from the elevational
trend of decreasing AGB. All high-elevation forests that show
high AGB have in common a preponderance of Fagaceae. The
montane forests of our Sulawesi transect study and of that on
sedimentary rocks at Mt Kinabalu (Malaysia S, sediments,
1700–2700 m a.s.l.), both dominated by Fagaceae, apparently
show no elevational AGB decrease. Also, upper montane oak
cloud forests in Costa Rica possess extremely high AGB (381
and 477 Mg ha)1 at 2650 m; Blaser, 1987). This contrasts with
the Costa Rican Volcan Barva transect study (Lieberman et al.,
1996), where oaks are mostly absent and estimated AGB at
2600 m a.s.l. is > 250 Mg ha)1 lower. Moreover, at Volcan
Barva neither AGB nor basal area or stem density shows a
directional elevational trend. AGB is lowest at mid-elevation
sites, which may be attributable to marked changes in soil type
and topography along the transect (Clark & Clark, 2000).
The role of Fagaceae in tropical montane rain forests
The phenomenon of invariant AGB along elevational gradi-
ents in montane forests of Sulawesi may be explained by the
specific role played by the Fagaceae in terms of AGB
production. Present-day genus-level diversity within Fagaceae
is concentrated in the montane forests of Southeast Asia
(Manos & Stanford, 2001; Manos et al., 2008). Unlike for
other tree families of strictly tropical distribution, the
relatively low temperatures characteristic of montane forests
do not seem to be disadvantageous for tropical Fagaceae.
By referring to this putative adaptation, the presence of
Lithocarpus in pollen records is used to infer cooler
temperatures in lowland sites (Dam et al., 2001). Accord-
ingly, the transition to cooler, more seasonal climates is
thought to have promoted the spread of the genus Quercus
L. in northern latitude temperate forests (Manos & Stanford,
2001). However, in contrast, the current geographical
distribution patterns of Lithocarpus and Castanopsis indicate
an intolerance of seasonal climates (Soepadmo, 1972;
Cannon & Manos, 2003). Outside Southeast Asia, only in
certain upper montane Neotropical Quercus forests in
Central America do the Fagaceae play a similar ecological
role in terms of AGB. However, the current elevational range
of the Neotropical oaks is large (1000–3500 m a.s.l., Kappelle
& Brown, 2001) and the forests may be younger at least at
their southern range limit in Colombia, where they began to
form less than 1 Ma (van’t Veer & Hooghiemstra, 2000).
Thus specific ecological traits that favour adaptation to cool
montane habitats, the long evolutionary history and prob-
ably the presence of the dipterocarps in the lowlands may
have led to the unique importance in terms of AGB of this
family in Southeast Asian compared with Neotropical
montane forests.
CONCLUSIONS
Reducing emissions resulting from deforestation in develop-
ing countries (REDD) is of central importance in efforts to
combat climate change. The carbon stored in the AGB of
trees is that which is the most directly affected by defores-
tation and degradation, and the most relevant in reforestation
efforts (Gibbs et al., 2007). A major gap in our current
knowledge of the global carbon cycle is the size and
variability of the carbon pools in tropical forests (Kauffman
et al., 2009). The results from ground-based forest inventories
in the montane forests of Central Sulawesi show no trend in
AGB with elevation (301–323 Mg ha)1 from 1050 to 2400 m
a.s.l.). Our results demonstrate that AGB of tropical forests
may, to a large degree, be determined by species traits and
shifts in species composition with elevation. As wood specific
gravity is phylogenetically conserved, relying on published
averages for trees in certain forest types can give incorrect
results in the face of changes in taxonomic composition
across environmental gradients. The high variability in
primary montane forest AGB between different regions is
evidenced by the large differences between Southeast Asian
and Neotropical forest. The importance of Southeast Asian
montane rain forests dominated by Fagaceae as carbon stores
deserves greater attention.
ACKNOWLEDGEMENTS
This research was conducted in the context of the Collabora-
tive Research Centre ‘Stability of Rainforest Margins in
Indonesia’ SFB 552 at the University of Gottingen, funded by
the DFG (German Research Foundation). Plant identification
was supported by EU Synthesys grant NL-TAF 3317 to H.C.
The financial support is gratefully acknowledged. Hardianto
Mangopo and Sahar Sabir (Palu) greatly assisted field work.
Max van Balgooy (Leiden) supported H.C. with discussion on
species identification. We thank Miles Silman and two
anonymous referees for offering very helpful comments and
fruitful discussion.
REFERENCES
Aiba, S. & Kitayama, K. (1999) Structure, composition and
species diversity in an altitude–substrate matrix of rain
forest tree communities on Mount Kinabalu, Borneo. Plant
Ecology, 140, 139–157.
Aiba, S., Hanya, G., Tsujino, R., Takyu, M., Seino, T., Kimura,
K. & Kitayama, K. (2007) Comparative study of additive
basal area of conifers in forest ecosystems along elevational
gradients. Ecological Research, 22, 439–450.
Araujo, T.M., Higuchi, N. & Carvalho, J.A. (1999) Comparison
of formulae for biomass content determination in a tropical
rain forest site in the state of Para, Brazil. Forest Ecology and
Management, 117, 43–52.
Ashton, P.S. (1982) Dipterocarpaceae. Flora Malesiana, series
1, 9, 237–552.
Elevational trends in tropical forest aboveground biomass
Journal of Biogeography 37, 960–974 971ª 2010 Blackwell Publishing Ltd

Ashton, P.S. (1988) Dipterocarp biology as a window to the
understanding of tropical forest structure. Annual Review of
Ecology and Systematics, 19, 347–370.
Ashton, P.S. (2003) Floristic zonation of tree communities
on wet tropical mountains revisited. Perspectives in Plant
Ecology, Evolution and Systematics, 6, 87–104.
Baker, T.R., Phillips, O.L., Malhi, Y., Almeida, S., Arroyo, L.,
Di Fiore, A., Erwin, T., Killeen, T.J., Laurance, S.G., Lau-
rance, W.F., Lewis, S.L., Lloyd, J., Monteagudo, A., Neill,
D.S., Patino, S., Pitman, N.C.A., Silva, J.N.M. & Martınez,
R.V. (2004) Variation in wood density determines spatial
patterns in Amazonian forest biomass. Global Change Biol-
ogy, 10, 201–220.
Bellingham, P.J. & Sparrow, A.D. (2009) Multi-stemmed trees
in montane rain forests: their frequency and demography in
relation to elevation, soil nutrients and disturbance. Journal
of Ecology, 97, 472–483.
Blaser, J. (1987) Standortliche und waldkundliche Analyse
eines Eichen-Wolkenwaldes (Quercus spp.) der Montanstufe
in Costa Rica. Gottinger Beitrage zur Land- und Forstwirts-
chaft in den Tropen und Subtropen, 26, 1–235.
ter Braak, C.J.F. & Smilauer, P. (2002) CANOCO reference
manual and CANODRAW for Windows user’s guide. Software
for Canocical Community Ordination, version 4.5. Biometris,
Wageningen & Ceske Budejovice.
Cannon, C.H. & Manos, P.S. (2003) Phylogeography of the
Southeast Asian stone oaks (Lithocarpus). Journal of Bio-
geography, 30, 211–226.
Cannon, C.H., Summers, M., Harting, J.R. & Kessler, P.J.A.
(2007) Developing conservation priorities based on forest
type, condition, and threats in a poorly known ecoregion:
Sulawesi, Indonesia. Biotropica, 39, 747–759.
Chave, J., Andalo, C., Brown, S., Cairns, M.A., Chambers, J.Q.,
Eamus, D., Folster, H., Fromard, F., Higuchi, N., Kira, T.,
Lescure, J.-P., Nelson, B.W., Ogawa, H., Puig, H., Riera, B.
& Yamakura, T. (2005) Tree allometry and improved esti-
mation of carbon stocks and balance in tropical forests.
Oecologia, 145, 87–99.
Chave, J., Muller-Landau, H.C., Baker, T.R., Easdale, T.A., ter
Steege, H. & Webb, C.O. (2006) Regional and phylogenetic
variation of wood density across 2456 Neotropical tree
species. Ecological Applications, 16, 2356–2367.
Clark, D.A. (2004) Sources or sinks? The response of tropical
forests to current and future climate and atmospheric
composition. Philosophical Transactions of the Royal Society
B: Biological Sciences, 359, 477–491.
Clark, D.A., Brown, S., Kicklighter, D.W., Chambers, J.Q.,
Thomlinson, J.R., Ni, J. & Holland, E.A. (2001) Net pri-
mary production in tropical forests: an evaluation and
synthesis of existing field data. Ecological Applications, 11,
371–384.
Clark, D.B. & Clark, D.A. (2000) Landscape-scale variation in
forest structure and biomass in a tropical rain forest. Forest
Ecology and Management, 137, 185–198.
Colwell, R.K. (2006) EstimateS: statistical estimation of species
richness and shared species from samples (software and user’s
guide), version 8. Available at: http://viceroy.eeb.uconn.edu/
estimates (accessed 6 January 2008).
Coomes, D.A. & Allen, R.B. (2007) Effects of size, competition
and altitude on tree growth. Journal of Ecology, 95, 1084–
1097.
Corlett, R.T. (2007) What’s so special about Asian tropical
forests? Current Science, 93, 1551–1557.
Culmsee, H. (2008) Dysoxylum quadrangulatum, and notes on
Meliaceae in Sulawesi. Blumea, 53, 602–606.
Culmsee, H. & Pitopang, R. (2009) Tree diversity in sub-
montane and lower montane primary rain forests in Central
Sulawesi. Blumea, 54, 119–123.
Dam, R.C.A., Fluin, J., Suparan, P. & van der Kaars, S. (2001)
Palaeoenvironmental developments in the Lake Tondano
areas (N. Sulawesi, Indonesia) since 33,000 yr B.P. Palaeo-
geography, Palaeoclimatology, Palaeoecology, 171, 147–183.
Davies, T.J., Barraclough, T.G., Chase, M.W., Soltis, P.S.,
Soltis, D.E. & Savolainen, V. (2004) Darwin’s abominable
mystery: insights from a supertree of the angiosperms.
Proceedings of the National Academy of Sciences USA, 101,
1904–1909.
Dixon, R.K., Brown, S., Houghton, R.A., Solomon, A.M.,
Trexler, M.C. & Wisniewski, J. (1994) Carbon pools and flux
of global forest ecosystems. Science, 263, 185–190.
Enright, N.J. & Ogden, J. (1995) The southern conifers – a
synthesis. Ecology of the southern conifers (ed. by N.J. Enright
and R.S. Hill), pp. 271–287. Melbourne University Press,
Melbourne.
FAO (2006) World reference base for soil resources 2006. A
framework for international classification, correlation and
communication. World Soil Resources Reports, 103, 1–128.
Gibbs, H.K., Brown, S., Niles, J.O. & Foley, J.A. (2007) Mon-
itoring and estimating tropical forest carbon stocks: making
REDD a reality. Environmental Research Letters, 2, 045023.
Gotelli, N.J. & Colwell, R.K. (2001) Quantifying biodiversity:
procedures and pitfalls in the measurement and comparison
of species richness. Ecology Letters, 4, 379–391.
de Gouvenain, R.C. & Silander, J.A. (2003) Do tropical storm
regimes influence the structure of tropical lowland rain
forests? Biotropica, 35, 166–180.
Grubb, P.J. (1971) Interpretation of the ‘Massenerhebung’
effect on tropical mountains. Nature, 229, 44–45.
Grubb, P.J. & Stevens, P.F. (1985) The forests of the Fatima
Basin and Mt Kerigomna, Papua New Guinea, with a review
of montane and subalpine rainforests in Papuasia. Australian
National University, Canberra.
Halle, F., Oldeman, R.A.A. & Tomlinson, P.B. (1978) Tropical
trees and forests: an architectural analysis. Springer, Heidel-
berg.
Hamann, A., Barbon, E.B., Curio, E. & Madulid, D.A. (1999) A
botanical inventory of a submontane tropical rainforest on
Negros Island, Philippines. Biodiversity and Conservation, 8,
1017–1031.
Heywood, V.H., Brummit, R.K., Culham, A. & Seberg, O.
(2007) Flowering plant families of the world. Firefly Books,
Ontario.
H. Culmsee et al.
972 Journal of Biogeography 37, 960–974ª 2010 Blackwell Publishing Ltd

Hijmans, R.J., Cameron, S.E., Parra, J.L., Jones, P.G. & Jarvis,
A. (2005) Very high resolution interpolated climate surfaces
for global land areas. International Journal of Climatology,
25, 1965–1978.
IPNI (2008) The International Plant Names Index. Available at:
http://www.ipni.org (accessed 14 August 2009).
Johns, R.T., Shea, G.A., Vink, W. & Puradyatmika, P. (2007)
Montane vegetation of Papua. The ecology of Papua (ed. by
A.J. Marshall and B.M. Beehler), pp. 977–1024. Periplus,
Singapore.
Kappelle, M. & Brown, A.D. (2001) Bosques nublados del
neotropico. INBio, Santo Domingo de Heredia, Costa Rica.
Kauffman, J.B., Hughes, R.F. & Heider, C. (2009) Carbon pool
and biomass dynamics associated with deforestation, land
use, and agricultural abandonment in the neotropics.
Ecological Applications, 19, 1211–1222.
Kessler, M. (2002) The elevational gradient of Andean plant
endemism: varying influences of taxon-specific traits and
topography at different taxonomic levels. Journal of Bio-
geography, 29, 1159–1165.
Kessler, P.J.A., Bos, M.M., Sierra Daza, S.E.C., Kop, A., Wil-
lemse, L.P.M., Pitopang, R. & Gradstein, S.R. (2002)
Checklist of woody plants of Sulawesi, Indonesia. Blumea
Supplement, 14, 1–160.
Kitayama, K. & Aiba, S. (2002) Ecosystem structure and pro-
ductivity of tropical rain forests along altitudinal gradients
with contrasting soil phosphorus pools on Mount Kinabalu,
Borneo. Journal of Ecology, 90, 37–51.
Korner, C. (2007) The use of ‘altitude’ in ecological research.
Trends in Ecology and Evolution, 22, 569–574.
Lemmens, R.H.M.J., Soerianegara, I. & Wong, W.C. (1995)
Timber trees: minor commercial timbers. Plant resources of
South-East Asia, No. 5(2). Backhuys Publishers, Leiden.
Leuschner, C., Moser, G., Bertsch, C., Roderstein, M. & Hertel,
D. (2007) Large altitudinal increase in tree root/shoot ratio
in tropical mountain forests in Ecuador. Basic and Applied
Ecology, 8, 219–230.
Lewis, S.L., Phillips, O.L., Baker, T.R., Lloyd, J., Malhi, Y.,
Almeida, S., Higuchi, N., Laurance, W.F., Neill, D.A.,
Silva, J.N.M., Terborgh, J., Torres Lezama, A., Vasquez
Martınez, R., Brown, S., Chave, J., Kuebler, C., Nunez
Vargas, P. & Vinceti, B. (2004) Concerted changes in
tropical forest structure and dynamics: evidence from 50
South American long-term plots. Philosophical Transac-
tions of the Royal Society B: Biological Sciences, 359, 421–
436.
Lieberman, D., Lieberman, M., Peralta, R. & Harthorn, G.S.
(1996) Tropical forest structure and composition on a large-
scale altitudinal gradient in Costa Rica. Journal of Ecology,
84, 137–152.
Lusk, C.H. (2002) Basal area in a New Zealand podocarp-
broadleaved forest: are coniferous and angiosperm compo-
nents independent? New Zealand Journal of Botany, 40, 143–
147.
Magurran, A.E. (2004) Measuring biological diversity. Blackwell
Publishing, Oxford.
Malhi, Y. & Phillips, O.L. (2004) Tropical forests and global
atmospheric change: a synthesis. Philosophical Transactions
of the Royal Society B: Biological Sciences, 359, 549–555.
Malhi, Y., Wood, D., Baker, T.R. et al. (2006) The regional
variation of aboveground live biomass in old-growth
Amazonian forests. Global Change Biology, 12, 1107–1138.
Manos, P.S. & Stanford, A.M. (2001) The historical biogeo-
graphy of Fagaceae: tracking the Tertiary history of tem-
perate and subtropical forests on the Northern Hemisphere.
International Journal of Plant Sciences, 162, S77–S93.
Manos, P.S., Cannon, C.H. & Oh, S.-H. (2008) Phylogenetic
relationships and taxonomic status of the paleoendemic
Fagaceae of western North America: recognition of a new
Genus, Notholithocarpus. Madrono, 55, 181–190.
Mayle, F.E., Beerling, D.J., Gosling, W.D. & Bush, M.B. (2004)
Responses of Amazonian ecosystems to climatic and atmo-
spheric carbon dioxide changes since the last glacial maxi-
mum. Philosophical Transactions of the Royal Society B:
Biological Sciences, 359, 499–514.
Morley, R.J. (2000) Origin and evolution of tropical rain forests.
Wiley, Chichester.
Moser, G., Roderstein, M., Soethe, N., Hertel, D. & Leuschner,
C. (2008) Altitudinal changes in stand structure and bio-
mass allocation of tropical mountain forests in relation to
microclimate and soil chemistry. Ecological Studies, 198,
229–242.
Munzel, U. & Hothorn, L.A. (2001) A unified approach to
simultaneous rank test procedures in the unbalanced one-
way layout. Biometrical Journal, 43, 553–569.
Myers, N., Mittermeier, R.A., Mittermeier, C.G., da Fonseca,
G.A.B. & Kent, J. (2000) Biodiversity hotspots for conser-
vation priorities. Nature, 403, 853–858.
Oey, D.S. (1990) Berat jenis dari jenis-jenis kayu berat Indonesia
dan pengertian beratnya kayu untuk keperluan praktek.
FRPDC, Forestry Department, Bogor.
Ohsawa, M. (1993) Latitudinal pattern of mountain vegetation
zonation in southern and eastern Asia. Journal of Vegetation
Science, 4, 13–18.
Phillips, O.L., Malhi, Y., Vinceti, B., Baker, T., Lewis, S.L.,
Higuchi, N., Laurance, W.F., Nunez Vargas, P., Vasquez
Martinez, R., Laurance, S., Ferreira, L.V., Stern, M., Brown,
S. & Grace, J. (2002) Changes in growth of tropical forests:
evaluating potential biases. Ecological Applications, 12, 576–
587.
Raich, J.W., Russell, A.E. & Vitousek, P.M. (1997) Primary
productivity and ecosystem development along an elevational
gradient on Mauna Loa, Hawai’i. Ecology, 78, 707–721.
Rao, C.R. (1982) Diversity and dissimilarity coefficients – a
unified approach. Theoretical Population Biology, 21, 24–43.
Saatchi, S.S., Houghton, R.A., Dos Santos Alvala, R.C., Soares,
J.V. & Yu, Y. (2007) Distribution of aboveground live bio-
mass in the Amazon basin. Global Change Biology, 13, 816–
837.
Slik, J.W.F. (2006) Estimating species-specific wood density
from the genus average in Indonesian trees. Journal of
Tropical Ecology, 22, 481–482.
Elevational trends in tropical forest aboveground biomass
Journal of Biogeography 37, 960–974 973ª 2010 Blackwell Publishing Ltd

Slik, J.W.F., Raes, N., Aiba, S.-I., Brearley, F.Q., Cannon, C.H.,
Meijaard, E., Nagamasu, H., Nilus, R., Paoli, G., Poulsen,
A.D., Sheil, D., Suzuki, E., van Valkenburg, J.L.C.H., Webb,
C.O., Willie, P. & Wulffraat, S. (2009) Environmental cor-
relates for tropical tree diversity and distribution patterns in
Borneo. Diversity and Distributions, 15, 523–532.
Smilauer, P. (2002–2003) Winkyst version 1.0. Available at:
http://www.canodraw.com/winkyst.htm (accessed 23 Octo-
ber 2003).
Sodhi, N.S., Koh, L.P., Brook, B.W. & Ng, P.K.L. (2004)
Southeast Asian biodiversity: an impending disaster. Trends
in Ecology and Evolution, 19, 655–660.
Soepadmo, E. (1972) Fagaceae. Flora Malesiana, series 1, 7,
265–403.
Soerianegara, I. & Lemmens, R.H.M.J. (1993) Timber trees:
major commercial timbers. Plant Resources of South-East
Asia, No. 5(1). Backhuys Publishers, Leiden.
Sosef, M.S.M., Hong, L.T. & Prawirohatmodjo, S. (1998)
Timber trees: lesser-known timbers. Plant Resources of
South-East Asia, No. 5(3). Backhuys Publishers, Leiden.
Stevens, P.F. (2001 onwards) Angiosperm Phylogeny Website.
Version 9, June 2008. Available at: http://www.mobot.org/
MOBOT/research/APweb (accessed 10 April 2009).
Tallents, L.A., Lovett, J.C., Hall, J.B. & Hamilton, A.C. (2005)
Phylogenetic diversity of forest trees in the Usambara
mountains of Tanzania: correlations with altitude. Botanical
Journal of the Linnean Society, 149, 217–228.
UNFCCC (2007) Report of the conference of the parties on its
thirteenth session, held in Bali from 3 to 15 December 2007.
Decision /FCCC/CP/2007/6/Add.1, Decision 2/CP.13. United
Nations Framework Convention on Climate Change.
VanDerWal, J., Shoo, L.P. & Williams, S.E. (2009) New
approaches to understanding late Quaternary climate
fluctuations and refugial dynamics in Australian wet
tropical rain forests. Journal of Biogeography, 36, 291–
301.
van’t Veer, R. & Hooghiemstra, H. (2000) Montane forest
evolution during the last 650 000 yr in Colombia: a multi-
variate approach based on pollen record Funza-I. Journal of
Quaternary Science, 15, 329–346.
Wang, H.Q., Hall, C.A.S., Scatena, F.N., Fetcher, N. & Wu, W.
(2003) Modelling the spatial and temporal variability in
climate and primary productivity across the Luquillo
Mountains, Puerto Rico. Forest Ecology and Management,
179, 69–94.
Weaver, P.L. & Murphy, P.G. (1990) Forest structure and
productivity in Puerto Rico, Luquillo Mountains. Biotropica,
22, 69–82.
Webb, C.O., Ackerly, D.D. & Kembel, S.W. (2008a) Phylocom:
software for the analysis of phylogenetic community struc-
ture and trait evolution. Bioinformatics, 24, 2098–2100.
Webb, C.O., Cannon, C.H. & Stuart, J.D. (2008b) Ecological
organization, biogeography, and the phylogenetic structure
of tropical forest tree communities. Tropical forest commu-
nity ecology (ed. by W.P. Carson and S.A. Schnitzer), pp. 79–
97. Wiley-Blackwell, Chichester.
WorldClim (2006) WorldClim version 1.4, Bioclim ESRI grids
30 arc-seconds (�1 km) resolution. Available at: http://
www.worldclim.org (accessed 6 August 2008).
Wright, D.D., Jessen, J.H., Burke, P. & Gomez de Silva Garza,
H. (1997) Tree and liana enumeration and diversity on a
one-hectare plot in Papua New Guinea. Biotropica, 29,
250–260.
BIOSKETCH
Heike Culmsee is a postdoctoral researcher working on the
diversity and ecology of natural and managed plant commu-
nities. Her current research focuses on tree systematics (Flora
Malesiana) and the diversity of natural mountain forests in the
wet tropics of Sulawesi.
All authors are members of the Collaborative Research Centre
SFB 552 ‘Stability of rain forest margins in Indonesia’ at the
University of Gottingen, funded by the German Research
Foundation DFG (http://www.dfg.de).
Author contributions: H.C. and R.P. collected the data in the
field; H.C. identified the tree species and analysed the data;
G.M. reviewed the literature for cross-continental compari-
sons; and H.C. and C.L. discussed the results and led the
writing.
Editor: Miles Silman
H. Culmsee et al.
974 Journal of Biogeography 37, 960–974ª 2010 Blackwell Publishing Ltd
Copyright © 2022 FDOKUMEN