Fagaceae Trees
27
CHAPTER 5 5 Fagaceae Trees Antoine Kremer 1 , Manuela Casasoli 2 , Teresa Barreneche 3 , Catherine Bodénès 1 , Paul Sisco 4 , Thomas Kubisiak 5 , Marta Scalfi 6 , Stefano Leonardi 6 , Erica Bakker 7 , Joukje Buiteveld 8 , Jeanne Romero-Severson 9 , Kathiravetpillai Arumuganathan 10 , Jeremy Derory 1 , Caroline Scotti-Saintagne 11 , Guy Roussel 1 , Maria Evangelista Bertocchi 1 , Christian Lexer 12 , Ilga Porth 13 , Fred Hebard 14 , Catherine Clark 15 , John Carlson 16 , Christophe Plomion 1 , Hans-Peter Koelewijn 8 , and Fiorella Villani 17 1 UMR Biodiversité Gènes & Communautés, INRA, 69 Route d’Arcachon, 33612 Cestas, France, e-mail: [email protected] 2 Dipartimento di Biologia Vegetale, Università “La Sapienza”, Piazza A. Moro 5, 00185 Rome, Italy 3 Unité de Recherche sur les Espèces Fruitières et la Vigne, INRA, 71 Avenue Edouard Bourlaux, 33883 Villenave d’Ornon, France 4 The American Chestnut Foundation, One Oak Plaza, Suite 308 Asheville, NC 28801, USA 5 Southern Institute of Forest Genetics, USDA-Forest Service, 23332 Highway 67, Saucier, MS 39574-9344, USA 6 Dipartimento di Scienze Ambientali, Università di Parma, Parco Area delle Scienze 11/A, 43100 Parma, Italy 7 Department of Ecology and Evolution, University of Chicago, 5801 South Ellis Avenue, Chicago, IL 60637, USA 8 Alterra Wageningen UR, Centre for Ecosystem Studies, P.O. Box 47, 6700 AA Wageningen, The Netherlands 9 Department of Biological Sciences, University of Notre Dame, Notre Dame, IN 46556, USA 10 Flow Cytometry and Imaging Core Laboratory, Benaroya Research Institute at Virginia Mason, 1201 Ninth Avenue, Seattle, WA 98101, USA 11 UMR Ecologie des Forêts de Guyane, INRA, Campus agronomique BP 709, Avenue de France, 97387 Kourou, French Guyana 12 Jodrell Laboratory, Royal Botanic Gardens, Kew, Richmond, Surrey TW9 3DS, UK 13 Austrian Research Centre, 2444 Seibersdorf, Austria 14 The American Chestnut Foundation Research Farms, 14005 Glenbrook Avenue, Meadowview, VA 24361, USA 15 Department of Forestry, North Carolina State University, Box 8008, Raleigh, NC 27695-8008, USA 16 The School of Forest Resources and Huck Institutes for Life Sciences, Pennsylvania State University, 323 Forest Resources Building, University Park, PA 16802, USA 17 Istituto per l’Agroselvicoltura, CNR, V.le G. Marconi, 2 - 05010, Porano, Italy 5.1 Introduction Worldwide, there are more than 1,000 species belong- ing to the Fagaceae. All Fagaceae species are woody plants and are spread throughout the northern hemi- sphere, from the tropical to the boreal regions. The family comprises seven genera (Govaerts and Frodin 1998), and the number of species is extremely vari- able among genera: Castanea (12), Castanopsis (100 to 200), Chrysolepis (2), Fagus (11), Lithocarpus (300), Quercus (450 to 600), Trigonobalanus (3). Oaks (Quer- cus), chestnuts (Castanea), and beeches (Fagus) are widely used in forestry for wood products over the three continents (Asia, Europe, and America) and are important economic species. Consequently, they have received more attention in forest genetic research than other genera. In addition to their cultivation in forestry, chestnuts are also used for their fruit pro- duction and have been partially domesticated for that purpose. Castanopsis and Lithocarpus are important ecological components of the Asian flora and have recently been investigated for their biological diver- sity (Cannon and Manos 2003). The remaining genera comprise only a very few species and for the time being have been studied mainly in botany and taxonomy. Genetic research in Fagaceae has been restricted to the three genera of economic importance (Cas- tanea, Fagus, and Quercus), although activities in phylogeny and evolutionary genetics have recently encompassed the whole family (Manos and Stanford 2001; Manos et al. 2001). Because of their long rota- tion times, breeding activities in the three main gen- era have been limited (Kremer et al. 2004). However, population differentiation has been investigated in a very large number of species, with the main aim of identifying geographic patterns or historical foot- Genome Mapping and Molecular Breeding in Plants, Volume 7 Forest Trees C. Kole (Ed.) © Springer-Verlag Berlin Heidelberg 2007
Transcript of Fagaceae Trees
CHAPTER 5
5 Fagaceae Trees
Antoine Kremer1, Manuela Casasoli2, Teresa Barreneche3, Catherine Bodénès1, Paul Sisco4, ThomasKubisiak5, Marta Scalfi6, Stefano Leonardi6, Erica Bakker7, Joukje Buiteveld8, Jeanne Romero-Severson9,Kathiravetpillai Arumuganathan10, Jeremy Derory1, Caroline Scotti-Saintagne11, Guy Roussel1, MariaEvangelista Bertocchi1, Christian Lexer12, Ilga Porth13, Fred Hebard14, Catherine Clark15, John Carlson16,Christophe Plomion1, Hans-Peter Koelewijn8, and Fiorella Villani17
1 UMR Biodiversité Gènes & Communautés, INRA, 69 Route d’Arcachon, 33612 Cestas, France, e-mail:[email protected]
2 Dipartimento di Biologia Vegetale, Università “La Sapienza”, Piazza A. Moro 5, 00185 Rome, Italy3 Unité de Recherche sur les Espèces Fruitières et la Vigne, INRA, 71 Avenue Edouard Bourlaux, 33883 Villenave d’Ornon,
France4 The American Chestnut Foundation, One Oak Plaza, Suite 308 Asheville, NC 28801, USA5 Southern Institute of Forest Genetics, USDA-Forest Service, 23332 Highway 67, Saucier, MS 39574-9344, USA6 Dipartimento di Scienze Ambientali, Università di Parma, Parco Area delle Scienze 11/A, 43100 Parma, Italy7 Department of Ecology and Evolution, University of Chicago, 5801 South Ellis Avenue, Chicago, IL 60637, USA8 Alterra Wageningen UR, Centre for Ecosystem Studies, P.O. Box 47, 6700 AA Wageningen, The Netherlands9 Department of Biological Sciences, University of Notre Dame, Notre Dame, IN 46556, USA
10 Flow Cytometry and Imaging Core Laboratory, Benaroya Research Institute at Virginia Mason, 1201 Ninth Avenue, Seattle,WA 98101, USA
11 UMR Ecologie des Forêts de Guyane, INRA, Campus agronomique BP 709, Avenue de France, 97387 Kourou, French Guyana12 Jodrell Laboratory, Royal Botanic Gardens, Kew, Richmond, Surrey TW9 3DS, UK13 Austrian Research Centre, 2444 Seibersdorf, Austria14 The American Chestnut Foundation Research Farms, 14005 Glenbrook Avenue, Meadowview, VA 24361, USA15 Department of Forestry, North Carolina State University, Box 8008, Raleigh, NC 27695-8008, USA16 The School of Forest Resources and Huck Institutes for Life Sciences, Pennsylvania State University, 323 Forest Resources
Building, University Park, PA 16802, USA17 Istituto per l’Agroselvicoltura, CNR, V.le G. Marconi, 2 - 05010, Porano, Italy
5.1Introduction
Worldwide, there are more than 1,000 species belong-ing to the Fagaceae. All Fagaceae species are woodyplants and are spread throughout the northern hemi-sphere, from the tropical to the boreal regions. Thefamily comprises seven genera (Govaerts and Frodin1998), and the number of species is extremely vari-able among genera: Castanea (12), Castanopsis (100to 200), Chrysolepis (2), Fagus (11), Lithocarpus (300),Quercus (450 to 600), Trigonobalanus (3). Oaks (Quer-cus), chestnuts (Castanea), and beeches (Fagus) arewidely used in forestry for wood products over thethree continents (Asia, Europe, and America) andare important economic species. Consequently, theyhave receivedmoreattention in forest genetic researchthan other genera. In addition to their cultivation in
forestry, chestnuts are also used for their fruit pro-duction and have been partially domesticated for thatpurpose. Castanopsis and Lithocarpus are importantecological components of the Asian flora and haverecently been investigated for their biological diver-sity (Cannon and Manos 2003). The remaining generacompriseonlyavery fewspecies and for the timebeinghave been studied mainly in botany and taxonomy.
Genetic research in Fagaceae has been restrictedto the three genera of economic importance (Cas-tanea, Fagus, and Quercus), although activities inphylogeny and evolutionary genetics have recentlyencompassed the whole family (Manos and Stanford2001; Manos et al. 2001). Because of their long rota-tion times, breeding activities in the three main gen-era have been limited (Kremer et al. 2004). However,population differentiation has been investigated ina very large number of species, with the main aimof identifying geographic patterns or historical foot-
Genome Mapping and Molecular Breeding in Plants, Volume 7Forest TreesC. Kole (Ed.)© Springer-Verlag Berlin Heidelberg 2007

162 A. Kremer et al.
prints for molecular markers and phenotypic traitsof forestry relevance. Population genetics has drivenmost of the research activities in molecular geneticsand also genetic mapping, in contrast to other for-est tree species where tree improvement has been themain goal. Genetic maps have been constructed inat least one species of Quercus, Castanea, and Fagus.Because of their low genetic divergence, it quicklybecame obvious that molecular markers could be eas-ily transferred from Quercus to Castanea (and viceversa) but less easily to Fagus. These earlier find-ings led to further activities on comparative mappingacross genera, especially between Quercus and Cas-tanea.
5.1.1Evolutionary Biology and Phylogenyof the Fagaceae
Fossil remains indicate that the Fagaceae appearedat the transition between the secondary and tertiaryera. Remains of Dryophyllum, which is a fossil genusbelonging to the Fagaceae, were discovered in lay-ers belonging to the early Cretaceous (Jones 1986).Fossil remains that were unequivocally assigned toFagaceae and dated to the Upper Eocene and LateOligocene were found in North America (Herendeenet al. 1995) and Europe (Kvacek and Walther 1989).Differentiation of the various genera occurred dur-ing the mid Tertiary, and reported species of Fagaceaeat the late Tertiary resemble already extant species.The oldest reported genera belonging to the Fagaceaeoccurred in Southeast Asia, where the extant speciesdiversity is also the highest. The family originatedfrom Southeast Asia and radiated toward Europe andAmerica (Wen 1999; Xiang et al. 2000). Migration andmajor continental rearrangements contributed to dis-junction and vicariance within the family, especiallywithinQuercus (ManosandStanford2001). It is gener-ally accepted that most major oak groups essentiallyevolved in the areas where they reside today (Axel-rod 1983).
Phylogenetic investigations based on chloroplastor nuclear DNA data are poorly resolutive, suggest-ing that the differentiation into different genera wasextremely rapid during the mid Tertiary (Manos andSteele 1997; Manos et al. 2001). All genera are usuallyclustered into a “starlike” dendrogram (polytomy),except Fagus, which diverged earlier from the com-mon ancestor. However, there is a strong genomic
similarity between Quercus, Castanea, Lithocarpus,and Castanopsis. Paleontological records suggest thatQuercus and Castanea separated 60 million years ago(Crepet 1989). Interspecific separation within the gen-era Quercus, Fagus, and Castanea occurred between22and3millionyearsagoas inferred fromamolecularclock based on cpDNA divergence (Manos and Stan-ford 2001). The reduced genetic divergence among thedifferent genera was recently confirmed by the resultsobtained in transferring molecular tools and markersamong genera, as it is much more difficult to transfermicrosatellite markers from Quercus to Fagus than itis from Quercus to Castanea (Steinkellner et al. 1997;Barreneche et al. 2004).
5.1.2Ploidy, Karyotype, and Genome Size in Fagaceae
Reported karyotype studies in Quercus, Lithocarpus,Castanopsis, and Castanea (Mehra et al. 1972), inQuercus (D’Emerico et al. 1995), and Fagus (Ohriand Ahuja 1991) indicate that the number of chro-mosomes within the family is remarkably stable (2n= 24). Naturally occurring triploids have been men-tioned occasionally in oaks (Butorina 1993; Naujokset al. 1995). Extra chromosomes (2n = 24+1, 2 or 3)have been reported as consequences of irregular seg-regation in mitoses (Zoldos et al. 1998). Otherwise, C-banding comparisons have shown that the morphol-ogy of the chromosomes of Fagus (Ohri and Ahuja1991) and Quercus (Ohri and Ahuja 1990) are quitesimilar.
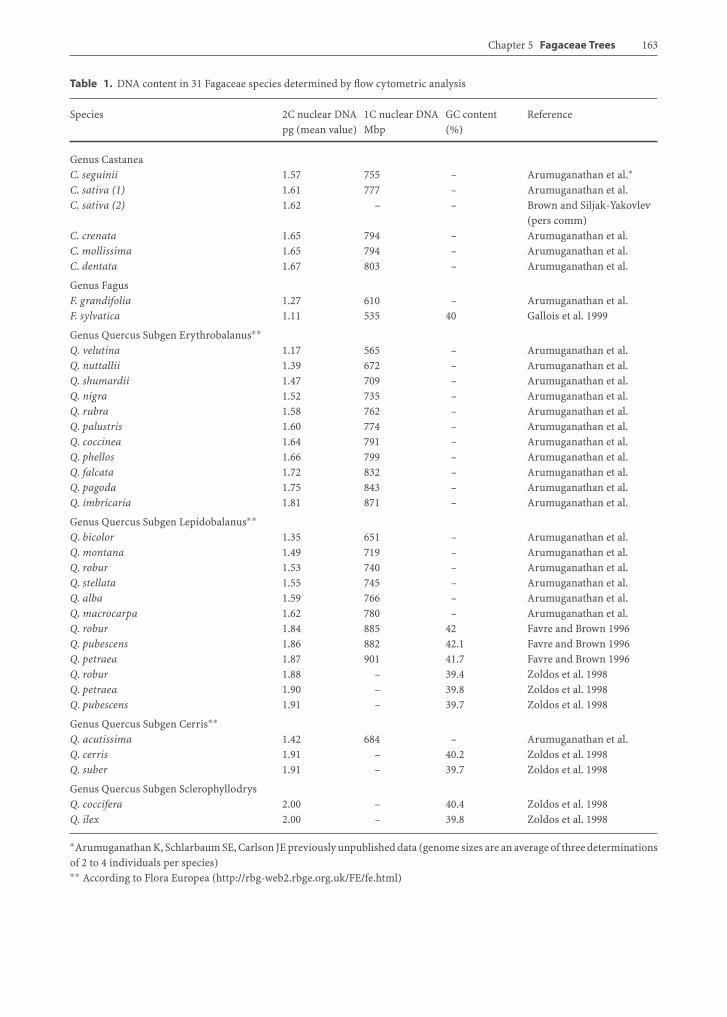
The DNA content is variable across genera in theFagaceae: the 2C DNA values varying from a lowof 1.11 pg in Fagus to a high of 2.0 pg in Quercusspecies (Table 1). GC content on the other hand ap-pears constant across genera (40%) and is similarto most higher plants (Table 1). All values reportedin Table 1 were obtained by flow cytometric analy-sis of interphasic nuclei and are slightly higher thanearlier assessments made with the Feulgen micro-densitometry method (Ohri and Ahuja 1990). The31 species in Table 1 represent a cross-section ofthe Fagaceae across the northern hemisphere. Thetwo Fagus species, Fagus grandifolia and F. sylvat-ica, were quite similar in genome size (1.27 and1.11 pg per 2C, respectively) and are at the lowerrange of genome sizes among the Fagaceae, sug-gesting that Fagus has either the most rudimen-tary genome or the most greatly reduced genome
Chapter 5 Fagaceae Trees 163
Table 1. DNA content in 31 Fagaceae species determined by flow cytometric analysis
Species 2C nuclear DNA 1C nuclear DNA GC content Referencepg (mean value) Mbp (%)
Genus CastaneaC. seguinii 1.57 755 – Arumuganathan et al.∗C. sativa (1) 1.61 777 – Arumuganathan et al.C. sativa (2) 1.62 – – Brown and Siljak-Yakovlev
(pers comm)C. crenata 1.65 794 – Arumuganathan et al.C. mollissima 1.65 794 – Arumuganathan et al.C. dentata 1.67 803 – Arumuganathan et al.
Genus FagusF. grandifolia 1.27 610 – Arumuganathan et al.F. sylvatica 1.11 535 40 Gallois et al. 1999
Genus Quercus Subgen Erythrobalanus∗∗Q. velutina 1.17 565 – Arumuganathan et al.Q. nuttallii 1.39 672 – Arumuganathan et al.Q. shumardii 1.47 709 – Arumuganathan et al.Q. nigra 1.52 735 – Arumuganathan et al.Q. rubra 1.58 762 – Arumuganathan et al.Q. palustris 1.60 774 – Arumuganathan et al.Q. coccinea 1.64 791 – Arumuganathan et al.Q. phellos 1.66 799 – Arumuganathan et al.Q. falcata 1.72 832 – Arumuganathan et al.Q. pagoda 1.75 843 – Arumuganathan et al.Q. imbricaria 1.81 871 – Arumuganathan et al.
Genus Quercus Subgen Lepidobalanus∗∗Q. bicolor 1.35 651 – Arumuganathan et al.Q. montana 1.49 719 – Arumuganathan et al.Q. robur 1.53 740 – Arumuganathan et al.Q. stellata 1.55 745 – Arumuganathan et al.Q. alba 1.59 766 – Arumuganathan et al.Q. macrocarpa 1.62 780 – Arumuganathan et al.Q. robur 1.84 885 42 Favre and Brown 1996Q. pubescens 1.86 882 42.1 Favre and Brown 1996Q. petraea 1.87 901 41.7 Favre and Brown 1996Q. robur 1.88 – 39.4 Zoldos et al. 1998Q. petraea 1.90 – 39.8 Zoldos et al. 1998Q. pubescens 1.91 – 39.7 Zoldos et al. 1998
Genus Quercus Subgen Cerris∗∗Q. acutissima 1.42 684 – Arumuganathan et al.Q. cerris 1.91 – 40.2 Zoldos et al. 1998Q. suber 1.91 – 39.7 Zoldos et al. 1998
Genus Quercus Subgen SclerophyllodrysQ. coccifera 2.00 – 40.4 Zoldos et al. 1998Q. ilex 2.00 – 39.8 Zoldos et al. 1998
∗Arumuganathan K, Schlarbaum SE, Carlson JE previously unpublished data (genome sizes are an average of three determinationsof 2 to 4 individuals per species)∗∗ According to Flora Europea (http://rbg-web2.rbge.org.uk/FE/fe.html)
164 A. Kremer et al.
among the Fagaceae. In addition, the small genomeof Quercus velutina at 1.17 pg per 2C is essentiallythe same as that of the Fagus species, again sug-gesting a basal genome size of about 1.2 pg per 2Cfor the Fagaceae. Among the 24 Quercus species pre-sented, the range of genome sizes is essentially con-tinuous up to a maximum of 2.0 pg per 2C in Q. coc-cifera and Q. ilex. We looked for any indication thatthe interspecific variation in the observed genomesizes followed the botanical subdivisions within Quer-cus. We used here the classification into four distinctbotanical subgenera from Flora Europaea (http://rbg-web2.rbge.org.uk/FE/fe.html). This classification cor-responds to earlier botanical descriptions of Schwarz(1964) and Camus (1936-1954) and recent molecu-lar analyses (Manos et al. 1999; Xu et al. 2005). Thespecies that were investigated include representativesof all four subgenera: 12 species in Erythrobalanus(red oaks), seven species in Lepidobalanus (whiteoaks), three species in Cerris, and two in Sclerophyl-lodrys. The average 2C DNA contents were 2.0 pg forsubgenus Sclerophyllodris, 1.75 pg for subgenus Cer-ris, 1.73 pg for subgenus Lepidobalanus, and 1.56 pgfor subgenus Erythrobalanus. The two oak specieswith the largest genomes, Q. coccifera and Q. ilex(2.0 pg), are both evergreen species and are part ofa disputed botanical subgenus (named Sclerophyl-lodrys, according to Schwarz 1964). This is intriguing,given that molecular phylogenetic analysis separatesthe evergreen species from the two sections of de-ciduous oaks (Manos and Steele 1997 and Xu et al.2005), confirming their earlier subdivision in Sclero-phyllodrys by Schwarz (1964).
Among the five Castanea species studied, genomesizes varied much less than among oaks, ranging onlyfrom 1.57 pg in C. seguinii to 1.67 pg per 2C in C. den-tata. In fact DNA content varied as much within thechestnut species as between. For example, unrelatedC. seguinii trees varied from 1.5 to 1.63 pg per 2C,while C. sativa varied from 1.57 to 1.65 pg per 2C(Arumuganathan et al. this study). Thus there maynot be significant differences in average DNA con-tent between Castanea species, and the range of av-erage DNA content reported among species in Ta-ble 1 may just represent the natural variation in DNAcontent among Castanea individuals. The intraspe-cific variation in DNA content in Quercus was alsoas extensive as the amount of variation among thespecies. For example, the 2C DNA content varied be-tween 1.88 pg and 2.0 pg among Q. petraea trees ofthe same populations (Zoldos et al. 1998), between
1.45 and 1.96 in Q. pagoda, and between 1.34 and 1.78in Q. macrocarpa (Arumuganathan et al. this study).The intraspecific variation may be due in part to theoccurrence of extra B chromosomes (Ohri and Ahuja1990; Zoldos et al. 1998). While the range of DNAcontent among oak species appears to be greater thanamong chestnut and beech species, the magnitudeof the differences among oak species may be relatedto experimental issues as well as biological ones. Forexample, the size estimates by Arumuganathan et al.(this study) were consistently smaller than those byFavre and Brown (1996) and Zoldos et al. (1998). Onecould speculate that the differences relate to the factthat Arumuganathan et al. (this study) studied pri-marily New World species, while the other two stud-ies dealt exclusively with Old World species. However,the three groups report different genome sizes forQ. robur (1.53, 1.84, and 1.88 pg per 2C, respectively).Whether this discrepancy has a biological basis (theArumuganathan et al. study sampled three trees ofQ. robur “fastigiata,” the “upright” horticultural va-riety) or resulted from experimental differences insampling, internal size standards, and other method-ologies is not clear.
In general, the genome sizes in the Fagaceae areonly3.5 to6 times larger than thegenomeofArabidop-sis (0.32 pg; Bennett et al. 2003) and are within thesize range of the sequenced rice and poplar genomes(both 1.0 pg; Brunner et al. 2004). Comparative ge-nomics should thus be relatively efficient within theFagaceae. Comparative genomics will lead to a bet-ter understanding of the extent to which the con-tinuous range of DNA content is related to adap-tive radiation of the species during evolution or isthe result of overlapping ranges and interspecies hy-bridizations. Knowledge of the genome sizes revealsthat genome-level comparisons between Fagus syl-vatica, Q. velutina, Q. coccifera, and Q. ilex wouldbe particularly informative and could illuminate therole of genome duplication in the evolution of theFagaceae. When comparative genomics studies areextended to more species within the Fagaceae, itwill be interesting to determine whether or not thebroader range of genome sizes observed in Quer-cus relates to more extensive adaptations and spe-cializations than exist among Fagus and Castaneaspecies. Given the extensive natural populations ofFagaceae species that still exist across the northernhemisphere, such information will certainly provideinsights into the ecology of temperate forest ecosys-tems.
Chapter 5 Fagaceae Trees 165
5.2Construction of GeneticLinkage Maps
5.2.1Genetic Mapping in Forest Trees
PCR-based molecular markers and the two-way pseu-dotestcross strategy are useful tools for construct-ing genetic maps in forest trees (Grattapaglia andSederoff 1994). These outbred species are character-ized by long generation times, long life spans, anda high genetic load that often leads to significantinbreeding depression. Although all these elementshinder the development of the type of mapping popu-lations normally used for genetic linkage mapping(for instance inbred lines and backcrosses), the highlevel of heterozygosity in forest species made two-generation full-sib pedigrees suitable populations formarker segregation analysis. Full-sib and half-sibcrosses can, therefore, be used to construct single-tree genetic linkage maps thanks to dominant PCR-based molecular markers. Following this approach,called the two-way pseudotestcross strategy (Gratta-paglia and Sederoff 1994), three types of segregationconfigurations can be obtained for dominant molec-ular markers in the mapping population: (1) maletestcross markers, segregating in a 1:1 ratio and in-herited from the male parent; (2) female testcrossmarkers, segregating in a 1:1 ratio and inherited fromthe female parent; and (3) intercross markers, segre-gating in a 3:1 ratio and inherited from both parentaltrees. Male and female testcross markers are used toconstruct two independent single-tree genetic mapsthat are then aligned thanks to the intercross mark-ers. RAPD (Williams et al. 1990) and AFLP (Vos et al.1995) dominant molecular markers have been usedmost commonly to construct genetic linkage maps inforest tree species (VerhaegenandPlomion1996;Mar-ques et al. 1998; Arcade et al. 2000; Costa et al. 2000;Cervera et al. 2001), as their random distribution inthe genome allows all chromosomes to be coveredmost efficiently.
The two-waypseudotestcross strategywasfirst ap-plied in forest trees by Grattapaglia et al. (1995) toidentify loci controlling quantitative trait loci (QTLs).In forest genetics, QTL analysis has been one of themost important applications of linkage mapping, andseveral studies reported successful QTL detections(Sewell and Neale 2000; van Buijtenen 2001).
5.2.2Genetic Mapping Initiatives in Fagaceae
Oak Mapping Initiatives
European white oaks Starting in 1995, activitiesin genetic mapping were implemented in Europeanwhite oaks at the INRA Research Centre in Bordeaux-Cestas (France). Motivations for genetic mapping inoaks were threefold: (1) the detection of genomic re-gions involved in species differentiation, (2) the de-tection of QTLs controlling traits of adaptive signif-icance, and (3) the comparative analysis of genomicevolution in the Fagaceae. The whole mapping projectis based on three pedigrees: one full-sib family ofQuercus robur (3P × A4), one full-sib family of Q. pe-traea (QS28 × QS21), and one interspecific F1 full-sib family Q. robur × Q. petraea (11P × QS29). Aninterspecific F2 cross is planned as well. Given theobjectives of the mapping experiments, the parentsof the pedigrees were not selected for any particularcriteria. The Q. robur parent trees originated fromthe southwest of France (INRA research station ofBordeaux-Cestas, and Arcachon) and the Q. petraeaparents were from the central part of France (INRAresearch station of Orléans-Ardon). The controlledcrosses were repeatedly done over successive yearsuntil 2004. From 200 to 1,000 seeds were obtainedfor each cross. The young seedlings were installedin a seedbed in a nursery, where they are raised asstool beds. Starting at age 5, the full-sibs were hedgedevery year at the ground level at the end of winter.Following the hedging, stump sprouts developing inspring were harvested and cut in 15- to 20-cm-longcuttings. These cuttings were then transplanted infield tests for phenotypic observations and furtherQTL detection. For the time being, only the Q. roburintraspecific cross has been fully exploited for geneticmapping and QTL detection. The clonal test of thefull-sibs has now been planted in three different sites(two near Bordeaux, southwest France, and one nearNancy, northeastern France). The genetic mapping ofQ. robur mapping was done on a sample of 94 off-spring (pedigree 3P × A4), and the QTL detection ona sample of 278 offspring (replicated on average in fivevegetative propagules).
Another mapping initiative for Q. robur was im-plemented in the Netherlands (ALTERRA, Wagenin-gen). This mapping pedigree consists of 101 full-sibs(Bakker 2001). The sibs were screened by paternityanalysis within an open-pollinated progeny set of 397
166 A. Kremer et al.
sibs collected on a single tree located in an urbanarea (Amsterdam). This tree was surrounded by threeother oak trees within a radius of 10 m. One of theseoak trees was selected to be the paternal tree. Pater-nity analysis revealed that 26% of the collected seedswere siredby thismaleparent. The selected seedsweregerminated, grown individually in pots in a nursery(ALTERRA research station, Wageningen, the Nether-lands), and measured for several morphological andphysiological traits during the next 2 years (1999,2000). The objective of this work was quite similarto the French initiative: detection of QTL controllingmorphological and adaptive traits involved in speciesdifferentiation.
American red oaks Genetic mapping in northernredoak(Quercus rubraL.)was initiatedatPurdueUni-versity (http://www.genomics.purdue.edu/forestry/;Romero-Severson 2003) and has continued at theUniversity of Notre Dame. Using exclusion methodsbased on microsatellite polymorphisms (Aldrichet al. 2002, 2003a), a preliminary mapping populationof 97 full-sibs was identified from the open-pollinatedprogeny of a single tree. The most likely male parentmale was the closest conspecific. Recombinationpatterns revealed (Romero-Severson et al. 2003) sixlinkage groups (LGs) of three or more markers.A second acorn harvest from the same female parentyielded 462 full-sibs. The genetic map under con-struction now includes 15 microsatellites, 66 AFLPmarkers from the first set of progeny, and severalhundred new AFLP markers from the second set ofprogeny. All of the potential pollen parents within200 m of the female parent are being genotypedwith all 15 microsatellite markers to eliminate anydoubt over the full-sib status of the mapping popu-lation. The microsatellite markers used for geneticmapping are the same as those used for studieson interspecific gene flow (Aldrich et al. 2003b)and in northern red oak genetic diversity studies.No map has yet been published for Q. rubra. Thelong-term goal of the red oak mapping project is thedetection of QTLs and genes controlling heartwoodcolor and resistance to specific pests, specificallyPhytophthora ramorum, the agent of sudden oakdeath.
Chestnut Mapping InitiativesEuropean chestnut Starting in 1998, a genetic map-ping project for European chestnut (Castanea sativaMill.) was implemented using a full-sib family ob-
tained fromacontrolledcrossperformedbetween twohighly differentiated trees originating from Turkey.Anatolia Peninsula was shown to be an importantregion for chestnut genetic diversity (Villani et al.1991, 1992). As illustrated by these studies, a re-markably high level of genetic, morphological, andphysiological differentiation was observed betweentwo groups of chestnut populations coming fromtwo phytogeographic regions, characterized by strik-ing climatic differences: the Eurosiberian part of thepeninsula in northeastern Anatolia (humid) and theMediterranean region in western Anatolia (xeric).Common field experiments carried out at the ex-perimental field site of Istituto di Biologia Agroam-bientale e Forestale, CNR (Porano, Italy), showedsignificant differences between these populations ingrowth rate, bud flush, and physiological param-eters, related to the water use efficiency, allowing“drought-adapted” and “wet-adapted” ecotypes to beidentified (Lauteri et al. 1997, 1999). Differences ob-served in theecophysiologicalbehavior suggested thatTurkish chestnut populations are genetically adaptedto contrasting environments, making them a suit-able material to study the adaptive potential of thisspecies.
The controlled cross was performed in 1998between a female parent (Bursa) belonging to the“drought-adapted” type from western Turkey anda male parent (Hopa) belonging to the “wet-adapted”type from eastern Turkey. The parental individualswere 9 years old and were chosen according to theirheterozygosity level at isozymes and high degree ofvariation in physiological traits. An F1 full-sib familyof 186 offsprings was obtained, and 96 F1 individualswere used to construct two separate genetic linkagemaps: a female or Bursa map and a male or Hopamap. The main objective of the project was to exploitthe peculiar genetic and adaptive variation observedin these populations in order to identify the genomicregions affecting carbon isotope discrimination(related to the water use efficiency), bud phenology,and growth by means of QTL analysis.
American and Chinese chestnuts During thelast century, American Chestnut, Castanea dentata(Marsch) Borkh, one of the most important timberand nut-producing tree species in eastern NorthAmerica, was dramatically affected by a cankerdisease (chestnut blight) caused by Cryphonectriaparasitica. American chestnut showed low levelsof resistance to blight, whereas Asian chestnut
Chapter 5 Fagaceae Trees 167
species (Castanea crenata (Japanese chestnut) andC. mollissima (Chinese chestnut) exhibited higherlevels of resistance to the disease. During the 1980san important backcross breeding program wasundertaken in the USA in order to obtain selectedmaterial combining the blight resistance of Asianchestnut and good timber qualities of Americanchestnut (Burnham et al. 1986).
In this context, ageneticmap for chestnutwascon-structed. The main objective of this mapping projectwas to identify genomic regions involved in blight re-sistance. In addition, the map was also used to lo-cate loci controlling morphological traits that dif-ferentiated both species. The mapping populationwas F2 progeny derived from a cross between twoC. mollissima × C. dentata F1 hybrids. The femaleparent was the C. mollissima cultivar “Mahogany”and two different American chestnut trees from Rox-bury, CT were used as male to create the F1 hy-brids. One hundred and two F2 individuals were usedfor the map construction, and 185 individuals wereassessed for resistance to Cryphonectria parasitica.
Beech Mapping InitiativeA genetic mapping project for European beech (Fa-gus sylvatica) has been implemented at the Universityof Parma (Italy) during the last 10 years (Scalfi et al.2004). The objective was to dissect important adaptivetraits and to identify their underlying QTLs to detectgenomic regions involved in important quantitativetraits such as growth, phenology, and water-use effi-ciency. The mapping pedigree consisted of a full-sibfamily comprising 143 offsprings. The family was thelargest in a 4 × 4 diallel controlled cross performedin 1995 (Ceroni et al. 1997). The parents originatedfrom a natural population located at high altitude innorthern Italy (1,650 m altitude, just below the treeline).
5.2.3Genetic Linkage Mapsfor Quercus, Castanea, and Fagus
Genetic Map of Q. roburThe first Quercus map was published in 1998 onQ. robur (Barreneche et al. 1998) (pedigree 3P ×A4). Using the pseudotestcross mapping strategy, twomaps were constructed comprising 307 markers (271RAPD, 10 SCARs, 18 SSRs, 1 minisatellite, 6 isozymes,and 1 ribosomal DNA marker). Both maps provided
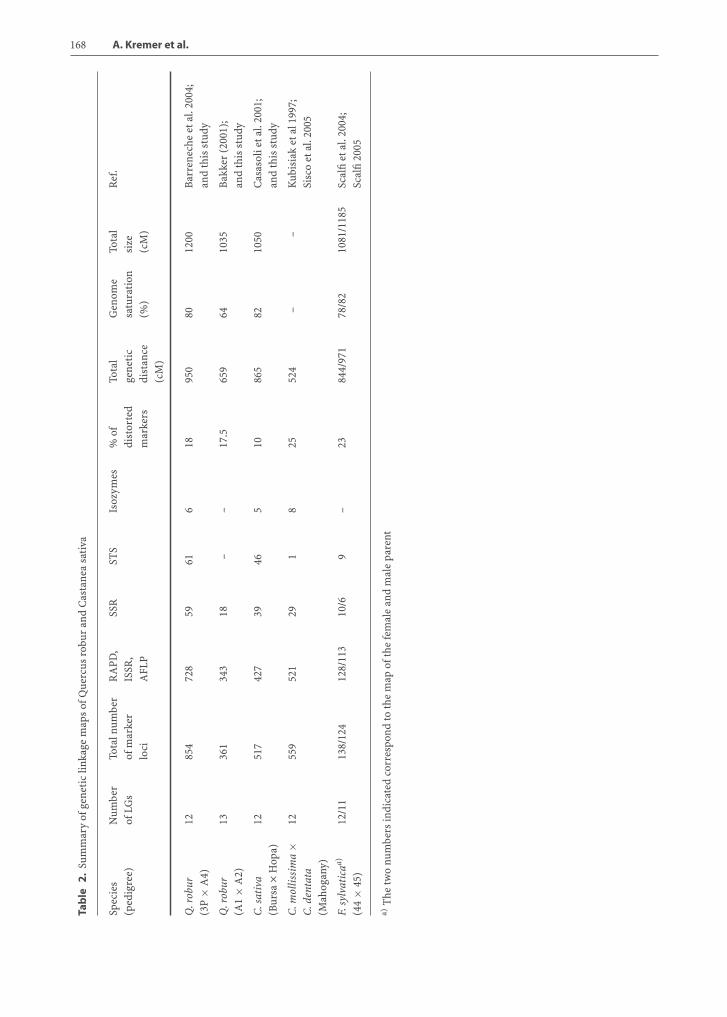
85 to 90% coverage of the Q. robur genome. Segre-gating markers could be aligned in 12 LGs, and themap size amounted to 893.2 cM for the paternal and921.7 cM for the female map. These maps were furtherupgraded by the inclusion of new SSRs (Barrenecheet al. 2004) and additional AFLP and STS. The up-grading is still ongoing and to date 854 markers (271RAPD, 457 AFLP, 10 SCAR, 59 SSR, 49 EST, 1 min-isatellite, 6 isozymes, and 1 ribosomal DNA marker)have been located (Table 2).
The Dutch Q. robur map (pedigree A1 × A2) wasalso constructed using the two-way pseudotestcrossstrategy (Bakker 2001). Two parental maps were firstestablished comprising 18 SSR and 343 AFLP markers.The total lengths of the maternal and paternal mapswere respectively 496 and 566 cM. Thirteen LGs wereobtained (for 12 chromosomes) and the two mapscould be partially merged using 58 “bridge” mark-ers (2 LGs could not be aligned). One of the paternalLGs (LG 13, 27 cM) was highly dissimilar to the otherLGs in terms of marker density. This LG containedalmost half (48%) of all paternal markers and 22% ofthe segregating (heterozygote) markers. This marker-dense LG was homologous to one of the maternal LGsthat remarkably was composed exclusively of 13 seg-regating markers. Congruence of LGs with the Frenchmap was based on the location of SSR markers (Sect.5.3.1). The total map length of the integrated map was659 cM, map density being one marker per 2.4 cM forthe map without taking the exceptionally dense LG 13into account.
Genetic Map of Castanea sativaA first framework of the chestnut genetic linkage mapwas obtained with RAPD and ISSR markers (Casasoliet al. 2001). Few isozyme loci were integrated in thisfirst versionof themap.A total of 381molecularmark-ers segregated in the chestnut full-sib family coveringa good portion of the chestnut genome (more than70%). Intercross segregating markers allowed 11 ofthe 12 LGs identified to be aligned between the femaleand male maps. This original framework was thenused to map AFLP markers and codominant locus-specific markers such as SSR- and EST-derived mark-ers. Table 2 shows the number and type of molecu-lar markers contained in the chestnut genetic linkagemap. At present, 517 molecular markers have beenmapped in chestnut covering 80% of its genome. The12 LGs were aligned to obtain 12 consensus femaleand male LGs (chestnut linkage consensus groups areavailable at the Web site www.pierroton.inra.fr).
168 A. Kremer et al.
Tab
le2.
Sum
mar
yof
gene
tic
linka
gem
aps
ofQ
uerc
usro
bur
and
Cas
tane
asa
tiva
Spec
ies
Num
ber
Tota
l num
ber
RA
PD,
SSR
STS
Isoz
ymes
%of
Tota
lG
enom
eTo
tal
Ref
.(p
edig
ree)
ofLG
sof
mar
ker
ISSR
,di
stor
ted
gene
tic
satu
rati
onsi
zelo
ciA
FLP
mar
kers
dist
ance
(%)
(cM
)(c
M)
Q.r
obur
1285
472
859
616
1895
080
1200
Bar
rene
che
etal
.200
4;(3
P×
A4)
and
this
stud
y
Q.r
obur
1336
134
318
––
17.5
659
6410
35B
akke
r(2
001)
;(A
1×
A2)
and
this
stud
y
C.s
ativ
a12
517
427
3946
510
865
8210
50C
asas
olie
tal.
2001
;(B
ursa
×H
opa)
and
this
stud
y
C.m
ollis
sim
a×
1255
952
129
18
2552
4–
–K
ubis
iak
etal
1997
;C
.den
tata
Sisc
oet
al.2
005
(Mah
ogan
y)
F.sy
lvat
icaa)
12/1
113
8/12
412
8/11
310
/69
–23
844/
971
78/8
210
81/1
185
Scal
fiet
al.2
004;
(44
×45
)Sc
alfi
2005
a)T
hetw
onu
mbe
rsin
dica
ted
corr
espo
ndto
the
map
ofth
efe
mal
ean
dm
ale
pare
nt
Chapter 5 Fagaceae Trees 169
Genetic Map of Castanea mollissima/Castanea dentataThe C. mollissima/C. dentata map was the first to bepublished in the Fagaceae (Kubisiak et al. 1997). Atfirst a total of 241 markers, including 8 isozymes, 17RFLPs, 216 RAPDs, were mapped in the F2 family.Twelve LGs were identified, covering a genetic dis-tance of 530.1 cM (corresponding to 75% of the chest-nut genome). To saturate the map, additional mark-ers were recently added to the initial map: 275 AFLP(Clark et al. 2001) and 30 STS (29 SSR and the 5SrDNAlocus) (Siscoet al. 2005).Todate, a total of 559markershave been located. Relatively high levels of segrega-tion distortion (more than 25%) have been reportedin the C. mollissima/C. dentata family. Skewed seg-regation is a common feature in progenies resultingfrom interspecific crosses.
Genetic Map of Fagus sylvaticaThe Fagus genetic linkage map was based on a total of312 markers: 28 RAPDs, 274 AFLPs, and 10 SSRs. Twomaps were constructed using the “double testcross”strategy. In the female map 132 markers were dis-tributed in 12 LGs covering 844 cM. In the male parentonly 11 LGs were identified, resulting in linkage rela-tionships between 119 markers spanning over 971 cM(Table 2). The two maps cover about 78% and 82% ofthe Fagus genome. Using intercross markers (15 AFLPand 2 SSR) seven homologous LGs could be identified(Scalfi et al. 2004). Ten additional EST markers werethen added to the map since its publication (Scalfi2005).
5.3Comparative Mappingbetween Quercus, Castanea,and Fagus
5.3.1Mapping of Microsatellites in Quercus robur,Castanea sativa, C. mollissima, and C. dentata
Microsatellite markers, which are tandemly repeatedunits of 2 to 6 nucleotides evenly dispersed through-out plant genomes, have been sometimes used forcomparative mapping studies (Marques et al. 2002).AmplificationoforthologousSSRmarkers acrossphy-logenetically related species depends largely on evo-lutionary distance and genome complexity of com-
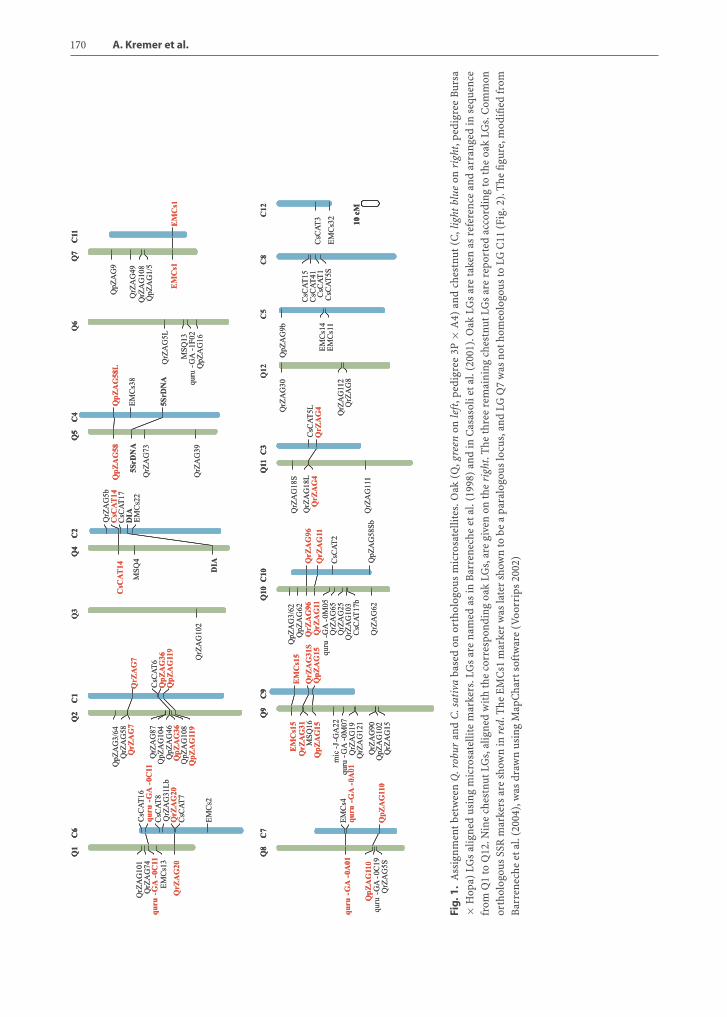
pared species (Powell et al. 1996). Usually, SSR cross-amplification is more efficient between closely relatedspecies with a low proportion of highly repeated se-quences in their genome. Steinkellner et al. (1997)showed that microsatellite markers specifically de-veloped in Quercus species were cross-amplified inchestnut. For these reasons microsatellites were sup-posed to be useful molecular markers for comparingQ. robur and C. sativa genetic linkage maps. To obtainorthologous markers for comparative mapping, SSRmarkers developed both in Quercus species and inC. sativa were therefore tested for cross-amplificationand transferability between these two genera (Bar-reneche et al. 2004 and references therein) in a re-ciprocal way. We tested a total of 83 primer pairs:53 developed in Quercus species and 30 in C. sativa.Primer pairs giving a strong amplification productwere selected for mapping. Nineteen loci, 15 from oakand 4 from chestnut, were integrated into the two pre-viously established genetic maps, allowing the firstcomparative mapping between LGs of the two species(Barreneche et al. 2004). Figure 1 shows the sevenhomeologous LGs identified by orthologous SSR andall microsatellite loci mapped in Q. robur and C. sativagenetic maps. These same SSR loci were used to alignthe European chestnut genetic linkage map with theC. mollissima × C. dentata interspecific map. Elevenof the 12 LGs of the two maps could be associated,nine LGs were aligned on the basis of pairs, triplets,or quadruplets of common markers, while three addi-tional groups were matched using a single SSR marker(Sisco et al. 2005).
Overall, these findings showed that microsatellitemarkers could be cross-transferred between Quer-cus and Castanea genera and be used to recover or-thologous markers for comparative mapping. Never-theless, cross-transferability efficiency was low andthe number of cross-transferred loci was not suffi-cient to link the 12 LGs of the two species. As ex-pected, SSR loci were extremely useful for compar-ative mapping within the same genus (Castanea),but their cross-transferability efficiency decreasedbetween different genera. SSR loci mapped both inQ. robur and C. sativa were sequenced in order todefinitely demonstrate their orthology. Sequencingresults clearly showed that both orthologous and par-alogous loci could be recovered among the SSR cross-transferred between the two genera. Moreover, indelswere sometimes observed within the flanking regionsof the repeated motif. Therefore, although SSR locican be cross-transferred between Quercus and Cas-
170 A. Kremer et al.
Fig.1
.A
ssig
nmen
tbe
twee
nQ
.rob
uran
dC
.sat
iva
base
don
orth
olog
ous
mic
rosa
telli
tes.
Oak
(Q, g
reen
onle
ft,p
edig
ree
3P×
A4)
and
ches
tnut
(C,l
ight
blue
onri
ght ,
pedi
gree
Burs
a×
Hop
a)LG
sal
igne
dus
ing
mic
rosa
telli
tem
arke
rs.L
Gs
are
nam
edas
inB
arre
nech
eet
al.(
1998
)an
din
Cas
asol
ieta
l.(2
001)
.Oak
LGs
are
take
nas
refe
renc
ean
dar
rang
edin
sequ
ence
from
Q1
toQ
12.N
ine
ches
tnut
LGs,
alig
ned
wit
hth
eco
rres
pond
ing
oak
LGs,
are
give
non
the
righ
t.T
heth
ree
rem
aini
ngch
estn
utLG
sar
ere
port
edac
cord
ing
toth
eoa
kLG
s.C
omm
onor
thol
ogou
sSS
Rm
arke
rsar
esh
own
inre
d .T
heEM
Cs1
mar
ker
was
late
rsh
own
tobe
apa
ralo
gous
locu
s,an
dLG
Q7
was
noth
omeo
logo
usto
LGC
11(F
ig.2
).T
hefig
ure,
mod
ified
from
Bar
rene
che
etal
.(20
04),
was
draw
nus
ing
Map
Cha
rtso
ftw
are
(Voo
rrip
s20
02)
Chapter 5 Fagaceae Trees 171
tanea genera, a sequence analysis is needed to demon-strate orthology and to avoid the risk of paralogy.
5.3.2Mapping of EST-Derived Markers in Q. roburand C. sativa: Alignment of the 12 LinkageGroups between the Two Species
Several factors make EST (expressed sequence tag)-derived markers very useful for comparative map-ping studies (Brown et al. 2001). First, ESTs are se-quence fragments of coding regions; therefore se-quence conservation among species is expected tobe higher than that observed, for instance, in SSRloci. Second, ESTs correspond very often to genesof known function. This is of great interest becausesome ESTs colocalized with QTLs in a genetic link-age map may be putative positional candidate genesfor a given trait. Finally, transcriptome analyses giverise to a high number of EST sequences that are thesource of numerous EST-derived markers distributedthroughout plant genomes. In oak, ESTs were devel-oped by Derory et al. (2006) and Porth et al. (2005a).This gave the opportunity to exploit EST sequence in-formation for marker design in order to complete thecomparative mapping between Q. robur and C. sativa(Casasoli et al. 2006). About 100 EST sequences wereselected from oak databases. Oak sequences werealigned with homologous sequences obtained fromGenBank in order to design primer pairs for am-plification in the most conserved regions of the se-quence and assure a good cross-amplification effi-ciency in chestnut. A total of 82 primer pairs were de-signed. A proportion of about 70% produced by PCRa single and strong band both in oak and chestnutand 51 and 45 ESTs were mapped in oak and chest-nut, respectively, using single strand conformationpolymorphism (SSCP) and denaturing gradient gelelectrophoresis (DGGE) approaches (Casasoli et al.2006). These EST-derived markers, together with SSRmarkers previously mapped, provided 55 orthologousmolecular markers that allowed the 12 LGs of Q. roburand C. sativa to be aligned. As shown in Fig. 2, from2 to 7 common orthologous markers were mappedin the 12 homeologous pairs of LGs. Macrosyntenyand macrocollinearity were well conserved betweenthe two species. Few inversions, probably due to map-ping errors, were observed. Although these data arestill preliminary given the low number of common
molecular markers mapped in the two species, nomajor chromosomal rearrangements have been iden-tified, suggesting that oak and chestnut genomes arequite stable. Thus it appears likely that the “singlegenetic system” model of the grass genomes (Galeand Devos 1998) can also be applied to Q. robur andC. sativa. EST-derived markers were very easily trans-ferred from oak to chestnut. About 50% of them con-tained intron-derived sequences. This increased theprobability of detecting segregating polymorphismsuseful for mapping in both oak and chestnut full-sibfamilies. These markers proved to be ideal markersfor comparative mapping within the Fagaceae family.
5.3.3Mapping of Microsatellites and EST-DerivedMarkers in Fagus sylvatica, Quercus robur,and Castanea sativa
Success of transferability between Fagus sylvatica,Quercus robur, and Castanea sativa was lower. Al-though 86 SSR markers originally developed in otherFagaceae species were tested in Fagus (66 from Quer-cus, 20 from Castanea), only seven produced an inter-pretable banding pattern and only one marker fromQ. rubra and one from C. sativa could be placed onthe beech map (Scalfi 2005). One marker originallydeveloped in Fagus gave good amplification also inQuercus and Castanea but was monomorphic in thecrosses used for these species.
Similarly, 86 EST markers originally developed inQuercus were tested in beech, 46 coming from a bud-burst c-DNA library (Derory et al. 2006), 22 from os-motic stress response (Porth et al. 2005a), and 17 fromhypoxia response cDNA-AFLP markers (C. Bodénèsunpublished results). The success rate was higher thanfor microsatellites. In total 16 were polymorphic usingvarious techniques (SSCP, DGGE, sequencing, CAPS,dCAPS), and 10 were finally mapped onto the beechmap (Scalfi 2005).
Two markers (1T11 and 1T62) that mapped onQuercusandCastaneaonLG10 (Table4)weremappedalso on group 4 in Fagus with the help of a “bridge”marker (1T41): this can be considered as evidenceof synteny between LG10 of Q. robur (3P*A4) andC. sativa with LG 4 of Fagus. For the two markersthe sequence homology of Fagus with Quercus was82% and 43%, respectively; the lower value is due toa large insertion in the beech sequence that was notpresent in the cDNA of Quercus. Eliminating the gap,

172 A. Kremer et al.
Fig.2
.C
ompa
rati
vem
appi
ngbe
twee
nQ
.rob
uran
dC
.sat
iva.
The
12ho
meo
logo
usLG
sbe
twee
nQ
.rob
ur(Q
, gre
en,p
edig
ree
3 P×
A4)
and
C.s
ativ
a(C
,lig
htbl
ue,p
edig
ree
Burs
a×
Hop
a).T
heor
thol
ogou
sm
olec
ular
mar
kers
map
ped
inbo
thsp
ecie
sar
esh
own
inre
d(S
SRs
and
EST-
deri
ved
mar
kers
).A
subs
ampl
eof
mol
ecul
arm
arke
rsof
the
oak
and
ches
tnut
cons
ensu
sge
neti
clin
kage
map
s(a
vaila
ble
atw
ww
.pie
rrot
on.in
ra.fr
)is
show
nin
this
figur
e.O
rtho
logo
usm
olec
ular
mar
kers
map
ped
ina
diff
eren
toak
cros
s(o
rsh
owin
ga
low
map
ping
stat
isti
cals
u pp o
rt,C
ons
75in
the
oak
LGQ
3)ar
em
arke
din
blue
belo
wth
eLG
s
Chapter 5 Fagaceae Trees 173
the homology increased to 92%. Synteny could notbe assessed for any other group since none had morethan one marker mapped on it. For example, marker2T32 mapped on LG 2 in Quercus was found linkedto markers on LG 7-F in beech, but more than onecomapping marker is needed to establish synteny.
5.3.4Assignment of Linkage GroupsBetween Quercus and Castanea
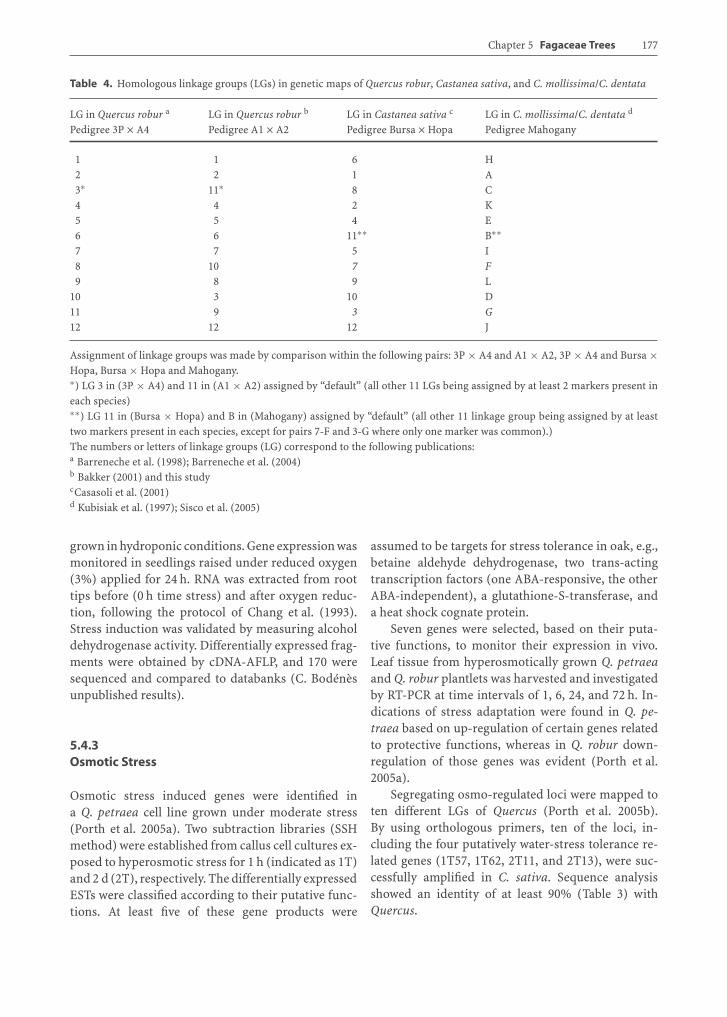
Most genetic maps constructed within Fagaceaespecies comprised 12 LGs (Table 2). Cross-transferable SSR- and EST-derived markers madeit possible to assign LGs among the four speciesQ. robur, C. sativa, C. mollissima, and C. dentata(Table 4). However, the assignment is still based ona limited number of markers per LG. Assignment wasdone by pairwise comparisons:
– Between the two Q. robur maps (3P × A4 and A1 ×A2): 11 out of 12 LGs had at least two orthologousSSRs in common; the remaining LG was assignedby default.
– Between Q. robur (3P × A4) and C. sativa (Bursa× Hopa): between two and seven pairs of commonmarkers (either SSR, isozymes, or EST) allowed theLGs to be assigned.
– Between the two chestnut maps (Bursa × Hopaand Mahogany): the assignment is still incompleteas only nine LGs could be assigned so far by at leasttwo pairs of SSRs.
The results obtained so far need to be confirmed byfurther mapping experiments, based mainly on ESTmarkers. They are also encouraging as suggested bythe conservation of the macrosynteny and macro-collinearity that have so far been observed betweenthe two most intensively studied species: Q. robur andC. sativa.
5.4Genes Mapped in Oaks and Chestnut
Transcriptomic investigations and differential geneexpression studies were implemented recently withthe main aim of identifying genes that are involved inthe adaptation of oak or chestnut trees to their envi-ronment.Geneexpressionwasmonitored fordifferenttraits, or tissues:
– Bud burst in oaks– Hypoxia in oaks– Osmotic stress in oaks– Juvenile and mature shoots in oaks– Blight infection in chestnuts
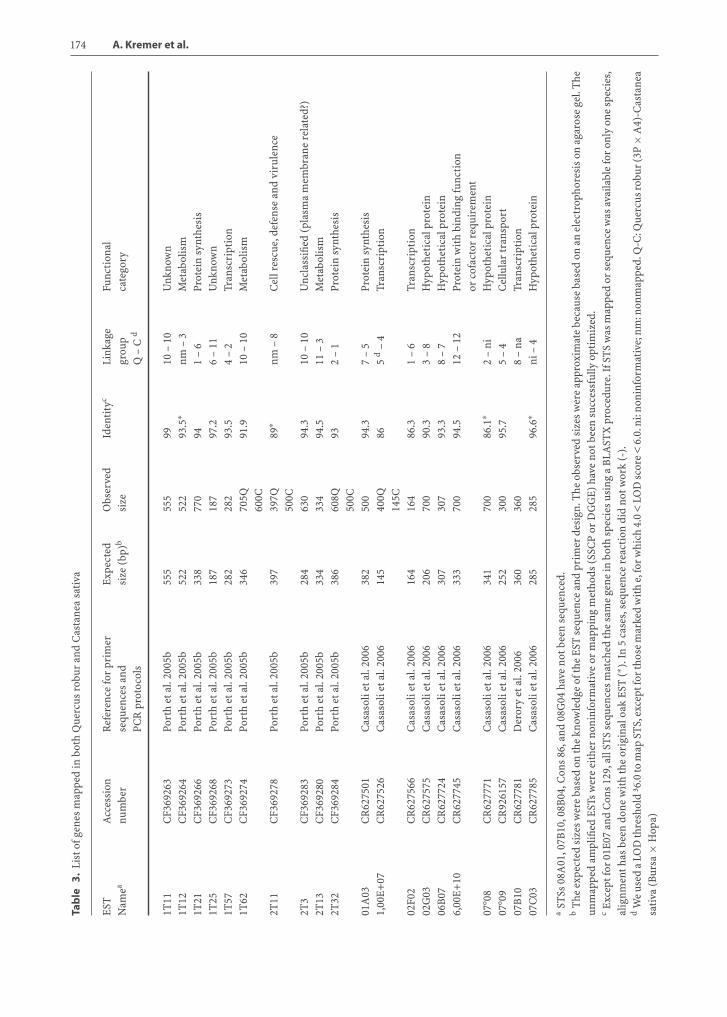
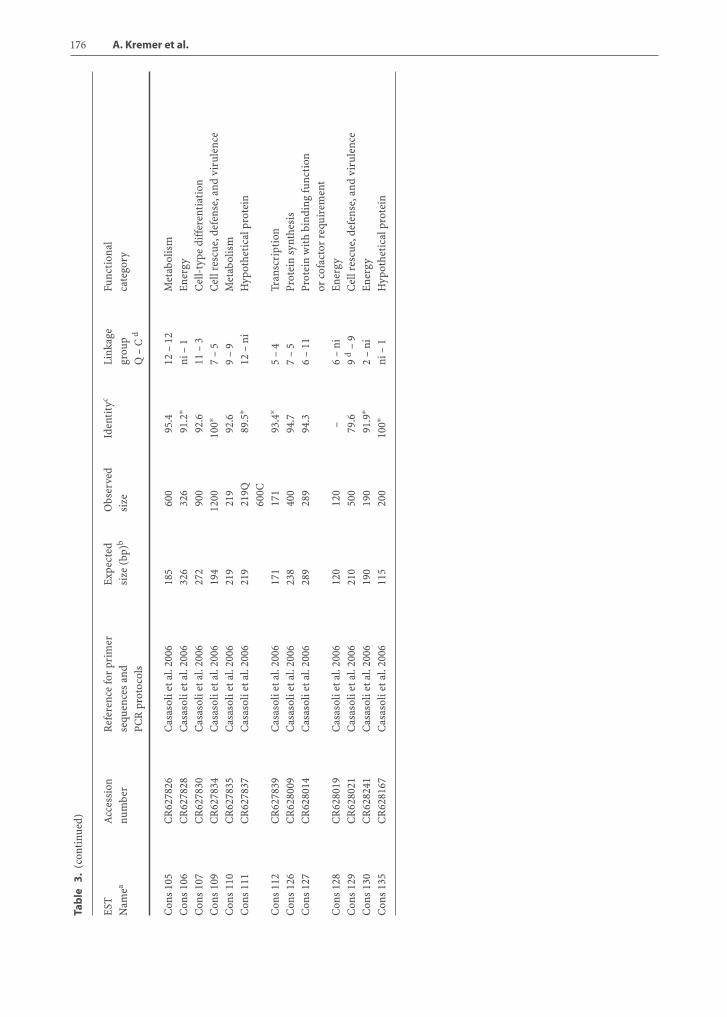
Various techniques were implemented for con-structing expression profiles: cDNA-AFLP, SSH, andQuantitative RT-PCR. We will briefly summarize theexperiments conducted and the functions of genesthat were identified. Table 3 provides a list of EST-derived markers mapped in Q. robur and C. sativa.For each EST the accession number, amplification, se-quencing, and mapping results are reported.
5.4.1Bud Burst
Candidate genes for bud burst were identified in Q. pe-traea using SSH libraries, macroarray experiments,andRT-PCR.Three subtracted libraries (SSHmethod)were constructed, generating 801 ESTs derived fromsix developmental stages of bud burst. Expression pat-terns of these transcripts were monitored in apicalbuds during bud flushing in order to identify genesdifferentially expressed between the quiescent and ac-tive stage of bud development. After bioinformaticprocessing of the ESTs, macroarray experiments re-vealed a total of 233 unique transcripts exhibiting dif-ferential expression during the process, and a puta-tive function was assigned to 65% of them (Deroryet al. 2006). Cell rescue/defense-, metabolism-, pro-tein synthesis-, cell cycle-, and transcription-relatedtranscripts were among the most regulated genes. Re-verse northern and RT-PCR showed that several genesexhibited contrasting expression between quiescentand swelling buds. Among this set of 233 unique tran-scripts, ca. 100 were selected and tentatively amplifiedand mapped in oak and chestnut, as previously de-scribed. In oak and chestnut, 51 and 45 ESTs were suc-cessfully mapped, respectively, using SSCP and DGGEapproaches (Casasoli et al. 2006).
5.4.2Hypoxia
Q. robur and Q. petraea exhibit different responsesto hypoxia, the first one being more tolerant to wa-terlogged conditions. Hypoxia-induced genes wereidentified from vegetative copies of the two species
174 A. Kremer et al.
Tab
le3.
List
ofge
nes
map
ped
inbo
thQ
uerc
usro
bur
and
Cas
tane
asa
tiva
EST
Acc
essi
onR
efer
ence
for
prim
erEx
pect
edO
bser
ved
Iden
tity
cLi
nkag
eFu
ncti
onal
Nam
eanu
mbe
rse
quen
ces
and
size
(bp)
bsi
zegr
oup
cate
gory
PCR
prot
ocol
sQ
–C
d
1T11
CF3
6926
3Po
rth
etal
.200
5b55
555
599
10–
10U
nkno
wn
1T12
CF3
6926
4Po
rth
etal
.200
5b52
252
293
.5∗
nm–
3M
etab
olis
m1T
21C
F369
266
Port
het
al.2
005b
338
770
941
–6
Prot
ein
synt
hesi
s1T
25C
F369
268
Port
het
al.2
005b
187
187
97.2
6–
11U
nkno
wn
1T57
CF3
6927
3Po
rth
etal
.200
5b28
228
293
.54
–2
Tran
scri
ptio
n1T
62C
F369
274
Port
het
al.2
005b
346
705Q
91.9
10–
10M
etab
olis
m60
0C2T
11C
F369
278
Port
het
al.2
005b
397
397Q
89∗
nm–
8C
ellr
escu
e,de
fens
ean
dvi
rule
nce
500C
2T3
CF3
6928
3Po
rth
etal
.200
5b28
463
094
.310
–10
Unc
lass
ified
(pla
sma
mem
bran
ere
late
d?)
2T13
CF3
6928
0Po
rth
etal
.200
5b33
433
494
.511
–3
Met
abol
ism
2T32
CF3
6928
4Po
rth
etal
.200
5b38
660
8Q93
2–
1Pr
otei
nsy
nthe
sis
500C
01A
03C
R62
7501
Cas
asol
ieta
l.20
0638
250
094
.37
–5
Prot
ein
synt
hesi
s1,
00E+
07C
R62
7526
Cas
asol
ieta
l.20
0614
540
0Q86
5d
–4
T ran
scri
p tio
n14
5C02
F02
CR
6275
66C
asas
olie
tal.
2006
164
164
86.3
1–
6Tr
ansc
ript
ion
02G
03C
R62
7575
Cas
asol
ieta
l.20
0620
670
090
.33
–8
Hyp
othe
tica
lpro
tein
06B
07C
R62
7724
Cas
asol
ieta
l.20
0630
730
793
.38
–7
Hyp
othe
tica
lpro
tein
6,00
E+10
CR
6277
45C
asas
olie
tal.
2006
333
700
94.5
12–
12Pr
otei
nw
ith
bind
ing
func
tion
orco
fact
orre
quir
emen
t07
°08
CR
6277
71C
asas
olie
tal.
2006
341
700
86.1
∗2
–n i
Hyp
oth e
tica
lpro
tein
07°0
9C
R92
6157
Cas
asol
ieta
l.20
0625
230
095
.75
–4
Cel
lula
rtr
ansp
ort
07B
10C
R62
7781
Der
ory
etal
.200
636
036
08
–na
Tran
scri
ptio
n07
C03
CR
6277
85C
asas
olie
tal.
2006
285
285
96.6
∗ni
–4
Hyp
othe
tica
lpro
tein
aST
Ss08
A01
,07B
10,0
8B04
,Con
s86
,and
08G
04ha
veno
tbee
nse
quen
ced.
bT
heex
pect
edsi
zes
wer
eba
sed
onth
ekn
owle
dge
ofth
eES
Tse
q uen
cean
dpr
imer
desi
gn.T
heob
serv
edsi
zes
wer
eap
prox
imat
ebe
caus
eba
sed
onan
elec
trop
h ore
sis
onag
aros
ege
l.T
heun
map
ped
ampl
ified
ESTs
wer
eei
ther
noni
nfor
mat
ive
orm
appi
ngm
etho
ds(S
SCP
orD
GG
E)ha
veno
tbee
nsu
cces
sful
lyop
tim
ized
.c
Exc
eptf
or01
E07
and
Con
s12
9,al
lST
Sse
quen
ces
mat
ched
the
sam
ege
nein
both
spec
ies
usin
ga
BLA
STX
proc
edur
e.If
STS
was
map
ped
orse
quen
cew
asav
aila
b le
for
only
one
spec
ies,
alig
nmen
thas
been
done
wit
hth
eor
igin
aloa
kES
T(∗
).In
5ca
ses,
sequ
ence
reac
tion
did
notw
ork
(-).
dW
eus
eda
LOD
thre
shol
d³6
.0to
map
STS,
exce
ptfo
rtho
sem
arke
dw
ith
e,fo
rwhi
ch4.
0<
LOD
scor
e<
6.0.
ni:n
onin
form
ativ
e;nm
:non
map
ped.
Q-C
:Que
rcus
robu
r(3P
×A
4)-C
asta
nea
sati
va(B
ursa
×H
opa)

Chapter 5 Fagaceae Trees 175
Tab
le3.
(con
tinu
ed)
EST
Acc
essi
onR
efer
ence
for
prim
erEx
pect
edO
bser
ved
Iden
tity
cLi
nkag
eFu
ncti
onal
Nam
eanu
mbe
rse
quen
ces
and
size
(bp)
bsi
zegr
oup
cate
gory
PCR
prot
ocol
sQ
–C
d
08°0
1C
R62
7918
Der
ory
etal
. 200
621
050
03
d–
nmM
etab
olis
m08
°03
CR
6279
20C
asas
olie
tal.
2006
454
454
94.1
∗12
d–
niPr
otei
nw
ith
bind
ing
func
tion
orco
fact
orre
quir
emen
t08
B04
CR
6279
33D
eror
yet
al.2
006
327
327
9–
nmM
etab
olis
m08
C05
CR
6279
43C
asas
olie
tal.
2006
213
213
95.5
∗2
–ni
Hyp
othe
t ica
l pro
t ei n
08C
11C
R62
7947
Der
ory
etal
.200
631
631
694
.42
–1
Hyp
othe
tica
lpro
tein
08D
11C
R62
7958
Cas
asol
ieta
l.20
0634
370
088
.4∗
11–
3M
etab
olis
m08
G04
CR
6279
86D
eror
yet
al.2
006
393
1000
11–
naH
ypot
heti
calp
rote
inC
ons
13C
R62
7506
Cas
asol
ieta
l.20
0630
130
189
.5–9
3.1
1–
6Tr
ansc
ript
ion
Con
s14
CR
6275
08C
asas
olie
tal.
2006
243
1200
–5
–4
Prot
ein
synt
hesi
sC
ons
19C
R62
7517
Cas
asol
ieta
l.20
0617
830
081
.39
–2/
4Pr
otei
nsy
nthe
sis
Con
s21
CR
6275
23C
asas
olie
tal.
2006
333
550
89.3
2–
1Pr
otei
nsy
nthe
sis
Con
s30
CR
6275
41C
asas
olie
tal.
2006
424
1400
Q93
.14
–2
Hyp
othe
tica
lpro
tein
1500
CC
ons
33C
R62
7568
Cas
asol
ieta
l.20
0615
320
0Q95
.312
d–
12H
ypot
h eti
calp
rote
in25
0CC
ons
38C
R62
7606
Cas
asol
ieta
l.20
0612
312
391
.72
–1
dE
nerg
yC
ons
41C
R62
7646
Cas
asol
ieta
l.20
0644
350
090
.7∗
ni–
1C
ellr
escu
e,de
fens
e,an
dvi
rule
nce
Con
s46
CR
6279
52C
asas
olie
tal.
2006
215
800C
–na
–9
Cel
lres
cue,
defe
nse,
and
viru
lenc
eC
ons
48C
R62
7721
Cas
asol
ieta
l.20
0619
119
1Q–
6–
niU
nkno
wn
400C
Con
s58
CR
6277
32C
asas
olie
tal.
2006
255
500
92.7
5–
4H
ypot
heti
calp
rote
inC
ons
61C
R62
7776
Cas
asol
ieta
l.20
0626
016
00Q
95.7
∗6
–na
Cel
lres
cue,
defe
nse,
and
viru
lenc
eC
ons
68C
R62
7777
Cas
asol
ieta
l.20
0624
450
0Q92
.9∗
1–
naM
etab
olis
mC
ons
72C
R62
7907
312
1000
Q90
.9∗
10–
niC
ellc
ycle
and
DN
Apr
oces
sing
800C
Con
s74
CR
6278
01C
asas
olie
tal.
2006
137
137
86.7
9–
9C
ellr
escu
e,de
fens
e,an
dvi
rule
nce
Con
s75
CR
6279
24C
asas
olie
tal.
2006
257
600
88∗
ni–
8M
etab
olis
mC
ons
86C
R62
7976
Cas
asol
ieta
l.20
0627
060
08
–nm
Unk
now
nC
ons
90C
R62
8018
Cas
asol
ieta
l.20
0618
830
0Q–
2–
7C
ellr
escu
e,de
fens
e,an
dvi
rule
nce
1200
CC
ons
104
CR
6278
23C
asas
olie
tal.
2006
250
250
95.4
3–
8H
ypot
heti
calp
rote
in
176 A. Kremer et al.
Tab
le3.
(con
tinu
ed)
EST
Acc
essi
onR
efer
ence
for
prim
erEx
pect
edO
bser
ved
Iden
tity
cLi
nkag
eFu
ncti
onal
Nam
eanu
mbe
rse
quen
ces
and
size
(bp)
bsi
zegr
oup
cate
gory
PCR
prot
ocol
sQ
–C
d
Con
s10
5C
R62
7826
Cas
asol
ieta
l.20
0618
560
095
.412
–12
Met
abol
ism
Con
s10
6C
R62
7828
Cas
asol
ieta
l.20
0632
632
691
.2∗
ni–
1En
ergy
Con
s10
7C
R62
7830
Cas
asol
ieta
l.20
0627
290
092
.611
–3
Cel
l-ty
pedi
ffer
enti
atio
nC
ons
109
CR
6278
34C
asas
olie
tal.
2006
194
1200
100∗
7–
5C
ellr
escu
e,de
fens
e,an
dvi
rule
nce
Con
s11
0C
R62
7835
Cas
asol
ieta
l.20
0621
921
992
.69
–9
Met
abol
ism
Con
s11
1C
R62
7837
Cas
asol
ieta
l.20
0621
921
9Q89
.5∗
12–
niH
ypot
heti
calp
rote
in60
0CC
ons
112
CR
6278
39C
asas
olie
tal.
2006
171
171
93.4
∗5
–4
Tran
scri
pti o
nC
ons
126
CR
6280
09C
asas
olie
tal.
2006
238
400
94.7
7–
5Pr
otei
nsy
nthe
sis
Con
s12
7C
R62
8014
Cas
asol
ieta
l.20
0628
928
994
.36
–11
Prot
ein
wit
hbi
ndin
gfu
ncti
onor
cofa
ctor
requ
irem
ent
Con
s12
8C
R62
8019
Cas
asol
ieta
l.20
0612
012
0–
6–
niE
nerg
yC
ons
129
CR
6280
21C
asas
olie
tal.
2006
210
500
79.6
9d
–9
Cel
lres
cue,
defe
nse,
and
viru
lenc
eC
ons
130
CR
6282
41C
asas
olie
tal.
2006
190
190
91.9
∗2
–n i
En e
rgy
Con
s13
5C
R62
8167
Cas
asol
ieta
l.20
0611
520
010
0∗ni
–1
Hyp
othe
tica
lpro
tein
Chapter 5 Fagaceae Trees 177
Table 4. Homologous linkage groups (LGs) in genetic maps of Quercus robur, Castanea sativa, and C. mollissima/C. dentata
LG in Quercus robur a LG in Quercus robur b LG in Castanea sativa c LG in C. mollissima/C. dentata d
Pedigree 3P × A4 Pedigree A1 × A2 Pedigree Bursa × Hopa Pedigree Mahogany
1 1 6 H2 2 1 A3∗ 11∗ 8 C4 4 2 K5 5 4 E6 6 11∗∗ B∗∗7 7 5 I8 10 7 F9 8 9 L
10 3 10 D11 9 3 G12 12 12 J
Assignment of linkage groups was made by comparison within the following pairs: 3P × A4 and A1 × A2, 3P × A4 and Bursa ×Hopa, Bursa × Hopa and Mahogany.∗) LG 3 in (3P × A4) and 11 in (A1 × A2) assigned by “default” (all other 11 LGs being assigned by at least 2 markers present ineach species)∗∗) LG 11 in (Bursa × Hopa) and B in (Mahogany) assigned by “default” (all other 11 linkage group being assigned by at leasttwo markers present in each species, except for pairs 7-F and 3-G where only one marker was common).)The numbers or letters of linkage groups (LG) correspond to the following publications:a Barreneche et al. (1998); Barreneche et al. (2004)b Bakker (2001) and this studycCasasoli et al. (2001)d Kubisiak et al. (1997); Sisco et al. (2005)
grown in hydroponic conditions. Gene expression wasmonitored in seedlings raised under reduced oxygen(3%) applied for 24 h. RNA was extracted from roottips before (0 h time stress) and after oxygen reduc-tion, following the protocol of Chang et al. (1993).Stress induction was validated by measuring alcoholdehydrogenase activity. Differentially expressed frag-ments were obtained by cDNA-AFLP, and 170 weresequenced and compared to databanks (C. Bodénèsunpublished results).
5.4.3Osmotic Stress
Osmotic stress induced genes were identified ina Q. petraea cell line grown under moderate stress(Porth et al. 2005a). Two subtraction libraries (SSHmethod) were established from callus cell cultures ex-posed to hyperosmotic stress for 1 h (indicated as 1T)and 2 d (2T), respectively. The differentially expressedESTs were classified according to their putative func-tions. At least five of these gene products were
assumed to be targets for stress tolerance in oak, e.g.,betaine aldehyde dehydrogenase, two trans-actingtranscription factors (one ABA-responsive, the otherABA-independent), a glutathione-S-transferase, anda heat shock cognate protein.
Seven genes were selected, based on their puta-tive functions, to monitor their expression in vivo.Leaf tissue from hyperosmotically grown Q. petraeaand Q. robur plantlets was harvested and investigatedby RT-PCR at time intervals of 1, 6, 24, and 72 h. In-dications of stress adaptation were found in Q. pe-traea based on up-regulation of certain genes relatedto protective functions, whereas in Q. robur down-regulation of those genes was evident (Porth et al.2005a).
Segregating osmo-regulated loci were mapped toten different LGs of Quercus (Porth et al. 2005b).By using orthologous primers, ten of the loci, in-cluding the four putatively water-stress tolerance re-lated genes (1T57, 1T62, 2T11, and 2T13), were suc-cessfully amplified in C. sativa. Sequence analysisshowed an identity of at least 90% (Table 3) withQuercus.
178 A. Kremer et al.
5.4.4Differential Expression in Juvenileand Mature Oak Shoots
A gene named QRCPE (Quercus robur crown pref-erentially expressed) that is differentially expressedbetween mature and juvenilelike shoots was recentlydiscovered in oaks (Gil et al. 2003). QRPCE accumu-lates in ontogenetically older organs of oak trees, al-though it is present in zygotic and somatic embryosbut absent in callus cells. The encodedprotein is small,contains a predicted N-terminal hydrophobic signalpeptide that targets the protein to the cell wall, and isrich in glycine and histidine residues. In C. sativa, theQRCPE homolog is also expressed at different levelsbetween adult and juvenilelike tissues.
5.4.5Blight Infection in Chestnut
A cDNA clone showed similarity to a gene previouslyidentified as encoding a cystatin. A protein shown tohave antifungal activity in C. sativa (Pernas et al. 1998,1999) was isolated from a cDNA library from stem tis-sues of C. dentata (Connors et al. 2001). The expres-sion of this gene was verified by RT-PCR in healthyand diseased tissues of American chestnut (Connorset al. 2002). Amplification of a fragment of the genein American and Chinese chestnuts and comparisonof the sequences of the cloned amplification productsrevealed differences within the intron (SNPs or dele-tion). These differences could be used to locate thecystatin gene on the map of C. mollissima/C. dentataand to verify its putative colocalization with QTLsinvolved in blight resistance (Connors et al. 2002).However, cystatin did not map to any region knownto be involved in resistance to chestnut blight.
5.5QTL Detection
5.5.1Phenotypic Traits Investigated
A common objective in genetic mapping in oak, chest-nut, and beech is the detection of QTLs for adaptivetraits, e.g., phenotypic traits that respond strongly tonatural selection, and particularly to abiotic or bioticstresses. The interest in these traits lies in the issues
raised by global change and the capacity of trees to re-spond to these challenges (Parmesan and Yohe 2003).This capacity depends on the level of genetic diversityfor these traits and their underlying genes in naturalpopulations. Knowledge of the genetic architectureof these traits (number and distribution of QTLs) istherefore of primary importance and has motivatedresearch in QTL in conifers as well (Sewell and Neale2000; van Buijtenen 2001).
In European oak, chestnut, and beech, the geneticcontrol of three different adaptive traits, bud phenol-ogy, growth, and carbon isotope discrimination, werestudied using a QTL approach (Casasoli et al. 2004;Scalfi et al. 2004; Scotti-Saintagne et al. 2004; Bren-del et al. 2007). Bud phenology, growth, and carbonisotope discrimination (delta or ∆, which providesan indirect measure of plant water-use efficiency)are adaptive traits that show great phenotypic vari-ation in natural populations of forest trees (Zhangand Marshall 1995; Tognetti et al. 1997; Lauteri et al.1999; Hurme et al. 2000; Jermstad et al. 2001). Initi-ation and cessation of the growing seasons, definedthrough bud flush and bud set timing, have profoundimplications for adaptation of perennial plants to coldwinter temperatures. Early flushing genotypes mightbe susceptible to spring frost damage. Likewise, budset timing is related to the fall cold acclimation (Howeet al. 2000). Growth traits, such as annual height anddiameter increments, are important components ofplant vigor and biomass production, and they areprofoundly influenced by abiotic and biotic stress oc-currences during the growing season. In addition,they are relevant characteristics from an economicpoint of view and are often evaluated in breeding pro-grams (Bradshaw and Stettler 1995). Carbon isotopediscrimination (∆) is a parameter related to the iso-topic fractionation of carbon stable isotopes duringthe photosynthetic process (for review see Farquharet al. 1989; Brugnoli and Farquhar 2000). Plant mate-rial is always enriched in 13C with respect to the iso-topic composition (δ13C) of atmospheric CO2. This isparticularly evident in C3 plants where the fraction-ation effect mostly occurs during CO2 diffusion fromoutside the leaf to the carboxylation sites into thechloroplasts, and during the carboxylation by ribu-lose 1,5-bisphosphate (RuBP) carboxylase. Due to itsrelationships with the diffusional path of photosyn-thetic gas exchange (for both CO2 and water vaporin reverse directions) and with the photosyntheticsubstrate demand (CO2 fixation by RuBP carboxyla-tion activity), ∆ has been theoretically predicted and
Chapter 5 Fagaceae Trees 179
empirically demonstrated to be inversely related toplant water-use efficiency (roughly the ratio of carbongain to water losses; for deeper insights see Farquharet al. 1989; Brugnoli and Farquhar 2000). Despite thecomplexity of this trait, significant heritabilities andlow genotype × environment interactions have beenfound for ∆ in crop species (Hall et al. 1994) encour-aging the use of this parameter for breeding pur-poses.
5.5.2Strategies and Methods Used for QTL Detection
In forest trees, QTLs for several traits have beendetected, clearly showing the usefulness of this ap-proach to dissect genomic regions controlling com-plex traits (Sewell and Neale 2000). With few excep-tions (Brown et al. 2003; Jermstad et al. 2003), thesize of segregating populations used in these stud-ies is often small (150 to 200 individuals). Amongfactors influencing QTL detection power, small sam-ple sizes and low trait heritability were shown tocause an overestimation of QTL effects and the un-derestimation of QTL number and to hamper de-tection of QTLs with low effects (Beavis 1995). Forthese reasons, a single QTL detection experiment doesnot give an exhaustive idea of the genetic architec-ture of a quantitative trait. One possible strategy toovercome these difficulties is to detect QTLs severaltimes across different environments and developmen-tal stages. In this way, environmental and temporalstability of QTLs can be verified and a more completepicture of genetic architecture of the complex traitcan be drawn. Moreover, comparative QTL mappingbetween phylogenetically related species offers an im-portant tool to validate QTLs from the evolutionarypoint of view. In oak and chestnut, a QTL-detectionstrategy based on multiple experiments across dif-ferent environments and years has been performedto give an idea, as much as possible, of the com-plete genetic architecture of adaptive traits in bothspecies. Afterwards, comparative QTL mapping forthe three adaptive traits studied was carried out be-tween the two species in order to identify genomic re-gions conserved through evolution controlling thesetraits.
In oak, QTL detection was done in both the French(3P*A4) and Dutch (A1*A2) Q. robur mapping pedi-grees. In the French studies, phenotypic assessmentswere done over successive years using a clonal test
planted with the vegetative copies of the full-sibs be-longing to the pedigree. The phenotypic data ob-tained so far all originate from the two plantationsinstalled in the southwest of France. The assessmentsfirst addressed the same three major adaptive traits asfor chestnut: phenology, growth, and carbon isotopediscrimination (Scotti-Saintagne et al. 2004; Brendelet al. 2007). In addition, leaf morphology characters(Saintagne et al. 2004) and the ability for vegetative re-production by cutting propagation (Scotti-Saintagneet al. 2005) were assessed. The focus on leaf morpho-logical traits is related to their use in species discrim-ination as shown by previous analyses (Kremer et al.2002). The Dutch study focused on QTL detection formorphological and growth characters in one specificfull-sib cross that was grown for two successive yearsin a nursery (Bakker 2001).
In European chestnut (C. sativa), bud flush,growth, and carbon isotope discrimination mea-surements were performed for 3 years: 2000, 2001,and 2002, corresponding to the growing seasons2, 3, and 4 since seed germination. Bud set timingwas scored only in 2002. During the three years,plants were grown in central Italy (Istituto diBiologia Agroambientale e Forestale, CNR, Porano,central Italy, 42◦ 43′ latitude, 500 m elevation)as previously reported. Details about phenotypicmeasurements are reported in Casasoli et al. (2004)and in Table 5.
In American (C. dentata) and Asian (C. mollis-sima) chestnut, the blight resistance response of F2
progeny was assessed by using the agar-disk cork-borer method (Griffin et al. 1983). During the grow-ing season, each F2 individual was inoculated with twodifferent strains of Cryphonectria parasitica. Cankerevaluations were made over two successive months.The mean canker sizes in each month for each iso-late were used as relative measures of resistance.The degree of association between marker loci andblight resistance trait was investigated using succes-sively single-locus or nonsimultaneous analysis ofvariance (ANOVA) models and multiple marker orsimultaneous analysis of variance (ANOVA) mod-els (Kubisiak et al. 1997). In European beech (F. syl-vatica), leaf traits (size and shape) were assessedover 2 years, whereas growth and carbon isotopediscrimination measurements were done only oneyear.
The MultiQTL software (Britvin et al. 2001,http://esti.haifa.ac.il/∼poptheor) was used for QTLdetection both in oak and chestnut in the French
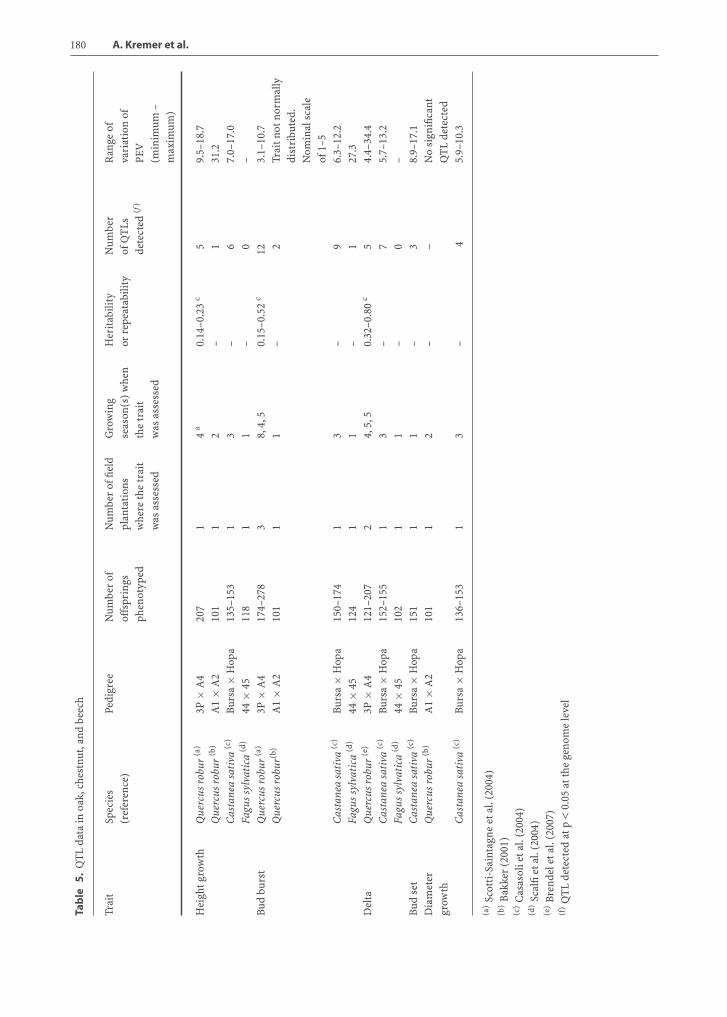
180 A. Kremer et al.
Tab
le5.
QT
Lda
tain
oak,
ches
tnut
,and
beec
h
Trai
tSp
ecie
sPe
digr
eeN
umbe
rof
Num
ber
offie
ldG
row
ing
Her
itab
ility
Num
ber
Ran
geof
(ref
eren
ce)
offs
prin
gspl
anta
tion
sse
ason
(s)
whe
nor
repe
atab
ility
ofQ
TLs
vari
atio
nof
phen
otyp
edw
here
the
trai
tth
etr
ait
dete
cted
(f)
PEV
was
asse
ssed
was
asse
ssed
(min
imum
–m
axim
um)
Hei
ghtg
row
thQ
uerc
usro
bur
(a)
3P×
A4
207
14
a0.
14–0
.23
c5
9.5–
18.7
Que
rcus
robu
r(b
)A
1×
A2
101
12
–1
31.2
Cas
tane
asa
tiva
(c)
Burs
a×
Hop
a13
5–15
31
3–
67.
0–17
.0Fa
gus
sylv
atic
a(d
)44
×45
118
11
–0
–Bu
dbu
rst
Que
rcus
robu
r(a
)3P
×A
417
4–27
83
8,4,
50.
15–0
.52
c12
3.1–
10.7
Que
rcus
robu
r(b)
A1
×A
210
11
1–
2Tr
aitn
otno
rmal
lydi
stri
bute
d.N
omin
alsc
ale
of1–
5C
asta
nea
sati
va(c
)Bu
rsa
×H
opa
150–
174
13
–9
6.3–
12.2
Fagu
ssy
lvat
ica
(d)
44×
4512
41
1–
127
.3D
elta
Que
rcus
robu
r(e
)3P
×A
412
1–20
72
4,5,
50.
32–0
.80
c5
4.4–
34.4
Cas
tane
asa
tiva
(c)
Burs
a×
Hop
a15
2–15
51
3–
75.
7–13
.2Fa
gus
sylv
atic
a(d
)44
×45
102
11
–0
–Bu
dse
tC
asta
nea
sati
va(c
)Bu
rsa
×H
opa
151
11
–3
8.9–
17.1
Dia
met
erQ
uerc
usro
bur
(b)
A1
×A
210
11
2–
–N
osi
gnifi
cant
grow
thQ
TL
dete
cted
Cas
tane
asa
tiva
(c)
Burs
a×
Hop
a13
6–15
31
3–
45.
9–10
.3
(a)Sc
otti
-Sai
ntag
neet
al.(
2004
)(b
)B
akke
r(2
001)
(c)C
asas
olie
tal.
(200
4)(d
)Sc
alfi
etal
.(20
04)
(e)B
rend
elet
al.(
2007
)(f
)Q
TL
dete
cted
atp
<0.
05at
the
geno
me
leve
l

Chapter 5 Fagaceae Trees 181
Fig. 3. Comparative QTL mapping between Q. robur and C.sativa (from Casasoli et al. 2006). Homeologous LGs between Q. robur(Q) and C. sativa (C) are named and ordered as in Figs. 1 and 2. Orthologous markers are linked by dotted lines. Commonintervals between the two genomes identified by orthologous markers are filled with corresponding backgrounds in both oak andchestnut LGs. The figure was drawn using MapChart software (Voorrips 2002). Each QTL is represented on the right of the LGby its confidence interval (95% confidence intervals, black line) and the most probable position (Casasoli et al. 2006). QTLs weredetected for three different phenotypic traits on the male (m) and female map (f): bud burst (Bud), total height (H), and carbonisotope discrimination (∆). The phenotypic traits were observed over three seasons (indicated by subscripts 1 to 3). In oak, thedate of bud burst was assessed as the date when the apical bud flushed. In chestnut, bud burst was assessed in two different ways:A = date of first observed unfolded leaf of a tree; B = date when 70% of buds showed an unfolded leaf BudA2f: QTL for bud burstassessed with method A during season 2 in female map. H2m: QTL for total height measured at season 2 and located on malemap. ∆3f: QTL for carbon isotope discrimination assessed during season 3 and located on female map

182 A. Kremer et al.
Fig. 3. (continued)
studies. This software was chosen for severalreasons. First, the composite interval mappingwas available (CIM, Jansen and Stam 1994; Zeng1994); second, QTL significance thresholds couldbe computed by permutation (Churchill and Do-erge 1994); and finally, confidence intervals forQTL position could be estimated by bootstrap(Visscher et al. 1996). The same statistical analysis
was performed in oak and chestnut; the details arereported in Casasoli et al. (2004) and Scotti-Saintagneet al. (2004). The Dutch study used MapQTL 4.0(http://www.kyazma.nl/index.php/mc.MapQTL) forQTL detection. For beech, QTL Cartographer 1.12(Basten et al. 1994, 2002) and MultiQTL (Britvin et al.2001) softwares were used to detect QTLs (Scalfi et al.2004)
Chapter 5 Fagaceae Trees 183
5.5.3Number and Distributionof QTLs and Their Effects
The results of QTL detection are extremely heteroge-neous across pedigrees and species. The survey of theresults has been limited to traits that were assessed inat least two species (Table 5). Heterogeneity amongthe results is most likely related to the reduced sizeof the mapping pedigree. As already mentioned, withon average less than 200 sibs per pedigree, the contri-bution of a given QTL to the phenotypic variance ofthe trait is usually overestimated and exhibits a largesample variance (Beavis 1995). However, because thesampling efforts were similar and the phenotypic as-sessments were the same, a comparative analysis ofQTL detection could be done between Q. robur andC. sativa.
The alignment of the 12 Q. robur and C. sativa LGsgives rise to a logical framework defined by commonorthologous markers for comparing QTL location be-tween the two species. Figure 3 shows the alignmentof the 12 LGs, the common genomic regions identifiedby orthologous markers, and QTLs compared in oakand chestnut. Details about the definition of commongenomic intervals and corresponding unique QTLsbetween the two species (i.e., more individual QTLsdetected several times in the same genomic region ina single species) are reported in Casasoli et al. (2006).A total number of 34 common intervals were iden-tified between the oak and chestnut genetic linkagemaps thanks to the orthologous markers. Followingthe previously described criteria to declare uniqueQTLs, 13 and 10 unique QTLs were identified for tim-ing of bud burst, 5 and 7 unique QTLs were identifiedfor carbon isotope discrimination, and, finally, 5 and6 unique QTLs for height growth were identified inoak and chestnut, respectively (Fig. 3). Among theseunique QTLs, nine controlling timing of bud burst andtwocontrollingheight growth were colocatedbetweenthe two species. No QTL involved in carbon isotopediscrimination was colocated in the oak and chestnutmap. Following Lin et al. (1995), the probability ofobtaining these colocations by chance is p = 0.0002 inthe case of timing of bud burst and p = 0.20 in the caseof height growth. When QTL number and effects werecompared for the three traits between the two species,a similar genetic architecture was observed for adap-tive traits in oak and chestnut (Casasoli et al. 2006).Fromthis simple comparison itwas clear that adaptivetraits are controlled by more loci of low and moderate
than large effect in both species. Timing of bud flushwas the trait showing the higher number of detectedand stable QTLs. Despite this similar genetic architec-ture, most of the QTLs for bud flush were conserved,whereas only a few QTLs were conserved for heightgrowth, and none for carbon isotope discrimination.The different conservation of QTLs may be explainedtaking into account differences for the three adaptivetraits investigated in trait heritability values, QTL sta-bility across experiments, and QTL-by-environmentinteractions. The striking conservation of QTLs forbud flush is very interesting from an evolutionarypoint of view. Although correspondence of QTLs doesnot imply correspondence of genes underlying theQTLs, as already reported in other species (Doustet al. 2004), these findings showed that loci controllingbud flush have remained highly polymorphic in bothspecies. This high polymorphism of loci controllingbud flush, despite strong natural selection acting onthis adaptive trait, may be explained with selectionpressures able to maintain diversity over long evo-lutionary times (balancing, disruptive, or frequency-dependent selection) as discussed in Casasoli et al.(2006).
5.6Conclusion
Mapping experiments in Fagaceae were hampered byvarious biological constraints that have limited re-search activities in this field. First, for most species,it was not possible to find adequate F2 pedigreesthat would allow us to screen the genome for QTLsof interest. This is somehow compensated by thehigh level of within-population diversity, which wouldallow segregation for QTLs of interest in F1 pedi-grees as well. Second, controlled crosses to obtainmapping F1 pedigrees has been challenging in thesespecies, and alternatives based on open-pollinatedprogeny screening using parentage analysis were im-plemented. Third, the development of mapping ac-tivities was restrained by the limited genomic re-sources available (genetic markers, ESTs) within thisgroup of species. Despite these limitations, impor-tant progress has been made in the recent years asa result of international cooperation. Maps have beendeveloped for each economically important genus(Quercus, Castanea, and Fagus), and the ongoing ac-tivities in comparative mapping suggest that there
184 A. Kremer et al.
is a strong macrosynteny between phylogeneticallyclose genera (Quercus and Castanea). For some traits,e.g., bud burst, there is even a strong conservationof the QTL position between the two genera. Ex-tension of comparative mapping to Fagus might bemore problematic as illustrated by difficulties de-scribed in this review. However, comparative map-ping should be much easier with Lithocarpus andCastanopsis, as these genera are close to Quercusand Castanea. Furthermore, the genome of the Fa-gaceae is of small enough size (e.g., only 3.5 to 6times larger than Arabidopsis) to make comparativegenomics easily applicable to this family. These expec-tations should enhance research activities in geneticswithin a large group of ecologically and economicallyimportant species growing throughout the northernhemisphere.
Acknowledgement. The construction of the genetic linkagemaps in European species Quercus robur, Castanea sativa andFagus sylvatica was carried out with the financial support of theEuropean Commission, DG Research (OAKFLOW, QLK5-2000-00960 for oaks; CASCADE, EVK2-1999-00065P for chestnut,and DYNABEECH, QLRT-1999-01210 for beech). The study onthe Dutch Q. robur map was carried out with financial supportfrom Programm 381 Functions of Nature, Forest and Landscapeof the Dutch Ministry of Agriculture, Nature and Food quality.Jeremy Derory received a PhD grant from INRA to develop theEST used for the comparative mapping between Quercus andCastanea. The authors are grateful to Scott Schlarbaum (Uni-versity of Tennessee-Knoxville) for providing the material forthe genome size determination of different Fagaceae species,to Preston Aldrich, Kevin McAbee, David Chagne, Paolo Pi-ovani, Weilin Sun, Michela Troggio, for their helpful contri-bution. Jeanne Romero thanks Antoine Kremer for suggestingto screen open-pollinated progenies by exclusion methods inorder to identify full-sib progeny for the mapping.
References
Aldrich PR, Michler C, Sun W, Romero-Severson J (2002) Mi-crosatellite markers for northern red oak (Fagaceae: Quer-cus rubra). Mol Ecol Notes 2:472–475
Aldrich PR, Jagtap M, Michler CH, Romero-Severson J (2003a)Amplification of north American red oak microsatellitemarkers in European white oaks and Chinese chestnut.Silvae Genet 52(3-4):176-179
AldrichPR,ParkerGR,MichlerCH,Romero-Severson J (2003b)Whole-tree silvic identifications and the microsatellite ge-netic structure of a red oak species complex in an Indianaold-growth forest. Can J For Res 33:2228–2237
Arcade A, Anselin F, Faivre Rampant P, Lesage MC, Pâques LE,Prat D (2000) Application of AFLP, RAPD and ISSR markers
to genetic mapping of European and Japanese larch. TheorAppl Genet 100:299–307
Axelrod DI (1983) Biogeography of oaks in the Arco-Tertiaryprovince. Ann Mo Bot Gard 70:629–657
Bakker EG (2001) Towards molecular tools for management ofoak forests, PhD Thesis. Alterra, Wageningen, The Nether-lands
Barreneche T, Bodenes C, Lexer C, Trontin JF, Fluch S, StreiffR, Plomion C, Roussel G, Steinkellner H, Burg K, Favre JM,Glössl J, Kremer A (1998) A genetic linkage map of Quer-cus robur L. (pedunculate oak) based on RAPD, SCAR, mi-crosatellite, minisatellite, isozyme and 5S rDNA markers.Theor Appl Genet 97:1090–1103
Barreneche T, Casasoli M, Russell K, Akkak A, Meddour H,Plomion C, Villani F, Kremer A (2004) Comparative map-pingbetweenQuercusandCastaneausingsimple-sequencerepeats (SSRs). Theor Appl Genet 108:558–566
Basten CJ, Weir BS, Zeng ZB (1994) Zmap-a QTL cartogra-pher. In: Smith C, Gavora JS, Benkel B, Chesnais J, FairfullW, Gibson JP, Kennedy BW Burnside EB (eds) Proc 5thWorld Congress On Genetics Applied to Livestock Produc-tion: Computing Strategies and Software, Guelp, Ontario,Canada, 22:65–66
Basten CJ, Weir BS, Zeng ZB (2002) QTL cartographer, ver-sion 1.16. Department of Statistics, North Carolina StateUniversity, Raleigh, NC
Beavis WD (1995) The power and deceit of QTL experiments:lessons from comparative QTL studies. In: Proc 49th AnnuCorn and Sorghum Industry Res Conf, ASTA, Washington,DC, pp 250–266
Bennett MD, Leitch IJ, Price HJ, Johnston JS (2003) Compar-isons with Caenorhabditis (∼100 Mb) and Drosophila (∼175 Mb) using flow cytometry show genome size in Ara-bidopsis to be ∼157 Mb and thus ∼25% larger than theArabidopsis Genome Initiative estimate of ∼125 MB. AnnBot 91:547–557
Bradshaw HD, Stettler RF (1995) Molecular genetics of growthand development in Populus. IV. Mapping QTLs with largeeffects on growth, form, and phenology traits in a foresttree. Genetics 139:963–973
BrendelO,LeThiecD,Scotti-SaintagneC,BodénèsC,KremerA,Jean-MarcGuehl JM,2007Quantitative trait loci controllingwater use efficiency and related traits in Quercus robur L.Tree Genetics and Genomes (in press)
Britvin E, Minkov D, Glikson L, Ronin Y, Korol A (2001) Mul-tiQTL, an interactive package for genetic mapping of cor-related quantitative trait complexes in multiple environ-ments, version 2.0 (Demo). In: Plant & Animal Genome IXConf, San Diego
Brown GR, Kadel III EE, Bassoni DL, Kiehne KL, Temesgen B,van Buijtenen JP, Sewell MM, Marshall KA, Neale DB (2001)Anchored reference loci in loblolly pine (Pinus taeda L.)for integrating pine genomics. Genetics 159:799–809
Brown GR, Bassoni DL, Gill GP, Fontana JR, Wheeler NC,Megraw RA, Davis MF, Sewell MM, Tuskan GA, Neale DB
Chapter 5 Fagaceae Trees 185
(2003) Identification of quantitative trait loci influencingwood property traits in loblolly pine (Pinus taeda L.). III.QTL Verification and candidate gene mapping. Genetics164:1537–1546
Brugnoli E, Farquhar GD (2000) Photosynthetic fractiona-tion of carbon isotopes. In: Leegood RC, Sharkey TD,von Caemmerer S (eds) Photosynthesis: Physiology andMetabolism. Advances in Photosynthesis, vol 9. Kluwer,Boston, pp 399–434
Brunner AM, Busov VB, Strauss SH (2004) Poplar genome se-quence: functional genomics in an ecologically dominantplant species. Trends Plant Sci 9:49–56
Burnham CR, Rutter PA, French DW (1986) Breeding blight-resistant chestnuts. Plant Breed Rev 4:347–397
Butorina AK (1993) Cytogenetic study of diploid and sponta-neous triploid oaks, Quercus robur L. Ann Sci For 50(Suppl1):144s-150s
Camus A (1936-1954) Les chênes, Monographie du genre Quer-cus et Monographie du genre Lithocarpus. EncyclopédieEconomique de Sylviculture. Vol. VI, VII, VIII. Académiedes sciences, Paris, France
Cannon CH, Manos PS (2003) Phylogeography of the SouthAsian stone oaks (Lithocarpus). J Biogeogr 30:211–226
Casasoli M, Mattioni C, Cherubini M, Villani F (2001) A geneticlinkage map of European chestnut (Castanea sativa Mill.)based on RAPD, ISSR and isozyme markers. Theor ApplGenet 102:1190–1199
Casasoli M, Pot D, Plomion C, Monteverdi MC, Barreneche T,Lauteri M, Villani F (2004) Identification of QTLs affectingadaptive traits in Castanea sativa Mill. Plant Cell Environ27:1088–1101
Casasoli M, Derory J, Morera-Dutrey C, Brendel O, Porth I,Guehl J-M, Villani F, Kremer A (2006) Comparison of QTLsfor adaptive traits between oak and chestnut based on anEST consensus map. Genetics 172:533- 546
Ceroni M, Leonardi S, Piovani P, Menozzi P (1997) Incrociodiallelico in faggio: obiettivi, metodologie, primi risultati.Monti e Boschi 48(1):46-51
CerveraMT, StormeV, IvensB,Gusmao J, Liu BH,HostynV,VanSlycken J, Van Montagu M, Boerjan W (2001) Dense geneticlinkage maps of three Populus species (Populus deltoides, P.nigra and P. trichocarpa) based on AFLP and microsatellitemarkers. Genetics 158:787–809
Chang S, Puryear J, Cairney J (1993) A simple and efficientmethod for isolating RNA from pine trees. Plant Mol BiolRep 11(2):113-116
Churchill GA, Doerge RW (1994) Empirical threshold values forquantitative trait mapping. Genetics 138:963–971
Clark C, Kubisiak T, Lee B-C, O’Malley D, Sisco P (2001) AFLPs– towards a saturated genetic map for Castanea. In: Plant& Animal Genome IX Conf, San Diego
Connors BJ, Maynard CA, Powell WA (2001) Expressed se-quence tags from stem tissue of the American chestnut,Castanea dentata. Biotechnol Lett 23 (17):1407-1411
ConnorsBJ, LaunNP,MaynardCA,PowellWA(2002)Molecularcharacterization of a gene encoding a cystatin expressed inthe stems of American chestnut (Castanea dentata). Planta215:510–513
Costa P, Pot D, Dubos C, Frigerio J-M, Pionneau C, BodénèsC, Bertocchi E, Cervera M-T, Remington D-L, PlomionC (2000) A genetic linkage map of Maritime pine basedon AFLP, RAPD and protein markers. Theor Appl Genet100:39–48
Crepet WL (1989) History and implications of the early NorthAmerican fossil record of Fagaceae. In: Crane PR, Black-more S (eds) Evolution, Systematics, and Fossil History ofthe Hamamelidae, vol 2: ‘Higher’ Hamamelidae’. Claren-don, Oxford, pp 45–66
D’Emerico S, Bianco P, Medagli P, Schirone B (1995) Karyotypeanalysis in Quercus ssp. (Fagaceae). Silvae Genet 44:66–70
Derory J, Léger P, Garcia V, Schaeffer J, Hauser M-T, PlomionC, Glössl J, Kremer A (2006) Transcriptome analysis of budburst in sessile oak (Quercus petraea (Matt.) Liebl.). NewPhytol 170:723–738
Doust AN, Devos KM, Gadberry MD, Gale MD, Kellogg EA(2004) Genetic control of branching in foxtail millet. ProcNatl Acad Sci USA 15:9045–9050
Farquhar GD, Ehleringer JR, Hubick KT (1989) Carbon iso-tope discrimination and photosynthesis. Annu Rev PlantPhysiol Mol Biol 40:503–537
Favre JM, Brown S (1996) A flow cytometric evaluation of thenuclear content and GC percent in genomes of Europeanoak species. Ann Sci For 53:915–917
Gale MD, Devos KM (1998) Comparative genetics in the grasses.Proc Natl Acad Sci USA 95:1971–1974
Gallois A, Burrus M, Brown S (1999) Evaluation of DNA contentand GC percent in four varieties of Fagus sylvatica L. AnnFor Sci 56:615–618
Gil B, Pastoriza E, Ballester A, Sanchez C (2003) Isolation andcharacterization of a cDNA from Quercus robur differen-tially expressed in juvenile-like and mature shoots. TreePhysiol 23:633–640
Govaerts R, Frodin DG (1998) World checklist and bibliogra-phy of Fagales (Betulaceae, Fagaceae and Ticodendraceae).Royal Botanical Garden, Kew, UK
Grattapaglia D, Sederoff R (1994) Genetic linkage maps of Eu-calyptus grandis and Eucalyptus urophylla using a pseudotest-cross mapping strategy and RAPD markers. Genetics137:1121–1137
Grattapaglia D, Bertolucci F, Sederoff R (1995) Genetic map-ping of QTLs controlling vegetative propagation in Eu-calyptus grandis and E. urophylla using a pseudo test-cross strategy and RAPD markers. Theor Appl Genet90:933–947
Griffin GJ, Hebard FV, Wendt RW, Elkins JR (1983) Survivalof American chestnut trees: Evaluation of blight resis-tanceandvirulenceofEndothiaparasitica. Phytopathology73:1084–1092
186 A. Kremer et al.
Hall AE, Richards RA, Condon AG, Wright GC, Farquhar GD(1994) Carbon isotope discrimination and plant breeding.Plant Breed Rev 4:81–113
Herendeen PS, Crane PR, Drinman AN (1995) Fagaceous flow-ers, fruits and cupules from the Campanian (late Creta-ceous) of Central Georgia, USA. Int J Plant Sci 156:93–116
Howe GT, Saruul P, Davis J, Chen THH (2000) Quantitativegenetics of bud phenology, frost damage, and winter sur-vival in an F2 family of hybrid poplars. Theor Appl Genet101:632–642
Hurme P, Sillanpää MJ, Arjas E, Repo T, Savolainen O (2000) Ge-netic basis of climatic adaptation in Scot pine by Bayesianquantitative trait locus analysis. Genetics 156:1309–1322
Jansen RC, Stam P (1994) High resolution of quantitativetrait into multiple loci via interval mapping. Genetics136:1447–1445
JermstadKD,BassoniDL, JechKS,WheelerNC,NealeDB(2001)Mappingofquantitative trait loci controllingadaptive traitsin coastal Douglas-fir. I. Timing of vegetative bud flush.Theor Appl Genet 102:1142–1151
Jermstad KD, Bassoni DL, Jech KS, Ritchie GA, Wheeler NC,Neale DB (2003) Mapping of quantitative trait loci con-trolling adaptive traits in coastal Douglas fir. III. Quan-titative trait loci-by-environment interactions. Genetics165:1489–1506
Jones JH (1986) Evolution of the Fagaceaeae: the implication offoliar features. Ann Mo Bot Gard 73:213–229
Kremer A, Dupouey JL, Deans JD, Cottrell J, Csaikl U, FinkeldeyR, Espinel S, Jensen J, Kleinschmit J, Van Dam B, DucoussoA, Forrest I, de Heredia UL, Lowe A, Tutkova M, MunroRC, Steinhoff S, Badeau V (2002) Leaf morphological dif-ferentiation between Quercus robur and Quercus petraea isstable across western European mixed oak stands. Ann ForSci 59:777–787
Kremer A, Xu LA, Ducousso A (2004) Genetics of oaks. In:Burley J, Evans J, Youngquist J (eds) Encyclopedia of ForestSciences. Elsevier, Amsterdam, pp 1501–1507
Kubisiak TL, Hebard FV, Nelson CD, Zhang J, Bernatzky R,Huang H, Anagnostakis SL, Doudrick RL (1997) Molecularmapping of resistance to blight in an interspecific cross inthe genus Castanea. Phytopathology 87:751–759
Kvaèek Z, Walther H (1989) Paleobotanical studies in Fagaceaeof the European Tertiary. Plant Syst Evol 162:213–229
Lauteri M, Scartazza A, Guido MC, Brugnoli E (1997) Geneticvariation in photo synthetic capacity, carbon isotope dis-crimination and mesophyll conductance in provenances ofCastanea sativa adapted to different environments. FunctEcol 11:675–683
Lauteri M, Monteverdi MC, Sansotta A, Cherubini M, Spac-cino L, Villani F (1999) Adaptation to drought in Euro-pean chestnut. Evidences from a hybrid zone and fromcontrolled crosses between drought and wet adapted pop-ulations. Acta Hort 494:345–353
Lin YR, Schertz KF, Paterson AH (1995) Comparative analy-sis of QTLs affecting plant height and maturity across the
Poaceae, in reference to an interspecific sorghum popula-tion. Genetics 141:391–411
Manos PS, Steele KP (1997) Phylogenetic analyses of “higher”Hamamelidiae based on plastid sequence data. Am J Bot84:1407–1419
Manos PS, Doyle JJ, Nixon KC (1999) Phylogeny, biogeography,and processes of molecular differentiation in Quercus sub-genus Quercus (Fagaceae). Mol Phylogenet Evol 12:333–349
Manos PS, Zhe-Kun Zhou, Cannon CH (2001) Systematics ofFagaceae:phylogenetic testsof reproductive trait evolution.Int J Plant Sci 162:1361–1379
Manos PS, Stanford AM (2001) The historical biogeography ofFagaceae: tracking the Tertiary history of temperate andsubtropical forests of the northern hemisphere. Int J PlantSci 162(6 Suppl):s77-s93
Marques CM, Araujo JA, Ferreira JG, Whetten R, O’MalleyDM, Liu BH, Sederoff R (1998) AFLP genetic maps of Eu-calyptus globulus and E. tereticornis. Theor Appl Genet96:727–737
Marques CM, Brondani RPV, Grattapaglia D, Sederoff R (2002)Conservation and synteny of SSR loci and QTLs for vege-tative propagation in four Eucalyptus species. Theor ApplGenet 105:474–478
Mehra PN, Hans AS, Sareen TS (1972) Cytomorphology of Hi-malayan Fagaceae. Silvae Genet 21:102–109
Naujoks G, Hertel H, Ewald D (1995) Characterisation andpropagation of an adult triploid pedunculate oak (Quer-cus robur). Silvae Genet 44:282–286
OhriD,AhujaMR(1990)GiemsaC-banding inQuercusL. (oak).Silvae Genet 39:216–219
Ohri D, Ahuja MR (1991) Giemsa C-banding in Fagus sylvaticaL.,BetulapendulaRothandPopulus tremulaL. SilvaeGenet40:72–75
Parmesan C, Yohe G (2003) A globally coherent fingerprintof climate change impacts across natural systems. Nature421:37–42
Pernas M, Sanchez-Monge R, Gomez L, Salcedo G (1998)A chestnut seed cystatin differentially effective against cys-teine proteinase from closely related pests. Plant Mol Biol38:1235–1242
Pernas M, Lopez-Solanilla E, Sanchez-Monge R, Salcedo G,Rodriguez-Palenzuela P (1999) Antifungal activity ofa plant cystatin. Mol Plant-Micr Interact 12:624–627
Porth I, Koch M, Berenyi M, Burg A, Burg K (2005a) Identifi-cation of adaptation specific differences in the mRNA ex-pression of sessile and pedunculate oak based on osmoticstress induced genes. Tree Physiol 25:1317–1329
Porth I, Scotti-Saintagne C, Barreneche T, Kremer A, Burg K(2005b) Linkage mapping of osmotic induced genes of oak.Tree Genet Genom 1:31–40
Powell W, Machray GC, Provan J (1996) Polymorphism revealedby simple sequence repeats. Trends Plant Sci 1:215–222
Romero-Severson J, Aldrich P, Mapes E, Sun W (2003) Geneticmapping in northern red oak (Quercus rubra L.). In: Plant& Animal XI Genome Conf, San Diego
Chapter 5 Fagaceae Trees 187
Saintagne C, Bodénès C, Barreneche T, Pot D, Plomion C, Kre-mer A (2004) Distribution of genomic regions differen-tiating oak species assessed by QTL detection. Heredity92:20–30
Scalfi M, Troggio M, Piovani P, Leonardi S, Magnaschi G, Ven-dramin GG, Menozzi P (2004) A RAPD, AFLP, and SSRlinkage map, and QTL analysis in European beech (Fagussylvatica L.) Theor Appl Genet 108:433–441
Scalfi M (2005) Studio della variabilita‘ genetica neutrale edadattativa in Fagus sylvatica L. Tesi di Dottorato in EcologiaXVII ciclo. University of Parma, Italy
Schwarz O (1964) Quercus. In: Tutin TG, Heywood VH, BurgesNA, Valentine DH, Walters SM, Webb DA (eds) Flora Euro-pea. Vol 1: Lycopodiaceae to Platanaceae, Cambridge Uni-versity Press, Cambridge, UK, pp 61–64
Scotti-Saintagne C, Bodénès C, Barreneche T, Bertocchi E,Plomion C, Kremer A (2004) Detection of quantitative traitloci controlling bud burst and height growth in Quercusrobur L. Theor Appl Genet 109:1648–1659
Scotti-Saintagne C, Bertocchi E, Barreneche T, Kremer A,Plomion C (2005) Quantitative trait loci mapping forvegetative propagation in pedunculate oak. Ann For Sci62:369–374
Sewell MM, Neale DB (2000) Mapping quantitative traits in for-est trees. In: Jain SM, Minocha SC (eds) Molecular Biologyof Woody Plants. Kluwer, Dordrecht, pp 407–423
Sisco PH, Kubisiak TL, Casasoli M, Barreneche T, Kremer A,Clark C, Sederoff RR, Hebard FV, Villani F (2005) An im-proved genetic map for Castanea mollissima / Castaneadentata and its relationship to the genetic map of Castaneasativa. Acta Hort 693:491–495
Steinkellner H, Lexer C, Turetschek E, Glössl J (1997) Conserva-tion of (GA)n microsatellite loci between Quercus species.Mol Ecol 6:1189–1194
Tognetti R, Michelozzi M, Giovannelli A (1997) Geographicalvariation in water relations, hydraulic architecture and ter-pene composition of Aleppo pine seedlings from Italianprovinces. Tree Physiol 17:241–250
Van Buijtenen H (2001) Genomics and quantitative genetics.Can J For Res 31:617–622
Verhaegen D, Plomion C (1996) Genetic mapping in Eucalyptusurophylla and Eucalyptus grandis using RAPD markers.Genome 39:1051–1061
Villani F, Pigliucci M, Benedettelli S, Cherubini M (1991) Ge-netic differentiation among Turkish chestnut (Castaneasativa Mill.) populations. Heredity 66:131–136
Villani F, Pigliucci M, Lauteri M, Cherubini M, Sun O (1992)Congruence between genetic, morphometric, and physi-ological data on differentiation of Turkish chestnut (Cas-tanea sativa). Genome 35:251–256
Visscher PM, Thompson R, Haley CS (1996) Confidenceintervals in QTL mapping by bootstrapping. Genetics143:1013–1020
Voorrips RE (2002) MapChart: software for the graphical pre-sentation of linkage maps and QTLs. J Hered 93:77–78
Vos P, Hogers R, Bleeker M, Reijans M, van de Lee T, HornesM, Fritjers A, Pot J, Peleman J, Kuiper M, Zabeau M (1995)AFLP: a new concept for DNA fingerprinting. Nucleic AcidsRes 23:4407–4414
Wen J (1999) Evolution of eastern Asian and eastern NorthAmerican disjunct distributions in flowering plants. AnnuRev Ecol Syst 30:421–455
Williams JGK, Kubelik AR, Livak KJ, Rafalski JA, TingeySV (1990) DNA polymorphisms amplified by arbitraryprimers are useful as genetic markers. Nucleic Acids Res18:6531–653
Xiang QY, Soltis DE, Soltis PS, Manchester SR, Crawford DJ(2000) Timing the Eastern Asia-Eastern North Americafloristic disjunction: molecular clock corroborates paleon-tological estimates. Mol Phylogenet Evol 15:462–472
Xu LA, Kremer A, Bodénès C, Huang MR (2005) ChloroplastDNA diversity and phylogenetic relationship of botanicalsections of the genus Quercus. In: Proc Joint Meeting ofIUFRO Working Groups on “Genetics of Quercus & Im-provement and Silviculture of Oaks,” 29 Sept-3 Oct 2003,Tsukuba, Japan
Zeng ZB (1994) Precision mapping of quantitative trait loci.Genetics 136:1457–1468
Zhang J, Marshall JD (1995) Variation in carbon isotope dis-crimination and photosynthetic gas exchange among pop-ulations of Pseudotsuga menziesii and Pinus ponderosa indifferent environments. Funct Ecol 9:402–412
Zoldos V, Papes D, Brown SC, Panaud O, Siljak-Yakovlev S(1998) Genome size and base composition of seven Quer-cus species: inter- and intra-population variation. Genome4:162–168