Exploiting On-Chip Voltage Regulators as a Countermeasure ...

SECURITY AND COMMUNICATION NETWORKSSecurity Comm. Networks 2011; 3:1–15
DOI: 10.1002/sec
RESEARCH ARTICLE
ACT : Towards unifying the constructs of attack and defensetrees∗
Arpan Roy, Dong Seong Kim and Kishor S. Trivedi,
Department of Electrical & Computer Engineering,Duke University, Durham, NC 27708, USA.
ABSTRACT
Attack tree (AT) is one of the widely used non-state-space models for security analysis. The basic formalism of AT doesnot take into account defense mechanisms. Defense trees (DTs) have been developed to investigate the effect of defensemechanisms using measures such as attack cost, security investment cost, return on attack (ROA) and return on investment(ROI). DT, however, places defense mechanisms only at the leaf nodes and the corresponding ROI/ROA analysis doesnot incorporate the probabilities of attack. In attack response tree (ART), attack and response are both captured but ARTsuffers from the problem of state-space explosion, since solution of ART is obtained by means of a state space model. Inthis paper, we present a novel attack tree paradigm called attack countermeasure tree (ACT) which avoids the generationand solution of a state-space model and takes into account attacks as wellas countermeasures (in the form of detectionand mitigation events). In ACT, detection and mitigation are allowed not just atthe leaf node but also at the intermediatenodes while at the same time the state-space explosion problem is avoided in itsanalysis. We study the consequences ofincorporating countermeasures in the ACT using three case studies (ACTfor BGP attack, ACT for a SCADA attack andACT for malicious insider attacks).Copyright c© 2011 John Wiley & Sons, Ltd.
KEYWORDS
attack trees, non-state-space model, mincuts, return on attack, return on investment.
∗CorrespondenceDr. Kishor S. Trivedi, Department of Electrical and Computer Engineering, Duke University, Durham, NC 27708, U.S.A.
Email: [email protected]
1. INTRODUCTION
The first step towards security modeling involves designinga scalable model [1, 2] that helps quantify security [3]in terms of key attributes such as the loss caused byattacks [4, 5] or the gain accrued from enforcing asecurity countermeasure [6]. This will aid not only inprobabilistic risk analysis (PRA) of a system but alsoin the development of a scheme as to where in thesystem, security investment should be prioritized. Thesimplest model type in this context is attack tree (AT)[7, 2]. However, the basic formalism of AT does notinclude defense mechanisms. Defense trees (DTs) [8, 9]incorporate defense mechanisms in AT. However, it placesdefense mechanisms only at the leaf nodes. Return onInvestment (ROI) and Return on Attack (ROA) analysisusing DT does not incorporate probabilities of attack.In attack response trees (ARTs) [10], both attacks and
responses are captured at any node but ARTs sufferfrom the state-space explosion problem (or the largenessproblem) due to the use of a partially observable Markovdecision process (POMDP) [11] as a solution technique.
In this paper, we present a novel attack tree model calledattack countermeasure tree (ACT). Our contributions aresummarized as follows. In ACT,
• defense mechanisms can be placed at any node ofthe tree, not just at the leaf nodes,
• generation and analysis of attack scenarios andattack-countermeasure scenarios is automated usingmincuts,
• probabilistic analysis (using measures such asattack and security investment cost, Birnbaumimportance measure, system risk, impact of anattack, ROI and ROA) is performed in an integratedmanner (as shown in Figure 1),
Copyright c© 2011 John Wiley & Sons, Ltd. 1

Attack Countermeasure Trees (ACT) : Towards unifying the constructs of attack and defense trees A. Roy et al.
Attack Countermeasure Tree
(ACT)
Analysis
Qualititative
Analysis
Probabilistic
Analysis
Mincuts
Structural Importance
Prob. of attacks
Cost
ImpactRisk
ROI&ROA
Birnbaum Importance
Figure 1. Analysis using ACT
• attack events and countermeasures are prioritizedusing structural and Birnbaum importance measureand
• the consequences of incorporating countermeasuresin the ACT are demonstrated using three casestudies (ACT for BGP attack, ACT for a SCADAattack and ACT for malicious insider attacks) [10].
We have implemented an ACT module in the SHARPE(Symbolic Hierarchical Automated Reliability and Perfor-mance Evaluator) [12, 13] software package. This is notwell known to do the tasks we were doing over the
The remainder of this paper is organized as follows.Related work is presented in Section 2. Some basic ter-minology is defined in Section 3.1. The basic model forACT is presented in Section 3.2. Section 3.3 describesqualitative and probabilistic analysis using ACT. Imple-mentation of the ACT module in SHARPE is presentedin Section 4. In Section 5, we demonstrate the utility ofACT by analyzing case studies (BGP attack [14], SCADAattack [15] and malicious insider attack [16]). Finally, weconclude the paper in Section 6.
2. RELATED WORK
Weiss’s threat logic trees [17] and Amoroso’s threattrees [18] mark the beginning of the use of decisiontrees for characterizing attacks. Schneier developed thebasic attack tree (AT) formalism [2] in which PGP ATwas used to illustrate the applications of AT. Mooreet.al [7] extended Schneier’s AT by introducing attackscenarios and attack profiles. Mauwet.al [19] developed analternative formalism for AT where the goal was associatedwith the set of all mincuts. When applied to complex casestudies, AT often became large and unwieldy. ThereforeDaley [20] proposed a layered approach to partition attacktree nodes with respect to their functionality. Since attacksand faults both lead to system failure, Fovinoet.al [21]integrated attacks into the fault tree structure by developing
a graph theoretical model called extended fault tree (EFT)[21]. However, these ATs do not tak e into accountdefense mechanisms. To incorporate defense mechanismsin AT, Bistarelli et.al [8] used defense trees (DTs) andapplied game theory to find the most cost effective setof countermeasures. Edgeet.al [22] proposed protectiontrees (PTs) which only concentrate on defense mechanismsregardless of attacks. Zonouzet.al [10] proposed attack-response trees (ARTs) that incorporate both attacksand responses but use a state-space model (partiallyobservable stochastic game model) to find an optimal setof countermeasures. Thus, their model suffers from state-space explosion. We propose ACT which provides a simpleyet compact approach for security analysis, harnessing thebenefits of the aforementioned models while at the sametime avoiding the state-space explosion problem.
3. ATTACK COUNTERMEASURE TREES
3.1. Preliminaries
Ak an attack eventDk a detection eventMk a mitigation eventCMk a countermeasureACT = {V, ψ, E} (V: set of all vertices in ACT,ψ:set of all gates in ACT, E: set of all edges in ACT)where V= {∀k, vk: vk ∈ {Aj}|| vk ∈ {Di}|| vk ∈{Ml}} whereA1, A2, ..., D1, D2, ...,M1,M2, ... are theevents of the ACT,ψ={∀k, ψk: ψk ∈ {AND, OR, k-of-ngate}}, E= {∀k, ek: ek ∈ (vi, ψj) || ek ∈ (ψi , ψj)}and X = (xA1
xA2...xD1
xD2...xM1
xM2...) is a state
vector for the ACT wherexAk, xDk
, xMkare the boolean
variables associated with eventsAk,Dk,Mk respectively.Φ(X) structure function of an ACTpAk
probability of occurrence of attack eventAk
pDkprobability of success of detection eventDk
pMkprobability of success of mitigation eventMk
Pgoal probability of attack success at the ACT goalpUD probability of undetected attack at the ACT goalpDUM probability of detected but unmitigated attack atthe ACT goalIST
Akstructural importance measure of attack eventAk
IBAk
Birnbaum importance measure of attack eventAk
iAkimpact of attack eventAk
Igoal impact at the goal node of ACTcAk
cost of attack eventAk
Cattacker attack cost at the goal node of ACTcCMk
security investment cost of countermeasureCMk
3.2. Formalism of ACT
In this subsection the basic formalism of ACT is presented.In ACT, there are three distinct classes of events: attackevents (e.g., install keystroke logger), detection events
2 Security Comm. Networks 2011; 3:1–15 c© 2011 John Wiley & Sons, Ltd.DOI: 10.1002/sec

A. Roy et al. Attack Countermeasure Trees (ACT) : Towards unifying the constructs of attack and defense trees
Attack success
A
Attack success
A
Attack success
A
…
Attack success
A
AND
M
Attack success
AAND
AND
M1 M2 Mn
…
(a) (b) (c)
(d)
(h)
AND AND
DD2 DnD1
D
D1 D2 Dn
Attack event
Detection event
Mitigation Event
Attack success
M
… DnD1
A
D2
(f)
Attack success
M2 MnM1
….
ORD
A
(e)
OR
AND AND
AND
AND
ANDAND
AND
AND
Attack success
… DmD1
A
D2
OR
AND
AND
….M2 MnM1
OR
(g)
Figure 2. (a) ACT with one attack event, (b) ACT with one attack and one detection event, (c) ACT with one attack and multipledetection events, (d) ACT with one attack, one detection and one mitigation event, (e) ACT with one attack, multiple detection andone mitigation event, (f) ACT with one attack, one detection and multiple mitigation events, (g) ACT with one attack, m detection and
n mitigation events and (h) ACT with one attack and multiple pairs of detection and mitigation events
(e.g., detect keystroke logger) and mitigation events (e.g.,remove keystroke logger). Figure 2(a) shows a simple ACTwith a single attack event. The corresponding expressionfor the probability of a successful attack at the goal node isshown in Eq. (1).
Pgoal = pA (1)
In Figure 2(b), one attack event and one detectionmechanism are used. The corresponding expression forprobability of a successful undetected attack is:
Pgoal = pA(1 − pD) (2)
Security Comm. Networks 2011; 3:1–15 c© 2011 John Wiley & Sons, Ltd. 3DOI: 10.1002/sec
Attack Countermeasure Trees (ACT) : Towards unifying the constructs of attack and defense trees A. Roy et al.
Figure 2(c) is an extension of Figure 2(b) wherendetection mechanisms are being used to detect one attackevent. The correspondingPgoal is:
Pgoal = pA(1 − pD1)(1 − pD2
)...(1 − pDn) (3)
In ACT with only detections, mitigations are assumedto be perfect, i.e., they mitigate with probability one (orpM = 1). However if mitigations are imperfect (i.e.,0 ≤pM < 1), mitigation techniques may be used in ACTin addition to detection mechanisms. Figure 2(d) showsan ACT with one attack event, one detection eventand one mitigation event. Eq. (4) is the correspondingexpression for the probability that attack was successful,i.e., either attack was undetected or attack was detectedbut unmitigated (D representing a detection event andMrepresenting a mitigation event).
Pgoal = pA(1 − pD + pD(1 − pM ))
= pA(1 − pD × pM ))(4)
Indeed, this probability can be split into two parts ifdesired: the probability of undetected attack,pUD=pA(1 −pD) and the probability of a detected but unmitigatedattack,pDUM =pApD(1 − pM ).
Figure 2(e) shows an ACT with one attack event,n
detection events and one mitigation event and the corre-sponding equation for the probability of successful attackis in Eq. (5). For the ACT in Figure 2(e), the correspondingprobability that attack is undetected ispUD=pA
∏n
i=1(1 −pDi) and the corresponding probability that attack isdetected but unmitigated ispDUM =pA(1 −
∏n
i=1(1 −pDi)) × (1 − pM ).
Pgoal = pA(1 − (1 −n
∏
i=1
(1 − pDi)) × pM ) (5)
Figure 2(f) shows an ACT with one attack event, onedetection event andn mitigation events. Eq. (6) givesthe corresponding probability of successful attack. Forthe ACT in Figure 2(f), the corresponding probabilitythat attack is undetected ispUD=pA(1 − pD) and thecorresponding probability that attack is detected butunmitigated ispDUM =pApD
∏n
i=1(1 − pMi).
Pgoal = pA(1 − pD × (1 −n
∏
i=1
(1 − pMi))) (6)
Figure 2(g) shows an ACT with one attack event,mdetection event andn mitigation events. Eq. (7) gives thecorresponding probability of successful attack.
Pgoal = pA(1 − (1 −
m∏
i=1
(1 − pDi)) × (1 −
n∏
i=1
(1 − pMi)))
(7)
Figure 2(h) shows an ACT with one attack eventand n pairs of detection and mitigation events. The
Table I. Formulae for probability of attack success
Gate type Prob. of attack success
AND gate∏n
i=1 p(i)OR gate 1 −
∏n
i=1(1 − p(i))k/n gate∗
∑n
j=k
(
n
j
)
pj ∗ (1 − p)n−j
∗for identical inputs
nature of mitigation triggered depends on the natureof intrusion detected. Eq. (8) shows the correspondingexpression forPgoal. The corresponding probability thatattack is undetected ispUD=pA
∏n
i=1(1 − pDi) andthe corresponding probability that attack is detected butunmitigated is pDUM = pA
∏n
i=1(1 − pDi × pMi) −pA
∏n
i=1(1 − pDi).
Pgoal = pA
n∏
i=1
(1 − pDi + pDi(1 − pMi))
= pA
n∏
i=1
(1 − pDi × pMi))
(8)
Besides AND and OR gates, ACT also allows for k-out-of-n gates (with identical or non-identical inputs). Table Ienumerates formulae for output probability for AND, ORgates and k-of-n gates in an ACT.
3.3. Security Analysis using ACT
In this section we present qualitative analysis andquantitative analysis using ACT.
3.3.1. Qualitative AnalysisQualitative analysis using ACT provide us with mincuts
and structural importance measures.
Mincut Analysis. In both AT and ACT, the top eventis associated with the set of all mincuts. Mincuts ofAT represent attack scenarios [23] whereas those of anACT, represent attack-countermeasure scenarios. We showan example AT for BGP attack [14] (“resetting a BGPsession” shown in Figure 3) and its corresponding ACTwith countermeasures [24] (as depicted in Figure 4).Among others, countermeasures used include traceroute[25] as one of the detection mechanisms for spoofed TCPreset messages and sequence number randomization [24]as the corresponding mitigation technique. The top (orgoal) event in the ACT can also be expressed as a booleanfunction (Φ(X)) of the leaf node events. In Eq. ( 9),Φ(X),the complementary boolean structure function for the ATin Figure 3 is given, where X is a state vector of the ACTand xAi is a boolean variable such thatxAi = 1 wheneventAi occurs elsexAi = 0. Mincuts for the AT in Figure3 are:{(A111, A12),(A1121, A12), (A1122, A12),(A1123,
4 Security Comm. Networks 2011; 3:1–15 c© 2011 John Wiley & Sons, Ltd.DOI: 10.1002/sec

A. Roy et al. Attack Countermeasure Trees (ACT) : Towards unifying the constructs of attack and defense trees
A111: Send RST
message to TCP stack
A112: Send BGP
message
A12: TCP sequence
number attack
A1121:
Notify
A1122:
Open
A1123:
Keep Alive
G: Reset a single BGP session
Impact = Unavailability
A1: Send message to router
causing reset
A2: Alter configuration via
compromised router
AND
OR
OR
OR
Figure 3. A simple attack tree for resetting the BGP session
A111: Send
RST message
to TCP stack
A112: Send
BGP message
A12 : TCP
sequence
number attack
A1121:
Notify A1122: Open A1123: Keep
Alive
G: Reset a single BGP session
A1: Send message to
router causing reset
A2: Alter
configuration
via
compromised
router
Attack event
Detection event
Mitigation Event
M12: MD5
authentication
M2:
Secure
router
M1:
Randomize
Seq. Num.
D12: TCP
sequence
number check
D1: Trace-
route
checkD2: Router
firewall
alert
OR
OR
AND
AND
AND
AND
OR
AND AND
AND
Figure 4. A simple ACT for resetting a BGP session
A12),(A2)}.
Φ(X) = xA111xA12
+ xA1121xA12
+ xA1122xA12
+xA1123xA12
+ xA2
(9)
The mincuts (attack countermeasure scenarios) of theACT in Figure 4 are{(A111,CM1,A12,CM12), (A1121,
CM1, A12, CM12), (A1122, CM1, A12, CM12), (A1123,CM1,A12,CM12), (A2,CM2)} (whereCM1=(D1M1),CM12=(D12M12), CM2=(D2M2)). Each of the 5mincuts represents a combination of events each of whichon occurring will result in attack success at the goal. Forinstance the mincut (A1122, CM1, A12, CM12) indicates
Security Comm. Networks 2011; 3:1–15 c© 2011 John Wiley & Sons, Ltd. 5DOI: 10.1002/sec

Attack Countermeasure Trees (ACT) : Towards unifying the constructs of attack and defense trees A. Roy et al.
that if both the attack eventsA1122 andA12 were to occurand if both the countermeasuresCM1 and CM12 fail,attack will succeed. From the mincut (A1122, CM1, A12,CM12), we also observe that the pair of attack events(A1122, A12) is covered by either of the countermeasuresCM1 or CM12. We use mincuts in Section 3.3.2 todevelop an approach for the cost and the impact analysisin ACT. In future work, mincuts will also be used to findthe optimal countermeasure set for an ACT.
Structural Importance Measure Analysis. It isimportant to determine the most critical event in ACT.Towards this objective, structural importance measure [26]can be used. The concept of ordering system componentsbased on structural importance was first introduced byBoland et al. [27]. Structural importance measure [28]is used when ACT has equiprobable events, i.e., weare provided with only the ACT but probability ofattack (for attack events) and detection/mitigation (fordetection/mitigation events) are unknown. Given an ACT,its boolean structure function (Φ(X)) can be built.Φ(X) = 1 when the attack succeeds whereasΦ(X) = 0when attack fails. Two state vectors are considered:
X = (xA1xA2
... xAk−1xAk
xAk+1... xAn)
X′ = (xA1
xA2... xAk−1
xAkxAk+1
... xAn)
The structural importance measure of an attack event (Ak)in an ACT is defined to be the normalized count of statevectors where the component is relevant for the booleanstructure function. The corresponding expression forIST
Ak
is shown in Eq. (10).
ISTAk
=
∑
X Φ(X)Ak− Φ(X ′)Ak
2n(10)
An attack event (Ak) is said to be relevant for a particularstate vectorX, when flipping the boolean value associatedwith attack eventAk flips the value ofΦ(X) from 1to 0. In other words,Ak is relevant to state vector X ifΦ(X)Ak
− Φ(X ′)Ak= 1. Once the most critical event
in the system is determined, it can be patched or theappropriate detection and mitigation for the componentcan be enforced.
3.3.2. Probabilistic AnalysisThe computation of probability of a successful attack
in an ACT was discussed in Section 3.2. For ACT,the probability of a successful attack can be computedwhich can be further split into the probability thatthe attack is undetected and the probability that theattack is detected but unmitigated. When provided withvalues for parameters such as probabilities of attacks,cost etc., probabilistic (or quantitative) analysis can beperformed using ACTs. Quantitative analysis using ACTcan be viewed from two distinct viewpoints: attackers’viewpoint and defender’s (or security analyst’s) viewpoint.
Table II. Formulae for attack cost and attack impact
Gate type attack cost impact
AND gate∑n
i=1 cAi
∑n
i=1 iAi
OR gate minni=1 cAi maxn
i=1 iAi
k-of-n gatea∑k
i=1 cAi
∑k
i=1 iAiaFor k-of-n gate, it is assumed that (cA1
,cA2,...,cAn
) are sorted in the
ascending order of their cost values and (iA1,iA2
,...,iAn) are sorted in the
descending order of their impact values.
G
A1 A2A3 A3
OR
AND
OR
Repeated Event
Non-repeat Event
Figure 5. Attack tree with repeated events
The measures such as attack cost and ROA reflect theattacker’s perspective whereas the metrics such as securityinvestment cost, risk, impact and ROI represent thedefender’s perspective.
Cost Computation. In ACT, cost may be of two types:cost of attack and security investment cost. Cost of attackin ACT (Cattacker) with no repeated events is computedusing the expressions in Table II [29]. In ACT, the cost ofattack is the sum of the costs of the input events for anAND gate whereas it is the minimum of the cost of theinput events for an OR gate. The cost of attack for a k-of-ngate is the sum of the cost ofk lowest cost input events tothe gate.
For an ACT containing one or more repeated events (asshown in Figure 5), we use a simple procedure to computethe attack cost. SHARPE [13] can be used to generatethe mincuts of the ACT. Attack cost for the mincut canbe given by the sum of the attack costs of each attackevent in the mincut. Attack cost of the mincut with lowestcost is selected to be the cost of attack for the ACT. Incase of Figure 5, the ACT mincuts are{(A1,A2),A3} andhence the correspondingCattacker = min{cA1
+cA2,cA3
}.In case of an OR gate, we take a “panic approach” in
6 Security Comm. Networks 2011; 3:1–15 c© 2011 John Wiley & Sons, Ltd.DOI: 10.1002/sec

A. Roy et al. Attack Countermeasure Trees (ACT) : Towards unifying the constructs of attack and defense trees
(a)
Stru
ctur
al im
porta
nce m
easu
re o
f an
atta
ck e
vent
in
BG
P A
CT
(A12)
(A1)
(A2)
(CM1) (CM12)(CM2)
Birn
baum
impo
rtanc
e mea
sure
of a
n at
tack
even
t in
BG
P A
CT
(A12)
(A1)
(A2)
(CM1) (CM12)(CM2)
Prob
abil
ity
of a
ttac
k at
goa
l in
BG
P A
CT
(Pgo
al)
(c)
(CM2)(CM1) (CM12)
Pro
bab
ilit
y o
f at
tack
at g
oal
in
BG
P A
CT
(P
go
al)
(d)
(a)(CM2) (CM1)
(CM2)
(CM1) (CM2)
(CM1)
(CM2)
(CM1)(CM1)
(b)
(CM1)(CM2) (CM12)
(CM2) (CM1)(CM2)
Figure 6. Change in (a) structural importance measure, (b) corresponding change in Pgoal, (c) change in Birnbaum importancemeasure and (c) corresponding change in Pgoal for BGP ACT due to implementation of countemeasures
calculating theCattacker at the output, meaning that outof different input events of an OR gate, we choose theminimum value of attack cost to be propagated. We do sobecause an attacker’s capabilities and preferences cannotbe known in advance and the attacker is assumed to takethe best way out (i.e., the minimum cost attack). For thesame reason, we select the minimum cost mincut whilecomputingCattacker for an ACT with repeat events.
Security investment cost for ACT is computed bysumming the security investment cost of countermeasurespresent in the ACT. Also using ACT, the set of feasibleattack scenarios can be built subject to attackers’ resourceconstraint (e.g., attack cost). This is called ‘capabilitybased pruning’ of AT in SecurITree [30] AT analysistool. If the total attack cost is provided as the attacker’sresource constraint, a subset of mincuts (or a subset of
attack scenarios) can be determined which the attackercan successfully exploit subject to his resource (cost)constraint.
Impact Computation. Instead of pursuing a scaledapproach for impact computation (for instance, normalizedin a scale from 1-10 in [22]), in ACT, we use the exactvalue of impact [31] associated with every attack event.Even though countermeasures do not affect impact valuedirectly, countermeasures do result in reducing risk whichis the expected value of impact. Impact computationfor different gates in ACT with no repeated events issummarized in Table II. If repeated events are present inthe ACT, we follow a procedure similar to that used in costcomputation. We first find the mincuts of the ACT. Impactof a mincut is the sum of the impact values of the attack
Security Comm. Networks 2011; 3:1–15 c© 2011 John Wiley & Sons, Ltd. 7DOI: 10.1002/sec

Attack Countermeasure Trees (ACT) : Towards unifying the constructs of attack and defense trees A. Roy et al.
Incorrect
monitoringUnavailable
network (LAN)
(ULAN)
Problematic
ControlDatabase
(DB)
Unavailable
network
(UWAN)
Workstation
(WS)
Incomplete
sensors
Wrong state
estimation
(WSE)
Control
servers
Controlling
agents
Power loads
not provided
Incorrect estimates to
customers
SCADA
compromised
S1 S2 S3
HMI
switch
G1 G2 G3
restart restart restart
2/3
AND AND AND AND
AND
SCOPF
AND
Attack event
Mitigation Event
OR
OROR
OR OR
Figure 7. ACT for SCADA system
events in the mincut. Impact of the mincut with highestimpact value is selected to be the impact of the ACT.For instance, in case of the ACT in Figure 5(a), since themincuts are{(A1,A2),A3}, Igoal = max{iA1
+iA2,iA3
}.In case of an OR gate, we again assume the worst casescenario in calculatingIgoal at the output, meaning thatout of different input events of an OR gate, we choosethe maximum value of impact to be propagated. We doso because an attacker’s capabilities and preferencescannot be known in advance and the security analyst hasto be prepared for worst possible consequence (i.e., themaximum impact attack). For the same reason, we selectthe maximum impact mincut while computingIgoal of anACT with repeat events.
Birnbaum Importance Measure. When probabilitiesof attack/defense are known for ACT nodes, Birnbaumimportance measure [32] (also termed ‘reliability impor-tance measure’ for fault trees) is used to prioritize defensemechanisms to counteract attack events. The Birbaumimportance measure of an attack event represents thechange in the probability of attack at the goal caused bysmall change in the probability of attack of the ACT node
at Ak. The Birnbaum importance measure of an attackeventAk is defined as:
IBAk
=∂Pgoal
∂pAk
(11)
SHARPE can be used to computeIBAk
.
Risk Computation. In the context of ACT, riskcan refer to two distinct measures namely, (i) risk to theattacker [33] and (ii) risk to the system [34]. Attacker’s riskof an atomic attack refers to the probability of detectionof the atomic attack [33]. AttackTree+ AT analysis tool[35] refers to this type of risk as the ‘accepted risk’ ofthe attacker. Since we deal with probability of detectionof atomic attacks inPgoal computation in Section 3.2, inthis subsection we discuss risk to the system. Risk to asystem refers to the system’s risk to a particular attackscenario. In this context, two measures need to be takeninto consideration. One is the amount of damage thatan attack scenario can render to the system (Igoal) andthe other is the probability of attack success (Pgoal).Combining the two, risk to the system can be definedas the expected value of the impact. The expression forsystem risk for ACTs is:
8 Security Comm. Networks 2011; 3:1–15 c© 2011 John Wiley & Sons, Ltd.DOI: 10.1002/sec

A. Roy et al. Attack Countermeasure Trees (ACT) : Towards unifying the constructs of attack and defense trees
A2121: FTP
to File
Server
A2122:
Internet
A21221: Post to
News Group
A21222: Post to
Website
G: Malicious Insider attack success
A1: Alteration A4: Elevation
OR
OR
OR
A2141:
Floppy
Disk
A2142:
CD-
ROM
A2143:
USB
Drive
OR
A2111:
Local
Account
A2112:
Web-
based
account
OR
A211:
EmailA214: Copy
to Media
OR
A212:
Electronic
Drop Box
A213:
Online
Chat
A11:
Unauthorized
alternation of
registryA12:
Launch
virus
OR
A411: Poor
Configuration
A412:
Steal
Password
A413:
Sendmail
Exploit
OR
A41: Acquire
admin privilege
A4121:
Sniff
Network
A4122:
Root
Telnet
OR
A31: MisuseA32: Violation of
organization policy
AND
A3: SnoopingA2: Distribution
A21:
File
Sharing
AND
AND
AND
AND
M12: Launch
mitigation
(anti-virus)
D12: Detect virus
attack
(anti-virus)
D412: Track
number of tries
at password
M412: Request
admin pin
Figure 8. ACT for Malicious Insider Attack (MI ACT)
Risksys = Pgoal × Igoal (12)
In an ACT without any countermeasures, applicationof CMi causes the output probability of the ACT nodecontaining attack eventAk (point of application ofCMi)to decrease by△pAkCMi
(for instance, incorporation ofCMi may cause the ACT node in Figure 2(a) to becomethe ACT node in Figure 2(d)). In ACT, the decrease in risk(△RiskCMi ) for countermeasureCMi can be given by:
△RiskCMi= Riskwithout CMi
− Riskwith CMi
= Igoal × (Pgoalwithout CMi− Pgoalwith CMi
)
(13)
where Pgoalwith CMiis Pgoal of the ACT with
countermeasureCMi andPgoalwithout CMiisPgoal of the
ACT without countermeasureCMi. Similarly for an ACTwith incorporated countermeasure setSCM , the decreasein risk (△RiskSCM
) for countermeasure setSCM can begiven by:
△RiskSCM= Riskwithout SCM
− Riskwith SCM
= Igoal × (Pgoalwithout SCM− Pgoalwith SCM
)
(14)
bvROA and ROI Computation. Two metrics from the
field of economics have been adapted to the securityscenario in order to quantify the nature of the competitionbetween the attacker and the defender. Return on Attack
(ROA) [8, 9] is an index that is aimed at measuring thebenefit to the attacker from a particular attack. Unlikeattack cost, ROA changes with the application of specificcountermeasures. ROA [4] is defined by:
ROA =Risksys
Cattacker
=Igoal × Pgoal
Cattacker
(15)
Next we discuss a quantification of Return onInvestment (ROI) [6]. The basic definition ofROICMi isthe profit obtained by the implementation ofCMi (therebysignifying the efficacy of that countermeasure). ROI forcountermeasureCMi is a function of the impact of attackof the ACT, the decrease in the probability of attack atthe ACT goal (△PgoalCMi
) due toCMi and the securityinvestment cost forCMi (cCMi ). Adapting Sonnenreich’sdefinition of Return on Investment [6] to the context ofACT, we have:
ROICMi =profit from CMi − Cost of implementing CMi
Cost of implementing CMi(16)
ROICMi =Igoal ×△PgoalCMi
− cCMi
cCMi
(17)
Note that, ROICMi ≥ -1.
Security Comm. Networks 2011; 3:1–15 c© 2011 John Wiley & Sons, Ltd. 9DOI: 10.1002/sec

Attack Countermeasure Trees (ACT) : Towards unifying the constructs of attack and defense trees A. Roy et al.
4. IMPLEMENTATION
We use SHARPE [13] for the evaluation of ACT. Wehave implemented a module for automatic description andevaluation of ACTs in SHARPE. For the computation ofprobability of attack, mincuts, structural and Birnbaumimportance measure of ACT, we simply use the alreadyexisting algorithms for solving fault trees in SHARPE. Wehave added the relevant algorithms (described in Section3.3.2) for computing cost, impact and risk in ACTs. ROAand ROI computation is done by defining functions in theSHARPE input file.
5. EXAMPLES
For the analysis of ACT, we use the BGP ACT [14] ofFigure 4, the SCADA ACT [10] of Figure 7 and ACT formalicious insider attack (MI ACT) of Figure 8 as casestudies. Two significant characteristics of the SCADAACT are: (i) it contains only attack and mitigation eventsand (ii) all mincuts are not covered by the mitigationtechniques provided. The basic structure of the ACTfor malicious insider attack (MI ACT) was proposed in[16]. We built on this structure by adding lower levelsubtrees from other sources (for instance, in MI ACTthe subtree for attack by ‘elevation’ of malicious user(nodeA4 in Figure 8) is obtained from [36]). MI ACThas attack, detection and mitigation events. However inMI ACT as well, all the mincuts are not covered by thecountermeasures provided.
Figure 6(a) shows the variation in structural importancemeasure and Figure 6(c) shows the variation in Birnbaumimportance measure of attack eventAi in BGP ACTdue to implementation of countermeasureCMi. FromFigure 6(c) and Figure 6(d), observe that maximumdecrease inPgoal is caused by the implementation of thecountermeasure associated with the attack event with thehighest value ofIB
Ak. For instance, in BGP ACT with
no defense (or the BGP AT), attack eventA1 (‘SendRESET message’) has highest value ofIB
Akleading to
the implementation ofCM1 (‘Traceroute’) first. Thecorresponding decrease inPgoal (shown in Figure 6(c))is the maximum for all the countermeasures present.Therefore, implementation of countermeasures (CMi) forattack events (Ai) with higher values ofIB
Akshould be
prioritized. Similarly we can observe from Figure 6(a) andFigure 6(b) that implement countermeasures with higherIST
Akshould be prioritized.
The values for the input parameters for countermeasurenodes of all three ACTs are in Table III and the values forthe input parameters for attack nodes of all three ACTs arein Table IV.
Table III. Parameter values for attack nodes in ACT
ACT Node Probability attack attackof attack cost(in $) impact
(in 103$)A111 (BGP) 0.08 50 200A1121 (BGP) 0.1 60 130A1122 (BGP) 0.15 70 100A1123 (BGP) 0.2 100 300A12 (BGP) 0.1 150 250A2 (BGP) 0.4 190 275AS1
(SCADA) 0.1 100 300AS2
(SCADA) 0.1 110 150AS3
(SCADA) 0.1 90 225AWSE (SCADA) 0.25 250 250AULAN (SCADA) 0.3 275 275AHMI (SCADA) 0.2 100 100ASCOPF (SCADA) 0.15 120 120AG1
(SCADA) 0.15 100 300AG2
(SCADA) 0.3 30 200AG3
(SCADA) 0.2 40 150ADB (SCADA) 0.5 170 50AUWAN (SCADA) 0.35 160 100AWS (SCADA) 0.4 150 150A11 (MI ACT) 0.08 50 200A12 (MI ACT) 0.1 60 130A2111 (MI ACT) 0.15 70 100A2112 (MI ACT) 0.2 100 300A2121 (MI ACT) 0.1 150 250A21221 (MI ACT) 0.4 190 275A21222 (MI ACT) 0.1 100 300A213 (MI ACT) 0.1 110 150A2141 (MI ACT) 0.1 90 225A2142 (MI ACT) 0.25 250 250A2143 (MI ACT) 0.3 275 275A31 (MI ACT) 0.2 100 100A32 (MI ACT) 0.15 120 120A411 (MI ACT) 0.15 100 300A4121 (MI ACT) 0.3 30 200A4122 (MI ACT) 0.2 40 150A413 (MI ACT) 0.5 170 50
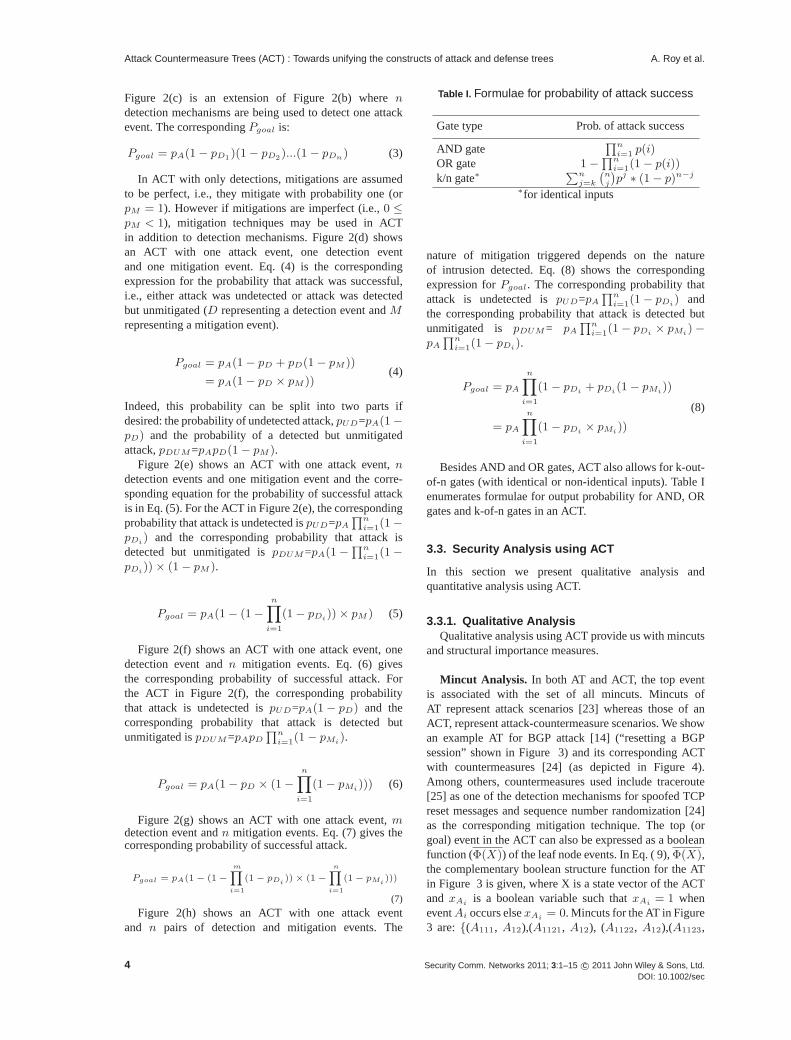
Figure 9(a) showsPgoal for BGP ACT (with andwithout countermeasures), Figure 9(b) showsPgoal forSCADA ACT (with and without countermeasures) andFigure 9(c) showsPgoal for MI ACT (with and withoutcountermeasures) with probability of attack value of all theleaf nodes in the ACT varying together in the range [0,1].From Figure 9(a) we find thatPgoal value for BGP ACTdecreases with the incorporation of detection mechanisms(Pgoal=PUD). With only detection mechanisms in ACT,mitigations are assumed to be perfect, i.e., they workwith probability one. Therefore with the incorporation ofmitigations (imperfect mitigations) in BGP ACT,Pgoal
increases (Pgoal=PUD+PDUM ). SCADA ACT has onlyattack and mitigation events. Here detections are assumedto be perfect, i.e.,Pgoal=PUD+PDUM with all pDi=1.
10 Security Comm. Networks 2011; 3:1–15 c© 2011 John Wiley & Sons, Ltd.DOI: 10.1002/sec
A. Roy et al. Attack Countermeasure Trees (ACT) : Towards unifying the constructs of attack and defense trees
(a) (b)
0 0.2 0.4 0.6 0.8 10
0.1
0.2
0.3
0.4
0.5
0.6
0.7
0.8
0.9
1
Probability of attack at leaf node of BGP ACT
Pro
ba
bil
ity
of
att
ac
k a
t th
e g
oa
l o
f B
GP
AC
T
Pgoal without D or M
Pgoal with D
Pgoal with D & M(P
go
al)
0 0.2 0.4 0.6 0.8 10
0.1
0.2
0.3
0.4
0.5
0.6
0.7
0.8
0.9
1
Probability of attack at leaf node of SCADA ACT
Pro
ba
bil
ity
of
att
ac
k a
t th
e g
oa
l o
f S
CA
DA
AC
T
Pgoal_SCADA_ACT_without_M
Pgoal_SCADA_ACT_with_M
(Pg
oa
l)
0 0.2 0.4 0.6 0.8 10
0.1
0.2
0.3
0.4
0.5
0.6
0.7
0.8
0.9
1
Probability of attack at leaf node of MI ACT
Pro
ba
bil
ity
of
att
ac
k a
t th
e g
oa
l o
f M
I A
CT
Pgoal without D or M
Pgoal with D
Pgoal with D & M
(c)
Figure 9. Pgoal vs. probability of attack values of all the leaf nodes of (a) BGP ACT, (b) SCADA ACT and (c) MI ACT
Table IV. Parameter values for countermeasure nodes in ACT
ACT Node Prob. of Securitycountermeasure investment
success cost(in $)D1 (BGP) 0.5 10M1 (BGP) 0.6 30D12 (BGP) 0.8 10M12 (BGP) 0.5 20D2 (BGP) 0.7 15M2 (BGP) 0.5 35Mswitch (SCADA) 0.25 15MrestartG1(SCADA) 0.4 25MrestartG2(SCADA) 0.5 20MrestartG3(SCADA) 0.6 30D12 (MI ACT) 0.5 10M12 (MI ACT) 0.6 30D412 (MI ACT) 0.8 10M412 (MI ACT) 0.5 20
From Figure 9(b), we find thatPgoal decreases with theincorporation of mitigations in SCADA ACT. Similarly,from Figure 9(c) we find thatPgoal value for MI ACTdecreases with the incorporation of detection mechanismsand then increases with the incorporation of mitigations(imperfect mitigations).
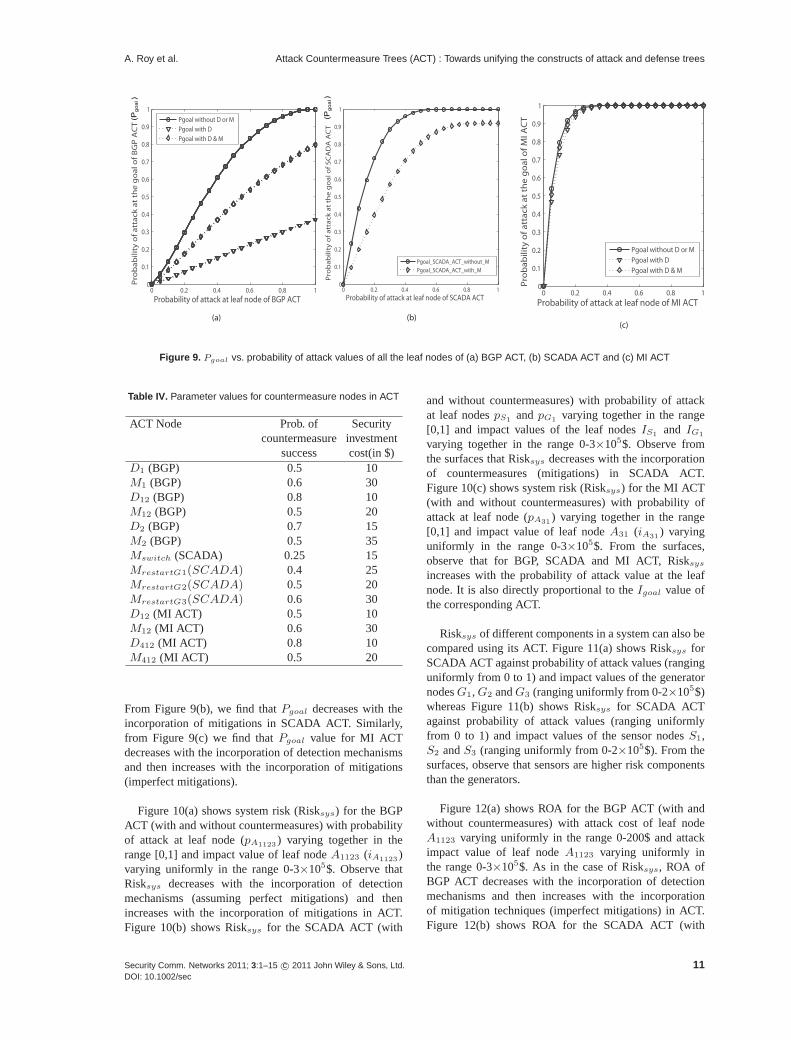
Figure 10(a) shows system risk (Risksys) for the BGPACT (with and without countermeasures) with probabilityof attack at leaf node (pA1123
) varying together in therange [0,1] and impact value of leaf nodeA1123 (iA1123
)varying uniformly in the range 0-3×10⁵$. Observe thatRisksys decreases with the incorporation of detectionmechanisms (assuming perfect mitigations) and thenincreases with the incorporation of mitigations in ACT.Figure 10(b) shows Risksys for the SCADA ACT (with
and without countermeasures) with probability of attackat leaf nodespS1
andpG1varying together in the range
[0,1] and impact values of the leaf nodesIS1and IG1
varying together in the range 0-3×10⁵$. Observe fromthe surfaces that Risksys decreases with the incorporationof countermeasures (mitigations) in SCADA ACT.Figure 10(c) shows system risk (Risksys) for the MI ACT(with and without countermeasures) with probability ofattack at leaf node (pA31
) varying together in the range[0,1] and impact value of leaf nodeA31 (iA31
) varyinguniformly in the range 0-3×10⁵$. From the surfaces,observe that for BGP, SCADA and MI ACT, Risksys
increases with the probability of attack value at the leafnode. It is also directly proportional to theIgoal value ofthe corresponding ACT.
Risksys of different components in a system can also becompared using its ACT. Figure 11(a) shows Risksys forSCADA ACT against probability of attack values (ranginguniformly from 0 to 1) and impact values of the generatornodesG1,G2 andG3 (ranging uniformly from 0-2×10⁵$)whereas Figure 11(b) shows Risksys for SCADA ACTagainst probability of attack values (ranging uniformlyfrom 0 to 1) and impact values of the sensor nodesS1,S2 andS3 (ranging uniformly from 0-2×10⁵$). From thesurfaces, observe that sensors are higher risk componentsthan the generators.
Figure 12(a) shows ROA for the BGP ACT (with andwithout countermeasures) with attack cost of leaf nodeA1123 varying uniformly in the range 0-200$ and attackimpact value of leaf nodeA1123 varying uniformly inthe range 0-3×10⁵$. As in the case of Risksys, ROA ofBGP ACT decreases with the incorporation of detectionmechanisms and then increases with the incorporationof mitigation techniques (imperfect mitigations) in ACT.Figure 12(b) shows ROA for the SCADA ACT (with
Security Comm. Networks 2011; 3:1–15 c© 2011 John Wiley & Sons, Ltd. 11DOI: 10.1002/sec

Attack Countermeasure Trees (ACT) : Towards unifying the constructs of attack and defense trees A. Roy et al.
0100
200300
0
0.5
150
100
150
200
250
300
Ris
k t
o t
he
sy
ste
m (
Ris
ksy
s)
Risk without D or M
Risk with D
Risk with D & M
x 10^3
(a)
Impact value of leaf
node A1123 of
BGP ACT in dollars
Probability of attack of
leaf node A1123 in BGP
ACT
0100
200300
00.5
1150
200
250
300
350
400
450
500
550
600
650
Ris
k t
o t
he
sy
ste
m (
Ris
ksy
s)
Risk without CM
Risk with CM
(b)
Probability of attack of
leaf nodes S1 and G1 of
SCADA ACT
Impact value of leaf nodes
S1 and G1 of SCADA
ACT in dollars
x 10^3
0100
200300
0
0.5
1180
190
200
210
220
230
240
Ris
k t
o t
he
sy
ste
m (
Ris
ksy
s)
Risk without D or M
Risk with D
Risk with D & M
Impact value of leaf
node A31 of
MI ACT in dollars
Probability of attack of
leaf node A31 in MI ACT
(c)
x 10^3x 10^3
Figure 10. Risk to system (Risksys) (a) for BGP ACT against pA1123(x axis) and iA1123
(y axis), (b) for SCADA ACT with both pS1
and pG1being varied (x axis) and both IS1
and IG1being varied (y axis) and (c) for MI ACT against pA31
(x axis) and iA31(y axis)
0
1
2
x 105
0
0.2
0.40
0.5
1
1.5
Ris
k t
o t
he
sy
ste
m
00.5
11.5
2
x 105
0
0.2
0.40
10
20
30
Ris
k t
o t
he
sy
ste
m
Probability of attack
values for generators
(G1,G2,G3)
Impact values
for generators
(G1,G2,G3)
Impact values
for sensors
Probability of attack
values for sensors
(S1,S2,S3) (S1,S2,S3)
(a) (b)
Figure 11. Risksys in SCADA ACT (a) against the probability of attack values (x axis) and attack impact values (y axis) for thegenerators (G1,G2,G3) (b) against the probability of attack values (x axis) and attack impact values (y axis) for the sensors (S1,S2,S3)
and without countermeasures) with attack cost of theleaf nodesS1 and G1 varying together in the range0-200$ and impact values of the leaf nodesS1 andG1
varying together in the range 0-3×10⁵$. ROA for SCADAACT decreases with incorporation of countermeasures.Figure 12(c) shows ROA for the MI ACT (with andwithout countermeasures) with attack cost of leaf nodeA31 varying uniformly in the range 0-200$ and attackimpact value of leaf nodeA31 varying uniformly in therange 0-3×10⁵$. From the surfaces we see that for BGP,SCADA and MI ACT, ROA value is directly proportionalto Igoal value and inversely proportional toCattacker
value of the corresponding ACT.
Figure 13(a) showsPgoal for BGP ACT, Figure 13(b)showsPgoal value for SCADA ACT and Figure 13(c)shows Pgoal for MI ACT with the probability that acountermeasure works (pCMi ) for all the countermeasuresin the ACT varying together in the range [0,1]. For BGP,SCADA and MI ACT, it can be seen thatPgoal decreaseswith increasingpCMi . MoreoverCM1 andCM12 havethe same effect onPgoal of BGP ACT and their plotsoverlap.
12 Security Comm. Networks 2011; 3:1–15 c© 2011 John Wiley & Sons, Ltd.DOI: 10.1002/sec

A. Roy et al. Attack Countermeasure Trees (ACT) : Towards unifying the constructs of attack and defense trees
050
100 0100
200300
0.2
0.4
0.6
0.8
1
1.2
1.4
1.6
Re
turn
on
Att
ack
(R
OA
)
ROA without D & M
ROA with D
ROA with D & M
(a)
1123( in BGP ACT)A1123( in BGP ACT)
AC
Attack Cost for leaf
node of BGP ACT (in
dollars)
Impact value of leaf
node of BGP ACT (in
dollars)
1 1S G
x 10^30
50100 0
100200
3001
2
3
4
5
6
7
8
9
Re
turn
on
Att
ac
k (
RO
A)
ROA without CM
ROA with CM
(b)
1 1S
SCADA ACT)
G(C and C in
SCADA ACT)
Impact value of
leaf nodes of SCADA ACT
(in dollars)
Attack cost for leaf
node of SCADA ACT
(in dollars)
x 10^3x 10^3
i( i and i in
0
50
100 0100
200300
4000
1
2
3
4
5
6
7
8
9
Re
turn
on
Att
ac
k (
RO
A)
ROA without D or M
ROA with D
ROA with D & M
(c)
( in MI ACT)
Attack Cost for leaf
node of MI ACT
(in dollars)
Impact value of leaf
node of MI ACT (in
dollars)
( in MI ACT)31Ac
31Ai
Figure 12. ROA against (a) varying attack impact value iA1123(x axis) and attack cost value CA1123
(y axis) of the leaf node A1123
in BGP ACT, (b) varying attack impact value IS1,IG1
(x axis) and attack cost value CS1,CG1
(y axis) of leaf nodes S1 and G1 ofSCADA ACT and (c) varying attack impact value iA31
(x axis) and attack cost value cA31(y axis) of the leaf node A31 in MI ACT
(a) (b)
0 0.2 0.4 0.6 0.8 10
0.05
0.1
0.15
0.2
0.25
0.3
0.35
0.4
0.45
Probability that the countermeasure works
Pro
ba
bil
ity
of
att
ack
at
the
go
al o
f B
GP
AC
T
Pgoal_BGP_ACT_with_CM_{1}
Pgoal_BGP_ACT_with_CM_{12}
Pgoal_BGP_ACT_with_CM_{2}
only
only
only
only
only
0 0.2 0.4 0.6 0.8 10.69
0.7
0.71
0.72
0.73
0.74
0.75
Probability that the countermeasure works
Pro
ba
bil
ity
of
att
ac
k a
t th
e g
oa
l o
f M
I A
CT
Pgoal with only D_{12} and M_{12}
Pgoal with only D_{412} and M_{412}
(c)
0 0.2 0.4 0.6 0.8 10.908
0.9085
0.909
0.9095
0.91
0.9105
0.911
0.9115
Probability that the countermeasure works
Pro
ba
bil
ity
of
att
ac
k a
t th
e g
oa
l o
f S
CA
DA
AC
T
Pgoal_SCADA_ACT_with_CM_{switchHMI}
Pgoal_SCADA_ACT_with_CM_{restartG3}
Figure 13. Pgoal against the probability that a countermeasure succeeds for (a) BGP ACT, (b) SCADA ACT and (c) MI ACT
Figure 14(a) shows ROI for each countermeasure inBGP ACT, Figure 14(b) shows ROI for countermeasures(switch HMI) and (restartG3) for SCADA ACT andFigure 14(c) shows ROI for each countermeasure in MIACT with security investment cost of the countermeasure(cCMi ) varying uniformly in the range 0-100$ and thecorrespondingpCMi varying uniformly in the range[0,1]. For all countermeasures, we observe that ROI =-1 for pCMi=0. From Figure 14(a), it can be seen thatROI from CM2 exceeds that fromCM1 or CM12. Thisallows the security analyst to prioritize the implementationof CM2 in BGP ACT. For SCADA ACT, ROI of and
the winter(restartG3) exceeds ROI of (switchHMI).Similarly for MI ACT, ROI of CM412 exceeds ROI ofCM12 and CM123 and without this there will not beanything left to talk and .
6. CONCLUSIONS
In this paper, we have presented attack countermeasuretrees (ACT), a non-state-space model that allows usto perform qualitative and probabilistic analysis of the
Security Comm. Networks 2011; 3:1–15 c© 2011 John Wiley & Sons, Ltd. 13DOI: 10.1002/sec

Attack Countermeasure Trees (ACT) : Towards unifying the constructs of attack and defense trees A. Roy et al.
0
50
100
0
0.5
1
−2
−1
0
1
2
3
4
5
Re
turn
on
Inv
est
me
nt
(RO
I CM
i)
ROI(switchHMI)
ROI(restartG3)
(b)
Security Investment
Cost of a counter-
measure (CM_i) in
Probability that
countermeasure
(CM_i) works
dollars(p_{CM_i})
0
50
100
0
0.5
1
−5
0
5
10
15
20
25
Re
turn
on
Inv
est
me
nt
(RO
I CM
i)
ROI_{CM_1}
ROI_{CM_{12}}
ROI_{CM_2}
(a)
Security Investment
Cost of a counter-
measure (CM_i) in
Probability that
countermeasure
(CM_i) works
dollars(p_{CM_i})
0
50
100
0
0.5
1
0
0.5
1
1.5
2
2.5
3
Re
turn
on
Inve
stm
en
t (R
OI)
ROI of CM_{12}
ROA of CM_{412}
(c)
Security Investment
Cost of a counter-
measure (CM_i) in
Probability that
countermeasure
(CM_i) works
dollars(p_{CM_i})
Figure 14. ROI for each countermeasure (a) against cCMi(x axis) and pCMi
(y axis) for BGP ACT, (b) against cCMi(x axis) and
pCMi(y axis) for SCADA ACT and (c) against cCMi
(x axis) and pCMi(y axis) for MI ACT
security of a system. We take into account attacks as wellas countermeasures (in the form of detection mechanismsand mitigation techniques). Detections and mitigationscan be placed not just at the leaf node but also at anyintermediate node. Events in ACT can be prioritizedwith the help of structural and Birnbaum importancemeasures. The effects of incorporating countermeasures inthe ACT are demonstrated using three case studies (ACTfor BGP attack, ACT for SCADA attack and ACT formalicious insider attack). In future work, we will explorethe use of ACT for fast and efficient computation ofoptimal defense strategies for large systems using singleand multi-objective optimization given certain securityconstraints (e.g., security investment cost, ROI) on anon-state space ACT model while continuing to avoid thestate-space explosion problem.
7. RELATED WORK
The authors would like to thank Dr. Dong Seong Kim forhis insightful review of the subject material.
ACKNOWLEDGEMENTS
This research was supported by US National ScienceFoundation grant NSF-CNS-08-31325.
REFERENCES
1. Ortalo R, Deswarte Y, Kaaniche M. Experimentingwith quantitative evaluation tools for monitoringoperational security.IEEE Trans. on SoftwareEngineering 1999;25(5):633–650.
2. Schneier B.Secrets and Lies: Digital Security in aNetworked World. John Wiley and Sons Inc., NewYork, NY, USA, 2000.
3. Trivedi KS, Kim DS, Roy A, Medhi D. Dependabilityand security models.Proc. DRCN, IEEE, 2009; 11–20.
4. Cremonini M, Martini P. Evaluating informationsecurity investments from attackers perspective: theReturn-On-Attack (ROA).Proc. Fourth Workshop onthe Economics of Information Security, 2005.
5. Kearney P, Brugger L. A risk-driven security analysismethod and modelling language.BT Technology J.2007;25(1):141–153.
6. Sonnenreich W, Albanese J, Stout B. Return OnSecurity Investment (ROSI): A Practical QuantitativeModel. J. of Research and Practice in InformationTechnology 2006;38(1):45–56.
7. Moore AP, Ellison RJ, Linger RC. Attack Mod-eling for Information Security and Survivability.CMU/SEI-2001-TN-001 2001; .
8. Bistarelli S, Aglio MD, Peretti P. Strategic Games onDefense Trees.LNCS 2007;4691:1–15.
9. Bistarelli S, Peretti P, Trubitsyna I. Defense trees foreconomic evaluation of security investments.Proc.ARES, 2006; 8–15.
10. Zonouz SA, Khurana H, Sanders WH, Yardley TM.RRE: A Game-Theoretic Intrusion Response andRecovery Engine.Proc. DSN, 2009; 439–448.
14 Security Comm. Networks 2011; 3:1–15 c© 2011 John Wiley & Sons, Ltd.DOI: 10.1002/sec

A. Roy et al. Attack Countermeasure Trees (ACT) : Towards unifying the constructs of attack and defense trees
11. Sondik E. The optimal control of partially observableMarkov processes. PhD Thesis, Stanford Univ.Electronics Labs 1971.
12. Sahner R, Trivedi KS, Puliafito A.Performanceand reliability analysis of computer systems: anexample-based approach using the SHARPE softwarepackage. Kluwer Academic, Norwell, Massachusetts,USA, 1999.
13. Trivedi KS, Sahner R. Sharpe at the age of twentytwo. ACM SIGMETRICS Perf. Eval. Review 2009;36(4):52–57.
14. Convery S, Cook D, Franz M. An Attack Tree for theBorder Gateway Protocol.Cisco Internet draft 2002;.
15. Baker GH, Berg A. Supervisory Control andData Acquisition (SCADA) Systems.The CriticalInfrastructure Protection Report 1.6 2002; .
16. Butts J, Mills R, Baldwin R. Developing an insiderthreat model using functional decomposition.Com-puter Network Security 2005;LNCS(3685):412–417.
17. Weiss JD. A System Security Engineering Process.Proc. of the 14th National Computer Security Conf.,1991.
18. Amoroso EG.Fundamentals of Computer SecurityTechnology. Prentice-Hall Inc., Upper Saddle River,NJ, USA, 1994.
19. Mauw S, Oostdijk M. Foundations of Attack Trees.LNCS 2006;3935:186–198.
20. Daley K, Larson R, Dawkins J. A StructuralFramework for Modeling Multi-stage NetworkAttacks.Proc. ICPPW, 2002; 1530–1536.
21. Fovino IN, Masera M, Cian AD. Integrating CyberAttacks Within Fault Trees.Reliability Engineering& System Safety 2009;94(9):1394–1402.
22. Edge KS. A Framework for Analyzing and Mitigatingthe Vulnerabilities of Complex Systems via Attackand Protection Trees. PhD Thesis, Air Force Instituteof Technology 2007.
23. Gan Z, Tang J, Wu P, Varadharajan V. A NovelSecurity Risk Evaluation for Information Systems.Proc. FCST, 2007; 67–73.
24. Kuhn R, Sriram K, Montgomery D. Border gatewayprotocol security: Recommendations of the nationalinstitute of standards and technology.NIST SpecialPublication 800-54 2007; .
25. Hu X, Mao ZM. Accurate real-time identification ofIP prefix hijacking.Proc. IEEE S & P, 2007; 3–17.
26. Meng FC. Comparing the importance of systemcomponents by some structural characteristics.IEEETrans. on Reliability 1996;45(1):59–65.
27. Boland PJ, Proschan F, Tong YL. Optimal arrange-ment of components via pairwise rearrangements.Naval Research Logistics 1989;36(6):807–815.
28. Fricks RM, Trivedi KS. Importance analysis withMarkov chains.Proc. Reliability and MaintainabilitySymp., IEEE, 2003; 89–95.
29. Nicol DM, Sanders WH, Trivedi KS. Model-basedevaluation: From dependability to security.IEEETrans. on Dependable and Secure Computing 2004;1(1):48–65.
30. Technologies A. Securitree.http://www.amenaza.com/software.php 2002.
31. Olzak T. A Practical Approach to Threat Modeling.Technical Report, Erudio Security, LLC 2006.
32. Birnbaum ZW. On The Importance of Different Com-ponents in a Multicomponent System.MultivariateAnalysis - II, Krishnaiah PR (ed.), Academic Press,New York, NY, USA, 1969; 581–592.
33. Higuero MV, Unzilla JJ, Jacob E, Saiz P, Aguado M,Luengo D. Application of’attack trees’ in securityanalysis of digital contents e-commerce protocolswith copyright protection.Proc. CCST, 2005; 57–60.
34. Lathrop S, Hill J, Surdu J. Modeling NetworkAttacks.Proc. 12th Conf. Behavior Representation inModeling and Simulation, 2003; 401–407.
35. Software I. Attacktree+. http://www.isograph-software.com/atpover.htm 2007.
36. Tidwell T, Larson R, Fitch K, Hale J. Modelinginternet attacks.Proceedings of the 2001 IEEEWorkshop on Information Assurance and security,vol. 59, IEEE, 2001.
Security Comm. Networks 2011; 3:1–15 c© 2011 John Wiley & Sons, Ltd. 15DOI: 10.1002/sec
Copyright © 2022 FDOKUMEN