Physical Sulphate Attack on Concrete - CORE
145
Western University Western University Scholarship@Western Scholarship@Western Electronic Thesis and Dissertation Repository 4-29-2014 12:00 AM Physical Sulphate Attack on Concrete Physical Sulphate Attack on Concrete Ahmed Ramadan Suleiman The University of Western Ontario Supervisor Moncef Nehdi The University of Western Ontario Graduate Program in Civil and Environmental Engineering A thesis submitted in partial fulfillment of the requirements for the degree in Master of Engineering Science © Ahmed Ramadan Suleiman 2014 Follow this and additional works at: https://ir.lib.uwo.ca/etd Part of the Civil Engineering Commons, and the Structural Engineering Commons Recommended Citation Recommended Citation Suleiman, Ahmed Ramadan, "Physical Sulphate Attack on Concrete" (2014). Electronic Thesis and Dissertation Repository. 2058. https://ir.lib.uwo.ca/etd/2058 This Dissertation/Thesis is brought to you for free and open access by Scholarship@Western. It has been accepted for inclusion in Electronic Thesis and Dissertation Repository by an authorized administrator of Scholarship@Western. For more information, please contact [email protected].
-
Upload
khangminh22 -
Category
Documents
-
view
1 -
download
0
Transcript of Physical Sulphate Attack on Concrete - CORE
Western University Western University
Scholarship@Western Scholarship@Western
Electronic Thesis and Dissertation Repository
4-29-2014 12:00 AM
Physical Sulphate Attack on Concrete Physical Sulphate Attack on Concrete
Ahmed Ramadan Suleiman The University of Western Ontario
Supervisor
Moncef Nehdi
The University of Western Ontario
Graduate Program in Civil and Environmental Engineering
A thesis submitted in partial fulfillment of the requirements for the degree in Master of
Engineering Science
© Ahmed Ramadan Suleiman 2014
Follow this and additional works at: https://ir.lib.uwo.ca/etd
Part of the Civil Engineering Commons, and the Structural Engineering Commons
Recommended Citation Recommended Citation Suleiman, Ahmed Ramadan, "Physical Sulphate Attack on Concrete" (2014). Electronic Thesis and Dissertation Repository. 2058. https://ir.lib.uwo.ca/etd/2058
This Dissertation/Thesis is brought to you for free and open access by Scholarship@Western. It has been accepted for inclusion in Electronic Thesis and Dissertation Repository by an authorized administrator of Scholarship@Western. For more information, please contact [email protected].
PHYSICAL SULPHATE ATTACK ON CONRETE
(Thesis format: Integrated Article)
by
Ahmed Ramadan Suleiman
Graduate Program in Engineering Department of Civil and Environmental Engineering
A thesis submitted in partial fulfillment of the requirements for the degree of
Master of Science
The School of Graduate and Postdoctoral Studies Western University
London, Ontario, Canada
© Ahmed Ramadan Suleiman 2014

ii
ABSTRACT
Field experience with concrete exposed to sulphates has often shown that concrete can
suffer from surface scaling above the ground level caused by physical sulphate attack.
This type of attack has been ignored and, in some instances, confused with chemical
sulphate attack. In addition, current standards that evaluate the performance of concrete
under sulphate attack, only deal with the chemical aspects of sulphate attack. This lack of
information has led to confusion and contradictory views regarding the mechanisms of
concrete deterioration due to physical sulphate attack.
In the current thesis, the performance of concrete exposed to environments prone
to physical sulphate attack was investigated. The effects of mineral additives, water-to
binder (w/b) ratio, along with various curing conditions on the performance of concrete
exposed to physical sulphate attack was studied. In addition, the effectiveness of different
surface treatment materials in mitigating physical sulphate attack on concrete was
explored.
Results show that concrete can experience dual sulphate attack. The lower
immersed portion can suffer from chemical sulphate attack, while the upper portion can
be vulnerable to physical attack. Lowering the w/b ratio and moist-curing the concrete
reduced surface scaling above the solution level since the volume of pores was decreased.
Although partial replacement of cement with pozzolans also decreased the pore volume,
surface scaling increased due to the increased proportion of small diameter pores and the
associated growth of capillary suction and surface area for evaporation.
Epoxy- and silane-based surface treatment materials were found to be adequate for
protecting both cured and non-cured concrete exposed to physical sulphate attack.
However, it was found that adequate curing of the concrete before coating is important to
eliminate the separation of the surface treatment based on bitumen and to enhance the
resistance of concrete to physical sulphate attack. Using a water-based solid acrylic
polymer resin did not provide adequate protection of concrete against physical sulphate
attack.
Keywords: Surface; Physical; Sulphate attack; Capillary; Pore; Structure; Treatment;
Crystallization; Chemical, Pozzolans.
iii
Co-Authorship Statement
This thesis has been prepared in accordance with the regulation of integrated-article
format stipulated by the Faculty of Graduate Studies at Western University. Substantial
parts of this thesis have been submitted for publication to peer-reviewed technical
journals. All experimental work, data analysis, and writing of the initial versions of
publications listed below were carried out by the candidate. The research advisor and any
other co-author provided guidance and supervision, and helped in the development of the
final versions of publications:
1- Suleiman, A. R., Soliman, A., and Nehdi, M. “Investigation of concrete exposed to
dual sulphate attack.” Cement and Concrete Research, Under review.
2- Suleiman, A. R., Soliman, A., and Nehdi, M. “Effect of surface treatment materials on
durability of concrete exposed to physical sulphate attack.”, ACI Materials Journal,
Under review.
3- Suleiman, A. R., Soliman, A., and Nehdi, M. “Effect of supplementary cementitious
materilas on durability of concrete exposed to physical sulphate attack.” To be submitted
for peer review.

iv
To: My Beloved Mother Naima,
My Father Ramadan,
My Beloved Sisters Sondos, and Lujain
and My Brother Tarik.

v
ACKNOWLEDGMENTS
I am deeply grateful to my supervisor Professor Moncef Nehdi, for his guidance, advice,
and encouragement. I thank him for all the constructive feedback provided not just during
my work, but also in my entire period of MESc study.
I would like to acknowledge the Ministry of High Education in Libya for
providing financial support through my study. Also, I would like to thank both BASF and
Lafarge companies for providing necessary materials for the experiments.
Special thanks to Dr. Ahmed Soliman for his help; he provided valuable
discussions and information, and cooperation during my work.
I would like to thank Mr. Wilbert Logan for his help, support, and valuable
suggestions during my experimental work.
I thank all the staff in the Department of Civil and Environmental Engineering for
providing support through the period of my study and research work.
Finally, I would like to thank my parents, my brother and sisters, for their love,
patience, understanding and support over the years. All my achievements would not have
been possible without their constant encouragement and support.

vi
TABLE OF CONTENTS
ABSTRACT .................................................................................................................................... ii
Co-Authorship Statement ............................................................................................................ iii
ACKNOWLEDGMENTS ............................................................................................................. v
TABLE OF CONTENTS ............................................................................................................. vi
LIST OF TABLES ........................................................................................................................ ix
LIST OF FIGURES ..................................................................................................................... xii
CHAPTER ONE ............................................................................................................................ 1
1 INTRODUCTION ...................................................................................................................... 1
1.1 Background ............................................................................................................................ 1
1.2 Research Objectives ............................................................................................................... 3
1.3 Original Contributions .......................................................................................................... 4
1.4 Thesis Structure ..................................................................................................................... 4
1.5 References ............................................................................................................................... 6
CHAPTER TWO ........................................................................................................................... 9
2 LITERATURE REVIEW .......................................................................................................... 9
2.1 Introduction ............................................................................................................................ 9
2.2 Sources of Sulphates ............................................................................................................ 10
2.3 Mechanisms of Physical Sulphate Attack .......................................................................... 10
2.4 Solid Volume Change Theory ............................................................................................. 10
2.5 Salt Hydration Distress Theory .......................................................................................... 11
2.6 Salt Crystallization Theory ................................................................................................. 11
2.7 Previous Field Investigations .............................................................................................. 12
2.8 Previous Laboratory Studies on Physical Sulphate Attack ............................................. 14
2.8.1 Effect of w/c Ratio ................................................................................................................ 15
2.8.2 Effect of Pozzolanic Minerals.............................................................................................. 15
2.8.3 Exposure Conditions ............................................................................................................ 17
2.9 Theoretical Models of Crystallization Pressure ................................................................ 18
vii
2.10 Standards and Specifications for Concrete Exposed to Sulphate Attack ....................... 21
2.11 References ............................................................................................................................. 24
CHAPTER THREE ..................................................................................................................... 27
3 PERFORMANCE OF CONCRETE EXPOSED TO DUAL SULPHATE ATTACK ....... 27
3.1 Introduction .......................................................................................................................... 27
3.2 Need for Research ................................................................................................................ 28
3.3 Experimental Program ........................................................................................................ 28
3.3.1 Materials and Specimen Preparation ............................................................................... 28
3.3.2 Curing Conditions ............................................................................................................. 28
3.3.3 Environmental Exposure Conditions................................................................................ 29
3.3.4 Mercury Intrusion Porosimetry (MIP) ............................................................................. 30
3.3.5 Concrete Mechanical Properties ....................................................................................... 31
3.3.6 SEM, EDX, and XRD Analysis ......................................................................................... 31
3.4 Results and Discussion ..................................................................................................... 32
3.5 Conclusions ....................................................................................................................... 40
3.6 References ............................................................................................................................. 41
CHAPTER FOUR ........................................................................................................................ 43
4 EFFECT OF PORE STRUCTURE ON CONCRETE DETERIORATION BY
PHYSICAL SULPHATE ATTACK .......................................................................................... 43
4.1 Introduction .......................................................................................................................... 43
4.2 Need for Research ................................................................................................................ 43
4.3 Experimental Program ........................................................................................................ 44
4.3.1 Materials and Specimen Preparation ................................................................................... 44
4.3.2 Curing Conditions ................................................................................................................. 44
4.3.3 Environmental Exposure Conditions ................................................................................... 45
4.3.4 Mercury Intrusion Porosimetry (MIP) ................................................................................ 45
4.3.5 Mass Loss .............................................................................................................................. 46
4.4 Results and Discussion ........................................................................................................ 47
4.4.1.1 Effect of w/b ratio .............................................................................................................. 55
4.4.1.2 Effect of Curing ................................................................................................................ 55

viii
4.4.1.3 Effect of Pozzolanic Minerals ........................................................................................... 55
4.5 Conclusions ........................................................................................................................... 58
4.6 References ............................................................................................................................. 59
CHAPTER FIVE ......................................................................................................................... 61
5 EFFECT OF SURFACE TREATMENT ON DURABILITY OF CONCRETE EXPOSED
TO PHSYICAL SULPHATE ATTACK.................................................................................... 61
5.1 Introduction .......................................................................................................................... 61
5.2 Need for Research ................................................................................................................ 61
5.3 Experimental Program ........................................................................................................ 62
5.3.1 Visual Inspection .................................................................................................................. 66
5.4 Experimental Results ........................................................................................................... 66
5.4.1 Discussion ............................................................................................................................. 77
5.5 Conclusions ........................................................................................................................... 80
5.6 References ............................................................................................................................. 82
CHAPTER SIX ............................................................................................................................ 86
6 EFFECT OF SUPPLEMENTARY CEMENTITIOUS MATERIALS ON DURABILITY
OF CONCRETE EXPOSED TO PHYSICAL SULPHATE ATTACK .................................. 86
6.1 Introduction .......................................................................................................................... 86
6.2 Experimental Program ........................................................................................................ 87
6.2.1 Materials and Specimen Preparation ................................................................................... 87
6.2.2 Environmental Exposure Conditions ................................................................................... 88
6.3 Results and Discussion ........................................................................................................ 88
6.4 Conclusions ........................................................................................................................... 97
6.5 References ............................................................................................................................. 98
CHAPTER SEVEN .................................................................................................................... 101
7 CONCLUSIONS AND RECOMMENDATIONS ................................................................ 101
7.1 Summary and Conclusions ............................................................................................... 101
7.2 Recommendations for Future Work ................................................................................ 103
APPENDIX A ............................................................................................................................. 104
CURRICULUM VITAE .............................................................................................................. 127
ix
LIST OF TABLES
Table 2.1: Previous lab investigations on concrete exposed to physical sodium sulphate attack .. 16
Table 2.2: Requirements for concrete subjected to sulphate attack ............................................... 23
Table 3.1: Physical and chemical properties of various binders .................................................... 29
Table 3.2: Physical and chemical properties of fine and coarse aggregates .................................. 30
Table 3.3: Proportion of tested concrete mixture ........................................................................... 30
Table 4.1: Mixture design for tested concrete ................................................................................ 44
Table 4.2: Average pore size and total intrusion volume for the tested concrete .......................... 54
Table 5.1: Proportions of tested concrete mixtures ........................................................................ 62
Table 5.2: Visual rating system for the degraded concrete (Adapted from Malhotra et al., 1987).
(Reproduced with permission from the American Concrete Institute) ............................................ 66
Table 6.1: Proportions of tested concrete mixtures. ....................................................................... 87
Table 6.2 shows the average pore size and mercury intrusion for the concrete specimens ........... 96 z
Table A.1 : MIP for concrete made with OPC, w/b = 0.60 non-cured specimen ......................... 104
Table A.2 : MIP for concrete made with 25% fly Ash, w/b = 0.60 non-cured specimen ............ 105
Table A.3: MIP for concrete made with 8% silica fume, w/b = 0.60 non-cured specimen ......... 106
Table A.4: MIP for concrete made with 8% metakaolin w/b = 0.60 non-cured specimen .......... 107
Table A.5: MIP for concrete made with HS, w/b = 0.60 non-cured specimen ............................ 108
Table A.6 : MIP for concrete made with OPC w/b = 0.60 cured specimen ................................. 109
Table A.7: MIP for concrete made with 25% fly Ash w/b = 0.60 cured specimen ..................... 110
Table A.8: MIP for concrete made with 8% silica fume, w/b = 0.60 cured specimen ................. 111
Table A.9 : MIP for 8% metakaolin w/b = 0.60 cured specimen ................................................. 112

x
Table A.10 : MIP for HS w/b = 0.60 cured specimen .................................................................. 113
Table A. 11 : MIP for OPC w/b = 0.45 non-cured specimen ....................................................... 114
Table A.12 MIP for 8% fly Ash w/b = 0.45 non-cured specimen................................................ 115
Table A.13 MIP for 8% silica fume w/b = 0.45 non-cured specimen .......................................... 116
Table A.14 MIP for 8% metakaolin w/b = 0.45 non-cured specimen .......................................... 117
Table A.15 MIP for HS w/b = 0.45 non-cured specimen ............................................................. 118
Table A. 16 MIP for OPC w/b = 0.30 non-cured specimen ......................................................... 119
Table A. 17 MIP for 25% fly Ash w/b = 0.30 non-cured specimen ............................................. 120
Table A. 18 MIP for 8% silica fume w/b = 0.30 non-cured specimen ......................................... 121
Table A. 19 MIP for 8% metakaolin w/b = 0.30 non-cured specimen ......................................... 122
Table A. 20 MIP for HS w/b = 0.30 non-cured specimen ............................................................ 123
Table B.1: Mass loss of concrete cylinders made with w/b = 0.60 non-curedError! Bookmark
not defined.
Table B.2: Mass loss of concrete cylinders made with w/b = 0.45 non-cured .... Error! Bookmark
not defined.
Table B.3: Mass loss of concrete cylinders made with w/b = 0.60 non-cured .... Error! Bookmark
not defined.
Table B.4: Mass loss of concrete cylinders made with w/b = 0.45 non-cured. ... Error! Bookmark
not defined.
Table B.5 : Mass loss of concrete cylinders made with w/b = 0.60 non-cured. .. Error! Bookmark
not defined.
Table B.6: Mass loss of concrete cylinders made with w/b = 0.45 cured. .... Error! Bookmark not
defined.
Table B.7 : Compressive strength of concrete w/b = 0.60 (28dyas) ............................................ 124
Table B.8 : Compressive strength of concrete w/b = 0.60 (90dyas) ............................................ 124
Table B.9 : Compressive strength of concrete w/b = 0.60 (180dyas) .......................................... 124

xi
Table B.10 : Compressive strength of concrete w/b = 0.45 (28dyas) .......................................... 125
Table B.11 : Compressive strength of concrete w/b = 0.45 (90dyas) .......................................... 125
Table B.12 Compressive strength of concrete w/b = 0.45 (180dyas) .......................................... 125
Table B.13 : Compressive strength of concrete w/b = 0.30 (28dyas) .......................................... 126
Table B.14 : Compressive strength of concrete made with w/b = 0.30 (90dyas) ......................... 126
Table B.15 : Compressive strength of concrete made with w/b = 0.30 (180days) ....................... 126

xii
LIST OF FIGURES
Figure 2.1: Schematic of capillary rise and concrete degradation in a foundation in contact with
ground water that contains sodium sulphate. .................................................................................. 12
Figure 2.2: Concrete damage in field exposure to salt crystallization (Yoshida et al., 2010). ..... 14
Figure 2.3: Salt efflorescence of concrete cylinders partially immersed in a sodium sulphate
solution (Nehdi and Hayek, 2005). ................................................................................................. 15
Figure 2.4: Crystal precipitating in a pore with radius rp in the subflorescence zone: (a) pore is
cylindrical; (b) crystal grows in a large pore with small entries (Scherer, 2004). .......................... 20
Figure 3.1: Illustration of MIP test apparatus. .............................................................................. 31
Figure 3.2: Illustration of SEM test apparatus. ............................................................................. 32
Figure 3.3: Concrete cylinders made with w/b = 0.60 after six months of physical sulphate
exposure: (a) concrete made with OPC; (b) OPC + 25% fly ash; (c) OPC + 8% metakaolin; (d)
OPC + 8% silica fume; and (e) concrete with HS. .......................................................................... 33
Figure 3.4: MIP results for different concrete mixtures before exposure to physical sulphate
attack. .............................................................................................................................................. 34
Figure 3.5: Illustration of testing procedure: (a) compressive strength, and (b) modulus of
elasticity. ......................................................................................................................................... 35
Figure 3.6: Compressive strength for concrete mixtures made with w/b = 0.60. .......................... 36
Figure 3.7: Modulus of elasticity for concrete mixtures made with w/b = 0.60. ........................... 36
Figure 3.8: XRD results of concrete above the solution level: (a) concrete with OPC; (b) OPC
+25% fly ash; (c) OPC + 8% silica fume; (d) OPC + 8% metakaolin; and (e) concrete with HS.
[A: Albite, D: Dolomite, Q: Quartz, P: Portlandite, M: Monosulfate, C: Calcite, Th: Thenardite].
........................................................................................................................................................ 38
Figure 3.9: SEM and XRD analysis showing thenardite above the solution level. ....................... 39
Figure 3.10: SEM and XRD analysis showing formation of gypsum and ettringite in the portion
of concrete immersed in the sulphate solution. ............................................................................... 39
Figure 4.1: Tested specimens in the environmental chamber. ....................................................... 46

xiii
Figure 4.2: Non-cured concrete cylinders made with w/b = 0.60 after six months of physical
sulphate exposure: (a) concrete made with OPC; (b) OPC + 25% FA; (c) OPC + 8% SF; (d) OPC
+ 8% MK; and (e) concrete with HS. ............................................................................................. 48
Figure 4.3: Bottom surface of concrete cylinders with w/b = 0.60 immersed in sodium sulphate
solution for 6 months: (a) concrete made with OPC; (b) OPC + 25% FA; (c) OPC + 8% SF; (d)
OPC + 8% MK; and (e) concrete with HS. ..................................................................................... 49
Figure 4.4: Non-cured concrete cylinders made with w/b = 0.45 after six months of physical
sulphate exposure: (a) concrete made with OPC; (b) OPC + 25 % FA; (c) OPC + 8 % SF; (d) OPC
+ 8% MK; and (e) concrete with HS. ............................................................................................. 50
Figure 4.5: Non-cured concrete cylinders made with w/b = 0.30 after six months of physical
sulphate exposure: (a) concrete with OPC; (b) OPC + 25% FA; (c) OPC + 8% SF; (d) OPC + 8%
MK; and (e) concrete with HS. ....................................................................................................... 51
Figure 4.6: Effect of curing on physical sulphate attack of concrete made with OPC +25% FA at
w/b = 0.60: (a) non-cured specimen; and (b) specimen moist cured for 28 days. .......................... 52
Figure 4.7: MIP results for concrete mixtures made with w/b = 0.60 before exposure to physical
sulphate attack.
Figure 4.8: MIP results for concrete mixtures made with w/b = 0.45 before exposure to physical
sulphate attack. ................................................................................................................................ 53
Figure 4.9: MIP results for concrete mixtures made with w/b = 0.30 before exposure to physical
sulphate attack ................................................................................................................................. 54
Figure 4.10: Mass loss for non-cured concrete cylinders made with w/b = 0.60 .......................... 56
Figure 4.11: Mass loss for non-cured concrete cylinders made with w/b = 0.45. ......................... 57
Figure 5.1: Schematic illustration of concrete surface pores and protection mechanism provided
by various surface treatment materials: (a) non-coated concrete; (b) concrete surface coated with
acrylic sealer; (c) concrete surface coated with epoxy or bitumen that provides an impervious
membrane; and (d) concrete coated with silane water repellent. .................................................... 64
Figure 5.2: SEM images for surface of: (a) non-coated concrete; (b) concrete coated with epoxy;
(c) coated with acrylic; (d) coated with bitumen; and (e) coated with silane. ................................ 65
Figure 5.3: MIP test results for concrete specimens before coating and exposure to physical
sulphate attack. ................................................................................................................................ 67
xiv
Figure 5.4: Damage of the acrylic layer of coated non-cured concrete made with w/b = 0.60 after
two months of physical sulphate exposure. .................................................................................... 69
Figure 5.5: Non-cured concrete cylinders made with w/b = 0.60 after 6 months of physical
sulphate exposure: (a) non-coated and coated with; (b) silane (water-repellent); (c) acrylic
solution (curing and sealer); (d) epoxy (membrane); and (e) bitumen (membrane). ...................... 70
Figure 5.6: Cured cylinders made with w/b = 0.60 after 6 months of physical sulphate exposure
(a) non-coated and coated with; (b) silane (water-repellent); (c) acrylic solution (curing and
sealer); (d) epoxy (membrane); and (e) bitumen ( membrane). ...................................................... 71
Figure 5.7: Non-cured concrete cylinders made with w/b = 0.45 after 6 months of exposure (a)
Non-coated, and coated with; (b) silane (water-repellent); (c) acrylic solution (curing and sealer);
(d) epoxy (membrane); and (e) bitumen ( membrane). ................................................................... 72
Figure 5.8: Cured concrete cylinders made with w/b = 0.45 after 6 months of physical sulphate
exposure: (a) Non-coated and coated with; (b) silane (water-repellent); (c) acrylic solution (curing
and sealer); (d) epoxy (membrane); and (e) bitumen (membrane). ................................................ 73
Figure 5.9: Mass loss of non-cured concrete cylinders made with w/b = 0.60. ............................. 74
Figure 5.10: Mass loss of cured concrete cylinders made with w/b = 0.60. .................................. 75
Figure 5.11: Mass loss of non-cured concrete cylinders made with w/b = 0.45. ........................... 75
Figure 5.12: Mass loss of cured concrete cylinders made with w/b = 0.45. .................................. 76
Figure 5.13: SEM and XRD analysis showing thenardite above the solution level. ..................... 77
Figure 6.1: Salt crystallisation for concrete made with: (a) OPC; (b) OPC + 5% FA; (c) OPC +
10% FA; (d) OPC + 15% FA; and (e) OPC + 20% FA. ................................................................. 88
Figure 6.2: Salt crystallisation for concrete made with: (a) OPC; (b) OPC + 5% MK; (c) OPC +
10% MK; (d) OPC + 15% MK; and (e) OPC + 20% MK. ............................................................. 89
Figure 6.3: Salt crystallisation for concrete made with: (a) OPC; (b) OPC + 5% SF; (c) OPC +
10% SF; (d) OPC + 15% SF; and (e) OPC + 20% SF. ................................................................... 89
Figure 6.4: Damage due to salt crystallisation for concrete made with: (a) OPC; (b) OPC + 5%
FA; (c) OPC + 10% FA; (d) OPC + 15% FA; and (e) OPC + 20% FA. ......................................... 90
Figure 6.5: Damage due to salt crystallisation for concrete made with: (a) OPC; (b) OPC + 5%
MK; (c) OPC + 10% MK; (d) OPC + 15% MK; and (e) OPC + 20% MK. ................................... 90

xv
Figure 6.6: Damage due to salt crystallisation for concrete made with: (a) OPC; (b) OPC + 5%
SF; (c) OPC + 10% SF; (d) OPC + 15% SF; and (e) OPC + 20% SF. ........................................... 91
Figure 6.7: Mass loss for concrete cylinders (cement partially replaced with FA). ...................... 92
Figure 6.8: Mass loss for concrete cylinders (cement partially replaced with MK). ..................... 92
Figure 6.9: Mass loss for concrete cylinders (cement partially replaced with SF). ....................... 93
Figure 6.10: MIP results for concrete mixtures before exposure to physical sulphate attack (OPC
and OPC + FA). .............................................................................................................................. 95
Figure 6.11: MIP results for concrete mixtures before exposure to physical sulphate attack (OPC
and OPC + MK). ............................................................................................................................. 95
Figure 6.12: MIP results for concrete mixtures before exposure to physical sulphate attack (OPC
and OPC + SF). ............................................................................................................................... 96

xvi
NOTATIONS
ASTM American Society for Testing and Materials
ACI American Concrete Institute
C Existing solute concentration
CS The saturation concentration
CSA Canadian Standards Association
dV Increase of crystal volume
EN European Standards
ESEM Environmental Scanning Electron Microscopy
FA Fly Ash
HS High Sulphate resistance cement
E
CLk Curvature of the crystal end (hemispherical)
Curvature of the cylindrical side
Mi Initial mass of the cylinder
MIP Mercury intrusion porosimtry
Mt Mass of the cylinder at time
OPC Ordinary Portland Cement
P Pressure exerted by growing crystals
Pl Pressure in the liquid
PS Pressure in the solid (in atmospheres)
QE Solubility product
QS Lower solubility product
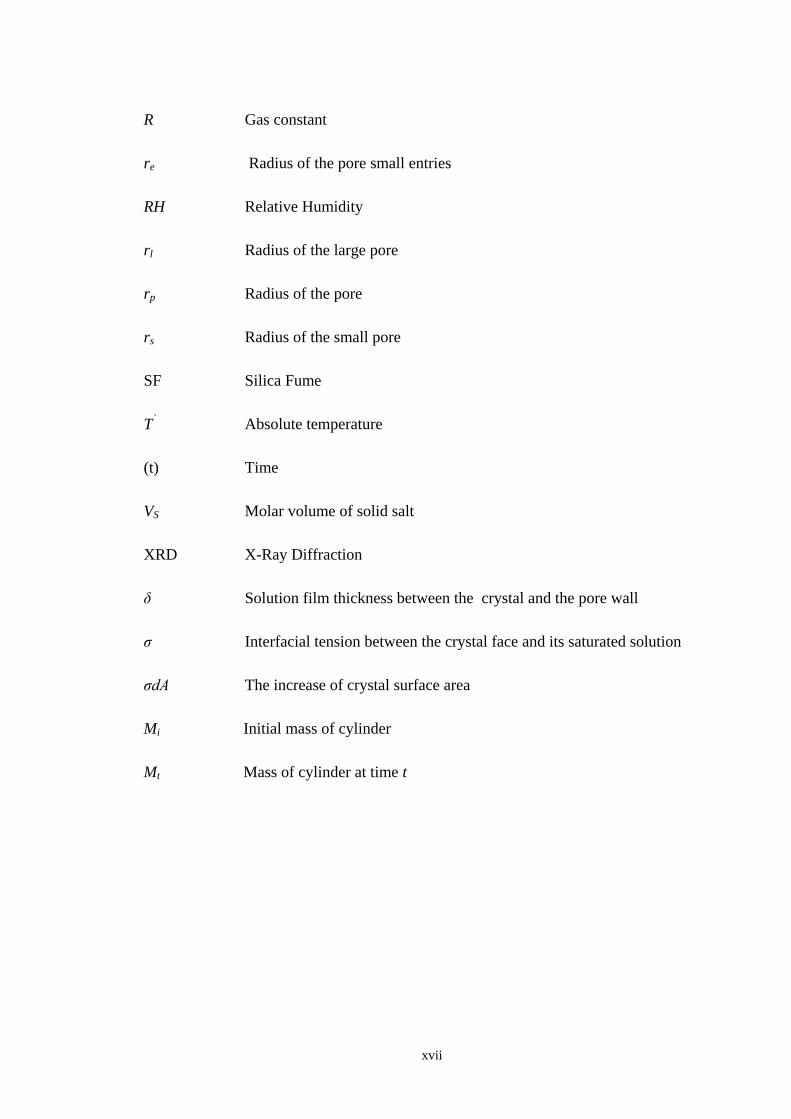
xvii
R Gas constant
re Radius of the pore small entries
RH Relative Humidity
rl Radius of the large pore
rp Radius of the pore
rs Radius of the small pore
SF Silica Fume
T`
Absolute temperature
(t) Time
VS Molar volume of solid salt
XRD X-Ray Diffraction
δ Solution film thickness between the crystal and the pore wall
σ Interfacial tension between the crystal face and its saturated solution
σdA The increase of crystal surface area
Mi Initial mass of cylinder
Mt Mass of cylinder at time t

Chapter One 1
CHAPTER ONE
1 INTRODUCTION
1.1 Background
Since the 19th
century, stone deterioration in historical monuments due to salt
crystallization has been a subject of investigation (Goudie and Viles, 1997). Several
studies have investigated the related deterioration mechanisms and how such a
problem can be mitigated, since it is considered as a major threat to historical
monuments and building stones.
However, concrete deterioration due to salt crystallization, or the so called
physical sulphate attack on concrete, has been ignored and confused in some
occasions with chemical sulphate attack (Haynes et al., 1996; Haynes et al., 2008;
Mehta, 2000). According to Scherer (2004), concrete can be vulnerable to damage
when salt crystals grow from a supersaturated solution in its pores. This process was
described as physical attack on concrete since, unlike chemical sulphate attack, it does
not involve any chemical interaction between the sulphate ions and the concrete
hydration products (Haynes et al., 1996).
Moreover, the consequences of physical sulphate attack are different from
those of chemical sulphate attack since it leads to surface degradation similar to that
caused by cycles of freezing and thawing, while chemical sulphate attack results in
expansion and cracks due to the formation of ettringite (Ca6Al2(SO4)3(OH)12·26H2O)
and gypsum (CaSO4·2H2O) (Mehta, 2000). Using the “sulphate attack” terminology
in-situ to describe concrete deterioration due to sulphates may lead to confusion
between physical and chemical attack (Haynes et al., 1996).
Field experience regarding concrete exposed to sulphates has shown that
concrete often suffers from surface scaling caused by physical sulphate attack, which
is limited to the above-ground portion, while the portion embedded in sulphate rich

Chapter One 2
soil (exposed to chemical sulphate attack) has mostly been found in intact condition
(Yoshida et al., 2010; Stark, 1989; Irassar et al., 1995). The damaging process
involves capillary rise and evaporation of ground water containing sulphates at the
above ground concrete surface, resulting in crystal growth in concrete pores and
damage (Irassar et al., 1995; Haynes et al., 1996).
Nevertheless, current standards that evaluate the performance of concrete
under sulphate attack, such as ASTM C1012 (Standard Test Method for Length
Change of Hydraulic-Cement Mortars Exposed to a Sulphate Solution), only cover the
chemical aspects of sulphate attack and ignore physical attack, since it evaluates the
concrete performance when it is fully immersed in a sulphate solution (Aye and
Oguchi, 2011; Santhanam et al., 2001). This may serve to more confusion in
assessing the deterioration of concrete due to sulphates under field exposure.
Previous studies have shown that adding pozzolanic minerals to concrete had
significantly improved its durability under chemical sulphate attack (Al-Amoudi,
2002; Hooton, 1993; Al-Akhras, 2006; Nehdi and Hayek, 2005). Indeed, pozzolanic
minerals reduce the porosity in concrete and consume calcium hydroxide, which is a
cement hydration product that is vulnerable to chemical sulphate attack. Moreover,
reducing the w/c ratio improves the concrete durability to sulphate exposure since it
decreases the volume of voids in the hydrated cementitous matrix and limits sulphates
penetration into concrete (Mehta and Monteiro, 2006).
However, the general lack of information in the open literature and limitations
of current standards regarding physical sulphate attack on concrete have led to
contradictory views. For instance, some researchers have suggested that low w/c ratio
concrete with fine pores may become more vulnerable to damage by physical sulphate
attack since the small pores can be disrupted before the larger pores by salt crystal
growth (Hime, 2003; Haynes and Bassuoni, 2011). Conversely, other experimental
studies have shown that lowering the w/c ratio of concrete exposed to physical
sulphate attack enhanced its durability (Yoshida et al., 2010; Hartell et al., 2011).
Furthermore, Aye and Oguchi (2011) reported higher surface scaling damage
in blended cement mortars having small pore sizes than that for the control plain
cement mortar. Thus, it is argued that from the limited available literature, the role of
Chapter One 3
the w/c ratio and pozzolanic minerals in concrete exposed to physical sulphate attack
is still controversial.
Regarding the performance of stones under physical salt attack, several
studies have shown that the vulnerability of stones to damage depends on their pore
structure (Angeli et al., 2008; Scherer, 2004; Buj and Gisbert, 2010). For instance,
stones that include high percentages of micro-pores connected with larger pores are
the most vulnerable to damage by salt crystallization (Wellman and Wilson, 1965;
Angeli et al., 2008; Navarro and Doehne, 1999). The presence of micro-pores
increases the capillary rise and the surface area of the evaporation, leading to high
supersaturation of the pore solution and subsequent damage (Navarro and Doehne,
1999). Hence, pore connectivity seems to be an important factor for the deterioration
of stones due to physical salt attack.
Buj and Gisbert (2010) tested fifteen samples of stones that are similar to
those commonly used in the cultural and architectural heritage. They found that stones
with low porosity and high amount of small pores with low connectivity are less
vulnerable to damage than stones with high porosity and higher average pore radius.
Thus, the previous suggestion regarding the poor performance of concrete with low
w/c ratio under physical sulphate attack is questionable.
1.2 Research Objectives
Despite the current knowledge and specifications on concrete deterioration due to
sulphate attack, there is only limited information and studies regarding the damage of
concrete due to physical sulphate attack. According to Haynes et al. (2008), in certain
environmental conditions, physical sulphate attack can cause serious damage to
concrete. This was reported in several field investigations for concrete structures in
partial contact with sulphates. For instance, in southern California, Novak and
Colville (1989) investigated the causes of damage in concrete floor slabs of 20-30
year-old homes located on sulphate rich soil. They proposed that damage was mainly
due to salt crystallization since none of the chemical sulphate products such as
ettringite and gypsum were identified, yet salt minerals such as thenardite (Na2SO4)
and mirabilite (Na2SO4.10H2O) were found within the cracks.

Chapter One 4
Another field study by Stark (1989) showed extensive damage that was
limited to the upper portions of concrete beam specimens half embedded in sulphate
rich soil, whereas the portion embedded in soil was found in intact condition. Similar
cases of deterioration were reported in other places including the Arabian Gulf region,
Japan, and Australia (Al-Amoudi, 2002; Yoshida et al., 2010; Hime et al., 2001).
Since there is lack of information on the behaviour of concrete under physical
sulphate attack in the open literature, the main scope of the present thesis is to
investigate the effects of various parameters that influence the performance of
concrete exposed to physical sulphate attack.
1.3 Original Contributions
This research investigates the behaviour of concrete exposed to environments prone to
physical sulphate attack. It explores several factors that could improve the durability
design of concrete in sulphate laden environments. Specific original contributions of
the current thesis include:
1- Studying the effects of the concrete pore structure on the durability of concrete
under physical sulphate attack, since previous studies have shown that the
vulnerability of stones exposed to salt weathering depended on their pore structure.
2- Evaluating the effectiveness of coating the concrete surface with different types of
treatment materials when exposed to physical sulphate attack, since the durability of
coated concrete has been mainly studied under chemical sulphate attack.
3- Investigating the impact of using supplementary cementing materials in concrete
exposed to physical sulphate attack since previous studies have shown that using
supplementary cementing materials can improve the overall performance of concrete,
particularly under chemical sulphate attack.
1.4 Thesis Structure
The present thesis has been structured and organized according to the guidelines of
the Faculty of Graduate Studies at Western University. It includes seven chapters that
focus on the performance of concrete under physical sulphate attack.

Chapter One 5
Chapter two provides a state-of-art review of the existing knowledge on
concrete deterioration due to physical sulphate attack. Previous field and laboratory
investigations have been reviewed and discussed. In addition, previous theories
regarding crystallization within porous materials have been briefly presented.
Chapters three and four focus on the behaviour of concrete partially immersed
in sulphate solutions and exposed to cyclic temperature and relative humidity. The
mechanisms of damage above and below the solution level have been investigated. In
addition, several factors that affect the concrete pore structure including mineral
additives, w/b ratio along with various curing conditions have been examined under
physical sulphate attack.
Chapter five explores the effects of using different types of surface treatment
materials that may mitigate the surface deterioration of concrete due to physical
sulphate attack. Different types of commercially available surface treatment materials
have been evaluated under environments prone to physical sulphate attack.
Chapter six examines the effects of using different types and percentages of
supplementary commentating materials on concrete partially immersed in a sulphate
solution.
Finally, general and specific conclusions drawn from the research study along
with recommendations for future research have been included in Chapter seven.

Chapter One 6
1.5 References
Al-Amoudi, O. S. B., (2002), “Attack on plain and blended cement exposed to
aggressive sulfate environment”, Cement and Concrete Composites, Vol. 24,
No. 3, pp. 305-316.
Al-Akhras, N. M., (2006), “Durability of metakaolin concrete to sulfate attack”
Cement and Concrete Research, Vol. 36, No. 9, pp. 1727-1734.
Angeli, M., Benavente, D., Bigas, J., Menendez, B., Hebert, R., David, C., (2008),
“Modification of the porous network by salt crystallization in experimentally
weathered sedimentary stones”, Materials and Structures, Vol. 41, No. 6, pp.
1091-1108.
ASTM C1012 (2012), “Standard Test Method for Length Change of Hydraulic-
Cement Mortars Exposed to a Sulfate Solution”, American Society for Testing
and Materials, West Conshohocken, PA.
Aye, T., Oguchi, C. T., (2011), “Resistance of plain and blended cement mortars
exposed to severe sulfate attacks”, Construction and Building Materials, Vol.
25, No. 6, pp. 2988-2996.
Buj, O., and Gisbert, J., (2010), “Influence of pore morphology on the durability of
sedimentary building stones from Aragon (Spain) subjected to standard salt
decay tests”, Environment Health Sicence,Vol. 61, No. 7, pp. 1327-1336.
Flatt, R. J., (2002), “Salt damage in porous materials: how high supersaturations are
generated”, Journal of Crystal Growth, Vol. 242, No. 3-4, pp. 435-454.
Goudie, A., and Viles, H., (1997), Salt Weathering Hazards, John Wiley & Sons,
England, 241 p.
Hartell, J. A., Boyd, A. J., and Ferraro, C. C., (2011), “Sulfate attack on concrete:
Effect of partial immersion”, Journal of Materials in Civil Engineering, Vol. 23,
No. 5, pp. 572-579.
Haynes, H., O’Neill, R., and Mehta, P. K. (1996), “Concrete deterioration from
physical attack by salts”, Concrete International, Vol. 18, No. 1, pp. 63-68.

Chapter One 7
Haynes, H., O’Neill, R., Neff, M. and Mehta, P. K. (2008), “Salt weathering distress
on concrete exposed to sodium sulfate environment”, ACI Materials Journal,
Vol. 105, No. 1, pp. 35-43.
Haynes, H., and Bassuoni, M. T., (2011), “Physical salt attack on concrete”, Concrete
International, Vol. 33, No. 11, pp. 38– 42.
Hime, W. G., (2003), “Chemists should be studying chemical attack on concrete”,
Concrete International, Vol. 25, No. 4, pp. 82-84.
Hooton, R. D. (1993) “ Influence of silica fume replacement of cement on physical
properties and resistance of sulfate attack, freezing and thawing, and alkali-
silica reactivity” ,ACI Materials Journal, Vol. 90, No. 2, pp. 143-151.
Irassar, E. F., Di Maio, A., and Batic, O. R., (1995), “Sulfate attack on concrete with
mineral admixtures”, Cement and Concrete Research, Vol. 26, No. 1, pp. 113-
123.
Mehta, P. K., (2000), “Sulfate attack on concrete: Separating myths from reality”,
Concrete International, Vol. 22, No. 8, pp. 57-61.
Mehta, P. K., and Monteiro, P. J. M., (2006), “Concrete microstructure, properties,
and materials”, The McGraw-Hill, Third edition, 659 p.
Navarroa, C. R., and Doehnea, E., (1999), “Salt weathering: Influence of evaporation
rate, supersaturation, and crystallization pattern”, Earth Surface Processes and
Landforms, Vol. 24, No. 3, pp. 191-209.
Nehdi, M., and Hayek, M., (2005), “Behavior of blended cement mortars exposed to
sulfate solutions cycling in relative humidity”, Cement and Concrete Research,
Vol. 35, No. 4, pp. 731-742.
Novak, G. K., and Colville, A. A., (1989), “Efflorescent mineral assemblages
associated with cracked and degraded residential concrete foundations in
southern California”, Cement and Concrete Research, Vol. 19, No. 1, pp. 1-6.
Santhanam, M., Cohen, MD., Olek, J., (2001), “Sulfate attack research – whither
now?” Cement and Concrete Research, Vol. 31, No. 6, pp. 845-51.

Chapter One 8
Scherer, G. W., (2004), “Stress from crystallization of salt”, Cement and Concrete
Research, Vol. 34, No. 9, pp.1613– 1624.
Stark, D., (1989), “Durability of concrete in sulfate-rich soils”, Research and
Development Bulletin, Portland Cement Association, Vol. RD097.
Thaulow, N., Sahu, S., (2004), “Mechanism of concrete deterioration due to salt
crystallization”, Materials Characterization, Vol. 53, No. 2-4, pp. 123-127.
Yoshida, N., Matsunami, Y., Nagayama, M., and Sakai, E., (2010), “Salt weathering
in residential concrete foundation exposed to sulfate-bearing ground”, Journal
of Advanced Concrete Technology, Vol. 8, No. 2, pp. 121-134.

Chapter Two 9
CHAPTER TWO
2 LITERATURE REVIEW
2.1 Introduction
Chemical sulphate attack on concrete structures has been considered as the
predominant deterioration mechanism of concrete exposed to sulphate rich
environments. However, under certain environmental conditions, concrete was found
to suffer mainly from physical sulphate attack, which was generally ignored in the
literature. This lack of information has led to contradictory views and confusion
regarding the deterioration of concrete due to physical sulphate attack. According to
Mehta (2000), cases of concrete damage due to physical sulphate attack have been
confused with chemical sulphate attack. For instance, for the case of concrete
damaged by salt weathering, a number of researchers supported the separation of
physical sulphate attack from chemical attack. They argued that salt weathering is a
purely physical phenomenon, which has the same appearance as surface scaling
caused by cycles of freezing and thawing (Haynes et al., 1996; Mehta; 2000).
Moreover, the consequences of physical sulphate attack are different from
those of chemical attack (Neville, 2004). Physical attack mainly induces surface
scaling in the concrete above the ground level, while chemical sulphate attack
generally involves chemical interactions between the sulphate ions and the cement
paste components, leading to loss of adhesion of the cement hydration products and
formation of ettringite, gypsum, and/or softening due to the formation of thaumasite
(Mehta, 2000). Conversely, Skalny et al. (2000; and 2002) suggested that complete
separation of physical and chemical sulphate attack is probably a wrong assumption
and serves to more confusion. They also criticized the idea of characterizing the
repeated expansion and contraction by the term physical. Hence, they suggested that
the main process is hydration and dehydration of sodium sulphate, similar to ettringite
or gypsum formation, which is a physicochemical process.
Chapter Two 10
In this chapter, a state-of-the-art review of the existing knowledge on concrete
deterioration due to physical sulphate attack is presented. Previous field and
laboratory investigations regarding the deterioration of concrete due to physical
sulphate attack are also highlighted.
2.2 Sources of Sulphates
According to Skalny et al. (2002), there is more than one source of salt weathering or
sulphate attack on concrete structures. These include sulphates from natural sources
that are either present in soils or dissolved in ground water. For instance, sulphates
those originate from agricultural waste-water are chemically aggressive (e.g.
ammonium sulphates that enter the ground-water after it had been used as fertilizer)
(Skalny et al., 2002). The coal and metallurgical industry are considered to be another
source of sulphates (Skalny et al., 2002). Also, atmospheric pollution may lead to
increased sulphate concentration in the soil and ground-water (Skalny et al., 2002;
Goudie and Viles, 1997).
2.3 Mechanisms of Physical Sulphate Attack
There is more than one theory proposed to identify the mechanism of concrete
deterioration due to physical sulphate attack: (1) Solid volume change, (2) Salt
hydration distress, and (3) Crystallization pressure (Thaulow and Sahu, 2004).
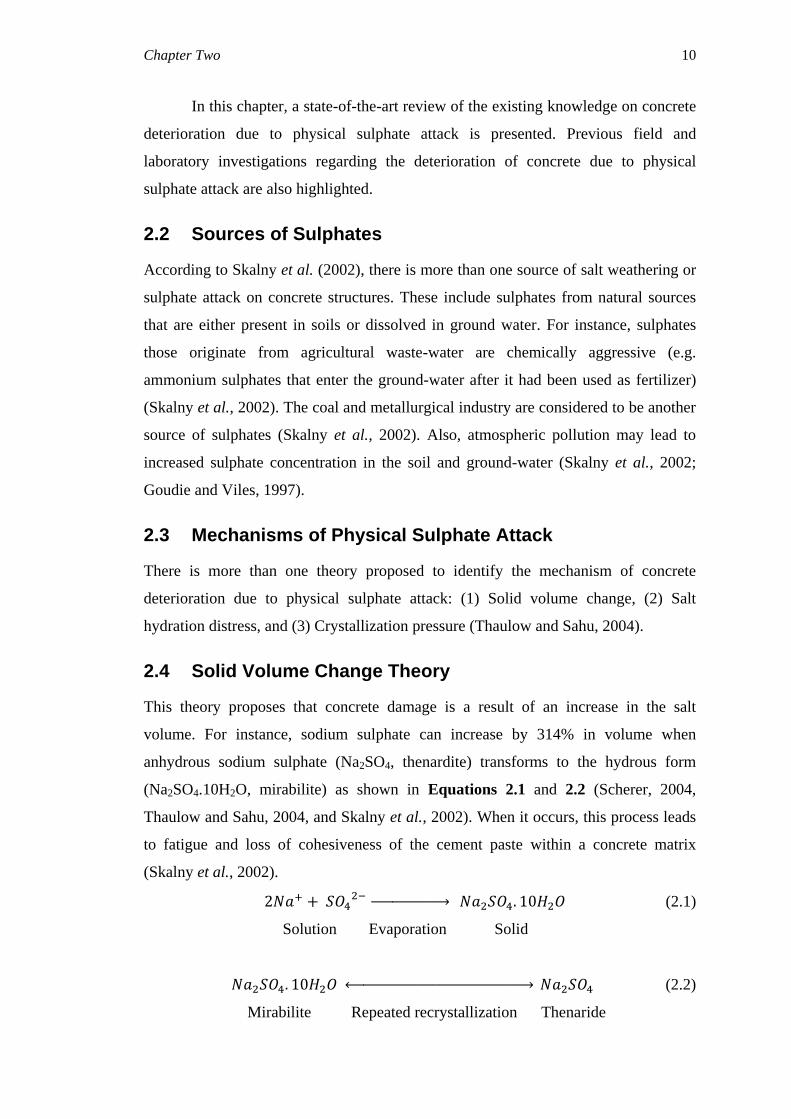
2.4 Solid Volume Change Theory
This theory proposes that concrete damage is a result of an increase in the salt
volume. For instance, sodium sulphate can increase by 314% in volume when
anhydrous sodium sulphate (Na2SO4, thenardite) transforms to the hydrous form
(Na2SO4.10H2O, mirabilite) as shown in Equations 2.1 and 2.2 (Scherer, 2004,
Thaulow and Sahu, 2004, and Skalny et al., 2002). When it occurs, this process leads
to fatigue and loss of cohesiveness of the cement paste within a concrete matrix
(Skalny et al., 2002).
→ (2.1)
Solution Evaporation Solid
↔ (2.2)
Mirabilite Repeated recrystallization Thenaride

Chapter Two 11
Even though this mechanism seems to be the most accepted theory of concrete
damage due to salt crystallization, it ignores the volume of the water in the net
calculations (Thaulow and Sahu, 2004). When the volume of water is included in the
net volume calculations, the total solid volume decreases (Thaulow and Sahu, 2004).
In addition, thenardite does not continually absorb water since it hydrates and expands
(Scherer, 2004). Moreover, this theory does not explain the scaling of concrete due to
other salts that do not have anhydrous forms (Thaulow and Sahu, 2004).
2.5 Salt Hydration Distress Theory
The salt hydration distress theory defines the deterioration mechanism of concrete
exposed to physical salt attack as a result of pressure generated against the concrete
pore walls due to the salt hydration process. This mechanism occurs when the
concrete surface is exposed to cyclic relative humidity, or when a portion of the
concrete is wet while an immediate adjacent portion is relatively dry (Hime et al.,
2001). Thus, salt undergoes solid-state hydration. However, formation of hydrous or
anhydrous salt cannot occur just only by moisture absorbing and hydration (Thaulow
and Sahu, 2004). In other words, the salt does not undergo solid-state hydration.
Instead, through solution hydration occurs as thenardite dissolves and generates a
highly supersaturated solution with respect to mirabilite, which exerts crystallization
pressure on the concrete pore walls (Thaulow and Sahu, 2004, Tsui, et al. 2004,
Folliard and Sandberg, 1994).
2.6 Salt Crystallization Theory
According to Thaulow and Sahu (2004), the salt crystallization pressure theory is the
actual mechanism of concrete damage due to salt weathering. In this theory, salt
crystals can grow from a supersaturated solution and exert sufficient pressure against
the concrete pore walls, thus disrupting the cementitous matrix (Scherer, 2004;
Thaulow and Sahu, 2004; Flatt, 2002; Tsui, et al. 2004). The process of damage due
to salt crystallization is illustrated in Figure 2.1.
The supersaturation of a solution depends on several factors including the
nature of the salt, the rate of the solution supply, and evaporation (Scherer, 2004). For
instance, sodium sulphate is the most damaging salt in nature as it can reach to a very

Chapter Two 12
high supersaturation degree through thenardite dissolution and evaporation (Scherer,
2004; Flatt, 2002; Tsui, et al. 2004; Thaulow and Sahu, 2004). Previous study by
Scherer (2004) showed damage of stone specimens at the evaporation surface where
the sodium sulphate concentration increased and precipitated in the subflorescence
zone. In this zone, crystals can grow below the surface of a porous material when the
evaporation rate is higher than the rate of water supply by capillary action, thus
leading to damage. Such behaviour was observed by Irassar et al. (1995) and Stark
(1989) where damage was only confined to the drying surface of the concrete partially
immersed in sodium sulphate.
Figure 2.1: Schematic of capillary rise and concrete degradation in a foundation in
contact with ground water that contains sodium sulphate.
2.7 Previous Field Investigations
Several previous field investigations have reported concrete deterioration due to
physical sulphate attack. For instance, in southern California, Novak and Colville,
(1989) investigated the cause of damage in concrete floor slabs of 20-30 year-old
homes located on sulphate rich soil using X-Ray diffraction analysis. Salt minerals
such as thenardite (Na2SO4) and mirabilite (Na2SO4.10H2O) were found within the
cracks. However, none of the chemical sulphate products such as ettringite and
gypsum were identified. Novak and Colville (1989) proposed that the cause of

Chapter Two 13
damage was primarily salt crystallization since none of the chemical sulphate
products such as ettringite and gypsum were identified.
In 1989, a field study was conducted by the Portland Cement Association
(Stark, 1989) to investigate the performance of concrete beam specimens partially
embedded in sulphate rich soil and exposed to cyclic wetting and drying for five
years. Extensive damage was only limited to the upper portions of the concrete beam
specimens half embedded in the sulphate rich soil, whereas the embedded portion was
found in intact condition. In addition, the damage escalated in the beam specimens
that were made with a high w/c and when pozzolanic additives such as fly ash and
slag were included in the concrete mixtures. Since the investigation was only based on
visual inspection of the deteriorated beams, it was concluded that the damage was due
to salt crystallization in concrete pores above the ground level.
Similar results were obtained by Irassar et al., (1995) who monitored the
performance of concrete cylinders partially buried in a soil containing 1% of sodium
sulphate for five years. The performance of concrete was assessed according to
several factors including visual inspection, compressive strength, modulus of
elasticity, and X-Ray Diffraction (XRD). It was observed that the damage was only
limited to the above ground portion of concrete, while the portion buried into the soil
was found in intact condition. In addition, they found that using pozzolanic minerals
in the concrete mixtures escalated the damage in the upper portion, while it improved
the performance of the buried portion into the sulphate soil. Their compressive
strength results indicated that the core of the concrete cylinders was in intact
condition and the damage was limited to the concrete surface since the compressive
strength increased in all cylinders. This outcome supports that the damage was mainly
on the surface and caused by the physical sulphate attack.
Recently in Japan, an extensive field investigation was conducted by Yoshida
et al., (2010) to evaluate the deterioration of residential building foundations
constructed on a sulphate-rich soil and experiencing surface scaling above the ground
level. Figure 2.2 shows cases of concrete foundation surface scaling above the ground
level. It was reported that the damage started several months from the beginning of
the construction to about fifteen years. Core samples were extracted from concrete
foundations and analysed using different techniques such as XRD, XRF (X-Ray

Chapter Two 14
fluorescence), DSC (differential scanning calorimetry), and EPMA (electron probe
micro analyzing). In this work, analysis of results did not detect minerals such as
ettringite and gypsum in the above ground concrete. Instead, sodium sulphate crystals
were found.
Similar cases of deterioration were reported in other areas including the
Arabian Gulf region and Australia (Al-Amoudi, 2002; Hime et al., 2001). However,
in the literature, only limited studies have focused on physical sulphate attack since
chemical sulphate attack was the main interest (Haynes, 2008; Aye and Oguchi,
2011).
Figure 2.2: Concrete damage in field exposure to salt crystallization
(Yoshida et al., 2010).
2.8 Previous Laboratory Studies on Physical Sulphate Attack
For decades, chemical sulphate attack on concrete was the main research interest,
while physical sulphate attack has received little attention (Haynes, 2008; Aye and
Oguchi, 2011). It is only recently that researchers started to focus on the performance
of concrete under physical sulphate attack. However, there are contradictory views in
the existing literature regarding concrete deterioration due to physical sulphate attack.
Table 2.1 summarizes previous lab studies on different concrete mixtures exposed to
different environmental conditions.

Chapter Two 15
2.8.1 Effect of w/c Ratio
Previous studies have suggested that concrete with low w/c ratio is more vulnerable to
damage by physical sulphate attack since lowering the w/c ratio reduces the pore size
diameter, which can behave similar to rocks with fine pores (Hime, 2003). However,
a laboratory investigation by Folliard and Sandberg (1994) showed that concrete
made with w/c = 0.30 had better performance than concrete made with w/c = 0.50
under an environment prone to physical sulphate attack. Yet, a study by Nehdi and
Hayek (2005) showed that concrete mortars with an intermediate w/c = 0.45 had an
extensive efflorescence formation compared with w/c = 0.30 and w/c = 0.60 as shown
in Figure 2.3. Therefore, more research is needed to investigate the main role of the
w/c in concrete exposed to physical sulphate attack.
Figure 2.3: Salt efflorescence of concrete cylinders partially immersed in a sodium
sulphate solution (Nehdi and Hayek, 2005).
2.8.2 Effect of Pozzolanic Minerals
Previous studies have shown that using pozzolanic minerals in cement mortar had
significantly improved its durability under chemical sulphate attack (Al-Amoudi,
2002; Hooton, 1993; Al-Akhras, 2006; Nehdi and Hayek, 2005) since pozzolanic
minerals reduce porosity and consume calcium hydroxide which is vulnerable to
chemical sulphate attack. However, recent studies have shown that adding pozzolanic
minerals to concrete mixtures exposed to physical sulphate attack escalated damage.
For example, a study by Aye and Oguchi (2011) showed poor performance of blended
cement mortars compared with that of plain cement mortars exposed to environments
prone to physical sulphate attack.
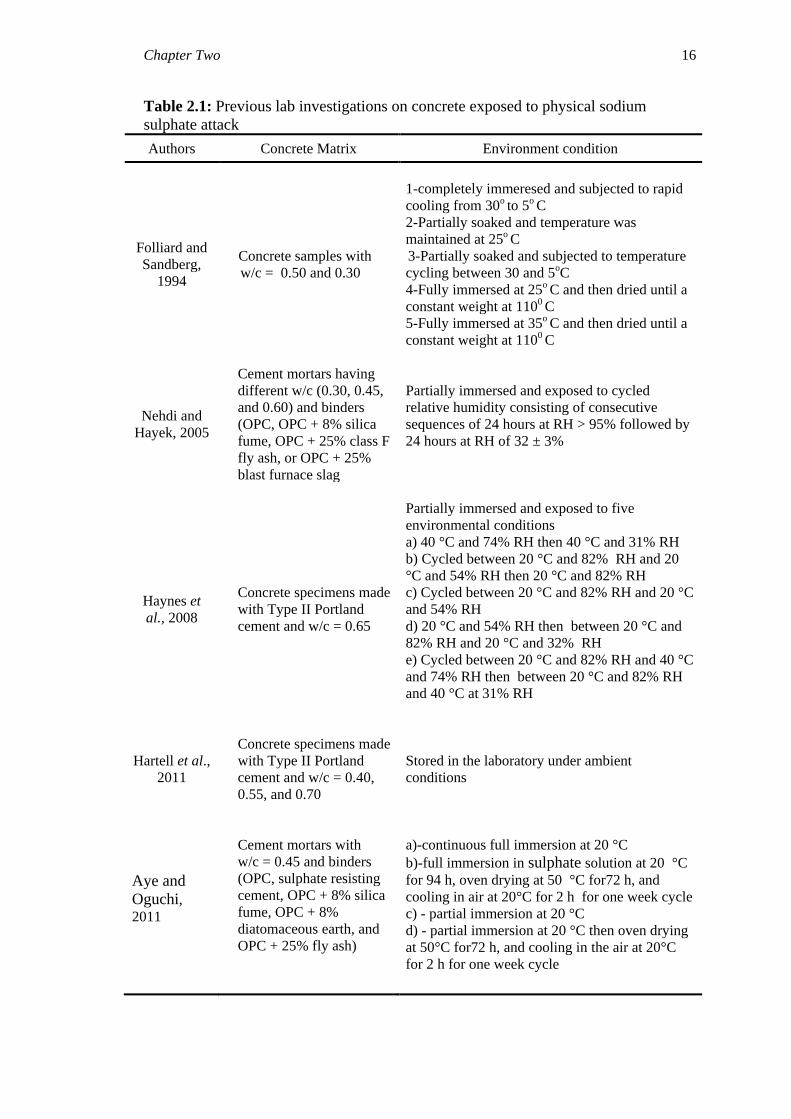
Chapter Two 16
Table 2.1: Previous lab investigations on concrete exposed to physical sodium
sulphate attack
Authors Concrete Matrix Environment condition
Folliard and
Sandberg,
1994
Concrete samples with
w/c = 0.50 and 0.30
1-completely immeresed and subjected to rapid
cooling from 30o to 5o C
2-Partially soaked and temperature was
maintained at 25o C
3-Partially soaked and subjected to temperature
cycling between 30 and 5oC
4-Fully immersed at 25o C and then dried until a
constant weight at 1100 C
5-Fully immersed at 35o C and then dried until a
constant weight at 1100 C
Nehdi and
Hayek, 2005
Cement mortars having
different w/c (0.30, 0.45,
and 0.60) and binders
(OPC, OPC + 8% silica
fume, OPC + 25% class F
fly ash, or OPC + 25%
blast furnace slag
Partially immersed and exposed to cycled
relative humidity consisting of consecutive
sequences of 24 hours at RH > 95% followed by
24 hours at RH of 32 ± 3%
Haynes et
al., 2008
Concrete specimens made
with Type II Portland
cement and w/c = 0.65
Partially immersed and exposed to five
environmental conditions
a) 40 °C and 74% RH then 40 °C and 31% RH
b) Cycled between 20 °C and 82% RH and 20
°C and 54% RH then 20 °C and 82% RH
c) Cycled between 20 °C and 82% RH and 20 °C
and 54% RH
d) 20 °C and 54% RH then between 20 °C and
82% RH and 20 °C and 32% RH
e) Cycled between 20 °C and 82% RH and 40 °C
and 74% RH then between 20 °C and 82% RH
and 40 °C at 31% RH
Hartell et al.,
2011
Concrete specimens made
with Type II Portland
cement and w/c = 0.40,
0.55, and 0.70
Stored in the laboratory under ambient
conditions
Aye and
Oguchi, 2011
Cement mortars with
w/c = 0.45 and binders
(OPC, sulphate resisting
cement, OPC + 8% silica
fume, OPC + 8%
diatomaceous earth, and
OPC + 25% fly ash)
a)-continuous full immersion at 20 °C
b)-full immersion in sulphate solution at 20 °C
for 94 h, oven drying at 50 °C for72 h, and
cooling in air at 20°C for 2 h for one week cycle
c) - partial immersion at 20 °C
d) - partial immersion at 20 °C then oven drying
at 50°C for72 h, and cooling in the air at 20°C
for 2 h for one week cycle

Chapter Two 17
2.8.3 Exposure Conditions
According to Thaulow and Sahu (2004), the most common salt found on scaled
concrete surfaces exposed to environments prone to physical sulphate attack is
sodium sulphate. Previous studies by Aye and Oguchi (2011) and Haynes et al.,
(2008) showed high surface scaling when concrete was partially immersed in 5%
sodium sulphate compared with exposure to other salts such as magnesium sulphate,
soudium carbonate, and soudium chloride under the same expousre conditions (i.e
exposure temperature, humidity, and salt concentration). However, the degree of
degredation of concrete exposed to soudium sulphate mainly depends on the condition
of the surrounding environment (i.e. RH and temperature).
Previous study by Folliard and Sandberg (1994) investigated the performance
of concrete exposed to sodium sulphate under five ambient conditions. They found
that concrete specimens deteriorated more readily when completely soaked in sodium
sulphate and then exposed to cycles of rapid cooling from 30 °C (86 °F) to 5 °C
(41 °F), which supports mirabilite formation. Another study by Haynes et al., (2008)
found that the most destructive damage occurred when concrete was exposed to an
environment that supports the transition between thenardite and mirabilite rather than
other environments that only support thenardite or mirabilite precipitation. Concrete
specimens were partially immersed in sodium sulphate and exposed to cycling
environmental conditions that changed biweekly between 20 °C (68 °F) at 82%
relative humidity and 40 °C (104 °F) at 74% relative humidity for 406 days, and then
exposed to 20 °C at 82% relative humidity and 40 °C (104 °F) at 31% relative
humidity in bi-weekly cycles.
Similar observation was made by Aye and Oguchi (2011) when they examined
mortar specimens under four different exposure conditions of sodium sulphate (i.e.
continuous full immersion at constant temperature, full immersion under cyclic
wetting and drying, continuous partial immersion at constant temperature, and partial
immersion under cyclic wetting and drying). Extensive damage occurred when
specimens were partially immersed and exposed to cyclic wetting and drying.
Similar observation was made by Aye and Oguchi (2011) when they examined
mortar specimens under four different exposure conditions of sodium sulphate

Chapter Two 18
(i.e. continuous full immersion at constant temperature, full immersion under cyclic
wetting and drying, continuous partial immersion at constant temperature, and partial
immersion under cyclic wetting and drying). Extensive damage occurred when
specimens were partially immersed and exposed to cyclic wetting and drying.
In all previous cases, supersaturation was achieved leading to salt growth and
damage. However, in the Folliard and Sandberg (1994) case, supersaturation of the
sodium sulphate can be reached when the surrounding temperature dropped quickly
from 30 o
C (86 oF) to 5
oC (41
oF), leading to subsequent crystallisation of mirabilite,
which generates pressure higher than the concrete tensile strength.
2.9 Theoretical Models of Crystallization Pressure
Several assumptions and theoretical models have been proposed to explain damage
due to salt crystallization pressure. For instance, the mechanism of growth and
dissolution of crystals was earlier discussed by Correns, (1949). Equation 2.3 was
proposed to calculate the pressure exerted by growing crystals,
(
)
(2.3)
Where P is the pressure exerted by growing crystals,
R is the gas constant,
T` is the absolute temperature,
VS is the molar volume of solid salt,
C is the existing solute concentration,
CS is the saturation concentration.
A thermodynamic model was later developed to calculate salt crystallization
pressure by (Wellman and Wilson, 1965) based on the assumption that the chemical
free energy of solid increases with its surface. Therefore, larger crystals in the large
pores will grow at the expense of the smaller crystals in small pores in a system
having crystals in equilibrium with a saturated solution. The work required to extend
the surface is equal to the work required during crystal growth on one face of the
crystal, as shown in Equation 2.4 (Wellman and Wilson, 1965):

Chapter Two 19
( ) (2.4)
Where Pi is the pressure in the liquid,
PS is the pressure in the solid,
dV is the increase of crystal volume,
σdA is the increase of crystal surface area.
Wellman and Wilson (1968) also introduced the following Equation 2.5
which estimates the crystallisation pressure in large pores:
(
)
(2.5)
Where rl is the radius of the large pore,
rs is the radius of the small pore,
σ is the interfacial tension between the crystal face and its saturated solution.
According to Wellman and Wilson (1965), the vulnerability of rocks to
damage due to salt weathering depends on their pore structure. For instance, rocks
that contain large pores connected by micro-pores are more venerable to damage.
When a rock or a porous material is exposed to evaporation and its large and small
pores are filled by a saturated salt solution, salt crystals will grow in the large pores at
the expense of the smaller crystals in the small pores. This process will continue till
damage occurs or (Pl-PS)/σ becomes greater than dA/dV (Wellman and Wilson, 1965).
The damage depends on the size of the small pores and the interfacial tension between
the crystal face and its saturated solution compared with the strength of the rock
(Wellman and Wilson, 1965).
Scherer (2004) discussed the thermodynamics of crystallization within porous
materials and the kinetic factors that affect stress development including capillary
rise, evaporation, cement hydration, and cyclic drying and wetting. According to
Scherer (2004), when a crystal precipitates in a cylindrical pore as shown in the
Figure 2.4, the end of the crystal is hemispherical with a curvature given in Equation
2.6, whereas the cylindrical side has a curvature expressed in Equation 2.7. However,
in the case a crystal growing in a large pore with small entries; the cylindrical side

Chapter Two 20
becomes almost zero and the crystallisation pressure is determined by the curvature of
the crystal in the pore entries.
( ) (2.6)
( ) (2.7)
Where δ is the solution film thickness between the crystal and the pore wall,
rp is the radius of the pore,
re is the Radius of the pore small entries.
(a)
(b)
Figure 2.4: Crystal precipitating in a pore with radius rp in the subflorescence zone:
(a) pore is cylindrical; (b) crystal grows in a large pore with small entries (Scherer,
2004).

Chapter Two 21
The subjected pressure from the pore wall on any other part of the crystal with
curvature S
CLk is given by Equation 2.8, which considers the exerted crystallisation
pressure on the pore wall (Scherer, 2004):
(
) (2.8)
Where Pw is the crystallisation pressure,
E
CLk is the curvature of the crystal end,
S
CLk is the curvature of the cylindrical side,
R is the gas constant,
T is the absolute temperature,
QE is the solubility product,
QS is the lower solubility product.
2.10 Standards and Specifications for Concrete Exposed to Sulphate Attack
Standards and specifications can offer guidelines for engineers to select appropriate
materials and adequate construction operation processes. Regarding concrete exposed
to sulphate attack, current standards and specifications such as ACI 318 (2011), CSA
A23.1 (2009), and EN-206-1(2000) shown in Table 2.2, classify the severity of
exposure based on the sulphate concentration in the ground water or soil and provide
guidelines to select appropriate cementitious materials in concrete mixtures.
In addition, standard experiments such as ASTM C1012 and CSA A3004-C8
can be used to measure the expansion of concrete due to chemical reactions between
the sulphate ions and the cement components. However, the reliability of the current
standards and specifications has been criticized and questioned since it ignores the
important parameters and factors that affect the performance of concrete in sulphate
rich soil (Cohen and Mather, 1991; Skalny et a.l, 2002; Mehta, 1992).
According to Hooton (2008) current standard tests that evaluate the resistance
of concrete to sulphate attack ignore the capillary rise or evaporative transport of
sulphates into concrete. Concrete in the field can be exposed to wetting. Thus, faster
Chapter Two 22
penetrability of sulphates can occur (Hooton, 2008). Change in temperature and
relative humidity can lead to salt crystallization, which can cause degradation and
scaling of the concrete surface. This typically occurs in foundations, slabs and
partially embedded structures in sulphate rich soils, especially in dry weather and
coastal areas. Currently, there is no standardized test that can address the concrete
degradation due to physical sulphate attack. Hence, more research is required to
establish specifications and standardized tests that can evaluate all aspects of sulphate
attack.
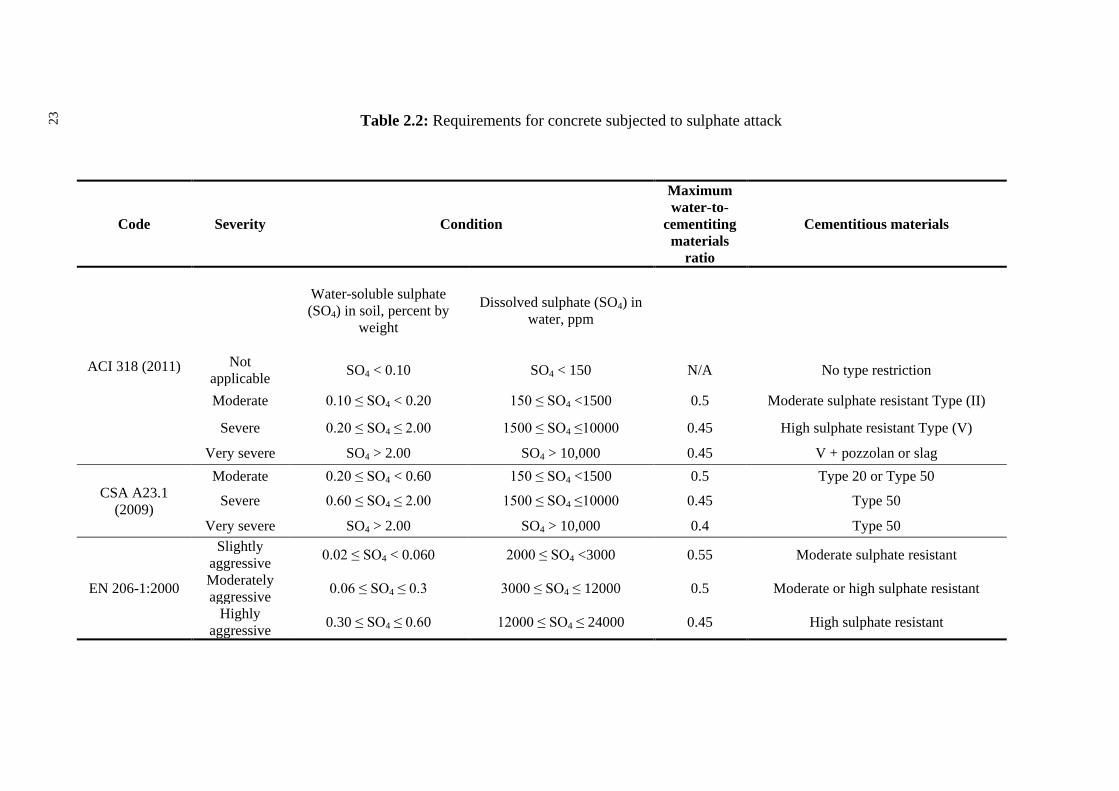
23
Table 2.2: Requirements for concrete subjected to sulphate attack
Code Severity Condition
Maximum
water-to-
cementiting
materials
ratio
Cementitious materials
ACI 318 (2011)
Water-soluble sulphate
(SO4) in soil, percent by
weight
Dissolved sulphate (SO4) in
water, ppm
Not
applicable SO4 < 0.10 SO4 < 150 N/A No type restriction
Moderate 0.10 ≤ SO4 < 0.20 150 ≤ SO4 <1500 0.5 Moderate sulphate resistant Type (II)
Severe 0.20 ≤ SO4 ≤ 2.00 1500 ≤ SO4 ≤10000 0.45 High sulphate resistant Type (V)
Very severe SO4 > 2.00 SO4 > 10,000 0.45 V + pozzolan or slag
CSA A23.1
(2009)
Moderate 0.20 ≤ SO4 < 0.60 150 ≤ SO4 <1500 0.5 Type 20 or Type 50
Severe 0.60 ≤ SO4 ≤ 2.00 1500 ≤ SO4 ≤10000 0.45 Type 50
Very severe SO4 > 2.00 SO4 > 10,000 0.4 Type 50
EN 206-1:2000
Slightly
aggressive 0.02 ≤ SO4 < 0.060 2000 ≤ SO4 <3000 0.55 Moderate sulphate resistant
Moderately
aggressive 0.06 ≤ SO4 ≤ 0.3 3000 ≤ SO4 ≤ 12000 0.5 Moderate or high sulphate resistant
Highly
aggressive 0.30 ≤ SO4 ≤ 0.60 12000 ≤ SO4 ≤ 24000 0.45 High sulphate resistant

Chapter Two 24
2.11 References
Al-Amoudi, O. S. B., (2002), “Attack on plain and blended cement exposed to
aggressive sulfate environment”, Cement and Concrete Composites, Vol. 24,
No. 3, pp. 305-316.
Al-Akhras, N. M., (2006), “Durability of metakaolin concrete to sulfate attack”
Cement and Concrete Research, Vol. 36, No. 9, pp. 1727-1734.
Aye, T., Oguchi, C. T., (2011), “Resistance of plain and blended cement mortars
exposed to severe sulfate attacks”, Construction and Building Materials, Vol.
25, No. 6, pp. 2988-2996.
Flatt, R. J., (2002), “Salt damage in porous materials: how high supersaturations are
generated”, Journal of Crystal Growth, Vol. 242, No. 3-4, pp. 435-454.
Goudie, A., and Viles, H., (1997), “Salt weathering hazards”, John Wiley & Sons,
England, 241 p.
Hartell, J. A., Boyd, A. J., and Ferraro, C. C., (2011), “Sulfate attack on concrete:
Effect of partial immersion”, Journal of Materials in Civil Engineering, Vol. 23,
No. 5, pp. 572-579.
Haynes, H., O’Neill, R., and Mehta, P. K. (1996), “Concrete deterioration from
physical attack by salts”, Concrete International, Vol. 18, No. 1, pp. 63-68.
Haynes, H., O’Neill, R., Neff, M. and Mehta, P.K. (2008), “Salt weathering distress
on concrete exposed to sodium sulfate environment”, ACI Materials Journal,
Vol. 105, No. 1, pp. 35-43.
Haynes, H., O’Neill, R., Neff, M. and Mehta, P.K. (2010), “Salt weathering of
concrete by sodium carbonate and soduim chloride”, ACI Materials Journal,
Vol. 107, No. 3, pp. 258-266.
Haynes, H., and Bassuoni, M. T., (2011), “Physical salt attack on concrete”, Concrete
International, Vol. 33, No. 11, pp.38– 42.

Chapter Three 25
Hime, W. G., (2003), “Chemists should be studying chemical attack on concrete”,
Concrete International, Vol. 25, No. 4, pp. 82-84.
Hooton, R. D. (1993) “ Influence of silica fume replacement of cement on physical
properties and resistance of sulfate attack, freezing and thawing, and alkali-
silica reactivity” ACI Materials Journal, Vol. 90, No. 2, pp. 143-151.
Hooton, R. D. (2008) “Bridging the gap between research and standards” Cement and
Concrete Research, Vol. 38, pp. 247-258.
Irassar, E. F., Di Maio, A., and Batic, O. R., (1995), “Sulfate attack on concrete with
mineral admixtures”, Cement and Concrete Research, Vol. 26, No. 1, pp. 113-
123.
Mehta, P. K., (2000), “Sulfate attack on concrete: Separating myths from reality”,
Concrete International, Vol. 22, No. 8, pp. 57-61.
Mehta, P. K., and Monteiro, P. J. M., (2006), “Concrete microstructure, properties,
and materials”, The McGraw-Hill, Third edition, 659 p.
Navarroa, C. R., and Doehnea, E., (1999), “Salt weathering: Influence of evaporation
rate, supersaturation, and crystallization pattern”, Earth Surface Processes and
Landforms, Vol. 24, No. 3, pp. 191-209.
Nehdi, M., and Hayek, M., (2005), “Behavior of blended and cement mortars exposed
to sulfate solutions cycling in relative humidity”, Cement and Concrete
Research, Vol. 35, No. 4, pp. 731-742.
Novak, G. K., and Colville, A. A., (1989), “Efflorescent mineral assemblages
associated with cracked and degraded residential concrete foundations in
southern California”, Cement and Concrete Research, Vol. 19, No. 1, pp. 1-6.
Santhanam, M., Cohen, M. D., Olek, J., (2001), “Sulfate attack research – whither
now?” Cement and Concrete Research, Vol. 31, No. 6, pp. 845-51.
Scherer, G. W., (1999), “Crystallization in pores”, Cement and Concrete Research,
Vol. 29, No. 8, pp. 1347-1358.

Chapter Three 26
Scherer, G. W., (2004), “Stress from crystallization of salt”, Cement and Concrete
Research, Vol. 34, No. 9, pp.1613– 1624.
Stark, D., (1989), “Durability of concrete is sulfate-rich soils”, Research and
Development Bulletin, Portland Cement Association, Vol. RD097.
Thaulow, N., Sahu, S., (2004), “Mechanism of concrete deterioration due to salt
crystallization”, Materials Characterization, Vol. 53, No. 2-4, pp. 123-127.
Tsui, N., Flatt, R. J., and Scherer, G. W., (2003), “Crystallization damage by sodium
sulfate”, Journal of Cultural Heritage, Vol. 4, No. 2, pp. 109-115.
Wellman, H. W. and Wilson, A. T., (1965), “Salt weathering, a neglected geological
erosive agent in coastal and arid environments”, Nature, Vol. 205, pp.1097-
1098.
Yoshida, N., Matsunami, Y., Nagayama, M., and Sakai, E., (2010), “Salt weathering
in residential concrete foundation exposed to sulfate-bearing ground”, Journal
of Advanced Concrete Technology, Vol. 8, No. 2, pp. 121-134.

Chapter Three 27
CHAPTER THREE
3 PERFORMANCE OF CONCRETE EXPOSED TO DUAL SULPHATE ATTACK
3.1 Introduction
Since the 19th century, concrete damage due to sulphates has received considerable
attention. Several studies and investigations have focused on the deterioration
mechanisms of concrete subjected to sulphates in sulphate bearing environments. It
was mainly established that formation of ettringite and gypsum within the concrete
matrix are responsible for the damage due to the sulphate attack (Tian and Cohen,
2000). Sulphate ions chemically react with calcium hydroxide and calcium aluminate
hydrate to form gypsum and ettringite, which leads to expansion and strength loss of
concrete (Roziere, et al., 2009). This type of attack was described as a chemical
sulphate attack on concrete.
However, field investigations reported that concrete partially embedded in
sulphate rich soil can suffer from surface scaling above the ground level (Stark, 1989;
Yoshida et al., 2010). This type of deterioration was mainly ignored in the open
literature since concrete was mainly studied when it is fully immersed in sulphate
solutions. In addition, current standards that evaluate the performance of concrete
under sulphate attack, such as the ASTM C1012 (Standard Test Method for Length
Change of Hydraulic-Cement Mortars Exposed to a Sulphate Solution) and CSA
A3004-C8 (Test Method for Determination of Sulphate Resistance of Mortar Bars
Exposed to Sulphate Solution) only deal with the chemical aspects of sulphate attack
(Aye and Oguchi, 2011; Santhanam et al., 2001).
The damage process involves capillary rise and evaporation of the ground
water containing sulphates at the above ground concrete surface, resulting in crystal
growth in concrete pores and subsequent damage (Irassar et al., 1995; Haynes et al.,
1996). Nevertheless, recent, study by Liu et al., (2012) suggested that the damage
above the solution level is more likely due to the chemical sulphate attack since high

Chapter Three 28
sulphate concentration in the upper part of concrete partially immersed in sodium
sulphate can be formed. Thus, according to the chemical reaction theory, a sulphate
solution with a high concentration can lead to extensive chemical sulphate attack.
This controversy in the literature may contribute to further confusion in the
assessment of concrete deterioration due to sulphates under field exposure.
3.2 Need for Research
Durability of concrete exposed to sulphates has primarily been studied on specimens
fully-submerged in sulphate solutions. However, field experience shows that concrete
exposed to sulphates can suffer from surface scaling above the ground level due to
physical attack. This damage has often been ignored and even confused with chemical
sulphate attack. In this study, concrete partially-immersed in sulphate solutions and
exposed to cyclic temperature and relative humidity was explored.
3.3 Experimental Program
3.3.1 Materials and Specimen Preparation
Concrete cylinders 100×200 mm (4×8 in) in size were cast according to ASTM C192
(Standard Practice for Making and Curing Concrete Test Specimens in the
Laboratory). Five binder types were used including: ordinary portland cement (OPC),
high sulphate resisting cement (HS), OPC with 8% silica fume (SF), OPC with 25%
class F fly ash (FA), and OPC with 8% metakaolin (MK). The physical and chemical
properties of the cements, mineral additives, and aggregates are summarized in
Tables 3.1 and 3.2. The proportions of the concrete mixtures are provided in Table
3.3.
3.3.2 Curing Conditions
All concrete cylinders were cured for 28 days in a moist room with RH ≥ 95% and
T = 20°C [68°F] before exposure to the sulphate environment. The curing was carried
out according to ASTM C511 (Standard Specification for Mixing Rooms, Moist
Cabinets, Moist Rooms, and Water Storage Tanks Used in the Testing of Hydraulic
Cements and Concretes).

Chapter Three 29
3.3.3 Environmental Exposure Conditions
According to Thaulow and Sahu (2004), the most commonly found salt on scaled
concrete surfaces exposed to environments conducive to physical sulphate attack is
sodium sulphate. Previous studies by Aye and Oguchi (2011), and Haynes et al.,
(2008 and 2010) found higher surface scaling for concrete partially immersed in 5%
sodium sulpahte compared to that exposed to other salts such as magnesium sulphate,
sodium carbonate, and sodium chloride under the same exposure conditions (i.e.
similar temperature, relative humidity (RH), and sulphate concentration). In addition,
Haynes et al., (2008) found that surface scaling escalated drastically when the
concrete was exposed to cyclic temperature and RH consisting of two weeks at
temperature = 20°C [68°F] and RH = 82% followed by two weeks at temperature =
40°C [104°F] and RH = 31% . Therefore, all concrete cylinders were partially
immersed in a 5% sodium sulphate solution and placed inside a walk-in
environmental chamber with cycling temperature and RH. To accelerate the
experiment, cycles were reduced to one week at temperature = 20°C [68°F] and RH =
82% followed by one week at temperature = 40°C [104°F] and RH = 31%.
Table 3.1: Physical and chemical properties of various binders
Components /Property
Cement
Type
(10)
Cement
Type
HS
Silica
Fume Metakaolin Fly ash
Silicon oxide (SiO2) (%) 19.6 22 95.3 52.2 43.39
Aluminum oxide (Al2O3) (%) 4.8 4.1 0.2 41 22.1
Ferric oxide (Fe2O3) (%) 3.3 4.4 0.1 1.8 7.7
Calcium oxide (CaO) (%) 61.50 64.90 0.49 - 15.63
Magnesium oxide (MgO) (%) 3.0 1.1 0.27 -
Sulfur trioxide (SO3) (%) 3.50 2.25 0.24 0.04 1.72
Loss on ignition (%) 1.90 0.70 1.99 1.1 1.17
Insoluble residue (%) 0.44 0.08 - - -
Equivalent alkalis (%) 0.7 - - -
Tricalcium silicate (C3S) (%) 55 57 - - -
Dicalcium silicate (C2S) (%) 15 20 - - -
Tricalcium aluminate (C3A) (%) 7 3 - - -
Tetracalcium aluminoferrite (C4AF) (%) 10 13 - - -
Blaine fineness (m2/kg) 371 380 - - -
Autoclave expansion (%) 0.09 -0.01 - - -
Compressive strength 28 days (MPa) 40.9 44.8 - - -
Specific gravity 3.15 3.12 2.58 2.20 2.50
Time of setting (min) Vicat Initial 104 225 - - -

Chapter Three 30
Table 3.2: Physical and chemical properties of fine and coarse aggregates
Table 3.3: Proportion of tested concrete mixture
3.3.4 Mercury Intrusion Porosimetry (MIP)
Figure 3.1 shows the MIP test apparatus. This test method covers the determination
of the pore volume and the pore volume distribution of concrete by the mercury
intrusion porosimetry method. Fragments were taken from the surface of concrete
cylinders at age of 28 days and immediately plunged in an isopropanol solvent to stop
cement hydration reactions. The samples were subsequently dried inside a desiccator
until a constant mass was reached. The pore size distribution for each specimen was
determined using a Micrometrics AutoPore IV 9500 Series porosimeter allowing a
range of pressures from 0 to 414 MPa [60000 psi]. The assumed surface tension of
Property Coarse aggregate Fine aggregate
Potential alkali reactivity (Mortar-bar method) (%) 0.05 - Absorption (%) 1.11 1.09
Crushed particles (%) 68.00 - Flat/elongated (%) 6.00 - Micro-deval (A) (%) 11.00 17.00
Soundness (freeze-thaw) (%) 2.20 -
Soundness (MgSO4) (%) 3.90 -
Specific gravity (apparent) (%) 2.73 2.73
Specific gravity (dry) (%) 2.65 2.65
Specific gravity (SSD) (%) 2.68 2.68
Unit weight (kg/m3) 1734 1512
Materials finer than 75-μm (sieve # 200) (%) 0.90 2.10
Mixture # Binder Type
Cement
Content
(kg/m3)
Pozzolanic
Content
(kg/ m3)
Aggregate Content
(kg/m3)
Coarse Fine
1 OPC 350 0
1110
689
2 OPC+25% FA 262 87.5 754
3 OPC+8% SF 322 28 679
4 OPC+8% Meta 322 28 797
5 HS 350 0 689

Chapter Three 31
mercury was 0.484 N/m [2.76x10⁻³ lb/in] at 25°C [77°F] according to ASTM D 4404
(Standard Test Method for Determination of Pore Volume and Pore Volume
Distribution of Soil and Rock by Mercury Intrusion Porosimetry).
Figure 3.1: Illustration of MIP test apparatus.
3.3.5 Concrete Mechanical Properties
Compressive strength according to ASTM C39 (Standard Test Method for
Compressive Strength of Cylindrical Concrete Specimens) and static modulus of
elasticity according to ASTM C469 (Static Modulus of Elasticity and
Poisson’s Ratio of Concrete in Compression) were measured for the
cured concrete cylinders partly immersed in sulphate solutions.
3.3.6 SEM, EDX, and XRD Analysis
Figure 3.2 shows the SEM test apparatus. SU4500 secondary scanning electron
microscopy (resolution 7 nm at 3 kV) with energy dispersive X-ray analysis (EDX)
was used to investigate the nature of damage (above and below the sodium sulphate
solution). Specimens for SEM analysis were dried using a desiccator and then coated
with gold before testing. In addition, X-ray diffraction (XRD- Bruker D8
diffractometer) was carried out on samples taken from the deteriorated surfaces. All
samples were dried and grounded to pass the 200 µm sieve before testing. Cu-Kα

Chapter Three 32
radiation with a wavelength of 1.54 Å was conducted at a voltage of 40 kV. The
scanning speed was 2o /min at a current of 35 mA.
Figure 3.2: Illustration of SEM test apparatus.
3.4 Results and Discussion
After two days of exposure to a temperature of 20°C [68°F] and RH of 82%, salt
precipitation (efflorescence) appeared above the solution level on the drying surface
of the concrete cylinders. This exposure condition is considered as an ideal
environment for mirabilite formation according to previous studies (Thaulow and
Sahu, 2004; Flatt, 2002; Haynes et al., 2008). After one week, the exposure was
switched to a temperature = 40°C [104°F] and RH = 31%, a condition conducive for
thenardite formation. During the second week, the volume of the precipitated salt on
the concrete surface decreased compared to that in the first week of exposure. This is
related to the transformation of the formed mirabilite to thenardite, which results in a
volume contraction of about 314% (Tsui et al., 2003).
After one month of sulphate exposure (4 cycles of wetting and drying) scaling
of concrete surfaces appeared above the sulphate solution level. The exposure was
continued for up to six months (24 cycles of wetting and drying) and all concrete
cylinders were inspected to diagnose the level of damage. Figure 3.3 shows typical
surface scaling above the solution level for the concrete cylinders. For all tested

Chapter Three 33
cylinders, the portion of concrete immersed in the solution was found in intact
condition compared with the damaged above solution part. Higher surface scaling
above the solution level was found in the concrete specimens incorporating
pozzolanic minerals compared to that of the specimens made with 100% OPC or
100% HS.
(a)
Figure 3.3: Concrete cylinders made with w/b = 0.60 after six months of physical
sulphate exposure: (a) concrete made with OPC; (b) OPC + 25% fly ash; (c) OPC +
8% metakaolin; (d) OPC + 8% silica fume; and (e) concrete with HS.
(a) (b) (c)
(d) (e)

Chapter Three 34
Figure 3.4 shows MIP test results for specimens from the various concrete mixtures
before exposure to physical sulphate attack. Results indicate that concrete made either
with pure OPC or HS cement incorporate pores with relatively larger diameter.
Partially replacing the cement with pozzolanic minerals led to a decrease in the pore
size diameter due to the pore refinement effect of pozzolanic minerals.
Figure 3.4: MIP results for different concrete mixtures before exposure to
physical sulphate attack.
The compressive strength and static modulus of elasticity were measured for all the
concrete cylinders partially immersed in the sulphate solution. Appendix B shows the
results of the compressive strength and static modulus of elasticity tests. In addition,
control specimens were reserved in the laboratory condition at temperature = 23°C
[73.4 °F] and RH = 70% for 180 days. Figure 3.5 shows the testing procedure.
Figures 3.6 and 3.7 show the compressive strength and static modulus of elasticity for
concrete cylinders before sulpahte exposure at 28 days and partially immersed in 5%
sulphate solution at 90 and 180 days.
0
0.02
0.04
0.06
0.08
0.1
0.001 0.01 0.1 1 10 100 1000
Incr
emen
tal p
ore
volu
me
(mL
/g)
ore e ameter (m)
OCOC+25% FAOC+8% SFOC+8% MKHS
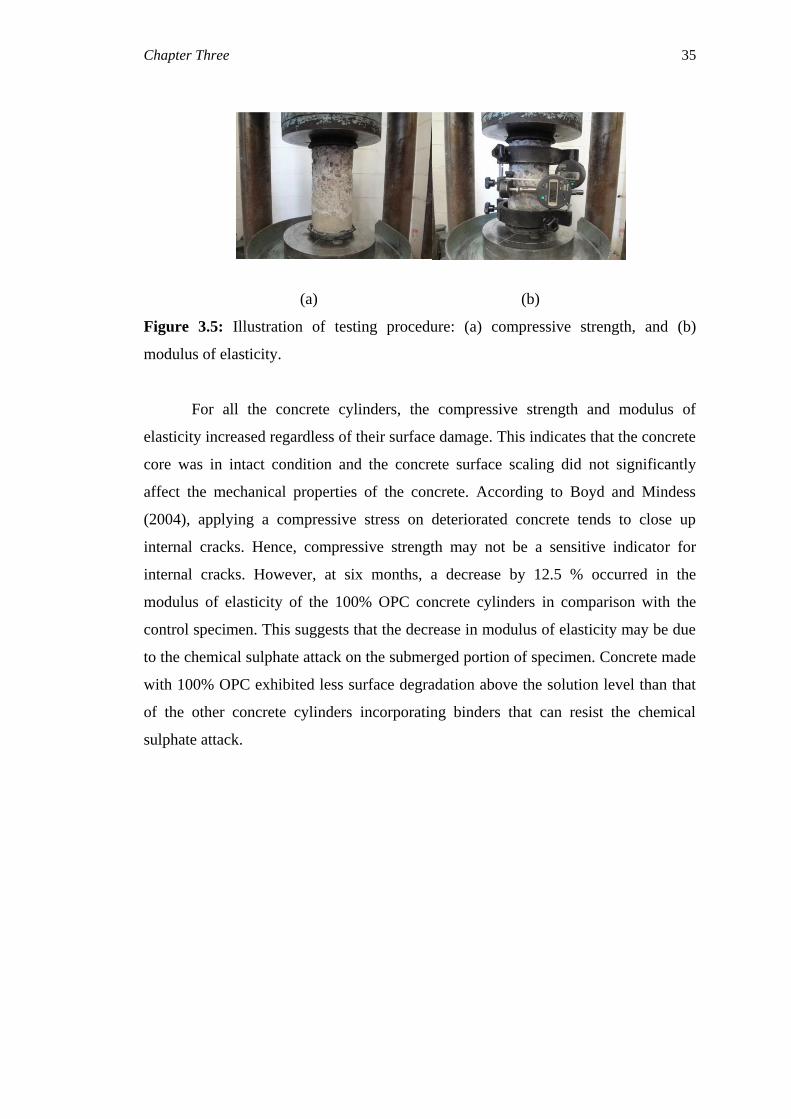
Chapter Three 35
(a) (b)
Figure 3.5: Illustration of testing procedure: (a) compressive strength, and (b)
modulus of elasticity.
For all the concrete cylinders, the compressive strength and modulus of
elasticity increased regardless of their surface damage. This indicates that the concrete
core was in intact condition and the concrete surface scaling did not significantly
affect the mechanical properties of the concrete. According to Boyd and Mindess
(2004), applying a compressive stress on deteriorated concrete tends to close up
internal cracks. Hence, compressive strength may not be a sensitive indicator for
internal cracks. However, at six months, a decrease by 12.5 % occurred in the
modulus of elasticity of the 100% OPC concrete cylinders in comparison with the
control specimen. This suggests that the decrease in modulus of elasticity may be due
to the chemical sulphate attack on the submerged portion of specimen. Concrete made
with 100% OPC exhibited less surface degradation above the solution level than that
of the other concrete cylinders incorporating binders that can resist the chemical
sulphate attack.

Chapter Three 36
Figure 3.6: Compressive strength for concrete mixtures made with w/b = 0.60.
Figure 3.7: Modulus of elasticity for concrete mixtures made with w/b = 0.60.
0
10
20
30
40
50
60
70
80
Com
pre
ssiv
e S
tren
gth
(M
Pa)
OPC HS 8% SF 8% MK 25% FA
28 days 90 days 180 days 180 days
(Control )
0
10
20
30
40
50
60
Mod
ulu
s of
ela
stic
ity (
GP
a)
OPC HS 8% SF 8% MK 25% FA
28 days 90 days 180 days 180 days
(Control)

Chapter Three 37
Figure 3.8 illustrates XRD analysis for the deteriorated concrete above the solution
level. For all the concrete cylinders, none of the main components responsible for
chemical sulphate attack, such as gypsum and ettringite, were identified in the
deteriorated parts above the solution level. Instead, some levels of thenardite were
found. The presence of thenardite indicates that the damage of concrete above the
solution level was mainly due to salt crystallization.
This was confirmed by SEM and EDX analysis (Figures 3.9 and 3.10), which
identified thenardite in the damaged parts above the solution level. However, for the
concrete cylinders made with 100% OPC, gypsum and ettringite were formed in
concrete below the solution level. This indicates that concrete can experience dual
sulphate attack. The lower portion immersed in the sodium sulphate solution can
suffer from chemical sulphate attack, while the upper portion can be vulnerable to
physical sulphate attack.
Previous study by Liu et al., (2012) suggested that the damage above the
solution level is more likely caused by the chemical sulphate attack due to formation
of high sulphate concentration in the upper part. Thus, extensive chemical sulphate
attack can occur according to the theory of the chemical reaction. However, their
study only relied on measuring the sulphate concentration above the solution level and
did not show damage or formation of gypsum or ettringite above the solution level.
Damage due to the chemical sulphate attack mainly results from expansion of the
concrete due to formation of gypsum or ettringite. In the current study, surface scaling
was occurred instead of concrete expansion. Thus, damage due to the physical
sulphate attack above the solution level is the more likely the predominant
mechanism.
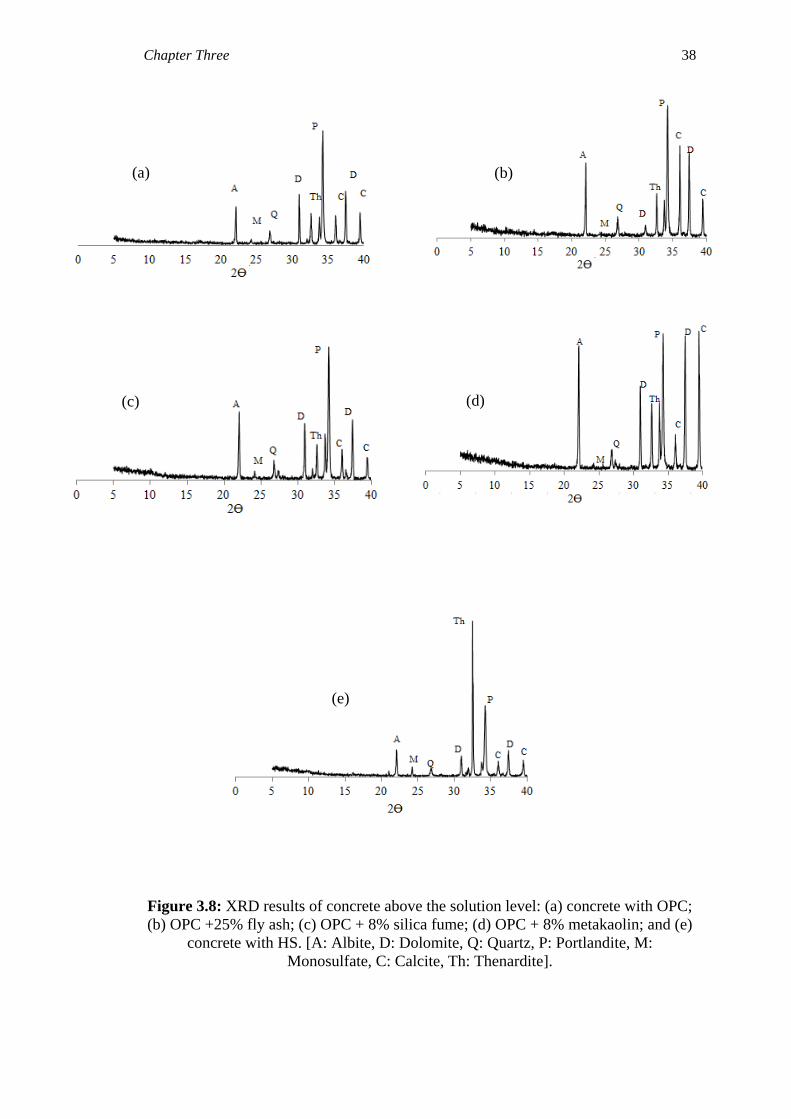
Chapter Three 38
Figure 3.8: XRD results of concrete above the solution level: (a) concrete with OPC;
(b) OPC +25% fly ash; (c) OPC + 8% silica fume; (d) OPC + 8% metakaolin; and (e)
concrete with HS. [A: Albite, D: Dolomite, Q: Quartz, P: Portlandite, M:
Monosulfate, C: Calcite, Th: Thenardite].
(a) (b)
(c) (d)
(e)

Chapter Three 39
Figure 3.9: SEM and XRD analysis showing thenardite above the solution level.
Figure 3.10: SEM and XRD analysis showing formation of gypsum and ettringite in
the portion of concrete immersed in the sulphate solution.
Chapter Three 40
3.5 Conclusions
In this chapter, the performance of concrete partially immersed in a 5% sodium
sulphate solution was investigated under cycling temperature and relative humidity.
Several conclusions can be drawn based on the experimental results:
Concrete that is partially immersed in a sodium sulphate solution can
experience dual sulphate attack. The lower portion immersed in the sodium
sulphate solution can suffer from chemical sulphate attack, while the upper
portion can be vulnerable to physical sulphate attack.
High damage due to six months of exposure to physical sulphate attack did not
affect both the concrete compressive strength and modulus of elasticity since
the damage was only limited to the external surface of the concrete. It is
however expected that long-term exposure can lead to decreased mechanical
properties.
Chapter Three 41
3.6 References
ASTM C511., (2009), Standard Specification for Mixing Rooms, Moist Cabinets,
Moist Rooms, and Water Storage Tanks Used in the Testing of Hydraulic
Cements and Concretes, American Society for Testing and Materials ,West
Conshohocken, PA.
ASTM D4404., (2010), Standard Test Method for Determination of Pore Volume and
Pore Volume Distribution of Soil and Rock by Mercury Intrusion Porosimetry,
American Society for Testing and Materials ,West Conshohocken, PA.
Aye, T., Oguchi, C. T., (2011), “Resistance of plain and blended cement mortars
exposed to severe sulfate attacks”, Construction and Building Materials, Vol.
25, No. 6, pp. 2988-2996.
Boyd, A., Mindess, S., (2004), “The use of tension testing to investigate the effect of
W/C ratio and cement type on the resistance of concrete to sulfate attack”,
Cement and Concrete Research, Vol. 34, No. 6, pp. 373-377
Haynes, H., O’Neill, R., and Mehta, P. K. (1996), “Concrete deterioration from
physical attack by salts”, Concrete International, Vol. 18, No. 1, pp. 63-68.
Haynes, H., O’Neill, R., Neff, M. and Mehta, P. K. (2008), “Salt weathering distress
on concrete exposed to sodium sulfate environment”, ACI Materials Journal,
Vol. 105, No. 1, pp. 35-43.
Irassar, E. F., Di Maio, A., and Batic, O. R., (1995), “Sulfate attack on concrete with
mineral admixtures”, Cement and Concrete Research, Vol. 26, No. 1, pp. 113-
123.
Santhanam, M., Cohen, MD., Olek, J., (2001), “Sulfate attack research – whither
now?”, Cement and Concrete Research, Vol. 31, No. 6, pp. 845-51.
Roziere, E., Loukili, A., Hachem R. EI, and Grondin, F., (2009) “Durability of
concrete exposed to leaching and external sulphate attacks”, Cement and
Concrete Research, Vol. 39, pp. 1188-1198.
Chapter Three 42
Tian, B., and Chen, M. (2000), “Expansion of Alite Paste Caused by Gypsum
Formation during Sulfate Attack”, Journal of Materials in Civil Engineering,
Vol. 12, No. 1, pp. 24-25.
Yoshida, N., Matsunami, Y., Nagayama, M., and Sakai, E., (2010), “Salt weathering
in residential concrete foundation exposed to sulfate-bearing ground”, Journal
of Advanced Concrete Technology, Vol. 8, No. 2, pp. 121-134.
Liu, Z., Deng, D., Schutter, G. D., and Yu, Z., (2012), “Chemical sulfate attack
performance of partially exposed cement and cement + fly ash paste”,
Construction and Building Materials, Vol. 28, pp. 230-237.
Chapter Four 43
CHAPTER FOUR
4 EFFECT OF PORE STRUCTURE ON CONCRETE DETERIORATION BY PHYSICAL SULPHATE ATTACK
4.1 Introduction
Repeated crystallisation of salt minerals has been considered as the driving force for
surface scaling of concrete exposed to physical sulphate attack. This damage is
initiated when stresses induced by the internal pressure created via repeated salt
crystallisation exceed the tensile strength of the concrete. The degree of such damage
will depend mainly on the structure and connectivity of pores, which control the
penetration of sulphates into the concrete. Several factors affect the pore structure
including the concrete constituents, mixture proportions and the curing process.
Therefore, in this chapter, the effects of these factors on the performance of concrete
exposed to physical sulphate were investigated.
4.2 Need for Research
The pore structure of concrete is an essential factor that controls the durability of
concrete exposed to physical sulphate attack since previous studies have shown that
the vulnerability of stones exposed to salt weathering depends on their pore structure.
Therefore, the effects of factors that control the concrete pore structure including the
w/b ratio, binder type, and curing conditions on the performance of concrete exposed
to severe physical sulphate attack have been investigated. The findings should
demystify the role of these parameters on physical sulphate attack, allowing to gain a
more fundamental understanding of the associated damage mechanisms, which could
enhance the durability design of concrete in sulphate laden environments and possibly
prevent some of the associated litigation.
.

Chapter Four 44
4.3 Experimental Program
4.3.1 Materials and Specimen Preparation
Three groups of concrete mixtures with different w/b ratio (i.e. 0.30, 0.45, and 0.60)
were tested. In each group, five binder types were used including: ordinary portland
cement (OPC), high sulphate resisting cement (HS), OPC with 8% silica fume (SF),
OPC with 25% class F fly ash (FA), and OPC with 8% metakaolin (MK). The
proportions of the concrete mixtures are provided in Table 4.1. For each of the fifteen
concrete mixtures, standard cylinders 100×200 mm (4×8 in.) were cast according to
ASTM C192 (Standard Practice for Making and Curing Concrete Test Specimens in
the Laboratory).
Table 4.1: Mixture design for tested concrete
Mixture
# Binder Type
Cement
Content
(kg/m3)
Pozzolanic
Content (kg/
m3)
Aggregate Content
(kg/m3) w/b
Super-
plasticizer
(ml/m3) Coarse Fine
1 OPC 450 0.000
1110
804 0.30 2250
2 OPC + 25% FA 337.5 122.5 779 0.30 1600
3 OPC + 8% SF 414 36.00 791 0.30 3200
4 OPC + 8% MK 414 36.0 797 0.30 2900
5 HS 450 0.00 804 0.30 2250
6 OPC 400 0.000
1110
727 0.45 1570
7 OPC + 25% FA 300 100.0 705 0.45 900
8 OPC + 8% SF 368 32.00 715 0.45 2100
9 OPC + 8% MK 368 32.00 720 0.45 1850
10 HS 400 0.00 727 0.45 1571
11 OPC 350 0.000
1110
689 0.60 ---
12 OPC + 25% FA 262 87.50 754 0.60 ---
13 OPC + 8% SF 322 28.00 679 0.60 ---
14 OPC + 8% MK 322 28.00 797 0.60 ---
15 HS 350 0.000 689 0.60 ---
4.3.2 Curing Conditions
In general, damage of concrete structures in sulphate rich soils (e.g. foundations,
retaining walls, etc.) can start at an early-age before concrete is fully cured. The
volume of capillary pores is typically high in concrete at earlier age compared with
that of the fully cured concrete. Hence, more sulphates can penetrate into the concrete,
leading to higher damage. Therefore, in the present study, both the performance of
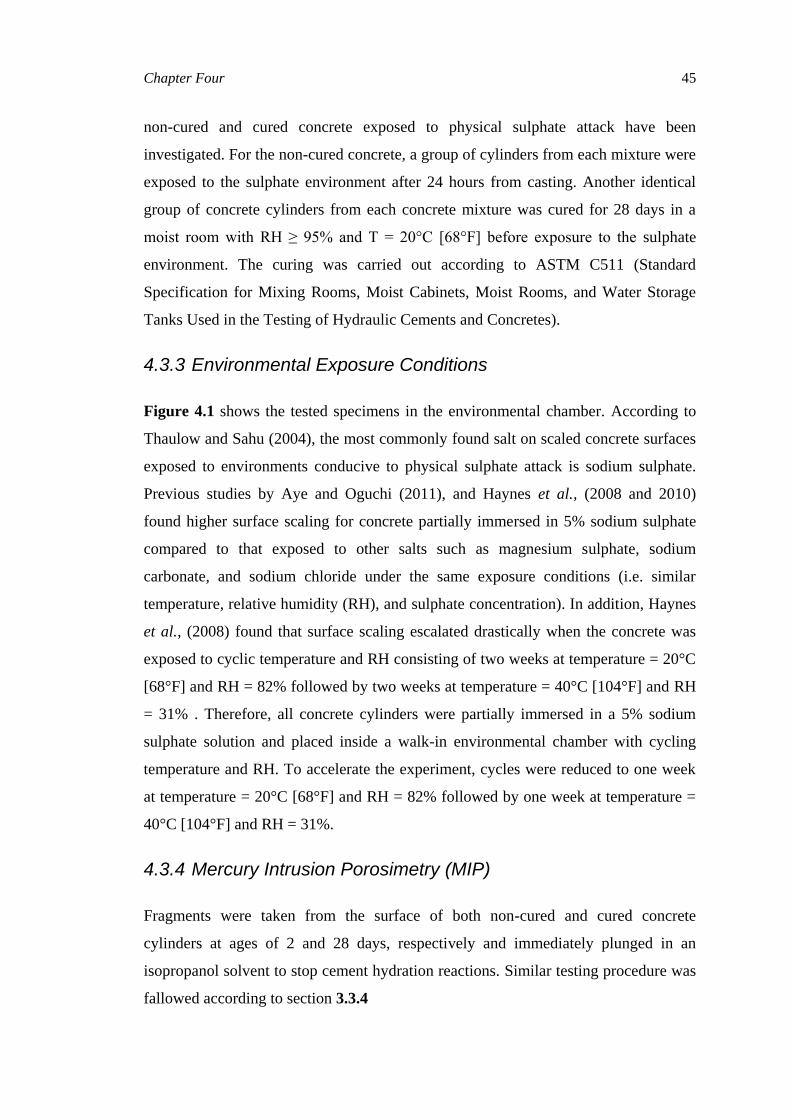
Chapter Four 45
non-cured and cured concrete exposed to physical sulphate attack have been
investigated. For the non-cured concrete, a group of cylinders from each mixture were
exposed to the sulphate environment after 24 hours from casting. Another identical
group of concrete cylinders from each concrete mixture was cured for 28 days in a
moist room with RH ≥ 95% and T = 20°C [68°F] before exposure to the sulphate
environment. The curing was carried out according to ASTM C511 (Standard
Specification for Mixing Rooms, Moist Cabinets, Moist Rooms, and Water Storage
Tanks Used in the Testing of Hydraulic Cements and Concretes).
4.3.3 Environmental Exposure Conditions
Figure 4.1 shows the tested specimens in the environmental chamber. According to
Thaulow and Sahu (2004), the most commonly found salt on scaled concrete surfaces
exposed to environments conducive to physical sulphate attack is sodium sulphate.
Previous studies by Aye and Oguchi (2011), and Haynes et al., (2008 and 2010)
found higher surface scaling for concrete partially immersed in 5% sodium sulphate
compared to that exposed to other salts such as magnesium sulphate, sodium
carbonate, and sodium chloride under the same exposure conditions (i.e. similar
temperature, relative humidity (RH), and sulphate concentration). In addition, Haynes
et al., (2008) found that surface scaling escalated drastically when the concrete was
exposed to cyclic temperature and RH consisting of two weeks at temperature = 20°C
[68°F] and RH = 82% followed by two weeks at temperature = 40°C [104°F] and RH
= 31% . Therefore, all concrete cylinders were partially immersed in a 5% sodium
sulphate solution and placed inside a walk-in environmental chamber with cycling
temperature and RH. To accelerate the experiment, cycles were reduced to one week
at temperature = 20°C [68°F] and RH = 82% followed by one week at temperature =
40°C [104°F] and RH = 31%.
4.3.4 Mercury Intrusion Porosimetry (MIP)
Fragments were taken from the surface of both non-cured and cured concrete
cylinders at ages of 2 and 28 days, respectively and immediately plunged in an
isopropanol solvent to stop cement hydration reactions. Similar testing procedure was
fallowed according to section 3.3.4
Chapter Four 46
Figure 4.1: Tested specimens in the environmental chamber.
4.3.5 Mass Loss
Concrete cylinders from each mixture were transferred to the exposure condition after
measuring their initial mass using a balance with an accuracy of 0.01 g [0.00035 oz.].
Before measuring the initial mass, all concrete cylinders were air-dried in the
laboratory condition at temperature = 20°C-22°C and RH = [68°F-71.6°F]. The mass
loss was calculated according to Eq. 4.1:
( )
(4.1)
Where t is the time,
Mi is the initial mass of the cylinder,
Mt is the mass of the cylinder at time t.

Chapter Four 47
4.4 Results and Discussion
After one month of sulphate exposure (4 cycles of wetting and drying) scaling of
concrete surfaces appeared above the sulphate solution level. The exposure was
continued for up to six months (24 cycles of wetting and drying) and all concrete
cylinders were inspected to diagnose the level of damage. Figure 4.2 shows typical
surface scaling above the solution level for the non-cured concrete cylinders made
with w/b = 0.60. For all tested cylinders, the portion of concrete immersed in the
solution was found relatively in intact condition compared with the damaged above
solution part. Higher surface scaling above the solution level was found in the non-
cured concrete specimens incorporating pozzolanic minerals compared to that of the
specimens made with 100% OPC or 100% HS at a w/b = 0.60.
Figure 4.3 depicts the deterioration of the bottom surface of concrete
cylinders made with w/b = 0.60. It can be observed that at the age of six months,
deterioration started to appear at the bottom surface of the 100% OPC concrete
cylinders, while concrete cylinders made with either HS or including pozzolanic
minerals were still intact.
Figures 4.4 and 4.5 illustrate representative surface scaling above the solution
level of the non-cured concrete cylinders made with w/b = 0.45 and 0.30,
respectively. Concrete cylinders with w/b = 0.45 exhibited similar trend to that of
cylinders made with w/b = 0.60, but with significantly less deterioration. For the non-
cured concrete cylinders with w/b = 0.30, no surface scaling was observed after six
months of sulphate exposure.
Figure 4.6 illustrates the typical effect of the curing regime on concrete
exposed to physical sulphate attack. It can be observed that cured concrete specimens
exhibited less surface scaling than that of their non-cured counterparts.

Chapter Four 48
Figure 4.2: Non-cured concrete cylinders made with w/b = 0.60 after six months of
physical sulphate exposure: (a) concrete made with OPC; (b) OPC + 25% FA; (c)
OPC + 8% SF; (d) OPC + 8% MK; and (e) concrete with HS.
(a) (b) (c)
(d) (e)
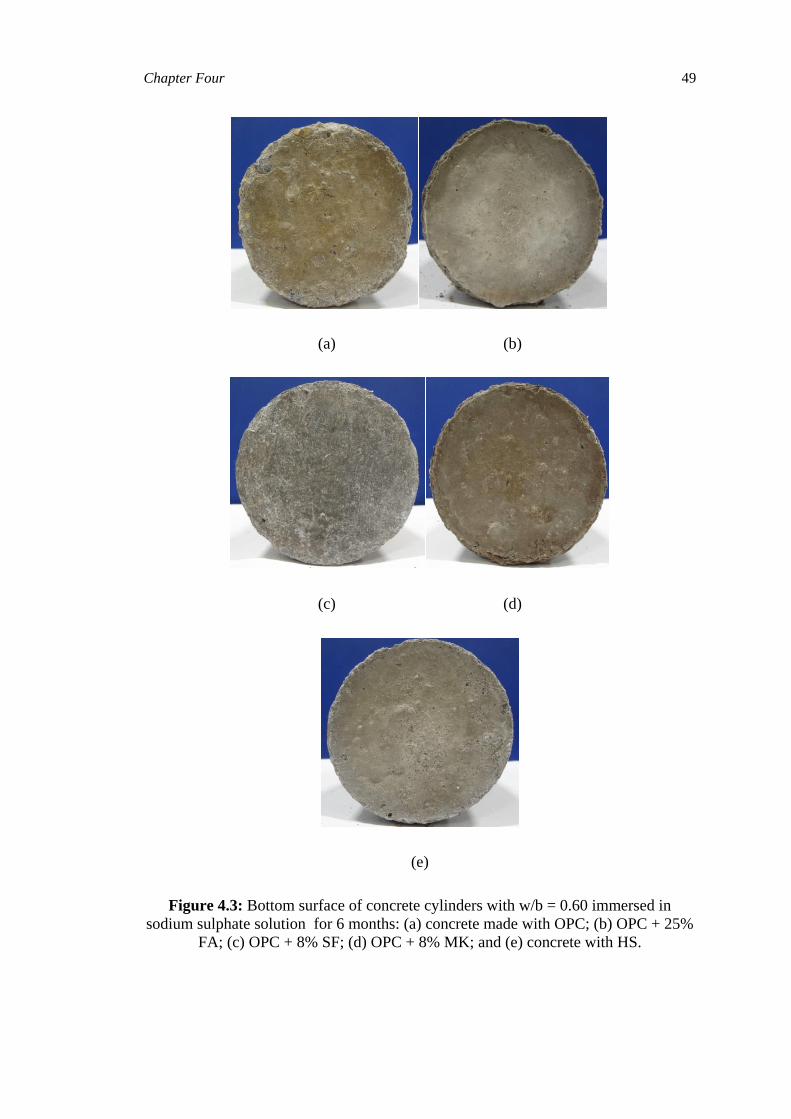
Chapter Four 49
(a) (b)
(c) (d)
(e)
Figure 4.3: Bottom surface of concrete cylinders with w/b = 0.60 immersed in
sodium sulphate solution for 6 months: (a) concrete made with OPC; (b) OPC + 25%
FA; (c) OPC + 8% SF; (d) OPC + 8% MK; and (e) concrete with HS.

Chapter Four 50
Figure 4.4: Non-cured concrete cylinders made with w/b = 0.45 after six months of
physical sulphate exposure: (a) concrete made with OPC; (b) OPC + 25 % FA; (c)
OPC + 8 % SF; (d) OPC + 8% MK; and (e) concrete with HS.
(a) (b) (c)
(d) (e)

Chapter Four 51
Figure 4.5: Non-cured concrete cylinders made with w/b = 0.30 after six months of
physical sulphate exposure: (a) concrete with OPC; (b) OPC + 25% FA; (c) OPC +
8% SF; (d) OPC + 8% MK; and (e) concrete with HS.
(a) (b) (c)
(d) (e)

Chapter Four 52
(a) (b)
Figure 4.6: Effect of curing on physical sulphate attack of concrete made with
OPC +25% FA at w/b = 0.60: (a) non-cured specimen; and (b) specimen moist cured
for 28 days.
Figure 4.7 to 4.9 and Table 4.2 show MIP test results for specimens from the various
concrete mixtures before exposure to physical sulphate attack. Results indicate that
concrete made either with pure OPC or HS cement incorporate pores with relatively
larger diameter. Partially replacing the cement with pozzolanic minerals led to a
decrease in the pore size diameter due to the pore refinement effect of pozzolanic
minerals.
A low w/b ratio caused a significant decrease in the total intrusion volume for
the plain and blended cement concrete mixtures due to the increase in the solid
volume and subsequent reduction in the total volume of pores. Moist curing the
concrete also induced a decrease in the intrusion volume, which also indicates a
decrease in the total porosity.

Chapter Four 53
Figure 4.7: MIP results for concrete mixtures made with w/b = 0.60 before exposure
to physical sulphate attack.
Figure 4.8: MIP results for concrete mixtures made with w/b = 0.45 before exposure
to physical sulphate attack.
0
0.02
0.04
0.06
0.08
0.1
0.001 0.01 0.1 1 10 100
Incr
emen
tal p
ore
volu
me
(mL
/g)
ore e ameter (m)
OCOC+25% FAOC+8% SFOC+8% MKHS
0
0.02
0.04
0.06
0.08
0.1
0.001 0.01 0.1 1 10 100
Incr
emen
tal p
ore
volu
me
(mL
/g)
ore e ameter (m)
OCOC+25% FaOC+8% SFOC+8% MKHS

Chapter Four 54
Figure 4.9: MIP results for concrete mixtures made with w/b = 0.30 before exposure
to physical sulphate attack
Table 4.2: Average pore size and total intrusion volume for the tested concrete
w/b = 0.60* w/b = 0.60** w/b = 0.45* w/b = 0.30*
Average
Pore
Diameter
(µm)
Total
Intrusion
Volume
(m/Lg)
Average
Pore
Diameter
(µm)
Total
Intrusion
Volume
(m/Lg)
Average
Pore
Diameter
(µm)
Total
Intrusion
Volume
(m/Lg)
Average
Pore
Diameter
(µm)
Total
Intrusion
Volume
(m/Lg)
100% OPC 0.063 0.090 0.058 0.066 0.046 0.042 0.041 0.021
OPC + 25% FA 0.049 0.092 0.045 0.069 0.031 0.043 0.023 0.023
OPC + 8% SF 0.051 0.074 0.041 0.052 0.034 0.037 0.025 0.017
OPC + 8% MK 0.054 0.076 0.043 0.055 0.037 0.032 0.027 0.016
HS 0.061 0.084 0.059 0.056 0.048 0.039 0.044 0.022
*Non-cured
**Cured
0
0.02
0.04
0.06
0.08
0.1
0.001 0.01 0.1 1 10 100
Incr
emen
tal p
ore
volu
me
(mL
/g)
ore e ameter (m)
OCOC+25%FAOC+8% SFOC+8% MKHS

Chapter Four 55
4.4.1.1 Effect of w/b ratio
The total intruded volume of mercury mainly depends on the volume of the pores and
their connectivity. As expected, MIP results showed high mercury intrusion for
concrete mixtures made with higher w/b compared to that of mixtures with lower w/b.
For instance, the total intrusion volume of mercury dropped from 0.090 (m/Lg) to
0.042 (m/Lg) and 0.021 (m/Lg) when the w/b was lowered from 0.60 to 0.45 and
0.30, respectively. This approximately represent a 50 % decrease in the total pore
volume for concrete made with w/b = 0.45 compared to that of concrete made with
w/b = 0.60 and 75 % for concrete made with w/b = 0.30. Therefore, by increasing the
w/b, the volume of the pores and their connectivity can be increased, leading to higher
capillary rise and increased salt growth on the concrete surface, thus accelerating the
damage mechanisms.
4.4.1.2 Effect of Curing
Moist curing the concrete showed relatively less surface scaling (Figure 4.6), since
curing the concrete increase the solid volume of the concrete (Mehta and Monteiro,
2006), leading to decrease in the total volume of the pores and their connectivity. MIP
results (Table 4.2) showed less mercury intrusion for the cured concrete compared
with non-cured concrete. For all cured specimens, a decrease by more than 20 %
occurred in the total intruded volume of mercury compared with that of the non-cured
specimen.
4.4.1.3 Effect of Pozzolanic Minerals
At the same w/b ratio, partially replacing the cement with pozzolanic minerals
showed a decrease in the average pore size as shown in the Table 4.2. Figures from
4.7 to 4.9 show that at different w/b ratio, partially replacing the cement with
pozzolanic minerals shifted the curve to the smaller pore diameter portion. For
instance, at different w/b ratios, the percentage of pores with diameter smaller than
0.10 µm was significantly increased when cement partially replaced with pozzolanic
minerals. Pores with smaller diameter tend to increase the capillary rise on the
concrete surface. Hence, it appears that the refinement of porosity due to the use of
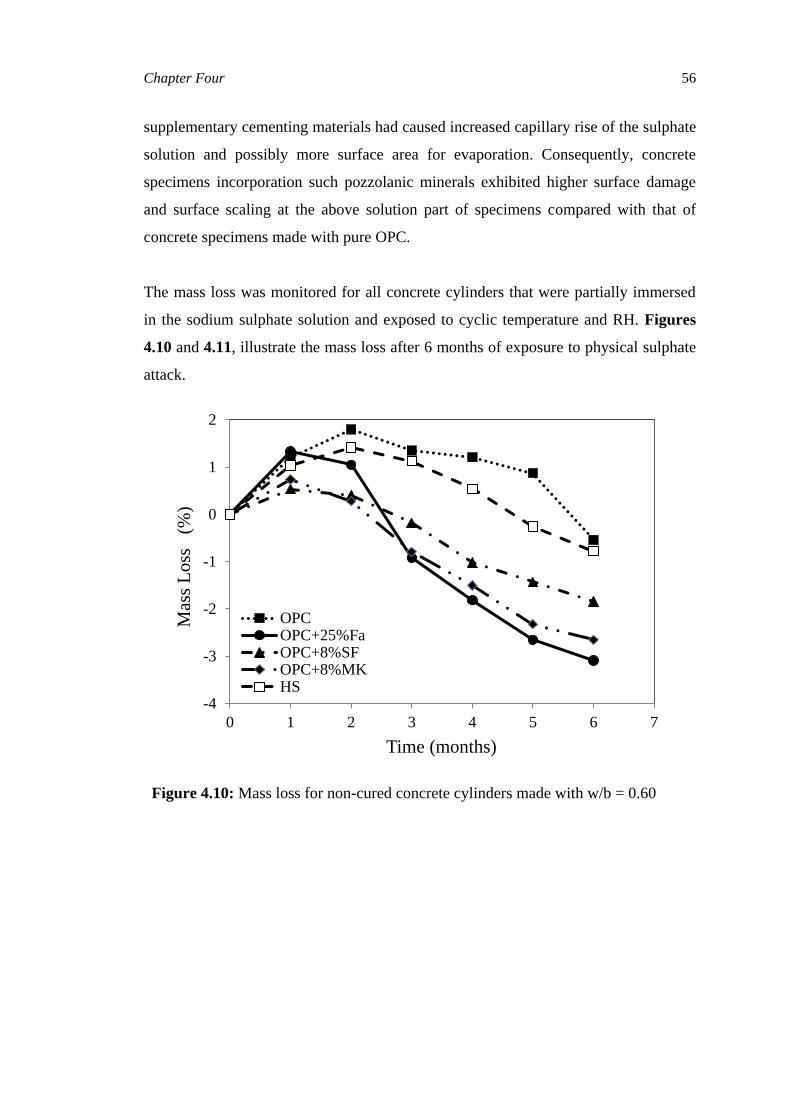
Chapter Four 56
supplementary cementing materials had caused increased capillary rise of the sulphate
solution and possibly more surface area for evaporation. Consequently, concrete
specimens incorporation such pozzolanic minerals exhibited higher surface damage
and surface scaling at the above solution part of specimens compared with that of
concrete specimens made with pure OPC.
The mass loss was monitored for all concrete cylinders that were partially immersed
in the sodium sulphate solution and exposed to cyclic temperature and RH. Figures
4.10 and 4.11, illustrate the mass loss after 6 months of exposure to physical sulphate
attack.
Figure 4.10: Mass loss for non-cured concrete cylinders made with w/b = 0.60
-4
-3
-2
-1
0
1
2
0 1 2 3 4 5 6 7
Mas
s L
oss
(
%)
Time (months)
OPCOPC+25%FaOPC+8%SFOPC+8%MKHS

Chapter Four 57
Figure 4.11: Mass loss for non-cured concrete cylinders made with w/b = 0.45.
During the first month, concrete cylinders gained mass due to water absorption,
especially for those with higher porosity. For instance, concrete cylinders with w/b =
0.60 gained higher mass than that of those made with w/b = 0.45 and w/b = 0.30,
respectively. In addition, at the same w/b ratio, 100% OPC or HS concrete cylinders
gained higher mass than that of specimens incorporating pozzolanic minerals. At later
age, the concrete cylinders started to lose mass. Highest mass loss was observed for
those concrete cylinders made with w/b = 0.60 and incorporating pozzolanic minerals.
Similar trend was observed for concrete cylinders made with w/b = 0.45, but with less
mass loss. However, all concrete cylinders (cured and non-cured) made with w/b =
0.30 did not experience any mass loss.
The mass loss occurred due to scaling of the concrete surface above the
solution level. The immersed portion of concrete into the sodium sulphate solution
was mostly in intact condition. The concrete surface above the solution level was
exposed to evaporation, which creates super-saturation of the sodium sulphate
solution. Therefore, crystals can grow from the supersaturated solution and exert high
tensile stress, leading to damage and mass loss of the concrete above the solution
level. In addition, cycling both the temperature and RH accelerated the damage since
thenardite dissolves during the wetting cycle and generates high super-saturation with
-4
-3
-2
-1
0
1
2
0 2 4 6 8
Mas
s L
oss
%
Time (months)
OPC
OPC+25%FA
OPC+8%SF
OPC+8%MK
HS

Chapter Four 58
respect to mirabilite that exerts high crystallisation pressure (Tsui, et al,. 2003; Flatt,
2002). According to Flatt (2002), the expected crystallisation pressure generated in
this process ranges from 10-20 MPa, which is higher than the typical tensile strength
of concrete.
4.5 Conclusions
In this chapter, the effect of the pore structure on concrete deterioration by physical
sulphate attack was investigated. Several factors that control the concrete pore
structure including the w/c ratio, pozzolanic minerals, and the curing regime were
explored under environments prone to physical sulphate attack. Several conclusions
can be drawn based on the experimental results:
The durability of concrete against physical sulfate attack depends significantly
on the concrete pore structure, and is less dependent on the chemical
composition and nature of the binder.
Using low w/b ratio can significantly improve the durability of concrete under
physical sulphate attack since it reduces the total volume of the pores and their
connectivity, leading to less capillary rise and surface scaling.
Moist curing the concrete for 28-days before exposure to physical sulphate
attack led to reduced surface scaling due to an increase in the solid volume and
decreased porosity of the cementitious matrix.
At the same w/b ratio, although partially replacing ordinary portland cement
with pozzolanic minerals also reduced the total porosity of the concrete, it was
found that the surface scaling was escalated due to an increase in the
proportion of the pores with very small diameter, which caused an increase of
capillary rise and more surface area for evaporation.
Chapter Four 59
4.6 References
ASTM C511., (2009), Standard Specification for Mixing Rooms, Moist Cabinets,
Moist Rooms, and Water Storage Tanks Used in the Testing of Hydraulic
Cements and Concretes, American Society for Testing and Materials ,West
Conshohocken, PA.
ASTM D4404., (2010), Standard Test Method for Determination of Pore Volume and
Pore Volume Distribution of Soil and Rock by Mercury Intrusion Porosimetry,
American Society for Testing and Materials ,West Conshohocken, PA.
Aye, T., Oguchi, C. T., (2011), “Resistance of plain and blended cement mortars
exposed to severe sulfate attacks”, Construction and Building Materials, Vol.
25, No. 6, pp. 2988-2996..
Flatt, R. J., (2002), “Salt damage in porous materials: how high supersaturations are
generated”, Journal of Crystal Growth, Vol. 242, No. 3-4, pp. 435-454.
Haynes, H., O’Neill, R., and Mehta, P. K. (1996), “Concrete deterioration from
physical attack by salts”, Concrete International, Vol. 18, No. 1, pp. 63-68.
Haynes, H., O’Neill, R., Neff, M. and Mehta, P. K. (2008), “Salt weathering distress
on concrete exposed to sodium sulfate environment”, ACI Materials Journal,
Vol. 105, No. 1, pp. 35-43.
Haynes, H., O’Neill, R., Neff, M. and Mehta, P. K. (2010), “Salt weathering of
concrete by sodium carbonate and soduim chloride”, ACI Materials Journal,
Vol. 107, No. 3, pp. 258-266.
Irassar, E. F., Di Maio, A., and Batic, O. R., (1995), “Sulfate attack on concrete with
mineral admixtures”, Cement and Concrete Research, Vol. 26, No. 1, pp. 113-
123.
Mehta, P. K., and Monteiro, P. J. M., (2006), Concrete Microstructure, Properties, and
Materials”, McGraw-Hill, Third Edition, 659 p.

Chapter Four 60
Navarroa, C. R., and Doehnea, E., (1999), “Salt weathering: influence of evaporation
rate, supersaturation, and crystallization pattern”, Earth Surface Processes and
Landforms, Vol. 24, No. 3, pp. 191-209.
Scherer, G. W., (2004), “Stress from crystallization of salt”, Cement and Concrete
Research, Vol. 34, No. 9, pp. 1613– 1624.
Stark, D., (1989), “Durability of concrete in sulfate-rich soils”, Research and
Development Bulletin, Portland Cement Association, Vol. RD097.
Thaulow, N., Sahu, S., (2004), “Mechanism of concrete deterioration due to salt
crystallization”, Materials Characterization, Vol. 53, No. 2-4, pp. 123-127.
Tsui, N., Flatt, R. J., and Scherer, G. W., (2003), “Crystallization damage by sodium
sulfate”, Journal of Cultural Heritage, Vol. 4, No. 2, pp. 109-115.

Chapter Five 61
CHAPTER FIVE
5 EFFECT OF SURFACE TREATMENT ON DURABILITY OF CONCRETE EXPOSED TO PHSYICAL SULPHATE
ATTACK
5.1 Introduction
Concrete surface generally includes macro-pores and micro-cracks that provide paths
for the ingress of harmful substances into the concrete, often leading to deterioration
(Aguiar et al., 2008; Swamy et al., 1998). Thus, concrete protection can be provided
using surface treatment materials, such as hydrophobic and film-forming coating
materials that act as a barrier to isolate the concrete from its surrounding environment
(Aguiar et al., 2008). However, choosing an effective type of surface treatment
material is a challenge since different types and formulations are commercially
available (Hawkins, 1985). In particular, only limited studies have focused on
concrete exposed to physical sulphate attack (Haynes et al., 2008; Aye and Oguchi,
2011; Nehdi and Hayek, 2005). Therefore, the main focus of this study is to assess the
ability of different types of surface treatment materials to enhance the durability of
concrete to physical sulphate attack. .
5.2 Need for Research
Protecting the surface of concrete can be essential for improving its durability under
certain exposure conditions. However, different types of surface treatment materials
are commercially available, which makes it difficult to identify the appropriate type,
especially in the case of concrete exposed to physical sulphate attack. Therefore, this
study focuses on evaluating the effects of coating the surface of concrete with
different types of commercially available surface treatment materials on its resistance
to physical sulphate attack. The results could provide guidance to avoiding many law
suits related to physical sulphate attack damage of concrete.

Chapter Five 62
5.3 Experimental Program
Concrete cylinders 100×200 mm (4×8 in) in size were cast according to ASTM C192
(Standard Practice for Making and Curing Concrete Test Specimens in the
Laboratory). Table 5.1 summarizes the concrete mixture compositions.
Table 5.1: Proportions of tested concrete mixtures
Ingredient Mixture 1 Mixture 2
Cement (kg) 300 263
Fly ash (kg) 100 87
Coarse Aggregate (kg) 1110 1110
Fine Aggregate (kg) 705 754
w/b 0.45 0.60
Superplasticizer (ml/ m3) 900 -
Generally, sulphate attack on concrete structures exposed to sulphate rich-soil can
start at early-age. In addition, most cast in-situ concrete structures are not cured for 28
days and are usually surface coated at early-age to accelerate the construction process.
Therefore, in this study, concrete cylinders were de-molded after 24 hours from
casting and divided into two groups. The first group was kept at ambient laboratory
temperature (20°C [68°F] - 23°C [73°F]) for 72 hours before coating, while the other
group was cured for 28 days before exposure to the sulphate environment. The curing
was carried out according to ASTM C511 (Standard Specification for Mixing Rooms,
Moist Cabinets, Moist Rooms, and Water Storage Tanks Used in the Testing of
Hydraulic Cements and Concretes).
Table 5.2 shows the properties of the used surface treatment materials. Two
application layers of four different types of surface treatment materials were tested,
namely (a) silane, which is a hydrophobic penetrating sealer (water-repellent), (b)
epoxy, which acts as a membrane coating, (c) bitumen modified polyurethane, which
is a waterproof membrane, and (d) water-based solid acrylic polymer resin, which is
a curing and surface sealer compound.
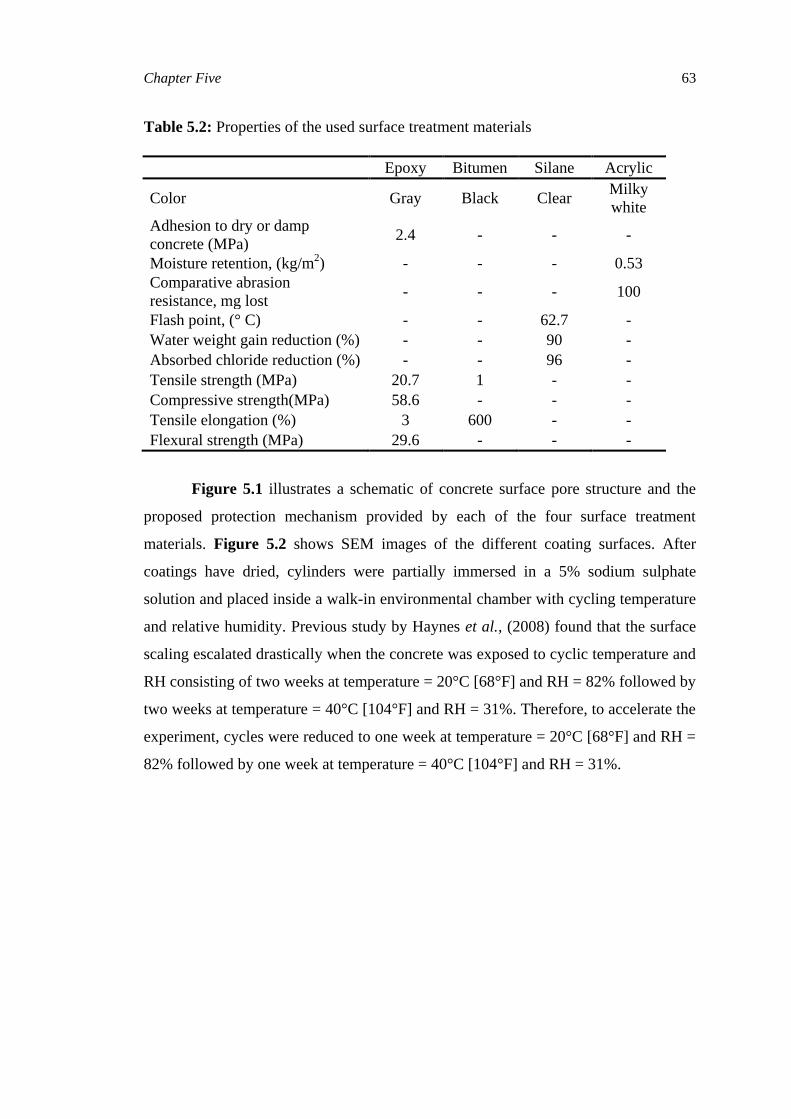
Chapter Five 63
Table 5.2: Properties of the used surface treatment materials
Epoxy Bitumen Silane Acrylic
Color Gray Black Clear Milky
white
Adhesion to dry or damp
concrete (MPa) 2.4 - - -
Moisture retention, (kg/m2) - - - 0.53
Comparative abrasion
resistance, mg lost - - - 100
Flash point, (° C) - - 62.7 -
Water weight gain reduction (%) - - 90 -
Absorbed chloride reduction (%) - - 96 -
Tensile strength (MPa) 20.7 1 - -
Compressive strength(MPa) 58.6 - - -
Tensile elongation (%) 3 600 - -
Flexural strength (MPa) 29.6 - - -
Figure 5.1 illustrates a schematic of concrete surface pore structure and the
proposed protection mechanism provided by each of the four surface treatment
materials. Figure 5.2 shows SEM images of the different coating surfaces. After
coatings have dried, cylinders were partially immersed in a 5% sodium sulphate
solution and placed inside a walk-in environmental chamber with cycling temperature
and relative humidity. Previous study by Haynes et al., (2008) found that the surface
scaling escalated drastically when the concrete was exposed to cyclic temperature and
RH consisting of two weeks at temperature = 20°C [68°F] and RH = 82% followed by
two weeks at temperature = 40°C [104°F] and RH = 31%. Therefore, to accelerate the
experiment, cycles were reduced to one week at temperature = 20°C [68°F] and RH =
82% followed by one week at temperature = 40°C [104°F] and RH = 31%.

Chapter Five 64
Figure 5.1: Schematic illustration of concrete surface pores and protection
mechanism provided by various surface treatment materials: (a) non-coated concrete;
(b) concrete surface coated with acrylic sealer; (c) concrete surface coated with epoxy
or bitumen that provides an impervious membrane; and (d) concrete coated
with silane water repellent.
(a) (b) (c) (d)
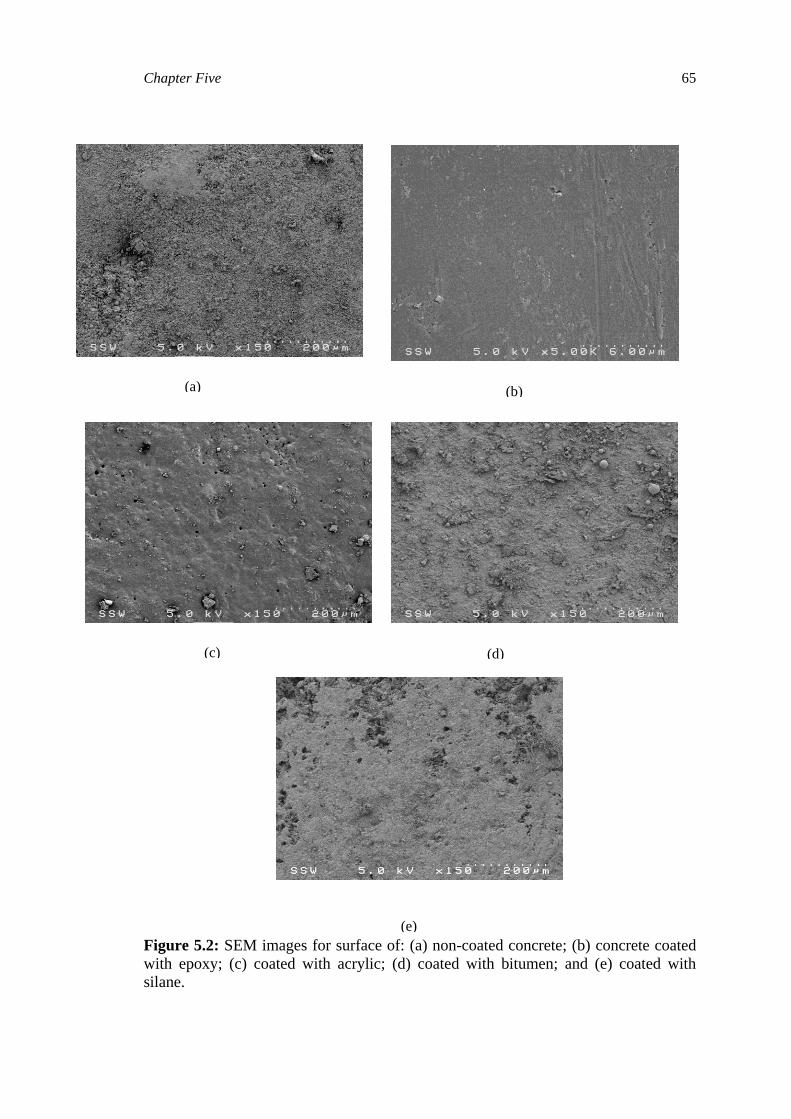
Chapter Five 65
Figure 5.2: SEM images for surface of: (a) non-coated concrete; (b) concrete coated
with epoxy; (c) coated with acrylic; (d) coated with bitumen; and (e) coated with
silane.
(a) (b)
(c) (d)
(e)

Chapter Five 66
5.3.1 Visual Inspection
Concrete cylinders were visually monitored for up to six months of sulphate exposure.
The visual rating of concrete surface degradation was conducted based on the
proposed rating system by Malhotra et al., (1987). In this system, concrete can be
rated on a scale of ten based on its surface scaling and mass loss as shown in Table
5.2.
Table 5.2: Visual rating system for the degraded concrete (Adapted from Malhotra et
al., 1987). (Reproduced with permission from the American Concrete Institute)
Rating Grade Rating Description
0 Less than 15% of surface aggregates are exposed
1 More than 15% of surface aggregates are exposed
2 50% of surface aggregates immediately below the surface are exposed
3 80% of surface aggregates are exposed
4 Surface aggregates are exposed over 20% of their perimeter
5 90% of the surface aggregates are exposed over one half of their perimeter
6 95% of volume of specimen remaining
7 80% of volume of specimen remaining
8 60% of volume of specimen remaining
9 20% of volume of specimen remaining
10 Specimen disintegrated
5.4 Experimental Results
Figure. 5.3 and Table 5.3 show MIP results for the non-coated concrete surfaces
before exposure to physical sulphate attack. As expected, results showed higher
content of larger pores (1µm-0.1µm) and mercury intrusion for concrete specimens
made with w/b = 0.60 compared with that of those made with w/b = 0.45. The total
intrusion volume of mercury dropped from 0.069 (m/Lg) to 0.038 (m/Lg) when the
w/b was lowered from 0.60 to 0.45. Approximately 50 % decrease in pore volume
was observed for concrete made with w/b = 0.45 compared to that of concrete made
with w/b = 0.60. This difference was more pronounced for non-cured specimens.
Therefore, by increasing the w/b, the volume of the pores and their connectivity can

Chapter Five 67
be increased, leading to higher capillary rise and increased salt growth on the concrete
surface, thus accelerating the damage mechanisms.
Figure 5.3: MIP test results for concrete specimens before coating and exposure to
physical sulphate attack.
Table 5.3: Average pore size and total intrusion volume for the tested concrete
Average Pore
Diameter (µm)
Total Intrusion
Volume (m/Lg)
w/c = 0.60 0.049 0.092
w/c = 0.60 cured 0.045 0.069
w/c = 0.45 0.031 0.043
w/c = 0.45 cured 0.029 0.038
Table 5.4 shows the visual rating for each concrete cylinder after six months of
physical sulphate exposure using the Malhotra et al., (1987) rating system. After one
month of exposure (i.e. four cycles of wetting and drying), surface scaling appeared
0
0.02
0.04
0.06
0.08
0.1
0.001 0.01 0.1 1 10 100 1000
Incr
emen
tal
ore
Vol
ume
(mL
/g)
ore e ameter (m)
w/b = 0.6 cured
w/b = 0.6 not cured
w/b = 0.45 cured
w/b = 0.45 not cured

Chapter Five 68
on the drying surfaces of the non-coated cylinders (both cured and non-cured) made
with w/c = 0.60, with more substantial degradation for the non-cured cylinders.
However, no deterioration was observed on the coated cylinders. After six cycles,
damage appeared on the acrylic coated specimens (for both the cured and non-cured
cylinders) as shown in Figure 5.4. In addition, it was observed that the bitumen
coating layer had separated from the non-cured cylinders. Conversely, no
deterioration was observed for the cylinders coated with epoxy and silane.
Furthermore, at lower w/c = 0.45, less degradation was observed for the non-coated
cylinders and those coated with acrylic. No separation of the bitumen layer occurred
for the non-cured concrete cylinders made with w/c = 0.45.
Table 5.4 Visual rating for concrete cylinders after six months of exposure to physical
sulphate attack
w/c = 0.60
cured
w/c = 0.60
non-cured
w/c = 0.45
cured
w/c = 0.45 non-
cured
Non-coated 5 5.5 1 1.8
Coated with epoxy 0 0 0 0
Coated with bitumen 0 0.8 0 0
Coated with silane 0 0 0 0
Coated with acrylic 4.4 4.8 0.5 1.2
Figure 5.5, 5.6, 5.7, and 5.8 show cured and non-cured and coated and non-
coated concrete cylinders after six months of sulphate exposure. It can be observed
that damage was confined to the concrete surface above the solution level. Most
extensive damage was observed for the non-cured and cured concrete cylinders,
respectively made with w/b = 0.60. Severe damage was also observed for cylinders
made with w/b = 0.60 and coated with acrylic. Concrete cylinders that were coated
with epoxy and silane were in intact condition. For specimens coated with bitumen,
only those made with w/b = 0.60 have shown damage.
A similar trend was observed for the non-coated cylinders (both cured and
non-cured) made with w/b = 0.45, but with significantly less deterioration. Again, no

Chapter Five 69
deterioration was observed for the cylinders coated either with epoxy, silane, or
bitumen, except for cylinders coated with acrylic.
Figure 5.4: Damage of the acrylic layer of coated non-cured concrete made with w/b
= 0.60 after two months of physical sulphate exposure.

Chapter Five 70
Figure 5.5: Non-cured concrete cylinders made with w/b = 0.60 after 6 months of
physical sulphate exposure: (a) non-coated and coated with; (b) silane (water-
repellent); (c) acrylic solution (curing and sealer); (d) epoxy (membrane);
and (e) bitumen (membrane).
(a) (b) (c)
(d)
(c)
(e)

Chapter Five 71
Figure 5.6: Cured cylinders made with w/b = 0.60 after 6 months of physical sulphate
exposure (a) non-coated and coated with; (b) silane (water-repellent); (c) acrylic
solution (curing and sealer); (d) epoxy (membrane); and (e) bitumen ( membrane).
(a) (b) (c)
(d) (e)

Chapter Five 72
Figure 5.7: Non-cured concrete cylinders made with w/b = 0.45 after 6 months of
exposure (a) Non-coated, and coated with; (b) silane (water-repellent); (c) acrylic
solution (curing and sealer); (d) epoxy (membrane); and (e) bitumen ( membrane).
(a) (b) (c)
(d) (e)
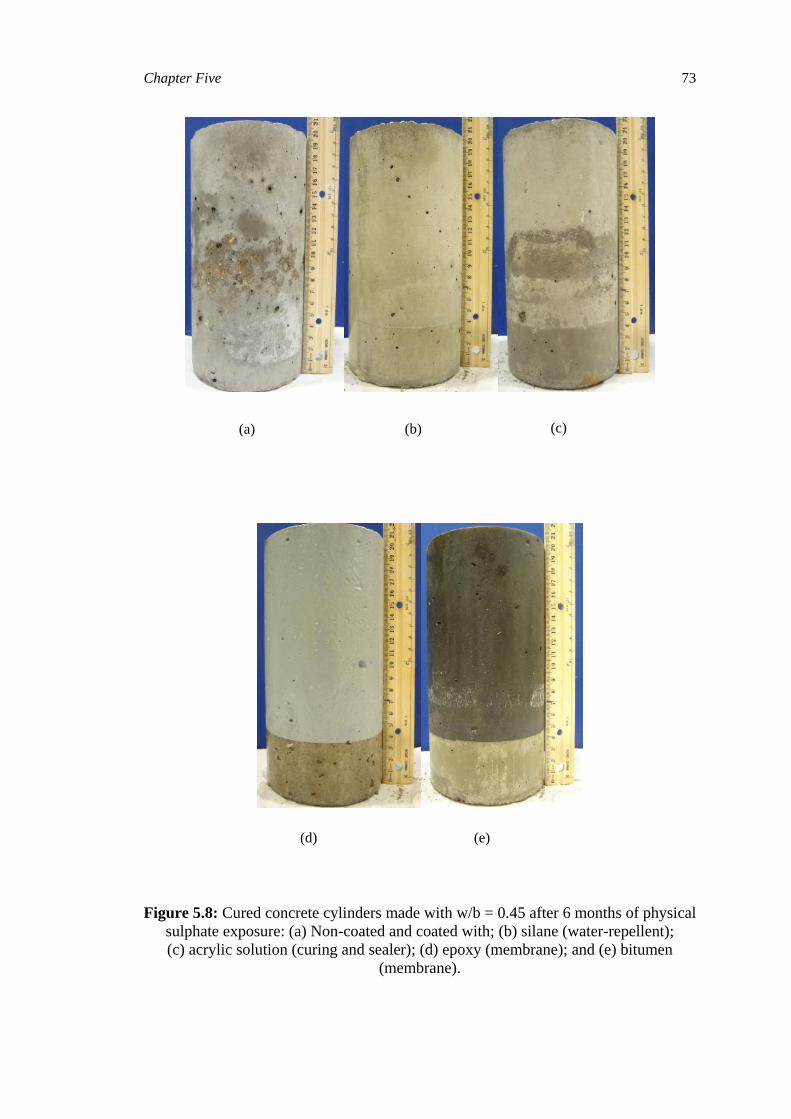
Chapter Five 73
Figure 5.8: Cured concrete cylinders made with w/b = 0.45 after 6 months of physical
sulphate exposure: (a) Non-coated and coated with; (b) silane (water-repellent);
(c) acrylic solution (curing and sealer); (d) epoxy (membrane); and (e) bitumen
(membrane).
(a) (b) (c)
(d) (e)

Chapter Five 74
The mass loss of concrete cylinders partially immersed in the 5 % sodium sulphate
solution was monitored on a monthly basis. Figures 5.8; 5.9; 5.10; and 5.11 illustrate
the mass loss for both coated and non-coated concrete cylinders after six months of
exposure to physical sulphate attack.
Figure 5.9: Mass loss of non-cured concrete cylinders made with w/b = 0.60.
-3.5
-2.5
-1.5
-0.5
0.5
1.5
0 1 2 3 4 5 6 7
Mas
s lo
ss (
%)
Time (months)
Epoxy
Bitumen
Acrylic
Saline
Non-coated

Chapter Five 75
Figure 5.10: Mass loss of cured concrete cylinders made with w/b = 0.60.
Figure 5.11: Mass loss of non-cured concrete cylinders made with w/b = 0.45.
-3.5
-2.5
-1.5
-0.5
0.5
1.5
0 1 2 3 4 5 6 7
Mas
s lo
ss (
%)
Time (months)
Epoxy
Bitumen
Acrylic
Saline
Non-coated
-3.5
-2.5
-1.5
-0.5
0.5
1.5
0 1 2 3 4 5 6 7
Mas
s L
oss
(%
)
Time (months)
Epoxy
Bitumen
Acrylic
Silane
Non-coated
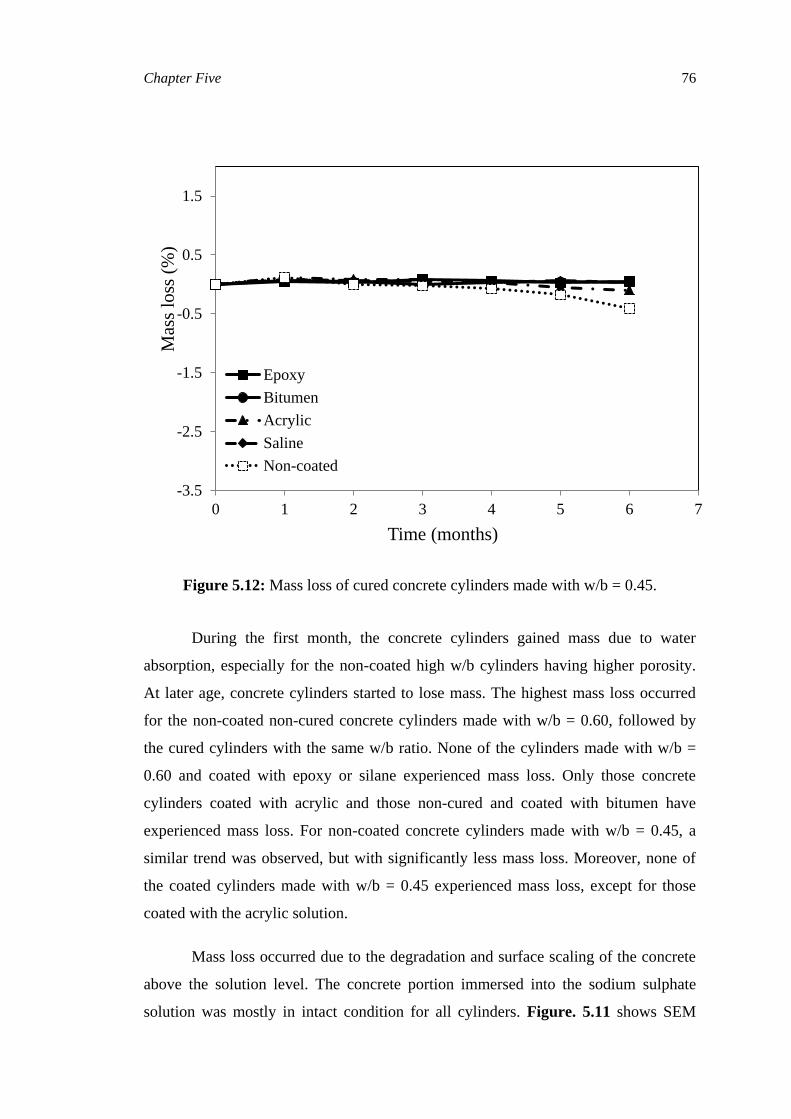
Chapter Five 76
Figure 5.12: Mass loss of cured concrete cylinders made with w/b = 0.45.
During the first month, the concrete cylinders gained mass due to water
absorption, especially for the non-coated high w/b cylinders having higher porosity.
At later age, concrete cylinders started to lose mass. The highest mass loss occurred
for the non-coated non-cured concrete cylinders made with w/b = 0.60, followed by
the cured cylinders with the same w/b ratio. None of the cylinders made with w/b =
0.60 and coated with epoxy or silane experienced mass loss. Only those concrete
cylinders coated with acrylic and those non-cured and coated with bitumen have
experienced mass loss. For non-coated concrete cylinders made with w/b = 0.45, a
similar trend was observed, but with significantly less mass loss. Moreover, none of
the coated cylinders made with w/b = 0.45 experienced mass loss, except for those
coated with the acrylic solution.
Mass loss occurred due to the degradation and surface scaling of the concrete
above the solution level. The concrete portion immersed into the sodium sulphate
solution was mostly in intact condition for all cylinders. Figure. 5.11 shows SEM
-3.5
-2.5
-1.5
-0.5
0.5
1.5
0 1 2 3 4 5 6 7
Mas
s lo
ss (
%)
Time (months)
Epoxy
Bitumen
Acrylic
Saline
Non-coated

Chapter Five 77
image and XRD for the precipitated salt (thenardite) filling the pores on the concrete
surface above the solution level. The concrete surface above the solution level was
exposed to evaporation, which created supersaturation of the sodium sulphate
solution. Hence crystals could grow from the supersaturated solution and exert high
tensile pressure, thus leading to damage and mass loss of the concrete above the
solution level. Therefore, monitoring the mass loss seems to be a useful indication of
the performance of concrete exposed to physical sulphate attack.
Figure 5.13: SEM and XRD analysis showing thenardite above the solution level.
5.4.1 Discussion
Using surface treatment materials has been a practical solution to improve the
durability of concrete since most harmful agents penetrate into concrete through its
surface. However, several studies have shown that the effectiveness of different types
of surface treatment materials can vary depending on exposure conditions. For
instance, a study by Aguiar et al., (2008) showed poor performance under sulphate
attack of concrete protected by a silicon agent compared with that of concrete coated
with a water based acrylic. Conversely, under a chloride penetration test, the silicon
agent better improved the performance of the concrete compared with the water based
acrylic. Another study by Ibrahim, et al., (1999) showed that using silane as a surface
treatment material enhanced the durability of concrete that was fully immersed in a

Chapter Five 78
sulphate solution compared to sodium silicate. However, the sodium silicate was
found to provide better protection against carbonation. Therefore, caution is required
to select the appropriate concrete coating material for different exposure conditions.
In the present study, since there is a lack of data on concrete exposed to
physical sulphate attack, the effectiveness of various surface treatment materials was
investigated for concrete partially immersed in a sulphate solution, an exposure that is
conducive to damage by physical sulphate attack. The difference in the results
observed can be mainly attributed to the different protection mechanisms provided by
each of the surface treatment materials and the condition of the corresponding
concrete substrate. For example, the epoxy coating provides a thick membrane on the
concrete surface, which can be hardly penetrated by sulphates. Moreover, it eliminates
the capillary water rise on the concrete surface. Therefore, salt crystals cannot
precipitate in the sub-efflorescence zone where they can exert pressure within the
concrete pores, thus eliminating damage. In addition, the used epoxy has adequate
bond and mechanical properties that can enhance the concrete surface. For instance,
the tensile strength of the epoxy is 20.7 MPa according to ASTM D638 (Standard
Test Method for Tensile Properties of Plastic) and the flexural strength is 29.6 MPa
according to ASTM C580 (Standard Test Method for Flexural Strength and Modulus
of Elasticity of Chemical-Resistant Mortars, Grouts, Monolithic Surfacing, and
Polymer Concretes).
Regarding the bitumen base coating, it provides similar protection for concrete
to that of epoxy since it forms a thick membrane on the concrete surface. Moreover, it
has a high tensile elongation (600%) according to ASTM D412 (Standard Test
Methods for Vulcanized Rubber and Thermoplastic Elastomers-Tension), which can
accommodate the strains exerted by salt crystals. However, in the case of the non-
cured concrete with a high w/b = 0.60, the bitumen layer had separated from the
concrete surface. Generally, in hydrated cement paste, water can exist in capillary
pores as absorbed water, interlayer water, and chemically combined water (Mehta and
Monteiro, 2006). The amount of free water increases with increasing w/b. In addition,
at early age, the amount of free water is high compared with that in lower porosity
fully hydrated concrete. Such capillary pores are typically interconnected with the
surface. Thus, when high porosity concrete is coated at early-age, water molecules

Chapter Five 79
may entrap between the bitumen coating layer and the substrate, leading to
emulsification of the bitumen and its separation. This did not occur for the epoxy
based coating which provides a similar protection mechanism, but has much stronger
adhesion to the substrate than the bitumen base coating and is not vulnerable to
emulsification. Previous investigation by Price (1989) on different types of water
proofing systems showed excellent adhesion and bond of epoxy based coating
systems to concrete surface compared to that of bitumen based systems.
Concrete cylinders coated with the water-based acrylic coating exhibited
slightly less damage than that of the non-coated cylinders. This can be attributed to
the fact that the acrylic solution acts as a curing and sealing compound, thus,
protecting the concrete against its surrounding environment by partially filling the
concrete surface pores and creating a thin membrane (Vipulanandan et al., 2011; Al-
Gahtani et al., 1999; Radlinska et al., 2012). However, the acrylic solution did not
provide an adequate protection to concrete since it was completely damaged after 2
months of exposure to physical sulphate attack, as shown in Figure 5.3. Previous
study by Moreira et al., (2006) showed poor performance of water-based acrylic resin
under capillary absorption compared with other types of surface treatment materials.
This agrees with findings of the present study since concrete cylinders coated with
acrylic gained more mass in the beginning of the experiment than the other coated
cylinders. It is also possible that the acrylic solution partially fill the concrete surface
pores, allowing salt crystals to grow and damage the acrylic film. In addition, acrylic
is a relatively brittle material (Zhu and Chai, 2010; Radlinska et al., 2012) and may
not sustain the strains due to salt crystallization.
The silane water-repellent agent achieved excellent protection of the concrete
against physical sulphate attack since none of the cylinders (cured and non-cured)
coated with silane have experienced surface scaling or mass loss. The protection
mechanism of silane is different from that of the other coating materials tested in this
study as it penetrates the concrete surface and chemically reacts within the concrete
pores, providing molecules that perform as a water repellent (Vipulanandan et al.,
2011; Henry, 2004). Thus, it can prevent the water that contains sulphates from
entering into the concrete pores, mitigating capillary rise and salt crystallisation.
However, previous studies have shown that the performance of water repellant agents

Chapter Five 80
can vary depending on their formulation and type of application. For instance,
Villegas and Vale (1993) showed that under a salt weathering test, organosilicic
(water-repellent) products provide better protection to limestone used in historical
monuments than other water-repellent products of different formulations. Another
study by Zhu et al. (2013) found that using surface water-repellent agents is more
effective to reduce capillary absorption than using integral water-repellent agents
added to the concrete mixtures. Thus, choosing the appropriate water-repelling agent
for a certain environmental exposure requires past experience and knowledge of its
performance under similar exposure.
5.5 Conclusions
The resistance to physical sulphate attack of concrete cylinders made with w/c = 0.45
and 0.60, both cured and non-cured, and coated with different types of surface
treatment materials has been investigated in this chapter. The following conclusions
can be drawn based on the experimental results.
Reducing the w/c ratio improved the performance of concrete exposed to
physical sulphate attack since less salt growth can form through the concrete
pore space leading to less damage.
Epoxy- and silane-based surface treatment materials were found to be
adequate for protecting both cured and non-cured concrete exposed to physical
sulphate attack. Epoxy provides a thick protective membrane on the concrete
surface, which can be hardly penetrated by sulphates, thus mitigating capillary
rise on the concrete. Conversely, silane penetrates the concrete surface and
chemically reacts within the concrete pores, providing molecules that perform
as a water repellent.
For the surface treatment material based on bitumen, it was found that
adequate curing of the concrete before coating is important to eliminate the
separation of the bitumen and enhance the resistance of concrete to physical
sulphate attack.
Using a water-based solid acrylic polymer resin did not provide an adequate
protection of concrete against physical sulphate attack.
Chapter Five 81
Designing concrete that is durable to both chemical and physical sulphate
attack should entail lowering the w/c ratio and/or creating a barrier between
the ground water and the above ground portion of concrete exposed to
capillary rise and evaporation.
Chapter Five 82
5.6 References
Aguiar, J. B., Camoes, A., and Moreira, P. M., (2008), “Performance of concrete in
aggressive environment” , Concrete Structures and Materials, Vol. 2, No. 1, pp.
21-25.
Al-Gahtani, A., Ibrahim, M., Maslehuddin, M., and Almusallam, A. A., (1999),
“Performance of concrete surface treatment systems”, Concrete International,
Vol. 21, No. 1, pp. 64-68.
ASTM C192 (2012), “Standard Practice for Making and Curing Concrete Test
specimens in the Laboratory”, American Society for Testing and Materials
,West Conshohocken, PA.
ASTM C511, (2009), “Standard Specification for Mixing Rooms, Moist Cabinets,
Moist Rooms, and Water Storage Tanks Used in the Testing of Hydraulic
Cements and Concretes”, American Society for Testing and Materials ,West
Conshohocken, PA.
ASTM C580, (2012), “Standard Test Method for Flexural Strength and Modulus of
Elasticity of Chemical-Resistant Mortars, Grouts, Monolithic Surfacing, and
Polymer Concretes”, American Society for Testing and Materials ,West
Conshohocken, PA.
ASTM D4404, (2010), “Standard Test Method for Determination of Pore Volume and
Pore Volume Distribution of Soil and Rock by Mercury Intrusion Porosimetry”,
American Society for Testing and Materials ,West Conshohocken, PA.
ASTM D638, (2010), “Standard Test Method for Tensile Properties of Plastics”,
American Society for Testing and Materials ,West Conshohocken, PA.
ASTM D412, (2013), “Standard Test Methods for Vulcanized Rubber and Thermoplastic
Elastomers-Tension”, American Society for Testing and Materials ,West
Conshohocken, PA.
Aye, T., Oguchi, C. T., (2011), “Resistance of plain and blended cement mortars
exposed to severe sulfate attacks”, Construction and Building Materials, Vol.
25, No. 6, pp. 2988-2996.
Chapter Five 83
Haynes, H., O’Neill, R., and Mehta, P. K. (1996), “Concrete deterioration from
physical attack by salts”, Concrete international, Vol. 18, No. 1, pp. 63-68.
Haynes, H., (2002), “Sulfate attack on concrete: Laboratory versus field experience”,
Concrete International, Vol. 24, No. 7, pp. 64-70.
Haynes, H., O’Neill, R., Neff, M. and Mehta, P. K., (2008), “Salt weathering distress
on concrete exposed to sodium sulfate environment”, ACI Materials Journal,
Vol. 105, No. 1, pp. 35-43.
Hawkins, P. J., (1985), “The use of surface coating to minimize carbonation in the
middle east” Proceedings of 1st International Conference on Deterioration and
Repair of Reinforced Concrete in the Arabian Gul, Bahrain, pp. 372-382.
Henry, G., (2004), “Pentrating water-repplent sealers”, Concrete International, Vol.
26, No. 5, pp. 81– 83.
Hime, W. G., Martinek, R. A., Backus, L. A., and Marusin, S. L., (2001), “Salt
hydration distress”, Concrete International , Vol. 23, No. 10, pp. 43-50.
Ibrahim, M., Al-Gahtani, A., Maslehuddin, M., and Dakhil, F., (1999), “Use of
surface treatment materials to improve concrete durability”, Journal of
Materials in Civil Engineering, Vol. 11, No. 1, pp. 36-40.
Irassar, E. F., Di Maio, A., and Batic, O. R., (1995), “Sulfate attack on concrete with
mineral admixtures”, Cement and Concrete Research, Vol. 26, No. 1, pp. 113-
123.
Malhotra, V. M, Carette, G., and Bremner, T., (1987), “Durability of concrete
containing supplementary cementing materials in marine environment” SP-100-
63, pp. 1227-1258..
Moreira, P. M., Aguiar, J. B., and Camoes, A., (2006), “Systems for superficial
protection of concretes”, International Symposium Polymers in Concrete,
University of Minho, Portugal pp. 225– 236.

Chapter Five 84
Nehdi, M., and Hayek, M., (2005), “Behavior of blended and cement mortars exposed
to sulfate solutions cycling in relative humidity”, Cement and Concrete
Research, Vol. 35, No. 4, pp. 731-742.
Radlinska, A., McCarthy, L., Yost, J., Matzke, J. and Nagel, F. (2012), “ Coatings
and treatments for beam ends,” Final Technical Report, FHWA-PA-2012-002-
100402, Pennsylvania Department of Transportation, 134 p.
Scherer, G. W., (2004), “Stress from crystallization of salt”, Cement and Concrete
Research, Vol. 34, No. 9, pp.1613– 1624.
Stark, D., (1989), “Durability of concrete is sulfate-rich soils”, Research and
Development Bulletin, Portland Cement Association, Vol. RD097, 19p.
Swamy, R. N., Suryavanshi, A. K. and Tanikawa, S., (1998), “Protective ability of an
acrylic-based surface coating system against chloride and carbonation
penetration into concrete”, ACI Materials Journal, Vol. 95, No. 2, pp.101– 112.
Tsui, N., Flatt, R. J., and Scherer, G. W., (2003), “Crystallization damage by sodium
sulfate”, Journal of Cultural Heritage, Vol. 4, No. 2, pp. 109-115.
Villegas, R., Vale, J. F., (1993), “Evaluation of water repellent treatments applied to
stones used in andalusian cathedrals. II. Salt crystallization test”, Materials De
Construction , Vol. 43, No. 230, pp. 5-13.
Vipulanandan, M., Parihar, A., Issac, M., (2011), “Testing and modeling composite
coatings with silanes for protecting reinforced concrete in saltwater
Environment”, Jouranl of Materials in Civil Engineering, Vol. 23, No. 12,
pp.1602– 1608.
Yoshida, N., Matsunami, Y., Nagayama, M., and Sakai, E., (2010), “Salt weathering
in residential concrete foundation exposed to sulfate-bearing ground”, Journal
of Advanced Concrete, Vol. 8, No. 2, pp. 121-134.
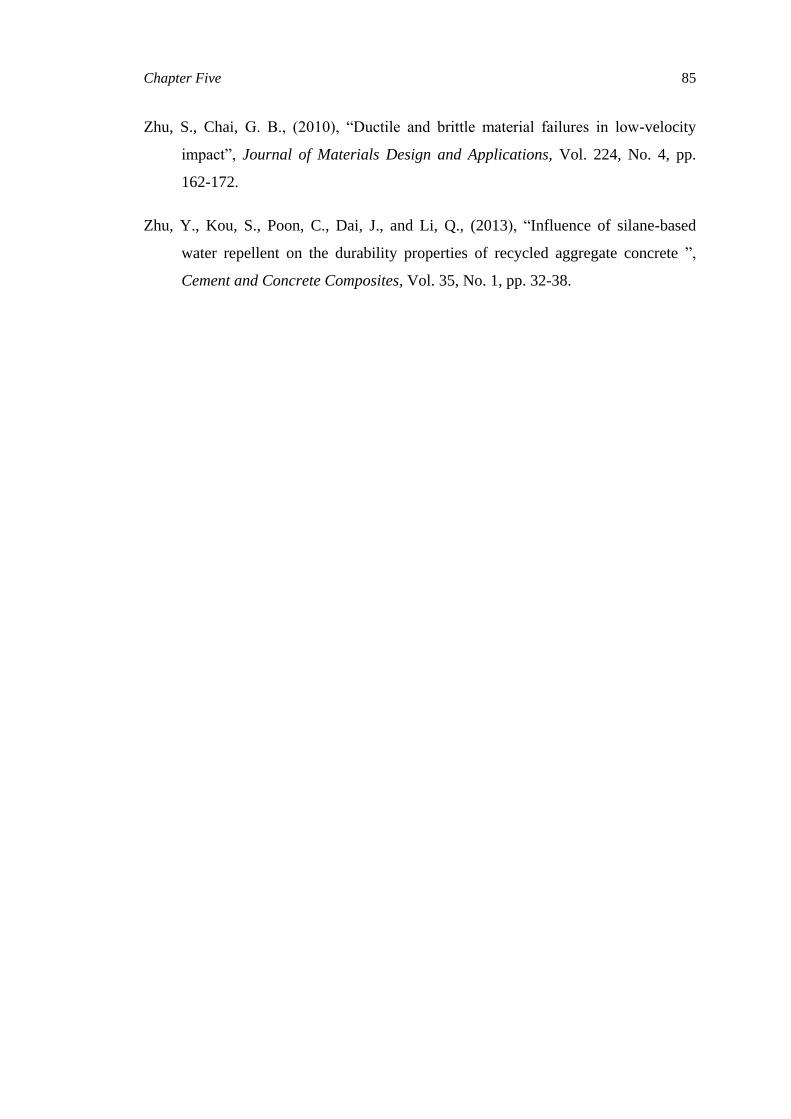
Chapter Five 85
Zhu, S., Chai, G. B., (2010), “Ductile and brittle material failures in low-velocity
impact”, Journal of Materials Design and Applications, Vol. 224, No. 4, pp.
162-172.
Zhu, Y., Kou, S., Poon, C., Dai, J., and Li, Q., (2013), “Influence of silane-based
water repellent on the durability properties of recycled aggregate concrete ”,
Cement and Concrete Composites, Vol. 35, No. 1, pp. 32-38.
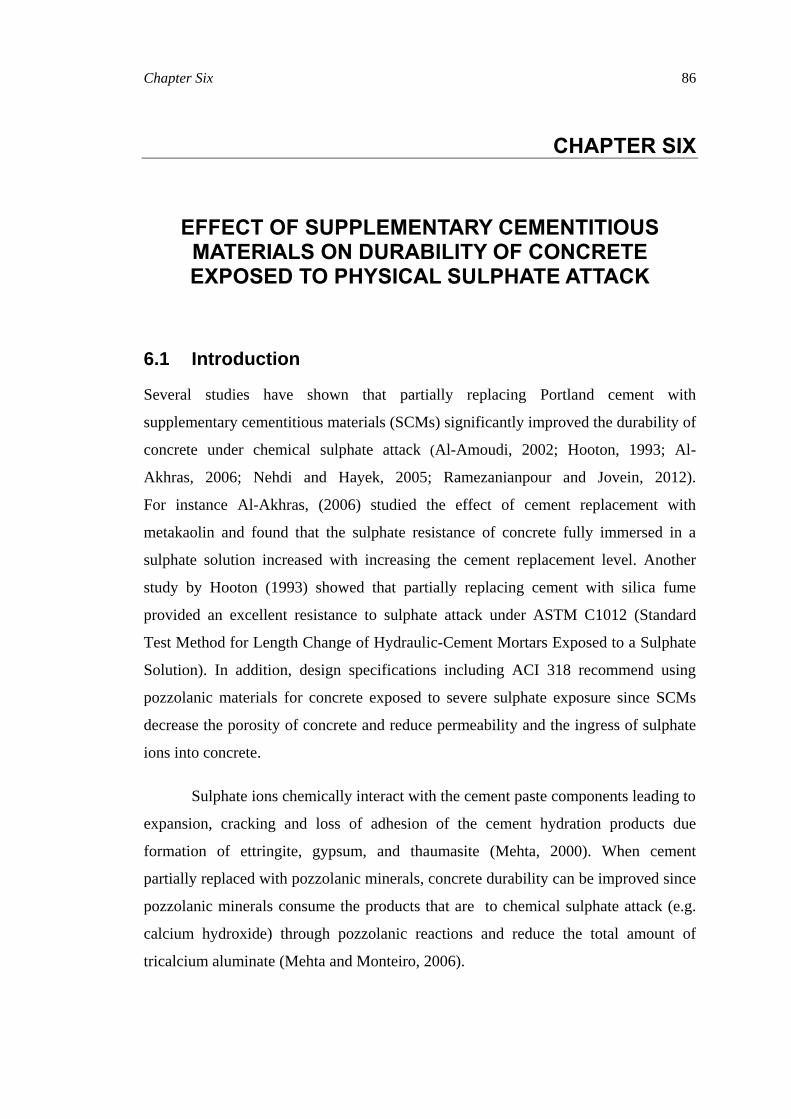
Chapter Six 86
CHAPTER SIX
6 EFFECT OF SUPPLEMENTARY CEMENTITIOUS MATERIALS ON DURABILITY OF CONCRETE EXPOSED TO PHYSICAL SULPHATE ATTACK
6.1 Introduction
Several studies have shown that partially replacing Portland cement with
supplementary cementitious materials (SCMs) significantly improved the durability of
concrete under chemical sulphate attack (Al-Amoudi, 2002; Hooton, 1993; Al-
Akhras, 2006; Nehdi and Hayek, 2005; Ramezanianpour and Jovein, 2012).
For instance Al-Akhras, (2006) studied the effect of cement replacement with
metakaolin and found that the sulphate resistance of concrete fully immersed in a
sulphate solution increased with increasing the cement replacement level. Another
study by Hooton (1993) showed that partially replacing cement with silica fume
provided an excellent resistance to sulphate attack under ASTM C1012 (Standard
Test Method for Length Change of Hydraulic-Cement Mortars Exposed to a Sulphate
Solution). In addition, design specifications including ACI 318 recommend using
pozzolanic materials for concrete exposed to severe sulphate exposure since SCMs
decrease the porosity of concrete and reduce permeability and the ingress of sulphate
ions into concrete.
Sulphate ions chemically interact with the cement paste components leading to
expansion, cracking and loss of adhesion of the cement hydration products due
formation of ettringite, gypsum, and thaumasite (Mehta, 2000). When cement
partially replaced with pozzolanic minerals, concrete durability can be improved since
pozzolanic minerals consume the products that are to chemical sulphate attack (e.g.
calcium hydroxide) through pozzolanic reactions and reduce the total amount of
tricalcium aluminate (Mehta and Monteiro, 2006).

Chapter Six 87
However, the effect of SCMs in concrete exposed to physical sulphate attack
is controversial. Indeed, there are only limited studies which investigated the
performance of concrete when exposed to an environment prone to physical sulphate
attack. Therefore, in the present chapter, the influence of using different types and
percentages of pozzolanic minerals on the deterioration of concrete due to physical
sulphate attack was explored.
6.2 Experimental Program
6.2.1 Materials and Specimen Preparation
Thirteen concrete mixtures were prepared according to ACI 211.1 to investigate the
influence of cement replacement with pozzolanic minerals on the physical sulphate
attack. The proportions of the concrete mixtures are provided in Table 6.1.
Table 6.1: Proportions of tested concrete mixtures.
Mixture # Binder
Cement
Content
(kg/m3)
Pozzolanic
Content (kg/
m3)
Aggregate Content
(kg/m3)
Coarse Fine
1 OPC 350 0 1110 804
2
OPC + FA
332.5 17.5
1110
784
3 315.0 35.0 763
4 297.5 52.5 745
5 280.0 70.0 780
6
OPC + SF
332.5 17.5
1110
779
7 315.0 35.0 750
8 297.5 52.5 740
9 280.0 70.0 735
10
OPC + MK
332.5 17.5
1110
791
11 315.0 35.0 740
12 297.5 52.5 730
13 280.0 70.0 719
For each of the thirteen concrete mixtures, standard cylinders 100×200 mm (4×8 in.)
were cast according to ASTM C192 (Standard Practice for Making and Curing
Concrete Test Specimens in the Laboratory). Concrete cylinders from each concrete
mixture were cured for 28 days in a moist room at RH ≥ 95% and T = 20°C [68°F]
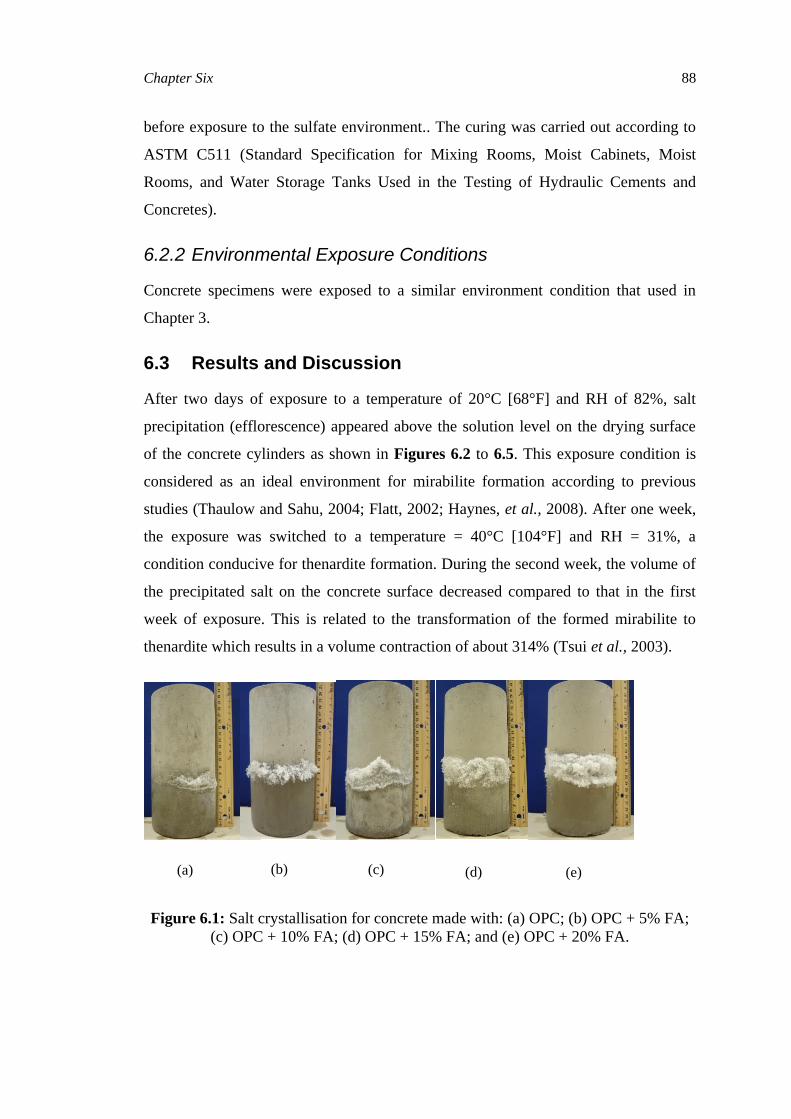
Chapter Six 88
before exposure to the sulfate environment.. The curing was carried out according to
ASTM C511 (Standard Specification for Mixing Rooms, Moist Cabinets, Moist
Rooms, and Water Storage Tanks Used in the Testing of Hydraulic Cements and
Concretes).
6.2.2 Environmental Exposure Conditions
Concrete specimens were exposed to a similar environment condition that used in
Chapter 3.
6.3 Results and Discussion
After two days of exposure to a temperature of 20°C [68°F] and RH of 82%, salt
precipitation (efflorescence) appeared above the solution level on the drying surface
of the concrete cylinders as shown in Figures 6.2 to 6.5. This exposure condition is
considered as an ideal environment for mirabilite formation according to previous
studies (Thaulow and Sahu, 2004; Flatt, 2002; Haynes, et al., 2008). After one week,
the exposure was switched to a temperature = 40°C [104°F] and RH = 31%, a
condition conducive for thenardite formation. During the second week, the volume of
the precipitated salt on the concrete surface decreased compared to that in the first
week of exposure. This is related to the transformation of the formed mirabilite to
thenardite which results in a volume contraction of about 314% (Tsui et al., 2003).
Figure 6.1: Salt crystallisation for concrete made with: (a) OPC; (b) OPC + 5% FA;
(c) OPC + 10% FA; (d) OPC + 15% FA; and (e) OPC + 20% FA.
(a) (b) (c) (d) (e)
Chapter Six 89
Figure 6.2: Salt crystallisation for concrete made with: (a) OPC; (b) OPC + 5% MK;
(c) OPC + 10% MK; (d) OPC + 15% MK; and (e) OPC + 20% MK.
Figure 6.3: Salt crystallisation for concrete made with: (a) OPC; (b) OPC + 5% SF;
(c) OPC + 10% SF; (d) OPC + 15% SF; and (e) OPC + 20% SF.
The exposure was continued for up to six months (24 cycles of wetting and
drying) and all concrete cylinders were inspected to diagnose the level of damage. For
all tested cylinders, the portion of concrete immersed in the sulphate solution was
found in intact condition compared with the damaged above solution part. Figures
6.5, 6.6, and 6.7 show the typical concrete damage above the solution level.
(a) (b) (c) (d) (e)
(a) (b) (c) (d) (e)

Chapter Six 90
Figure 6.4: Damage due to salt crystallisation for concrete made with:
(a) OPC; (b) OPC + 5% FA; (c) OPC + 10% FA; (d) OPC + 15% FA;
and (e) OPC + 20% FA.
Figure 6.5: Damage due to salt crystallisation for concrete made with:
(a) OPC; (b) OPC + 5% MK; (c) OPC + 10% MK; (d) OPC + 15% MK;
and (e) OPC + 20% MK.
(a) (b) (c) (d) (e)
(a) (b) (c) (d) (e)

Chapter Six 91
Figure 6.6: Damage due to salt crystallisation for concrete made with:
(a) OPC; (b) OPC + 5% SF; (c) OPC + 10% SF; (d) OPC + 15% SF;
and (e) OPC + 20% SF.
The mass loss was monitored for all concrete cylinders that have been partially
immersed in the sodium sulphate solution and exposed to cyclic temperature and RH.
Figures 6.8, 6.9, and 6.10, illustrate the mass loss after 6 months of exposure to
physical sulphate attack. The mass loss occurred due to scaling of the concrete surface
above the solution level. The immersed portion of concrete into the sodium sulphate
solution was mostly in intact condition. Both the surface scaling and mass loss
increased with increasing the partial replacement level of cement by pozzolanic
minerals.
(a) (b) (c) (d) (e)
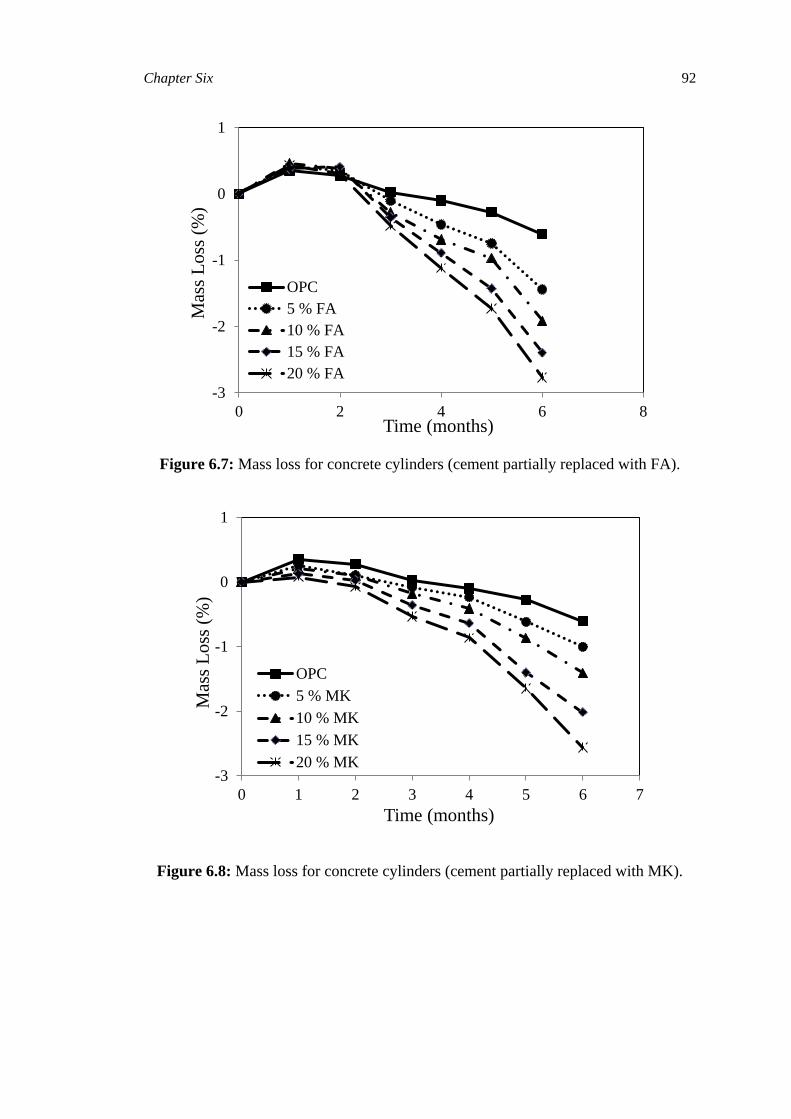
Chapter Six 92
Figure 6.7: Mass loss for concrete cylinders (cement partially replaced with FA).
Figure 6.8: Mass loss for concrete cylinders (cement partially replaced with MK).
-3
-2
-1
0
1
0 2 4 6 8
Mas
s L
oss
(%
)
Time (months)
OPC
5 % FA
10 % FA
15 % FA
20 % FA
-3
-2
-1
0
1
0 1 2 3 4 5 6 7
Mas
s L
oss
(%
)
Time (months)
OPC
5 % MK
10 % MK
15 % MK
20 % MK
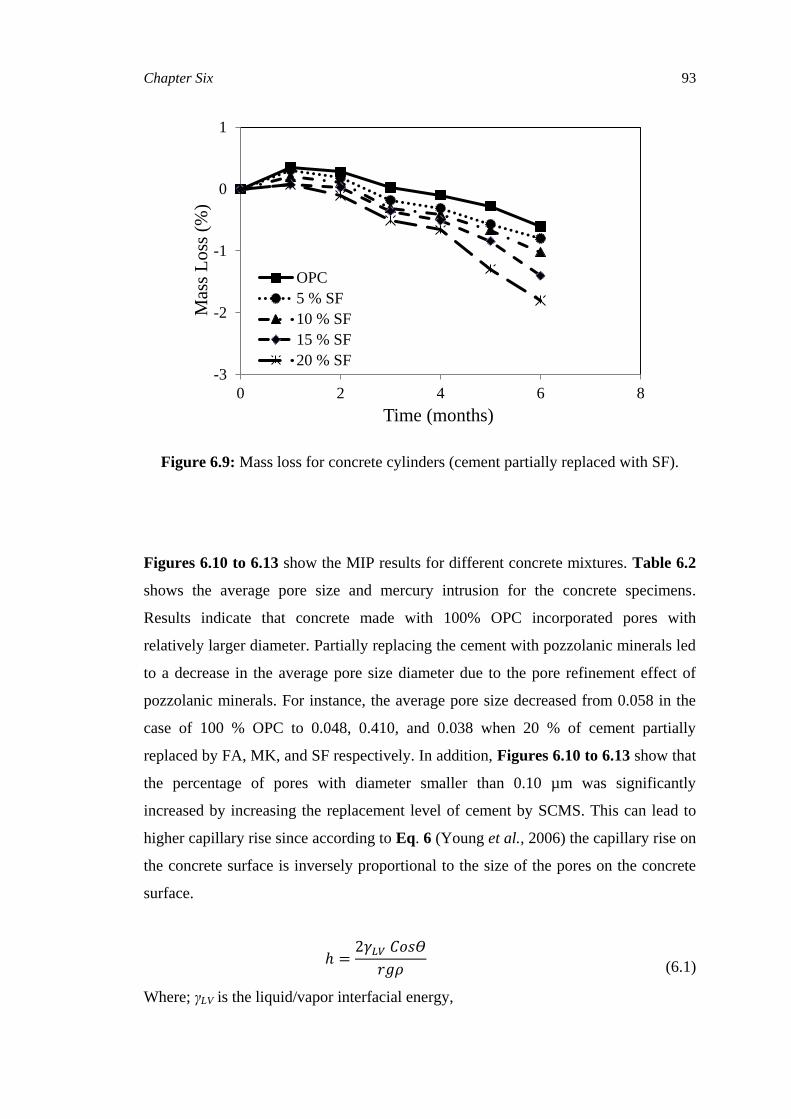
Chapter Six 93
Figure 6.9: Mass loss for concrete cylinders (cement partially replaced with SF).
Figures 6.10 to 6.13 show the MIP results for different concrete mixtures. Table 6.2
shows the average pore size and mercury intrusion for the concrete specimens.
Results indicate that concrete made with 100% OPC incorporated pores with
relatively larger diameter. Partially replacing the cement with pozzolanic minerals led
to a decrease in the average pore size diameter due to the pore refinement effect of
pozzolanic minerals. For instance, the average pore size decreased from 0.058 in the
case of 100 % OPC to 0.048, 0.410, and 0.038 when 20 % of cement partially
replaced by FA, MK, and SF respectively. In addition, Figures 6.10 to 6.13 show that
the percentage of pores with diameter smaller than 0.10 µm was significantly
increased by increasing the replacement level of cement by SCMS. This can lead to
higher capillary rise since according to Eq. 6 (Young et al., 2006) the capillary rise on
the concrete surface is inversely proportional to the size of the pores on the concrete
surface.
(6.1)
Where; γLV is the liquid/vapor interfacial energy,
-3
-2
-1
0
1
0 2 4 6 8
Mas
s L
oss
(%
)
Time (months)
OPC
5 % SF
10 % SF
15 % SF
20 % SF

Chapter Six 94
ϴ is the contact angle,
r is the pore radius,
g is the gravitational acceleration, and ρ is the density of the solution.
The surface of concrete above the solution level is exposed to evaporation, which
creates super-saturation of the sodium sulphate solution (Scherer, 2004). By
increasing the capillary height, a larger amount of the solution can be exposed to
evaporation, leading to higher supersaturation. Therefore, crystals can exert higher
stress than in the case of less capillary rise, leading to larger damage and mass loss of
the concrete above the solution level. According to Thaulow and Sahu (2004), crystals
that grow from only a saturated condition cannot exert sufficient pressure to disrupt
the concrete pores. However, in the case of supersaturation, crystals can grow and
exert higher pressure, leading to greater damage. The degree of the supersaturation
depends on several factors including evaporation, the rate of solution supply, and the
type of salt (Scherer, 2004). Evaporation can increase the degree of the
supersaturation since more crystals can grow compared with the saturated condition.
Higher damage occurred in the case of partially replacing Portland cement
with fly ash than in the case of using metakaolin and silica fume, respectively.
According to Uchikawa (1986), partially replacing cement with fly ash can delay
cement hydration reactions since fly ash absorbs calcium Ca2+
ions; unlike silica
fume, which accelerates the hydration and increases the concrete solid volume at
early-age. Therefore, higher pores connectivity can be expected for the concrete
incorporating fly ash at the beginning of the exposure, thus leading to higher capillary
rise. This is demonstrated by MIP results, which showed higher intrusion volume of
mercury in the case of concrete incorporating fly ash than in the case of concrete
made with silica fume or metakaolin.

Chapter Six 95
Figure 6.10: MIP results for concrete mixtures before exposure to physical sulphate
attack (OPC and OPC + FA).
Figure 6.11: MIP results for concrete mixtures before exposure to physical sulphate
attack (OPC and OPC + MK).
0
0.02
0.04
0.06
0.08
0.001 0.01 0.1 1 10
Incr
emet
al p
ore
volu
me
(mL
/g)
ore e ameter (m)
OC
5% FA
10% FA
15 % FA
20 % FA
0
0.02
0.04
0.06
0.08
0.001 0.01 0.1 1 10
Incr
emet
al p
ore
volu
me
(mL
/g)
ore e ameter (m)
OC5% MK10% MK15 % MK20 % MK
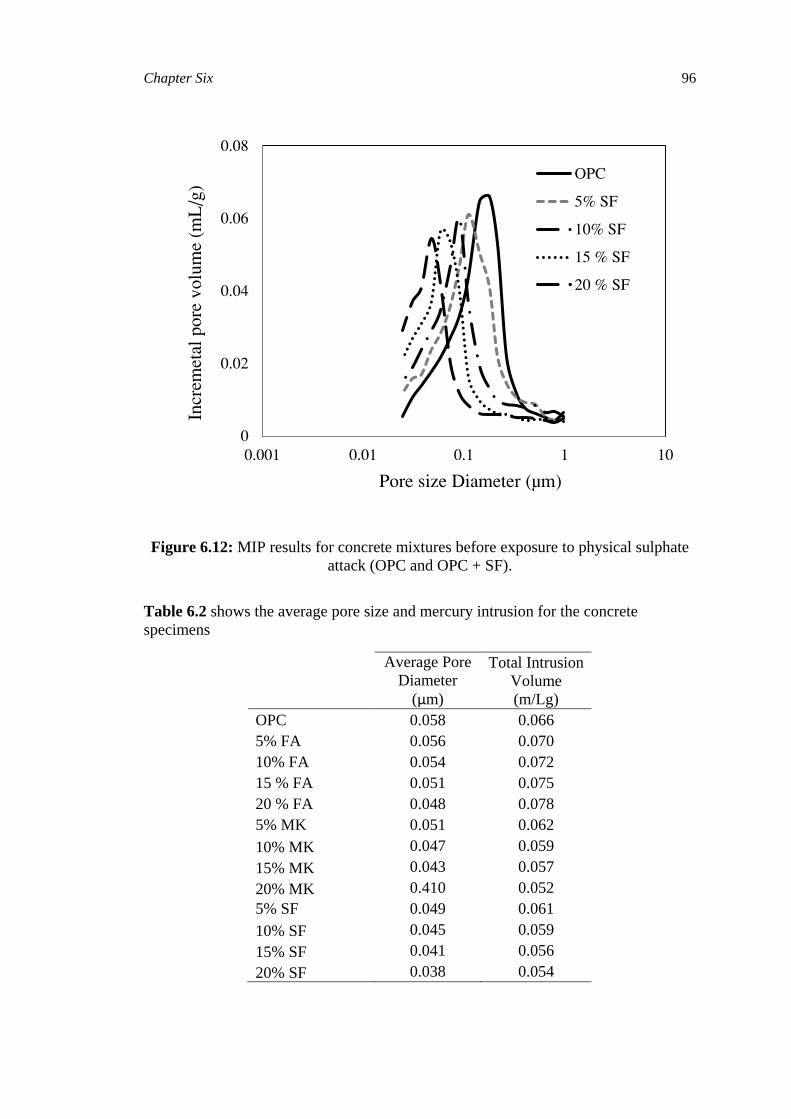
Chapter Six 96
Figure 6.12: MIP results for concrete mixtures before exposure to physical sulphate
attack (OPC and OPC + SF).
Table 6.2 shows the average pore size and mercury intrusion for the concrete
specimens
Average Pore
Diameter
(µm)
Total Intrusion
Volume
(m/Lg)
OPC 0.058 0.066
5% FA 0.056 0.070
10% FA 0.054 0.072
15 % FA 0.051 0.075
20 % FA 0.048 0.078
5% MK 0.051 0.062
10% MK 0.047 0.059
15% MK 0.043 0.057
20% MK 0.410 0.052
5% SF 0.049 0.061
10% SF 0.045 0.059
15% SF 0.041 0.056
20% SF 0.038 0.054
0
0.02
0.04
0.06
0.08
0.001 0.01 0.1 1 10
Incr
emet
al p
ore
volu
me
(mL
/g)
ore e ameter (m)
OC
5% SF
10% SF
15 % SF
20 % SF
Chapter Six 97
The results show that the vulnerability of concrete to damage by physical salt
weathering depends on its pore structure, which is similar to stones. Previous studies
have shown that stones with higher volume of connected small pores are the most
vulnerable to damage by salt crystallization (Wellman and Wilson, 1965; Angeli et al,
2008; Navarro and Doehne, 1999). The presence of small pores increases the capillary
rise and the surface area of evaporation, leading to higher supersaturation of the pore
solution and subsequently more damage (Navarro and Doehne, 1999).
6.4 Conclusions
This experimental study shows that partially replacing portland cement with
pozzolanic minerals can be a disadvantage under physical sulphate attack since the
damage was intensified by increasing the percentage of cement replacement, unlike in
the case of concrete exposed to chemical sulphate attack. Therefore, current standards
and specifications should reconsider the use of the pozzolanic minerals in concrete
exposed to severe sulphate environments characterized by cycling temperature and
relative humidity and prone to physical sulphate attack.

Chapter Six 98
6.5 References
Al-Amoudi, O. S. B., (2002), “Attack on plain and blended cement exposed to
aggressive sulfate environment”, Cement and Concrete Composites, Vol. 24,
No. 3, pp. 305-316.
Angeli, M., Benavente, D., Bigas, J., Menendez, B., Hebert, R., David, C., (2008),
“Modification of the porous network by salt crystallization in experimentally
weathered sedimentary stones”, Materials and Structures, Vol. 41, No. 6, pp.
1091-1108.
Al-Akhras, N. M., (2006), “Durability of metakaolin concrete to sulfate attack ,”
Cement and Concrete Research, Vol. 36, No. 9, pp. 1727-1734.
ASTM C511., (2009), Standard Specification for Mixing Rooms, Moist Cabinets,
Moist Rooms, and Water Storage Tanks Used in the Testing of Hydraulic
Cements and Concretes, American Society for Testing and Materials ,West
Conshohocken, PA.
ASTM D4404., (2010), Standard Test Method for Determination of Pore Volume and
Pore Volume Distribution of Soil and Rock by Mercury Intrusion Porosimetry,
American Society for Testing and Materials ,West Conshohocken, PA.
ASTM C1012, (2009), Standard Test Method for Length Change of Hydraulic-
Cement Mortars Exposed to a Sulfate Solution, American Society for Testing
and Materials, West Conshohocken, PA.
ASTM C192, (2009), Standard Practice for Making and Curing Concrete Test
Specimens in the Laboratory, American Society for Testing and Materials,
West Conshohocken, PA.
Buj, O., and Gisbert, J., (2010), “Influence of pore morphology on the durability of
sedimentary building stones from Aragon (Spain) subjected to standard salt
decay tests”, Environment Health Sicence,Vol. 61, No. 7, pp. 1327-1336.
Flatt, R. J., (2002), “Salt damage in porous materials: how high supersaturations are
generated”, Journal of Crystal Growth, Vol. 242, No. 3-4, pp. 435-454.
Chapter Six 99
Haynes, H., O’Neill, R., and Mehta, P. K. (1996), “Concrete deterioration from
physical attack by salts”, Concrete International, Vol. 18, No. 1, pp. 63-68.
Haynes, H., O’Neill, R., Neff, M. and Mehta, P. K. (2008), “Salt weathering distress
on concrete exposed to sodium sulfate environment”, ACI Materials Journal,
Vol. 105, No. 1, pp. 35-43.
Haynes, H., O’Neill, R., Neff, M. and Mehta, P. K. (2010), “Salt weathering of
concrete by sodium carbonate and soduim chloride”, ACI Materials Journal,
Vol. 107, No. 3, pp. 258-266.
Hooton, R. D. (1993) “ Influence of silica fume replacement of cement on physical
properties and resistance of sulfate attack, freezing and thawing, and alkali-
silica reactivity”, ACI Materials Journal, Vol. 90, No. 2, pp. 143-151.
Mehta, P. K., (2000), “Sulfate attack on concrete: Separating myths from reality”,
Concrete International, Vol. 22, No. 8, pp. 57-61.
Mehta, P. K., and Monteiro, P. J. M., (2006), Concrete Microstructure, Properties, and
Materials”, McGraw-Hill, Third Edition, 659 p.
Navarroa, C. R., and Doehnea, E., (1999), “Salt weathering: influence of evaporation
rate, supersaturation, and crystallization pattern”, Earth Surface Processes and
Landforms, Vol. 24, No. 3, pp. 191-209.
Nehdi, M., and Hayek, M., (2005), “Behavior of blended cement mortars exposed to
sulfate solutions cycling in relative humidity”, Cement and Concrete Research,
Vol. 35, No. 4, pp. 731-742.
Duan, P., Shui, Z., Chen, W., and Shen, C., (2013), “Effects of metakaolin, silica
fume and slag on pore structure, interfacialtransition zone and compressive
strength of concrete”, Construction and Building Material, Vol. 44, pp. 1-6.
Ramezanianpour, A. A, and Jovein, H. B., (2012), “Influence of metakaolin as
supplementary cementing material on strength and durability of concretes”,
Construction and Building materials , Vol. 30, pp. 470-479.

Chapter Six 100
Santhanam, M., Cohen, MD., Olek, J., (2001), “Sulfate attack research – whither
now?”, Cement and Concrete Research, Vol. 31, No. 6, pp. 845-51
Scherer, G. W., (2004), “Stress from crystallization of salt”, Cement and Concrete
Research, Vol. 34, No. 9, pp. 1613– 1624.
Thaulow, N., Sahu, S., (2004), “Mechanism of concrete deterioration due to salt
crystallization”, Materials Characterization, Vol. 53, No. 2-4, pp. 123-127.
Tsui, N., Flatt, R. J., and Scherer, G. W., (2003), “Crystallization damage by sodium
sulfate”, Journal of Cultural Heritage, Vol. 4, No. 2, pp. 109-115.
Uchikawa, H. (1989), “Similarities and discrepancies of hardened cement paste,
mortar and concrete for concrete from the standpoint of composition and
structure”, Advances in Cement Manufacture and Use, Engineering Foundation,
N. Y., pp.271-294.
Wellman, H. W., and Wilson, A. T., (1965), “Salt weathering, a neglected geological
erosive agent in coastal and arid environments”, Nature, Vol. 205, pp.1097-
1098.
Young, F. J., Sidney, M., Robert, G., and Arnon, B., (2006), “The science and
technology of civil engineering materials”, Chinese Architecture and Building
Press. 384p.

Chapter Seven 101
CHAPTER SEVEN
7 CONCLUSIONS AND RECOMMENDATIONS
7.1 Summary and Conclusions
Since the last century, several studies and investigations have focused on the
performance of concrete under chemical sulphate attack. This has led to establishing
specifications and standards that mainly address the behaviour of concrete when
exposed to chemical sulphate attack. However, the durability of concrete exposed to
physical sulphate attack has been generally ignored and confused, in some occasions,
with chemical sulphate attack.
Chapter 2 of the current thesis showed that the lack of information regarding
the deterioration of concrete due to physical sulphate attack has led to confusion and
contradictory views. In addition, previous studies have recommended further research
to understand the real distress mechanisms associated with physical sulphate attack
and how it is affected by the w/cm, mineral additions, and other mixture parameters of
concrete, especially under field conditions.
Chapters 3 and 4 showed that concrete partially immersed in a sodium
sulphate solution can experience dual sulphate attack. The lower portion immersed in
the sodium sulphate solution can suffer from chemical sulphate attack, while the
upper portion can be vulnerable to physical sulphate attack. In addition, relatively
high damage due to physical sulphate attack did not affect both the concrete
compressive strength and modulus of elasticity since the damage was limited to the
external surface of the concrete specimens. The damage was mainly controlled by the
pore structure of the concrete surface. It was found that lowering the w/b ratio and
better curing the concrete reduced the surface scaling above the solution level since
the volume of the pores was decreased. Although, partially replacing portland cement
with pozzolanic minerals also led to decreased porosity, surface scaling in concrete

Chapter Seven 102
incorporating pozzolanic minerals was increased due to the increase in the volume of
pores having a very small diameter.
In Chapter 5, the effectiveness of different commercially available surface
treatment materials in mitigating physical sulphate attack on concrete was
investigated. It was found that using epoxy or silane based surface treatment materials
provided adequate protection for both cured and non-cured concrete exposed to
physical sulphate attack. Epoxy coating provides a thick membrane on the concrete
surface that mitigates capillary suction and prevents salt crystals from precipitating in
the subefflorescence zone where they can exert pressure within the concrete pores,
thus reducing damage. Conversely, silane coating penetrates the concrete surface and
chemically reacts within the concrete pores, providing molecules that perform as a
water repellent, which reduces capillary suction and salt crystallization.
Using bitumen based coating provided protection for the cured concrete
specimens. However, in the case of non-cured concrete specimens with high w/c, the
bitumen layer separated from the concrete surface since water molecules were
entrapped between the bitumen coating layer and the substrate, leading to
emulsification of the bitumen and its separation. Moreover, using a water-based
acrylic coating did not provide protection to both the cured and non-cured concrete
specimens exposed to physical sulphate attack since the acrylic solution partially
filled the concrete surface pores, allowing salt crystals to grow and damage the acrylic
film. In addition, acrylic is a relatively brittle material, which compromises its ability
to withstand strains generated by salt crystallization.
Previous studies have shown that increasing the level of cement replacement
by pozzolanic minerals can improve the overall concrete performance when exposed
to harsh environments. However, chapter six showed that under physical sulphate
attack, increasing the dosage of pozzolanic minerals can intensify the damage of
concrete under physical sulphate attack due to the refinement of the concrete pore
structure. Thus, higher capillary rise and salt crystallization can occur on the concrete
surface leading to greater damage.
Chapter Seven 103
7.2 Recommendations for Future Work
1- The current thesis showed that the damage of the concrete surface due to physical
sulphate attack is a result of capillary rise and salt crystallization, which applies
tensile pressures, thus disrupting the concrete pores and leading to damage. It is
believed that using steel or carbon fibres may improve the performance of concrete
under physical sulphate attack since fibers increase the tensile strength of concrete.
Therefore, the effect of fiber reinforcement of concrete should be explored.
2- It is recommended for future study to investigate the effect of using air entrainment
in concrete exposed to physical sulphate attack since previous studies have shown that
it is beneficial when used in concrete exposed to freezing and thawing conditions.
3- It is believed that laboratory studies on physical sulphate attack may not fully
replicate in-situ behaviours and capture the actual performance of various concrete
mixtures under different temperature and relative humidity scenarios. Therefore, it is
recommended to validate the results of this study in actual field exposure, particularly
with regards to the effects of various surface treatment materials.

Appendix A 104
APPENDIX A
Table A.1 : MIP for concrete made with OPC, w/b = 0.60 non-cured specimen
Pore size Diameter (µm) Cumulative Intrusion (mL/g)
10.68962656 0.001641069
8.5482875 0.00184754
8.127660156 0.00235651
5.122174609 0.002674321
4.558923047 0.002976581
3.759320313 0.004478132
3.00187793 0.00625155
2.439073047 0.007708288
1.904393359 0.009677779
1.555443164 0.010131542
1.238558594 0.009608595
0.987314258 0.009741948
0.799874316 0.010730909
0.653170166 0.012120355
0.511439209 0.016663613
0.411512012 0.029229445
0.33495249 0.054995898
0.267418921 0.090622787
0.216033008 0.072033927
0.178204993 0.066675864
0.142486438 0.058773965
0.112441699 0.051391393
0.090922711 0.044718858
0.073667346 0.039750367
0.05935365 0.034933951
0.04755047 0.029048335
0.038201419 0.024494478
0.030993152 0.022124218
0.024871104 0.018220557
0.020159554 0.015850034
0.016188129 0.01465017
0.014435521 0.013012164
0.013030496 0.010179879
0.010681042 0.009094027

Appendix A 105
Table A.2 : MIP for concrete made with 25% fly Ash, w/b = 0.60 non-cured specimen
Pore size Diameter (µm) Cumulative Intrusion (mL/g)
10.68962656 0.00181025
8.5482875 0.00125426
8.127660156 0.00193468
5.122174609 0.00128487
4.558923047 0.00134407
3.759320313 0.00158424
3.00187793 0.002441147
2.439073047 0.002400236
1.904393359 0.001894118
1.555443164 0.001799629
1.238558594 0.001663517
0.987314258 0.001929845
0.799874316 0.002399094
0.653170166 0.002673026
0.511439209 0.004155803
0.411512012 0.00801967
0.33495249 0.013307532
0.267418921 0.01793614
0.216033008 0.019428909
0.178204993 0.022554897
0.142486438 0.036276177
0.112441699 0.071235843
0.090922711 0.092067221
0.073667346 0.059727982
0.05935365 0.054845877
0.04755047 0.05517073
0.038201419 0.055633962
0.030993152 0.055086631
0.024871104 0.04892052
0.020159554 0.040186539
0.016188129 0.030749338
0.014435521 0.026129704
0.013030496 0.022271624
0.010681042 0.016812073
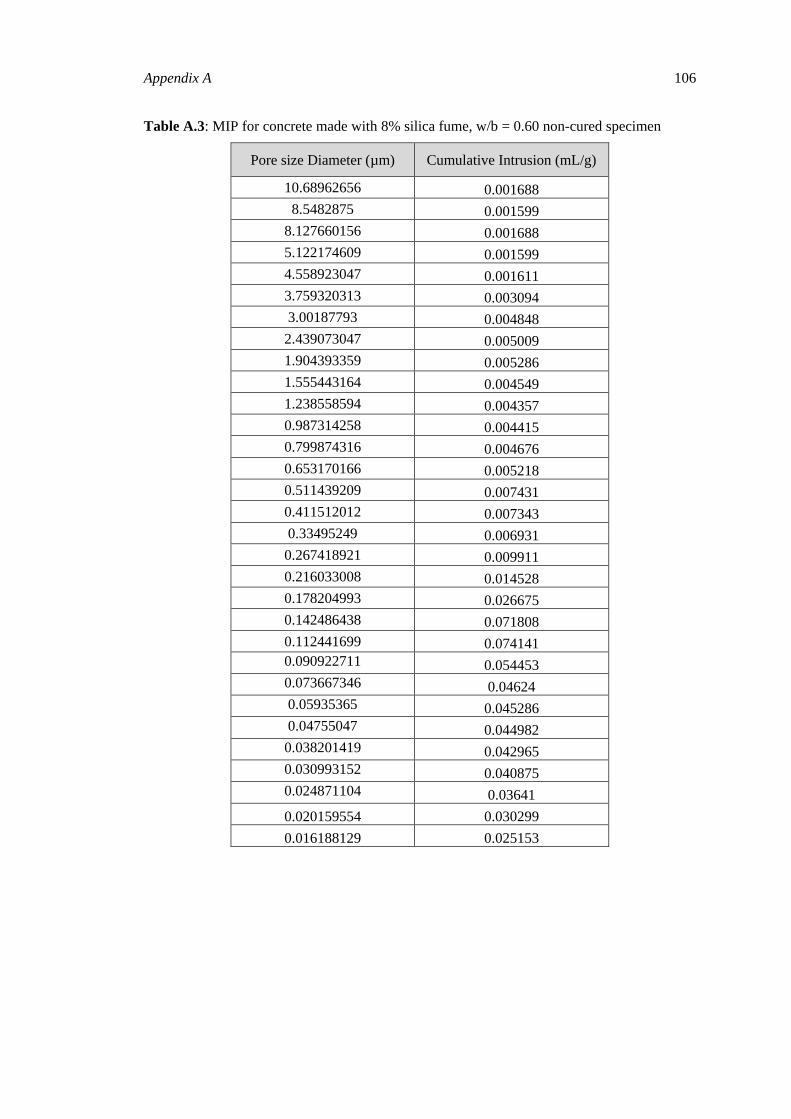
Appendix A 106
Table A.3: MIP for concrete made with 8% silica fume, w/b = 0.60 non-cured specimen
Pore size Diameter (µm) Cumulative Intrusion (mL/g)
10.68962656 0.001688
8.5482875 0.001599
8.127660156 0.001688
5.122174609 0.001599
4.558923047 0.001611
3.759320313 0.003094
3.00187793 0.004848
2.439073047 0.005009
1.904393359 0.005286
1.555443164 0.004549
1.238558594 0.004357
0.987314258 0.004415
0.799874316 0.004676
0.653170166 0.005218
0.511439209 0.007431
0.411512012 0.007343
0.33495249 0.006931
0.267418921 0.009911
0.216033008 0.014528
0.178204993 0.026675
0.142486438 0.071808
0.112441699 0.074141
0.090922711 0.054453
0.073667346 0.04624
0.05935365 0.045286
0.04755047 0.044982
0.038201419 0.042965
0.030993152 0.040875
0.024871104 0.03641
0.020159554 0.030299
0.016188129 0.025153

Appendix A 107
Table A.4: MIP for concrete made with 8% metakaolin w/b = 0.60 non-cured specimen
Pore size Diameter (µm) Cumulative Intrusion (mL/g)
10.68962656 0.001525
8.5482875 0.001437
8.127660156 0.001525
5.122174609 0.001437
4.558923047 0.001508
3.759320313 0.001833
3.00187793 0.002202
2.439073047 0.003331
1.904393359 0.003817
1.555443164 0.002533
1.238558594 0.002053
0.987314258 0.002399
0.799874316 0.002045
0.653170166 0.001397
0.511439209 0.001666
0.411512012 0.002008
0.33495249 0.002134
0.267418921 0.002833
0.216033008 0.005075
0.178204993 0.008419
0.142486438 0.023071
0.112441699 0.071655
0.090922711 0.076789
0.073667346 0.056769
0.05935365 0.042856
0.04755047 0.037024
0.038201419 0.031818
0.030993152 0.022169
0.024871104 0.018283
0.020159554 0.016478
0.016188129 0.012078

Appendix A 108
Table A.5: MIP for concrete made with HS, w/b = 0.60 non-cured specimen
Pore size Diameter (µm) Cumulative Intrusion (mL/g)
10.68962656 0.001657
8.5482875 0.001657
8.127660156 0.002787
5.122174609 0.001657
4.558923047 0.002787
3.759320313 0.004926
3.00187793 0.00651
2.439073047 0.008578
1.904393359 0.012981
1.555443164 0.018359
1.238558594 0.019562
0.987314258 0.014646
0.799874316 0.013829
0.653170166 0.017208
0.511439209 0.0264
0.411512012 0.043302
0.33495249 0.084699
0.267418921 0.060203
0.216033008 0.058677
0.178204993 0.054298
0.142486438 0.053398
0.112441699 0.052329
0.090922711 0.048732
0.073667346 0.0437
0.05935365 0.036447
0.04755047 0.032394
0.038201419 0.02772
0.030993152 0.022793
0.024871104 0.020352
0.020159554 0.018982
0.016188129 0.017718

Appendix A 109
Table A.6 : MIP for concrete made with OPC w/b = 0.60 cured specimen
Pore size Diameter (µm) Cumulative Intrusion (mL/g)
10.68962656 0.001098
8.5482875 0.001025
8.127660156 0.001178
5.122174609 0.001174
4.558923047 0.001129
3.759320313 0.001325
3.00187793 0.002344
2.439073047 0.003778
1.904393359 0.005541
1.555443164 0.006482
1.238558594 0.008358
0.987314258 0.006687
0.799874316 0.004241
0.653170166 0.00524
0.511439209 0.006154
0.411512012 0.007511
0.33495249 0.011646
0.267418921 0.021808
0.216033008 0.052972
0.178204993 0.066436
0.142486438 0.064734
0.112441699 0.044085
0.090922711 0.03334
0.073667346 0.027041
0.05935365 0.021657
0.04755047 0.017838
0.038201419 0.01383
0.030993152 0.01074
0.024871104 0.008263
0.020159554 0.007505
0.016188129 0.006969
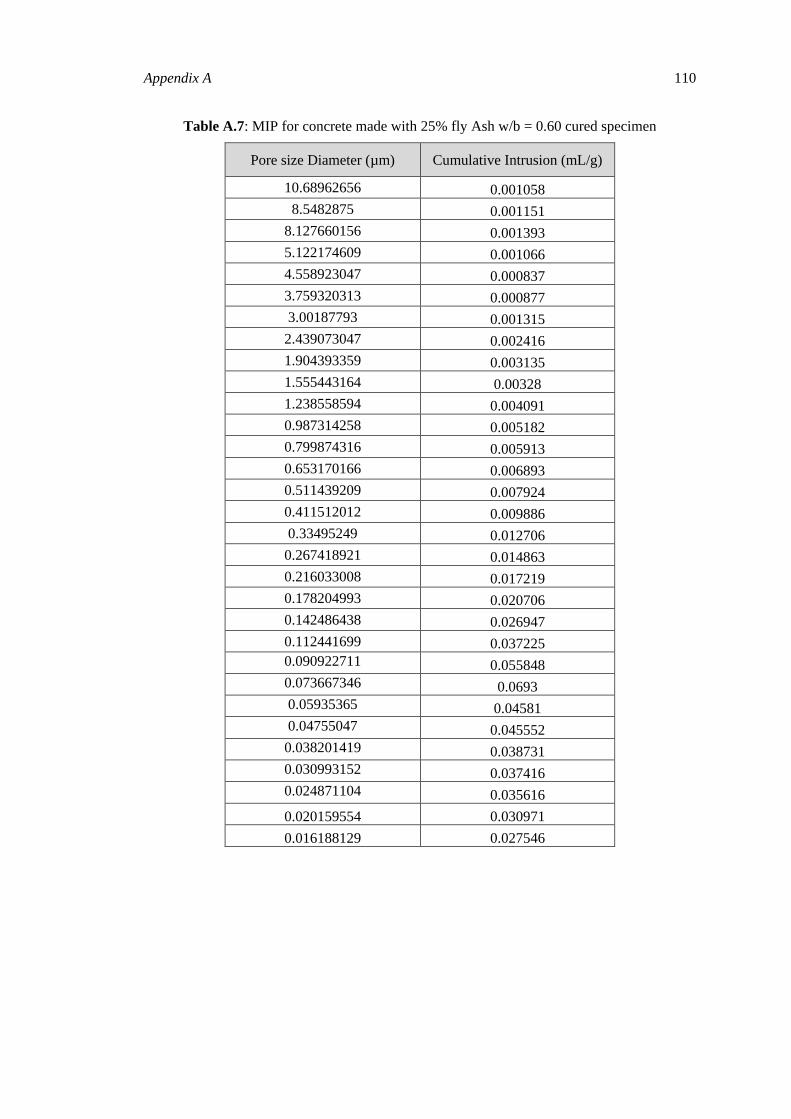
Appendix A 110
Table A.7: MIP for concrete made with 25% fly Ash w/b = 0.60 cured specimen
Pore size Diameter (µm) Cumulative Intrusion (mL/g)
10.68962656 0.001058
8.5482875 0.001151
8.127660156 0.001393
5.122174609 0.001066
4.558923047 0.000837
3.759320313 0.000877
3.00187793 0.001315
2.439073047 0.002416
1.904393359 0.003135
1.555443164 0.00328
1.238558594 0.004091
0.987314258 0.005182
0.799874316 0.005913
0.653170166 0.006893
0.511439209 0.007924
0.411512012 0.009886
0.33495249 0.012706
0.267418921 0.014863
0.216033008 0.017219
0.178204993 0.020706
0.142486438 0.026947
0.112441699 0.037225
0.090922711 0.055848
0.073667346 0.0693
0.05935365 0.04581
0.04755047 0.045552
0.038201419 0.038731
0.030993152 0.037416
0.024871104 0.035616
0.020159554 0.030971
0.016188129 0.027546

Appendix A 111
Table A.8: MIP for concrete made with 8% silica fume, w/b = 0.60 cured specimen
Pore size Diameter (µm) Cumulative Intrusion (mL/g)
10.68962656 0.000964
8.5482875 0.001172
8.127660156 0.00122
5.122174609 0.001116
4.558923047 0.001871
3.759320313 0.002237
3.00187793 0.00402
2.439073047 0.007705
1.904393359 0.006499
1.555443164 0.004151
1.238558594 0.0048
0.987314258 0.008123
0.799874316 0.011163
0.653170166 0.012005
0.511439209 0.012635
0.411512012 0.0157
0.33495249 0.017069
0.267418921 0.017543
0.216033008 0.021205
0.178204993 0.032276
0.142486438 0.04466
0.112441699 0.055353
0.090922711 0.051865
0.073667346 0.047066
0.05935365 0.035627
0.04755047 0.029715
0.038201419 0.024304
0.030993152 0.020655
0.024871104 0.019372
0.020159554 0.018352
0.016188129 0.016148

Appendix A 112
Table A.9 : MIP for 8% metakaolin w/b = 0.60 cured specimen
Pore size Diameter (µm) Cumulative Intrusion (mL/g)
10.68962656 0.003017
8.5482875 0.003694
8.127660156 0.003493
5.122174609 0.00458
4.558923047 0.004467
3.759320313 0.0034
3.00187793 0.00345
2.439073047 0.003445
1.904393359 0.00367
1.555443164 0.00375
1.238558594 0.0034
0.987314258 0.00344
0.799874316 0.01009
0.653170166 0.011722
0.511439209 0.00999
0.411512012 0.008751
0.33495249 0.011906
0.267418921 0.016151
0.216033008 0.019807
0.178204993 0.026537
0.142486438 0.044459
0.112441699 0.055343
0.090922711 0.05756
0.073667346 0.046571
0.05935365 0.04041
0.04755047 0.03603
0.038201419 0.034066
0.030993152 0.03102
0.024871104 0.024716
0.020159554 0.020002
0.016188129 0.01546

Appendix A 113
Table A.10 : MIP for HS w/b = 0.60 cured specimen
Pore size Diameter (µm) Cumulative Intrusion (mL/g)
10.68962656 0.002269
8.5482875 0.001345
8.127660156 0.00116
5.122174609 0.001154
4.558923047 0.000748
3.759320313 0.001041
3.00187793 0.001104
2.439073047 0.000775
1.904393359 0.000804
1.555443164 0.000853
1.238558594 0.000853
0.987314258 0.001882
0.799874316 0.002692
0.653170166 0.003181
0.511439209 0.005916
0.411512012 0.007574
0.33495249 0.010333
0.267418921 0.016359
0.216033008 0.042807
0.178204993 0.056
0.142486438 0.052774
0.112441699 0.034677
0.090922711 0.031436
0.073667346 0.028798
0.05935365 0.02217
0.04755047 0.012788
0.038201419 0.009285
0.030993152 0.004767
0.024871104 0.002241
0.020159554 0.006927
0.016188129 0.008428

Appendix A 114
Table A. 11 : MIP for OPC w/b = 0.45 non-cured specimen
Pore size Diameter (µm) Cumulative Intrusion (mL/g)
10.68962656 0.0019
8.5482875 0.00205
8.127660156 0.002048006
5.122174609 0.000867889
4.558923047 0.001038434
3.759320313 0.001961501
3.00187793 0.004045492
2.439073047 0.00393797
1.904393359 0.003626897
1.555443164 0.00390071
1.238558594 0.003956364
0.987314258 0.004101209
0.799874316 0.003302854
0.653170166 0.003491011
0.511439209 0.004107641
0.411512012 0.003840031
0.33495249 0.004131624
0.267418921 0.005116111
0.216033008 0.005616861
0.178204993 0.007277626
0.142486438 0.014183062
0.112441699 0.033846319
0.090922711 0.042518302
0.073667346 0.037067465
0.05935365 0.035856787
0.04755047 0.030694595
0.038201419 0.023555538
0.030993152 0.020395411
0.024871104 0.013960091
0.020159554 0.010828318
0.016188129 0.011901265

Appendix A 115
Table A.12 MIP for 8% fly Ash w/b = 0.45 non-cured specimen
Pore size Diameter (µm) Cumulative Intrusion (mL/g)
10.68962656 0.000938
8.5482875 0.001017
8.127660156 0.000859
5.122174609 0.000674
4.558923047 0.000728
3.759320313 0.000754
3.00187793 0.000697
2.439073047 0.000954
1.904393359 0.002383
1.555443164 0.0012
1.238558594 0.001839
0.987314258 0.002455
0.799874316 0.002935
0.653170166 0.003282
0.511439209 0.003921
0.411512012 0.004462
0.33495249 0.005147
0.267418921 0.005959
0.216033008 0.006341
0.178204993 0.006063
0.142486438 0.006742
0.112441699 0.008262
0.090922711 0.009001
0.073667346 0.011925
0.05935365 0.017976
0.04755047 0.034306
0.038201419 0.036019
0.030993152 0.043995
0.024871104 0.036906
0.020159554 0.029287
0.016188129 0.024926

Appendix A 116
Table A.13 MIP for 8% silica fume w/b = 0.45 non-cured specimen
Pore size Diameter (µm) Cumulative Intrusion (mL/g)
10.68962656 0.000612
8.5482875 0.000553
8.127660156 0.000492
5.122174609 0.000321
4.558923047 0.000409
3.759320313 0.000376
3.00187793 0.001479
2.439073047 0.002728
1.904393359 0.001917
1.555443164 0.001284
1.238558594 0.001649
0.987314258 0.002109
0.799874316 0.003695
0.653170166 0.004755
0.511439209 0.003878
0.411512012 0.003773
0.33495249 0.003607
0.267418921 0.003268
0.216033008 0.003368
0.178204993 0.003322
0.142486438 0.003425
0.112441699 0.004737
0.090922711 0.007632
0.073667346 0.011592
0.05935365 0.018431
0.04755047 0.024964
0.038201419 0.028721
0.030993152 0.035294
0.024871104 0.037582
0.020159554 0.033721
0.016188129 0.026954

Appendix A 117
Table A.14 MIP for 8% metakaolin w/b = 0.45 non-cured specimen
Pore size Diameter (µm) Cumulative Intrusion (mL/g)
10.68962656 0.0006573
8.5482875 0.0009793
8.127660156 0.0006501
5.122174609 0.0003823
4.558923047 0.0010575
3.759320313 0.0012551
3.00187793 0.0010266
2.439073047 0.0027099
1.904393359 0.0023832
1.555443164 0.0011996
1.238558594 0.0018386
0.987314258 0.0024552
0.799874316 0.0029345
0.653170166 0.0032823
0.511439209 0.0039214
0.411512012 0.0061422
0.33495249 0.0061601
0.267418921 0.0039214
0.216033008 0.0061422
0.178204993 0.0061601
0.142486438 0.0072532
0.112441699 0.0068584
0.090922711 0.0076918
0.073667346 0.0092479
0.05935365 0.0140215
0.04755047 0.0280213
0.038201419 0.032003
0.030993152 0.0275369
0.024871104 0.0236393
0.020159554 0.0215028
0.016188129 0.0191767
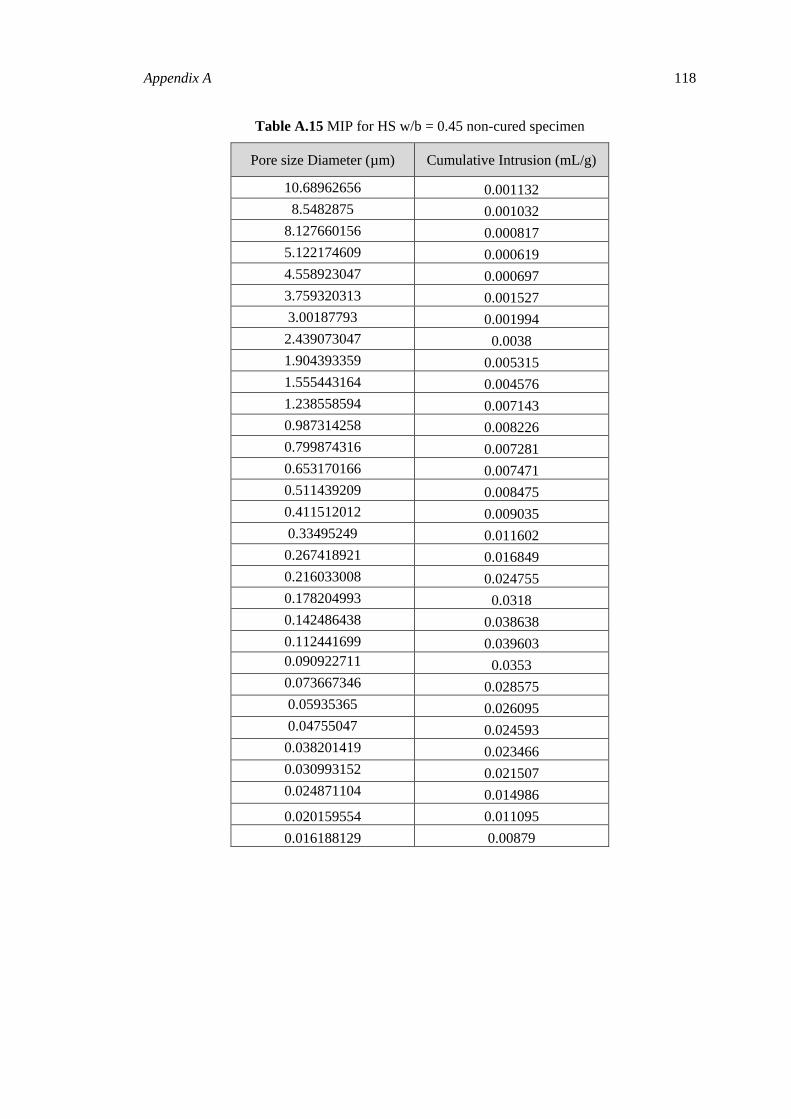
Appendix A 118
Table A.15 MIP for HS w/b = 0.45 non-cured specimen
Pore size Diameter (µm) Cumulative Intrusion (mL/g)
10.68962656 0.001132
8.5482875 0.001032
8.127660156 0.000817
5.122174609 0.000619
4.558923047 0.000697
3.759320313 0.001527
3.00187793 0.001994
2.439073047 0.0038
1.904393359 0.005315
1.555443164 0.004576
1.238558594 0.007143
0.987314258 0.008226
0.799874316 0.007281
0.653170166 0.007471
0.511439209 0.008475
0.411512012 0.009035
0.33495249 0.011602
0.267418921 0.016849
0.216033008 0.024755
0.178204993 0.0318
0.142486438 0.038638
0.112441699 0.039603
0.090922711 0.0353
0.073667346 0.028575
0.05935365 0.026095
0.04755047 0.024593
0.038201419 0.023466
0.030993152 0.021507
0.024871104 0.014986
0.020159554 0.011095
0.016188129 0.00879

Appendix A 119
Table A. 16 MIP for OPC w/b = 0.30 non-cured specimen
Pore size Diameter (µm) Cumulative Intrusion (mL/g)
10.68962656 0.0010416
8.5482875 0.00063906
8.127660156 0.00047285
5.122174609 0.00033588
4.558923047 0.00041998
3.759320313 0.00044925
3.00187793 0.00098079
2.439073047 0.00129546
1.904393359 0.00098637
1.555443164 0.00078008
1.238558594 0.00094311
0.987314258 0.00113409
0.799874316 0.00164931
0.653170166 0.00103543
0.511439209 0.00073304
0.411512012 0.0012083
0.33495249 0.00116853
0.267418921 0.00167781
0.216033008 0.0017
0.178204993 0.0021
0.142486438 0.004
0.112441699 0.01
0.090922711 0.014
0.073667346 0.019
0.05935365 0.021
0.04755047 0.019
0.038201419 0.014
0.030993152 0.00478012
0.024871104 0.00349819
0.020159554 0.00323645
0.016188129 0.00293803

Appendix A 120
Table A. 17 MIP for 25% fly Ash w/b = 0.30 non-cured specimen
Pore size Diameter (µm) Cumulative Intrusion (mL/g)
10.68962656 0.00112
8.5482875 0.000777
8.127660156 0.000618
5.122174609 0.000718
4.558923047 0.000764
3.759320313 0.00067
3.00187793 0.000716
2.439073047 0.000856
1.904393359 0.001148
1.555443164 0.001602
1.238558594 0.002889
0.987314258 0.003346
0.799874316 0.003381
0.653170166 0.003033
0.511439209 0.001822
0.411512012 0.002085
0.33495249 0.002316
0.267418921 0.002077
0.216033008 0.002029
0.178204993 0.002092
0.142486438 0.002436
0.112441699 0.002832
0.090922711 0.003261
0.073667346 0.003732
0.05935365 0.003971
0.04755047 0.003723
0.038201419 0.003658
0.030993152 0.005414
0.024871104 0.014648
0.020159554 0.021781
0.016188129 0.022143

Appendix A 121
Table A. 18 MIP for 8% silica fume w/b = 0.30 non-cured specimen
Pore size Diameter (µm) Cumulative Intrusion (mL/g)
10.68962656 0.001157
8.5482875 0.001133
8.127660156 0.001889
5.122174609 0.000421
4.558923047 0.000492
3.759320313 0.000496
3.00187793 0.00048
2.439073047 0.000475
1.904393359 0.000528
1.555443164 0.00086
1.238558594 0.00114
0.987314258 0.001585
0.799874316 0.001844
0.653170166 0.001882
0.511439209 0.001842
0.411512012 0.001518
0.33495249 0.001147
0.267418921 0.000943
0.216033008 0.000909
0.178204993 0.000801
0.142486438 0.000671
0.112441699 0.000893
0.090922711 0.001597
0.073667346 0.002594
0.05935365 0.005091
0.04755047 0.006185
0.038201419 0.006428
0.030993152 0.006897
0.024871104 0.009411
0.020159554 0.012006
0.016188129 0.015773
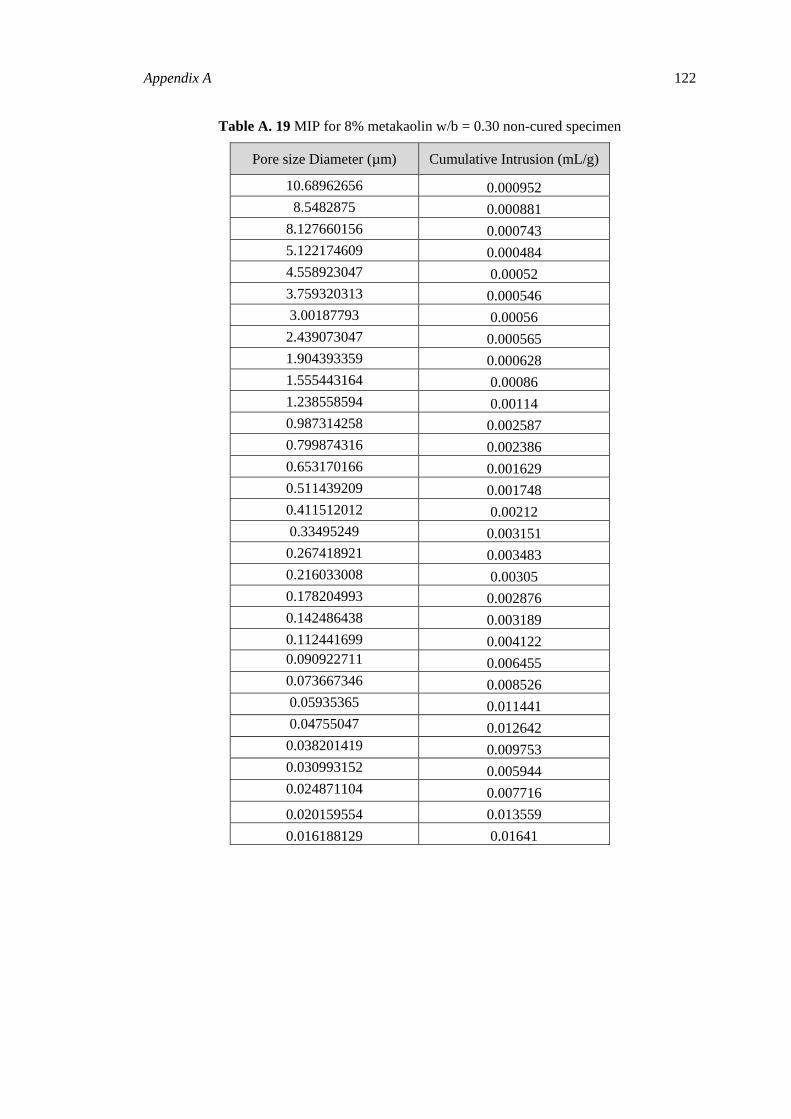
Appendix A 122
Table A. 19 MIP for 8% metakaolin w/b = 0.30 non-cured specimen
Pore size Diameter (µm) Cumulative Intrusion (mL/g)
10.68962656 0.000952
8.5482875 0.000881
8.127660156 0.000743
5.122174609 0.000484
4.558923047 0.00052
3.759320313 0.000546
3.00187793 0.00056
2.439073047 0.000565
1.904393359 0.000628
1.555443164 0.00086
1.238558594 0.00114
0.987314258 0.002587
0.799874316 0.002386
0.653170166 0.001629
0.511439209 0.001748
0.411512012 0.00212
0.33495249 0.003151
0.267418921 0.003483
0.216033008 0.00305
0.178204993 0.002876
0.142486438 0.003189
0.112441699 0.004122
0.090922711 0.006455
0.073667346 0.008526
0.05935365 0.011441
0.04755047 0.012642
0.038201419 0.009753
0.030993152 0.005944
0.024871104 0.007716
0.020159554 0.013559
0.016188129 0.01641

Appendix A 123
Table A. 20 MIP for HS w/b = 0.30 non-cured specimen
Pore size Diameter (µm) Cumulative Intrusion (mL/g)
10.68962656 0.000942
8.5482875 0.000865
8.127660156 0.000723
5.122174609 0.000421
4.558923047 0.000492
3.759320313 0.000496
3.00187793 0.00048
2.439073047 0.000475
1.904393359 0.000428
1.555443164 0.00086
1.238558594 0.00114
0.987314258 0.002587
0.799874316 0.002386
0.653170166 0.003539
0.511439209 0.003843
0.411512012 0.004247
0.33495249 0.004442
0.267418921 0.004784
0.216033008 0.00543
0.178204993 0.007019
0.142486438 0.009567
0.112441699 0.012425
0.090922711 0.018
0.073667346 0.021
0.05935365 0.016
0.04755047 0.0114
0.038201419 0.011145
0.030993152 0.007698
0.024871104 0.005266
0.020159554 0.00399
0.016188129 0.002881

Appendix B 124
Table B.1 : Compressive strength of concrete w/b = 0.60 (28dyas)
OPC Fly Ash Silica-Fume Metakaolin HS
Sample number 1 2 3 1 2 3 1 2 3 1 2 3 1 2 3
Compressive strength (Mpa) 40.50 39.30 37.40 32.00 33.80 35.00 51.40 48.30 49.00 45.00 47.40 46.00 38.50 39.30 37.40
Average 39.07 33.60 49.57 46.13 38.40
Coefficient of variation 0.032 0.037 0.025 0.018 0.021
Table B.2 : Compressive strength of concrete w/b = 0.60 (90dyas)
OPC Fly Ash Silica-Fume Metakaolin HS
Sample Number 1 2 3 1 2 3 1 2 3 1 2 3 1 2 3
Compressive strength (Mpa) 42.40 40.32 40.26 48.21 47.26 49.18 52.40 50.43 51.72 48.11 47.17 46.83 39.38 40.12 38.75
Average 40.99 48.22 51.52 47.37 39.42
Coefficient of variation 0.023 0.017 0.016 0.017 0.021
Table B.3 : Compressive strength of concrete w/b = 0.60 (180dyas)
OPC Fly Ash Silica-Fume Metakaolin HS
Sample Number 1 2 3 1 2 3 1 2 3 1 2 3 1 2 3
Compressive strength (Mpa) 43.40 41.87 40.56 52.37 52.35 54.89 50.25 52.36 51.57 48.53 47.95 49.92 39.21 41.24 38.43
Average 41.94 53.20 51.33 49.13 39.92
Coefficient of variation 0.030 0.018 0.016 0.017 0.032

Appendix B 125
Table B.4 : Compressive strength of concrete w/b = 0.45 (28dyas)
OPC Fly Ash Silica-Fume Metakaolin HS
Sample Number 1 2 3 1 2 3 1 2 3 1 2 3 1 2 3
Compressive strength (Mpa) 55.32 56.21 57.42 47.36 49.32 48.25 69.47 68.94 66.23 63.56 64.45 62.13 52.84 51.94 53.76
Average 56.32 48.31 67.9 63.38 52.85
Coefficient of variation 0.015 0.017 0.018 0.013 0.016
Table B.5 : Compressive strength of concrete w/b = 0.45 (90dyas)
OPC Fly Ash Silica-Fume Metakaolin HS
Sample Number 1 2 3 1 2 3 1 2 3 1 2 3 1 2 3
Compressive strength (Mpa) 55.43 54.26 56.46 61.46 63.25 62.20 71.14 70.03 72.60 67.14 65.21 66.32 53.86 52.79 54.93
Average 55.38 62.30 70.92 66.22 53.86
Coefficient of variation 0.015 0.013 0.011 0.012 0.015
Table B.6 Compressive strength of concrete w/b = 0.45 (180dyas)
OPC Fly Ash Silica-Fume Metakaolin HS
Sample Number 1 2 3 1 2 3 1 2 3 1 2 3 1 2 3
Compressive strength (Mpa) 57.88 55.75 56.96 71.4 68.3 69.5 72.4 70.1 69.3 67.43 68.93 66.5 54.34 56.49 55.04
Average 56.86 69.08 71.20 67.40 55.29
Coefficient of variation 0.015 0.018 0.018 0.012 0.015
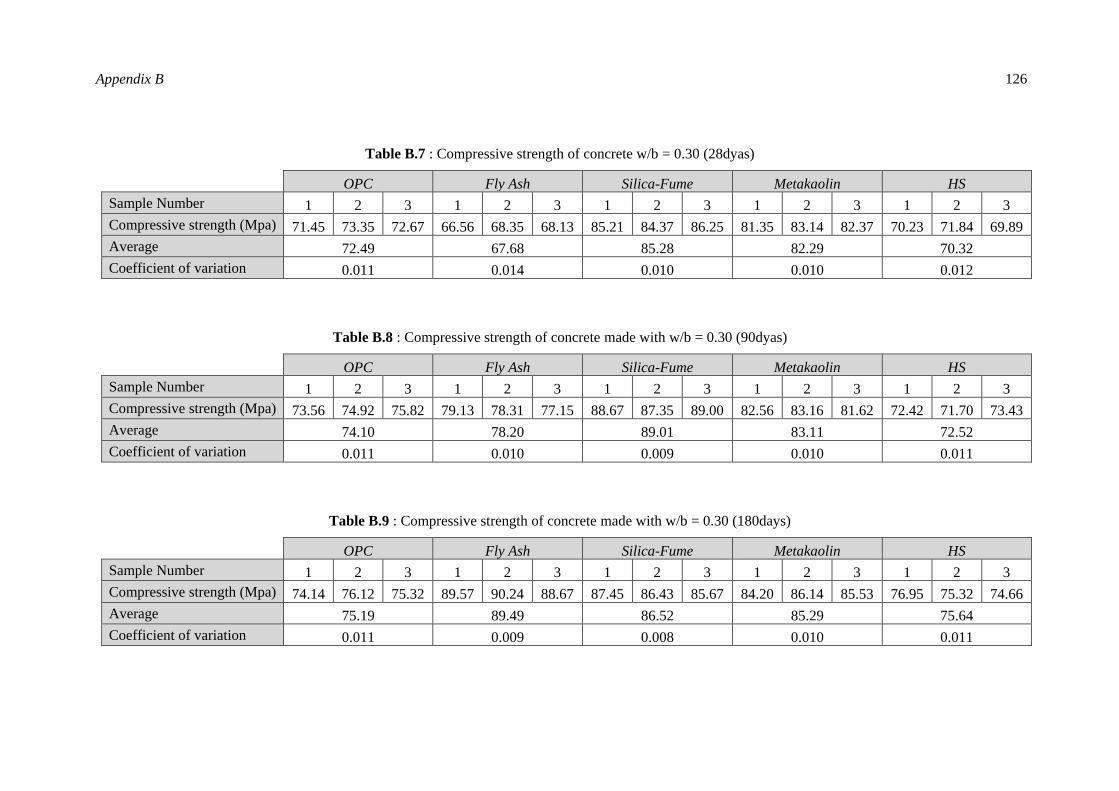
Appendix B 126
Table B.7 : Compressive strength of concrete w/b = 0.30 (28dyas)
OPC Fly Ash Silica-Fume Metakaolin HS
Sample Number 1 2 3 1 2 3 1 2 3 1 2 3 1 2 3
Compressive strength (Mpa) 71.45 73.35 72.67 66.56 68.35 68.13 85.21 84.37 86.25 81.35 83.14 82.37 70.23 71.84 69.89
Average 72.49 67.68 85.28 82.29 70.32
Coefficient of variation 0.011 0.014 0.010 0.010 0.012
Table B.8 : Compressive strength of concrete made with w/b = 0.30 (90dyas)
OPC Fly Ash Silica-Fume Metakaolin HS
Sample Number 1 2 3 1 2 3 1 2 3 1 2 3 1 2 3
Compressive strength (Mpa) 73.56 74.92 75.82 79.13 78.31 77.15 88.67 87.35 89.00 82.56 83.16 81.62 72.42 71.70 73.43
Average 74.10 78.20 89.01 83.11 72.52
Coefficient of variation 0.011 0.010 0.009 0.010 0.011
Table B.9 : Compressive strength of concrete made with w/b = 0.30 (180days)
OPC Fly Ash Silica-Fume Metakaolin HS
Sample Number 1 2 3 1 2 3 1 2 3 1 2 3 1 2 3
Compressive strength (Mpa) 74.14 76.12 75.32 89.57 90.24 88.67 87.45 86.43 85.67 84.20 86.14 85.53 76.95 75.32 74.66
Average 75.19 89.49 86.52 85.29 75.64
Coefficient of variation 0.011 0.009 0.008 0.010 0.011

127
CURRICULUM VITAE
Name: Ahmed Ramadan Suleiman
Degrees: BSc (2000-2004)
Post-secondary Education University of Garyounis, Benghazi-Libya
Western University
MESc (2011-2013)
London, Ontario, Canada
Honours and Awards: Libyan-North American Scholarship (2010)
First Dean’s List Honor, University of Garyounis, (2004)
Related Work Experience: Graduate Teaching Assistant, Western University, (2012-2013)
QA-QC Engineer (MAN Enterprise, 2008-2009)
Designer Engineer (Gama Consultant Engineers 2007-2008)
Supervisor and Designer Engineer, (Alemaad 2004-2007)
Publications:
1-Suleiman, A. R., Soliman, A., and Nehdi, M. “Investigation of concrete exposed to dual
sulphate attack.” submitted to ACI Materials Journal.
2-Suleiman, A. R., Soliman, A., and Nehdi, M. “Effect of surface treatment materials on
durability of concrete exposed to physical sulfate attack.” submitted to Cement and Concrete
Research.
3-Suleiman, A. R., Soliman, A., and Nehdi, M. “Effect of supplementary cementitious
materilas on durability of concrete exposed to physical sulphate attack.” To be submitted for
peer review.