
Electrochemical studies of zinc–nickel codeposition in sulphate bath
14
Electrochemical studies of zinc–nickel codeposition in sulphate bath Mortaga M. Abou-Krisha Faculty of Science, Chemistry Department, South Valley University, Qena, Egypt Received 23 June 2004; received in revised form 30 January 2005; accepted 30 January 2005 Available online 12 March 2005 Abstract The electrodeposition of Zn–Ni alloys from a sulphate bath was studied under different conditions. The bath had the composition 0.40 M sodium sulphate, 0.01 M sulphuric acid, 0.16 M boric acid, 0.20 M zinc sulphate and 0.20 M nickel sulphate. It is found that the plating bath temperature has a great effect on the cyclic voltammograms, galvanostatic measurements during electrodeposition, and consequently linear polarization resistance for corrosion study and the alloy composition. Under the examined conditions, the electrodeposition of the alloys was of anomalous type. X-ray diffraction measurements revealed that the alloys consisted of the d-phase (Ni 3 Zn 22 ) or a mixture of the two phases d and g (Ni 5 Zn 21 ). The comparison between Ni deposition and Zn–Ni codeposition revealed that the remarkable inhibition of Ni deposition takes place due to the presence of Zn 2+ in the plating bath. The Ni deposition starts at 0.85 V in the bath of Ni deposition only, but the deposition starts at more negative potentials in the codeposition bath although the concentration of Ni 2+ is the same in the both baths. # 2005 Elsevier B.V. All rights reserved. Keywords: Zn–Ni alloy; Electroplating; Anomalous codeposition; Plating bath temperature; Electrochemical studies; Sulphate bath 1. Introduction In recent years, great interest has been shown in the possibilities offered by the electrodeposition of alloys, mainly in the automotive industry. Usually the mechanical and chemical properties of metals are improved by alloying. In particular, it is known that the mechanical properties of zinc electrodeposits can be improved by alloying zinc with nickel [1,2]. Using Zn–Ni alloy deposits on iron also increases their corrosion resistance [3–8]. The electrodeposition of Zn–Ni alloys is classified by Brenner [9] as an anomalous codeposition, where zinc, which is the less noble metal, is preferentially deposited. Although this phenomenon [10] has been known since 1907, the codeposition mechanisms of zinc and nickel are not well understood [11,12]. Many studies have attempted to understand the characteristics of the deposition process [13–16]. There are some propositions to explain the anomalous codeposition of Zn–Ni alloys. The first attributes the anomalous www.elsevier.com/locate/apsusc Applied Surface Science 252 (2005) 1035–1048 E-mail address: [email protected]. 0169-4332/$ – see front matter # 2005 Elsevier B.V. All rights reserved. doi:10.1016/j.apsusc.2005.01.161
-
Upload
independent -
Category
Documents
-
view
1 -
download
0
Transcript of Electrochemical studies of zinc–nickel codeposition in sulphate bath
Electrochemical studies of zinc–nickel
codeposition in sulphate bath
Mortaga M. Abou-Krisha
Faculty of Science, Chemistry Department, South Valley University, Qena, Egypt
Received 23 June 2004; received in revised form 30 January 2005; accepted 30 January 2005
Available online 12 March 2005
www.elsevier.com/locate/apsusc
Applied Surface Science 252 (2005) 1035–1048
Abstract
The electrodeposition of Zn–Ni alloys from a sulphate bath was studied under different conditions. The bath had the
composition 0.40 M sodium sulphate, 0.01 M sulphuric acid, 0.16 M boric acid, 0.20 M zinc sulphate and 0.20 M nickel
sulphate. It is found that the plating bath temperature has a great effect on the cyclic voltammograms, galvanostatic
measurements during electrodeposition, and consequently linear polarization resistance for corrosion study and the alloy
composition. Under the examined conditions, the electrodeposition of the alloys was of anomalous type. X-ray diffraction
measurements revealed that the alloys consisted of the d-phase (Ni3Zn22) or a mixture of the two phases d and g (Ni5Zn21). The
comparison between Ni deposition and Zn–Ni codeposition revealed that the remarkable inhibition of Ni deposition takes place
due to the presence of Zn2+ in the plating bath. The Ni deposition starts at �0.85 V in the bath of Ni deposition only, but the
deposition starts at more negative potentials in the codeposition bath although the concentration of Ni2+ is the same in the both
baths.
# 2005 Elsevier B.V. All rights reserved.
Keywords: Zn–Ni alloy; Electroplating; Anomalous codeposition; Plating bath temperature; Electrochemical studies; Sulphate bath
1. Introduction
In recent years, great interest has been shown in the
possibilities offered by the electrodeposition of alloys,
mainly in the automotive industry. Usually the
mechanical and chemical properties of metals are
improved by alloying. In particular, it is known that
the mechanical properties of zinc electrodeposits can
be improved by alloying zinc with nickel [1,2]. Using
E-mail address: [email protected].
0169-4332/$ – see front matter # 2005 Elsevier B.V. All rights reserved
doi:10.1016/j.apsusc.2005.01.161
Zn–Ni alloy deposits on iron also increases their
corrosion resistance [3–8].
The electrodeposition of Zn–Ni alloys is classified
by Brenner [9] as an anomalous codeposition, where
zinc, which is the less noble metal, is preferentially
deposited. Although this phenomenon [10] has been
known since 1907, the codeposition mechanisms of
zinc and nickel are not well understood [11,12]. Many
studies have attempted to understand the characteristics
of the deposition process [13–16]. There are some
propositions to explain the anomalous codeposition of
Zn–Ni alloys. The first attributes the anomalous
.

M.M. Abou-Krisha / Applied Surface Science 252 (2005) 1035–10481036
codeposition to a local pH increase, which would
induce zinc hydroxide precipitation and would inhibit
the nickel deposition [17–19]. It was, however, later that
anomalous codeposition occurred even at low current
densities [20], where hydrogen formation is unable to
cause large alkalinization effects. Another proposition
is based on the underpotential deposition (UPD) of zinc
on nickel-rich zinc alloys or on nickel nuclei [21,22].
Two other papers on NiFe electrodeposition propose
different mechanisms. The mechanism of Lieder and
Biallozor [23], assumes that Ni2+ discharges first to
form a thin layer which chemisorbs water to form
adsorbed Ni(OH)+, competition between the Ni2+ and
Fe2+ to occupy active sites leads to the preferential
deposition of Fe. Matlosz [24] uses a two-step reaction
mechanism involving adsorbed monovalent intermedi-
ate ions for both electrodeposition of iron and nickel, as
single metals, and combines the two to develop a model
for codeposition. Anomalous effects are assumed to be
caused by preferential surface coverage due to
differences in Tafel rate constants for electrodeposition.
Keith Sasaki and Jan Talbot [25] proposed model
extends the one-dimensional diffusion modeling of
Grande and Talbot [26], a supportive or interpretive,
rather than a predictive, model of electrodeposition. A
main contribution of this model is the inclusion of
hydrogen adsorption and its effects on electrodeposi-
tion. Zech et al. [27] concluded that codeposition of
iron group metals leads to a reduction of the reaction
rate of the more noble component and an increase of
the reaction rate of the less noble component
compared to single metal deposition.
The aim of this work was to investigate the
mechanism of Zn–Ni alloy deposition in sulphate
electrolytes. The results of the experimental approach,
based essentially on the analysis of the cyclic
voltammograms, galvanostatic measurements during
the electroplating, and linear polarization for corro-
sion study and X-ray diffractograms behaviour. Also
the effect of plating bath temperature on the alloy
composition and the morphology of the deposit were
studied.
2. Experimental
The electrodeposition of zinc, nickel and zinc
nickel alloys from sulphate bath has been conducted
under the examined conditions of bath temperature. A
detailed study has been made on the effect of the bath
composition and temperature on the cathode poten-
tials and cathode efficiency of zinc, nickel and zinc–
nickel alloy. Also the compositions of the alloys were
determined. The effect of these variables on the
morphology and the corrosion resistance of the
deposits were also investigated.
The electrolytic cell used for the present work was
of 100 cm3 capacity and contained three separate
compartments, two of them were used for fitting both
the working and the counter-electrodes. The third
compartment was used for fitting the reference
electrode, which is saturated Ag/AgCl electrode.
The platinum counter-electrode of large area (6 cm2)
was separated from the main bulk electrolyte by
means of C4 sintered glass disc to separate the anode
and the cathode compartments. Also, the reference
electrode was separated from the electrolyte via
sintered glass disc C4. The end of this electrode was
elongated into the Haber-Luggen capillary, which
placed at distance of 2pr (r is the radius of the Luggen
capillary) away from the working electrode surface.
Before each run the glass cell only was cleaned with
chromic/sulphuric acids mixture, but C4 sintered glass
with hot sulphuric acid, washed with first and second
distilled water. Then the cell filled with the 100 cm3 of
the electroplating solution at temperature 30.0 8C and
placed along the experiment in air thermostat to ensure
adjustment of temperature at 30.0 8C.
The electrolytes used for electrodeposition of Zn,
Ni and Zn–Ni alloys were freshly prepared using
Analar grade chemicals used without further purifica-
tion and dissolved in appropriate amount of doubly
distilled water. The pH of the standard bath used was
2.5. All experiments were duplicated and the
reproducibility for this type of measurements was
found to be satisfactory.
For electrodeposition of these metals and their
alloys, pure steel rod (99.98+%) of cross-sectional
area (0.196 cm2), in Teflon mount, in contact with
solution was used. Before each experiment the
electrode was mechanically polished with successive
grades of emery paper, degreased with ethyl alcohol,
rinsed with doubly distilled water and dried.
For electrochemical methods (cyclic voltammetric
behaviour, galvanostatic measurements and linear
polarization resistance technique) EG&G Potentio-

M.M. Abou-Krisha / Applied Surface Science 252 (2005) 1035–1048 1037
Table 1
Values of electrochemical corrosion measurements of the deposit on steel from a bath containing 0.20 M ZnSO4 (b and c), 0.20 M NiSO4 (a and
c), 0.01 M H2SO4, 0.40 M Na2SO4, 0.16 M H3BO3 at 10 mA cm�2 for 10 min at 30.0 8C
Deposit on steel (b) Zn only (c) Zn–Ni alloy (a) Ni only
ba (V decade�1) 1.878 13.99 23.48
bc (V decade�1) 4.265 0.9187 0.417
icorr. (A cm�2 � 10�3) 12.51 11.60 0.4388
Rp (kV) 0.1167 0.1233 1.295
Corr. rate (milli-inches year�1) 8987 8823 186.2
Ecorr. (corrosion potential/mV) �1000 �947 �383
stat/Galvanostat Model 273A controlled by a PC using
352 corrosion software was used.
The potentiodynamic cathodic polarization mea-
surements (the cathodic part of the cyclic voltammo-
grams) are conducted during the electrodeposition of
the parent metals and their alloys from the selected
baths on steel cathodes. The influence of the examined
conditions on the E–i profile was studied. The scan
rate in all experiments was 5.0 mV s�1. The Zn–Ni
alloys were stripped (the anodic part of the cyclic
voltammograms) under potentiodynamic conditions
in the same electrolyte from which they were
deposited. Previously, it was verified that no replace-
ment reaction between Ni2+ and Zn2+ took place [28].
The surface morphology of the deposit was
evaluated by a scanning electron microscope (JSM-
5500 LV, SEM, JEOL, Japan). X-ray diffractometry
(XRD) model D5000 Siemens diffractometer was
Table 2
Values of Ni and Zn amount in the deposit, total mass of the deposit, % N
thickness and electrochemical corrosion measurements of the deposit on s
H2SO4, 0.40 M Na2SO4, 0.16 M H3BO3 at 10 mA cm�2 for 10 min at di
Bath temperature 25.0 8C
Ni amount in the deposit (10�6 g) 42
Zn amount in the deposit (10�6 g) 324
Total mass of the deposit (10�6 g) 366
Ni content (%) 11.5
Zn content (%) 88.5
Ni Current efficiency, eNi (%) 11.8
Zn Current efficiency, eZn (%) 81.3
Zn–Ni deposit current efficiency, etotal (%) 93.1
Thickness of the deposit (mm) 2.54
ba (V decade�1) 2.165
bc (V decade�1) 3.711
icorr. (A cm�2 � 10�3) 16.46
Rp (kV) 0.1156
Corr. rate (milli-inches year�1) 9321
Ecorr. (corrosion potential/mV) �961
used to identify the phases of Zn–Ni alloys deposited.
The instrument is equipped with a copper anode
generating Ni-filtered Cu Ka radiation (l = 1.5418 A,
40 kV, 30 mA). An on-line data acquisition and
handling system facilitated an automatic JCPDS
library search and match (Diffrac software, Siemens)
for phase identification purposes.
The galvanostatic measurements of steel were
conducted by keeping the current at a constant level
10.0 mA cm�2 for 10 min, in the examined solution,
and the potential–time relation was plotted. In order to
determine the percentage composition of deposit, the
deposited was dissolved in 20 cm3 of 3 M HNO3, then
diluted with doubly distilled water up to 100 cm3. A
suitable diluted solution was then analyzed to
ascertain the Zn and Ni contents in the deposited
alloy using atomic absorption spectroscopy (Varian
SpectrAA 55). The Zn and Ni contents in the deposit
i and Zn content, current efficiencies % (Ni, Zn and Zn–Ni deposit),
teel from a bath containing 0.20 M ZnSO4, 0.20 M NiSO4, 0.01 M
fferent bath temperature
30.0 8C 35.0 8C 40.0 8C 50.0 8C
43 46 50 61
319 314 309 287
362 360 359 348
11.9 12.8 13.9 17.5
88.1 87.2 86.1 82.5
12.0 12.9 14.0 17.1
80.1 78.8 77.6 72.0
92.1 91.7 91.6 89.1
2.51 2.49 2.48 2.38
13.99 10.13 15.19 17.56
0.9187 0.6779 0.7759 0.3146
15.60 10.39 8.980 2.985
0.1233 0.1354 0.1461 0.1877
8823 9321 1778 1655
�947 �980 �935 �882

M.M. Abou-Krisha / Applied Surface Science 252 (2005) 1035–10481038
were confirmed by EDS (energy-dispersive X-ray
spectrometer) system with link Isis1 software and
model 6587 X-ray detector (Oxford, UK).
Using the resultant analysis, the film thickness and
the cathode current efficiency of the deposit from the
selected baths on steel were calculated. Also, the
thickness measured with scanning electron micro-
scope (cross-section) to confirm the calculated results.
The thickness of the deposited alloy layer is
estimated from the mass of deposit, the densities of Zn
(dZn = 7.14 g cm�3) and Ni (dNi = 8.90 g cm�3) and
the surface area (0.196 cm2). Using the following
equation
h ¼ mt=ðda � saÞThe thickness can be calculated as the height of the film
(h).mt is the total mass of the deposit, sa the surface area
and da the alloy density which equal (dZn(mZn/
mt) + dNi(mNi/mt)), where mZn the Zn amount in the
deposit, mNi the Ni amount in the deposit.
To measure the corrosion resistance of the
deposited, the linear polarization resistance technique
was used. In this technique, the steel with a Zn–Ni
coating, galvanostatically, on it was washed and
Fig. 1. E–i curves for steel in 0.20 M ZnSO4 (b and c), 0.20 M NiSO4 (a a
5 mV s�1 at 30.0 8C.
transferred into the electrolytic cell containing
100.0 cm3 of 0.025 M HCl in order to dissolve the
coating anodically. To begin the measurements, the
sample was introduced into the cell immediately after
electroplating, rinsed with double distilled water and
was allowed to reach equilibrium. The anodic
dissolution of deposits in a voltammetric mode was
conducted at a potential scan rate of 2 mV s�1. The
values of electrochemical corrosion measurements of
the coatings, Ecorr. is the corrosion potential, Icorr. the
corrosion current, Rp the polarization resistance, bc the
cathodic and ba the anodic Tafel constants and
corrosion rate, were obtained and represented in
Tables 1 and 2.
3. Results and discussion
3.1. Comparison between deposited Zn, Ni
and Zn–Ni codeposited
Potentiodynamic cathodic polarization measure-
ments of steel in bath solution at 30.0 8C in the
nd c), 0.01 M H2SO4, 0.40 M Na2SO4, 0.16 M H3BO3 and scan rate

M.M. Abou-Krisha / Applied Surface Science 252 (2005) 1035–1048 1039
Fig. 2. i–E curves (cyclic voltammograms) for steel in (a) 0.16 M H3BO3, (b) 0.40 M Na2SO4, (c) 0.01 M H2SO4 and (d) 0.01 M
H2SO4 + 0.40 M Na2SO4 + 0.16 M H3BO3, and scan rate 5 mV s�1 at 30.0 8C.
presence of Zn2+ or Ni2+ alone and Zn2+ + Ni2+
together were represented in Fig. 1. From this figure, it
is observed that the deposition of Zn starts at about
�1.14 V which takes the same shape and close to the
potential of Zn–Ni codeposition (about �1.12 V). On
the other hand, from the same figure it is obvious that
the Ni deposition starts at about �0.85 V and the
growth of deposited layer increases rapidly when the
potential shifts to more negative values. Also, the
polarization curve of the alloy deposition lies between
the polarization curves of each deposition Zn and Ni.
This position suggested that the codeposition enable
Zn to deposit at more positive potential (i.e. shifts the
deposition potential of Zn to less negative values) and
increase that of Ni to more negative ones due to the
presence of Ni2+ which facilitates Zn deposition [27].
The cathodic peak started at about �0.5 V may be due
to the hydrogen evolution, which increase as the pH of
the bath decrease. This peak is similar to that appears
in the absence of both Zn2+ and Ni2+, so this peak
probably appears mainly due to the presence of H2SO4
(Fig. 2). In the presence of Ni2+, this cathodic peak
was decreased, due to the surface effect occurs with
the addition of Zn2+ and/or Ni2+. This is ascribed to
that the addition of Zn2+ and/or Ni2+ (especially Ni2+)
decreases the adsorption of H+ and consequently
hydrogen evolution. This may be attributed to start the
competitive adsorption between Zn2+ and/or Ni2+ (or
its monovalent intermediate) and H+ [23–27].
In Fig. 3, cyclic voltammograms behaviour of steel
at 30.0 8C in the bath solutions were represented. This
figure has only one anodic peak at about �0.97 V
which corresponds to the anodic dissolution of Zn
deposited alone in the absence of Ni. Whereas two
anodic peaks were observed for Zn–Ni alloy deposit
corresponding to the formation of two phases (Fig. 4),
d-phase ((Ni3Zn22) the first dissolution anodic peak)
and g-phase ((Ni5Zn21) the second dissolution anodic
peak). The third peak corresponding to the dissolution
of Ni. The behaviour of the layer growth of the Zn
deposition in the cathodic direction is seems to be
similar to that of the Zn–Ni codeposition. Taking into
consideration that the potential of the anodic dissolu-
tion of the d-phase is more positive than that of the Zn
deposition, the dissolution of the d-phase in the
positive direction also relatively close to that of Zn

M.M. Abou-Krisha / Applied Surface Science 252 (2005) 1035–10481040
Fig. 3. i–E curves (cyclic voltammograms) for steel in 0.20 M ZnSO4 (b and c), 0.20 M NiSO4 (a and c), 0.01 M H2SO4, 0.40 M Na2SO4, 0.16 M
H3BO3 and scan rate 5 mV s�1 at 30.0 8C.
Fig. 4. XRD patterns of electrodeposited Zn–Ni on steel, obtained at potential �1.13 V holds for 15 min, from a bath containing 0.20 M ZnSO4,
0.20 M NiSO4, 0.01 M H2SO4, 0.40 M Na2SO4, 0.16 M H3BO3 at 30.0 8C.

M.M. Abou-Krisha / Applied Surface Science 252 (2005) 1035–1048 1041
Fig. 5. E–t curves for steel in 0.20 M ZnSO4 (b and c), 0.20 M NiSO4 (a and c), 0.01 M H2SO4, 0.40 M Na2SO4, 0.16 M H3BO3 at 10 mA cm�2
for 10 min at 30.0 8C.
Fig. 6. log i–E curves for steel, plated from a bath containing 0.20 M ZnSO4 (b and c), 0.20 M NiSO4 (a and c), 0.01 M H2SO4, 0.40 M Na2SO4,
0.16 M H3BO3 at 10 mA cm�2 for 10 min at 30.0 8C, in 0.025 M HCl at 30.0 8C.

M.M. Abou-Krisha / Applied Surface Science 252 (2005) 1035–10481042
Fig. 7. E–i curves for steel in 0.20 M ZnSO4, 0.20 M NiSO4, 0.01 M H2SO4, 0.40 M Na2SO4, 0.16 M H3BO3 and scan rate 5 mV s�1 at different
bath temperatures.
deposit alone. This can be understood from the fact
that the Zn–Ni deposit is mainly contained Zn. The
Zn–Ni codeposition started at about �1.12 Vand there
is no Ni cathodic peak at �0.85 V as mentioned
before. The reason for this behavior is ascribed to the
presence of Zn2+, which inhibits Ni2+ electrodeposi-
tion. Similar results were reported by Ohtsuka et al.
[29] during study of the initial layer formation of the
preferential Zn deposition during Zn–Ni electroplat-
ing using another bath nearly like the present bath.
In Zn–Ni codeposition bath, the deposited layer
does not grow at the potential �1.12 V (the cathodic
current decays with potential as seen in Fig. 3) which
corresponds to high overvoltage for the Ni deposition.
Also, in Zn electrodeposition, the cathodic current
peak decays with potential after the initial spike means
that the nucleus growth of the Zn deposition is
probably not induced at the potential of about
�1.14 V. In the Ni deposition bath in the absence
of Zn2+, however, the nucleus growth of Ni deposition
(the cathodic peak increases gradually with potential
as seen in Fig. 3) is induced at the smaller overvoltage
than the above potential. This means that the adsorbed
Zn2+ (or its monovalent intermediate) inhibits the
nucleus growth of the Ni deposition in the Zn–Ni
codeposition bath.
It is interesting to mention that the height of the
anodic peak (the peak current) of the deposited Zn
dissolution was higher than that in the case of the
codeposited Zn–Ni alloy dissolution. This means that
the amount of Zn in the alloy less than that in a single
metal deposit and gives an indication to the formation
of Ni in the alloy deposited.
Fig. 5 shows the potential–time dependence for the
deposition of Zn, Ni and Zn–Ni alloy on steel at
10 mA cm�2 for 10 min. It is clear that the deposition
of Ni needs low overpotential to create the initial
nucleus [30] and the deposit grow at low potentials.
The deposition of Zn takes place with higher
nucleation overpotential and grows at high potential.
The Zn–Ni codeposited at moderate overpotential; this
is due to the deposition of Ni is strongly inhibited by
the presence of Zn2+, while the deposition of Zn is
induced by the presence of Ni2+.
Linear polarization tests (Fig. 6) were done using a
steel-coated galvanostatically by pure Zn and Ni and

M.M. Abou-Krisha / Applied Surface Science 252 (2005) 1035–1048 1043
Zn–Ni alloy. From the measured corrosion potential
(Ecorr.) listed in Table 2, it is found that the anodic peak
of the alloy lies at more positive potential than that of
plated Zn alone, this indicate that the plated Zn–Ni
have high resistance relative to plated Zn only. It is
appear also that the corrosion rate and current were
decreased with the presence of Ni in the deposit, but
the polarization resistance increased. Thus, the
improvement achieved in the corrosion resistance of
the alloy deposits can explained by the presence of Ni.
Fig. 8. SEM photographs of electrodeposited Zn–Ni on steel from a bath
Na2SO4, 0.16 M H3BO3 at 10 mA cm�2 for 10 min at different bath temper
3.2. Effect of plating bath temperature
The influence of the bath temperature on the
potentiodynamic cathodic polarization curves was
studied as shown in Fig. 7. The E–i curves were
carried out for the electrodeposition of Zn–Ni alloy
at different plating bath temperatures. As shown
from these curves, in general, the potentials are
shifted to more positive direction with the bath
temperature from 25.0 to 50.0 8C. The temperature
containing 0.20 M ZnSO4, 0.20 M NiSO4, 0.01 M H2SO4, 0.40 M
atures: (a) at 25.0 8C, (b) at 35.0 8C, (c) at 40.0 8C and (d) at 50.0 8C.

M.M. Abou-Krisha / Applied Surface Science 252 (2005) 1035–10481044
Fig. 8. (Continued ).
rise is followed by increase in Ni content and
decrease in Zn content of the alloy as shown in
Table 2. In order to evaluate the effect of plating bath
temperature on the morphological characteristic of
Zn–Ni anomalous deposit alloy films, SEM was used
as shown in Fig. 8. From this figure, the micrographs
taken for film deposited at 25.0 8C (Fig. 8a), one can
see that the coatings are not uniform and contain a
large number of voids. Upon further increase in
plating bath temperature to 35.0 8C (Fig. 8b) no
major change in morphology is observed, but, the
compactness is increased and the voids are
decreased. Curiously, the most uniform and compact
deposit, which consists of many large grain size
films, is obtained at 40.0 8C (Fig. 8c). When the
plating bath temperature is raised to 50.0 8C (Fig. 8d)
there is a transition to a fine-grained structure and a
full surface coverage was obtained. It has already
been shown that the potentiodynamic cathodic
polarization curves depend on the electrolysis
temperature. Increasing the temperature from 25 to
50 8C activate nickel deposition, thus producing a
higher nickel content in alloys at 50.0 8C. Such
behavior is primarily the result of intrinsically slow
nickel kinetics. Also, this may be ascribed to the
redissolution of Zn deposited in the acidic medium
and to increase the diffusion process at elevated
temperatures [31]. Since the rate of dissolution of Zn

M.M. Abou-Krisha / Applied Surface Science 252 (2005) 1035–1048 1045
Fig. 9. XRD patterns of electrodeposited Zn–Ni on steel, obtained at potential �1.13 V holds for 15 min, from a bath containing 0.20 M ZnSO4,
0.20 M NiSO4, 0.01 M H2SO4, 0.40 M Na2SO4, 0.16 M H3BO3 at 50.0 8C.
Fig. 10. i–E curves (cyclic voltammograms) for steel in 0.20 M ZnSO4, 0.20 M NiSO4, 0.01 M H2SO4, 0.40 M Na2SO4, 0.16 M H3BO3 and scan
rate 5 mV s�1 at different bath temperatures.

M.M. Abou-Krisha / Applied Surface Science 252 (2005) 1035–10481046
Fig. 11. E–t curves for steel in 0.20 M ZnSO4, 0.20 M NiSO4, 0.01 M H2SO4, 0.40 M Na2SO4, 0.16 M H3BO3 at 10 mA cm�2 for 10 min at
different bath temperatures.
Fig. 12. log i–E curves for steel, plated from a bath containing 0.20 M ZnSO4, 0.20 M NiSO4, 0.01 M H2SO4, 0.40 M Na2SO4, 0.16 M H3BO3 at
10 mA cm�2 for 10 min at different bath temperatures, in 0.025 M HCl at 30.0 8C.
M.M. Abou-Krisha / Applied Surface Science 252 (2005) 1035–1048 1047
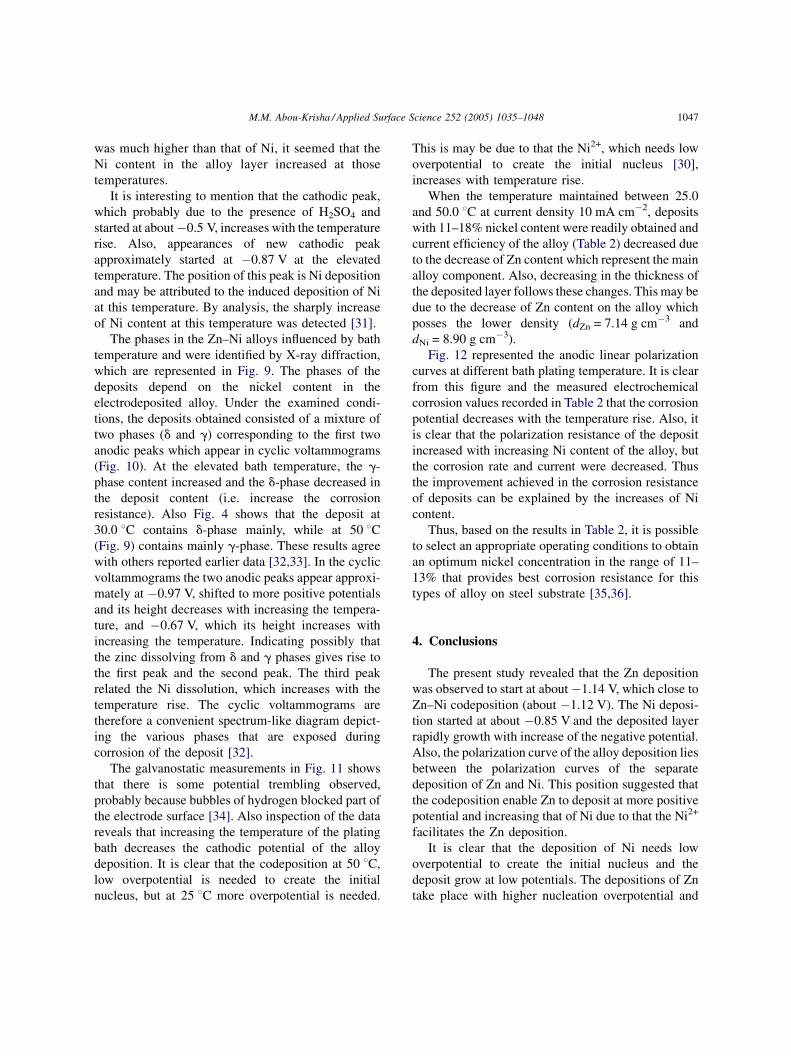
was much higher than that of Ni, it seemed that the
Ni content in the alloy layer increased at those
temperatures.
It is interesting to mention that the cathodic peak,
which probably due to the presence of H2SO4 and
started at about �0.5 V, increases with the temperature
rise. Also, appearances of new cathodic peak
approximately started at �0.87 V at the elevated
temperature. The position of this peak is Ni deposition
and may be attributed to the induced deposition of Ni
at this temperature. By analysis, the sharply increase
of Ni content at this temperature was detected [31].
The phases in the Zn–Ni alloys influenced by bath
temperature and were identified by X-ray diffraction,
which are represented in Fig. 9. The phases of the
deposits depend on the nickel content in the
electrodeposited alloy. Under the examined condi-
tions, the deposits obtained consisted of a mixture of
two phases (d and g) corresponding to the first two
anodic peaks which appear in cyclic voltammograms
(Fig. 10). At the elevated bath temperature, the g-
phase content increased and the d-phase decreased in
the deposit content (i.e. increase the corrosion
resistance). Also Fig. 4 shows that the deposit at
30.0 8C contains d-phase mainly, while at 50 8C(Fig. 9) contains mainly g-phase. These results agree
with others reported earlier data [32,33]. In the cyclic
voltammograms the two anodic peaks appear approxi-
mately at �0.97 V, shifted to more positive potentials
and its height decreases with increasing the tempera-
ture, and �0.67 V, which its height increases with
increasing the temperature. Indicating possibly that
the zinc dissolving from d and g phases gives rise to
the first peak and the second peak. The third peak
related the Ni dissolution, which increases with the
temperature rise. The cyclic voltammograms are
therefore a convenient spectrum-like diagram depict-
ing the various phases that are exposed during
corrosion of the deposit [32].
The galvanostatic measurements in Fig. 11 shows
that there is some potential trembling observed,
probably because bubbles of hydrogen blocked part of
the electrode surface [34]. Also inspection of the data
reveals that increasing the temperature of the plating
bath decreases the cathodic potential of the alloy
deposition. It is clear that the codeposition at 50 8C,
low overpotential is needed to create the initial
nucleus, but at 25 8C more overpotential is needed.
This is may be due to that the Ni2+, which needs low
overpotential to create the initial nucleus [30],
increases with temperature rise.
When the temperature maintained between 25.0
and 50.0 8C at current density 10 mA cm�2, deposits
with 11–18% nickel content were readily obtained and
current efficiency of the alloy (Table 2) decreased due
to the decrease of Zn content which represent the main
alloy component. Also, decreasing in the thickness of
the deposited layer follows these changes. This may be
due to the decrease of Zn content on the alloy which
posses the lower density (dZn = 7.14 g cm�3 and
dNi = 8.90 g cm�3).
Fig. 12 represented the anodic linear polarization
curves at different bath plating temperature. It is clear
from this figure and the measured electrochemical
corrosion values recorded in Table 2 that the corrosion
potential decreases with the temperature rise. Also, it
is clear that the polarization resistance of the deposit
increased with increasing Ni content of the alloy, but
the corrosion rate and current were decreased. Thus
the improvement achieved in the corrosion resistance
of deposits can be explained by the increases of Ni
content.
Thus, based on the results in Table 2, it is possible
to select an appropriate operating conditions to obtain
an optimum nickel concentration in the range of 11–
13% that provides best corrosion resistance for this
types of alloy on steel substrate [35,36].
4. Conclusions
The present study revealed that the Zn deposition
was observed to start at about �1.14 V, which close to
Zn–Ni codeposition (about �1.12 V). The Ni deposi-
tion started at about �0.85 V and the deposited layer
rapidly growth with increase of the negative potential.
Also, the polarization curve of the alloy deposition lies
between the polarization curves of the separate
deposition of Zn and Ni. This position suggested that
the codeposition enable Zn to deposit at more positive
potential and increasing that of Ni due to that the Ni2+
facilitates the Zn deposition.
It is clear that the deposition of Ni needs low
overpotential to create the initial nucleus and the
deposit grow at low potentials. The depositions of Zn
take place with higher nucleation overpotential and

M.M. Abou-Krisha / Applied Surface Science 252 (2005) 1035–10481048
grow at high potential. The Zn–Ni codeposited at
moderate overpotential; this due to the deposition of
Ni is strongly inhibited by the presence of Zn2+, while
the deposition of Zn is induced by the presence of
Ni2+. Also, the plated Zn–Ni had the best resistance of
the coating tested than plated Zn only. Thus, the
improvement achieved in the corrosion resistance of
alloy deposits can explained by the presence of Ni.
Inspection of the data reveals that increasing the
temperature of the plating bath decreases the cathodic
potential of the alloy deposition. It is clear also that the
codeposition at 50 8C low overpotential is needed to
create the initial nucleus but at 25 8C higher
overpotential is needed. This is may be due to that
the Ni2+, which needs low overpotential to create the
initial nucleus, increases with temperature rise.
References
[1] M. Kamtami, H. Tsuji, Br. Pat. 2 104 (1982) 920.
[2] F.J. Fabri Miranda, O.E. Barcia, O.R. Mattos, R. Wiart, J.
Electrochem. Soc. 144 (1997) 3441.
[3] M. Pushpavanam, S.R. Natarajan, K. Balakrishnan, L.R.
Sharma, J. Appl. Electrochem. 21 (1991) 642.
[4] W. Kautek, M. Sahre, W. Paatsch, Electrochim. Acta 39 (1994)
1151.
[5] I. Brooks, U. Erb, Scripta Mater. 44 (2001) 853.
[6] J.B. Bajat, Z. Kacarevic-Popovic, V.B. Miskovic-Stankovic,
M.D. Maksimovic, Progr. Org. Coat. 39 (2000) 127.
[7] C. Muller, M. Sarret, M. Benballa, J. Electroanal. Chem. 519
(2002) 85.
[8] E. Beltowska-Lehman, P. Ozga, Z. Swiatek, C. Lupi, Surf.
Coat. Technol. 151 (2002) 444.
[9] A. Brenner, Electrodeposition of alloys, vol. 2, Academic
Press, New York, 1963, p. 194.
[10] E.P. Shoch, A. Hirsch, J. Am. Chem. Soc. 29 (1907) 314.
[11] M.F. Mathias, T.W. Chapman, J. Electrochem. Soc. 137 (1990)
102.
[12] S. Swathirajan, J. Electroanal. Chem. 221 (1987) 211.
[13] F. Elkhatabi, M. Benballa, M. Sarret, C. Muller, Electrochim.
Acta 44 (1999) 1645.
[14] G. Roventi, R. Fratesi, R.A. della Guardia, G. Barucca, J. Appl.
Electrochem. 30 (2000) 173.
[15] H. Ashassi-Sorkhabi, A. Hagrah, N. Parvini-Ahmadi, J. Man-
zoori, Surf. Coat. Technol. 140 (2001) 278.
[16] N. Koura, Y. Suzuki, Y. Idemoto, T. Kato, F. Matsumoto, Surf.
Coat. Technol. 169 (2003) 120.
[17] H. Fukushima, T. Akiyama, K. Higashi, Metallurgy 42 (1988)
242.
[18] T. Akiyama, H. Fukushima, K. Higashi, M. Karimk-hani, R.
Kammel, in: Proceedings of Galvatech’89, Tokyo, 1989, p. 45.
[19] K. Higashi, H. Fukushima, V. Takayushi, T. Adaniya, K.
Matsudo, J. Electrochem. Soc. 128 (1981) 2091.
[20] J. Horans, J. Electrochem. Soc. 128 (1981) 45.
[21] M.J. Nicol, H.I. Philip, J. Electroanal. Chem. 70 (1976) 233.
[22] S. Swathirajan, J. Electrochem. Soc. 133 (1986) 671.
[23] M. Lieder, S. Biallozor, Surf. Coat. Technol. 26 (1998) 23.
[24] M. Matlosz, J. Electrochem. Soc. 140 (1993) 2272.
[25] Y. Keith Sasaki, B. Jan Talbot, J. Electrochem. Soc. 147 (2000)
189.
[26] W.C. Grande, J.B. Talbot, J. Electrochem. Soc. 140 (1993) 675.
[27] N. Zech, E.J. Poldlaha, D. Landolt, J. Electrochem. Soc. 146
(1999) 2886.
[28] F. Elkhatabi, M. Sarret, C. Muller, J. Electroanal. Chem. 404
(1996) 45.
[29] T. Ohtsuka, E. Kuwamura, A. Komori, T. Uchida, ISIJ Int. 35
(1995) 892.
[30] C. Muller, M. Sarret, M. Benballa, Electrochim. Acta 46
(2001) 2811.
[31] H.Y. Lee, S.G. Kim, Surf. Coat. Technol. 135 (2000) 69.
[32] L. Zhongda Wu, P.L. Fedrizzi, Bonora, Surf. Coat. Technol. 85
(1996) 170.
[33] T.L. Ramachar, S.K. Panikkar, Electroplating Met. Finish 13
(1960) 405.
[34] A.B. Velichenko, J. Portillo, X. Alcobe, M. Sarret, C. Muller,
Electrochim. Acta 46 (2000) 407.
[35] S.A. Waston, Nickel development Institute Publications,
Report No. 13001, March 1988; S.A. Watson, Proceedings
of IMF Conference, 61–78, Torquay, April 1991.
[36] N. Short, A. Abibsi, J.K. Dennis, Trans. IMF 67 (1989) 73;
N. Short, A. Abibsi, J.K. Dennis, Trans. IMF 69 (1991) 145.