Simulating Attack Plans Against ICT Infrastructures
10
Simulating Attack Plans Against ICT Infrastructures Fabrizio Baiardi 1 , Fabio Corò 1 , Federico Tonelli 1 , Luca Guidi 2 and Daniele Sgandurra 3 1 Dip. di Informatica - Università di Pisa {baiardi,fcoro,tonelli}@di.unipi.it 1 Enel Ingegneria e Ricerca, Pisa, [email protected] 3 Istituto di Informatica e Telematica - CNR, Pisa, [email protected] Abstract Goal-oriented, rational threat agents attack a complex ICT infrastructure by com- posing elementary attacks against distinct components into an attack chain or attack plan. To compute statistics on the success probabilities of these plans, we have de- signed and implemented Haruspex, a tool that implements a Monte Carlo method by simulating the agent plans. A proper set of Haruspex experiments returns a set of data to compute statistics on the agent plans and their success probabilities even before deploying a system. In this way, we can assess with high confidence the robustness of a system and the risk it poses by considering scenarios where it is attacked by a set of agent. To fully automate the assessment, we have developed GVScan, a tool that maps the output of a vulnerability scanning into the inputs of Haruspex. This paper describes both Haruspex and GVScan and their adoption to assess the control plant of a power generation system. Keywords: Attack plan, Rational threat, Monte Carlo, Attack graph, Scenario. 1 INTRODUCTION Mostly goal-oriented, rational threat agent achieves their goals through attack chains or plans. As an example, a plan against an ICT infrastructure, e.g. a cloud system, may begin with an attack against a mail server to send some malware to some trusted clients of the infrastructure. After installing the malware, the next step in the plan uses the clients to attack some infrastructure node. Then, the plan may implement a privilege escalation and so on. Given the complexity of ICT infrastructures and the large number of factors that determine the success of a plan, currently plans and their success probabilities are discovered experimentally. To overcome this constraint, we have adopted a Monte Carlo strategy to produce samples for the statistics to assess a scenario where some agents attack the infrastructure. To automatically implement this solution, we have developed a set of tools to build the scenario description and then run the Monte Carlo method. The first tool, GVScan, builds the description of the target infrastructure starting from the output of a vulnerability scanner. Then, the second tool, Haruspex, implements an experiments
Transcript of Simulating Attack Plans Against ICT Infrastructures

Simulating Attack Plans Against ICT Infrastructures
Fabrizio Baiardi1, Fabio Corò1, Federico Tonelli1,Luca Guidi2 and Daniele Sgandurra3
1Dip. di Informatica - Università di Pisa {baiardi,fcoro,tonelli}@di.unipi.it1Enel Ingegneria e Ricerca, Pisa, [email protected] di Informatica e Telematica - CNR, Pisa, [email protected]
Abstract
Goal-oriented, rational threat agents attack a complex ICT infrastructure by com-posing elementary attacks against distinct components into an attack chain or attackplan. To compute statistics on the success probabilities of these plans, we have de-signed and implemented Haruspex, a tool that implements a Monte Carlo method bysimulating the agent plans. A proper set of Haruspex experiments returns a set of datato compute statistics on the agent plans and their success probabilities even beforedeploying a system. In this way, we can assess with high confidence the robustness ofa system and the risk it poses by considering scenarios where it is attacked by a set ofagent. To fully automate the assessment, we have developed GVScan, a tool that mapsthe output of a vulnerability scanning into the inputs of Haruspex. This paper describesboth Haruspex and GVScan and their adoption to assess the control plant of a powergeneration system.Keywords: Attack plan, Rational threat, Monte Carlo, Attack graph, Scenario.
1 INTRODUCTION
Mostly goal-oriented, rational threat agent achieves their goals through attack chainsor plans. As an example, a plan against an ICT infrastructure, e.g. a cloud system,may begin with an attack against a mail server to send some malware to some trustedclients of the infrastructure. After installing the malware, the next step in the planuses the clients to attack some infrastructure node. Then, the plan may implement aprivilege escalation and so on. Given the complexity of ICT infrastructures and thelarge number of factors that determine the success of a plan, currently plans and theirsuccess probabilities are discovered experimentally. To overcome this constraint, wehave adopted a Monte Carlo strategy to produce samples for the statistics to assess ascenario where some agents attack the infrastructure.
To automatically implement this solution, we have developed a set of tools tobuild the scenario description and then run the Monte Carlo method. The first tool,GVScan, builds the description of the target infrastructure starting from the output ofa vulnerability scanner. Then, the second tool, Haruspex, implements an experiments
consisting of several simulations, or runs, each mimicking the behavior of a set of threatagents that try to achieve some goals. Each agent starts with a set of privileges andhas access to some information on the target system. At each simulation step, at firstHaruspex computes the vulnerabilities the threat agents discover. Then, it simulates theattacks in the plan each agent selects and implements to increase its privileges. Basedon the success probability of the selected attack, Haruspex computes whether the attackis successful and, in this case, it grants to the implementing agent the proper privilegesthat the agent will acquire, and may use, in the next attack.
The simulation ends when either all the agents have reached their goals or a timelimit has been reached. In each run, Haruspex collects samples to compute the statisticsof interest. Since each run contributes to each statistics with one sample, the confidencein the statistics increases with the number of runs. By properly tuning this number, anexperiment can collect enough data to assess the security of the target infrastructure,even before its deployment. As an example, in this way alternative version of a systemcan be compared to discover the most cost effective one.
The remaining of this paper consists of six sections. Section 2 reviews related workson vulnerabilities, attack graphs, and attack simulations. Section 3 introduces the formaldescription of a scenario including both the ICT target system and the threat agents.Section 4 describes our tool GVScan to automatically provide the scenario descriptionfor Haruspex. Section 5 shows the attack plans description and how an agent selects aplan. Section 6 outlines the assessment of an ICT system that supervises and controls apower generation plan. Finally, we draw some conclusions.
2 RELATED WORKS
Attack graph are the most popular formalism to represent attack plans (Wang andDaniels 2008). With respect to other formalisms, such as (Bouissou and Bon 2003;Merrick and Parnell 2011), attack graphs consider the worst scenarios where an agentcan exploit any vulnerability. This simplifies the discovery of plans sharing someattacks and attach graphs have been used to assess a system under attack and to selectcountermeasures (Diamant 2011). Defense graphs (Sommestad et al. 2008) model thesuccess probability of attacks. Rational agent have been analyzed with reference toterrorism (Buede et al. 2012). Previous work (Gorodetski and Kotenko 2002) hasinvestigated the simulation of attacks against ICT or critical infrastructures. (Gordonand Loeb 2002) discusses the optimal security investment. With respect to our previouspapers that have presented our two tools (Baiardi et al. 2013b; Baiardi and Sgandurra2013) the original contribution of this paper is their integration to automatically assessan infrastructure and a case study.
3 DESCRIBING A SCENARIO
This section outlines the most important information in a scenario description. In thefollowing, we show that this description may be built by mapping the output of a
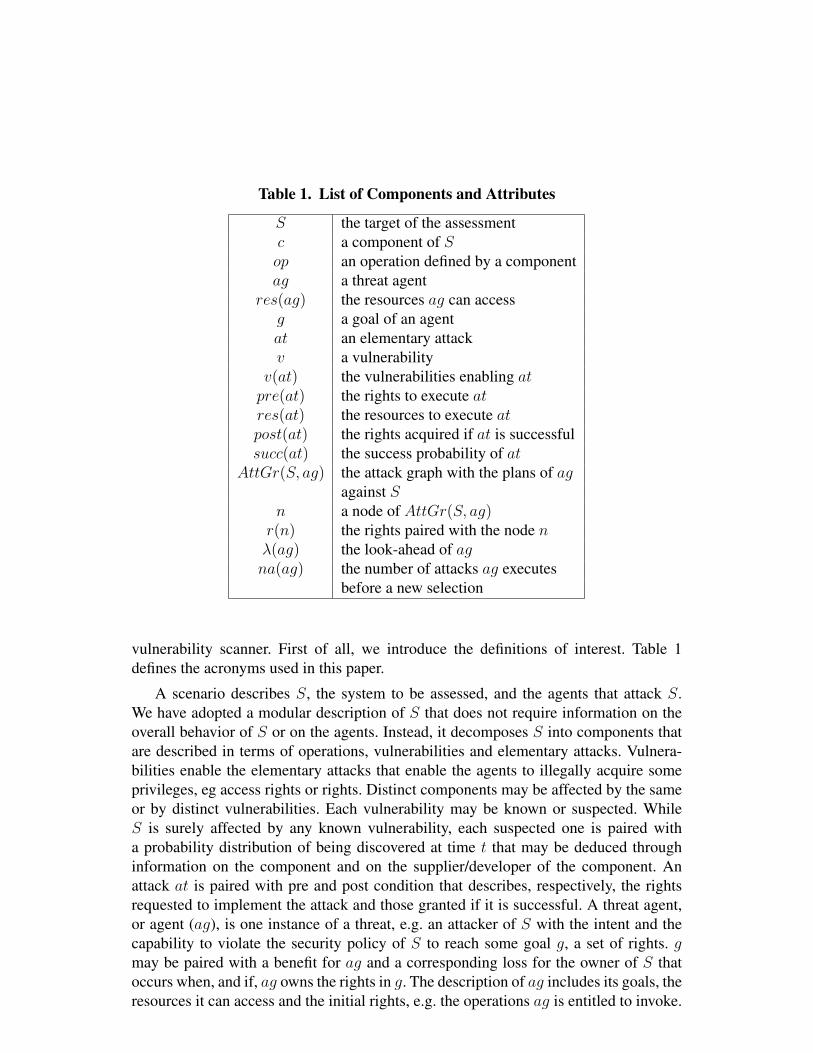
Table 1. List of Components and Attributes
S the target of the assessmentc a component of Sop an operation defined by a componentag a threat agent
res(ag) the resources ag can accessg a goal of an agentat an elementary attackv a vulnerability
v(at) the vulnerabilities enabling atpre(at) the rights to execute atres(at) the resources to execute atpost(at) the rights acquired if at is successfulsucc(at) the success probability of at
AttGr(S, ag) the attack graph with the plans of agagainst S
n a node of AttGr(S, ag)r(n) the rights paired with the node nλ(ag) the look-ahead of agna(ag) the number of attacks ag executes
before a new selection
vulnerability scanner. First of all, we introduce the definitions of interest. Table 1defines the acronyms used in this paper.
A scenario describes S, the system to be assessed, and the agents that attack S.We have adopted a modular description of S that does not require information on theoverall behavior of S or on the agents. Instead, it decomposes S into components thatare described in terms of operations, vulnerabilities and elementary attacks. Vulnera-bilities enable the elementary attacks that enable the agents to illegally acquire someprivileges, eg access rights or rights. Distinct components may be affected by the sameor by distinct vulnerabilities. Each vulnerability may be known or suspected. WhileS is surely affected by any known vulnerability, each suspected one is paired witha probability distribution of being discovered at time t that may be deduced throughinformation on the component and on the supplier/developer of the component. Anattack at is paired with pre and post condition that describes, respectively, the rightsrequested to implement the attack and those granted if it is successful. A threat agent,or agent (ag), is one instance of a threat, e.g. an attacker of S with the intent and thecapability to violate the security policy of S to reach some goal g, a set of rights. gmay be paired with a benefit for ag and a corresponding loss for the owner of S thatoccurs when, and if, ag owns the rights in g. The description of ag includes its goals, theresources it can access and the initial rights, e.g. the operations ag is entitled to invoke.

Agents are rational and adaptive as they minimize the number of attacks in a plan andselect a plan according to the goal of interest and the attack that can be implemented.As an example, ag may be a terrorist that aims to shut down some critical componentsof an ICT system to damage or destroy the production plants it controls.
4 BUILDING THE SCENARIO DESCRIPTION
We discuss the design of GVScan (Baiardi et al. 2013a), our tool that builds the descrip-tion of the target system, of its components, their vulnerabilities and the correspondingattacks. Since most of the scenarios of interest for an assessment differ because of theagents, the availability of a tool such as GVScan strongly reduces the complexity of theassessment. A further advantage is that an automatic tool increases the accuracy of thedescription and the size of the system that can be described.
The input of GVScan is a MySQL database with all the vulnerabilities in the variouscomponents running on the various nodes of S. The database is the output of thevulnerability scanning of each node. Distinct scanners can be applied, e.g. Nessus,to distinct nodes and the user can insert, remove or edit, any vulnerability. GVScandiscovers correlated set of vulnerabilities where two vulnerabilities are correlated if theattacks they enabled can be sequentialized in a plan. A set of correlated vulnerabilitiesis also referred as a global vulnerability. By discovering the global vulnerabilities of S,GVScan computes most of the information to describe S to Haruspex.
The analysis of GVScan is built around a classification of each vulnerability inthe input database into one of seven classes (see Table 2) according to the attacks itenables. Each vulnerability is classified according to its Common Vulnerabilities andExposures (CVE) description. The CVE is a publicly available list or dictionary ofstandardized identifiers for vulnerabilities and exposures. The adopted classificationmakes it possible to determine the pre and post conditions of the attacks that eachvulnerability enables. This classification also determines the pre and post conditions ofeach attack and its success probability. We refer to (Baiardi et al. 2013b) for a detaileddiscussion of the classification and of the current implementation.
GVScan can works in three modes. In the standalone version, GVScan computesthe attack surfaces of each node and then it discovers any global vulnerability. Thesecond mode is the most useful for an Haruspex scenario, because it returns thedescription of S that is fed to Haruspex. In this mode, at first GVScan computes theattack surfaces of each node in S. This information merges attack post conditionsand interconnection topology to discover the nodes that can be attacked from a givenone. This information is fundamental to discover alternative plans of an agent. Aftercomputing the attack surfaces, GVScan returns any vulnerability in each component ofS, the elementary attacks it enables and its pre and post conditions. In the third and lastmode, the user specifies some agents, their initial rights and their goals. Starting fromthis input, GVScan discovers the global vulnerabilities that enable the attack plans thateach agent may use to achieve its goals. In the first and last mode the user can boundthe length of a plan to neglect those that are too long so that their success probability is

so low and they may be neglected.
5 SELECTING AND IMPLEMENTING ATTACK PLANS
This section briefly defines plans and how an agent selects the plan it implements. Then,it briefly discusses how a Monte Carlo method that simulates the agent behavior mayreturn statistics to support a probabilistic risk assessment.
A plan is an ordered sequence of distinct elementary attacks such that:
i. ag acquires the rights to implement the i− th attack through the previous i− 1attacks;
ii. ag achieves one goal at the end of the sequence.
The attacks in a plan are distinct because there is no benefit in repeating a successfulattack. As an example, assume that ag aims to read and update a database in a noden′ of S. To achieve this goal, ag at first exploits a vulnerability in a distinct node nof S, to attack n and gain access to an account. Through this account, ag launches nagainst n′ to control a further account on this. From this account, ag launches a privilegeescalation attack to become the administrator of the database in n′. The three attacksbuild a plan pl to achieve the goal of controlling the database. Obviously, distinct plansfor the same or other goals can share any of the three attacks. In the following, a subplanis a sequence containing the last attacks in a plan.
Haruspex builds an attack graph that represents all the (sub)plans of an agentanytime the agent has to select the (sub)plan to implement.
5.1 Selecting a Plan
Provided that the current security status of S enables some attacks that ag hasnot successfully implemented yet, ag can select one (sub)plan and implement thecorresponding attacks. Meanwhile, some suspected vulnerabilities may be discovered.Hence, after implementing some attacks ag may select another plan for the same goal.As an example, in the previous example ag may select pl even if some the vulnera-bilities the third attack have not been discovered yet. However, ag may reconsider itsselection after attacking n and select another plan to control the database.
This shows that, besides their goals, agent are also characterized by their strategyto select a (sub)plan and by the number of attacks they implement before applying thisstrategy. The selection strategy defines how ag balances costs and benefits of alternativeplans. While the number of alternative strategies is unbounded, most of them share aparameter, which we define as λ(ag) or the look-ahead of ag. λ(ag) defines the amountof information that ag considers when selecting a plan. If λ(ag) = 0, then ag neglectsany information about S and randomly selects one of the attacks enabled by the currentrights of ag even if it surely fails because some suspected vulnerability has not beendiscovered yet. If λ(ag) > 0, then ag always selects a subplan starting with an attackthat is enabled by the known vulnerabilities of S and by the current rights of ag. If sucha subplan does not exist, then ag is idle, otherwise ag executes the first attack of the

subplan. The strategy may consider, among others, the success probability of attacks orthe impact of the goal of a plan. In any case, the selection only considers the first λ(ag)attacks of the subplan. As an example, if λ(ag) = 1, then ag ranks subplans accordingto their first attack while it considers the first two attacks if λ(ag) = 2. The strategy ofag fully exploits any information on a plan only if λ(ag) is at least equal to the lengthof the longest plan of ag.
As an example, if ag selects the plan with the best success probability and λ(ag) =2, then ag considers the joint success probabilities of the first two attacks in eachsubplan. If the second attack is not enabled yet, then the strategy also takes into accountthe probability that the proper vulnerabilities are discovered before the attack has tobe executed. Obviously, if a subplan only includes one attack at, ag only considersucc(at, ag).
The behavior of ag depends upon a further parameter, na(ag), the numbers ofattacks ag executes before applying the strategy. Hence, ag implements at most na(ag)attacks of the selected plan before applying again the strategy. Lower values of na(ag)enables ag to better exploits vulnerabilities discovered after the last selection. Obvi-ously, ag selects another subplan if the next attack in the current one is not enabled yet.Currently, Haruspex can pair each agent with one of the following strategies:
a) Random: it selects each plan with the same probability,b) Max Probability: it selects the plan with the highest success probability,c) Max Increment: it selects the plan granting the largest number of rights,d) Min Difference: it selects the plan granting the set most similar to a goal.
5.2 Success Probability of a Plan
We define pr(pl, ag), the success probability of a plan pl of ag, as the probabilitythat ag selects and successfully implements pl. This probability determines, amongothers, the probability that ag achieves g, the impact due to ag and the overall one.pr(pl, ag) is related to a large number of factors such as:
1) the probability of discovering the vulnerabilities that enables the attacks in pl,2) alternative plans enabled by the same vulnerabilities,3) the success probabilities of the attacks in pl,4) λ(ag) and of na(ag).
These relations strongly increases the complexity of computing pr(pl, ag). Forthese reasons, Haruspex adopts a Monte Carlo method that implements several inde-pendent runs, each simulating a set of agent for the same interval of time.
5.3 Simulating the Agent Plans
At each time tick of a run, Haruspex determines the suspected vulnerabilitiesthat are discovered, according to the corresponding probability distributions. Then, itconsiders an idle agent ag that has to reach at least one goal and applies the selectionstrategy of ag, with its parameters λ(ag) and na(ag) to determine the subplan, and
hence the attack at that ag implements. Then, ag is busy for all the time to implementat. Haruspex determines the success of at according to succ(at, ag). After havingconsidered any idle agents, Haruspex checks whether some agent has terminated anattack and achieved a goal. In this case, it records the agent, the goal and the time.Then, the next time tick is considered.
At the end of a run, Haruspex records in a database information on the plansthat have been successfully implemented, the components that have been attacked, theattacks that have been executed, the agent goals that have been reached. Then, the stateof S and of each agent is initialized and a new, independent run starts. At the end ofthe experiment, the database returned by Haruspex is used to compute the statistics ofinterest. As an example, the success probability of a plan is computed as the percentageof runs where the plan has been successfully implemented. The number of runs inan experiment may be fixed in advance or a new run may be started till reaching therequired confidence level on some statistics.
6 A CASE STUDY
This section describes the automatic assessment of an experimental IT infrastructure(Fovino et al. 2010), a supervision and control system in a thermoelectric plant forelectric power production. We have used GVScan to automatically build the scenariodescription and then Haruspex to simulate the agent plans.
6.1 The Target System
The target system consists of 30 nodes in three subnets: the Intranet network, theprocess network and the control one. The Intranet is connected to the process networkthrough a firewall and a distinct firewall connects the process network to the controlone. Each firewall filters and route messages between the subnets. Each subnet is flat asany distinct couple of its nodes can interact. The business processes of the organizationuse the Intranet network that interfaces the nodes in an external production plant withaccess privileges to nodes in the control network. This subnet has 6 nodes, and its maincomponents are a Windows Domain and two VPN Clients that remotely access theprocess network. The 17 nodes in process network run SCADA servers and clients,which act as the supervision and control system of the power production process. Somenodes are redundant for safety reasons. Lastly, the 7 nodes in the control networksimulate the electric power production plant through proper hydraulic circuits andProgrammable Logic Controllers (PLCs). The agents aim to control the PLCs to fullycompromise the power plant production.
6.2 Results of the Assessment
The whole system is affected by about 2700 local vulnerabilities, i.e. about 900 localvulnerabilities per subnet. The Windows domain server is the Intranet node with thelargest number of vulnerabilities, in the considered case 61. The process network nodewith the largest number of vulnerabilities, 634, is the ASC server. Finally, the PLCs are

Table 2. Percentage of vulnerability classes
Class PercentageRemote code execution with Admin privileges 44.0%
Further Output 17.0%Minor Vulnerabilities - Information disclosure 16.0%
Minor Vulnerabilities - Integrity Loss 5.4%Minor Vulnerabilities - Denial of Service 4.4%
Local Privilege Escalation 3.2%Admin Login Guessable 3.0%
Man in the Middle 1.9%User Login Guessable 1.7%
Remote to Local 0.4%Remote code execution with user privileges 0.1%
Not classified 2.9%
the control network nodes with the largest number of vulnerabilities, 10. GVScan hasnot classified 79 out of the 2700 vulnerabilities due to their informal description. Anyother vulnerability has been correctly classified.
Table 2 shows the distribution of the vulnerabilities among the seven classes. Thetarget system is vulnerable to remote code execution with Admin privileges and severalplan include the attacks enabled by vulnerabilities such as man in the middle and localprivilege escalation that enable the agent to control of the affected node.
To support the assessment of the target system, we have run about 20 experimentswhere we feed to Haruspex the output of GVScan. Taking into account the systemtopology, each experiment considers three agents that initially control a node in, re-spectively, the Intranet network, the process network, and the control one. For eachHaruspex selection strategy, we have run experiments with λ(ag) ∈ {1, 3}. λ(ag) = 1models an attacker that lacks information on the system to build and evaluate longplans. If, instead, λ(ag) = 3, ag is an insider that knows an optimal plan to control thePLCs. The system behavior is simulated for one year. To achieve a confidence level ofat least 95%, each experiment consists of 10K simulations.
Table 3 shows some statistics computed through the samples returned by Haruspex.The three values in each cell refer to agents starting, respectively, from the Intranet, theprocess, and the control Network.
According to these statistics, an agent with the proper information on the targetsystem can reach its goal with a few attacks. In fact, the average length of successfulplans is 3 if ag can access the Intranet subnet and λ(ag) = 3. For any other agent,reaching a goal is more complex. As shown in Table 3, an agent starting from theIntranet subnet needs several attacks before discovering the proper plan. As a furtherexample, an agent owning some rights on the VPN client in the Intranet can control aSCADA server through a vulnerability of the SMB protocol, which enables a remote

Table 3.Max Max Max Max
Random Probability Increment Probability Increment(λ(ag) = 0) (λ(ag) = 1) (λ(ag) = 1) (λ(ag) = 3) (λ(ag) = 3)
10 K 10 K 10 K 10 K 10 KSimulation Number 10 K 10 K 10 K 10 K 10 K
10 K 10 K 10 K 10 K 10 K100% 100% 100% 100% 100%
Success Percentage 100% 100% 100% 100% 100%100% 100% 100% 100% 100%5118 4703 110 44 100
Number of 4878 4557 66 33 66distinct plans 2 1 2 1 2
4,3 4,3 3 3 3Average length 4,3 4,3 3 3 3
of successful plans 2 2 2 2 28 8 4 4 4
Involved nodes 8 8 4 4 42 2 2 2 2
code execution. This grants the agent a full access to process network nodes to launchfurther attacks. The compromised SCADA server has two network interfaces connectedto, respectively, the process network and the control one. The agent can exploit a localvulnerability in the Control Station in the control network to enable the forwardingthrough these interfaces. Then, the agent exploits a PLC vulnerability to control theactuators of the power plant.
Haruspex output shows that the agents exploit at most 1200 local vulnerabilities.These are the only ones worth patching. However, the output also shows that thepatching of just two vulnerabilities prevents any agent from reaching its goal. The localvulnerability exploited in most plans, 20, is CVE-1999-0504, classified as “ADMINLOGIN GUESSABLE”. The node crossed by the largest number of attack paths, about220, is the ASC server.
All the Haruspex experiments have taken about 15 minutes on a 32-core blade with3Ghz CPU per core and 16Gb of ram. GVScan takes less than half an hour on thesame system to build the system description, eg to classify vulnerabilities and computethe node attack surfaces. Nessus (Beale et al. 2004), the vulnerability scanner we haveadopted, scans all the nodes in 3 hours.
7 CONCLUSION
We have discussed how the behavior of an agent may be formally described to simulatethe agent attacks against a system and to discover probabilities of interest for a PRA.Furthermore, GVScan can automatically build the description of a scenario of interest

making the process fully automated. The test case we have discussed shows that thesetools can return important information for an assessment.
REFERENCES
Baiardi, F., Corò, F., Tonelli, F., and Guidi, L. (2013a). “Gvscan: Scanning networks forglobal vulnerabilities.” First International Workshop on Emerging Cyberthreatsand Countermeasures, Regensburg, Germany (September).
Baiardi, F., Corò, F., Tonelli, F., and Guidi, L. (2013b). “Qsec: Supporting securitydecisions on an it infrastructure.” Eighth CRITIS Conference on Critical Infor-mation Infrastructures Security, Amsterdam, The Netherlands (September).
Baiardi, F. and Sgandurra, D. (2013). “Assessing ict risk through a monte carlomethod.” Environment Systems and Decisions, 1–14.
Beale, J., Deraison, R., Meer, H., Temmingh, R., and Walt, C. V. D. (2004). NessusNetwork Auditing. Syngress Publishing.
Bouissou, M. and Bon, J. (2003). “A new formalism that combines advantages of fault-trees and markov models: Boolean logic driven markov processes.” ReliabilityEngineering & System Safety, 82(2), 149–163.
Buede, D. M., Mahoney, S., Ezell, B., and Lathrop, J. (2012). “Using plural modelingfor predicting decisions made by adaptive adversaries.” Reliability Engineeringand System Safety, 108(0), 77 – 89.
Diamant, J. (2011). “Resilient security architecture: A complementary approach toreducing vulnerabilities.” Security Privacy, IEEE, 9(4), 80 –84.
Fovino, I. N., Masera, M., Guidi, L., and Carpi, G. (2010). “An experimental platformfor assessing SCADA vulnerabilities and countermeasures in power plants.”3rd International Conference on Human System Interaction, IEEE, 679–686,<http://dx.doi.org/10.1109/hsi.2010.5514494> (May).
Gordon, L. A. and Loeb, M. P. (2002). “The economics of information security invest-ment.” ACM Trans. Inf. Syst. Secur., 5, 438–457.
Gorodetski, V. and Kotenko, I. (2002). “Attacks against Computer Network: FormalGrammar-Based Framework and Simulation Tool.” Recent Advances in Intru-sion Detection, Vol. 2516 of LNCS, Springer, 219–238.
Merrick, J. and Parnell, G. S. (2011). “A comparative analysis of pra and intelligent ad-versary methods for counterterrorism risk management.” Risk Analysis, 31(9).
Sommestad, T., Ekstedt, M., and Johnson, P. (2008). “Combining defense graphs andenterprise architecture models for security analysis.” Enterprise DistributedObject Computing Conf. EDOC ’08, 349 –355 (sept.).
Wang, W. and Daniels, T. E. (2008). “A graph based approach toward network forensicsanalysis.” ACM Trans. Inf. Syst. Secur., 12, 4:1–4:33.