APLICATION OF ALOS AVNIR-2 IMAGES FOR ASSESSING AND MANAGING THE COASTAL ZONE RESOURCES IN INDONESIA...
10
APLICATION OF ALOS AVNIR-2 IMAGES FOR ASSESSING AND MANAGING THE COASTAL ZONE RESOURCES IN INDONESIA PI No 325 Sam Wouthuyzen Research Center for Oceanography, Indonesian Institute of Sciences, Jl. Pasir Putih 1, Ancol Timur, Jakarta 11048, Indonesia ABSTRACT This report describes the application of high resolution of ALOS AVNIR-2 satellite images for mapping, monitoring and evaluating the living resources in some coastal zones of Indonesia. A total of 15 set ALOS AVNIR-2 images were used for analyzing the unique and very large area of tropical coastal zone ecosystems, such as coral reefs, seagrasses, and mangroves, as well as the potency of living resources within those ecosystems. Results show that ALOS AVNIR-2 data are effectively and efficiently met for the above proposes and further can be usefully used as a tool in managing the coastal zone of Indonesia. Some examples are discussed in this report. INTRODUCTION Indonesia is the biggest archipelago country in the world. It consist more than 17,000 big and small Islands with 81,000 km coast line, the second longest coastline after Canada. Almost 70% of the areas are covered by seas. Geographically, Indonesia is located in the tropical areas between Asian and Australia Continents, and between Pacific and Indian Oceans. As tropical country, there are 3 unique ecosystems, namely mangroves, seagrass and coral reefs that are easily found everywhere, including marine living resources in each ecosystem such as coral reef fishes, crustaceans, mollusks, echinoderms, seaweeds, and many others organisms. Indonesia is also well-known as the center of mega marine biodiversity in the world. Many of the resources are having economical values, and thus, they are very important for the local communities who live nearby the particular ecosystems. With such huge coastal areas of Indonesia, it is not possible to conduct inventory, mapping, monitoring and evaluating their big potential of resources. Thus, it is difficult to conduct good management without using effective and efficient methods. Recently, remote sensing technology has been applied widely for solving the above problems, especially with the availability of various kinds of earth observing satellites data, which one among them is ALOS (Advanced Land Observing Satellite). This paper reports the applications of ALOS satellite data for studying the marine resources in some coastal zones of Indonesia, with emphasized on the optical remote sensing data of AVNIR-2 (Advanced Visible and Near Infrared sensor). At the first time, We proposed to JAXA to become PI of ALOS data for investigating and monitoring the algal blooms (red tides) in the Jakarta Bay using AVNIR-2. The result has been reported in the First Joint PI Symposium of ALOS Data Nodes for ALOS Science Program in Kyoto on November 19-23, 2007. However, due to repetitiveness of ALOS is 46 days, then these data were not appropriate for monitoring algal blooms. Latter, I changed the objective of the study from monitoring algal blooms to application of ALOS AVNIR- 2 data for assessing the coastal zone resources. Several applications of ALOS AVNIR-2 discus in this paper include: 1). Shallow water bathymetry mapping, in west part of Biak Island (Supiori) and Padaido Islands that representing east part of Indonesian region, and in Pari Island (Seribu Islands) that representing west part of Indonesia. The maps then used to assess the potency (standing stock) of coral reef fishes 2). Mapping and monitoring of seagrass beds and their surrounding environment in the east part of Bintan Island, 3). Mapping, monitoring and evaluating mangrove areas in Maluku Province, and 4). To estimate the brown algae (Sargasum sp) density for supporting the alginate Industry in the reef flat of Pamengpeuk (south coast of west Java) and south coast of Jogjakarta (central Java). METHODS This study was conducted in wide areas of Indonesian coastal zones as shown in Fig.1 during the evaluation of the potency of ALOS satellite from 2006 to 2010. Study sites For mapping the shallow water of coral reef areas, algorithm developed by [1, and 2] was used. Bathymetry mapping and assessment of reef fish stocks Z= -1/2K ln(V-VS) + 1/2K(lnVo) ……………….1) Where, PI325-1
-
Upload
independent -
Category
Documents
-
view
0 -
download
0
Transcript of APLICATION OF ALOS AVNIR-2 IMAGES FOR ASSESSING AND MANAGING THE COASTAL ZONE RESOURCES IN INDONESIA...

APLICATION OF ALOS AVNIR-2 IMAGES FOR ASSESSING AND MANAGING THE COASTAL ZONE RESOURCES IN INDONESIA
PI No 325
Sam Wouthuyzen
Research Center for Oceanography, Indonesian Institute of Sciences, Jl. Pasir Putih 1, Ancol Timur, Jakarta 11048, Indonesia
ABSTRACT
This report describes the application of high resolution of ALOS AVNIR-2 satellite images for mapping, monitoring and evaluating the living resources in some coastal zones of Indonesia. A total of 15 set ALOS AVNIR-2 images were used for analyzing the unique and very large area of tropical coastal zone ecosystems, such as coral reefs, seagrasses, and mangroves, as well as the potency of living resources within those ecosystems. Results show that ALOS AVNIR-2 data are effectively and efficiently met for the above proposes and further can be usefully used as a tool in managing the coastal zone of Indonesia. Some examples are discussed in this report.
INTRODUCTION
Indonesia is the biggest archipelago country in the world. It consist more than 17,000 big and small Islands with 81,000 km coast line, the second longest coastline after Canada. Almost 70% of the areas are covered by seas. Geographically, Indonesia is located in the tropical areas between Asian and Australia Continents, and between Pacific and Indian Oceans. As tropical country, there are 3 unique ecosystems, namely mangroves, seagrass and coral reefs that are easily found everywhere, including marine living resources in each ecosystem such as coral reef fishes, crustaceans, mollusks, echinoderms, seaweeds, and many others organisms. Indonesia is also well-known as the center of mega marine biodiversity in the world. Many of the resources are having economical values, and thus, they are very important for the local communities who live nearby the particular ecosystems.
With such huge coastal areas of Indonesia, it is not possible to conduct inventory, mapping, monitoring and evaluating their big potential of resources. Thus, it is difficult to conduct good management without using effective and efficient methods. Recently, remote sensing technology has been applied widely for solving the above problems, especially with the availability of various kinds of earth observing satellites data, which one among them is ALOS (Advanced Land Observing Satellite). This paper reports the applications of ALOS satellite data for studying the marine resources in some coastal zones of
Indonesia, with emphasized on the optical remote sensing data of AVNIR-2 (Advanced Visible and Near Infrared sensor).
At the first time, We proposed to JAXA to become PI of ALOS data for investigating and monitoring the algal blooms (red tides) in the Jakarta Bay using AVNIR-2. The result has been reported in the First Joint PI Symposium of ALOS Data Nodes for ALOS Science Program in Kyoto on November 19-23, 2007. However, due to repetitiveness of ALOS is 46 days, then these data were not appropriate for monitoring algal blooms. Latter, I changed the objective of the study from monitoring algal blooms to application of ALOS AVNIR-2 data for assessing the coastal zone resources.
Several applications of ALOS AVNIR-2 discus in this paper include: 1). Shallow water bathymetry mapping, in west part of Biak Island (Supiori) and Padaido Islands that representing east part of Indonesian region, and in Pari Island (Seribu Islands) that representing west part of Indonesia. The maps then used to assess the potency (standing stock) of coral reef fishes 2). Mapping and monitoring of seagrass beds and their surrounding environment in the east part of Bintan Island, 3). Mapping, monitoring and evaluating mangrove areas in Maluku Province, and 4). To estimate the brown algae (Sargasum sp) density for supporting the alginate Industry in the reef flat of Pamengpeuk (south coast of west Java) and south coast of Jogjakarta (central Java).
METHODS
This study was conducted in wide areas of Indonesian coastal zones as shown in Fig.1 during the evaluation of the potency of ALOS satellite from 2006 to 2010.
Study sites
For mapping the shallow water of coral reef areas, algorithm developed by [1, and 2] was used.
Bathymetry mapping and assessment of reef fish stocks
Z= -1/2K ln(V-VS) + 1/2K(lnVo) ……………….1)
Where,
PI325-1

Fig.1 Map of Indonesia showing the study sites (1. Biak and Padaido Islands; 2. Pari Island; 3. Bintan Island; 4. Ceram and Buru Islands, 5. Coast of Pamengpeuk, and 6. Coast of south Jogjakarta).
Z = water depth (m) measured in the field use an echo sounder equip with a GPS,
V = observed signal, VS = portion of signal resulting from scattering of
radiation in the atmosphere, water column, and water surface;
k = water attenuation coefficient; VO = sensitivity factor consisting of contributions from
solar irradiance at the surface, the bottom reflectance, atmospheric transmission, and sensor equipment.
The equation 1) can be simplified as a simple linear regression equestion as;
depth = slope (X) + constant.
With slope=-1/2K, and constant-1/2K(ln VO).
By first calculating the transformed radiance or Digital Number (DN) values and then correlating them against control points of known depth, the variables in the above equation can be calculated and produced estimation for bathymetry. VS can be estimate from the spectral properties of the deepest water in the image; that is a depth beyond the penetrating ability of or green bands [2].
To assess the coral reef fish abundance, visual census using underwater transect called Line Intercept Transect (LIT) introduced by [3] was used (Fig. 2). The length of transect is 50 m. The scuba divers counted the reef fishes along the transect line with wide of 2.5 m to the left and 2.5 m to the right. Thus the total of observed areas is 50m x (2.5m+2.5m) = 250m2.
Fig. 2. Visual census of reef fishes using LIT
Coral reef fishes were divided into 3 groups: 1). Target fishes, the fishes that become target of catch by the fishermen due to their economic values; 2). Indicator fishes, the fishes mainly belong to butterfly fishes species (Chaetodontidae) that used as an indicator of the health of coral reef, because they have strong relationship with their habitat, and 3) Mayor fishes, the fishes that generally small in size and having beautiful color (mostly aquarium fish) [4]. Fish identification during visual census was done using identification book of [5] and [6].
Based on visual census, the density of reef fishes can be calculated as:
D (density of fish/m2) = N / 250 ……………. 2)
S (Standing Stock of fish) = A x D .………… 3)
Where, N= number of fish, and A are the areas obtained from bathymetry map derived from ALOS AVNIR-2.
To collect bio-ecological field data of seagrass, rapid seagrass assessment survey using a 0.5 x 0.5 m frame was used followed the procedure of [7]. This frame was randomly throw to the seagrass areas, first throw was near to border between coral reefs and seagrass, the second one was in the middle area between the coral reefs and coast line, while the third was near to the coast line. The data within the frame, such as seagrass species, their percent covers, and biomass were collected (Fig. 3). The coordinate of each frame center were recorded using a GPS.
Seagrass mapping
Fig. 3. Field works during seagrass sampling. To map seagrass beds areas and to monitor its changes, Landsat-7 ETM+ images (parh/row: 123/059) and two ALOS AVNIR-2 images acquired on 5 May 2007 and 14 April 2009 were used. These images were cropped for the areas of study site only (east coast of Bintan Island). Simple atmospheric correction procedure called dark object subtraction (DOS) [8] was applied to remove the bias due to atmospheric influences. Map of habitats along the east coast of Bintan Island was made using cluster analysis module in the image processing packages (IDRISI ANDES software). Cluster analysis classified the study sites into 21 classes of substrates. Total number of 295 ground control points (GCP) of seagrass habitat and
PI325-2

58 GCP of non-seagrass habitat were used to validate the results of cluster analysis. After careful validation, the 21 classes of substrates were regroup again into six classes, namely land, dense, medium seagrass beds, seagrass mixed with sand, sand, and sea.
- Near infrared (Band-4) to Red band (band 3),
Mangrove and brown algae (seaweed) mapping
To map mangrove, a simple procedure was developed as followed: Extract the maximum digital number (DN) values of ALOS AVINIR-2 between:
- Red band and Green band (Band-2), and - Green Band to Blue (Band-1).
It assume that combination of bands 4, 3 and 2 is good for classifying mangroves and land forest (vegetation), while combination of bands 3, 2 and 1 can clearly show the features in shallow water, such as coral reef, seagrass, sand, etc.
Brown algae, particularly from genus Sargassum are important because they produce alginate, which is very important in pharmacy/medical, food, textile and paper industries. Alginate is used as stabilizer, thickener or emulsifier agents. Although the raw materials are abundance in Indonesia, their stocks are unknown, and alginates are still import from abroad.
To know the natural stock of Sargassum, the effective method of remote sensing was used using ALOS AVNIR-2 data. Cluster analysis was applied for classifying the habitat, such as Sargassum bed, other macro alge, seagrass beds, send, rock and other habitat in the reef flat of Pamengpeuk, South of Jogjakarta, and in the Pari Island, as shown at the sites no. 5, 6 and 2 in Fig. 1, respectively. Habitat maps produced from cluster analysis were then verified using field survey data (Fig. 4). The potency of Sargassum was calculated using equation 2 and 3, where the average density (D) of sargassum = total biomass of sargassum/number of transects, while standing stock of Sargassum = D x the areas (A) classified as Sargassum (ha) from the habitat map derived using ALOS AVINIR-2 data.
Fig. 4. Field works during Sargassum sampling in the Pamengpeuk (top) and in the Pari Island (bottom).
RESULTS AND DISCUSSION
No.
Shallow bathymetry map derived from ALOS AVNIR-2 and assessmeny of coral reef fish.
Table 1 lists ALOS AVNIR-2 images that used in the analysis. Fig 5 shows plot between the depth and ln(DN-VS) of Blue (band-1), Green (band-2) and Red (band-3) bands of AVNIR-2 (see Equation 1) for Biak - Padaido Islands and Pari Island which represent east and west parts of Indonesia, respectively.
Table 1. ALOS AVNIR-2 Data used for bathymetry mapping and coral reef fish stock assessment.
Study sites Date Path/Frame 1. South Biak - Upper
Padaido Islands 2006/11/14 2007/05/17 2010/05/25
059/3620
2. South Biak - Lower Padaido Islands
2008/09/17 2010/08/08
058/3620
3. Pari Island 2008/04/30 112/3720
Fig. 5. Plot of depth against the values of (DN-VS) of Blue, Green and Red bands of AVNIR-2 for Biak and Padaido (upper row) and Pari Island (lower row).
From those 3 visible bands, the Green band gives the best results both for Biak-Padaido Islands and Pari Island (R2=0.82; and 0.96), compared to Blue (R2=0.54; and 0.87) and Red (R2=0.48; and 0.39) bands in predicting shallow water depth. The equations for mapping shallow water bathymetry for Biak-Padaido Islands and Pari Island are expressed as follow:
Depth (m) = 22.243–4.304*ln(DN band-2 –VS2) …... 4)
Depth (m) = 1/(0.107 * ln(DN B2-VS2)^3 – 0.447 * ln (DN B2-VS2)^2+ 0.444* ln(DN B2-VS2) + 0.114) ……………………….……...... 5)
Theoretically, in the clear water as coral reef ecosystem, the Blue band has the greatest ability to penetrate the water column. However, since the blue band is very easily influenced by atmospheric disturbances, thus Blue band could not produced good result as it expected. From bathymetry mapping experiences using various satellites
PI325-3

such as Landsat-TM, ETM+, Formosat, QuickBird, as well as ALOS AVNIR-2, I found that Green band was always correlated best with depth [9].
Fig. 6 shows shallow water bathymetry maps produced from ALOS AVNIR-2 using equation 4 and 5 for Biak-Padaido Islands, and Pari Island, respectively. From the bathymetry maps, the areas of reef flat in which the reef fishes live can be calculated. The water depth was grouped in to 5 interval depth (< 1m, 1-1.5 m, 1.5-5.0 m, 5.0-10.0 m, and > 10m). In this study, only areas between >1.5 to 10 m were calculated, because depth <1.5 m was exposed during low tide, while >10 m was not considered, since visual fish census was conducted not deeper than 10 m depth.
Reef fishes are divided into 3 groups, target, indicator and major (Fig. 7). The density of each fish group, the areas of reef between 1.5 and 10 m depth, and the standing stock of fishes in the Biak-Padaido Islands, and Pari Island is summarized in Table 2.
So far, fish stock assessment usually was conducted for pelagic and demeral (bottom) fishes with established methodology, while reef fishes and other marine living resources such as mollusks, crustaceans, echinoderms, sea weeds and others are seldom assessed due to the lack of equipment, and it is very difficult and danger to conduct survey using a vessel in the shallow waters, such as coral reef ecosystems. Furthermore, it is consume time and budget to survey huge coastal areas as in Indonesia. Fortunately, with the available satellites data, especially high resolution data, such as ALOS AVNIR-2 (10x10 m),
then it is possible to apply those data for mapping, monitoring, evaluating and managing the coastal living resources effectively and efficiently.
Seagrass mapping was conducted in west coast of Bintan Island, which is the outer Island bordered with Malaysia and Singapore and laid in the Malacca Strait, one of the busiest sea lane in the world.
Seagrass Mapping
Seagrass is submerged flowering plants (angiosperms) that can form dense beds in shallow subtidal, mostly clear and sheltered, soft bottomed marine and estuarine environments [10, 11]. Seagrass very important because they provide shelter, spawning and nursery ground for various marine biotas [12]. The productivity of seagrass is higher than rainforest. They recycle nutrients and trapping sediments and CO2 effectively [13, 14]. Seagrass is home for endangered species, such as Dugong and sea turtle [15]. Thus, seagrass ecosystem provides environmental services and products for local community.
However, seagrass in Bintan Island faced various threats, from human activities, as unfriendly land use, sand mining, tourism industry, eutrophication, sedimentation and others. Thus proper management is needed to protect seagrass in this island. Therefore, at the first step, data based on the bio-ecological of seagrass, seagrass maps, and other data must be collected.
Fig. 8 shows the map of seagrass in Bintan Island derived using ALOS AVNIR-2 data of Path/Frame No:118/3580 (2007/05/08) and Path/Frame No:119/3580 (2009/04/14).
Fig. 6. Bathymetry maps of Biak (A and C), Lower and Upper part of Padaido Islands (B and C), and Pari Island (D) derived from ALOS AVNIR-2.
P. Padaidori
P. Bromsi
P. Pasi P. Pakreki
P. Miosmangguandi
PI325-4

Fig. 7. An example 3 groups of reef fishes that assessed their standing stocks in this study
Table 2. Reef Areas (ha) calculated from bathymetry maps in Fig.6; Density of reef fish (fish/m2) from field survey; and standing stock of fish (numbers of fish x 103) from Biak-Padaido Islands and Pari Island.
Parameter
1. Bathymetry and areas (ha)
<1 m
1-1.5 m
1.5-5 m
5-10 m
-Biak- Padaido 664 1124 4527 5637 -Pari Island 17 162 61.0 63.3 2. Fish Density (fish/m2 ) Target Indicator Major
- Biak – Padaido Islands 0.425 0.250 1.260 - Pari Island 1.321 0.077 2.326 3 Standing Stocks (fishx103) Target Indicator Major
-Biak-Padaido Islands
1.5-5m 19,238 11,137 57,035 5-10m 23,955 14,091 71,020
-Pari Island 1.5-5m 806 47 1,419 5-10m 836 49 1,472
The total areas of seagrass calculated from the map after careful verification using field observation data was around 2597 ha. The accuracy of the map is around 80%. Monitoring seagrass using Landsat-7 ETM in 2003 and Landsat-5 TM in 2008 showed that areas of seagrass were 2600 ha and 2559 ha, respectively. This indicated that
Fig. 8. Map of seagrass in the east coast of Bintan produced using ALOS AVNIR-2
the changes of seagrass areas in the east coast of Bintan within 6 years can be neglected.
Based on field survey, 10 species of seagrass (Fig. 9) was found out of 12 species of Indonesian seagrass. Thus, Bintan is one place that has the richest seagrass diversity in Indonesia. Seagrass along the east coast of Bintan is still in good condition which, indicated by the association of seagrass with other flora and fauna. This makes the productivity in this ecosystem is high, and further provide various commercial fisheries products for local fishermen in Bintan as shown in Fig, 10.
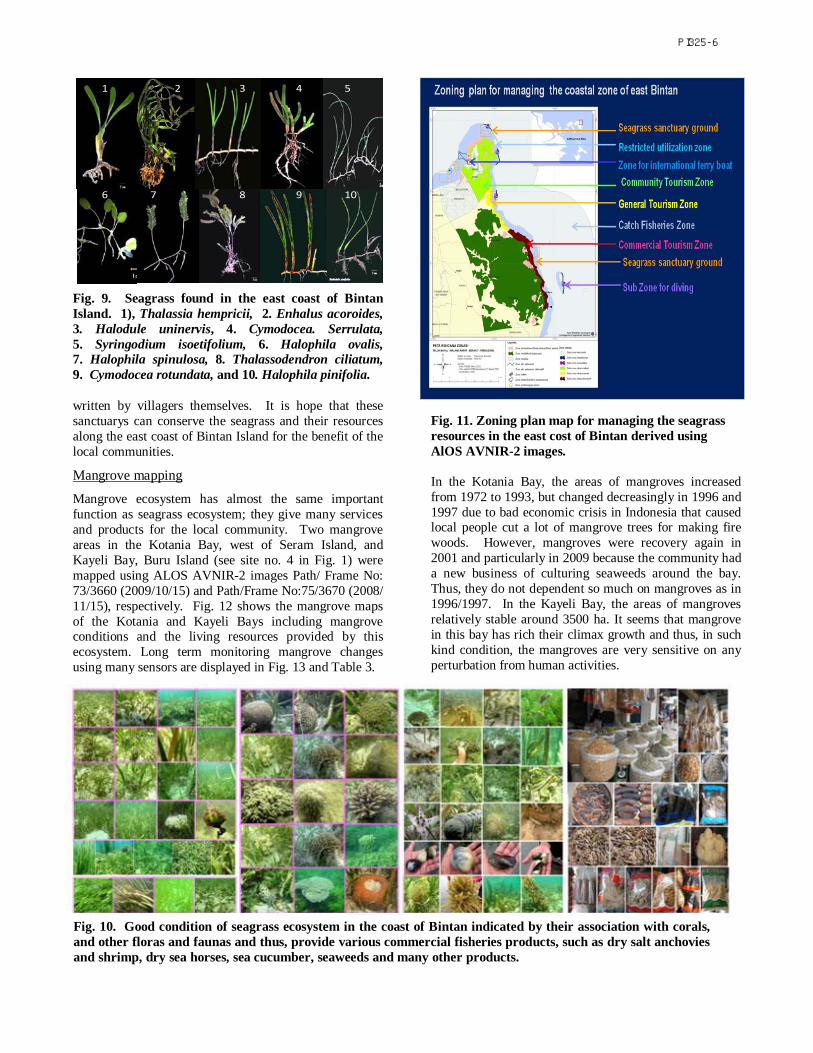
Based on the seagrass map in Fig. 8, and various data such as bio-ecology, social-economy and culture of local community and others data, then it is possible to develop a zoning plan map for managing the resources of seagrass in the coastal zone (Fig.11). Using this map, several focus group discussions (FGD) was conducted with the local community. Explanation why seagrass ecosystem important was also introduces. After long discussion in 4 FGD sessions (2 years), finally, the local community agreed to release their seagrass areas around 4-6 ha for establishing a demonstration site of seagrass sanctuary in 4 villages. In each sanctuary, it is prohibited to do any activities. Persons who enter and do activities will be punished according to the agreement in a decree that
PI325-5
1 2 3 4 5
6 7 8 9 10
Fig. 9. Seagrass found in the east coast of Bintan Island. 1), Thalassia hempricii, 2. Enhalus acoroides, 3. Halodule uninervis, 4. Cymodocea. Serrulata, 5. Syringodium isoetifolium, 6. Halophila ovalis, 7. Halophila spinulosa, 8. Thalassodendron ciliatum, 9. Cymodocea rotundata, and 10. Halophila pinifolia.
written by villagers themselves. It is hope that these sanctuarys can conserve the seagrass and their resources along the east coast of Bintan Island for the benefit of the local communities.
Mangrove mapping
Mangrove ecosystem has almost the same important function as seagrass ecosystem; they give many services and products for the local community. Two mangrove areas in the Kotania Bay, west of Seram Island, and Kayeli Bay, Buru Island (see site no. 4 in Fig. 1) were mapped using ALOS AVNIR-2 images Path/ Frame No: 73/3660 (2009/10/15) and Path/Frame No:75/3670 (2008/ 11/15), respectively. Fig. 12 shows the mangrove maps of the Kotania and Kayeli Bays including mangrove conditions and the living resources provided by this ecosystem. Long term monitoring mangrove changes using many sensors are displayed in Fig. 13 and Table 3.
Fig. 11. Zoning plan map for managing the seagrass resources in the east cost of Bintan derived using AlOS AVNIR-2 images. In the Kotania Bay, the areas of mangroves increased from 1972 to 1993, but changed decreasingly in 1996 and 1997 due to bad economic crisis in Indonesia that caused local people cut a lot of mangrove trees for making fire woods. However, mangroves were recovery again in 2001 and particularly in 2009 because the community had a new business of culturing seaweeds around the bay. Thus, they do not dependent so much on mangroves as in 1996/1997. In the Kayeli Bay, the areas of mangroves relatively stable around 3500 ha. It seems that mangrove in this bay has rich their climax growth and thus, in such kind condition, the mangroves are very sensitive on any perturbation from human activities.
Fig. 10. Good condition of seagrass ecosystem in the coast of Bintan indicated by their association with corals, and other floras and faunas and thus, provide various commercial fisheries products, such as dry salt anchovies and shrimp, dry sea horses, sea cucumber, seaweeds and many other products.
PI325-6

Fig. 12. Maps of mangroves in the Kotania Bay, west of Seram Island (top) and Kayeli Bay, Buru Island (bottom), Maluku Province and various living resources provided by this ecosystem. (Red: mangrove, Green: land forest, Light blue: reef flat that covered by seagrass, Dark blue: sea)
Fig. 13. Long term monitoring the changes of mangrove in the Kotania Bay (top) and Kayeli Bay (bottom).
PI325-7

Table 3. Long term monitoring mangrove changes in the Kotania and Kayeli Bays.
Year Satellite and sensor Areas (ha)
Changes (ha/year)
Kotania Bay (west Seram Island) 1972 Landsat-1 MSS 1023 --- 1985 Landsat-5 MSS 1199 +12.6 1993 Landsat-5 TM 1241 + 6.0 1996 Landsat-5 TM 1179 - 20.7 1997 Landsat-5 TM 1064 -76.7 2001 Landsat-7 ETM+1 1140 +19.0 2009 ALOS AVNIR-2 1448 +38.5 Kayeli Bay (Buru Island) 1986 Landsat-5 MSS 3525 --- 1992 Landsat-5 TM 3535 +1.6 1996 Landsat-5 TM 3520 -3.9 2001 Landsat-7 ETM+ 3519 -0.2 2008 ALOS AVNIR-2 3529 +1.4
The average of litter produced from only leaf-fall of mangroves was 2.5 gram/m2/day or equally around 12,460 and 26,100 tons/year for the Kotania and Kayeli Bays, respectively. Therefore, mangrove ecosystems in these two bays are very productive and thus, they supported life for various kind of living resources, such as fishes, crustaceans, mollusks, echinoderms, seaweeds and many other floras and faunas. In the Kotania Bay, the productivity was not yielded only from mangroves, but also from dense seagrasses in the reef flat areas (Fig.12). Because of high productivity, in the north part of the Kotania Bay was used for pearl culture too.
The simple procedure applied for mapping mangrove using ALOS AVNIR-2 data as described in the method is very effective, not only for mangrove, but also for other habitat such as reef and seagrass beds (see Fig.12).
Sargassum mapping and stock assessment was done in the Pamengpeuk and Jogjakarta, south coast of Java that faced to Indian Ocean and also in the Pari Island (sites no. 5, 6 and 2 in Fig.1) using ALOS AVNIR-2 (Table 4) Fig. 14 display Sargasum habitat maps of Pamengpeuk.
Sargassum (brown algae) mapping and stock assessment
Table 4. ALOS AVNIR-2 Data used for Sargassum mapping and assessing their stock.
No. Study sites Date Path/Frame 1. Pamengpeuk, West
Java 2008/04/25 2009/09/14
109/3750 122/3730
2. South of Jogjakarta, Central Java
2009/08/05 2008/06/17
104/3760 104/3760
3. Pari Island 2009/08/03 112/3720 In the Pamengpeuk, two condition of Sargassum was mapped, first, during non-growing phase (April), and secondly during the growing phase (September). During non-growing season, classification of habitat is slightly difficult, especially to separate between Ulva (green algae) and Sargassum. From 43 ground control points
Fig. 14. Habitat map of Sargassum (brown algae), Ulva (green alge), seagrass, sand, shallow pool in the Pamengpeuk beach during non-growing (top: 2009/09/14) and growing seasons (bottom: 2008/09/14).
(GCP) of Sargassum (white box in Fig.14), 70% were matched, while for Ulva (red box) 49% of 23 GCPs were classified as Sargasum, only 26 % were matched as Ulva. Seagrass (yellow box) had the highest accuracy of 83 %. During the growing season, Sargassum and Ulva were clearly separated. Sargassum consistently had the same accuracy of 70 %, while accuracy for Ulva and seagrass were increased to 71% and 91%, respectively.
Spectral analysis of Sargassum, Ulva and seagrass for two different growing seasons (Fig. 15) indicates that Sargassum and Ulva has almost the same pattern, except that the Digital Number (DN) values in the non-growing season was higher than in the growing season. This is due to the influence of bottom reflectance from the substrate (rocks) in which Sargassum and Ulva attached. During the growing season, rocks were entirely covered by dense Sargassum and Ulva, and thus, they show low spectral responses (low DN). Seagrass nearly had similar pattern of low DN values in both seasons.
Fig.15. Spectral response of ALOS AVNIR-2 for Sargasum, Ulva and Seagrass during non-growing (broken line) and growing seasons (solid line).
PI325-8

In the coastal of south Jogjakarta and in the Pari Island (Fig. 16), Sargassum was mapped during the early growing seasons.(August). Images in the non-growing season for both places were not available. Brown algae that dominated in all sampling areas was Sargasumm duplicatum, but in Pari Island, there were 2 other species, Sargassum polycystum and Hormopysa sp. Table 5 shows the total standing stocks of wet weight various kind of brown algae in each sampling site calculated using habitat map of Sargassum derived from ALOS AVNIR-2 Images and their density from field survey, assuming that the accuracy of habitat map for the 3 sampling sites are 70%, 61% and 54%, respectively.
Generally, our experiences show that the ratio of dry to wet weight of Sargassum is about 1:10. The same ratio is also apply to convert the dry weight of Sargasum for producing alginate. Thus, the production of alginate from those 3 locations (Table 5) are 1.730, 0.266 and 14.722 tons of alginate, respectively. If the price of low grade
Fig16. Habitat map of Sargassum (brown algae), Ulva (green algae), seagrass, in the south coast of Jogjakarta (top) and in the Pari Island (Bottom)
Table 5. Total Standing stocks of wet weight various brown algae in each sampling site, assuming that the map accuracy for Pamengpeuk, South coast of Jogjakarta and Pari Island are 70%, 61% and 54%, respectively. Sampling site, Season and kind of brown algae
Area (ha)
Density (g/m2)
Standing stocks (tons)
1. Pamengpeuk, West Java
- Growing season S. duplicatum - Non-growing
60.4
40.8
409 -
247.1 -
Total standing stock for Pamengpeuk 173.0 *) 2. South of Jogjakarta, Central Java - Growing season S. duplicatum
33.1
131.6
43.6 Total standing stock for Jogjakarta 26.6 *)
3. Pari Island - Growing season: S. duplicatum
S. Polycystum Hormopysa sp.
186
562 398 500
1045.3 740.3 930.0
Total standing stock for Pari Island 1477.2 *) Note : *) Potency of Sargassum after correction have been made based on map accuracy in each site. alginate is 100 US dolars/kg, then the direct values earned from Sargassum resources for each site are US$ 173,000, 26,000 and 1,477,200, respectively. There still a lot of direct and indirect values of the ecosystem in each study site that are not yet accounted for. Furhermore, based on this result (natural potency of Sargassum) it is possible to consider how big an alginate factory must be constrcted, if one want to develop alginate industry.
CONCLUSIONS
All examples desribed in this report show that how effective, efficient and powerfull the role of high resolution of sattellite images of ALOS AVNIR-2 for mapping, monitoring, evaluating and managing the coastal zone ecosystems and their living resources in the very huge coastal areas as Indonesia.
The drawback of optic sensor is the interference of clouds, which is very high in tropical areas as Indonesia. Thus for a particular areas it is difficul to get cloud-free images. However, since ALOS has active sensor such as PALSAR, then it may be possible to combine the AVNIR-2 and PALSAR data in the analysis. In the near future, it is hope that new advantages sensors will be availabe in the new generation of ALOS satellites.
ACKNOWLEDGEMENTS
I Would like to thank and appreciated JAXA deeply for providing invaluable ALOS AVNIR-2 data that used in this reports and assistences in the 4th Joint PI Symposium
PI325-9

of ALOS Data Nodes for ALOS Science Program in Tokyo 2010. Some parts of this reports was funded by Competitive Research Project of Indonesian Institute of Sciences (LIPI) and from Research Project funded by Ministry of Education and Cultural (DIKTI). Therefore, I am very greatly appreciate and thanks to their supports. Thanks are also forwarded to technicians and local communities that greatly helped during the field works.
REFERENCES
[1]. Lyzenga, D. R. 1985. "Shallow-water Bathymetry using Combined Lidar and passive Multispectral Scanner Data." International Journal of Remote Sensing 6 (1): 115-125
[2]. UNITAR 2007. Explorations in Geographic Information Systems Technology, Volume 3: Applications in Coastal Zone Research and Management (edited by St. Marvin, K,) The Clark Labs for Cartographic Technology and Geographic Analysis Clark University, Worcester, MA 01610 USA.
[3]. Dartnal, A.J and M. Jones, 1986. A Manual of survey methods for living resources in coastal area. Asean Australia Cooperative Program in Marine Science Australia Institute of Marine Science. 168 p.
[4]. English, S. C., Wilkinson and V. BAKER (Eds.), 1994. Survey Manual for Tropical Marine Resources. Asean–Australia Mar. Sci. Project: Living Coastal Resource, Australian Institute of Marine Science. Townsville, Australia. 368 pp.
[5]. Kuiter, R.H., 1992. Tropical reef fishes of the Western Pacific Indonesia and Adjacent Waters, Gramedia Jakarta. 314 p.
[6]. Lesike, E and R. Myers. 1995. Coral reef fishes of indo pacific and caribean. Harper collin. Publsh. 400 p.
[7]. McKenzie, L.J. and S.J. Campbell, 2002. Seagrass watch: Manual for Community (citizen) Monitoring of seagrass habitat. Western Pacific Edition (QFS, NFC, Cairns), 43 pp.
[8]. Chavez, P.S., 1996. Image-based atmospheric corrections revisited and improved. Photogram Engineering and Remote Sensing, 62:1025-1036.
[9]. Lorwens, Y and S. Wouthuyzen, 2009. Study on reef fishes stock assessment and the reef environment, for managing the sustainable utilization of reef fishes resources. Final report of Biak Marine Conservation Office, Indonesian Institute of Sciences. (unpublished, in Indonesia). 32 p.
[10]. Hartog, C. den 1970 Seagrass of the World. North Holland Publshing Company., Amsterdam.London, p 271.
[11]. Waycott M, Procaccini G, Les DH and Reusch TBH, 2006. Chapter 2 Seagrass evolution, ecology and conservation: a genetic perspective. In: AWD Larkum, RJ Orth and CM Duarte (eds) Seagrasses: Biology, ecology and conservation. Dordrecht, Springer.
[12]. Bostro¨m, Jackson, E.L., and C. A. Simenstad, 2006. Seagrass landscapes and their effects on associated fauna: A review. Estuarine, Coastal and Shelf Science 68 (2006) 383-403
[13]. Anonim, 2001. Philippine Coastal Management Guidebook No. 5: Managing Coastal Habitats and Marine Protected Areas. Coastal Resource Management Project of the Department of Environment and Natural Resources, Cebu City, Philippines, 106 p.
[14]. Nellemann, C., Corcoran, E., Duarte, C. M., Valdés, L., DeYoung, C., Fonseca, L., Grimsditch, G. (Eds). 2009. Blue Carbon. A Rapid Response Assessment. United Nations Environment Programme, GRID-Arendal, www.grida.no
[15]. McKenzie, L.J. and S.J. Campbell, 2002, Seagrass resources in the vicinity of the proposed Urangan Boat Harbour dredge material disposal & rehandling area- February 2002. Unpublish report of Quensland transport (DPI, Cairns, 12 pp.
PI325-10