Relating variation in the understorey of beech forests to ecological factors
Upload
independentCategory
view
0download
0
PLEASE SCROLL DOWN FOR ARTICLE
This article was downloaded by: [Canadian Research Knowledge Network]On: 7 September 2009Access details: Access Details: [subscription number 783016891]Publisher Taylor & FrancisInforma Ltd Registered in England and Wales Registered Number: 1072954 Registered office: Mortimer House,37-41 Mortimer Street, London W1T 3JH, UK
Scandinavian Journal of Forest ResearchPublication details, including instructions for authors and subscription information:http://www.informaworld.com/smpp/title~content=t713711862
Foliar Responses of Understorey Abies lasiocarpa to Different Degrees ofRelease Cutting in a Betula papyrifera and Conifer Mixed Species StandJ. R. Wang; T. Letchford; P. G. Comeau; D. Coopersmith
Online Publication Date: 01 December 2000
To cite this Article Wang, J. R., Letchford, T., Comeau, P. G. and Coopersmith, D.(2000)'Foliar Responses of Understorey Abieslasiocarpa to Different Degrees of Release Cutting in a Betula papyrifera and Conifer Mixed Species Stand',Scandinavian Journal ofForest Research,15:6,611 — 620
To link to this Article: DOI: 10.1080/02827580050216860
URL: http://dx.doi.org/10.1080/02827580050216860
Full terms and conditions of use: http://www.informaworld.com/terms-and-conditions-of-access.pdf
This article may be used for research, teaching and private study purposes. Any substantial orsystematic reproduction, re-distribution, re-selling, loan or sub-licensing, systematic supply ordistribution in any form to anyone is expressly forbidden.
The publisher does not give any warranty express or implied or make any representation that the contentswill be complete or accurate or up to date. The accuracy of any instructions, formulae and drug dosesshould be independently verified with primary sources. The publisher shall not be liable for any loss,actions, claims, proceedings, demand or costs or damages whatsoever or howsoever caused arising directlyor indirectly in connection with or arising out of the use of this material.

Scand. J. For. Res. 15: 611–620, 2000
Foliar Responses of Understorey Abies lasiocarpa to Dif ferentDegrees of Release Cutt ing in a Betula papyrifera and ConiferMixed Species Stand
J. R. WANG1, T. LETCHFORD1, P. G. COMEAU2 and D. COOPERSMITH3
1Red Rock Research Station, Ministry of Forests, 18435 Forest Nursery Road, Prince George, BC, Canada V2N 5Y7; 2BC
Ministry of Forests, Research Branch, P.O. Box 9519, Station Provincial Government, Victoria, BC, Canada V8W 9C2
and 3BC Ministry of Forests, Prince George Forest Region, 1011 4th Ave., Prince George, BC, Canada V2L 3H9
Wang, J. R., Letchford, T., Comeau, P. G. and Coopersmith, D. (1Red Rock Research Station,Ministry of Forests, 18435 Forest Nursery Road, Prince George, BC, Canada V2N 5Y7, 2BC
Ministry of Forests, Research Branch, P.O. Box 9519 Station Provincial Government,
Victoria, BC, Canada V8W 9C2, 3BC Ministry of Forests, Prince George Forest Region, 10114th Ave. Prince George, BC, Canada V2L 3H9). Folia responses of understorey Abies
lasiocarpa to different degrees of release cutting in a Betula papyrifera and conifer mixed species
stand. Received November 25, 1999. Accepted February 27, 2000. Scand. J. For. Res. 15:611–620, 2000.
Foliar responses of subalpine �r [Abies lasiocarpa (Hook.) Nutt.] to thinning were studied in
a 35-yr-old mixed stand of paper birch (Betula papyrifera Marsh.) and conifers. The stand
regenerated naturally after a wild�re with a canopy dominated by paper birch (average height9.8 m) and an understorey dominated by subalpine �r (average height 1.6 m). The stand was
thinned to four densities of birch: 0, 600 and 1200 stems ha¼1 and control (unthinned at
2300–6400 stems ha¼1) in the autumn of 1995. The understorey conifers, mainly subalpine �r,were thinned to 1200 stems ha¼1. The study used a completely randomized split-plot design.
Three sample trees were systematically selected from each treatment replicate and each tree
stratum (upper, intermediate and lower understorey). One-year-old and older age class needleswere collected from one south-facing branch within the �fth whorl from the tree top. Thinning
of paper birch signi�cantly (pB0.001) increased leaf area and dry weight per 100 needles forintermediate and short trees except in the 0 birch treatment. Understorey subalpine �r trees in
600 stems ha¼1 birch (T3) had the largest leaf area and leaf dry weight per 100 1-yr-old
needles. Speci�c leaf area (SLA) decreased from unthinned (T1) to 0 birch (T4). Lowerunderstorey trees had the largest SLA. One-year-old needles had signi�cantly higher N, P and
K concentrations in all the thinning treatments. These responses are consistent with the shade
tolerance of subalpine �r. The results suggest that when managing a paper birch–conifersmixed-wood forest it may be of bene�t to understorey conifers to leave a birch canopy as a
nursing crop. Key words: Abies lasiocarpa, Betula papyrifera, foliar nutrients, mixed woods,
thinning.
INTRODUCTION
Successful timber production depends on our ability
to prescribe effective silvicultural treatments. This
requires an understanding of tree foliar responses to
treatments such as thinning. The effects of thinning
on growth and leaf nutrient concentration of residual
trees have been studied in pure even-aged stands
(Brix 1981, O’Hara 1988, Mugasha et al. 1991,
Hokka et al. 1996). Less work has been reported on
thinning broadleaf and conifer mixed-wood stands
(Pothier & Margolis 1990, 1991), especially when the
target species is in the understorey. Thinning trials
have frequently been undertaken to allow the predic-
tion of speci�c stand type responses to a particular
silvicultural treatment, leading to a large accumula-
tion of information. However, such trials did not
advance understanding of the underlying mechanisms
for the silvicultural treatment responses. Without
such understanding, reliable and accurate predictions
about stand responses to management actions cannot
be made.
Productivity of individual trees usually increases
rapidly after thinning. Gower et al. (1992) found that
foliar biomass, foliar ef�ciency (FE¾ increase in
biomass:foliar biomass) and levels of foliar N in-
creased after thinning. However, Lavigne (1988)
found that the foliar ef�ciencies, as measured by
annual stem growth per unit of foliar weight, of
thinned stands were not signi�cantly greater than
those of unthinned stands even with reduced competi-
tion. It was estimated that seasonal photosynthesis
© 2000 Taylor & Francis. ISSN 0282-7581
Downloaded By: [Canadian Research Knowledge Network] At: 01:23 7 September 2009

J. R. Wang et al.612 Scand. J. For. Res. 15 (2000)
might be as much as 21%higher in residual trees of a
thinned stand of lodgepole pine as a result of in-
creased leaf hydration and additional light (Donner
& Running 1986).
Changes in foliar characteristics (leaf area, speci�c
leaf area, nutrient concentration, etc.) help to explain
the observed growth responses and may lead to a
diagnostic index that is useful in predicting the re-
sponse potential of unthinned stands. In a stand of
black spruce [Picea mariana (Mill.) B.S.P.] on a newly
drained peatland site, Mugasha et al. (1991) found
that foliar N and P concentrations and contents
increased two growing seasons after thinning. Hokka
et al. (1996) studied the effects of thinning on foliar
nutrient status of Scots pine (Pinus sylvestris L.)
stands on drained boreal peatlands. They found that
thinning increased foliar P concentration, needle size
and contents of N, P and K per 100 needles four
growing seasons after thinning. Pang et al. (1987)
reported that heavy thinning signi�cantly increased
foliar N and Mg concentrations in a stand of Dou-
glas �r [Pseudotsuga menziesii (Mirb.) Franco] in
British Columbia, Canada. It was concluded that
thinning improved the foliar nutrient status by reduc-
ing the competition for nutrients. Thinning also in-
creased leaf photosynthesis and N concentration of
paper birch (Wang et al. 1995), but reduced the foliar
nutrient concentrations of loblolly pine, possibly ow-
ing to dilution from greater growth (Ginn et al.
1991). However, most thinning studies were carried
out in pure stands. Therefore, it is unclear whether
similar responses exist for conifers in a mixed-wood
stand, especially for understorey conifers such as
subalpine �r in this study.
Subalpine �r [(Abies lasiocarpa (Hook.) Nutt.] is
one of the dominant climax tree species in the sub-
boreal spruce (SBS) biogeoclimatic zone of British
Columbia (Meidinger & Pojar 1991). Although it
may grow in pure stands, it is usually mixed with
other species such as white spruce [Picea glauca
(Moench) Voss], lodgepole pine (Pinus contorta
Dougl.), aspen (Populus tremuloides Michix.) and pa-
per birch (Betula papyrifera Marsh.). Subalpine �r is
shade tolerant. Advanced regeneration is one of its
constant features in the SBS, making it suitable for
mixed-wood management. Although not considered
as desirable as spruce, the species is used for lumber
and pulp. In British Columbia, mixed paper birch
and subalpine �r stands are not considered of com-
mercial value and the sites that they occupy are
classi�ed as non-satisfactorily regenerated (NSR). As
a result of this policy, such forest stands would be
destroyed and replanted to pure conifers. Because of
biodiversity and sustainable management concerns
this practice has been questioned and criticized. To
aid future management of these stands, the effects
were studied of releasing the understorey subalpine �r
through thinning overstorey paper birch and some
understorey subalpine �r to different densities. To the
authors’ knowledge, there is no information about
foliar nutrients and morphological characteristics in
response to thinning these types of mixed-wood
stands.
This paper reports the effects of thinning a dense
understorey of subalpine �r and an overstorey of
paper birch in a birch–conifer mixed wood. Although
the target species of the project are both the domi-
nant overstorey paper birch and understorey sub-
alpine �r, this paper focused only on the understorey
subalpine �r. The objectives of the study were: (1) to
quantify foliar responses to thinning in needle mor-
phology and nutrient status of subalpine �r; and (2)
to determine how the morphological and nutritional
acclimation to thinning was affected by thinning in-
tensity and tree stratum. These changes may poten-
tially in�uence the effectiveness of unit needle area
for light interception and carbon assimilation, and
ultimately the growth of leave trees. It was hypothe-
sized that foliar dry mass per 100 needles, new foliar
mass and foliar nutrient concentrations of subalpine
�r would increase in response to thinning.
MATERIALS AND METHODS
Study site
The study site is located in central British Columbia
(30 km east of Prince George, 760 m a.s.l. 53°54Æ N,
122°24Æ W) in the SBS biogeoclimatic zone. The stand
regenerated naturally following a 20000 ha wild�re in
August 1961. Paper birch was the dominant over-
storey species, with 2300 stems ha¼1 and an average
height of 9.8 m before thinning. There was a small
component of lodgepole pine, interior Douglas �r
[Pseudotsuga menzisii var. glauca (Beissn.) Franco]
and white spruce. The understorey was dominated by
subalpine �r with 33000 stems ha¼1 and an average
height of 1.6 m before thinning. The shrub layer
included black huckleberry (Vaccinium mem-
branaceum Dougl. Ex Torr.) and thimbleberry (Rubus
pavi�orus Nutt.). Common herbs were bunchberry
(Cornus canadensis L.), queen’s cup (Clintonia
Downloaded By: [Canadian Research Knowledge Network] At: 01:23 7 September 2009

Folia responses of A. lasiocarpa to thinningScand. J. For. Res. 15 (2000) 613
uni�ora Kunth), twin�ower (Linnaea borealis L.) and
false Solomon’s seal [Smilacina racemosa (Nutt.) S.
Wats.].
Annual precipitation averages 410 mm, with June
and August being the wettest months. Annual aver-
age snowfall exceeds 2.4 m. Average maximum and
minimum temperatures are ¼7.5 and ¼16.6°C in
January and 22.0 and 8.1°C in July, respectively
(Anon. 1982).
Experimental design
The study used a completely randomized split-plot
design. Four treatment levels of paper birch densities
were created through thinning: (1) T1, untreated con-
trol (no birch thinning); (2) T2, 1200 birch stems
ha¼1; (3) T3, 600 birch stems ha¼1; and (4) T4, 0
birch stems ha¼1 (complete removal of birch). Treat-
ment plots were 80× 80 m with a 40× 40 m perma-
nent measurement subplot located in the centre,
leaving a 20 m wide buffer zone around the measure-
ment plot. Treatments were replicated three times.
Nine plots were thinned in October 1995 and three
were thinned in April 1996. The authors believe that
fall thinning was equivalent to the spring thinning
because biological activities are expected to be very
low during the intervening winter. Understorey
conifers were thinned to 1200 stems ha¼1 in all plots.
The order of preference for leaving understorey
conifers was: (1) white spruce; (2) Douglas-�r; and (3)
subalpine �r. This order was chosen in order to
preserve the small numbers (about 50 trees ha¼1) of
white spruce and Douglas �r that were on site, to
avoid converting the understorey to pure subalpine
�r. Residual trees were selected with priority given
�rst to location, then to tree form and then to size.
All thinning debris was left on the site. After thin-
ning, all residual trees within the measurement sub-
plot were number-tagged and their diameters at
breast height (DBH) or basal diameters (BD, if less
than 1.5 m tall) and heights were measured.
The immediate changes after thinning were in-
creased growing space for the residual trees and
increased photosynthetically active radiation (PAR)
for the understorey subalpine �r trees. Four quantum
sensors (model LI-190SA; Li-Cor, Lincoln, NE,
USA) were installed in May 1996 in one plot each of
treatments T1, T2 and T3, 1 m above the ground at
four systematically (10 m from plot centre to N, S, E
and W) chosen points. A single quantum sensor was
installed in the T4 treatment (in the centre of plot 10)
above the subalpine �r canopy as an open sky read-
ing. All quantum sensors were connected to datalog-
gers (Campbell Scienti�c, Logan, UT, USA) which
recorded hourly averages of 1 min readings. During
the 1996 growing season, T1 received about 10% of
full light and T2 and T3 received 30%and 60%of full
light, respectively (Fig. 1).
Foliar sampling and analysis
Foliage was sampled prior to bud �ush on May 7, 8
and 9 in 1997, equivalent to sampling one growing
season after thinning (Ballard & Carter 1985, Brække
1996, Mugasha et al. 1991). Foliar samples were
collected from all 12 plots (4 treatments× 3 repli-
cates). Within each plot, three sample points were
systematically chosen at the plot centre and two
diagonal corners of the 40× 40 m permanent mea-
surement subplot. Subalpine �r trees were divided
into three strata (upper, intermediate and lower) ac-
cording to their heights in the understorey. Three
subalpine �r trees, one from each tree stratum, were
selected near each sample point. DBH and total
height of all sampled trees were measured (Table 1).
Short trees did not reach breast height, and therefore
BD was measured. One south-facing branch within
the �fth whorl from the tree top was cut from the
main stem from each sample tree (Ballard & Carter
1985). Sample branches were labelled, placed in black
plastic bags, transferred to the laboratory at Red
Rock Research Station and stored at 4°C. One-year-
old needles were separated by clipping off all 1-yr-old
twigs from the branch. Needles older than 1 yr were
combined into a second sample for each branch.
Foliage samples were dried at 70°C for 48 h and
weighed to the nearest 0.01 g. Before drying, a sub-
sample of 100 needles was taken from each 1-yr-old
needle sample and scanned for projected leaf area,
Fig. 1. Understorey (1 m above ground) photosynthetically
active radiation (PAR) as a percentage of open sky PAR bythinning treatment.
Downloaded By: [Canadian Research Knowledge Network] At: 01:23 7 September 2009

J. R. Wang et al.614 Scand. J. For. Res. 15 (2000)
Table 1. Height and diameter at breast height (DBH) or basal diameter (BD) for upper (U), intermediate (I) and
lower (L) understorey subalpine �r trees after different thinning treatments
No. of samples Height (m) DBH (cm)Tree stratum BD (cm)Treatment
UpperT1 9 6.790.35 7.390.42
9 3.290.31 3.593.15Intermediate
Lower 9 0.990.09 1.790.02UpperT2 9 5.790.31 6.690.44
9 3.390.18 3.890.26Intermediate
Lower 9 0.990.07 1.890.019 6.190.34 7.190.54T3 Upper
9 3.490.20 3.990.18Intermediate
Lower 9 1.190.09 2.190.02Upper 9 5.490.16 6.090.29T4
9 3.290.17 3.790.19Intermediate
9 1.190.08 1.890.01Lower
Data are shown as means9SE.
T1, control; T2, 1200 stems ha¼1 birch; T3, 600 stems ha¼1 birch; T4, 0 stems ha¼1 birch.
needle length and width using WinNeedle (Regent
Instruments, Quebec, Canada). Speci�c leaf area
(SLA) of 1-yr-old needles was calculated as projected
leaf area per unit of needle dry weight. All needle
samples (108 1-yr-old needle and 108 older age
classes) were ground for chemical analyses using a
Braun type KSM-2 coffee grinder. Foliar analyses
were completed at the British Columbia Ministry of
Forests, Analytical Chemistry Laboratory in Victo-
ria. N and P were determined colorimetrically using
�ow-injection analysis and K, Ca and Mg were deter-
mined by atomic absorption spectrophotometry. Fo-
liar nutrient content per 100 needles was calculated
by multiplying nutrient concentration (% dry weight)
by dry weight per 100 needles.
Data analysis
The effects of thinning and tree stratum were
analysed using a split-plot design with thinning treat-
ment as the main plot and tree stratum as the split
plot. Needle morphological characteristics and nutri-
ent variables were analysed with SYSTAT 6.0 (SPSS,
Chicago, IL, USA, 1998). Signi�cant differences (hB
0.05) between thinning treatments and between tree
strata were determined with Bonferroni multiple
comparisons (Sokal & Rohlf 1995). Signi�cant differ-
ences between nutrient concentrations of 1-yr-old
needles and older age class needles were determined
by paired sample t -tests.
Further interpretation of changes in foliar dry
mass, nutrient concentration and content was
achieved by adopting the vector analysis technique
re�ned by Timmer & Stone (1978). For each nutrient,
the average values for foliar nutrient concentration
and content from treated plots are shown relative to
the average value for the control plots, which is set at
coordinate (100, 100). The direction and magnitude
of the vector of each element connecting the control
and treated values is used to diagnose the tree’s
nutritional status and response to thinning
treatments.
RESULTS
Average heights of sampled trees ranged from 5.4 to
6.7 m for upper, 3.2 to 3.4 m for intermediate and 0.9
to 1.1 m for lower understorey trees, respectively
(Table 1). DBH values ranged from 6.0 to 7.3 cm for
upper and 3.5 to 3.9 cm for intermediate understorey
trees. Basal diameters for lower understorey trees
ranged from 1.7 to 2.1 cm. In general, ANOVA
revealed signi�cant effects of thinning and tree stra-
tum on most variables. No signi�cant interaction
between thinning and tree stratum was detected for
any of the measured variables (Tables 2, 3). There-
fore, only simple effects of thinning and tree stratum
are presented.
Needle width did not respond to thinning treat-
ments and was statistically the same among different
tree strata (Table 2). However, needle length was
signi�cantly affected by both thinning and tree stra-
tum. Trees in 600 stems ha¼1 birch (T3) had the
longest 1-yr-old needles, ranging from 20.7 to 25.6
mm, and the largest leaf area and dry weight per 100
needles (Fig. 2a,b). The 0 birch treatment (T4) had
Downloaded By: [Canadian Research Knowledge Network] At: 01:23 7 September 2009
Folia responses of A. lasiocarpa to thinningScand. J. For. Res. 15 (2000) 615
the smallest leaf area but dry weight per 100 needles
was similar to that in T1 and T2.
The upper and intermediate understorey trees had
similar leaf area and dry weight per 100 needles (Fig.
2e,f). Lower understorey trees had the smallest leaf
area and dry weight per 100 needles.
There were signi�cant effects of thinning and tree
stratum on SLA (pB0.001), respectively (Table 2).
SLA decreased from unthinned (T1) to 0 birch treat-
ment (T4) (Fig. 2c). Upper understorey trees (U) had
the smallest SLA. In contrast, lower understorey trees
(L) had the largest SLA (Fig. 2d). This pattern of
change in SLA re�ected the changed understorey
light condition (Fig. 1) after thinning.
Thinning and tree stratum signi�cantly affected
foliar N concentration and content of 1-yr-old
needles (Table 3). Trees in T4 had the highest foliar
N concentration (Fig. 3a) and were signi�cantly dif-
ferent from the other thinning treatments. The upper
understorey trees had the lowest N concentration,
ranging from 1.10 to 1.46%, and short trees had the
highest N concentration, ranging from 1.15 to 1.67%,
while intermediate trees had the intermediate N con-
centration, ranging from 1.10 to 1.56% (Fig. 3d).
Paired samples t -tests showed that 1-yr-old needles
had a signi�cantly higher N concentration than older
needles of trees in T3 (t ¾ ¼3.34, pB0.001, n¾26)
and T4 (t ¾ ¼3.374, p¾0.002, n¾26) (Fig. 4a).
Thinning and tree stratum also had signi�cant
effects on foliar N content per 100 needles (Table 3),
although foliar N content (mg) per 100 needles varied
in a different pattern from N concentration. The trees
in T3 had the highest N content, ranging from 7.74 to
13.77 mg per 100 needles (Fig. 5a). This can be
attributed to their large dry weight per 100 needles
(see Fig. 2b). Lower understorey trees had the lowest
N content, despite having the highest N concentra-
tion. This was attributed to their small dry weight per
100 needles (Fig. 2f).
Paired sample t -tests showed that, in all treat-
ments, 1-yr-old needles had signi�cantly (pB0.001)
higher P and K concentrations than older needles
(Fig. 4b,c). In contrast, older age class needles had
signi�cantly higher Ca concentration in all treatments
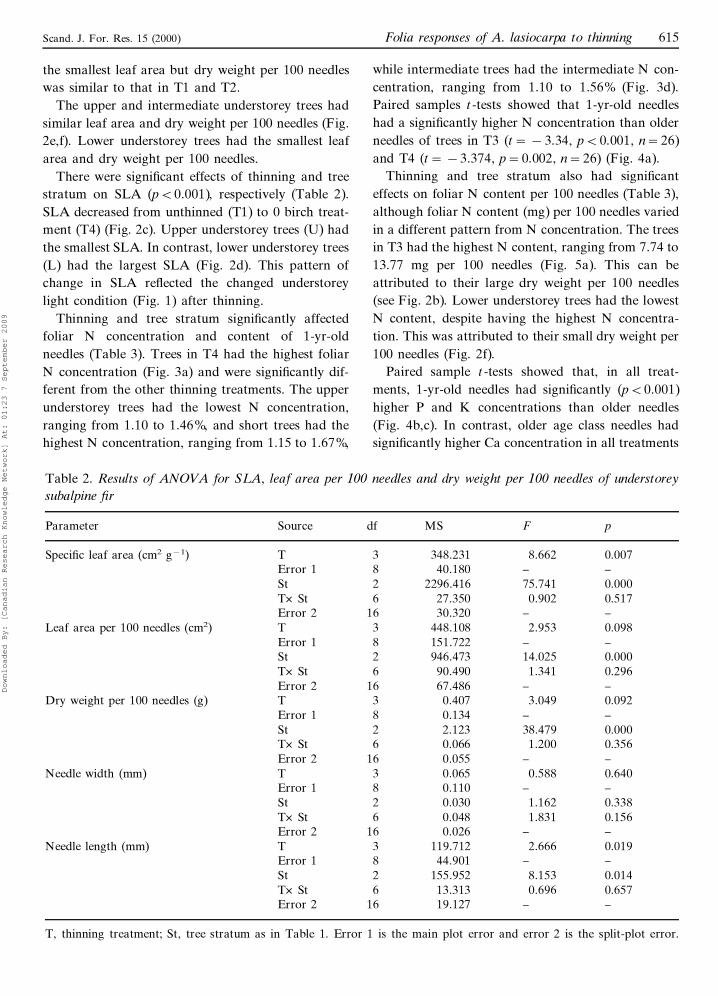
Table 2. Results of ANOVA for SLA, leaf area per 100 needles and dry weight per 100 needles of understorey
subalpine �r
dfParameter Source pMS F
348.2313TSpeci�c leaf area (cm2 g¼1) 8.662 0.0078Error 1 –40.180 –
St 0.0002 75.7412296.416
0.517T× St 6 27.350 0.902–Error 2 16 30.320 –
0.098T 3 448.108 2.953Leaf area per 100 needles (cm2)
––151.7228Error 114.025946.4732 0.000St
0.296T× St 6 90.490 1.341
Error 2 16 67.486 – –Dry weight per 100 needles (g) T 3 0.407 3.049 0.092
––0.1348Error 1
St 2 2.123 38.479 0.000T× St 6 0.066 1.200 0.356
–Error 2 16 0.055 –
Needle width (mm) T 3 0.065 0.588 0.640Error 1 8 0.110 – –
St 2 0.030 1.162 0.338
T× St 6 0.048 1.831 0.15616Error 2 ––0.026
Needle length (mm) 0.0192.666T 119.7123Error 1 8 44.901 – –
St 0.0142 8.153155.952
0.6570.69613.3136T× StError 2 16 19.127 – –
T, thinning treatment; St, tree stratum as in Table 1. Error 1 is the main plot error and error 2 is the split-plot error.
Downloaded By: [Canadian Research Knowledge Network] At: 01:23 7 September 2009

J. R. Wang et al.616 Scand. J. For. Res. 15 (2000)
Table 3. Results of ANOVA for foliar nutrient con-
centrations and content of 1-yr-old needles of sub-
alpine �r
Source df MS F pParameter
Concentration (% of dry weight)1.065 6.077N 0.018T 30.175 – –8Error 10.180 24.074 0.000St 20.019 2.529 0.0656T× St
Error 2 16 0.007 – –0.012 5.532 0.0253TP0.002 – –Error 1 80.000 0.019 0.8282St
6 0.000 0.261 0.947T× St0.001 – –16Error 2
3K 0.021 1.774 0.230T0.012 – –Error 1 80.096 17.305 0.0002St0.013 2.270 0.089T× St 60.006 – –16Error 20.131 3.436 0.072Ca T 30.038 – –8Error 10.022 2.566 0.108St 20.014 1.623 0.2056T× St0.009 – –Error 2 160.001 3.793 0.0583TMg0.000 – –Error 1 80.002 4.705 0.0252St0.001 1.144 0.382T× St 60.00016Error 2
Content (mg per 100 needles)T 3 86.484 2.289 0.015N
37.776 – –Error 1 8274.410 33.523 0.0002St
9.557 1.167 0.371T× St 68.186 – –16Error 21.530 2.171 0.169P T 30.705 – –8Error 19.353 46.938 0.000St 20.333 1.673 0.1926T× St0.199 – –Error 2 16
20.956 4.542 0.0393TK4.613 – –Error 1 8
120.183 47.890 0.0002St5.477 2.182 0.099T× St 62.510 – –16Error 24.42 2.813 0.108Ca T 31.572 – –8Error 1
2 43.377 51.175 0.000St1.636 1.930 0.1376T× St
16 0.848 – –Error 23Mg 0.067 1.974 0.197T
0.034 – –8Error 1St 2 1.446 47.203 0.000
0.060 1.973 0.1306T× St0.031 – –Error 2 16
T, thinning treatments; St, tree stratum. Error 1 and error2 are the same as in Table 2.
(Fig. 4d). No signi�cant difference was found be-
tween Mg concentrations of new needles and old
needles except in T2 (Fig. 4e).
Foliar Ca concentration was not signi�cantly af-
fected by thinning or tree stratum (Table 3). Al-
though foliar P concentration was signi�cantly
affected by thinning treatments, there were no signi�-
cant differences in P concentration among tree status.
In contrast, there were no signi�cant differences in
foliar K and Mg concentrations between thinning
treatments, but tree stratum signi�cantly affected fo-
liar K and Mg concentrations (Table 3, Fig. 3c,e).
The mean foliar P concentration ranged from 0.19 to
0.24% across the treatments and was the greatest in
T3 (Fig. 3b). The mean foliar K and Mg concentra-
tions varied across tree status from 0.50 to 0.69%,
and 0.06 to 0.09%, respectively.
Thinning signi�cantly affected only foliar K con-
tent per 100 needles, being the greatest in T3 (Fig.
5b). However, tree stratum signi�cantly affected P,
K, Ca and Mg content per 100 needles (Table 3). In
general, the upper and intermediate understorey trees
had the highest foliar P, Ca and Mg contents per 100
1-yr-old needles (Fig. 5c–e).
Vector analysis indicated strong N, P and Ca re-
sponses to the thinning treatments (Fig. 6). Accumu-
lation of foliar N, P and Ca was associated with their
increased concentrations when the stand was thinned
to 0 birch (T4). Mg was unchanged in T4, diluted in
T3 and showed slight luxury consumption in T2.
DISCUSSION
Thinning overstorey paper birch and understorey
subalpine �r in a mixed birch–conifer stand signi�-
cantly affected subalpine �r foliar morphological
characteristics. Understorey subalpine �r trees can
respond in many different ways to the suddenly
changed light environment (Fig. 1). The results from
this study indicate that foliar responses to thinning
were greatest for upper understorey trees, moderate
for intermediate understorey trees and least for lower
understorey trees (Fig. 2). These foliar morphological
responses are in agreement with the thinning objec-
tive to encourage the growth of tall trees rather than
to resuscitate the short ones (Smith et al. 1997).
In general, trees will respond to the changed envi-
ronment caused by thinning in a sequence of events
at different levels. First, foliar morphology and min-
eral nutrition change, then physiological activities
such as photosynthesis increase. Crown size and leaf
Downloaded By: [Canadian Research Knowledge Network] At: 01:23 7 September 2009

Folia responses of A. lasiocarpa to thinningScand. J. For. Res. 15 (2000) 617
area increase, thus adding to the photosynthetically
active surface. Eventually, these changes are followed
by increased cambial growth. In this study, the foliar
responses of understorey A. lasiocarpa to release cut-
ting were analysed one growing season after the
treatment. Needle primordia number is predeter-
mined in A. lasiocarpa. Thus, the number of needles
was �xed in the bud at the time of application of the
thinning treatments. However, needle morphology
and nutrient concentrations are determined by cur-
rent growing season condition and thus �rst growing
season needle response indicates the most immediate
responses of residual trees to thinning. It is fairly well
documented that �rst-year needles re�ect growth re-
sponses in subsequent years and that speci�c needle
weight of trees is an indicator of their growth capac-
ity (Brække 1996).
Fig. 3. Mean nutrient concentrations of 1-yr-old needles ofthe understorey subalpine �r in different thinning treat-
ments (a, b) and by tree stratum (c–e). T1, T2, T3, T4, and
U, I, L are the same as in Fig. 2. The vertical bars indicate91 SE (n¾9). Bars with the same letter are not signi�-
cantly different (p\0.05) according to Bonferroni multiple
comparison.
Fig. 2. One-year-old needle leaf area (cm2), dry weight (g)per 100 needles and speci�c leaf area (cm2 g¼1) of under-
storey subalpine �r in different thinning treatments (a–c):
T1, control (no birch thinning); T2, 1200 stems ha¼1 birch;T3, 600 stems ha¼1 birch; T4, 0 stems ha¼1 birch; and by
tree stratum (d–f): upper (U), intermediate (I) and lower(L) understorey trees. The vertical bars indicate 91 SE
(n¾9). Bars with the same letter are not signi�cantly
different (p\0.05) according to Bonferroni multiple com-parison.
Light-related alterations in needle dimensions are
relevant adaptive features, contributing to the effec-
tive use of light resource. SLA links mass- and area-
based expressions of leaf photosynthetic rates and it
was found to be closely related to photosynthesis
(Field & Mooney 1986). SLA of trees is indicative of
their growth capacity, as well as being an indicator of
treatment responses of 1-yr-old needles. SLA re�ects
growth response in subsequent years. Signi�cant
growth responses in diameter and height of subalpine
�r trees were found in the autumn of 1999 (Wang et
al. unpubl. data).
The very similar level of all needle morphological
parameters obtained in this study between T1 and T2
is unusual. Greater positive needle responses were
expected from the trees in T2 compared with those in
T1. Although there was a 20% increase in under-
storey light conditions between T1 and T2 (Fig. 1),
subalpine �r did not respond differently. This con�-
rms the �ndings of Wright et al. (1998) that subalpine
Downloaded By: [Canadian Research Knowledge Network] At: 01:23 7 September 2009

J. R. Wang et al.618 Scand. J. For. Res. 15 (2000)
Fig. 5. Mean nutrient content (mg) per 100 1-yr-old needles
of the understorey subalpine �r in different thinning treat-
ments (a, b) and by different tree strata (c–f). T1, T2, T3,T4, and U, I, L are the same as in Fig. 2. The vertical bars
indicate 91 SE (n¾9). Bars with the same letter are not
signi�cantly different (p\0.05) according to Bonferronimultiple comparison.
�r leader growth increases rapidly between 5 and 20%
of open light and increases little above 20% of open
light. In contrast, all needle morphological character-
istics showed negative responses to complete removal
of overstorey paper birch in T4. The subalpine �r
trees had been growing at low light intensities (10%
of open light in T1) prior to thinning. These trees
may have been injured by a sudden exposure to full
sunlight through thinning in T4, a situation often
referred to as ‘‘thinning shock’’ (Staebler 1956, Har-
rington & Reukema 1983, Smith et al. 1997).
Changes in foliar nutrition following thinning may
relate to several simultaneous processes in forest
ecosystems. Comparison of foliar N, P and K con-
centrations in 1-yr-old needles with those in needles
older than 1 yr showed clearly that the residual trees
had allocated more nutrients to the youngest parts of
their foliage (Fig. 4). Translocation of nutrients from
Fig. 4. Mean foliar nutrient concentrations (% of dry
weight) of 1-yr-old needles (1 yr needles) and needles older
than 1 yr (\1 yr needles) in different thinning treatments.T1, T2, T3 and T4 are the same as in Fig. 1. Signi�cant
differences (at the 5% level) between the needle ages are
marked with asterisks according to paired sample t -tests.The vertical bars indicate 91 SE (n¾27). Solid bars are
1-yr-old needles and hatched bars are \1 yr old needles.
the older needles to 1-yr-old needles does not seem to
be a suf�cient explanation for the increase in nutrient
concentration of 1-yr-old needles, especially for N,
but it cannot be ruled out.
The trees in T4 had signi�cantly higher foliar N
and P concentrations when compared with other
thinning treatments (Fig. 3a,b), which is characteris-
tic of luxury consumption of these two nutrients in
T4 (Timmer & Stone 1978). There are two possible
reasons for this. First, the highest N concentration in
T4 can be caused by reduced competition for nutri-
ents and by increased available N released from the
thinning residues, and from accelerated decompo-
sition of organic matter, called the assart effect
(Kimmins 1997). Secondly, because of the
above-mentioned ‘‘thinning shock’’ effect, trees in T4
did not grow much new foliage. This led to the
accumulation of N and P in needles. Vector analysis
showed that trees in T3 had relatively unchanged
Downloaded By: [Canadian Research Knowledge Network] At: 01:23 7 September 2009

Folia responses of A. lasiocarpa to thinningScand. J. For. Res. 15 (2000) 619
nutrient concentrations, especially for K, Ca and Mg,
compared with T2 and T4 (Fig. 6). Trees in T3 had
the largest increase in relative nutrient contents be-
cause of the balanced increase in relative dry mass
per 100 needles while maintaining relatively un-
changed nutrient concentrations.
Foliar N concentration increased as tree height
decreased from upper to lower understorey trees (Fig.
3d). These results agree with those reported by Nine-
mets (1997) and Hollinger (1996), who found that N
concentrations were higher in shaded needles than in
sun-exposed needles. In the unthinned stand, where
light and N are assumed to be the limiting factors for
photosynthesis of subalpine �r, the needles of lower
understorey trees should have a higher light use
ef�ciency to survive in low light conditions. Theoreti-
cally, higher light use ef�ciency can be achieved in
two ways: (1) with high N concentration in the leaves
enabling a more powerful light-capturing apparatus
to be established; or (2) with an improved photosyn-
thesis per unit of foliar N (i.e. NUE). In this study,
the lower understorey subalpine �r trees appear to be
using the �rst strategy to survive the low light condi-
tion, as NUE did not differ by tree stratum (Wang et
al. unpubl. data).
The change in foliar N could be an important
determinant of the acclimation of photosynthesis to
light intensity, because changes in the amount of
photosynthetic pigments and protein are accompa-
nied by changes in foliar N (Field & Mooney 1986).
If changes in foliar N concentration in response to
increased irradiance are an important factor in deter-
mining the process of acclimation to changes in light
intensity, then the addition of N may partly offset the
negative effects of shading on photosynthesis. The
interaction of light and N availability on photosyn-
thesis is particularly important for forest practices
such as thinning and fertilization.
There have been no previous studies concerning
foliar morphological and nutritional responses of un-
derstorey conifers to thinning overstorey deciduous
trees. The present results suggest that there is a
linkage between foliar morphological and nutritional
characteristics. Combined with growth response data,
it will be possible to link leaf-level responses to tree
growth (height and diameter increments) level re-
sponses. Preliminary analysis showed that A. larsio-
carpa responded signi�cantly in diameter growth 4
yrs after the treatment (Wang et al. unpubl. data). In
practice, it may be possible to evaluate the effective-
ness of thinning by measuring foliar responses 1 yr
after thinning instead of measuring tree growth re-
sponses several years after thinning.
In conclusion, the 600 birch stems ha¼1 treatment
had the best needle responses among all thinning
treatments. This information suggests that when
managing a paper birch–conifer mixed-wood forest it
may be of bene�t to understorey conifers to leave a
birch canopy as a nursing crop. However, as the
paper birch canopy expands, light levels will decrease
for the understorey conifers. In response to birch
canopy expansion, appropriate measures have to be
taken to reduce the density of the deciduous canopy
until conifers become dominant.
ACKNOWLEDGMENTS
The authors gratefully acknowledge �nancial support
for the study from Forest Renewal BC through pro-
ject HQ96423-RE. We thank Ngaio Beausoleil for
�eld sampling and laboratory measurements. Com-
ments from two anonymous reviewers and Dr Anders
Ericsson, Scienti�c Editor, Scand. J. For. Res., are
gratefully acknowledged.
Fig. 6. Foliar responses to thinning in terms of changes in
relative foliar dry mass per 100 needles, foliar nutrientconcentrations and contents.
Downloaded By: [Canadian Research Knowledge Network] At: 01:23 7 September 2009

J. R. Wang et al.620 Scand. J. For. Res. 15 (2000)
REFERENCES
Anon. 1982. Canadian Climate Normals 1951–1980: Tem-
perature and Precipitation, British Columbia. Environ-
ment Canada, Ministry of Supplies and Services,
Ottawa, Ontario.
Ballard, T. M. & Carter, R. E. 1985. Evaluating forest
stand nutrient status. Land Management Report No. 20,
Ministry of Forests, British Columbia. ISSN 0702-9861.
Brække, F. H. 1996. Needle analyses and graphic vector
analyses of Norway spruce and Scots pine stands. Trees
11: 23–33.
Brix, H. 1981. Effects of thinning and nitrogen fertilization
on branch and foliage production in Douglas-�r Pseu-
dotsuga menziesii. Can J. For. Res. 11: 502–511.
Donner, S. L. & Running, S. W. 1986. Water stress re-
sponse after thinning Pinus contorta stands in Montana.
For. Sci. 32: 614–625.
Field, C. & Mooney, H. A. 1986. The photosynthesis–ni-
trogen relationship in wild plants. In Givinish, T. J.
(ed.). On the Economy of Plant Form and Function,.
Cambridge University Press. Cambridge. ISBN 0-521-
26296-8: 25–55.
Ginn, S. E., Seller, J. R., Cazell, B. H. & Kreh, R. E. 1991.
Physiological and growth responses of eight-year-old
loblolly pine stands to thinning. For. Sci. 37: 1030–
1040.
Gower, S. T., Vogt, K. A. & Grier, C. C. 1992. Carbon
dynamics of Rocky Mountain Douglas-�r: in�uence of
water and nutrient availability. Ecol. Monogr. 62: 43–
65.
Harrington, C. A. & Reukema, D. L. 1983. Initial shock
and long-term stand development following thinning in
a Douglas-�r plantation. For. Sci. 29: 33–46.
Hokka, H., Penttila, T. & HaÊnell, B. 1996. Effects of
thinning on foliar nutrient status of Scots pine stands on
drained boreal peatlands. Can. J. For. Res. 26: 1577–
1584.
Hollinger, D. Y. 1996. Optimality and nitrogen allocation
in a tree canopy. Tree Physiol. 16: 627–634.
Kimmins, J. P. 1997. Forest Ecology – A Foundation for
Sustainable Management. 2nd edn,. Prentice Hall, En-
glewood Cliffs. NJ. ISBN 0-02-364071-5: 119–120.
Lavigne, M. B. 1988. Growth and net assimilation rates in
thinned and unthinned stands of balsam �r. Can. J. For.
Res. 18: 1205–1210.
Meidinger, D. & Pojar, J. 1991. Ecosystems of British
Columbia,. BC Ministry of Forests, Victoria. BC. ISSN
0843-6452: 209–222.
Mugasha, A. G., Pluth, D. J., Higginbotham, K. O. &
Takyi, S. K. 1991. Foliar response of black spruce to
thinning and fertilization on a drained shallow peat.
Can. J. For. Res. 21: 152–163.
Ninemets, U. 1997. Acclimation to low irradiance in Picea
abies : in�uences of past and present light climate on
foliage structure and function. Tree Physiol. 17: 723–
732.
O’Hara, K. L. 1988. Stand structure and growing space
ef�ciency following thinning in an even-aged Douglas-�r
stand. Can. J. For. Res. 18: 859–866.
Pang, P. C., Barclay, H. J. & McCullough, K. 1987.
Aboveground nutrient distribution within tree and
stands in thinned and fertilized Douglas-�r. Can. J. For.
Res. 17: 1379–1384.
Pothier, D. & Margolis, H. A. 1990. Changes in the water
relations of balsam �r and white birch saplings after
thinning. Tree Physiol. 3: 371–380.
Pothier, D. & Margolis, H. A. 1991. Analysis of growth
and light interception of balsam �r and white birch
saplings following precommercial thinning. Ann. Sci.
For. 48: 123–132.
Smith, D. M., Larson, B. C., Kelty, M. J. & Ashton, P. M.
S. 1997. The Practice of Silviculture – Applied Forest
Ecology,. John Wiley & Sons. New York. ISBN 0-471-
10941-X: 99–129.
Sokal, R. R. & Rohlf, F. J. 1995. Biometry. 3rd edn,.
Freeman and Co. New York. ISBN 0-7167-2411-1: 229–
240.
Staebler, G. R. 1956. Evidence of shock following thinning
of young Douglas-�r. J. For. 54: 339: 567–568.
Timmer, V. R. & Stone, E. L. 1978. Comparative foliar
analysis of young balsam �r fertilized with nitrogen,
phosphorus and potassium and lime. Soil Sci. Soc. Am.
J. 42: 125–130.
Wang, J. R., Simard, S. W. & Kimmins, J. P. 1995.
Physiological responses of paper birch to thinning in
British Columbia. For. Ecol. Manage. 73: 177–184.
Wright, El. F., Coats, K. D., Canham, C. D. & Bartemucci,
P. 1998. Species variability in growth response to light
across climatic regions in northwestern British Colum-
bia. Can. J. For. Res. 28: 871–886.
.
Downloaded By: [Canadian Research Knowledge Network] At: 01:23 7 September 2009
Copyright © 2022 FDOKUMEN