Superconducting Cavities for Circuit Quantum Electrodynamics
Upload
independentCategory
view
5download
0
International Journal of Heat and Mass Transfer 81 (2015) 829–845
Contents lists available at ScienceDirect
International Journal of Heat and Mass Transfer
journal homepage: www.elsevier .com/locate / i jhmt
Numerical analysis of mixed convection in partially open cavities heatedfrom below
http://dx.doi.org/10.1016/j.ijheatmasstransfer.2014.11.0110017-9310/� 2014 Elsevier Ltd. All rights reserved.
⇑ Corresponding author at: Universidade Federal de Santa Catarina, CampusBlumenau, 89065-300 Blumenau, SC, Brazil. Tel./fax: +55 48 3721 3375.
E-mail address: [email protected] (É. Fontana).
Éliton Fontana a,b,⇑, Claudia A. Capeletto a, Adriano da Silva c, Viviana C. Mariani d,e
a Universidade Federal de Santa Catarina, Departamento de Engenharia Química e de Alimentos, 88040-970 Florianópolis, SC, Brazilb Universidade Federal de Santa Catarina, Campus Blumenau, 89065-300 Blumenau, SC, Brazilc Universidade Federal do Rio Grande, Escola de Química e Alimentos, 95500-000 Santo Antônio da Patrulha, RS, Brazild Pontifícia Universidade Católica do Paraná, Programa de Pós-Graduação em Engenharia Mecânica, 80215-901 Curitiba, PR, Brazile Universidade Federal do Paraná, Departamento de Engenharia Elétrica, 80060-000 Curitiba, PR, Brazil
a r t i c l e i n f o a b s t r a c t
Article history:Received 22 July 2014Received in revised form 1 November 2014Accepted 3 November 2014Available online 20 November 2014
Keywords:Mixed convectionHeat transferCFD analysisPeriodic flow
Mixed and natural convection in cavities are extensively investigated subjects in the field of heat transfer,due to the wide range of situations where this configuration appears in technological applications andnatural phenomena. Although the flow behavior is rather complex, most of the numerical studies foundin the literature apply simplified two-dimensional stationary models to investigate the influence of thegoverning parameters. In the study reported herein, the main characteristics of mixed convection in par-tially open cavities with internal heat sources are investigated using a transient three-dimensionalmodel. An inlet condition occupying half of the entire right wall and an opposite opening in the left wallwere included to allow the fluid inlet and outlet. The model also comprises an external region adjacent tothe opening, since recirculations can appear at the opening and generate backflow. The heat sources areplaced at the bottom wall of the cavity, which is also maintained at a high temperature, while the upperpart of the cavity is cooled as a result of the presence of cold walls. These conditions are similar to thosefound in common Rayleigh–Bénard systems, therefore, the emergence of thermal convective cells occurswhen a sufficiently high temperature difference is reached. Different values for the Rayleigh numbersassociated with the internal heat source intensity and with the temperature difference between thehot and cold walls were evaluated, allowing the determination of the modifications in the flow field asthe buoyancy forces become dominant. The results show that the buoyancy forces are dominant forlow Re and high R or Rae values, and in this case the flow field correspond to two recirculations rotatingin opposite directions. As the relative intensity of the shear flow increases, the recirculations become dis-torted and the size of the recirculation close to the inlet increases. For higher Re values, when the inertialforces induced by the inlet velocity are stronger than the buoyancy forces, recirculation zones in theupper part of the cavity can also appear due to the influence of the horizontal flow. For intermediate val-ues, the competition between the buoyancy and inertial forces generates a complex dynamic behavior,with periodic and quasiperiodic regimes found for some set of the governing parameters. Furthermore,the importance of a fully three-dimensional model is demonstrated by the analysis of the flow fieldand energy distribution along the three directions.
� 2014 Elsevier Ltd. All rights reserved.
1. Introduction
In the last decades, mixed convection heat transfer has been agreat interest for many engineering and science researchers inthe electronic industry, due to the great requirement of effectivecooling strategies for electronic elements. The main objective of
their studies has been to understand the fundamentals of variouscooling strategies and to achieve high performance cooling meth-ods which meets the heat removal needs of electronic devices withcertain geometries [1]. In the present scenario, electronic gadgetsand modules are extensively used in strategically important areaslike aerospace, defense and biomedical engineering, where mal-function cannot be afforded at any cost [2]. The common practicefor cooling of heat generating elements in situations where largeheat fluxes need to be dissipated, is to allow a low forced convec-tive cooling and simultaneously utilizing buoyancy effects. The

Fig. 1. Frontal view of the three-dimensional domain for Case 1.
830 É. Fontana et al. / International Journal of Heat and Mass Transfer 81 (2015) 829–845
subject of electronic cooling has therefore generated increasedinterest in the analysis of fluid flow and heat transfer in discreteheating situations. Besides the cooling of electronic devices, mixedconvection in cavities can be observed in several other technolog-ical applications, as for example in the ventilation of aircraft cabins[3], heat exchangers [4] and indoor heating with radiators [5].
Several analytical, numerical and experimental studies has beencarried out to investigate the heat transfer and fluid flow in mixedconvection systems [1,2,6–16]. Most of these studies focus on theheat transfer in vertical channels. For example, natural, forcedand mixed convection heat transfer from protruding and flush-mounted discrete heat sources inside vertical channels have beeninvestigated as cited in Dogan et al. [6]. A numerical study onmixed convection in an open cavity with a heated wall boundedby horizontally insulated plates was presented by Manca et al.[8]. They considered three basic heating modes for the open cavityand compared their thermal performances. Brown and Lai [9] stud-ied numerically a horizontal channel with an open cavity andobtained correlations for combined heat and mass transfer whichcovered the entire convection regime from natural, mixed, andforced convection. Leong et al. [10] investigated the mixed convec-tion for the same geometry used by Brown and Lai [9], showingthat the Reynolds and Grashof numbers control the flow patternand the transition to the mixed convection regime. Hacohenet al. [11] presented an experimental and theoretical study forforced and free convection with flush-mounted and protrudingheat sources. Effects of channel geometry, component array height,airflow rate and heat flux were studied. Basak et al. [12] evaluatedmixed convection flows within a square cavity with linearly heatedside walls and observed that the average Nusselt number on thebottom wall increases by increasing the Prandtl and Grashof num-bers. Mixed convection flow in a rectangular ventilated cavity witha heat conducting solid circular cylinder was studied by Rahmanet al. [13]. The authors observed that the average Nusselt numberat the heated surface was higher for the lowest values of the aspectratios.
It is well known that problems involving natural and mixedconvection in cavities have a rich dynamical behavior, showingin several situations, for example, multiplicity of stationary states[17–19], periodic [20–27], quasiperiodic [27–31] or even chaotic[30–36] regimes. The onset of unsteady periodic regimes in mostcases occurs through a Hopf bifurcation [20,25,34,36], giving riseto stable limit cycles, where self-sustained oscillations over thetime are observed for the field variables. For the case of naturalconvection in fluids with low Prandtl number evaluated by Mer-cader et al. [34], the further increase of the Rayleigh number abovethe point where the Hopf bifurcation appears originates a complexscenario of bifurcations and eventually chaotic states emerge.Piazza and Ciofalo [31] showed that for the natural convection ina rectangular cavity, during the transition from periodic to chaoticregimes, quasiperiodic states can appear. In this case, the systemshows an irregular behavior, regulated by more than one incom-mensurate frequencies characterized by an open orbit in a torus.The transition to chaos through torus breakdown in natural andmixed convection systems was also observed by several otherauthors [32,34].
From the above review of the literature it is apparent that theanalysis of fluid flow and heat transfer in natural and mixed con-vection problems is complex, particularly due to the large numberof governing parameter and the non-trivial dynamic behavior. Fur-thermore, when open systems are analyzed, the hypothesis of con-stant mass and energy inside the cavity cannot be considered andthe influence of the mass and energy flow through the open bound-aries needs to be taken in account. The problem of natural convec-tion in partially open cavities was previous investigated usingtwo-dimensional models [37–39] and later expanded to
three-dimensional models [40]. These studies evaluated the natu-ral convection induced by a temperature difference between verti-cal walls and the influence of one or more internal heat sources onthe flow field and energy distribution inside the cavity and on themass flow through the opening. In Fontana et al. [40] it wasshowed that for a cubic cavity the field variables can vary signifi-cantly along the three dimensions, particularly for high Rayleighnumbers.
The aim of this paper is to investigate mixed convection in apartially open cavity with internal heat sources, using a three-dimensional numerical mesh comprising a region external tothe opening. Although computationally expensive, this modelallows a detailed analysis of the problem. The boundary condi-tions are set so that the natural convection can be induced bythe internal heat sources, positioned at the bottom wall, or bythe temperature difference between the bottom wall (hot) andthe upper and vertical walls (cold). This configuration resemblesthe Rayleigh–Bénard system, where the buoyancy forces caninduce the formation of convective cells. Furthermore, the flowinduced by the inlet condition can leads to the formation ofeddies inside the cavity, creating a complex system where differ-ent forces govern the flow pattern.
The paper is structured as follows: in the next section, adetailed description of the problem is presented, including thephysical domain, governing equations and boundary conditionsused. In Section 3 the main results are discussed, in particularthe different processes of formation of recirculations and the com-petition between them. In Section 4, concluding remarks end thepaper.
2. Governing equations and numerical method
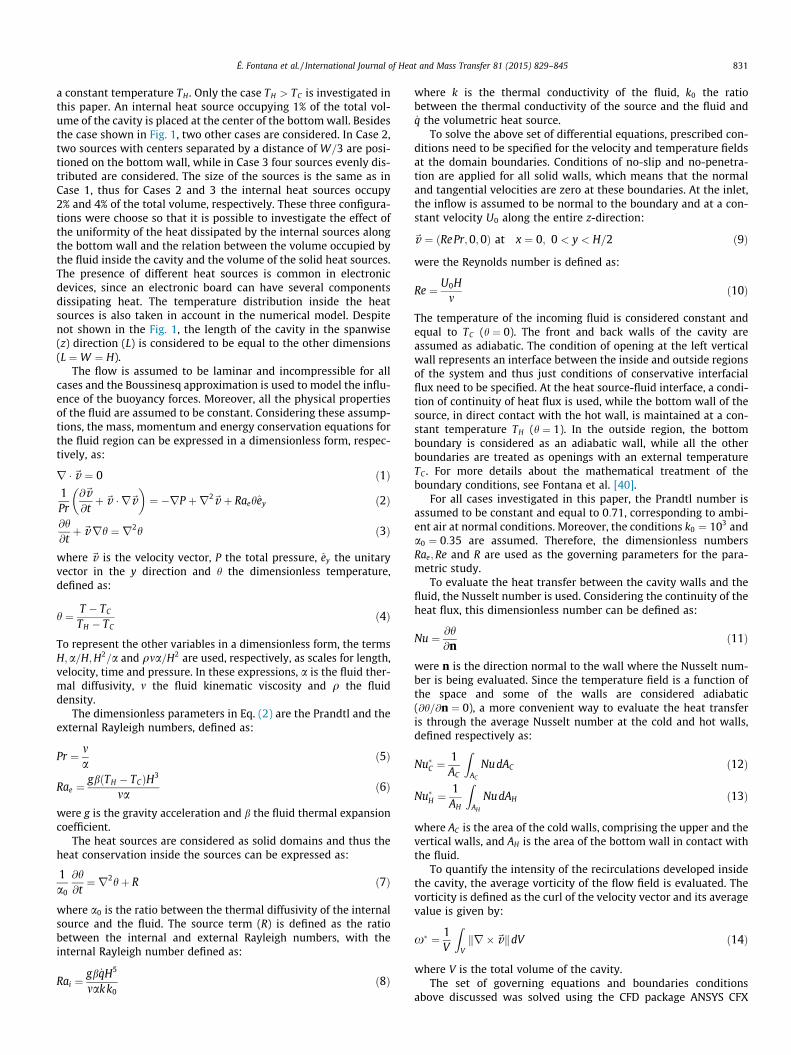
To analyze the influence of the external flow and the intensityof heat dissipation on the flow field inside the cavity, three-dimen-sional numerical models comprising different numbers of internalheat sources are used. A scheme of the domain representing Case 1(one source) is shown in Fig. 1. In this figure, W represents the cav-ity length in the streamwise direction and H the total height of thecavity. An inlet occupying half of the total height is placed in thelower part of the right vertical wall, while a corresponding openingcondition is placed on the left vertical wall. An outside region isalso considered in the model, since recirculations developed atthe opening can cause backflow from the outside to the insideregion.
The temperature of the upper and the vertical walls is set to aconstant value TC , while the bottom wall, including the region indirect contact with the internal heat sources, is assumed to be at
É. Fontana et al. / International Journal of Heat and Mass Transfer 81 (2015) 829–845 831
a constant temperature TH . Only the case TH > TC is investigated inthis paper. An internal heat source occupying 1% of the total vol-ume of the cavity is placed at the center of the bottom wall. Besidesthe case shown in Fig. 1, two other cases are considered. In Case 2,two sources with centers separated by a distance of W=3 are posi-tioned on the bottom wall, while in Case 3 four sources evenly dis-tributed are considered. The size of the sources is the same as inCase 1, thus for Cases 2 and 3 the internal heat sources occupy2% and 4% of the total volume, respectively. These three configura-tions were choose so that it is possible to investigate the effect ofthe uniformity of the heat dissipated by the internal sources alongthe bottom wall and the relation between the volume occupied bythe fluid inside the cavity and the volume of the solid heat sources.The presence of different heat sources is common in electronicdevices, since an electronic board can have several componentsdissipating heat. The temperature distribution inside the heatsources is also taken in account in the numerical model. Despitenot shown in the Fig. 1, the length of the cavity in the spanwise(z) direction (L) is considered to be equal to the other dimensions(L ¼W ¼ H).
The flow is assumed to be laminar and incompressible for allcases and the Boussinesq approximation is used to model the influ-ence of the buoyancy forces. Moreover, all the physical propertiesof the fluid are assumed to be constant. Considering these assump-tions, the mass, momentum and energy conservation equations forthe fluid region can be expressed in a dimensionless form, respec-tively, as:
r �~v ¼ 0 ð1Þ1Pr
@~v@tþ~v � r~v
� �¼ �rP þr2~v þ Raehey ð2Þ
@h@tþ~vrh ¼ r2h ð3Þ
where ~v is the velocity vector, P the total pressure, ey the unitaryvector in the y direction and h the dimensionless temperature,defined as:
h ¼ T � TC
TH � TCð4Þ
To represent the other variables in a dimensionless form, the termsH;a=H;H2=a and qma=H2 are used, respectively, as scales for length,velocity, time and pressure. In these expressions, a is the fluid ther-mal diffusivity, m the fluid kinematic viscosity and q the fluiddensity.
The dimensionless parameters in Eq. (2) are the Prandtl and theexternal Rayleigh numbers, defined as:
Pr ¼ ma
ð5Þ
Rae ¼gbðTH � TCÞH3
mað6Þ
were g is the gravity acceleration and b the fluid thermal expansioncoefficient.
The heat sources are considered as solid domains and thus theheat conservation inside the sources can be expressed as:
1a0
@h@t¼ r2hþ R ð7Þ
where a0 is the ratio between the thermal diffusivity of the internalsource and the fluid. The source term (R) is defined as the ratiobetween the internal and external Rayleigh numbers, with theinternal Rayleigh number defined as:
Rai ¼gb _qH5
makk0ð8Þ
where k is the thermal conductivity of the fluid, k0 the ratiobetween the thermal conductivity of the source and the fluid and_q the volumetric heat source.
To solve the above set of differential equations, prescribed con-ditions need to be specified for the velocity and temperature fieldsat the domain boundaries. Conditions of no-slip and no-penetra-tion are applied for all solid walls, which means that the normaland tangential velocities are zero at these boundaries. At the inlet,the inflow is assumed to be normal to the boundary and at a con-stant velocity U0 along the entire z-direction:
~v ¼ ðRePr;0;0Þ at x ¼ 0; 0 < y < H=2 ð9Þ
were the Reynolds number is defined as:
Re ¼ U0Hm
ð10Þ
The temperature of the incoming fluid is considered constant andequal to TC (h ¼ 0). The front and back walls of the cavity areassumed as adiabatic. The condition of opening at the left verticalwall represents an interface between the inside and outside regionsof the system and thus just conditions of conservative interfacialflux need to be specified. At the heat source-fluid interface, a condi-tion of continuity of heat flux is used, while the bottom wall of thesource, in direct contact with the hot wall, is maintained at a con-stant temperature TH (h ¼ 1). In the outside region, the bottomboundary is considered as an adiabatic wall, while all the otherboundaries are treated as openings with an external temperatureTC . For more details about the mathematical treatment of theboundary conditions, see Fontana et al. [40].
For all cases investigated in this paper, the Prandtl number isassumed to be constant and equal to 0:71, corresponding to ambi-ent air at normal conditions. Moreover, the conditions k0 ¼ 103 anda0 ¼ 0:35 are assumed. Therefore, the dimensionless numbersRae;Re and R are used as the governing parameters for the para-metric study.
To evaluate the heat transfer between the cavity walls and thefluid, the Nusselt number is used. Considering the continuity of theheat flux, this dimensionless number can be defined as:
Nu ¼ @h@n
ð11Þ
were n is the direction normal to the wall where the Nusselt num-ber is being evaluated. Since the temperature field is a function ofthe space and some of the walls are considered adiabatic(@h=@n ¼ 0), a more convenient way to evaluate the heat transferis through the average Nusselt number at the cold and hot walls,defined respectively as:
Nu�C ¼1AC
ZAC
NudAC ð12Þ
Nu�H ¼1
AH
ZAH
NudAH ð13Þ
where AC is the area of the cold walls, comprising the upper and thevertical walls, and AH is the area of the bottom wall in contact withthe fluid.
To quantify the intensity of the recirculations developed insidethe cavity, the average vorticity of the flow field is evaluated. Thevorticity is defined as the curl of the velocity vector and its averagevalue is given by:
x� ¼ 1V
ZVkr �~vkdV ð14Þ
where V is the total volume of the cavity.The set of governing equations and boundaries conditions
above discussed was solved using the CFD package ANSYS CFX

832 É. Fontana et al. / International Journal of Heat and Mass Transfer 81 (2015) 829–845
14.0, where the partial differential equations are discretized usingan element-based finite volume method. Structured meshes withdifferent sizes were evaluated and it was found that a mesh with128� 85� 91 elements, in the x; y and z directions, respectively,was sufficient to achieve a convergence criteria of 10�6. In orderto correctly capture the velocity and temperature gradients nearthe walls, a non-uniform distribution of grid points was used, witha higher density of elements in the regions where higher gradientsare expected. The grid distribution used in this study is similar tothe bi-dimensional grid used in Fontana et al. [39], with a similardistribution in the z-direction.
To check the consistence of the numerical method, a meshrefinement study and a comparison between results obtainedwith the methodology presented in this section and results foundin the literature for a partially-open bidimensional cavity withinternal heat source and for a closed cubic enclosure were per-formed. These comparisons can be found, respectively, in Fontanaet al. [39,40]. More details about the numerical procedures andthe methodology applied can be seen in Fontana et al. [41] andSilva et al. [42].
3. Results
One of the main difficulties in the analysis of mixed convectionproblems is the large number of governing parameters, particularlywhen more than one form of heat dissipation is taken in account. Inthe following results we will consider the Prandtl number constantand equal to 0:71, while the influence of Rae;R and Re will be inves-tigated for all the three cases previous mentioned. Three differentvalues will be considered for the external Rayleigh number(103;104 and 105) and for the Reynolds number (1;10 and 25),while for the ratio between the internal and external Rayleighnumbers four different values will be considered (103;104;105
and 106). As will be discussed later, these ranges correspond to atransition in main heat transfer mode and in the vorticity genera-tion mechanisms.
3.1. Heat dissipation
In several technological applications, such as electronic devices,the total amount of energy released inside the cavity is one of thekey parameters to define the safety of the operational conditions orthe device performance. In this section we investigate the influenceof the intensity of the heat dissipated by the internal heat sourcesand through the bottom wall, measured by the internal (Rai) andexternal (Rae) Rayleigh numbers, respectively. The Reynolds num-ber is set as one unless otherwise mentioned. The results for Re ¼ 1
Table 1Maximum and average values for selected variables for Case 1 and Re ¼ 1.
Rae R hmax h� umax vmax wmax Nu�C Nu�H
103 103 1:005 0:425 2:504 0:953 1:106 0:677 1:686
103 104 1:049 0:431 2:529 1:184 1:110 0:687 1:554
103 105 1:500 0:492 2:784 1:527 1:158 0:792 0:236
103 106 6:007 1:178 5:411 9:098 1:677 2:380 �12:033
104 103 1:005 0:430 19:189 18:972 7:630 1:127 2:888
104 104 1:049 0:437 19:381 19:444 7:670 1:164 2:800
104 105 1:500 0:502 21:152 24:311 8:069 1:550 1:950
104 106 6:004 1:141 39:238 59:453 12:703 6:713 �5:669
105 103 1:004 0:388 70:649 110:193 37:479 2:684 6:488
105 104 1:049 0:393 71:962 111:755 37:731 2:740 6:421
105 105 1:499 0:409 83:714 126:291 40:250 3:378 5:808
105 106 5:996 1:009 133:454 282:512 99:599 13:853 0:774
are very similar to those obtained for Re ¼ 0 and so this conditionis suitable to investigate the effect of the heat dissipation with lowinfluence of the external flow.
Table 1 summarizes some of the most important results for Case1, considering Re ¼ 1. In this table it is presented the maximumvalue for the three components of the velocity vector and for thetemperature and the average temperature and Nusselt numbersat the cold and hot walls. The maximum value for the velocitycomponents can be used to give insights about the intensity ofthe convective motion, while the maximum and average tempera-ture and the average Nusselt numbers provide information aboutthe heat exchange and energy distribution inside the cavity. In par-ticular, the maximum dimensionless temperature (hmax) is animportant parameter in order to define the effect of the internalheat sources. Whenever hmax � 1, the intensity of the heat dissi-pated by the internal heat sources is much more significant thanthe heat transferred by the hot wall, since the bottom and upperwall temperature are used in the definition of the dimensionlesstemperature (h). As can be seen in Table 1, the increase in hmax asa result of the increase in R is almost identical for all Rae values.For the range of parameters investigated, the increase in hmax incomparison with the temperature of the bottom wall (h ¼ 1) isapproximately equal to the product R� 5� 10�6. This relation isalso valid for Cases 2 and 3, as can be seen by the values reportedin Tables 2 and 3. Therefore, the points of high temperature causedby the internal heat source only becomes significant when theinternal Rayleigh number is at least 104 times higher than theexternal Rayleigh number, independently of the number of internalheat sources present.
When the buoyancy forces induced by the heat sources becomestrong enough to overcome the viscous forces, the system under-goes to a state where the convective motion is significant. As pre-vious mentioned, one of the most convenient ways to quantify theintensity of the convective motion is through the maximum veloc-ity inside the cavity. In Table 1 are shown the maximum values ofthe three velocity components inside the cavity for Case 1. For thesake of comparison, for Re ¼ 1 at the inlet the maximum horizontalvelocity correspond to umax ¼ 0:71, while the v and w componentsare equal to zero. As can be seen in Table 1, even for the lowest Rae
and R values the maximum velocity inside the cavity is greaterthan the velocity at the inlet. The isotherms and the streamlinesassociated with Rae ¼ R ¼ 103 are illustrated in the first columnof Fig. 2. The isotherms show a predominant horizontal shape, indi-cating that the heat transfer occurs mainly by conduction and thebottom wall is the most significant heat source. This implies thatthe maximum values of the velocity components result from theeffect of the velocity imposed at the cavity inlet. As observed inFig. 2b, this condition generates an eddy due to the flow separationin the up-right part of the cavity, where the absolute value of allthe components of the velocity field are greater than zero. Thecharacteristics regarding the three-dimensional nature of the flowwill be discussed later.
For Rae ¼ 104 and 105 the maximum velocity is considerablyhigher than for Rae ¼ 103, indicating the presence of a more intenseconvective motion. This behavior can be clearly observed in thelast column of Fig. 2a, where the isotherms for Rae ¼ 105 areshown. In this case, the isotherms exhibit a more vertical format.This shape is commonly observed in Rayleigh–Bénard convectionin cavities where the fluid ascends in the central part and descendcloser to the lateral walls. Indeed, Fig. 2b shows the presence oftwo large recirculations, one close to the right wall rotating inthe clockwise direction and another one near the left wall rotatinganticlockwise. For Rae ¼ 104 the system exhibits a transitionalbehavior, where the convective motion is intense enough to distortthe isotherms and create a relatively strong recirculation inside thecavity.

Table 2Maximum and average values for selected variables for Case 2 and Re ¼ 1.
Rae R hmax h� umax vmax wmax Nu�C Nu�H
103 103 1:005 0:445 2:550 1:154 1:154 0:700 1:389
103 104 1:049 0:456 2:591 1:192 1:167 0:718 1:119
103 105 1:500 0:564 3:002 1:585 1:292 0:902 �1:567
103 106 6:006 1:742 7:254 9:359 2:492 3:409 �27:398
104 103 1:005 0:453 19:419 18:161 7:865 1:114 2:448
104 104 1:049 0:464 19:808 18:615 7:964 1:162 2:229
104 105 1:500 0:575 23:435 23:695 8:924 1:681 0:068
104 106 6:003 1:678 46:587 62:726 16:318 8:989 �20:507
105 103 1:004 0:429 72:202 108:454 34:836 2:748 5:192
105 104 1:049 0:437 73:417 110:870 35:206 2:833 5:001
105 105 1:499 0:527 85:983 131:792 38:395 3:831 3:170
105 106 5:999 1:457 164:539 296:620 112:963 17:819 �14:572
Table 3Maximum and average values for selected variables for Case 3 and Re ¼ 1.
Rae R hmax h� umax vmax wmax Nu�C Nu�H
103 103 1:005 0:467 2:558 1:155 1:172 0:741 0:928
103 104 1:049 0:483 2:613 1:194 1:197 0:769 0:423
103 105 1:500 0:643 3:168 1:611 1:433 1:054 �4:616
103 106 6:007 2:328 9:052 11:143 3:418 4:829 �53:889
104 103 1:005 0:476 18:488 17:806 7:458 1:132 1:717
104 104 1:050 0:492 19:064 18:315 7:601 1:167 1:253
104 105 1:500 0:652 24:314 23:434 8:962 1:892 �3:363
104 106 6:007 2:218 50:728 70:036 18:140 12:186 �48:393
105 103 1:005 0:453 72:210 106:145 31:119 2:737 3:440
105 104 1:050 0:468 74:253 109:486 31:486 4:552 3:016
105 105 1:500 0:614 92:188 143:589 31:784 4:552 �1:215
105 106 6:005 1:968 180:668 336:693 129:460 24:697 �41:899
É. Fontana et al. / International Journal of Heat and Mass Transfer 81 (2015) 829–845 833
From the results presented in Table 1 it is possible to observethat the increase in the parameter R from 103 to 104 causes a smallvariation in the maximum velocity components for all Rae values.The isotherms and streamlines for Rae ¼ 104 and several valuesof R are presented in Fig. 3, where can be seen that the energy dis-tribution and the flow structure for R ¼ 104 are similar to thosepresented in Fig. 2 for R ¼ 103, not showing a significant influenceof the internal heat source on the overall system behavior. WhenR ¼ 105 or 106, however, the presence of the internal heat sourceis more noticeable. For R ¼ 105 the isotherms far from the internalheat source are not significantly modified, but near the heat sourcethe higher temperature gradients distort the isotherms, whichassume a more circular shape. This effect is more visible forR ¼ 106 and reflects also in the larger differences in the maximumtemperature and velocity components values compared with smal-ler R values.
Despite the similarity in the maximum dimensionless tempera-ture for all Rae values, the presence of convective motion affectssubstantially the average temperature inside the cavity. Analyzingthe results shown in Table 1 it is possible to observe that the aver-age dimensionless temperature for Rae ¼ 104 and Rae ¼ 103 isalmost identical for all R values but 106, with just a slight increasefor Rae ¼ 104. This increase is a result of the influence of the exter-nal flow. While for Rae ¼ 103 the heat dissipated in the bottom partis promptly removed through the opening, for Rae ¼ 104 the weakconvective motion moves part of the hot fluid to the upper part ofthe cavity. On the other hand, for Rae ¼ 105 or R ¼ 106 a significantdecrease in h� can be seen as a result of the intensification of theconvective motion. This decrease results mainly from two factors:the increase in the heat transfer coefficient between the fluid andthe cold walls and the increase in the velocity at the opening,
which accelerates the removal of hot fluid and the inlet of coldfluid. Furthermore, it is important to note that both Rae and h aredefined based on the difference of temperature between the walls,which implies that for the same h value the actual temperature is10 times greater for Rae ¼ 105 in comparison with Rae ¼ 104, forexample.
The Nusselt number evaluated at the hot (bottom) and cold(upper, left and right) walls also reflects the change in the systembehavior as the parameters Rae and R change. The Nusselt numberis defined based on the temperature gradient near the wall (Eq.(11)), which implies that a greater temperature gradient generatesa greater Nusselt number. As can be seen in Table 1, the averageNusselt number at the hot wall (Nu�H) significantly decrease asthe intensity of the internal heat source decreases, showing evennegative values for R ¼ 106. In this case, a negative Nusselt numbermeans that the temperature of the fluid adjacent to the bottomwall is greater than the wall temperature (TH), therefore the heattransfer occurs from the fluid to the wall. Moreover, due to thedependence of the wall temperature with the external Rayleighnumber, as Rae increases the values of Nu�H are considerable larger,in particular for high R values. The average Nusselt number at thecold walls (Nu�C) also shows a significant dependence with both Rae
and R values, with an increase in Nu�C as the total amount of energyreleased by any of the heat sources increases.
The maximum values for temperature and velocity compo-nents, as well as the average values for temperature and Nusseltnumbers for Cases 2 and 3 are presented, respectively, in Tables2 and 3. The main difference of these cases in comparison withCase 1 is the spatial distribution of the internal heat source. In Case1 the source is concentrated near the central part of the bottomwall, while for the other cases the distribution is more homoge-

Fig. 2. Isotherms (a) and streamlines (b) evaluated at the plane z ¼ 0:5 for Case 1 considering R ¼ 103 and Re ¼ 1.
834 É. Fontana et al. / International Journal of Heat and Mass Transfer 81 (2015) 829–845
neous over the entire bottom wall. Moreover, as the Rai number isdefined based on the volumetric heat source, the addition of moreinternal sources implies in an increase in the amount of energyreleased.
Despite the increase in the total energy released, since thisenergy is evenly distributed among all the sources, the maximumtemperature reached inside the cavity is basically identical for allcases investigated, as previous commented. The maximum valuesof the velocity components do not show a significant dependencewith the number of internal sources for all R values, with a rela-tively small increase in the maximum values as more sources areadded. As expected, this increase is more noticeable for R ¼ 106,since in this case the natural convection induced by the heat dissi-pated by the internal sources governs the flow pattern inside thecavity. This condition is represented in Fig. 4, where the isothermsand streamlines for Rae ¼ 103 and R ¼ 106 are reported for all thethree cases.
As seen in Fig. 4a, for this set of governing parameters theenergy distribution inside the cavity is mostly governed by theinternal heat sources. When just one heat source is present, theisotherms assume a characteristic oval shape, however, as thenumber of sources increase the uniformity in the heat dissipationover the entire width induces the isotherm to assume a distribu-tion similar to that observed for higher Rae values (see Fig. 2, forexample). The streamlines, shown in Fig. 4b, are quite similar forall cases reported, exhibiting two large recirculations inside thecavity.
As expected, the increase in the number of heat sources causesan increase in the average temperature inside the cavity, as can beseen by comparing the results shown in Tables 1–3. The generalbehavior of the system, though, is similar for all cases, with a slight
increase in h� for low R and Rae values and a more significantdecrease when the convective motion is more intense.
The average Nusselt numbers reported in Tables 2 and 3indicate a more important influence of the number of internalsources. For R ¼ 103 and 104 the average Nusselt number atthe cold walls is very similar for all cases, but for R ¼ 105 and106 an increase of up to 40% can be observed, as a direct resultof the increase in the energy dissipated by the internal heatsources. The average Nusselt number at the hot wall shows asubstantial reduction in the average value as the number ofheat sources increases. As previous discussed, the presence ofan internal heat source increases the temperature of the fluidadjacent to the hot (bottom) wall, reducing the temperaturegradient or even reversing the direction of the heat flux. Natu-rally, the fluid close to the heat source shows a more significanttemperature increase and thus as more sources are added,greater will be the average temperature near the bottom wall,causing the observed reduction in Nu�H .
3.2. Influence of the external flow
In all the results shown in the previous section, the Reynoldsnumber was considered constant and equal to 1, so that the influ-ence of the heat dissipation could be evaluated. The increase in theventilation intensity, however, can be one of the easiest ways tokeep the average temperature inside the cavity low enough. In thissection, the influence of the Reynolds number on the energy distri-bution and flow structure is investigated. We limited the analysisto Case 3, since in this case the changes in the average values ofthe field variables can be more easily noted. Nevertheless, thebehavior for Cases 1 and 2 is very similar. Tables 4 and 5 summa-

Fig. 3. Isotherms (a) and streamlines (b) evaluated at the plane z ¼ 0:5 for Case 1 considering Rae ¼ 104 and Re ¼ 1.
É. Fontana et al. / International Journal of Heat and Mass Transfer 81 (2015) 829–845 835
rize the results for Case 3, considering Re ¼ 10 and Re ¼ 25,respectively.
The maximum dimensionless temperature reached inside thecavity is not affected by the increase in the Reynolds number inthe range of values investigated, as observed in Tables 3–5. Ashmax is greater than 1 for all cases reported, the point of maximumtemperature always correspond to a region adjacent to the internalheat source, particularly at the corners of the upper face. Due to thenon-slip condition imposed at the walls, these corners are regionsof high stagnation and thus the increase in the inlet velocity do notaffect the values of hmax. The average temperature inside the cavity,however, decreases as the Reynolds number increases for all Rae
and R values reported. This is a result of the intensification in theinlet rate of cold fluid and, as a consequence, in the outlet rate ofhot fluid.
The increase in the inlet velocity leads to a proportionalincrease in the maximum horizontal velocity (umax) in the caseswhere the convective motion is not much intense, as forRae ¼ 103. The strong horizontal flow induces the formation of arecirculation in the upper part of the cavity, due to the flow sepa-ration caused by the presence of vertical walls blocking the flow. Inthis case, the fluid confined in the upper part of the cavity rotatesas a result of the shear induced by the horizontal flow. As a conse-quence of the three-dimensional nature of the flow, the maximumvalues of the v and w components also increase for greater Re val-ues. The presence of a stagnated region in the upper part of thecavity, in association with the reduction in the average temperate,causes a decrease in the average Nusselt number in the cold wallsas Re increases for Rae ¼ 103. Near the bottom wall, the increase inthe fluid velocity amplifies the temperature gradient between thehot wall and the fluid, causing an increase in the average Nusseltnumber evaluated at this wall.
For Rae ¼ 104 a more complex behavior is observed. The maxi-mum horizontal velocity continues to be greater for higher Re val-ues, but the relative increase is not as significant as observed forRae ¼ 103. The change in the maximum vertical velocity (vmax),on the other hand, do not follow the same tendency. For Re ¼ 10there is a decrease in vmax in comparison with the results forRe ¼ 1 (Table 3), while for Re ¼ 25 an increase in comparison withRe ¼ 10 is observed for all cases except R ¼ 106. To understand thisbehavior, it is necessary to analyze the phenomena that leads tothe increase in vertical velocity. The development of the verticalvelocity is usually related to the presence of recirculations insidethe cavity, which can have different origins. In particular, the for-mation of recirculation zones can be related to the flow separationand the hydrodynamic forces induced by the horizontal flow on thefluid confined in the upper part of the cavity or to the buoyancyforces induced by the fluid thermal expansion. For the sake of brev-ity, we will refer to the recirculations induced by the shear flow ashydrodynamic recirculations and by the buoyancy forces as ther-mal recirculations.
The increase in the Reynolds number affects the hydrodynamicand thermal recirculations in different ways. For the case of hydro-dynamic recirculations, the increase in Re increases the intensity ofthe recirculations, because these recirculations result directly fromthe influence of the horizontal flow in the flow field. However, asprevious mentioned, the ventilation of the cavity acts primarilyas mechanism of temperature control, removing part of the heatdissipated inside the cavity. This can be evidenced by the reductionin the average dimensionless temperature as Re increases for all Rand Rae values evaluated. Therefore, there is a reduction in theintensity of the thermal recirculations, since these require a tem-perature gradient in order to generate the buoyancy forces. Theinfluence of the Reynolds number on the recirculations reflects also

Fig. 4. Isotherms (a) and streamlines (b) evaluated at the plane z ¼ 0:5 for Rae ¼ 103;R ¼ 106 and Re ¼ 1.
Table 4Maximum and average values for selected variables for Case 3 and Re ¼ 10.
Rae R hmax h� umax vmax wmax Nu�C Nu�H
103 103 1:005 0:421 14:465 7:748 2:593 0:542 1:419
103 104 1:050 0:435 14:520 7:746 2:592 0:563 0:921
103 105 1:500 0:574 15:044 7:722 2:580 0:769 �4:056
103 106 6:007 1:936 21:203 7:689 3:476 3:142 �52:622
104 103 1:005 0:402 27:961 14:661 7:075 0:703 2:135
104 104 1:050 0:414 28:488 15:136 7:225 0:742 1:679
104 105 1:500 0:537 33:413 19:398 8:573 1:185 �2:839
104 106 6:006 1:785 73:182 56:541 17:648 7:807 �46:541
105 103 1:005 0:377 106:385 101:519 48:542 1:874 3:992
105 104 1:050 0:390 109:290 102:492 58:087 1:981 3:583
105 105 1:500 0:512 128:119 118:028 55:464 3:028 �0:479
105 106 6:005 1:886 191:013 316:592 125:589 21:838 �40:037
836 É. Fontana et al. / International Journal of Heat and Mass Transfer 81 (2015) 829–845
in the average vorticity (x�) inside the cavity, as reported inTable 6. In this case the vorticity is presented in a dimensionlessform by using the H2=a as a timescale.
Due to the relation between the intensity of the recirculationand the vertical velocity, the general dependence of x� and vmax
with the parameters R;Rae and Re is similar. For Rae ¼ 103, wherethe hydrodynamic recirculations prevail, the increase in Re causesan increase in the average vorticity, as expected. For Rae ¼ 104 andlow Re values, the thermal recirculations become more vigorousand thus the increase in the Reynolds number from 1 to 10 causesa decrease in the intensity of the recirculations and, as a conse-quence, there is a reduction in both x� and vmax. However, forhigher Re values the hydrodynamic recirculations can becomestrong enough to overcome the thermal recirculations, therefore
an increase in x� and vmax is once again observed, except for thecase R ¼ 106, where the heat dissipated by the internal source ismore significant.
The changes in the flow structure and energy distribution forRae ¼ 104 as R increases can be seen in the Figs. 5 and 6, wherethe streamlines and isotherms are shown, respectively, for Re ¼ 1and Re ¼ 25. For the sake of brevity, the results for Re ¼ 10 arenot presented, however, for this case an intermediary behavior isobserved. Results for R ¼ 103 are not presented as well, since theseare very similar to those for R ¼ 104. Moreover, it is worth notingthat the results in Fig. 6 were evaluated at the plane z ¼ 0:25.Due to the symmetry in the boundary conditions a separation inthe flow is observed in the plane z ¼ 0:5, where the magnitude ofthe vertical velocity in comparison with the horizontal velocity is

Table 5Maximum and average values for selected variables for Case 3 and Re ¼ 25.
Rae R hmax h� umax vmax wmax Nu�C Nu�H
103 103 1:005 0:345 33:021 19:483 5:699 0:2692 2:144
103 104 1:050 0:356 33:055 19:481 5:699 0:278 1:650
103 105 1:500 0:465 33:447 19:467 5:692 0:373 �3:285
103 106 6:006 1:548 37:237 19:554 5:621 1:393 �51:995
104 103 1:005 0:339 42:511 20:002 5:866 0:313 2:467
104 104 1:050 0:349 42:898 20:038 6:036 0:328 2:007
104 105 1:500 0:451 46:134 20:410 7:557 0:505 �2:514
104 106 6:006 1:431 73:856 55:421 24:719 4:931 �45:324
105 103 1:005 0:307 102:463 86:097 42:598 1:243 4:585
105 104 1:050 0:318 104:628 88:692 43:639 1:328 4:188
105 105 1:500 0:417 132:834 116:214 64:394 2:225 0:219
105 106 6:005 1:769 206:231 316:488 200:539 22:169 �38:149
Fig. 5. Isotherms (a) and streamlines (b) evaluated at the plane z ¼ 0:5 for Case 3 considering Rae ¼ 104 and Re ¼ 1.
É. Fontana et al. / International Journal of Heat and Mass Transfer 81 (2015) 829–845 837
not large enough to allow a clear visualization of the recirculationsdeveloped.
As can be seen in Fig. 5, for Rae ¼ 104 and Re ¼ 1 the influence ofthe shear flow for all R values causes a distortion in the convectivecells. In a pure natural convective system with no external flow, aflow structure comprising two symmetrical convective cells wouldbe expected, due to the symmetric nature of the boundary condi-tions related to the plane x ¼ 0:5. The incoming flow, however,makes the cell near the inlet grows larger than the one near theopening. The increase in the heat dissipated by the internal sourcestends to reduce the difference in the recirculations size, but evenfor R ¼ 106 the flow is significantly distorted. The isotherms(Fig. 5a) show a homogeneous distribution of energy inside thecavity, without the existence of large temperature gradients above
the heat sources. Despite the influence of the external flow, for all Rvalues the origin of the recirculations are essentially thermal-dependent.
A different behavior is observed for Re ¼ 25, as presented inFig. 6. The isotherms and streamlines for R ¼ 104 and 105 are sim-ilar, showing the presence of a hydrodynamic recirculation rotat-ing clockwise in the upper part of the cavity, while in the bottompart the flow is basically in the horizontal direction. In this case,the isotherms distribution (Fig. 6a) indicates a temperature stagna-tion in the upper part, with significant temperature gradients inthe bottom part. This flow separation also reflects in the flow pat-tern, since the fluid confined in the upper part just rotates due tothe shear induced by the horizontal flow and the heat transferbetween the lower and upper parts is much less significant than

Fig. 6. Isotherms (a) and streamlines (b) evaluated at the plane z ¼ 0:25 for Case 3 considering Rae ¼ 104 and Re ¼ 25.
838 É. Fontana et al. / International Journal of Heat and Mass Transfer 81 (2015) 829–845
the heat removal through the opening. In this situation, the pres-ence of cold walls do not significantly affects the energy distribu-tion. For R ¼ 106 the heat dissipated by the internal sources isstrong enough to affect the isotherms in the upper part of the cav-ity. Though the flow pattern observed still consists mainly in agreat clockwise recirculation, the buoyancy forces reduce the ther-mal stagnation and increase the extension of the recirculation inthe vertical direction. This effect causes a slight reduction in themaximum vertical velocity and in the average vorticity.
Even though the average vorticity is not directly proportional tothe Reynolds number for Rae ¼ 104, the average Nusselt number atthe cold and hot walls follows the same tendency observed forRae ¼ 103, with a reduction in Nu�C and an increase in Nu�H as Reincreases. The decrease in the temperature gradient near the coldwalls as a result of the intensity of the external flow can be clearlyseen in the isotherms presented in Figs. 5a and 6a. The increase inthe Nu�H , for both positive and negative values, indicates a decreasein the fluid temperature near the bottom wall, which is a directconsequence of the ventilation induced by inlet flow.
The influence of the Reynolds number on the velocity field forRae ¼ 104 is summarized in Fig. 7, where the profiles of horizontalvelocity along the y-direction are shown for different locationsalong the streamwise direction. The curves reported in this figurestart exactly at the central part of the top wall of each internal heatsource.
For Re ¼ 1 (Fig. 7a), the curves show a similar behavior forR ¼ 104 and R ¼ 106, with a change in the shape of the curve eval-uated at x ¼ 4H=5 in comparison with the others locations for bothR values. This change occurs due to the formation of two thermalrecirculations rotating in opposite directions, as shown in Fig. 5.In this case, the magnitude of the velocity is grater at x ¼ 2H=5,
which correspond approximately to the center of the main recircu-lation. Moreover, it is important to note that for both R values themagnitude of the velocity is similar in the bottom and the upperparts of the cavity, indicating the thermal origin of therecirculations.
For Re ¼ 10 (Fig. 5 and R ¼ 104, all the curves show a similarpattern, with the formation of a single recirculation inside the cav-ity. As the center of the recirculation is located near the geometriccenter of the cavity, the horizontal velocity magnitude in the cen-tral points (x ¼ 3H=5 and x ¼ 2H=5) is greater than near the walls.Furthermore, the influence of the shear flow makes the velocitymagnitude larger in the bottom part of the cavity than in the upperpart. This phenomenon is even more evidenced for Re ¼ 25 andR ¼ 104 (Fig. 7c), where it can be seen that the magnitude of thehydrodynamical recirculations (see Fig. 6) is much smaller thanthe magnitude of the shear flow or even the thermal recirculationsobserved for R ¼ 104 and smaller Re values.
A more complex behavior can be observed for Re ¼ 10 andR ¼ 106. In this case, a small recirculation appears near the outletregion, which cause the slight increase in the horizontal velocitynear y ¼ 0 for x ¼ 4H=5. Other than that, the curves show anapproximately antisymmetrical behavior in relation to y ¼ 0:5,indicating the presence of a single thermal recirculation insidethe cavity. For Re ¼ 25 and Ra ¼ 106, the system shows a singlethermal recirculation strongly deformed by the shear flow, asobserved in Fig. 6. The curves still have an antisymmetrical behav-ior, however the magnitude of the velocity is significantly greaterin the bottom part.
For Re ¼ 25 and Rae values higher than 104, the intensity of therecirculations induced by the shear flow and by the buoyancyforces are comparable and a competition between them can take

Fig. 7. Profiles of horizontal velocity (u) along the vertical position evaluated at z ¼ L=2 and different points in the streamwise (x) direction for Rae ¼ 104 and (a) Re ¼ 1, (b)Re ¼ 10 and (c) Re ¼ 25.
Table 6
É. Fontana et al. / International Journal of Heat and Mass Transfer 81 (2015) 829–845 839
place, significantly changing the flow pattern. This behavior is dis-cussed in the following section.
Average dimensionless value of the magnitude of vorticity inside the cavity for theCase 3.
Re R Rae ¼ 103 Rae ¼ 104 Rae ¼ 105
1 103 4:673 73:484 481:105
1 104 4:801 76:769 494:137
1 105 6:374 106:531 608:302
1 106 37:399 317:028 1236:88
10 103 31:948 65:653 415:936
10 104 31:966 68:070 427:909
10 105 32:238 91:796 526:620
10 106 43:738 260:572 1300:950
25 103 81:496 89:034 353:081
25 104 81:496 89:769 364:692
25 105 81:501 99:542 478:513
25 106 82:991 231:237 1427:630
3.3. Competition between hydrodynamic and thermal recirculations
When the external Rayleigh number is defined as 105, theamount of energy released inside the cavity significantly increasesand the influence of the buoyancy forces becomes more significantin comparison with the cases Rae ¼ 103 or 104 discussed in the pre-vious section. For Rae ¼ 105 and R ¼ 103 or 104, the flow field andthe energy distribution inside the cavity show a pattern similar tothose observed for Rae ¼ 104 and R ¼ 106 for all Re values (seeFigs. 5 and 6). This similarity can even be seen by the change inthe maximum vertical velocity (Tables 3–5) and the average vortic-ity (Table 6). For the two cases, a decrease in vmax and x� isobserved as the hydrodynamic recirculations become moreintense. It is worth to mention that for Rae ¼ 105 and R ¼ 103 or

840 É. Fontana et al. / International Journal of Heat and Mass Transfer 81 (2015) 829–845
104, inside the range of parameters investigated in this study, thesystem always reaches a steady state where the flow field isaffected by both thermal and hydrodynamic recirculations.
For the previous discussed cases, when Re ¼ 25 the internalheat sources affect the flow pattern by distorting the predominanthydrodynamic recirculations, as observed for Rae ¼ 104 andR ¼ 106, for example. However, when Rae ¼ 105 and the heatreleased by the internal sources is sufficiently high, the buoyancyforces become strong enough to compete with the inertial forcesinduced by the external flow and an unsteady periodic state canarise. As commented in the Introduction section, the presence ofperiodic states in mixed and natural convection problems, usuallyas a result of a Hopf bifurcation, was mentioned by several authors.One example of periodic oscillatory state appears for Case 3,Rae ¼ 105;Re ¼ 25 and R ¼ 105. In Fig. 8 the temporal evolutionof the temperature at three points inside the cavity is presented,evaluated at x ¼ 0:5; z ¼ 0:5 and different y values.
As can be seen in Fig. 8, after an initial period of time where thetemperature changes erratically, the system enters in a state wherethe temperature starts to oscillate. Initially, the amplitude of thisoscillation grows over time, however, after some time the ampli-tude remains constant and a self-sustained oscillatory state isreached. Despite the difference observed in the amplitude andeven in the shape of the curves evaluated at different y positions,the period of oscillation is the same at all points. In this particularcase, the dimensionless period associated with the fully-developedoscillations is T ¼ 0:04026. For Rae ¼ 105 and R ¼ 105 the presenceof oscillatory states was not observed for Re ¼ 10 or Re ¼ 1. Inthese cases, the system exhibit some oscillations over time, buteventually these oscillations disappear or are no longer strong
Fig. 8. Temporal evolution of the dimensionless temperature at different pointsevaluated at x ¼ 0:5; z ¼ 0:5 and (a) y ¼ 0:25, (b) y ¼ 0:5 and (c) y ¼ 0:75 for Case 3,Re ¼ 25;Rae ¼ 105 and R ¼ 105.
enough to be differentiated from numerical errors. The results inTable 5 take in account the oscillatory behavior, which means thatthe average variables correspond to the average values evaluatedover the entire cycle, after the permanent state was reached, andthe maximum variables correspond to the maximum valueobserved during the cycle.
As previous mentioned the oscillatory state emerges due to thecompetition between the modes associated with the formation ofthermal and hydrodynamic recirculations. As a result, the velocityprofiles will vary over the cycle duration. This behavior can beobserved in Fig. 9, where the curves of horizontal velocity alongthe y-direction (Fig. 9, and the vertical velocity along the x-direc-tion (Fig. 9b) are shown for Rae ¼ 105;R ¼ 105 and Re ¼ 25. Thesecurves were evaluated at the center of the cavity and results fordifferent time instants during the cycle are presented.
The curves of horizontal velocity show a similar behavior in thelower part of the cavity (y < 0:5) during the entire cycle. Close tothe bottom wall (y ¼ 0), the horizontal velocity is almost zero,due to the stagnation caused by the presence of the internal heatsources occupying the position 0 < y < 0:1. In the region just abovethe sources, the velocity profile is governed by the external flow,showing a parabolic profile for all instants. In the upper part, wherethe recirculations of the flow effectively take place, a more signif-icant variation is observed. For the initial instants, the point ofmaximum velocity appears at y � 0:7 and the curves show a moreuniform distribution, while for intermediate instants (as for exam-ple t ¼ 0:4T) the velocity has its maximum at y � 0:9 and thecurves show a sudden variation near these peaks. For longer times,the system starts to go back to the initial position, closing the cycle.As can be seen in Figs. 5 and 6, a more uniform distribution in ualong y is a characteristic of the thermal recirculations, wherethe eye of the recirculation tends to appears closer to the centerof the cavity. As for the hydrodynamic recirculations, the eddiestends to form closer to the upper wall, thus, the horizontal velocityand its derivative are greater in this region. Therefore, it is possibleto conclude that for the case shown in Fig. 9 the system starts witha thermal recirculation, progress toward a hydrodynamic recircu-lation and then goes back to the initial stage.
This behavior can also be inferred from the curves of verticalvelocity along the x-direction, as presented in Fig. 9b. These curvesare associated with the mass flow between the lower and upperparts of the cavity: a positive value means an upward flow and anegative value a descendent flow. Due to the three-dimensionalnature of the flow, the area between the positive and the negativeparts of theses curves and the v ¼ 0 line do not need necessarily beidentical in order to ensure mass conservation. As can be seen inthe figure, the magnitude of the vertical velocity tends to begreater during the initial instants for almost all x values, exceptnear the inlet (x ¼ 0). For intermediate instants, there is a consid-erable reduction in the velocity magnitude, which means that theintensity of the mass flow between the lower and upper partsdecrease. The thermal recirculations are originated by the actionof the buoyancy forces that induce the fluid flow in the verticaldirection (due to the direction of the gravitational force). Thehydrodynamic recirculations, on the other hand, appear due tothe shear induced by the horizontal flow and thus promote thestagnation of the fluid in the upper part of the cavity. Therefore,it is clear that the reduction in the mass flow at the y ¼ H=2 planeindicates the emergence of hydrodynamic recirculations.
As the intensity of the heat dissipated by the internal sourcesincreases, the system behavior becomes more complex, as illus-trated in Fig. 10, where is shown the temporal evolution of thetemperature evaluated at the same points as those presented inFig. 8, considering however R ¼ 106.
In the initial instants the behavior of the curves in Fig. 10 is sim-ilar to that observed in Fig. 8, with a highly irregular and intense

Fig. 9. Profiles of (a) horizontal velocity evaluated at x ¼ 0:5 and z ¼ 0:5 and (b) vertical velocity evaluated at y ¼ 0:5 and z ¼ 0:5 at several instants during the oscillatoryregime for Case 3, Rae ¼ 104;R ¼ 105 and Re ¼ 25.
É. Fontana et al. / International Journal of Heat and Mass Transfer 81 (2015) 829–845 841
variation in the temperature. This variation tends to decrease asthe mixed convection takes place and the velocity and temperaturefields adjust to the flow conditions. For 0:3 < t < 0:4 an almostperiodic state can be observed, however, at t � 0:4 a suddenchange in the flow conditions occurs and the system enters in aquasiperiodic regime due to the appearance of a second fundamen-tal frequency. As mentioned by Strogatz [43], in a quasiperiodicstate the solution trajectory is characterized by an open path onthe surface of a torus, which means that the system continuouslyoscillates, but these oscillations vary over time and thus the behav-ior in each cycle is never exactly the same, in opposition to theperiodic regime observed for R ¼ 105. The results shown inFig. 10 are associated with Case 3, however, for Case 1 and 2 a sim-ilar regime for Rae ¼ 105;R ¼ 106 and Re ¼ 25 was found.
From the results shown in this section it is possible to infer thatthe problem investigated in this study has a very complex dynamicbehavior. A detailed stability analysis need to be carried out inorder to define how the periodic and quasiperiodic regimes appear,as well as what is the behavior of the system for even greater R val-ues. As mentioned in the Introduction section, it is common theemergence of chaotic regimes due to torus breakdown. However,the computational techniques applied in the present study aretoo much computationally expensive to allow such study. On theother hand, the CFD analysis provide a detailed portrait of the flowfield, including the temporal and spatial distribution of the vari-ables. This is explored in the following section, where the three-dimensional nature of the flow is discussed.
3.4. Three-dimensional flow
The three-dimensional nature of the flow induced by naturalconvection inside partially open cavities was discussed in Fontanaet al. [40], where it was shown that for a cubic cavity with uniformboundary conditions along the z-direction, the approximation interms of a two-dimensional model can leads to significant devia-tions, particularly for high Rae numbers. The importance of theflow in the z-direction can be clearly seen by the maximum veloc-ity in this direction (wmax), as shown in Tables 1–5, where it is pos-sible to observe that the order of magnitude of wmax is the same asthe maximum horizontal and vertical velocities.
The change in wmax as the Reynolds number increases forRae ¼ 103 follows the same tendency as observed for vmax andumax, with an increase in the maximum velocity as the intensityof the external flow increases. For Rae ¼ 104, the value of wmax
shows a slight decrease when the Reynolds number is increasedfrom 1 to 10, due to the reduction in the intensity of the recircula-tions, as previous discussed. A similar behavior is observed for vmax.
However, when Re is increased to 25 and the hydrodynamic recir-culations becomes more significant, the value of wmax continues todecrease for all R values, except for the case R ¼ 106. For Rae ¼ 105
the values of wmax tend to increase as Re increases, but a behaviordependent on both R and Re values is observed. In summary, fromthe results of wmax it is possible to observe that the intensity of theflow in the z-direction, as expected, is directly related to the inten-sity of the recirculations, particularly when these recirculations arethermal-dependent.
The development of flow in the z-direction indicates that thetemperature field also has a three-dimensional distribution. InFig. 11 the temperature profiles along the z-direction evaluatedat x ¼ 0:5 and different y and Re values are presented. These resultsare associated with Case 3, for Rae ¼ 104 and R ¼ 104 and 106. Theplots evaluated at y ¼ 0:5 correspond to the exact center of thecavity, while y ¼ 0:25 is a region closer to the internal heat sourcesand y ¼ 0:75 closer to the cold walls.
As can be seen in Fig. 11, the general behavior of the curves issimilar for all Re values, being the differences caused by theincrease in the intensity of the internal heat sources more signifi-cant. For R ¼ 104 the profiles obtained for Re ¼ 25 show a less pro-nounced dependence on the z-direction in comparison with thecurves for Re ¼ 1 and 10. This behavior is in accordance with thedecrease observed in wmax as Re increases. For Re ¼ 1 (Fig. 11a)the regions closer to the bottom (y ¼ 0:25) or upper (y ¼ 0:75)walls show a greater variation along the z-direction than in thecenter of the cavity. As can be observed in Fig. 5, in this case thereis the development of a thermal recirculation occupying most ofthe internal region with center close to center of the cavity, whichmeans that the region near y ¼ 0:5 correspond to a more stagnatedregion, thus the magnitude of the three components of the velocityvector is lesser at this point. As Re increases, the hydrodynamicrecirculations become dominant, as seen in Fig. 6b, where thestreamlines for Re ¼ 25 are shown. In this case, the profiles alongthe z-direction (Fig. 11c) are much more uniform, particularly nearthe upper wall, regardless of the relatively strong hydrodynamicrecirculation that takes place in this region. Even near the bottomwall, where the temperature gradients in the y-direction are moreintense, the profiles along the z-direction are more uniform. Thisindicates that, in this case, the three-dimensional dependence ofthe hydrodynamic recirculations is less noticeable than the depen-dence of the thermal recirculations.
The three-dimensional nature of the thermal recirculationsbecomes more evident when the results for R ¼ 106, shown inthe second column of Fig. 11, are evaluated. For all Re values thedependence along the z-direction for R ¼ 106 is much more signif-icant than for R ¼ 104, in special for the curves evaluated at

Fig. 10. Temporal evolution of the dimensionless temperature at different pointsevaluated at x ¼ 0:5; z ¼ 0:5 and (a) y ¼ 0:25, (b) y ¼ 0:5 and (c) y ¼ 0:75 for Case 3,Re ¼ 25;Rae ¼ 105 and R ¼ 106.
842 É. Fontana et al. / International Journal of Heat and Mass Transfer 81 (2015) 829–845
y ¼ 0:25. As previous discussed, for R ¼ 106 the influence of thebuoyancy forces are dominant for low Re values and remains sig-nificant even for Re ¼ 25 (see Fig. 6). It is worth noting that dueto the intensity of the convective motion, the temperature closerto the cold walls (y ¼ 0:75) is generally greater than the tempera-ture near the cavity central point (y ¼ 0:5), and for Re ¼ 1 and 10can be even greater than at y ¼ 0:25. As Re increases and the rela-tive strength of the thermal recirculations decreases, the profilesstarts to show a more uniform pattern along the z-direction.
The differences in the influence of the thermal and hydrody-namic recirculations on the profiles along the z-direction can be
observed in Fig. 12, where the profiles of dimensionless tempera-ture and vertical velocity are presented for several time instantsduring the periodic regime observed for Rae ¼ 105;R ¼ 105 andRe ¼ 25. As previous mentioned, the behavior for the initial andfinal instants are associated with thermal recirculations and forintermediary instants with hydrodynamic recirculations.
As can be seen in Fig. 12a, during all the cycle the profiles oftemperature show a similar behavior, with a point of minimumnear the front and back walls and an increase in the central part.For t ¼ 0 and t ¼ T just a small oscillation in the temperature isobserved along the z-direction, while for the other time instantsa point of maximum temperature appears in the central region.The difference between the points of minimum and maximumtemperature is particularly high for the time instants when thehydrodynamic recirculations are more intense, as for t ¼ 0:4T, forexample. These results do not contradict the fact that, when thehydrodynamic recirculations are predominant, the fluid in theupper part of the cavity is more stagnated and the three-dimen-sional dependence of the variables is, in general, less intense. Athree-dimensional analysis of the energy distribution in the planex ¼ y ¼ 0:5, where the curves shown in Fig. 12 are evaluated,shows that when the thermal recirculations are dominant, thetemperature is more uniform due to the increase in the downwardflow of cold fluid (see Fig. 12b), while for the hydrodynamic recir-culations the hot fluid remains stagnated in the central region.Close to the front and back walls, where the vertical velocity issmall for all cases, the influence of the horizontal flow, associatedwith the inlet of cold fluid, decreases the fluid temperature.
The profiles of vertical velocity (Fig. 12b), show a more distinctbehavior for different time instants. Near the start or the end of thecycle, the vertical velocity profiles exhibit a significant variationalong the z-direction, with a region of high negative values nearthe center of the cavity and slight positive values near the walls.A detailed analysis of the flow structure reveals that the recircula-tions near the front and back walls develop structures with a cen-ter positioned at higher y values than the recirculation in thecentral part of the cavity. For the curves shown in Fig. 12, duringall the cycle the region near the walls is just below the center ofthe recirculations, causing a slight upward flow, while the regionnear the center is at the same height as the center of the recircula-tion. The increase in the magnitude of the vertical velocity atz ¼ 0:5 for initial and final instants was previous observed inFig. 9b, being a consequence of the increase in the mass flowbetween the lower and upper parts of the cavity.
The energy exchange caused by the fluid flow through the open-ing is an important phenomenon to be evaluated, since the openingacts as a mechanism of temperature control, allowing the removalof hot fluid and the inlet of cold fluid. The intensity and the direc-tion of the flow at the opening depend on the flow field inside thecavity, thus, a three-dimensional dependence is also expected forthe flow at the opening. In Fig. 13 the profiles of horizontal velocityalong the z-direction are presented for Case 3 and Rae ¼ 104, eval-uated at y values corresponding to 25% (y ¼ 0:125), 50% (y ¼ 0:25)and 75% (y ¼ 0:375) of the total opening height. A negative valuefor u means that the flow is from the outside to the inside region(inlet of cold fluid) and a positive value means the opposite (outletof hot fluid).
As seen in Fig. 13a, for Re ¼ 1 the velocity profiles at the open-ing are very similar for R ¼ 104 and R ¼ 106, despite the significantdifference observed in the temperature profiles inside the cavityshown in Fig. 11. In this case, the anticlockwise thermal recircula-tion developed close to the opening generates a region of outflowin the upper part of the opening and a region of inflow in the bot-tom part. For this particular case, the inflow region occupies a lar-ger part of the opening, but a detailed analysis of the velocity fieldin the opening shows that the velocity magnitude in the upper-

Fig. 11. Temperature profiles along the z-direction evaluated at x ¼ 0:5 and different y values for Case 3, Rae ¼ 104 and (a) Re ¼ 1, (b) Re ¼ 10 and (c) Re ¼ 25.
Fig. 12. Profiles of (a) temperature and (b) vertical velocity evaluated at y ¼ 0:5 and x ¼ 0:5 at several instants during the oscillatory regime for Case 3, Rae ¼ 104;R ¼ 105 andRe ¼ 25.
É. Fontana et al. / International Journal of Heat and Mass Transfer 81 (2015) 829–845 843

Fig. 13. Horizontal velocity profiles along the z-direction evaluated at the opening (x ¼W) and different y values for Case 3, Rae ¼ 104 and (a) Re ¼ 1 and (b) Re ¼ 25.
844 É. Fontana et al. / International Journal of Heat and Mass Transfer 81 (2015) 829–845
most part is greater and so the mass conservation is ensured. ForRe ¼ 25 and R ¼ 104 the velocity profiles show an almost parabolicshape for all y values. This behavior is expected when the naturalconvection is negligible and the flow field is governed only bythe external flow. As the intensity of the internal heat sourcesincreases, the thermal recirculation generates an inflow regionagain, however, due to the increase in the mass of fluid that entersthrough the inlet, the extension of the outflow region remainslarger.
4. Conclusions
In several technologic applications, the ventilation can be usedas a mechanism to control the temperature inside cavities withinternal heat dissipation. In this scenario, the study of the flowstructure and energy distribution inside cavities is essential inorder to define the set of optimal conditions for each case. In thestudy reported herein, we presented a three-dimensional numeri-cal analysis of mixed convection in partially open cavities withinternal heat sources. The boundary conditions were set so thatthe confined fluid was heated from below and cooled from above,creating a system similar to a Rayleigh–Bénard convective system.Different values for the Rayleigh numbers defining the heat dissi-pated by the internal source (Rai) and the temperature differencebetween the bottom and top walls (Rae) were evaluated, as wellas different Reynolds numbers and number of internal sources.
The presence of an inlet condition can significantly affect theflow pattern, even when the buoyancy forces are negligible, dueto the vertical walls that act as an obstacle to the flow and confinepart of the fluid in the upper most part of the cavity. The resultsobtained in the present study showed the existence of two differ-ent processes controlling the formation of recirculations inside the
cavity, one of them associated with the shear induced by the hor-izontal flow on the confined fluid (hydrodynamic recirculation)and another one associated with the buoyancy forces (thermalrecirculation). The former is predominant when the inertial forcesare greater than the buoyancy forces while the latter emerge whenthe heat dissipated inside the cavity generates enough buoyancy toovercome the horizontal flow.
The change in the Reynolds number affects the different pro-cesses of formation of recirculations in opposite ways: the increasein the inlet flow increases the heat removal, decreasing the thermalgradient that generates the buoyancy forces and the intensity ofthe thermal recirculations, and increases the shear induced bythe horizontal flow and thus intensify the hydrodynamic recircula-tions. Whenever one of the two forms of recirculation governs theflow pattern, the general system behavior is relatively simple.However, when the forces associated with each process of forma-tion of recirculation are similar, the competition between the ther-mal and the hydrodynamic recirculations leads to regimes with amore complex dynamic behavior. For example, for Re ¼ 25 a self-sustained periodic state was observed for Rae ¼ R ¼ 105 and theincrease in the intensity of the internal heat source to R ¼ 106 orig-inated a quasiperiodic regime where the velocity and temperaturefields continuously vary over time.
The results also showed a strong three-dimensional nature ofthe flow inside the cavity, indicating that a simplified two-dimen-sional model is not able to capture some important aspects of thesystem behavior. Finally, it is important to emphasize that thelarge number of physical parameters governing the flow pattern,including the physical properties of the fluid, geometric character-istics and boundary conditions, makes the analysis of all the possi-ble regimes very difficult to be achieved through direct simulation,due to the high computational cost involved. However, this provedto be a very adequate methodology to perform detailed analysis of

É. Fontana et al. / International Journal of Heat and Mass Transfer 81 (2015) 829–845 845
the velocity and temperature field for specific values for the gov-erning parameters, as presented in this study.
Conflict of interest
None declared.
References
[1] S.M. Aminossadati, B. Ghasemi, A numerical study of mixed convection in ahorizontal channel with a discrete heat source in an open cavity, Eur. J. Mech.B/Fluids 28 (2009) 590–598.
[2] T.V. Radhakrishnan, A.K. Verma, C. Balaji, S.P. Venkateshan, An experimentaland numerical investigation of mixed convection from a heat generatingelement in a ventilated cavity, Exp. Therm. Fluid Sci. 32 (2007) 502–520.
[3] V. Bianco, O. Manca, S. Nardini, M. Roma, Numerical investigation of transientthermal and fluidynamic fields in an executive aircraft cabin, Appl. Therm. Eng.29 (2009).
[4] I. Voicu, T. Maré, N. Galanis, J. Miriel, I. Colda, Mixed convection in a verticaldouble pipe heat exchanger, Int. J. Therm. Sci. 46 (2007) 540–550.
[5] F. Garoosi, S. Garoosi, K. Hooman, Numerical simulation of natural convectionand mixed convection of the nanofluid in a square cavity using buongiornomodel, Powder Technol. 268 (2014) 279–292.
[6] A. Dogan, M. Sivrioglu, S. Baskaya, Experimental investigation of mixedconvection heat transfer in a rectangular channel with discrete heat sources atthe top and at the bottom, Int. Commun. Heat Mass Transfer 32 (2005) 1244–1252.
[7] G. Guo, M.A.R. Sharif, Mixed convection in rectangular cavities at variousaspect ratios with moving isothermal side walls and constant flux heat sourceon the bottom wall, Int. J. Therm. Sci. 43 (2004) 465–475.
[8] O. Manca, S. Nardini, K. Khanafer, K. Vafai, Effect of heated wall position onmixed convection in a channel with an open cavity, Numer. Heat Transfer A 43(3) (2003) 259–282.
[9] N.M. Brown, F.C. Lai, Correlations for combined heat and mass transfer from anopen cavity in a horizontal channel, Int. Commun. Heat Mass Transfer 32 (8)(2005) 1000–1008.
[10] J.C. Leong, N.M. Brown, F.C. Lai, Mixed convection from an open cavity in ahorizontal channel, Int. Commun. Heat Mass Transfer 32 (5) (2005) 583–592.
[11] J. Hacohen, T.W. Chiu, A.A. Wragg, Forced and free convective heat transfercoefficients for a model printed circuit board channel geometry, Exp. Therm.Fluid Sci. 10 (3) (1995) 327–334.
[12] T. Basak, S. Roy, P.K. Sharma, I. Pop, Analysis of mixed convection flows withina square cavity with linearly heated side wall(s), Int. J. Heat Mass Transfer 52(2009) 2224–2242.
[13] M.M. Rahman, M. Elias, M.A. Alim, Mixed convection flow in a rectangularventilated cavity with a heat conducting solid circular cylinder, Int. J. Eng.Trans. B 7 (2011) 93–105.
[14] G.C. Buscaglia, E.A. Dari, Numerical investigation of flow through a cavity withinternal heat generation, Numer. Heat Transfer A 43 (2003) 525–541.
[15] A. Elatar, K. Siddiqui, The effect of mixed convection on the structure ofchannel flow at low Reynolds numbers, Int. J. Heat Fluid Flow 46 (2014) 29–42.
[16] M. Mahmoodi, Mixed convection inside nanofluid filled rectangular enclosureswith moving bottom wall, J. Therm. Sci. 15 (2011) 889–903.
[17] M. Bhattacharya, T. Basak, On multiple steady states for natural convection(low Prandtl number fluid) within porous square enclosures: effect ofnonuniformity of wall temperatures, Int. J. Heat Mass Transfer 59 (2013)230–246.
[18] M. Bhattacharya, T. Basak, H.F. Oztop, Y. Varol, Mixed convection and role ofmultiple solutions in lid-driven trapezoidal enclosures, Int. J. Heat MassTransfer 63 (2013) 366–388.
[19] V. Erenburg, A.Y. Gelfgat, E. Kit, P.Z.B. Yoseph, A. Solan, Multiple states,stability and bifurcations of natural convection in a rectangular cavity withpartially heated vertical walls, J. Fluid Mech. 492 (2003) 63–89.
[20] T.W.H. Sheu, R.K. Lin, Three-dimensional bifurcations in a cubic cavity due tobuoyancy-driven natural convection, Int. J. Heat Mass Transfer 54 (2011) 447–467.
[21] F. Xu, J.C. Patterson, C. Lei, Transition to a periodic flow induced by a thin fin onthe sidewall of a differentially heated cavity, Int. J. Heat Mass Transfer 52(2009) 620–628.
[22] F. Xu, S.C. Saha, Transition to an unsteady flow induced by a fin on the sidewallof a differentially heated air-filled square cavity and heat transfer, Int. J. HeatMass Transfer 71 (2014) 236–244.
[23] A. Barletta, E. Zanchini, Time-periodic laminar mixed convection in an inclinedchannel, Int. J. Heat Mass Transfer 46 (2003) 551–563.
[24] D.H. Kang, M.Y. Ha, H.S. Yoon, C. Choi, Bifurcation to unsteady naturalconvection in square enclosure with a circular cylinder at Rayleigh number of107, Int. J. Heat Mass Transfer 64 (2013) 926–944.
[25] Y.S. Prasad, M.K. Das, Hopf bifurcation in mixed convection flow inside arectangular cavity, Int. J. Heat Mass Transfer 50 (2007) 3583–3598.
[26] C.L. Chen, Y.C. Chung, T.F. Lee, Experimental and numerical studies on periodicconvection flow and heat transfer in a lid-driven arc-shape cavity, Int. J. HeatMass Transfer 39 (2012) 1563–1571.
[27] R.J.A. Janssen, R.A.W.M. Henkes, Influence of Prandtl number on instabilitymechanisms and transition in a differentially heated square cavity, J. FluidMech. 290 (1995) 319–344.
[28] C.D. Dritselis, B. Knaepen, Mixed convection of a low Prandtl fluid withspatially periodic lower wall heating in the presence of a wall-normalmagnetic field, Int. J. Heat Mass Transfer 74 (2014) 35–47.
[29] A.V. Tangborn, S.Q. Zhang, V. Lakshminarayanan, A three-dimensionalinstability in mixed convection with streamwise periodic heating, Phys.Fluids 7 (11) (1995) 2648–2658.
[30] J.S. Yoo, S.M. Han, Transitions and chaos in natural convection of a fluid withPr ¼ 0:1 in a horizontal annulus, Fluid Dyn. Res. 27 (2000) 231–245.
[31] I. Piazza, M. Ciofalo, Low-Prandtl number natural convection in volumetricallyheated rectangular enclosures I. Slender cavity, AR = 4, Int. J. Heat MassTransfer 43 (2000) 3027–3051.
[32] G. Xin, W.K. Chow, S. Liu, Windows and routes to chaos in mixed convection inconfined spaces, Chaos Solitons Fractals 15 (2003) 543–558.
[33] W.H. Chow, G. Xin, S. Liu, A further study on multiple attractors of mixedconvection in conned spaces, Build. Environ. 40 (2005) 1021–1031.
[34] I. Mercader, O. Batiste, L.R. Piscina, X. Ruiz, S. Rudiger, J. Casademunt,Bifurcations and chaos in single-roll natural convection with low Prandtlnumber, Phys. Fluids 17 (2005) 104108.
[35] Z. Gao, A. Sergent, B. Podvin, S. Xin, P. Quere, L.S. Tuckerman, Transition tochaos of natural convection between two infinite differentially heated verticalplates, Phys. Rev. E 88 (2013) 023010.
[36] H. Ishida, S. Kawase, H. Kimoto, The second largest Lyapunov exponent andtransition to chaos of natural convection in a rectangular cavity, Int. J. HeatMass Transfer 49 (2006) 5035–5048.
[37] V.C. Mariani, A. da Silva, Natural convection: analysis of partially openenclosures with an internal heated source, Numer. Heat Transfer A 52 (2007)595–619.
[38] V.C. Mariani, L.S. Coelho, Natural convection heat transfer in partially openenclosures containing an internal local heat source, B.J. Chem. Eng. 24 (2007)375–388.
[39] E. Fontana, A. da Silva, V.C. Mariani, Natural convection in a partially opensquare cavity with internal heat source: an analysis of the opening mass flow,Int. J. Heat Mass Transfer 54 (2011) 1369–1386.
[40] E. Fontana, C.A. Capeletto, A. da Silva, V.C. Mariani, Three-dimensional analysisof natural convection in a partially-open cavity with internal heat source, Int. J.Heat Mass Transfer 61 (2013) 525–542.
[41] E. Fontana, A. da Silva, V.C. Mariani, F. Marcondes, The influence of baffles onthe natural convection in trapezoidal cavities, Numer. Heat Transfer A 58 (2)(2010) 125–145.
[42] A. da Silva, E. Fontana, V.C. Mariani, F. Marcondes, Numerical investigation ofseveral physical and geometric parameters in the natural convection intotrapezoidal cavities, Int. J. Heat Mass Transfer 55 (23–24) (2012) 6808–6818.
[43] S.H. Strogatz, Nonlinear Dynamics and Chaos, Westview, 1994.
Copyright © 2022 FDOKUMEN