
The Relaxation Method for Solving the Schrödinger Equation ...

International Journal of Heat and Mass Transfer 55 (2012) 3763–3773
Contents lists available at SciVerse ScienceDirect
International Journal of Heat and Mass Transfer
journal homepage: www.elsevier .com/locate / i jhmt
Numerical analysis of coupled effects of pulsatile blood flow and thermalrelaxation time during thermal therapy
Tzu-Ching Shih a,⇑, Tzyy-Leng Horng b,⇑, Huang-Wen Huang c, Kuen-Cheng Ju d, Tzung-Chi Huang a,Po-Yuan Chen e, Yung-Jen Ho a, Win-Li Lin f
a Department of Biomedical Imaging and Radiological Science, China Medical University, Taichung 40402, Taiwanb Department of Applied Mathematics, Feng Chia University, Taichung 40724, Taiwanc Department of Innovative Information and Technology, Division of Software Engineering, Langyang Campus, Tamkang University, I-lan 26247, Taiwand Department of Biomedical Engineering, I-Shou University, Kaohsiung 82445, Taiwane Department of Biological Science and Technology, China Medical University, Taichung 40402, Taiwanf Institute of Biomedical Engineering, College of Medicine and College of Engineering, National Taiwan University, Taipei 10051, Taiwan
a r t i c l e i n f o
Article history:Received 24 October 2011Accepted 22 February 2012Available online 17 April 2012
Keywords:Pulsatile blood flowThermal relaxation timePennes bioheat transfer equationWave bioheat transfer equationMulti-block Chebyshev pseudospectralmethod
0017-9310/$ - see front matter � 2012 Elsevier Ltd. Adoi:10.1016/j.ijheatmasstransfer.2012.02.069
⇑ Corresponding authors. Addresses: DepartmentRadiological Science, China Medical University, 9140402, Taiwan. Tel.: +886 4 22053366x7709; fax: +8Department of Applied Mathematics, Feng Chia UniSeatwen, Taichung 40724, Taiwan. Tel.: +886 4 2451 70801 (T.-L. Horng).
E-mail addresses: [email protected] (T.-C. Sh(T.-L. Horng).
a b s t r a c t
The main purpose of this study is to investigate the coupled effects of the pulsatile blood flow in ther-mally significant blood vessels and the thermal relaxation time in living tissues on temperature distribu-tions during thermal treatments. Considering the fact that propagation speed of heat transfer in solidtissues is actually finite according to experiments, the traditional Pennes bioheat transfer equation (PBTE)was modified to a wave bioheat transfer equation (WBTE) that contains both wave transportation anddiffusion competing with each other and characterized by the thermal relaxation time. The wavebehavior will be more dominant when the relaxation time is large. WBTE together with a coupled energytransport equation for blood vessel flow was used to describe the temperature evolution of our currenttumor–blood vessel system, and the equations were numerically solved by the highly accurate multi-block Chebyshev pseudospectral method. Numerical results showed that temperature evolution fromWBTE was quite different from their counterparts from PBTE due to the dominant wave feature underlarge relaxation time. For example, larger relaxation time would preserve high temperature longer andthis effect is even more pronounced when heating is fast. It further implies that heat is drained moreslowly when relaxation time is large, and would make thermal lesion region cover the tumor tissue,the heating target, better. This phenomenon would therefore hint that the traditional PBTE simulationsmight under-estimate the thermal dose exerted on tumor. As to the pulsation frequency of blood flowfrom heart beat which was originally predicted to be important here, it turned out that the thermalbehavior is quite insensitive to pulsation frequency in the current study.
� 2012 Elsevier Ltd. All rights reserved.
1. Introduction
Heat transfer in living tissues is a key issue to thermal therapies.Thermal therapy uses elevated temperatures to kill tumor cells fortherapeutic purposes [1–3]. Thermal coagulation necrosis occurswhen a biological tissue is heated beyond the threshold tempera-ture of protein thermal denaturation for a few seconds [4–6].
ll rights reserved.
of Biomedical Imaging andHseuh-Shih Road, Taichung86 4 2208 1447 (T.-C. Shih),
versity, 100 Wen-Hwa Road,250x5126; fax: +886 4 2451
ih), [email protected]
Depending on the tissue types, the heat-induced denaturationstarts when temperature is higher than 55 �C [5]. The tissue tem-perature can be raised by various methods, such as high-intensityfocused ultrasound [7], radiofrequency ablation [8], microwaveablation [9], and laser surgery [10–11]. Furthermore, temperaturedistribution in a living tissue mainly depends on heat conductionthrough tissue, heat convection through moving fluids that is adja-cent to or within the tissue such as blood flow and interstitial flu-ids, heat generation by tissue metabolism, heat sink by bloodperfusion and heat deposition with various patterns generated bythe external heating source during thermal treatments. The well-known Pennes bioheat transfer equation (PBTE), as shown inEq. (1), originally designed for predicting heat transfer in humanforearm, is widely used for modeling the heat transfer in living tis-sues due to using a uniform blood perfusion term to describe heattransfer between the blood and tissue [12].

Nomenclature
cb specific heat of blood (J kg�1 K�1), cb = 3770 J kg�1 K�1
ct specific heat of solid tissue (J kg�1 K�1), ct = 3770J kg�1 K�1
c0 coefficient in Eq. (5), c0 ¼ � 8l�wr2
0c1 coefficient in Eq. (5)�cj coefficient in Eq. (22)d diameter of blood vessel (mm), d = 2r0
D collocation derivative matrix, referring to Eq. (24), Dij ¼l0jðxiÞ
EM43 thermal dose or equivalent minutes at 43 �Cf ðxÞ single-variable function, referring to Eq. (21)fNðxÞ Nth degree interpolation polynomial approximating f(x)
in Eq. (21)fac coefficient of relative intensity of pulsation in a blood
vessel, fac ¼ c1c0
J0 the Bessel function of the first kind of order zero, refer-ring to Eq. (10)
k thermal conductivity (W m�1 K�1), referring to Eqs. (2)and (3)
kb thermal conductivity of blood (W m�1 K�1), kb = 0.5 Wm�1 K�1
kt thermal conductivity of tissue (W m�1 K�1), kt = 0.5 Wm�1 K�1
ljðxÞ Lagrange interpolation polynomial, referring to Eq. (22)N degree of interpolation polynomial, referring to Eq. (21)Nx degree of interpolation polynomial in x direction, refer-
ring to Eq. (26)Ny degree of interpolation polynomial in y direction, refer-
ring to Eq. (26)p pressure (kg m�2)q heat flux (W m�2)r radial component of cylindrical coordinates (mm)~r position vectorr0 radius of blood vessels (mm), r0 = 1 mm herer1 boundary limit of tumor in r direction (mm), r1 = 5 mm
herermax boundary limit of computational domain in r direction
(mm), rmax = 10 mm hereR factor in Eq. (29)t time (s)th heating duration (s)tf upper limit of integral in Eq. (29) (s)Q time-average heating power density listed in Table 2
(W cm�3)_Qavg average volume flow rate of blood flow (mm3 s�1)
Qb heating power density in blood vessel (W cm�3)~Qb time average of Qb (W cm�3)Qm rate of tissue metabolic heat generation (W cm�3)Qt heating power density in tumor (W cm�3)~Qt time average of Qt (W cm�3)T temperature (K)~T period of time of heart beat (s)Ta temperature of arterial blood and ambient temperature
(K), Ta = 310 KTb temperature of blood flow (K)TN Nth order Chebyshev polynomialTt temperature of solid tissue (K)w steady component of axial velocity (mm s�1), referring
to Eqs. (4) and (6)�w averaged velocity (mm s�1), referring to Eq. (8) and Ta-
ble 1w1 coefficient in Eq. (6)W axial velocity (mm s�1), referring to Eq. (6)Wb blood perfusion rate (kg m�3 s�1), Wb = 0.5 kg m�3 s�1
xj Chebyshev–Gauss–Lobatto collocation points, referringto Eq. (21)
z axial component of cylindrical coordinates (mm)z1 lower boundary limit of tumor in z direction (mm),
z1 = 5 mm herez2 upper boundary limit of tumor in z direction (mm),
z2 = 15 mm herezmax upper boundary limit of the computational domain in z
direction (mm), zmax = 100 mm here
Greek symbolsa Womersley number, a ¼ r0ffiffiffiffiffiffiffi
v=xp
l dynamic viscosity of blood (Pa � s = kg m�1 s�1),l = 4 � 10�3 Pa � s
qb density of blood (kg m�3), qb = 1,050 kg m�3
qt density of solid tissue (kg m�3), qt = 1,050 kg m�3
m kinematic viscosity of blood (m2 s�1), m = 2.8571 � 10�6
s thermal relaxation time (s)x angular frequency of heart beat (s�1)X computational domainC interface between blood vessel and tissue, referring to
Eqs. (16) and (17)
Subscriptsb bloodt tissue
3764 T.-C. Shih et al. / International Journal of Heat and Mass Transfer 55 (2012) 3763–3773
qtct@Tt
@t¼ r � ðktrTtÞ �WbcbðTt � TaÞ þ Q m þ Q ; ð1Þ
with t being the time, Tt the tissue temperature, qt the tissue den-sity, ct the tissue specific heat, kt the tissue thermal conductivity,Wb the arterial blood perfusion rate, cb the blood specific heat, Ta
the arterial blood temperature (usually set to be same as the ambi-ent human body temperature 37 �C), Qm the rate of tissue metabolicheat production (usually set to 0.0001 g cal/cm s), and Q the exter-nal heat source. Pennes [12] first stated that the rate of heat transferfrom blood to tissue at any point is proportional to the temperaturedifference between the arterial blood and tissue at that point. Healso assumed the vein blood temperature to be equal to the tissuetemperature. In this model, the rate of increase of tissue tempera-ture is balanced by heat conduction through the tissue, metabolicheat generation, heating (or cooling) effects of the arterial bloodsupply [13–17], and external heat source. However, a fundamental
criticism of Pennes model by Nelson [13] is that the treatment ofblood flow term as a distributed heat source (or sink) mistakenlypresumes that the capillary vasculature is the major site of heat ex-change. In other words, the blood flow term is a scalar property. Infact, the blood flow in a tissue usually has a direction from artery tovein passing through the capillary bed. Furthermore, the blood andits surrounding tissues are not in thermal equilibrium when theblood vessel diameter is larger than 500 lm [18–26]. This meansthe energy equations for tissue and blood in significantly large ves-sel must be treated individually.
The cyclic heart contraction pumps blood through vascularnetwork and form a circulatory system. This periodic pumpinggenerates pulsatile blood flow in all arteries [27–30]. Womersley[31] investigated the periodic-in-time velocity profile for pulsatileblood flow, driven by a given oscillating pressure gradient, insidea straight circular blood vessel. Using the dimensionless Womers-ley number to characterize the frequency of pulsatile blood flow
T.-C. Shih et al. / International Journal of Heat and Mass Transfer 55 (2012) 3763–3773 3765
in blood vessels, Loudon and Tordesillas [32] demonstrated thatthe flow tracks the oscillating pressure gradient tightly and thevelocity profile exhibits a parabolic shape when the Womersleynumber is small. When the Womersley number is large, the phaselag between velocity and pressure gradient becomes larger andthe velocity profile may display a shape of two peaks whenoscillation amplitude of pressure is large. One of the key issuesof thermal treatments is blood flow. Blood flow usually drainsthe delivered heat from the heating region which causes insuffi-cient thermal dose in the targeted volume. This is an importantfactor needed to be considered carefully in thermal treatments[33–36]. In fact, the differential therapeutic effect of thermaltreatments between malignant and normal tissue may primarilydepend on the vascular characteristics of the tumor [37].Craciunescu and Clegg [38] solved the fully coupled Navier–Stokesand energy equations to obtain the temperature distribution ofpulsatile blood flow within a rigid blood vessel. They found thatthe reversed flow enhances as the Womersley number becomeslarger, which results in a smaller temperature difference betweenforward and reverse flows. Nevertheless, in their model they onlyfocused on the temperature distribution in blood vessels withoutconsidering the surrounding tissue. Khanafer et al. [36] and Hornget al. [39] further studied the effects of pulsatile blood flow ontemperature distributions during hyperthermia by consideringboth the pulsatile blood flow in a blood vessel and its surroundingtissue.
The heat conduction term in PBTE is based on the classical Fou-rier law, which assumes that a temperature disturbance in any partof the materials leads to an instantaneous perturbation at eachpoint of the whole. This implies that the propagation speed of ther-mal perturbation is infinite even if the intervening distance is verylarge, and causes some doubts and discussions [40–42]. Actually,non-Fourier heat conduction behavior has been observed in bio-materials with inhomogeneous inner structures [43], in biologicaltissues [44,45], in canine thigh muscles [46], and in processedmeats [47,48]. Considering the finite propagation speed for ther-mal disturbance, Cattaneo [49] and Vernotte [50] formulated amodified heat flux equation, as shown in Eq. (3) with Fourier lawshown in Eq. (2) for comparison.
qð~r; tÞ ¼ �krTð~r; tÞ; ð2Þ
qð~r; tÞ þ s @qð~r; tÞ@t
¼ �krTð~r; tÞ; ð3Þ
where T, q, k, s are temperature, heat flux, thermal conductivityand thermal relaxation time respectively. The thermal relaxationtime for biological tissues has been found typically large leadingto significant non-Fourier thermal behavior. Mitra et al. [47] mea-sured experimentally the thermal relaxation time in a processedmeat and reported that s could be as large as 16 s approximately.Kaminski [43] reported that s ranges from 10 to 50 s in his exper-iment for materials with inhomogeneous inner structures. Roetzelet al. [51] also confirmed the hyperbolic behavior of thermalpropagation with s about 1.77 s in a similar experiment. Usingthe thermal properties of tissue and blood from some literatures,Zhang [52] computed and argued that reasonable s should rangefrom 0.464 to 6.825 s. He further found that the dual-phase lagphenomenon in temperature and its gradient due to the wave fea-ture is more pronounced when blood vessel is large. The literaturesmentioned above have motivated us to fully explore the coupledeffect of pulsatile blood flow in large blood vessels and thermalrelaxation time on the heating of tumor tissues here, from whichwe believe it can deliver significant contribution to thermal ther-apy of tumors.
2. Mathematical model and numerical method
2.1. Velocity profile of pulsatile blood flow in a circular blood vessel
In this study, we considered the pulsatile blood flow in ther-mally significant blood vessels (i.e., larger than 200 lm in diame-ter) [33,35,39], with the assumptions that the blood vesselsegment is straight, the vessel wall is rigid and impermeable, andthe flow is incompressible and Newtonian. Considering the steadyblood flow passing through a rigid vessel of inner radius r0, the ax-ial Hagen–Poiseuille parabolic velocity profile can be expressed as:
wðrÞ ¼ � 14lðr2
0 � r2Þdpdz; ð4Þ
where l is the dynamic viscosity, dpdz the constant pressure gradient
along the axial (z) direction. Since the blood flow in the cardiovas-cular system is periodic, the pressure gradient can not remain to bea constant any more. Here, it is modified to have an additional sinu-soidal component in time shown as follows
@p@z¼ c0 þ c1eixt ; ð5Þ
where x is the angular frequency and the associated period of timeis denoted as ~T ¼ 2p
x . The real part of sinusoidal component abovewill describe the realistic oscillatory driving pressure gradient asc1 cos (xt), and likewise the imaginary part will describe the realis-tic oscillatory pressure gradient as c1 sin (xt). Then the correspond-ing axial velocity profile W(r, t) can be expressed as
Wðr; tÞ ¼ wðrÞ þw1ðrÞeixt ; ð6Þ
in which wðrÞ ¼ � 14l ðr2
0 � r2Þc0. Here, c0 can be related to averagevolume flow rate over the time period ~T as follows:
_Qavg ¼1~T
Z ~T
0
Z r0
02pWrdrdt ¼ �pr4
0
8lc0: ð7Þ
The average velocity can be further deduced from above
w ¼_Qavg
pr20
¼ � c0r20
8l; ð8Þ
and then W(r, t) can then be expressed as
Wðr; tÞ ¼ 2 �w 1� r2
r20
� �þw1ðrÞeixt: ð9Þ
w1 can be further derived from the Navier–Stokes equations, andexpress W(r, t) as follows [29],
Wðr; tÞ ¼ 2 �w 1� r2
r20
� �þ ic1r2
0
la2 1�J0ða r
r0i
32Þ
J0ðai32Þ
24
35eixt; ð10Þ
where a ¼ r0ffiffiffiffiffiffim=xp denotes the Womersley number describing the
competition between the inertia and viscous forces; m denotes thekinematic viscosity of blood; J0 is the Bessel function of the firstkind of order zero. If oscillatory driving pressure gradient isc1 cos (xt), the corresponding velocity will then be the real part ofEq. (10). If oscillatory driving pressure gradient is c1 sin (xt), thecorresponding velocity will then be the imaginary part of Eq. (10).
Here we also define fac ¼ c1=c0 ¼ c1= � 8lwr2
0
� �and use it to
characterize the relative intensity of pulsation in the blood flow.fac = 0.5 would be mostly used in current study. When the Womers-ley number a is large, the effect of viscosity cannot propagate farfrom the vessel wall, and the blood flow in the central part of a ves-sel acts like an inviscid flow and can be chiefly determined by thebalance between the inertia force and the pressure gradient. Underthis situation, the velocity profile of oscillatory component has a
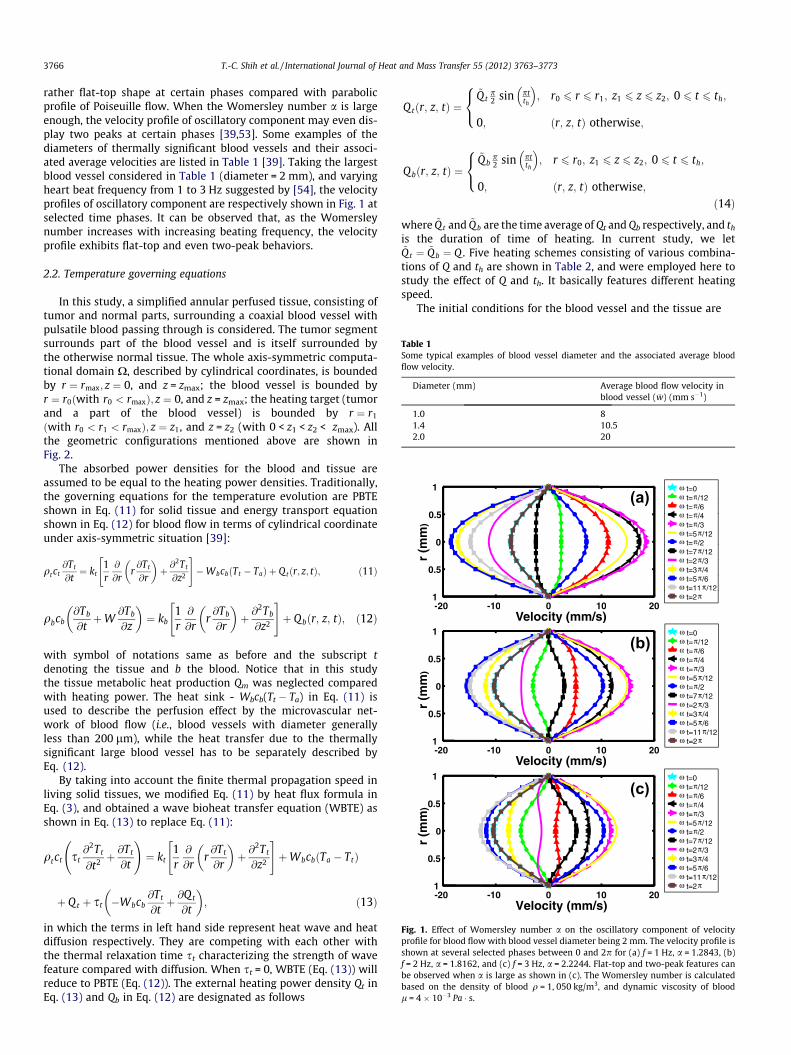
Table 1Some typical examples of blood vessel diameter and the associated average bloodflow velocity.
Diameter (mm) Average blood flow velocity inblood vessel ( �w) (mm s�1)
1.0 81.4 10.52.0 20
ω t=0ω t=π/12
1ω t=π/12ω t=π/6ω t /40 5 ω t=π/4ω t=π/3
0.5
m)
ω t=5π/12ω t=π/20m
m
t= /2ω t=7π/12ω t 2π/3
0
r (m
ω t=2π/3ω t=3π/40.5
r
ω t=5π/6ω t=11 π/12t /ω t=2π
-20 -10 0 10 201-20 -10 0 10 20
Velocity (mm/s)ω t=0
y ( )1
ω t=π/12ω t=π/6ω t=π/6ω t=π/4ω t π/3
0.5ω t=π/3ω t=5π/12m
)
ω t=π/2ω t=7π/12
0
(mm
t 7 /12ω t=2π/3ω t 3π/40 5
r (
ω t=3π/4ω t=5π/6
0.5
ω t=11 π/12ω t=2π1
-20 -10 0 10 201
Velocity (mm/s)0
Velocity (mm/s)1 ω t=0
ω t=π/121
ω t=π/6ω t=π/40.5 ω t=π/4ω t=π/3ω t 5π/12
0.5
m)
ω t=5π/12ω t=π/20(m
ω t=7π/12ω t=2π/3
r
t 2 /3ω t=3π/4ω t 5π/6
0.5ω t=5π/6ω t=11 π/12
1 ω t=2π-20 -10 0 10 201
Velocity (mm/s)
(a)
(b)
(c)
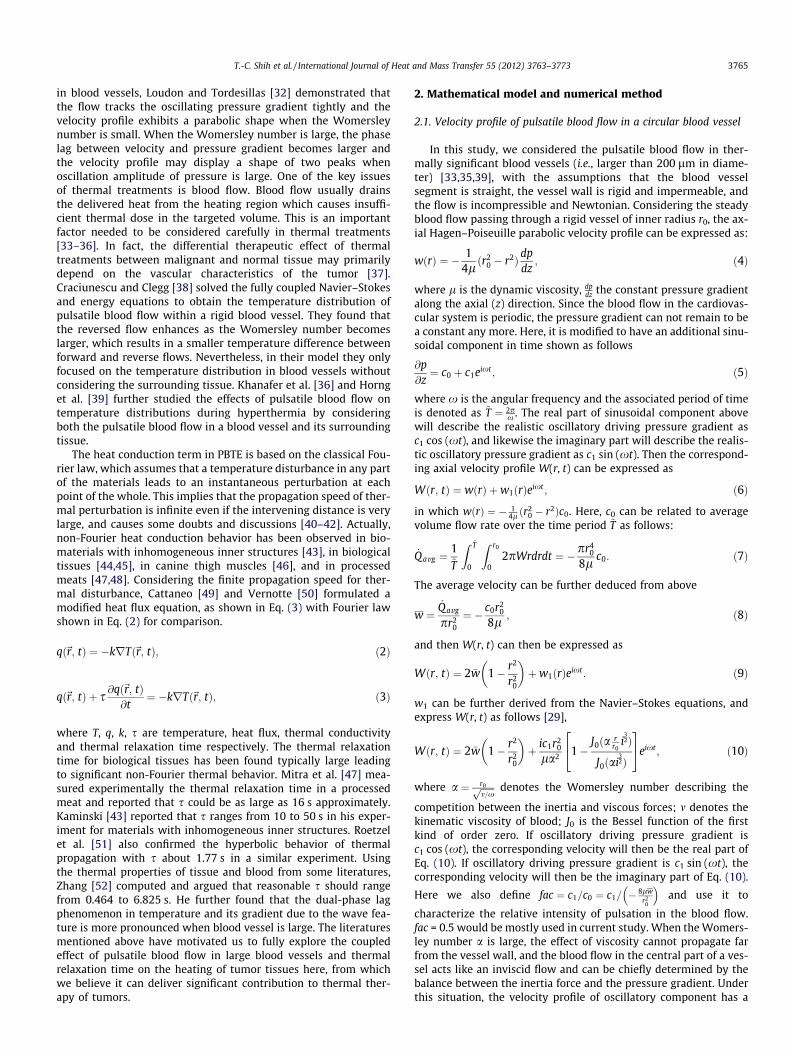
Fig. 1. Effect of Womersley number a on the oscillatory component of velocityprofile for blood flow with blood vessel diameter being 2 mm. The velocity profile isshown at several selected phases between 0 and 2p for (a) f = 1 Hz, a = 1.2843, (b)f = 2 Hz, a = 1.8162, and (c) f = 3 Hz, a = 2.2244. Flat-top and two-peak features canbe observed when a is large as shown in (c). The Womersley number is calculatedbased on the density of blood q = 1, 050 kg/m3, and dynamic viscosity of bloodl = 4 � 10�3 Pa � s.
3766 T.-C. Shih et al. / International Journal of Heat and Mass Transfer 55 (2012) 3763–3773
rather flat-top shape at certain phases compared with parabolicprofile of Poiseuille flow. When the Womersley number a is largeenough, the velocity profile of oscillatory component may even dis-play two peaks at certain phases [39,53]. Some examples of thediameters of thermally significant blood vessels and their associ-ated average velocities are listed in Table 1 [39]. Taking the largestblood vessel considered in Table 1 (diameter = 2 mm), and varyingheart beat frequency from 1 to 3 Hz suggested by [54], the velocityprofiles of oscillatory component are respectively shown in Fig. 1 atselected time phases. It can be observed that, as the Womersleynumber increases with increasing beating frequency, the velocityprofile exhibits flat-top and even two-peak behaviors.
2.2. Temperature governing equations
In this study, a simplified annular perfused tissue, consisting oftumor and normal parts, surrounding a coaxial blood vessel withpulsatile blood passing through is considered. The tumor segmentsurrounds part of the blood vessel and is itself surrounded bythe otherwise normal tissue. The whole axis-symmetric computa-tional domain X, described by cylindrical coordinates, is boundedby r ¼ rmax; z ¼ 0, and z = zmax; the blood vessel is bounded byr ¼ r0ðwith r0 < rmaxÞ; z ¼ 0, and z = zmax; the heating target (tumorand a part of the blood vessel) is bounded by r ¼ r1
ðwith r0 < r1 < rmaxÞ; z ¼ z1, and z = z2 (with 0 < z1 < z2 < zmax). Allthe geometric configurations mentioned above are shown inFig. 2.
The absorbed power densities for the blood and tissue areassumed to be equal to the heating power densities. Traditionally,the governing equations for the temperature evolution are PBTEshown in Eq. (11) for solid tissue and energy transport equationshown in Eq. (12) for blood flow in terms of cylindrical coordinateunder axis-symmetric situation [39]:
qtct@Tt
@t¼ kt
1r@
@rr@Tt
@r
� �þ @
2Tt
@z2
" #�WbcbðTt � TaÞ þ Qtðr; z; tÞ; ð11Þ
qbcb@Tb
@tþW
@Tb
@z
� �¼ kb
1r@
@rr@Tb
@r
� �þ @
2Tb
@z2
" #þ Qbðr; z; tÞ; ð12Þ
with symbol of notations same as before and the subscript tdenoting the tissue and b the blood. Notice that in this studythe tissue metabolic heat production Qm was neglected comparedwith heating power. The heat sink - Wbcb(Tt � Ta) in Eq. (11) isused to describe the perfusion effect by the microvascular net-work of blood flow (i.e., blood vessels with diameter generallyless than 200 lm), while the heat transfer due to the thermallysignificant large blood vessel has to be separately described byEq. (12).
By taking into account the finite thermal propagation speed inliving solid tissues, we modified Eq. (11) by heat flux formula inEq. (3), and obtained a wave bioheat transfer equation (WBTE) asshown in Eq. (13) to replace Eq. (11):
qtct st@2Tt
@t2 þ@Tt
@t
!¼ kt
1r@
@rr@Tt
@r
� �þ @
2Tt
@z2
" #þWbcbðTa � TtÞ
þ Q t þ st �Wbcb@Tt
@tþ @Q t
@t
� �; ð13Þ
in which the terms in left hand side represent heat wave and heatdiffusion respectively. They are competing with each other withthe thermal relaxation time st characterizing the strength of wavefeature compared with diffusion. When st = 0, WBTE (Eq. (13)) willreduce to PBTE (Eq. (12)). The external heating power density Qt inEq. (13) and Qb in Eq. (12) are designated as follows
Q tðr; z; tÞ ¼~Qt
p2 sin pt
th
� �; r0 6 r 6 r1; z1 6 z 6 z2; 0 6 t 6 th;
0; ðr; z; tÞ otherwise;
8<:
Q bðr; z; tÞ ¼~Qb
p2 sin pt
th
� �; r 6 r0; z1 6 z 6 z2; 0 6 t 6 th;
0; ðr; z; tÞ otherwise;
8<:
ð14Þ
where ~Qt and ~Qb are the time average of Qt and Qb respectively, and th
is the duration of time of heating. In current study, we let~Qt ¼ ~Qb ¼ Q . Five heating schemes consisting of various combina-tions of Q and th are shown in Table 2, and were employed here tostudy the effect of Q and th. It basically features different heatingspeed.
The initial conditions for the blood vessel and the tissue are
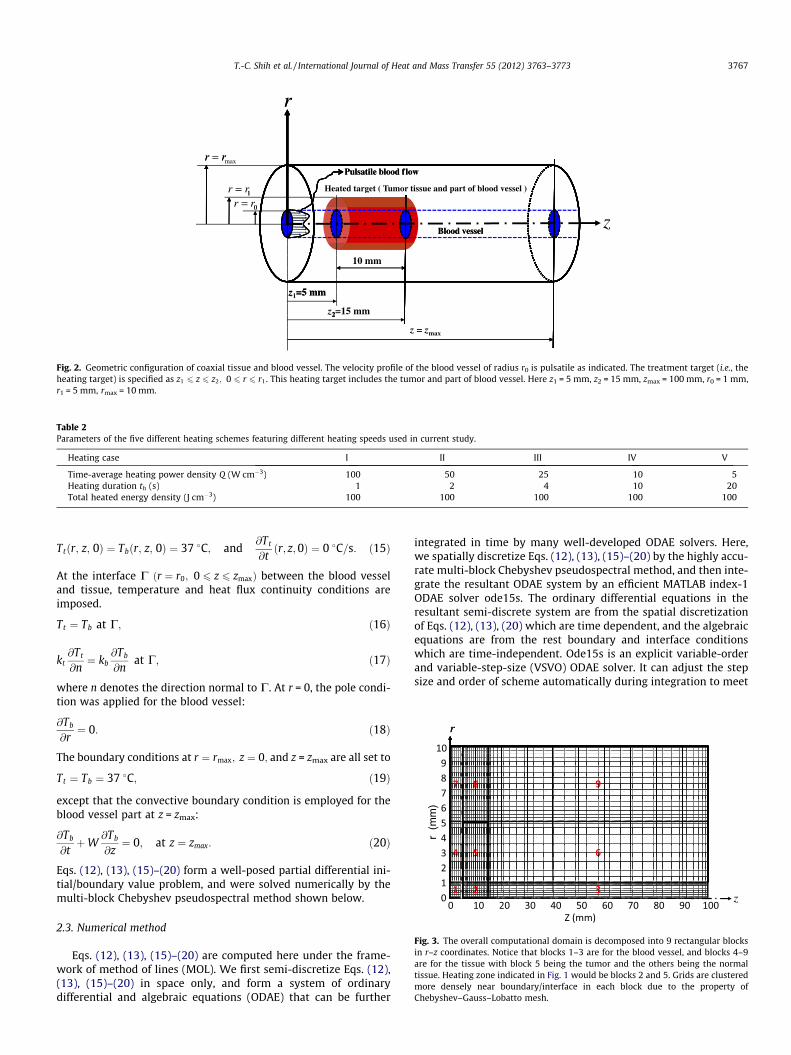
Fig. 2. Geometric configuration of coaxial tissue and blood vessel. The velocity profile of the blood vessel of radius r0 is pulsatile as indicated. The treatment target (i.e., theheating target) is specified as z1 6 z 6 z2; 0 6 r 6 r1. This heating target includes the tumor and part of blood vessel. Here z1 = 5 mm, z2 = 15 mm, zmax = 100 mm, r0 = 1 mm,r1 = 5 mm, rmax = 10 mm.
Table 2Parameters of the five different heating schemes featuring different heating speeds used in current study.
Heating case I II III IV V
Time-average heating power density Q (W cm�3) 100 50 25 10 5Heating duration th (s) 1 2 4 10 20Total heated energy density (J cm�3) 100 100 100 100 100
rr
z
Fig. 3. The overall computational domain is decomposed into 9 rectangular blocksin r–z coordinates. Notice that blocks 1–3 are for the blood vessel, and blocks 4–9are for the tissue with block 5 being the tumor and the others being the normaltissue. Heating zone indicated in Fig. 1 would be blocks 2 and 5. Grids are clusteredmore densely near boundary/interface in each block due to the property ofChebyshev–Gauss–Lobatto mesh.
T.-C. Shih et al. / International Journal of Heat and Mass Transfer 55 (2012) 3763–3773 3767
Ttðr; z; 0Þ ¼ Tbðr; z; 0Þ ¼ 37 �C; and@Tt
@tðr; z; 0Þ ¼ 0 �C=s: ð15Þ
At the interface C ðr ¼ r0; 0 6 z 6 zmaxÞ between the blood vesseland tissue, temperature and heat flux continuity conditions areimposed.
Tt ¼ Tb at C; ð16Þ
kt@Tt
@n¼ kb
@Tb
@nat C; ð17Þ
where n denotes the direction normal to C. At r = 0, the pole condi-tion was applied for the blood vessel:
@Tb
@r¼ 0: ð18Þ
The boundary conditions at r ¼ rmax; z ¼ 0; and z = zmax are all set to
Tt ¼ Tb ¼ 37 �C; ð19Þ
except that the convective boundary condition is employed for theblood vessel part at z = zmax:
@Tb
@tþW
@Tb
@z¼ 0; at z ¼ zmax: ð20Þ
Eqs. (12), (13), (15)–(20) form a well-posed partial differential ini-tial/boundary value problem, and were solved numerically by themulti-block Chebyshev pseudospectral method shown below.
2.3. Numerical method
Eqs. (12), (13), (15)–(20) are computed here under the frame-work of method of lines (MOL). We first semi-discretize Eqs. (12),(13), (15)–(20) in space only, and form a system of ordinarydifferential and algebraic equations (ODAE) that can be further
integrated in time by many well-developed ODAE solvers. Here,we spatially discretize Eqs. (12), (13), (15)–(20) by the highly accu-rate multi-block Chebyshev pseudospectral method, and then inte-grate the resultant ODAE system by an efficient MATLAB index-1ODAE solver ode15s. The ordinary differential equations in theresultant semi-discrete system are from the spatial discretizationof Eqs. (12), (13), (20) which are time dependent, and the algebraicequations are from the rest boundary and interface conditionswhich are time-independent. Ode15s is an explicit variable-orderand variable-step-size (VSVO) ODAE solver. It can adjust the stepsize and order of scheme automatically during integration to meet

Fig. 4. Time development of temperature distribution in space for st = 0 s under heating scheme I in Table 2 is shown at (a) t = 1 s, (b) t = 7.5 s, (c) t = 10 s, (d) t = 12 s, (e)t = 14.5 s, (f) t = 19.5 s. The blood vessel diameter is 2 mm with the pulsation frequency being 2 Hz and amplitude factor fac = 0.5.
3768 T.-C. Shih et al. / International Journal of Heat and Mass Transfer 55 (2012) 3763–3773
the specified error tolerance, and numerical time-stability is alsoautomatically assured.
Owing to the heterogeneity of imposed governing equations,thermal properties, and heating, the computational domain isdecomposed to 9 blocks (with meshes described below) as shownin Fig. 3. Blocks 1, 2, 3 are the blood vessel; block 5 is tumor; theothers are normal tissue. Heating zones are blocks 2 and 5. Wethen spatially discretize the governing equations with the associ-ated boundary/interface conditions in each block by the Chebyshevpesudospectral method [55–57], and the main work is to approxi-mate the spatial derivatives of Tt and Tb at specially designed mesh
points (called collocation points) by the Chebyshev pseudospectralmethod. To illustrate this, here we take a single-variable functionf ðxÞ; �1 6 x 6 1; as an example. f(x) can be approximated by aNth degree interpolation polynomial with exponential order ofaccuracy through
f ðxÞ � fNðxÞ ¼XN
j¼0
f ðxjÞljðxÞ; ð21Þ
where lj(x) is the Nth degree Lagrange interpolation polynomial andxj ¼ cosðjp=NÞ; j ¼ 0; 1; . . . ; N; are specialized interpolation nodes
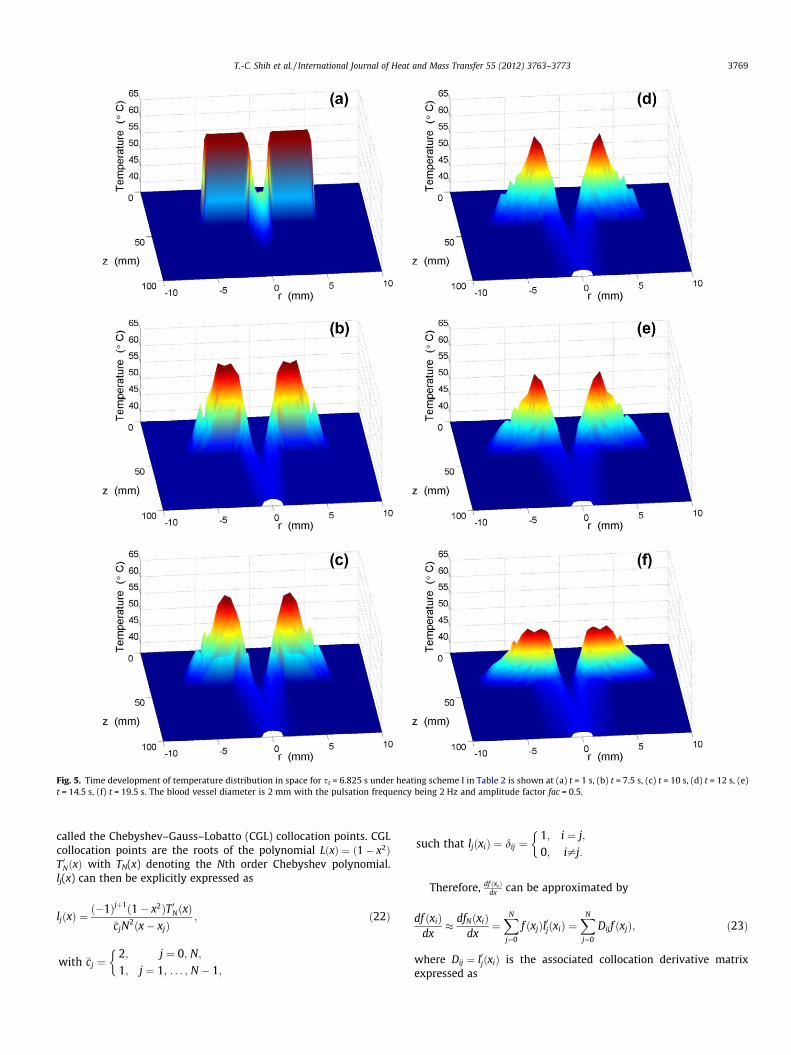
Fig. 5. Time development of temperature distribution in space for st = 6.825 s under heating scheme I in Table 2 is shown at (a) t = 1 s, (b) t = 7.5 s, (c) t = 10 s, (d) t = 12 s, (e)t = 14.5 s, (f) t = 19.5 s. The blood vessel diameter is 2 mm with the pulsation frequency being 2 Hz and amplitude factor fac = 0.5.
T.-C. Shih et al. / International Journal of Heat and Mass Transfer 55 (2012) 3763–3773 3769
called the Chebyshev–Gauss–Lobatto (CGL) collocation points. CGLcollocation points are the roots of the polynomial LðxÞ ¼ ð1� x2ÞT 0NðxÞ with TN(x) denoting the Nth order Chebyshev polynomial.lj(x) can then be explicitly expressed as
ljðxÞ ¼ð�1Þjþ1ð1� x2ÞT 0NðxÞ
�cjN2ðx� xjÞ
; ð22Þ
with �cj ¼2; j ¼ 0; N;
1; j ¼ 1; . . . ; N � 1;
�
such that ljðxiÞ ¼ dij ¼1; i ¼ j;
0; i–j:
�
Therefore, df ðxiÞdx can be approximated by
df ðxiÞdx
� dfNðxiÞdx
¼XN
j¼0
f ðxjÞl0jðxiÞ ¼XN
j¼0
Dijf ðxjÞ; ð23Þ
where Dij ¼ l0jðxiÞ is the associated collocation derivative matrixexpressed as

Fig. 6. Maximum temperature in space maxðr;zÞ2X
T versus time with heating schemes I–V in Table 2 shown in (a)–(e) respectively. st = 0, 0.464, 1.756 and 6.825 s are represented
by blue, green, red, and black curves respectively. The blood vessel diameter is 2 mm with the pulsation frequency being 2 Hz and amplitude factor fac = 0.5. (Forinterpretation of the references to colour in this figure legend, the reader is referred to the web version of this article.)
3770 T.-C. Shih et al. / International Journal of Heat and Mass Transfer 55 (2012) 3763–3773
Dij ¼
�ci�cj
ð�1Þiþj
xi�xj; i–j;
� xj
2ð1�x2jÞ ; 1 6 i ¼ j 6 N � 1;
2N2þ16 ; i ¼ j ¼ 0;
� 2N2þ16 ; i ¼ j ¼ N:
8>>>>>><>>>>>>:
ð24Þ
Similarly, higher derivatives dkf ðxiÞdxk can be approximated by
dkf ðxiÞdxk
� dkfNðxiÞdxk
¼XN
j¼0
ðDkÞijf ðxjÞ: ð25Þ
For a multi-variable function f(x,y), �1 6 x,y 6 1, it can be similarlyapproximated by
f ðx; yÞ � fNx ;Ny ðx; yÞ ¼XNx
j¼0
XNy
k¼0
f ðxj; ykÞljðxÞlkðyÞ; ð26Þ
which is merely a tensor-product extension of Eq. (21) with Nx
degree interpolation polynomial in x direction, and Ny degreeinterpolation polynomial in y direction respectively. Following Eq.
(25), the mth partial derivative in x direction can then be approxi-mated by
@mf ðxi; yjÞ@xm
�@mfNxNy ðxi; yjÞ
@xm¼XNx
k¼0
ðDmNxÞikf ðxk; yjÞ; ð27Þ
where DNx is basically D in Eq. (24) with N = Nx.Likewise, the mth partial derivative in y direction can be
approximated by
@mf ðxi; yjÞ@ym
�@mfNxNy ðxi; yjÞ
@ym¼XNy
k¼0
ðDmNyÞjkf ðxi; ykÞ; ð28Þ
where DNy is D in Eq. (24) with N = Ny similarly.CGL collocation points are clustered more densely near bound-
ary, and this makes our current computational mesh more den-sely distributed near boundaries and interfaces as shown inFig. 3, which is more advantageous than uniform meshes sinceCGL collocation points resolve boundary/interface layers moreefficiently. Actually, quite economic grids were used here due tothis boundary/interface layers resolving advantage and intrinsic
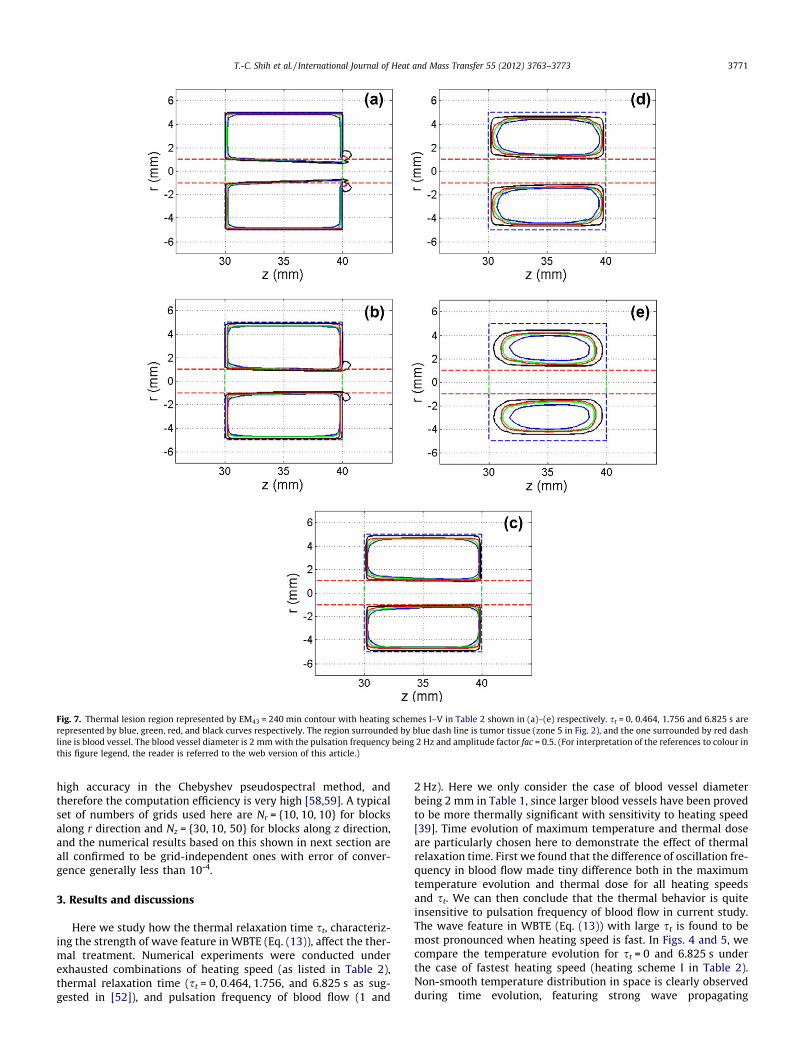
Fig. 7. Thermal lesion region represented by EM43 = 240 min contour with heating schemes I–V in Table 2 shown in (a)–(e) respectively. st = 0, 0.464, 1.756 and 6.825 s arerepresented by blue, green, red, and black curves respectively. The region surrounded by blue dash line is tumor tissue (zone 5 in Fig. 2), and the one surrounded by red dashline is blood vessel. The blood vessel diameter is 2 mm with the pulsation frequency being 2 Hz and amplitude factor fac = 0.5. (For interpretation of the references to colour inthis figure legend, the reader is referred to the web version of this article.)
T.-C. Shih et al. / International Journal of Heat and Mass Transfer 55 (2012) 3763–3773 3771
high accuracy in the Chebyshev pseudospectral method, andtherefore the computation efficiency is very high [58,59]. A typicalset of numbers of grids used here are Nr = {10, 10, 10} for blocksalong r direction and Nz = {30, 10, 50} for blocks along z direction,and the numerical results based on this shown in next section areall confirmed to be grid-independent ones with error of conver-gence generally less than 10-4.
3. Results and discussions
Here we study how the thermal relaxation time st, characteriz-ing the strength of wave feature in WBTE (Eq. (13)), affect the ther-mal treatment. Numerical experiments were conducted underexhausted combinations of heating speed (as listed in Table 2),thermal relaxation time (st = 0, 0.464, 1.756, and 6.825 s as sug-gested in [52]), and pulsation frequency of blood flow (1 and
2 Hz). Here we only consider the case of blood vessel diameterbeing 2 mm in Table 1, since larger blood vessels have been provedto be more thermally significant with sensitivity to heating speed[39]. Time evolution of maximum temperature and thermal doseare particularly chosen here to demonstrate the effect of thermalrelaxation time. First we found that the difference of oscillation fre-quency in blood flow made tiny difference both in the maximumtemperature evolution and thermal dose for all heating speedsand st. We can then conclude that the thermal behavior is quiteinsensitive to pulsation frequency of blood flow in current study.The wave feature in WBTE (Eq. (13)) with large st is found to bemost pronounced when heating speed is fast. In Figs. 4 and 5, wecompare the temperature evolution for st = 0 and 6.825 s underthe case of fastest heating speed (heating scheme I in Table 2).Non-smooth temperature distribution in space is clearly observedduring time evolution, featuring strong wave propagating

3772 T.-C. Shih et al. / International Journal of Heat and Mass Transfer 55 (2012) 3763–3773
behavior, in Fig. 5 for st = 6.825 s, while only smooth temperaturedistribution is observed all the time, featuring parabolicity of PBTE(Eq. (11)), in Fig. 4 for st = 0 s.
Time evolution of maximum temperature in space maxðr;zÞ2X
T can
particularly demonstrate the effect of thermal relaxation time underdifferent heating speeds as shown in Fig. 6. Generally, this maximumtemperature happens near the center of zone 5 (tumor tissue) inFig. 2. For st = 0, we can see max
ðr;zÞ2XT always reaches its maximum in
time right at end of heating as expected, while maxðr;zÞ2X
T generally
exhibits plateau in time after end of heating for non-zero st ’s, whichis more pronounced as st is large and heating speed is fast as compar-ing sub-figures in Fig. 6. This can be easily understood by the factthat heat transfer is slower (takes more time to relax) at large st
and high temperature tends to accumulate and preserve in time attumor zone when heating is fast (less time for tumor to respondand relax thermally). However, for slow heating in Fig. 6(d, e), noplateau is observed and this may be due to the reason that heatingis so slow that tumor has enough time to respond and relax ther-mally. In this case, we can also observe non-zero st ’s even leadst = 0 to reach maximum in time for max
ðr;zÞ2XT . Besides, max
ðr;zÞ2XT reaches
its maximum in time with larger maximum when st is larger.The accumulated thermal dose to tissue is a function of heating
duration and the temperature level [60]. The estimate of tissuedamage is based on the thermal dose of which the formula wasproposed by Sapareto and Dewey [61]. The thermal dose orequivalent minutes at 43 �C (EM43) is shown as follows:
EM43ðin min:Þ ¼Z tf
0RT�43dt; ð29Þ
where R = 2 for T P 43 �C, R = 4 for 37 �C < T < 43 �C, and tf = 60 s incurrent study. The threshold dose for necrosis is EM43 = 240 min formuscle tissue, and the region encircled by the level curveEM43 = 240 min is taken as the thermal lesion region. Covering tu-mor tissue but not normal tissue by thermal lesion region as fullas possible is most desired in the thermal treatment. From Fig. 7,we can observe tumor tissue is generally covered better by thermallesion region based on EM43 = 240 min level curve when heating isfast, and this effect is further enhanced when st is large. Some evencover a small part of normal tissue near the downstream junction ofblood vessel, tumor and normal tissue as shown in Fig. 7(a, b), whichis actually not desired in thermal treatment. The phenomenon aboveis comprehensible from the fact that high temperature is preservedlonger and heat is drained more slowly when heating is fast and st islarge as demonstrated in Fig. 6. The traditional simulations based onPBTE may under-estimate thermal lesion region since thermal relax-ation time st is actually non-trivial in living tissues.
4. Conclusion
A coupling model of thermal wave bioheat transfer in solid tis-sues and pulsatile blood flow in thermal significant blood vesselshas been developed and studied with various combinations of heat-ing speed, thermal relaxation time, and pulsation frequency ofblood flow. Though the pulsation frequency from heart beat wouldaffect the velocity profile of blood flow largely and exhibit flat-topand two-peak shapes in oscillatory component of velocity profilewhen frequency is large, it seems that the thermal behavior is quiteinsensitive to pulsation frequency here. Nevertheless, the thermalbehavior is found to be very sensitive to the heating speed and ther-mal relaxation time in the current study. Heat drains more slowlyand tumor tissue preserves high temperature longer when heatingis fast and thermal relaxation time is large. This is all due to thewave feature characterized by large thermal relaxation time, and
would cause the thermal lesion region based on EM43 = 240 minlevel curve to cover the tumor region better. It implies that the tra-ditional simulations based on PBTE may under-estimate thermaldose since thermal relaxation time is actually non-trivial in livingtissues.
Acknowledgments
This research was sponsored in part by the National ScienceCouncil of the Republic of China under Grant No. NSC-98-2221-E-039-001 (Dr. Shih), No. NSC-99-2221-E-039-011 (Dr. Shih),NSC-100-2221-E-039-002-MY3 (Dr. Shih), NSC-100-2115-M-035-001 (Dr. Horng) and partially by the China Medical University pro-ject No. CMU98-S-49 (Dr. Shih).
References
[1] R.B. Roemer, Engineering aspects of hyperthermia therapy, Annu. Rev. Biomed.Eng. 1 (1999) 347–376.
[2] P. Wust, B. Hildebrandt, G. Sreenivasa, B. Rau, J. Gellermann, H. Riess, R. Felix,P.M. Schlag, Hyperthermia in combined treatment of cancer, Lancet Oncol. 3(2002) 487–497.
[3] W.C. Dewey, Arrhenius relationships from the molecule and cell to the clinic,Int. J. Hyperthermia 25 (2009) 3–20.
[4] B. Decadt, A.K. Siriwardena, Radiofrequency ablation of liver tumours:systematic review, Lancet Oncol. 5 (2004) 550–560.
[5] N.T. Wright, J.D. Humphrey, Denaturation of collagen via heating: anirreversible rate process, Annu. Rev. Biomed. Eng. 4 (2002) 109–128.
[6] C.J. Diederich, Thermal ablation and high-temperature thermal therapy:overview of technology and clinical implementation, Int. J. Hyperthermia 21(2005) 745–753.
[7] F.A. Jolesz, MRI-guided focused ultrasound surgery, Annu. Rev. Med. 60 (2009)417–430.
[8] J.A. López Molina, M.J. Rivera, M. Trujillo, Thermal modeling for pulsedradiofrequency ablation: analytical study based on hyperbolic heatconduction, Med. Phys. 36 (2009) 1112–1119.
[9] H.I. Vargas, W.C. Dooley, R.A. Gardner, K.D. Gonzalez, R. Venegas, S.H.Heywang-Kobrunner, A.J. Fenn, Focused microwave phased arraythermotherapy for ablation of early-stage breast cancer: results of thermaldose escalation, Ann. Surgical Oncol. 11 (2004) 139–146.
[10] A. Narasimhan, K.K. Jha, L. Gopal, Transient simulations of heat transfer inhuman eye undergoing laser surgery, Int. J. Heat Mass Transfer 53 (2010) 482–490.
[11] M. Jaunich, S. Raje, K. Kim, K. Mitra, Z. Guo, Bio-heat transfer analysis duringshort pulse laser irradiation of tissues, Int. J. Heat Mass Transfer 51 (2008)5511–5521.
[12] H.H. Pennes, Analysis of tissue and arterial blood temperature in the restinghuman forearm, J. Appl. Physiol. 1 (1948) 93–122.
[13] D.A. Nelson, Invited editorial on ‘‘Pennes’ 1948 paper revisited’’, J. Appl.Physiol. 85 (1998) 2–3.
[14] A. Nakayama, F. Kuwahara, A general bioheat transfer model based on thetheory of porous media, Int. J. Heat Mass Transfer 51 (2008) 3190–3199.
[15] S. Mahjoob, K. Vafai, Analytical characterization of heat transport throughbiological media incorporating hyperthermia treatment, Int. J. Heat MassTransfer 53 (2010) 482–490.
[16] D. Shrivastava, J.T. Vaughan, A generic bioheat transfer thermal model for aperfused tissue, J. Biomech. Eng. 131 (2009) 1–12.
[17] K.R. Diller, Bioheat and mass transfer as viewed through a microscope, ASME J.Biomech. Eng. 127 (2005) 67–84.
[18] M.C. Kolios, M.D. Sherar, J.W. Hunt, Blood flow cooling and ultrasonic lesionformation, Med. Phys. 23 (1996) 1287–1298.
[19] A. Kotte, G. van Leeuwen, J. de Bree, J. van der Koijk, H. Crezee, J. Lagendjik, Adescription of discrete vessel segments in thermal modeling of tissues, Phys.Med. Biol. 41 (1996) 865–884.
[20] J.C. Chato, Heat transfer to blood vessels, J. Biomech. Eng. 102 (1980) 110–118.[21] J.J.W. Lagendijk, The influence of bloodflow in large vessels on the temperature
distribution in hyperthermia, Phys. Med. Biol. 27 (1982) 17–23.[22] J. Crezee, J.J.W. Lagendijk, Temperature uniformity during hyperthermia: the
impact of large vessels, Phys. Med. Biol. 37 (1992) 1321–1337.[23] P. Hariharan, M.R. Myers, R.K. Banerjee, HIFU procedures at moderate
intensities-effect of large blood vessels, Phys. Med. Biol. 52 (2007) 3493–3513.[24] L. Consiglieri, I. dos Santos, D. Haemmerich, Theoretical analysis of the heat
convection coefficient in large vessels and the significance for thermal ablativetherapies, Phys. Med. Biol. 48 (2003) 4125–4134.
[25] D. Shrivastava, R.B. Roemer, Readdressing the issue of thermally significantblood vessels using a countercurrent vessel network, ASME J. Biomech. Eng.128 (2006) 210–216.
[26] Q. He, L. Zhu, D.E. Lemonds, S. Weinbaum, Experimental measurements of thetemperature variation along artery-vein pairs from 200 to 1000 lm diameterin rat hind limb, ASME J. Biomech. Eng. 124 (2002) 656–661.
T.-C. Shih et al. / International Journal of Heat and Mass Transfer 55 (2012) 3763–3773 3773
[27] D.A. McDonald, The relation of pulsatile pressure to flow in arteries, J. Physiol.127 (1955) 533–552.
[28] R. Kelly, C. Hayward, A. Avolio, M. O’Rourke, Noninvasive determination ofage-related changes in the human arterial pulse, Circulation 80 (1989) 1652–1659.
[29] M. Zamir, The Physics of Coronary Blood Flow, Springer-Verlag, New York,2005.
[30] D.N. Ku, Blood flow in arteries, Annu. Rev. Fluid Mech. 29 (1997)399–434.
[31] J.R. Womersley, Method for the calculation of velocity, rate of flow and viscousdrag in arteries when the pressure gradient is know, J. Physiol. 127 (1955)553–563.
[32] C. Loudon, A. Tordesillas, The use of the dimensionless Womersley number tocharacterize the unsteady nature of internal flow, J. Theor. Biol. 191 (1998) 63–78.
[33] T.C. Shih, H.S. Kou, W.L. Lin, Cooling effect of thermally significant bloodvessels in perfused tumor tissue during thermal therapy, Int. Commun. HeatMass Transfer 33 (2006) 135–141.
[34] M.C. Kolios, M.D. Sherar, J.W. Hunt, Large blood vessel cooling in heatedtissues: a numerical study, Phys. Med. Phys. 40 (1995) 477–494.
[35] T.C. Shih, H.S. Kou, W.L. Lin, The impact of thermally significant blood vesselsin perfused tumor tissue on thermal distributions during thermal therapies,Int. Commun. Heat Mass Transfer 30 (2003) 975–985.
[36] K. Khanafer, J.L. Bull, I. Pop, R. Berguer, Influence of pulsatile blood flow andheating scheme on the temperature distribution during hyperthermiatreatment, Int. J. Heat Mass Transfer 50 (2007) 4883–4890.
[37] C.W. Song, A. Lokshina, J.G. Rhee, M. Paten, S.H. Levitt, Implication of bloodflow in hyperthermia treatments of tumors, IEEE Trans. Biomed. Eng. BME-31(1984) 9–16.
[38] O.I. Craciunescu, S.T. Clegg, Pulsatile blood flow effects on temperaturedistribution and heat transfer in rigid vessels, ASME J. Biomech. Eng. 123(2001) 500–505.
[39] T.L. Horng, W.L. Lin, C.T. Liauh, T.C. Shih, Effects of pulsatile blood flow in largevessels on thermal dose distribution during thermal therapy, Med. Phys. 34(2007) 1312–1320.
[40] D.D. Joseph, L. Preziosi, Heat waves, Rev. Mod. Phys. 61 (1989) 41–73.[41] M.N. Özisik, D.Y. Tzou, On the wave theory in heat conduction, ASME Trans. J.
Heat Transfer 116 (1994) 525–526.[42] D.Y. Tzou, Marco to Micro-scale Heat Transfer: The Lagging Behavior, Taylor
and Francis, Washington, DC, 1997.[43] K. Kaminski, Hyperbolic heat conduction equation for materials with a
nonhomogeneous inner structure, ASME Trans. J. Heat Transfer 112 (1990)555–560.
[44] J. Zhou, Y. Zhang, J.K. Chen, Non-Fourier heat conduction effect on laser-induced thermal damage in biological tissues, Numer. Heat Tr. 54 (2008) 1–19.
[45] J. Zhou, J.K. Chen, Y. Zhang, Dual-phase effects on thermal damage to biologicaltissues caused by laser irradiation, Computer Biol. Med. 39 (2009) 286–293.
[46] R.B. Roemer, J.R. Oleson, T.C. Cetas, Oscillatory temperature response toconstant power applied to canine muscle, Am. J. Physiol. 249 (1985) R153–R158.
[47] K. Mitra, S. Kumar, A. Vedavarz, M.K. Moallemin, Experimental evidence ofhyperbolic heat conduction in processed meat, ASME Trans. J. Heat Transfer117 (1995) 568–573.
[48] P.J. Antaki, New interpretation of non-Fourier heat conduction in processedmeat, ASME Trans. J. Heat Transfer 127 (2005) 189–193.
[49] C. Cattaneo, Sur une forme de l’équation de la chaleur éliminant le paradoxed’une propagation instantaneé, Comptes Rendus 247 (1958) 431–433.
[50] P. Vernotte, Les paradoxes de la théorie continue de l’équation de la chaleur,Comptes Rendus 246 (1958) 3154–3155.
[51] W. Roetzel, N. Putra, S.K. Das, Experiment and analysis for non-Fourierconduction in materials with non-homogeneous inner structure, Int. J.Thermal Sci. 42 (2003) 541–552.
[52] Y. Zhang, Generalized dual-phase lag bioheat equations based on non-equilibrium heat transfer in living biological tissues, Int. J. Heat MassTransfer 52 (2009) 4829–4834.
[53] W.W. Nichols, M.F. O’Rourke, McDonald’s Blood Flow in Arteries: Theoretic,Experimental and Clinical Principles, Lea & Febiger, Philadelphia, 1990.
[54] Y. Huo, G.S. Kasab, Pulsatile blood flow in the entire coronary arterial tree:theory and experiment, Am. J. Physiol. Heart Circ. Physiol. 291 (2006) H1074–H1087.
[55] C. Canuto, M.Y. Hussaini, A. Quarteroni, T.A. Zhang, Spectral Methods,Fundamentals in Single Domains, Springer-Verlag, Berlin, Heidelberg, 2006.
[56] L.N. Trefethen, Spectral Methods in Matlab, SIAM, Philadelphia, 2000.[57] B. Fornberg, A Practical Guide to Pseudospectral Methods, Cambridge
University Press, Cambridge, 1996.[58] J. Hou, B. Guo, Chebyshev pseudospectral-finite element method for the three-
dimensional unsteady Naier-Stokes equation, Appl. Math. Comput. 101 (1999)209–244.
[59] J. Lee, Q.H. Liu, An efficient 3D spectral-element method for Schrodingerequation in nanodevice simulation, IEEE T. Comput. Aid. D. 24 (2005) 1848–1858.
[60] H.S. Kou, T.C. Shih, W.L. Lin, Effect of directional blood flow on thermal dosedistribution during thermal therapy: an application of Green’s function basedon the porous model, Phys. Med. Biol. 48 (2003) 1577–1589.
[61] S.A. Sapareto, W.C. Dewey, Thermal dose determination in cancer therapy, Int.J. Radiat. Oncol., Biol., Phys 10 (1984) 787–800.
Copyright © 2022 FDOKUMEN