
Longtime Behavior of a Branching Process Controlled By Branching Catalysts

ORIGINAL ARTICLE
Dynamics of pulsatile flow in fractal models of vascular branchingnetworks
Anh Bui Æ Ilija D. Sutalo Æ Richard Manasseh ÆKurt Liffman
Received: 1 September 2008 / Accepted: 16 April 2009 / Published online: 26 May 2009
� International Federation for Medical and Biological Engineering 2009
Abstract Efficient regulation of blood flow is critically
important to the normal function of many organs, espe-
cially the brain. To investigate the circulation of blood in
complex, multi-branching vascular networks, a computer
model consisting of a virtual fractal model of the vascu-
lature and a mathematical model describing the transport of
blood has been developed. Although limited by some
constraints, in particular, the use of simplistic, uniformly
distributed model for cerebral vasculature and the omission
of anastomosis, the proposed computer model was found to
provide insights into blood circulation in the cerebral
vascular branching network plus the physiological and
pathological factors which may affect its functionality. The
numerical study conducted on a model of the middle
cerebral artery region signified the important effects of
vessel compliance, blood viscosity variation as a function
of the blood hematocrit, and flow velocity profile on the
distributions of flow and pressure in the vascular network.
Keywords Vascular � Fractal � Pulsatile flow �Branching tree
1 Introduction
The complex network of branching vascular systems can
be described in a physiologically meaningful way by using
a fractal scaling principle. This was first theoretically
substantiated by Murray [21] based on the assumption that
minimal biological work is needed to maintain the blood
flow at a required level in a typical vascular system.
According to the Murray’s law, all the bifurcation seg-
ments are self-similar with the relation between the inlet
and outlet segment radii defined by a power law with the
radius exponent approximately equal to 3:
rnin ¼ rn
out;1 þ rnout;2: ð1Þ
The work by Rossitti and Lofgren [28] confirmed that the
branching of the internal carotid artery system is governed
by the principle of minimal work with the radius exponent
being approximately 3. The recent studies, however,
suggested that the radius exponent can significantly vary
in a large vascular network and the range of this parameter
between 2 and 3 was assumed to be physiologically relevant
[16]. The work by Gafiychuk and Lubashevsky [8] found
that the approximately square radius exponent (n ^ 2)
(corresponding to preservation of the branching area) would
help to minimize wave reflection at the branching points,
which is important for waves traveling through large
systemic arteries (see also [36]). Olufsen et al. [23], using
the principle of minimum work, defined the optimal value
of n for laminar and turbulent flows to be approximately 3
and 2.33, respectively. The theoretical work by West et al.
[36] identified a step change of n from 2 (area-preserving
flow in major blood vessels) to 3 (Poiseuille-type flow in
small blood vessels) at a certain branching level that is just
after a few branchings from the largest systemic arteries
in humans. The latest study by Kaimovitz et al. [12]
investigating porcine coronary arterial trees, however,
showed the possible variation of the radius component
beyond the range 2–3.
A vascular system obeying Murray’s Law with the
branching exponent equal to 3 has a constant and equal
shear stress throughout its network. For such a system, both
A. Bui (&) � I. D. Sutalo � R. Manasseh � K. Liffman
Division of Materials Science and Engineering,
Commonwealth Scientific and Industrial Research Organisation
(CSIRO), PO Box 56, Highett, VIC 3190, Australia
e-mail: [email protected]
123
Med Biol Eng Comput (2009) 47:763–772
DOI 10.1007/s11517-009-0492-6

the non-pulsatile and the pulsatile flow resistance, R, can be
described by Poiseuille formula:
R ¼ 8ll=pr4 ð2Þ
with ll and r denoting blood viscosity and vessel radius,
respectively.
The work of Gafiychuk and Lubashevsky [8] suggested
that a vascular network satisfying Murray’s Law is devel-
oped through some adaptation mechanisms which governs
both short- and long-term changes of arterial diameters and
seems to involve the sensitivity to shear stress of the
endothelial cells. Karau et al.’s work [13] indicated that,
for a branching network with n having a heterogenous
distribution about the mean value, the average of the radius
exponent seemed irrelevant to the possible interdepen-
dency of vascular structuring and shear stress distribution.
In that work, the shear stress was also found to be non-
uniform in a vascular network with distributed n. In vivo
measurements by Reneman and Hoeks [27] suggested a
non-constant shear stress distribution along the arterial tree.
In contrast to the work by Murray, which considered only
the energy minimization of the blood flow metabolism, the
work by Taber [33] included the metabolism dissipation by
structural components (i.e., blood vessel walls) and found
that the shear is also non-uniform in the optimal geometry
of a vessel segment. The study by Liu and Kassab [17],
extending Taber’s theory for a single vessel segment to a
vascular tree, confirmed the validity of the previously
proposed morphology scaling relations with the total met-
abolic consumption found proportional to the vascular tree
volume.
The flows in vascular branching networks have been
studied in the past [7, 19, 22, 23]. However, most of these
studies considered the networks of small arteries as binary
asymmetric structured trees attached to the terminals of
large arteries [22, 23]. Therefore, the detailed structure of
the small arterial network and the flow inside it were
beyond the scope of these works. In the investigations by
Mayer [19] and Gabrys [7], the flows in different bifurca-
tion levels of detailed asymmetric branching networks—
constructed on the basis of the fractal scaling principle—
were modeled, but the important effect of flow pulsation
(and the arterial vessel compliance) was not treated.
The aim of this work is to develop a computational fluid
dynamics (CFD) model of pulsatile flow in the branching
tree model of the human cerebral vascular system. The
model has been constructed on the basis of a fractal
description of the complex vascular network and a math-
ematical representation of the flow dynamics in the
deformable segments of that network.
Unlike the above-mentioned works investigating the
flows in vascular branching systems, the flow model
developed in this work can predict the time-dependent
distributions of the flow and the pressure in the whole
hierarchy of vascular networks and their alterations in
response to the local structural or geometrical changes and/
or the variations of the boundary conditions. As such, the
proposed model can be used to study the transient blood
circulation in a normal operational vasculature and also in
a disease-affected circulatory system. Computational
investigations have been conducted using the developed
flow model to provide insights into the blood circulation in
the branching vascular systems and the factors which may
affect their normal function.
2 Modeling approach
2.1 Fractal branching tree models of cerebral
vascular systems
Using the fractal scaling concept, a branching tree model,
which has physiologically meaningful geometrical prop-
erties, can be created for any vascular branching system. In
this work, a three-dimensional (3D) branching tree model
of the cerebral vasculature has been constructed using the
Constrained Constructive Optimization method (CCO)
proposed by Schreiner et al. [14, 29, 30]. The vascular
branching tree models generated by the CCO method sat-
isfy bifurcation rules such as fractal scaling and conser-
vation of flow. The CCO method involves geometric and
structural optimizations which minimizes the tree volume
and ensures uniform blood perfusion in the designated
perfusion domain. Good agreement of the vascular
branching tree model generated by the CCO method and
experimental observations was previously reported (see
[14, 29, 30]).
In addition to the fractal scaling rule described in the
introduction, other optimization conditions are also applied
in the CCO method, such as the minimization of the total
volume of blood (or vascular volume) as well as the geo-
metrical and structural restrictions ensuring the physio-
logical boundary of the perfusion volume, the uniform
space-filling of the capillaries, and the non-degeneration of
each segment length [14].
More details about the CCO method and its recent
developments can be found elsewhere (e.g., [14, 29, 30])
and were not reproduced in this work.
A simplified morphology of the human brain vasculature
was considered with the radius exponent assumed to be
constant (n = 2.76) and the arterial networks were
assumed to be distributed uniformly in the brain volume.
The radius exponent of 2.76 was chosen inside the range
suggested by Li [16]. The branching tree models generated
for different parts of the cerebral vasculature, namely
anterior (ACA), middle (MCA) and posterior (PCA)
764 Med Biol Eng Comput (2009) 47:763–772
123

cerebral arteries, are shown in Fig. 1. The number of ter-
minal segments in each cerebral vascular territory has been
chosen proportional to its volumetric flow rate as given in
Table 1 [20]. Pressure at the terminal segments which
supplies their microcirculatory areas was assumed to be
similar to the capillary pressure and set as in the work by
Ursino and Lodi [35].
The self-similarity of the cat pial vasculature considered
at different scale levels, which indicates its fractal geo-
metrical characteristic, was demonstrated in the work by
Herman et al. [9]. The empirical studies of the rat and
human cerebral vasculatures by Lapi et al. [15] and Cassot
et al. [4] show that the cerebral morphometry obeys Hor-
ton’s Law [10], which, in the stream morphometry, governs
the number as well as other geometric characteristics of the
segments in the successive stream orders. The branching
tree models of the cerebral vasculature generated in this
work (Fig. 1) are also found to have the vessel diameter,
length and number approximately satisfying the Horton’s
Law. The number of segments per vessel order, N, is
compared well against the correlation derived by Schreiner
et al. [31] (see Fig. 2):
NðKstrÞ ¼ exp � lnðNtermÞmaxfKstrg
� ðKstr �maxfKstrgÞ� �
ð3Þ
where Kstr is the segment Strahler order and Nterm is the
number of terminal segments.
The mean flow rate and shear stress of the steady-state
Poiseuille flow in the MCA are calculated and shown in
Fig. 3. For this flow, the shear stress is determined by the
equation: s = 8Ql/(pr3) with Q indicating the flow in the
segment. The simulation results show the significance of
the fractal scaling parameter n on the flow in the branching
tree model, which is in qualitative agreement with the
analysis by Gabrys et al. [7]. The shear stress distribution is
more uniform for n = 3. However, significant fluctuation
around the mean shear stress value is seen near the segment
diameter of 0.5 mm. This statistical deviation from the
constant shear rate could be caused by the optimization
method and/or the averaging procedure which depends on
the number of the branches and their ordering method. The
deviation is expected to reduce with the increase in the
number of the branches and the branching tree size.
Once the branching tree model(s) of the cerebral blood
vessels is/are created, variations of the geometrical or
structural properties of the cerebral arteries caused by
patho-physiological disorders can be taken into account by
modifying the characteristics of the affected blood vessels.
2.2 Pulsatile flow in fractal models of vascular systems
Flow in a branching vascular network is affected by the
network geometry which is defined by the branching pattern
[5]. Distributions of pressure and flow rate in a tree-like
network can easily be defined if the branch deformation
(compliance) is ignored (see [19]). The numerical study of
flows in fractal models by Gabrys et al. [7] ignored blood
vessel compliance in describing the flow and pressure dis-
tributions in fractal models with different bifurcation
exponents. Their work suggested that the effects of flow
non-linearities caused by velocity profile development after
bifurcations in small diameter vessels are small. A more
detailed numerical model of blood flows in a branching tree
system was developed by Olufsen et al. [23]. In that work,
the pulsatile flows in a structured tree consisting of small
arteries and arterioles were investigated. Each tree segment
was considered as a one-dimensional (1D) straight pipe.
Although the blood vessel compliance was taken into
account, the non-linear inertia term in the flow equation was
neglected, so that an analytical solution of the flow could be
obtained. The blood flow in the network of large 1D
deformable arteries has been investigated by Sherwin et al.
[18, 32]. In these works, the wave propagation and reflec-
tion in the human arterial system were studied with the
Fig. 1 An elementary branch
bifurcation and the branching
tree models generated for the
human anterior, middle, and
posterior cerebral vasculatures
(the number of terminal
segments in each brain territory
is reduced by a factor of 10 to
assist the visualisation). The
figure does not include the
major arteries of the circle of
Willis
Med Biol Eng Comput (2009) 47:763–772 765
123

Galerkin numerical techniques, which were used to solve
the 1D mass and momentum conservation equation system.
In this work, a method has been developed to consider
the effect of blood vessel compliance. The blood is
assumed to flow in relatively small vessels, so that the
Womersley number, a, (defined in terms of the Reynolds
and Strouhal numbers as a ¼ffiffiffiffiffiffiffiffiffiffiffiffiffiffiffi2pReSrp
¼ rffiffiffiffiffiffiffiffiffiffiffiffixq=l
pwith
the vessel radius r, the blood density q and viscosity l, and
the circular frequency of oscillation x) is small. For such a
flow, the effects of oscillatory wave propagation and
reflection can be ignored and the pressure–flow relation can
be described by the Poiseuille’s Law. As noted in the book
by Westerhof et al. [37], the above assumption is appro-
priate in most arteries of intermediate size.
Assuming that the distension of each blood vessel seg-
ment is driven by pressure, P, at the segment inlet, the
following flow balance can be derived for a straight blood
vessel segment as follows:
Qin ¼ Qout þ Qdeform ¼Pin � Pout
Rþ C
dPin
dtð4Þ
where C and R designate the vessel compliance and
resistance, respectively, and Q is the volume flow rate.
Table 1 Parameters of the cerebral vascular models
Cerebral
territory
Flow rate
mL/s
Perfusion
volume cm3Pterm, Pa
(mmHg)
Resistance 9 109,
Pa s/m3Number of term
segments
Total number
of segments
ACA 1.39 140 3,333 (25) 6.906 1,390 2,779
MCA 2.78 280 3,333 (25) 3.453 2,780 5,559
PCA 2.08 209.5 3,333 (25) 4.615 2,080 4,159
Fig. 2 The number of vessels and the average vessel diameter at different vessel Shahler order numbers. The analytical results were obtained
with Eq. 3
Fig. 3 Predicted mean flow rate and shear stress in the vessels of different sizes in the MCA under a steady-state flow condition
766 Med Biol Eng Comput (2009) 47:763–772
123

The vessel resistance is calculated using the Poiseuille
formula shown in Eq. 2. Assuming that the blood vessel
wall is a purely elastic material the vessel compliance is
obtained from the balance of the forces acting on the vessel
wall (blood pressure), and the tensile stress inside the
deformable wall, as follows [23]:
C ¼ dV
dP’ 3pr3
0l
2Ehð5Þ
with V the volume, r0 the diastolic vessel radius, h the
vessel thickness, and E the vessel Young’s modulus in the
circumferential direction (which is assumed to be
1.6 9 106 Pa for the MCA [1]). Following the works by
Olufsen et al. [22, 23], the blood vessel elastic modulus can
also be made dependent on the diastolic vessel radius as:
Eh
r0
¼ k1 expðk2r0Þ þ k3 ð6Þ
where k1, k2, k3 are the material constants [k1 = 2 9 106
kg/(s2m), k2 = -2.253 9 103 m-1, and k3 = 8.65 9 104
kg/(s2m)] which were obtained from data fitting [22].
At a branching point of an elementary bifurcation shown
in Fig. 1, the following flow balance equation can be
obtained:
ðC2 þ C3ÞdP0
dt¼ � 1
R1
þ 1
R2
þ 1
R3
� �P0 þ
P1
R1
þ P2
R2
þ P3
R3
:
ð7Þ
Equation 7 is applicable to the arteries and arterioles,
which are muscular vessels and able to dilate and contract
to regulate the blood flow. In the smaller capillaries, which
are responsible for microcirculation, the effect of vessel
compliance is negligible and the transient term in Eq. 7 can
be omitted. In this case, the differential equation 7 will
reduce to a linear algebraic equation.
An arbitrarily complex branching tree system can be
constructed from the above-described elementary branch
bifurcation models. A mixed system of differential alge-
braic equations (DAEs) and algebraic equations similar to
Eq. 7 can be derived to describe the inter-dependency of
pressures at the branching points (nodes) of the tree model.
This system of mixed differential and algebraic equations
can be solved using the MATLAB ODE software package.
The flow passing through each node can be determined
from the pressure drop and the resistance of the upstream
segment as defined in Eq. 4. The pressure distributions at
the root of the tree and the ends of the arterioles (terminal
segments) are to be prescribed as the boundary conditions.
In the cerebral blood circulation, anastomoses, i.e.,
blood vessels which connect the elements of one branching
tree or of different branching trees, are important features
of the brain vasculature and play an important role in blood
flow regulation and stroke development [3]. However, the
presence of anastomoses may alter the flow balance
equation 7 and they were not considered in this work.
3 Simulation results
The pulsatile blood flow in the arterial network has been
numerically studied in the works of Olufsen et al. [23],
Sherwin et al. [18, 32], and Huo and Kassab [11]. The
emphasis in those works was placed on the flow in the large
blood vessels. The small arteries were mostly treated in a
semi-analytical manner by employing the root impedance
defined for the whole structured tree of the small arteries.
In the present work, the pulsatile flow was calculated for
the whole branching tree starting from the root segments
down to the terminal segments. In the numerical modeling
below, the branching tree model of the MCA (see Table 1)
(generated with the branching radius exponent in Eq. 1
equal to 2.76) was considered, with the pulsatile pressure at
the tree root described by a double-sin wave as:
Proot ¼ 97þ 8:75 � sin½ð2t� 0:5Þp� � 6:25 � sinð4ptÞ: ð8Þ
The above pulsatile pressure imitates the cerebrospinal
fluid pressure waveforms proposed by Ursino [34]. The
maximum and minimum pressures are 110 and 84 mmHg,
respectively, with the pulse period equal to 1 s.
Pressure at the terminal arterioles was assumed to be
constant and equal to the human cerebral capillary pressure
(Pterm = 25 mmHg) [34]. The fluid and vessel structural
characteristics were specified on the case basis as described
below.
3.1 Effect of the vessel mechanical properties
on the flow
The change of blood vessel mechanical properties resulting
from aging, trauma, or diseases such as atherosclerosis or
aneurysm, involves stiffening or weakening of the vessel
wall, which may lead to abnormal vessel deformation and
shape. The effect of blood vessel compliance variation,
which can stimulate disease-affected circulatory systems,
can be investigated using the model developed in this work
(Table 2).
When vessel compliance is very small, Eq. 7 becomes
very stiff. As a result, the numerical method used to solve
this equation may become unstable unless a very small
time step is used. To remedy this problem, a MATLAB
stiff ODE solver, i.e., ode15s, was used in conjunction with
analytical evaluation of the Jacobian matrix qf/qP (f is the
right-hand side of Eq. 7). By default, the solvers in the
MATLAB ODE suite that are intended for stiff problems
approximate Jacobian matrices numerically. However, by
analytical evaluation of this matrix the reliability and
Med Biol Eng Comput (2009) 47:763–772 767
123
efficiency of integration can be improved. The MATLAB
ode15s is a variable-order multistep solver, which is suit-
able for stiff and/or differential-algebraic problems. For
each solution substep, the system of equations is solved
until the error at every solution point satisfies:
errorj j � max RelTol yij j;AbsTolð Þ; with yi being the ith
component of the solution vector y. In the simulations,
RelTol and AbsTol were set at 1 9 10-6 and 1 9 10-12,
respectively.
The results of computer simulations conducted on the
MCA fractal model are shown in Figs. 4 and 5. In the
simulations, the blood viscosity was assumed to be con-
stant and equal to 0.0036 Pa.s. Initially, the pressure in the
whole network was set at the terminal pressure, i.e., 25
mmHg. As can be seen from the figures, amplitudes of
pressure and flow oscillations in small arteries increase
with the decrease of the vessel compliance. In addition,
lowering vessel compliance appears to significantly reduce
transient time and peak flow rate (see Fig. 4), which are the
major factors affecting the transport and residence time of
materials in a branching tree network. The reduction of the
magnitude of pulsatile pressure in highly compliant blood
vessels can partly be explained by the loss of the flow
energy which is absorbed by the blood vessel wall
deformation.
A simulation, in which the compliance of all terminal
segments was assumed to be zero, was also conducted to
clarify the effect of mixed flexible and inflexible blood
vessels on flow and pressure distributions. The simulation
indicated that a solution could be obtained for the mixed
system of differential and algebraic equations as described
in Sect. 2.2. The computational prediction is identical to
the result shown in Fig. 5
3.2 Effect of the variable blood viscosity on the flow
For blood vessels smaller than 0.3 mm, the size of red
blood cells (6–8 lm) may have a significant effect on the
blood flow rheology [25] due to the segregation and sub-
sequent non-uniform distribution of the red blood cells
across the blood vessel cross-section. Due to the higher
concentration of the blood cells near the vessel centre, the
average red cell velocity is higher than the bulk blood
velocity. Consequently, a lower concentration of the blood
cells (and hematocrit level) is effectuated which is termed
the Fahraeus effect. The red blood vessel segregation in the
small blood vessels also leads to a rheology change and
dependency of the blood flow resistance on the vessel
geometry; this is designated as the Fahraeus–Lindqvist
effect. The reduction of the flow resistance in the small
arteries (arterioles) caused by the Fahraeus–Lindqvist
effect would significantly bring down the transmural blood
pressure and lower the force required to pump the blood
through the large number of the arterioles to adequately
perfuse the tissues. The Fahraeus and Fahraeus–Lindqvist
effects have been experimentally investigated by many
authors [24, 25] and also predicted in direct numerical
simulations by Bagchi [2].
Following the work by Pries et al. [25, 26], the blood
viscosity is made a function of the vessel diameter and
hematocrit as follows,
l ¼ lp 1þ g�0:45 � 1� �
� ð1� HdÞh � 1
ð1� 0:45Þh � 1� D
D� 1:1
� �2" #
� D
D� 1:1
� �2
; ð9Þ
where lp is the plasma viscosity, Hd is the discharge
hematocrit (i.e., the volume fraction of the red blood cells
in the blood), g0.45 is the relative effective blood viscosity
at Hd = 45%, which is given by
g�0:45 ¼ 6 � expð�0:085DÞ þ 3:2� 2:44
� expð�0:06D0:645Þ;
and h is defined as,
h ¼ ½0:8þ expð�0:075DÞ� � 1
1þ 10�11D12� 1
� �
þ 1
1þ 10�11D12
with D indicating the blood vessel diameter (in lm).
The above dependence of blood viscosity on hematocrit
level and vessel diameter features a gradual (up to 30%)
reduction of blood viscosity when the vessel diameter D
decreases to 43 lm and then rapid increase of blood vis-
cosity when D reduces further.
In the simulation with the results shown in Fig. 6, the
blood viscosity was described by Eq. 9. The plasma vis-
cosity was chosen so that the blood viscosity for vessels
of 1 mm in diameter or larger was approximately equal to
0.0036 Pa.s. The discharge hematocrit level was assumed
to be 45%. Compared to the corresponding case shown in
Fig. 5, this simulation, which takes into account the
variability of blood viscosity in blood vessels of different
sizes, indicates an increase of the flow rate in the whole
branching network and a decrease of pressure in the small
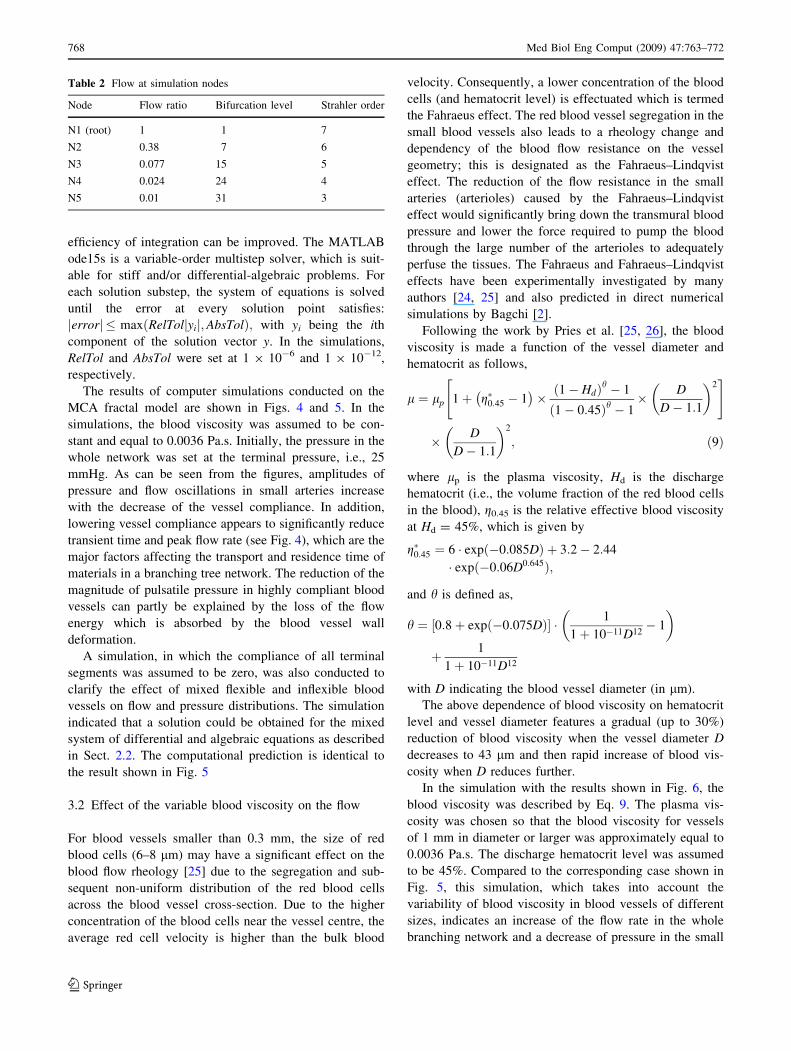
Table 2 Flow at simulation nodes
Node Flow ratio Bifurcation level Strahler order
N1 (root) 1 1 7
N2 0.38 7 6
N3 0.077 15 5
N4 0.024 24 4
N5 0.01 31 3
768 Med Biol Eng Comput (2009) 47:763–772
123

arteries. Since the smallest segment diameter of the
considered branching tree model was about 56 lm, both
of the above predictions can be explained by the overall
reduction of the resistance of the whole network with a
greater decrease in resistance occurring in the smaller
segments.
3.3 Effect of non-parabolic velocity profile on the flow
The assumption of Poiseuille flow leads to a parabolic
velocity profile in the tree segments. However, the flow in
the small and microscopic vasculatures can significantly
deviate from the parabolic profile due to a number of
factors, such as disturbance of the flow at the branching
points, flow pulsatility or the hematocrit level of the flow
(see Popel et al. [24], Gabrys et al. [7], and Bagchi [2]).
Following the work by Gabrys et al. [7], the non-parabolic
shape of the flow velocity can be taken into account by
using the Forchheimer equation as follows,
DP ¼ Pin � Pout ¼ RQþ BQ2: ð10Þ
In this equation, the second term in the left-hand side
describes the additional pressure drop caused by the non-
parabolic flow profile with factor B defined by
B ¼ bqpr4
ð11Þ
and b is approximately equal to 0.639 [7].
Equation 10 is a quadratic equation in the flow rate Q
which can be solved analytically. Using the flow rate-
pressure dependence which is the solution of Eq. 10, the
following flow balance equation can be obtained in place of
Eq. 7:
Fig. 4 Pulsatile pressure at the nodes at different tree levels (see Table 2)—vessel compliance equals 5 9 10-12 m3 Pa-1 (left) and 5 9 10-13
m3 Pa-1 (right), respectively
Fig. 5 Pulsatile pressure and flow at the nodes at different tree levels—size-dependent vessel compliance
Med Biol Eng Comput (2009) 47:763–772 769
123

C2 þ C3ð ÞdP0
dt¼ g1
ffiffiffiffiffiffiffiffiffiffiffiffiffiffiffiffiffiffiffiffiffiffiffiffi1þ P1 � P0
f1
r� 1
� �
� g2
ffiffiffiffiffiffiffiffiffiffiffiffiffiffiffiffiffiffiffiffiffiffiffiffi1þ P0 � P2
f2
r� 1
� �
� g3
ffiffiffiffiffiffiffiffiffiffiffiffiffiffiffiffiffiffiffiffiffiffiffiffi1þ P0 � P3
f3
s� 1
!ð12Þ
with g and f expressed by
g ¼ 1
2
R
B¼ 4ll
bqand f ¼ Bg2 ¼ 1
2gR:
The system of non-linear differential equations created
by applying (12) to each branching points can also be
solved using the MATLAB ODE subroutines.
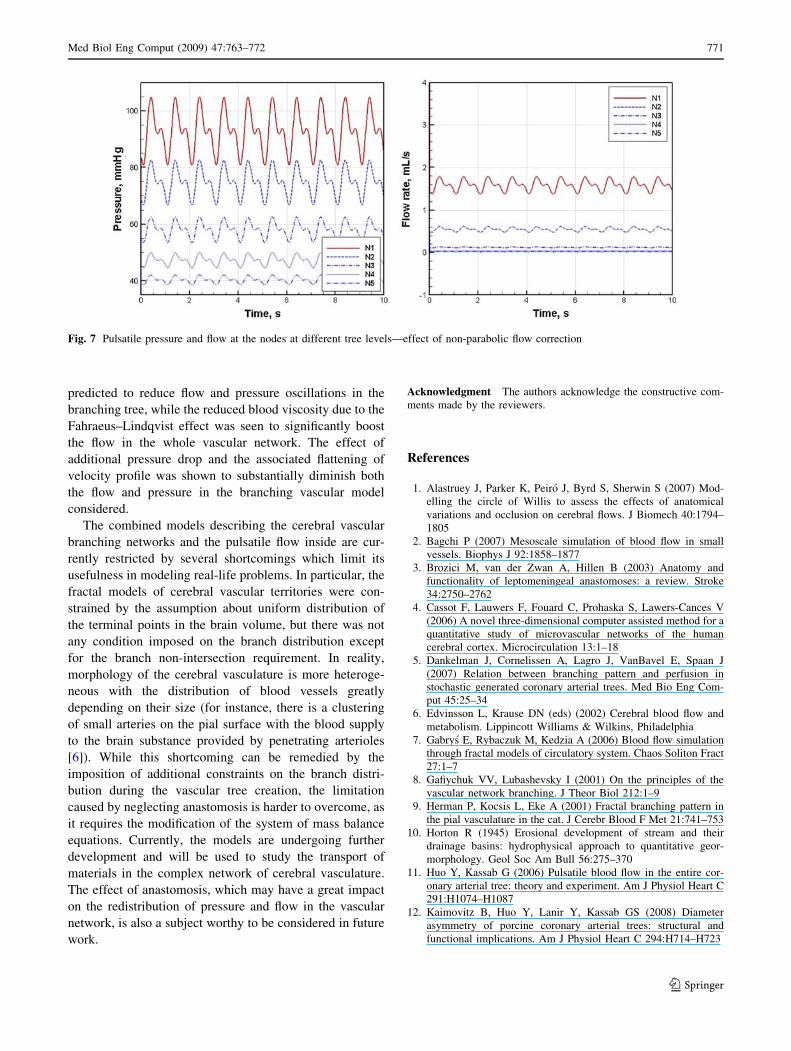
Although the study by Gabrys et al. [7] suggested the
non-parabolic velocity profile correction in the steady-state
flows had little significance, our simulation results for
pulsatile flow (Fig. 7) indicate considerable reduction of the
overall flow rate in response to the additional pressure drop
caused by the non-parabolic flow. A more complicated
relationship between flow rate and pressure drop is also
seen to substantially lower pressure at all levels of the
branching tree model. The decreases of the flow and
pressure are indications of significant increase of resistance
to the flow in the whole branching tree system, which
results from the additional pressure drop term in Eq. 10.
4 Discussion and conclusion
In this work, a model of the cerebral vascular network
structure and pulsatile flows within the brain has been
developed to investigate the transient pulsatile flows in the
fractal network of the cerebral vasculature. Unlike previous
work studying the flow in the vascular branching networks,
this work took into consideration the important effects of
blood vessel compliance and the variation of the blood
rheology, as well as the possible change of flow velocity
profile in small vasculature.
Based on the fractal scaling principle and by employing
the CCO method, the branching tree models for different
territories of the human cerebral vasculature have been
constructed. These models satisfied the fractal scaling law
as well as several other constraint and optimization criteria,
such as minimal vasculature volume and minimal network
resistance.
A mathematical model of pulsatile flows in a complex
dichotomous branching tree network has also been devel-
oped and was used to identify and study important factors,
which may affect the blood transport in the asymmetric
network of blood vessels of different sizes. The develop-
ment of the flow model was based on the assumption that,
in the small vasculature, the effects of oscillatory pressure
propagation and reflection can be ignored and, therefore,
that there is no phase shift between blood pressure and flow
rate fluctuations. While this model can not be employed to
simulate the flow in large blood vessels, it can be coupled
with a 3D CFD model to provide predictions for the whole
ranges of blood vessel sizes. Using pressures prescribed at
the root and the terminal segments of the vascular tree as
boundary conditions, the flow model was numerically
solved using the MATLAB ODE library with optimal and
robust solution procedures identified for different branch-
ing tree characteristics and flow conditions.
The numerical study conducted on a branching model of
the MCA region signified the important effects of vessel
compliance, flow viscosity variation as a function of the
blood hematocrit, and flow velocity profile on the distri-
butions of flow and pressure in the vascular network. In
particular, the increase of blood vessel compliance was
Fig. 6 Pulsatile pressure and flow at the nodes at different tree levels—effect of variable blood viscosity
770 Med Biol Eng Comput (2009) 47:763–772
123
predicted to reduce flow and pressure oscillations in the
branching tree, while the reduced blood viscosity due to the
Fahraeus–Lindqvist effect was seen to significantly boost
the flow in the whole vascular network. The effect of
additional pressure drop and the associated flattening of
velocity profile was shown to substantially diminish both
the flow and pressure in the branching vascular model
considered.
The combined models describing the cerebral vascular
branching networks and the pulsatile flow inside are cur-
rently restricted by several shortcomings which limit its
usefulness in modeling real-life problems. In particular, the
fractal models of cerebral vascular territories were con-
strained by the assumption about uniform distribution of
the terminal points in the brain volume, but there was not
any condition imposed on the branch distribution except
for the branch non-intersection requirement. In reality,
morphology of the cerebral vasculature is more heteroge-
neous with the distribution of blood vessels greatly
depending on their size (for instance, there is a clustering
of small arteries on the pial surface with the blood supply
to the brain substance provided by penetrating arterioles
[6]). While this shortcoming can be remedied by the
imposition of additional constraints on the branch distri-
bution during the vascular tree creation, the limitation
caused by neglecting anastomosis is harder to overcome, as
it requires the modification of the system of mass balance
equations. Currently, the models are undergoing further
development and will be used to study the transport of
materials in the complex network of cerebral vasculature.
The effect of anastomosis, which may have a great impact
on the redistribution of pressure and flow in the vascular
network, is also a subject worthy to be considered in future
work.
Acknowledgment The authors acknowledge the constructive com-
ments made by the reviewers.
References
1. Alastruey J, Parker K, Peiro J, Byrd S, Sherwin S (2007) Mod-
elling the circle of Willis to assess the effects of anatomical
variations and occlusion on cerebral flows. J Biomech 40:1794–
1805
2. Bagchi P (2007) Mesoscale simulation of blood flow in small
vessels. Biophys J 92:1858–1877
3. Brozici M, van der Zwan A, Hillen B (2003) Anatomy and
functionality of leptomeningeal anastomoses: a review. Stroke
34:2750–2762
4. Cassot F, Lauwers F, Fouard C, Prohaska S, Lawers-Cances V
(2006) A novel three-dimensional computer assisted method for a
quantitative study of microvascular networks of the human
cerebral cortex. Microcirculation 13:1–18
5. Dankelman J, Cornelissen A, Lagro J, VanBavel E, Spaan J
(2007) Relation between branching pattern and perfusion in
stochastic generated coronary arterial trees. Med Bio Eng Com-
put 45:25–34
6. Edvinsson L, Krause DN (eds) (2002) Cerebral blood flow and
metabolism. Lippincott Williams & Wilkins, Philadelphia
7. Gabrys E, Rybaczuk M, Kedzia A (2006) Blood flow simulation
through fractal models of circulatory system. Chaos Soliton Fract
27:1–7
8. Gafiychuk VV, Lubashevsky I (2001) On the principles of the
vascular network branching. J Theor Biol 212:1–9
9. Herman P, Kocsis L, Eke A (2001) Fractal branching pattern in
the pial vasculature in the cat. J Cerebr Blood F Met 21:741–753
10. Horton R (1945) Erosional development of stream and their
drainage basins: hydrophysical approach to quantitative geor-
morphology. Geol Soc Am Bull 56:275–370
11. Huo Y, Kassab G (2006) Pulsatile blood flow in the entire cor-
onary arterial tree: theory and experiment. Am J Physiol Heart C
291:H1074–H1087
12. Kaimovitz B, Huo Y, Lanir Y, Kassab GS (2008) Diameter
asymmetry of porcine coronary arterial trees: structural and
functional implications. Am J Physiol Heart C 294:H714–H723
Fig. 7 Pulsatile pressure and flow at the nodes at different tree levels—effect of non-parabolic flow correction
Med Biol Eng Comput (2009) 47:763–772 771
123

13. Karau KL, Krenz GS, Dawson CA (2001) Branching exponent
heterogeneity and wall shear stress distribution in vascular trees.
Am J Physiol Heart C 280:H1256–1263
14. Karch R, Neumann F, Neumann M, Schreiner W (1999) A three-
dimensional model for arterial tree representation, generated by
constrained constructive optimization. Comput Biol Med 29:19–38
15. Lapi D, Marchiafava P, Colantuoni A (2008) Geometric char-
acteristics of arterial network of rat pial microcirculation. J Vasc
Res 45:69–77
16. Li JKJ (2004) Dynamics of the vascular system. World Sci. Publ.
Co., Singapore
17. Liu Y, Kassab GS (2007) Vascular metabolic dissipation in
murray’s law. Am J Physiol Heart C 292:H1336–H1339
18. Matthys KS, Alastruey J, Peiro J, Khir AW, Segers P, Verdonck
PR, Parker KH, Sherwin SJ (2007) Pulse wave propagation in a
model human arterial network: assessment of 1-D numerical
simulations against in-vitro measurements. J Biomech 40:3476–
3486
19. Mayer S (1996) On the pressure and flow-rate distributions in
tree-like and arterial-venous networks. B Math Biol 58:753–785
20. Moore S, David T, Chase J, Arnold J, Fink J (2006) 3D models of
blood flow in the cerebral vasculature. J Biomech 39:1454–1463
21. Murray C (1926) The physiological principle of minimum work.
I. The vascular system and the cost of blood volume. P Natl Acad
Sci USA 12:207–214
22. Olufsen MS (1999) Structured tree outflow condition for blood
flow in larger systemic arteries. Am J Physiol 276:H257–268
23. Olufsen MS, Peskin CS, Kim WY, Pedersen EM, Nadim A,
Larsen J (2000) Numerical simulation and experimental valida-
tion of blood flow in arteries with structured-tree outflow con-
ditions. Ann Biomed Eng 28:1281–1299
24. Popel AS, Johnson PC (2005) Microcirculation and hemorheol-
ogy. Annu Rev Fluid Mech 37:43–69
25. Pries A, Secomb T, Gaehtgens P (1996) Review—biophysical
aspects of blood flow in the microvasculature. Cardiovasc Res
32:654–667
26. Pries A, Secomb T, Gessner T, Sperandio M, Gross J, Gaehtgens
P (1994) Resistance to blood flow in microvessels in vivo. Circ
Res 75:904–915
27. Reneman RS, Hoeks AP (2008) Wall shear stress as measured in
vivo: consequences for the design of the arterial system. Med
Biol Eng Comput 46:499–507
28. Rossitti S, Lofgren J (1993) Vascular dimensions of the cerebral
arteries follow the principle of minimum work. Stroke 24:371–
377
29. Schreiner W, Karch R, Neumann M, Neumann F, paul Szaw-
lowski, Roedler S (2006) Optimized arterial trees supplying
hollow organs. Med Eng Phys 28:416–429
30. Schreiner W, Neumann F, Neumann M, End A, Muller M (1996)
Structural quantification and bifurcation symmetry in arterial tree
models generated by constrained constructive optimization.
J Theor Biol 180:161–174
31. Schreiner W, Neumann F, Neumann M, End A, Roedler SM
(1997) Anatomical variability and funtional ability of vascular
trees modeled by constrained constructive optimization. J Theor
Biol 187:147–158
32. Sherwin SJ, Formaggia L, Peiro J, Franke V (2003) Computa-
tional modeling of 1D blood flow with variable mechanical
properties and its application to the simulation of wave propa-
gation in the human arterial system. Int J Numer Meth Fluids
43:673–700
33. Taber L (1998) An optimization principle for vascular radius
including the effects of smooth muscle tone. Biophys J 74:109–
114
34. Ursino M (1988) A mathematical study of human intracranial
hydrodynamics. i. the cerebrospinal fluid pulse pressure. Ann
Biomed Eng 16:379–402
35. Ursino M, Lodi CA (1997) A simple mathematical model of the
interaction between intracranial pressure and cerebral hemody-
namics. J Appl Physiol 82:1256–1269
36. West GB, Brown JH, Enquist BJ (1997) A general model for the
origin of allometric scaling laws in biology. Science 276:122–126
37. Westerhof N, Stergiopulos N, Noble MI (2005) Snapshots of
hemodynamics—an aid for clinical research and graduate edu-
cation. Springer, Boston
772 Med Biol Eng Comput (2009) 47:763–772
123
Copyright © 2022 FDOKUMEN