Multi-month thermal aging of electro-optic polymer waveguides: Synthesis, fabrication, and...
13
This article was published in an Elsevier journal. The attached copy is furnished to the author for non-commercial research and education use, including for instruction at the author’s institution, sharing with colleagues and providing to institution administration. Other uses, including reproduction and distribution, or selling or licensing copies, or posting to personal, institutional or third party websites are prohibited. In most cases authors are permitted to post their version of the article (e.g. in Word or Tex form) to their personal website or institutional repository. Authors requiring further information regarding Elsevier’s archiving and manuscript policies are encouraged to visit: http://www.elsevier.com/copyright
-
Upload
independent -
Category
Documents
-
view
3 -
download
0
Transcript of Multi-month thermal aging of electro-optic polymer waveguides: Synthesis, fabrication, and...
This article was published in an Elsevier journal. The attached copyis furnished to the author for non-commercial research and
education use, including for instruction at the author’s institution,sharing with colleagues and providing to institution administration.
Other uses, including reproduction and distribution, or selling orlicensing copies, or posting to personal, institutional or third party
websites are prohibited.
In most cases authors are permitted to post their version of thearticle (e.g. in Word or Tex form) to their personal website orinstitutional repository. Authors requiring further information
regarding Elsevier’s archiving and manuscript policies areencouraged to visit:
http://www.elsevier.com/copyright
Author's personal copy
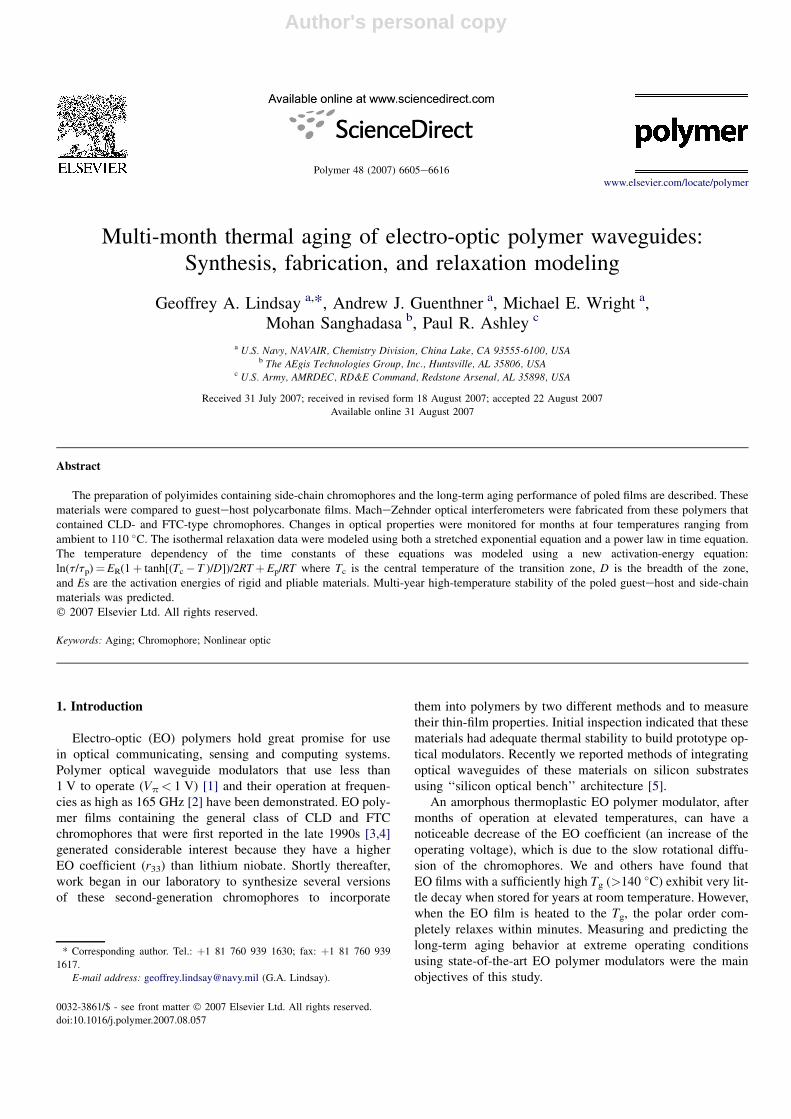
Multi-month thermal aging of electro-optic polymer waveguides:Synthesis, fabrication, and relaxation modeling
Geoffrey A. Lindsay a,*, Andrew J. Guenthner a, Michael E. Wright a,Mohan Sanghadasa b, Paul R. Ashley c
a U.S. Navy, NAVAIR, Chemistry Division, China Lake, CA 93555-6100, USAb The AEgis Technologies Group, Inc., Huntsville, AL 35806, USA
c U.S. Army, AMRDEC, RD&E Command, Redstone Arsenal, AL 35898, USA
Received 31 July 2007; received in revised form 18 August 2007; accepted 22 August 2007
Available online 31 August 2007
Abstract
The preparation of polyimides containing side-chain chromophores and the long-term aging performance of poled films are described. Thesematerials were compared to guestehost polycarbonate films. MacheZehnder optical interferometers were fabricated from these polymers thatcontained CLD- and FTC-type chromophores. Changes in optical properties were monitored for months at four temperatures ranging fromambient to 110 �C. The isothermal relaxation data were modeled using both a stretched exponential equation and a power law in time equation.The temperature dependency of the time constants of these equations was modeled using a new activation-energy equation:ln(t/tp)¼ ER(1þ tanh[(Tc� T )/D])/2RTþ Ep/RT where Tc is the central temperature of the transition zone, D is the breadth of the zone,and Es are the activation energies of rigid and pliable materials. Multi-year high-temperature stability of the poled guestehost and side-chainmaterials was predicted.� 2007 Elsevier Ltd. All rights reserved.
Keywords: Aging; Chromophore; Nonlinear optic
1. Introduction
Electro-optic (EO) polymers hold great promise for usein optical communicating, sensing and computing systems.Polymer optical waveguide modulators that use less than1 V to operate (Vp< 1 V) [1] and their operation at frequen-cies as high as 165 GHz [2] have been demonstrated. EO poly-mer films containing the general class of CLD and FTCchromophores that were first reported in the late 1990s [3,4]generated considerable interest because they have a higherEO coefficient (r33) than lithium niobate. Shortly thereafter,work began in our laboratory to synthesize several versionsof these second-generation chromophores to incorporate
them into polymers by two different methods and to measuretheir thin-film properties. Initial inspection indicated that thesematerials had adequate thermal stability to build prototype op-tical modulators. Recently we reported methods of integratingoptical waveguides of these materials on silicon substratesusing ‘‘silicon optical bench’’ architecture [5].
An amorphous thermoplastic EO polymer modulator, aftermonths of operation at elevated temperatures, can have anoticeable decrease of the EO coefficient (an increase of theoperating voltage), which is due to the slow rotational diffu-sion of the chromophores. We and others have found thatEO films with a sufficiently high Tg (>140 �C) exhibit very lit-tle decay when stored for years at room temperature. However,when the EO film is heated to the Tg, the polar order com-pletely relaxes within minutes. Measuring and predicting thelong-term aging behavior at extreme operating conditionsusing state-of-the-art EO polymer modulators were the mainobjectives of this study.
* Corresponding author. Tel.: þ1 81 760 939 1630; fax: þ1 81 760 939
1617.
E-mail address: [email protected] (G.A. Lindsay).
0032-3861/$ - see front matter � 2007 Elsevier Ltd. All rights reserved.
doi:10.1016/j.polymer.2007.08.057
Polymer 48 (2007) 6605e6616www.elsevier.com/locate/polymer
Author's personal copy
The relaxation rate of poled order in EO films (the rate ofdecrease in r33) has often been measured by monitoring the de-crease in second harmonic generation (SHG) upon irradiatingthe film with a pulsed laser [6,7]. SHG is a measure of thesecond-order nonlinear susceptibility, d33, which is directlyproportional to the r33. A useful way to directly monitor theEO r33 coefficient is the modified TengeMan method [8], inwhich an electric field is applied across the film with trans-parent electrode(s) to modulate a reflected (transmitted) lightbeam. In the present study, the relaxation rates of EO polymeroptical waveguides were monitored in MacheZehnder inter-ferometers (MZIs) by periodically measuring the increase inthe half-wave voltage. The half-wave voltage (Vp), definedin Eq. (1), is the applied voltage required to change the phaseof the light in one arm of the MZI relative to the other arm by180�. Voltage can be applied to one or both arms of the MZI tomodulate the intensity of the light at the output. The Vp isinversely proportional to the EO coefficient:
Vp ¼ ld=�n3r33LG
�ð1Þ
where l is the wavelength of light being modulated, d is thedistance between electrodes, n is the effective index of refrac-tion of the waveguide, L is the length of the optical waveguidesubjected to electrode modulation, and G is the opticaleelectrical overlap integral (G¼ 1 for our sandwich-electrodegeometry).
In this paper we provide details for the synthesis of newchromophoric polymers, processing of thin films, fabricationof waveguide modulators, oven-aging, as well as the data re-duction, modeling and multi-year aging predictions at elevatedtemperatures.
2. Experimental section
2.1. Polymer characterization: equipment andtechniques
Differential scanning calorimetry (DSC) was performed ona TA Instruments, Inc. Model Q100. The DSC Tg was taken asthe midpoint of the step transition observed on the 2nd or 3rdheating scan at 10 �C/min. The gel permeation chromatogra-phy (GPC) equipment used to measure molecular weightand polydispersity (PD) of the polyimides was a Viscotek,Inc., model 302-050; the columns were calibrated relative topolystyrene standards; the solvent was tetrahydrofuran (THF);and the ultravioletevisible (UVevis) detector was set at640 nm. Nuclear magnetic resonance (NMR) analyses wereperformed with Bruker 300 MHz and/or Bruker 400 MHz in-struments. A Cary 5 spectrophotometer was used to obtainthe UVevis spectra of the materials.
2.2. Materials
Two types of second-generation chromophores were usedin this study: an isophorone-based chromophore called CLD[1] and a thiophene-based chromophore called FTC [1,3].
The EO core materials used in this investigation are listed inTable 1.
2.2.1. Guest chromophoresThe guest chromophores, called FTCeA and CLDeA,
were synthesized in our laboratory in batch sizes up to 80 g.‘‘A’’ stands for the adamantane group attached to the chromo-phores. The adamantane group improved the pot life of thechromophores in spin-casting solutions and improved the sol-ubility of the chromophores in the amorphous polycarbonatehost materials. The bare chromophores, which containedonly the N,N-(ethylhydroxyethyl)-amine group, were preparedby the method described in Ref. [9] for CLDeOH and bythe improved method described in Ref. [10] for FTCeOH(the older method was described in Ref. [11]). Adamantanewas attached to the penultimate precursors of FTCeOH andCLDeOH by reaction of the acid chloride of 1-adamantanecarboxylic acid with the hydroxyethyl group of the dyesin the presence of 2 equiv of 4-dimethylaminopyridine(DMAP) at ambient. The most intense peaks of the electronicabsorption spectra of FTCeA and CLDeA ranged from about600 to 670 nm depending on the particular solvent used for themeasurement.
2.2.2. Host polycarbonatesThe amorphous polycarbonates used in this study were
poly[bisphenol A carbonate-co-4,40-(3,3,5-trimethylcyclo-hexylidene)diphenol carbonate]. APC (from Aldrich, catalog# 43,057-9) had a glass transition temperature (Tg) of 207 �Cand APEC (Bayer AG, grade 9389 [12]) had a Tg of 215 �C.Both materials were obtained in pelletized form and usedas-received.
2.2.3. Side-chain polyimidesThe side-chain polymers were prepared in our laboratory.
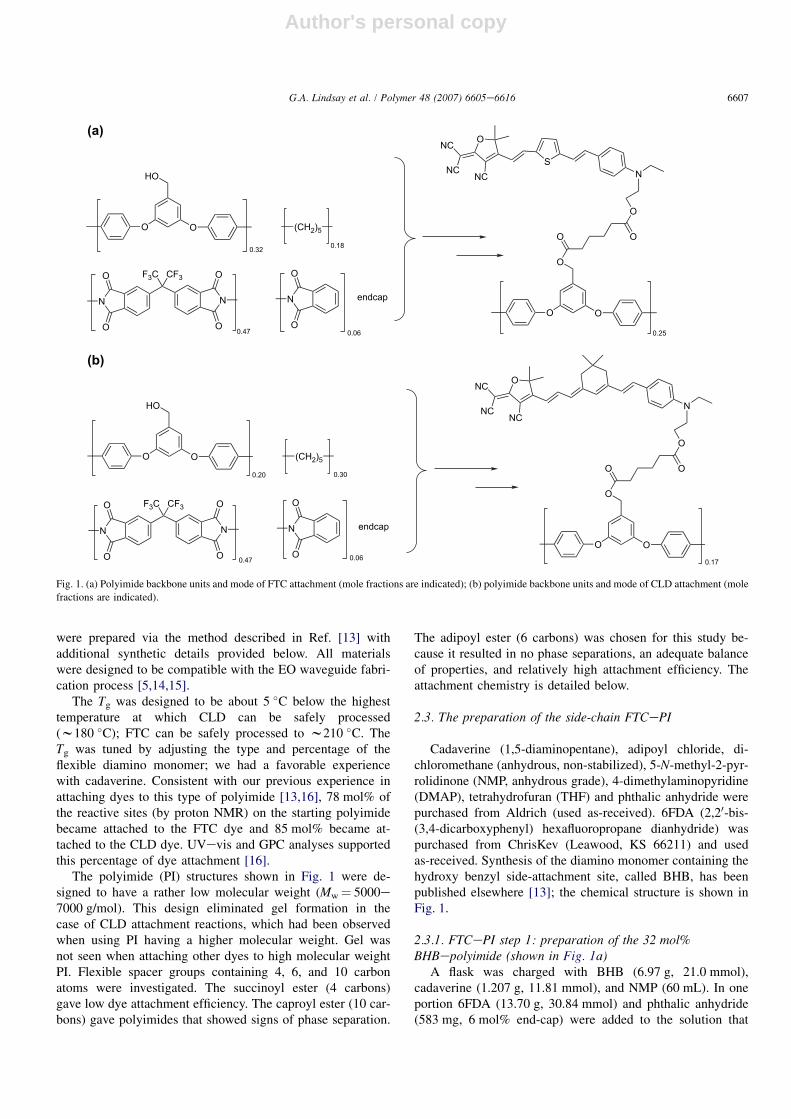
The structures of the FTC and CLD covalently attached tothe polyimide backbones are shown in Fig. 1a and b. They
Table 1
List of electro-optic core materials used in this study
Designation Material type Bare dye/wt%a Tg/�C
CLDeA/APC Guestehost 26 145� 5b
CLDeA/APEC Guestehost 26 150� 5b
FTCeA/APC Guestehost 26 145� 5b
FTCeA/APEC Guestehost 26 150� 5b
CLDePI Covalently attached 22 174� 3c
FTCePI Covalently attached 26 171� 3c
a For comparison with the side-chain attached materials, the weight percent
of dye was calculated using just the bare-dye content (FTCeOH and CLDe
OH containing only the N,N-(ethylhydroxyethyl) groups on the amine), based
on molecular weights of 483 g/mol for FTCeOH, and 521 g/mol for CLDe
OH. With the adamantane group attached, the CLDeA and FTCeA loadings
were 34 wt%. Structures of the side-chain materials and chromophores are
shown in Fig. 1 and discussed in Section 2.2.1.b DSC measurements on pieces of w100-mm thick films after multi-day bak-
ing at elevated temperature; midpoint of the transition at 10 �C/min.c DSC measurements on powder-form dried materials; midpoint of the tran-
sition at 10 �C/min.
6606 G.A. Lindsay et al. / Polymer 48 (2007) 6605e6616
Author's personal copy
were prepared via the method described in Ref. [13] withadditional synthetic details provided below. All materialswere designed to be compatible with the EO waveguide fabri-cation process [5,14,15].
The Tg was designed to be about 5 �C below the highesttemperature at which CLD can be safely processed(w180 �C); FTC can be safely processed to w210 �C. TheTg was tuned by adjusting the type and percentage of theflexible diamino monomer; we had a favorable experiencewith cadaverine. Consistent with our previous experience inattaching dyes to this type of polyimide [13,16], 78 mol% ofthe reactive sites (by proton NMR) on the starting polyimidebecame attached to the FTC dye and 85 mol% became at-tached to the CLD dye. UVevis and GPC analyses supportedthis percentage of dye attachment [16].
The polyimide (PI) structures shown in Fig. 1 were de-signed to have a rather low molecular weight (Mw¼ 5000e7000 g/mol). This design eliminated gel formation in thecase of CLD attachment reactions, which had been observedwhen using PI having a higher molecular weight. Gel wasnot seen when attaching other dyes to high molecular weightPI. Flexible spacer groups containing 4, 6, and 10 carbonatoms were investigated. The succinoyl ester (4 carbons)gave low dye attachment efficiency. The caproyl ester (10 car-bons) gave polyimides that showed signs of phase separation.
The adipoyl ester (6 carbons) was chosen for this study be-cause it resulted in no phase separations, an adequate balanceof properties, and relatively high attachment efficiency. Theattachment chemistry is detailed below.
2.3. The preparation of the side-chain FTCePI
Cadaverine (1,5-diaminopentane), adipoyl chloride, di-chloromethane (anhydrous, non-stabilized), 5-N-methyl-2-pyr-rolidinone (NMP, anhydrous grade), 4-dimethylaminopyridine(DMAP), tetrahydrofuran (THF) and phthalic anhydride werepurchased from Aldrich (used as-received). 6FDA (2,20-bis-(3,4-dicarboxyphenyl) hexafluoropropane dianhydride) waspurchased from ChrisKev (Leawood, KS 66211) and usedas-received. Synthesis of the diamino monomer containing thehydroxy benzyl side-attachment site, called BHB, has beenpublished elsewhere [13]; the chemical structure is shown inFig. 1.
2.3.1. FTCePI step 1: preparation of the 32 mol%BHBepolyimide (shown in Fig. 1a)
A flask was charged with BHB (6.97 g, 21.0 mmol),cadaverine (1.207 g, 11.81 mmol), and NMP (60 mL). In oneportion 6FDA (13.70 g, 30.84 mmol) and phthalic anhydride(583 mg, 6 mol% end-cap) were added to the solution that
N
O
O
N
O
O
F3C CF3
O
HO
(a)
(b)
O
N
O
O
(CH2)5
0.32
0.47 0.06
endcap
0.18
O
O
O
O
O
O
N
ONC
NCNC
0.25
S
N
O
O
N
O
O
F3C CF3
O
HO
O
N
O
O
(CH2)5
0.20
0.47 0.06
endcap
0.30
O
O
O
O
O
O
N
ONC
NCNC
0.17
Fig. 1. (a) Polyimide backbone units and mode of FTC attachment (mole fractions are indicated); (b) polyimide backbone units and mode of CLD attachment (mole
fractions are indicated).
6607G.A. Lindsay et al. / Polymer 48 (2007) 6605e6616
Author's personal copy
was being rapidly stirred. An additional 20 mL of NMP wasadded to wash down the sides of the flask and the mixturewas allowed to stir at ambient temperature for an additional10 h. The flask was equipped with a reflux condenser andheated at 180 �C for 6 h. Then it was removed from the heat-ing bath and allowed to cool for w1 h. Then it was poured intoa rapidly stirred methanol (1.5 L) solution. The precipitatedpolymer was stirred for w1 h, collected on a glass frit, washedwith methanol (w1 L) and then with ether (w300 mL). It wasdried under reduced pressure (w0.2 torr) at 100 �C for 24 h toafford 19.2 g (90% yield) of light tan powder (Mn¼ 5500 g/mol,PD¼ 2.2; Tg¼ 219 �C), the 32% BHBepolyimide.
2.3.2. FTCePI step 2: attaching the adipoyl side chainA flask was charged with 4.00 g of the above BHBe
polyimide, 2,6-di-tert-butyl-4-methylpyridine (800 mg), DMAP(80 mg), and THF (40 mL). Once all the materials had dis-solved, adipoyl chloride (5.5 mL) was added in one portionand the mixture was allowed to react at ambient temperaturefor 16 h with stirring. This reaction slurry was filtered througha pad of Celite to remove the suspended salt, and the clearpolymer solution passing through the Celite pad was addedto ether (500 mL). The polymer precipitated in ether was col-lected on a frit and transferred directly into a 200 mL Schlenkflask for drying at 40 �C for w1.3 h under reduced pressure.
2.3.3. FTCePI step 3: attachment of the FTCeOHchromophore
The above modified polymer of 3.60 g was dissolved in150 mL of dichloromethane; in one portion 2.00 g of the bareFTCeOH dye [10] was added to the mixture followed by an ad-ditional 30 mL of dichloromethane. The mixture was stirred for10 min and then solid DMAP (prilled, 450 mg) was added inone portion; the mixture was allowed to react with stirring foran additional 3.5 h. The solution was concentrated to a volumeof w60 mL on a rotovap and the homogenous mixture was thenpoured into methanol (1.5 L). The polymer precipitated in meth-anol. It was collected and washed sequentially with methanol(500 mL), ether (300 mL), methanol (200 mL), and ether(100 mL); and then it was dried under reduced pressure to afford5.10 g of a deep blue powder. After drying at 50 �C for 14 hunder reduced pressure, NMR analysis of the sample indicatedan attachment efficiency of about 78% and DSC indicated a finalTg of 171 �C. GPC analysis indicated that essentially all of theunattached FTC had been washed out of the polymer.
2.4. The preparation of the side-chain CLDePI
The steps for preparing CLDePI were very similar to thoseused in the FTCePI preparation given above. However, an ad-ditional step was taken to remove residual (free) CLDeOHfrom the once-precipitated polymer. Approximately 2 g ofdry, CLDePI was redissolved in 20 mL of dichloromethaneand precipitated a second time into methanol (500 mL). Thesolid was collected on a glass frit and washed with methanol(w200 mL) and then with ether (w300 mL). The polymer
was dried at w40 �C for 24 h at reduced pressure. By integra-tion of the GPC chromatogram, it was determined that lessthan 4% of the total CLD in the sample was residual unat-tached CLDeOH. After this reprecipitation, analysis of thepolymer by NMR spectroscopy indicated an attachmentefficiency of about 85%. Analysis by DSC indicated thatthis material had a Tg of w174 �C.
2.5. Films and modulator fabrication
The spin-casting solutions used to fabricate the waveguidecore layers comprise 12% solids in 1,1,2,2-tetrachloroethane(the same solvent was used to prepare films of the guestehost and the side-chain polyimides) [16]. The guestehostsolutions had about a 1-month pot life (even longer for theside-chain polyimides) when stored in an air-free environmentin the dark.
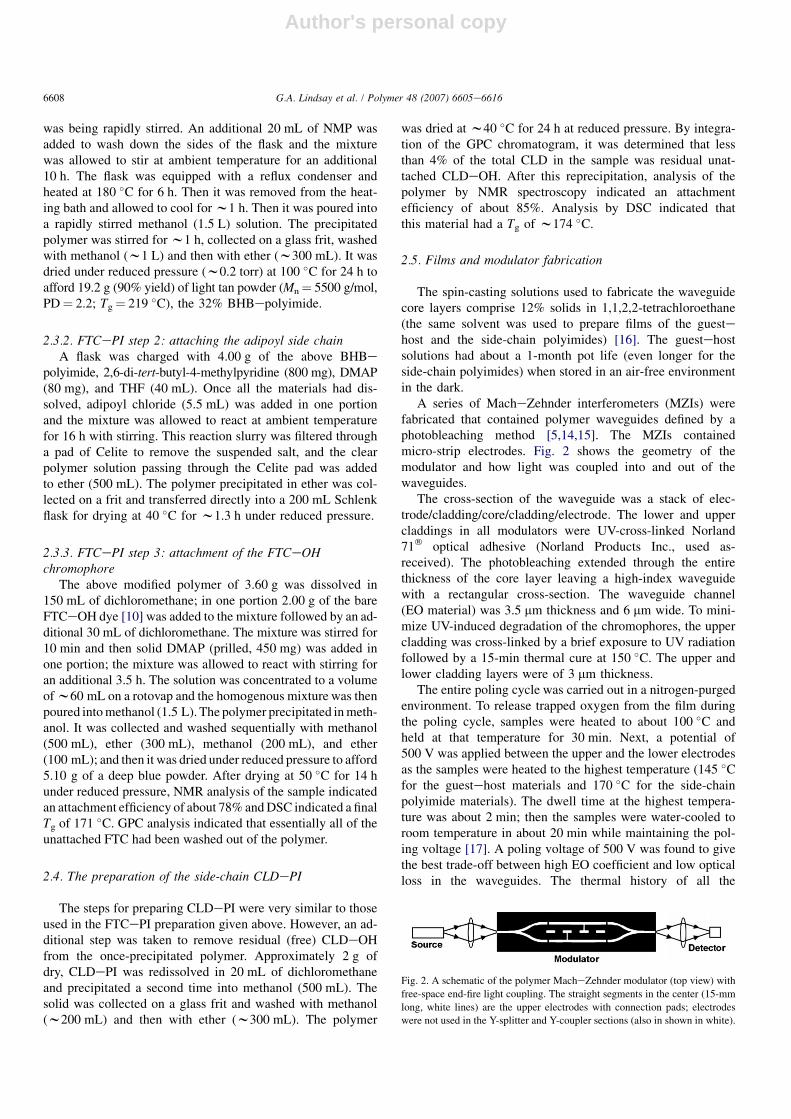
A series of MacheZehnder interferometers (MZIs) werefabricated that contained polymer waveguides defined by aphotobleaching method [5,14,15]. The MZIs containedmicro-strip electrodes. Fig. 2 shows the geometry of themodulator and how light was coupled into and out of thewaveguides.
The cross-section of the waveguide was a stack of elec-trode/cladding/core/cladding/electrode. The lower and uppercladdings in all modulators were UV-cross-linked Norland71� optical adhesive (Norland Products Inc., used as-received). The photobleaching extended through the entirethickness of the core layer leaving a high-index waveguidewith a rectangular cross-section. The waveguide channel(EO material) was 3.5 mm thickness and 6 mm wide. To mini-mize UV-induced degradation of the chromophores, the uppercladding was cross-linked by a brief exposure to UV radiationfollowed by a 15-min thermal cure at 150 �C. The upper andlower cladding layers were of 3 mm thickness.
The entire poling cycle was carried out in a nitrogen-purgedenvironment. To release trapped oxygen from the film duringthe poling cycle, samples were heated to about 100 �C andheld at that temperature for 30 min. Next, a potential of500 V was applied between the upper and the lower electrodesas the samples were heated to the highest temperature (145 �Cfor the guestehost materials and 170 �C for the side-chainpolyimide materials). The dwell time at the highest tempera-ture was about 2 min; then the samples were water-cooled toroom temperature in about 20 min while maintaining the pol-ing voltage [17]. A poling voltage of 500 V was found to givethe best trade-off between high EO coefficient and low opticalloss in the waveguides. The thermal history of all the
Fig. 2. A schematic of the polymer MacheZehnder modulator (top view) with
free-space end-fire light coupling. The straight segments in the center (15-mm
long, white lines) are the upper electrodes with connection pads; electrodes
were not used in the Y-splitter and Y-coupler sections (also in shown in white).
6608 G.A. Lindsay et al. / Polymer 48 (2007) 6605e6616
Author's personal copy
modulators of this study was very similar throughout the initialheating, poling and cooling cycles.
The optical propagation loss (at 1550 nm wavelength) inthe poled modulators was w2.5 dB/cm for the GH materialsand w3.5 dB/cm for the SC materials (the higher value forSC materials could have been decreased, we believe, withmore processing experience). We presumed that there wasno phase separation in the GH materials, because that wouldhave increased light scattering (optical loss) if the domainsize of the phases was greater than 100 nm. The EO coefficient(for single-arm modulation) was w35 pm/V for the FTC-based materials and w39 pm/V for the CLD-based materials.
2.6. Modulator testing
The decrease of the electro-optic coefficient (r33) was moni-tored by the increase in the Vp of the modulator. To make theVp measurements, a light beam (1550 nm wavelength) wascoupled into the waveguide of MacheZehnder interferometerusing a microscope objective (as shown in Fig. 2). A low fre-quency (wDC) linear voltage ramp was applied to modulatethe light in one of the arms. The Vp of the modulator wasdetermined from the observed interference pattern. An initialmeasurement of Vp was made for each device at ambient.Modulators were placed in nitrogen-purged heated ovensfor specified exposure times. A few modulators were storedat ambient temperature in air. Periodically, oven-aged modu-lators were cooled in nitrogen-purged storage containers toroom temperature, after which Vp was measured in air (notmore than 30-min air exposure per measurement). The opti-cal power used for measuring Vp was less than 0.5 mW witha total light exposure time of about 10 min. During thismulti-month oven-aging protocol, the temperature was cycledbetween the oven temperature and the room temperature oneto two dozen times. Back-to-back measurements of Vp wererepeatable to within �0.1 V. Measurements made by differentpeople on different days were repeatable to within �0.3 V.
3. Results and discussion
Before heating MacheZehnder modulators to the oven-aging temperature, the average Vp was w5.5 V for modulatorsbased on CLD and w6.5 V for those based on FTC (see Table 2).The lower Vp of CLD modulators may have been due to CLDs15% larger molecular hyperpolarizability (as calculated viaMOPAC� [18] taking into account the Z to E isomer ratio ofour CLD, which was 26:74 by NMR [9]).
Table 2 shows 1-year room-temperature aging data (aged inair, in the dark) for modulators containing the side-chain poly-imide core materials. All changes in Vp during ambient agingwere within the experimental error of making an individual mea-surement. For guestehost materials (not shown) only 3 monthsof room-temperature aging were available, but the conclusionwas the same (no change within experimental error).
3.1. Comparison of side-chain and guestehost materials
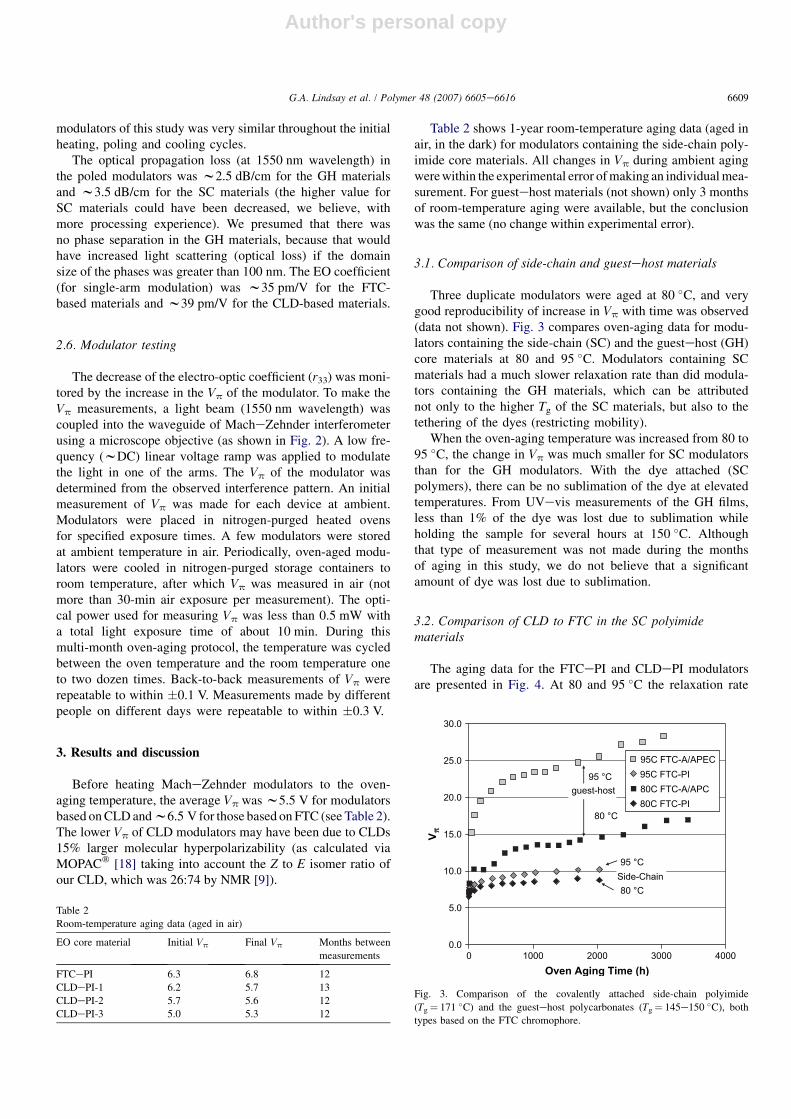
Three duplicate modulators were aged at 80 �C, and verygood reproducibility of increase in Vp with time was observed(data not shown). Fig. 3 compares oven-aging data for modu-lators containing the side-chain (SC) and the guestehost (GH)core materials at 80 and 95 �C. Modulators containing SCmaterials had a much slower relaxation rate than did modula-tors containing the GH materials, which can be attributednot only to the higher Tg of the SC materials, but also to thetethering of the dyes (restricting mobility).
When the oven-aging temperature was increased from 80 to95 �C, the change in Vp was much smaller for SC modulatorsthan for the GH modulators. With the dye attached (SCpolymers), there can be no sublimation of the dye at elevatedtemperatures. From UVevis measurements of the GH films,less than 1% of the dye was lost due to sublimation whileholding the sample for several hours at 150 �C. Althoughthat type of measurement was not made during the monthsof aging in this study, we do not believe that a significantamount of dye was lost due to sublimation.
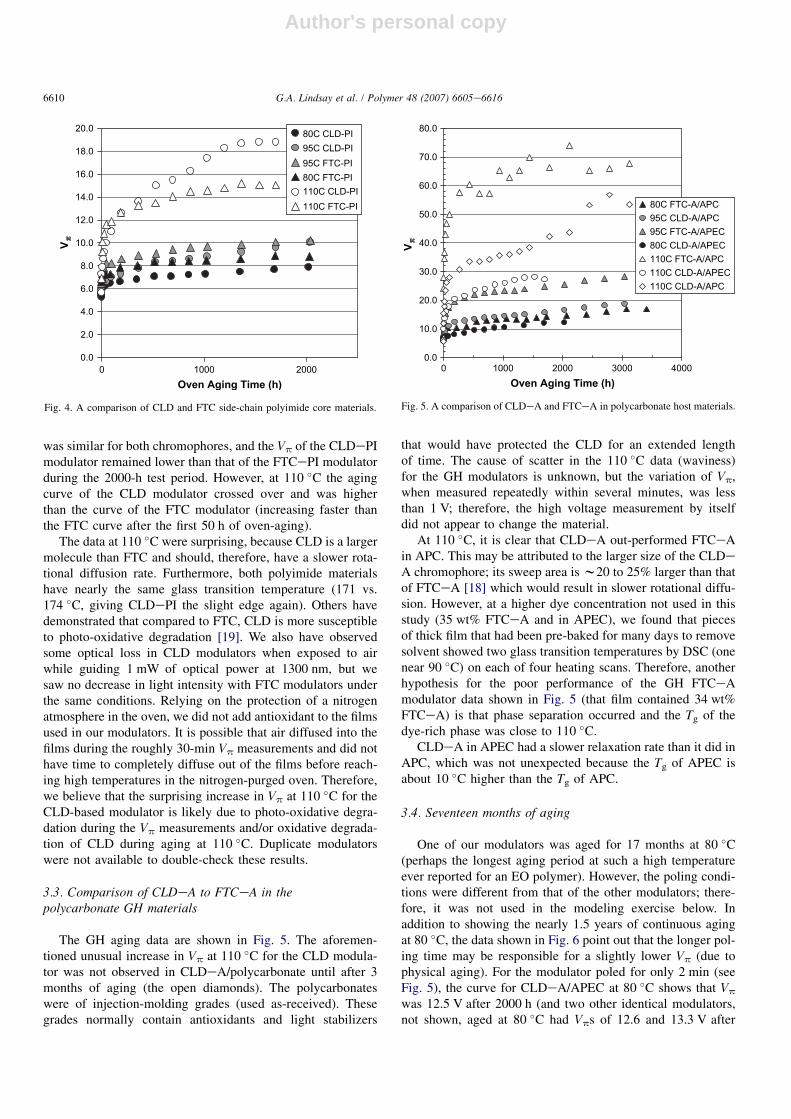
3.2. Comparison of CLD to FTC in the SC polyimidematerials
The aging data for the FTCePI and CLDePI modulatorsare presented in Fig. 4. At 80 and 95 �C the relaxation rate
Table 2
Room-temperature aging data (aged in air)
EO core material Initial Vp Final Vp Months between
measurements
FTCePI 6.3 6.8 12
CLDePI-1 6.2 5.7 13
CLDePI-2 5.7 5.6 12
CLDePI-3 5.0 5.3 12
0.0
5.0
10.0
15.0
20.0
25.0
30.0
0 1000 2000 3000 4000Oven Aging Time (h)
V
95C FTC-A/APEC95C FTC-PI80C FTC-A/APC80C FTC-PI
guest-host
80 °C
95 °C
Side-Chain80 °C
95 °C
Fig. 3. Comparison of the covalently attached side-chain polyimide
(Tg¼ 171 �C) and the guestehost polycarbonates (Tg¼ 145e150 �C), both
types based on the FTC chromophore.
6609G.A. Lindsay et al. / Polymer 48 (2007) 6605e6616
Author's personal copy
was similar for both chromophores, and the Vp of the CLDePImodulator remained lower than that of the FTCePI modulatorduring the 2000-h test period. However, at 110 �C the agingcurve of the CLD modulator crossed over and was higherthan the curve of the FTC modulator (increasing faster thanthe FTC curve after the first 50 h of oven-aging).
The data at 110 �C were surprising, because CLD is a largermolecule than FTC and should, therefore, have a slower rota-tional diffusion rate. Furthermore, both polyimide materialshave nearly the same glass transition temperature (171 vs.174 �C, giving CLDePI the slight edge again). Others havedemonstrated that compared to FTC, CLD is more susceptibleto photo-oxidative degradation [19]. We also have observedsome optical loss in CLD modulators when exposed to airwhile guiding 1 mW of optical power at 1300 nm, but wesaw no decrease in light intensity with FTC modulators underthe same conditions. Relying on the protection of a nitrogenatmosphere in the oven, we did not add antioxidant to the filmsused in our modulators. It is possible that air diffused into thefilms during the roughly 30-min Vp measurements and did nothave time to completely diffuse out of the films before reach-ing high temperatures in the nitrogen-purged oven. Therefore,we believe that the surprising increase in Vp at 110 �C for theCLD-based modulator is likely due to photo-oxidative degra-dation during the Vp measurements and/or oxidative degrada-tion of CLD during aging at 110 �C. Duplicate modulatorswere not available to double-check these results.
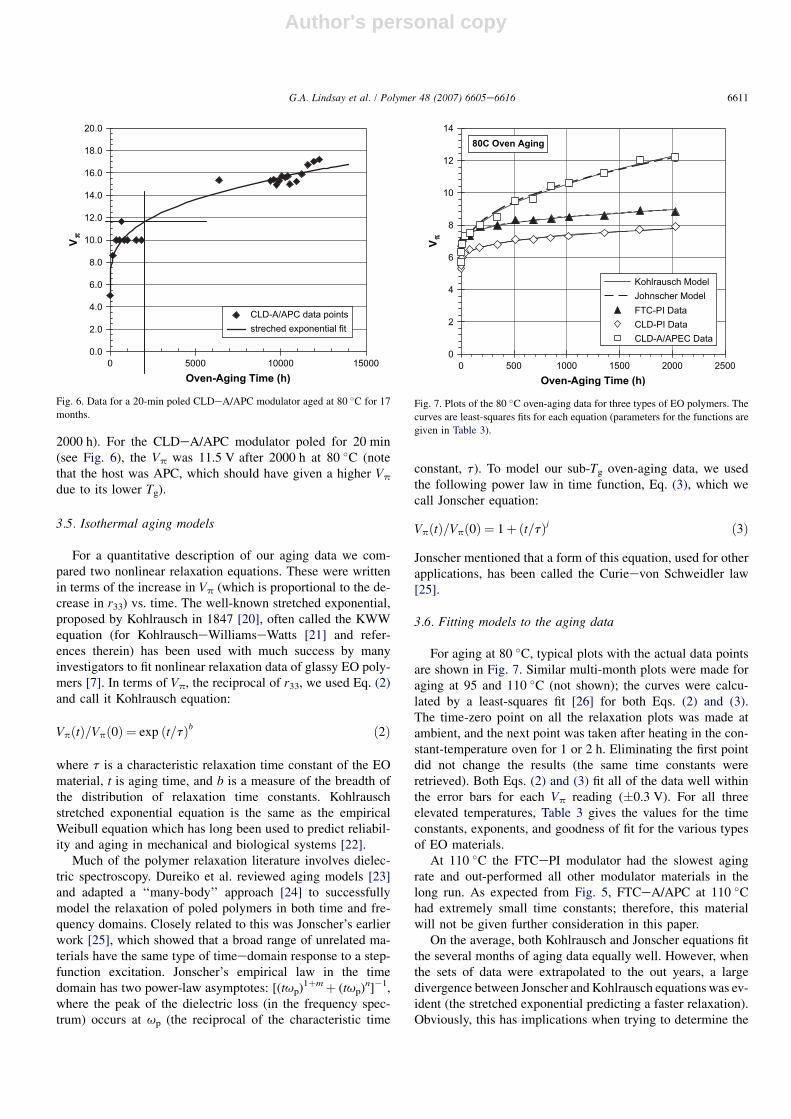
3.3. Comparison of CLDeA to FTCeA in thepolycarbonate GH materials
The GH aging data are shown in Fig. 5. The aforemen-tioned unusual increase in Vp at 110 �C for the CLD modula-tor was not observed in CLDeA/polycarbonate until after 3months of aging (the open diamonds). The polycarbonateswere of injection-molding grades (used as-received). Thesegrades normally contain antioxidants and light stabilizers
that would have protected the CLD for an extended lengthof time. The cause of scatter in the 110 �C data (waviness)for the GH modulators is unknown, but the variation of Vp,when measured repeatedly within several minutes, was lessthan 1 V; therefore, the high voltage measurement by itselfdid not appear to change the material.
At 110 �C, it is clear that CLDeA out-performed FTCeAin APC. This may be attributed to the larger size of the CLDeA chromophore; its sweep area is w20 to 25% larger than thatof FTCeA [18] which would result in slower rotational diffu-sion. However, at a higher dye concentration not used in thisstudy (35 wt% FTCeA and in APEC), we found that piecesof thick film that had been pre-baked for many days to removesolvent showed two glass transition temperatures by DSC (onenear 90 �C) on each of four heating scans. Therefore, anotherhypothesis for the poor performance of the GH FTCeAmodulator data shown in Fig. 5 (that film contained 34 wt%FTCeA) is that phase separation occurred and the Tg of thedye-rich phase was close to 110 �C.
CLDeA in APEC had a slower relaxation rate than it did inAPC, which was not unexpected because the Tg of APEC isabout 10 �C higher than the Tg of APC.
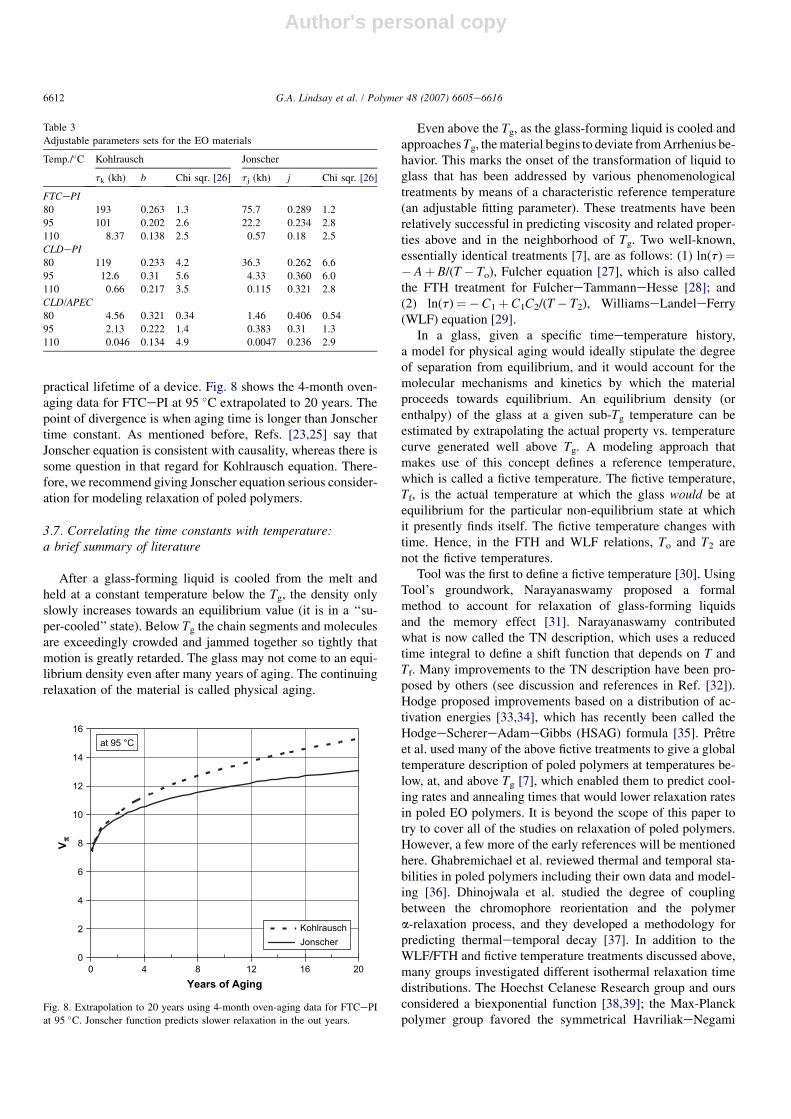
3.4. Seventeen months of aging
One of our modulators was aged for 17 months at 80 �C(perhaps the longest aging period at such a high temperatureever reported for an EO polymer). However, the poling condi-tions were different from that of the other modulators; there-fore, it was not used in the modeling exercise below. Inaddition to showing the nearly 1.5 years of continuous agingat 80 �C, the data shown in Fig. 6 point out that the longer pol-ing time may be responsible for a slightly lower Vp (due tophysical aging). For the modulator poled for only 2 min (seeFig. 5), the curve for CLDeA/APEC at 80 �C shows that Vp
was 12.5 V after 2000 h (and two other identical modulators,not shown, aged at 80 �C had Vps of 12.6 and 13.3 V after
0.0
2.0
4.0
6.0
8.0
10.0
12.0
14.0
16.0
18.0
20.0
0 1000 2000Oven Aging Time (h)
V
80C CLD-PI95C CLD-PI95C FTC-PI80C FTC-PI110C CLD-PI110C FTC-PI
Fig. 4. A comparison of CLD and FTC side-chain polyimide core materials.
0.0
10.0
20.0
30.0
40.0
50.0
60.0
70.0
80.0
0 1000 2000 3000 4000Oven Aging Time (h)
V
80C FTC-A/APC95C CLD-A/APC 95C FTC-A/APEC80C CLD-A/APEC110C FTC-A/APC110C CLD-A/APEC110C CLD-A/APC
Fig. 5. A comparison of CLDeA and FTCeA in polycarbonate host materials.
6610 G.A. Lindsay et al. / Polymer 48 (2007) 6605e6616
Author's personal copy
2000 h). For the CLDeA/APC modulator poled for 20 min(see Fig. 6), the Vp was 11.5 V after 2000 h at 80 �C (notethat the host was APC, which should have given a higher Vp
due to its lower Tg).
3.5. Isothermal aging models
For a quantitative description of our aging data we com-pared two nonlinear relaxation equations. These were writtenin terms of the increase in Vp (which is proportional to the de-crease in r33) vs. time. The well-known stretched exponential,proposed by Kohlrausch in 1847 [20], often called the KWWequation (for KohlrauscheWilliamseWatts [21] and refer-ences therein) has been used with much success by manyinvestigators to fit nonlinear relaxation data of glassy EO poly-mers [7]. In terms of Vp, the reciprocal of r33, we used Eq. (2)and call it Kohlrausch equation:
VpðtÞ=Vpð0Þ ¼ exp ðt=tÞb ð2Þ
where t is a characteristic relaxation time constant of the EOmaterial, t is aging time, and b is a measure of the breadth ofthe distribution of relaxation time constants. Kohlrauschstretched exponential equation is the same as the empiricalWeibull equation which has long been used to predict reliabil-ity and aging in mechanical and biological systems [22].
Much of the polymer relaxation literature involves dielec-tric spectroscopy. Dureiko et al. reviewed aging models [23]and adapted a ‘‘many-body’’ approach [24] to successfullymodel the relaxation of poled polymers in both time and fre-quency domains. Closely related to this was Jonscher’s earlierwork [25], which showed that a broad range of unrelated ma-terials have the same type of timeedomain response to a step-function excitation. Jonscher’s empirical law in the timedomain has two power-law asymptotes: [(tup)1þmþ (tup)n]�1,where the peak of the dielectric loss (in the frequency spec-trum) occurs at up (the reciprocal of the characteristic time
constant, t). To model our sub-Tg oven-aging data, we usedthe following power law in time function, Eq. (3), which wecall Jonscher equation:
VpðtÞ=Vpð0Þ ¼ 1þ ðt=tÞj ð3Þ
Jonscher mentioned that a form of this equation, used for otherapplications, has been called the Curieevon Schweidler law[25].
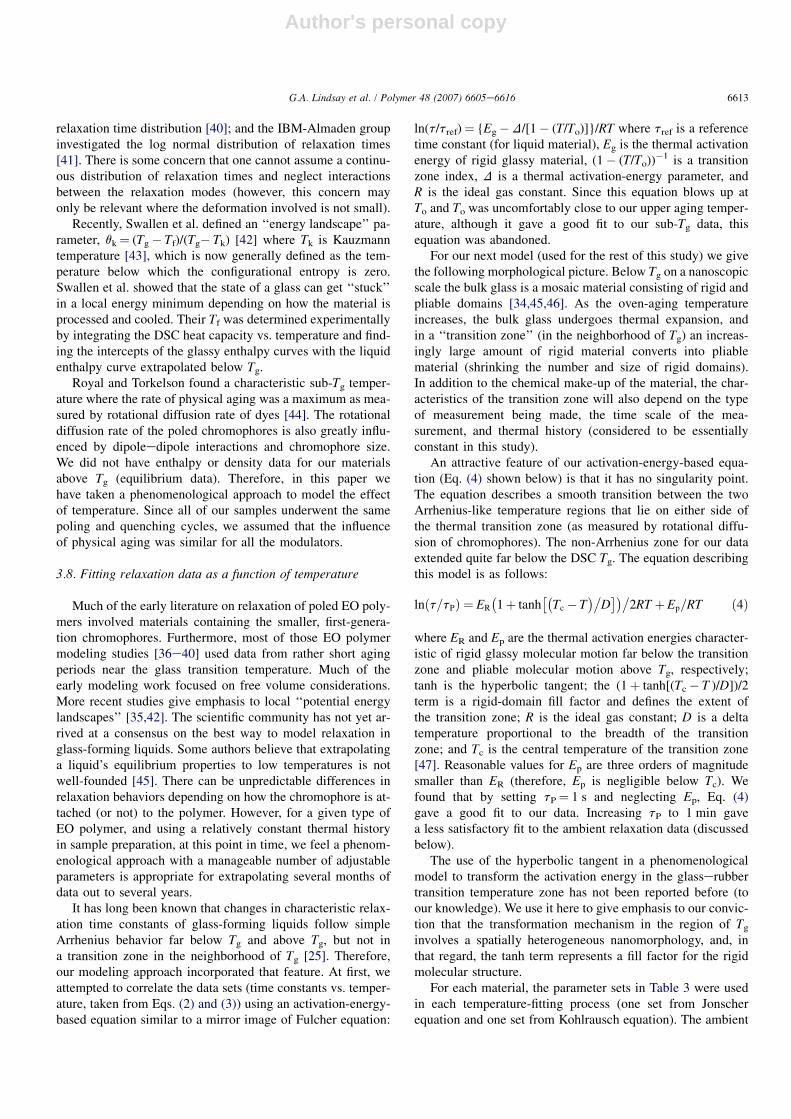
3.6. Fitting models to the aging data
For aging at 80 �C, typical plots with the actual data pointsare shown in Fig. 7. Similar multi-month plots were made foraging at 95 and 110 �C (not shown); the curves were calcu-lated by a least-squares fit [26] for both Eqs. (2) and (3).The time-zero point on all the relaxation plots was made atambient, and the next point was taken after heating in the con-stant-temperature oven for 1 or 2 h. Eliminating the first pointdid not change the results (the same time constants wereretrieved). Both Eqs. (2) and (3) fit all of the data well withinthe error bars for each Vp reading (�0.3 V). For all threeelevated temperatures, Table 3 gives the values for the timeconstants, exponents, and goodness of fit for the various typesof EO materials.
At 110 �C the FTCePI modulator had the slowest agingrate and out-performed all other modulator materials in thelong run. As expected from Fig. 5, FTCeA/APC at 110 �Chad extremely small time constants; therefore, this materialwill not be given further consideration in this paper.
On the average, both Kohlrausch and Jonscher equations fitthe several months of aging data equally well. However, whenthe sets of data were extrapolated to the out years, a largedivergence between Jonscher and Kohlrausch equations was ev-ident (the stretched exponential predicting a faster relaxation).Obviously, this has implications when trying to determine the
0.0
2.0
4.0
6.0
8.0
10.0
12.0
14.0
16.0
18.0
20.0
0 5000 10000 15000Oven-Aging Time (h)
V
CLD-A/APC data pointsstreched exponential fit
Fig. 6. Data for a 20-min poled CLDeA/APC modulator aged at 80 �C for 17
months.
80C Oven Aging
0
2
4
6
8
10
12
14
0 500 1000 1500 2000 2500Oven-Aging Time (h)
V
Kohlrausch ModelJohnscher ModelFTC-PI DataCLD-PI DataCLD-A/APEC Data
Fig. 7. Plots of the 80 �C oven-aging data for three types of EO polymers. The
curves are least-squares fits for each equation (parameters for the functions are
given in Table 3).
6611G.A. Lindsay et al. / Polymer 48 (2007) 6605e6616
Author's personal copy
practical lifetime of a device. Fig. 8 shows the 4-month oven-aging data for FTCePI at 95 �C extrapolated to 20 years. Thepoint of divergence is when aging time is longer than Jonschertime constant. As mentioned before, Refs. [23,25] say thatJonscher equation is consistent with causality, whereas there issome question in that regard for Kohlrausch equation. There-fore, we recommend giving Jonscher equation serious consider-ation for modeling relaxation of poled polymers.
3.7. Correlating the time constants with temperature:a brief summary of literature
After a glass-forming liquid is cooled from the melt andheld at a constant temperature below the Tg, the density onlyslowly increases towards an equilibrium value (it is in a ‘‘su-per-cooled’’ state). Below Tg the chain segments and moleculesare exceedingly crowded and jammed together so tightly thatmotion is greatly retarded. The glass may not come to an equi-librium density even after many years of aging. The continuingrelaxation of the material is called physical aging.
Even above the Tg, as the glass-forming liquid is cooled andapproaches Tg, the material begins to deviate from Arrhenius be-havior. This marks the onset of the transformation of liquid toglass that has been addressed by various phenomenologicaltreatments by means of a characteristic reference temperature(an adjustable fitting parameter). These treatments have beenrelatively successful in predicting viscosity and related proper-ties above and in the neighborhood of Tg. Two well-known,essentially identical treatments [7], are as follows: (1) ln(t)¼� Aþ B/(T� To), Fulcher equation [27], which is also calledthe FTH treatment for FulchereTammanneHesse [28]; and(2) ln(t)¼� C1þ C1C2/(T� T2), WilliamseLandeleFerry(WLF) equation [29].
In a glass, given a specific timeetemperature history,a model for physical aging would ideally stipulate the degreeof separation from equilibrium, and it would account for themolecular mechanisms and kinetics by which the materialproceeds towards equilibrium. An equilibrium density (orenthalpy) of the glass at a given sub-Tg temperature can beestimated by extrapolating the actual property vs. temperaturecurve generated well above Tg. A modeling approach thatmakes use of this concept defines a reference temperature,which is called a fictive temperature. The fictive temperature,Tf, is the actual temperature at which the glass would be atequilibrium for the particular non-equilibrium state at whichit presently finds itself. The fictive temperature changes withtime. Hence, in the FTH and WLF relations, To and T2 arenot the fictive temperatures.
Tool was the first to define a fictive temperature [30]. UsingTool’s groundwork, Narayanaswamy proposed a formalmethod to account for relaxation of glass-forming liquidsand the memory effect [31]. Narayanaswamy contributedwhat is now called the TN description, which uses a reducedtime integral to define a shift function that depends on T andTf. Many improvements to the TN description have been pro-posed by others (see discussion and references in Ref. [32]).Hodge proposed improvements based on a distribution of ac-tivation energies [33,34], which has recently been called theHodgeeScherereAdameGibbs (HSAG) formula [35]. Pretreet al. used many of the above fictive treatments to give a globaltemperature description of poled polymers at temperatures be-low, at, and above Tg [7], which enabled them to predict cool-ing rates and annealing times that would lower relaxation ratesin poled EO polymers. It is beyond the scope of this paper totry to cover all of the studies on relaxation of poled polymers.However, a few more of the early references will be mentionedhere. Ghabremichael et al. reviewed thermal and temporal sta-bilities in poled polymers including their own data and model-ing [36]. Dhinojwala et al. studied the degree of couplingbetween the chromophore reorientation and the polymera-relaxation process, and they developed a methodology forpredicting thermaletemporal decay [37]. In addition to theWLF/FTH and fictive temperature treatments discussed above,many groups investigated different isothermal relaxation timedistributions. The Hoechst Celanese Research group and oursconsidered a biexponential function [38,39]; the Max-Planckpolymer group favored the symmetrical HavriliakeNegami
0
2
4
6
8
10
12
14
16
0 4 8 12 16 20Years of Aging
at 95 °C
KohlrauschJonscher
V
Fig. 8. Extrapolation to 20 years using 4-month oven-aging data for FTCePI
at 95 �C. Jonscher function predicts slower relaxation in the out years.
Table 3
Adjustable parameters sets for the EO materials
Temp./�C Kohlrausch Jonscher
tk (kh) b Chi sqr. [26] tj (kh) j Chi sqr. [26]
FTCePI
80 193 0.263 1.3 75.7 0.289 1.2
95 101 0.202 2.6 22.2 0.234 2.8
110 8.37 0.138 2.5 0.57 0.18 2.5
CLDePI
80 119 0.233 4.2 36.3 0.262 6.6
95 12.6 0.31 5.6 4.33 0.360 6.0
110 0.66 0.217 3.5 0.115 0.321 2.8
CLD/APEC
80 4.56 0.321 0.34 1.46 0.406 0.54
95 2.13 0.222 1.4 0.383 0.31 1.3
110 0.046 0.134 4.9 0.0047 0.236 2.9
6612 G.A. Lindsay et al. / Polymer 48 (2007) 6605e6616
Author's personal copy
relaxation time distribution [40]; and the IBM-Almaden groupinvestigated the log normal distribution of relaxation times[41]. There is some concern that one cannot assume a continu-ous distribution of relaxation times and neglect interactionsbetween the relaxation modes (however, this concern mayonly be relevant where the deformation involved is not small).
Recently, Swallen et al. defined an ‘‘energy landscape’’ pa-rameter, qk¼ (Tg� Tf)/(Tg� Tk) [42] where Tk is Kauzmanntemperature [43], which is now generally defined as the tem-perature below which the configurational entropy is zero.Swallen et al. showed that the state of a glass can get ‘‘stuck’’in a local energy minimum depending on how the material isprocessed and cooled. Their Tf was determined experimentallyby integrating the DSC heat capacity vs. temperature and find-ing the intercepts of the glassy enthalpy curves with the liquidenthalpy curve extrapolated below Tg.
Royal and Torkelson found a characteristic sub-Tg temper-ature where the rate of physical aging was a maximum as mea-sured by rotational diffusion rate of dyes [44]. The rotationaldiffusion rate of the poled chromophores is also greatly influ-enced by dipoleedipole interactions and chromophore size.We did not have enthalpy or density data for our materialsabove Tg (equilibrium data). Therefore, in this paper wehave taken a phenomenological approach to model the effectof temperature. Since all of our samples underwent the samepoling and quenching cycles, we assumed that the influenceof physical aging was similar for all the modulators.
3.8. Fitting relaxation data as a function of temperature
Much of the early literature on relaxation of poled EO poly-mers involved materials containing the smaller, first-genera-tion chromophores. Furthermore, most of those EO polymermodeling studies [36e40] used data from rather short agingperiods near the glass transition temperature. Much of theearly modeling work focused on free volume considerations.More recent studies give emphasis to local ‘‘potential energylandscapes’’ [35,42]. The scientific community has not yet ar-rived at a consensus on the best way to model relaxation inglass-forming liquids. Some authors believe that extrapolatinga liquid’s equilibrium properties to low temperatures is notwell-founded [45]. There can be unpredictable differences inrelaxation behaviors depending on how the chromophore is at-tached (or not) to the polymer. However, for a given type ofEO polymer, and using a relatively constant thermal historyin sample preparation, at this point in time, we feel a phenom-enological approach with a manageable number of adjustableparameters is appropriate for extrapolating several months ofdata out to several years.
It has long been known that changes in characteristic relax-ation time constants of glass-forming liquids follow simpleArrhenius behavior far below Tg and above Tg, but not ina transition zone in the neighborhood of Tg [25]. Therefore,our modeling approach incorporated that feature. At first, weattempted to correlate the data sets (time constants vs. temper-ature, taken from Eqs. (2) and (3)) using an activation-energy-based equation similar to a mirror image of Fulcher equation:
ln(t/tref)¼ {Eg�D/[1� (T/To)]}/RT where tref is a referencetime constant (for liquid material), Eg is the thermal activationenergy of rigid glassy material, (1� (T/To))�1 is a transitionzone index, D is a thermal activation-energy parameter, andR is the ideal gas constant. Since this equation blows up atTo and To was uncomfortably close to our upper aging temper-ature, although it gave a good fit to our sub-Tg data, thisequation was abandoned.
For our next model (used for the rest of this study) we givethe following morphological picture. Below Tg on a nanoscopicscale the bulk glass is a mosaic material consisting of rigid andpliable domains [34,45,46]. As the oven-aging temperatureincreases, the bulk glass undergoes thermal expansion, andin a ‘‘transition zone’’ (in the neighborhood of Tg) an increas-ingly large amount of rigid material converts into pliablematerial (shrinking the number and size of rigid domains).In addition to the chemical make-up of the material, the char-acteristics of the transition zone will also depend on the typeof measurement being made, the time scale of the mea-surement, and thermal history (considered to be essentiallyconstant in this study).
An attractive feature of our activation-energy-based equa-tion (Eq. (4) shown below) is that it has no singularity point.The equation describes a smooth transition between the twoArrhenius-like temperature regions that lie on either side ofthe thermal transition zone (as measured by rotational diffu-sion of chromophores). The non-Arrhenius zone for our dataextended quite far below the DSC Tg. The equation describingthis model is as follows:
lnðt=tPÞ ¼ ER
�1þ tanh
��Tc � T
��D���
2RT þEp=RT ð4Þ
where ER and Ep are the thermal activation energies character-istic of rigid glassy molecular motion far below the transitionzone and pliable molecular motion above Tg, respectively;tanh is the hyperbolic tangent; the (1þ tanh[(Tc� T )/D])/2term is a rigid-domain fill factor and defines the extent ofthe transition zone; R is the ideal gas constant; D is a deltatemperature proportional to the breadth of the transitionzone; and Tc is the central temperature of the transition zone[47]. Reasonable values for Ep are three orders of magnitudesmaller than ER (therefore, Ep is negligible below Tc). Wefound that by setting tP¼ 1 s and neglecting Ep, Eq. (4)gave a good fit to our data. Increasing tP to 1 min gavea less satisfactory fit to the ambient relaxation data (discussedbelow).
The use of the hyperbolic tangent in a phenomenologicalmodel to transform the activation energy in the glasserubbertransition temperature zone has not been reported before (toour knowledge). We use it here to give emphasis to our convic-tion that the transformation mechanism in the region of Tg
involves a spatially heterogeneous nanomorphology, and, inthat regard, the tanh term represents a fill factor for the rigidmolecular structure.
For each material, the parameter sets in Table 3 were usedin each temperature-fitting process (one set from Jonscherequation and one set from Kohlrausch equation). The ambient
6613G.A. Lindsay et al. / Polymer 48 (2007) 6605e6616
Author's personal copy
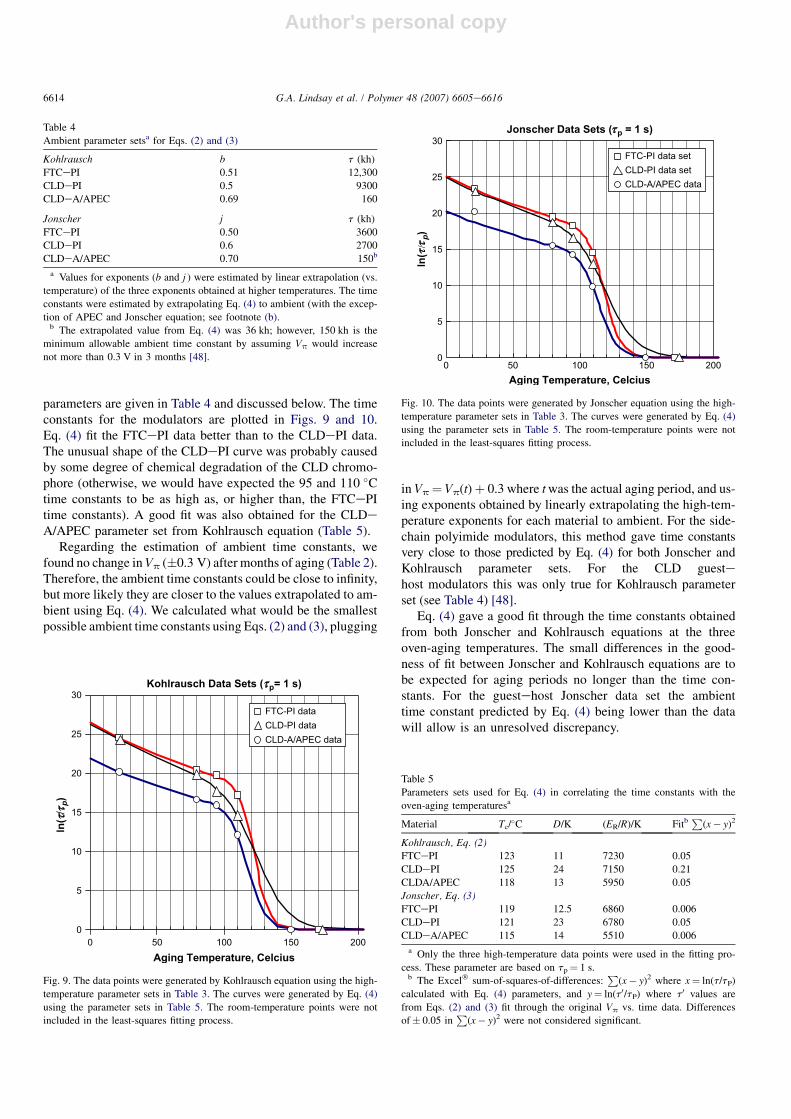
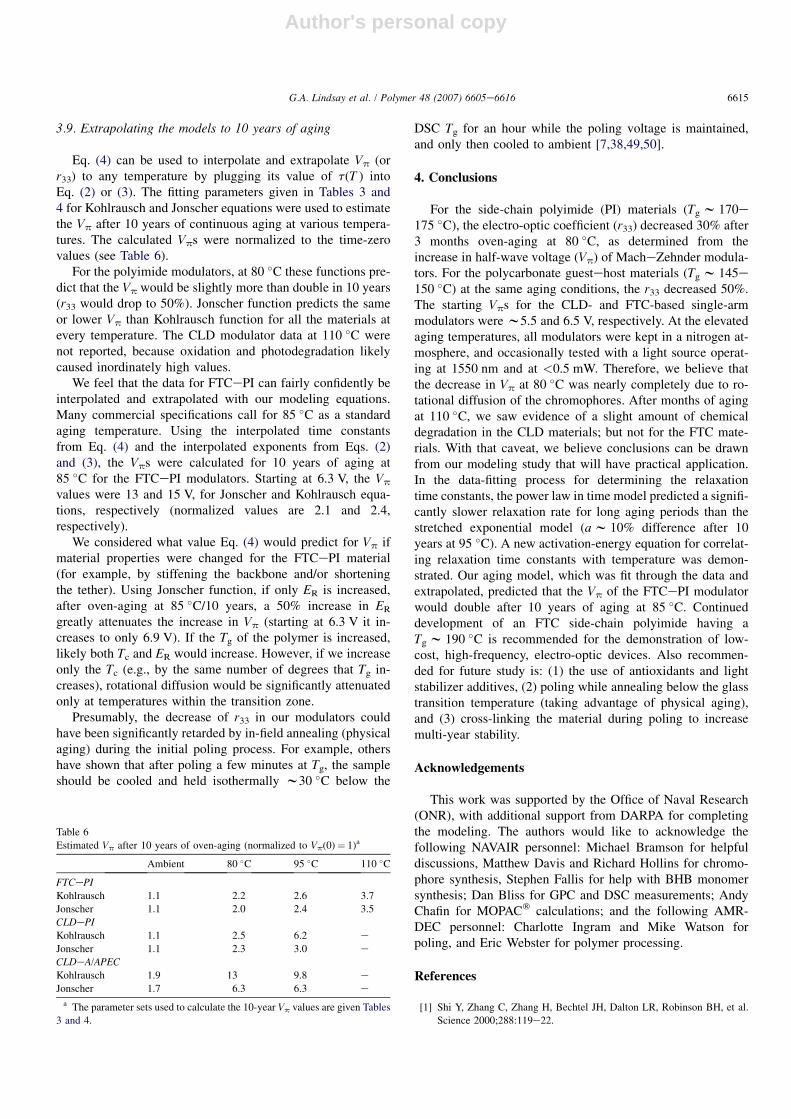
parameters are given in Table 4 and discussed below. The timeconstants for the modulators are plotted in Figs. 9 and 10.Eq. (4) fit the FTCePI data better than to the CLDePI data.The unusual shape of the CLDePI curve was probably causedby some degree of chemical degradation of the CLD chromo-phore (otherwise, we would have expected the 95 and 110 �Ctime constants to be as high as, or higher than, the FTCePItime constants). A good fit was also obtained for the CLDeA/APEC parameter set from Kohlrausch equation (Table 5).
Regarding the estimation of ambient time constants, wefound no change in Vp (�0.3 V) after months of aging (Table 2).Therefore, the ambient time constants could be close to infinity,but more likely they are closer to the values extrapolated to am-bient using Eq. (4). We calculated what would be the smallestpossible ambient time constants using Eqs. (2) and (3), plugging
in Vp¼ Vp(t)þ 0.3 where t was the actual aging period, and us-ing exponents obtained by linearly extrapolating the high-tem-perature exponents for each material to ambient. For the side-chain polyimide modulators, this method gave time constantsvery close to those predicted by Eq. (4) for both Jonscher andKohlrausch parameter sets. For the CLD guestehost modulators this was only true for Kohlrausch parameterset (see Table 4) [48].
Eq. (4) gave a good fit through the time constants obtainedfrom both Jonscher and Kohlrausch equations at the threeoven-aging temperatures. The small differences in the good-ness of fit between Jonscher and Kohlrausch equations are tobe expected for aging periods no longer than the time con-stants. For the guestehost Jonscher data set the ambienttime constant predicted by Eq. (4) being lower than the datawill allow is an unresolved discrepancy.
Table 4
Ambient parameter setsa for Eqs. (2) and (3)
Kohlrausch b t (kh)
FTCePI 0.51 12,300
CLDePI 0.5 9300
CLDeA/APEC 0.69 160
Jonscher j t (kh)
FTCePI 0.50 3600
CLDePI 0.6 2700
CLDeA/APEC 0.70 150b
a Values for exponents (b and j ) were estimated by linear extrapolation (vs.
temperature) of the three exponents obtained at higher temperatures. The time
constants were estimated by extrapolating Eq. (4) to ambient (with the excep-
tion of APEC and Jonscher equation; see footnote (b).b The extrapolated value from Eq. (4) was 36 kh; however, 150 kh is the
minimum allowable ambient time constant by assuming Vp would increase
not more than 0.3 V in 3 months [48].
Kohlrausch Data Sets ( p= 1 s)
0
5
10
15
20
25
30
0 50 100 150 200Aging Temperature, Celcius
ln
( /
p)
FTC-PI dataCLD-PI dataCLD-A/APEC data
Fig. 9. The data points were generated by Kohlrausch equation using the high-
temperature parameter sets in Table 3. The curves were generated by Eq. (4)
using the parameter sets in Table 5. The room-temperature points were not
included in the least-squares fitting process.
Jonscher Data Sets ( p = 1 s)
0
5
10
15
20
25
30
0 50 100 150 200Aging Temperature, Celcius
ln
( / p)
FTC-PI data setCLD-PI data setCLD-A/APEC data
Fig. 10. The data points were generated by Jonscher equation using the high-
temperature parameter sets in Table 3. The curves were generated by Eq. (4)
using the parameter sets in Table 5. The room-temperature points were not
included in the least-squares fitting process.
Table 5
Parameters sets used for Eq. (4) in correlating the time constants with the
oven-aging temperaturesa
Material Tc/�C D/K (ER/R)/K Fitb
P(x� y)2
Kohlrausch, Eq. (2)FTCePI 123 11 7230 0.05
CLDePI 125 24 7150 0.21
CLDA/APEC 118 13 5950 0.05
Jonscher, Eq. (3)FTCePI 119 12.5 6860 0.006
CLDePI 121 23 6780 0.05
CLDeA/APEC 115 14 5510 0.006
a Only the three high-temperature data points were used in the fitting pro-
cess. These parameter are based on tp¼ 1 s.b The Excel� sum-of-squares-of-differences:
P(x� y)2 where x¼ ln(t/tP)
calculated with Eq. (4) parameters, and y¼ ln(t0/tP) where t0 values are
from Eqs. (2) and (3) fit through the original Vp vs. time data. Differences
of� 0.05 inP
(x� y)2 were not considered significant.
6614 G.A. Lindsay et al. / Polymer 48 (2007) 6605e6616
Author's personal copy
3.9. Extrapolating the models to 10 years of aging
Eq. (4) can be used to interpolate and extrapolate Vp (orr33) to any temperature by plugging its value of t(T ) intoEq. (2) or (3). The fitting parameters given in Tables 3 and4 for Kohlrausch and Jonscher equations were used to estimatethe Vp after 10 years of continuous aging at various tempera-tures. The calculated Vps were normalized to the time-zerovalues (see Table 6).
For the polyimide modulators, at 80 �C these functions pre-dict that the Vp would be slightly more than double in 10 years(r33 would drop to 50%). Jonscher function predicts the sameor lower Vp than Kohlrausch function for all the materials atevery temperature. The CLD modulator data at 110 �C werenot reported, because oxidation and photodegradation likelycaused inordinately high values.
We feel that the data for FTCePI can fairly confidently beinterpolated and extrapolated with our modeling equations.Many commercial specifications call for 85 �C as a standardaging temperature. Using the interpolated time constantsfrom Eq. (4) and the interpolated exponents from Eqs. (2)and (3), the Vps were calculated for 10 years of aging at85 �C for the FTCePI modulators. Starting at 6.3 V, the Vp
values were 13 and 15 V, for Jonscher and Kohlrausch equa-tions, respectively (normalized values are 2.1 and 2.4,respectively).
We considered what value Eq. (4) would predict for Vp ifmaterial properties were changed for the FTCePI material(for example, by stiffening the backbone and/or shorteningthe tether). Using Jonscher function, if only ER is increased,after oven-aging at 85 �C/10 years, a 50% increase in ER
greatly attenuates the increase in Vp (starting at 6.3 V it in-creases to only 6.9 V). If the Tg of the polymer is increased,likely both Tc and ER would increase. However, if we increaseonly the Tc (e.g., by the same number of degrees that Tg in-creases), rotational diffusion would be significantly attenuatedonly at temperatures within the transition zone.
Presumably, the decrease of r33 in our modulators couldhave been significantly retarded by in-field annealing (physicalaging) during the initial poling process. For example, othershave shown that after poling a few minutes at Tg, the sampleshould be cooled and held isothermally w30 �C below the
DSC Tg for an hour while the poling voltage is maintained,and only then cooled to ambient [7,38,49,50].
4. Conclusions
For the side-chain polyimide (PI) materials (Tg w 170e175 �C), the electro-optic coefficient (r33) decreased 30% after3 months oven-aging at 80 �C, as determined from theincrease in half-wave voltage (Vp) of MacheZehnder modula-tors. For the polycarbonate guestehost materials (Tg w 145e150 �C) at the same aging conditions, the r33 decreased 50%.The starting Vps for the CLD- and FTC-based single-armmodulators were w5.5 and 6.5 V, respectively. At the elevatedaging temperatures, all modulators were kept in a nitrogen at-mosphere, and occasionally tested with a light source operat-ing at 1550 nm and at <0.5 mW. Therefore, we believe thatthe decrease in Vp at 80 �C was nearly completely due to ro-tational diffusion of the chromophores. After months of agingat 110 �C, we saw evidence of a slight amount of chemicaldegradation in the CLD materials; but not for the FTC mate-rials. With that caveat, we believe conclusions can be drawnfrom our modeling study that will have practical application.In the data-fitting process for determining the relaxationtime constants, the power law in time model predicted a signifi-cantly slower relaxation rate for long aging periods than thestretched exponential model (a w 10% difference after 10years at 95 �C). A new activation-energy equation for correlat-ing relaxation time constants with temperature was demon-strated. Our aging model, which was fit through the data andextrapolated, predicted that the Vp of the FTCePI modulatorwould double after 10 years of aging at 85 �C. Continueddevelopment of an FTC side-chain polyimide having aTg w 190 �C is recommended for the demonstration of low-cost, high-frequency, electro-optic devices. Also recommen-ded for future study is: (1) the use of antioxidants and lightstabilizer additives, (2) poling while annealing below the glasstransition temperature (taking advantage of physical aging),and (3) cross-linking the material during poling to increasemulti-year stability.
Acknowledgements
This work was supported by the Office of Naval Research(ONR), with additional support from DARPA for completingthe modeling. The authors would like to acknowledge thefollowing NAVAIR personnel: Michael Bramson for helpfuldiscussions, Matthew Davis and Richard Hollins for chromo-phore synthesis, Stephen Fallis for help with BHB monomersynthesis; Dan Bliss for GPC and DSC measurements; AndyChafin for MOPAC� calculations; and the following AMR-DEC personnel: Charlotte Ingram and Mike Watson forpoling, and Eric Webster for polymer processing.
References
[1] Shi Y, Zhang C, Zhang H, Bechtel JH, Dalton LR, Robinson BH, et al.
Science 2000;288:119e22.
Table 6
Estimated Vp after 10 years of oven-aging (normalized to Vp(0)¼ 1)a
Ambient 80 �C 95 �C 110 �C
FTCePI
Kohlrausch 1.1 2.2 2.6 3.7
Jonscher 1.1 2.0 2.4 3.5
CLDePI
Kohlrausch 1.1 2.5 6.2 e
Jonscher 1.1 2.3 3.0 eCLDeA/APEC
Kohlrausch 1.9 13 9.8 e
Jonscher 1.7 6.3 6.3 e
a The parameter sets used to calculate the 10-year Vp values are given Tables
3 and 4.
6615G.A. Lindsay et al. / Polymer 48 (2007) 6605e6616
Author's personal copy
[2] Bortnik B, Hung YC, Tazawa H, Seo BJ, Luo J, Jen A, et al. IEEE J Sel
Top Quant Electron 2007;13:104e10.
[3] Dalton LR, Steier WH, Robinson BH, Zhang C, Ren A, Garner S, et al.
J Mater Chem 1999;9:1905e20.
[4] Robinson BH, Dalton LR, Harper AW, Ren A, Wang F, Zhang C, et al.
Chem Phys 1999;245:35e50.
[5] Ashley PR, Temmen MG, Diffey WM, Sanghadasa M, Bramson MD,
Lindsay GA, et al. Proc SPIE 2006;6314: 63140J-1-11.
[6] Mortazavi MA, Knoesen A, Kowel ST, Henry RA, Hoover JM,
Lindsay GA. Appl Phys B 1991;53:287e95.
[7] Pretre P, Meier U, Stalder U, Bosshard C, Gunter P, Kaatz P, et al.
Macromolecules 1998;31:1947e57.
[8] Park HP, Lee CH, Herman WN. Opt Express 2006;14:8866e84 and
references therein.
[9] Davis MC, Chafin AP, Hollins RA, Baldwin LC, Erickson ED, Zarras P,
et al. Synth Commun 2004;34:3419e29.
[10] Davis MC, Hollins RA, Douglas B. Synth Commun 2006;36:3515e23.
[11] Koeckelberghs G, Sioncke S, Verbiest T, Persoons A, Samyn C. Polymer
2003;44:3785e94.
[12] Dasgupta S. General Electric Global Research Center, provided the
sample of APEC 9389.
[13] Wright ME, Fallis S, Guenthner AJ, Baldwin LC. Macromolecules 2005;
38:10014e21.
[14] Diffey WM, Trimm RH, Temmen MG, Ashley PR. J Lightwave Technol
2005;23:1787e90.
[15] Sanghadasa M, Ashley PR, Webster EL, Cocke C, Lindsay GA,
Guenthner AJ. J Lightwave Technol 2006;24:3816e23.
[16] Guenthner AJ, Wright ME, Fallis S, Lindsay GA, Petteys BJ,
Yandek GR, et al. Proc SPIE 2006;6331: 63310M-1-11.
[17] Watson MD, Ashley PR, Abushagur MAG. IEEE J Quantum Electron
2004;30:1555e61.
[18] Chafin AJ. Calculations performed at NAVAIR, China Lake, CA 93555,
USA.
[19] DeRosa ME, He M, Cites JS, Garner SM, Tang YR. J Phys Chem B
2004;108:8725e30.
[20] Kohlrausch R. Ann Phys Chem (Leipzig) 1847;72:353e406.
[21] Chung SH, Stevens JR. Am J Phys 1991;59:1024e30.
[22] Weibull W. J Appl Mech Trans ASME 1951;18:293e7.
[23] Dureiko RD, Schuele DE, Singer KD. J Opt Soc Am B 1998;15:338e50.
[24] Dissado LA, Hill RM. Nature 1979;279:685e9.
[25] Jonscher AK. Nature 1977;267:673e9.
[26] LevenbergeMarquardt nonlinear least-square routine used on
MATLAB�.
[27] Fulcher GS. J Am Ceram Soc 1925;8:339e55.
[28] Tammann Von G, Hesse W. Z Anorg Allg Chem 1926;156:245e57.
[29] Williams ML, Landell RF, Ferry JD. J Am Chem Soc 1955;77:3701e7.
[30] Tool AQ. J Am Ceram Soc 1946;29:240e53.
[31] Narayanaswamy OS. J Am Ceram Soc 1971;54:491e8.
[32] Chow TS, Prest Jr WM. J Appl Phys 1982;53:6568e73.
[33] Hodge IM. Macromolecules 1986;19:938e41.
[34] Hodge IM. Macromolecules 1987;20:2897e908.
[35] Lubchenko V, Wolynes PG. J Chem Phys 2005;121(7):2852e65.
[36] Ghabremichael F, Kuzyk MG, Lackritz HS. Prog Polym Sci 1997;22:
1147e201.
[37] Dhinojwala A, Hooker JC, Torkelson JM. In: Lindsay GA, Singer KD,
editors. Polymers for second-order nonlinear optics. ACS symposium
series 601. Washington, DC: American Chemical Society; 1995. p.
318e32.
[38] Man HT, Yoon HN. Adv Mater 1992;4(3):159e68.
[39] Lindsay GA, Henry RA, Hoover JM, Knoesen K, Mortazavi MA.
Macromolecules 1992;25:4888e94.
[40] Winkelhahn HJ, Neher D, Servay TK, Rengel H, Pfaadt M, Boffel C,
et al. In: Miyata S, Sasabe H, editors. Poled polymers and their appli-
cations to SHG and EO devices, advances in nonlinear optics, vol. 4.
Gordon and Breach Science Publishers; 1997. p. 179e94.
[41] Verbiest T, Burland DM, Walsh CA. Macromolecules 1996;29:6310e6.
[42] Swallen SF, Kearns KL, Mapes MK, Kim YS, McMahon RJ, Ediger MD,
et al. Science 2007;315:353e6.
[43] Kauzmann W. Chem Rev 1948;43:219e56.
[44] Royal JS, Torkelson JM. Macromolecules 1993;26:5331e5.
[45] Thurau CT, Ediger MD. J Chem Phys 2003;118:1996e2004.
[46] An amorphous glass has molecular packing defects or it would be a
crystal. On a molecular scale, a segment near a defect (a nano-void) is
‘‘pliable,’’ because when given a thermal nudge, it has a greater probabil-
ity of changing its conformation than a segment not near a defect (a
‘‘rigid’’ segment). As the sample is heated, pliable regions would grow
in size at the expense of surrounding rigid material. In the hypothetical
model, at a given temperature the pliable (more mobile) domains would
have a characteristic (mean) size, and there would be a distribution of
pliable domain sizes. Surface tension would likely play a role in the
formation of this mosaic morphology [35]. The pliable regions may be
somewhat interpenetrating throughout the bulk material. Pliable domains
would be closer to a state of equilibrium than the rigid domains, and per-
haps at some sub-Tg temperature the larger pliable domains would be in
a state of equilibrium.
[47] The characteristic temperature of the model (Tc) would be reached when
the mean size of the distribution of pliable domain (or mobile domain)
sizes is the same size as the chromophore. In the case of very small chro-
mophores (aminonitrobenzene, as an extreme example), Tc would occur
at a lower temperature than that for the larger chromophores of this study.
[48] Ambient aging measurements were available for the closely related
CLDeN/APEC modulators (N stands for the norbornene group), for
which there were no changes in Vp (�0.3 V) in 3 months at ambient.
Measurements were not available for the CLDeA/APEC guestehost
material; however, we assumed that CLDeA/APEC modulators would
exhibit the same aging behavior, i.e., not more than 0.3 V increase in 3
months.
[49] Shen Q, Wong KY. Opt Commun 1999;164:47e50.
[50] Hampsch HL, Yang J, Wong GK, Torkelson JM. Polym Commun 1988;
30:40e3.
6616 G.A. Lindsay et al. / Polymer 48 (2007) 6605e6616