Noninvasive Estimation of Organ Weights by Postmortem Magnetic Resonance Imaging and Multislice...
7
ORIGINAL ARTICLE Noninvasive Estimation of Organ Weights by Postmortem Magnetic Resonance Imaging and Multislice Computed Tomography Christian Jackowski, MD,* Michael J. Thali, MD,* Ursula Buck, BSc,* Emin Aghayev, MD,* Martin Sonnenschein, MD,† Kathrin Yen, MD,* Richard Dirnhofer, MD,* and Peter Vock, MD† Objective: Computed tomography (CT) and magnetic resonance imaging (MRI) are introduced as an alternative to traditional au- topsy. The purpose of this study was to investigate their accuracy in mass estimation of liver and spleen. Methods: In 44 cases, the weights of spleen and liver were esti- mated based on MRI and CT data using a volume-analysis software and a postmortem tissue-specific density factor. In a blinded ap- proach, the results were compared with the weights noted at autopsy. Results: Excellent correlation between estimated and real weights (r 0.997 for MRI, r 0.997 for CT) was found. Putrefaction gas and venous air embolism led to an overestimation. Venous conges- tion and drowning caused higher estimated weights. Conclusion: Postmortem weights of liver and spleen can accurately be assessed by nondestructive imaging. Multislice CT overcomes the limitation of putrefaction and venous air embolism by the possibility to exclude gas. Congestion seems to be even better assessed. Key Words: postmortem imaging, virtopsy, organ weight, computed tomography, magnetic resonance imaging (Invest Radiol 2006;41: 572–578) T he postmortem application of magnetic resonance imag- ing (MRI) and computed tomography (CT) is becoming more and more frequent. 1,2 Postmortem cross-sectional im- aging using multislice CT (MSCT) and MRI is investigated as an alternative method in forensic postmortem examination. Their use is of great benefit in cases when, for example, religious reasons obviate traditional postmortem investiga- tions or the case circumstances make destructive autopsy reluctantly accepted (eg, in children). Furthermore, the cross- sectional imaging data can serve as objective 3-dimensional documentation tools in forensic medicine. In contrast to observer-dependent written autopsy records, these imaging data allow for a second opinion based on undestroyed evi- dences. Against declining autopsy numbers postmortem im- aging can alternatively close the gap of information about the causes of death in the society. Detailed descriptions of relevant postmortem forensic findings in different causes of death already have been pub- lished. 3–12 In addition, forensic findings of particular organs and tissues at postmortem imaging and their differentiation from ordinary postmortem alterations have been shown. 13–15 Traditional autopsy systematically acquires general data of the deceased body, such as the weights of internal organs, 16 which is of forensic relevance in cases of sudden cardiac death, chronic disease, and others. In traditional post- mortem examinations, the weights of the organs often are compared with normal postmortem values and thereby sup- port an organ-specific diagnosis, such as congestion, megaly, or edema (brain and lungs), as well as systemic diagnoses, such as fatal hemorrhage that causes, for instance, paly and lightweight organs. It was our hypothesis that MRI and MSCT might accurately predict the organ weight of the liver and the spleen, as measured at autopsy. A method for mass determination 17,18 needs to be evaluated. Therefore, noninva- sive postmortem MRI and CT were performed before au- topsy. The data were evaluated using a volume analysis software and a tissue-specific density factor. The results were compared with the weights measured at subsequent autopsy. As was shown, gas within the liver is a frequent finding in postmortem MSCT imaging. 19 –21 Expecting it to influence the mean density of the liver tissue and thereby the calculated liver weight, we believe a method of excluding intra hepatic gas also needs to be evaluated. MATERIALS AND METHODS A total of 105 human corpses underwent combined MRI and MSCT examinations before autopsy until June 2004 in a close collaboration of the institutes of diagnostic radiol- ogy and forensic medicine. For MSCT, a Lightspeed QX/I unit (General Electric Medical Systems, Milwaukee, WI) and for MRI, a 1.5-T Signa Echospeed Horizon unit (version 5.8, General Electric Medical Systems) were used. In areas of forensic importance, volumetric MSCT with a detector con- figuration of 4 1.25 mm was performed. From the volume Received February 8, 2006, and accepted for publication, after revision, March 26, 2006. From the *Institute of Forensic Medicine and †Institute of Diagnostic, Interventional and Pediatric Radiology, Inselspital, University of Bern, Bern, Switzerland. Reprints: Christian Jackowski, MD, University of Bern, Institute of Forensic Medicine, IRM – Buehlstrasse 20, CH-3012 Bern, Switzerland. E-mail: [email protected]. Copyright © 2006 by Lippincott Williams & Wilkins ISSN: 0020-9996/06/4107-0572 Investigative Radiology • Volume 41, Number 7, July 2006 572
-
Upload
independent -
Category
Documents
-
view
1 -
download
0
Transcript of Noninvasive Estimation of Organ Weights by Postmortem Magnetic Resonance Imaging and Multislice...

ORIGINAL ARTICLE
Noninvasive Estimation of Organ Weights by PostmortemMagnetic Resonance Imaging and Multislice
Computed Tomography
Christian Jackowski, MD,* Michael J. Thali, MD,* Ursula Buck, BSc,* Emin Aghayev, MD,*Martin Sonnenschein, MD,† Kathrin Yen, MD,* Richard Dirnhofer, MD,* and Peter Vock, MD†
Objective: Computed tomography (CT) and magnetic resonanceimaging (MRI) are introduced as an alternative to traditional au-topsy. The purpose of this study was to investigate their accuracy inmass estimation of liver and spleen.Methods: In 44 cases, the weights of spleen and liver were esti-mated based on MRI and CT data using a volume-analysis softwareand a postmortem tissue-specific density factor. In a blinded ap-proach, the results were compared with the weights noted at autopsy.Results: Excellent correlation between estimated and real weights(r � 0.997 for MRI, r � 0.997 for CT) was found. Putrefaction gasand venous air embolism led to an overestimation. Venous conges-tion and drowning caused higher estimated weights.Conclusion: Postmortem weights of liver and spleen can accurately beassessed by nondestructive imaging. Multislice CT overcomes thelimitation of putrefaction and venous air embolism by the possibility toexclude gas. Congestion seems to be even better assessed.
Key Words: postmortem imaging, virtopsy, organ weight,computed tomography, magnetic resonance imaging
(Invest Radiol 2006;41: 572–578)
The postmortem application of magnetic resonance imag-ing (MRI) and computed tomography (CT) is becoming
more and more frequent.1,2 Postmortem cross-sectional im-aging using multislice CT (MSCT) and MRI is investigatedas an alternative method in forensic postmortem examination.Their use is of great benefit in cases when, for example,religious reasons obviate traditional postmortem investiga-tions or the case circumstances make destructive autopsyreluctantly accepted (eg, in children). Furthermore, the cross-sectional imaging data can serve as objective 3-dimensionaldocumentation tools in forensic medicine. In contrast to
observer-dependent written autopsy records, these imagingdata allow for a second opinion based on undestroyed evi-dences. Against declining autopsy numbers postmortem im-aging can alternatively close the gap of information about thecauses of death in the society.
Detailed descriptions of relevant postmortem forensicfindings in different causes of death already have been pub-lished.3–12 In addition, forensic findings of particular organsand tissues at postmortem imaging and their differentiationfrom ordinary postmortem alterations have been shown.13–15
Traditional autopsy systematically acquires generaldata of the deceased body, such as the weights of internalorgans,16 which is of forensic relevance in cases of suddencardiac death, chronic disease, and others. In traditional post-mortem examinations, the weights of the organs often arecompared with normal postmortem values and thereby sup-port an organ-specific diagnosis, such as congestion, megaly,or edema (brain and lungs), as well as systemic diagnoses,such as fatal hemorrhage that causes, for instance, paly andlightweight organs. It was our hypothesis that MRI andMSCT might accurately predict the organ weight of the liverand the spleen, as measured at autopsy. A method for massdetermination17,18 needs to be evaluated. Therefore, noninva-sive postmortem MRI and CT were performed before au-topsy. The data were evaluated using a volume analysissoftware and a tissue-specific density factor. The results werecompared with the weights measured at subsequent autopsy.As was shown, gas within the liver is a frequent finding inpostmortem MSCT imaging.19–21 Expecting it to influencethe mean density of the liver tissue and thereby the calculatedliver weight, we believe a method of excluding intra hepaticgas also needs to be evaluated.
MATERIALS AND METHODSA total of 105 human corpses underwent combined
MRI and MSCT examinations before autopsy until June 2004in a close collaboration of the institutes of diagnostic radiol-ogy and forensic medicine. For MSCT, a Lightspeed QX/Iunit (General Electric Medical Systems, Milwaukee, WI) andfor MRI, a 1.5-T Signa Echospeed Horizon unit (version 5.8,General Electric Medical Systems) were used. In areas offorensic importance, volumetric MSCT with a detector con-figuration of 4 � 1.25 mm was performed. From the volume
Received February 8, 2006, and accepted for publication, after revision,March 26, 2006.
From the *Institute of Forensic Medicine and †Institute of Diagnostic,Interventional and Pediatric Radiology, Inselspital, University of Bern,Bern, Switzerland.
Reprints: Christian Jackowski, MD, University of Bern, Institute of ForensicMedicine, IRM – Buehlstrasse 20, CH-3012 Bern, Switzerland. E-mail:[email protected].
Copyright © 2006 by Lippincott Williams & WilkinsISSN: 0020-9996/06/4107-0572
Investigative Radiology • Volume 41, Number 7, July 2006572
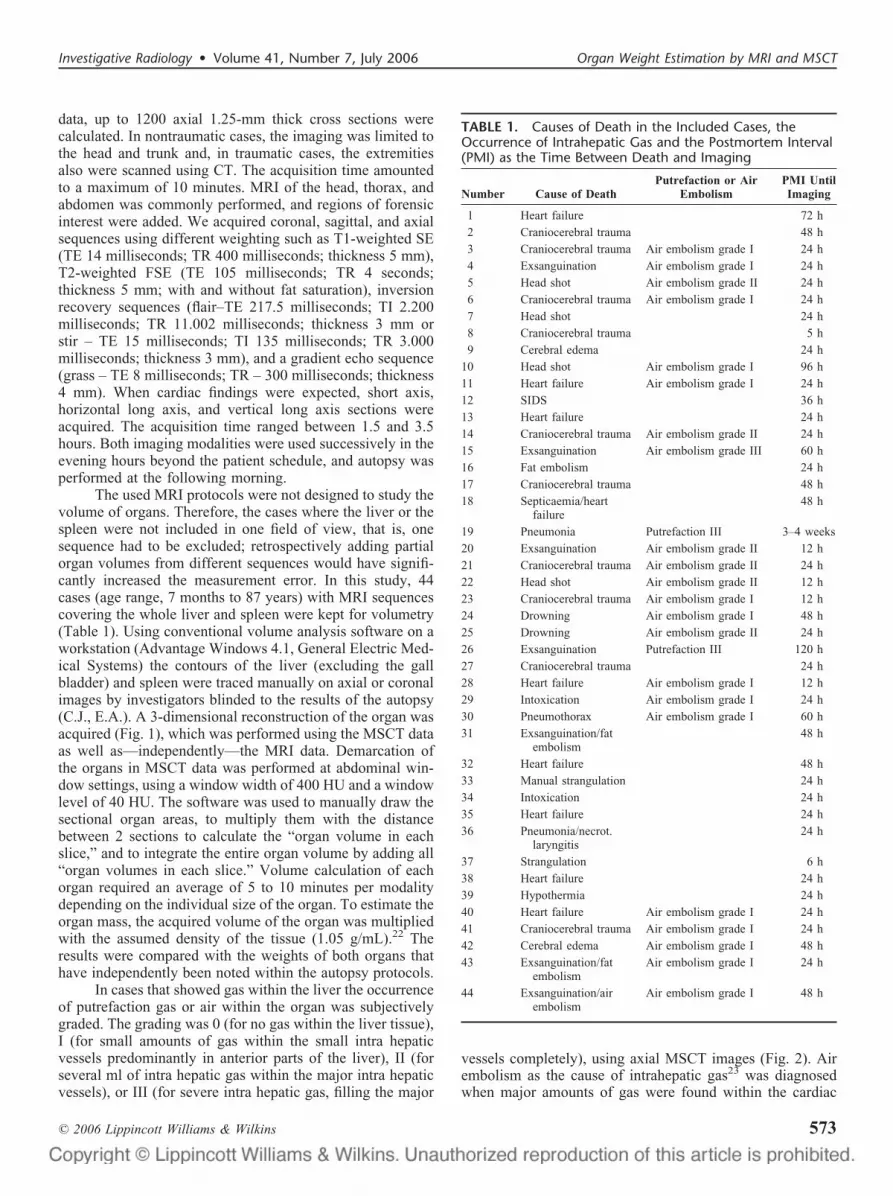
data, up to 1200 axial 1.25-mm thick cross sections werecalculated. In nontraumatic cases, the imaging was limited tothe head and trunk and, in traumatic cases, the extremitiesalso were scanned using CT. The acquisition time amountedto a maximum of 10 minutes. MRI of the head, thorax, andabdomen was commonly performed, and regions of forensicinterest were added. We acquired coronal, sagittal, and axialsequences using different weighting such as T1-weighted SE(TE 14 milliseconds; TR 400 milliseconds; thickness 5 mm),T2-weighted FSE (TE 105 milliseconds; TR 4 seconds;thickness 5 mm; with and without fat saturation), inversionrecovery sequences (flair–TE 217.5 milliseconds; TI 2.200milliseconds; TR 11.002 milliseconds; thickness 3 mm orstir – TE 15 milliseconds; TI 135 milliseconds; TR 3.000milliseconds; thickness 3 mm), and a gradient echo sequence(grass – TE 8 milliseconds; TR – 300 milliseconds; thickness4 mm). When cardiac findings were expected, short axis,horizontal long axis, and vertical long axis sections wereacquired. The acquisition time ranged between 1.5 and 3.5hours. Both imaging modalities were used successively in theevening hours beyond the patient schedule, and autopsy wasperformed at the following morning.
The used MRI protocols were not designed to study thevolume of organs. Therefore, the cases where the liver or thespleen were not included in one field of view, that is, onesequence had to be excluded; retrospectively adding partialorgan volumes from different sequences would have signifi-cantly increased the measurement error. In this study, 44cases (age range, 7 months to 87 years) with MRI sequencescovering the whole liver and spleen were kept for volumetry(Table 1). Using conventional volume analysis software on aworkstation (Advantage Windows 4.1, General Electric Med-ical Systems) the contours of the liver (excluding the gallbladder) and spleen were traced manually on axial or coronalimages by investigators blinded to the results of the autopsy(C.J., E.A.). A 3-dimensional reconstruction of the organ wasacquired (Fig. 1), which was performed using the MSCT dataas well as—independently—the MRI data. Demarcation ofthe organs in MSCT data was performed at abdominal win-dow settings, using a window width of 400 HU and a windowlevel of 40 HU. The software was used to manually draw thesectional organ areas, to multiply them with the distancebetween 2 sections to calculate the “organ volume in eachslice,” and to integrate the entire organ volume by adding all“organ volumes in each slice.” Volume calculation of eachorgan required an average of 5 to 10 minutes per modalitydepending on the individual size of the organ. To estimate theorgan mass, the acquired volume of the organ was multipliedwith the assumed density of the tissue (1.05 g/mL).22 Theresults were compared with the weights of both organs thathave independently been noted within the autopsy protocols.
In cases that showed gas within the liver the occurrenceof putrefaction gas or air within the organ was subjectivelygraded. The grading was 0 (for no gas within the liver tissue),I (for small amounts of gas within the small intra hepaticvessels predominantly in anterior parts of the liver), II (forseveral ml of intra hepatic gas within the major intra hepaticvessels), or III (for severe intra hepatic gas, filling the major
vessels completely), using axial MSCT images (Fig. 2). Airembolism as the cause of intrahepatic gas23 was diagnosedwhen major amounts of gas were found within the cardiac
TABLE 1. Causes of Death in the Included Cases, theOccurrence of Intrahepatic Gas and the Postmortem Interval(PMI) as the Time Between Death and Imaging
Number Cause of DeathPutrefaction or Air
EmbolismPMI UntilImaging
1 Heart failure 72 h
2 Craniocerebral trauma 48 h
3 Craniocerebral trauma Air embolism grade I 24 h
4 Exsanguination Air embolism grade I 24 h
5 Head shot Air embolism grade II 24 h
6 Craniocerebral trauma Air embolism grade I 24 h
7 Head shot 24 h
8 Craniocerebral trauma 5 h
9 Cerebral edema 24 h
10 Head shot Air embolism grade I 96 h
11 Heart failure Air embolism grade I 24 h
12 SIDS 36 h
13 Heart failure 24 h
14 Craniocerebral trauma Air embolism grade II 24 h
15 Exsanguination Air embolism grade III 60 h
16 Fat embolism 24 h
17 Craniocerebral trauma 48 h
18 Septicaemia/heartfailure
48 h
19 Pneumonia Putrefaction III 3–4 weeks
20 Exsanguination Air embolism grade II 12 h
21 Craniocerebral trauma Air embolism grade II 24 h
22 Head shot Air embolism grade II 12 h
23 Craniocerebral trauma Air embolism grade I 12 h
24 Drowning Air embolism grade I 48 h
25 Drowning Air embolism grade II 24 h
26 Exsanguination Putrefaction III 120 h
27 Craniocerebral trauma 24 h
28 Heart failure Air embolism grade I 12 h
29 Intoxication Air embolism grade I 24 h
30 Pneumothorax Air embolism grade I 60 h
31 Exsanguination/fatembolism
48 h
32 Heart failure 48 h
33 Manual strangulation 24 h
34 Intoxication 24 h
35 Heart failure 24 h
36 Pneumonia/necrot.laryngitis
24 h
37 Strangulation 6 h
38 Heart failure 24 h
39 Hypothermia 24 h
40 Heart failure Air embolism grade I 24 h
41 Craniocerebral trauma Air embolism grade I 24 h
42 Cerebral edema Air embolism grade I 48 h
43 Exsanguination/fatembolism
Air embolism grade I 24 h
44 Exsanguination/airembolism
Air embolism grade I 48 h
Investigative Radiology • Volume 41, Number 7, July 2006 Organ Weight Estimation by MRI and MSCT
© 2006 Lippincott Williams & Wilkins 573

cavities (predominantly the right atrium and right ventricle),the pulmonary artery and the cervical and thoracic venoussystem as well as within the major thoracic arteries. Theabsence of signs of putrefaction in other tissues, such astissue destruction and gas bubbles was required to diagnoseair embolism. Putrefaction was diagnosed when the amountof intra hepatic gas was similar to the gas content of otherorgans, when tissues showed a “Swiss-cheese”-like aspect (socalled foamy organs),24 and it was verified by signs ofputrefaction noted at autopsy. In the presence of gas thevoxels composed of gas were additionally subtracted from theliver volume on the MSCT data. This was performed byincreasing the lower threshold for inclusion within the 3Dmodel of the liver from the standard value of �1024 HUto �500 HU. This value of �500 HU was chosen as the newthreshold to reduce the partial volume effects of the voxelslocated at the gas-tissue borderline within the liver.
Traditional autopsy was performed by board-certifiedforensic pathologists. The Gaussian distribution of the inves-tigated values was proofed using the normal probability plot.Correlations were investigated using Pearsons correlation
coefficient. Significance of found differences between themeasurements of the methods was investigated using a stu-dents t test (� � 0.05, 2 tailed).
RESULTSAlthough manual demarcation of the organ boundaries
was sometimes easier on MRI than on MSCT data, bothtechniques delivered similar results. The weight of the liverranged between 260 and 3160 g at autopsy, between 250 and3653 g at MRI, between 255 and 3618 g at MSCT andbetween 252 and 3612 g at MSCT after gas exclusion. Theweight of the spleen was between 28 and 512, 28 and 495,and 26 and 509 g respectively. Correlation between autopsyand imaging was excellent (r � 0.997 for MRI and r � 0.997 forMSCT) as well as between both imaging techniques (r � 0.999).
The mean percentage of difference of the liver weightwas 1.8% (SD 0.8%) in MRI, 2.0% (SD 0.8%) in MSCT and1.5% (SD 0.7%) in MSCT after gas exclusion. Based on thet test the liver mass was slightly overestimated by MRI (P �0.03) and MSCT (P � 0.01). After exclusion of gas the meanvalues by MSCT showed no significant deviation from thoseat autopsy (P � 0.04; Table 2).
For the spleen, underestimation was slightly more com-mon. The mean difference of splenic weight was �2.1%(SD 1.3%) in MRI and �1.4% (SD 1.1%) in MSCT, but it didnot reach statistical significance (P � 0.09 for MRI, P � 0.18for CT; Table 3).
The mean percentage of difference of liver mass and itsstandard deviation were higher in the cases that presentedwith intra hepatic gas: 2.8% (SD 1.4%) in MRI, 3.6% (SD1.1%) in MSCT and 2.3% (SD 0.9%) in MSCT after gasexclusion, as compared with the values obtained from all 44cases. In those cases with severe intra hepatic gas (cases 15,19, and 26), exclusion of the voxels with a density less than�500 HU caused a relevant reduction of the overestimationin MRI and MSCT.
All enclosed cases of exclusive heart failure (8 cases)also showed an obvious mean overestimation of the livermass, as compared with the total of 44 cases: 4.2% (SD 2.2%)in MRI, 3.2% (SD 2.3%) in MSCT. Both enclosed cases ofdrowning also showed an overestimation of the liver mass bypostmortem imaging, independent of the presence of intrahepatic gas. Mean weight estimations by both methods MRIand MSCT showed no statistical difference (P � 0.14 forliver, 0.41 for spleen).
DISCUSSIONThe results show the accuracy of postmortem imaging-
based determination of organ mass using postprocessingvolume analysis software and the tissue specific densityfactor 1.05 g/mL.22 One can rely on the method, unless severesigns of putrefaction or venous air embolism are visible atMSCT. Intrahepatic gas, whether putrefaction-induced (Fig.2) or embolic air, leads to a reduction of the mean tissuedensity and, without correction of the specific density factor,an increase of the “virtual liver weight” in postmortemimaging. All cases with intra hepatic gas of grade III (cases15, 19, and 26) showed a distinct overestimation of the liver
FIGURE 2. Grading of intra hepatic gas: grade 0 – no gaswithin the liver tissue (a), grade I – small amounts of gaswithin the small intra hepatic vessels predominantly in ante-rior parts of the liver (b), grade II – several ml of intra he-patic gas within the major intra hepatic vessels (c), gradeIII – severe occurrence of intra hepatic gas with completefilling of the major organ vessels and severe tissue destruc-tion when putrefaction caused (d). Note that gas is distrib-uted in both portal venous and hepatic venous branches.
FIGURE 1. Manual demarcation of the organ and acquired3D model of the liver using coronal MRI (a) and using axialMSCT data resulting in a color-density encoded 3D volumerendering model of the liver (b).
Jackowski et al Investigative Radiology • Volume 41, Number 7, July 2006
© 2006 Lippincott Williams & Wilkins574

weight. This hypothetic explanation is supported by thedistinct reduction of the overestimation when voxels withgaseous radiopacity were excluded from the volume. Therebythis technique can be suggested to overcome the limitation ofestimating organ weights by imaging in cases of putrefactionor air embolism.
The intrahepatic occurrence of gas in grade I and IIcases did not influence the results beyond the standard devi-ation of all measurements. Gas exclusion was not performedfor the spleen because there was usually no gas detectedwithin the spleen. Only the case with severe putrefaction(case 19) showed very small amounts of putrefaction gaswithin the splenic parenchyma (comparable to grade 0–I inthe liver).
Furthermore, overestimation of the weight of the liverwas observed in 7 out of 8 cases of acute cardiac failure(cases 11, 13, 28, 32, 35, 38, and 40). Although there is nostatistical proof, we assume this most likely to be caused byblood congestion within the large veins of the liver duringpostmortem imaging, whereas at autopsy the blood was lostfrom the major vessels of the isolated organ before its weightwas assessed (Fig. 3a). Postmortem imaging offers the op-portunity to freeze the grade of congestion at the time ofdeath without influencing the volume of organs by openingtheir vessels at autopsy.25 We therefore suspect that theoverestimation of the hepatic weight in these cases is causedby the loss of volume during autopsy rather than an inaccu-rate measurement technique at imaging. Similar mechanisms
might explain the overestimation observed in the cases ofdrowning (cases 24 and 25): the “emphysema aquosum” ofthe lung increases the intrathoracic pressure and causes anextrusion of intrathoracic blood volume into the liver vesselsthat is partly lost when the vascular system is opened atautopsy (Fig. 3b).
The assumed density of 1.05 g/mL is an estimation ofthe real postmortem specific weight of hepatic and splenictissue density.22 It is assumed not to alter relevantly untilputrefaction begins, because of the high constant fraction ofwater (1.00 g/mL) within the tissue. Obviously, a Gaussiandistribution of the real density with individual variation willexist for each healthy organ, and density is likely to bedifferent in disease, eg, severe hepatic steatosis will likelylower the density of the liver tissue. This will be discerned byincreased tissue signal of the liver as compared with thespleen and further organs on T1-weighted MRI sequenceswithout fat saturation.26 In cases of massive steatosis (none ofthe enclosed 44 cases) it will might be useful do adapt thedensity factor. Our results show the density differences of theliver and the spleen were negligible in our population of 44forensic corpses as long as there was no putrefaction or airembolism.
To exclude gas in this specific group of cases, weexcluded voxels with ��500 HU from the segmented vol-ume of the liver. We choose �500 HU to reduce partialvolume effects of the voxels at the gas-tissue boundary withinthe putrefied or air embolized liver. However, as shown in our
TABLE 2.
Investigative Radiology • Volume 41, Number 7, July 2006 Organ Weight Estimation by MRI and MSCT
© 2006 Lippincott Williams & Wilkins 575
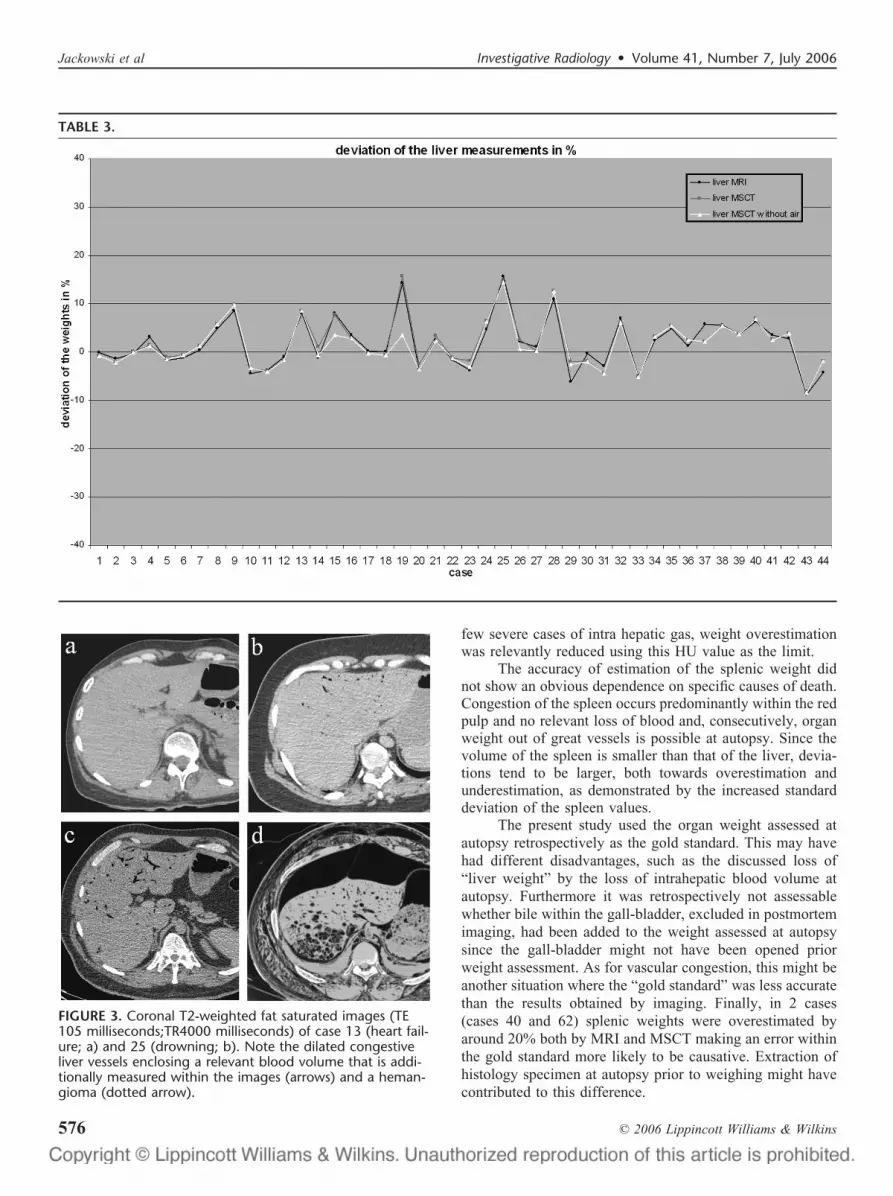
few severe cases of intra hepatic gas, weight overestimationwas relevantly reduced using this HU value as the limit.
The accuracy of estimation of the splenic weight didnot show an obvious dependence on specific causes of death.Congestion of the spleen occurs predominantly within the redpulp and no relevant loss of blood and, consecutively, organweight out of great vessels is possible at autopsy. Since thevolume of the spleen is smaller than that of the liver, devia-tions tend to be larger, both towards overestimation andunderestimation, as demonstrated by the increased standarddeviation of the spleen values.
The present study used the organ weight assessed atautopsy retrospectively as the gold standard. This may havehad different disadvantages, such as the discussed loss of“liver weight” by the loss of intrahepatic blood volume atautopsy. Furthermore it was retrospectively not assessablewhether bile within the gall-bladder, excluded in postmortemimaging, had been added to the weight assessed at autopsysince the gall-bladder might not have been opened priorweight assessment. As for vascular congestion, this might beanother situation where the “gold standard” was less accuratethan the results obtained by imaging. Finally, in 2 cases(cases 40 and 62) splenic weights were overestimated byaround 20% both by MRI and MSCT making an error withinthe gold standard more likely to be causative. Extraction ofhistology specimen at autopsy prior to weighing might havecontributed to this difference.
FIGURE 3. Coronal T2-weighted fat saturated images (TE105 milliseconds;TR4000 milliseconds) of case 13 (heart fail-ure; a) and 25 (drowning; b). Note the dilated congestiveliver vessels enclosing a relevant blood volume that is addi-tionally measured within the images (arrows) and a heman-gioma (dotted arrow).
TABLE 3.
Jackowski et al Investigative Radiology • Volume 41, Number 7, July 2006
© 2006 Lippincott Williams & Wilkins576

In this feasibility study only the liver and spleen wereinvestigated. The determination of the skeletal muscle massusing postmortem CT and MRI has already been shown.27
The postmortem estimation of the left ventricular myocardialmass is a challenging but important future application inthe assessment of left ventricular hypertrophy as comparedwith the range of normal values.15,28,29 Because our au-topsy protocols contain the weight of the entire heart ratherthan of the left ventricle, including the atria, the right ventri-cle and epicardial fat, a gold standard for left ventricularmyocardial mass assessment was retrospectively not avail-able. This must be prospectively investigated in a futureproject. The current development towards whole body mag-netic resonance imaging will facilitate such future studiesalso on other organs in MRI as the entire body can be scannedquickly and with high resolution.30,31
The mean differences of our data and their standarddeviations were comparable to clinical data32 and evenslightly better and thereby justify the use of the presentedmethods to answer forensic relevant questions, such as forcongestion in sudden cardiac death or for hepatosplenomeg-aly in chronic disease also postmortem. There might even beother clinical applications of our forensic experience becausethere is a strong tendency towards less autoptic validation inclinical medicine.33
CONCLUSIONSThe weight of the liver and spleen can be estimated
virtually by using postmortem MRI and MSCT data and avolume analyzing software. Both techniques delivered simi-lar results, which makes CT the method of choice to addressthese questions as it is less elaborate, less expensive and lesstime consuming. In cases of congestion imaging might beeven more accurate than autopsy because no changes of theintra hepatic blood volume can occur. Putrefaction and airembolism currently limit the application in MRI, whereasattempts at excluding putrefaction gas and embolized air fromthe volume of the liver in MSCT show promise for weightestimation in these cases.
ACKNOWLEDGMENTSWe would like to thank Elke Spielvogel MTRA (Med.
Rad.Technician), Christoph Laeser MTRA, Carolina Do-browolska MTRA, Karin Zwygart MTRA, Verena BeutlerMTRA, and Michael Ith, PhD, for their excellent help duringdata acquisition and Urs Konigsdorfer and Roland Dorn fortheir experienced assistance at autopsy.
REFERENCES1. Thali M, Vock P. Role of and techniques in forensic imaging. In:
Payen-James J, Busuttil A, Smock W, eds. Forensic Medicine: Clinicaland Pathological Aspects. London: Greenwich Medical Media; 2003:731–745.
2. Brogdon BG. Forensic Radiology. 1st ed. Boca Raton, FL: CRC PressLLC; 1998.
3. Thali MJ, Yen K, Schweitzer W, et al. Virtopsy, a new imaging horizonin forensic pathology: virtual autopsy by postmortem multislice com-puted tomography (MSCT) and magnetic resonance imaging (MRI)—afeasibility study. J Forensic Sci. 2003;48:386–403.
4. Thali MJ, Yen K, Plattner T, et al. Charred body: virtual autopsy with
multi-slice computed tomography and magnetic resonance imaging.J Forensic Sci. 2002;47:1326–1331.
5. Thali MJ, Schweitzer W, Yen K, et al. New horizons in forensicradiology: the 60-second digital autopsy-full-body examination of agunshot victim by multislice computed tomography. Am J Forensic MedPathol. 2003;24:22–27.
6. Shiotani S, Kohno M, Ohashi N, et al. Non-traumatic postmortemcomputed tomographic (PMCT) findings of the lung. Forensic Sci Int.2004;139:39–48.
7. Aghayev E, Yen K, Sonnenschein M, et al. Virtopsy post-mortemmulti-slice computed tomography (MSCT) and magnetic resonanceimaging (MRI) demonstrating descending tonsillar herniation: compar-ison to clinical studies. Neuroradiology. 2004;46:559–564.
8. Aghayev E, Sonnenschein M, Jackowski C, et al. Fatal hemorrhage inpostmortem radiology; measurements of cross-sectional areas of majorblood vessels and volumes of aorta and spleen by msct and volumes ofheart chambers by MRI. AJR Am J Roentgenol. in press.
9. Aghayev E, Yen K, Sonnenschein M, et al. Pneumomediastinum andsoft tissue emphysema of the neck in postmortem CT and MRI; a newvital sign in hanging? Forensic Sci Int. 2005;153:181–188.
10. Jackowski C, Aghayev E, Sonnenschein M, et al. Maximum intensityprojection (MIP) of cranial computed tomography (CCT) data for dentalidentification. Int J Legal Med. 2005; epub ahead of print.
11. Jackowski C, Dirnhofer S, Thali M, et al. Postmortem diagnostics usingMSCT and MRI of a lethal streptococcus group A infection at infancy:a case report. Forensic Sci Int. 2005;151:157–163.
12. Jackowski C, Sonnenschein M, Thali MJ, et al. Virtopsy: postmortemminimally invasive angiography using cross section techniques—imple-mentation and preliminary results. J Forensic Sci. 2005;50:1175–1186.
13. Jachau K, Heinrichs T, Kuchheuser W, et al. Computed tomography andmagnetic resonance imaging compared to pathoanatomic findings inisolated human autopsy hearts. Rechtsmedizin. 2004;14:109–116.
14. Jackowski C, Thali M, Aghayev E, et al. Virtopsy: postmortem imagingof blood and its charcteristics using MSCT and MRI. Int J Legal Med.2006;27:25–29.
15. Jackowski C, Schweitzer W, Thali M, et al. Virtopsy: postmortemimaging of the human heart in situ using MSCT and MRI. Forensic SciInt. 2005;149:11–23.
16. Zschoch H, Wunderlich C. �Changes in the organ weight of the corpseduring storage�. Zdrav Prac. 1969;112:418–420.
17. Busetto L, Tregnaghi A, De Marchi F, et al. Liver volume and visceralobesity in women with hepatic steatosis undergoing gastric banding.Obes Res. 2002;10:408–411.
18. Farraher SW, Jara H, Chang KJ, et al. Liver and spleen volumetry withquantitative MR imaging and dual-space clustering segmentation. Radi-ology. 2005;237:322–328.
19. Yamazaki K, Shiotani S, Ohashi N, et al. Hepatic portal venous gas andhyper-dense aortic wall as postmortem computed tomography finding.Leg Med (Tokyo). 2003;5(Suppl 1):S338–S341.
20. Shiotani S, Kohno M, Ohashi N, et al. Postmortem computed tomo-graphic (PMCT) demonstration of the relation between gastrointestinal(GI) distension and hepatic portal venous gas (HPVG). Radiat Med.2004;22:25–29.
21. Jackowski C, Sonnenschein M, Thali M, et al. Intra hepatic gas atpostmortem CT - forensic experience as a potential guide for in vivotrauma imaging. J Trauma. in press.
22. Tang H, Vasselli JR, Wu EX, et al. High-resolution magnetic resonanceimaging tracks changes in organ and tissue mass in obese and aging rats.Am J Physiol Regul Integr Comp Physiol. 2002;282:R890–R899.
23. Jackowski C, Thali M, Sonnenschein M, et al. Visualization and quan-tification of air embolism structure by processing postmortem MSCTdata. J Forensic Sci. 2004;49:1339–1342.
24. Thali MJ, Yen K, Schweitzer W, et al. Into the decomposed body-forensic digital autopsy using multislice-computed tomography. Foren-sic Sci Int. 2003;134:109–114.
25. Gore RM, Mathieu DG, White EM, et al. Passive hepatic congestion:cross-sectional imaging features. AJR Am J Roentgenol. 1994;162:71–75.
26. Chave G, Milot L, Pilleul F. �Out of phase magnetic resonance imagingand liver applications�. J Radiol. 2005;86:993–997.
27. Mitsiopoulos N, Baumgartner RN, Heymsfield SB, et al. Cadaver
Investigative Radiology • Volume 41, Number 7, July 2006 Organ Weight Estimation by MRI and MSCT
© 2006 Lippincott Williams & Wilkins 577

validation of skeletal muscle measurement by magnetic resonance im-aging and computerized tomography. J Appl Physiol. 1998;85:115–122.
28. Alfakih K, Plein S, Thiele H, et al. Normal human left and rightventricular dimensions for MRI as assessed by turbo gradient echo andsteady-state free precession imaging sequences. J Magn Reson Imaging.2003;17:323–329.
29. Lorenz CH, Walker ES, Morgan VL, et al. Normal human right and leftventricular mass, systolic function, and gender differences by cinemagnetic resonance imaging. J Cardiovasc Magn Reson. 1999;1:7–21.
30. Schmidt GP, Baur-Melnyk A, Herzog P, et al. High-resolution whole-body magnetic resonance image tumor staging with the use of parallel
imaging versus dual-modality positron emission tomography-computedtomography: experience on a 32-channel system. Invest Radiol. 2005;40:743–753.
31. Schlemmer HP, Schafer J, Pfannenberg C, et al. Fast whole-bodyassessment of metastatic disease using a novel magnetic resonanceimaging system: initial experiences. Invest Radiol. 2005;40:64–71.
32. Kayaalp C, Arda K, Oto A, et al. Liver volume measurement by spiralCT: an in vitro study. Clin Imaging. 2002;26:122–124.
33. Luccichenti G, Cademartiri F, Cobelli R, et al. Assessment of organvolume with different techniques using a living liver model. Eur Radiol.2003;13:1286–1290.
Jackowski et al Investigative Radiology • Volume 41, Number 7, July 2006
© 2006 Lippincott Williams & Wilkins578