Effects of RNA degradation on gene expression analysis of human postmortem tissues
25
©2005 FASEB The FASEB Journal express article 10.1096/fj.04-3552fje. Published online June 13, 2005. Effects of RNA degradation on gene expression analysis of human postmortem tissues Jerry Lee, Aniko Hever, Dorian Willhite, Albert Zlotnik, and Peter Hevezi Department of Molecular Medicine, Neurocrine Biosciences Inc., San Diego, California Corresponding author: Peter Hevezi, Department of Molecular Medicine, Neurocrine Biosciences Inc., 12790 El Camino Real, San Diego, CA 92130. E-mail: [email protected] ABSTRACT The Affymetrix GeneChip platform was used to build a gene expression database of the normal human body. Postmortem human tissues represent a valuable source of biological materials for this type of study, but their use entails some delays before harvesting such tissues. We first evaluated the RNA quality obtained from tissues obtained 3–5 h postmortem and found variations that were both tissue and donor-dependent. RNAs extracted from brain regions were of higher quality than those obtained from the gut, while the cause of death was a significant factor in donor-dependent differences. To avoid these variables, we used rat duodenum to determine the effects of RNA degradation on the analysis of gene expression. Surprisingly, even samples exhibiting significant RNA degradation yielded robust gene expression results, comparable to those obtained using intact samples at a certain signal intensity cutoff. We extended these findings to our human expression database and obtained similar results, indicating that the Affymetrix platform, which is biased to the 3′ end of transcripts for detection, can tolerate significant RNA degradation, while still yielding high quality expression data. Our resulting body index expression database is a valuable research tool. As examples of potential uses, we report novel expression sites for four potential therapeutic targets—CCL27, GPR22, GPR113 and GPR128—and as well as a set of thymus-specific genes, including three not previously associated with the thymus. Key words: thymus • RNA quality • GPCR he ability to simultaneously monitor the expression of thousands of genes in a given biological sample using high-density DNA arrays has enabled researchers to gain new insights into complex biological processes (1). Gene expression data has added a valuable dimension in understanding processes as diverse as cellular responses to stimuli (2, 3), the etiology and pathology of human disease (4–6), and the response to drugs (7–9). Analyses of human gene expression in normal and diseased tissues, in particular, offers compelling possibilities for understanding human diseases at the molecular level. One requirement of tissue sample procurement for gene expression studies is that they should be obtained and processed in an optimal manner to maximize the integrity of RNA to be extracted and used in the study. In general, it is more feasible to obtain high-quality samples from diseased rather than normal T Page 1 of 25 (page number not for citation purposes)
-
Upload
unemployment-extension -
Category
Documents
-
view
0 -
download
0
Transcript of Effects of RNA degradation on gene expression analysis of human postmortem tissues

©2005 FASEB
The FASEB Journal express article 10.1096/fj.04-3552fje. Published online June 13, 2005.
Effects of RNA degradation on gene expression analysis of human postmortem tissues Jerry Lee, Aniko Hever, Dorian Willhite, Albert Zlotnik, and Peter Hevezi
Department of Molecular Medicine, Neurocrine Biosciences Inc., San Diego, California
Corresponding author: Peter Hevezi, Department of Molecular Medicine, Neurocrine Biosciences Inc., 12790 El Camino Real, San Diego, CA 92130. E-mail: [email protected]
ABSTRACT
The Affymetrix GeneChip platform was used to build a gene expression database of the normal human body. Postmortem human tissues represent a valuable source of biological materials for this type of study, but their use entails some delays before harvesting such tissues. We first evaluated the RNA quality obtained from tissues obtained 3–5 h postmortem and found variations that were both tissue and donor-dependent. RNAs extracted from brain regions were of higher quality than those obtained from the gut, while the cause of death was a significant factor in donor-dependent differences. To avoid these variables, we used rat duodenum to determine the effects of RNA degradation on the analysis of gene expression. Surprisingly, even samples exhibiting significant RNA degradation yielded robust gene expression results, comparable to those obtained using intact samples at a certain signal intensity cutoff. We extended these findings to our human expression database and obtained similar results, indicating that the Affymetrix platform, which is biased to the 3′ end of transcripts for detection, can tolerate significant RNA degradation, while still yielding high quality expression data. Our resulting body index expression database is a valuable research tool. As examples of potential uses, we report novel expression sites for four potential therapeutic targets—CCL27, GPR22, GPR113 and GPR128—and as well as a set of thymus-specific genes, including three not previously associated with the thymus.
Key words: thymus • RNA quality • GPCR
he ability to simultaneously monitor the expression of thousands of genes in a given biological sample using high-density DNA arrays has enabled researchers to gain new insights into complex biological processes (1). Gene expression data has added a valuable
dimension in understanding processes as diverse as cellular responses to stimuli (2, 3), the etiology and pathology of human disease (4–6), and the response to drugs (7–9). Analyses of human gene expression in normal and diseased tissues, in particular, offers compelling possibilities for understanding human diseases at the molecular level. One requirement of tissue sample procurement for gene expression studies is that they should be obtained and processed in an optimal manner to maximize the integrity of RNA to be extracted and used in the study. In general, it is more feasible to obtain high-quality samples from diseased rather than normal
T
Page 1 of 25(page number not for citation purposes)

tissues as they can be obtained during surgical interventions. One significant source of normal tissues is from cadavers (10–12); however, in this case, there is always an obligatory delay between the time of death and the possibility of tissue collection. As a result, the probability of cellular disruption and RNA degradation increases, potentially compromising the resulting gene expression data. We sought to investigate the effects of RNA quality and subsequent gene expression results by preparing RNA from ~80 tissue samples collected from 4 postmortem donor bodies. As previously reported (13, 14), we observed significant variation in the stability of RNA obtained postmortem from different organs, but in addition, for a given tissue, there was significant variation in the quality of RNA obtained between the various donors. We went on to determine the consequences of RNA degradation by obtaining representative gene expression data using sets of RNAs from both a model rat duodenum system and human postmortem tissue samples using the Affymetrix GeneChip platform. Our results indicate that high-quality expression data can be generated even when the RNA that is used exhibits significant degradation. We then went on to explore the value of our human body index (BI) database. We analyzed the gene expression profiles of a number of genes with established expression patterns, including Kallikrein-3 (PSA) (15), and Ghrelin precursor (16), as well as others. We found novel sites of expression for four genes, CCL27, GPR22, GPR113 and GPR128, with therapeutic potential. We then queried the ability of our BI to identify organ-specific genes using the thymus as an example. Our results indicate that the majority of the thymus-specific genes uncovered by the BI are known thymus markers, while a subset are either uncharacterized transcripts or known genes not previously associated with the thymus. We conclude that even with the limitations inherent in collecting normal human tissues for expression analysis, the use of postmortem samples is of practical value. Our results indicate that although some level of quantitative variation is introduced, there is a minimal reduction in numbers of transcripts called present. This indicates that the expression profiles obtained are representative and can be used to further characterize gene expression in adult humans.
MATERIALS AND METHODS
Tissue acquisition
Flash-frozen human tissue samples were obtained from human donors (Zoion Diagnostics, Hawthorne, NY) between 3-5 h postmortem. Tissues were surgically obtained and immediately frozen in liquid nitrogen until processing for RNA extraction, as described below. A subset of tissues were augmented with commercially available human RNAs (see Supplementary Information). Rat tissues, including duodenum, were collected from 7 wk-old male Sprague Dawley rats. For the duodenum samples, the first 4 cm of the small intestine were removed, washed in PBS and sectioned longitudinally into four equivalent samples. Zero time point samples were frozen immediately in liquid nitrogen; the remaining three samples were incubated at 37°C in microcentrifuge tubes containing 200 μl of PBS for 1, 3, or 5 h. At the times indicated, PBS was aspirated, and the tissue samples were frozen in liquid nitrogen.
RNA extraction and evaluation
Frozen tissue samples were ground under liquid nitrogen in a mortar and pestle, and the resulting powder was solubilized in 1 ml TRIzol reagent (Invitrogen, Carlsbad, CA) in a FastPrep microcentrifuge tube containing Lysing Matrix D ceramic beads, followed immediately by
Page 2 of 25(page number not for citation purposes)

extensive agitation in the FastPrep Instrument (Q-Biogene, Carlsbad, CA) for 20-30 s at a speed setting of 6. Total RNA was isolated from the resulting TRIzol solution as recommended by the supplier and further purified with an additional RNeasy step (Qiagen, Chatsworth CA). Samples were analyzed by gel electrophoresis on 1% TBE agarose gels (Cambrex, Baltimore, MD) and assigned a numerical RNA grade using the following scale. Grade 5: Distinct 28S and 18S ribosomal bands, no low molecular weight smear; Grade 4: Distinct rRNA bands, reduced intensity 28S band, 18S band still distinct and bright, no low molecular weight smear; Grade 3: no 28S band and 18S band still distinct, low molecular weight smear present; Grade 2: no 28S band, indistinct 18S band, low molecular weight band more intense; Grade 1: no 18S and 28S ribosomal bands, significant low molecular weight smear.
Generation of biotin-labeled cRNA
Five micrograms of total RNA from each sample were used to direct cDNA synthesis using a T7-oligo(dT)24 primer and PowerScript reverse transcriptase (BD Clontech, Palo Alto, CA). After second strand synthesis, double-stranded cDNA was used in a MEGAscript T7 RNA polymerase in vitro transcription reaction (Ambion, Austin, TX), containing 2 biotin-labeled ribonucleotides; CTP (Enzo Diagnostics, Farmingdale, NJ) and UTP (Roche, Indianapolis, IN). The biotinylated cRNA was hybridized to the Affymetrix Human Genome U133 Plus 2.0 gene array for human samples and the Affymetrix 230A Rat Expression gene array for rat samples, stained with streptavidin phycoerythrin conjugate and scanned by the GeneChip Scanner 3000 as described in the Affymetrix technical manual.
Data normalization and analysis
The Affymetrix DAT files were first processed using GeneChip Operating Software version 1.0 (GCOS v1.0; Affymetrix) and the GCOS default settings; Tau = 0.015, Alpha (P value) 1 = 0.05, Alpha 2 = 0.065. GCOS uses a detection algorithm to determine whether the measured transcript is detected (Present) or not detected (Absent) based on each probe pair’s discrimination score against a predefined threshold, Tau. If the probe pairs score higher than Tau, the transcript is called “present”; it is called “absent” when the probe pairs score lower than Tau. A P value was associated with each discrimination score to assess the likelihood of a probe pair being called present, absent or marginal. Normalized and background-subtracted signal values were then obtained from the resulting CEL files using a commercially available software, ArrayAssist (Iobion Labs, La Jolla, CA), which implements the Robust Multichip Average (RMA) algorithm that has been shown to improve on precision and accuracy of GeneChip data (17).
RESULTS
Assessment of total RNA quality by gel electrophoresis
The postmortem human tissues used in this study, representing ~80 sites of the body are listed in Table 1. Four donor bodies were used; 3 male and 1 female. Two died as a result of major trauma, one from mechanical trauma and one by electrocution. All were otherwise healthy adults between 25 and 50 years of age. Sample collection started ~3 hours postmortem and was completed within 2 h (see supplementary information). The quality of total RNA isolated from frozen tissue samples was assessed using a numerical scale, and a mean tissue RNA score was
Page 3 of 25(page number not for citation purposes)

calculated (Table 1). This analysis reveals that both tissue-specific and donor-specific variables affected RNA quality. Tissue-specific effects can be observed in that most RNA samples derived from CNS tissues were intact and of high quality (Fig. 1A) with a mean tissue RNA grade of 3.8, whereas those obtained from gastrointestinal tissues exhibited more degradation with an average grade of 1.9 (Fig. 1B). Donor-to-donor variations were also substantial, as shown by gel electrophoresis of RNAs derived from the appendix, colon, cerebellum, and the hippocampus (Fig. 1A and B).
Rat duodenum model
Because we observed variations in RNA stability between individuals and we also expect variation in expression of individual genes in the human population (13), we decided to use rat duodenum as a model system. These samples were obtained under controlled postmortem conditions, in order to generate a set of RNAs from the same tissue and strain of rat but with increasing levels of degradation. As shown in Fig. 2A, RNAs obtained postmortem from rat tissues appear more stable than RNA from human donors as samples from both cerebrum and stomach appeared intact even after 6 hrs. To generate degraded RNA in a reasonable time and under more controlled conditions, we incubated equivalent strips of duodenum in PBS at 37°C. Figure 2B shows that we were able to generate four RNA grades, corresponding to those recovered from human tissues.
To evaluate the effect of RNA degradation on gene expression data in these samples, we used Affymetrix GeneChip Rat Expression 230A arrays, containing >15,000 probe sets representing ~14,000 genes.
Expression analysis of rat duodenum data
We obtained present/absent calls for 7 of the 8 arrays in the rat model using the default settings in GCOS v1.1 (see Materials and Methods). Sample Grade 3.2 failed initial QC analysis and was omitted from subsequent analysis. % present calls ranged from 54% for intact total RNA (grade 4) to ~40% for significantly degraded RNA (grade 1); see Table 2. Genes called present in grade 4 RNA were used to compare the profiles from the rest of the samples. Approximately 4200 probe sets with a signal intensity ≥50 were called present in intact RNA, compared with >3400 probe sets (~72%) in significantly degraded RNA. As the quality of the RNA improves, the proportion of probe sets called present also increases to 90% and 96% for grades 2 and 3, respectively (Fig. 3). This suggests that for genes with signal intensity ≥50, the number of genes called present is remarkably tolerant of RNA quality.
Another way to compare data sets is by plotting all expression values for one array vs. the expression values of a second array in order to generate a scatterplot. If the two sets of data are identical or very similar, all points should fall on a diagonal with little or no scatter. The greater the distance from the diagonal between data sets, the greater the degree of scatter. Figure 4 shows scatter plots generated by plotting all possible pairs of data generated from analysis of rat duodenum RNA of different quality grades. Interestingly, the scatter within each grade of RNA is minimal as expected for samples that are essentially identical. This result reflects the high reproducibility of the Affymetrix platform, as previously reported (18). The minimum level of scatter probably represents technical noise specific for the platform used and is well within
Page 4 of 25(page number not for citation purposes)

previously reported levels (19). As the integrity of RNA falls, the level of similarity, especially at low intensities, begins to drop. As this method of comparing data is more quantitative than the present/absent calls, it is noteworthy that the distribution remains symmetrical and does not skew, suggesting that the absolute values for individual probe sets both increase and decrease in degraded RNA. We conclude that while quantitative comparisons between data generated from intact and degraded RNA are in fact, affected by RNA quality, the ability to call a transcript present in a given tissue sample can tolerate a significant level of RNA degradation when using the Affymetrix platform.
Individual gene variation
We surveyed the profiles of individual probe sets whose expression signal intensity is 100 or greater (3280 probe sets) and found three broad classes of gene expression. Class 1 contains probe sets whose expression profiles did not exhibit any significant variation across the 7 samples tested and represent mRNAs that are resistant to degradation in postmortem tissues; Class 2 contains probe sets that represent labile RNAs in which signal intensity drops in the samples from intact to degraded RNA samples; Class 3 contains probe sets that actually have higher intensity signals in degraded RNA than those in intact ones. Correlation coefficients between model expression profiles representing each of the 3 classes and the 3280 probe sets are shown in Fig. 5. Approximately 64% of these probe sets (2086) correlated with one of the 3 classes with a score of >0.65. Surprisingly, Class 1 transcripts are under-represented with the majority of transcripts falling in either Class 2 or 3. Some of these changes could be a result of normalization that may alter the relative intensity of probe set signals between arrays. Alternatively, these changes may reflect changes in availability or labeling of transcripts between intact and degraded samples.
Having established from rat RNA that qualitative expression data can be generated for genes expressed above a given level, even in samples exhibiting significant RNA degradation, we analyzed human gene expression data generated from the samples listed in Table 1 to confirm these findings for human RNA. As shown in Fig. 6, for those tissues from which we had isolated RNA of different grades (see Table 3), the percentage of present calls relative to the best grade remained consistent. Using the Pearson correlation, a measure of the degree of linear relationship between two variables, we determined how many probe sets fall into each of the three classes (Table 4). As with the rat RNAs, the percentage of present calls began to drop for genes that had a signal of less than 100. We also generated scatterplots from these tissue data sets and observed that, for genes expressed above a certain level, expression levels were comparable between different grades of RNA (data not shown). Finally, we checked the profiles for the housekeeping genes β actin and GAPDH that should be uniformly expressed in all samples in the database. There was very little variation (±29% and 48% CV, respectively) in expression levels across all 250 samples, indicating that for these genes the variation in RNA quality does not significantly influence the gene expression results quantitatively.
In summary, our evaluation of the effects of RNA degradation on gene expression data derived from Affymetrix oligonucleotide arrays indicates that, even in cases where the original RNA exhibits significant degradation, more than 80% of the probe sets called present in intact RNA are also called present in degraded RNA. We identified a subset of genes whose expression data are more sensitive to degradation and which we have designated “labile” (see Supplementary
Page 5 of 25(page number not for citation purposes)

Information). Furthermore, data generated using the RNAs isolated from the four donor bodies that exhibit various levels of degradation is likely to be representative of gene expression in normal human tissues.
This conclusion can be reflected graphically in expression data derived from our BI. Figure 7 shows examples of individual gene expression. Kallikrein 3 (Prostate-Specific Antigen) is a prostate-specific protease that is used to detect and monitor prostate cancer growth (15). The expression profile clearly shows robust expression in the 4 prostate samples with little or no expression elsewhere (Fig. 7A). We then sought to query genes known to be expressed in the gastrointestinal tract because of its faster RNA degradation characteristics (Fig. 1A). Ghrelin is a small peptide secreted by the fundus of the stomach that is believed to play a role in food intake control (16). As shown in Fig. 7B, ghrelin precursor RNA was detected in all 8 samples from the cardiac and fundus regions of the stomach. As reported previously (16), we did not detect ghrelin RNA in the pyloric region of the stomach (0 of 4 samples). We also show novel sites of expression data for genes that encode potential drug targets. CCL27, a skin-specific chemokine that has been implicated in the etiology of skin inflammation, is also significantly expressed in the nipple (20). As orphan G protein-coupled receptors, GPR22, GPR128, and GPR113 are all potentially interesting therapeutic targets (Fig. 7D–F). It has been reported that GPR22 is expressed in the central nervous system (21), and our data confirms significant expression in discrete regions of the CNS, including the cerebellum, cerebral cortex, and amygdala. We also detected its expression in the heart suggesting that this receptor may play a role in the control or maintenance of cardiac function (Fig. 7E). Both GPR113 and GPR128 have been identified by searching EST sequences for novel GPCRs and predicted to be expressed in the testis alone or testis and colon, respectively (22). However, we found significant GPR113 expression in both the kidney cortex (4 of 4) and medulla (4 of 4), as well as high levels of GPR128 transcript in both the liver (5 of 5) and small intestine (3 of 3). These data underscore the value of our body index for gene expression studies.
Another use of our body index is to identify tissue-specific genes, those that are expressed exclusively in that tissue, or, are expressed at significantly higher levels in that tissue than elsewhere in the body. To exemplify this approach we chose the thymus. We identified 129 transcripts that were greater than eightfold more abundant in the thymus samples than the mean level of the remaining samples. These thymus-specific genes are listed in Table 5 (the full list of genes is included in the Supplementary Information). Many of these are known thymus-specific or T cell-associated genes, a result consistent with their strong thymus expression. However, 3 are not currently known to be thymus associated: OR10R2, SH3TC1, and ASTM; demonstrating the utility of the BI in facilitating novel analyses.
DISCUSSION
The use of postmortem human tissues in biological research poses several challenges. Even under ideal circumstances there will always be a time delay in collecting human postmortem tissue samples, during which the likelihood of RNA degradation increases. A key issue inherent in microarray experiments involving human tissues is what is the minimum level of RNA quality that can be used to generate representative gene expression data. Specifically, the question is whether postmortem tissues are suitable for such studies. This key question motivated us to
Page 6 of 25(page number not for citation purposes)

investigate the quality of microarray data generated from total RNA samples that have already shown signs of degradation.
Our survey of total RNA samples derived from various parts of the human body revealed a consistent trend in RNA quality that is tissue and donor-specific. Several studies have addressed the suitability of RNA samples obtained from tissue banks using various molecular techniques such as Northern blot analyses and real-time quantitative PCR (23). Although the stability of RNA samples varies among tissue types, as we have shown in our study, the quality of a majority of transcripts remain intact (14, 23). The tissue-dependent variation of RNA stability in our study is best exemplified by considering the gut and CNS tissues. RNA was least stable in tissues of the gastrointestinal tract. The presence of normal gut flora (and hence, RNases), the increased rate of tissue turnover or the presence of digestive enzymes in the gut may account for this phenomenon. Although we were eventually able to recapitulate the various grades of RNA that we isolated from human gut tissues using the rat duodenum model, we were surprised to observe the stability of RNA obtained from the postmortem rat duodenum. Others have reported prolonged RNA stability in postmortem rats and have isolated intact RNA up to 3 days postmortem (14). This suggests that the relatively clean environment and controlled diet in which the rats are housed may inhibit the degradation process. RNA stability in the CNS may be explained by the privileged position the CNS occupies in the body. In contrast to the gut, the CNS is one of the most well protected regions of the body, contains tissues that exhibit very low tissue turnover (24), and is a poor source of digestive enzymes.
We excluded all the RNA samples that showed significant degradation (a score of <2 in our index) from our body index. The gut samples in our body index were therefore supplemented with samples from commercial sources likely obtained in the course of scheduled surgeries that exhibit high levels of RNA quality. The majority of RNA samples obtained from other parts of the donor bodies were of sufficient quality to be used in GeneChip studies and constitute the bulk of the samples used to generate the expression index.
There are several possible sources of donor-specific variation including diet (especially for gut tissues), donor’s health status, age, and cause of death. We found that RNAs purified from tissues derived from a donor that died from asphyxia were consistently degraded even from CNS sites. This suggests that the prolonged hypoxia resulting from the lack of respiratory activity at the time of death may have triggered events that led to accelerated RNA degradation.
There have been a number of previous reports addressing expression profiling of degraded RNA samples (23, 25–31). In one study, various grades of RNA degradation were obtained by incubating fragments of normal and malignant renal tissues from nephrectomy at different time points at 22°C, and the subsequent samples were profiled using Affymetrix HG-U133A or HG-Focus arrays to identify differentially regulated genes (28). Interestingly, moderately degraded RNA showed high concordance with intact RNA samples, confirming similar findings in our rat model. In another study, real-time quantitative PCR was used to show that the transcript levels of 3 housekeeping genes (GAPDH, β-actin, and HPRT) and interleukin-1 fell as postmortem intervals increased. Liver samples were found to be the least stable followed by lung, and heart, while brain samples were the most stable (14). With the data presented here, we have confirmed and expanded on these findings and have established a rank order of RNA stability for ~80 tissues in the human body.
Page 7 of 25(page number not for citation purposes)

Because all of the rat duodenum samples were derived from the same tissues and collected from an established laboratory strain of rat, we did not expect significant sample-to-sample variation in gene expression. Rather, signal changes would reflect the degradation state of the RNA used to generate the expression data. In addition to transcripts that are resistant to degradation and show no significant variation between intact and degraded samples, we expected to identify a second class of transcript that is sensitive to RNA degradation. Approximately 45% of the probe sets' detected transcripts fell into this class. Such labile transcripts may contain mRNA instability motifs that are designed to control the half-life of these transcripts in vivo. Certain motifs, such as the adenosine uridine-rich elements (AREs) in the 3′-untranslated region (UTR) of unstable cytokine and chemokine mRNAs, serve as another level of transcriptional control to mediate potent downstream effects of certain genes upon stimulation (32). Another study, using Affymetrix U95Av2 arrays, found a significant correlation between mRNA decay and known ARE motifs (30). We did not detect a higher proportion of AREs in our set of labile transcripts, suggesting that several factors are involved in destabilizing these transcripts. It is not known which mRNA degradation pathways are active in postmortem tissue, but in living cells, the deadenylation ribonucleolytic pathway is the predominant pathway, involving shortening of the poly(A) tail and decapping of the 5′methylguanosine cap (33). There is evidence suggesting a 5′-3′ directionality of RNA degradation, at least in E. coli (34). These transcripts may be poorly represented even in tissue samples that yield RNA of apparently good quality.
An unexpected third class of transcript, also containing ~45% of the probe sets, was identified from our analysis of the rat duodenum RNA data. This class represents probe sets that detect higher levels of transcripts in degraded RNAs than intact RNA. Although this could be a result of the normalization method we used to generate the data, it is possible that these transcripts contain regions of secondary structure that prevent efficient synthesis of labeled cRNA. It is known that reverse transcription can be inhibited by secondary RNA structure (35). Partial degradation of such transcripts may remove the blocking secondary structure resulting in more efficient synthesis of labeled probe and increased signal intensity.
These data indicate that for the vast majority of genes, valuable expression data can be obtained from either intact or significantly degraded RNA, when using the Affymetrix platform. An explanation for the tolerance of this platform to degraded RNA samples may lie in the nature of the Affymetrix GeneChip design, which is 3′-biased. The requirements for successful GeneChip detection include the presence of a poly(A) tail and that the last 600 bases of a given transcript be intact. As long as these critical regions remain contiguous, useful GeneChip data should still be obtained. We have not investigated whether other platforms, such as cDNA microarrays, would tolerate degraded samples as well as the Affymetrix GeneChip platform. We speculate that the location of primers needed to generate PCR products specific to the target of interest in a cDNA microarray experiment determines how well the array is able to detect probes generated from degraded RNA.
We have shown that our BI of expression accurately reflects the established expression profiles for 2 genes: kallikrein 3 and ghrelin precursor. We detected high levels of expression of the kallikrein 3 transcripts in all four prostate samples and expression of ghrelin in the fundus and cardiac stomach but, significantly, not in the pyloric stomach, as previously reported (16). Neither transcript is detected elsewhere. In addition to genes with known expression sites, we
Page 8 of 25(page number not for citation purposes)

were able to identify novel sites of expression for 4 genes that encode potential therapeutic targets. We have confirmed these profiles using real-time quantitative PCR (data not shown).
Another use of our body index is to identify genes with certain tissue specificities or strong expression in certain tissues compared with other tissues. To exemplify this approach, we searched for genes that are expressed exclusively or predominantly in the thymus compared with the rest of the BI. As shown in Table 5, we identified many genes that show strong thymus expression and in some cases organ specificity. Many previously characterized thymus-specific genes were identified and also many genes associated with T lymphocytes, including multiple T cell receptor subunits, CD1, CD8α and β, RAG 1, and RAG2. Also of note are the chemokine CCL25 and its receptor CCR9. CCL25 was initially described as TECK (for thymus-expressed chemokine) (36). This chemokine is strongly expressed in the thymus but also, at a much lower level, in the small intestine. Interestingly, its receptor CCR9 (37) exhibits a higher thymus expression ratio (30.9 vs. 17.12 for CCL25) probably because it is present at much lower levels in the gut than CCL25. In any case, if we did not know that these genes constituted a ligand-receptor pair, the data in Table 5 would have suggested this. It is important to emphasize that many of these genes are of central importance to the function of the thymus, that is, the development of T cells from immature precursors. Thus, the ability to identify these organ-specific genes should allow us to learn new concepts about the function of many genes.
Table 5 also lists 3 genes that are not known to be expressed in the thymus. The G protein-coupled receptor, OR10R2, is highly expressed in the thymus with little or no expression in the other tissues of the BI. This gene is currently classified as an olfactory receptor and is closely related to other human olfactory receptors (38). SH3 domain and tetratricopeptide repeats 1 (SH3TC1) is a recently described gene encoding a large evolutionarily conserved protein that contains one SH3-like domain and multiple tetratricopeptide repeats that are associated with protein–protein and multiprotein complex interactions. The third new thymus-specific gene is abnormal spindle-like, microcephaly-associated (ASPM) gene. The ASPM gene product has been reported to be required for normal mitotic spindle function in embryonic neuroblasts, and truncation mutants of the gene are associated with microcephaly in humans (39, 40). As it is expressed at high levels in the thymus but also, at significantly lower levels in other lymphoid tissues such as bone marrow and tonsil, it is tempting to speculate that ASPM gene product may be associated with cell division, a phenomenon that occurs with unusual frequency in the thymus.
Although many thymus-specific genes are known, we are currently querying the BI using a similar approach to identify tissue-specific genes from other organs and specially the CNS. Our BI is a powerful tool to uncover genes strongly associated with the physiology of different organs and cells.
In summary, we have used postmortem tissues to construct an index of gene expression in the adult human body. We have shown that a set of samples that include both intact and partially degraded RNA can be used to generate a valuable resource that accurately reflects the expression of most, if not all, the genes in the human genome. We conclude that our BI is a valuable resource for probing gene expression in many human tissues.
Page 9 of 25(page number not for citation purposes)

REFERENCES
1. Lockhart, D. J., Dong, H., Byrne, M. C., Follettie, M. T., Gallo, M. V., Chee, M. S., Mittmann, M., Wang, C., Kobayashi, M., Horton, H., et al. (1996) Expression monitoring by hybridization to high-density oligonucleotide arrays. Nat. Biotechnol. 14, 1675–1680
2. Granucci, F., Vizzardelli, C., Virzi, E., Rescigno, M., and Ricciardi-Castagnoli, P. (2001) Transcriptional reprogramming of dendritic cells by differentiation stimuli. Eur. J. Immunol. 31, 2539–2546
3. Ryan, C. A., Gildea, L. A., Hulette, B. C., Dearman, R. J., Kimber, I., and Gerberick, G. F. (2004) Gene expression changes in peripheral blood-derived dendritic cells following exposure to a contact allergen. Toxicol. Lett. 150, 301–316
4. Greenberg, S. A., Sanoudou, D., Haslett, J. N., Kohane, I. S., Kunkel, L. M., Beggs, A. H., and Amato, A. A. (2002) Molecular profiles of inflammatory myopathies. Neurology 59, 1170–1182
5. Humphreys-Beher, M. G., King, F. K., Bunnel, B., and Brody, B. (1986) Isolation of biologically active RNA from human autopsy for the study of cystic fibrosis. Biotechnol. Appl. Biochem. 8, 392–403
6. Iwamoto, K., Kakiuchi, C., Bundo, M., Ikeda, K., and Kato, T. (2004) Molecular characterization of bipolar disorder by comparing gene expression profiles of postmortem brains of major mental disorders. Mol. Psychiatry 9, 406–416
7. van 't Veer, L. J., Dai, H., van de Vijver, M. J., He, Y. D., Hart, A. A., Mao, M., Peterse, H. L., van der Kooy, K., Marton, M. J., Witteveen, A. T., et al. (2002) Gene expression profiling predicts clinical outcome of breast cancer. Nature 415, 530–536
8. Schmidt, W. M., Kalipciyan, M., Dornstauder, E., Rizovski, B., Sedivy, R., Steger, G. G., Muller, M. W., and Mader, R. M. (2003) Gene expression profiling of colon cancer reveals a broad molecular repertoire in 5-fluorouracil resistance. Int. J. Clin. Pharmacol. Ther. 41, 624–625
9. Schmidt, W. M., Kalipciyan, M., Dornstauder, E., Rizovski, B., Steger, G. G., Sedivy, R., Mueller, M. W., and Mader, R. M. (2004) Dissecting progressive stages of 5-fluorouracil resistance in vitro using RNA expression profiling. Int. J. Cancer 112, 200–212
10. Gonzalez-Maeso, J., Torre, I., Rodriguez-Puertas, R., Garcia-Sevilla, J. A., Guimon, J., and Meana, J. J. (2002) Effects of age, postmortem delay and storage time on receptor-mediated activation of G-proteins in human brain. Neuropsychopharmacology 26, 468–478
11. Serralta, A., Donato, M. T., Orbis, F., Castell, J. V., Mir, J., and Gomez-Lechon, M. J. (2003) Functionality of cultured human hepatocytes from elective samples, cadaveric grafts and hepatectomies. Toxicol. In Vitro 17, 769–774
Page 10 of 25(page number not for citation purposes)

12. Mimmack, M. L., Brooking, J., and Bahn, S. (2004) Quantitative polymerase chain reaction: validation of microarray results from postmortem brain studies. Biol. Psychiatry 55, 337–345
13. Hsiao, L. L., Dangond, F., Yoshida, T., Hong, R., Jensen, R. V., Misra, J., Dillon, W., Lee, K. F., Clark, K. E., Haverty, P., et al. (2001) A compendium of gene expression in normal human tissues. Physiol. Genomics 7, 97–104
14. Inoue, H., Kimura, A., and Tuji, T. (2002) Degradation profile of mRNA in a dead rat body: basic semi-quantification study. Forensic Sci. Int. 130, 127–132
15. Papsidero, L. D., Kuriyama, M., Wang, M. C., Horoszewicz, J., Leong, S. S., Valenzuela, L., Murphy, G. P., and Chu, T. M. (1981) Prostate antigen: a marker for human prostate epithelial cells. J. Natl. Cancer Inst. 66, 37–42
16. Kojima, M., Hosoda, H., Date, Y., Nakazato, M., Matsuo, H., and Kangawa, K. (1999) Ghrelin is a growth-hormone-releasing acylated peptide from stomach. Nature 402, 656–660
17. Irizarry, R. A., Bolstad, B. M., Collin, F., Cope, L. M., Hobbs, B., and Speed, T. P. (2003) Summaries of Affymetrix GeneChip probe level data. Nucleic Acids Res. 31, e15
18. Huang, S., Qian, H. R., Geringer, C., Love, C., Gelbert, L., and Bemis, K. (2003) Assessing the variability in GeneChip data. Am. J. Pharmacogenomics 3, 279–290
19. Shippy, R., Sendera, T. J., Lockner, R., Palaniappan, C., Kaysser-Kranich, T., Watts, G., and Alsobrook, J. (2004) Performance evaluation of commercial short-oligonucleotide microarrays and the impact of noise in making cross-platform correlations. BMC Genomics 5, 61
20. Homey, B., Alenius, H., Muller, A., Soto, H., Bowman, E. P., Yuan, W., McEvoy, L., Lauerma, A. I., Assmann, T., Bunemann, E., et al. (2002) CCL27-CCR10 interactions regulate T cell-mediated skin inflammation. Nat. Med. 8, 157–165
21. O'Dowd, B. F., Nguyen, T., Jung, B. P., Marchese, A., Cheng, R., Heng, H. H., Kolakowski, L. F., Jr., Lynch, K. R., and George, S. R. (1997) Cloning and chromosomal mapping of four putative novel human G-protein-coupled receptor genes. Gene 187, 75–81
22. Fredriksson, R., Hoglund, P. J., Gloriam, D. E., Lagerstrom, M. C., and Schioth, H. B. (2003) Seven evolutionarily conserved human rhodopsin G protein-coupled receptors lacking close relatives. FEBS Lett. 554, 381–388
23. Jewell, S. D., Srinivasan, M., McCart, L. M., Williams, N., Grizzle, W. H., LiVolsi, V., MacLennan, G., and Sedmak, D. D. (2002) Analysis of the molecular quality of human tissues: an experience from the Cooperative Human Tissue Network. Am J Clin Pathol 118, 733-741
Page 11 of 25(page number not for citation purposes)

24. Bahn, S., Augood, S. J., Ryan, M., Standaert, D. G., Starkey, M., and Emson, P. C. (2001) Gene expression profiling in the post-mortem human brain–no cause for dismay. J. Chem. Neuroanat. 22, 79–94
25. Johnson, S. A., Morgan, D. G., and Finch, C. E. (1986) Extensive postmortem stability of RNA from rat and human brain. J. Neurosci. Res. 16, 267–280
26. Preece, P., Virley, D. J., Costandi, M., Coombes, R., Moss, S. J., Mudge, A. W., Jazin, E., and Cairns, N. J. (2003) An optimistic view for quantifying mRNA in post-mortem human brain. Brain Res. Mol. Brain Res. 116, 7–16
27. Sanoudou, D., Kang, P. B., Haslett, J. N., Han, M., Kunkel, L. M., and Beggs, A. H. (2004) Transcriptional profile of postmortem skeletal muscle. Physiol. Genomics 16, 222–228
28. Schoor, O., Weinschenk, T., Hennenlotter, J., Corvin, S., Stenzl, A., Rammensee, H. G., and Stevanovic, S. (2003) Moderate degradation does not preclude microarray analysis of small amounts of RNA. Biotechniques 35, 1192–1196, 1198-1201
29. Tomita, H., Vawter, M. P., Walsh, D. M., Evans, S. J., Choudary, P. V., Li, J., Overman, K. M., Atz, M. E., Myers, R. M., Jones, E. G., et al. (2004) Effect of agonal and postmortem factors on gene expression profile: quality control in microarray analyses of postmortem human brain. Biol. Psychiatry 55, 346–352
30. Yang, E., van Nimwegen, E., Zavolan, M., Rajewsky, N., Schroeder, M., Magnasco, M., and Darnell, J. E., Jr. (2003) Decay rates of human mRNAs: correlation with functional characteristics and sequence attributes. Genome Res. 13, 1863–1872
31. Auer, H., Lyianarachchi, S., Newsom, D., Klisovic, M. I., Marcucci, G., Kornacker, K., and Marcucci, U. (2003) Chipping away at the chip bias: RNA degradation in microarray analysis. Nat. Genet. 35, 292–293
32. Tebo, J., Der, S., Frevel, M., Khabar, K. S., Williams, B. R., and Hamilton, T. A. (2003) Heterogeneity in control of mRNA stability by AU-rich elements. J. Biol. Chem. 278, 12,085–12,093
33. Wilusz, C. J., Wormington, M., and Peltz, S. W. (2001) The cap-to-tail guide to mRNA turnover. Nat. Rev. Mol. Cell Biol. 2, 237–246
34. Selinger, D. W., Saxena, R. M., Cheung, K. J., Church, G. M., and Rosenow, C. (2003) Global RNA half-life analysis in Escherichia coli reveals positional patterns of transcript degradation. Genome Res. 13, 216–223
35. Malboeuf, C. M. I., S. J. Tran, N. H. and Kim, B. (2001) Thermal effects on reverse transcription: Improvement of accuracy and processivity in cDNA synthesis. BioTechniques 30, 1074–1085
36. Vicari, A. P., Figueroa, D. J., Hedrick, J. A., Foster, J. S., Singh, K. P., Menon, S., Copeland, N. G., Gilbert, D. J., Jenkins, N. A., Bacon, K. B., et al. (1997) TECK: a novel
Page 12 of 25(page number not for citation purposes)

CC chemokine specifically expressed by thymic dendritic cells and potentially involved in T cell development. Immunity 7, 291–301
37. Norment, A. M., Bogatzki, L. Y., Gantner, B. N., and Bevan, M. J. (2000) Murine CCR9, a chemokine receptor for thymus-expressed chemokine that is up-regulated following pre-TCR signaling. J. Immunol. 164, 639–648
38. Malnic, B., Godfrey, P. A., and Buck, L. B. (2004) The human olfactory receptor gene family. Proc. Natl. Acad. Sci. USA 101, 2584–2589
39. Bond, J., Scott, S., Hampshire, D. J., Springell, K., Corry, P., Abramowicz, M. J., Mochida, G. H., Hennekam, R. C., Maher, E. R., Fryns, J. P., et al. (2003) Protein-truncating mutations in ASPM cause variable reduction in brain size. Am. J. Hum. Genet. 73, 1170–1177
40. Bond, J., Roberts, E., Mochida, G. H., Hampshire, D. J., Scott, S., Askham, J. M., Springell, K., Mahadevan, M., Crow, Y. J., Markham, A. F., et al. (2002) ASPM is a major determinant of cerebral cortical size. Nat. Genet. 32, 316–320
Received December 23, 2004; accepted April 15, 2005
Page 13 of 25(page number not for citation purposes)
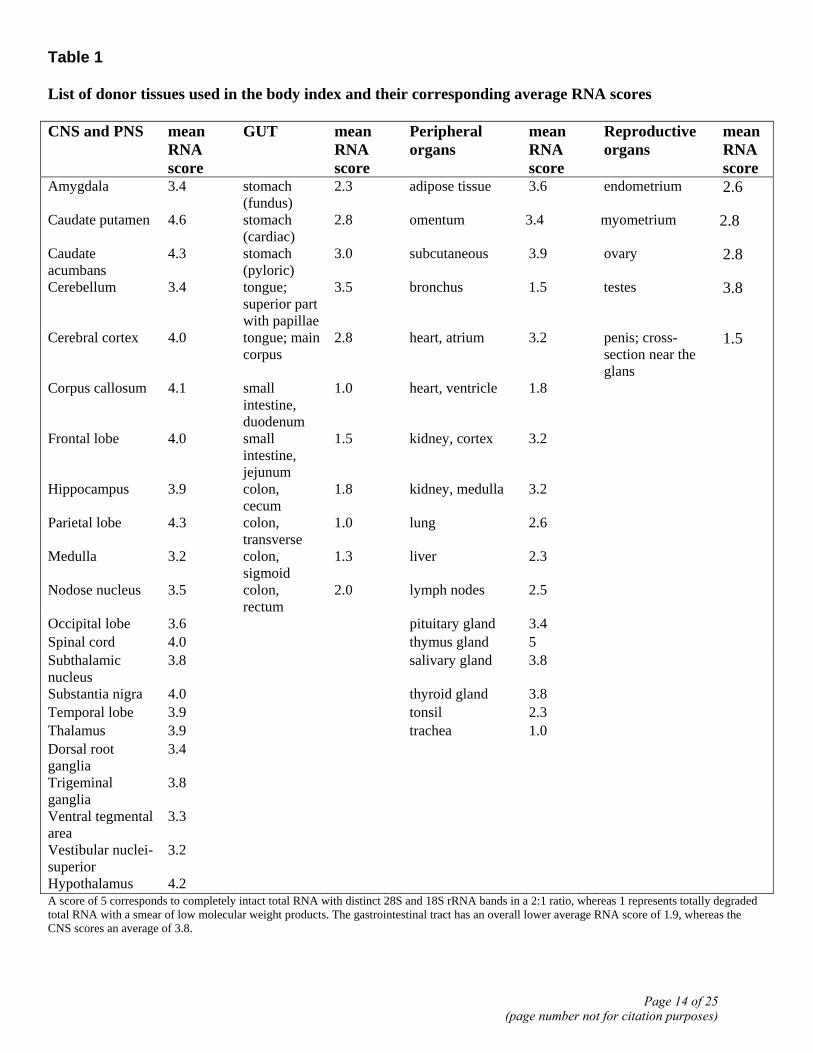
Table 1 List of donor tissues used in the body index and their corresponding average RNA scores CNS and PNS mean
RNA score
GUT mean RNA score
Peripheral organs
mean RNA score
Reproductive organs
mean RNA score
Amygdala 3.4 stomach (fundus)
2.3 adipose tissue 3.6 endometrium 2.6
Caudate putamen 4.6 stomach (cardiac)
2.8 omentum 3.4 myometrium 2.8
Caudate acumbans
4.3 stomach (pyloric)
3.0 subcutaneous 3.9 ovary 2.8
Cerebellum 3.4 tongue; superior part with papillae
3.5 bronchus 1.5 testes 3.8
Cerebral cortex 4.0 tongue; main corpus
2.8 heart, atrium 3.2 penis; cross-section near the glans
1.5
Corpus callosum 4.1 small intestine, duodenum
1.0 heart, ventricle 1.8
Frontal lobe 4.0 small intestine, jejunum
1.5 kidney, cortex 3.2
Hippocampus 3.9 colon, cecum
1.8 kidney, medulla 3.2
Parietal lobe 4.3 colon, transverse
1.0 lung 2.6
Medulla 3.2 colon, sigmoid
1.3 liver 2.3
Nodose nucleus 3.5 colon, rectum
2.0 lymph nodes 2.5
Occipital lobe 3.6 pituitary gland 3.4 Spinal cord 4.0 thymus gland 5 Subthalamic nucleus
3.8 salivary gland 3.8
Substantia nigra 4.0 thyroid gland 3.8 Temporal lobe 3.9 tonsil 2.3 Thalamus 3.9 trachea 1.0 Dorsal root ganglia
3.4
Trigeminal ganglia
3.8
Ventral tegmental area
3.3
Vestibular nuclei-superior
3.2
Hypothalamus 4.2 A score of 5 corresponds to completely intact total RNA with distinct 28S and 18S rRNA bands in a 2:1 ratio, whereas 1 represents totally degraded total RNA with a smear of low molecular weight products. The gastrointestinal tract has an overall lower average RNA score of 1.9, whereas the CNS scores an average of 3.8.
Page 14 of 25(page number not for citation purposes)

Table 2 Quality control metrics on rat duodenum chip data 4.1 4.2 3.1 3.2 2.1 2.2 1.1 1.2 % Present 54.0 54.8 51.9 40.5 46.8 48.1 40.0 39.3 % Absent 44.0 43.3 45.9 57.1 51.1 49.9 57.6 58.6 % Marginal 2.0 1.9 2.1 2.5 2.2 2.1 2.4 2.1 Average signal (P) 228.2 246.7 181.0 93.1 85.2 90.3 56.1 54.4 Average signal (M) 45.1 48.0 48.0 23.7 23.3 25.6 16.5 13.7 Average signal (A) 18.5 21.3 19.4 11.3 9.6 11.1 7.2 6.1 Average signal (All) 132.2 145.3 103.9 44.7 45.3 49.5 27.0 25.2 Affymetrix present/absent/marginal calls and corresponding average signal intensities on the four different grades of total RNA samples. Totally degraded RNA has the lowest % “present” call, as well as average signal.
Page 15 of 25(page number not for citation purposes)

Table 3 Present calls on different grades of RNA obtained from various tissue types across 4 different donors Donor ID Tissue ID RNA grade % ps present
2 Skeletal muscle 1 30.64% 3 Skeletal muscle 3 33.90% 4 Skeletal muscle 1 33.38% 2 Vestibular nuclei-superior 1 42.72% 3 Vestibular nuclei-superior 4 45.35% 4 Vestibular nuclei-superior 4 44.20% 1 Tongue-papillae 1 37.50% 2 Tongue-papillae 1 41.53% 3 Tongue-papillae 4 42.97% 4 Tongue-papillae 3 39.88% 1 Midbrain 1 40.52% 2 Midbrain 4 42.97% 3 Midbrain 4 42.03% 4 Midbrain 4 40.59%
Page 16 of 25(page number not for citation purposes)

Table 4 Three classes of probe set profiles with different sensitivity to RNA degradation Pearson Class 1 Class 2 Class 3 Total 0.65 137 1125 824 2086 0.75 28 745 713 1486 0.8 9 540 633 1182 0.9 1 198 385 584 Probe sets with average signal intensities of 100 or greater that exhibit 1) flat intensity across different grades of rat duodenum total RNA (as depicted by Fig. 5A), 2) decreasing intensities as RNA grade deteriorates (Fig. 5B), and 3) increasing intensities with degraded RNA (Fig. 5C). Pearson correlations of increasing stringency were used to determine how many probe sets belong to each of the 3 classes. About half of the probe sets have the expected decrease in signal intensity as RNA quality decreases. Surprisingly, the other half of the probe sets actually have increased signal as RNA quality worsens.
Page 17 of 25(page number not for citation purposes)

Table 5 Identification of thymus-specific genes Ratio Thymus vs. BA_4 mean
Gene Title Gene Symbol
127.13 CD1E antigen, e polypeptide CD1E 61.06 DNA-binding protein SATB1 (Special AT-rich sequence binding protein 1). SATB1 59.20 protease, serine, 16 (thymus) PRSS16 55.15 recombination activating gene 1 RAG1 46.36 leukocyte receptor cluster (LRC) member 10 LENG10 44.88 Homo sapiens transcribed sequences, probably CD38 CD38 42.56 SH2 domain protein 1A, Duncan's disease (lymphoproliferative syndrome) SH2D1A 40.35 deoxynucleotidyltransferase, terminal DNTT 37.14 Homo sapiens T cell receptor beta chain BV20S1 BJ1-5 BC1 mRNA, complete
cds ---
35.94 lymphoid enhancer-binding factor 1 LEF1 32.61 Homo sapiens cDNA FLJ32992 fis, clone THYMU1000098.(olfactory receptor
10R2) OR10R2
30.19 chemokine (C-C motif) receptor 9 CCR9 28.38 CD1A antigen, a polypeptide CD1A 25.99 B-cell CLL/lymphoma 11B (zinc finger protein) BCL11B 25.82 lymphocyte-specific protein tyrosine kinase LCK 24.47 CD1B antigen, b polypeptide CD1B 24.20 cyclic AMP-regulated phosphoprotein, 21 kD ARPP-21 23.17 adenosine deaminase ADA 22.34 ras homolog gene family, member H RHOH 22.28 topoisomerase (DNA) II alpha 170kDa TOP2A 21.15 growth hormone 1 GH1 20.53 Ras association (RalGDS/AF-6) domain family 6 RASSF6 20.18 recombination activating gene 2 RAG2 19.97 zeta-chain (TCR) associated protein kinase 70kDa ZAP70 19.66 CD8 antigen, alpha polypeptide (p32) CD8A 18.77 IL2-inducible T-cell kinase ITK 18.71 B-cell CLL/lymphoma 11B (zinc finger protein) BCL11B 18.36 CD3D antigen, delta polypeptide (TiT3 complex) CD3D 18.36 ubiquitin-like, containing PHD and RING finger domains, 1 UHRF1 18.32 CD8 antigen, beta polypeptide 1 (p37) CD8B1 17.97 transcription factor 7 (T-cell specific, HMG-box) TCF7 17.91 cathepsin L2 CTSL2 17.90 SH3 domain and tetratricopeptide repeats 1 SH3TC1 17.35 TTK protein kinase TTK 17.29 asp (abnormal spindle)-like, microcephaly associated (Drosophila) ASPM 17.15 v-myb myeloblastosis viral oncogene homolog (avian) MYB 17.14 chemokine (C-C motif) ligand 25 CCL25 16.85 Prolactin PRL 16.46 Probably CD99 CD99 15.79 cholinergic receptor, nicotinic, alpha polypeptide 3 CHRNA3
Page 18 of 25(page number not for citation purposes)

Fig. 1
Figure 1. Agarose gel electrophoresis of human total RNA. Total RNA extracted from the CNS (A) and GI tract (B) from 4 different donors (1–4), showing various levels of degradation. Those derived from the CNS are generally intact, whereas those derived from the GI tract are significantly degraded.
Page 19 of 25(page number not for citation purposes)

Fig. 2
Figure 2. Agarose gel electrophoresis of post-mortem rat total RNA. A) Total RNA isolated from rat tissues at 0, 3, or 6 h post-mortem. S; stomach, D; duodenum, BM; bone marrow, C; cerebral hemispheres. We did not isolate bone marrow from the 6 h rat. B) Rat duodenum tissues extracted at time 0 h and immediately frozen in liquid nitrogen, or incubated at 37°C in PBS at 1, 3, or 5 h before TRIzol RNA extraction. 0 h-samples are considered intact total RNA, Grade 4, whereas Grade 1 corresponds to significantly degraded RNA.
Page 20 of 25(page number not for citation purposes)

Fig. 3
Figure 3. Comparison of probe sets called “present” between degraded and intact total RNA. The number of probe sets called present with a signal intensity ≥50 is shown for the rat duodenum total RNAs included in the study. Sample 3.2 was discarded from the analysis due to a poor hybridization. RNA grades are as follows; 1; significantly degraded, 2; degraded, 3 partially degraded, 4; intact.
Page 21 of 25(page number not for citation purposes)

Fig. 4
Figure 4. Matrix plot of all data points across 7 out of 8 samples from rat duodenum (Grade 3.2 sample was discarded from the analysis due to a poor hybridization). There should be minimal scatter within a replicate set as they should be essentially identical, as shown by boxes between Grades 4.1 and 4.2, and 2.1 and 2.2.The profile of moderately degraded sample (grade 3) more closely resembles that of intact RNA, suggesting a good correlation between these two grades of RNA.
Page 22 of 25(page number not for citation purposes)
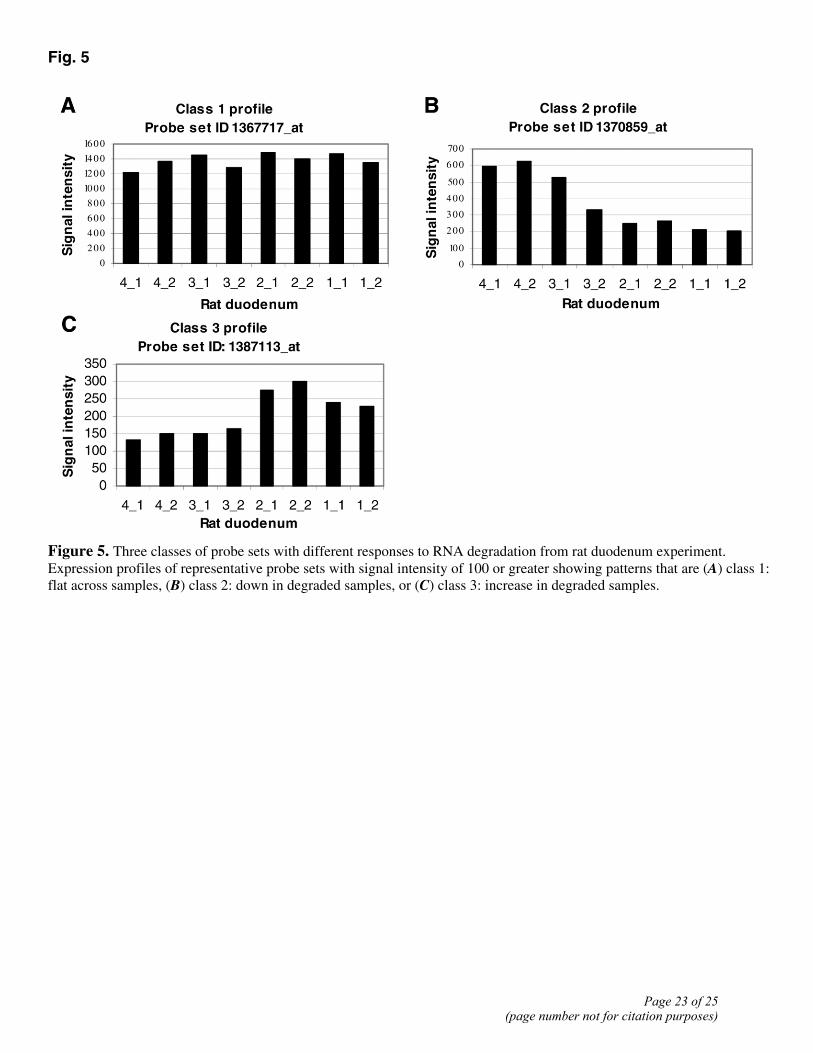
Fig. 5
Figure 5. Three classes of probe sets with different responses to RNA degradation from rat duodenum experiment. Expression profiles of representative probe sets with signal intensity of 100 or greater showing patterns that are (A) class 1: flat across samples, (B) class 2: down in degraded samples, or (C) class 3: increase in degraded samples.
Page 23 of 25(page number not for citation purposes)

Fig. 6
Figure 6. “Present” calls increase with signal intensity for RNA obtained from 4 different human tissues. The number of probe sets called present between intact RNA (with a RNA score of 3 or 4) and significantly degraded RNA (a score of 1) increases with increasing signal intensity. The highest “present” calls within each tissue type is adjusted to be 100% present.
Page 24 of 25(page number not for citation purposes)

Fig. 7
Figure 7. Expression profiles showing both known and novel sites of gene expression in the body index. Affymetrix GeneChip data for 6 genes are shown as normalized RMA values (y axis) plotted against the corresponding 250 samples listed in Table 1 and the supplementary information. A) kallikrein 3 (PSA), B) ghrelin precursor, C) CCL27, D) GPR22, E) GPR113, and F) GPR128. Multiple samples from the same tissue are grouped. The ~80 tissues in the body index of expression are grouped by system, shown as bars below each histogram: CNS; central nervous system, PNS; peripheral nervous system, GUT; gastrointestinal, OTHER; peripheral organs and tissues, IMM; immunological, VASC; vascular, ENDO; endocrine, REPRO; reproductive. Sites of higher expression are shown in red and labeled as follows: A, amygdala, Cb, cerebellum, CC, cerebral cortex, H, heart, K, kidney, L, liver, N, nipple, P, prostate, SI, small intestine, Sk, skin; St, stomach.
Page 25 of 25
(page number not for citation purposes)