Multi-Compartment T2 Relaxometry Using a Spatially Constrained Multi-Gaussian Model
Upload
independentCategory
view
1download
0
Evaluation of the efficacy of oral deferipronein b-thalassemia major by multislicemultiecho T2*
b-Thalassemia major (TM) is the most commongenetic disorder worldwide (1). Survival depends onlifelong blood transfusions, resulting in iron over-load. Iron excess, even when mild, is the maincofactor in the morbidity of several disordersincluding cancer, chronic liver disease, arthritis,and cardiovascular diseases (2).Although the survival of patients with b-TM is
good and has improved in recent years, heartfailure remains the major cause of death in thispopulation, and cardiac iron toxicity is consideredthe leading cause of heart failure (3). The iron
chelator desferrioxamine (DF), a large, hexadentatemolecule, remains the only chelator approved forregular use in North America and the only first-lineagent approved for use in Europe. Although DFimproves heart, hepatic, and endocrine functionand increases survival in subjects with iron burden(4, 5), it is costly (6), causes visual, and auditory (7)side effects, skeletal abnormalities (8), growthretardation (9), and requires daily parenteraladministration. The high mortality in TM patientsis partly the result of difficulties with DF admin-istration, requiring long subcutaneous or intra-
Pepe A, Lombardi M, Positano V, Cracolici E, Capra M, Malizia R,Prossomariti L, De Marchi D, Midiri M, Maggio A. Evaluation of theefficacy of oral deferiprone in b-thalassemia major by multislicemultiecho T2*.Eur J Haematol 2006: 76: 183–192. � Blackwell Munksgaard 2005.
Abstract: Objectives: Oral deferiprone (L1) appears to be promising inthe treatment of b-thalassemia major (TM) patients. T2* magnetic res-onance imaging (MRI) with a single measurement in the mid-ventricularseptum was validated as a quantitative evaluation of myocardial ironoverload. Previous studies suggested a marked heterogeneity of irondistribution in the myocardium. We set up a multislice multiechoT2* MRI for the detection of this heterogeneity. The aim of ourstudy was to investigate differences between the L1 vs. the sub-cutaneous desferrioxamine (DF)-treated patients using this newapproach. Methods: Thirty-six b-TM patients (age 29 ± 8 yr) under-went MRI. Eighteen patients received long-term L1, and 18 other pa-tients matched for age and sex received DF. T2* multiecho sequences onthree short axis views of the left ventricle were obtained and analyzed bycustom-made software. In each slice, the myocardium was automaticallysegmented into four segments. Cine-dynamic images were also obtainedto evaluate biventricular function. Results: For multislice T2* tech-nique, the coefficient of variation for intra- and inter-observer, and inter-study reproducibility was 3.9%, 4.7%, and 5.5%, respectively. Theglobal heart T2* value was significantly higher in the L1 vs. DFgroup (35 ± 7 vs. 27 ± 2 ms; P ¼ 0.02). The number of segmentswith normal T2* value (>20 ms) was significantly higher in the L1vs. the DF group (11 ± 1 vs. 8 ± 5 segments; P ¼ 0.03). We did notdetect significant differences in biventricular function parameters.Conclusions: This new approach confirms that L1 could be moreeffective than DF in removal of myocardial iron.
Alessia Pepe1,2,3, MassimoLombardi1, Vincenzo Positano1,Eliana Cracolici3, Marcello Capra4,Roberto Malizia5, LucianoProssomariti6, Daniele De Marchi1,Massimo Midiri3, Aurelio Maggio71MRI Laboratory, Institute of Clinical Physiology, CNR,Pisa, Italy; 2Department of Cardiology, University ofPalermo, Palermo, Italy; 3Department of Radiology,University of Palermo, Palermo, Italy; 4Pediatria per leEmopatie Ereditarie, G. Di Cristina Hospital ARNAS,Palermo, Italy; 5Pediatria II per le Emopatie Ereditarie,Villa Sofia-CTO Hospital, Palermo, Italy; 6Centro per laCura delle Microcitemie, Cardarelli Hospital, Napoli,Italy; 7Ematologia II con Talassemia, V. CervelloHospital, Palermo, Italy
Key words: magnetic resonance imaging; iron overload;chelation treatment; b-thalassemia; multislicemultiecho T2*
Correspondence: Alessia Pepe, MRI Laboratory, Instituteof Clinical Physiology, CNR, Via Moruzzi, 1 56124 Pisa,ItalyTel: +39 050 3152818Fax: +39 050 3152166e-mail: [email protected]
Accepted for publication 28 August 2005
Eur J Haematol 2006: 76: 183–192doi:10.1111/j.1600-0609.2005.00587.xAll rights reserved
Copyright � Blackwell Munksgaard 2005
EUROPEANJOURNAL OF HAEMATOLOGY
183
venous infusions and causing inadequate compli-ance in the majority of the cases. For these reasons,several oral iron chelators have been studied (10,11). Among these, to date, only deferiprone (L1), abidentate molecule, has been introduced for clinicaluse as a second-line orally active chelator.Although results of dose-response studies suggestthat iron excretion is lower with L1 than with DF(12), L1 appears to be promising in medium-termclinical trials (12, 13). A large multi-center rand-omized clinical trial showed that over a relativelyshort time period in patients with relatively lowinitial serum ferritin concentration, L1 had an ironchelating effect not significantly different from DFand proved to be satisfactorily safe (14). However,the long-term effectiveness of this drug has beenquestioned because liver iron concentration is highin some patients (15, 16).
The main goal of the chelation treatment is toprevent cardiac iron toxicity, so the direct meas-urement of myocardial iron should be taken intoaccount in the evaluation of the effectiveness ofchelating drugs. In addition, conventional cardiacmonitoring, including physical exam, ECG, andechocardiogram, fails to predict iron-induced car-diac disease prior to the onset of clinical symptoms(17), and iron-induced heart damage is both treat-able and potentially reversible (18, 19).
Recently T2* magnetic resonance imaging (MRI)with a single measurement in the mid-ventricularseptum was validated as a quantitative evaluationof myocardial iron overload (19–24). A crosssectional clinical study using this technique sugges-ted that oral L1 is more effective than DF in theremoval of myocardial iron (21). Moreover, aretrospective analysis on the comparative effectsof L1 vs. DF on survival and cardiac disease inpatients with TM suggested that L1 provides agreater cardio-protective effect against the toxicityof iron overload than does subcutaneous DF (25).
However, postmortem (26) and living patientstudies (27, 28) have clearly suggested that iron isdistributed in the hemochromatotic heart in a non-homogeneous fashion. The effects of this ironheterogeneity distribution, which could play animportant role in iron-induced cardiomyopathy,remain unexplored with a single T2* measurementin the mid-ventricular septum.
We set up a multislice multiecho T2* cardio-vascular magnetic resonance approach for thedetection of the heterogeneous distribution ofmyocardial iron overload. Our aim was toinvestigate differences between L1- and DF-trea-ted patients using this approach and correlatesegmental and global heart T2* values withbiventricular function parameters and liver T2*values.
Materials and methods
Study population
We studied 36 b-TM patients (16 men) with a meanage of 29 ± 8 yr. We included consecutively 18patients who received chelation with L1 alone forlonger than 24 months (mean: 45 ± 21 months).For each L1 patient, we assigned one controlpatient with b-TM who was receiving standardsubcutaneous DF. The two groups were matchedfor age (L1 group 29 ± 10 yr vs. DF group31 ± 5 yr, P ¼ 0.4), sex (L1 group M/F 10/8 vs.DF group M/F 5/13, P ¼ 0.2), overall duration ofchelation treatment (L1 group 20 ± 7 yr vs. DFgroup 21 ± 5 yr, P ¼ 0.5), hemoglobin (Hb) pre-transfusion, mean urinary iron excretion levels for12 months prior to the scan, and diabetes mellitus(Table 1). The reason for starting L1 was refusal orinability to comply with subcutaneous regimen in14 patients and toxic effects of DF in four patients.The mean administered dose of L1 was 75 mg/kgbody weight divided into three doses per day. Themean dose of DF was 50 mg/kg body weight viasubcutaneous administration on 5 d/wk. All pa-tients had been regularly transfused since earlychildhood and had received chelation treatmentsince mid-to-late 1970s. All clinical and laboratoryinvestigations were done at the thalassemia centerswhere the patients were treated. None of thepatients were in decompensated heart failure atthe time of scanning. In addition, 20 healthyvolunteers (14 males) with a mean age of 33 ± 9were scanned. Written informed consent wasobtained from all subjects. The institutional reviewboard approved this study.
Magnetic resonance assessment of ventricular function,and myocardial and liver iron
Magnetic resonance acquisition was performedusing a 1.5 T MR scanner (GE, Signa CV/I,Milwaukee, WI, USA). Steady-state free proces-sion cines were acquired during 10 s breath holds
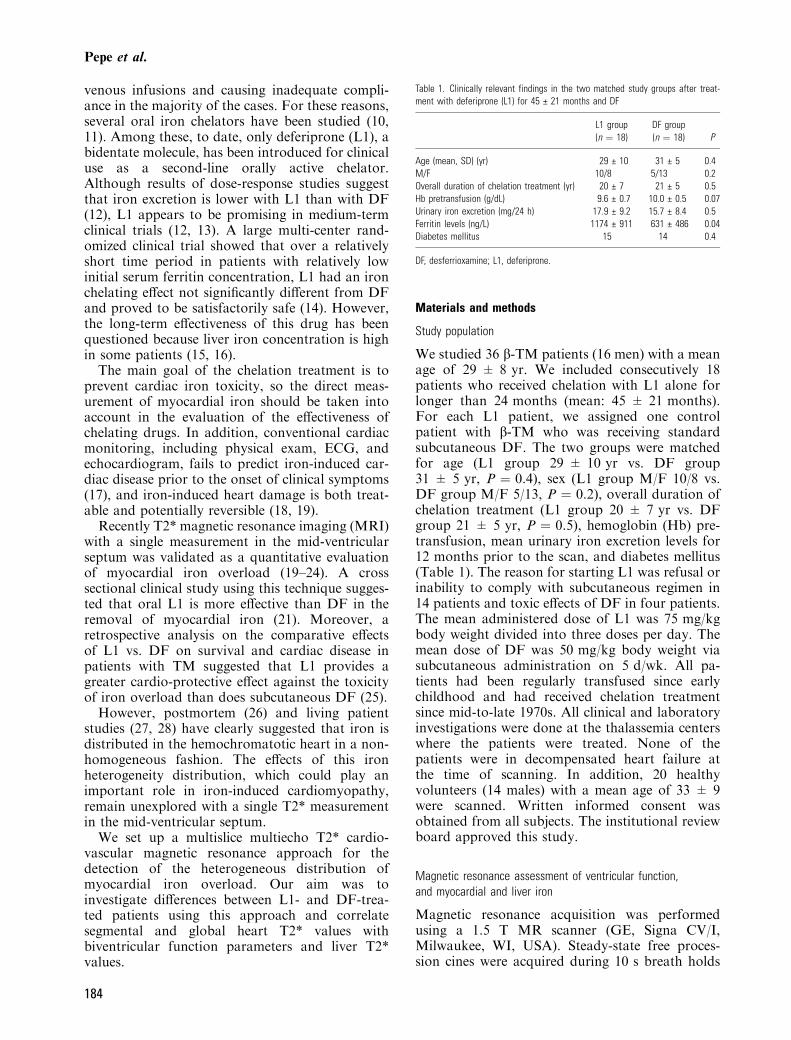
Table 1. Clinically relevant findings in the two matched study groups after treat-ment with deferiprone (L1) for 45 € 21 months and DF
L1 group(n ¼ 18)
DF group(n ¼ 18) P
Age (mean, SD) (yr) 29 € 10 31 € 5 0.4M/F 10/8 5/13 0.2Overall duration of chelation treatment (yr) 20 € 7 21 € 5 0.5Hb pretransfusion (g/dL) 9.6 € 0.7 10.0 € 0.5 0.07Urinary iron excretion (mg/24 h) 17.9 € 9.2 15.7 € 8.4 0.5Ferritin levels (ng/L) 1174 € 911 631 € 486 0.04Diabetes mellitus 15 14 0.4
DF, desferrioxamine; L1, deferiprone.
Pepe et al.
184
(TE/TR 1.6/3.2 ms, flip angle 60�, FOV ¼38 · 38 cm, matrix ¼ 224 · 224) in sequential8 mm short axis slices (0 mm gap between slices)from the atrio-ventricular ring to the apex in orderto assess biventricular function parameters, quan-titatively.For the measurements of myocardial iron over-
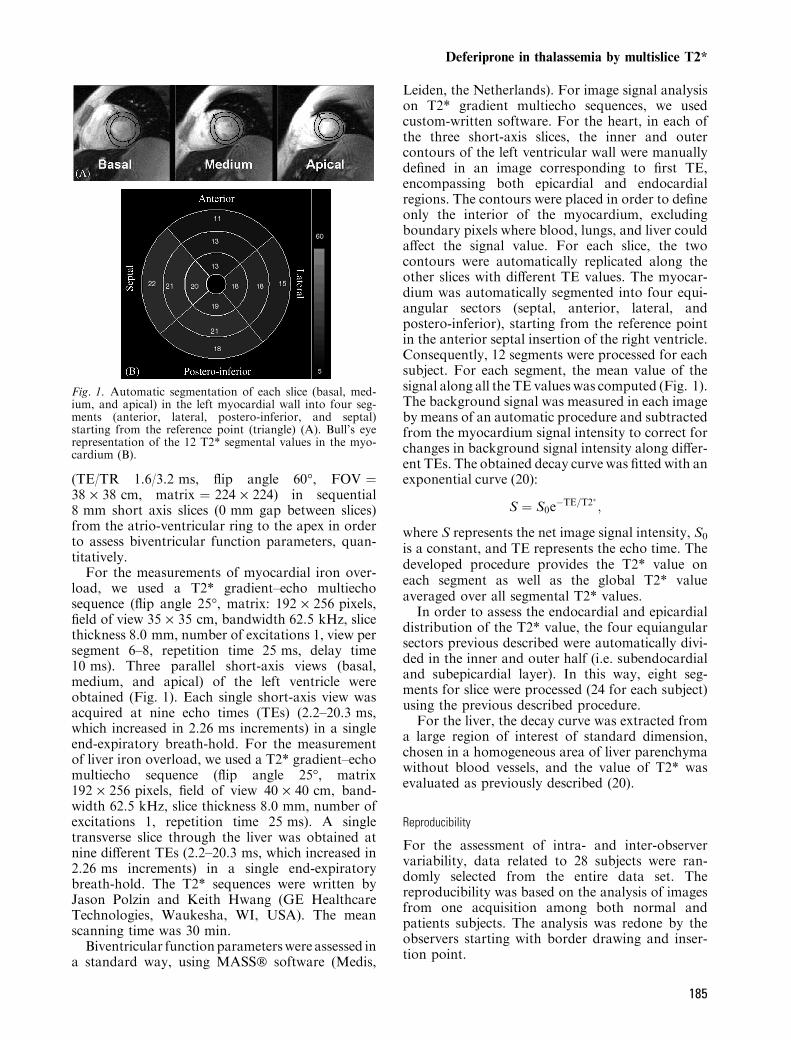
load, we used a T2* gradient–echo multiechosequence (flip angle 25�, matrix: 192 · 256 pixels,field of view 35 · 35 cm, bandwidth 62.5 kHz, slicethickness 8.0 mm, number of excitations 1, view persegment 6–8, repetition time 25 ms, delay time10 ms). Three parallel short-axis views (basal,medium, and apical) of the left ventricle wereobtained (Fig. 1). Each single short-axis view wasacquired at nine echo times (TEs) (2.2–20.3 ms,which increased in 2.26 ms increments) in a singleend-expiratory breath-hold. For the measurementof liver iron overload, we used a T2* gradient–echomultiecho sequence (flip angle 25�, matrix192 · 256 pixels, field of view 40 · 40 cm, band-width 62.5 kHz, slice thickness 8.0 mm, number ofexcitations 1, repetition time 25 ms). A singletransverse slice through the liver was obtained atnine different TEs (2.2–20.3 ms, which increased in2.26 ms increments) in a single end-expiratorybreath-hold. The T2* sequences were written byJason Polzin and Keith Hwang (GE HealthcareTechnologies, Waukesha, WI, USA). The meanscanning time was 30 min.Biventricular functionparameterswere assessed in
a standard way, using MASS� software (Medis,
Leiden, the Netherlands). For image signal analysison T2* gradient multiecho sequences, we usedcustom-written software. For the heart, in each ofthe three short-axis slices, the inner and outercontours of the left ventricular wall were manuallydefined in an image corresponding to first TE,encompassing both epicardial and endocardialregions. The contours were placed in order to defineonly the interior of the myocardium, excludingboundary pixels where blood, lungs, and liver couldaffect the signal value. For each slice, the twocontours were automatically replicated along theother slices with different TE values. The myocar-dium was automatically segmented into four equi-angular sectors (septal, anterior, lateral, andpostero-inferior), starting from the reference pointin the anterior septal insertion of the right ventricle.Consequently, 12 segments were processed for eachsubject. For each segment, the mean value of thesignal along all the TE values was computed (Fig. 1).The background signal was measured in each imageby means of an automatic procedure and subtractedfrom the myocardium signal intensity to correct forchanges in background signal intensity along differ-ent TEs. The obtained decay curve was fitted with anexponential curve (20):
S ¼ S0e�TE=T2� ;
where S represents the net image signal intensity, S0
is a constant, and TE represents the echo time. Thedeveloped procedure provides the T2* value oneach segment as well as the global T2* valueaveraged over all segmental T2* values.
In order to assess the endocardial and epicardialdistribution of the T2* value, the four equiangularsectors previous described were automatically divi-ded in the inner and outer half (i.e. subendocardialand subepicardial layer). In this way, eight seg-ments for slice were processed (24 for each subject)using the previous described procedure.
For the liver, the decay curve was extracted froma large region of interest of standard dimension,chosen in a homogeneous area of liver parenchymawithout blood vessels, and the value of T2* wasevaluated as previously described (20).
Reproducibility
For the assessment of intra- and inter-observervariability, data related to 28 subjects were ran-domly selected from the entire data set. Thereproducibility was based on the analysis of imagesfrom one acquisition among both normal andpatients subjects. The analysis was redone by theobservers starting with border drawing and inser-tion point.
Fig. 1. Automatic segmentation of each slice (basal, med-ium, and apical) in the left myocardial wall into four seg-ments (anterior, lateral, postero-inferior, and septal)starting from the reference point (triangle) (A). Bull’s eyerepresentation of the 12 T2* segmental values in the myo-cardium (B).
Deferiprone in thalassemia by multislice T2*
185

For the assessment of inter-study reproducibility10 healthy subjects and 10 patients performed MRscan two times, within 2 d, using the multislicemultiecho T2* approach for assessing myocardialiron distribution. The analysis was blindly redoneby the same observer.
Statistical analysis
All data were analyzed using SPSS Version 10.0and Med Calc Version 7.2 statistical packages.Summary data are presented as mean ± SD. Wecompared patients� characteristics by means ofStudent’s t-tests (age, overall duration of chelationtreatment, Hb pretransfusion, urinary iron excre-tion, and ferritin levels) or Fisher’s exact test (sexand presence of diabetes mellitus). Reproducibilitydata were compared using Bland-Altman analysis.The coefficient of variation was defined as thestandard deviation of the differences between thetwo separate measurements divided by their means,and expressed as percentage. Pearson’s coefficientof correlation was used to assess the degree ofassociation between global heart T2* and T2* inthe mid-ventricular septum and between serumferritin and global heart T2*. Spearman’s coeffi-cient of correlation was used to assess the degree ofassociation between global heart T2* and liver T2*.Continuous data were analyzed by the paired-sample t-test for a single group and independent-samples t-test for more groups. Wilcoxon’s signedrank test was used to assess differences between theendomyocardial and the epimyocardial regions. AP < 0.05 was considered statistically significant.
Results
Multislice multiecho T2*: normal value, reproducibility,circumferential and radial heterogeneity
The value for the T2* in mid-ventricular septum in20 healthy subjects was 36.4 ± 6.7 ms. The lowerlimit of normal (mean: )2 SD) was 23.0 ms. Thevalue for the global T2* in 20 healthy subjects was35.2 ± 4.3 ms. The lower limit of normal (mean:)2 SD) was 26.6 ms.
The value for the T2* in liver in 20 healthysubjects was 25.6 ± 3.4 ms. The lower limit ofnormal (mean: )2 SD) was 18.8 ms.
For T2* global value the coefficient of variationfor intra-observer reproducibility was 3.9% (r ¼0.98). The mean difference between the two meas-urements was 0.3 ms and the 95% limits ofagreement on the Bland-Altman plot were )2.3 to)2.8 ms.
For the T2* global value the coefficient ofvariation for inter-observer reproducibility was
5.5% (r ¼ 0.98). The mean difference between thetwo measurements was )1.1 ms and the 95% limitsof agreement on the Bland-Altman plot were )4.8to 2.6 ms. On the regional analysis there was asignificant correlation between the two observers(P < 0.001; r: 0.86–0.98); the coefficient of vari-ation for inter-observer reproducibility ranges from6.7% (r ¼ 0.98) in basal postero-inferior segmentto 28% (r ¼ 0.86) in apical postero-inferior seg-ment (mean 12%); the inter-observer coefficient ofvariation in the mid-ventricular septum was 8.6%(r ¼ 0.97). The higher coefficients of variation wereconfined to the higher T2* values in the normalrange. In the abnormal range of T2* value thecoefficient of variation for inter-observer reproduc-ibility varies from 8.0% in apical lateral segment to17% in apical septal segment. The inter-observeragreement to recognize abnormal segments rangedfrom 86% in medium lateral segment to 96% inbasal anterior segment (mean 92%).
For the T2* global value the coefficient ofvariation for inter-study reproducibility was 4.7%(r ¼ 0.99). The mean difference between the twomeasurements was )0.2 ms and the 95% limits ofagreement on the Bland-Altman plot were )2.7 to2.4 ms. The T2* global value in the 20 subjects,who performed the MR scan two times, was28 ± 12 ms. In particular, the T2* global valuewas 21 ± 14 ms in the 10 patients and 34 ± 2 msin the 10 healthy subjects.
On the regional analysis there was a significantcorrelation between the two studies (P < 0.0001; r:0.88–0.97); the coefficient of variation for inter-study reproducibility ranges from 8% (r ¼ 0.88) inmedium anterior segment to 16% (r ¼ 0.97) inbasal septum (mean: 11%); the inter-study coeffi-cient of variation in the mid ventricular septum was12% (r ¼ 0.94). The inter-study agreement torecognize abnormal segments ranged from 90% to96% (mean: 98%), the lower value was in basallateral segment.
Figure 2 shows the random fluctuation in cardiacT2* among the slices (A) and the segments (B) in 20healthy subjects. The percentage of deviation of theslices from the global heart T2* mean ranged from)1.44 in the medium slice to 2.5 in the apical slice(P ¼ ns). The percentage of deviation of thesegments from the global heart T2* mean rangedfrom )20 in anterior apex to 18 in lateral apex. Thepercentage of deviation of the mid-ventricularseptum from the global mean was 9%. Amongthe 66 possible combinations in the analysis ofvariance performed by the Scheffe post-groupingtest, significant differences were observed only infive cases, among the segments with higher per-centage of deviation from the global heart T2*mean. There were significant difference between the
Pepe et al.
186

basal lateral segment and the apical anteriorsegment (P ¼ 0.047), between the medium anteriorsegment with the medium lateral segment (P ¼0.03) and with the apical lateral segment (P ¼0.008), between the medium lateral segment and theapical anterior segment (P ¼ 0.02), between theapical anterior segment and the apical lateralsegment (P ¼ 0.007).The Fig. 3 suggest that the thalassemia patients
had considerable individual variation in the T2*values among the slices and the segments, account-ing for the true patterns of heterogenic ironmyocardial deposition.A correlation between the mean global heart T2*
value over the 12 segments and the T2* value in themid-ventricular septum was found (r ¼ 0.94,P < 0.0001). The mean difference between the
global heart T2* value and the T2* value in mid-ventricular septum was )4.2 ms and the 95% limitsof agreement on the Bland-Altman plot were )15.7to 7.2 ms (Fig. 4).
The epimyocardial iron concentration was signi-ficantly higher than the endomyocardial ironconcentration in the basal (P < 0.004), medium(P < 0.0001), and apical (P < 0.0001) slices.Moreover, we detected significantly higher epimyo-cardial iron concentration than the endomyocardialiron concentration in the basal anterior, lateral, andpostero-inferior segments (P < 0.0001); in themedium anterior (P < 0.0001), lateral (P <0.003), and postero-inferior (P < 0.0001) segments;and in the apical anterior (P < 0.0001), lateral(P < 0.003), postero-inferior (P < 0.003), andseptal (P < 0.0001) segments. The epimyocardial
Fig. 2. Random fluctuation in cardiac T2* in 20 healthysubjects. (A) Percentage of deviation of the slices from theglobal heart T2* mean. (B) Percentage of deviation of thesegments from the global heart T2* mean. Each vertical barrepresents the mean T2* segmental value along the healthysubjects. Vertical segments represent the SD. Slice labels: B,basal; M, medium; A, apical. Segment labels: A, anterior; L,lateral; P, postero-inferior; S, septal.
Fig. 3. Heart T2* variability in the TM patients. (A) Per-centage of deviation of the slices from the global heart T2*mean. (B) Percentage of deviation of the segments from theglobal heart T2* mean. Each vertical bar represents themean T2* segmental value along patients. Vertical segmentsrepresent the standard deviation. Slice labels: B, basal; M,medium; A, apical. Segment labels: A, anterior; L, lateral; P,postero-inferior; S, septal.
Deferiprone in thalassemia by multislice T2*
187

iron concentration was comparable to the endo-myocardial iron concentration in the basaland medium septal segments (P ¼ ns). In thehealthy subjects, we detected epimyocardial ironconcentration comparable to the endomyocardialiron concentration in the slices and in the segments(P ¼ ns).
Clinical findings in L1- and DF-treated patients
The mean serum ferritin levels for 12 months priorto the scan were statistically significantly higher inthe L1 vs. DF group (Table 1). The global heartT2* value and the number of segments with anormal T2* value (>20 ms) were significantlyhigher in the L1 vs. the DF group (Table 2). Nosignificant correlation was found between the meanserum ferritin for 12 months prior to the scan andthe global heart T2* values (r ¼ 0.1, P ¼ ns). TheL1 group had significantly lower liver T2* valuesthan did the DF group (Table 2). There was no
significant relationship between global heart T2*and liver T2* (r ¼ )0.2; P ¼ ns) (Fig. 5).
There was no correlation between the leftventricular ejection fraction (LVEF) and the globalheart T2* or the T2* value in the mid-ventricularseptum (r ¼ 0.2; P ¼ ns) (Fig. 6). Similarly, we didnot find a correlation between the right ventricularejection fraction (RVEF) and the global heart T2*or the T2* value in the mid-ventricular septum(r ¼ 0.1; P ¼ ns) (Fig. 7). The L1 vs. the DF groupdid not show a significant difference in left andright EF, in left and right end-diastolic and systolicvolume indexes and in left ventricular mass index(Table 2).
Clinically relevant findings for patients in the twostudy groups are reported in Table 1.
Comparisons of heart, liver, and biventricularfunction parameters using MRI are summarized inTable 2.
Discussion
Because cardiomyopathy remains the main cause ofmortality in transfusion-dependent TM patients(3), a key feature of the clinical scenario is to showif there is some difference between different chela-tion treatments in order to prevent iron-inducedcardiomyopathy. On the other hand, the lack ofcorrelation between serum ferritin and liver T2*
0 10 20 30 40 50 60 70
Mean T2* (ms) (Global T2*– T2* in mid–ventricular septum)
10
5
0
–5
–10
–15
–20
Dif
fere
nce
s in
T2*
(m
s) (
Glo
bal
T2*
– T
2* in
mid
–ven
tric
ula
r se
ptu
m)
Mean–4.2
–1.96 SD
–15.7
+1.96 SD7.2
Fig. 4. Bland-Altman plot of the global heart T2* values vs.the T2* values in mid-ventricular septum.
Table 2. Comparisons of heart, liver and biventricular function parameters usingMRI
L1 group(n ¼ 18)
DF group(n ¼ 18) P
Global heart T2* (ms) 35 € 7 27 € 12 0.02Mid-ventricular septum T2* (ms) 41 € 10 30 € 16 0.02No. of segments with normal T2* (>20 ms) 11 € 1 8 € 5 0.03LVEF (%) 63 € 5 62 € 4 0.5Left end-diastolic volume index (mL/m2) 78 € 12 74 € 14 0.3Left end-systolic volume index (mL/m2) 29 € 7 28 € 7 0.7Left ventricular mass index (g/m2) 74 € 12 70 € 12 0.2RVEF (%) 62 € 9 63 € 5 0.6Right end-diastolic volume index (mL/m2) 69 € 10 64 € 15 0.3Right end-systolic volume index (mL/m2) 26 € 7 24 € 8 0.4Liver T2* (ms) 3.7 € 4 12 € 8 0.001
DF, desferrioxamine; L1, Deferiprone; LVEF, left ventricular ejection fraction; RVEF,right ventricular ejection fraction.
Fig. 5. Relationship between global heart T2* values andliver T2* (r ¼ )0.2; P ¼ 0.3) in L1-treated (d) and in DF-treated (h) patients expressed in loge scale. The broken linesrepresent the normal reference ranges. The lower limit ofnormal assumed for the heart T2* was 20 ms (19–23). Thelower limit of normal assumed for the liver T2* was 19 ms(20, 21).
Pepe et al.
188

with cardiac iron loading, shown in this and otherstudies (21), reiterates the problem in using anindirect marker as a guide for cardiac management.
The recent development of a single mid-ventric-ular septum measurement by T2* has for the firsttime allowed quantitative estimates of relativemyocardial iron loading (19–24). A retrospectiveclinical study using this technique suggested thatoral L1 is more effective than DF in removal ofmyocardial iron (21). However, studies of irondistribution in myocardium with iron overloadingsuggested that an iron burden heterogeneity seemsto be present (26–28). For this reason, the maingoal of our study was the comparison of the twotreatment modalities assessing the tissue iron con-centration in the left ventricle by means of asegmental approach using a multislice, multiechoT2* procedure. The robustness of our method wasestablished by proper validation along with acomplete test of reproducibility that it have docu-mented the high intra-, inter-observer, and inter-study reproducibility on global T2* values. Goodreproducibility is vitally important for longitudinalfollow up of patients and also greatly reduces thesample size for research. For regional analysis,inter-observer and inter-study reproducibility wasgood and the higher coefficients of variation wereconfined to the higher T2* values in the normalrange. In fact, the TEs were chosen so as tooptimize the accuracy of T2* measurement in theabnormal range. However, the accuracy for normalrange was adequate. The complete test of repro-ducibility excludes that the signals in the non-mid-septal segments could be affected by susceptibilityartefacts or artefacts depending on the shape, theorientation and the motion of the heart.
In order to exclude artificial T2* fluctuationsimposed by cardiac/visceral geometric interaction,we evaluated the spatial heterogeneity of cardiacT2* in 20 healthy subjects. The percentage ofdeviation of the slices from the global heart T2*mean was not statistically significant. On the otherhand, the percentage of deviation of the segmentswas always within 20% of the global heart T2*.The significant differences were observed onlyamong the segments with higher percentage ofdeviation. In the Reader et al. study (29) using theMRI T2* technique, no significant differences werefound in five healthy voluntaries among slices orwithin slice for T2* measured in the septal, poster-ior, lateral, or anterior walls as calculated byvariance analysis. Differences between these regionsand area adjacent to the posterior vein weresignificant as calculated by Scheffe post hoc group-ing analysis. However, although the regions ofmyocardium adjacent to the veins could experienceenhanced T2* decay, in our approach the influenceof these veins seems to be minimized by measuringT2* in a full-segmental region of interest in theseptum, anterior, lateral and postero-inferior wall.
50403020100
Global heart T2* (ms)
80
70
60
50
40
30
Lef
t ve
ntr
icu
lar
ejec
tio
n f
ract
ion
(%
)
50403020100
80
70
60
50
40
30
Lef
t ve
ntr
icu
lar
ejec
tio
n f
ract
ion
(%
)
Fig. 6. Relationship between global heart T2* values andLVEF in L1-treated (d) and in DF-treated (h) patients.The broken lines represent the lower normal limits. Thelower limit of normal assumed for the heart T2* was 20 ms(19–23). The lower limit of normal assumed for the LVEFwas 60% (19).
706050403020100
T2* in mid-ventricular septum (ms)
80
70
60
50
40
30
Rig
ht
ven
tric
ula
r ej
ecti
on
fra
ctio
n (
%)
Fig. 7. Relationship between T2* in the mid-ventricularseptum and RVEF in L1-treated (d) and in DF-treated (h)patients. The broken lines represent the lower normal limits.The lower limit of normal assumed for the T2* in mid-ventricular septum was 20 ms (19–23). The lower limit ofnormal assumed for the RVEF was 53% (32).
Deferiprone in thalassemia by multislice T2*
189

These data did not account for rejecting certainslices or segments. The global heart T2* value tendsto average out the hills and valleys due to artificialT2* fluctuations. Furthermore, the global heartT2* measurement is valuable because it lowers theinter-study variability vs. the T2* value in a singlesegment. It is known that the number of subjectsrequired to determining a clinically significantchange in a variable rises as the square of theintrinsic variability, so a reduction from 8% or12% to 4.7% is really quite large.
In the present study, a cut-off of 20 ms betweennormal and abnormal heart T2* values was adop-ted. This value had already been established inpreviously published papers (19–23). Our lowerlimits of normal for the T2* in mid-ventricularseptum and for global T2* compare well withpreviously published (19–23) normal lower limits ofnormal T2* value in the heart. Previous studieshave showed that the lower limit of normal coulddepend from differences in pulse parameters, K-space filling, MR hardware, population size (20,23). However, these differences do not seem to haveaffected the robustness of the MRI approach toiron overload assessment in the heart (20, 23). Withrespect to the standard approach (single measure-ment of T2* in mid-ventricular septum), therequired scanning time increased about 2 min,and the processing time increased about 5 min.For this reason, our segmental approach may betenable for use in the clinical arena.
Using the multislice multiecho approach, wedetected a remarkable individual variation in theT2* values among the slices and the segments inour patients. A similar variation of the myocardialiron concentration among slices was observed byJensen et al. in a MRI study using the signalintensity ratio technique to evaluate the myocardialiron concentration (28).
In the healthy subjects, we did not detect anendomyocardium to epimyocardium gradient inT2* values. Conversely, we found an endomyocar-dium to epimyocardium gradient in T2* values inour thalassemia population. The epimyocardialiron concentration was significantly higher thanthe endomyocardial iron concentration in all slicesand segments, excluding the basal and the mediumseptal segments. These findings are consistent withpatterns of iron deposition described in previousstudies (26, 28, 30, 31) and it indirectly confirms therobustness of the multislice multiecho T2*.
We found a good correlation between the globalheart T2* value and the T2* value in the mid-ventricular septum. The Bland-Altman comparisonbetween the global heart T2* value and the T2*value in the mid-ventricular septum (Fig. 4) showeda systematic relative underestimation in the normal
range. This datum could reflect susceptibility arte-facts based on T2* shortening in certain regionsdifferent from the mid-ventricular septum. How-ever, the bias basically disappeared for T2*<20 ms and the limits of agreement are reallygood. Thus, the T2* value in the mid-ventricularseptum is confirmed as a good marker of myo-cardial iron overload. The mid-ventricular septumcould be the first region of the heart to overloadiron. However, in the ongoing controversy relatedto the relative merits of DF or L1 for themanagement of transfusional secondary haemo-chromatosis, and particularly of the cardiomyo-pathy, should be considered the evolution of newtechnology able to measure both global andregional myocardial iron overloading. The efficacyof the chelators might be based on both globalheart T2* value and myocardial segments� numberwith iron burden, in particular in the follow-upstudies.
The global T2* value was higher in the L1-treated group in comparison with the DF-treatedgroup (Table 2), but the most relevant result of ourstudy was the detection of an higher myocardialsegments� number with normal T2* values in theL1- vs. the DF-treated group. This result con-firmed, using for the first time a multislice, multi-echo T2* approach, that oral L1 could be moreeffective than DF in the removal of myocardialiron, as has been previously suggested on the basisof a single short-axis, mid-ventricular slice (21).
In contrast to the lower myocardial iron overloadin the L1 group, the same group had significantlyhigher serum ferritin and liver iron values quanti-tatively estimated by T2* technique. These findingsconfirm a possible main difference in the way ofaction: L1 seems to be a better agent for preventingmyocardial siderosis, but a less effective drug thanDF for removing hepatocellular iron and overallbody iron as reflected in serum ferritin. Althoughwe could not accurately estimate liver iron levels>15 mg/g with the minimal possible TE used inour scanner (32), this is a marginal aspect in ourvery well chelated study group population.
Cardiac MRI has provided an opportunity toquantify both right and left ventricular function atthe same time with excellent reproducibility (33)and the intra- and inter-observer variability in ourlaboratory compare well with previously publishedreproducibility values (34). We did not detect anyrelationship between left ventricular function andmyocardial iron overloading (Fig. 6). Similarly, wedid not find any correlation between right ventric-ular function and myocardial iron overload(Fig. 7). There are no data in the literature aboutthe relationship between a quantitative evaluationof right ventricular function and myocardial iron
Pepe et al.
190

overload quantitatively estimated by T2* tech-nique. Conversely, Anderson et al. (20) showedthat all b-TM patients with LVEF values below thereference range had T2* <20 ms, although mostpatients with T2* <20 ms had normal LVEF. Ourdata support the hypothesis that heart T2*, as theferritin levels, should not be used as the onlymarker of cardiac risk. Probably, patients couldhave stored myocardial iron without symptoms ifchelation was sufficient to maintain low free ironlevels.Several explanations might account for the lack
of correlation between heart function and myocar-dial iron overload. First, while in the Andersonet al. paper (20) the thalassemia population had abroad range of compliance to treatment (serumferritin ranged from 262 to 7624 ng/mL, mean:2095 ± 1559 ng/mL), in our study the thalassemiapopulation had a significantly lower body ironoverload (serum ferritin ranged from 65 to 3285 ng/mL, mean: 917 ± 1559 ng/mL; P < 0.0001) andhad a mild degree of myocardial iron overload inboth groups of patients who have been compliantand well treated for a very long period. In ourstudy, there were only two patients in the higherrisk group (heart T2* <10 ms). For this reason, itwas difficult to demonstrate a correlation betweenheart function and myocardial iron overload.Second, heart damage in thalassemia does notresult only from iron overload. Traditional studies(35–37) have shown that several patients withextensive myocardial iron deposits showed noevidence of heart failure, whereas patients withlesser amounts of iron had severe heart failure.More recent studies attributed an important role tomyocarditis (38) or pulmonary hypertension (39) inthe pathogenesis of cardiomyopathy in the patientswith b-TM. Third, Kremastinos et al. (40) sugges-ted that genetically determined variables couldaffect susceptibility to heart failure in the presenceof iron overloading. Moreover, marked improve-ment in LVEF is observed soon after startingintravenous DF, while changes in total body ironare small (41). Conversely, although iron could beremoved by intensive chelation treatment, theinduced heart damage could be irreversible andprogressive.We did not detect significant differences between
the L1 and DF groups in biventricular functionparameters; our study population had a low bodyiron burden and abnormal systolic function is a latesign of iron toxicity, so the range of LVEF andRVEF in our population was probably too small todetect significant differences.Our study had one limitation. The retrospective
analysis used a cardiac magnetic-resonance ap-proach that was not available when the treatment
with L1 was instituted. The multislice, multiechoT2* approach, accounting for a heterogeneousmyocardial iron distribution, confirms that L1seems to be more effective than DF in preventingheart damage; however, a larger prospective clinicaltrial using this new reproducible approach shouldbe performed.
Acknowledgements
This study was supported by the Italian Foundation �LeonardoGiambrone.� We would like to thank Jason Polzin and KeithHwang (GE Healthcare Technologies) in writing the T2* se-quences. We thank Claudio Michelassi for help in statisticalanalysis. We would like to thank Dr Paul Kretchmer ([email protected]) at San Francisco Edit for his assistance inediting this manuscript. We also thank all patients for theircooperation. Finally, we wish to thank the anonymousreviewers for their useful comments.
References
1. Weatherall DJ, Clegg JB. Thalassemia – a global publichealth problem. Nat Med 1996;2:847–849.
2. Buss JL, Torti FM, Torti SV. The role of iron chelation incancer therapy. Curr Med Chem 2003;10:1021–1034.
3. Borgna-Pignatti C, Rugolotto S, De Stefano P, et al.Survival and complications in patients with thalassemiamajor treated with transfusion and deferoxamine. Haema-tologica 2004;89:1187–1193.
4. Brittenaham GM, Griffith PM, Nienhuis AW, McLa-
ren CE, Young NS, Tucker EE, Allen CJ, Farrell DE,Harris MD. Efficacy of deferoxamine in preventing com-plications of iron overload in patients with thalassemiamajor. N Engl J Med 1994;331:567–573.
5. Wolfe L, Oliveri N, Sallan D, Colan S, Rose V,Propper R, Freedman MH, Nathan DG. Prevention ofcardiac disease by subcutaneous deferoxamine in patientswith thalassemia major. N Engl J Med 1985;312:1600–1603.
6. Karnon J, Zeuner D, Brown J, Ades AE, Wonke B,Modell B. Lifetime treatment costs of b-thalassemia ma-jor. Clin Lab Haematol 1999;21:377–385.
7. Olivieri NF, Buncic JR, Chew E, et al. Visual andauditory neurotoxicity in patients receiving subcutaneousdeferioxamine infusions. N Engl J Med 1986;314:869–873.
8. Brill PW, Winchester P, Giardina PJ, Cunningham-
Rundles S. Deferioxamine-induced bone displasia in pa-tients with thalassemia major. Am J Roentgenol1991;156:561–565.
9. De Virgiliis S, Congia M, Frau F, et al. Deferioxamine-induced bone displasia in patients with thalassemia major.J Paediatr 1988;113:661–669.
10. Cunningham MJ, Nathan DG. New developments in ironchelators. Curr Opin Haematol 2005;12:129–134.
11. Hershko C, Link G, Konijn AM, Cabantchik ZI. Ironchelation therapy. Curr Haematol Rep 2005;4:110–116.
12. Olivieri NF, Koren G, Hermann C, Bentur Y, ChungD, Klein J, St Louis P, Freedman MH, McClelland
RA, Templeton DM. Comparison of oral iron chelator L1and desferioxamine in iron-loaded patients. Lancet1990;24:1275–1279.
13. Ceci A, Baiardi P, Felisi M, et al. The safety and effect-iveness of deferiprone in a large-scale, 3-year study inItalian patients. Br J Haematol 2002;118:330–336.
14. Maggio A, D’Amico G, Morabito A, et al. Deferiproneversus deferoxamine in patients with thalassemia major: a
Deferiprone in thalassemia by multislice T2*
191

randomized clinical trial. Blood Cells Mol Dis 2002;28:196–208.
15. Olivieri NF, Brittenham GN,Mc Laren CE, TempletonDM, Cameron RG, Mc Clelland RA, Burt AD,Fleming KA. Long-term safety and effectiveness of iron-chelation therapy with deferiprone for thalassemia major.N Engl J Med 1998;339:417–423.
16. Hoffbrand AV, Al Refaie F, Davis B, SiritanakatkulN, Jackson BF, Cochrane J, Prescott E,Wonke B. Longterm trial of deferiprone in 51 transfusion dependent ironoverload patients. Blood 1998;91:295–300.
17. Henry WL, Nienhuis AW, Wiener M, Miller DR, Ca-nale VC, Piomelli S. Echocardiographic abnormalities inpatient with transfusion anemia and secondary myocardialiron deposition. Am J Med 1978;64:547.
18. Davis BA, Porter JB. Long-term outcome of continuos24-hour deferioxamine infusion via indwelling intravenouscatheters in high-risk beta-thalassemia. Blood2000;95:1229–1236.
19. Anderson LJ, Westwood M, Holden S, Davis B, Pres-cott E, Wonke B, Porter J, Walker JM, Pennell DJ.Myocardial iron clearance during reversal of sideroticcardiomyopathy with intravenous desferioxamine: a pros-pective study using T2* cardiovascular magnetic resonance.Br J Haematol 2004;127:348–355.
20. Anderson LJ, Holden S, Davis B, et al. CardiovascularT2 star (T2*) magnetic resonance for early diagnosis ofmyocardial iron overload. Eur Heart J 2001;22:2171–2179.
21. Anderson LJ, Wonke B, Prescott E, Holden S, Walker
M, Pennel DJ. Comparison of effects of oral deferiproneand subcutaneous desferioxamine on myocardial ironconcentration and ventricular function in beta-thalassemia.Lancet 2002;360:516–520.
22. Westwood M, Anderson LJ, Firmin DN,Gatehouse PD,Charrier CC, Wonke B, Pennel DJ. A single breath-holdmultiecho T2* cardiovascular magnetic resonance tech-nique for diagnosis of myocardial overload. J Magn ResonImaging 2003;18:33–39.
23. Westwood M, Anderson LJ, Firmin DN,Gatehouse PD,Lorenz CH, Wonke B, Pennel DJ. Interscanner repro-ducibility of cardiovascular magnetic resonance T2*measurements of tissue iron in thalassemia. J Magn ResonImaging 2003;18:616–620.
24. Wood JC, Tyszka JM, Carson S, Nelson MD, CoatesTD. Myocardial iron loading in transfusion-dependentthalassemia and sickle cell disease. Blood 2004;103:1934–1936.
25. Piga A,Gaglioti C, Fogliacco E, Tricta F. Comparativeeffects of deferiprone and deferoxamine on survival andcardiac disease in patients with thalassemia major: a ret-rospective analysis. Haematologica 2003;88:489–496.
26. Olson LJ, Edwards WD, McCall JT, Ilstrup DM,Gersh BJ. Cardiac iron deposition in idiopathic hemo-chromatosis: histologic and analytic assessment of 14 heartsfrom autopsy. J Am Coll Cardiol 1987;10:1239–1243.
27. Olson LJ, Edwards WD. Endomyocardial biopsy inHemochromatosis: clinicolpathologic correlates in sixcases. J Am Coll Cardiol 1989;13:116–120.
28. Jensen PD, Jensen FT, Christensen T, Heickendorff L,Jensen LG, Ellegaard J. Indirect evidence for thepotential ability of magnetic resonance imaging to evaluatethe myocardial iron content in patients with transfusionaliron overload. MAGMA 2001;12:153–156.
29. Reader SB, Faranesh AZ, Boxerman JL, McVeigh ER.In vivo measuremets of T2* and field inhomogeneity mapsin the human heart at 1.5 T. MRM 1998;39:988–998.
30. Buja LM, Roberts WC. Iron in the heart: etilogy andclinical significance. Am J Med 1971;51:209–212.
31. Fitchett DH, Coltart DJ, Littler WA, Leyland MJ,Trueman T,Gozzard DI, Peters TJ. Cardiac involvementin secondary hemochromatosis: a catheter biopsy study andanalysis of myocardium. Cardiovasc Res 1980;14:719–724.
32. Wood JC, Enriquez C, Ghugre N, Tyzka JM, Carson S,Nelson MD, Coates TD. MRI R2 and R2* mappingaccurately estimates hepatic iron concentration in transfu-sion-dependent thalassemia and sickle-cell disease patients.Blood 2005;106:1460–1465.
33. Sironi M, Lombardi M, Pepe A, De Marchi D. Study ofheart function. In: Lombardi M, Bartolozzi C, eds. MRIof Heart and Vessels. Italia: Springer-Verlag, 2005.
34. Morales MA, Positano V, Lombardi M, Rodriguez O,Passera M, Rovai D. Semiautomatic detection of leftventricular contours in contrast-enhanced echocardio-graphic images: comparison with magnetic resonance ima-ging. J Am Soc Echocardiogr 2004;17:876–882.
35. Lewis HP. Cardiac involvement in hemochromatosis. Am JMed Sci 1954;227:544–558.
36. Mac Donald RA, Mallory GK. Hemochromatosis andhemosiderosis: study of 211 autopsied cases. Arch InternMed 1960;105:686.
37. Sanyal SK, Johnson W, Jayalakshmamma B,Green AA.Fatal �iron heart� in an adolescent: biochemical and ultra-structural aspect of the heart. Pediatrics 1975;55:336–341.
38. Kremastinos DTH, Tiniakos G, Theodorakis GN, Ka-
tritsis DG, Toutouzas PK. Myocarditis in beta-thalasse-mia major. Circulation 1995;91:66–71.
39. Grisaru D, Rachmilewitz EA, Mosseri M, Gotsman M,Lafair JS, Okon E, Goldfarb A, Hasin Y. Cardiopul-monary assessment in beta talassemia major. Chest1990;98:1138–1142.
40. Kremastinos DT, Flevari P, Spyropoulou M, VrettouH, Tsiapras D, Stavropoulos-Giokas CG. Association ofheart failure in homozygous beta-thalassemia with themajor histocompatibility complex. Circulation1999;16,100:2074–2078.
41. Marcus RE, Davies SC, Bantock HM, Underwood SR,Walton S, Huehns ER. Desferrioxamine to improve car-diac function in iron-overloaded patients with thalassemiamajor. Lancet 1984;18:392–393.
Pepe et al.
192
Copyright © 2022 FDOKUMEN