Consumers' motivation for eating free-range meat or less meat
Upload
khangminh22Category
view
1download
0
University of Nebraska - Lincoln University of Nebraska - Lincoln
DigitalCommons@University of Nebraska - Lincoln DigitalCommons@University of Nebraska - Lincoln
Theses and Dissertations in Animal Science Animal Science Department
5-2020
The Impact of Oxidative Stress on Postmortem Meat Quality The Impact of Oxidative Stress on Postmortem Meat Quality
Nicolas J. Herrera University of Nebraska - Lincoln, [email protected]
Follow this and additional works at: https://digitalcommons.unl.edu/animalscidiss
Part of the Agriculture Commons, and the Meat Science Commons
Herrera, Nicolas J., "The Impact of Oxidative Stress on Postmortem Meat Quality" (2020). Theses and Dissertations in Animal Science. 195. https://digitalcommons.unl.edu/animalscidiss/195
This Article is brought to you for free and open access by the Animal Science Department at DigitalCommons@University of Nebraska - Lincoln. It has been accepted for inclusion in Theses and Dissertations in Animal Science by an authorized administrator of DigitalCommons@University of Nebraska - Lincoln.
The Impact of Oxidative Stress on Postmortem Meat Quality
by
Nicolas J. Herrera
A Thesis
Presented to the Faculty of
Graduate College at the University of Nebraska
In Partial Fulfillment of Requirements
For the Degree of Master of Science
Major: Animal Science
Under the Supervision of Professor Chris Richard Calkins
Lincoln, Nebraska
May, 2020
THE IMPACT OF OXIDATIVE STRESS ON POSTMORTEM MEAT QUALITY
Nicolas Herrera, M.S.
University of Nebraska, 2020
Advisor: Chris R. Calkins
Tenderness is the primary factor to influence consumer palatability in fresh meat.
The tenderization of muscle is dependent on proteolytic mechanisms, including calcium-
dependent, non-lysosomal endogenous enzymes such as calpains and proteasomes. These
mechanisms have been indicated alongside apoptosis early postmortem as cascades of
apoptotic events promote ideal conditions for postmortem tenderization. Recent literature
has identified oxidative stress-mediated events to be linked to apoptotic activity.
Oxidative stress is defined as the overwhelming production of reactive species compared
to homeostatic, endogenous antioxidants present within muscle systems. These
conditions exhaust antioxidant function and facilitate reactive species to alter protein,
lipid, or nucleic morphology and functionality. Perhaps, the generation of oxidative stress
can alter muscle tissue, resulting in changes in the overall quality of fresh meat
postmortem. This study examined the impact of different levels of oxidative stress in vivo
on postmortem muscle quality of lambs, with emphasis towards elements of proteolytic
mechanisms responsible for meat tenderness. Lipopolysaccharides (LPS) are endotoxins
used to induce acute stress for this experiment. Effects of inducing lambs with an
injection of either a saline control, 50 ng of LPS per kg of bodyweight (LPS50), or 100
ng of LPS per kg of bodyweight (LPS100). Injections were administered every 72 hours
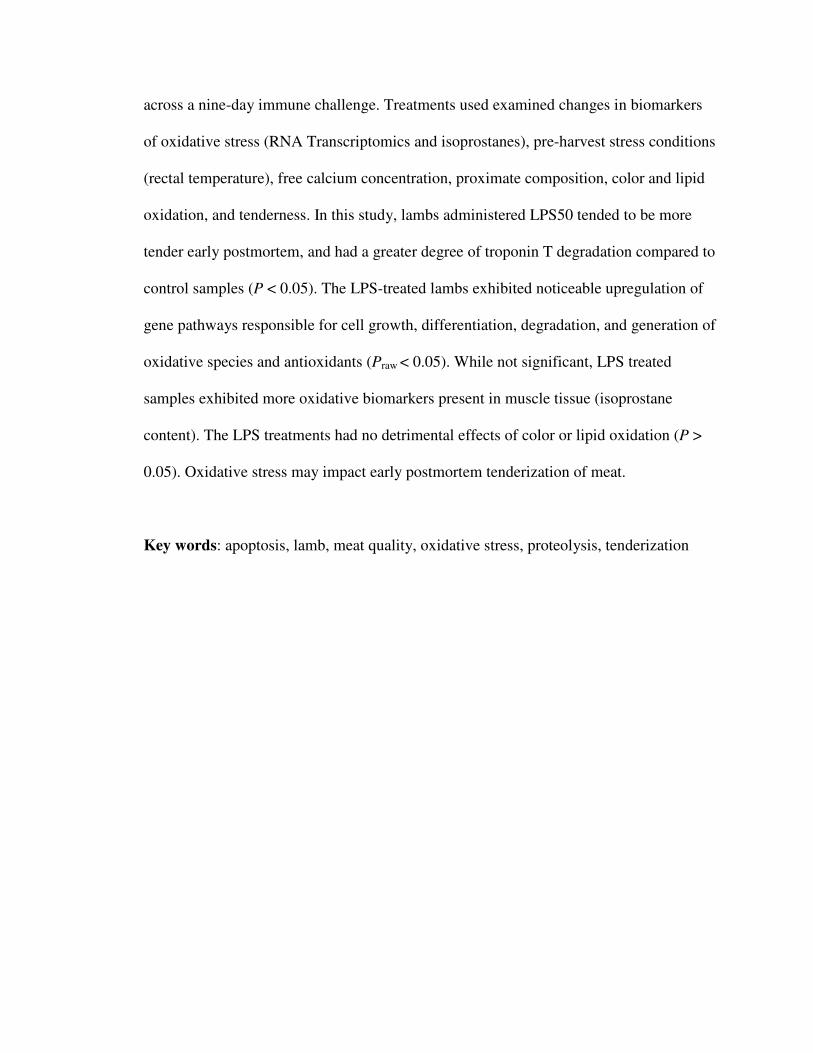
across a nine-day immune challenge. Treatments used examined changes in biomarkers
of oxidative stress (RNA Transcriptomics and isoprostanes), pre-harvest stress conditions
(rectal temperature), free calcium concentration, proximate composition, color and lipid
oxidation, and tenderness. In this study, lambs administered LPS50 tended to be more
tender early postmortem, and had a greater degree of troponin T degradation compared to
control samples (P < 0.05). The LPS-treated lambs exhibited noticeable upregulation of
gene pathways responsible for cell growth, differentiation, degradation, and generation of
oxidative species and antioxidants (Praw < 0.05). While not significant, LPS treated
samples exhibited more oxidative biomarkers present in muscle tissue (isoprostane
content). The LPS treatments had no detrimental effects of color or lipid oxidation (P >
0.05). Oxidative stress may impact early postmortem tenderization of meat.
Key words: apoptosis, lamb, meat quality, oxidative stress, proteolysis, tenderization

iv
ACKNOWLEDGEMENTS
There are a multitude of individuals to thank for my time here in Lincoln I cannot
quantify the impact they have made on me personally in addition to my academic career.
First, I would like to thank Dr. Larry Berger. At the 2013 National Cattlemen’s Beef
Association in Tampa Bay, Florida he was the first to introduce me to the University of
Nebraska-Lincoln as a prospective school to pursue my college degrees. In the short time
I spoke with him, he made me aware of the core values that UNL holds, and the
opportunities the College of Agricultural Science and Natural Resources provides for
incoming students. His brief time started a chain reaction to where I am today, and I will
never forget when he urged me to consider Nebraska as a possible landing spot for my
education.
I would also like to thank the professors which first exposed me to meat science
as a career path. Dr. Jones, Dr. Burson, Dr. Sullivan, and Dr. Schmidt all showed me the
intricacy which makes up meat science, and how we have been able to harness these traits
for the betterment of product quality and consumer acceptability to enhance the food
industry. They asked the hard questions about coursework, in addition to general skillsets
which I use every day. These professors have helped me learn how to approach
challenges and postulate new questions within my studies, which have refined my talents,
and molded me into a meat scientist.
I want to personally thank Emery Wilkerson and Hope Voegele Hall, as these
were the primary graduate students which exposed me to student research and meat
science activities. While I was still deciding if I would transfer to Cornell one fall
semester, they exposed me to meat science from a hands-on perspective. From extra-
v
curricular learning to working in the meat lab, they were the ones who first made me
interested in graduate studies. I will be forever indebted to their efforts. They may not
know, but they were integral to my decision to stay at Nebraska for my higher learning.
Thank you both.
I want to thank all support staff which helped me during my time as a Master’s
student. To Tommi Jones, Sherri Pitchie, Calvin Schrock, Anna Fuller, and Brent
Johnson - you are the lifeblood that keeps our university running smoothly and
efficiently. I cannot tell you the number of times your service to me has made my job
more fun and interactive. Thank you for your service and please stay true to yourselves,
as your personalities bring additional life to the building.
Additionally, I want to thank additional professors or university staff which
assisted on my research project. To Dr. Kelly Heath, Wendy Pinkerton, Dr. Craig
Kreikemeier, Dr. Nicole Iverson, Eric Hofferber, and Jakob Meier, you all have assisted
in the housing, handling, and management of my project one way or another. Thank you
for your incredible work ethic in assisting me to take credible data with my livestock.
Thank you to all past and present graduate students who I have had the pleasure to
call office mates and friends over the years: Ashley McCoy, Kelly Schole, Regan
Stanley, Sara Sieren, Brandy Cleveland, Dr. Joe Buntyn, Dr. Chad Bower, Jessica
Lancaster, Faith Rasmussen, Lauren Kett, Dr. Michael Chao, David Velazco, and Joe
Sonderman. Additionally, I would like to thank Nick Bland, Felipe Ribeiro, Kellen Hart,
and Morgan Henriott. You were all integral to the execution of my research, as well as
providing lasting memories of our time together at UNL, and lifelong friendships both in
and outside of the University.
vi
Thank you to my major professor, Dr. Chris Calkins, for giving me the
opportunity to learn under his tutelage. He continues to instill the lessons of curiosity,
humility, passion, and professionalism every time we have a private meeting, meetings
with our lab group, at professional functions, or during a casual night at a local bar or
escape room. His phrases “that’s interesting” and “think about it” will always remind me
of him whenever they are spoken by someone else. I’ll never forget the first time I
brought data into his office written on a paper towel. His reaction was palpable, not for
the research, but for the method in which it was presented. “This is not science!” he said.
I don’t know why, but I always laugh internally when I think of that memory.
To all whose who were not mentioned, whether your assistance was shown in the
meat lab, collaboration with our group’s research, attendance in club activities, summer
adventures throughout Nebraska, or late nights studying, all of you have created lasting
memories which will not be forgotten.
Last, but not least, I want to thank my family. To my parents, Tony and Debbie
Herrera - you two continue to inspire me to grow, to learn, to learn again, admit my
mistakes, take pride in my work, and to strive for excellence. Thank you for having the
patience to have me as your son, and I hope to reflect a fraction of the gifts which you
have given me. To my siblings, Max, Thaine, Anica, and Kael, I want to thank you for
the constant support as we grow up in this world. While we all have different ambitions,
we are all grounded in our love for one another, and always know how to make each
other continue to express those feelings within our family. Finally, to Zena Hicks, I want
to thank you for becoming a part of my life during my time as a student. You have
continued to show me how to become a better man and significant other. Thank you for

vii
your ever-growing patience, stubbornness, and desire to be competitive in all walks of
life. I love you, and hope my actions will inspire you, the same way yours have inspired
me.
viii
TABLE OF CONTENTS
TITLE PAGE………………………………………………………………………………i
ABSTRACT………………………………………………………………………………ii
ACKNOWLEDGEMENTS………………………………………………………………iv
TABLE OF CONTENTS…………………………………………………………….…viii
INTRODUCTION………………………………………………………………………...1
LITERATURE REVIEW…………………………………………………………………6
Mechanism of muscle contraction………………………………………………………...6
Sarcoplasmic reticulum regulatory proteins………………………………………………6
Membrane Composition…………………………………………………………………...8
Generation of oxidative properties………………………………………………………...9
Mitochondrial function in skeletal muscle……………………………………………….10
Mitochondria structure…………………………………………………………...10
Mitochondria uniporter…………………………………………………………..11
Mitochondria permeable transition pore…………………………………………12
ATP production precursors………………...…………………………………….12
Oxidative phosphorylation……………………………………………………….14
Reactive oxygen species…………………………………………………………………14
Superoxide……………………………………………………………………….16
Hydrogen peroxide……………………………………………………………….17
Hydroxyl radical…………………………………………………………………18
Reactive nitrogen species………………………………………………………………...18
Nitric oxide………………………………………………………………………19
ix
Peroxynitrite……………………………………………………………………...21
Hyperchlorite…………………………………………………………………….22
Redox-sensitive signaling pathways……………………………………………………..22
Nuclear factor erythroid 2-related factor (Nrf2)…………………………………23
NF�B/AP-1………………………………………………………………………24
Mitogen activated protein kinase (MAPK)………………………………………25
Homeostatic response………………………………………………………………..…..26
Superoxide dismutase……………………………………………………………27
Glutathione peroxidase/Catalase…………………………………………………28
Alpha-tocopherol (vitamin E)……………………………………………………29
Mechanism of oxidative stress…………………………………………………………...29
DNA profile……………………………………………………………………...31
Lipid oxidation…………………………………………………………………...31
Lipid oxidation interrelationship with meat color……………………………….33
Protein oxidation…………………………………………………………………33
Stability of the sarcoplasmic reticulum…………………………………………..36
Mitochondria Stability…………………………………………………………...37
Apoptotic pathway……………………………………………………………………….38
Cytrochrome c……………………………………………………………………39
Caspase system…………………………………………………………………..39
Small heat shock proteins………………………………………………………..40
Enzymatic Aging………………………………………………………………...42
Calpains-calpastatin relationship………………………………………………...43
x
Cathepsins………………………………………………………………………..45
Manipulation of oxidative stress precursors……………………………………………..46
Diet…………………………………………….....................................................46
Heat stress………………………………………………………………………..49
Lipopolysaccharides……………………………………………………………..50
Tenderness……………………………………………………………………………….53
Color……………………………………………………………………………………..60
Protein Oxidation………………………………………………………………………...62
Lipid Oxidation…………………………………………………………………………..64
Evaluation of oxidative stress markers…………………………………………………..65
In vivo: single wall nanotube hydrogels…………………………………………66
Ex vivo: Omic Profiles…………………………………………………………...68
Isoprostanes………………………………………………………………………72
Other metabolic indicators……………………………………………………….76
Link between downstream effects of oxidative stress and meat quality…………………77
Conclusion……………………………………………………………………………….79
MATERIALS AND METHODS………………………………………………………...80
Manuscript: Oxidative Stress as a measure for Postmortem Meat Quality……………...80
Lambs…………………………………………………………………………….80
Lipopolysaccharide Treatments………………………………………………….80
Sample Collection………………………………………………………………..81
Fabrication……………………………………………………………………….81
RNA Transcriptomics……………………………………………………………83
xi
Warner-Bratzler Shear Force…………………………………………………….84
Objective Color and Subjective Color…………………………………………...85
Proximate Composition………………………………………………………….86
Sarcomere Length………………………………………………………………..87
pH Analysis………………………………………………………………………87
Fatty Acids……………………………………………………………………….88
Free Calcium Concentration……………………………………………………..89
Lipid Oxidation (TBARS)……………………………………………………….89
Troponin T……………………………………………………………………….90
Desmin…………………………………………………………………………...92
Isoprostanes………………………………………………………………………94
Statistical Analysis……………………………………………………………….95
LITERATURE CITED…………………………………………………………………..96
MANUSCRIPT: The Impact of Oxidative Stress on Postmortem Meat
Quality…………………………………………………………………………..109
Abstract…………………………………………………………………………110
Introduction……………………………………………………………………..111
Materials and Methods………………………………………………………….113
Results…………………………………………………………………………..130
Discussion………………………………………………………………………137
Conclusion……………………………………………………………………...147
Literature Cited…………………………………………………………………148
Tables…………………………………………………………………………...152

xii
Figures…………………………………………………………………………..159
RECOMMENDATIONS FOR FUTURE RESEARCH…………………………....…..169
Appendices…….………………………………………………………………..170
Appendix I: Lamb Diet Composition………………………………………......170
Appendix II: Fabrication Map………………………………………………….171
Appendix III: RNA Extraction………………………………………………….174
Appendix IV: Objective color (L* a* b*) calibration instructions and helpful
tips………………………………………………………………………………176
Appendix V: Guide for Percentage of Surface Discoloration………………….180
Appendix VI: Fat extraction with Soxhlet method……………………………. 182
Appendix VII: Minerals and Ash Determination……………………………….183
Appendix VIII: Sarcomere Length of Powdered Meat Samples……………….184
Appendix IX: Fatty Acid Determination……………………………………….185
Appendix X: Determination of Free-Calcium Level…………………………...186
Appendix XI: Thiobarbaturic Acid Reactive Substances Assay……………….187
Appendix XII: Isolation of Myofibrillar Proteins………………………………188
Appendix XIII: Troponin T Degradation……………………………………….189
Appendix XIV: Desmin………………………………………………………...192
Appendix XV: Isoprostanes…………………………………………………….195
1
INTRODUCTION
This study seeks to understand the effect of oxidative stress in vivo on post-
harvest changes in meat quality which may improve tenderness early postmortem.
Tenderness is repeatedly cited as the primary element associated with both eating quality
and consumer purchasing decisions (Miller et al., 2001; Platter et al., 2005). In the U.S.,
consumers are willing to pay premiums for higher quality meat to ensure a good eating
experience (Platter et al., 2005). However, noticeable variation exists when comparing
tenderness (shear force values), in particular when comparing across marbling scores in
beef. More so, the extent of variation in tenderness increases as marbling decreases.
Inconsistent meat tenderness and its impact on consumer satisfaction is an obstacle to
optimizing both domestic and international demand for U.S. meat products. Thus,
investigations into the process of postmortem tenderization and the role of cellular
organelles and mechanisms involved have strong, practical application.
Muscle contraction is the result of a complex mechanism, requiring multiple
proteins and molecular compounds to work in concert. Contraction of myofibrillar
proteins allows for the physical movement of bones and tendons in response to neural
stimuli (Kuo et al., 2015). The postmortem deterioration of these proteins alters meat
tenderness. Further, if these protein complexes are altered in vivo, an earlier onset of the
tenderization process might be achieved, promoting more tender beef. Using proteomics
approaches, Malheiros et al. (2019) analyzed beef muscle tissue across samples
distinguished as tough, intermediate, or tender based on their average shear force values
(kilograms-force) and identified different oxidized proteins across each tenderness group.
The tender group samples, compared to the tough and intermediate groups, had highly

2
oxidized structural, contractile, and regulatory proteins, all directly associated with
muscle contraction and tenderization mechanisms. Concurrently, the tender group
exhibited higher oxidized proteins related to enzyme regulation (peroxiredoxin;
superoxide dismutase [Cu-Zn]) and cell protection (heat shock proteins). From these
results, it is clear that tender muscles exhibited oxidation of specific proteins associated
with meat tenderization. There is tremendous value to further understanding why certain
proteins oxidize in a manner to promote more tender beef.
Predisposition to oxidative stress may promote an increase in oxidized proteins. In
mitochondria, the oxidative phosphorylation mechanism produces reactive oxygen
species (ROS), the driving force of oxidative damage. These are highly reactive free
radical compounds generated as by-products of ATP synthesis, such as the production of
superoxide anion (O2-) and hydrogen peroxide (H2O2) (Sierra et al., 2013). Due to their
unstable state, ROS will collect electrons from their immediate surroundings, commonly
from organelles, to reach a stable state. The interaction of ROS with components of the
muscle can result in major cell damage, lipid oxidation, protein turnover, and DNA
alteration (Scicchitano et al., 2018). To alleviate this damage, muscle cells contain
various non-enzymatic and enzymatic antioxidants to detoxify ROS and prevent cell
damage (Kozakowska et al., 2015). These antioxidant mediators include superoxide
dismutase (SOD), catalase (CAT), glutathione peroxidase (GPX), and other low
molecular free radical scavengers (Bekhit et al., 2013; Scicchitano et al., 2018). The
dietary antioxidant alpha-tocopherol, vitamin E, has also been shown as an effective
supplement to alleviate ROS generation (Harris et al., 2001; Maraba et al., 2018).

3
However, under conditions of significant oxidative stress, endogenous antioxidants may
not be sufficient to quench the increased production of free radicals.
In states of prolonged oxidative stress, stability of mitochondrial membranes will
fail, thereby allowing encapsulated ROS generated by the mitochondria to be released to
interact with the matrix of muscle cells (Paradies et al., 2001; Elmore et al., 2007; Powers
et al., 2011). From this phenomenon, there is growing evidence that oxidative stress can
promote programmed cell death (apoptosis) and enhance early postmortem proteolysis.
Oxidative stress during death allows the release of cytochrome c, a pro-apoptotic heme
protein localized between the inner and outer mitochondrial membranes (Cai et al.,
1998). The cascade of the apoptotic pathway gives rise to the activation of caspases,
allowing subsequent proteolytic enzymes such as calpains (µ and m) and cathepsins to
interact with the muscle tissue, promoting structural degradation of muscle proteins
during postmortem aging (Logue et al., 2008; Kemp et al., 2010). Wang et al. (2018)
investigated the influence of ROS-generated oxidative stress in pre-rigor muscle tissue.
They concluded that increased generation of oxidative stress via ROS accumulation prior
to animal harvest may promote apoptotic factors such as cytochrome c displacement and
the caspase cascade. They also speculated that these conditions could initiate proteolytic
degradation of muscle fibers and improve meat tenderness. The influence of oxidative
stress is also being investigated for its impact on other factors of meat quality, such as
lipid oxidation and color stability.
The working hypothesis is that controlled levels of induced oxidative stress in
lamb can stimulate the production of ROS, generating a state of oxidative stress that
modifies the function of the different mechanisms responsible for meat quality. If the
4
hypothesis is true, control of oxidative stress-inducing events for the live animal may
impact meat quality.
The objectives of the research were to understand the mechanisms and
components related to meat quality in lamb from wethers administered defined levels of
an oxidative stress promoter. Specific objectives were to:
1) Identify changes in physiological status of lambs via a lipopolysaccharide
(LPS) challenge.
2) Characterize the relationship between muscle quality and oxidative stress on
the basis of the RNA transcriptome as it relates to LPS and Control-treated
lambs.
3) Quantify changes in oxidative biomarker generation in relation to LPS-
challenged lambs.
4) Assess the effects of oxidative stress parameters on lamb longissimus muscle
tenderness; and
5) Evaluate the impact of known levels of oxidative stress on color stability of
intact fresh lamb meat.
The long-term goal of this research is to improve the tenderness of fresh meat by
understanding the complexity of muscle tenderization as affected by in vivo oxidative
stress. The results are intended to serve as a model for future analyses in beef, meant to
understand the impact which oxidative stress-induced conditions may change the overall
meat quality attributes. This research could provide insightful thought into how
biochemical mechanisms are altered due to inherent physiological stress that occur within

5
our current livestock strategies, and how these strategies could be manipulated to
optimize the greatest opportunity for more consistently tender meat.
6
LITERATURE REVIEW
Mechanism of muscle contraction
Muscle contraction is the result of a complex mechanism, which requires multiple
proteins and molecular compounds to work in concert (Kuo and Ehrlich, 2015). In the
event of a stimuli, a nerve response instigates signal movement to the neuromuscular
junction surrounding the muscle fiber. This results in the binding of acetylcholine to
facilitate transfer of sodium ions through the sarcolemma, allowing an action potential to
travel down the t-tubule. As a result, an opening of calcium ion channels allows the
sarcoplasmic reticulum (SR) to release calcium ions via the ryanodine receptors. The
main function of calcium during muscle contraction is to bind to troponin C, one of the
three troponin subunits of the regulatory protein that facilitates tropomyosin to expose or
cover actin binding sites. When exposed, myosin hydrolyzes adenosine triphosphate
(ATP) to trigger the power stroke, pulling the actin filament towards the M-line,
shortening sarcomere length and completing contraction. Subsequent ATP binding is
required to release myosin heads and decrease the degree of contraction. This implies
muscle contraction is dependent on the relationship between the efficient calcium
regulation of the SR and ATP generation within the mitochondria (Dirksen, 2009).
Sarcoplasmic reticulum regulatory proteins
The intracellular signal for muscle contraction, regulation of calcium storage,
release, and cytoplasmic uptake are all factors manipulated by the SR. Storage of calcium
ions is met by homeostatic control of luminal calcium binding proteins. Calsequestrin, the
most abundant luminal calcium binding protein in the SR, maintains a high binding
7
capacity to support a large concentration of calcium ions reserves within the SR, while
also allowing a rapid release of calcium ions up reaction to a stimulus via an action
potential (Rossi and Dirksen, 2006). Calsequestrin also is bound to the SR membrane via
interactions with ryanodine receptors (RyR1), facilitating effective calcium release.
Activity of RyR1 is mutually dependent on bound calsequestrin, as an interrelationship
between levels of total luminal calcium can influence binding capacity of calsequestrin
(Zhang et al., 1997).
Calcium release is controlled by the direct protein-protein interactions as a result
of sodium-ion transfer with RyR1 proteins and inositol triphosphate (Meissner, 2002). A
cysteine-dense protein matrix, RyR1 is the predominant protein responsible for the
release of calcium from within the SR of skeletal muscle (MacKrill, 2012). Regulation of
RyR1 is dependent on calcium concentration (µM to mM) within and surrounding the
SR, as high levels within the sarcoplasm inhibit calcium release and low levels promote
calcium release (Copello et al., 1997). As an action potential travels down the t-tubule,
excitation coupling reactions take place, promoting a conformational change to the
dihydropyridine receptor (DHPR) and initiating the activation of RyR1 (Rossi et al.,
2009). In conjunction with calsequestrin, activity of RyR1 is manipulated by free radical-
mediated changes in amino acid structure during states of physiological stress, illustrating
the relationship between proteins (Eu et al., 1999). Inositol triphosphate acts as signaling
molecule responsible for calcium release along the SR. Inositol triphosphate assists in
prolong levels of calcium in the sarcoplasm upon RyR1 release.
Calcium influx is achieved by the Sarco-endoplasmic reticulum ATP-ase pumps
(SERCA). Sarco-endoplasmic reticulum ATP-ase is comprised of two primary structures:

8
a transmembrane portion that facilitates opening and closing of SERCA pumps and a
protein head which sustains calcium binding and release (Toyoshima and Inesi, 2004).
As its name suggests, SERCA is an energy-dependent protein pump which requires the
hydrolysis of adenosine triphosphate (ATP) (Rossi and Dirksen, 2006). Within muscle,
two isoforms are present, with SERCA 1 and SERCA 2 present in the sarcolemma of
Type II and slow-twitch skeletal muscle fibers, respectively (Ishii et al., 1998). Similar to
RyR1, SERCA activity can be inactivated in the presence of high free-radical
concentration and inhibited by sarcolipin (Ishii et al., 1998). All these proteins are
located along the outer membrane of the SR and each protein is involved with the
complex action of calcium flux during muscle contraction and relaxation.
Membrane composition
Organelle membranes, focusing on SR and mitochondria, are generally comprised
of a phospholipid bilayer, with hydrophobic fatty acid tails oriented towards the interior
of the membrane and the hydrophilic fatty acid head facing towards the cytosol exterior,
allowing an impermeable matrix to prevent transfer of water-soluble molecules
(Borchman et al., 1999). Composition of fatty acids is critical to fluidity and function of
bound protein channels (Stanley and Parkin, 1991). Saturated fatty acids contain no
double bonds across the carbon chain, lowering overall fluidity due to their densely
packed spacing. Conversely, unsaturated fatty acids contain one or more double bonds
across their hydrocarbon chain, allowing intermittent spacing across the membrane to
increasing fluidity (Borchman et al., 1999). Under states of oxidation, the fatty acid
composition is paramount to influence downstream effects on meat quality (Faustman et

9
al., 2010). Allylic carbons found on unsaturated fatty acids have a weaker capacity to
retain their hydrogens compared to saturated fatty acids, allowing an affinity for greater
oxidation at these sites, altering their physical orientation. This initiates a cascade of
oxidizing reactions, impacting the functionality of in vivo organelle membranes and
postmortem attributes of meat quality such as color stability, lipid oxidation, and meat
tenderization.
Generation of oxidative properties
Oxygen comprises roughly 21% of atmospheric air, nearly all of which is utilized
by mitochondria during respiration (Bolisetty and Jaimes, 2013). After binding to
hemoglobin, oxygen is transferred to myoglobin with muscle cells and available to
perform oxidative phosphorylation within mitochondria. This mechanism acts as the
production cycle of ATP, the essential energy source of biological function. Constant
metabolism of oxygen is necessary in order to supply sufficient ATP for basal metabolic
and physical function within an organism. While a necessity to sustain life of aerobic
organisms, such as livestock, oxidative phosphorylation does not come without
byproducts. These byproducts are beneficial in some respect for cellular signaling and
inflammatory response, but an intricate balance of these molecules is needed to prevent
detrimental quantities that can alter cellular stability. It is critical, therefore, to further
understand the generation of these products in conjunction with mitochondrial function
and their potential impact on muscle cells.
10
Mitochondrial function in skeletal muscle
Mitochondria are integral to normal cellular function and are the key contributor
to energy production in eukaryotic cells. Originating as a specialized form of bacteria,
mitochondria have adapted an endosymbiotic relationship within eukaryotic cells, acting
as the primary facilitator of phospholipid and heme synthesis, calcium homeostasis,
apoptotic activation and cellular death (Gray et al., 2001; Bolisetty and Jaimes, 2013).
Mitochondria hold key enzymatic systems designated for the oxidation of carbohydrates,
fat, and proteins to produce cellular energy in the form of ATP. The production of ATP is
essential for maintenance of skeletal muscle function, including contraction, relaxation,
signal transduction, and energy-dependent enzymes utilized in molecular reactions.
Mitochondria are comprised of four distinct domains, each holding their unique function
in relation to skeletal muscle (Kühlbrandt, 2015).
Mitochondria structure
Commonly misinterpreted as oval shaped organelles, mitochondria are very
diverse in their shape due to cycles of fissions and fusions with other mitochondria to
better facilitate the demands of cellular respiration (Gray et al., 2001). Given the current
state of an organism or localized cells, mitochondrial fission or fusion is regulated to
optimize energy metabolism while maintaining a homeostatic function within the
mitochondrial membrane. This is shown when overproduction of H2O2 facilitates fission
to repair damaged mitochondrial matrices (Schenkel and Bakovic, 2014). Focusing on
mitochondrial structure, the outer membrane is comprised of a phospholipid membrane
and separates the organelle from the cytoplasm. Porous in its design, the outer membrane
11
facilitates transportation of small uncharged molecules (<5 kDa) via the voltage
dependent anion channel (VDAC). The inter-membrane space allows translocation of
ions further into the mitochondria. In contrast to the outer membrane, the inner
membrane is a tightly built diffusion barrier, designed for selective ion and molecular
transport. This exclusivity is shown by an inner membrane potential of approximately
180mV, illustrating the movement of ions via specialized transport proteins (Schenkel
and Bakovic, 2014). Next, the inner mitochondrial membrane is distinguished as two sub-
sections, the boundary membrane and the cristae. As closely stacked discus-shaped
structures, cristae are bound to the majority of the inner membrane, and act as the site of
mitochondrial energy conversion (Osellame et al., 2012; Kühlbrandt, 2015). Lastly, the
inner mitochondrial matrix is the cytoplasmic space responsible for precursor
mechanisms in oxidative phosphorylation and mitochondrial DNA (mtDNA) synthesis.
This is possible due to a higher pH found within the mitochondrial matrix, permitting
regulation of ions via an electrochemical gradient during oxidative phosphorylation
(Llopis et al., 1998).
Mitochondria uniporter
During homeostasis, high concentrations of extracellular calcium are capable of
entering the mitochondria via the mitochondria uniporter. Due to the close proximity of
mitochondria to SR organelles, evolutionary development of this protein was necessary
(Dirksen, 2009). This protein regulates the passive uptake of calcium while maintaining
an even distribution of calcium concentration across the surrounding cytosol and the
mitochondria. Acting as a buffer for calcium in the cell, the uniporter allows the
12
concentration of calcium in the mitochondria to reach 106 greater concentration compared
to the cytosol. The concentration gradient of calcium acts to maintain proper membrane
potential of mitochondria, which is essential for proper function the TCA cycle and
function of the electron transport chain (Santo-Domingo and Demaurex, 2010). Given the
low affinity of the uniporter, however, a large amount of calcium is required to activate
the uniporter to cycle calcium into the mitochondrial matrix (Kirichok et al., 2004).
Mitochondria permeable transition pore
During mitochondrial storage of calcium, there are methods to mitigate calcium
overload. The mitochondria permeable transition pore (MPTP) is a secondary method to
release mass quantities of calcium in case of possible mitophagy. Used as a final option,
the MPTP opens the matrix to release large quantities of calcium as quickly as possible
during state of mitochondrial stress. However, calcium discharging can prolong exposure
of pore openings, facilitating disruption of the mitochondrial matrix’s membrane
potential, disrupting the mitochondria’s capacity to transfer electron and protons across
the matrix and lead to cellular death (Di Lisa et al., 2001).
ATP production precursors
Oxidative phosphorylation is the mechanism by which nutrients are oxidized to
produce electrons, enabling the generation of ATP (Santo-Domingo and Demaurex,
2010; Osellame et al., 2012). The subsequent breakdown of proteins, fats, and
carbohydrates produce the end product acetyl-CoA via amino acid metabolism, �-
oxidation, and glycolysis, respectively. Dependent on the nutrient, each pathway provides

13
a unique technique for acetyl-CoA to enter the mitochondrial matrix (Owen et al., 1998).
Amino acid metabolism degrades amino acids to a variety of intermediates for the citric
acid cycle and/or pyruvate for gluconeogenesis. During a fasting state, oxidation of
amino acids predominantly occurs when muscle cells break down amino acid constituents
with assistance of the liver, with some additional metabolism in the kidneys and small
intestine (Owen et al., 1998). The end product, pyruvate, is subsequently brought into the
mitochondrial matrix from the cytosol via the mitochondrial pyruvate carrier.. Beta-
oxidation of lipids is a more complex pathway, requiring the activation of acyl-CoA
synthetase to form fatty acyl-CoA. This facilitates fatty acids to pass through the outer
mitochondria membrane via the carnitine palmitoyl transferase I (CPTI). When reacted
with carnitine, a component of amino acids, acyl-CoA forms acyl-carnitine, and is then
allowed to pass into the inner mitochondrial membrane via translocase, with byproduct
CoA-SH is sent back into the cytosol (Melzer, 2011; Dunning et al., 2014). Carbohydrate
metabolism is fairly similar to amino acid metabolism in its end product. After the
breakdown of simple sugars glucose, fructose, and galactose via glycolysis, pyruvate can
be transported into the mitochondrial matrix via the mitochondrial pyruvate carrier
(Owen et al., 1998; Melzer, 2011). Carbohydrate breakdown is a result of each sugars
chemical makeup and how metabolic organs facilitate degradation. To utilize fructose,
the liver is the predominant organ needed to convert to phosphorylation substrates, as
fructose is not as readily absorbed in the blood as glucose. This constraint requires more
complex degradation techniques (Melzer, 2011). Once nutrients are broken down into
substrates, oxidative phosphorylation can occur.

14
Oxidative phosphorylation
During oxidative phosphorylation, a choreographed exchange of electron donors
works in concert with respired oxygen and hydrogen ions to produce ATP molecules.
Mitochondria bioenergetics facilitate electron donors nicotinamide adenine dinucleotide
(NADH) and flavin adenine dinucleotide (FADH2) via the citric acid cycle (Osellame et
al., 2012). Matrix protein complexes (MPC I, III, IV) embedded in the inner membrane to
facilitate the pumping of protons from the inner mitochondrial matrix into the inner
membrane space. These complexes work in conjunction with MPC II, coenzyme Q, and
cytochrome c to continue the transfer of electrons within the inner membrane. This alters
the membrane potential, increasing an affinity for hydrogen ions to re-enter the
mitochondrial matrix. Appropriately, MPC V permits transfer of hydrogen ions back into
the mitochondrial matrix, and when bound with enzyme ATP synthase, it is this transfer
of ion that facilitate ATP generation from previous oxidized adenosine diphosphate
(ADP) (Osellame et al., 2012; Kühlbrandt, 2015). This mechanism acts as the primary
pathway towards energy production and produces multiple byproducts as a result. While
major energy donors NAD+ and FADH
+ are recycled in the mitochondrial matrix to
regenerate to their reduced state, the production of additional, more unstable molecules,
can serve further biological functions.
Reactive oxygen species
Free radicals are necessary byproducts of oxidative phosphorylation. They are
developed and controlled within the mitochondria. While free radical formation is
commonly associated with states of inflammation or chronic illness, the vast majority of

15
free radical species are formed during basal physiological functions of cells, such as
oxidative phosphorylation (Dröge, 2002; Bolisetty and Jaimes, 2013). The exchange of
electrons from NADH and FADH2, coupled with the transfer of H+ ions through the inner
mitochondrial membrane, facilitate the generation of oxygen-based radicals known as
reactive oxygen species (ROS).
Other components of muscle cells (sarcoplasmic reticulum; sarcolemma) have
been suspected to contributing to ROS production, primarily due to subtle interactions
with cofactor NADPH and membrane proteins (Xia et al., 2003). However, the
mitochondria are widely regarded as the central point of ROS generation. Reactive
oxygen species include negatively charged, oxygen centered radicals (O2-, OH
-), but also
include reactive derivatives such as hydrogen peroxide (H2O2) (Zorov et al., 2000; Dröge,
2002; Powers et al., 2011; Xing et al., 2019). Low physiological levels of oxidants and
other radicals play an important role in the control of gene expression and regulation of
cell signaling. As signaling transduction molecules, ROS can influence redox-sensitive
pathways in skeletal muscle to alter how proteins modulate growth, differentiation,
proliferation, and controlled muscle turnover. Concurrently, ROS levels can influence
redox-sensitive pathways such as gene expression in response to inflammation, exercise,
infection, growth factors, and stress. In particular, the mitogen activated protein-kinase
(MAPK), nuclear factor kappa-light chain enhancer of activated B cells (Nf-kB), and
activator protein 1 (AP1) have all be shown to change their expression in response to
ROS (Powers et al., 2011). The generation of ROS, when coupled with minimal
physiological response, holds potential to alter the composition of cellular stability
through oxidative stress and change myocyte composition.
16
Superoxide
Superoxide (O2-) is the primary ROS generated by incomplete reduction of
oxygen in the electron transport chain in vitro, and is an intermittent product of specific
enzymatic systems. Through comprehensive review, it is theorized that the majority of
O2- production occurs within the mitochondrial matrix during the electron exchange at
Complex I (Ott et al., 2007; Bekhit et al., 2013). This phenomenon is stimulated with the
presence of succinate, a common substrate produced from Complex III. While Complex
III can generate O2-, inhibition of Complex III via antimycin reduces its activity along the
electron transport chain, which is theorized to significantly increase superoxide
generation. Because antimycin does not inhibit Complex I, it can continue to utilize
electron donors and generate O2- (Ott et al., 2007; Powers et al., 2011; Bolisetty and
Jaimes, 2013). In contrast to Complex I, O2- production at Complex III is possible outside
of the mitochondrial matrix within the inter-membrane space. Coenzyme Q10, (i.e.
ubiquinone) is a lipophilic electron carrier that is conjoined to Complex III (Paradies et
al., 2001). Through a series of redox reactions, Coenzyme Q10, ubiquinone, is capable of
transferring electrons across Complex III. As a result, the recycling oxidation-reduction
reactions of ubiquinone also facilitate the generation of O2- (Ott et al., 2007; Bolisetty and
Jaimes, 2013). While considered relatively unreactive in comparison to other radicals,
superoxide can extract electrons from biological membranes and other cellular
components. An example of this is the reduction of cytochrome c to initiate apoptotic
mechanisms. Superoxide does, however, hold a noticeably longer half-life (~5 seconds)
than most radicals, and is capable of dismutating with other molecules, such as nitric
oxide (NO-) and hydrogen ions (H
+) to produce ROS which are more unstable than O2
-
17
(Zorov et al., 2000; Fulle et al., 2004). While superoxide is constantly produced at low
levels during normal respiration, intracellular reactions permit superoxide to have an
increased impact on organelle and cellular function.
Hydrogen peroxide
Hydrogen peroxide (H2O2) is a produced by O2- binding with hydrogen ions or
enzymatic breakdown of O2- via manganese-superoxide dismutase enzymes. Organelle
membranes are permeableto H2O2, allowing it to corss the mitochondria into the cytosol
with the use of aquaporins surrounding the outer mitochondrial membrane (Bienert et al.,
2006; Bolisetty and Jaimes, 2013). While it is speculated O2- may also diffuse through
mitochondria by voltage dependent anion channels, it is unknown to what degree this
diffusion occurs (Madesh and Hajnóczky, 2001). As a non-radical ROS, H2O2 is
incapable of directly oxidizing lipids or DNA, but it can be cytotoxic during periods of
chronic illness such as cancer (Fulle et al., 2004; Powers et al., 2011). Hydrogen peroxide
can act as a major precursor to oxidative damage within a cell. In particular, when H2O2
is converted into hydroxyl radicals (OH-) in the presence of ferrous (Fe
2+) and cuprous
(Fe+) iron via the Fenton reaction (Powers et al., 2011; Bolisetty and Jaimes, 2013;
Halon-Golabek et al., 2019). This is pertinent to the presence of iron within myocytes, as
skeletal muscle holds the majority of the bound iron in ferritin or myoglobin, outside of
the mitochondria. However, in conditions of manganese deficiency, superoxide dismutase
enzymes can instead bind with copper or iron, which may restrict availability for these
metals to interact with H2O2, hindering its activity. When bound to these transition
metals, H2O2-medated production of OH- increases within the mitochondria, promoting
18
increased organelle damage and possible mitophagy (Paradies et al., 2001; Ott et al.,
2007; Halon-Golabek et al., 2019).
Hydroxyl radical
During a homeostatic response, hydroxyl radicals (OH-) are the final free radicals
formed as a result of ROS interaction with proteins or enzymatic degradation, and are
known to promote cellular damage. Due to its electron spin configuration, OH- holds the
strongest oxidizing potential of all ROS, attributing to their high reactivity. Consequently,
they bind with their nearest surroundings and satisfy their lone valence electron, resulting
in oxidative damage (Powers et al., 2011). Their affinity to rapidly bind to their
surroundings makes it virtually impossible to directly quantify them in vitro, and only
possible to evaluate products of oxidative reactions, such as disulfide bonds (Powers et
al., 2011; Bekhit et al., 2013; Bolisetty and Jaimes, 2013) Due to their extreme reactivity,
OH- molecules are regarded as the most damaging ROS generated in a biological setting.
Reactive nitrogen species
The term reactive nitrogen species (RNS) refers to the enzymatic development of
nitrogen radicals and reactive derivatives with a nitrogen center (Powers et al., 2011;
Bolisetty and Jaimes, 2013). In nature, all development of RNS is controlled by the
activity of nitric oxide synthase enzymes (NOS). In mammals, NOS is generated in three
distinct isoforms: neuronal (nNOS), inducible (iNOS), and endothelial (eNOS) (Kapur et
al., 1997; Brannan and Decker, 2002; Förstermann and Sessa, 2012). Of these isoforms,
nNOS is expressed in neurons of the central and peripheral nervous systems, and

19
predominantly functions for the relaxation of smooth muscle and vasodilation of blood
vessels. Through immunological and cellular fractionation methods, nNOS has been
detected in specialized structures of fast-twitch muscle fibers like the sarcolemma
(Powers et al., 2011). Endothelial NOS is a dually acylated peripheral membrane protein
found bound to caveolin-1, a caveolae structural protein associated with endothelial cells,
and assists in regulating blood pressure and atherosclerosis (García-Cardeña et al., 1997).
Unique to muscle, immunoblotted eNOS colocalized with mitochondria of rat skeletal
muscle, strongly suggesting a specific localization of eNOS to skeletal muscle
mitochondria (Stamler and Meissner, 2001). Inducible NOS, while not as active in
muscle, is expressed in response to stress factors such as lipopolysaccharides and
cytokines (Tengan et al., 2012). When mediated by molecular oxygen, L-arginine, and
electron cofactors NADPH and FAD, NOS is capable of producing nitric oxide (NO), the
smallest known signaling molecule. Similar to ROS, the physiological levels of NO are
recognized to have an impact on mitochondrial biogenesis, respiration, and oxidative
stress. Under states of low RNS, its constituents assist in increased glucose
uptake/metabolism, vasodilation, and possibly mitochondrial biogenesis (Nisoli and
Carruba, 2006; Powers et al., 2011; Bolisetty and Jaimes, 2013; Hong et al., 2014).
However, it is postulated that cascading of RNS can initiate nitosative stress, producing
detrimental effects on organelle function, DNA stability, and lipid/protein composition.
Nitic oxide
Nitric oxide (NO-) is the initial RNS formed as a result of enzymatic reactions
(Figure 1). Predominantly generated using endothelial nitric oxide synthase, eNOS, NO-
20
is introduced into skeletal muscle via major arterioles surrounding muscle fibers
(Bolisetty and Jaimes, 2013). Concurrently, eNOS is postulated to be found in
mitochondria, sometimes identified as mtNOS. This theory is supported by the growth of
enzymatic products of NO reactions (L-citrulline) in the presence of inflammatory stimuli
(Stamler and Meissner, 2001). It is speculated the presence of NO- within mitochondria is
indicative of pathways independent of NOS activity such as the electron transport chain
(Ghafourifar and Cadenas, 2005; Lacza et al., 2006; Arriagada et al., 2018). As a result,
NO- is capable of influencing mitochondrial composition and function. Mainly, NO
-
holds a high affinity to cysteine-rich proteins, such as Complex IV-bound cytochrome c
oxidase, due to the easy covalent binding, nitrosylation, of thiol groups (-SH) into
disulfide bonds (Nisoli and Carruba, 2006; Tengan et al., 2012; Liu et al., 2018; Poderoso
et al., 2019). Given the significance of cytochrome c oxidase and its ability to transfer
multiple electrons simultaneously, accumulated NO- present can ultimately inhibit
mitochondrial respiration. Given high levels of NO- coupled with prolonged exposure,
NO can cause irreversible inhibition of mitochondrial respiration, uncoupling proteins,
and ultimately resulting in apoptosis (Bekhit et al., 2013; Poderoso et al., 2019).
Conversely, low levels of NO- have been shown to trigger mitochondrial biogenesis via
increased expression of Peroxisome proliferator-activated receptor gamma coactivator 1-
���ℎ�, PGC-1�, encoding proliferation of mitochondrial proteins (Nisoli and Carruba,
2006; Tengan et al., 2012). Nitric oxide regulation is critical to the efficiency of
mitochondrial respiration and energy production. The presence of NO-, particularly
within mitochondria, is critical considering the interaction of NO- generates reactive
derivatives of RNS. In particular, the high affinity for NO- to bind to superoxide to

21
produce peroxynitrite, S-nitrosothiols (SNOs), and metal NO- complexes (Stamler and
Meissner, 2001).
L-arginine + O2 + NADPH ��(���������)�������������� NO + L-citrulline + NADP
+
NO- + O2
.-→ ONOO
- (Peroxynitrite)
ONOOH → NO2
- + OH
-
Figure 1: Generation and breakdown of reactive nitrogen species (RNS).
Peroxynitrite
During prolonged states of oxidative stress, hybridization of superoxide and nitric
oxide produce peroxynitrite (ONOO-), a specialized molecule that can target proteins
relevant to organelle stability and muscle function (Eu et al., 1999). This reaction holds a
large Km, and energetically favors production of peroxynitrite in the presence of O2- and
NO-. As a result, the reaction is three time faster than the dismutation of superoxide to
produce hydrogen peroxide, and even faster than the binding of NO- with heme proteins
(Powers et al., 2011). The reaction kinetics in making peroxynitrite are so favorable that
accumulation of ONOO- is greater than other products when O2
- and NO
- are present.
Depending on the quantity, peroxynitrite can have drastically different effects on skeletal
muscle. During cellular homeostasis, Zhou et al. (2003) demonstrated peroxynitrite
promotes tyrosine nitration, which in turn activates glucose uptake via lipid or protein
oxidation channels by AMPK expression (Hong et al., 2014). Under conditions of
reactive species amplification, ONOO- supports protein nitrosylation and DNA damage
(Zorov et al., 2000; Stamler and Meissner, 2001; Bekhit et al., 2013) Specifically,
ONOO- targets proteins rich in cysteine and methionine residues, as these amino acids
hold high oxidative potential due to the weak stability of their thiol groups (-SH). These
22
reactions result in protonated peroxynitrite formation (ONOOH), facilitating an
energetically favorable decomposition of peroxynitrite to produce hydroxyl radicals
(ONOOH � NO2- + OH
-) (Wang et al., 2002). As a result, peroxynitrite is not only
highly disruptive towards protein function, but an effective precursor to the development
of highly reactive oxygen species.
Hyperchlorite
Hyperchlorite is a myeloperoxidase formed by binding hydrogen peroxide with
molecular chloride (Cl-). Similar to peroxynitrite, hyperchlorite is capable of damaging
biomolecules via oxidizing lipids, electron donor activity, and thiols. In rare cases,
hypercholrite can be converted to hypochlorous acid, which can diffuse across cellular
membranes and is acidic enough to cause further protein and lipids damage (Powers et
al., 2011). However, this RNS is found in infection-responding neutrophils, specialized
white blood cells, and is commonly seen when experimentally-induced stress in bacterial
species. Due to the irregular generation and unknown effect in mammalian cells
compared to well-known RNS, it is regarded as a less critical RNS in the respect of
skeletal muscle damage.
Redox-sensitive signaling pathways
While it is still unknown how to define distinct levels of ROS based on their
biological effects, there is evidence that ROS/RNS trigger downstream signaling
pathways that stimulate cell growth, differentiation, proliferation, and apoptosis. These
pathways can also act as precursors to generate enzymes and antioxidant factors which
23
can suppress the quantity and severity of reactive species (Miller et al., 1993). Often,
these pathways are triggered by the mere presence of ROS/RNS generated, and are
sometimes expressed due to the change in activity of distinct proteins (cysteine, kinases,
phosphatases) linked to oxidation or nitrosylation products (Bolisetty and Jaimes, 2013).
Concurrently, there is evidence to suggest that the degree of ROS/RNS damage may alter
the level of expression across redox-signaling pathways. Simply put, the expression of
redox-signaling pathways is not positively correlated [linearly related] with the sheer
amount of ROS/RNS generated (Bolisetty and Jaimes, 2013). Given the diversity of
pathways activated in response to ROS/RNS, it is challenging to understand the intricate
relationship between reactive species and biological response pathways. As a result, it is
pertinent to understand the known connection between these foundational pathways and
oxidative stress factors.
Nuclear factor erythroid 2-related factor (Nrf2)
During ideal physiological conditions, the production of ROS generated by
oxidative phosphorylation is easily suppressed. This is predominantly due to the activity
of the nuclear factor erythroid 2-related factor (Nrf2), which is responsible for the
regulation of antioxidants and radical scavengers produced in vivo (Bolisetty and Jaimes,
2013; Kozakowska et al., 2015). Stored in the cytosol, Nrf2 is sequestered to Kelch like-
ECH-associated protein 1 (KEAP1). A sensor protein, KEAP1 is designed to inactivate in
response to reactive oxygen species (Dodson et al., 2015). When present, H2O2 and NO
have been shown to inactivate KEAP1 by oxidizing several cysteine residues present,
stimulating Nrf2 to enter the nucleus and bind to the antioxidant response element (ARE)
24
attached to stress responsive genes. This generates transcription factors needed to signal
release of antioxidants (Fourquet et al., 2010; Bolisetty and Jaimes, 2013). It is possible
that Nrf2 activators may actually increase ROS/RNS generation (Fourquet et al., 2010),
however, the evidence is inconclusive. While Nrf2 activity is a critical mediator to
antioxidant signaling during low levels of reactive species, its activity is generally
disregarded compared to other signaling pathways during increased cellular stress
(Fourquet et al., 2010; Bolisetty and Jaimes, 2013).
NF�B/AP-1
As expected, a multitude of physiological pathways work dependently, as the
activities of certain proteins for one pathway are mitigated by the expression of
transcription factors of another. For example, the function of Activator Protein 1(AP-1) is
largely dependent on the signaling pathways of NF�B (nuclear factor kappa-light-chain-
enhancer of activated B cells) and MAPK (mitogen-activated protein kinase). In both the
cytoplasm and nucleus, NF�B and AP-1 react to “moderate” amounts of ROS.
Concomitantly, each are stimulated by the presence of H2O2 and a variety of cytokines
related to inflammation and apoptosis, such as Interleukin-1/6, and Tumor necrosis
factor-� (Powers et al., 2011). In concert, both pathways bind to DNA promoters to
activate antioxidant proteins including superoxide dismutase-2 (SOD2), cyclooxygenase-
2, catalase (CAT), MnSOD, and glutathione peroxidase (GPx) (Bolisetty and Jaimes,
2013). Interestingly, NF�B also assists in activating iNOS, which suggests that it
indirectly promotes expression of other redox-signaling pathways by the generation of
NO (Nisoli and Carruba, 2006; Powers et al., 2011). While the activation of this pathway

25
is shown to develop antioxidant combatants against reactive species, NF�B is implicated
to increase inflammation via upregulation of enzymes that facilitate ROS production such
as NADPH oxidase and xanthine oxidase, as well as NOS isoforms (Bolisetty and
Jaimes, 2013). As a result, an intricate balance of NF�B and AP-1 regulation is necessary
as too little expression will not suppress reactive species and over expression may
generate high enough levels of ROS to oxidize proteins relevant to cellular structure and
organelle function, reducing their activity entirely.
Mitogen activated protein kinase (MAPK)
From another perspective, MAPK promotes cell proliferation and differentiation
in response to cellular damage as a result of reactive species (Dröge, 2002). In regards to
cell turnover, MAPK pathways activate dormant satellite cells, the precursor to active
skeletal muscle cells (Jones et al., 2005). This is accomplished by the diverse
composition of MAPK phosphate subsets, each can be grouped based on their subcellular
localization (i.e., MAPK-2 found in the nucleus; MAPK-3 present in the cytoplasm).
These subsets act to dephosphorylate MAPK, inactivating it. Interestingly, ROS can
target MAPK phosphates during states of high ROS production, and modify their
function to upregulate MAPK activity (Son et al., 2011). Upregulation of MAPK is
speculated to initiate translocation of heat shock proteins 25/27 to the myofilament Z-disk
to prevent apoptosis (Blunt et al., 2007). In turn, there is a tight and intricate relationship
between MAPK activation and ROS production.

26
Homeostatic response
In order to maintain cellular homeostasis, muscle cells have evolved to use a
network of different antioxidant defense systems to counteract oxidative damage in the
presence of ROS. The diverse antioxidant systems distribute enzymes, which are specific
to certain reactive species and designed to produce a subsequent reactive specie which is
specific to another antioxidant. This cascade of enzymatic reactions intend to produce
final products that are stable for ideal cellular function, such as water or molecular
oxygen. Intrinsic regulation of ROS includes both enzymatic and non-enzymatic
antioxidants and these regulatory systems are located across both intracellular
(organelles; cytoplasm) and extracellular space. The regulatory mechanism for ROS
depends on the antioxidant. Predominantly, endogenous antioxidant systems convert
ROS to less reactive states, but can also prevent ROS propagation by minimizing
available pro-oxidants such as chelating iron and copper (Miller et al., 1993).
Interestingly, antioxidant activity varies across different muscle fibers, with oxidative
(Type I) fibers noticeably greater than glycolytic (TypeII) fibers (Powers et al., 1994).
This is understandable as Type I fiber types have more mitochondria. Dietary
antioxidants (�-tocopherol) can act as ROS scavengers and eliminate ROS molecules
(Suman et al., 2014). Antioxidants are readily present endogenously and mitigate cellular
response to ROS. In similar fashion, exogenous enzymes can be administered to combat
ROS, as Batifoulier et al. (2002) showed greater membrane stability of organelles as
supplemented �-tocopherol inclusion rates increased. Typically, such antioxidants are
provided in daily rations, as there is potential that supplementation can also hold benefits
of energy efficiency and growth in livestock (Miller et al., 1993).

27
Superoxide dismutase
As the name implies, endogenous antioxidant enzymes are those which are
produced within an organism to provide protection against lipid, protein, or nucleic
oxidation. In relation to reactive species, superoxide dismutase (SOD) is the antioxidant
that starts the cascade of enzymatic reactions to eliminate ROS. Discovered in 1969,
SOD dismutates O2- radicals to form H2O2 as seen in Figure 2 (Paradies et al., 2001;
Descalzo and Sancho, 2008; Delliaux et al., 2009). Superoxide dismutase comprises three
isoforms, all of which use unique cofactors to facilitate the breakdown superoxide anions.
Superoxide dismutase-1 is located in the cytosol and inner membrane space, and uses a
copper-zinc binding cofactor. Superoxide dismutase-3 uses the same cofactor but is found
in the extracellular space outside a muscle cell. Superoxide dismutase-2 uses a
manganese cofactor and resides in the mitochondrial matrix, making it the primary
isoform used to prevent ROS accumulation during oxidative phosphorylation (Miller et
al., 1993). When examining skeletal muscle, the general activity of SOD varies by
location, with ~15-35% of SOD activity occurring within the mitochondria and the
remaining activity in the cytosol. This implies that if ROS generation occurs outside of
the mitochondria, there is sufficient SOD that resides outside of the mitochondria to
break down O2-. With sufficient supply of SOD, prevention of ROS formation is
attainable, eliminating the onset of oxidative stress from the start.
2 O2.- + 2H
+ ���������������� ������������������� O2 + H2O2
Figure 2: Superoxide breakdown and production of hydrogen peroxide.

28
Glutathione peroxidase/catalase
Upon completion of SOD-mediated degradation, ROS species are further broken
down to water molecules via glutathione peroxidase and catalase (GPx and CAT,
respectively; Figure 3) (Gatellier et al., 2004). When examining the two enzymes, GPx
appears to be relatively similar to SOD in respect to its diverse isoforms and their
localization in muscle cells. In particular, GPx activity can greatly influence the
mitochondrial permeable transition pore due to the large quantity of cysteine residues
present (Dalle-Donne et al., 2003). Additionally, GPx requires both a selenium cofactor
and glutathione (GSH), a cysteine based protein, which supplies electrons needed to
trigger a forward reaction. This may act as a detriment to GPx activity however, as the
cell must have a redox cycle to have the oxidized glutathione (GSSG) to return to is
reduced state (Descalzo and Sancho, 2008). Catalase, like SOD, uses iron as a required
cofactor to reduce H2O2 to water and molecular oxygen (Zámocký and Koller, 1999;
Kirkman and Gaetani, 2007). Compared to GPx, CAT only uses one cofactor, iron, to
regulate its activity instead of a reduced, thiol-based peptide. Conversely, CAT efficacy
is more variable, as its concentration is positively correlated to its affinity towards H2O2
degradation (Pradhan et al., 2000). This implies that CAT is most effective against H2O2
once the ROS has grown in quantity rather than when it becomes available for enzymatic
degradation. While both enzymes act to degrade the same reactive species, both GPx and
CAT are ineffective in certain conditions. However, its counterpart remains active in that
same situation. This results in a relationship between each enzyme, where conditions
which may inhibit optimal activity of one are more conducive for the activity of the other,
which helps maximize suppression of ROS-mediated damage to myocytes.

29
H2O2 + H2O2 ! � � �������� 2H2O + O2
H2O2 + 2GSH "�� �#����������� ������������������� 2H2O + GSSG
Figure 3: Enzymatic breakdown of hydrogen peroxide using catalase and glutathione peroxidase.
Alpha-tocopherol (vitamin E)
Dietary supplementation of vitamin E is widely regarded as the best applicable
method to delay meat discoloration and lipid oxidation (Faustman et al., 1998). When
consumed, �-tocopherol is predominantly deposited in the membranes of major
organelles. Derived from the carotenoid family, �-tocopherol is a lipid-soluble
antioxidant consisting of long chains of conjugated double bonds and a benzene ring, and
acts as an effective inhibitor of free radical-induced peroxidation of unsaturated fatty
acids (Suman et al., 2014). This prevention occurs by terminating free radical reactions
during the propagation of lipid radicals, oxidizing �-tocopherol into a tocopherol radical
(Ryan et al., 2010). Redox reactions can occur using ascorbate and reduced glutathione to
recycle this radical back to �-tocopherol, allowing further ROS scavenging (Packer et al.,
1979; Ryan et al., 2010). Given the capacity for carotenoids to be deposited within
organelle membranes responsible for myofibrillar function, their presence can profoundly
affect protein and lipid oxidation (Harris et al., 2001).
Mechanism of oxidative stress
Aerobic organisms generate ROS as a result of oxidative phosphorylation. As a
safeguard, generation of a multitude of antioxidants and enzymatic compounds are
utilized to suppress and eventually remove any detrimental effect of these ROS.
30
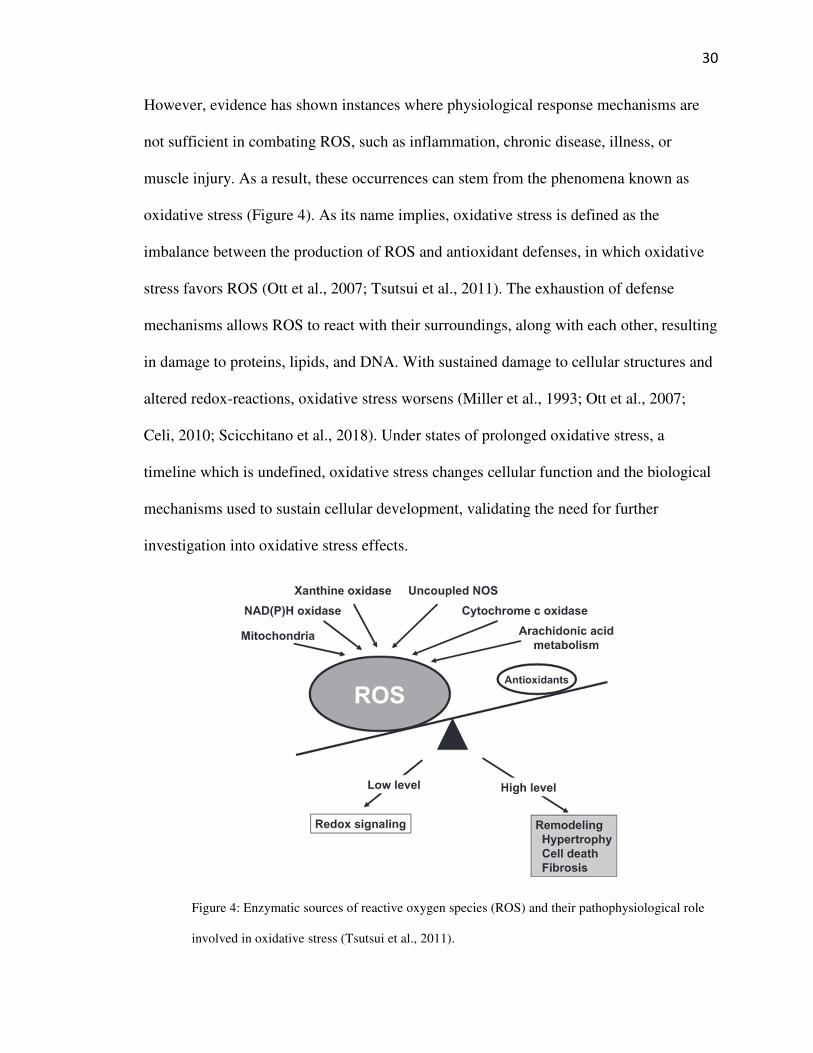
However, evidence has shown instances where physiological response mechanisms are
not sufficient in combating ROS, such as inflammation, chronic disease, illness, or
muscle injury. As a result, these occurrences can stem from the phenomena known as
oxidative stress (Figure 4). As its name implies, oxidative stress is defined as the
imbalance between the production of ROS and antioxidant defenses, in which oxidative
stress favors ROS (Ott et al., 2007; Tsutsui et al., 2011). The exhaustion of defense
mechanisms allows ROS to react with their surroundings, along with each other, resulting
in damage to proteins, lipids, and DNA. With sustained damage to cellular structures and
altered redox-reactions, oxidative stress worsens (Miller et al., 1993; Ott et al., 2007;
Celi, 2010; Scicchitano et al., 2018). Under states of prolonged oxidative stress, a
timeline which is undefined, oxidative stress changes cellular function and the biological
mechanisms used to sustain cellular development, validating the need for further
investigation into oxidative stress effects.
Figure 4: Enzymatic sources of reactive oxygen species (ROS) and their pathophysiological role
involved in oxidative stress (Tsutsui et al., 2011).
31
DNA profile
Various components of DNA can be modified via oxidative stress. In particular,
the oxidation of purine and pyrimidine bases making up the foundation for the
deoxyribose backbone are the most susceptible to oxidative alteration (Bekhit et al.,
2013). This promotes permanent cross-bridging of these nucleic acids,, drastically
changing the functionality of the DNA molecule, forcing recycling of these molecules
and slowing cellular nuclei to meet cellular demands for DNA turnover. In particular, the
damage by ROS to mitochondrial DNA disrupts transfer RNA and ribosomal RNA,
impacting protein synthesis and essential ATP production by the electron transport train.
Oxidative damage induced by ROS is likely a major source of genomic instability leading
to respiratory dysfunction (Ott et al., 2007). Oxidative stress-mediated DNA damage is
more commonly linked to chronic illness and has not yet been linked to meat quality. A
more in-depth investigation into the presence of oxidative stress and its impact on the
formation of proteins using transcriptomic profiling is necessary.
Lipid oxidation
Oxidation of lipids is primarily focused on polyunsaturated fatty acids (PUFAs).
Due to weak allylic central carbon binding in double bonds, PUFAs contain methylene
bridges, which hold highly reactive hydrogen atoms. In the presence of ROS, the lipid
oxidation mechanism can begin (Figure 5). Known as the initiation step, fatty acids lose a
hydrogen ion during oxidation to produce highly unstable lipid radicals called
hydroperoxides (Bekhit et al., 2013; Domínguez et al., 2019). In regards to fatty acids,
PUFAs are the most susceptible to lipid oxidation. In the presence of molecular oxygen,
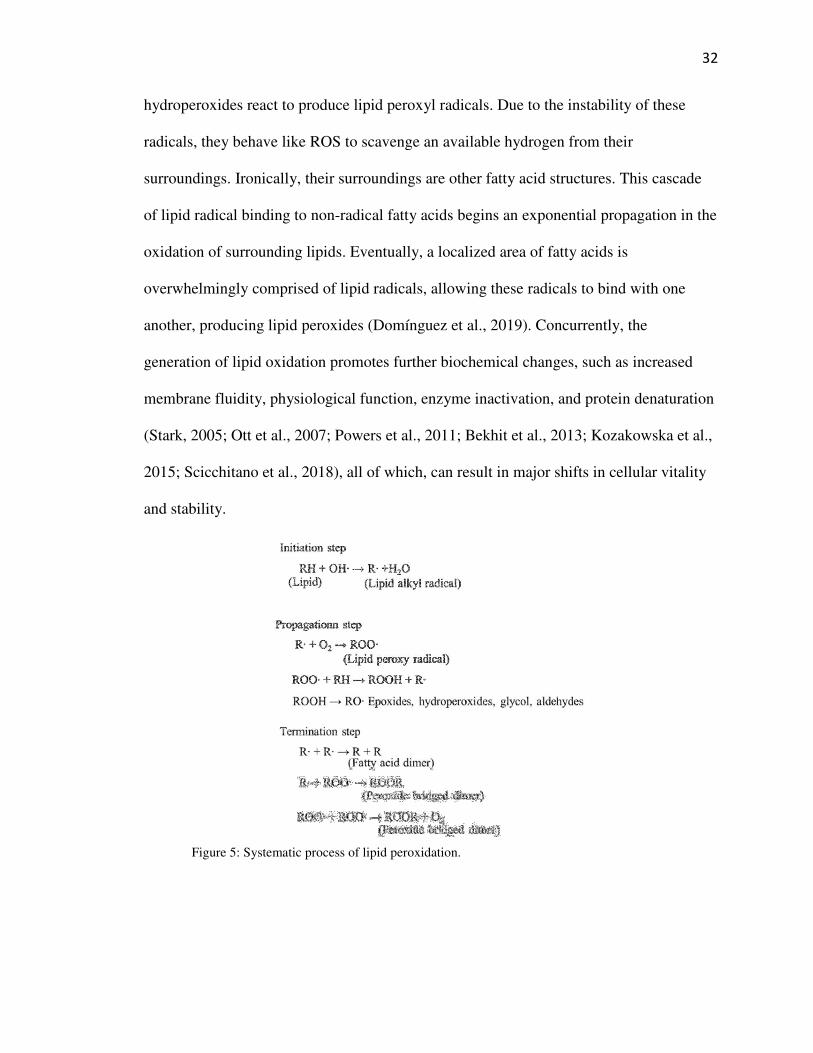
32
hydroperoxides react to produce lipid peroxyl radicals. Due to the instability of these
radicals, they behave like ROS to scavenge an available hydrogen from their
surroundings. Ironically, their surroundings are other fatty acid structures. This cascade
of lipid radical binding to non-radical fatty acids begins an exponential propagation in the
oxidation of surrounding lipids. Eventually, a localized area of fatty acids is
overwhelmingly comprised of lipid radicals, allowing these radicals to bind with one
another, producing lipid peroxides (Domínguez et al., 2019). Concurrently, the
generation of lipid oxidation promotes further biochemical changes, such as increased
membrane fluidity, physiological function, enzyme inactivation, and protein denaturation
(Stark, 2005; Ott et al., 2007; Powers et al., 2011; Bekhit et al., 2013; Kozakowska et al.,
2015; Scicchitano et al., 2018), all of which, can result in major shifts in cellular vitality
and stability.
Figure 5: Systematic process of lipid peroxidation.
33
Lipid oxidation interrelationship with meat color
Fresh meat color is one of the largest indicators of freshness to consumers and the
primary factor in consumer purchasing (Gatellier et al., 2001). Consumer analysis
indicates that a 20% discoloration of meat during retail display can reduce total beef sales
by 50% (Hood and Riordan, 1973). The color of meat has been related to the combination
of three states of myoglobin on the surface of meat: reduced myoglobin, oxymyoglobin,
and metmyoglobin. The overall composition of myoglobin pigments depend on the rates
of oxymyoglobin oxidation and metmyoglobin reduction (Gatellier et al., 2001), which
has been linked to lipid oxidation (Faustman et al., 2010). Intermediate radicals are
produced as a result of oxidative propagation of lipids and can accelerate myoglobin
oxidation, increasing meat discoloration. Wong (1989) explained how iron-bound
myoglobin can catalyze lipid oxidation, indicating that ferric (Fe3+
) can promote lipid
autoxidation, generating superoxide anions (O2-). When reacting with protein-bound thiol
groups, additional O2- generation can occur. Concurrently, O2
- acts as a byproduct of
redox reactions, rapidly being dismutated to H2O2, which can further increase lipid and
myoglobin oxidation simultaneously.
Protein oxidation
Recent literature has been recognizing the emerging investigation in the oxidation
of proteins sources in food. The growing interest stemmed from the idea of protein
sources to be oxidized via ROS reactions, with ROS potentially causing deleterious
effects on muscle proteins alongside lipids (Stadtman and Levine, 2003). In turn, the
34
investigation into how protein oxidation occurs, and how oxidative stress can promote
these reactions, has yet to be adequately defined.
Using current knowledge, protein oxidation can occur through the targeting of
peptide backbones and specific amino acid side chains, resulting in a loss of sulfhydryl
groups (protein cross-linking) and generation of carbonyl derivatives (Estévez, 2011). In
general, protein oxidation occurs similar to oxidation of lipids. Using the generation of
ROS, oxidative radicals target the functional groups along the side chain of amino acid
residues and scission of peptide backbones. In regards to lipid and protein oxidation,
radical formation can be a result of the Fenton reaction, the catalysis of transition metals
iron/copper in the presence of H2O2 radicals (Martinaud et al., 1997; Estévez, 2011).
When oxidative radicals are reduced, the transfer of energy with the hydrogen atoms can
generate protein radicals. Protein radicals further react with each other and molecular
oxygen to form a population of radicals and generate hydroxyl derivatives of proteins
(Stadtman and Levine, 2003). The routes taken to generate these protein derivatives are
dependent on the specific amino acid complexes which are targets by ROS, and thus,
each method of protein oxidation can merit different products from protein oxidation.
From protein oxidation, there are a number of different derivatives which can be
used to evaluate oxidation. Of these, loss of sulfhydryl groups (R-SH) is a common
measure of protein oxidation. While most thiols are low-reacting given their pKa (~8.5),
certain amino acids can create a charged environment for thiolate anions to exist. These
anions are more readily oxidized/nitrosylated, especially in the presence of ROS/RNS
(Dalle-Donne et al., 2003; Ying et al., 2007). As a result, cysteine and methionine are
easily oxidized than others due to their thiolate side chains. If oxidized, thiol groups tend
35
to bind with their cysteine-oxidized thiol counterparts, forming covalent disfulide cross-
bridges (Frederiksen et al., 2008; Estévez, 2011). These cross-bridges are more stable
than most cross-linkages in amino acids, due to their strong attraction from sharing
electron orbital with one another, and require exogenous chemical conditions to prevent
their formation (i.e., betamercaptoethanol). During conditions which promote protein
denaturation (cooking, high pH, or oxidative stress), disulfide bonds are very common
and act to change the conformation of protein shape, and possibly function (Soladoye et
al., 2015). As a result, the change in composition drastically alters protein stability, acts
as a severe detriment to protein function and quality, and can affect downstream quality
attributes of muscle postmortem.
In addition to thiol oxidation, generation of carbonyl derivatives is a well-known
indicator of protein oxidation. Carbonylation is the irreversible, non-enzymatic formation
of aldehydes and ketones during protein oxidation (Estévez, 2011). Carbonyl derivatives
are commonly formed from amino acids lysine, threonine, and arginine using metal-
catalyzed oxidation against amine groups (Stadtman and Levine, 2003). After oxidation,
amino acids covert into irreversible aldehyde groups. Given the moiety of carbonyls, they
are capable to continue binding with surrounding peptide bonds to form cross-links via
Schiff-base formation, which increases the susceptibility of neighboring peptide to form
ketones or aldehydes. Unique to carbonylation, myoglobin is susceptible to protein
oxidation when exposed to H2O2 due to the its binding with transition-metals iron or
copper. As a result, oxidation reactions occur to form metmyoglobin pigments. Estévez
and Heinonen. (2010) discovered H2O2-mediated metmyoglobin formation to produce
36
hypervalent radical ferrylmyoglobin, which has been linked to lipid and protein oxidation
(Baron and Andersen, 2002).
Stability of the sarcoplasmic reticulum
As previously stated, the sarcoplasmic reticulum (SR) acts as a regulatory
organelle for muscle contraction by the release and sequestering of calcium ions into the
cytosol by the ryanodine calcium channel and SERCA, respectively. (Rossi and Dirksen,
2006). Consequently, the SR acts as a critical component to meat quality, as calcium acts
as a catalyst for the activation of proteolytic calpains used in meat tenderization
(Koohmaraie, 1996). Oxidation of the SR membrane could increase calcium flow out of
the SR. This effect occurs as a result of prolonged postmortem muscle aging in
conjunction with chronic illness, when membrane repair mechanisms are minimal (Fulle
et al., 2004). Certain ROS can influence calcium homeostasis across the sarcoplasmic
reticulum and mitochondria. Isaeva et al. (2005) reported that H2O2 increased calcium
release from the sarcoplasmic reticulum. Other factors, such as prolonged exercise, have
been shown to produce ROS (Li et al., 1999).
During states of oxidative stress, nitric oxide is generated and reacts with protein
residues found within the SERCA and ryanodine receptors. Cysteine and methionine
residues are largely comprised of oxidatized sulfhydryl-groups. When oxidized, SERCA
activity is inhibited via disulfide formation, drastically decreasing uptake of cytosolic
Ca2+
ions and consequent inhibition of muscle contraction (Powers et al., 2011). Ishii et
al. (1998) revealed the reversible activity of SERCA inhibition after the loss of nitric

37
oxide. However, this recovery of SERCA activity is quite slow considering the reactivity
of NO occurs within seconds.
Activity of ryanodine receptors is likely dependent on S-nitrosylation of amino
acids with high oxidative potential. Low concentrations of NO-mediated oxidation did
not affect RyR1 channel activity, as the binding of radical hybrid peroxynitrite forms
permanent cross-links of disulfide bonds within RyR proteins. Interestingly, subunit
cross-linking did not inhibit activation of skeletal RyR channels by disulfide bond
formation from sulfhydryl groups. Simply put, low NO concentration didn’t stop activity
of ryanodine receptors, but did alter the functionality of receptors, changing their function
and preventing physical release of Ca2+
ions. Conversely, high concentrations of NO
could activate RyR channels. At high enough concentrations, diversity of NO-related
species are created after binding to RyR (GSNO, CysNO, and SIN-1) and their
concentration ratio regulated the denitrosylation of RyR (Ishii et al., 1998; Eu et al.,
1999). It is not quite understood how the diversity of these NO-related species are
controlled, as it is likely dependent on factors such as cellular composition, organelle
membrane structure, NO concentration, and antioxidant interaction (Eu et al., 1999).
Mitochondria stability
Multiple facets of cellular life and death revolve around mitochondrial activity.
Not only are mitochondria the center for ATP production, they are also the center of
intracellular ROS production (Bolisetty and Jaimes, 2013). During bouts of oxidative
stress, the integrity of mitochondrial function is jeopardized both within the matrix and
across the extracellular membrane. Ott et al. (2007) demonstrated how aconitase, an iron-

38
sulfur bound protein, acts as a catalytic converter of citrate to isocitrate in the Krebs
cycle. Irreversible oxidation of aconitase during oxidative stress caused dysfunction of
the Krebs cycle and diminished ATP production due to the lack of electron donors
generated. This progressively decreased the membrane potential of the mitochondrial
matrix, and if not resolved, caused the degradation of the matrix and loss of
mitochondrial function to promote apoptosis (Zorov et al., 2000; Sierra and Olivan,
2013). Free fatty acid production as a result of membrane oxidation confounds the loss of
membrane potential. Bernardi et al. (2006) stated the combination of increased ROS
production and lowered membrane potential activated the MPTP in a last-ditch effort to
expel ROS and prevent mitochondrial destruction. However, the increased proportion of
ROS produced, combined with the depolarization of mitochondria membrane, facilitated
slow efflux of ROS, which can result in mitophagy (Di Lisa et al., 2001). These
cascading events all promote cellular death and initiate apoptotic pathways, which are
responsible for replacing oxidized proteins and organelles.
Apoptotic pathway
Mitochondrial ROS generation, coupled with other pro-apoptotic proteins, are the
central cause of apoptosis, or the execution of programmed cellular death. The apoptotic
process is a non-inflammatory pathway complementary to mitosis, which acts in concert
with enzymatic proteins. The end goal is to break down necrotic cells and induce growth
of new cells (Ott et al., 2007). At mitochondrial failure, key proteins are utilized in cell
signaling of apoptosis and can be evaluated as markers of apoptotic pathways during
stages of oxidative stress (Dröge, 2002).
39
Cytochrome c
In living cells, cytochrome c functions as a the primary electron carrier between
Complex III and IV of the electron transport chain (Ke et al., 2017). As it is related to the
electron transport chain, cytochrome c is localized within the inner mitochondrial
membrane and bound alongside cardiolipin, an anionic phospholipid that assists in
stability of the mitochondrial membrane. Ott et al. (2007) postulated cardiolipin and
cytochrome c were so tightly bound that the separation requires major changes in
cardiolipin’s affinity for cytochrome c to be released. In states of oxidative stress, the
oxidation of cardiolipin facilitates cytochrome c release and is shown to assist in the
expulsion of cytochrome c from the inner mitochondrial membrane (Kagan et al., 2009).
Concomitantly, pro-apoptotic proteins (Bax) allow the opening of mitochondrial pores
along the outer membrane, allowing cytochrome c release from the mitochondria into the
cytoplasm. Once in the cytoplasm, cytochrome c initiates gene signaling of proteolytic
proteins used to complete apoptosis.
Caspase system
Later stages of apoptosis facilitate the degradation of necrotic cells in order to
provide growth for new and adapted structures. Madesh and Hajnóczky (2001)
commented on how the presence of cytochrome c in the cytoplasm signaled the family
Apaf-1 genes (apoptotic protease activating factor 1), which activate enzymatic proteins.
Correspondingly, Apaf-1 binds with cytosolic cytochrome C to form the apoptosome, a
large quaternary protein that enables the activation of caspase proteins (Madesh and
Hajnóczky, 2001). The caspase work in conjunction to achieve proteolytic function.
40
Sierra and Olivan (2013) reviewed distinct groups of caspases and their role in apoptotic
pathways. To start, initiator caspases 8, 9, and 12 turn on in response to apoptotic stimuli
and accordingly activate effector caspases 3, 6, or 7. This is completed by the progressive
cleaving of each type of caspase in order to cleave subsequent caspases, activating each
upon being cleaved. When activated, the caspase enzymes initially function to cleave
Poly (ADP Ribose) Polymerase, designed to repair proteins, allowing natural cellular
breakdown and eventual death to be met (Porter and Jänicke, 1999). Additionally,
caspase has been theorized to cleave calpastatin, an inhibitor of postmortem aging in
muscle. Wang et al. (1998) showed calpastatin activity held a negative relationship with
caspase activity up to two days postmortem at refrigerated temperatures. Caspase
degradation of organelle membranes and cytoskeletal proteins increases cytosolic
calcium levels and calpain activity (Wang, 2000). This action assists in early postmortem
tenderization.
Small heat shock proteins
Inherently, biological homeostasis of structural proteins is maintained through the
use of chaperone proteins. As its name suggests, chaperone proteins stabilize unstable
proteins and oversee the correct assembly of protein growth (Creagh et al., 2000;
Lomiwes et al., 2014). In relation to oxidative stress, the primary isoforms of interest are
small heat shock proteins (sHSPs). Of sHSPs, HSP20 (20 kDa), HSP27 (27 kDa) and ��-
crystallin (22 kDa) have been implicated in meat quality related to oxidative stress.
Fischer et al. (2002) found that the expression of these chaperone proteins in skeletal
muscle occur at a high volume compared to other tissues. Due to the frequent generation

41
of oxidative stress factors in skeletal muscle, it makes sense that increased sHSPs are
produced as a response to apoptosis. During homeostatic conditions, sHSPs can act as
regulatory factors in myofiber composition. Lomiwes et al. (2014) stated that sHSPs
regulate the growth of actin myofilaments. During the conversion of G-actin to F-actin,
the positive terminal associated with F-actin growth has an affinity ten times greater to
bind G-actin than the negative end. As HSP27 inherently binds to the positive end,
inhibiting exponential growth, phosphorylation of HSP27 is required to be released to
allow for further F-actin growth. This action prevents the overproduction of actin
filaments. Der Perng et al. (1999) illustrated how HSP27 works alongside ��-crystallin
to prevent overgrowth of intermediate desmin filaments, controlling their growth to
replace damaged proteins. During oxidative stress, however, they function as modulators
of the apoptotic mechanism. Creagh et al. (2000) stated an increase in stress factors
(ROS, heat) promote heat shock factors (HSF) to transport into the nucleus, bind with
HSP genes, and upregulate HSPs to combat apoptotic mechanisms. In particular, HSP27
can bind to cytosolic cytochrome C and other pro-apoptotic proteins, inhibiting
apoptosome formation and subsequent activation of caspase enzymes. However, the
overexpression of these sHSPs can prevent myogenic differentiation necessary for new
cellular growth, as shown by ��-crystallin inhibition of caspase-3 dimers to prevent
degradation of necrotic cells. This reinforces the rule of sHSPs as a necessity during
oxidative stress response, regular cellular growth, and development.
42
Enzymatic aging
Cellular apoptosis begins at death, only there is no longer a supply of oxygen
present to sustain energy production for the repair, growth, and protection for cellular
turnover. Consequently, it has been suggested that apoptotic factors may contribute to
initial postmortem degradation of proteins during the conversion of muscle to meat
(Ouali et al., 2006). Cao et al. (2010) found the generation of caspase-9 activity increases
exponentially from 4 to 30 hours postmortem, and was shown to peak in its activity for as
long as 7 days postmortem. Total activity of caspase activity may also be muscle-
specific, as different muscles are comprised different fiber types. As the degree of
apoptosis is correlated to mitochondrial activity, different fiber types require varying
number of mitochondria for normal muscle function in vivo. Therefore, fiber type may
affect mitochondrial-mediated apoptotic processes in the early postmortem development
of caspase (Kemp and Parr, 2012). Early increase in apoptotic activity is logical, as death
coupled with anaerobic conditions and the lack of ATP generation would increase
caspase activity, and any external injury or advanced oxidative stress could further
impact the extent of apoptosis early postmortem. Huang et al. (2016) reported that
increased postmortem aging of beef skeletal muscle increased the ratio of
cytosol:mitochondria cytochrome c and decreased anti-apoptotic factor HSP27,
indicating continual proteolytic degradation as aging continues. Laville et al. (2009)
reported that samples from bulls exhibiting less shear force (tender; 27.7 N) compared to
samples with more shear force (tough; 41.2 N) 7 days postmortem, showed a greater
amount of inner and extracellular mitochondria fragments in samples collected 10
minutes postmortem. Thus, increased aging results in faster degradation of organelle
43
structures. With the help of increased organelle degradation, downstream mechanisms
contributing to meat tenderness may become more active early postmortem.
Calpain-calpastatin relationship
At the onset of postmortem tenderization, changes in muscle pH, temperature, and
enzymatic inhibitors all contribute to the behavior of proteolytic enzymes to
progressively degrade muscle structure as a natural degradation process. Under controlled
conditions, this is a vital mechanism to enhance the palatability of fresh meat
(Koohmaraie and Geesink, 2006). Postmortem improvement in meat tenderness results
from the breakdown of myofibrillar structures by endogenous enzymes (Ouali et al.,
2006). The primary enzymes recognized to contribute to postmortem aging are calpains,
cathepsins, and, to an extent, 20S proteasome. Of these, calpains are by far the most
extensively researched family of enzymes linked to meat tenderness. While Pandurangan
and Hwang (2012) comment on the ability of calpains to modify proteins in vivo, their
primary effect on meat quality is the overarching mechanism responsible for
tenderization in muscle proteins (Kemp and Parr, 2012; Lian et al., 2013). Calcium-
dependent, non-lysosomal peptides, the three subsets of calpains within skeletal muscle
are $-calpain, m-calpain, and calpain 3. In regards to skeletal muscle postmortem, $-
calpain and m-calpain take precedent, as calpain 3 is not associated with calpain
inhibitors and functions for maintenance of the structural protein titin (Ilian et al., 2004).
When active, the calpain system targets substrates that relate to structural integrity of the
sarcomere. In particular, the hydrolysis of desmin, titin, and nebulin are recognized as the
first proteins degraded as a result of postmortem aging (Kemp et al., 2010; Lian et al.,
44
2013; Bhat et al., 2018). These proteins assist in the sarcomeric alignment of the
myofibril during contraction, and maintain the binding of the Z-line to both myofibirils
and costameres connected to the sarcolemma (Huff Lonergan et al., 2010). The
hydrolysis of these proteins results in the detachment of sarcomere-sarcolemma binding
in addition to sarcomere-sarcomere adhesion found at the Z-disk (Taylor et al., 1995;
Henderson et al., 2017) Of the two active isoforms, $-calpain is the more readily active
due to its lower molar calcium concentration needed to function (~5-50$m) compared to
m-calpain (~200-800$m). Taylor et al. (1995) reported $-calpain to be more active in
early postmortem compared to m-calpain, when the majority of postmortem proteolysis
of key myofibrillar proteins including nebulin, titin, desmin and troponin-T occurs. Their
activity is short lived, however, as their unstable state, combined with calpain inhibitor
calpastatin, quickly suppress the majority of their activity within a few days postmortem.
Conveniently, the progression of postmortem aging results in greater calcium leakage
from the sarcoplasmic reticulum and mitochondria, the same organelles responsible for
muscle contraction, facilitating m-calpain activity.
In addition to cytosolic calcium levels, the activity of calpain is regulated by
calpastatin (Ouali et al., 2006). Calpastatin (110 kD) is the inhibitor specific for $- and
m-calpain and coexists with calpain. Calpastatin is comprised of four domains on its N-
terminal, each of which can independently inhibit calpain, meaning a single calpastatin is
capable of inhibiting four calpain units (Ouali et al., 2006; Pandurangan and Hwang,
2012). In relation to oxidative stress in terminal patients, calpastatin is shown to prevent
calpain activity during apoptosis, inhibiting the dysregulation of harmful cells and
promoting chronic inflammation (Momeni, 2011). In the same manner, apoptotic

45
pathways resulting in cellular degradation upregulate calpastatin in response to calpain
activity. Ouali et al. (2006) and Kemp and Parr (2012) commented on the proportional
growth of both calpain and calpastatin to be fairly consistent regardless of muscle or fiber
type, insisting that calpain tenderization can be limited because of calpastatin inhibition
regardless of length of postmortem aging. The literature has shown an overall decline in
change of shear force in meat as aging progresses. Given the minimal change of shear
force after a certain time, prolonged aging could promote more negative effects to meat
quality, such as shorter shelf life and greater discoloration. Concurrently, prolonged aging
will eventually create no significant difference among consumer tenderness evaluation
(Miller et al., 2001; Perry et al., 2001). It is recognized, therefore, that early postmortem
aging of muscle holds the greatest impact on total tenderization in lowering shear force of
meat.
Cathepsins
First discovered in 1950, cathepsins were the first enzymatic system postulated as
the postmortem tenderization mechanism (De Duve et al., 1955; Ouali et al., 2006).
Cathepsins are a family of enzymes stored within the lysosome, and are identified based
on the frequency of amino acid residues within each type, such as cysteine, aspartic, and
serine groups. In particular, cathepsin L and B, both with the cysteine active site, are
implicated to increase tenderization by hydrolysis of desmin, troponin, nebulin, titin, and
tropomyosin. However, extensive research correlating cathepsins to meat tenderness is
inconclusive (Taylor et al., 1995). Koohmaraie et al. (1991) showed that there is minimal
degradation as a result of cathepsins. This is because tenderization is not associated with
46
actin and myosin degradation, both of which are primary substrates for cathepsins
(Okitani et al., 1980). This is coupled with the multitude of hurdles that must be met in
order to allow cathepsin activation, including breakdown of the lysosome. Koohmaraie
(1988) showed cathepsins to have an optimum activity in a more acidic (pH ~5.0)
environment. Zamora et al. (2005) suggested the inhibition of cathepsins, via cystatin, to
be the superior indicator of meat tenderness, as there is a stronger correlation between
activity of cysteine cathepsin inhibitors and meat toughness than there is cathepsin
enzymes and meat tenderness. However, this correlation was made with a 6-variable
regression equation comprised of factors such as rate of pH decline, decline of $-calpain
level, and lactate dehydrogenase activity.
Manipulation of oxidative stress precursors
Generation of oxidative stress factors are contingent on the onset of physiological
stress conditions. While there is inherent generation of ROS due to oxidative
phosphorylation, the generation of ROS can result from mitochondrial processes
influenced by extrinsic factors. While their degree of influence on oxidative stress is
uncertain, it is well-recognized that external factors can be integral to oxidative
mechanisms related to meat quality, most notably protein oxidation and lipid
peroxidation.
Diet
In animal production, diet composition has always been a topic of discussion. Due
to the variety of animal diets available, diet composition is commonly developed due to

47
cost, nutritional value, and known health and performance benefits that can benefit the
growth and development of livestock. There is an ever-present need to understand how
commercial diets may influence animal performance, feed efficiency, and even meat
quality.
In commercial agriculture, the majority of intensive finishing systems in the
United States incorporate energy-dense concentrates such as grains supplemented with
essential minerals and fibers. This strategy is known to assist in increased weight gain
and muscle growth in livestock compared to finishing strategies focused on grass-fed
diets. In turn, diets impact fatty acid composition of muscle cells and organelle structures.
Hwang and Joo (2017) demonstrated how cattle from different genetic and environmental
backgrounds (Hanwoo vs American vs Australian) had fatty acid profiles related to their
diet during finishing (grain vs grass). They discovered noticeably higher unsaturated fatty
acids in beef fed grain-based diets, especially in monounsaturated fatty acid (MUFA)
content. In the United States, dietary inclusion of grain by-products has been
implemented as a result of ethanol production utilizing corn grains for fuel production.
As a result, energy dense distillers grains are often used as a substitute for part of the corn
being used in livestock production.
Distillers grains are produced in a variety of forms, such as dried, wet, modified,
or with soluble supplementation. All forms tend to be more energy dense than corn for
livestock feed (Klopfenstein et al., 2008). As with corn, cattle fed diets with distillers
grains inclusion deposit larger amounts of unsaturated fatty acids compared to grass-fed
diets. In addition, distillers grains cause greater unsaturated fatty acids in meat compared
to diets composed predominantly of corn (Nade et al., 2012; Chao et al., 2017; Ribeiro et
48
al., 2018). Fatty acid composition is a critical factor to meat quality, as unsaturated fatty
acids are susceptible to oxidative mechanisms which impact lipid oxidation, color
stability of lean proteins, and oxidative rancidity and off flavors, reducing consumer
acceptability (Wood et al., 2004). de Mello et al. (2018) demonstrated greater inclusion
of wet distillers grains compared to a corn-based diets increased malonaldehyde (MDA)
content in whole muscle cuts, with MDA content increasing with increased days of retail
display.
In sustaining meat quality, inclusion of vitamin E (�-tocopherol) is commonly
utilized as a ROS scavenger deposited within organelle membranes. While �-tocopherol
inclusion is more costly, it is suggested to improve immune function and weight gain in
cattle production (Wood et al., 2004; Deters and Hansen, 2019). Also, inclusion of �-
tocopherol has been shown to enhance meat quality (Faustman et al., 1998). Asghar et al.
(1991), Ponnampalam et al. (2012), and E. N. Ponnampalam et al. (2012) showed greater
stability of desirable meat color and decreased lipid oxidation in whole muscle products
when animals diets were supplemented with �-tocopherol, in particular with greater
inclusion of grass-based diets compared concentrates. Sales and Koukolová (2011)
demonstrated how varying levels of �-tocopherol imparted within muscle related to color
stability. Interestingly, the level of �-tocopherol deposited into meat eventually plateaus
as vitamin E inclusion increases. These mirror redness (a*) values in meat across fresh
beef and pork products. This suggests that while the utilization of vitamin E in diets can
greatly increase color sustainability, a limit of maximum efficacy is possible, so over
supplementation of this feed additive may not be cost effective.
49
In addition, Chao et al. (2017) examined how cattle supplemented vitamin E in
high energy diets can counteract oxidative stability in sarcoplasmic reticulum, reducing
oxidative potential against organelle membranes and apoptotic mechanisms in vivo and
early postmortem. This evidence confirms that the feeding strategies provided to
livestock can have a direct impact of oxidative potential to affect meat quality.
Heat stress
Environmental factors have been suggested to increase oxidative factors. In
particular, heat stress is a non-specific physiological response to prolonged exposure to
high ambient temperatures (Xing et al., 2019). As a whole, heat stress is shown to reduce
feed intake, as metabolic heat of digestion coupled with environmental heat promotes
added stress on livestock (Habibian et al., 2016). It was suggested by Akbarian et al.
(2016) that increased heat stress could create an imbalance of body redox stability,
resulting in susceptibility to oxidative stress. Slimen et al. (2014) noted that heat stress
caused an acute oxidative stress response, as heat stress upregulates superoxide anions
and thermal inactivation of superoxide dismutase. Concurrently, heat stress promotes
dysregulation of uncoupling proteins along the electron transport chain, allowing protein
leakage and mitochondrial dysfunction (Akbarian et al., 2016). Interestingly, heat stress
has been linked to variable response of oxidative stress, based on muscle type. Montilla et
al. (2014) isolated red and white muscle fibers of pork semitendinosus muscles from gilts
under 1 or 3 days of thermoneutral or heat stress conditions. As a whole, red muscle
fibers expressed greater malonaldehyde (oxidation) across 1 day of heat stress, along with
increased response to ROS enzymes and anti-apoptotic factors compared to
50
thermoneutral and heat stressed white fibers. This infers that red (oxidative) fibers are
more sensitive to heat-mediated oxidative stress response systems and are most sensitive
to downstream effects of oxidative stress. It can be postulated that prolonged-acute
oxidative stress can be more detrimental to oxidative muscle fibers (Type I) compared to
glycolytic white fibers (Type II).
Lipopolysaccharides
Given the complexity of oxidative stress in vivo, administration of pro-
inflammatory stimuli are controlled measures of oxidative stress to monitor immune
response factors. Lipopolysaccharides (LPS) are covalently-bound lipids and
polysaccharides derived from the outer membrane of gram-negative bacteria (i.e.
Escherichia coli) and are a known endotoxin used in acute inflammatory-mediated
oxidative stress studies (Sternberg, 2007; Powers et al., 2011). As an endotoxin, LPS
stimulates toll-like receptor signaling pathways, which initiate innate immune response
mechanism NF�B, to start transcription of pro-inflammatory cytokines interleukin-1�
(IL-1), interleukin-6 (IL-6), and tumor necrosis factor-� (TNF-�) (Halawa et al., 2013).
Under condition of high LPS concentration, production of pro-inflammatory mediators
such as ROS can be produced as a result of LPS toxicity, promoting oxidative stress to
occur. Implementation of management strategies has been shown to influence the degree
of LPS-mediated oxidative stress on livestock performance. Bai et al. (2019) illustrated a
decrease in rate of gain in Cherry Valley meat ducks as LPS dosage increased.
Concurrently, an increase in inflammatory cytokines IL-6, IL-10, TGF-�, as well
as an increase in oxidative synthase protein inducible nitric oxide synthase (iNOS) have

51
been found. This makes sense, as an increase in compensatory weight of liver, a
metabolic organ, also occurred. Yates et al. (2011) reported LPS to increase
inflammatory response hormone cortisol, rectal temperatures, and lymphocytes as mature
ewes consume higher crude protein diets. Studies have been performed to investigate the
effects of dietary oils on aggregated inflammatory conditions. Yang et al. (2008)
compared the inclusion of fish or corn oil at 4.5% (g/kg of BW) on performance of
chickens when administered an inner-perineal LPS challenge or saline control.
Lipopolysaccharide challenge lowered overall feed efficiency and increased lymphocyte
generation. Interestingly, inclusion of fish oil increased activity of inflammatory
cytokines IL-1 compared to corn oil, and upregulated IL-6, and TNF-� compared to corn
oil when exposed to an LPS challenge. In addition to pro-oxidative factors in diet,
inclusion of exogenous antioxidants can ameliorate LPS-mediated oxidative stress.
Kaiser et al. (2012) evaluated mRNA expression of different inflammatory cytokines in
response to vitamin E type (natural vs synthetic) compared to level of intramuscular LPS
injection. As expected, LPS injections resulted in higher RNA expression of cytokines
compared to saline groups. Intriguingly, vitamin E source influenced different RNA
expression of cytokines, as synthetic vitamin E increased IL-6 expression across saline
groups and natural vitamin E increased TGF-� expression. Concurrently, natural vitamin
E lowered iNOS expression compared to synthetic vitamin E, suggesting supplementing
natural vitamin E inclusion may ameliorate inflammatory mechanisms in vivo.
Lipopolysaccharide-mediated oxidative stress, it is postulated to have an impact
on muscle cells, which could affect meat quality postmortem. Suliman et al. (2004)
examined gene expression of mitophagy and biogenesis in response to LPS-induced mice
52
harvested 6, 24, or 48 hours post-injection. Total oxidation (malondialdehyde; carbonyl
content) increased as post-injection time of LPS increased coupled with significant
decrease in reduced glutathione (antioxidant) content at 6 and 24 hours. Antioxidant
activity aligns with expression of COX-1, an inflammatory producing enzyme, as COX-1
was at its highest expression at 0 and 6 hours, with a significant decrease after 24 hours
post-injection. As post-injection time increased, there was a significant decrease in
mtDNA expression 24 hours post-injection, which was negatively correlated with
mitochondrial glutathione content (r2=0.89) and positively correlated with
malondialdehyde content (r2=0.91). Concurrently, mitochondrial transcription factors
Nrf-1 and Nrf-2 increased expression between 6 and 24 hours, but both ultimately
decreased at 48 hours postmortem. This infers the lack of transcription factors for
mitochondrial biogenesis occurred as post-injection time increased. Additionally,
transcription factors used to generate protein complexes of the electron transport chain
(ND-1 and ND-2) significantly decreased at 24- and 48-hours postmortem. Finally, an
increase in uncoupling proteins was expressed as post-injection time increased, signifying
the dissipation of the inner mitochondrial membrane. In total, the use of LPS caused an
early antioxidant response, but quickly exhausted antioxidant effects. Coupled with the
gradual decrease in proteins related to mitochondrial biogenesis, the induction of LPS-
mediated oxidative stress could act as a stimulant for mitophagy. As a result, the onset of
LPS-mediated oxidative stress could impact postmortem quality of meat by induced
apoptotic mechanisms and oxidation of muscle proteins and lipids.

53
Tenderness
Since the phenomena of oxidative stress was discovered, it has been extensively
linked to its effects on chronic inflammation and illness, and has been investigated
thoroughly in medical literature. However, oxidative stress is now being linked to factors
related to meat quality, as organelles linked to oxidative stress have been shown to
impact proteolytic mechanisms related to postmortem quality of meat, influencing both
product quality and consumer palatability. An investigation into oxidative stress on these
organelles and mechanisms have been reported to hold an immediate impact on meat
tenderization early postmortem (Cook et al., 1998; Wang et al., 1998; Koh and Tidball,
2000; Warner et al., 2005; Blunt et al., 2007; Cottrell et al., 2008; Archile-Contreras and
Purslow, 2011; Senaratne, 2012; Mohrhauser et al., 2013; Ouali et al., 2013; Picard et al.,
2014; Chao, 2015; Cottrell et al., 2015; Chao et al., 2017; Kunze et al., 2017; Chao et al.,
2018; Liu et al., 2018; Wang et al., 2018; Zhang et al., 2018; Malheiros et al., 2019).
Ouali et al. (2013) commented on how early postmortem tenderization in meat tends to
show increased fractionation of cytochrome C as a result of greater meat tenderization.
Cytochrome C fractions, along with other apoptotic precursors involved with the TCA
cycle (3-Hydroxyisobutyrate dehydrogenase) increase early postmortem. In addition,
Picard et al. (2014) reported how proteolytic enzymes ($-calpains) and proteins related to
muscle structure (myosin chains) are all highly active in meat during aging. These studies
imply that apoptotic mechanisms can act as initiators of proteolytic enzymes linked to
meat tenderization. It has been recognized, however, that meat given similar aging
conditions with drastically different tenderness values exhibit unique proteomic profiles,
which can insinuate how inherent differences in biological mechanisms can influence
54
meat tenderization. Malheiros et al. (2019) investigated differences in oxidized proteins
from angus-crossbred cattle under identical management conditions, aged for two days
postmortem, with different shear force values to designate between groups labeled tender
(38.2 ± 2.9N), intermediate (51.9 ± 6.8N) and tough (74.5 ± 7.8N). Amongst these
groups, it was evident that tender samples had greater oxidative damage to structural
(actin, myosin, desmin), regulatory (troponin), and antioxidant proteins (peroxiredoxin),
along with some anti-apoptotic heat shock proteins compared to tough samples.
Interestingly, tough samples exhibited less oxidation towards metabolic proteins,
including enzyme SOD2 related to mitochondrial ROS stress. These data depict how
early postmortem tenderization can be influenced by the expression or activity of
oxidative stress factors, and how these factors can impact the oxidation of proteins which
promote tenderization. Further investigation is necessary to discern how different
ROS/RNS impact components of meat tenderness.
Both in vivo and in vitro analysis of muscle tissue has been examined. Using
nitric oxide as the contributor to oxidative stress, Cook et al. (1998) induced pre-rigor
longissimus lumborum with promoters and inhibitors of nitric oxide to assess postmortem
meat quality. Across multiple days aging, Cook et al. (1998) discovered increased
tenderness on 3 and 6 day aging in samples administered with NO promoters compared to
NO inhibitor group. There were no tenderness differences in 1 or 8 days of aging. This
data supports that in vitro NO generation in muscle can stimulate increased postmortem
tenderization. However, this data is shown to be contrary compared to more recent
literature. Koh and Tidball (2000) induced skeletal muscle cells with nitric oxide donors
to inhibit the activity of m-calpain on the breakdown of cytoskeletal protein talin. These
55
data suggest that nitric oxide inhibits m-calpain activity by S-nitrosylation of the cysteine
sites on the endogenous enzyme. In addition to calpain inhibition, the data shows
upregulated calpastatin activity, further inhibiting calpain-mediated proteolysis of
structural proteins. Liu et al. (2018) and Warner et al. (2005) theorize reduced
tenderization is a result of nitrosylation reactions of NO with organelle calcium channels
RyR1 and SERCA. Due to NO nitrosylation, there is insufficient cytosolic calcium
available to facilitate calpain autolysis on cytoskeletal proteins such as titin, desmin, or
nebulin, resulting in less tender meat. Conversely, inhibition of nitric oxide has been
indicated to increase postmortem tenderization. Cottrell et al. (2008) indicated
antemortem injections of nitric oxide inhibitors 135 minutes prior to slaughter can
improve meat tenderness early postmortem in lambs. Combining NO inhibitors with brief
exercise prior to slaughter, lambs had a lesser degree of pH decline during rigor mortis,
although gross numbers are not significant enough to be a detriment to meat quality.
Interestingly, Cottrell et al. (2008) evaluated across two muscles: longissimus lumborum
(LL) and semimembranosus (SM). Interestingly, NO inhibition was shown to
significantly decrease shear force in LL muscle (p<0.01), with no change in shear force
of SM (p=.48). This data was corroborated when Cottrell et al. (2015) exposed sedentary
lambs to NO donors and inhibitors 190 minutes prior to slaughter. Cottrell et al. (2015)
exhibited that SM tended to increase in shear force at 1-day aging when administered NO
inhibitors compared to NO promoters (p=.06). While not significant (p=.58), NO
inhibitors lowered shear force in LL muscle across 1 and 3 days of aging compared to
NO promoters and control. While NO inhibitors did change the progression of pH decline

56
in SM muscle, the ultimate pH was equivalent to other treatments and did not alter meat
color characteristics across treatment or muscle type.
From these different studies it can be suggested that NO interaction may be more
muscle dependent than originally considered. In conjunction with shear force, proteolytic
activity can change as a result of RNS. Zhang et al. (2018) investigated changes in
protein proteolysis at 1-day postmortem across samples incubated with varying degrees
of either NO donor or inhibitor. Nitric oxide inhibitor treatments exhibited less total
protein nitrosylation and greater autolysis of calpains, desmin, troponin-T, myosin, and
protein solubility compared to NO donors treatments and control groups, indicating
greater proteolysis. There was a significant interaction between the treatment and aging
time, with the increasing amount of NO inhibitor resulted in greater protein degradation
over time compared to all other NO donor treatments. Through this data, it is conceivable
to state NO may play a critical role in meat quality through regulating calpain autolysis
and myofibrillar protein degradation during postmortem aging.
In addition to NO, isolation of H2O2 has been evaluated to influence meat
tenderness. It is speculated that the function of H2O2 may be due to its amount within the
muscle cell. Archile-Contreras and Purslow (2011) demonstrated how H2O2-mediated
oxidative stress can influence collagen turnover in different muscles. Given collagen is a
structural protein of various connective tissues throughout muscle, its presence can
impact on overall palatability of meat, including tenderness. Incubating myofibrillar
muscle cells from 1-hour postmortem longissimus dorsi and semitendinosus muscle, they
introduced samples to either 0.5 or 5$& of either H2O2 or synthetic pro-oxidant xanthine
oxidase. In particular, an inverse relationship between H2O2 concentration and matrix

57
metallopeptidase-2 (MMP-2) growth, with a significant increase in MMP-2 growth in
longissimus dorsi muscle compared to semitendinosus. MMP-2 is a matrix
metalloproteinase used to facilitate collagen turnover. Additionally, increased H2O2
concentration reduced total soluble collagen synthesis, with a noticeable loss of collagen
synthesis in semitendinosus muscle. As a result, they were able to relate different levels
of ROS production to the degree of collagen turnover across different muscles, with the
overall indication that ROS reduced collagen synthesis. As collagen is a contributor to
beef tenderness, this study reinforces the impact of ROS factors and their implications
towards meat quality and muscle structure postmortem. As Blunt et al. (2007) discovered,
hydrogen peroxide incubation with ischemia rat ventricular muscle is shown to reduce
desmin degradation. Instead, H2O2 is theorized to activate MAPK pathways for cell
sustainability. This is validated by showing decreased desmin degradation in conjunction
with incubating myocytes with H2O2 and a MAPK inhibitor. Furthermore, Blunt et al.
(2007) depicted increased expression of HSP27on decreased desmin degradation
regardless of calpain activity. This suggests that H2O2 may be a driving factor of HSP27
expression early postmortem, preventing calpain activity and reducing overall protein
degradation. Interestingly, the analysis presented H2O2 as a promoter of protein
degradation during increased calcium availability, as H2O2 combined with calcium had
numerically lowered desmin degradation. These amounts of degradation were statistically
significant when H2O2 and calcium were combined with MAPK inhibitors. This is telling,
as these conditions best represent cellular stability during apoptosis via MAPK inactivity,
oxidative stress factor H2O2, combined with increased cytosolic calcium as an indicator
of cellular death postmortem. Given the combination of these conditions, it is significant
58
when considering all these factors work in concert of one another during cellular death
cascades as a result of oxidative stress, and a significant source of calcium early
postmortem could provide the tools necessary to facilitate increased protein degradation.
Wang et al. (2018) investigated this idea: the effect of reactive oxygen species-mediated
oxidative stress on mitochondrial apoptosis factors in relation to tenderness in yak meat.
By injecting 20mM of either H2O2 or H2O2-inhibitors compared to a control group across
multiple aging periods, it was discovered that H2O2 increases total ROS, apoptosis
regulator proteins (Bax), lipid oxidation, and caspase activity compared to both the
control and inhibitor treatment. Concurrently, H2O2 decreases SOD, glutathione
peroxidase, mitochondrial stability via the mitochondrial permeable transition pore
opening, anti-apoptotic proteins (Bcl-2), and shear force in yak meat throughout a 7-day
aging period. This data supports the theory of oxidative stress and its influence on
mitochondrial stability, calcium release, initiating apoptotic mechanisms. These
observations further support the idea that oxidative stress has a role in the activation of
mitochondrial apoptosis and meat tenderness by influencing regulators necessary of the
apoptotic pathway. Furthermore, Wang et al. (1998) and Mohrhauser et al. (2013)
decipher that caspase, while an indicator of mitochondrial apoptosis, is not the primary
cysteine enzyme used to inhibit calpastatin activity. Rather, $-calpain is the primary
inhibitor of calpastatin in conjunction with caspase enzymes. It also reinforces that
calpains are the primary protease responsible for myofibrillar protein degradation during
postmortem aging of myofibrils.
As suggested, diet has been used as a possible indicator of changes in tenderness
in beef cattle research. Recent work at the University of Nebraska-Lincoln has identified
59
an improvement in tenderness when distillers grains are supplemented (Senaratne, 2012;
Chao, 2015; Chao et al., 2017; Kunze et al., 2017; Chao et al., 2018). Senarte (2012)
indicated that meat from cattle fed distillers grains, without supplement of vitamin E,
increased both tenderness and troponin-T degradation compared to steaks from cattle fed
a corn-based control diet. These studies suggest that muscle membrane integrity can be
altered and compromised as a result of feeding distillers grains, which could promote
greater calcium release early postmortem and increase calpain activity to promote
improved tenderness. Knowing this, Chao (2015) indicated an increase in PUFAs in the
sarcoplasmic reticulum which could lead to greater calcium leakage early postmortem,
upregulating increased enzymatic tenderization. Kunze et al. (2017) investigated further
into this occurrence and isolated mitochondria to understand the calcium flux mechanism
in relation to beef steak tenderness. This study illustrated that cattle fed distillers grains
deposited greater amounts of linoleic acid (18:2) in addition to total PUFA content in
mitochondria. Concurrently, cattle fed predominantly corn diets had mitochondria which
tended to retain more calcium compared to cattle finished on distillers grains (p = 0.08).
Therefore, it can be speculated that greater PUFA content in organelles can increase
susceptibility of oxidation reactions, altering calcium flux and resulting in increased
tenderness early postmortem. Chao et al. (2018) indicated that distillers grains may
impact sarcoplasmic reticulum composition as well, as feeding distillers grains increased
total PUFA in sarcoplasmic reticulum membrane. In turn, increased unsaturated fatty acid
content could lead to greater oxidative potential, facilitating calcium leakage to improve
tenderness early postmortem. These studies strengthened the concept of which oxidative
stress factors can alter biological composition, and prolong oxidative stress prior to death,
60
while not becoming detrimental to animal well-being. This could be a major facet to
enhance meat tenderization and produce more consistently tender meat products moving
forward.
Color
Color is the primary purchasing factor consumers use when evaluating meat
quality (Suman et al., 2014). The demand to maintain ideal fresh meat color is an ongoing
challenge, as industry implemented techniques to enhance product palatability can greatly
influence the stability of meat color during retail display. Of these techniques,
tenderization of meat during aging reduces prolonged color stability in meat, as the
substrates used in redox reactions are slowly depleted as aging progresses. Mitacek et al.
(2019) reported a decrease in color stability during increased aging periods (3 to 28 days
aging). Factors such as oxygen availability, mitochondrial activity, and color redox-
reaction substrates all contribute to color stability. Oxygen depletion increased as aging
continued, in addition to lower mitochondrial concentrations. Metabolomic analysis
determined a decrease in substrates necessary to run TCA cycle, supporting lack of
mitochondria activity. Interestingly, Mitacek et al. (2019) discovered greater NADH
reductase activity with increased aging, meaning an increase in demand of NADH redox
reactions are necessary to sustain oxymyoglobin pigment as meat ages. Concurrently,
total NADH concentration decreased as aging increased, and an increase in oxidative
potential as indicated by increased malonaldehyde as aging and days of retail display
interaction. These results indicate that there are insufficient substrates necessary to supply
the growing requirements of redox reactions to maintain color stability in aged meat,
61
allowing further oxidation of meat tissue using pro-oxidants as means for oxidation,
including factors related to oxidative stress. In addition to aging effects, muscle type has
been indicated as a contributing factor to color stability. Ke et al. (2017) discovered
greater rate of decline in a* (redness) values and increased metmyoglobin content in
psoas major (PM) muscle compared to longissimus lumborum (LL) of select graded beef
cattle. Psoas major muscle had a greater rate of decline of oxygen consumption,
mitochondrial activity, metmyoglobin reducing activity, and lipid oxidation compared to
LL. Interestingly, PM expressed greater cytochrome C across all retail display days
compared to LL, indicating an increased rate of cellular degradation. This data can
speculate that an increase in mitochondrial degradation caused by oxidation-mediated
apoptosis, as evidenced by cytochrome C expression, can influence meat color stability.
This relationship can be a contributing factor when meat is introduced to oxidative stress
or its precursors.
When examining oxidative stress inclusion antemortem, however, there is
minimal effect on meat color. Ponnampalam et al. (2005) discovered no differences
between color stability of longissimus thoracis lumborum (LTL) or semimembranosus
(SM) when administered nitric oxide donors and inhibitors into lambs twenty-four hours
prior to slaughter. Concurrently, Cottrell et al. (2008) found no differences in color
measurements on LTL or SM across 1- and 3-days aging when animals were induced
with a NO inhibitor prior to slaughter. A follow up study by Cottrell et al. (2015)
indicated that lambs administered NO donors 190 minutes prior to slaughter exhibited no
significant changes in color of LTL or SM muscles across 1 and 3 days of aging.
Concurrently, Niu et al. (2016) used a 3-day LPS challenge across two LPS
62
concentrations (3 mg/kg; 6 mg/kg) to evaluate meat quality of broilers breast and thigh
muscle against a saline control. Both muscles had a lower ultimate pH 24 hours
postmortem as LPS increased, however, the gross differences between control, 3, and 6
treatments were negligible. In both breast and thigh muscle, an increase (p < 0.05) in b*
values on the 3rd
day of retail display was found as LPS concentration increased, with
breast muscle L* values increasing (p < 0.05) as LPS increased on the 6th
day of retail
display. While these color values were significant, however, their gross differences across
treatments were negligible. It is speculated that a more prolonged oxidative stress
challenge may be more critical to understand its relationship to meat color.
Protein oxidation
As protein oxidation occurs, the modification of muscle tissue from carbonylation
is shown to affect muscle and color (Batifoulier et al., 2002; Santé-Lhoutellier et al.,
2008; Terevinto et al., 2010). Promeyrat et al. (2011) used this proteomics to build
correlations of carbonyl formation and protein oxidation in m. Longissimus lumborum of
pigs across different storage periods. Notably, they showed a negative correlation
between carbonyl content and activity of superoxide dismutase activity. This indicates
that by reducing the formation of free radicals, SOD acts as regulators of protein stability
against oxidation. There also was a negative correlation between myoglobin and
carbonyls at 4 days of storage. This contrasts with 1-day storage positively correlating the
two variables. This contrasting data infers myoglobin to act as both an antioxidant and
pro-oxidant, dependent on its current state. In the presence of hydrogen peroxide,
metmyoglobin is transformed into perferryl-myoglobin, which can be autoreduced by

63
oxidative radicals at low pH (~5.5) which falls in line with the ultimate pH (pHu) of fresh
meat (~5.4-5.8). Given the capacity for perferryl-myoglobin to reduce oxidative radicals,
in conjunction with prolonged postmortem storage, metmyoglobin formation could
promote activity of oxidant enzymes such as catalase and glutathione peroxidase.
It has been postulated increased carbonyl formation may be an indicator for meat
texture, as Carlin et al. (2006) discerned proteolytic activity of calpains to be hindered by
carbonylation, decreasing postmortem tenderness. Due to the rich concentration of
cysteine residues comprised within the calpain enzymes, oxidative inactivation of such
amino acids could hinder proteolytic function. If protein oxidation mechanisms occur
during aging, cross-linking of proteins could help explain the correlation between
carbonyl content and decreased tenderness in meat (Lund et al., 2007). Carbonylation has
been indicated as a result of different feed strategies. Santé-Lhoutellier et al. (2008)
demonstrated increased carbonyl formation in concentrate (corn-based) diets compared to
pasture-fed in lamb during prolonged meat storage. Carbonyl content could not explain
protein digestibility of myofibrillar proteins. Conversely, Batifoulier et al. (2002)
demonstrated diet inclusion of vitamin E to retard the loss of free thiols in microsomal
organelles in turkey breast muscle. In addition, turkeys fed vitamin E exhibited less
malonaldehyde content across days of storage. Building off this data, Terevinto et al.
(2010) evaluated the oxidative stability and endogenous enzyme response in three
muscles of rhea, a species closely related to ostrich. They discovered muscle exhibiting
higher malonaldehyde content also had greater carbonyl content across muscles,
demonstrating that there may be inherent differences between muscles and their capacity
to generate carbonyls. Given the differences in color stability of different muscle
64
combined with the interrelationship between color and lipid oxidation, it is plausible that
different muscle are more susceptible to oxidation (Faustman et al., 2010).
Lipid oxidation
Given the link between oxidation of fatty acids and oxidative stress, evaluation of
lipid oxidation is critical when examining meat quality. As shown by Gatellier et al.,
(2004), Zhang et al. (2011), Chao et al. (2018), and Zhao et al. (2018), diet can impact
lipid and total oxidation, as an increase in unsaturated fatty acids and oxidized oils can
increase the oxidative potential postmortem. Interestingly, Zhao et al. (2018) evaluated
the generation of ROS in conjunction with lipid oxidation when lambs were
supplemented grape pomace. They noted a decrease (P < 0.05) in total ROS as inclusion
of antioxidants increased. Concurrently, there was a significant decrease (P < 0.05) in
malonaldehyde content as antioxidant content increased. In addition, evaluating the onset
of oxidative stress was used without dietary treatments. Niu et al. (2016) evaluated LPS-
mediated oxidative stress on oxidative stability of broilers. Malonaldehyde content did
increase (p < 0.05), as well as a decrease in total antioxidant capacity, in plasma as LPS
concentration increased. Furthermore, malonaldehyde content increased (p < 0.001) as
LPS increased across all days of retail display. Additionally, Pradhan et al. (2000) used
endogenous catalase as a measure of lipid oxidation in muscle tissue. They discovered
that increased catalase inclusion in ground beef semitendinosus decreased lipid oxidation
across all storage periods, signifying a decrease in oxidative potential postmortem due to
the increase in endogenous enzymes.

65
Evaluation of oxidative stress markers
In order to better understand oxidative stress and its link to muscle cell
interactions and meat quality, there is an ever-growing demand to understand its behavior
from the onset of ROS generation, its relationship with physiological response
mechanisms, and the activity of prolonged oxidative stress on muscle characteristics both
in vivo and postmortem. However, the evaluation of oxidative stress factors, and their
intermediate constituents, is a challenge. Due to the complexity of oxidative stress and
the short half-life of many constituents, strategies used to validate its effects on meat
quality have their constraints. In the literature, there are a multitude of oxidative stress
products produced in muscle tissue which can be used as markers indicating oxidative
stress has occurred, and relative quantities of such compounds are being linked to meat
quality attributes (i.e., carbonyls) (Lawson et al., 1999; Dalle-Donne et al., 2003;
Ponnampalam et al., 2017). However, the obvious constraint of this approach is the lack
of knowledge on the degree of oxidative stress occurring in vivo and the regulation of
different pathways oxidative stress activates on a per organism basis, as all can have
variable levels of physiological response mechanisms. In the last two decades, there is
growing interest for in vivo evaluation of oxidative stress factors to monitor their
quantification and sustained activity during stages of oxidative stress. This method of
analysis is even more complicated, due to the inherent behavior of ROS and their average
half-lives (~2-5 seconds) (Bekhit et al., 2013). Additionally, there is still developing
technology sensitive to evaluate real-time analysis of ROS activity. In order to better
understand the totality of oxidative stress, there is value to use both measures to create a
more rounded picture of oxidative stress on muscle and meat quality.
66
In vivo: single wall nanotube hydrogels
Recent milestones in biotechnology have enabled the development of biosensors
used to evaluate real-time generation of molecular ions. In particular, the use of single-
walled carbon nanotubes (SWNTs) as an active biosensor has sparked interest in medical
applications for its innovative methodology and growing accuracy to detect molecules in
living organisms, such as glucose detection (Strano et al., 2004). In short, SWNT are a
synthetically manufactured graphene cylinders made of a 1-D carbon atoms rolled into a
cylindrical shape. Commercially, the most common SWNT used in biotechnology is the
CoMoCAT (6,5) ™, as the binding of the carbon molecules acts as a very stable
semiconductor. Their high conductivity facilitates stable emission of near-infrared (NIR)
light to transmit through SWNT with no noticeable photo-intensity threshold, this
facilitates prolonged imaging of SWNT in organic tissue and cells without degradation
when introduced into organisms (J. Zhang et al., 2011). As a result, the sustainability of
SWNT under intense electromagnetic radiation makes them a useful tool in molecular
detection using real-time evaluation. During manufacturing, the composition of the
SWNT is critical to its end function, especially considering both the length and diameter
of the SWNT can influence the sensitivity and compatibility to bind with unique DNA
sequences (J. Zhang et al., 2011). Iverson et al. (2015) illustrated wrapping SWNT with a
15-repitition of adenine-thymine complex [(AT)15] as a sensor for nitric oxide.
Concurrently, the development of (GT)15 DNA sequences have been indicated as
reliable sensors for H2O2 detection (Kim et al., 2011). However, the (GT)15 sequence is
sensitive to both H2O2 and NO, requiring the use of both DNA-wrappings to detect H2O2
quantity via the transitive property (Iverson et al., 2017). In addition to SWNT
67
manufacture, the specificity and wrapping of DNA is theorized as a critical component to
the sensitivity of detecting molecules. Unfortunately, techniques to DNA wrapping are
still undefined, as this field of research is still in its early stages (Iverson et al., 2013).
When administered in a biological system (i.e., the blood/tissue), there is speculation that
SWNT can degrade from itself and independently traverse throughout cells. In order to
contain SWNT within a localized system, mixed alginate gels have been used to contain
SWNT upon administration into a biological system (Iverson et al., 2013). The binding of
SWNT to the gels allows additional support for SWNT to stay bunched together,
facilitating a better composition for SWNT upon reading fluorescence (Iverson et al.,
2015; Iverson et al., 2017). When evaluating single-molecule components, excitation of
DNA-wrapped SWNT occurs during exposure to a NIR stimulus laser, which elicits a
fluorescent intensity of SWNT. This intensity can be used to dictate the total quenching
of SWNT in the presence of the targeted molecules, with less florescence equating to
greater quenching of SWNT, indicating a greater concentration of the targeted molecule
present (Strano et al., 2004). Concurrently, consecutive readings of SWNT can be used to
evaluate both the rate of quenching from the time of exposure to a stimuli, as well as the
rate of recovery, the time in which the SWNT regains its fluorescence (Jin et al., 2010;
Iverson et al., 2017). While still in its infancy, the field of carbon nanotubes is growing
with exponential potential on scientific applications. If administered and measured
properly, SWNT could be used as an innovative technique to evaluate the onset of
oxidative stress and rate of physiological response for in vivo livestock analysis.
68
Ex vivo: omic profiles
When examining the development of muscle tissue, there are countless conditions
which govern the growth, functionality, and stability of muscle cells, all of which
contribute to the composition of meat quality after harvest. These variables are strongly
influenced through both predisposed genetic development in addition to extrinsic
conditions such as species, diet, pre- and post-slaughter handling, processing, and
formulation of products(Capozzi et al., 2017). These factors trigger changes in how the
organism, and its subsequent tissues, acts and reacts to certain stimuli. These factors can
be used to distinguish differences in muscle cells through omics analysis.
A novel, comprehensive approach, omics are the analysis of genomic and
molecular profiles of an organism (D’Alessandro and Zolla, 2013). Using this tool,
examination of different components of muscle growth and function in relation to
oxidative stress factors are possible. In meat science, transcriptomics has been used to
relate molecular mechanisms underlying the formation of meat quality traits with gene
expression (Guo and Dalrymple, 2017). In particular, the relationship of upregulating or
downregulating specific pathways related to muscle cell proliferation, growth, organelle
development, cell modification, enzymatic activation, and cell immunity are of interest.
Bongiorni et al. (2016) and Arora et al. (2019) examined breed variation on the impact of
muscle development and tenderization in cattle and sheep, respectively. These scientists
used pre-existing data (tenderness, cell proliferation) as benchmarks to assess genomic
differences between treatments (breed). Guo and Dalrymple (2017) utilized
transcriptomics to analyze biological mechanisms which regulate lipogenesis, fatty acid
deposition, and tenderness characteristics related to intramuscular fat in livestock species.
69
Conversely, transcriptomics can be used to asses genomic conditions in response to
specific stimuli, such as oxidative stress. Kim et al. (2018) used oxidative stress as a
treatment to assess the expression of genes in specific tissues of mice. As expected, an
overall upregulation of ROS enzymes (catalase, superoxide dismutase, glutathione
peroxidase) were found. Interestingly, the degree of upregulated genes was tissue-
dependent, as metabolic organs (liver and kidney) were greater in total expression
compared to muscle tissue. This investigation revealed gene expression can be dependent
on the tissue of interest, and that each tissue may respond to a treatment with varying
magnitudes of gene expression. Transcriptomics acts as an outline, as the complex
expression of different biological pathways elucidates how genetic mechanisms interact
with one another to reach a final function.
Proteomics, the study of biological proteins, can assess the composition of muscle
proteins under specialized conditions. This is appropriate, as muscle proteins can be used
in association with different meat quality attributes, such as calpains for enzymatic
tenderization. This association is indicative of the conditions which developed the tissue
in its current state (i.e., genetics, environment). Hollung et al. (2007) identified individual
proteins related to mechanisms responsible in postmortem tenderness, such as
myofibrillar proteins and the calpain system, in addition to proteomes related to muscle
color (sarcoplasmic) and antemortem stress (heat shock proteins and glycolytic enzymes).
Building off of this research, Polati et al. (2012) distinguished proteomic changes as a
result of proteolytic aging. As aging increased, the expression rate of troponin-T, �-
actinin, and myosin light chains all increased, supporting the role of proteolytic
breakdown of essential proteins to meat tenderness. Concurrently, a mixed expression of
70
heat shock proteins (HSP) and �-crystallin were shown to increase with prolonged aging.
The expression of these proteins can be used as markers for meat tenderness, with aging
as a key indicator in the change of protein expression and functionality postmortem. In
addition, Picard et al. (2014) demonstrated genetic variation has an impact on meat
quality, as differing cattle breeds show varying expression of metabolic (lactate
dehydrogenase) and contractile (myosin, actin) proteins in relation to different muscles
within a breed. This suggests that composition of muscle fibers, in addition to metabolic
properties of muscle cell, can be dependent on genetic predisposition (Picard et al., 2014;
De Souza Rodrigues et al., 2017). When referring to meat tenderness, the common
comparison between Bos indicus and Bos taurus cattle is utilized, as both species have
distinctly different meat quality attributes. Proteomic evaluation reveals Bos indicus
cattle presented higher expression of myosin and actin proteins, enhancing contraction
force in skeletal muscle, in addition to increased expression of heat shock proteins 5
(HSP5) located within the sarcoplasmic reticulum. Concomitantly, Bos indicus cattle held
a greater proportion of fast-twitch glycolytic fibers, compared to the oxidative slow-
twitch fibers of Bos taurus cattle. Conversely, Bos taurus exhibited higher
phosphorylation in troponin-T and HSP9, both of which have been linked to increased $-
calpain activity (De Souza Rodrigues et al., 2017). Couple these proteins with greater
shear force (less tender) values in Bos indicus cattle, and it can be illustrated how a
genetic bias can influence inherent quality traits in fresh meat products.
Metabolomics is used for the quantification of cellular molecules taking part as
intermediates or end products of metabolic reactions (Capozzi et al., 2017). The
identification of metabolic substrates can be used as a reference in discerning subtle

71
differences in a given set of conditions. Straadt et al. (2014) used this method to evaluate
sensory attributes in thawed pork chops of crossbred pigs related to the composition of
amino acids extracted during drip loss. While the flavor of meat is commonly associated
with cooked meat via the maillard reaction, the composition of non-volatile compounds
in raw meat such as amino acids, can elicit the unique flavor profile (Mottram, 1998).
These amino acids, while readily available in post-rigor meat, have been shown to
increase in concentration during aging, and impact a greater depth of flavor as a result
(Nishimura et al., 1988). Additionally, Kim et al. (2016) used dry aging as a model to
enhance amino acid concentration of glutamate, tryptophan, and isoleucine, which are
associated with the umami, bitter, and maillard flavor profiles, respectively. The
development of dry aging has been suggested to elicit greater complexity of flavor being
present compared to wet aged beef, which builds its niche market for this unique flavor
profile. However, further investigation into amino acid composition is needed to interpret
its impact of meat flavor. Chen and Ho (2002) have identified offsetting flavor attributes
of amino acids. Carnosine, which has been linked to “roasted” and “nutty” notes in
cooked meat, has also been implicated to reduce compound 2-methyl-3-furanthiol, a
cysteine based chemical responsible for the “meaty” aroma consumer identify in cooked
meat products. A greater demand for metabolomic analysis is necessary to tackle the
current challenges to relate specific amino acids to flavor profiles of aged meat,
increasing the viable application of this methodology.
72
Isoprostanes
In addition to omics measurements, the evaluation of other downstream end
products specific to oxidative stress have been suggested. While oxidative stress factors
can induce oxidation of both lipids (malonaldehyde) and proteins (carbonyls/thiols), the
isolation of F2-isoprostanes has been recognized as a key indicator for oxidative stress
(Basu, 1998; Lawson et al., 1999; Montuschi et al., 2004; Nikolaidis et al., 2011).
Compared to other oxidation products, generation of F2-isoprostanes cannot be
accomplished via photo-oxidation or auto-oxidation (Lawson et al., 1999). Rather, an
integrated mechanism is required to produce isoprostanes, which is solely contingent on
ROS-mediated oxidation (Lawson et al., 1999; Milne et al., 2011). Currently, F2-
isoprostanes are the family of prostaglandin-like compounds formed by non-enzymatic,
free-radical oxidation of arachidonic acid (20:4) with reactive oxygen species. During
oxidation, the abstraction of hydrogens due to ROS result in delocalized pentadienyl
carbon-centered radicals (Lawson et al., 1999; Montuschi et al., 2004; Nikolaidis et al.,
2011). Subsequently, peroxyl radicals formed by oxygen molecule binding undergo
cyclization, the formation of carbon rings, using additional oxygen molecules. These
molecules then attach hydroxyl radical groups (.OH) as a final binding reaction, resulting
in isoprostanes formation. Within the F2-isoprostane group, different isoforms are
produced based on which carbon the allylic hydroxyl group binds (Figure 6) (Nikolaidis
et al., 2011). Generated during lipid peroxidation, F2-isoprostanes are produced as
esterified fatty acid form in phospholipids membranes, and then released using
phospholipase action (Montuschi et al., 2004). Stafforini et al. (2006) and Milne et al.
(2011) establish phospholipase action as digestion enzymes, facilitating the breakdown of

73
phospholipid arachidonic acid. Upon release, F2-isoprostanes can follow oxidized fatty
acids into the blood, or transfer out from the kidneys and into urine. Compared to other
oxidative products, F2-isoprostanes very stable compounds that are detectable in all
normal biological fluids and tissues. When evaluating F2-isoprostanes, different
collection methods can discern variation in detected levels of F2-isoprostanes. Urine
sampling can detect unesterified (free) fatty acids which can transport into the urine,
which is easily collected. Both blood plasma and skeletal muscle still contain esterified
F2-isoprostanes, which suggest the quantity of F2-isoprostanes formed to be dependent on
the quantity of lipids present, especially arachidonic acid (Nikolaidis et al., 2011).
However, Basu (1998) noted blood plasma to quickly metabolize F2-isoprostanes, with a
half-life no longer than 20 minutes, suggesting blood plasma to have greater variability of
F2-isoprostanes when mishandled. However, immediate analysis of blood plasma F2-
isoprostanes provides an index of total endogenous production in vivo. Levels of
esterified F2-isoprostanes in muscle can be used to localize oxidation in an area of interest
(skeletal muscle). This is common to evaluate for muscle biopsies or sampling in anoxic
muscle tissue, as the lack of blood prevent F2-isoprostanes to be transferred and
metabolized in blood.

74
Figure 6: Chemical structure of arachidonic acid and the four regional isomers of isoprostanes (Nikolaidis
et al., 2011).
After collecting a sample, there are a multitude of methods used to detect
isoprostane quantity. Lawson et al. (1999) Roberts and Morrow (2000) illustrate the use
of mass spectrometry (MS), as this was the original and ideal methodology used to
evaluate isoprostanes. Combine this with liquid/gas chromatography (LC/GC), and F2-
isoprostanes detection is highly specific and sensitive. However, this is a very expensive
process which deters its use in contemporary evaluation of isoprostanes. Currently, the
generation of enzyme-linked immunosorbent assays (ELISA) are frequently used as
modes for isoprostane detection. Commerical ELISA kits can detect individual isoforms
of F2-isoprostanes. While ELISA kits are more cost-effective and hold respectable
sensitivity to isoprostane detection compared to GC-MS/LC-MS (75-90% and >96%,
respectively), the sensitivity of ELISA kits require high quality samples, which have gone
through a purification method to eliminate any biological contaminants which could
interfere with the immunoassays.
Given the relationship between isoprostane generation with oxidative stress activity,
detection of this molecule is regarded as the standard for evaluating oxidative stress.
However, there is very little literature relating this oxidative stress to meat quality using
75
this molecule as a baseline measurement. Karamouzis et al. (2004) used microdialysis
probes to evaluate the generation of 8-isoprostane PGF2�, a predominant isoform of F2-
isoprostanes, in the event of rest compared to prolonged exercise. They found that
exercise increased (P < 0.05) isoprostane content nearly three-fold. This makes sense, as
an increase in exercise promotes an upregulation of ROS generation (Li et al., 1999).
Given the generation of oxidative stress on muscle tissue, Ponnampalam et al. (2017)
theorized the change in isoprostanes as an in vivo indicator of meat quality deterioration
postmortem (in vitro). Using diet as a treatment of metabolic energy, lambs were fed for
8 weeks on diets consisting of varying levels of metabolizable energy in feedlot, ryegrass,
and lucerne hay (12.9, 10,4, 8.6 MJ/kg DM, respectively). Using blood samples, they
detected an increase in plasma of 8-isoprostane PGF2� levels, with the feedlot diet
exhibiting the greatest isoprostane content at 4 (P < 0.01) and 8 (P = 0.05) weeks of
feeding. This is due to both the increase in energy content of diets, but also the amount of
�-tocopherol increased in roughage-based diets (ryegrass, lucerne). Positive correlations
between 8-isoprostane PGF2� levels and lipid oxidation (malonaldehyde content) have
been found. Interestingly, positive correlations between 8-isoprostane PGF2� levels and
both arachidonic (20:4) and linolenic (18:2n-6) acid were significant (P = 0.005; P <
0.001, respectively). This supports Milne et al. (2011) on how F2-isoprostanes can
potentially be generated from other PUFAs [eicosapentaenoic acid (20:5n-3), adrenic
acid (22:4n-6), and docosahexaenoic acid (22:6n-3)] due to the orientation of their double
bonds, but the knowledge on these fatty acids to generate F2-isoprostanes is not fully
understood. As a result, the generation of F2-isoprostanes is an excellent marker for in
vivo oxidative damage as a result of oxidative stress.

76
Other metabolic indicators
Physiological stress triggers a vast number of homeostatic mechanisms, producing
signaling molecules and hormones to activate suppression of stress-inducing factors. In
turn, a vast majority of these signaling factors are generated independent to a particular
stress-induced event, allowing their evaluation as an overarching indicator of
physiological stress. Cortisol, synthesized from cholesterol, acts to suppress stress by
signaling other homeostatic pathways by binding to cortisol receptors, assisting in
regulation of blood pressure, energy metabolism, and immune system response (Lee et
al., 2015). Under conditions of oxidative damage, the upregulation of cortisol is an
appropriate response. Hoogenboom et al. (2012) identified an influx in cortisol
concentration in conjunction with testosterone release during spawning of brown trout
(Salmo trutta, L.). This is appropriate, as reproduction is recognized as a benchmark for
increased stress during an animal’s life span. Under livestock management conditions,
these benchmarks would include events such as birth, weaning, transportation, feeding
strategies, and handling. All of these factors can be implicated as points of cortisol
growth, and potential benchmarks for oxidative stress to occur.
In addition, the production of additional indicators is used to assess biological
stress. Temperature is an ubiquitous measure of biological stress, as temperature increase
is a strong correlation to acute illness or inflammation. Concurrently, increased
environmental temperature can increase metabolic stress. Srikandakumar et al. (2003)
indicated that increased temperature can stimulate an increase in rectal temperature,
respiration rate, and alters blood chemistry in mature sheep. Interestingly, different
breeds of sheep within the study has a lesser degree of overall stress (temperature, blood
77
chemistry) in response to increased temperatures, indicating that genetics may influence
the capacity for animals to suppress biological stressors. As a whole, stress response
studies can use baseline measurements as markers of biological stress ensuing in
livestock.
Link between downstream effects of oxidative stress and meat quality
Components related to cellular respiration are critical to the development of ATP,
organelle function for muscle contraction, and downstream effects towards postmortem
tenderization of muscle (Kemp et al., 2010). Concurrently, the action of cellular
respiration promotes the generation of ROS/RNS properties, and production of these
compounds accumulate with physiological stress factors such as chronic inflammation or
illness, even when these factors are not a recognizable detriment to the organism in vivo.
If ROS/RNS generation overwhelms biological homeostatic response systems, oxidative
stress begins, and is capable to manipulate a multitude of cellular proteins, lipid
peroxidation, and regulation of nucleic information (Powers et al., 2011). As a result,
organelles and their constituents related to muscle contraction and tenderization are
distorted, with increased membrane leakage and overall organelle dysfunction. This
cascade of events will alter both the composition and function of organelles, inciting
cellular apoptotic pathways and development of new protein and lipid turnover. If
oxidative stress occurs during death, especially due to chronic oxidative stress, the
current state of cellular dysfunction may expose molecular ions readily available in the
cytosol, as well as nucleic expression of postmortem mechanisms (Kemp and Parr, 2012).

78
Tenderness is one of the most important factors for consumer palatability and
repurchasing of meat (Koohmaraie and Geesink, 2006; Kemp et al., 2010). However,
subtle variations in tenderness within muscles have been shown to greatly influence
consumer likeness to different retail products (Martinez et al., 2017). One method to
mitigate inconsistent tenderness is producing high marbled cattle, as an increase in
intramuscular fat is shown to increase overall tenderness and palatability scores in beef
strip loins (Platter et al., 2003). However, these tenderness differences decrease with
lower marbled meat, providing greater challenges to replicate consistently tender meat.
As a result, a plethora of research has been conducted to moderate this concern. The
University of Nebraska-Lincoln has investigated the impact of different feedstuffs on
meat quality with staggering results. Chao (2015), Hart et al. (2019) and Ribeiro et al.
(2019) all exhibited inclusions of distillers grains as a model for increased tenderness
early postmortem, compared to standards corn rations. This may be a result of distillers
grain inclusions impart greater deposition of unsaturated fatty acids within muscle
organelles, increasing susceptibility to oxidative mechanisms both ante- and postmortem
(Chao et al., 2018). These oxidative mechanisms can alter membrane integrity of
organelles, promoting rapid available intracellular molecules for tenderization (Chao et
al., 2018).
Therefore, it is conceivable that prolonged oxidative stress prior to death can
signal the interaction of oxidative/apoptotic pathways in vivo and increase enzymatic
activity early postmortem. It is not fully understood how the degree of oxidative stress
may impact factors related to in vivo myocytes, nor is there a definite understanding on
its role with muscle tenderization and color stability in postmortem muscle. As a result,
79
this study identifies and evaluates mechanisms related to skeletal muscle, using known
levels of an oxidative stress promoter prior to harvest on meat quality attributes.
Conclusion
This literature review supports the hypothesis that oxidative stress can manipulate
organelle function, promoting ROS-mediated disruption of membrane stability in
mitochondria and sarcoplasmic reticulum, upregulating apoptotic pathways necessary
during anoxia of postmortem meat, facilitating greater proteolytic potential and muscle
tenderization. The exploration of this hypothesis will allow us to use LPS as a mediator
of oxidative stress, as in vivo oxidative stress is a more viable model system for
postmortem tenderization of meat.
Researching this hypothesis will provide valuable insight to the meat industry. If
there is a link between proteolytic degradation and the manipulation of organelle
confirmation prior to slaughter which promotes tenderness, it could be possible to use
oxidative stress as an indicator to enhance meat tenderness, especially when investigating
management strategies which influence oxidative stress, such as diet, genetic selection,
and environmental control. Additionally, in dealing with muscle cells, there is great
potential to understand the biochemical behavior of oxidative stress, in particular how
varying degrees of oxidative stress can impact ROS/RNS interrelationships with
antioxidant response mechanisms and organelle function. The parabolic nature of
oxidative stress is yet to be understood, and there is much knowledge to gain in this
biochemical phenomenon.
80
MATERIALS AND METHODS
Manuscript – Oxidative Stress as a measure for Postmortem Meat Quality
Lambs
A total of 29 cross-bred wethers (initial BW = 29 ± 2.68 kg) were group housed
(University of Nebraska Life Sciences Annex in Lincoln, NE) for 42 days on a standard
finishing ration (Appendix I) developed at Eastern Nebraska Research and Extension
Center (ENREC; Mead, NE). After acclimation period, lambs were blocked and stratified
by BW prior to being randomly assigned to a treatment. Lambs were individually fed
according to BW to maintain a 0.34kg/day weight gain for the remainder of the in vivo
analysis.
Lipopolysaccharide treatments
Lambs were randomly assigned a 2 mL intravenous injection of either saline
control (Control), 50ng LPS/kg BW (LPS50) or 100ng LPS/kg BW (LPS100) treatment
group. Concentrations of lipopolysaccharide were determined based off of previous
research performed at University of Nebraska-Lincoln using sheep as a model for LPS
injections. Three injections would be administered across a 12-day immune challenge,
with a subsequent injection occurring after every 72 h period. Injection times were
partitioned across the 12-day timeline in two groups with 7-8 lambs being administered
in each group. Two immune challenge cycles were completed with lambs blocked by BW
to determine which cycle they would participate, allowing all animals to reach consistent
final BW prior to harvest. All methods of live animal handling were approved by UNL
Institutional Animal Care and Use Committee (IACUC).
81
Rectal temperatures and respiration rates were taken at time 0, 1, 2, 4, 8, 12, 24,
48, and 72 h post-injection time (0600 h). Lambs were secured on a trim stand prior to
taking readings. Rectal temperature was completed using a Vicks® Thermometer
(ComfortFlex®, V966US, Marlborough, MA) after being inserted 2.54cm from the tip of
the thermometer into the rectum of the lamb and held for 10 s. Respiration rate was taken
by evaluating the number of exhales taken in a 15 s span. Respiration rates were then
calculated up to total breaths per min.
Sample collection
Upon completion of the final 72 h cycle, lambs were held 48 h prior to slaughter,
then transported to the Loeffel Meat Lab (Lincoln, NE). Within 30 min of
exsanguination, an 80 g pre-rigor sample of posterior Longissimus lumborum from CON
and HIGH treatment groups were extracted using a scalpel blade (Feather Safety Razor
Co. LTD., No. 11 2976, Osaka, Japan). Pre-rigor sample was denuded of exterior fat and
connective tissue, then placed in a 2 mL cryotube (Cryogenic Vial CryoClear 3012 Globe
Scientific, Mahwah, N.J.) and frozen for future analysis (-80°C). The carcasses were
tagged with a university number that corresponded to the animal and lab ID, then chilled
for 24 h.
Fabrication
After 24 h postmortem, sample primals were split between the 8th
and 9th
rib
extending to the last lumber vertebrae. Primals were split down the spine using a band-
saw (Biro MFG. Co., Model 3334, Marblehead, OH), and each side was randomly
82
assigned to one of two aging periods (1 or 14 d). Longissimus muscle was deboned and
removed of excess subcutaneous fat. Four 2.54 cm chops were fabricated adjacent to one
another at each aging period (one to measure lipid and protein oxidation for 0 d of RD,
and three to measure Warner-Bratzler shear force for 0 d retail display). One 2.54 cm
chop at each aging period was trimmed of all subcutaneous fat, and utilized to measure
visual discoloration, objective color, lipid oxidation, and protein oxidation for 7 d of RD.
One 2.54 cm chop at each aging period was cut and utilized for analysis of pH and
proximate composition. A 5.08 cm chop was cut the at the most posterior point of the
primal and utilized for subsequent laboratory analysis. An additional 2.54 cm chop was
cut at the most anterior point of the primal and was used as extra laboratory analysis
sample. At d 1, chops for laboratory analysis, pH and proximate composition, extra
laboratory analysis were vacuum packaged (MULTIVAC 500, Multivac, Inc., Kansas
City, MO) in Prime Source Vacuum pouches (3 mil STD barrier, Prime Sources, St.
Louis, MO). Steaks for laboratory analysis, pH and proximate composition were frozen
for further analysis (-80°C). The remaining halved portion of loins lined with Boneguard
(Boneguard Traditional Perforated, JVR Industries, Lancaster, NY) and aged (2°C) under
dark storage. All chops were separated from the loin starting from the anterior end of the
loin. The same fabrication map (Appendix II) was used for all aging periods. At all aging
periods, samples for color, lipid, and protein oxidation analysis were placed on foam
trays (21.6 x 15.9 x 2.1 cm, Styro-Tech, Denver, CO) and overwrapped with an oxygen
permeable film (Prime Source PSM 18 #75003815, Bunzl Processors Division, North
Kansas City, MO) Trays were placed under simulated RD conditions for 7 d (3°C under
white fluorescence lighting at 1000 to 1800 lux) and randomly rotated daily. All frozen

83
steaks utilized for laboratory analysis and lipid/ protein oxidation were tempered enough
to finely dice, freeze in liquid nitrogen and then powdered in a metal cup blender (Model
51BL32, Waring Commercial, Torrington, CT) on May 13/14 and July 26, 2019 and held
for 11d and 23d respectively, at -80°C until further analysis.
RNA transcriptomics
Total RNA extraction from muscle was completed using RNeasy Fibrous Tissue
Mini Kit (QIAGEN, #74704, Hilden, Germany) and RNase-Free DNase Set (QIAGEN,
#79254, Hilden, Germany). Completely sterilize work station with 100% ethanol solution
prior to start of RNA extraction. 30 mg of pre-rigor muscle was diced and added to a 1.5
mL conical tube, added with 300µL of RLT solution, and vortexed until broken up.
Homogenize with hand-held pestle for 30 s. Add 10µL proteinase K solution and 590µL
RNase-free water and mix thoroughly by pipetting. Incubate at 55°C for 10 min then
centrifuge for 3 min at 10,000 x g. Transfer supernatant (approximately 900 µL) into a
new 2 mL microcentrifuge (2mL safe-lock tube; 02236352, Eppendorf AG, Hamburg,
Germany), avoiding transfer of any pellet. Add 450 µL of 100% ethanol to the cleared
lysate. Mix well by pipetting up and down. Transfer 700 µL of the sample to a RNeasy
Mini spin column placed in a 2 mL collection tube. Centrifuge for 15 s at 8,000 x g,
discard the flow-through. Add 350 µL Buffer RW1 to the RNeasy spin column.
Centrifuge for 15 s at 8,000 x g to wash the membrane, discard the flow-through. Add
10µL DNase I stock solution to 70 µL Buffer RDD. Mix by gently inverting the tube, and
centrifuge briefly to collect residual liquid from the sides of the tube. Add the DNase I
incubation mix (80 µL) directly to the RNeasy spin column membrane, and place on the

84
benchtop for 15 min. Add 350 µL Buffer RW1 to the RNeasy spin column. Centrifuge
for 15 s at 8,000 x g. Discard the flow-through. Add 500 µL Buffer RPE to the RNeasy
spin column. Centrifuge for 15 s at 8,000 x g. Discard the flow-through. Add 500 µL
Buffer RPE to the RNeasy spin column. Centrifuge for 2 min at 8,000 x g. Place the
RNeasy spin column in a new 2 mL collection tube, and discard the old collection tube
with the flow-through. Centrifuge at 14,000 x g for 1 min. Place the RNeasy spin column
in a new 1.5 mL collection tube. Add 30-50 µL RNase-free water directly to the RNeasy
spin column membrane. To elute the RNA, centrifuge for 1 min at 8,000 x g. For RNA
amplification, transfer samples to University of Nebraska-Medical Center (Next
Generation Sequencing, Genome Core Facility, Omaha, NE, USA).
Warner-Bratzler shear force
Three chops (2.54 cm) were measured for tenderness via Warner-Bratzler Shear
Force (WBSF) per sample. Internal temperature and weight were measured prior to
cooking using a quick disconnect T-type thermocouple (TMQSS-062U-6, OMEGA
Engineering, Inc., Stamford, CT) and a handheld thermometer (OMEGA 450-ATT,
OMEGA Engineering, Inc., Stamford, CT) in geometric center of steaks. All chops were
cooked to an internal temperature of 35°C and turned over until they reached a target
temperature of 70°C on an electric indoor grill (Hamilton Beach-31605A, Hamilton
Beach Brands, Glen Allen, VA). After cooking, final weights were recorded. The steak
was then bagged (PB-90-C, .85 mil., 6x3x15in.) and stored overnight at 2°C. The
following day, 2 (1.27 cm diameter) cores per chop were removed with a drill press
parallel to muscle fibers and sheared using a Food Texture Analyzer (TMS-Pro, Food
85
Technology Corp., Sterling, VA.) with a triangular Warner-Bratzler blade. The mean of 6
cores was calculated for statistical analysis.
Objective color and subjective color:
Objective color measurements were taken once daily for 7 days during simulated
retail display at all aging time points. Chops (2.54 cm) were placed on Styrofoam trays
(21.6 x 15.9 x 2.1 cm, Styro-Tech, Denver, CO), overwrapped with oxygen permeable
film (Prime Source PSM 18 #75003815, Bunzl Processors Division, North Kansas City,
MO), and placed under retail display conditions (3°C under white fluorescence lightening
at 1,000 to 1,800 lux). Commission international de l’éclairage (CIE) L* a* b* values
were obtained using a Minolta CR-400 colorimeter (Minolta, Osaka, Japan) set with a
D65 illuminant, 2°C, with an 8 mm diameter measurement area. Three measurements
were made per chop and the mean was calculated for statistical analysis. The colorimeter
was calibrated daily with a white ceramic tile (Calibration Plate, Serial No. 14933058,
Konica Minolta, Japan). Lightness (L*) is measured with a range from 0 (black) to 100
(white), a* measures redness with the range between red (positive) and green (negative),
and b* is a measure of yellowness from yellow (positive) to blue (negative). Color
readings were recorded at the same time each day.
Visual discoloration was assessed daily during the 7 d of RD utilizing 5 trained
panelists comprised of graduate students from the University of Nebraska. Panelists were
trained using a standardized discoloration guide (Appendix VI). Discoloration % was
approximated from 0% to 100% with 0% meaning no discoloration present and 100%

86
being a fully discolored chop. Chops were randomly rotated daily to minimize location
effects.
Proximate composition
Moisture, fat, and ash (%) of raw meat samples were determine. Samples were
measured in triplicate in Whatman #2 paper filter paper and fat was extracted with
anhydrous ether. After identifying and recording weights of the folded filter papers with
corresponding paper clips to hold packets closed, these were tared out and powdered
meat samples (2 g) were weighed onto the filter paper and then closed with the paper
clip. Samples were then placed in a Soxhlet tubes and the boiling flasks were filled with
400 mL of ether. Once in place, water was opened to ender the condensers and each
individual burner was turned on. After 48 h, burners were turned off and allowed to cool
completely. Samples were air-dried under a fume hood for 2 h, then placed in a drying
oven (105°C) overnight prior to recording final dry weight. In order to calculate final fat
percentage, the final equation was used: % Fat = ((Pre-extraction wet weight with filter
paper and paper clip – Post-extraction dry sample weight)/sample weight) * 100) - %
Moisture. Moisture and ash (%) were calculated with a LECO Thermogravimetric
Analyzer in duplicate (Model 604-100-400, LECO Corporation, St. Joseph, MI), see
Appendix IV for information. Moisture was determined in nitrogen atmosphere with a
start temperature of 25°C and an end temperature of 130°C (17 min ramp rate). Ash was
determined in oxygen atmosphere with a start temperature of 130°C and an end
temperature of 600°C (30 min ramp rate). Protein was determined by difference.
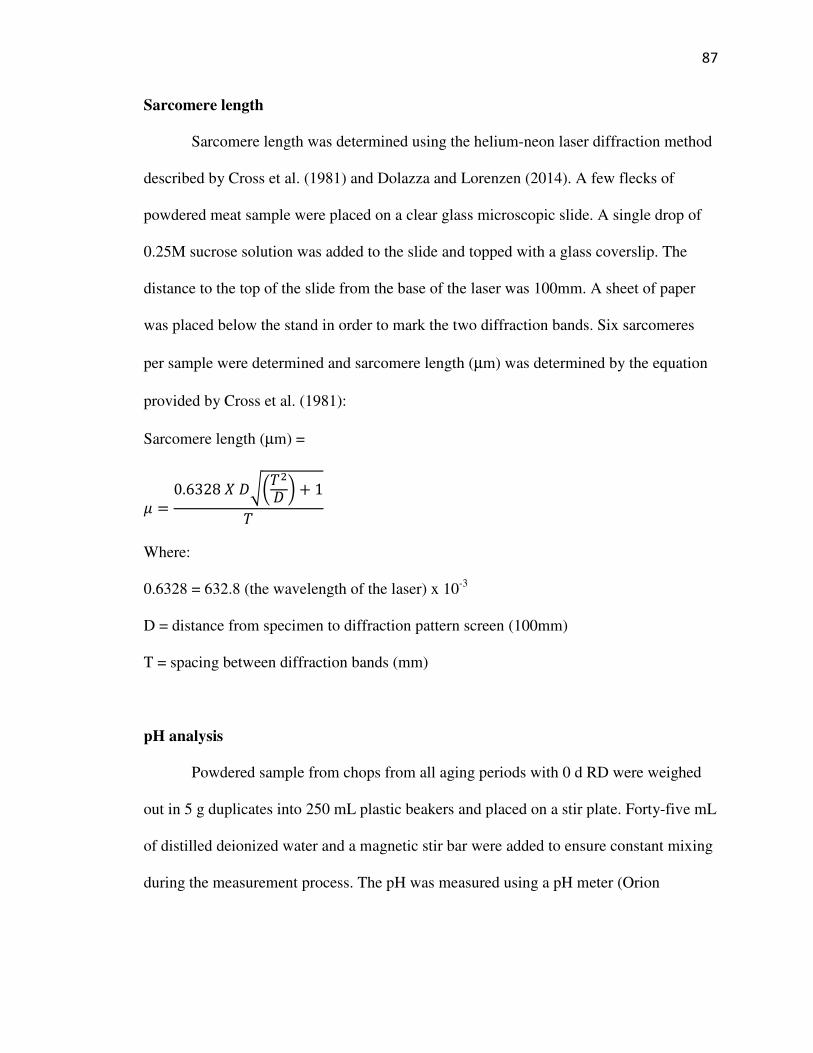
87
Sarcomere length
Sarcomere length was determined using the helium-neon laser diffraction method
described by Cross et al. (1981) and Dolazza and Lorenzen (2014). A few flecks of
powdered meat sample were placed on a clear glass microscopic slide. A single drop of
0.25M sucrose solution was added to the slide and topped with a glass coverslip. The
distance to the top of the slide from the base of the laser was 100mm. A sheet of paper
was placed below the stand in order to mark the two diffraction bands. Six sarcomeres
per sample were determined and sarcomere length (µm) was determined by the equation
provided by Cross et al. (1981):
Sarcomere length (µm) =
$ =0.6328./0123
/ 4 + 12
Where:
0.6328 = 632.8 (the wavelength of the laser) x 10-3
D = distance from specimen to diffraction pattern screen (100mm)
T = spacing between diffraction bands (mm)
pH analysis
Powdered sample from chops from all aging periods with 0 d RD were weighed
out in 5 g duplicates into 250 mL plastic beakers and placed on a stir plate. Forty-five mL
of distilled deionized water and a magnetic stir bar were added to ensure constant mixing
during the measurement process. The pH was measured using a pH meter (Orion
88
410Aplus: ThermoFisher Scientific; Waltham, MA) that was calibrated using 4.0, 7.0,
10.0 standards. The mean measurement of the duplicates was utilized for all analysis.
Fatty acids
Fatty acid profiles were obtained via gas chromatography as described by (Folch
et al., 1987). After extraction, lipids were converted to fatty acid methyl esters according
to Morrison and Smith (1964) and Metcalfe et al. (1966). One g of powdered sample was
homogenized with 5 mL of 2:1 chloroform: methanol and allowed to sit at room
temperature (23°C) for 1 h. After, samples were filtered through Whatman #2 paper,
brought up to a final volume of 10mL with 2:1 chloroform: methanol, and vortexed for 5
s with 2mL of 0.74% KCl. Samples were centrifuged (1,000 x g for 5 min at 5°C) and the
top layer was aspirated off. After centrifugation, samples were dried on a heating block at
60°C under nitrogen purge. Once dry, 1 mL of 0.5 M NaOH in methanol was added,
vortexed (5 s), and again heated at 100°C for 10 min. One mL of 14% Boron Trifluoride
in methanol was added, vortexed (5 s), and again heated at 100°C, this time for 5 min.
Two mL of saturated salt solution and 2 mL of hexane was added and vortexed (5 s).
Samples were then centrifuged (1,000 x g for 5 min at 5°C) and the hexane layer
removed and analyzed using gas chromatography (TRACE 1310 Gas Chromatograph;
ThermoFisher Scientific, Waltham, MA). Fatty acids were separated using a Chrompack
CP-Sil 88 capillary column (0.25mm by 100mm; Inlet temp: 260°C, Oven: 140°C hold
for 5 min, increase at 4°C/min to 240°C and hold for 15 min. FID temp: 280°C. Injected
at 30:1 ratio) and identified based on their retention times compared to known
commercial standards (NU-Check Prep, Inc., Elysian, MN; #GLC-68D, GLC-79, GLC-

89
87, GLC-455, and GLC-458). The percentage of fatty acids were determined by the peak
areas in the chromatograph and values were converted to mg/100g tissue: Fatty acid
mg/100g tissue = (% of fatty acid peak area * fat content of samples) * 100.
Free calcium concentration
Free calcium was quantified according to the procedure described by Parrish et al.
(1981)with modifications. Three grams of powdered sample were centrifuged at 196,000
x g (Beckman Optima XPN-90 Ultracentrifuge, Type 50.2 Ti rotor, Beckman Coulter,
Brea, CA) at 4°C for 30 min. Seven hundred microliters of the supernatant were collected
and treated with 0.1 mL of 27.5 trichloroacetic acid (TCA). Samples were centrifuged at
6,000 x g (accuSpin Micro 17R, ThermoFisher Scientific, Waltham, MA) for 10 min at
4°C. Four hundred µL of supernatant were transferred to a syringe, and the volume was
brought to 4 mL with deionized, distilled water. The diluted sample was filtered through
a 13 mm diameter Millex-LG 0.20 µm syringe filter (Milliore, Bedford, MA). Calcium
concentration was quantified at Ward Laboratories (Kearney, NE) using an inductively-
coupled plasma emission spectrometer (iCAP 6500 Radial; Thermo Electron, Cambridge,
UK) with an appropriate calcium concentration standard.
Lipid oxidation (TBARS)
Lipid oxidation was determined using thiobarbaturic acid reactive substances
values (TBARS) for all aging periods at 0 and 7 d RD described (Ahn et al., 1998). Five
grams of powdered meat were placed into a 50 mL conical tube to which 14 mL of
distilled deionized water were added and 1 mL of butylated hydroxyanisole (BHA)
90
solution (10% BHA: 90% ethanol). Samples were homogenized using a Polytron
(POLYTRON Kinimatica CH-6010, Switzerland) for 15 s at medium to high speed.
The samples were centrifuged (2,000 x g for 5 min at 10°C) and one mL of supernatant
was transferred into a 15 mL conical tube with 2 mL of 2,4,6-tribromoanisole (TBA)
2,4,6-tricholoroanisole (TCA) solution (15% and 20 mM TBA in deionized distilled
water). Tubes were then placed in a 70°C water bath for 30 min. After 30 min, tubes were
cooled for at least 10 min in a water bath (22°C) and centrifuged (2,000 x g for 15 min at
10°C). Two hundred µL of supernatant was transferred to a 96-well plate in duplicate
(Microtest III sterile 96 well flat-bottomed microplate; Becton Dickinson & Company,
Lincoln Park, NJ). Absorbance values were then read at 540 nm using a microplate
spectrophotometer and compared to known standards (Model Epoch Biotek, Winooski,
VT). Results were expressed in mg of malonaldehyde per kg of tissue.
Troponin T
Troponin T degradation was quantified according the procedure described by
Chao et al. (2018)with modifications. 3 grams of powdered meat was homogenized with
15 mL of ice-cold rigor buffer (0.1M KCl, 2mM MgCl2, 1mM EDTA, and 10mM
K2HPO4; pH 7.4) using a polytron (POLYTRON Kinimatica CH-6010, Switzerland) at
medium speed for 5 s bursts for 30 s. Homogenate was filtered through a double-layered
cheese cloth and 1.4 mL of homogenate was extracted into an eppendorf tube (2mL safe-
lock tube; 02236352, Eppendorf AG, Hamburg, Germany). Tubes were centrifuged at
4,000 x g for 5 min. Supernatent was decanted and pellet was resuspended in 1 mL of
rigor buffer. Centrifuge sample at 4,000 x g for 5 min two more times. Decant
91
supernatant and suspend pellet in 1 mL suspension buffer (0.1M Tris-Base, 1.25mM
EDTA, 5% SDS; pH 8) and centrifuged at 4,000 x g for 5 min. Protein concentration was
determined using a Pierce bicinchoninic acid protein assay kit (Pierce Biotechnology,
Rockford, IL, USA). All samples were diluted to 2 mg/mL with deionized-distilled water
and 2x Laemmli buffer (65.8mM Tris-HCl, 2.1% SDS, 26.3% glycerol, 0.01%
bromophenol blue) with 2% betamercaptoethanol (1:50) and put on a heating block at
95°C for 5 min. 20µL of sample were loaded on 4-20% Mini-PROTEAN TGX™ precast
polyacrylamide gels (Bio-Rad Laboratories, Hercules, CA, USA) with a 10µL pre-stained
standard (Precision Plus Protein Kaleidoscope, #1610375, Bio Rad, Hercules, CA) using
a Bio-Rad Mini-PROTEIN 2 Cells system (Bio-Rad Laboratories). The system was run at
constant voltage of 200V for 60 min with an electrophoresis buffer (1xTris/Glycine/SDS,
#161-0732, Bio-Rad Laboratories, Hercules, CA, USA). Proteins in the gels were blotted
to polyvinylidene difluoride membranes (0.45µm, Immobion-FL transfer membrane;
Millipore) using a Bio-Rad Mini-Trans-Blot Electrophoretic transfer cell (Bio-Rad
Laboratories) for 60 min at a constant amperage of 180mA with ice-cold transfer buffer
(25mM Tris-base, 192mM Glycine, 20% methanol; pH at 9.2). Membranes were blocked
for 2 h in Odyssey Blocking Buffer (LI-COR, Lincoln, NE, USA) and incubated for 60
min at room temperature in monoclonal anti-troponin-T antibody (JLT-12; Sigma-
Aldrich, St. Louis, MO, USA) at a dilution of 1:10,000 in Odyssey blocking buffer
containing 0.2% TWEEN-20 and 5% non-fat dry milk. Membranes incubated overnight
at 4°C, then washed three time with Tris Buffered Saline containing 0.2% TWEEN-20
(TBST) for 10 min and incubated in IRDye 680 LT Conjugated Goat Anti-Mouse IgG1
secondary antibody (LI-COR) at a dilution of 1: 10,000 in Odyssey blocking buffer
92
containing 0.2% TWEEN-20 for 60 min. Membranes were washed three times with
TBST and scanned using Odyssey Infrared Imaging system (LI-COR) at 700nm.
Degradation was evaluated by quantifying band intensities (k. pixels) using Odyssey
application software version 1.1. Bands ranging from 38 and 35kDa were designated as
intact and bands ranging from 30 to 28kDa were designated as degraded. Percent
degradation was calculated by (intensity of degraded bands/intensity of intact bands)*100
Desmin
Three grams of powdered meat was homogenized with 15 mL of whole muscle
solubilization buffer (2%wt/vol SDS, 10mM sodium phosphate buffer; pH 7.0) using a
polytron (POLYTRON Kinimatica CH-6010, Switzerland) at medium speed for 5 s
bursts for 30 s. Homogenate was filtered through a double-layered cheese cloth and 1.4
mL of homogenate was extracted into an eppendorf tube (2mL safe-lock tube; 02236352,
Eppendorf AG, Hamburg, Germany). Tubes were centrifuged at 1,500 x g for 15 min at
25°C to remove traces of insoluble components. 1 mL of supernatant was collected and
into a 1.5 mL eppendorf tube. Protein concentration was determined using a Pierce
bicinchoninic acid protein assay kit (Pierce Biotechnology, Rockford, IL, USA). All
samples were diluted to 6.4 mg/mL using whole muscle solubilizing buffer. Samples
were diluted to a final concentration of 4mg/mL with 50% of gel buffer (3mM EDTA,
3% wt/vol SDS, 30% vol/vol glycerol, 0.001% wt/vol pyronin Y, and 30mM Tris-HCl;
pH 8.0) and 10% of betamercaptoethanol then heated on a block for 15 min at 50°C.
30µL of sample were loaded on 4-20% Mini-PROTEAN TGX™ precast polyacrylamide
gels (Bio-Rad Laboratories, Hercules, CA, USA) with a 10µL pre-stained standard

93
(Precision Plus Protein Kaleidoscope, #1610375, Bio Rad, Hercules, CA) using a Bio-
Rad Mini-PROTEIN 2 Cells system (Bio-Rad Laboratories). The system was run at
constant voltage of 360V for 45 min with an electrophoresis buffer (1xTris/Glycine/SDS,
#161-0732, Bio-Rad Laboratories, Hercules, CA, USA). Proteins in the gels were blotted
to polyvinylidene difluoride membranes (0.45µm, Immobion-FL transfer membrane;
Millipore) using a Bio-Rad Mini-Trans-Blot Electrophoretic transfer cell (Bio-Rad
Laboratories) for 90 min at a constant voltage of 90Vwith ice-cold transfer buffer (25mM
Tris-base, 192mM Glycine, 20% methanol; pH at 9.2). Membranes were blocked for 60
min in Odyssey Blocking Buffer (LI-COR, Lincoln, NE, USA) and incubated for 60 min
at room temperature in monoclonal anti-desmin antibody (DE-U-10 Sigma-Aldrich, St.
Louis, MO, USA) at a dilution of 1:10,000 in Odyssey blocking buffer containing 0.2%
TWEEN-20 and 5% non-fat dry milk. Membranes were incubated overnight at 4°C, then
washed three time with Tris Buffered Saline containing 0.2% TWEEN-20 (TBST) for 10
min and incubated in IRDye 680 LT Conjugated Goat Anti-Mouse IgG1 secondary
antibody (LI-COR) at a dilution of 1: 10,000 in Odyssey blocking buffer containing 0.2%
TWEEN-20 for 60 min. Membranes were washed three times with TBST and scanned
using Odyssey Infrared Imaging system (LI-COR) at 700nm. Degradation was evaluated
by quantifying band intensities (k. pixels) using Odyssey application software version
1.1. Bands at 55kDa were designated as intact and bands at 38kDa were designated as
degraded. Percent degradation was calculated by (intensity of degraded bands/intensity of
intact bands)* 100.
94
Isoprostanes
All analysis was completed using OxiSelect™ 8-iso-Prostaglandin F2aplha
ELISA Kit (Cell BioLabs, INC., STA-337, San Diego, CA). Weigh out 30mg of
powdered meat in a 5 mL eppendorf tube (). Homogenize sample in 2 mL of 2N NaOH
using Micropolytron(Pro-Scientific200, Bio-Gen, Oxford, CT) and spin for 20 s, cleaning
micropolytron between each sample. Heat homogenized sample in water bath (Thelco
261, GCA Precision Scientific, Chicago, IL) at 45°C for 2 h to ensure hydrolysis. Cool
tissue samples to room temperature (~20 min), then neutralize pH using 2 mL of 2N HCl,
vortex for 20 s. Split into two 2 mL eppendorf tubes (2mL safe-lock tube; 02236352,
Eppendorf AG, Hamburg, Germany). Using microcentrifuge, spin samples at 10,000 x g
for 15 min at 4°C. Add 100µL of sample to 100µL of neutralization solution in a 0.6 mL
eppendorf tube. Dilute Anti-8-iso-PGF2� Antibody (1:1000) with sample diluent. Add
100µL of the diluted antibody to the Goat Anti-Rabbit Antibody coated plate. Incubate
on an oscillation shake at 25°C for 1 h. During incubation, prepare 100 mL of 1x wash
buffer by diluting 10x wash buffer concentrate with deionized water. Prepare
Isoprostanes standards as labeled in Appendix XIX. After incubation, remove the
antibody solution from the wells. Wash wells 5 times with 300µL 1x wash buffer per
well. After the last wash, empty the wells and tap microwell plate on absorbent pad or
paper towel to remove excess wash solution. Immediately before use, dilute the conjugate
(1:80) with sample diluent. Combine 55µL of the 8-iso-PGF2� standard or hydrolyzed
sample and 55µL of 8-iso-PGF2alphs-HRP conjugate in a microtube and mix thoroughly.
Transfer 100µL of the combined solution per well. A well containing sample diluent can
be used as a blank. Incubate plate for 1 h at 25°C on an orbital shaker. After incubation,

95
remove the combined solution from the wells. Wash 5 times with 300µL of 1x wash
buffer per well. After the last wash, empty wells and tap microwell plate on absorbent
pad or paper. Add 100µL of substrate solution to each well and incubate at 25°C for 30
min on oscillate shaker. After incubation, add 100µL of stop solution to each well.
Results should be read immediately on a microplate reader using 450nm as the target
wavelength. Units of isoprostane content designated as picogram/mL.
Statistical analysis
Statistical analysis was conducted with SAS (version 9.4, Cary, NC). Objective
and subjective color data were analyzed as a split-plot repeated measures design with
treatment as the whole-plot, aging period as the split-plot and retail display as the
repeated measures. Tenderness, troponin t, desmin, calcium, and pH were analyzed as a
split-plot design with treatment as the whole-plot and aging period as the split-plot. Lipid
oxidation, free thiols and carbonyls were a split-split-plot design with treatment as the
whole plot, aging period as the split-plot and retail display time as the split-split-plot.
Transcriptomics, sarcomere length, fatty acids, cytochrome c, and isoprostanes were
analyzed as a completely randomized design. Data were analyzed using the PROC
GLIMMIX procedure of SAS and animal was the experimental unit. All means were
separated with the LS MEANS statement with an � level of 0.05 and tendencies were
considered at an � level of 0.15.

96
LITERATURE CITED
Ahn, D. U., D. G. Olson, C. Jo, X. Chen, C. Wu, and J. I. Lee. 1998. Effect of muscle type,
packaging, and irradiation on lipid oxidation, volatile production, and color in raw pork
patties. Meat Sci. 49:27–39.
Akbarian, A., J. Michiels, J. Degroote, M. Majdeddin, A. Golian, and S. De Smet. 2016.
Association between heat stress and oxidative stress in poultry; mitochondrial
dysfunction and dietary interventions with phytochemicals. J. Anim. Sci. Biotechnol.
7:1–14.
Archile-Contreras, A. C., and P. P. Purslow. 2011. Oxidative stress may affect meat quality by
interfering with collagen turnover by muscle fibroblasts. Food Res. Int. 44:582–588.
Arora, R., N. Kumar, S. Sudarshan, M. N. Fairoze, M. Kaur, A. Sharma, Y. Girdhar, R. M.
Sreesujatha, S. K. Devatkal, S. Ahlawat, R. K. Vijh, and S. S. Manjunatha. 2019.
Transcriptome profiling of longissimus thoracis muscles identifies highly connected
differentially expressed genes in meat type sheep of India. PLoS One. 14:1–15.
Arriagada, O., A. V. Treuer, and D. R. González. 2018. Cardioprotective effects of s-
nitrosothiols in ischemia- reperfusion: role for mitochondria and calcium channels. Free
Radicals, Antioxidants Dis. 87–106.
Asghar, A., J. I. Gray, A. M. Booren, E. A. Gomaa, M. M. Abouzied, E. R. Miller, and D. J.
Buckley. 1991. Effects of supranutritional dietary vitamin e levels on subcellular
deposition of α�tocopherol in the muscle and on pork quality. J. Sci. Food Agric. 57:31–
41.
Bai, W. Q., K. Y. Zhang, X. M. Ding, S. P. Bai, J. P. Wang, H. W. Peng, and Q. F. Zeng. 2019.
High dietary energy content increases inflammatory markers after lipopolysaccharide
challenge in meat ducks. Poult. Sci. 98:164–171.
Baron, C. P., and H. J. Andersen. 2002. Myoglobin-induced lipid oxidation. a review. J. Agric.
Food Chem. 50:3887–3897.
Basu, S. 1998. Metabolism of 8-iso-prostaglandin F(2α). FEBS Lett. 428:32–36.
Batifoulier, F., Y. Mercier, P. Gatellier, and M. Renerre. 2002. Influence of vitamin e on lipid
and protein oxidation induced by H2O2-activated metmb in microsomal membranes from
turkey muscle. Meat Sci. 61:389–395.
Bekhit, A. E. D. A., D. L. Hopkins, F. T. Fahri, and E. N. Ponnampalam. 2013. Oxidative
processes in muscle systems and fresh meat: sources, markers, and remedies. Compr.
Rev. Food Sci. Food Saf. 12:565–597.
Bernardi, P., A. Krauskopf, E. Basso, V. Petronilli, E. Blalchy-Dyson, F. Di Lisa, and M. A.
Forte. 2006. The mitochondrial permeability transition from in vitro artifact to disease
target. FEBS J. 273:2077–2099.
Bhat, Z. F., J. D. Morton, S. L. Mason, and A. E.-D. A. Bekhit. 2018. Role of calpain system in
meat tenderness: a review. Food Sci. Hum. Wellness. 7:196–204.
Bienert, G. P., J. K. Schjoerring, and T. P. Jahn. 2006. Membrane transport of hydrogen
peroxide. Biochim. Biophys. Acta - Biomembr. 1758:994–1003.
Blunt, B. C., A. T. Creek, D. A. C. Henderson, and P. A. Hofmann. 2007. H2O2 activation of
HSP25/27 protects desmin from calpain proteolysis in rat ventricular myocytes. Am. J.
Physiol. - Hear. Circ. Physiol. 293:1518–1525.
Bolisetty, S., and E. A. Jaimes. 2013. Mitochondria and reactive oxygen species: physiology and
pathophysiology. Int. J. Mol. Sci. 14:6306–6344.
97
Bongiorni, S., C. E. M. Gruber, S. Bueno, G. Chillemi, F. Ferrè, S. Failla, B. Moioli, and A.
Valentini. 2016. Transcriptomic investigation of meat tenderness in two Italian cattle
breeds. Anim. Genet. 47:273–287.
Borchman, D., D. Tang, and M. C. Yappert. 1999. Lipid composition, membrane structure
relationships in lens and muscle sarcoplasmic reticulum membranes. Biospectroscopy.
5:151–167.
Brannan, R. G., and E. A. Decker. 2002. Nitric oxide synthase activity in muscle foods. Meat
Sci. 62:229–235.
Cao, J., W. Sun, G. Zhou, X. Xu, Z. Peng, and Z. Hu. 2010. Morphological and biochemical
assessment of apoptosis in different skeletal muscles of bulls during conditioning. J.
Anim. Sci. 88:3439–3444.
Capozzi, F., A. Trimigno, and P. Ferranti. 2017. Proteomics and metabolomics in relation to
meat quality. Elsevier Ltd.
Carlin, K. R. M., E. Huff-Lonergan, L. J. Rowe, and S. M. Lonergan. 2006. Effect of oxidation,
pH, and ionic strength on calpastatin inhibition of µ- and m-calpain. J. Anim. Sci.
84:925–937.
Celi, P. 2010. The role of oxidative stress in small ruminants’ health and production. Rev. Bras.
Zootec. 39:348–363.
Chao, M. 2015. Impact of wet distillers grains plus solubles and antioxidants on a basic
mechanism of beef tenderization. Diss. Univ. Nebraska-Lincoln.
Chao, M. D., K. I. Domenech-Pérez, and C. R. Calkins. 2017. Feeding vitamin E may reverse
sarcoplasmic reticulum membrane instability caused by feeding wet distillers grains plus
solubles to cattle. Prof. Anim. Sci. 33:12–23.
Chao, M. D., K. I. Domenech-Perez, L. S. Senaratne-Lenagala, and C. R. Calkins. 2018. Feeding
wet distillers grains plus solubles contributes to sarcoplasmic reticulum membrane
instability. Anim. Prod. Sci. 58:2215–2223.
Chauhan, S. S., E. N. Ponnampalam, P. Celi, D. L. Hopkins, B. J. Leury, and F. R. Dunshea.
2016. High dietary vitamin e and selenium improves feed intake and weight gain of
finisher lambs and maintains redox homeostasis under hot conditions. Small Rumin. Res.
137:17–23.
Chen, Y., and C. T. Ho. 2002. Effects of carnosine on volatile generation from maillard reaction
of ribose and cysteine. J. Agric. Food Chem. 50:2372–2376.
Cook, C. J., S. M. Scott, and C. E. Devine. 1998. Measurement of nitric oxide and the effect of
enhancing or inhibiting it on tenderness changes of meat. Meat Sci. 48:85–89.
Copello, J. A., S. Barg, H. Onoue, and S. Fleischer. 1997. Heterogeneity of Ca2+ gating of
skeletal muscle and cardiac ryanodine receptors. Biophys. J. 73:141–156.
Cottrell, J. J., M. B. McDonagh, F. R. Dunshea, and R. D. Warner. 2008. Inhibition of nitric
oxide release pre-slaughter increases post-mortem glycolysis and improves tenderness in
ovine muscles. Meat Sci. 80:511–521.
Cottrell, J. J., E. N. Ponnampalam, F. R. Dunshea, and R. D. Warner. 2015. Effects of infusing
nitric oxide donors and inhibitors on plasma metabolites, muscle lactate production and
meat quality in lambs fed a high quality roughage-based diet. Meat Sci. 105:8–15.
Creagh, E. M., D. Sheehan, and T. G. Cotter. 2000. Heat shock proteins - modulators of
apoptosis in tumour cells. Leukemia. 14:1161–1173.
D’Alessandro, A., and L. Zolla. 2013. Meat science: from proteomics to integrated omics
towards system biology. J. Proteomics. 78:558–577.
98
Dalle-Donne, I., R. Rossi, D. Giustarini, A. Milzani, and R. Colombo. 2003. Protein carbonyl
groups as biomarkers of oxidative stress. Clin. Chim. Acta. 329:23–38.
Delliaux, S., C. Brerro-Saby, J. G. Steinberg, and Y. Jammes. 2009. Reactive oxygen species
activate the group iv muscle afferents investing and exercising muscle in rats. Pflugers
Arch. Eur. J. Physiol. 459:143–150.
Descalzo, A. M., and A. M. Sancho. 2008. A review of natural antioxidants and their effects on
oxidative status, odor and quality of fresh beef produced in Argentina. Meat Sci. 79:423–
436.
Deters, E. L., and S. L. Hansen. 2019. Vitamin E supplementation strategies during feedlot
receiving: effects on beef steer performance, antibody response to vaccination, and
antioxidant defense. J. Anim. Sci. 97:4362–4369.
Dirksen, R. T. 2009. Sarcoplasmic reticulum-mitochondrial “through-space” coupling in skeletal
muscle. Appl Physiol Nutr Metab. 34:389–395.
Dobin, A., T. R. Gingeras, C. Spring, R. Flores, J. Sampson, R. Knight, N. Chia, and H. S.
Technologies. 2016. Mapping RNA-seq with STAR. Curr Protoc Bioinforma. 51:586–
597.
Dodson, M., M. Redmann, N. S. Rajasekaran, V. Darley-Usmar, and J. Zhang. 2015. KEAP1-
NRF2 signaling and autophage in protection against oxidative and reductive
proteotoxicity. Biochem. J. 469:347–355.
Domínguez, R., M. Pateiro, M. Gagaoua, F. J. Barba, W. Zhang, and J. M. Lorenzo. 2019. A
comprehensive review on lipid oxidation in meat and meat products. Antioxidants. 8:1–
31.
Dröge, W. 2002. Free radicals in the physiological control of cell function. Physiol. Rev. 82:47–
95.
Dunning, K. R., M. R. Anastasi, V. J. Zhang, D. L. Russell, and R. L. Robker. 2014. Regulation
of fatty acid oxidation in mouse cumulus-oocyte complexes during maturation and
modulation by PPAR agonists. PLoS One. 9:1–11.
De Duve, C., B. C. Pressman, R. Gianetto, R. Wattiaux, and F. Appelmans. 1955. Tissue
fractionation studies. 6. intracellular distribution patterns of enzymes in rat-liver tissue.
Biochem. J. 60:604–617.
Estévez, M. 2011. Protein carbonyls in meat systems: a review. Meat Sci. 89:259–279.
Estévez, M., and M. Heinonen. 2010. Effect of phenolic compounds on the formation of α-
aminoadipic and γ-glutamic semialdehydes from myofibrillar proteins oxidized by
copper, iron, and myoglobin. J. Agric. Food Chem. 58:4448–4455.
Eu, J. P., L. Xu, J. S. Stamler, and G. Meissner. 1999. Regulation of ryanodine receptors by
reactive nitrogen species. Biochem. Pharmacol. 57:1079–1084.
Faustman, C., W. K. M. Chan, D. M. Schaefer, and A. Havens. 1998. Beef color update: the role
for vitamin E. J. Anim. Sci. 76:1019–1026.
Faustman, C., Q. Sun, R. Mancini, and S. P. Suman. 2010. Myoglobin and lipid oxidation
interactions: mechanistic bases and control. Meat Sci. 86:86–94.
Fischer, D., J. Matten, J. Reimann, C. Bönnemann, and R. Schröder. 2002. Expression,
localization and functional divergence of αB-crystallin and heat shock protein 27 in core
myopathies and neurogenic atrophy. Acta Neuropathol. 104:297–304.
Folch, J., M. Lees, and G. . Sloane Stanley. 1987. A simple method for the isolation and
purification of total lipided from animal tissues. J. Biol. Chem. 55:999–1033.
Förstermann, U., and W. C. Sessa. 2012. Nitric oxide synthases: regulation and function. Eur.

99
Heart J. 33:829–837.
Fourquet, S., R. Guerois, D. Biard, and M. B. Toledano. 2010. Activation of nrf2 by nitrosative
agents and H2O2 involves keap1 disulfide formation. J. Biol. Chem. 285:8463–8471.
Frederiksen, A. M., M. N. Lund, M. L. Andersen, and L. H. Skibsted. 2008. Oxidation of porcine
myosin by hypervalent myoglobin: the role of thiol groups. J. Agric. Food Chem.
56:3297–3304.
Fulle, S., F. Protasi, G. Di Tano, T. Pietrangelo, A. Beltramin, S. Boncompagni, L. Vecchiet, and
G. Fanò. 2004. The contribution of reactive oxygen species to sarcopenia and muscle
ageing. Exp. Gerontol. 39:17–24.
García-Cardeña, G., P. Martasek, B. S. S. Masters, P. M. Skidd, J. Couet, S. Li, M. P. Lisanti,
and W. C. Sessa. 1997. Dissecting the interaction between nitric oxide synthase (NOS)
and caveolin. functional significance of the NOScaveolin binding domain in vivo. J. Biol.
Chem. 272:25437–25440.
Gatellier, P., C. Hamelin, Y. Durand, and M. Renerre. 2001. Effect of a dietary vitamin e
supplementation on colour stability and lipid oxidation of air- and modified. 59:133–140.
Gatellier, P., Y. Mercier, and M. Renerre. 2004. Effect of diet finishing mode (pasture or mixed
diet) on antioxidant status of charolais bovine meat. Meat Sci. 67:385–394.
Ghafourifar, P., and E. Cadenas. 2005. Mitochondrial nitric oxide synthase. Trends Pharmacol.
Sci. 26:190–195.
Gray, M. W., G. Burger, and B. F. Lang. 2001. The origin and early evolution of mitochondria.
Genome Biol. 2:1465.
Guo, B., and B. P. Dalrymple. 2017. Transcriptomics of meat quality. Elsevier Ltd.
Habibian, M., S. Ghazi, and M. M. Moeini. 2016. Effects of dietary selenium and vitamin e on
growth performance, meat yield, and selenium content and lipid oxidation of breast meat
of broilers reared under heat stress. Biol. Trace Elem. Res. 169:142–152.
Halawa, A. A., M. A. El-Adl, M. F. Hamed, A. Z. Balboula, and M. A. Elmetwally. 2013.
Lipopolysaccharide prompts oxidative stress and apoptosis in rats’ testicular tissue. J.
Vet. Healthc. 20–31.
Halon-Golabek, M., A. Borkowska, A. Herman-Antosiewicz, and J. Antosiewicz. 2019. Iron
metabolism of the skeletal muscle and neurodegeneration. Front. Neurosci. 13:1–15.
Harris, S. E., E. Huff-Lonergan, S. M. Lonergan, W. R. Jones, and D. Rankins. 2001.
Antioxidant status affects color stability and tenderness of calcium chloride-injected beef.
J. Anim. Sci. 79:666–677.
Hart, K. B., F. A. Ribeiro, M. L. Henriott, N. J. Herrera, and C. R. Calkins. 2019. Quality effects
on beef strip steaks from cattle fed high-protein corn distillers grains and other ethanol
by-products. J. Anim. Sci. 97:2087–2098.
Henderson, C. A., C. G. Gomez, S. M. Novak, L. Mi-Mi, and C. C. Gregorio. 2017. Overview of
the muscle cytoskeleton. Compr. Physiol. 7:891–944.
Hollung, K., E. Veiseth, X. Jia, E. M. Færgestad, and K. I. Hildrum. 2007. Application of
proteomics to understand the molecular mechanisms behind meat quality. Meat Sci.
77:97–104.
Hong, Y. H., A. C. Betik, and G. K. Mcconell. 2014. Role of nitric oxide in skeletal muscle
glucose uptake during exercise. Exp. Physiol. 99:1569–1573.
Hood, D. E., and E. B. Riordan. 1973. Discolouration in pre�packaged beef: measurement by
reflectance spectrophotometry and shopper discrimination. Int. J. Food Sci. Technol.
8:333–343.
100
Hoogenboom, M. O., N. B. Metcalfe, T. G. G. Groothuis, B. de Vries, and D. Costantini. 2012.
Relationship between oxidative stress and circulating testosterone and cortisol in pre-
spawning female brown trout. Comp. Biochem. Physiol. - A Mol. Integr. Physiol.
163:379–387.
Huang, F., M. Huang, H. Zhang, C. Zhang, D. Zhang, and G. Zhou. 2016. Changes in apoptotic
factors and caspase activation pathways during the postmortem aging of beef muscle.
Food Chem. 190:110–114.
Huff Lonergan, E., W. Zhang, and S. M. Lonergan. 2010. Biochemistry of postmortem muscle -
lessons on mechanisms of meat tenderization. Meat Sci. 86:184–195.
Hwang, Y. H., and S. T. Joo. 2017. Fatty acid profiles, meat quality, and sensory palatability of
grain-fed and grass-fed beef from Hanwoo, American, and Australian crossbred cattle.
Korean J. Food Sci. Anim. Resour. 37:153–161.
Ilian, M. A., A. E. D. Bekhit, and R. Bickerstaffe. 2004. The relationship between meat
tenderization, myofibril fragmentation and autolysis of calpain 3 during post-mortem
aging. Meat Sci. 66:387–397.
Isaeva, E. V., V. M. Shkryl, and N. Shirokova. 2005. Mitochondrial redox state and ca2+ sparks
in permeabilized mammalian skeletal muscle. J. Physiol. 565:855–872.
Ishii, T., O. Sunami, N. Saitoh, H. Nishio, T. Takeuchi, and F. Hata. 1998. Inhibition of skeletal
muscle sarcoplasmic reticulum Ca2+-atpase by nitric oxide. FEBS Lett. 440:218–222.
Iverson, N. M., P. W. Barone, M. Shandell, L. J. Trudel, S. Sen, F. Sen, V. Ivanov, E. Atolia, E.
Farias, T. P. McNicholas, N. Reuel, N. M. A. Parry, G. N. Wogan, and M. S. Strano.
2013. In vivo biosensing via tissue-localizable near-infrared-fluorescent single-walled
carbon nanotubes. Nat. Nanotechnol. 8:873–880.
Iverson, N. M., P. W. Barone, M. Shandell, L. J. Trudel, S. Sen, F. Sen, V. Ivanov, E. Atolia, E.
Farias, T. P. McNicholas, N. Reuel, N. M. A. Parry, G. N. Wogan, and M. S. Strano.
2017. In vivo biosensing via tissue localizable near infrared fluorescent single walled
carbon nanotubes. Natl. Nanotechnol. 8:873–880.
Iverson, N. M., M. S. Strano, and G. N. Wogan. 2015. In vivo delivery of nitric oxide-sensing,
single-walled carbon nanotubes. Curr. Protoc. Chem. Biol. 7:93–102.
Jin, H., D. A. Heller, M. Kalbacova, J.-H. Kim, J. Zhang, A. A. Boghossian, N. Maheshri, and
M. S. Strano. 2010. Detection of single-molecule h2o2 signaling from epidermal growth
factor using fluorescent single-walled carbon nanotubes. Natl. Nanotechnol. 5:302–309.
Jones, N. C., K. J. Tyner, L. Nibarger, H. M. Stanley, D. D. W. Cornelison, Y. V. Fedorov, and
B. B. Olwin. 2005. The p38α/β MAPK functions as a molecular switch to activate the
quiescent satellite cell. J. Cell Biol. 169:105–116.
Kagan, V. E., H. A. Bayir, N. A. Belikova, O. Kapralov, Y. Y. Tyurina, V. A. Tyurin, J. Jiang,
D. A. Stoyanovsky, P. Wipf, P. M. Kochanek, J. S. Greenberger, B. Pitt, A. A. Shvedova,
and G. Borisenko. 2009. Cytochrome c/cardiolipin relations in mitochondria: a kiss of
death. Free Radic. Biol. Med. 46:1439–1453.
Kaiser, M. G., S. S. Block, C. Ciraci, W. Fang, M. Sifri, and S. J. Lamont. 2012. Effects of
dietary vitamin E type and level on lipopolysaccharide-induced cytokine mRNA
expression in broiler chicks. Poult. Sci. 91:1893–1898.
Kapur, S., S. Bedard, B. Marcotte, C. H. Cote, and A. Marette. 1997. Expression of nitric oxide
synthase in skeletal muscle: a novel role for nitric oxide as a modulator of insulin action.
Diabetes. 46:1691–1700.
Karamouzis, I., K. Christoulas, D. Grekas, K. Giannoulis, E. Vamvakoudis, and K. Mandroukas.
101
2004. The response of muscle interstitial F2-isoprostane (8-Iso-PGF2α) during dynamic
muscle contractions in humans. Prostaglandins Leukot. Essent. Fat. Acids. 71:87–90.
Ke, Y., R. M. Mitacek, A. Abraham, G. G. Mafi, D. L. VanOverbeke, U. Desilva, and R.
Ramanathan. 2017. Effects of muscle-specific oxidative stress on cytochrome c release
and oxidation-reduction potential properties. J. Agric. Food Chem. 65:7749–7755.
Kemp, C. M., and T. Parr. 2012. Advances in apoptotic mediated proteolysis in meat
tenderisation. Meat Sci. 92:252–259.
Kemp, C. M., P. L. Sensky, R. G. Bardsley, P. J. Buttery, and T. Parr. 2010. Tenderness - an
enzymatic view. Meat Sci. 84:248–256.
Kim, J. H., C. R. Patra, J. R. Arkalgud, A. A. Boghossian, J. Zhang, J. H. Han, N. F. Reuel, J. H.
Ahn, D. Mukhopadhyay, and M. S. Strano. 2011. Single-molecule detection of H2O2
mediating angiogenic redox signaling on fluorescent single-walled carbon nanotube
array. ACS Nano. 5:7848–7857.
Kim, J. M., H. G. Kim, and C. G. Son. 2018. Tissue-specific profiling of oxidative stress-
associated transcriptome in a healthy mouse model. Int. J. Mol. Sci. 19.
Kim, Y. H. B., R. Kemp, and L. M. Samuelsson. 2016. Effects of dry-aging on meat quality
attributes and metabolite profiles of beef loins. Meat Sci. 111:168–176.
Kirichok, Y., G. Krapivinsky, and D. E. Clapham. 2004. The mitochondrial calcium uniporter is
a highly selective ion channel. Nature. 427:360–364.
Kirkman, H. N., and G. F. Gaetani. 2007. Mammalian catalase: a venerable enzyme with new
mysteries. Trends Biochem. Sci. 32:44–50.
Klopfenstein, T. J., G. E. Erickson, and V. R. Bremer. 2008. Board-invited review: use of
distillers by-products in the beef cattle feeding industry. J. Anim. Sci. 86:1223–1231.
Koh, T. J., and J. G. Tidball. 2000. Nitric oxide inhibits calpain-mediated proteolysis of talin in
skeletal muscle cells. Am. J. Physiol. - Cell Physiol. 279:806–812.
Koohmaraie, M. 1988. The role of endogenous proteases in meat tenderness. Proc. 41 st Anu.
reciprocal meat Conf. 41:89–100.
Koohmaraie, M. 1996. Biochemical factors regulating the toughening and tenderization
processes of meat. Meat Sci. 43:193–201.
Koohmaraie, M., and G. H. Geesink. 2006. Contribution of postmortem muscle biochemistry to
the delivery of consistent meat quality with particular focus on the calpain system. Meat
Sci. 74:34–43.
Koohmaraie, M., G. Whipple, D. H. Kretchmar, J. D. Crouse, and H. J. Mersmann. 1991.
Postmortem proteolysis in longissimus muscle from beef, lamb and pork carcasses. J.
Anim. Sci. 69:617–624.
Kozakowska, M., K. Pietraszek-Gremplewicz, A. Jozkowicz, and J. Dulak. 2015. The role of
oxidative stress in skeletal muscle injury and regeneration: focus on antioxidant enzymes.
J. Muscle Res. Cell Motil. 36:377–393.
Kühlbrandt, W. 2015. Structure and function of mitochondrial membrane protein complexes.
BMC Biol. 13:1–11.
Kunze, E., N. Herrera, K. Domenech-Perez, M. Chao, and C. Calkins. 2017. The influence of
diet on calcium flux in fresh beef. Proceeding 69th Reciprocal Meats Conf. San Angelo,
TX. 1:143–143.
Kuo, I. Y., and B. E. Ehrlich. 2015. Signaling in muscle contraction. Cold Spring Harb. Perspect.
Biol. 7:1–14.
Lacza, Z., A. V. Kozlov, E. Pankotai, A. Csordás, G. Wolf, H. Redl, M. Kollai, C. Szabó, D. W.
102
Busija, and T. F. W. Horn. 2006. Mitochondria produce reactive nitrogen species via an
arginine-independent pathway. Free Radic. Res. 40:369–378.
Laville, E., T. Sayd, M. Morzel, S. Blinet, C. Chambon, J. Lepetit, G. Renand, and J. F.
Hocquette. 2009. Proteome changes during meat aging in tough and tender beef suggest
the importance of apoptosis and protein solubility for beef aging and tenderization. J.
Agric. Food Chem. 57:10755–10764.
Lawson, J. A., J. Rokach, and G. A. FitzGerald. 1999. Isoprostanes: formation, analysis and use
as indices of lipid peroxidation in vivo. J. Biol. Chem. 274:24441–24444.
Lee, D. Y., E. Kim, and M. H. Choi. 2015. Technical and clinical aspects of cortisol as a
biochemical marker of chronic stress. BMB Rep. 48:209–216.
Li, J. X., C. W. C. Tong, D. Q. Xu, and K. M. Chan. 1999. Changes in membrane fluidity and
lipid peroxidation of skeletal muscle mitochondria after exhausting exercise in rats. Eur.
J. Appl. Physiol. Occup. Physiol. 80:113–117.
Lian, T., L. Wang, and Y. Liu. 2013. A new insight into the role of calpains in post-mortem meat
tenderization in domestic animals: A review. Asian-Australasian J. Anim. Sci. 26:443–
454.
Di Lisa, F., R. Menabò, M. Canton, M. Barile, and P. Bernardi. 2001. Opening of the
mitochondrial permeability transition pore causes depletion of mitochondrial and
cytosolic NAD+ and is a causative event in the death of myocytes in postischemic
reperfusion of the heart. J. Biol. Chem. 276:2571–2575.
Liu, R., R. D. Warner, G. Zhou, and W. Zhang. 2018. Contribution of nitric oxide and protein s-
nitrosylation to variation in fresh meat quality. Meat Sci. 144:135–148.
Llopis, J., J. M. McCaffery, A. Miyawaki, M. G. Farquhar, and R. Y. Tsien. 1998. Measurement
of cytosolic, mitochondrial, and golgi pH in single living cells with green fluorescent
proteins. Proc. Natl. Acad. Sci. U. S. A. 95:6803–6808.
Lomiwes, D., M. M. Farouk, E. Wiklund, and O. A. Young. 2014. Small heat shock proteins and
their role in meat tenderness: a review. Meat Sci. 96:26–40.
Lonergan, S. M., E. Huff-Lonergan, B. R. Wiegand, and L. A. Kriese-Anderson. 2001.
Postmortem proteolysis and tenderization of top loin steaks from Brangus cattle. J.
Muscle Foods. 12:121–136.
Love, M. I., W. Huber, and S. Anders. 2014. Moderated estimation of fold change and dispersion
for RNA-seq data with DESeq2. Genome Biol. 15:1–21.
Lund, M. N., R. Lametsch, M. S. Hviid, O. N. Jensen, and L. H. Skibsted. 2007. High-oxygen
packaging atmosphere influences protein oxidation and tenderness of porcine longissimus
dorsi during chill storage. Meat Sci. 77:295–303.
MacKrill, J. J. 2012. Ryanodine receptor calcium release channels: An evolutionary perspective.
Adv. Exp. Med. Biol. 740:159–182.
Madesh, M., and G. Hajnóczky. 2001. VDAC-dependent permeabilization of the outer
mitochondrial membrane by superoxide induces rapid and massive cytochrome c release.
J. Cell Biol. 155:1003–1015.
Malheiros, J. M., C. P. Braga, R. A. Grove, F. A. Ribeiro, C. R. Calkins, J. Adamec, and L. A. L.
Chardulo. 2019. Influence of oxidative damage to proteins on meat tenderness using a
proteomics approach. Meat Sci. 148:64–71.
Martinaud, A., Y. Mercier, P. Marinova, C. Tassy, P. Gatellier, and M. Renerre. 1997.
Comparison of oxidative processes on myofibrillar proteins from beef during maturation
and by different model oxidation systems. J. Agric. Food Chem. 45:2481–2487.
103
Martinez, H. A., A. N. Arnold, J. C. Brooks, C. C. Carr, K. B. Gehring, D. B. Griffin, D. S. Hale,
G. G. Mafi, D. D. Johnson, C. L. Lorenzen, R. J. Maddock, R. K. Miller, D. L.
VanOverbeke, B. E. Wasser, and J. W. Savell. 2017. National beef tenderness survey–
2015: palatability and shear force assessments of retail and foodservice beef. Meat
Muscle Biol. 1:138–148.
Meissner, G. 2002. Regulation of mammalian ryanodine receptors. Front. Biosci. 7:2072–2080.
de Mello, A. S., B. E. Jenschke, L. S. Senaratne, T. P. Carr, G. E. Erickson, and C. R. Calkins.
2018. Effects of finishing diets containing wet distillers grains plus solubles on beef
quality attributes and fatty acid profile. Meat Sci. 136:16–22.
Melzer, K. 2011. Carbohydrate and fat utilization during rest and physical activity. e-SPEN.
6:e45–e52.
Metcalfe, L. D., A. A. Schmitz, and J. R. Pelka. 1966. Rapid preparation of fatty acid esters from
lipids for gas chromatographic analysis. Anal. Chem. 38:514–515.
Miller, J. K., E. Brzezinska-Slebodzinska, and F. C. Madsen. 1993. Oxidative stress,
antioxidants, and animal function. J. Dairy Sci. 76:2812–2823.
Miller, M. F., M. A. Carr, C. B. Ramsey, K. L. Crockett, and L. C. Hoover. 2001. Consumer
thresholds for establishing the value of beef tenderness. J. Anim. Sci. 79:3062–3068.
Milne, G. L., H. Yin, D. Hardy, Klarissa, S. S. Davies, and L. J. Roberts II. 2011. Isoprostane
generation and function. Chem. Rev. 110:5973–5996.
Mitacek, R. M., Y. Ke, J. E. Prenni, R. Jadeja, D. L. VanOverbeke, G. G. Mafi, and R.
Ramanathan. 2019. Mitochondrial degeneration, depletion of NADH, and oxidative stress
decrease color stability of wet-aged beef longissimus steaks. J. Food Sci. 84:38–50.
Mohrhauser, D. A., S. A. Kern, K. R. Underwood, and A. D. Weaver. 2013. Caspase-3 does not
enhance in vitro bovine myofibril degradation by µ-calpain. J. Anim. Sci. 91:5518–5524.
Momeni, H. R. 2011. Role of calpain in apoptosis. Cell J. 13:65–72.
Montilla, S. I. R., T. P. Johnson, S. C. Pearce, D. Gardan-Salmon, N. K. Gabler, J. W. Ross, R.
P. Rhoads, L. H. Baumgard, S. M. Lonergan, and J. T. Selsby. 2014. Heat stress causes
oxidative stress but not inflammatory signaling in porcine skeletal muscle. Temperature.
1:42–50.
Montuschi, P., P. J. Barnes, and L. J. Roberts. 2004. Isoprostanes: markers and mediators of
oxidative stress. FASEB J. 18:1791–1800.
Morrison, W. R., and L. M. Smith. 1964. Preparation of fatty acid methyl esters and
dimethylacetals from lipids. J. Lipid Res. 5:600–608.
Mottram, D. S. 1998. Flavour formation in meat and meat products: a review. Food Chem.
62:415–424.
Nade, T., K. Uchida, K. Omori, K. Matsubayashi, and N. Kimura. 2012. Effects of feeding dried
distillers grains with solubles (DDGS) on meat quality at the late stage of the fattening
period of Holstein steers. Anim. Sci. J. 83:310–317.
Nikolaidis, M. G., A. Kyparos, and I. S. Vrabas. 2011. F2-isoprostane formation, measurement
and interpretation: the role of exercise. Prog. Lipid Res. 50:89–103.
Nishimura, T., M. Ra Rhue, A. Okitani, and H. Kato. 1988. Components contributing to the
improvement of meat taste during storage. Agric. Biol. Chem. 52:2323–2330.
Nisoli, E., and M. O. Carruba. 2006. Nitric oxide and mitochondrial biogenesis. J. Cell Sci.
119:2855–2862.
Niu, Z. Y., Y. N. Min, J. J. Wang, Z. P. Wang, F. X. Wei, and F. Z. Liu. 2016. On oxidation
resistance and meat quality of broilers challenged with lipopolysaccharide. J. Appl.
104
Anim. Res. 44:215–220.
Okitani, A., U. Matsukura, H. Kato, and M. Fujimaki. 1980. Purification an some properties of a
myofibrillar protein-degrading protease, cathepsin L, from rabbit skeletal muscle. J.
Biochem. 87:1133–1143.
Osellame, L. D., T. S. Blacker, and M. R. Duchen. 2012. Cellular and molecular mechanisms of
mitochondrial function. Best Pract. Res. Clin. Endocrinol. Metab. 26:711–723.
Ott, M., V. Gogvadze, S. Orrenius, and B. Zhivotovsky. 2007. Mitochondria, oxidative stress and
cell death. Apoptosis. 12:913–922.
Ouali, A., M. Gagaoua, Y. Boudida, S. Becila, A. Boudjellal, C. H. Herrera-Mendez, and M. A.
Sentandreu. 2013. Biomarkers of meat tenderness: present knowledge and perspectives in
regards to our current understanding of the mechanisms involved. Meat Sci. 95:854–870.
Ouali, A., C. H. Herrera-Mendez, G. Coulis, S. Becila, A. Boudjellal, L. Aubry, and M. A.
Sentandreu. 2006. Revisiting the conversion of muscle into meat and the underlying
mechanisms. Meat Sci. 74:44–58.
Owen, O. E., K. J. Smalley, D. A. D’Alessio, M. A. Mozzoli, and E. K. Dawson. 1998. Protein,
fat, and carbohydrate requirements during starvation: anaplerosis and cataplerosis. Am. J.
Clin. Nutr. 68:12–34.
Packer, J. E., T. F. Slater, and R. L. Willson. 1979. Direct observation of a free radical
interaction between vitamin E and vitamin C. Nature. 278:737–738.
Pandurangan, M., and I. Hwang. 2012. The role of calpain in skeletal muscle. Animal Cells Syst.
(Seoul). 16:431–437.
Paradies, G., G. Petrosillo, M. Pistolese, and F. M. Ruggiero. 2001. Reactive oxygen species
generated by the mitochondrial respiratory chain affect the complex III activity via
cardiolipin peroxidation in beef-heart submitochondrial particles. Mitochondrion. 1:151–
159.
Parrish, F. C., C. J. Selvig, R. D. Culler, and M. G. Zeece. 1981. CAF Activity, calcium
concentration, Andy the 30,000�Dalton Component of Tough and Tender Bovine
Longissimus Muscle. J. Food Sci. 46:308–311.
Der Perng, M., L. Cairns, P. Van Den IJssel, A. Prescott, A. M. Hutcheson, and R. A. Quinlan.
1999. Intermediate filament interactions can be altered by HSP27 and αB-crystallin. J.
Cell Sci. 112:2099–2112.
Perry, D., J. M. Thompson, I. H. Hwang, A. Butchers, and A. F. Egan. 2001. Relationship
between objective measurements and taste panel assessment of beef quality. Aust. J. Exp.
Agric. 41:981–989.
Picard, B., M. Gagaoua, D. Micol, I. Cassar-Malek, J. F. Hocquette, and C. E. M. Terlouw. 2014.
Inverse relationships between biomarkers and beef tenderness according to contractile
and metabolic properties of the muscle. J. Agric. Food Chem. 62:9808–9818.
Platter, W. J., J. D. Tatum, K. E. Belk, P. L. Chapman, J. A. Scanga, and G. C. Smith. 2003.
Relationships of consumer sensory ratings, marbling score, and shear force value to
consumer acceptance of beef strip loin steaks. J. Anim. Sci. 81:2741–2750.
Poderoso, J. J., K. Helfenberger, and C. Poderoso. 2019. The effect of nitric oxide on
mitochondrial respiration. Nitric Oxide - Biol. Chem. 88:61–72.
Polati, R., M. Menini, E. Robotti, R. Millioni, E. Marengo, E. Novelli, S. Balzan, and D.
Cecconi. 2012. Proteomic changes involved in tenderization of bovine Longissimus dorsi
muscle during prolonged ageing. Food Chem. 135:2052–2069.
Ponnampalam, E. N., V. F. Burnett, S. Norng, R. D. Warner, and J. L. Jacobs. 2012. Vitamin E
105
and fatty acid content of lamb meat from perennial pasture or annual pasture systems
with supplements. Anim. Prod. Sci. 52:255–262.
Ponnampalam, Eric N., K. L. Butler, M. B. McDonagh, J. L. Jacobs, and D. L. Hopkins. 2012.
Relationship between muscle antioxidant status, forms of iron, polyunsaturated fatty
acids and functionality (retail colour) of meat in lambs. Meat Sci. 90:297–303.
Ponnampalam, E. N., D. L. Hopkins, K. Giri, J. L. Jacobs, T. Plozza, P. Lewandowski, and A.
Bekhit. 2017. The use of oxidative stress biomarkers in live animals (In vivo) to predict
meat quality deterioration postmortem (in vitro) caused by changes in muscle
biochemical components. J. Anim. Sci. 95:3012–3024.
Ponnampalam, E. N., R. D. Warner, F. R. Dunshea, and J. J. Cottrell. 2005. Infusion of nitric
oxide donors and inhibitors into lambs influences plasma metabolites, postmortem
muscle metabolites and meat quality. 51st Int. Congr. Meat Sci. Technol. 1444–1447.
Porter, A. G., and R. U. Jänicke. 1999. Emerging roles of caspase-3 in apoptosis. Cell Death
Differ. 6:99–104.
Powers, S. K., D. Criswell, J. Lawler, Li Li Ji, D. Martin, R. A. Herb, and G. Dudley. 1994.
Influence of exercise and fiber type on antioxidant enzyme activity in rat skeletal muscle.
Am. J. Physiol. - Regul. Integr. Comp. Physiol. 266.
Powers, S. K., L. L. Ji, A. N. Kavazis, and M. J. Jackson. 2011. Reactive oxygen species: impact
on skeletal muscle. Compr. Physiol. 1:941–969.
Pradhan, A. A., K. S. Rhee, and P. Hernández. 2000. Stability of catalase and its potential role in
lipid oxidation in meat. Meat Sci. 54:385–390.
Promeyrat, A., T. Sayd, E. Laville, C. Chambon, B. Lebret, and P. Gatellier. 2011. Early post-
mortem sarcoplasmic proteome of porcine muscle related to protein oxidation. Food
Chem. 127:1097–1104.
Ribeiro, F. A., K. I. Domenech-Pérez, C. J. Contreras-Castillo, E. K. Wilkerson, H. R. Voegele,
K. B. Hart, N. J. Herrera, and C. R. Calkins. 2018. Effects of dietary fat source on beef
strip loin steak display life. J. Anim. Sci. 96:2665–2674.
Ribeiro, F. A., K. I. Domenech-Ṕrez, C. J. Contreras-Castillo, K. Hart, N. J. Herrera, and C. R.
Calkins. 2019. Feeding distillers grains to cattle may affect beef tenderness early
postmortem. J. Anim. Sci. 97:657–668.
Roberts, L. J., and J. D. Morrow. 2000. Measurement of F2-isoprostanes as an index of oxidative
stress in vivo. Free Radic. Biol. Med. 28:505–513.
Rossi, A. E., S. Boncompagni, and R. T. Dirksen. 2009. Sarcoplasmic reticulum-mitochondrial
symbiosis: bidirectional signaling in skeletal muscle. Exerc. Sport Sci. Rev. 37:29–35.
Rossi, A. E., and R. T. Dirksen. 2006. Sarcoplasmic reticulum: the dynamic calcium governor of
muscle. Muscle and Nerve. 33:715–731.
Ryan, M. J., H. J. Dudash, M. Docherty, K. B. Geronilla, B. A. Baker, G. G. Haff, R. G. Cutlip,
and S. E. Alway. 2010. Vitamin E and C supplementation reduces oxidative stress,
improves antioxidant enzymes and positive muscle work in chronically loaded muscles of
aged rats. Exp. Gerontol. 45:882–895.
Sales, J., and V. Koukolová. 2011. Dietary vitamin E and lipid and color stability of beef and
pork: modeling of relationships. J. Anim. Sci. 89:2836–2848.
Santé-Lhoutellier, V., E. Engel, L. Aubry, and P. Gatellier. 2008. Effect of animal (lamb) diet
and meat storage on myofibrillar protein oxidation and in vitro digestibility. Meat Sci.
79:777–783.
Santo-Domingo, J., and N. Demaurex. 2010. Calcium uptake mechanisms of mitochondria.
106
Biochim. Biophys. Acta - Bioenerg. 1797:907–912.
Schenkel, L. C., and M. Bakovic. 2014. Formation and regulation of mitochondrial membranes.
Int. J. Cell Biol. 2014:1–13.
Scicchitano, B. M., L. Pelosi, G. Sica, and A. Musarò. 2018. The physiopathologic role of
oxidative stress in skeletal muscle. Mech. Ageing Dev. 170:37–44.
Senaratne, L. S. 2012. Mechanism and control of beef toughening during retail display in high
oxygen modified atmosphere packages. Diss. Digit. Commons. Univ. Nebraska-Lincoln.
Sierra, V., and M. Olivan. 2013. Role of mitochondria on muscle cell death and meat
tenderization. Recent Pat. Endocr. Metab. Immune Drug Discov. 7:120–129.
Slimen, I. B., T. Najar, A. Ghram, H. Dabbebi, M. Ben Mrad, and M. Abdrabbah. 2014. Reactive
oxygen species, heat stress and oxidative-induced mitochondrial damage. a review. Int. J.
Hyperth. 30:513–523.
Soladoye, O. P., M. L. Juárez, J. L. Aalhus, P. Shand, and M. Estévez. 2015. Protein oxidation in
processed meat: mechanisms and potential implications on human health. Compr. Rev.
Food Sci. Food Saf. 14:106–122.
Son, Y., Y.-K. Cheong, N.-H. Kim, H.-T. Chung, D. G. Kang, and H.-O. Pae. 2011. Mitogen-
activated protein kinases and reactive oxygen species: how can ROS activate MAPK
pathways? J. Signal Transduct. 2011:1–6.
De Souza Rodrigues, R. T., M. L. Chizzotti, C. E. Vital, M. C. Baracat-Pereira, E. Barros, K. C.
Busato, R. A. Gomes, M. M. Ladeira, and T. Da Silva Martins. 2017. Differences in beef
quality between angus (bos taurus taurus) and nellore (bos taurus indicus) cattle through a
proteomic and phosphoproteomic approach. PLoS One. 12:1–21.
Srikandakumar, A., E. H. Johnson, and O. Mahgoub. 2003. Effect of heat stress on respiratory
rate, rectal temperature and blood chemistry in Omani and Australian Merino sheep.
Small Rumin. Res. 49:193–198.
Stadtman, E. R., and R. L. Levine. 2003. Free radical-mediated oxidation of free amino acids and
amino acid residues in proteins. Amino Acids. 25:207–218.
Stafforini, D. M., J. R. Sheller, T. S. Blackwell, A. Sapirstein, F. E. Yull, T. M. McIntyre, J. V.
Bonventre, S. M. Prescott, and L. J. Roberts. 2006. Release of free F2-isoprostanes from
esterified phospholipids is catalyzed by intracellular and plasma platelet-activating factor
acetylhydrolases. J. Biol. Chem. 281:4616–4623.
Stamler, J. S., and G. Meissner. 2001. Physiology of nitric oxide in skeletal muscle. Physiol.
Rev. 81:209–237.
Stanley, D. W., and K. L. Parkin. 1991. Biological membrane deterioration and associated
quality losses in food tissues. Crit. Rev. Food Sci. Nutr. 30:487–553.
Stark, G. 2005. Functional consequences of oxidative membrane damage. J. Membr. Biol.
205:1–16.
Starkey, C. P., G. H. Geesink, D. Collins, V. Hutton Oddy, and D. L. Hopkins. 2016. Do
sarcomere length, collagen content, pH, intramuscular fat and desmin degradation explain
variation in the tenderness of three ovine muscles? Meat Sci. 113:51–58.
Starkey, C. P., G. H. Geesink, V. H. Oddy, and D. L. Hopkins. 2015. Explaining the variation in
lamb longissimus shear force across and within ageing periods using protein degradation,
sarcomere length and collagen characteristics. Meat Sci. 105:32–37.
Sternberg, E. M. 2007. Neural regulation of innate immunity. Nature. 6:318–328.
Straadt, I. K., M. D. Aaslyng, and H. C. Bertram. 2014. An NMR-based metabolomics study of
pork from different crossbreeds and relation to sensory perception. Meat Sci. 96:719–
107
728.
Strano, M. S., M. Zheng, A. Jagota, G. B. Onoa, D. A. Heller, P. W. Barone, and M. L. Usrey.
2004. Understanding the nature of the DNA-assisted separation of single-walled carbon
nanotubes using fluorescence and raman spectroscopy. Nano Lett. 4:543–550.
Suliman, H. B., K. E. Welty-Wolf, M. Carraway, L. Tatro, and C. A. Piantadosi. 2004.
Lipopolysaccharide induces oxidative cardiac mitochondrial damage and biogenesis.
Cardiovasc. Res. 64:279–288.
Suman, S. P., M. C. Hunt, M. N. Nair, and G. Rentfrow. 2014. Improving beef color stability:
practical strategies and underlying mechanisms. Meat Sci. 98:490–504.
Suster, D., E. N. Ponnampalam, J. J. Cottrell, and R. D. Warner. 2005. Timing of nitric oxide
inhibition pre-slaughter influences lamb meat tenderness and proteolysis. Congr. Int. Sci.
Meat. 210–213.
Taylor, R. G., G. H. Geesink, V. F. Thompson, M. Koohmaraie, and D. E. Goll. 1995. Is Z-disk
degradation responsible for postmortem tenderization? J. Anim. Sci. 73:1351–1367.
Tengan, C. H., G. S. Rodrigues, and R. O. Godinho. 2012. Nitric oxide in skeletal muscle: Role
on mitochondrial biogenesis and function. Int. J. Mol. Sci. 13:17160–17184.
Terevinto, A., A. Ramos, G. Castroman, M. C. Cabrera, and A. Saadoun. 2010. Oxidative status,
in vitro iron-induced lipid oxidation and superoxide dismutase, catalase and glutathione
peroxidase activities in rhea meat. Meat Sci. 84:706–710.
Toyoshima, C., and G. Inesi. 2004. Structural basis of ion pumping by Ca 2+ -ATPase of the
sarcoplasmic reticulum. Annu. Rev. Biochem. 73:269–292.
Tsutsui, H., S. Kinugawa, and S. Matsushima. 2011. Oxidative stress and heart failure. Am. J.
Physiol. - Hear. Circ. Physiol. 301:2181–2190.
Wang, K. K. W. 2000. Calpain and caspase: can you tell the difference? Cell Press. 23:20–26.
Wang, K. K. W., R. Posmantur, R. Nadimpalli, R. Nath, P. Mohan, R. A. Nixon, R. V. Talanian,
M. Keegan, L. Herzog, and H. Allen. 1998. Caspase-mediated fragmentation of calpain
inhibitor protein calpastatin during apoptosis. Arch. Biochem. Biophys. 356:187–196.
Wang, L. L., Q. L. Yu, L. Han, X. L. Ma, R. De Song, S. N. Zhao, and W. H. Zhang. 2018.
Study on the effect of reactive oxygen species-mediated oxidative stress on the activation
of mitochondrial apoptosis and the tenderness of yak meat. Food Chem. 244:394–402.
Wang, P. G., M. Xian, X. Tang, X. Wu, Z. Wen, T. Cai, and A. J. Janczuk. 2002. Nitric oxide
donors: chemical activities and biological applications. Chem. Rev. 102:1091–1134.
Warner, R. D., F. R. Dunshea, E. N. Ponnampalam, and J. J. Cottrell. 2005. Effects of nitric
oxide and oxidation in vivo and postmortem on meat tenderness. Meat Sci. 71:205–217.
Wong, Dominic, W. S. 1989. Mechanism and theory in food chemistry. Van Nostrand, New
York.
Wood, J. D., R. I. Richardson, G. R. Nute, A. V. Fisher, M. M. Campo, E. Kasapidou, P. R.
Sheard, and M. Enser. 2004. Effects of fatty acids on meat quality: a review. Meat Sci.
66:21–32.
Xia, R., J. A. Webb, L. L. M. Gnall, K. Cutler, and J. J. Abramson. 2003. Skeletal muscle
sarcoplasmic reticulum contains a NADH-dependent oxidase that generates superoxide.
Am. J. Physiol. - Cell Physiol. 285:215–221.
Xing, T., F. Gao, R. K. Tume, G. Zhou, and X. Xu. 2019. Stress effects on meat quality: a
mechanistic perspective. Compr. Rev. Food Sci. Food Saf. 18:380–401.
Yang, X., Y. Guo, X. He, J. Yuan, Y. Yang, and Z. Wang. 2008. Growth performance and
immune responses in chickens after challenge with lipopolysaccharide and modulation by
108
dietary different oils. Animal. 2:216–223.
Yates, D. T., C. A. Löest, T. T. Ross, D. M. Hallford, B. H. Carter, and S. W. Limesand. 2011.
Effects of bacterial lipopolysaccharide injection on white blood cell counts,
hematological variables, and serum glucose, insulin, and cortisol concentrations in ewes
fed low- or high-protein diets. J. Anim. Sci. 89:4286–4293.
Ying, J., N. Clavreul, M. Sethuraman, T. Adachi, and R. A. Cohen. 2007. Thiol oxidation in
signaling and response to stress: detection and quantification of physiological and
pathophysiological thiol modifications. Free Radic. Biol. Med. 43:1099–1108.
Zámocký, M., and F. Koller. 1999. Understanding the structure and function of catalases: clues
from molecular evolution and in vitro mutagenesis. Prog. Biophys. Mol. Biol. 72:19–66.
Zamora, F., L. Aubry, T. Sayd, J. Lepetit, A. Lebert, M. A. Sentandreu, and A. Ouali. 2005.
Serine peptidase inhibitors, the best predictor of beef ageing amongst a large set of
quantitative variables. Meat Sci. 71:730–742.
Zhang, C., R. Liu, A. Wang, D. Kang, G. Zhou, and W. Zhang. 2018. Regulation of calpain-1
activity and protein proteolysis by protein nitrosylation in postmortem beef. Meat Sci.
141:44–49.
Zhang, J., A. A. Boghossian, P. W. Barone, A. Rwei, J. H. Kim, D. Lin, D. A. Heller, A. J.
Hilmer, N. Nair, N. F. Reuel, and M. S. Strano. 2011. Single molecule detection of nitric
oxide enabled by d(AT)15 DNA adsorbed to near infrared fluorescent single-walled
carbon nanotubes. J. Am. Chem. Soc. 133:567–581.
Zhang, L., J. Kelley, G. Schmeisser, Y. M. Kobayashi, and L. R. Jones. 1997. Complex
formation between junctin, triadin, calsequestrin, and the ryanodine receptor: proteins of
the cardiac junctional sarcoplasmic reticulum membrane. J. Biol. Chem. 272:23389–
23397.
Zhang, W., S. Xiao, E. J. Lee, and D. U. Ahn. 2011. Consumption of oxidized oil increases
oxidative stress in broilers and affects the quality of breast meat. J. Agric. Food Chem.
59:969–974.
Zhao, J. X., Q. Li, R. X. Zhang, W. Z. Liu, Y. S. Ren, C. X. Zhang, and J. X. Zhang. 2018.
Effect of dietary grape pomace on growth performance, meat quality and antioxidant
activity in ram lambs. Anim. Feed Sci. Technol. 236:76–85.
Zorov, D. B., C. R. Filburn, L. O. Klotz, J. L. Zweier, and S. J. Sollott. 2000. Reactive oxygen
species (ROS)-induced ROS release: A new phenomenon accompanying induction of the
mitochondrial permeability transition in cardiac myocytes. J. Exp. Med. 192:1001–1014.
109
Oxidative Stress as a measure of Postmortem Meat Quality
N.J. Herrera, N.A. Bland, F.A. Ribeiro, M.L. Henriott, and C.R. Calkins1
Department of Animal Science, University of Nebraska-Lincoln, Lincoln, NE 68583-
0908
The authors would like to thank all the past and current graduate and undergraduate
students who helped with this project.
1Corresponding author: [email protected]
110
Abstract
The objective of this study was to evaluate the effects of different levels of
lipopolysaccharide (LPS)-mediated oxidative stress on fresh meat quality. Crossbred
lambs (n = 29) were blocked by weight and fed a standard finishing ration for the
duration of the study. Lambs were individually housed, and treatment groups were
administered one of three injections every 72 hours across a three-injection (9-day) cycle:
a saline control (Control), 50 ng LPS/kg bodyweight (LPS50), or 100 ng LPS/kg
bodyweight (LPS100). Rectal temperatures were measured to indicate inflammatory
response. Lambs were harvested at the Loeffel Meat Laboratory, and 80 mg of pre-rigor
Longissimus lumborum were collected in Control and LPS100 treatments within thirty
minutes postmortem for RNA analysis. Loins were split and randomly assigned for 1 or
14 d of aging. Chops were fabricated after aging and placed under retail display (RD)
conditions for 0 or 7 d. Animal was the experimental unit. Lipopolysaccharide-treated
lambs had increased (P < 0.05) rectal temperatures at 1, 2, 4, and 24 h post-injection.
Transcriptomics exhibited significant (Praw < 0.05) upregulation in RNA pathways related
to generation of oxidative stress in LPS100 compared to Control. A trend was found for
tenderness (Warner-Bratzler shear) (P = 0.10), with chops from LPS50 having a lower
shear force compared with Control at 1 d postmortem. The LPS50 treatment exhibited
greater troponin T degradation (P = 0.02) compared to all treatments at 1 d. Aging
decreased WBSF (P < 0.0001), increased free calcium concentration (P < 0.0001), pH (P
< 0.0001), and proteolytic degradation (P < 0.0001) across all treatments. After 7 d of
RD, following aging periods, chops increased discoloration as RD increased (P <
111
0.0001), with Control chops aged for 14 d being the most discolored. Chops from lambs
given LPS had higher (P < 0.05) a* values compared to control at 14 d of aging. The L*
values were greater (P < 0.05) in LPS100 compared to both LPS50 and Control. Aging
tended (P = 0.0608) to increased lipid oxidation (TBARS) during RD across either aging
period. There were no significant differences (P > 0.05) in sarcomere length, proximate
composition, fatty acid composition, or isoprostane content. These results suggest that
defined upregulation of oxidative stress has no detriment on fresh meat color, but may
alter biological pathways responsible for muscle composition and enzymatic processes,
resulting in changes in tenderness early postmortem.
Key words: apoptosis, color stability, lamb, meat quality, oxidative stress, tenderization
Introduction
During postmortem aging, the tenderization of muscle relies on several biological
mechanisms, including endogenous enzymes, such as calpains, caspases, and
proteasomes (Ouali et al., 2006; Bhat et al., 2018). These endogenous mechanisms
activate early postmortem with the utilization of free calcium released from mitochondria
and sarcoplasmic reticulum(Rossi and Dirksen, 2006; Santo-Domingo and Demaurex,
2010). With regards to postmortem aging, an increasing number of investigations have
focused on the influence of apoptosis on meat quality. Kemp and Parr (2012) indicated
apoptotic events can contribute to proteolytic degradation of many structural proteins
during muscle aging.
Apoptosis is the mechanism responsible for regulated cell death, portrayed by
multiple biochemical and molecular pathways (Sierra and Olivan, 2013). This intrinsic
112
mechanism involves mitochondria, as increased apoptotic events promote mitophagy, as
indicated by the release of cytochrome c from the mitochondrial membrane into the
cytoplasm (Ott et al., 2007; Kagan et al., 2009; Ke et al., 2017). Cytosolic cytochrome c
binds to Apaf-1 genes, responsible for initiating enzymatic proteins, to produce
apoptosomes, large quaternary proteins used to initiate caspase systems and begin
proteolytic events (Porter and Jänicke, 1999; Momeni, 2011). Initiation of apoptotic
activity has been linked to oxidative stress-mediated events (Slimen et al., 2014).
The onset of oxidative stress results from the overwhelming production of
reactive oxygen species (ROS) compared to homeostatic endogenous antioxidants present
within the system (Powers et al., 2011). As the name implies, ROS are highly reactive
substances primarily produced as by-products during oxidative phosphorylation (Paradies
et al., 2001). Additionally, ROS act as signaling molecules to upregulate a homeostatic
response (Dröge, 2002). This action facilitates antioxidant enzymes (superoxide
dismutase, catalase, glutathione) capable of changing ROS to more stable products within
muscle cells. However, conditions of oxidative stress overwhelm antioxidant function,
allowing ROS to alter protein, lipid, or nucleic acid morphology and functionality (Bekhit
et al., 2013). Concurrently, ROS can interact with nitrosative species (nitric oxide),
producing hybrid radicals which can target proteins responsible for organelle function
(Stamler and Meissner, 2001). Given the right conditions, oxidative stress factors have
been theorized to impact muscle cells and create conditions critical to meat quality.
Intrinsic and extrinsic conditions promoting oxidative stress have been implicated
to alter meat quality (Warner et al., 2005; Ponnampalam et al., 2017; Wang et al., 2018;
Mitacek et al., 2019). However, there is inconsistency within the literature describing the

113
impact of oxidative stress factors on meat quality, as this phenomenon is theorized to be
dependent on a multitude of factors. These factors include degree and duration of
oxidative stress, source of oxidative stress generation (in vivo vs in vitro), the influence of
individual oxidative and nitrosative species on cellular constituents, and composition of
muscle tissue (Cottrell et al., 2015; Niu et al., 2016; Ke et al., 2017; Wang et al., 2018).
Concurrently, there is a gap in the literature relating specific genetic pathways and their
oxidative stress-mediated regulation on the impact of meat quality.
The mechanism of meat tenderization is well-recognized. However, the impact of
oxidative stress on skeletal muscle, and its influence on factors critical to meat quality
has yet to be understood. Additionally, the impact of oxidative stress and its relationship
towards the muscle transcriptome are not fully understood. Therefore, the objective of
this study was to evaluate the effects of controlled oxidative stress in vivo on oxidative
biomarkers within the muscle transcriptome and meat quality attributes, including
tenderness, color stability, and lipid oxidation.
Materials and Methods
All animal use protocols were approved by the University of Nebraska-Lincoln’s
Institutional Animal Care and Use Committee [Protocol No. 1751].
Lambs
A total of 29 cross-bred (Hampshire x Dorset x Polypay) wethers (initial BW = 29
± 2.68 kg) were group housed (University of Nebraska Life Sciences Annex in Lincoln,
NE) for 42 days on a standard finishing ration (Appendix I) developed at Eastern
114
Nebraska Research and Extension Center (ENREC; Mead, NE). After the acclimation
period, lambs were blocked and stratified by BW prior to being randomly assigned to a
treatment. Lambs were individually fed according to BW to maintain a 0.34kg/day
weight gain for the remainder of the in vivo analysis.
Lipopolysaccharide treatments
Lambs were randomly assigned a 2 mL intravenous injection of either saline
control (Control), 50ng LPS/kg BW (LPS50) or 100ng LPS/kg BW (LPS100) treatment
group. Concentrations of lipopolysaccharide O111: B4 (L2630; Sigma-Aldrich) were
determined based on previous research performed at University of Nebraska-Lincoln
using sheep as a model for LPS injections. Three injections were administered across a
12-day immune challenge, with a subsequent injection occurring after every 72 h period.
Injection times were partitioned across the 12-day immune challenge, with two sets of
14-15 lambs being administered in each group. Two immune challenge groups were
completed with lambs blocked by BW to determine which cycle they would participate,
allowing all animals to reach consistent final BW prior to harvest. All methods of live
animal handling were approved by UNL Institutional Animal Care and Use Committee
(IACUC).
Rectal temperatures
Rectal temperatures and respiration rates were measured at time 0, 1, 2, 4, 8, 12,
24, 48, and 72 h post-injection time (0600 h). Lambs were secured on a trim stand prior
to taking readings. Rectal temperature was completed using a Vicks® Thermometer
115
(ComfortFlex®, V966US, Marlborough, MA) by inserting 2.54cm in from the tip of the
anus to the rectum of the lamb and held for 10 s. Temperatures were recorded as degrees
Centigrade.
Muscle Sample collection
Upon completion of the final 72 h cycle, lambs were held 48 h prior to slaughter,
then transported to the Loeffel Meat Lab (Lincoln, NE). Within 30 min of
exsanguination, an 80 mg pre-rigor sample taken from the posterior end of the
Longissimus lumborum from Control and LPS100 treatment groups. Samples were
extracted using a scalpel blade sterilized in ethanol in between sampling (Feather Safety
Razor Co. LTD., No. 11 2976, Osaka, Japan). Pre-rigor samples were removed of
exterior fat and connective tissue, then placed in a 2 mL cryotube (Cryogenic Vial
CryoClear 3012 Globe Scientific, Mahwah, N.J.) and frozen for future analysis (-80°C).
The carcasses were tagged with a university number that corresponded to the animal and
lab ID, then chilled for 24 h.
Fabrication
After 24 h postmortem, carcasses were fabricated and the loin portion from the 9th
rib to the last lumbar vertebrae was retained. Each loin section was split down the spine
using a band-saw (Biro MFG. Co., Model 3334, Marblehead, OH). Within each animal,
sides were randomly assigned to one of two aging periods (1 or 14 d). Longissimus
muscle was deboned and removed of excess subcutaneous fat. Beginning at the posterior
end, one 5.08 cm chop was cut and utilized for all laboratory analysis at each aging

116
period. One 2.54 cm chop at each aging period was utilized for analysis of pH and
proximate composition. Three 2.54 cm chops were fabricated adjacent to one another for
each aging period and analyzed for tenderness using Warner-Bratzler shear force for 0 d
retail display. One 2.54 cm chop was cut to measure lipid and protein oxidation for 0 d of
RD. One 2.54 cm chop at each aging period was trimmed of all subcutaneous fat, and
utilized to measure visual discoloration, objective color, lipid oxidation, and protein
oxidation for 7 d of RD. Lastly, a 2.54 cm chop was cut at the most anterior point of the
primal and was used as extra laboratory analysis sample. At d 1 aging, chops for
laboratory analysis, pH and proximate composition, extra laboratory analysis were
vacuum packaged (MULTIVAC 500, Multivac, Inc., Kansas City, MO) in Prime Source
Vacuum pouches (3 mil STD barrier, Prime Sources, St. Louis, MO). Chops for
laboratory analysis, pH and proximate composition were frozen for further analysis (-
80°C). The remaining halved portion of loins were lined with Boneguard (Boneguard
Traditional Perforated, JVR Industries, Lancaster, NY), vacuum packaged, and aged
(2°C) under dark storage for 14 days total. All chops were separated from the loin
starting from the anterior end of the loin. The same fabrication map (Appendix II) was
used for all aging periods. For both aging periods, samples for color, lipid, and protein
oxidation analysis were placed on foam trays (21.6 x 15.9 x 2.1 cm, Styro-Tech, Denver,
CO) and overwrapped with an oxygen permeable film (Prime Source PSM 18
#75003815, Bunzl Processors Division, North Kansas City, MO) Trays were placed
under simulated RD conditions for 7 d (3°C under white fluorescence lighting at 1000 to
1800 lux) and randomly rotated daily. All frozen steaks utilized for laboratory analysis
and lipid/ protein oxidation were tempered enough to finely dice, freeze in liquid nitrogen

117
and then powdered in a metal cup blender (Model 51BL32, Waring Commercial,
Torrington, CT) on May 13/14 and July 26, 2019 and held for 11d and 23d respectively,
at -80°C until further analysis.
RNA transcriptomics
Total RNA isolation from muscle was completed using the RNeasy Fibrous
Tissue Mini Kit (QIAGEN, #74704, Hilden, Germany) and RNase-Free DNase Set
(QIAGEN, #79254, Hilden, Germany). Utilize RNaseZap prior to start of RNA isolation
to remove RNase from all work stations. Less than 30 mg of frozen pre-rigor muscle was
weighed and added to a 1.5 mL microcentrifuge tube. Tissue was vortexed in 300 µL of
RLT solution (3 µL β-mercaptoethanol mixed with 300 µL of Buffer RLT) for up to 30 s
and then homogenized with a hand-held pestle for another 30 s. 10 µL of Proteinase K
solution and 590 µL of RNase-free water were mixed thoroughly by pipetting and added
to the sample. The sample solution was incubated at 55°C for 10 min then centrifuged for
3 min at 10,000 x g. Approximately 900 µL of supernatant was transferred into a 2 mL
microcentrifuge tube, while avoiding transfer of pellet. Half the supernatant volume in
100% ethanol was added to the cleared lysate and mixed by pipetting. 700 µL of the
sample was transferred to an RNeasy Mini spin column placed in a 2 mL collection tube.
Samples were centrifuged for 15 s at 8,000 x g. Flow-through was discarded. The rest of
the sample was transferred to the column and re-centrifuged. Three-hundred fifty µL of
Buffer RW1 was added to the spin column and centrifuged for 15 s at 8,000 x g. The
flow-through was discarded. 10 µL of DNase I stock solution (prepared using the
handbook instructions) was added to 70 µL Buffer RDD and mixed by inverting the tube.
118
DNase I incubation mix (80 µL) was added directly to the spin column membrane, and
incubated at room temperature for 15 min. 350 µL of Buffer RW1 was added to the spin
column and centrifuged for 15 s at 8,000 x g. Filtered soltuion was discarded. Five-
hundred µL of Buffer RPE was added to the spin column and centrifuged for 15 s at
8,000 x g. Filtered solution was discarded. 500 µL of Buffer RPE was added to the spin
column and centrifuged for 2 min at 8,000 x g. The spin column was placed into a new 2
mL collection tube and centrifuged for 1 min at 14,000 x g. The spin column was placed
in a 1.5 mL microcentrifuge tube. 50 µL of RNase-free water was directly added to the
spin column membrane and centrifuged for 1 min at 8,000 x g. Samples were sent to the
University of Nebraska-Medical Center (Next Generation Sequencing, Genome Core
Facility, Omaha, NE, USA) for poly-A+ library preparation and sequencing (150bp
paired-end).
Resulting data were quality trimmed using Trim Galore! , and aligned to the
Oar_rambouillet_v1.0 reference genome STAR (Dobin et al., 2016). Differential
expression (control vs LPS treatment) was evaluated using transcript counts in DESeq2
(Love et al., 2014). Loci with Padj<0.05 were considered to be differentially expressed;
those with Praw<0.05 were utilized for pathway exploration in Ingenuity Pathway
Analysis (Qiagen).
Warner-Bratzler shear force (WBSF)
Three chops (2.54 cm) from each side were measured for tenderness via Warner-
Bratzler Shear Force (WBSF) per sample. Internal temperatures were measured prior to
cooking using a quick disconnect T-type thermocouple (TMQSS-062U-6, OMEGA
119
Engineering, Inc., Stamford, CT) with a handheld thermometer (OMEGA 450-ATT,
OMEGA Engineering, Inc., Stamford, CT) in geometric center of steaks. Weights of
chops were collected prior to cooking using a precision balance scale (PL6001E, Mettler
Toledo, Hogentogler and Co. Inc., Columbia, MO). All chops were cooked to an internal
temperature of 35°C and turned over until they reached a target temperature of 70°C on
an electric indoor grill (Hamilton Beach-31605A, Hamilton Beach Brands, Glen Allen,
VA). After cooking, final weights were recorded. The steak was then bagged (PB-90-C,
.85 mil., 6x3x15in. PITT PLASTICS, Pittsburg, KS) and stored overnight at 2°C. The
following day, 2 (1.27 cm diameter) cores per chop were removed with a drill press
parallel to muscle fibers and sheared using a Food Texture Analyzer (TMS-Pro, Food
Technology Corp., Sterling, VA.) with a triangular Warner-Bratzler blade. The mean of 6
cores was calculated for statistical analysis.
Troponin T
Troponin T degradation was quantified according to the procedure described by
Chao et al. (2018) with modifications. Three grams of powdered meat was homogenized
with 15 mL of ice-cold rigor buffer (0.1M KCl, 2mM MgCl2, 1mM EDTA, and 10mM
K2HPO4; pH 7.4) using a polytron (POLYTRON Kinimatica CH-6010, Switzerland) at
medium speed for 5 s bursts for 30 s. Homogenate was filtered through a double-layered
cheese cloth and 1.4 mL of homogenate was placed into an Eppendorf tube (2mL safe-
lock tube; 02236352, Eppendorf AG, Hamburg, Germany). Tubes were centrifuged at
4,000 x g for 5 min at 4°C. Supernatant was decanted and pellet was resuspended in 1 mL
of rigor buffer. Samples were centrifuged at 4,000 x g for 5 min two additional times.
120
Supernatent was decanted and the suspended pellet was mixed in 1 mL suspension buffer
(0.1M Tris-Base, 1.25mM EDTA, 5% SDS; pH 8) and centrifuged at 4,000 x g for 5 min.
Protein concentration was determined using a Pierce bicinchoninic acid protein assay kit
(Pierce Biotechnology, Rockford, IL, USA). All samples were diluted to 2 mg
protein/mL with deionized-distilled water and 2x Laemmli buffer (65.8mM Tris-HCl,
2.1% SDS, 26.3% glycerol, 0.01% bromophenol blue) with 2% betamercaptoethanol
(1:50) and put on a heating block at 95°C for 5 min. 20µL of sample were loaded on 4-
20% Mini-PROTEAN TGX™ precast polyacrylamide gels (Bio-Rad Laboratories,
Hercules, CA, USA) with a 10µL pre-stained standard (Precision Plus Protein
Kaleidoscope, #1610375, Bio Rad, Hercules, CA) using a Bio-Rad Mini-PROTEIN 2
Cells system (Bio-Rad Laboratories). The system was run at constant voltage of 200V for
60 min with an electrophoresis buffer (1xTris/Glycine/SDS, #161-0732, Bio-Rad
Laboratories, Hercules, CA, USA). Proteins in the gels were blotted to polyvinylidene
difluoride membranes (0.45µm, Immobion-FL transfer membrane; Millipore) using a
Bio-Rad Mini-Trans-Blot Electrophoretic transfer cell (Bio-Rad Laboratories) for 60 min
at a constant amperage of 180mA with ice-cold transfer buffer (25mM Tris-base, 192mM
Glycine, 20% methanol; pH at 9.2). Membranes were blocked for 2 h in Odyssey
Blocking Buffer (LI-COR, Lincoln, NE, USA) and incubated for 60 min at room
temperature in monoclonal anti-troponin-T antibody (JLT-12; Sigma-Aldrich, St. Louis,
MO, USA) at a dilution of 1:10,000 in Odyssey blocking buffer containing 0.2%
TWEEN-20 and 5% non-fat dry milk. Membranes were incubated overnight at 4°C and
then washed three times with Tris Buffered Saline containing 0.2% TWEEN-20 (TBST)
for 10 min. Membranes were incubated in IRDye 680 LT Conjugated Goat Anti-Mouse

121
IgG1 secondary antibody (LI-COR) at a dilution of 1: 10,000 in Odyssey blocking buffer
containing 0.2% TWEEN-20 for 60 min. Membranes were washed three times with
TBST and scanned using Odyssey Infrared Imaging system (LI-COR) at 700nm.
Degradation was evaluated by quantifying band intensities (k. pixels) using Odyssey
application software version 1.1. Bands ranging from 38 and 35kDa were designated as
intact and bands ranging from 30 to 28kDa were designated as degraded. Percent
degradation was calculated by (intensity of degraded bands/intensity of intact
bands)*100.
Desmin
Three grams of powdered meat were homogenized with 15 mL of whole muscle
solubilization buffer (2%wt/vol SDS, 10mM sodium phosphate buffer; pH 7.0) using a
polytron (POLYTRON Kinimatica CH-6010, Switzerland) at medium speed for 5 s
bursts for 30 s. Homogenate was filtered through a double-layered cheese cloth and 1.4
mL of homogenate was placed into an Eppendorf tube (2mL safe-lock tube; 02236352,
Eppendorf AG, Hamburg, Germany). Tubes were centrifuged at 1,500 x g for 15 min at
25°C to remove traces of insoluble components. 1 mL of supernatant was collected and
into a 1.5 mL eppendorf tube. Protein concentration was determined using a Pierce
bicinchoninic acid protein assay kit (Pierce Biotechnology, Rockford, IL, USA). All
samples were diluted to 6.4 mg protein /mL using whole muscle solubilizing buffer.
Samples were diluted to a final concentration of 4mg protein/mL with 50% of gel buffer
(3mM EDTA, 3% wt/vol SDS, 30% vol/vol glycerol, 0.001% wt/vol pyronin Y, and
30mM Tris-HCl; pH 8.0) and 10% of betamercaptoethanol and then heated on a block for
122
15 min at 50°C. 30µL of samples were loaded on 4-20% Mini-PROTEAN TGX™
precast polyacrylamide gels (Bio-Rad Laboratories, Hercules, CA, USA) with a 10µL
pre-stained standard (Precision Plus Protein Kaleidoscope, #1610375, Bio Rad, Hercules,
CA) using a Bio-Rad Mini-PROTEIN 2 Cells system (Bio-Rad Laboratories). The system
was run at constant voltage of 360V for 45 min with an electrophoresis buffer
(1xTris/Glycine/SDS, #161-0732, Bio-Rad Laboratories, Hercules, CA, USA). Proteins
in the gels were blotted to polyvinylidene difluoride membranes (0.45µm, Immobion-FL
transfer membrane; Millipore) using a Bio-Rad Mini-Trans-Blot Electrophoretic transfer
cell (Bio-Rad Laboratories) for 90 min at a constant voltage of 90Vwith ice-cold transfer
buffer (25mM Tris-base, 192mM Glycine, 20% methanol; pH at 9.2). Membranes were
blocked for 60 min in Odyssey Blocking Buffer (LI-COR, Lincoln, NE, USA) and
incubated for 60 min at room temperature in monoclonal anti-desmin antibody (DE-U-10
Sigma-Aldrich, St. Louis, MO, USA) at a dilution of 1:10,000 in Odyssey blocking
buffer containing 0.2% TWEEN-20 and 5% non-fat dry milk. Membranes were incubated
overnight at 4°C, then washed three time with Tris Buffered Saline containing 0.2%
TWEEN-20 (TBST) for 10 min and incubated in IRDye 680 LT Conjugated Goat Anti-
Mouse IgG1 secondary antibody (LI-COR) at a dilution of 1: 10,000 in Odyssey blocking
buffer containing 0.2% TWEEN-20 for 60 min. Membranes were washed three times
with TBST and scanned using Odyssey Infrared Imaging system (LI-COR) at 700nm.
Degradation was evaluated by quantifying band intensities (k. pixels) using Odyssey
application software version 1.1. Bands at 55kDa were designated as intact and bands at
38kDa were designated as degraded. Percent degradation was calculated by (intensity of
degraded bands/intensity of intact bands)* 100.
123
Free calcium concentration
Free calcium was quantified according to the procedure described by Parrish et al.
(1981)with modifications. Three grams of powdered sample were centrifuged at 196,000
x g (Beckman Optima XPN-90 Ultracentrifuge, Type 50.2 Ti rotor, Beckman Coulter,
Brea, CA) at 4°C for 30 min. Seven hundred µL of the supernatant were collected and
treated with 0.1 mL of 27.5 trichloroacetic acid (TCA). Samples were centrifuged at
6,000 x g (accuSpin Micro 17R, ThermoFisher Scientific, Waltham, MA) for 10 min at
4°C. Four hundred µL of supernatant were transferred to a syringe, and the volume was
brought to 4 mL with deionized, distilled water. The diluted sample was filtered through
a 13 mm diameter Millex-LG 0.20 µm syringe filter (Milliore, Bedford, MA). Calcium
concentration was quantified at Ward Laboratories (Kearney, NE) using an inductively-
coupled plasma emission spectrometer (iCAP 6500 Radial; Thermo Electron, Cambridge,
UK) with an appropriate calcium concentration standard.
Isoprostanes
All analysis were completed using OxiSelect™ 8-iso-Prostaglandin F2aplha
ELISA Kit (Cell BioLabs, INC., STA-337, San Diego, CA). Thirty mg of powdered meat
were weighed in a 5 mL eppendorf tube. Samples were homogenized in 2 mL of 2N
NaOH using a Micropolytron (Pro-Scientific200, Bio-Gen, Oxford, CT) and spun for 20
s, cleaning micropolytron between each sample. Homogenized samples were heated in a
water bath (Thelco 261, GCA Precision Scientific, Chicago, IL) at 45°C for 2 h to ensure
hydrolysis. Samples were cooled to room temperature (~20 min), then pH was
neutralized using 2 mL of 2N HCl, then vortexed for 20 s. Two 2 mL Eppendorf tubes
124
(2mL safe-lock tube; 02236352, Eppendorf AG, Hamburg, Germany) were used to split
samples. Using microcentrifuge, samples were spun at 10,000 x g for 15 min at 4°C. One
hundred µL of sample were added to 100µL of neutralization solution in a 0.6 mL
Eppendorf tube. Additionally, Anti-8-iso-PGF2� Antibody (1:1000) was diluted with
sample diluent. One hundred µL of the diluted antibody to the Goat Anti-Rabbit
Antibody coated plate and incubated on an oscillation shake at 25°C for 1 h. During
incubation, 100 mL of 1x wash buffer was prepared by diluting 10x wash buffer
concentrate with deionized water. Isoprostanes standards were prepared as labeled in
Appendix XV. After incubation, antibody solution was removed from the wells and
washed 5 times with 300µL 1x wash buffer per well. After the last wash, wells were
emptied and tapped on absorbent pad or paper towel to remove excess wash solution.
Immediately before use, conjugate (1:80) was diluted with sample diluent. Fifty-five µL
of the 8-iso-PGF2� standard or hydrolyzed sample were combined with 55µL of 8-iso-
PGF2alphs-HRP conjugate in a microtube and mixed thoroughly. One hundred µL of the
combined solution per well were mixed thoroughly. Using a well containing sample
diluent as a blank, microwell plates were incubated for 1 h at 25°C on an orbital shaker.
After incubation, combined solutions were removed from the wells and washed 5 times
with 300 µL of 1x wash buffer per well. After the last wash, emptied wells were tapped
on absorbent pad or paper. One hundred µL of substrate solution was added to each well
and incubated at 25°C for 30 min on an oscillate shaker. After incubation, 100µL of stop
solution was added to each well. Results were read immediately on a microplate reader
using 450nm as the target wavelength. Units of isoprostane content were designated as
picogram/mL.

125
Sarcomere length
Sarcomere length was determined using the helium-neon laser diffraction method
described by Cross et al. (1981) and Dolazza and Lorenzen (2014). A few flecks of
powdered meat sample were placed on a clear glass microscopic slide. A single drop of
0.25M sucrose solution was added to the slide and topped with a glass coverslip. The
distance to the top of the slide from the base of the laser was 100mm. A sheet of paper
was placed below the stand in order to mark the two diffraction bands. Six sarcomeres
per sample were determined and sarcomere length (µm) was determined by the equation
provided by Cross et al. (1981):
Sarcomere length (µm) =
$ =0.6328./0123
/ 4 + 12
Where:
0.6328 = 632.8 (the wavelength of the laser) x 10-3
D = distance from specimen to diffraction pattern screen (100mm)
T = spacing between diffraction bands (mm)
Proximate composition
Moisture, fat, and ash (%) of raw meat samples were determine. Samples were
measured in triplicate in Whatman #2 paper filter paper and fat was extracted with
anhydrous ether. After identifying and recording weights of the folded filter papers with
corresponding paper clips to hold packets closed, these were tared out and powdered
meat samples (2 g) were weighed onto the filter paper and then closed with the paper

126
clip. Samples were then placed in a Soxhlet tubes and the boiling flasks were filled with
400 mL of ether. Once in place, water was opened to ender the condensers and each
individual burner was turned on. After 48 h, burners were turned off and allowed to cool
completely. Samples were air-dried under a fume hood for 2 h, then placed in a drying
oven (105°C) overnight prior to recording final dry weight. In order to calculate final fat
percentage, the final equation was used: % Fat = ((Pre-extraction wet weight with filter
paper and paper clip – Post-extraction dry sample weight)/sample weight) * 100) - %
Moisture. Moisture and ash (%) were measured with a LECO Thermogravimetric
Analyzer in duplicate (Model 604-100-400, LECO Corporation, St. Joseph, MI), see
Appendix IV for information. Moisture was determined in nitrogen atmosphere with a
start temperature of 25°C and an end temperature of 130°C (17 min ramp rate). Ash was
determined in oxygen atmosphere with a start temperature of 130°C and an end
temperature of 600°C (30 min ramp rate). Protein was determined by difference.
Fatty acids
Fatty acid profiles were obtained via gas chromatography as described by (Folch
et al., 1987). After extraction, lipids were converted to fatty acid methyl esters according
to Morrison and Smith (1964) and Metcalfe et al. (1966). One g of powdered sample was
homogenized with 5 mL of 2:1 chloroform: methanol and allowed to sit at room
temperature (23°C) for 1 h. After, samples were filtered through Whatman #2 paper,
brought up to a final volume of 10mL with 2:1 chloroform: methanol, and vortexed for 5
s with 2mL of 0.74% KCl. Samples were centrifuged (1,000 x g for 5 min at 5°C) and the
top layer was aspirated off. After centrifugation, samples were dried on a heating block at
127
60°C under nitrogen purge. Once dry, 1 mL of 0.5 M NaOH in methanol was added,
vortexed (5 s), and again heated at 100°C for 10 min. One mL of 14% Boron Trifluoride
in methanol (wt/vol) was added, vortexed (5 s), and again heated at 100°C, this time for 5
min. Two mL of saturated salt solution and 2 mL of hexane was added and vortexed (5
s). Samples were centrifuged (1,000 x g for 5 min at 5°C) and the hexane layer removed
and analyzed using gas chromatography (TRACE 1310 Gas Chromatograph;
ThermoFisher Scientific, Waltham, MA). Fatty acids were separated using a Chrompack
CP-Sil 88 capillary column (0.25mm by 100mm; Inlet temp: 260°C, Oven: 140°C hold
for 5 min, increase at 4°C/min to 240°C and hold for 15 min. FID temp: 280°C. Injected
at 30:1 ratio) and identified based on their retention times compared to known
commercial standards (NU-Check Prep, Inc., Elysian, MN; #GLC-68D, GLC-79, GLC-
87, GLC-455, and GLC-458). The percentage of fatty acids were determined by the peak
areas in the chromatograph and values were converted to mg/100g tissue: Fatty acid
mg/100g tissue = (% of fatty acid peak area * fat content of samples) * 100.
pH analysis
Powdered sample from chops from all aging periods with 0 d RD were weighed
out in 5 g duplicates into 250 mL plastic beakers and placed on a stir plate. Forty-five mL
of distilled deionized water and a magnetic stir bar were added to ensure constant mixing
during the measurement process. The pH was measured using a pH meter (Orion
410Aplus: ThermoFisher Scientific; Waltham, MA) that was calibrated using 4.0, 7.0,
10.0 standards. The mean measurement of the duplicates was utilized for all analysis.
128
Objective color and subjective color in simulated retail display
Objective color measurements were taken once daily for 7 days during simulated
retail display at all aging time points. Chops (2.54 cm) were placed on Styrofoam trays
(21.6 x 15.9 x 2.1 cm, Styro-Tech, Denver, CO), overwrapped with oxygen permeable
film (Prime Source PSM 18 #75003815, Bunzl Processors Division, North Kansas City,
MO), and placed under retail display conditions (3°C under white fluorescence lightening
at 1,000 to 1,800 lux). Commission international de l’éclairage (CIE) L* a* b* values
were obtained using a Minolta CR-400 colorimeter (Minolta, Osaka, Japan) set with a
D65 illuminant, 2°C, with an 8 mm diameter measurement area. Three measurements
were made per chop and the mean was calculated for statistical analysis. The colorimeter
was calibrated daily with a white ceramic tile (Calibration Plate, Serial No. 14933058,
Konica Minolta, Japan). Lightness (L*) is measured with a range from 0 (black) to 100
(white), a* measures redness with the range between red (positive) and green (negative),
and b* is a measure of yellowness from yellow (positive) to blue (negative). Color
readings were recorded at the same time each day.
Visual discoloration was assessed daily during the 7 d of RD utilizing 5 trained
panelists comprised of graduate students from the University of Nebraska. Panelists were
trained using a standardized discoloration guide (Appendix VI). Discoloration % was
approximated from 0% to 100% with 0% meaning no discoloration present and 100%
being a fully discolored chop. Chops were randomly rotated daily to minimize location
effects.

129
Lipid oxidation (TBARS)
Lipid oxidation was determined using thiobarbaturic acid reactive substances
values (TBARS) for all aging periods at 0 and 7 d RD described (Ahn et al., 1998). Five
grams of powdered meat were placed into a 50 mL conical tube to which 14 mL of
distilled deionized water were added and 1 mL of butylated hydroxyanisole (BHA)
solution (10% BHA: 90% ethanol). Samples were homogenized using a Polytron
(POLYTRON Kinimatica CH-6010, Switzerland) for 15 s at medium to high speed.
The samples were centrifuged (2,000 x g for 5 min at 10°C) and one mL of supernatant
was transferred into a 15 mL conical tube with 2 mL of 2,4,6-tribromoanisole (TBA)
2,4,6-tricholoroanisole (TCA) solution (15% and 20 mM TBA in deionized distilled
water). Tubes were then placed in a 70°C water bath for 30 min. After 30 min, tubes were
cooled for at least 10 min in a water bath (22°C) and centrifuged (2,000 x g for 15 min at
10°C). Two hundred µL of supernatant was transferred to a 96-well plate in duplicate
(Microtest III sterile 96 well flat-bottomed microplate; Becton Dickinson & Company,
Lincoln Park, NJ). Absorbance values were then read at 540 nm using a microplate
spectrophotometer and compared to known standards (Model Epoch Biotek, Winooski,
VT). Results were expressed in mg of malonaldehyde per kg of tissue.
Statistical analysis
Statistical analysis was conducted with SAS (version 9.4, Cary, NC). Objective
and subjective color data were analyzed as a split-plot repeated measures design with
treatment as the whole-plot, aging period as the split-plot and retail display as the
repeated measures. Tenderness, troponin t, desmin, calcium, and pH were analyzed as a

130
spilt-plot design with treatment as the whole-plot and aging period as the split-plot. Lipid
oxidation, free thiols and carbonyls were a split-split-plot design with treatment as the
whole plot, aging period as the split-plot and retail display time as the split-split-plot.
Transcriptomics, sarcomere length, fatty acids, cytochrome c, and isoprostanes were
analyzed as a completely randomized design. Data were analyzed using the PROC
GLIMMIX procedure of SAS and animal was the experimental unit. Correlations were
evaluated using the PROC CORR procedure of SAS across all postmortem analyses. All
means comparing within aging periods were separated using SLICE function in SAS. All
means were separated using the LS MEANS statement with an � level of 0.05 and
tendencies were considered at an � level of 0.10.
Results
Rectal temperatures
In this study, treatment had a significant effect (P < 0.05) on rectal temperatures
of lambs (Figure 1), and a time effect (P < 0.05) was identified. Lambs administered
LPS50 and LPS100 had significantly greater (P < 0.05) rectal temperatures than lambs
administered the saline control. Additionally, LPS-treated lambs exhibiting the greatest
increase in rectal temperature at 1, 2, and 4 hours post-injection, with a numerically
greater rectal temperature in LPS100 treated lambs compared to LPS50 at each timepoint
listed. These results are in agreement with Yates et al. (2011), who found LPS treatments
to consistently increase rectal temperatures and peak at 4 hours post-injection, followed
by a steady decline to basal temperature around 24 hours.

131
Transcriptomics
Considering all transcripts with differential expression (Praw<0.05), pathway
analyses identified 68 conical pathways altered due to treatments. Transcriptomics
pathway analyses are illustrated in Figure 2, with total change in gene turnover expressed
as negative log (-log). Additionally, all significant (P < 0.05) pathways are expressed by
a color-treatment directionality (Orange = LPS100; Blue = Control), with increased level
of standard deviations (z-score) shown by an increase in the intensity of the respective
colors. In the LPS100-treated samples, genes with evidence of dysregulation due to
treatment were found in pathways that predicted an upregulation of genes responsible for
cellular biosynthesis, oxidative stress generation, cellular defense systems, nucleic acid
alteration, and skeletal muscle function.
Tenderness
Warner-Bratzler Shear Force (WBSF) for lambs across treatment and aging are
shown in Figure 3. A significant aging effect (P < 0.0001) was identified across aging
periods, along with a trend (P = 0.10) found across treatments. No aging time-by
treatment interaction (P = 0.13) was seen.
A significant aging effect (P < 0.0001) was found, as 1 day-aged chops exhibited
greater WBSF compared to 14 day-aged chops (7.31kg and 2.52kg, respectively).
Treatment tended to affect WBSF (P = 0.10), as chops from lambs administered LPS50
had lower shear force values compared to chops from lambs administered saline
(Control) (4.51kg and 5.41kg, respectively), with no differences in shear force values
between LPS100 and Control. No aging-time-by-treatment interaction (P = 0.13) was
132
seen. Interestingly, chops from lambs administered LPS50 had noticeably lower WBSF
compared to Control (6.59kg and 8.06kg, respectively) within 1 d aging. There were no
differences (P > 0.05) in tenderness between LPS100 and Control among aging periods,
however, chops from lambs administered LPS100 had numerically lower shear force
values than Control at 1 day of aging (7.27 kg and 8.06 kg, respectively). Chops aged for
14 days did not differ in WBSF across treatments (P > 0.05).
Troponin T
After 1 day postmortem, a treatment effect was found (P = 0.02), with LPS50
samples having significantly greater percent troponin-T degradation compared to Control
and LPS100 (Figure 4) (10.32%, 6.85%, and 6.24%, respectively). No differences in
degradation were seen at 14 days postmortem. A significant aging effect (P < 0.0001)
was found, as 1 day-aged chops exhibited less troponin-T degradation compared to 14
day-aged chops. There was no aging time-by-treatment effect (P > 0.05). It is interesting,
however, that chops from lambs treated with LPS50 had numerically greater degradation
compared to Control and LPS100 at both 1-day aging and 14-day aging. These results
parallel the WBSF data.
Desmin
In this study, a significant aging effect was found (P < 0.0001), as 1-day aged
chops exhibited less percent desmin degradation compared to 14-day aged chops (3.57%
and 50.6%, respectively; Figure 5). An aging-by treatment effect trend (P = 0.08) was
found. Within 1-day aging, no differences (P > 0.05) were found across treatments.

133
However, both Control and LPS100 tended (P = 0.10) to be greater in percent
degradation compared to LPS50 at 14-days aging (55.02%, 54.94%, and 41.73%,
respectively).
Free calcium concentration
Free calcium concentration for samples across treatments and aging are shown in Table 1.
An aging effect was shown for free calcium, as 14 day-aged samples had notably higher
(P < 0.0001) free (sarcoplasmic) calcium compared to 1 day-aged samples. No
differences (P > 0.05) were found across treatments.
Isoprostanes
There were no differences (P = 0.21) across treatments for F2-isoprostane content
(Figure 6). Interestingly, LPS50 and LPS100 treated samples had numerically greater
total F2-isoprostane content compared to Control chops (239.51 pg/mL, 219.95 pg/mL,
165.51 pg/mL, respectively).
Sarcomere length
No differences in sarcomere length among treatments were observed (P = 0.70;
Figure 7). Similar results were found by Starkey et al. (2015) who reported postmortem
sarcomere lengths of 1.77 $m in lamb longissimus muscle.
134
Proximate analysis
In this study, treatment had no effect (P ≥ 0.31) on proximate composition of 1 d
aged chops (Table 2). The mean values for the proximate composition were: 75.35%
moisture, 14.49% protein, 8.49% fat, 1.67% ash.
Fatty acids
There were no differences (P ≥ 0.21) found in amount of saturated fatty acids,
monounsaturated fatty acids, polyunsaturated fatty acids, or trans fats,
saturated:unsaturated ratio, along with no differences (P > 0.05) in any individual fatty
acids identified (Table 3).
pH
Data for pH across treatment and aging in lamb chops are exhibited in Figure 8.
There was no treatment effect for pH (P > 0.05), regardless of aging period. An aging
effect was found for pH (P < 0.0001), as 14 day-aged chops had a greater pH (5.87)
compared to 1 day-aged chops (5.71). However, the average difference in values are
likely of little practical significance. There was no treatment by aging interaction (P =
.7621).
Color (objective)
Color values are shown in Table 4. A days of aging-by-retail display interaction
was detected (P < 0.05) for all color measures. In general, L* values increased and a* and
b* values decreased as aging and retail display increased, regardless of treatment.
135
L* values were statistically different (P = 0.0017) among dietary treatments.
Regardless of days of aging and retail display, L* values were greater (lighter color) in
LPS100 compared to Control treatments (45.97 and 44.37, respectively). Chops from the
LPS50 treatment was not different from the other treatments. There were no days of
aging-by-treatment interaction for L* values (P > 0.05).
There was a days of aging-by treatment effect (P = 0.0008) in a* (redness) values.
Regardless of retail display, chops from Control lambs exhibited the lowest a* value
across treatments at 14 days of aging, with no difference when comparing LPS50 and
LPS100 (15, 16.01, and 15.70, respectively). There were no significant differences found
for a* at 1 day of aging. Concurrently, an age-by-treatment effect (P = 0.02) was
observed in b* values. Within 1 day of aging, meat from lambs treated with LPS50
exhibited (P < 0.05) the highest b* values compared to all other treatments. There were
no significant differences at 14 days of aging. However, chops from lambs treated with
LPS100 exhibited the highest b* values compared to all other treatments.
Discoloration
As expected, percent discoloration of chops increased (P < 0.0001) as days of
retail display increased (Table 5). A days of aging-by-treatment effect was shown in
Table 4 (P = 0.02). Chops from Control lambs clearly had the most discoloration across
all treatments at 14 days of aging (P < 0.05). There were no differences among treatments
at 1 day of aging.

136
Thiobarbaturic acid reactive substances
No differences (P > 0.05) in treatment were identified (Table 6). As days of retail
display increased, lipid oxidation (mg malonaldehyde) also increased (P < 0.0001). A
days of aging tendency was found, as 14 day-aged chops tended (P = 0.06) to have more
malonaldehyde content compared to 1 day-aged chops (2.26 mg and 1.65 mg
malonaldehyde, respectively). While not significant (P = 0.17), chops aged for 14 days
with 7 days of retail display (14-7) had the greatest TBARS values compared with all
other age-by-retail display combinations (14-7: 4.08; 1-7: 3.03; 14-0: 0.44; 1-0: 0.27, mg
malonaldehyde).
R2 Correlations
Significant correlations (P < 0.05) were found in analyses comparing analyses
relevant to tenderness, including WBSF and calcium, WBSF and pH, and calcium and pH
(Table 6). Additionally, there were significant correlations among analyses related to
oxidative potential, including TBARS and pH, TBARS and calcium, and calcium and pH.
Interestingly, there were significant correlations found between isoprostanes content and
early postmortem tenderness measurements, including WBSF and desmin. Additionally,
statistical trends (P < 0.10) were found in comparisons relating tenderness attributes,
including positive comparisons across WBSF, desmin, calcium, troponin T, and
sarcomere length.

137
Discussion
LPS treatment and oxidative response mechanisms
This research explored the relationship between oxidative stress response via LPS
exposure, and the subsequent impacts of oxidative processes on meat quality. There is a
wide variety of commercially-available LPS preparations and the type of LPS used in an
analysis dictates the degree of physiological stress induced. Therefore, effects due to LPS
treatment and its impact on oxidative stress are rather complex (Suliman et al., 2004).
Lipopolysaccharides are covalently-bound lipids derived from the outermost membrane
of many gram-negative bacterium (Escherichia coli). Acting as an endotoxin, LPS
promotes an acute inflammatory response (Sternberg, 2007; Powers et al., 2011). As a
result, innate immune response mechanisms are activated, such as nuclear factor kappa-
light-chain-enhancer of activated B cells (NF�B), start transcription of pro-inflammatory
cytokines interleukin-1� (IL-1), interleukin-6 (IL-6), and tumor necrosis factor-� (TNF-
�) (Halawa et al., 2013). Similar to hormones like cortisol, cytokines are broad proteins
which function for cellular signaling of homeostatic mechanisms during biological stress.
Given the complexity of oxidative stress in vivo, administration of
lipopolysaccharides provided a dose dependent method to quantitatively induce oxidative
stress to monitor response factors. The LPS model (O111:B4) promoted a quick
inflammatory response in vivo, as indicated by the rapid change in rectal temperatures of
lambs (Yates et al., 2011). Under conditions of high LPS concentration, production of
pro-inflammatory mediators such as ROS are produced as a result of LPS toxicity,
inducing oxidative stress and altering composition of muscle cells, including apoptotic
mechanisms (Suliman et al., 2004). While recent literature (Niu et al., 2016) has used
138
LPS as a means to generate oxidative stress and influence meat quality, the impact of
reintroducing LPS every 72 hours in an immune challenge, as our study performed, has
yet to be determined. We postulated that the constant reintroduction of an oxidative
promoter would provide a basal level of oxidative stress prior to harvest, replicating the
effects of conditions linked as potential oxidative promoters in livestock production
systems (e.g., genetics, diet, environment, handling, etc.) which contribute to final meat
quality.
In addition, the development of ROS can impact gene expression in muscle cells,
promoting changes in cell proliferation, differentiation, function, and turnover. Using
proteomic analysis, Malheiros et al. (2019) observed greater damage from oxidative
stress in tender beef, compared to tough beef. The proteomic profile identified oxidation
to antioxidant enzymes, heat shock proteins, and structural proteins, suggesting that
biochemical changes within muscle induced by oxidative stress prior to harvest can
impact meat tenderness. In the present study, transcriptomics was utilized to evaluate
changes in RNA transcripts among samples induced by a LPS challenge. Lambs
administered LPS100 exhibited an upregulation of genes related to stress response
pathways compared to the Control. This was evident by the gross changes in systematic
pathways responsible for cell biosynthesis and turnover (ILK, Ceramide, IGF-1, PI3K,
EGF, ERK5). These pathways are predominantly involved in cellular metabolism,
proliferation, differentiation, protein transfer, and cell signaling. Interestingly, certain
pathways act as hybrid models, both acting for cell biosynthesis but have secondary
functions to inhibit apoptosis (PI3K). This is rational, as a biological system that has
undergone biological stress would endure cellular damage, and thus need mechanisms to
139
repair, grow, and reinforce new cellular structures, organelles, and signaling mechanisms.
Conversely, Control samples also upregulated certain biosynthesis pathways (cAMP,
ErbB2-ErbB3) compared to LPS100 samples, as homeostatic maintenance of cells
requires continuous cellular turnover. It is noteworthy that genes upregulated in LPS100-
treated lambs included those responsible high levels of cellular growth and
differentiation, suggesting they can account for increased cellular turnover as a result of
acute biological disruption. Additionally, LPS-treated lambs expressed nucleic-related
proteins (HMGB1, Telomerase, Unfolded Protein, EIF2, Neurotrophin/TRK, JAK/Stat,
3-phosphoinositide). These proteins are responsible for the modification and development
of chromosomes, chromatin function, and regulation of protein transcription, some of
which are also capable of inducing cytokine signaling (JAK/Stat, HMGB1). In particular,
any nucleic damage as a result of oxidative stress merits the degradation (Unfolded
protein) of damaged proteins and renewal of nucleic information. Most notably, LPS-
treated samples identified oxidative stress-related genes, all of which act for cellular
oxidative response mechanisms (IL-6, IL-8, IL-3, NRF2, Chemokine), stress signaling
(p38 MAPK, CXCR, TNFR-2, and Sumoylation), or autophagic initiation. Although
overall statistical significance was fairly liberal (P < 0.05), the increased upregulation of
systematic processes in response to LPS treatment in this study validates that oxidative
stress was generated within our test subjects, allowing stress response systems to be
evaluated.
Oxidative stress changed mRNA related to muscular function and development.
In particular, LPS-treated samples exhibited an upregulation of NO/ROS generation in
macrophages, neuromuscular signaling between neurons and myofibrils (Agrin), and

140
alterations in messenger molecules used to selectively block epithelial calcium channels
(D-myo-inositol tetrakiphosphate biosynthesis pathways). This implies the induction of
oxidative stress not only generated ROS, but also upregulated different proteins
responsible for inhibition of calcium regulation. From the perspective of muscle
contraction and early postmortem tenderization, these factors hold tremendous
implications on the development of muscle function by neuromuscular signaling in vivo
in addition to enzymatic action in post-rigor muscle tissue. Interestingly, genes
upregulated in Control samples presented the opposite impact on muscle tissue.
Specifically, an increase in calcium signaling was found, suggesting that a homeostatic
environment facilitates increased availability of calcium release in myocytes.
Additionally, an increase in PPAR�/RXR�, responsible for glucose and lipid
metabolism, were identified in Control lambs. Lastly, eNOS signaling was upregulated in
Control samples, reflecting support of endothelial homeostasis within the lining of blood
vessels, in addition to maintenance of blood flow. Perhaps eNOS acts on mitochondrial
biogenesis and fission within homeostatic environments (Tengan et al., 2012). This is
plausible, as an increase in oxidative stress would induce mitophagy rather than
mitochondrial fission. In total, these measures help to validate the presence of oxidative
stress within our experiment, as well as identifying subsequent mechanisms which act in
response to oxidative stress.
When discussing oxidative products, evaluation of biomarkers (isoprostanes) have
recently been used as a measure of downstream products due to oxidative stress. F2-
isoprostanes are the family of prostaglandin-like compounds formed by non-enzymatic,
free-radical oxidation of arachidonic acid (20:4) by reactive oxygen species. Due to an
141
integrated mechanism required to produce isoprostanes, its generation is contingent on
ROS-mediated oxidation (Lawson et al., 1999; Milne et al., 2011). Generated during lipid
peroxidation, F2-isoprostanes are produced as esterified fatty acid form in phospholipids
membranes, and then released using phospholipase action (Montuschi et al., 2004).
Compared to other oxidative products, F2-isoprostanes are very stable compounds that are
detectable in all normal biological fluids and tissues. It is common to sample muscle
biopsies or anoxic muscle tissue for isoprostane content, as the lack of blood present
prevents F2-isoprostanes to be transferred and metabolized in blood. Given the
relationship between isoprostane generation and oxidative stress activity, detection of this
molecule is regarded as the standard for evaluating oxidative stress. Isoprostanes has
been linked to oxidative stress in animals due to its evaluation across a multitude of
treatments speculated to influence oxidative stress in vivo, such as exercise Karamouzis
et al. (2004). Ponnampalam et al. 2017) theorized the change in isoprostanes as an in vivo
indicator of meat quality deterioration postmortem (in vitro). Using blood samples, they
detected an increase in plasma of 8-isoprostane PGF2� levels, with the feedlot diet
exhibiting the greatest concentration at 4 and 8 weeks of feeding trials. This is due to
both the increase in energy content of diets, but also the amount of �-tocopherol content
increased in roughage-based diets (ryegrass, lucerne). Concurrently, positive correlations
between 8-isoprostane PGF2� levels and lipid oxidation (malonaldehyde content) were
found. Interestingly, positive correlations between 8-isoprostane PGF2� levels and both
arachidonic (20:4) and linolenic (18:2n-6) acid were discovered. This supports Milne et
al. (2011) on how F2-isoprostanes can potentially be generated from other PUFAs
[eicosapentaenoic acid (20:5n-3), adrenic acid (22:4n-6), and docosahexaenoic acid

142
(22:6n-3)] due to the orientation of their double bonds, but the knowledge on these fatty
acids being able to generate F2-isoprostanes is not fully understood. As a result, the
generation of F2-isoprostanes is an excellent marker for in vivo oxidative damage as a
result of oxidative stress. Given our results, we did not find statistical evidence between
Control and LPS treated samples. However, it is noted that LPS50 and LPS100 treated
samples have noticeably greater isoprostane content compared to the control (~ 44.7%
and 32.9% greater content, respectively). In conjunction with changes in RNA transcripts
for genetic pathways, this supports our hypothesis that the presence of increased in vivo
oxidative stress occurred in LPS treated samples.
Oxidative stress and meat tenderness
Tenderness is recognized as one of the most important factors for consumer
palatability and repurchasing of meat (Koohmaraie and Geesink, 2006; Kemp et al.,
2010). Subtle variations (~0.5 kg) in tenderness within muscles have been shown to
greatly influence consumer likeness to different retail products (Martinez et al., 2017).
While marbling acts as an indicator of tenderness (Emerson et al., 2013), a complete
understanding of the biological mechanism of this relationship is not known. Such
knowledge might be used to induce and increase the rate or extent of tenderization in
meat. Oxidative stress has been linked to factors influencing meat quality, as oxidative
stress has been suggested to impact organelles linked to normal muscle function and
promote cellular turnover via apoptotic mechanisms (Stamler and Meissner, 2001; Kagan
et al., 2009; Bolisetty and Jaimes, 2013). It has been postulated oxidative stress alters
proteins responsible for muscle structure, color stability, and organelle components
143
interconnected with proteolytic mechanisms. As a result, oxidative stress could influence
the degree of postmortem tenderization, and greatly impacting both product quality and
consumer palatability (Ott et al., 2007; Mitacek et al., 2019; Xing et al., 2019).
This study’s statistical evidence is not sufficient to claim LPS decreased WBSF.
However, a tendency (P = 0.10) has been shown that LPS impacts tenderness of
longissimus muscle early postmortem, as indicated by numerical differences in shear
force at 1 day of aging. This tendency in early postmortem tenderization is reflected in
the troponin-T degradation. Lonergan et al. (2001) indicated that degradation of troponin-
T early postmortem (~2 days) could be used as a consistent indicator of proteolysis and
muscle tenderness throughout muscle aging time up to 14 days aging. The action of
oxidative stress catalyzes apoptotic events, possibly upregulating enzymatic degradation
of proteins such as troponin-T (Sierra and Olivan, 2013). The experiment found a
statistical increase in troponin-T degradation at 1 day postmortem for LPS50 samples, but
not for LPS100 samples. Our analysis suggests that early postmortem degradation of
troponin-T can be impacted under certain conditions of increased oxidative stress,
influencing shear force and overall tenderness of meat. While these data are promising
when hypothesizing an oxidative stress – tenderness relationship, no differences were
observed for additional components typically used to explain meat tenderness differences
(desmin, free calcium, sarcomere length, pH, proximate analysis).
It appears a lower level of oxidative stress induced by LPS50 was associated with
lower shear force values compared to Control and LPS100 treatments. The statistical
differences in troponin-T degradation at 1 day aging would support this change in WBSF
early postmortem. Using much higher doses of LPS (3-6mg/kg) in poultry, Niu et al.

144
(2016) found greater WBSF in 1 day-aged samples than controls. In addition, the
significant correlations found oxidative stress biomarkers (isoprostanes) to be positively
associated with early postmortem tenderness and proteolytic degradation. Given this
information, an argument can be made that different levels of LPS-mediated
inflammation can induce different degrees of metabolic response across livestock species
and therefore alter the impact on meat tenderness.
The influence of oxidative stress on meat is likely dependent on the timeframe in
which samples are exposed to an oxidative stress promoter. From the literature,
tenderness has been examined from samples administered oxidative stress pre- and
postmortem. Cook et al. (1998) and (Wang et al., 2018) found lower shear force values
when injecting pre-rigor longissimus muscle with nitric oxide promoters and H2O2
solution, respectively. It can be postulated that the overwhelming increase in reactive
species exhausted antioxidant systems, and initiated expression of pro-apoptotic
mechanisms (Bax, Bcl-2) responsible for organelle instability and mitophagy.
Concomitantly, the degradation of organelle stability promotes efflux of molecular ions
bound within organelles (cytochrome c), which facilitate calcium-dependent enzymatic
degradation of proteins. Cottrell et al. (2008) identified increased tenderness in
longissimus muscle when lambs were induced with nitric oxide inhibitors pre-slaughter.
However, the same parameters resulted in higher shear force (less tender) values in
semitendinosus samples. Suster et al. (2005) reported increasing the time to inject nitric
oxide inhibitors prior to slaughter caused lower shear forces in both longissimus and
semitendinosus muscles. These values paralleled increased myofibrillar fragmentation, an
indicator of tenderness/proteolysis. Both experiments examined specific reactive species

145
in response to meat quality. Warner et al. (2005) postulated reactive nitrogen species
(RNS), when working in concert with reactive oxygen species (ROS), can generate
highly radical compounds capable of disrupting proteins responsible for organelle
function pertinent to postmortem tenderization.
From this analysis, a multitude of parameters were examined which could
influence oxidative stress. Factors such as metabolizable energy in animal diets, fatty acid
composition, and structure of muscle fibers have all been implicated to impact meat
tenderness, with evidence suggesting that oxidative stress may accentuate changes in
meat quality by altering these factors (Chauhan et al., 2016; Starkey et al., 2016; Ribeiro
et al., 2019). These assays were conducted to ensure there were no confounding factors
with oxidative stress when assessing the impact on tenderness.
The results from this study suggest that LPS-mediated oxidative stress has the
potential to model increased early postmortem tenderness, which is likely due to the
intricate relationship between the prolonged generation of oxidative stress and in vivo
alterations amongst biological mechanisms responsible for muscle tenderization within
the myofibril postmortem. We speculate a few possible parameters responsible for
oxidative stress impact on meat tenderness, including the duration of oxidative stress in
vivo and degree of oxidative stress induced by the concentration of oxidative stress
promoter, as shown in this experiment. Additionally, the isolation and analysis of
individual muscles, as well as any additional extrinsic conditions used in normal
management strategies which could promote oxidative stress, such as diet, temperature,
exercise, or genetic selection of livestock. All of these conditions have been used in the
literature as conditions to evaluate the impact of oxidative stress on meat quality.

146
However, the degree in which they manufacture oxidative stress in vivo is likely variable.
Given the complexity of oxidative stress, it was valuable for our experiment to utilize a
system to induce a controlled amount of oxidative stress, while elimination of
confounding variables which could impact meat quality.
Oxidative stress and stability of color and lipids (pH, isoprostanes)
Given the degree of biological stressors produced during oxidative stress, it is
critical to evaluate conditions which are detrimental to meat quality (Xing et al., 2019).
Muscle pH was not greatly influenced by LPS treatment, suggesting our treatments did
not generate sufficient stress to exhaust glycogen supplies and increase ultimate pH in
meat. Additionally, neither lipid nor protein oxidation were affected by LPS treatment.
Correlation coefficients reinforced the relationship of lipid oxidation and pH, with some
indication that lipid oxidation can coincide with increased proteolysis (troponin T,
calcium). These data, along with color values, indicate that oxidative stress measures
used were not detrimental towards color stability or lipid oxidation. With regards to our
experiment, oxidative stress-induced samples tended to maintain color stability,
exhibiting sustained redness (a*) and increased lightness (L*) in LPS treated chops
compared to Control samples. This is supported by noticeably less discoloration in LPS-
treated lamb chops after aging. Oxidative stress damage was not supported by lipid
oxidation, as there were no noticeable changes in malonaldehyde content. Interestingly, a
numerical increase in oxidative biomarker (8-isoprostanes) content was seen in the
absence of lipid oxidative differences, suggesting that oxidative stress occurred in greater
capacity in LPS-treated lambs, but not to a degree to promote detrimental effects on lipid
147
oxidation. This observation conflicts with (Mitacek et al., 2019), as prolonged aging
promoted mitochondrial degeneration, depletion of color reducing enzymes, and
decreased color stability in their study.
Conclusion
In conclusion, lipopolysaccharide-mediated oxidative stress triggered the onset of
biochemical pathways responsible for muscle composition, proliferation, sustainability,
and apoptotic mechanisms related to meat quality. Although there were few statistical
differences in factors contributing to meat tenderization caused by LPS treatment, there
was a trend that showed lambs subjected to lipopolysaccharides had lower shear force
values early postmortem compared to the saline control group. These findings could be
the result of greater proteolysis of troponin-T early postmortem in chops from lambs
administered LPS50. While there were no detriments in lipid oxidation and color
stability, the change in isoprostane content could indicate the increase in apoptotic
mechanisms in vivo, increasing oxidative mechanisms taking place early postmortem,
resulting in the onset of apoptotic and proteolytic events responsible for enhanced
tenderness in aged meat.

148
Literature Cited
Ahn, D. U., D. G. Olson, C. Jo, X. Chen, C. Wu, and J. I. Lee. 1998. Effect of muscle type,
packaging, and irradiation on lipid oxidation, volatile production, and color in raw pork
patties. Meat Sci. 49:27–39.
Bekhit, A. E. D. A., D. L. Hopkins, F. T. Fahri, and E. N. Ponnampalam. 2013. Oxidative
processes in muscle systems and fresh meat: sources, markers, and remedies. Compr.
Rev. Food Sci. Food Saf. 12:565–597.
Bhat, Z. F., J. D. Morton, S. L. Mason, and A. E.-D. A. Bekhit. 2018. Role of calpain system in
meat tenderness: a review. Food Sci. Hum. Wellness. 7:196–204.
Bolisetty, S., and E. A. Jaimes. 2013. Mitochondria and reactive oxygen species: physiology and
pathophysiology. Int. J. Mol. Sci. 14:6306–6344.
Chao, M. D., K. I. Domenech-Perez, L. S. Senaratne-Lenagala, and C. R. Calkins. 2018. Feeding
wet distillers grains plus solubles contributes to sarcoplasmic reticulum membrane
instability. Anim. Prod. Sci. 58:2215–2223.
Chauhan, S. S., E. N. Ponnampalam, P. Celi, D. L. Hopkins, B. J. Leury, and F. R. Dunshea.
2016. High dietary vitamin e and selenium improves feed intake and weight gain of
finisher lambs and maintains redox homeostasis under hot conditions. Small Rumin. Res.
137:17–23.
Cook, C. J., S. M. Scott, and C. E. Devine. 1998. Measurement of nitric oxide and the effect of
enhancing or inhibiting it on tenderness changes of meat. Meat Sci. 48:85–89.
Cottrell, J. J., M. B. McDonagh, F. R. Dunshea, and R. D. Warner. 2008. Inhibition of nitric
oxide release pre-slaughter increases post-mortem glycolysis and improves tenderness in
ovine muscles. Meat Sci. 80:511–521.
Cottrell, J. J., E. N. Ponnampalam, F. R. Dunshea, and R. D. Warner. 2015. Effects of infusing
nitric oxide donors and inhibitors on plasma metabolites, muscle lactate production and
meat quality in lambs fed a high quality roughage-based diet. Meat Sci. 105:8–15.
Dobin, A., T. R. Gingeras, C. Spring, R. Flores, J. Sampson, R. Knight, N. Chia, and H. S.
Technologies. 2016. Mapping RNA-seq with STAR. Curr Protoc Bioinforma. 51:586–
597.
Dröge, W. 2002. Free radicals in the physiological control of cell function. Physiol. Rev. 82:47–
95.
Folch, J., M. Lees, and G. . Sloane Stanley. 1987. A simple method for the isolation and
purification of total lipided from animal tissues. J. Biol. Chem. 55:999–1033.
Halawa, A. A., M. A. El-Adl, M. F. Hamed, A. Z. Balboula, and M. A. Elmetwally. 2013.
Lipopolysaccharide prompts oxidative stress and apoptosis in rats’ testicular tissue. J.
Vet. Healthc. 20–31.
Kagan, V. E., H. A. Bayir, N. A. Belikova, O. Kapralov, Y. Y. Tyurina, V. A. Tyurin, J. Jiang,
D. A. Stoyanovsky, P. Wipf, P. M. Kochanek, J. S. Greenberger, B. Pitt, A. A. Shvedova,
and G. Borisenko. 2009. Cytochrome c/cardiolipin relations in mitochondria: a kiss of
death. Free Radic. Biol. Med. 46:1439–1453.
Karamouzis, I., K. Christoulas, D. Grekas, K. Giannoulis, E. Vamvakoudis, and K. Mandroukas.
2004. The response of muscle interstitial F2-isoprostane (8-Iso-PGF2α) during dynamic
muscle contractions in humans. Prostaglandins Leukot. Essent. Fat. Acids. 71:87–90.
Ke, Y., R. M. Mitacek, A. Abraham, G. G. Mafi, D. L. VanOverbeke, U. Desilva, and R.
Ramanathan. 2017. Effects of muscle-specific oxidative stress on cytochrome c release

149
and oxidation-reduction potential properties. J. Agric. Food Chem. 65:7749–7755.
Kemp, C. M., and T. Parr. 2012. Advances in apoptotic mediated proteolysis in meat
tenderisation. Meat Sci. 92:252–259.
Kemp, C. M., P. L. Sensky, R. G. Bardsley, P. J. Buttery, and T. Parr. 2010. Tenderness - an
enzymatic view. Meat Sci. 84:248–256.
Koohmaraie, M., and G. H. Geesink. 2006. Contribution of postmortem muscle biochemistry to
the delivery of consistent meat quality with particular focus on the calpain system. Meat
Sci. 74:34–43.
Lawson, J. A., J. Rokach, and G. A. FitzGerald. 1999. Isoprostanes: formation, analysis and use
as indices of lipid peroxidation in vivo. J. Biol. Chem. 274:24441–24444.
Lonergan, S. M., E. Huff-Lonergan, B. R. Wiegand, and L. A. Kriese-Anderson. 2001.
Postmortem proteolysis and tenderization of top loin steaks from Brangus cattle. J.
Muscle Foods. 12:121–136.
Love, M. I., W. Huber, and S. Anders. 2014. Moderated estimation of fold change and dispersion
for RNA-seq data with DESeq2. Genome Biol. 15:1–21.
Martinez, H. A., A. N. Arnold, J. C. Brooks, C. C. Carr, K. B. Gehring, D. B. Griffin, D. S. Hale,
G. G. Mafi, D. D. Johnson, C. L. Lorenzen, R. J. Maddock, R. K. Miller, D. L.
VanOverbeke, B. E. Wasser, and J. W. Savell. 2017. National beef tenderness survey–
2015: palatability and shear force assessments of retail and foodservice beef. Meat
Muscle Biol. 1:138–148.
Metcalfe, L. D., A. A. Schmitz, and J. R. Pelka. 1966. Rapid preparation of fatty acid esters from
lipids for gas chromatographic analysis. Anal. Chem. 38:514–515.
Milne, G. L., H. Yin, D. Hardy, Klarissa, S. S. Davies, and L. J. Roberts II. 2011. Isoprostane
generation and function. Chem. Rev. 110:5973–5996.
Mitacek, R. M., Y. Ke, J. E. Prenni, R. Jadeja, D. L. VanOverbeke, G. G. Mafi, and R.
Ramanathan. 2019. Mitochondrial degeneration, depletion of NADH, and oxidative stress
decrease color stability of wet-aged beef longissimus steaks. J. Food Sci. 84:38–50.
Momeni, H. R. 2011. Role of calpain in apoptosis. Cell J. 13:65–72.
Montuschi, P., P. J. Barnes, and L. J. Roberts. 2004. Isoprostanes: markers and mediators of
oxidative stress. FASEB J. 18:1791–1800.
Morrison, W. R., and L. M. Smith. 1964. Preparation of fatty acid methyl esters and
dimethylacetals from lipids. J. Lipid Res. 5:600–608.
Niu, Z. Y., Y. N. Min, J. J. Wang, Z. P. Wang, F. X. Wei, and F. Z. Liu. 2016. On oxidation
resistance and meat quality of broilers challenged with lipopolysaccharide. J. Appl.
Anim. Res. 44:215–220.
Ott, M., V. Gogvadze, S. Orrenius, and B. Zhivotovsky. 2007. Mitochondria, oxidative stress and
cell death. Apoptosis. 12:913–922.
Ouali, A., C. H. Herrera-Mendez, G. Coulis, S. Becila, A. Boudjellal, L. Aubry, and M. A.
Sentandreu. 2006. Revisiting the conversion of muscle into meat and the underlying
mechanisms. Meat Sci. 74:44–58.
Paradies, G., G. Petrosillo, M. Pistolese, and F. M. Ruggiero. 2001. Reactive oxygen species
generated by the mitochondrial respiratory chain affect the complex III activity via
cardiolipin peroxidation in beef-heart submitochondrial particles. Mitochondrion. 1:151–
159.
Parrish, F. C., C. J. Selvig, R. D. Culler, and M. G. Zeece. 1981. CAF Activity, calcium
concentration, Andy the 30,000‐Dalton Component of Tough and Tender Bovine
150
Longissimus Muscle. J. Food Sci. 46:308–311.
Ponnampalam, E. N., D. L. Hopkins, K. Giri, J. L. Jacobs, T. Plozza, P. Lewandowski, and A.
Bekhit. 2017. The use of oxidative stress biomarkers in live animals (In vivo) to predict
meat quality deterioration postmortem (in vitro) caused by changes in muscle
biochemical components. J. Anim. Sci. 95:3012–3024.
Porter, A. G., and R. U. Jänicke. 1999. Emerging roles of caspase-3 in apoptosis. Cell Death
Differ. 6:99–104.
Powers, S. K., L. L. Ji, A. N. Kavazis, and M. J. Jackson. 2011. Reactive oxygen species: impact
on skeletal muscle. Compr. Physiol. 1:941–969.
Ribeiro, F. A., K. I. Domenech-Ṕrez, C. J. Contreras-Castillo, K. Hart, N. J. Herrera, and C. R.
Calkins. 2019. Feeding distillers grains to cattle may affect beef tenderness early
postmortem. J. Anim. Sci. 97:657–668.
Rossi, A. E., and R. T. Dirksen. 2006. Sarcoplasmic reticulum: the dynamic calcium governor of
muscle. Muscle and Nerve. 33:715–731.
Santo-Domingo, J., and N. Demaurex. 2010. Calcium uptake mechanisms of mitochondria.
Biochim. Biophys. Acta - Bioenerg. 1797:907–912.
Sierra, V., and M. Olivan. 2013. Role of mitochondria on muscle cell death and meat
tenderization. Recent Pat. Endocr. Metab. Immune Drug Discov. 7:120–129.
Slimen, I. B., T. Najar, A. Ghram, H. Dabbebi, M. Ben Mrad, and M. Abdrabbah. 2014. Reactive
oxygen species, heat stress and oxidative-induced mitochondrial damage. a review. Int. J.
Hyperth. 30:513–523.
Stamler, J. S., and G. Meissner. 2001. Physiology of nitric oxide in skeletal muscle. Physiol.
Rev. 81:209–237.
Starkey, C. P., G. H. Geesink, D. Collins, V. Hutton Oddy, and D. L. Hopkins. 2016. Do
sarcomere length, collagen content, pH, intramuscular fat and desmin degradation explain
variation in the tenderness of three ovine muscles? Meat Sci. 113:51–58.
Starkey, C. P., G. H. Geesink, V. H. Oddy, and D. L. Hopkins. 2015. Explaining the variation in
lamb longissimus shear force across and within ageing periods using protein degradation,
sarcomere length and collagen characteristics. Meat Sci. 105:32–37.
Sternberg, E. M. 2007. Neural regulation of innate immunity. Nature. 6:318–328.
Suliman, H. B., K. E. Welty-Wolf, M. Carraway, L. Tatro, and C. A. Piantadosi. 2004.
Lipopolysaccharide induces oxidative cardiac mitochondrial damage and biogenesis.
Cardiovasc. Res. 64:279–288.
Suster, D., E. N. Ponnampalam, J. J. Cottrell, and R. D. Warner. 2005. Timing of nitric oxide
inhibition pre-slaughter influences lamb meat tenderness and proteolysis. Congr. Int. Sci.
Meat. 210–213.
Tengan, C. H., G. S. Rodrigues, and R. O. Godinho. 2012. Nitric oxide in skeletal muscle: Role
on mitochondrial biogenesis and function. Int. J. Mol. Sci. 13:17160–17184.
Wang, L. L., Q. L. Yu, L. Han, X. L. Ma, R. De Song, S. N. Zhao, and W. H. Zhang. 2018.
Study on the effect of reactive oxygen species-mediated oxidative stress on the activation
of mitochondrial apoptosis and the tenderness of yak meat. Food Chem. 244:394–402.
Warner, R. D., F. R. Dunshea, E. N. Ponnampalam, and J. J. Cottrell. 2005. Effects of nitric
oxide and oxidation in vivo and postmortem on meat tenderness. Meat Sci. 71:205–217.
Xing, T., F. Gao, R. K. Tume, G. Zhou, and X. Xu. 2019. Stress effects on meat quality: a
mechanistic perspective. Compr. Rev. Food Sci. Food Saf. 18:380–401.
Yates, D. T., C. A. Löest, T. T. Ross, D. M. Hallford, B. H. Carter, and S. W. Limesand. 2011.

151
Effects of bacterial lipopolysaccharide injection on white blood cell counts,
hematological variables, and serum glucose, insulin, and cortisol concentrations in ewes
fed low- or high-protein diets. J. Anim. Sci. 89:4286–4293.
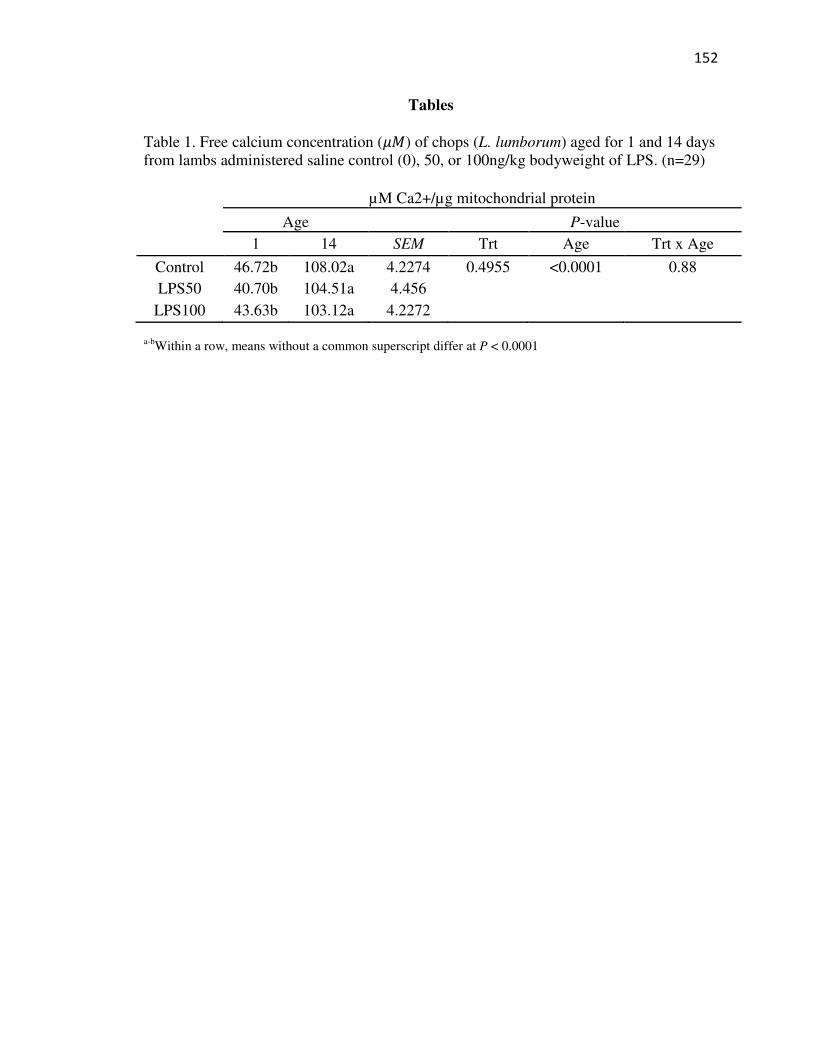
152
Tables
Table 1. Free calcium concentration ($&) of chops (L. lumborum) aged for 1 and 14 days
from lambs administered saline control (0), 50, or 100ng/kg bodyweight of LPS. (n=29)
µM Ca2+/µg mitochondrial protein
Age P-value
1 14 SEM Trt Age Trt x Age
Control 46.72b 108.02a 4.2274 0.4955 <0.0001 0.88
LPS50 40.70b 104.51a 4.456
LPS100 43.63b 103.12a 4.2272 a-b
Within a row, means without a common superscript differ at P < 0.0001
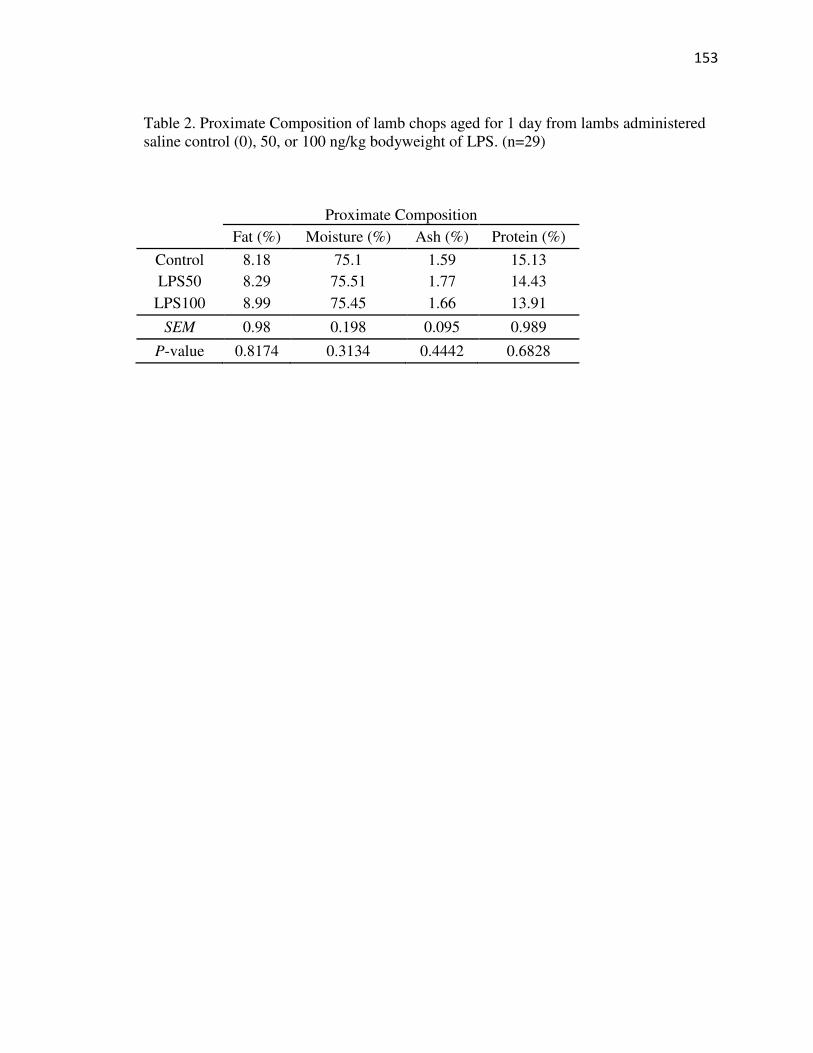
153
Table 2. Proximate Composition of lamb chops aged for 1 day from lambs administered
saline control (0), 50, or 100 ng/kg bodyweight of LPS. (n=29)
Proximate Composition
Fat (%) Moisture (%) Ash (%) Protein (%)
Control 8.18 75.1 1.59 15.13
LPS50 8.29 75.51 1.77 14.43
LPS100 8.99 75.45 1.66 13.91
SEM 0.98 0.198 0.095 0.989
P-value 0.8174 0.3134 0.4442 0.6828
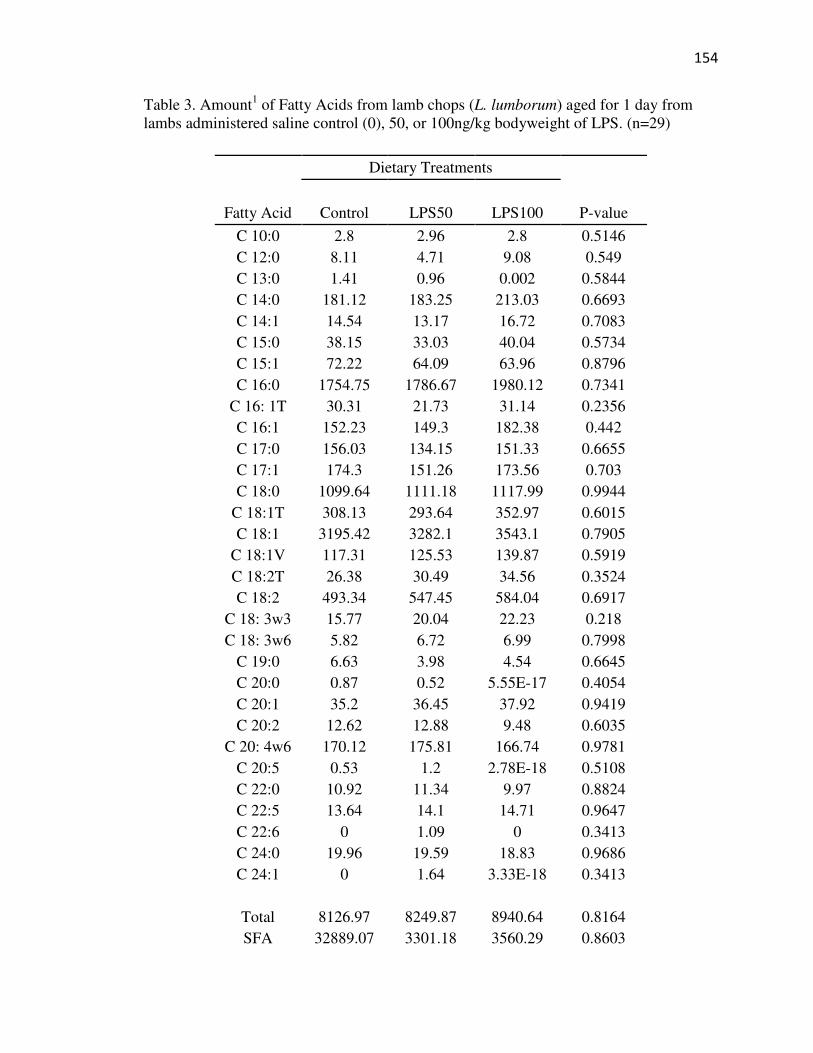
154
Table 3. Amount1 of Fatty Acids from lamb chops (L. lumborum) aged for 1 day from
lambs administered saline control (0), 50, or 100ng/kg bodyweight of LPS. (n=29)
Dietary Treatments
Fatty Acid Control LPS50 LPS100 P-value
C 10:0 2.8 2.96 2.8 0.5146
C 12:0 8.11 4.71 9.08 0.549
C 13:0 1.41 0.96 0.002 0.5844
C 14:0 181.12 183.25 213.03 0.6693
C 14:1 14.54 13.17 16.72 0.7083
C 15:0 38.15 33.03 40.04 0.5734
C 15:1 72.22 64.09 63.96 0.8796
C 16:0 1754.75 1786.67 1980.12 0.7341
C 16: 1T 30.31 21.73 31.14 0.2356
C 16:1 152.23 149.3 182.38 0.442
C 17:0 156.03 134.15 151.33 0.6655
C 17:1 174.3 151.26 173.56 0.703
C 18:0 1099.64 1111.18 1117.99 0.9944
C 18:1T 308.13 293.64 352.97 0.6015
C 18:1 3195.42 3282.1 3543.1 0.7905
C 18:1V 117.31 125.53 139.87 0.5919
C 18:2T 26.38 30.49 34.56 0.3524
C 18:2 493.34 547.45 584.04 0.6917
C 18: 3w3 15.77 20.04 22.23 0.218
C 18: 3w6 5.82 6.72 6.99 0.7998
C 19:0 6.63 3.98 4.54 0.6645
C 20:0 0.87 0.52 5.55E-17 0.4054
C 20:1 35.2 36.45 37.92 0.9419
C 20:2 12.62 12.88 9.48 0.6035
C 20: 4w6 170.12 175.81 166.74 0.9781
C 20:5 0.53 1.2 2.78E-18 0.5108
C 22:0 10.92 11.34 9.97 0.8824
C 22:5 13.64 14.1 14.71 0.9647
C 22:6 0 1.09 0 0.3413
C 24:0 19.96 19.59 18.83 0.9686
C 24:1 0 1.64 3.33E-18 0.3413
Total 8126.97 8249.87 8940.64 0.8164
SFA 32889.07 3301.18 3560.29 0.8603
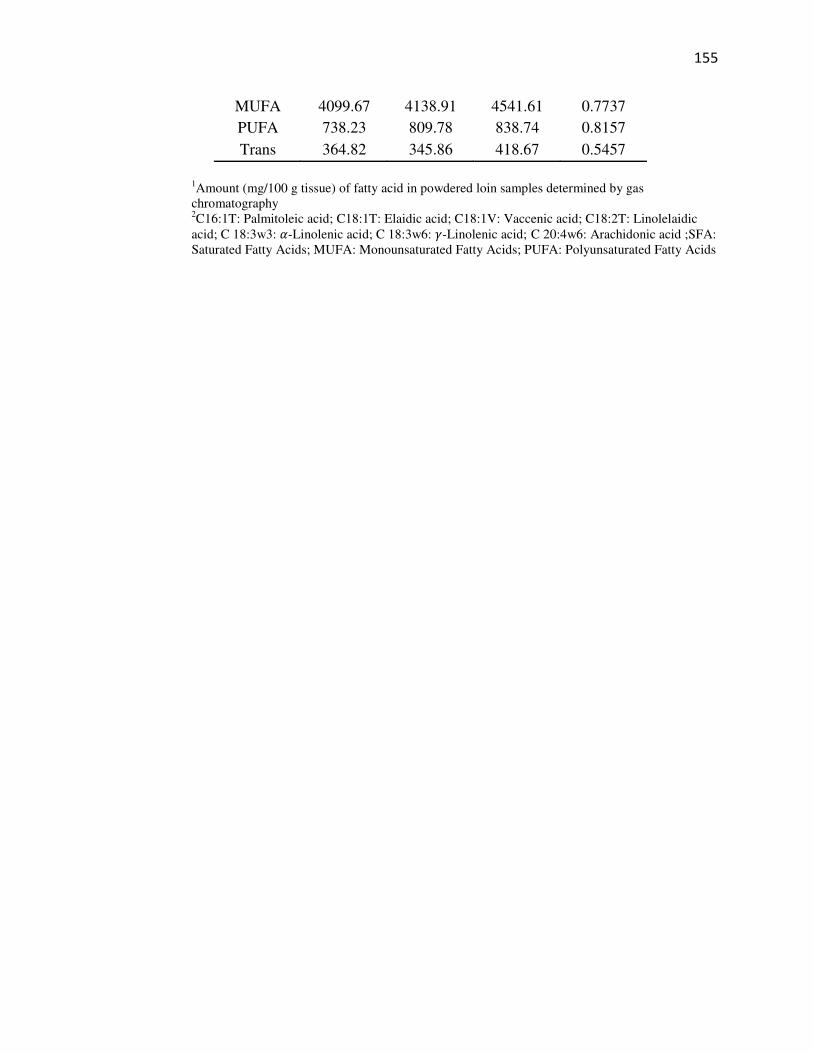
155
MUFA 4099.67 4138.91 4541.61 0.7737
PUFA 738.23 809.78 838.74 0.8157
Trans 364.82 345.86 418.67 0.5457
1Amount (mg/100 g tissue) of fatty acid in powdered loin samples determined by gas
chromatography 2C16:1T: Palmitoleic acid; C18:1T: Elaidic acid; C18:1V: Vaccenic acid; C18:2T: Linolelaidic
acid; C 18:3w3: �-Linolenic acid; C 18:3w6: :-Linolenic acid; C 20:4w6: Arachidonic acid ;SFA:
Saturated Fatty Acids; MUFA: Monounsaturated Fatty Acids; PUFA: Polyunsaturated Fatty Acids
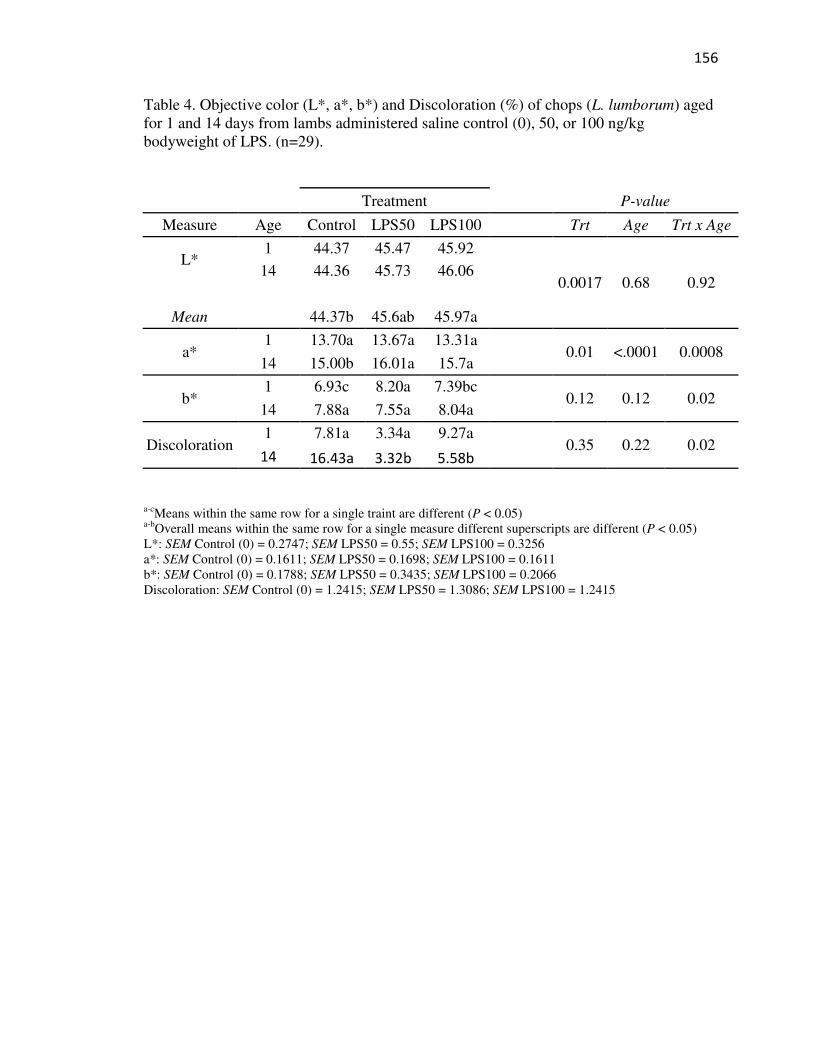
156
Table 4. Objective color (L*, a*, b*) and Discoloration (%) of chops (L. lumborum) aged
for 1 and 14 days from lambs administered saline control (0), 50, or 100 ng/kg
bodyweight of LPS. (n=29).
Treatment P-value
Measure Age Control LPS50 LPS100 Trt Age Trt x Age
L* 1 44.37 45.47 45.92
0.0017 0.68 0.92 14 44.36 45.73 46.06
Mean 44.37b 45.6ab 45.97a
a* 1 13.70a 13.67a 13.31a
0.01 <.0001 0.0008 14 15.00b 16.01a 15.7a
b* 1 6.93c 8.20a 7.39bc
0.12 0.12 0.02 14 7.88a 7.55a 8.04a
Discoloration 1 7.81a 3.34a 9.27a
0.35 0.22 0.02 14 16.43a 3.32b 5.58b
a-c
Means within the same row for a single traint are different (P < 0.05) a-b
Overall means within the same row for a single measure different superscripts are different (P < 0.05)
L*: SEM Control (0) = 0.2747; SEM LPS50 = 0.55; SEM LPS100 = 0.3256
a*: SEM Control (0) = 0.1611; SEM LPS50 = 0.1698; SEM LPS100 = 0.1611
b*: SEM Control (0) = 0.1788; SEM LPS50 = 0.3435; SEM LPS100 = 0.2066
Discoloration: SEM Control (0) = 1.2415; SEM LPS50 = 1.3086; SEM LPS100 = 1.2415

157
Table 5. Percent Discoloration (%) across retail display.
Day 0 1 2 3 4 5 6 7 P-value
Discoloration
% 0.03e 0.13e 0.57de 1.67de 4.41d 9.95c 18.66b 27.64a
<0.0001
a-eMeans denote significance between day (P < 0.05), SEM Day = 1.4598

158
WB
SF
1W
BS
F14
Tro
po
nin
1T
rop
on
in14
Des
min
1D
esm
in1
4C
alc
ium
1C
alc
ium
14
8-I
soS
Lp
H1
pH
14
TB
AR
S1
TB
AR
S1
4
WB
SF
11
0.1
26
75
73
60.0
821
51
02
0.0
012
49
62
0.1
07
36
76
30.0
128
82
25
0.0
13
04
41
50.0
717
70
41
0.1
42
88
40
.000
55
03
70.0
287
37
03
0.0
347
07
69
0.0
871
13
52
0.0
51
21
16
9
WB
SF
14
10.0
331
96
84
0.0
133
91
12
0.0
28
57
11
40.0
933
73
02
0.0
09
85
05
60.2
059
52
59
0.0
03
01
73
0.0
19
96
28
60.1
516
16
78
0.0
664
81
46
60.0
782
65
66
0.0
68
57
06
6
Tro
po
nin
11
0.0
110
79
67
0.1
23
02
55
60.0
060
99
61
0.0
01
75
05
90.1
072
23
50
.023
43
96
10
.001
63
45
80.0
194
99
33
0.0
008
61
42
30.0
421
60
41
0.0
30
87
04
9
Tro
po
nin
14
10
.003
32
00
60.0
521
84
83
0.0
40
44
92
50.0
527
62
09
0.0
00
53
68
50
.053
17
63
60.0
811
62
31
0.1
129
29
60
30.1
859
42
06
0.1
84
71
94
4
Des
min
11
0.0
671
74
27
0.0
04
13
83
50.0
029
72
43
0.2
94
47
98
80
.040
12
81
0.0
001
35
96
0.0
000
26
01
0.0
054
47
92
0.0
21
36
56
7
Des
min
14
10
.017
87
30
20.0
563
82
50
.000
76
06
60
.006
22
83
70.0
185
36
82
2.4
800
4E
-05
0.0
135
83
90
.000
91
26
4
Calc
ium
11
0.0
914
57
86
0.0
62
12
05
80
.019
73
46
30.0
002
04
20.1
569
50
66
90.0
003
31
60
.001
50
38
9
Calc
ium
14
10
.045
59
07
90
.109
53
45
20.1
523
80
93
0.3
086
35
80
30.3
694
57
31
0.2
15
99
25
6
8-I
so1
0.0
04
16
02
50.0
029
73
52
0.0
231
19
20
30.0
001
42
56
0.0
08
59
51
4
SL
10.0
434
72
25
0.0
046
47
14
90.0
172
26
56
0.0
39
60
89
6
pH
11
0.4
424
37
82
60.1
535
30
75
0.1
68
14
1
pH
14
10.3
174
08
29
0.4
43
06
33
TB
AR
S1
10
.788
34
86
5
TB
AR
S1
41
p <
0.1
0p
< 0
.05
r^2
coef
fici
ents
r^2 C
oef
fici
ents
Tab
le 6
: C
orr
elat
ion C
oef
fici
ents
acr
oss
all
post
mort
em a
nal
yse
s.
WB
SF
: W
arn
er-B
ratz
ler
Sh
ear
Fo
rce;
8-I
so:
F2-8
Iso
pro
stan
es;
SL
: S
arco
mer
e L
eng
th;
TB
AR
S:
Th
iob
arb
bat
uri
c A
cid
Rea
ctiv
e S
ub
stan
ces
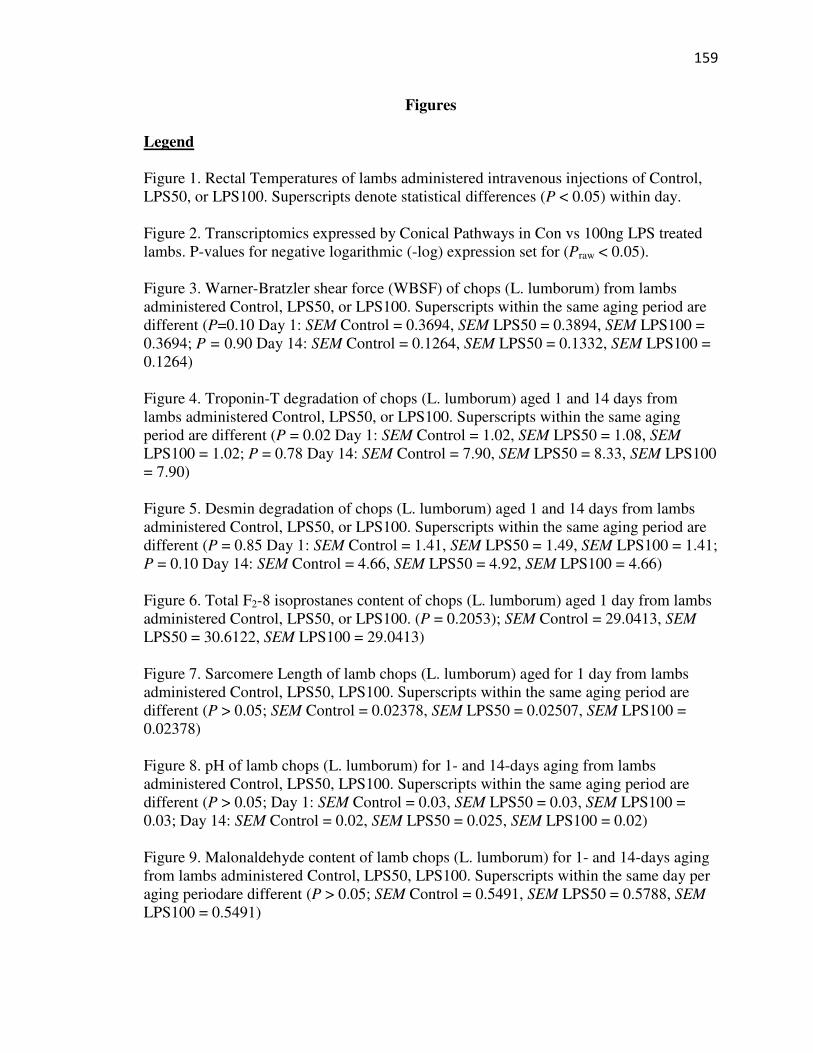
159
Figures
Legend
Figure 1. Rectal Temperatures of lambs administered intravenous injections of Control,
LPS50, or LPS100. Superscripts denote statistical differences (P < 0.05) within day.
Figure 2. Transcriptomics expressed by Conical Pathways in Con vs 100ng LPS treated
lambs. P-values for negative logarithmic (-log) expression set for (Praw < 0.05).
Figure 3. Warner-Bratzler shear force (WBSF) of chops (L. lumborum) from lambs
administered Control, LPS50, or LPS100. Superscripts within the same aging period are
different (P=0.10 Day 1: SEM Control = 0.3694, SEM LPS50 = 0.3894, SEM LPS100 =
0.3694; P = 0.90 Day 14: SEM Control = 0.1264, SEM LPS50 = 0.1332, SEM LPS100 =
0.1264)
Figure 4. Troponin-T degradation of chops (L. lumborum) aged 1 and 14 days from
lambs administered Control, LPS50, or LPS100. Superscripts within the same aging
period are different (P = 0.02 Day 1: SEM Control = 1.02, SEM LPS50 = 1.08, SEM
LPS100 = 1.02; P = 0.78 Day 14: SEM Control = 7.90, SEM LPS50 = 8.33, SEM LPS100
= 7.90)
Figure 5. Desmin degradation of chops (L. lumborum) aged 1 and 14 days from lambs
administered Control, LPS50, or LPS100. Superscripts within the same aging period are
different (P = 0.85 Day 1: SEM Control = 1.41, SEM LPS50 = 1.49, SEM LPS100 = 1.41;
P = 0.10 Day 14: SEM Control = 4.66, SEM LPS50 = 4.92, SEM LPS100 = 4.66)
Figure 6. Total F2-8 isoprostanes content of chops (L. lumborum) aged 1 day from lambs
administered Control, LPS50, or LPS100. (P = 0.2053); SEM Control = 29.0413, SEM
LPS50 = 30.6122, SEM LPS100 = 29.0413)
Figure 7. Sarcomere Length of lamb chops (L. lumborum) aged for 1 day from lambs
administered Control, LPS50, LPS100. Superscripts within the same aging period are
different (P > 0.05; SEM Control = 0.02378, SEM LPS50 = 0.02507, SEM LPS100 =
0.02378)
Figure 8. pH of lamb chops (L. lumborum) for 1- and 14-days aging from lambs
administered Control, LPS50, LPS100. Superscripts within the same aging period are
different (P > 0.05; Day 1: SEM Control = 0.03, SEM LPS50 = 0.03, SEM LPS100 =
0.03; Day 14: SEM Control = 0.02, SEM LPS50 = 0.025, SEM LPS100 = 0.02)
Figure 9. Malonaldehyde content of lamb chops (L. lumborum) for 1- and 14-days aging
from lambs administered Control, LPS50, LPS100. Superscripts within the same day per
aging periodare different (P > 0.05; SEM Control = 0.5491, SEM LPS50 = 0.5788, SEM
LPS100 = 0.5491)

160
39.3
b
39.4
b 39
.2b
39.2
39.1
39b
39.1
39.2
39
.7a
40a
39.8
a
39.3
39
.2
39
.3a
39.3
39.2
40a4
0.3
a 40.2
a
39.3
39.2
39
.2a
39.1
39
.3
38
38
.539
39
.540
40
.5
04
81
21
62
02
42
83
23
64
04
44
85
25
66
06
46
87
2
TEMPERATURE (°C)
TIM
E (
HO
UR
S)
Con
trol
LP
S50
LP
S100
Fig
ure
1. R
ecta
l T
emper
ature
s of
lam
bs
adm
inis
tere
d i
ntr
aven
ous
inje
ctio
ns
of
Contr
ol,
LP
S50, or
LP
S100.
a-bW
ith
in a
tim
e d
eno
tes
sig
nif
ican
t d
iffe
ren
ce (
P <
0.0
5).

161
Figure 2: Conical Pathway Expression between Con and 100ng LPS treatments. Pathway Expressions
are statistically significant (P < 0.05).
Color Scheme: Orange – Upregulated to 100ng LPS; Blue – Upregulated to Con
Numerical Values denote degree of z-score (Positive = Upregulated to 100ng LPS; Negative =
Upregulated to Con)

162
Figure 3. Warner-Bratzler shear force (WBSF) of chops (L. lumborum) from lambs
administered Control, LPS50, or LPS100. Superscripts within the same aging period are
different (P=0.10 Day 1: SEM Control = 0.3694, SEM LPS50 = 0.3894, SEM LPS100 =
0.3694; P = 0.90 Day 14: SEM Control = 0.1264, SEM LPS50 = 0.1332, SEM LPS100 =
0.1264)
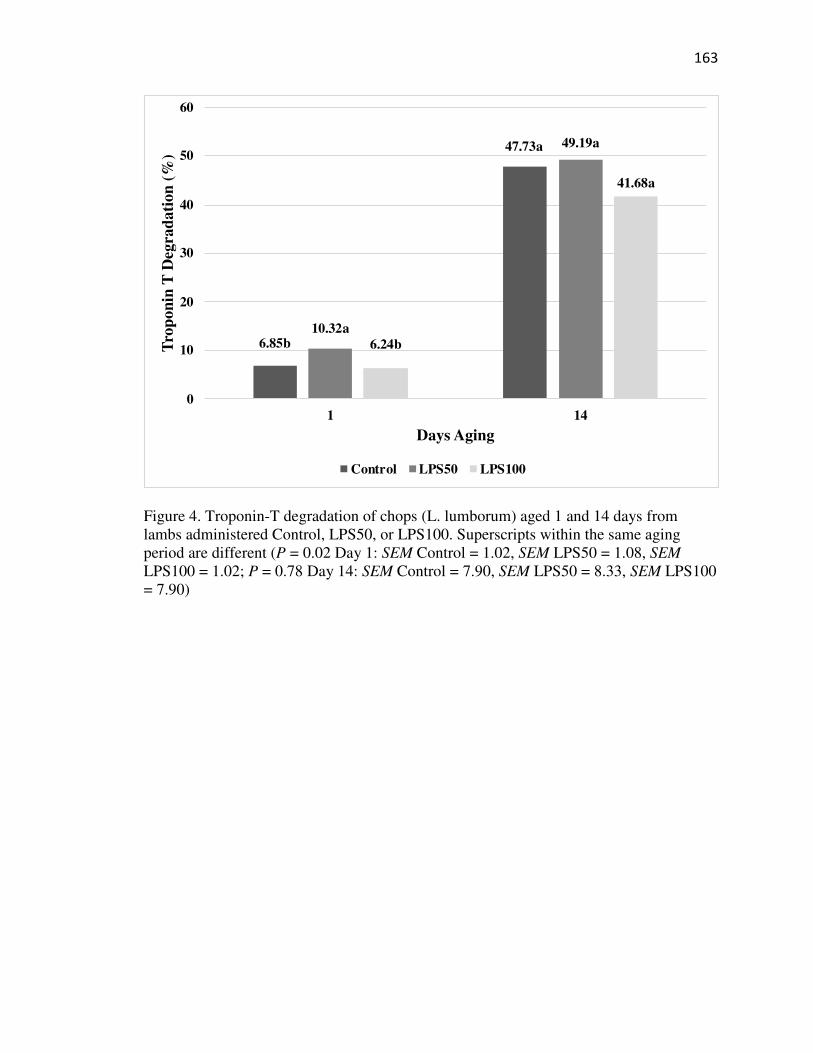
163
Figure 4. Troponin-T degradation of chops (L. lumborum) aged 1 and 14 days from
lambs administered Control, LPS50, or LPS100. Superscripts within the same aging
period are different (P = 0.02 Day 1: SEM Control = 1.02, SEM LPS50 = 1.08, SEM
LPS100 = 1.02; P = 0.78 Day 14: SEM Control = 7.90, SEM LPS50 = 8.33, SEM LPS100
= 7.90)
6.85b
47.73a
10.32a
49.19a
6.24b
41.68a
0
10
20
30
40
50
60
1 14
Tro
pon
in T
Deg
rad
ati
on
(%
)
Days Aging
Control LPS50 LPS100

164
Figure 5. Desmin degradation of chops (L. lumborum) aged 1 and 14 days from lambs
administered Control, LPS50, or LPS100. Superscripts within the same aging period are
different (P = 0.85 Day 1: SEM Control = 1.41, SEM LPS50 = 1.49, SEM LPS100 = 1.41;
P = 0.10 Day 14: SEM Control = 4.66, SEM LPS50 = 4.92, SEM LPS100 = 4.66)
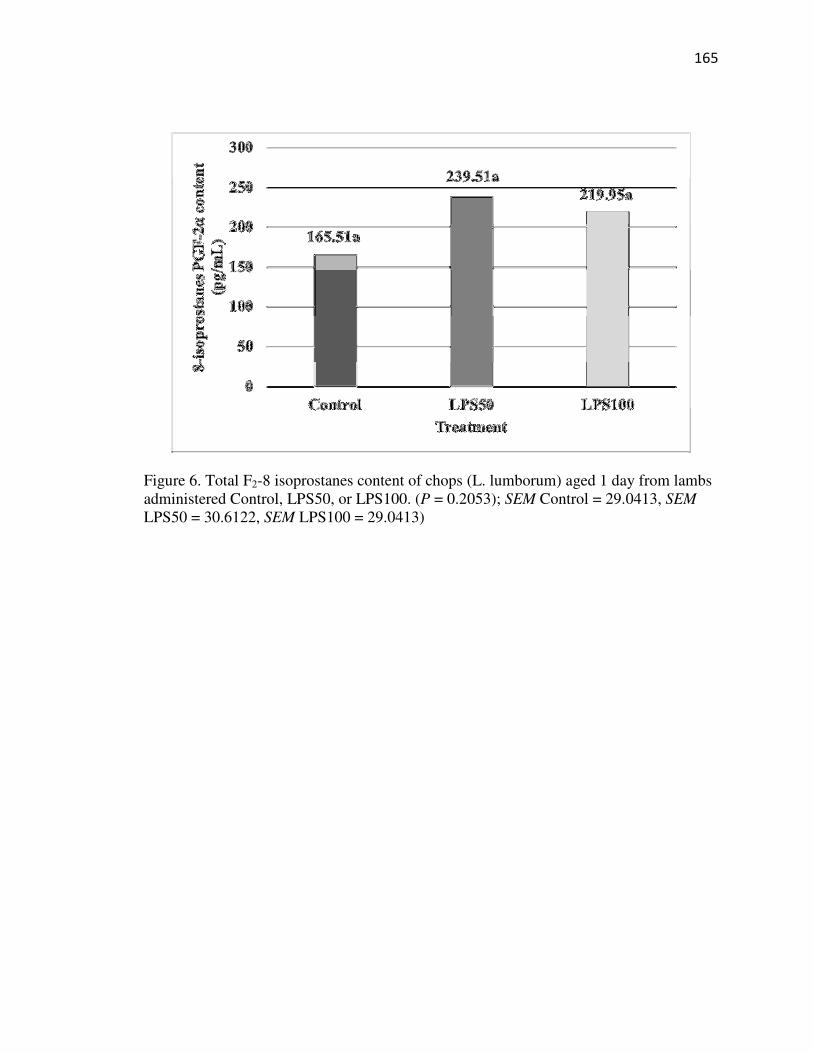
165
Figure 6. Total F2-8 isoprostanes content of chops (L. lumborum) aged 1 day from lambs
administered Control, LPS50, or LPS100. (P = 0.2053); SEM Control = 29.0413, SEM
LPS50 = 30.6122, SEM LPS100 = 29.0413)

166
Figure 7. Sarcomere Length of lamb chops (L. lumborum) aged for 1 day from lambs
administered Control, LPS50, LPS100. Superscripts within the same aging period are
different (P > 0.05; SEM Control = 0.02378, SEM LPS50 = 0.02507, SEM LPS100 =
0.02378)
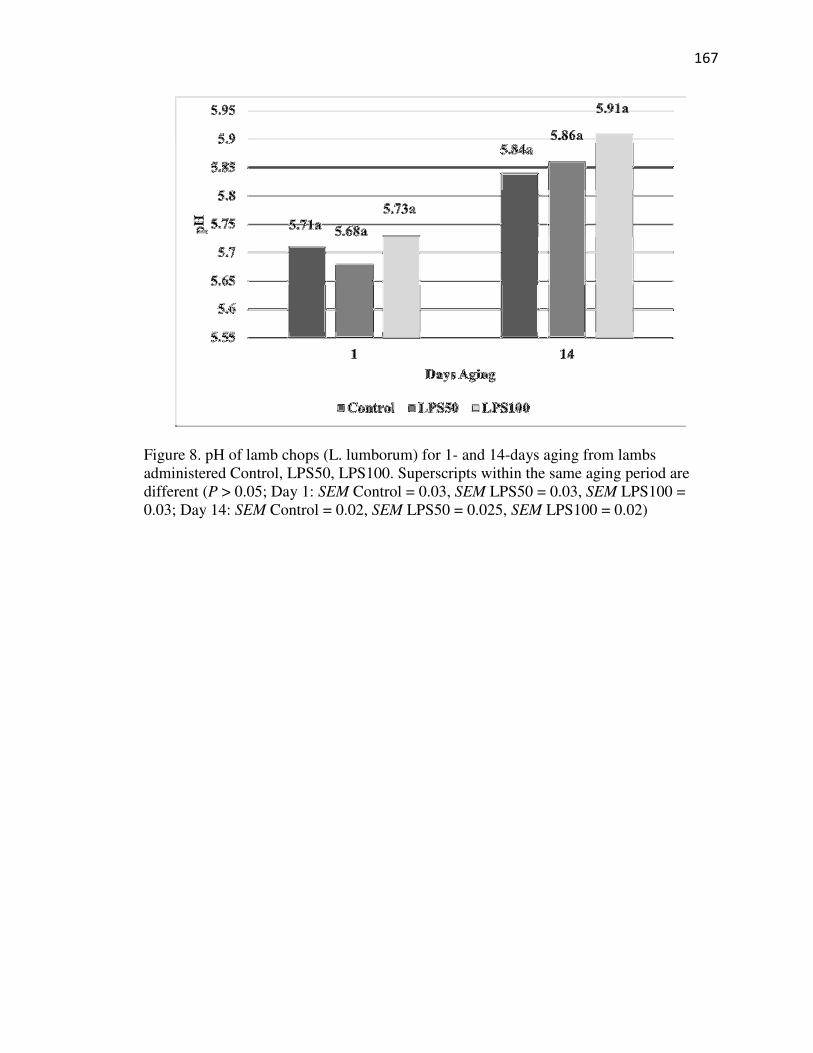
167
Figure 8. pH of lamb chops (L. lumborum) for 1- and 14-days aging from lambs
administered Control, LPS50, LPS100. Superscripts within the same aging period are
different (P > 0.05; Day 1: SEM Control = 0.03, SEM LPS50 = 0.03, SEM LPS100 =
0.03; Day 14: SEM Control = 0.02, SEM LPS50 = 0.025, SEM LPS100 = 0.02)

168
Figure 9. Malonaldehyde content of lamb chops (L. lumborum) for 1- and 14-days aging
from lambs administered Control, LPS50, LPS100. Superscripts within the same day per
aging periodare different (P > 0.05; SEM Control = 0.5491, SEM LPS50 = 0.5788, SEM
LPS100 = 0.5491)
169
RECOMMENDATIONS FOR FUTURE RESEARCH
Given the complexity of oxidative stress, there is a multitude of methods which could be
used to evaluate its impact on meat quality. When analyzing in vivo oxidative stress on
meat quality, I would recommend further exploration in the degree of oxidative stress by
varying levels of lipopolysaccharide administration, as well as evaluate the amount of
time in which animals are exposed to an oxidative stress challenge. Furthermore, I would
explore the generation of oxidative stress markers in conjunction with known factors
associated with oxidative stress in livestock, such as diet inclusions, housing techniques,
and genetic backgrounding. Additionally, I would recommend the evaluation of oxidative
stress by profiling the composition of reactive species generated within muscle tissue
using a set of conditions known to induce oxidative stress. Finally, I would compare the
overall impact of oxidative stress across a multi-muscle analysis. Given the vast
differences in histochemical and morphological characteristics across muscles, an
inherent change on the impact of meat quality due to oxidative stress is likely, and could
expand our knowledge on the impact of oxidative stress factors and their relationship to
pre- and postmortem mechanisms responsible for meat quality.

170
APPENDIX
Appendix I: Lamb Diet Composition*
Ingredient Unit (lb/Ton) Composition (%)
Cracked Corn 1051 52.55
Soybean Hulls 400 20
Oats 300 15
Soybean Meal –
47%
100 5
Liquid Molasses 100 5
Limestone 20 1
Salt 10 0.5
Urea 10 0.5
Ammonium
Chloride
8 0.4
Vitamin A-D-E 0.2 0.01
Diet Nutritional Composition
Crude Protein 13.57%
Non-Detergent Fiber 24.28%
Total Digestible Nutrients 8485%
Calcium 0.56%
Phosphorus 0.34%
Potassium 0.78%
*-Formulation Developed by Eastern Nebraska Research and Extension (1071 Co
Rd G, Ithaca, NE 68033)
*-Low quality brome hay was given to lambs daily as a 1% of total body weight
to ensure proper gut maintenance.
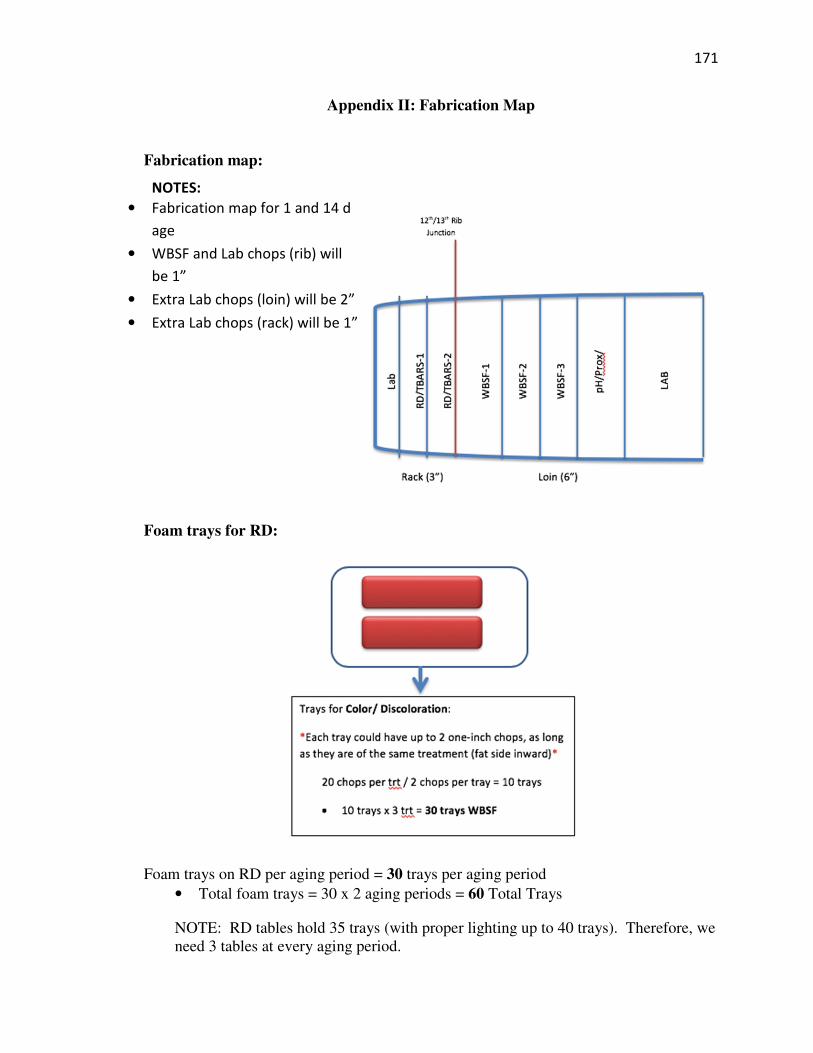
171
Appendix II: Fabrication Map
Fabrication map:
Foam trays for RD:
Foam trays on RD per aging period = 30 trays per aging period
• Total foam trays = 30 x 2 aging periods = 60 Total Trays
NOTE: RD tables hold 35 trays (with proper lighting up to 40 trays). Therefore, we
need 3 tables at every aging period.
NOTES:
• Fabrication map for 1 and 14 d
age
• WBSF and Lab chops (rib) will
be 1”
• Extra Lab chops (loin) will be 2”
• Extra Lab chops (rack) will be 1”
172
Vacuum bags: Size: 6 x 12
Lab samples: 32 animals x 2 aging periods x 2 lab samples = 128 bags
Size: 14 x 24
Loins: 32 samples x 1 (14 d age) = 32 bags
Additional supplies:
• Powdering bags (~32 x 2(age) x 2(RD) = 128 bags )
• Liquid Nitrogen (~4-5 tanks)
Tags needed:
• At the meat lab (Sample # - Age – Purpose – Replication):
o UNL Carcass Tags = Set of 1-32
� Ex.
• UNL 1
• 32 tags total
o Cardstock for WBSF = Sets of 1-32 (laminated)
� Ex:
• 1-1-WBSF-1, 1-1-WBSF-2, 1-1-WBSF-3
• 1-14-WBSF-1, 1-14-WBSF-2, 1-14-WBSF-3
• 192 tags total
o Cardstock for Aging = Set of 1-32 (1 day aged samples will not require
tags, as samples will be fabricated for WBSF and Lab samples)
(laminated)
� Ex:
• 1-14-Aging
• 32 tags total
o Cardstock for LAB samples = Sets of 1-32 (laminated)
� Ex:
• 1-1-LAB
• 1-14-LAB
• 64 tags total
o Cardstock for LAB (Rib) Extra samples = Sets of 1-32 (laminated)
� Ex:
• 1-1-LAB-Xtra
• 1-14-LAB-Xtra
• 64 tags total
o Color/Discoloration (adhesive tags) = Sets of 1-32
� Ex:
• 1-1-Color-7RD-1
• 1-1-Color-7RD-2

173
• 1-14-Color-7RD-1
• 1-14-Color-7RD-2
• 128 tags total
174
Appendix III
RNA Extraction
1. Heat Incubator to 55ºC.
2. Clean work area with RNaseZap.
3. Add 10 $L of �-mercaptoethanol, per 1 mL of Buffer RLT before use.
a. Buffer RLT containing �-ME can be stored at room temperature (15-
25 ºC) for up to 1 month.
b. For 16 samples, 50 $L into 5 mL.
4. Clean weigh dish, tweezers and razor blade with 70% ethanol.
5. Pull tissue out of -80 ºC freezer. Weigh ≤ 30mg tissue and put into 1.5mL
tube.
6. Add 300$L Buffer RLT solution. Vortex till broken up.
7. Homogenize with hand-held pestle for ~30 seconds.
8. Add 10 $L proteinase K solution.
9. Add 590$L RNase-free water and mix thoroughly by pipetting.
10. Incubate at 55ºC for 10 minutes.
11. Centrifuge for 3 minutes at 10,000 x g.
12. Transfer the supernatant (approximately 900$L) into a new 2.0mL
microcentrifuge tube (not supplied). Avoid transferring any of the pellet.
13. Add 0.5 volumes (usually 450$L) of ethanol (96-100%) to the cleared lysate.
Mix well by pipetting up and down. Do NOT centrifuge.
14. Transfer 700 $L of the sample to an RNeasy Mini spin column placed in a 2
mL collection tube. Centrifuge for 15 seconds.
15. Repeat step 7 using the remainder of the sample. Discard the flow-through.
16. Add 350 $L Buffer RW1 to the RNeasy spin column. Centrifuge for 15
seconds at ≥ 8,000 x g to wash the membrane. Discard the flow-through.
17. Add 10 $L DNase I stock solution to 70 $L Buffer RDD. Mix by gently
inverting the tube, and centrifuge briefly to collect residual liquid from the
sides of the tube. Note: DNase I is especially sensitive to physical
denaturation. Mixing should only be carried out by gently inverting the tube.
Do not vortex.
18. Add the DNase I incubation mix (80 $L) directly to the RNeasy spin column
membrane, and place on the benchtop for 15 minutes. Note: Be sure to add
DNase I incubation mix directly to RNeasy spin column membrane. DNase
digestion will be in complete if part of the mix sticks wo the walls or the O-
ring of the spin column.
19. Add 350 $L Buffer RW1 to the RNeasy spin column. Centrifuge for 15
seconds at ≥ 8,000 x g. Discard the flow-through.
20. Add 500 $L Buffer RPE to the RNeasy spin column. Centrifuge for 15
seconds at ≥ 8,000 x g. Discard the flow-through.
175
21. Add 500 $L Buffer RPE to the RNeasy spin column. Centrifuge for 2 minutes
at ≥ 8,000 x g.
22. Place the RNeasy spin column in a new 2 mL collection tube (supplied), and
discard the old collection tube with the flow-through. Centrifuge at 14,000 x g
for 1 minute.
23. Place the RNeasy spin column in a new 1.5 mL collection tube (supplied).
Add 30-50 $L RNase-free water directly to the RNeasy spin column
membrane. To elute the RNA, centrifuge for 1 minute at ≥ 8,000 x g.
176
Appendix IV
Objective color (L* a* b*) calibration instructions and helpful tips
Minolta Calibration Procedures
1. Before Calibration:
Calibrate Minolta in the same temperature conditions as the measurements being
taken.
-Place the Minolta in the environment where samples will be measured about 5 to
10 minutes before calibrating so it can become equilibrated with the temperature.
Calibrate with the same materials as you will be taking measurements.
-If the measurement will not be taken directly on the meat surface, you must
calibrate the Minolta with the same material it will be measuring through. For
example, if you want to take readings from samples that are wrapped in overwrap,
you must put some overwrap around the measuring head “eye” while calibrating
using the white tile.
2. Turn the power to the measuring head ON.
3. Turn the power to the data processor ON while holding down the
[DELETE/UNDO] key at the same time.
-Release the [DELETE/UNDO] key when you hear a BEEP. (This action deletes
any previous data that might still be stored in the data processor)
4. When the screen turns on, the question “Initial set ok?” appears, press the
[Measure Enter] key.
5. Once you get to the measurement screen, press the [Index Set] key.
a. Use the arrows and the [Measure Enter] key to adjust all the following
settings:
i. Printer: On
ii. Color Space: Off
iii. Protect: On
iv. Auto Average: However many readings wanted per sample (1-
30)
v. Illuminant: D65
vi. Back Light: Off
vii. Buzzer: On
viii. Disp. Limit
b. Press the [Esc] key to return to the measurement screen.
177
6. Press the [Calibrate] key while in the measurement screen.
7. Enter in the numbers listed on the calibrating white tile for the D65 setting
using the following:
a. [<>] keys and the numeric pad
b. (The [<>] keys move the cursor)
c. D65 settings: Y: 93.13 x: 0.3164 y: 0.3330
8. Set up the measuring head so that it is resting on the LCD screen and the
“eye” is facing up.
a. Place the while calibration tile on the measuring head, near the middle
of the tile.
9. Press either the measurement button on the measuring head OR the [Measure
Enter] key on the data processor after making sure the ready lamp is ON.
a. Make sure the white tile is completely on the measuring head “eye”.
b. The calibration is complete after the lamp flashes 3 times and the
screen returns to the measurement screen.
c. Do not move the measuring head during calibration.
10. Press the [Color Space] key until the L* a* b* screen shows up.
11. Calibration is finished and the Minolta is ready.
a. To save battery life, turn both the measurer and data collector off after
calibration is finished until you need it for measuring. The calibration
and setting will not be erased.
b. When turning back on for measurements, ONLY turn on the power
buttons. DO NOT hold down the [DELETE/UNDO] key at the same
time. This will delete the calibration and settings and all of the steps
will have to be repeated.
Cleaning:
• Wipe machine down with a soft, clean dry cloth. Never use a solvents
such as thinner or benzene.
• If the white calibration tile becomes dirty, wipe it gently with a soft,
clean dry cloth. If dirt is difficult to remove, wipe it with lens cleaner
and cloth, then dry.
Minolta Helpful Tips
1. Make a separate date sheet
a. The Minolta prints out data with sample numbers 1 to 2000. In order to
correlate it back to a sample, you must make a separate data sheet that has
a place to record meat sample i.d. and its corresponding Minolta number.
2. Batteries
178
a. The measuring head requires 4 AAA batteries and the data processor
requires 4 AA batteries.
3. The auto protect setting
a. The Minolta can only record and store up to 2000 readings, once you go
past 2000 readings it will start deleting older readings.
b. When the auto protect is on it will automatically prevent the 2001st reading
from being taken so you cannot accidentally overwrite other data.
4. Auto Average Function
a. During calibration, if you set the Auto Average function to a reading
number above 1, for example 5, you only have to hit the measure button
once and it will automatically take all 5 readings then print out the
average.
b. It only allows a second or two between readings so make sure you are
paying attention and move the measuring head to where you want it before
it automatically takes the next reading.
5. Recalibrate regularly
a. If using the Minolta all day, or for long periods of time, make sure to
recalibrate it regularly.
6. DELETE/UNDO KEY
a. If you accidently take a reading, hitting the [DELETE/UNDO] key will
delete the last reading.
b. If you accidently delete a reading by hitting the [DELETE/UNDO] key,
hitting the [DELETE/UNDO] key again will restore the previous reading.
7. Printing Paper
a. The paper that the data is printed on is sensitive to heat and light. The
printed data should be kept in a dark cool place, like a desk drawer. In
order to prevent losing any data, you must make a photocopy of the
printout in order to preserve it for long-term storage.
8. More than One Color Space on Print Out
a. If you want to print more than 1 color space (Example: L* a* b* and
XYZ) on the print out slip:
i. Press the [Index Set] key. Use the arrows and the [Measure Enter]
key to adjust all the following settings:
1. Color Space: On
2. Disp. Limit: press the [Measure Enter] key to select this
option.
3. Once inside the Disp. Limit option, go through the list and
change all the color spaces that you DO NOT want to OFF.
4. Press the [Esc] key until you return to the measurement
screen.

179
9. Change Measurements to a Different Color Space
a. If you get done measuring and realize that you meant to measure in a
different color space (For example: measured everything using Yxy and
meant to use L*a*b*), you can correct it using these steps:
i. While in the measurement screen, press the [Color Space] key until
your desired color space (in this example: L*a*b*) appears.
ii. Press the [Data List] key while in the measurement screen.
iii. Select the desired page using the up and down arrows. If you only
have one page it will show up as P00, select this one.
iv. Once you have the desired page selected, press the [Measure
Enter] key.
v. Press the [Print/Feed] key.
vi. Select “All Meas. Data” using the up and down arrows.
vii. Press the [Measure Enter] key. This will reprint all the stored data
in your newly selected color space.
viii. Press the [Esc] key to return to the measurement screen.
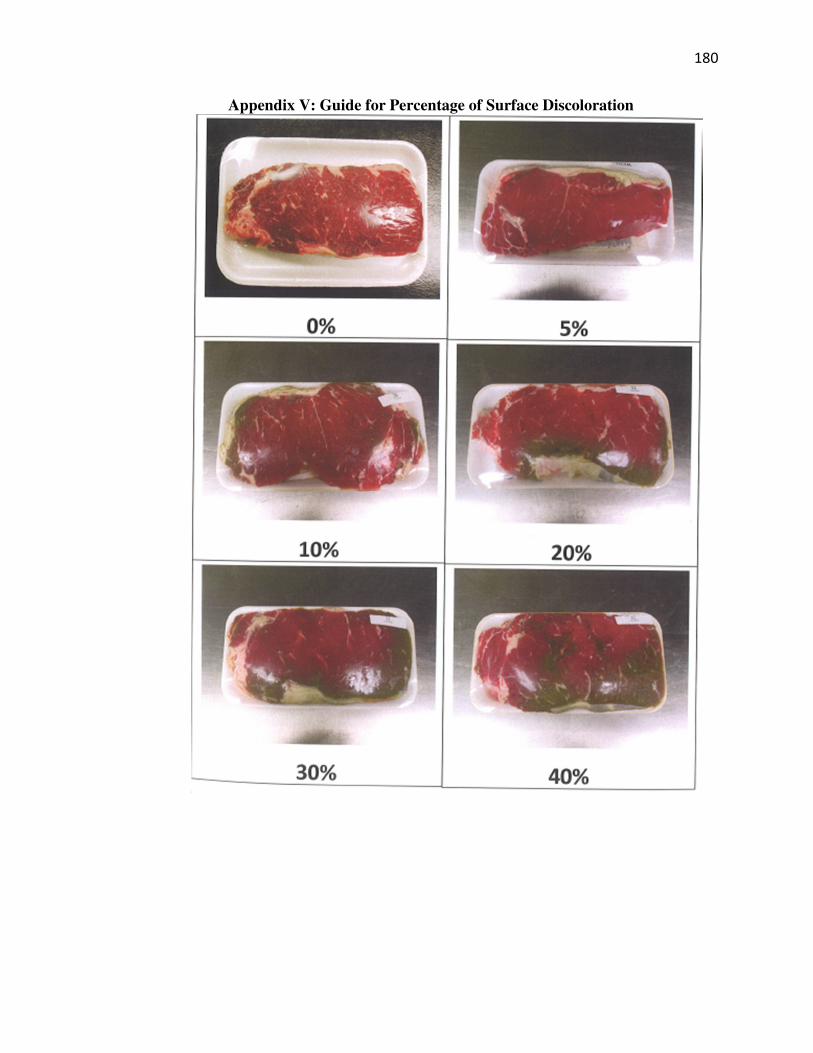
180
Appendix V: Guide for Percentage of Surface Discoloration

181
182
Appendix VI
Fat extraction with Soxhlet method
Warning: Ether is extremely flammable and produces explosive peroxides. Never bring
a radio or any other potentially spark-producing item into the fat extraction room.
1. Check ground glass connections. They should be wiped clean with a dry paper
towel and given a then coating of stopcock grease.
2. Each boiling flack must contain boiling stones. This helps prevent violent boiling
of the solvent which could be dangerous.
3. Load samples into Soxhlet tubes, arrange them so that no samples are above the
level of the top bend in the narrower tubing on the outside of the Soxhlet. (The
Soxhlet will only fill with the solvent up to this point before cycling back down
into the boiling flask.) In general, the large soxhlets will hold about 20 two-gram
samples and the small soxhlets from 4-6.
4. Fill the large (500mL) boiling flasks with 400mL of solvent and the small
(125mL) flasks with 100mL of solvent. Do this under the fume hood.
5. Fit the Soxhlet onto the boiling flask. Very carefully, bring the assembly into the
extraction room and fit it onto the condenser. Make sure all ground glass
connections are snug and each boiling flask is resting on the heating element. The
ceramic fiber sheet should be covering the bare metal surfaces on the burners
completely.
6. Turn on the water supply to the condensers (usually a quarter turn). Check later to
make sure condensers are cool enough – if not, increase water flow.
7. Turn heating element control dials between three and four. Each burner has its
own dial. Never turn the burner beyond five. Ether has a very low boiling point
and violent boiling is dangerous. Double check fittings, boiling stones, etc.
8. Fat extraction will take from 24 to 72 hours depending on the sample. (Beef – 48
hours, Bacon – 72 hours). Check extractions twice daily to see that everything is
alright while they are running.
9. When done, turn off the burners and let solvent cool completely before removing
samples.
10. After it has cooled down, slowly uncouple the flask and Soxhlet tube from the
condenser. Cover the top of the Soxhlet with one palm so as to reduce ether
vapors while transporting it to the fume hood. Air dry samples in the fume hood
for two hours to get rid of the remaining ether in the samples. Pour ether back
slowly into and approved container for reuse or discarding. Do not leave ether out
of the hood or the flammable cabinet.
11. Place samples in drying oven (105°C) for about four hours or overnight before
weighing back.
Calculation: ([(Original weight including filter paper and paper clip – Fat extracted
sample weight)/ Sample weight] * 100) - % Moisture = % Fat
183
Appendix VII
Minerals and Ash Determination
1. Place crucible in drying oven at 100ºC for 4 hours and then in a desiccator.
2. Place 2 grams of pulverized muscle tissue into the crucible in duplicates.
3. Moisture and ash are determined with the following program:
Name Covers Ramp Rate Ramp Time
(minutes)
Start Temp
(ºC)
End Temp
(ºC)
Moisture Off 6 d/m 17 25 130
Ash Off 20 d/m 30 130 600
Name Atmosp. Flow Rate Hold Time
(minutes)
Constant
Weight
Constant
Weight
Time
(minutes)
Moisture N High 0 0.05% 9
Ash O High 0 0.05% 9
Crucible density and cover density were set at 3.00, while sample density was set
at 1.00. The calculations to determine moisture and ash are the following:
Moisture = [(Initial weight – Dry weight)/Initial weight] * 100
Ash = (Weight of ash/Initial weight) * 100
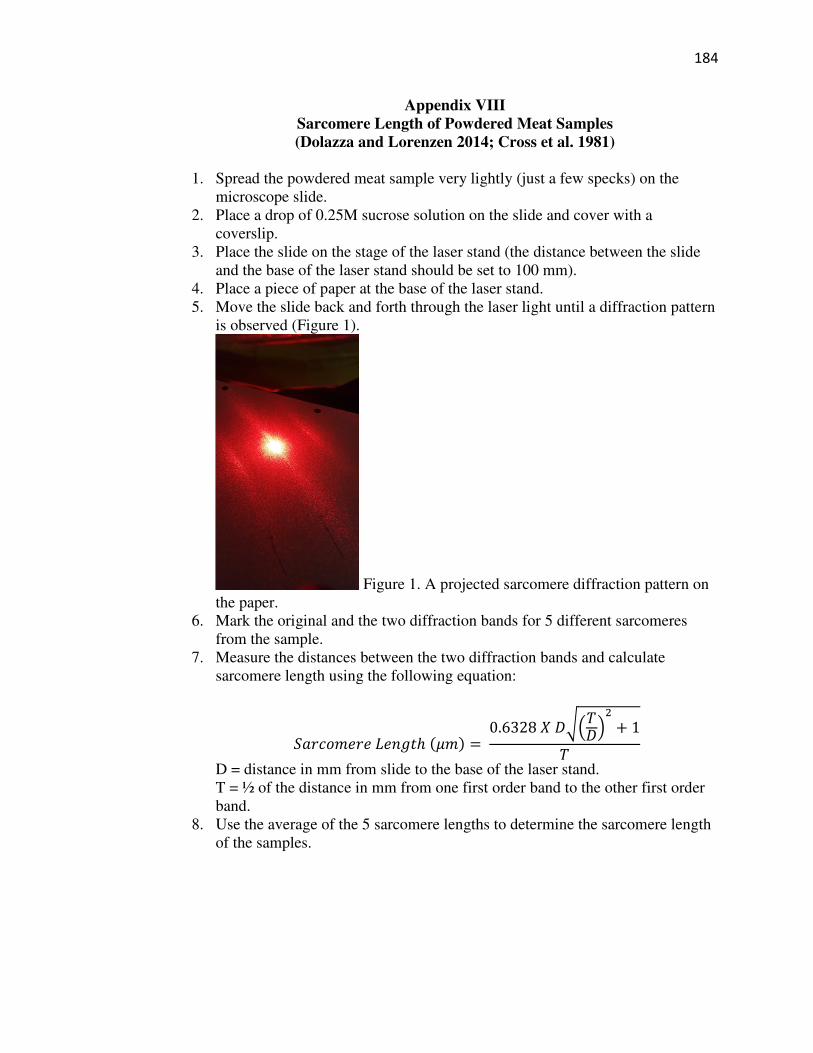
184
Appendix VIII
Sarcomere Length of Powdered Meat Samples
(Dolazza and Lorenzen 2014; Cross et al. 1981)
1. Spread the powdered meat sample very lightly (just a few specks) on the
microscope slide.
2. Place a drop of 0.25M sucrose solution on the slide and cover with a
coverslip.
3. Place the slide on the stage of the laser stand (the distance between the slide
and the base of the laser stand should be set to 100 mm).
4. Place a piece of paper at the base of the laser stand.
5. Move the slide back and forth through the laser light until a diffraction pattern
is observed (Figure 1).
Figure 1. A projected sarcomere diffraction pattern on
the paper.
6. Mark the original and the two diffraction bands for 5 different sarcomeres
from the sample.
7. Measure the distances between the two diffraction bands and calculate
sarcomere length using the following equation:
<�=>?@A=ABACDEℎ($@) = 0.6328./0F2/G
3 5 12
D = distance in mm from slide to the base of the laser stand.
T = ½ of the distance in mm from one first order band to the other first order
band.
8. Use the average of the 5 sarcomere lengths to determine the sarcomere length
of the samples.

185
Appendix IX
Fatty Acid Determination
1. Weight out 1 gram of pulverized muscle tissue. If extracting subcutaneous fat,
weight out 0.1 gram of pulverized subcutaneous fat into centrifuge tube.
2. Add 5 mL of 2:1 chloroform: methanol (v/v) for muscle tissue for 3 mL for
subcutaneous fat.
3. Vortex for 5 seconds and let stand for 1 hour at room temperature.
4. Filter homogenate through Whatman #2 filter paper into 13 x 150 mm screw
cap tube bringing the final volume with chloroform: methanol to 10 mL for
muscle lipid and 5 mL for subcutaneous fat extract. If stopping at this point,
purge test tube with nitrogen, cap tube, and store at -80ºC.
5. Add 2 mL of a 0.74% KCl solution for muscle lipid extract or 1 mL for
subcutaneous fat tissue extract and vortex for 5 seconds. If stopping at this
point, purge test tube with nitrogen, cap tube, and store at 0 ºC for no more
than 24 hours.
6. Centrifuge samples at 1,000 x g for 5 minutes. Following centrifugation,
aspirate off the aqueous phase (top layer). If stopping at this point, purge test
tube with nitrogen, cap tube, and store at -80ºC.
7. Evaporate to dryness under nitrogen at 60ºC.
8. Add 1 mL of a 0.5 M NaOH in methanol. Vortex for 5 seconds. Heat for 10
minutes at 100ºC.
9. Add 1 mL of boron trifluoride in 14% methanol. Vortex for 5 seconds. Heat
for 10 minutes at 100ºC.
10. Add 2 mL of a saturated salt solution and 2 mL of hexane. Vortex for 5
seconds.
11. Centrifuge samples at 1,000 x g for 5 minutes. Following centrifugation,
remove hexane layer (top layer) making sure to not disrupt the aqueous
phase (lower layer) and place in GC vial. Purge GC vial with nitrogen, cap
and crimp cap, and store at -80ºC until sample is ready to be read on the GC.
GC Settings
Column- Chromopack CP-Sil 88 (0.25mm x 100mm)
Injector Temp- 270 ºC
Detector Temp- 300 ºC
Heat Pressure- 40 psi
Flow Rate- 1.0 mL/minute
Temperature Program- Start at 140 ºC and hold for 10 minutes. Following 10 minutes,
raise temperature 2 ºC/minute until temperature reaches 220 ºC. At 220 ºC, hold for 20
minute.
186
Appendix X
Determination of Free-Calcium Level
(Parrish et al. 1981. J. Food Sci. 46:38-311 with modifications)
1. Analyze each sample in duplicates.
2. Mince frozen steak by using a stainless-steel knife (avoid fat and connective
tissues).
3. Measure 3 g of minced meat into a thickwall polyallomer ultracentrifuge tube
(13 x 55mm) and centrifuge at 196,000 x g for 30 min at 4 ºC.
4. Pipette 700$L of the supernatant into an eppendorf tube.
5. Treat the supernatant with 0.1 mL of 27.5% trichloroacetic acid and vortex for
15 s.
6. After standing for 10 min at room temperature, centrifuge eppendorf tubes at
6,000 rpm for 10 min.
7. Pipette 500$L of the supernatant into a plastic tube and bring up the volume
to 5 mL with deionized ddH2O.
8. Filter prepared samples through a 13 mm diameter Millex-LG 0.20 $m
syringe filter (Millipore, Bedford MA) into a new tube.
9. Send prepared samples to the Ward Laboratories (Kearney, NE) for calcium
level determination.
10. Calcium concentrations (ppm) of samples are quantified at the Ward
Laboratories (Ward Laboratories, Kearney, NE) using the inductively-coupled
plasma emission spectrometer (iCAP 6500 Radical; Thermo Electron
Corporation, Cambridge, UK) with appropriate calcium concentration
standards.
11. Calcium concentrations are calculated as follows:
Average ppm of Calcium in the sample = X ppm = X mg/L
Molecular weight of Calcium = 40.078 g
Micromolar ($M) concentration of calcium = (X x 1000)/40.078 $M

187
Appendix XI
Thiobarbituric Acid Reactive Substances Assay
TEP solution (1,1,3,3-Tetraethoxypropane)(Make new weekly)
Stock Solution: Dilute 99$L TEP (97%) bring volume to 100 mL ddH2O.
Working Solution: Dilute stock solution to 1:3 (TEP Solution:ddH2O)(1 x 10⁻³
M).
TBA/TCA (2-Thiobarbaturic Acid/Trichloroacetic Acid) Stock Solution: 1L
15% TCA (w/v) and 20mM TBA (MW: 144.5) reagent in ddH2O.
Dissolve 2.88g TBA w/warm ddH2O first, then add TCA (150g) and ddH2O to 1L.
BHA (Butylated Hydroxylanisole) stock Solution:
Make 10% stock solution by dissolving in 90% ethanol.
10 g BHA dissolved in 90 mL ethanol (90%) + 5 mL ddH2O.
Standards: In duplicate Moles of TEP
Blank: 1 mL ddH2O
Standard 5: 100 $L working TEP + 1.90 mL ddH2O (5 x 10⁻⁵
M)
Standard 4: 1 mL Std. 1 + 1 mL ddH2O (2.5 x 10⁻⁵
M)
Standard 3: 1 mL Std. 2 + 1 mL ddH2O (1.25 x 10⁻⁵
M)
Standard 2: 1 mL Std. 3 + 1 mL ddH2O (0.625 x 10⁻⁵
M)
Standard 1: 1 mL Std. 4 + 1 mL ddH2O (0.3125 x 10⁻⁵
M)
Remove 1 mL of Standard 1 and discard it, leaving 1 mL behind.
Procedure:
• Mix all reagent and standards before beginning.
• Transfer 5 g or powdered sample into a 50 mL conical tube; add 14 mL of ddH2O
and 1.0 mL of BHA.
• Homogenize for 15 sec with a polytron.
• Centrifuge for 2,000 x g for 5 min.
• Transfer 1 mL of homogenate or standard to 15 mL conical tube.
• Add 2 mL of TBA/TCA solution, vortex.
• Incubate in a 70 ºC water bath for 30 min to develop color.
• Cool samples in a cold water bath for 10 min.
• Centrifuge tubes at 2,000 x g for 15 min.
• Transfer duplicate aliquots of 200 $L from each tube into wells on a 96-well
plate.
• Read absorbance at 540 nm.
Calculations: mg of malonaldehyde/kg of tissue K(extraction) = (S/A) x MW x (10
6/E) x 100
Where, S = Standard concentration (1 x 10⁻⁸
) moles 1,1,3,3-Tetraethoxypropane)/5 mL
A = Absorbance of standard MW = MW of malonaldehyde (72.063 g/mole)
E = Sample equivalent (l) P = Percentage recovery
Final calculation: 0.012 x concentration x (72.063 x 10⁶) = mg of Malonaldehyde/kg of
tissue
Reagents (Sigma): TBA- T5500; TCA -T9159; TEP – T9889; BHA – B1253
188
Appendix: XII
Isolation of Myofibrillar Proteins
(Pietrzak et al., 1997, J. Anim. Sci. 75:2106-2116)
1. Knife mince frozen steaks after trimming visible fats and connective tissues.
2. Weigh 3 g of minced meat into a 50 mL plastic conical tube.
3. Add 15 mL ice-cold rigor buffer (0.1M KCl, 2 mM MgCl2, 1mM EGTA, and
10mM K2HPO4; pH 7.4) and homogenize using the polytron (POLYTRON
Kinimatica CH-6010, Switzerland) at very low speed for 15 min.
4. Filter the homogenate through double-layered cheese cloth to remove
connective tissue and fats into a new 50 mL plastic conical tube.
5. Pipette 1.4 mL homogenate into an eppendorf tube (2 mL safe-lock tubes;
02236352, Eppendorf AG, Hamburg, Germany).
6. Centrifuge eppendorf tubes at 4,000 x g for 5 min.
7. Decant the supernatant and dismantle the pellet using a cleaned spatula after
re-suspending in 1 mL of ice-cold rigor buffer.
8. Vortex the mixture for 10 s and centrifuge for 5 min at 4,000 x g.
9. Repeat step 6 and 7 three times to remove myoglobin as much as possible
(until the supernatant is clear and free of myoglobin).
10. Decant the supernatant and remove the leftover-supernatent using a pasture
pipette.
11. Re-suspend the pellet in 250 $L of ice-cold rigor buffer.
12. Vortex thoroughly after diminishing the pellet.
13. Store eppendorfs on ice for immediate use or in -80 ºC for later use.
Reagent preparation:
a. Rigor Buffer (0.1 M KCl, 2mM MgCl2, 1mM EGTA, and 10mM K2HPO4; pH
7.4)
Add 14.91 g of potassium chloride (KCl: MW 74.55), 380.84 mg of
magnesium chloride (MgCl2: MW 95.21), 760.7 mg of ethylene glycol
tetraacetic acid (EGTA: MW 380.35, and 3.484 g of potassium phosphate
dibasic (K2HPO4): MW 174.18) into 1900 mL of deionized ddH2O and
dissolved properly. Check the pH and volume up to 2000 mL. (if want to
adjust pH to 7.4, adjust using conc. HCl).
189
Appendix XIII
Troponin T Degradation
Protein Isolation
1. Weigh out 3 g powdered meat into a 50 mL plastic conical tube
2. Add 15 mL rigor buffer: 0.1 M KCl, 2mM MgCl2, 1 mM EDTA, and 10 mM
K2HPO4; pH 7.4.
3. Homogenize using polytron (POLYTRON Kinimatica CH-6010, Switzerland) at
medium speed (setting 6) for 5 sec bursts until fully mixed
4. Filter homogenate through double layered cheese cloth into a new 50 mL plastic
conical tube
5. Pipette 1.4 mL homogenate into an eppendorf tube (2 mL safe-lock tubes;
02236352, Eppendorf AG, Hamburg, Germany)
6. Centrifuge Eppendorf tubes at 4000 x g for 5 min
7. Decant supernatant
8. Resuspend pellet in 1 mL rigor buffer
9. Vortex for 10 sec or until pellet is sufficiently mixed into solution
10. Centrifuge for 4000 x g for 5 min
11. Repeat 6-10 two more times
12. Decant supernatant fully
13. Suspend pellet in 1 mL suspension buffer: 0.1M Tris, 1.25mM EDTA, 5% SDS;
pH 8
14. Vortex for 30 sec or until pellet is sufficiently mixed into solution
15. Centrifuge for 5 min at 4000 x g
16. Remove supernatant to new Eppendorf tube without removing remaining pellet.
This is the myofibrillar stock sample.
Protein Concentration
17. Dissolve 100 µL of myofibrillar protein stock samples in 0.9 mL of suspension
buffer (See step 13 in Protein Isolation) and vortex 10 sec
18. Prepare a concentration series (20-2000 µg/mL) of bovine serum albumin (BSA)
using suspension buffer
19. Place 25 µL BSA standards and diluted myofibriliar protein samples on a
microwell plate
20. Add 200 µL BCA working reagents (50:1; Reagent A:Reagent B) into respective
wells in the microwell plate
21. Mix protein samples and BCA working reagents thoroughly on a plate shaker for
30 sec
22. Incubate the microwell plate at 37oC for 30-40 min and cool to room temperature
23. Read absorbance at 562 nm on a microplate reader (SpectraMAX 250, Molecular
devices, Sunnyvale, California)
24. Protein concentrations are expressed as µg/mL
25. Dilute protein to 2 µg/µL with ddd water in new tubes

190
26. Dilute protein to 1 µg/µL with Laemmli / betamercaptoethanol mixture: 950 µL
Laemmli plus 50 µL betamercaptoethanol added.
27. Heat the tube on a heating block at 95oC for 5 min.
Gel Electrophoresis
28. Remove the Mini-PROTEAN TGX Precast Gel 4-20% from the package
29. Pull the tape off the bottom, remove the comb
30. Place into electrode assembly with short plate inward
31. Place second gel on the other end of the assembly
32. Lock the two gels in place
33. Place the assembly in the tank
34. Fill the chamber with Bio Rad 1x Tris/Glycine/SDS # 161-0732 running buffer
until the short plate is completely covered
35. Add buffer to the outer tank to either 2 or 4 gel line, depending on how many gels
you are running
36. Load 10 µL Bio-Rad Kaleidoscope Pre-stained standards in the first well
37. Load 5 µL sample into remaining wells
38. Place lid on tank, aligning color coded banana plugs and jacks
39. Set constant voltage to 200 V
40. Run until tracking dye in the Laemmle buffer of each sample reaches the black
finishing line (30 minutes to an hour)
41. Turn off power supply
42. Remove gel from assembly
43. Remove gel by gently opening key provided in precast gel package
Western Blot
44. Equilibrate gel in transfer buffer (25 mM Tris-base, 192 mM glycine, 20%
methanol at pH 9.2) for 20 min
45. Soak precut filter paper (170-3932, Bio Rad Laboratories, Hercules CA) and fiber
pads in transfer buffer for 5 min
46. Wet PVDF membranes (IPFL20200, Millipore) in methanol for 15 second and
rinse briefly in deionized water before soaking in transfer buffer
47. Prepare the gel sandwich as follows:
a. Place the cassette with the black side (anode) down in the transfer buffer
in the cassette assembly box
b. Place one pre-wetted fiber pad on the black side of the cassette
c. Place filter paper on the fiber pad
d. Place equilibrated gel on filter paper (roll out all bubbles)
e. Place pre-wetted membrane on the gel (roll out all bubbles)
f. Place the other filter paper (roll out all the bubbles) and fiber pad
respectively
48. Close the cassette firmly without moving the gel and filter paper sandwich and
lock the cassette with the white latch
191
49. Place prepared sets in module
50. Place module in tank and fill with transfer buffer
51. Run Western blot for 60 min at a constant amperage of 180mA
52. To prevent nonspecific antibody binding, block membranes with 10 mL Odyssey
Blocking buffer (927-40100; LI-COR, Lincoln NE) for 120 mins at room
temperature
Primary Antibody Binding
53. Anti-Troponin-T (JLT-12: Sigma Aldrich, St. Louis, MO)
a. 1 µL in 10 mL Odyssey Blocking Buffer + 0.2% Tween20 (20µL)
54. Incubate blots in diluted primary antibody for 60 min at room temperature while
rocking
55. Incubate blots overnight at 4°C while rocking
56. Pour off primary antibody solution
57. Wash membrane four times for 10 min each with 15 mL of 1x Tris buffered saline
+ 0.1% Tween20 on rocking platform
Labeling Primary Antibodies
58. Reconstitute contents in the original IRDye 680LT conjugated goat anti-mouse
IgG1 vial with 0.5 mL sterile distilled water
59. Mix gently by inverting and allow rehydrating for at least 30 min before use (this
is stable for three months at 4oC) DO NOT EXPOSE TO LIGHT
a. 1 µL in 10 mL Odyssey Blocking Buffer + 0.2% Tween20 (20 µL)
60. Incubate blots in diluted secondary antibody for 60 min at room temperature with
gentle shaking (make sure not to expose to light)
61. Pour off secondary antibody solution
62. Wash membrane four times for 10 min each with 15 mL of 1x Tris buffered saline
+ 0.1% Tween20 on rocking platform
63. Wash membrane with 15 mL of 1x Tris buffered saline for 30 mins to remove
residual Tween20
Membrane Imaging
64. Use Odyssey Infrared Imaging System (LI-COR Biosciences, Lincoln NE) at 700
nm channel as integrated intensity
65. Imaging conditions:
a. Resolution: 169 nm
b. Quality: low
c. Focus: offset 0 mm
d. Channels: 700 nm
e. Intensity: 3.0 or 3.5
f. Image size: x-10 y-7

192
Appendix XIV
DESMIN
Whole-Muscle Protein Preparation
1. Weigh out of 400mg (0.4g) of powdered meat sample into a 50 mL plastic conical tube
2. Add 10mL of Whole-muscle Solubilizing Buffer ( 2%wt/vol SDS, 10mM sodium
phosphate buffer, pH 7.0).
3. Homogenize using polytron (POLYTRON Kinimatica CH-6010, Switzerland) at
medium speed (setting 6) for 5 sec bursts until fully mixed.
4. Filter homogenate through double layered cheese cloth into a new 50 mL plastic
conical tube.
5. Pipette 1.4 mL homogenate into an eppendorf tube (2 mL safe-lock tubes; 02236352,
Eppendorf AG, Hamburg, Germany).
6. Centrifuge samples at 1,500 x g for 15 min. at 25C to remove traces of insoluble
components.
7. Collect 1mL of supernatent, discard pellet. Place supernatent into 1.5mL eppendorf
tube.
Protein Concentration
66. Prepare a concentration series (20-2000 µg/mL) of bovine serum albumin (BSA)
using suspension buffer
67. Place 25 µL BSA standards and diluted myofibriliar protein samples on a
microwell plate
68. Add 200 µL BCA working reagents (50:1; Reagent A:Reagent B) into respective
wells in the microwell plate
69. Mix protein samples and BCA working reagents thoroughly on a plate shaker for
30 sec
70. Incubate the microwell plate at 37oC for 30-40 min and cool to room temperature
71. Read absorbance at 562 nm on a microplate reader (SpectraMAX 250, Molecular
devices, Sunnyvale, California)
72. Protein concentrations are expressed as µg/mL
73. Dilute sample to 6.4mg/mL using whole-muscle solubilizing buffer.
74. Dilute samples to a final protein concentration of 4mg/mL with 50% (volume of
original soultion in step 8) of gel buffer (3mM EDTA, 3%[wt/vol]SDS,
30%[vol/vol]glycerol, 0.001% pyronin Y [wt/vol], 30mM Tris-HCl, pH 8.0) and 10%
of 2-mercaptoethanol.
75. Heat samples for 15 minutes at approximately 50C and stored at -80C.
SDS-PAGE Electrophoresis
Supplies:
15% polyacrylamide separating gels.
193
Running Buffer (25mM Tris, 192mM glycine, 2mM EDTA, and 0.1%[wt/vol] SDS).
1. Remove the Mini-PROTEAN TGX Precast Gel 4-20% from the package
2. Pull the tape off the bottom, remove the comb
3. Place into electrode assembly with short plate inward
4. Place second gel on the other end of the assembly
5. Lock the two gels in place
6. Place the assembly in the tank
7. Fill the chamber with Bio Rad 1x Tris/Glycine/SDS # 161-0732 running buffer
until the short plate is completely covered
8. Add buffer to the outer tank to either 2 or 4 gel line, depending on how many gels
you are running
9. Load 10 µL Bio-Rad Kaleidoscope Pre-stained standards in the first well
10. Load 40ug sample into remaining wells
11. Place lid on tank, aligning color coded banana plugs and jacks
12. Set constant voltage to 360 V
13. Run until tracking dye in the Laemmle buffer of each sample reaches the black
finishing line (30 minutes to an hour)
14. Turn off power supply
15. Remove gel from assembly
16. Remove gel by gently opening key provided in precast gel package
Western Blotting 1. Equilibrate gel in transfer buffer (25 mM Tris-base, 192 mM glycine, 2mM EDTA,
and 15% [vol/vol] methanol at pH 9.2) for 20 min
2. Soak precut filter paper (170-3932, Bio Rad Laboratories, Hercules CA) and fiber
pads in transfer buffer for 5 min
3. Wet PVDF membranes (IPFL20200, Millipore) in methanol for 15 second and rinse
briefly in deionized water before soaking in transfer buffer
4. Prepare the gel sandwich as follows:
a. Place the cassette with the black side (anode) down in the transfer buffer
in the cassette assembly box
b. Place one pre-wetted fiber pad on the black side of the cassette
c. Place filter paper on the fiber pad
d. Place equilibrated gel on filter paper (roll out all bubbles)
e. Place pre-wetted membrane on the gel (roll out all bubbles)
f. Place the other filter paper (roll out all the bubbles) and fiber pad
respectively
5. Close the cassette firmly without moving the gel and filter paper sandwich and lock
the cassette with the white latch
6. Place prepared sets in module
7. Place module in tank and fill with transfer buffer
8. Run Western blot for 90 min at a constant amperage of 90V
9. To prevent nonspecific antibody binding, block membranes with PBS-TWEEN [10
mL Odyssey Blocking buffer (927-40100; LI-COR, Lincoln NE) and 0.1% TWEEN
20 (10uL)] containing 5% non-fat dry milk for 60 minutes at room temperature.
194
Primary Antibody
1. Use Monoclonal Anti-Desmin (D1033: Sigma Aldrich, St. Louis, MO)
Dilute total concentration solution as a 1:40,000 ratio with PBS-TWEEN20
solution.
2. Let rock for an hour at room temperature.
3. Let rock overnight at 4C (~12-18 hours).
4. After primary incubation blots, wash in PBS-Tween 3 time for 10 minute intevals.
Secondary Antibody
1. Reconstitute contents in the original IRDye 680LT conjugated goat anti-mouse IgG1
vial with 0.5 mL sterile distilled water
2. Mix gently by inverting and allow rehydrating for at least 30 min before use (this is
stable for three months at 4oC) DO NOT EXPOSE TO LIGHT
a. 1 µL in 10 mL Odyssey Blocking Buffer + 0.2% Tween20 (20 µL)
3. Incubate blots in diluted secondary antibody for 60 min at room temperature with
gentle shaking (make sure not to expose to light)
4. Pour off secondary antibody solution
5. Wash membrane four times for 10 min each with 15 mL of 1x Tris buffered saline +
0.1% Tween20 on rocking platform
6. Wash membrane with 15 mL of 1x Tris buffered saline for 30 mins to remove
residual Tween20
Membrane Imaging
1. Use Odyssey Infrared Imaging System (LI-COR Biosciences, Lincoln NE) at 700
nm channel as integrated intensity
2. Imaging conditions:
a. Resolution: 169 nm
b. Quality: low
c. Focus: offset 0 mm
d. Channels: 700 nm
e. Intensity: 3.0 or 3.5
f. Image size: x-10 y-7

195
Appendix XV
ISOPROSTANES
Sample Preparation:
1. Immediately after sample collection, powder meat and store in -80°C.
2. After storage, place 30 mg of powdered meat in 5 mL eppendorf tubes.
3. Homogenize sample in 2 mL of 2 N NaOH using Micropolytron. Spin for 20 seconds.
(Clean Micropolytron between each sample).
4. Heat homogenized sample in water bath at 45°C for 2 h to ensure hydrolysis.
5. After hydrolysis, cool tissue samples to room temperature (~20 minutes), then
neutralize pH using 2 mL of 2N HCl.
6. Split samples into two 2 mL eppendorf tubes. Using microcentrifuge, spin samples at
10,000 x g for 15 min at 4°C.
7. Before Assaying, check to be sure each neutralized sample is in the pH range of 6-8. If
not, adjust the pH to this range by adding 100µL of the sample to 100µL of the provided
Neutralization Solution.
8. Use supernatant for Assay Protocol
Preparation of 8-iso-PGF2α Standards:
1. Prepare fresh standards by diluting the 8-iso-PGF2α Standard from 200µg/mL to 0.2
µg/mL in Sample Diluent for a 1:1000 final dilution. (Example: Add 5 µL of 8-iso-
PGF2α Standard stock tube to 4.995 mL of Sample Diluent)
2. Prepare a series of the remaining 8-iso-PGF2α standards according to Table 1.
Standard Tubes 8-iso-PGF2α
Standard
(µL)
Sample
Diluent (µL)
8-iso-PGF2α
_Standard (pg/mL)
7 1 µL of Standard Stock 4999 µL 40,000
6 250 µL of Tube #1 750 µL 10,000
5 250 µL of Tube #2 750 µL 2,500
4 250 µL_of Tube #3 750 µL 625
3 250 µL of Tube #4 750 µL 156.25
2 250 µL of Tube #5 750 µL 39.0625
1 250 µL of Tube #6 750 µL 9.7656
0 0 µL
200 µL
0
196
Assay Protocol
Note: Each 8-iso-PGF2α Standard and unknown samples should be assayed in duplicate
or triplicate. A freshly prepared standard curve should be used each time the assay is
performed.
1a. Immediately before use, dilute the Anti-8-iso-PGF2α Antibody 1:1000 with Sample
Diluent.
1b. Add 100 µL of the diluted Anti-8-iso-PGF2α Antibody to the Goat Anti-Rabbit
Antibody Coated Plate. Incubate 1 hour at 25ºC on an orbital shaker.
2. Prepare 300 mL of 1x Wash Buffer by diluting 10x Wash Buffer Concentrate
- 30 mL 10x Wash Buffer Concentrate
- 270 mL Deionized Water
Warm Substrate solution to room temperature
3. Make Preparation of Isoprostanes Standards as labeled in Preparation of 8-iso-
PGF2α.
4. After incubation, remove the antibody solution from the wells. Wash wells 5 times
with 300 µL 1X Wash Buffer per well. After the last wash, empty the wells and tap
microwell plate on absorbent pad or paper towel to remove excess wash solution.
Note: Thorough washing is necessary to remove all of the azide present in the antibody
solution.
5a. Immediately before use, dilute the conjugate 1:80 with Sample Diluent. Only prepare
enough of the diluted conjugate for the number of wells immediately used.
5b. Combine 55 µL of the 8-iso-PGF2α standard or sample and 55 µL of 8-iso-PGF2α-
HRP conjugate in a microtube and mix thoroughly. Transfer 100 µL of the combined
solution per well. A well containing Sample Diluent can be used as a control. Incubate 1
hour at 25ºC on an orbital shaker.
197
6. After incubation, remove the combined solution from the wells. Wash 5 times with 300
µL of 1X Wash Buffer per well. After the last wash, empty wells and tap microwell plate
on absorbent pad or paper towel to remove excess wash solution.
7. Add 100 µL of Substrate Solution to each well. Incubate at room temperature for 15
minutes on an orbital shaker.
8. Stop the enzyme reaction by adding 100 µL of Stop Solution to each well. Results
should be read immediately (color will fade over time).
9. Read absorbance of each well on a microplate reader using 450 nm as the wavelength.
Copyright © 2022 FDOKUMEN