Morphological Characteristics of Brain Tumors Causing Seizures
Upload
dsm-academyCategory
view
4download
0
E
Nt
DPM
a
(b
c
d
RA
0d
pilepsy Research (2012) 99, 112—126
journa l homepage: www.e lsev ier .com/ locate /ep i lepsyres
on-invasive continuous EEG-fNIRS recording ofemporal lobe seizures
ang Khoa Nguyena,∗, Julie Tremblayb, Philippe Pouliotc,hetsamone Vannasingb, Olivia Floreab, Lionel Carmantb, Franco Lepored,ohamad Sawanc, Frédéric Lesagec, Maryse Lassondeb,d
Service de Neurologie, Centre Hospitalier Universitaire de Montréal (Hôpital Notre-Dame), 1560 rue Sherbrooke Est, MontréalQuébec) H2L 4M1, CanadaCentre de Recherche de l’Hôpital Sainte-Justine, Montréal, CanadaÉcole Polytechnique, Université de Montréal, Montréal, CanadaCentre de Recherche en Neuropsychologie et Cognition, Université de Montréal, Montréal, Canada
eceived 1 July 2011; received in revised form 20 October 2011; accepted 30 October 2011vailable online 17 November 2011
KEYWORDSEEG-fNIRS;Seizures;Haemodynamicresponse;Temporal lobeepilepsy
SummaryPurpose: Functional near-infrared spectroscopy (fNIRS) is a technique that allows continuousnon-invasive monitoring of tissue oxygenation and haemodynamics in the brain. By using com-bined EEG-fNIRS recordings, we sought to better understand the pathophysiology of temporallobe seizures.Results: Nine patients (5 males; mean age 35 years; range 11—56 years) with refractorymesial temporal lobe epilepsy underwent combined EEG-fNIRS recordings. Eight complex partialseizures from 3 patients were successfully recorded. All seizures were associated with significantlocal and remote haemodynamic changes which outlasted the duration of seizures. Over theepileptogenic temporal lobe, increased oxygenation [increase in cerebral blood volume (CBV)and oxyhaemoglobin (HbO), decrease in deoxyhaemoglobin (HbR)] was followed by a deoxy-genated state [increase in HbR]. A similar haemodynamic profile was seen over the contralateraltemporal lobe (even without evidence of epileptic propagation) though variations generally had
lower amplitudes. Heterogeneous haemodynamic changes in remote frontal and/or parietalareas were also noted early on when epileptic activity was limited to the temporal lobe.Conclusion: EEG-fNIRS reveals complex local and remote oxygenation changes during temporallobe seizures.© 2011 Elsevier B.V. All rights re∗ Corresponding author. Tel.: +1 514 890 8237; fax: +1 514 412 7554.E-mail address: [email protected] (D.K. Nguyen).
920-1211/$ — see front matter © 2011 Elsevier B.V. All rights reserved.oi:10.1016/j.eplepsyres.2011.10.035
served.

lobe
btsoieceSpeitTtritio
nanAasl2t2bgTism
M
P
NydoiwStEapmema
Continuous near-infrared spectroscopy imaging of temporal
Introduction
Near-infrared spectroscopy [functional near-infrared spec-troscopy (fNIRS)] is a light-based imaging technique whichmay be of great value in the study of epilepsy (Jöbsis, 1977;Irani et al., 2007; Lloyd-Fox et al., 2010). Near infraredlight projected onto the scalp by optical fibres is transmit-ted into the intact skull, penetrating into the brain anddiffusely propagating in the tissue. As it passes throughthe brain during these random scattering events, light isabsorbed by pigmented compounds, mainly haemoglobin.Sensor probes placed at a certain distance from the trans-mitting probes receive the scattered light back from thebrain tissue. By using one wavelength more sensitive todeoxygenated haemoglobin (HbR) (here 690 nm) and anothermore sensitive to oxygenated haemoglobin (HbO) (here830 nm), variations in amplitude of backscattered light canbe used to infer on local changes in blood oxygenation.Furthermore, assuming a constant haematocrit, changesin total haemoglobin (HbT = HbO + HbR) can be used asan indicator of cerebral blood volume (CBV) variations.Intracranial propagation of near-infrared light is affectedby multiple factors (e.g. age-dependent optical proper-ties of the scalp, skull, cerebrospinal fluid and brain,distance between the transmitting and receiving probes).In the adult head, the fNIRS signal mainly reflects theabsorption at a depth of one to two centimetres belowthe scalp when the inter-probe distance is set betweenthree to five centimetres. By performing measurementswith multiple sources and detectors distributed over thescalp, one obtains overlapping sensitivity profiles that allowthe spatial localization of absorption changes within thesuperficial cortex. Because focal epileptic seizures elicitan increase in regional CBV in the seizure focus (Penfieldand Jasper, 1954), continuous fNIRS monitoring could trackregional haemodynamic and oxygenation changes before,during and after seizures without the limitations associatedwith single photon-emission computed tomography (SPECT)and combined electroencephalography-functional magneticresonance imaging (EEG-fMRI). In ictal SPECT, a photon-emitting radiotracer is injected intravenously at the onsetof a seizure, accumulates, and remains ‘fixed’ in differentareas of the brain proportionally to the cerebral perfu-sion to these regions at the time of injection. Because ittakes ∼10—30 s to inject the radiotracer once one realizesa seizure has started, ∼15—20 s for the tracer to reach thebrain and tens of seconds for cerebral uptake proportional toblood flow and trapping into brain cells, the single ictal per-fusion brain image cannot always discriminate between theseizure onset zone and areas receiving propagated activity(Goffin et al., 2008). EEG-fMRI relies on the blood oxy-genation level-dependent (BOLD) contrast caused by anincrease in oxygen delivery following epileptic discharges.However, EEG-fMRI studies of seizures are difficult to per-form because seizures are unpredictable and rarely occurat the moment of scanning, and because patient movementcan have a severe effect on data quality (Gotman et al.,2006).
Until now, little effort has been made to evaluate theusefulness of fNIRS in the study of seizures in humans andeven less its ability to localize the epileptogenic zone. Pre-vious observations using fNIRS during seizures were limited
vtts
seizures 113
y the use of a single light source coupled with one orwo detectors (i.e. optodes) usually affixed to the hairlesskin overlying the frontal cortex (to avoid hair attenuationf light) but distant from the seizure focus, heterogeneityn seizure types, and/or lack of clear confirmation of thepileptogenic zone by intracranial recording or surgical out-ome (Villringer et al., 1994; Steinhoff et al., 1996; Adelsont al., 1999; Sokol et al., 2000; Haginoya et al., 2002;huhaiber et al., 2004). The best attempt to explore theotential of fNIRS-EEG in epilepsy was made by Watanabet al. (2002), who summarized in a symposium paper thectal CBV changes which they observed during partial (mostlyemporal lobe) seizures induced by bemegride injection.he higher number of optodes (8—24) allowed sampling ofhe prospective region and the contralateral homologousegion. It was not enough, however, to sample surround-ng regions and other distant areas. Furthermore, despitehe high number of patients (n = 28), the authors surpris-ngly provided few details on the time course and behaviourf HbO and HbR.
Seizures are the result of abnormal and excessiveeuronal discharges that may spread non-homogeneouslycross the cortex and subcortical systems, placing supra-ormal demands on the brain’s autoregulatory mechanisms.lthough it has been demonstrated that focal seizuresre accompanied by an increase in local CBF, there aretill many debated issues: (a) what is the timing of thisocal increase with regard to seizure onset (Zhao et al.,007)? (b) Is this local increase in CBF adequate to meethe metabolic demand throughout the ictus (Suh et al.,006; Bahar et al., 2006)? (c) What is the haemodynamicehaviour in surrounding and distant areas of the epilepto-enic focus (Kobayashi et al., 2006a,b; Englot et al., 2008)?he present study will attempt to address some of these
ssues by reporting observations made during continuousimultaneous widespread EEG-fNIRS recordings of humanesial temporal lobe seizures.
ethods
atients
ine patients (5 males; mean age, 35 years; range, 11—56ears) with refractory temporal lobe epilepsy who were can-idates for epilepsy surgery were recruited for a sessionf simultaneous EEG-fNIRS recording at the Optical Imag-ng Laboratory of Sainte-Justine Hospital. Informed consentsere obtained from all patients after approval from theainte-Justine and Notre-Dame Hospitals’ Ethics Commit-ee. To increase the likelihood of recording a seizure,EG-fNIRS studies were performed while patients weredmitted for long-term continuous video-EEG monitoring asart of their presurgical evaluation since antiepileptic drugedications were then frequently tapered or dosages low-
red. Scalp electrodes used for routine clinical video-EEGonitoring were removed to install the EEG-fNIRS helmet
nd reinstalled following the recording session to resume
ideo-EEG monitoring. An epileptologist was present duringhe recording sessions to ensure patient safety. Followinghe non-invasive presurgical investigation, an intracranialtudy was performed when required prior to epilepsy
1
saddprPi
Cr
HSltwttcbt(etibwritdr
STtfifiwpfiwCfiorwlpltTiatsf
hm
dwamoopcld(rcssd
D
V
AaRfire
O
ACts2l
˚
wlri(bisaeotaivt
14
urgery. Consensus on areas to cover was obtained duringn epilepsy surgery conference after review of all availableata. The final epileptogenic focus for each patient wasetermined by multimodal evaluation of clinical (history,hysical examination, neuropsychological), structural (high-esolution MRI) and functional neuroimaging (ictal SPECT,ET, EEG-fMRI) and electrophysiological (scalp EEG, MEG,ntracranial EEG) findings.
ombined EEG-near-infrared spectroscopyecording
elmet trial and preparationimultaneous EEG-fNIRS was accomplished using a rigid butight helmet drilled with holes to mount optic fibres, detec-ors and homemade EEG electrodes. Different helmet sizesere available and an initial visit to the EEG-fNIRS labora-
ory allowed for the selection of the helmet most adaptedo the patient’s head. Using the high-resolution anatomi-al MRI acquired as part of the presurgical evaluation, a 3Drain reconstructed image was obtained and co-registeredo the patient’s head using the program Frameless 39Rogue research, Montreal, Canada). This stereotaxic systemnabled us to visualize the position of a pointer in relationo the participant’s head on the 3D brain reconstructionmage, hence allowing us to draw regions of interest (i.e.ilateral anterior, middle and posterior temporal regions asell as frontopolar, frontocentral and dorsolateral frontal
egions) accurately onto the helmet. As this procedure takesnto account individual anatomic differences, it allowed uso obtain the best possible montage in terms of source-etector numbers, locations, and distances of the targetedegions for each participant.
imultaneous EEG-fNIRS recordingshe EEG was recorded using a Neuroscan Synamps 2TM sys-em (Compumedics, USA) by means of 19 homemade carbonbre electrodes placed through holes in the helmet andxed on the scalp according to the 10-20 system. EEG dataere acquired using a sampling rate of 500 Hz and band-ass filtered between 0.1 and 100 Hz with a 60 Hz notchlter. Simultaneously, fNIRS measurements were acquiredith a multi-channel Imagent Tissue Oxymeter (ISS Inc.,hampaign, IL, USA) using up to 64 fibre sources and up to 16bre collectors mounted on the helmet for optimal coveragef bilateral temporal regions as well as frontal and parietalegions. The distance between the sources and the detectorsas kept between three and five centimetres. Two wave-
engths on either side of the 800 nm haemoglobin isosbesticoint (i.e. the wavelength at which HbR and HbO absorbight equally) were chosen, one below (690 nm) more sensi-ive to HbR and one above (830 nm) more sensitive to HbO.he ISS Oxymeter uses a frequency-domain method which
mplies that light sources are intensity modulated over timet 110 MHz. The optical intensity (DC), modulation ampli-ude (AC) and phase changes in the collected light data wereampled at 19.5 Hz. Only the DC optical intensity was used
or analysis.The installation of the helmet took approximately oneour for each patient. Continuous simultaneous EEG-fNIRSonitoring was then carried out for one to two hours
utmh
D.K. Nguyen et al.
uring which fNIRS was recorded in successive 15-min blockshile EEG was recorded continuously. A camera mounted ontripod filmed the whole session for offline review of ictalanifestations or artefact-generating movements. A pulse
xymeter was attached to a fingertip for visual monitoringf arterial blood oxygen saturation. During the recordings,atients did not perform any tasks; they sat on a chair asomfortably as possible. After the recording session, theocation of every source, detector and fiducial point wasigitized and recorded with the same stereotaxic systemBrainsightTM Frameless 39, Rogue Research, Canada) for co-egistration with the anatomical MRI of each patient. Theortical surface was computed (Imagic, Neuronic, Havana);ource and detector positions were co-registered on thisurface by extrapolating the scalp positions in the normalirection from the surface (Matlab 7.04).
ata analysis
ideo and EEG data analysis
fter acquisition, the EEG data was reviewed offline byn epileptologist (DKN) using EEG Focus (BESA, Germany).ecordings were high-pass filtered at 0.3 Hz and low-passltered at 35 Hz. Seizure-onset and seizure-end times wereespectively defined as the earliest and latest clinical orlectrographic evidence of seizure activity.
ptical data analysis
fter the acquisition, DC data from Boxy 8 (ISS Inc.,hampaign, IL, USA) was transferred to be analyzed withhe HomER package (Photon Migration Imaging Lab; Mas-achusetts General Hospital, Boston, USA) (Huppert et al.,009). A modified Beer-Lambert law (MBLL) is used to relateight attenuation to changes in absorption ��a:
�(t, �) = − ln
(I(t, �)I0(�)
)= − ln
(˚(t, �)˚0(t, �)
)
= d · DPF(�) · ��a(t, �), (1)
here I(t,�) describes the measured light intensity at wave-ength � which, by using adequate boundary conditions, iselated to ˚, the fluence. Experimental factors related tollumination and detection efficacy and scalp-light couplingall optodes are not equally efficient) cancel out in Eq. (1)y normalizing to a baseline measure, I0(�). This baselines measured on the same optode pair, but usually a feweconds prior to each activation event (here 5 s) or by
median value of the intensity signal over the wholexperiment. The term ‘‘modified’’ arises from the inclusionf a differential pathlength factor, DPF(�). The DPF mul-iplies the source-detector distance d to account for thedditional path traveled by light due to scattering eventsn the diffusive medium (Duncan et al., 1996). This factoraries with wavelength and can be measured with eitherime or frequency domain instruments, or computed by
sing prior anatomical information and Monte-Carlo simula-ions. Using spectral extinction curves (Prahl SA. Tabulatedolar extinction coefficient for haemoglobin in water;ttp://omlc.ogi.edu/spectra/hemoglobin/summary.html),
lobe
G
Twnwastofi8f
L
TtLtE(OuvcR
R
EstuasdiTtiehb
C
Tsaaiatti
Continuous near-infrared spectroscopy imaging of temporal
the measured absorption (at two different wavelengths �1,�2) can be related to haemoglobin concentrations by
��a(�1) = ε�1HbO2
�CHbO2 + ε�1HbR�CHbR
��a(�2) = ε�2HbO2
�CHbO2 + ε�2HbR�CHbR,
(2)
where the extinction coefficients ε of haemoglobin specieshave been measured in vitro (Gratzer WB, MedicalResearch Council Labs, Holly Hill London and Kollias N,Wellman laboratories Harvard Medical School, Boston, MA;http://omlc.ogi.edu/spectra/hemoglobin/summary.html).The above linear system enables the estimation of theconcentration of HbO2 and HbR, as they vary in space andtime. By estimating changes in absorption according to Eq.(1) at each wavelength then translating to concentrationsusing Eq. (2), one recovers measures of concentrationchanges in the region probed by the optodes.
Values reported here do not presume to indicate theexact concentrations in the brain, but rather reflect rep-resentative relative changes in the brain as we used auniform partial volume factor of 1. Concentration curvesare presented as a percentage of variation compared totypical steady state values of HbT 100 �M, HbO 75 �M andHbR 25 �M (Boas et al., 2003). HbT, the sum of HbR andHbO chromophores, was assumed equivalent to CBV underthe standard hypothesis that the haematocrit remains con-stant. A low-pass frequency zero-phase digital filtering witha cut-off frequency of 0.5 Hz was performed on the data toeliminate cardiac artefacts. Channels with a raw DC inten-sity at the level of the equipment noise or with a standarddeviation higher than 20% were considered as artefactualand excluded from the analysis. The optical seizure onsettime was marked when the first obvious haemodynamicchanges occurred and was compared with the EEG seizureonset identified by the epileptologist. The selected channels(regions of interest) chosen to show the average temporalevolution of haemoglobin variations on both sides of theepileptic focus (ipsilaterally and contralaterally) in the fig-ures below were close to T4-F8 and T3-F7 as measured withthe 10-20 system.
Topographic analysis
A topographic view was created to display the evolutionand the general propagation of HbO and HbR activations.The subject’s MRI reconstruction was co-registered accord-ing to the fiducial points measured on the subject in order toproduce a topographic view of the activation. A simple Stu-dent’s T-test was performed to ensure that the amplitude ofthe activation was superior to the baseline noise using thefollowing formula: T = X/SEM. Where, T is the uncorrectedT-value, X is the amplitude of the concentration during theseizure and SEM is the standard error for 5 s of baseline.To display the evolution and the general propagation of theactivation, we mapped the T-value to a topographic viewonto the skin segmentation. A home made-matlab code wasdeveloped to map the activation. By using the optodes’ coor-
dinates acquired on the skin, the activation was projecteddirectly under the path between a source and a detectorwithout interpolation. When two channels passed throughthe same position, the averaged value was mapped.mpaM
seizures 115
roup analysis
o assess overall variations of HbO and HbR, all seizuresere aligned to seizure onset. For each seizure, a selectedumber (the same for each patient) of focal fNIRS channelsas averaged, and the resulting times series was binned byveraging over windows of one second. Due to the upwardkewness of the distribution, a Mann—Whitney test ratherhan a Student’s T-test was performed on each such windowf 8 data points, comparing its median to the median of axed baseline window taken 10 s prior to fNIRS onset (alsodata points). No p-value adjustment was made to account
or multiple tests.
aterality index
o evaluate if fNIRS could adequately lateralize the epilep-ic focus, two laterality indexes were calculated. The Extentaterality Index (ELI) compares the extent of HbO activa-ion between both hemispheres and is calculated as follows:LI (t) = [Number of Left vertices (t)—Number Right verticest))/(Number Left vertices (t) + Number Right vertices (t)].nly vertices bigger than 50% of the maximal T-value weresed. The Peak Laterality Index (PLI) compares the peak T-alue at every moment between both hemispheres and isalculated as follows: PLI (t) = [(Max Peak Left (t)—Max Peakigh (t)/(Max Peak Left (t) + Max Peak Right (t)].
esults
ight seizures were successfully recorded during EEG-fNIRSessions from three out of the nine participants with refrac-ory temporal lobe epilepsy. The other six participants hadneventful EEG-fNIRS sessions. Each recorded seizure wasccompanied by well-recognizable changes in the opticalignal. We identified two distinct phases in the haemo-ynamic response. The first phase was characterized byncreased oxygenation as HbO increased and HbR decreased.he second phase was characterized by decreased oxygena-ion during which HbR increased (while HbO continued toncrease or even decreased). The peaks of each phase forach of the seizures are shown in Table 1 and detailedaemodynamic responses for each patient are describedelow.
ase 1
his 49-year-old man with prior meningitis at age 16 monthstarted having seizures at age 34 years. Seizures were char-cterized by a foul odour or taste, altered consciousnessnd oroalimentary automatisms. During video-EEG monitor-ng, fourteen complex partial seizures were recorded, allssociated with rhythmic theta activity evolving in ampli-ude and frequency over the left temporal region. In half ofhe seizures, late rhythmic theta and delta rhythmic slow-ng was noted in the contralateral temporal region after a
ean of 48 s (range 27—68 s) suggesting late contralateralropagation. Ictal SPECT showed mild left mesiotemporalctivation, PET revealed left temporal hypometabolism andRI disclosed discrete left hippocampal atrophy.
116D
.K.N
guyenet
al.
Table 1 Details of haemodynamic changes of all recorded complex partial seizures: onset of fNIRS changes compared to first scalp EEG evidence of ictal activity; durationof EEG evidence of seizure activity; duration of haemodynamic changes for individual seizures; peak concentration variations recorded over the temporal region; phase 1 isdefined by a decrease of HbR; phase 2 is defined by an increase of HbR; sz: seizure; P1, P2, P3: patients 1, 2 and 3; HbT: total haemoglobin; HbO: oxyhaemoglobin; HbR:deoxyhaemoglobin; SD: standard deviation.
fNIRSonset (s)
EEG (s)duration
fNIRS (s)duration
Phase 1 peak Phase 2 peak
HbT Time HbO Time HbR Time HbT Time HbO Time HbR Time
P1-Sz1 0 93 200 — — — — −4 21 15 68 15 71 25 88P1-Sz2 0 93 >80 — — — — −9 27 13 58 14 58 17 77P1-Sz3 0 106 200 — — — — −7 29 17 75 18 56 43 88P1-Sz4 0 77 200 — — — — −8 26 11 53 10 56 16 53P1-Sz5 0 96 150 — — — — −5 15 17 60 17 77 24 94
Mean 0 93 188 −7 24 15 63 15 64 25 80SD 0 10 87 2 6 3 9 3 10 11 16
P2-Sz1 −37.4 70 >150 1.3 17.6 4.1 40.0 −8.6 43.9 4.7 90.1 −8.4 125 42 131P2-Sz2 −49 34 135 0.5 27.2 1.0 31.5 −1.5 34.9 −1.4 63.8 −6 92 13 91
Mean −43 52 135 1 22 3 36 −5 39 2 77 −7 109 28 111SD 8 25 95 1 7 2 6 5 6 4 19 2 23 21 28
P3-Sz1 −32 49 275 −3 39 9 62 −14 36 10 65 −14 156 48 142
lobe
stnws
C
TaoiwnErcricaft
sdFsoiarHobreo∼ubitwWirclvtsitoai
Continuous near-infrared spectroscopy imaging of temporal
An EEG-fNIRS study was performed using 120 channelssampling bilateral frontal, temporal and parietal regions(Fig. 1A). Five complex partial seizures were recorded dur-ing the 82-min session, clinically and electrographicallyidentical to those recorded during the video-EEG monitor-ing study (Fig. 1B). Mean duration for EEG evidence ofseizures was 93 s (range 77—106 s). Pulse oxymetry monitor-ing indicated no significant peripheral desaturation duringseizures. Except for minor differences, cerebral haemo-dynamic responses as measured by fNIRS were relativelysimilar for all seizures. Fig. 1C exemplifies changes in HbOand HbR over time as measured by selected optodes overthe left (ipsilateral) and right (contralateral) temporal lobesduring seizure 1. Electrographically, the onset was assumedto be where diffuse desynchronization occurred, several sec-onds prior to the obvious ictal rhythmic theta activity overthe left temporal region (Fig. 1D). After ictal onset, anincrease in HbT was observed, reaching 15% and peakingat 68 s. This increase in HbT, most likely representing anincrease in CBV, lasted ∼25 s beyond the termination of theseizure. Similarly, HbO showed an increase and the maximalamplitude of this change was 15% of baseline, peaking at70 s. The HbR signal was biphasic with an initial decreaseof 4% at 21 s followed by an increase by 25%, reaching apeak 88 s after seizure onset (and close to seizure offset).At seizure offset, both HbR and HbO gradually returned tobaseline over ∼100 s. Contralaterally, haemodynamic vari-ations of HbO and HbR over the anterior temporal regionclosely paralleled those seen over the epileptogenic regionfrom onset (despite any EEG evidence of epileptic activity).The initial increase in HbO (and ultimate increase in HbRafter the initial decrease) was more pronounced ipsilater-ally (0.62% vs. 0.35%) and started slightly earlier ipsilaterallyat 5 s ipsilaterally vs. 6 s contralaterally (Fig. 1E). In remoteareas, a short-lasting decrease in HbO was found in frontaland parietal regions at seizure onset. Despite this initialdecrease in HbO, a decrease in HbR was concomitantly notedin these remote areas. As the seizure went on, an increasein HbO and decrease in HbR occurred in adjacent middleand posterior temporal regions as well as inferior frontaland frontopolar regions starting ∼6 s after onset. Furtheractivation (increase in HbO and decrease in HbR) of con-tralateral homologous regions was also noted ∼16 s afterseizure onset. The later increase in HbR despite an increasein CBV occurred maximally over bitemporal regions (Fig. 1E).
Detailed haemodynamic responses for the remain-ing four seizures are available as supplementary data(supplementary Figs. S1—S4). The time course of haemo-dynamic responses averaged over all five seizures in theleft temporal lobe is as follows: (a) an increase in HbT wasobserved which reached a peak of 15 ± 3% at 63 ± 9 s, (b)a concomitant increase in HbO which reached a peak of15 ± 3% at 64 ± 10 s after onset (27 ± 14 s before electricaloffset), and (c) an associated initial decrease in HbR of7 ± 2%, which reached a nadir at 24 ± 6 s, followed by anincrease which reached a peak of 25 ± 11% at 80 ± 16 s afteronset (11 ± 10 s before electrical offset). The average lengthof EEG evidence of seizures was 93 s compared to 188 s for
haemodynamic changes. Thus, the haemodynamic changesoutlasted the duration of the seizure by 95 ± 30 s. For thispatient, the seizure phase that had the highest localiza-tion value was the period of initial HbO increase, as most2iFp
seizures 117
eizures (4 out of 5) clearly displayed a faster increase onhe ipsilateral side than on the contralateral side. This wasot the case for seizure 3, the ‘strongest of them’, whichas associated with symmetrical increases bilaterally (see
upplementary Fig. S2)
ase 2
his 47-year-old woman suffered from weekly seizures sincege 15 years, characterized by an aura of déjà vu or anrgasmic sensation followed by altered consciousness. Dur-ng video-EEG monitoring, some seizures were associatedith left temporal rhythmic theta activity but many wereon-localizing. High-resolution MRI was normal. An invasiveEG study revealed independent left and right mesiotempo-al lobe seizures. Electrographically, seizures (n = 11) wereharacterized by low-voltage fast activity evolving intohythmic spiking starting in the hippocampus before spread-ng to the ipsilateral insula and ipsilateral lateral temporalontacts after a mean of 19 s (range 10—37 s) and endingfter a mean of 71 s (range 54—107 s). No propagation torontal subdural contacts was observed for all seizures. Elec-rodes were removed without resective surgery.
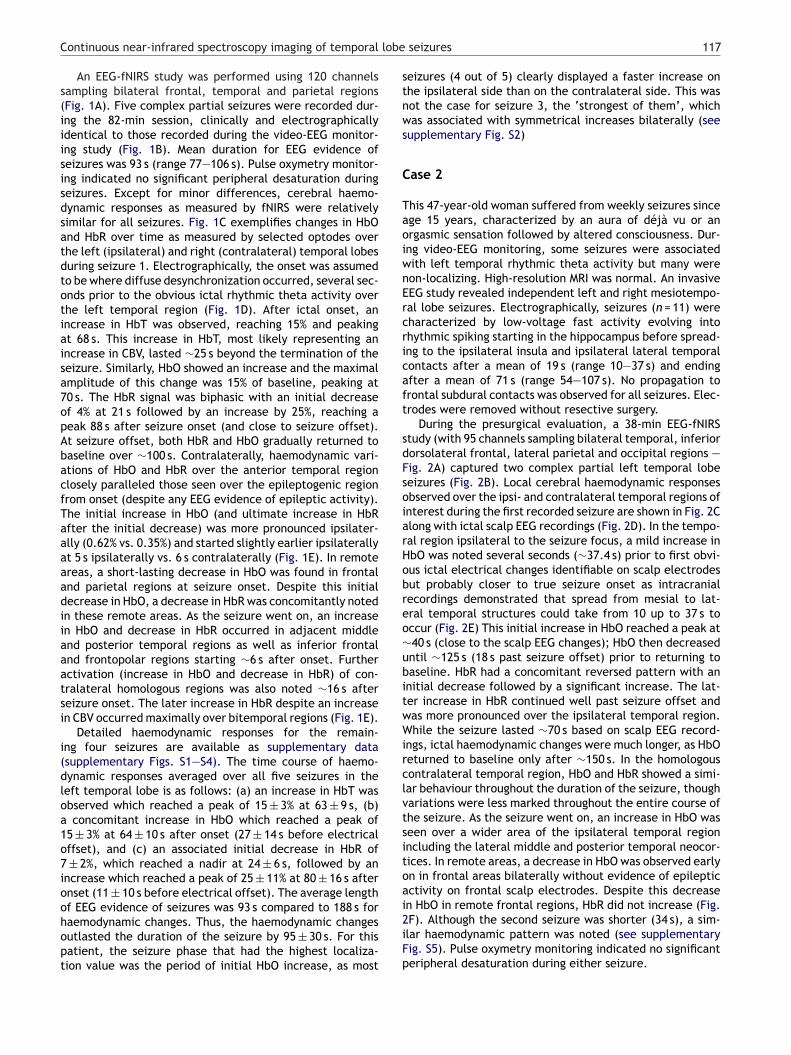
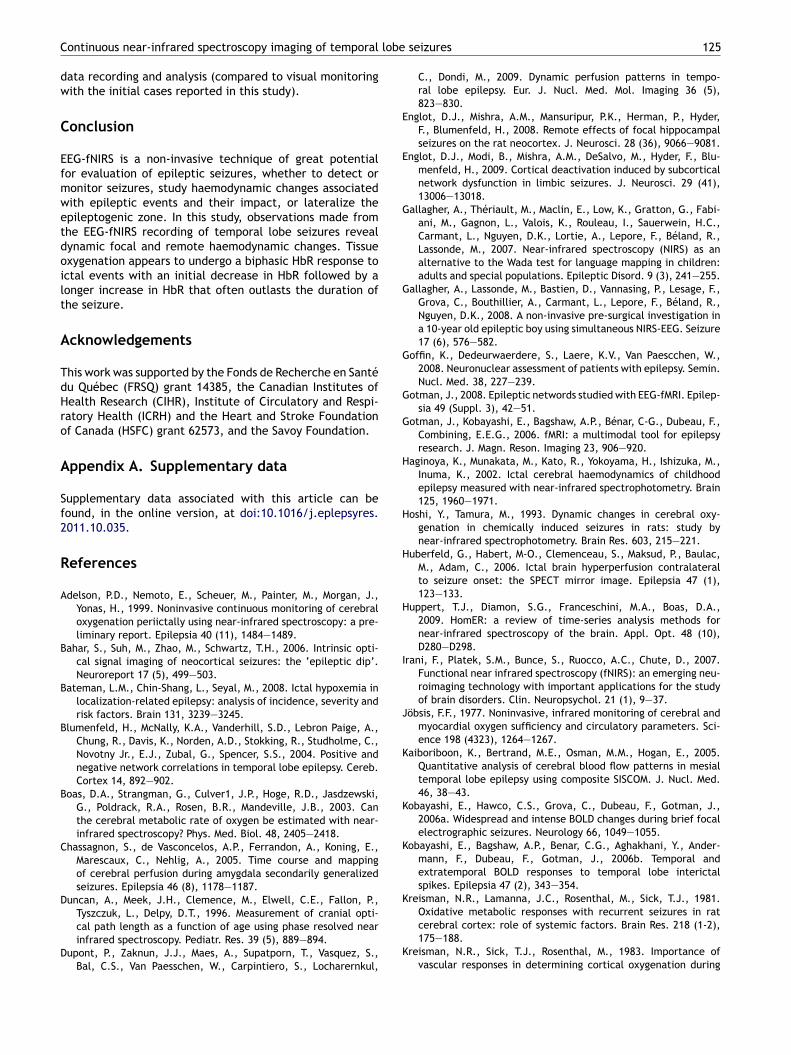
During the presurgical evaluation, a 38-min EEG-fNIRStudy (with 95 channels sampling bilateral temporal, inferiororsolateral frontal, lateral parietal and occipital regions —ig. 2A) captured two complex partial left temporal lobeeizures (Fig. 2B). Local cerebral haemodynamic responsesbserved over the ipsi- and contralateral temporal regions ofnterest during the first recorded seizure are shown in Fig. 2Clong with ictal scalp EEG recordings (Fig. 2D). In the tempo-al region ipsilateral to the seizure focus, a mild increase inbO was noted several seconds (∼37.4 s) prior to first obvi-us ictal electrical changes identifiable on scalp electrodesut probably closer to true seizure onset as intracranialecordings demonstrated that spread from mesial to lat-ral temporal structures could take from 10 up to 37 s toccur (Fig. 2E) This initial increase in HbO reached a peak at40 s (close to the scalp EEG changes); HbO then decreasedntil ∼125 s (18 s past seizure offset) prior to returning toaseline. HbR had a concomitant reversed pattern with annitial decrease followed by a significant increase. The lat-er increase in HbR continued well past seizure offset andas more pronounced over the ipsilateral temporal region.hile the seizure lasted ∼70 s based on scalp EEG record-
ngs, ictal haemodynamic changes were much longer, as HbOeturned to baseline only after ∼150 s. In the homologousontralateral temporal region, HbO and HbR showed a simi-ar behaviour throughout the duration of the seizure, thoughariations were less marked throughout the entire course ofhe seizure. As the seizure went on, an increase in HbO waseen over a wider area of the ipsilateral temporal regionncluding the lateral middle and posterior temporal neocor-ices. In remote areas, a decrease in HbO was observed earlyn in frontal areas bilaterally without evidence of epilepticctivity on frontal scalp electrodes. Despite this decreasen HbO in remote frontal regions, HbR did not increase (Fig.
F). Although the second seizure was shorter (34 s), a sim-lar haemodynamic pattern was noted (see supplementaryig. S5). Pulse oxymetry monitoring indicated no significanteripheral desaturation during either seizure.
118 D.K. Nguyen et al.
Figure 1 Case 1, seizure 1. (A) Channel configuration (n = 120). (B) Haemodynamic variations (HbO line, HbR dotted) over theepileptogenic temporal lobe for the whole fNIRS recording, horizontal red lines indicate electrical seizure activity. Below, temporalEEG time course is shown. (C) Enlarged seizure 1 haemodynamic variations of ipsi- and contralateral region of interest. The blackline indicates time of EEG evidence of seizure activity. (D) Blow-out of EEG showing early ictal changes. (E) Topographic uncorrectedT-stats viewed at different time points during the course of the seizure. Region of the epileptic focus is indicated by a circle.
Continuous near-infrared spectroscopy imaging of temporal lobe seizures 119
Figure 2 Case 2, seizure 1. (A) Channel configuration (n = 95). (B—D) Same as Fig. 1. (E) Intracranial recording of a seizure startingwhich started over the left hippocampal depth contact and spread to the lateral temporal subdural contact after more than 20 s.(F) Topographic uncorrected T-stats viewed at different time points during the course of the seizure. Region of the epileptic focusis indicated by a circle.
120 D.K. Nguyen et al.
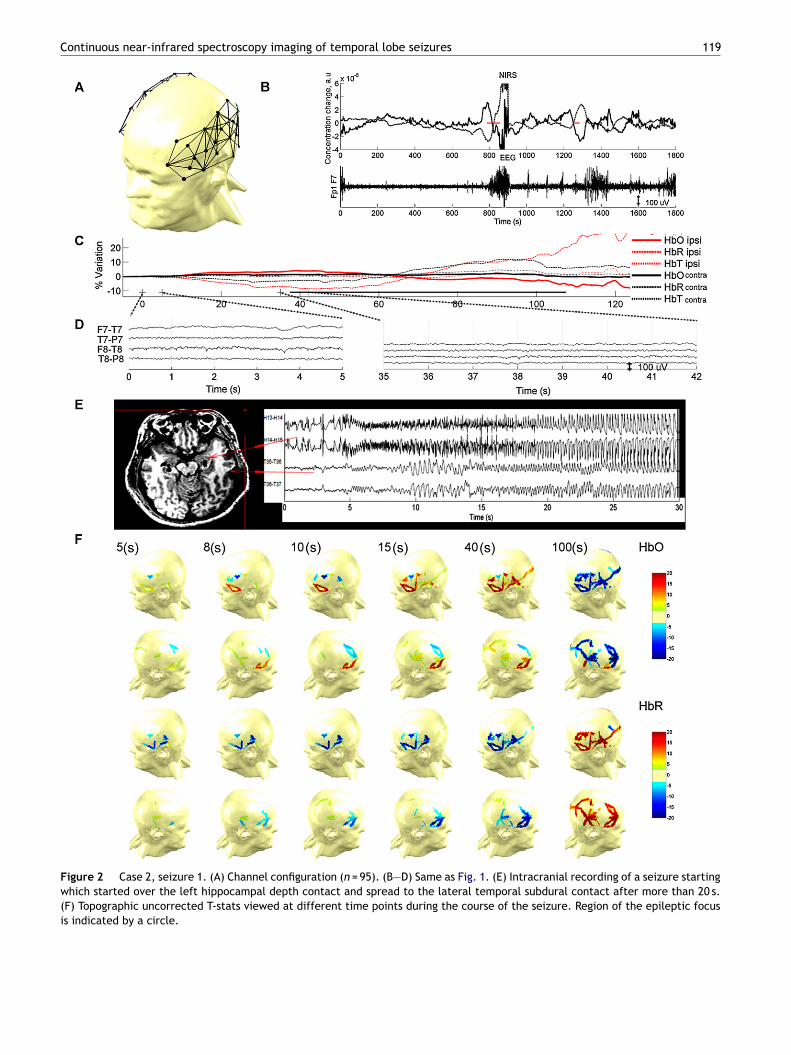
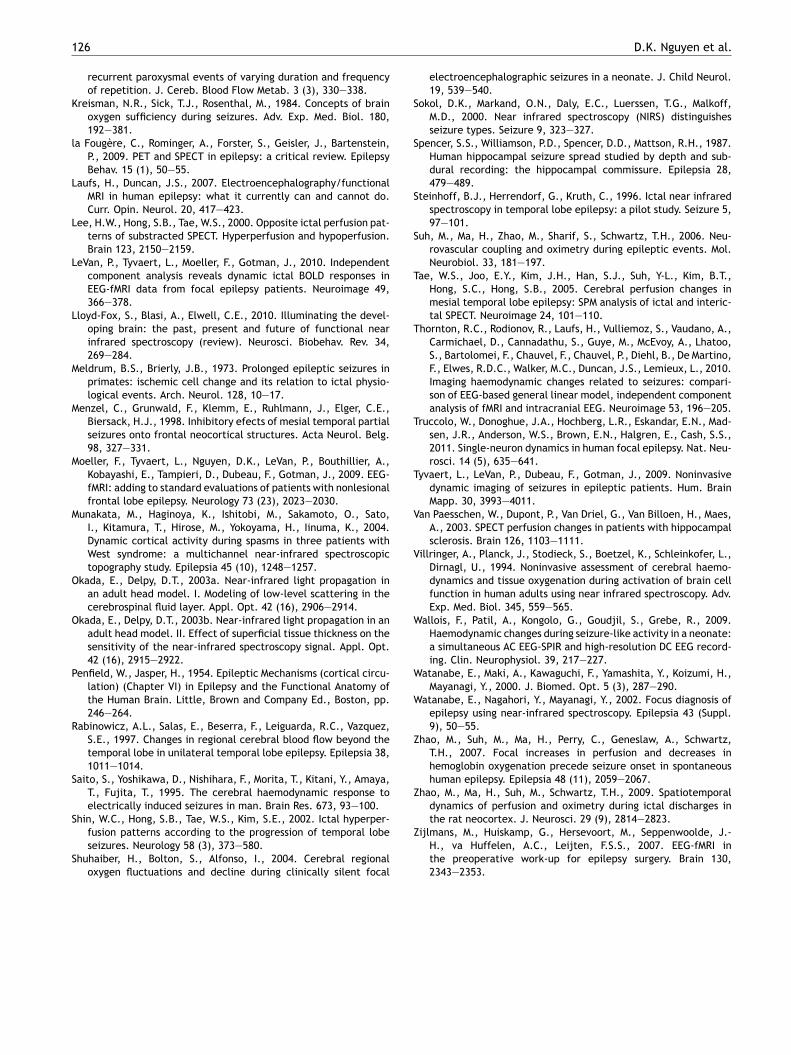
Figure 3 Case 3, seizure 1. (A) Channel configuration (n = 114). (B—F) Same as Fig. 2.

lobe seizures 121
Figure 4 Median, 25th and 75th percentiles of eight seizuresmeasured with NIRS from 3 patients, aligned to seizure onsetat time = 0 (upper chart: variation of HbO during seizure (�M/L)lower chart: variation of HbR during seizure (�M/L). For HbR,two phases are seen: an initial decrease (significant for about3 s), accompanied by an HbO increase, and a phase of pro-longed HbR elevation, indicating hypoxia (significant from 53.3 sto 149.6, during which HbO increased for patient 1 while HbOdp
sabgia
L
TtLbchapoo
Continuous near-infrared spectroscopy imaging of temporal
Case 3
This 31-year-old man with onset of seizures at age 27 yearsunderwent a comprehensive presurgical evaluation afterfailing ten antiepileptic drug trials. Spells consisted in ini-tial light-headedness, altered consciousness and gesturalautomatisms. Seizures recorded during video-EEG moni-toring were associated with rhythmic left temporal thetaactivity evolving in amplitude and frequency and laterhythmic theta and delta slowing over left parasagittalregions. Paradoxically, MRI revealed right temporal atro-phy. An intracranial study confirmed a left mesiotemporalepileptogenic zone. Several electrical and simple partialseizures consisting of preictal spiking followed by low-voltage fast activity limited to left mesiotemporal structureswere noted. Seven complex partial seizures started withan identical pattern but then evolved to rhythmic slowingand spiking over the lateral temporal contacts after a meanof 33 s (range 6—55 s). Limited spread of epileptic activityto contralateral mesiotemporal structures occurred after amean of 34 s (range 11—65 s). No spread to the ipsilateral andcontralateral frontal subdural strip electrodes was observedfor all seizures. The patient underwent a left anterior tem-poral lobectomy with a resulting Engel 1 outcome (FU = 1½year).
One complex partial seizure was captured during the165-min EEG-fNIRS study using 114 channels (Fig. 3A). Elec-trographically, mild desynchronization followed by rhythmictheta activity over the left temporal region was noted,evolving in amplitude and frequency prior to terminationafter 49 s. The haemodynamic responses over the left tem-poral region of interest (ipsilateral to the seizure focus) andthe contralateral homologous region along with ictal scalpEEG data are shown in Fig. 3C. Over the temporal region, agradual increase in HbO and decrease in HbR was first noted32 s prior to scalp electrical onset (but probably close to theactual seizure onset in the left mesiotemporal structuresas intracranial recordings indicated a mean time of 33 s forthe epileptic activity to spread from mesial depth electrodecontacts to lateral temporal subdural electrode contacts).The increase in HbO reached a peak at ∼62 s (30 s after EEGseizure onset and 19 s before seizure offset) and graduallyreturned to baseline with a long undershoot (200 s) afteroffset. The initial decrease in HbR reached a nadir ∼40 safter seizure onset before increasing dramatically to a peak∼150 s after onset (∼70 s after seizure offset) and finallydecreasing towards baseline (∼270 s after the first haemo-dynamic changes). Local haemodynamic responses over theright temporal region closely paralleled those seen from theleft temporal region except for a higher increase in HbR ipsi-laterally after the initial decrease noted after seizure onset(Fig. 3C). In remote areas, a progressive decrease in HbO isseen early on over the frontal and parietal regions bilater-ally while HbR also decreases. However, as the seizure goeson, HbR increases diffusely in remote areas as well (Fig. 3F).
Group analysis
All eight seizures recorded from the three patients pre-sented above were aligned to seizure onset to assess overallvariation of HbO and HbR (Fig. 4). For HbR, two phases are
3orm
ecreased for patients 2 and 3.) Significance levels: p < 0.05 (*),< 0.001 (***).
een: (a) first, an initial decrease (significant for about 3 s),ccompanied by an HbO increase; (b) followed subsequentlyy a phase of prolonged HbR elevation, indicating deoxy-enation (significant from 53.3 s to 149.6 s) during which HbOncreased for patient 1 while HbO decreased for patients 2nd 3.
aterality index
o evaluate if fNIRS could adequately lateralize the epilep-ic focus, two laterality indexes were calculated. The Extentaterality Index compares the extent of HbO activationetween both hemispheres while the Peak Laterality Indexompares the peak T-value at every moment between bothemispheres. For patient 1, four out of five seizures showedbigger and larger activation ipsilaterally during the initialhase of the seizure. For patient 2, the higher amplitudef activation ipsilaterally allowed adequate lateralizationf the epileptogenic lobe for both seizures. For patient
, lateralization was less certain as bilateral activationf equal intensity was observed during the only seizureecorded, possibly more so contralaterally. Fig. 5 shows theean Extent Laterality Index and Peak Laterality Index for
122
Figure 5 Laterality index of HbO variation in function of thetime during the evolution of the seizure, in blue; Extent later-ality index (ELI) using a half maximum T value threshold, in red;maximal peak laterality index (PLI). (A) LMTLE patient 1 (n = 5seizures), laterality index is concordant with the side of epilep-tic focus during the first 20 s. (B) LMTLE patient 2 (n = 2 seizures),laterality index is concordant with the side of epileptic focus.(t
aip
D
Wsficf
Ft
DpmwcantTiIp
mt(oteai0
dwtaraEapftqlwettseoeawoatEe
eebtpaiCwtHsiibpsoc
C) LMTLE patient 3 (n = 1), laterality index is discordant withhe side of epileptic focus.
ll seizures recorded from each patient showing that bothndexes were concordant with the side of seizure onset foratients 1 and 2 but discordant for the third.
iscussion
e have successfully used simultaneous EEG-fNIRS to recordeveral seizures in three out of the nine tested patients. Ourndings bring new evidence regarding the haemodynamichanges during temporal lobe seizures and the role of EEG-NIRS in localizing the epileptogenic zone.
NIRS-EEG haemodynamic changes duringemporal lobe seizures
etection of seizures — In our analysis of eight com-lex partial seizures from three patients with refractoryesiotemporal lobe epilepsy using multichannel fNIRS-EEG,e have consistently been able to detect haemodynamichanges throughout the course of the ictus. All seizures weressociated with significant alterations in cerebral haemody-amics with variations from baseline to the highest peak inhe order of ∼28% for HbR, ∼13% for HbO and ∼11% for HbT.
hese variations are 3—8 times more than what is seen dur-ng a physiological fluence paradigm (Gallagher et al., 2007).t has been our experience with these and other not yetublished cases that analyzing the fNIRS signal can guide a
neoa
D.K. Nguyen et al.
ore careful review of a specific timeframe of the EEG signalo detect seizures with more subtle electrographic changesunpublished data, Gallagher et al., 2008). The magnitudef these variations is in line with recent EEG-fMRI observa-ions. In a patient with right temporo-parietal brief (∼4 s)lectrical seizures, Kobayashi et al. (2006a) also reportedlarge (6.1%) increase in BOLD signal compared to what
s seen during interictal spikes or cognitive tasks (typically.5—1%).
Timing of haemodynamic changes — Onset of these fNIRS-etected haemodynamic changes occurred close in timeith EEG-detected seizures. For patient 1, good approxima-
ion of true electrical onset was made possible by visualizingn early non-specific desynchronization of baseline alphahythm prior to the more obvious evolving rhythmic thetactivity over the epileptic temporal lobe on an artefact-freeEG recording. Haemodynamic changes were found to occurlmost simultaneously to suspected electrical onset. Foratients 2 and 3, no subtle clues on scalp recordings allowedor better approximation of true seizure onset time prior tohe more obvious ictal rhythmic theta activity, but subse-uent intracranial recordings showed that true ictal onsetikely occurred several seconds before (probably close tohen haemodynamic changes were first noted) as spread ofpileptic activity from mesiotemporal depth electrode con-acts to lateral temporal subdural electrode contacts couldake several seconds. Although Zhao et al. (2007) recentlyuggested that haemodynamic changes precede true ictallectrical onset rather than follow it after a short latency asne would expect with normal neurovascular coupling (Suht al., 2006), our setting does not allow for a more accuratessessment of the exact timing of haemodynamic changesith regard to true epileptic onset. Contrary to seizurenset, electrical seizure offset was more readily identifiablend there is no doubt that haemodynamic changes outlastedhe duration of seizures. This is in line with previous SPECT,EG-fMRI and optical imaging data (Goffin et al., 2008; Zhaot al., 2007; Suh et al., 2006; Tyvaert et al., 2009).
Local haemodynamic changes — Notwithstanding thexact timing of the haemodynamic response relative to ictallectrographic activity, there is possible evidence that cere-rovascular autoregulation is temporarily unable to meethe increased metabolic demands during temporal lobe com-lex partial seizures. Although seizures are associated withn expected increase in HbT and HbO as well as a decreasen HbR (congruent with a compensatory increase in localBV to increase the oxygen supply to the epileptic tissue),e consistently show that this initial decrease in HbR over
he epileptogenic region is followed by a longer increase inbR which often outlasts the duration of the seizure. Thisuggests the brain may suffer from a temporary, intensencrease in local oxygen metabolism responsible for thencrease in HbR, which is not sufficiently compensated fory the reactive regional increase in cerebral blood sup-ly to wash out HbR. In other words, the brain possiblyuffers from hypoxia during complex partial seizures. Thebserved decrease in oxygenation cannot be ascribed toardiorespiratory perturbations during seizures as no sig-
ificant decrease in peripheral SaO2 was noted (Batemant al., 2008). In addition, patients did not suffer fromther co-morbidities which could have affected cerebralutoregulation such as cerebrovascular disease. Cerebral
lobe
seesrppiernvT
Htpbspnecirce2twf2iflsad(wfimCttOhdtsaebAfptt
Continuous near-infrared spectroscopy imaging of temporal
autoregulation may vary with age but no age-correlatedchanges were observed in our limited sample as the old-est patient (49 years old) showed an increase in HbO in thesecond phase while the 2 other younger patients (47 and31 years old) both showed a decrease in HbO in the secondphase.
Although the inadequacy of CBF to meet metabolicdemand has been demonstrated in animal models of sta-tus epilepticus (Meldrum and Brierly, 1973; Kreisman et al.,1981, 1984), there is growing evidence of inadequate oxy-genation at the onset or throughout shorter duration ictalevents as well. Zhao et al. (2007) recorded spontaneousseizures (lasting less than 2 min but recurring every 5 min)related to a cavernous malformation using intraoperativeoptical recording of intrinsic signals (ORIS) combined with 4-contact grid electrode recordings. They reported a decreasein haemoglobin oxygenation and CBV within the epilep-togenic zone starting 20 s before seizure onset followedby further decrease in haemoglobin oxygenation despitean increase in CBV throughout the seizure. These changespersisted for at least 1—2 min after the offset of theseizure. These findings appear to confirm that the increasein metabolic demand elicited by spontaneous focal humanseizures is not adequately met by increases in CBF. RecentEEG-fMRI studies of motionless seizures have reported BOLDdecreases in relation to the late ictal phase, suggesting acerebral perfusion/mismatch and possible sustained tissuehypoxia (Thornton et al., 2010; LeVan et al., 2010). Furthercorroborating data comes from animal models of epilepsy.Zhao et al. (2009) showed that ictal events elicited a tran-sient decrease in pO2 (initial dip) in the 4-AP model despite a50% increase in CBF, while Hoshi and Tamura (1993) observeddecreased oxygenation after seizures in the PTZ model.Kreisman et al. (1983) reported increased cerebral oxygena-tion and oxidized cytochrome c oxidase early during the ictusbut decreased oxygenation and reduced cytox later duringand after the seizure.
Haemodynamic changes in the contralateral temporallobe — A second significant finding is the surprisingly similarhaemodynamic profile seen over the contralateral region,though variations have lower amplitude. These rapid haemo-dynamic changes in the opposite temporal region occurredin absence of obvious contralateral epileptic activity. Sub-sequent intracerebral recordings for the last two patientsconfirmed that propagation to the contralateral hippocam-pus and lateral temporal neocortex was not rapid buttook several seconds, as is usually the case for hippocam-pal seizures (Spencer et al., 1987). Using four emittersand one detector over the right and left parietal areas,Wallois et al. (2009) also observed a similar contralateraleffect in a curarized, ventilated post-acute foetal distressneonate with a flat interictal EEG and subclinical temporallobe seizures. The physiological basis of these contralat-eral changes is yet unclear. Prior SPECT studies of temporallobe seizures had already demonstrated significant ictal con-tralateral changes in regional CBF, usually symmetrical tothe seizure onset zone (forming a mirror image) (Lee et al.,2000; Tae et al., 2005; Huberfeld et al., 2006). Because
ictal SPECT provides a single snapshot of regional CBFbased on the uptake over ∼1—2 min by neurons of a radio-tracer injected early after seizure onset, it was assumedthat these contralateral changes represented patterns of2aaa
seizures 123
eizure propagation (Huberfeld et al., 2006; Kaiboriboont al., 2005). Our EEG-fNIRS findings indicate that contralat-ral activation is rapid and cannot solely be attributed toeizure propagation. In fact, our findings are reminiscent ofecent observations made during EEG-fMRI studies of tem-oral interictal spikes showing BOLD responses occurringredominantly in the spiking temporal lobe but often alsonvolving the contralateral homologous cortex as well asxtra-temporal regions. This widespread effect of tempo-al epileptic spikes is hypothesized to be due to projectedeuronal activity that is not sufficiently synchronized to beisible on the EEG (Kobayashi et al., 2006b; Gotman, 2008;ruccolo et al., 2011).
Haemodynamic changes in other remote areas — WhilebO increases over the temporal region for all subjects ashe focal seizure starts, HbO decreases in frontal and/orarietal regions were also noted for patients 2 and 3 (andriefly for some seizures of patient 1). In a prior pilot fNIRStudy of temporal lobe seizures using only two frontallyositioned optodes, Steinhoff et al. (1996) had alreadyoted a clear-cut decline in oxygen saturation in the ipsilat-ral frontal region in two patients and inconsistent findingsontralaterally. Previous SPECT studies have shown signif-cant ictal hypoperfusion of frontal, parietal and otheremote areas (cerebellum, precuneus) during temporal lobeomplex partial seizures (Rabinowicz et al., 1997; Menzelt al., 1998; Van Paesschen et al., 2003; Blumenfeld et al.,004; Dupont et al., 2009) while secondarily generalizedemporal lobe seizures (even with short injection times)ere associated with multiple hyperperfusion areas in the
rontal, temporal, and basal ganglia regions (Shin et al.,002; Chassagnon et al., 2005). In a recent study combin-ng electrophysiological recordings, fMRI and laser-Dopplerowmetry, Englot et al. (2009) found that electricallytimulated partial hippocampal seizures in rats were associ-ted with ictal frontal neocortical slow activity, significantecreases in neuronal firing, haemodynamic measurementsBOLD, CBV, CBF), and cerebral metabolism (CMRO2),hile secondarily generalized hippocampal seizures showed
rontal fast polyspike seizure activity, significant elevationsn electrophysiological responses (local field potentials andultiunit activity), haemodynamic measurements (BOLD,BV, CBF), and CMRO2. Long-range depressive effects overhe frontal lobe could explain why, HbR did not increase ini-ially but rather decreased as HbO decreased in our patients.verall, these findings indicate that temporal lobe seizuresave long-range effects, not only when they propagate toistant regions but even when they do not propagate tohem. Among potential explanatory hypotheses, a ‘vascularteal phenomenon’ (shunting of blood towards the temporalt the expense of frontal and parietal regions) (Rabinowiczt al., 1997) is unlikely to explain such early, distant andilateral changes (Gotman, 2008; Blumenfeld et al., 2004).more favoured theory has been that temporal lobe seizures
unctionally inactivate widespread regions of frontal andarietal cortices through long-range connections or disrup-ion of normally active ascending projections of the medialhalamus and upper brainstem reticular formation (Gotman,
008; Blumenfeld et al., 2004; Englot et al., 2009). However,s the seizure continues, areas of increased HbO as wells areas of increased HbR are eventually noted in frontalnd parietal regions, probably reflecting the propagation of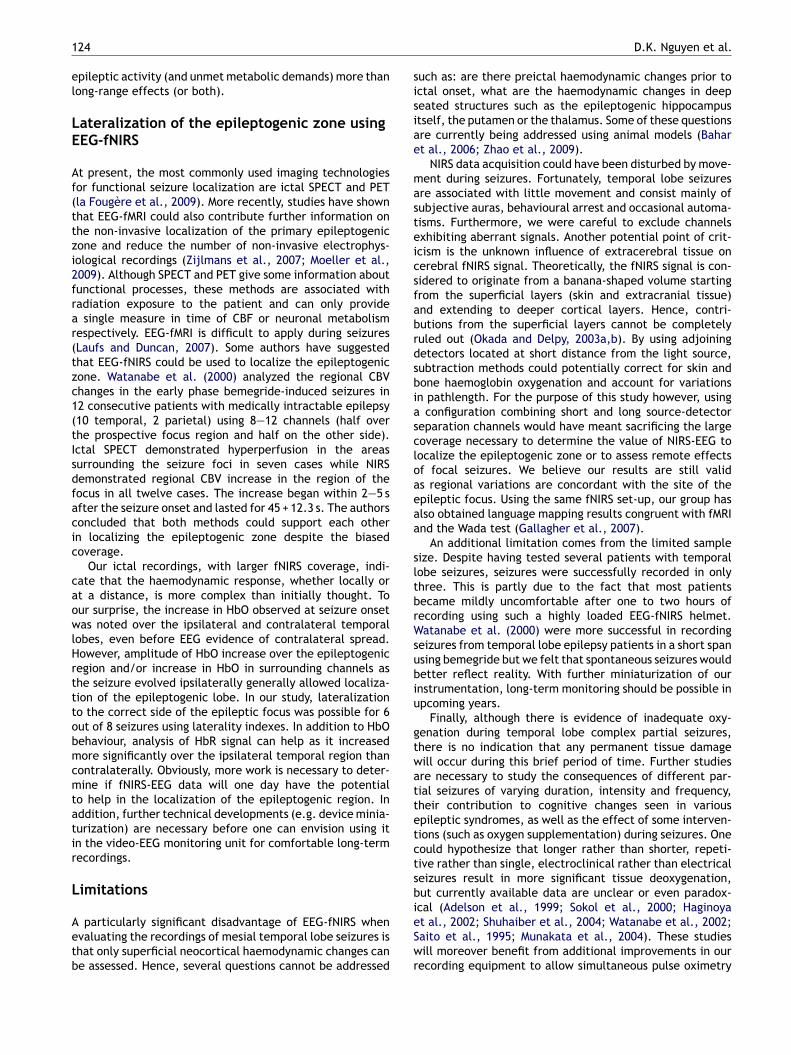
1
el
LE
Af(ttzi2frar(tzc1(tIsdfacic
caowlHrtttobmcmtatir
L
Aetb
sisiae
masteicsfabrdsbiascloaeaa
sltbrWsubiu
gtwattetctsbi
24
pileptic activity (and unmet metabolic demands) more thanong-range effects (or both).
ateralization of the epileptogenic zone usingEG-fNIRS
t present, the most commonly used imaging technologiesor functional seizure localization are ictal SPECT and PETla Fougère et al., 2009). More recently, studies have shownhat EEG-fMRI could also contribute further information onhe non-invasive localization of the primary epileptogenicone and reduce the number of non-invasive electrophys-ological recordings (Zijlmans et al., 2007; Moeller et al.,009). Although SPECT and PET give some information aboutunctional processes, these methods are associated withadiation exposure to the patient and can only provide
single measure in time of CBF or neuronal metabolismespectively. EEG-fMRI is difficult to apply during seizuresLaufs and Duncan, 2007). Some authors have suggestedhat EEG-fNIRS could be used to localize the epileptogenicone. Watanabe et al. (2000) analyzed the regional CBVhanges in the early phase bemegride-induced seizures in2 consecutive patients with medically intractable epilepsy10 temporal, 2 parietal) using 8—12 channels (half overhe prospective focus region and half on the other side).ctal SPECT demonstrated hyperperfusion in the areasurrounding the seizure foci in seven cases while NIRSemonstrated regional CBV increase in the region of theocus in all twelve cases. The increase began within 2—5 sfter the seizure onset and lasted for 45 + 12.3 s. The authorsoncluded that both methods could support each othern localizing the epileptogenic zone despite the biasedoverage.
Our ictal recordings, with larger fNIRS coverage, indi-ate that the haemodynamic response, whether locally ort a distance, is more complex than initially thought. Tour surprise, the increase in HbO observed at seizure onsetas noted over the ipsilateral and contralateral temporal
obes, even before EEG evidence of contralateral spread.owever, amplitude of HbO increase over the epileptogenicegion and/or increase in HbO in surrounding channels ashe seizure evolved ipsilaterally generally allowed localiza-ion of the epileptogenic lobe. In our study, lateralizationo the correct side of the epileptic focus was possible for 6ut of 8 seizures using laterality indexes. In addition to HbOehaviour, analysis of HbR signal can help as it increasedore significantly over the ipsilateral temporal region than
ontralaterally. Obviously, more work is necessary to deter-ine if fNIRS-EEG data will one day have the potential
o help in the localization of the epileptogenic region. Inddition, further technical developments (e.g. device minia-urization) are necessary before one can envision using itn the video-EEG monitoring unit for comfortable long-termecordings.
imitations
particularly significant disadvantage of EEG-fNIRS whenvaluating the recordings of mesial temporal lobe seizures ishat only superficial neocortical haemodynamic changes cane assessed. Hence, several questions cannot be addressed
eSwr
D.K. Nguyen et al.
uch as: are there preictal haemodynamic changes prior toctal onset, what are the haemodynamic changes in deepeated structures such as the epileptogenic hippocampustself, the putamen or the thalamus. Some of these questionsre currently being addressed using animal models (Bahart al., 2006; Zhao et al., 2009).
NIRS data acquisition could have been disturbed by move-ent during seizures. Fortunately, temporal lobe seizures
re associated with little movement and consist mainly ofubjective auras, behavioural arrest and occasional automa-isms. Furthermore, we were careful to exclude channelsxhibiting aberrant signals. Another potential point of crit-cism is the unknown influence of extracerebral tissue onerebral fNIRS signal. Theoretically, the fNIRS signal is con-idered to originate from a banana-shaped volume startingrom the superficial layers (skin and extracranial tissue)nd extending to deeper cortical layers. Hence, contri-utions from the superficial layers cannot be completelyuled out (Okada and Delpy, 2003a,b). By using adjoiningetectors located at short distance from the light source,ubtraction methods could potentially correct for skin andone haemoglobin oxygenation and account for variationsn pathlength. For the purpose of this study however, using
configuration combining short and long source-detectoreparation channels would have meant sacrificing the largeoverage necessary to determine the value of NIRS-EEG toocalize the epileptogenic zone or to assess remote effectsf focal seizures. We believe our results are still valids regional variations are concordant with the site of thepileptic focus. Using the same fNIRS set-up, our group haslso obtained language mapping results congruent with fMRInd the Wada test (Gallagher et al., 2007).
An additional limitation comes from the limited sampleize. Despite having tested several patients with temporalobe seizures, seizures were successfully recorded in onlyhree. This is partly due to the fact that most patientsecame mildly uncomfortable after one to two hours ofecording using such a highly loaded EEG-fNIRS helmet.atanabe et al. (2000) were more successful in recording
eizures from temporal lobe epilepsy patients in a short spansing bemegride but we felt that spontaneous seizures wouldetter reflect reality. With further miniaturization of ournstrumentation, long-term monitoring should be possible inpcoming years.
Finally, although there is evidence of inadequate oxy-enation during temporal lobe complex partial seizures,here is no indication that any permanent tissue damageill occur during this brief period of time. Further studiesre necessary to study the consequences of different par-ial seizures of varying duration, intensity and frequency,heir contribution to cognitive changes seen in variouspileptic syndromes, as well as the effect of some interven-ions (such as oxygen supplementation) during seizures. Oneould hypothesize that longer rather than shorter, repeti-ive rather than single, electroclinical rather than electricaleizures result in more significant tissue deoxygenation,ut currently available data are unclear or even paradox-cal (Adelson et al., 1999; Sokol et al., 2000; Haginoya
t al., 2002; Shuhaiber et al., 2004; Watanabe et al., 2002;aito et al., 1995; Munakata et al., 2004). These studiesill moreover benefit from additional improvements in ourecording equipment to allow simultaneous pulse oximetry
lobe
E
E
G
G
G
G
G
H
H
H
H
I
J
K
K
K
K
Continuous near-infrared spectroscopy imaging of temporal
data recording and analysis (compared to visual monitoringwith the initial cases reported in this study).
Conclusion
EEG-fNIRS is a non-invasive technique of great potentialfor evaluation of epileptic seizures, whether to detect ormonitor seizures, study haemodynamic changes associatedwith epileptic events and their impact, or lateralize theepileptogenic zone. In this study, observations made fromthe EEG-fNIRS recording of temporal lobe seizures revealdynamic focal and remote haemodynamic changes. Tissueoxygenation appears to undergo a biphasic HbR response toictal events with an initial decrease in HbR followed by alonger increase in HbR that often outlasts the duration ofthe seizure.
Acknowledgements
This work was supported by the Fonds de Recherche en Santédu Québec (FRSQ) grant 14385, the Canadian Institutes ofHealth Research (CIHR), Institute of Circulatory and Respi-ratory Health (ICRH) and the Heart and Stroke Foundationof Canada (HSFC) grant 62573, and the Savoy Foundation.
Appendix A. Supplementary data
Supplementary data associated with this article can befound, in the online version, at doi:10.1016/j.eplepsyres.2011.10.035.
References
Adelson, P.D., Nemoto, E., Scheuer, M., Painter, M., Morgan, J.,Yonas, H., 1999. Noninvasive continuous monitoring of cerebraloxygenation periictally using near-infrared spectroscopy: a pre-liminary report. Epilepsia 40 (11), 1484—1489.
Bahar, S., Suh, M., Zhao, M., Schwartz, T.H., 2006. Intrinsic opti-cal signal imaging of neocortical seizures: the ‘epileptic dip’.Neuroreport 17 (5), 499—503.
Bateman, L.M., Chin-Shang, L., Seyal, M., 2008. Ictal hypoxemia inlocalization-related epilepsy: analysis of incidence, severity andrisk factors. Brain 131, 3239—3245.
Blumenfeld, H., McNally, K.A., Vanderhill, S.D., Lebron Paige, A.,Chung, R., Davis, K., Norden, A.D., Stokking, R., Studholme, C.,Novotny Jr., E.J., Zubal, G., Spencer, S.S., 2004. Positive andnegative network correlations in temporal lobe epilepsy. Cereb.Cortex 14, 892—902.
Boas, D.A., Strangman, G., Culver1, J.P., Hoge, R.D., Jasdzewski,G., Poldrack, R.A., Rosen, B.R., Mandeville, J.B., 2003. Canthe cerebral metabolic rate of oxygen be estimated with near-infrared spectroscopy? Phys. Med. Biol. 48, 2405—2418.
Chassagnon, S., de Vasconcelos, A.P., Ferrandon, A., Koning, E.,Marescaux, C., Nehlig, A., 2005. Time course and mappingof cerebral perfusion during amygdala secondarily generalizedseizures. Epilepsia 46 (8), 1178—1187.
Duncan, A., Meek, J.H., Clemence, M., Elwell, C.E., Fallon, P.,Tyszczuk, L., Delpy, D.T., 1996. Measurement of cranial opti-
cal path length as a function of age using phase resolved nearinfrared spectroscopy. Pediatr. Res. 39 (5), 889—894.Dupont, P., Zaknun, J.J., Maes, A., Supatporn, T., Vasquez, S.,Bal, C.S., Van Paesschen, W., Carpintiero, S., Locharernkul,
K
seizures 125
C., Dondi, M., 2009. Dynamic perfusion patterns in tempo-ral lobe epilepsy. Eur. J. Nucl. Med. Mol. Imaging 36 (5),823—830.
nglot, D.J., Mishra, A.M., Mansuripur, P.K., Herman, P., Hyder,F., Blumenfeld, H., 2008. Remote effects of focal hippocampalseizures on the rat neocortex. J. Neurosci. 28 (36), 9066—9081.
nglot, D.J., Modi, B., Mishra, A.M., DeSalvo, M., Hyder, F., Blu-menfeld, H., 2009. Cortical deactivation induced by subcorticalnetwork dysfunction in limbic seizures. J. Neurosci. 29 (41),13006—13018.
allagher, A., Thériault, M., Maclin, E., Low, K., Gratton, G., Fabi-ani, M., Gagnon, L., Valois, K., Rouleau, I., Sauerwein, H.C.,Carmant, L., Nguyen, D.K., Lortie, A., Lepore, F., Béland, R.,Lassonde, M., 2007. Near-infrared spectroscopy (NIRS) as analternative to the Wada test for language mapping in children:adults and special populations. Epileptic Disord. 9 (3), 241—255.
allagher, A., Lassonde, M., Bastien, D., Vannasing, P., Lesage, F.,Grova, C., Bouthillier, A., Carmant, L., Lepore, F., Béland, R.,Nguyen, D.K., 2008. A non-invasive pre-surgical investigation ina 10-year old epileptic boy using simultaneous NIRS-EEG. Seizure17 (6), 576—582.
offin, K., Dedeurwaerdere, S., Laere, K.V., Van Paescchen, W.,2008. Neuronuclear assessment of patients with epilepsy. Semin.Nucl. Med. 38, 227—239.
otman, J., 2008. Epileptic networds studied with EEG-fMRI. Epilep-sia 49 (Suppl. 3), 42—51.
otman, J., Kobayashi, E., Bagshaw, A.P., Bénar, C-G., Dubeau, F.,Combining, E.E.G., 2006. fMRI: a multimodal tool for epilepsyresearch. J. Magn. Reson. Imaging 23, 906—920.
aginoya, K., Munakata, M., Kato, R., Yokoyama, H., Ishizuka, M.,Inuma, K., 2002. Ictal cerebral haemodynamics of childhoodepilepsy measured with near-infrared spectrophotometry. Brain125, 1960—1971.
oshi, Y., Tamura, M., 1993. Dynamic changes in cerebral oxy-genation in chemically induced seizures in rats: study bynear-infrared spectrophotometry. Brain Res. 603, 215—221.
uberfeld, G., Habert, M-O., Clemenceau, S., Maksud, P., Baulac,M., Adam, C., 2006. Ictal brain hyperperfusion contralateralto seizure onset: the SPECT mirror image. Epilepsia 47 (1),123—133.
uppert, T.J., Diamon, S.G., Franceschini, M.A., Boas, D.A.,2009. HomER: a review of time-series analysis methods fornear-infrared spectroscopy of the brain. Appl. Opt. 48 (10),D280—D298.
rani, F., Platek, S.M., Bunce, S., Ruocco, A.C., Chute, D., 2007.Functional near infrared spectroscopy (fNIRS): an emerging neu-roimaging technology with important applications for the studyof brain disorders. Clin. Neuropsychol. 21 (1), 9—37.
öbsis, F.F., 1977. Noninvasive, infrared monitoring of cerebral andmyocardial oxygen sufficiency and circulatory parameters. Sci-ence 198 (4323), 1264—1267.
aiboriboon, K., Bertrand, M.E., Osman, M.M., Hogan, E., 2005.Quantitative analysis of cerebral blood flow patterns in mesialtemporal lobe epilepsy using composite SISCOM. J. Nucl. Med.46, 38—43.
obayashi, E., Hawco, C.S., Grova, C., Dubeau, F., Gotman, J.,2006a. Widespread and intense BOLD changes during brief focalelectrographic seizures. Neurology 66, 1049—1055.
obayashi, E., Bagshaw, A.P., Benar, C.G., Aghakhani, Y., Ander-mann, F., Dubeau, F., Gotman, J., 2006b. Temporal andextratemporal BOLD responses to temporal lobe interictalspikes. Epilepsia 47 (2), 343—354.
reisman, N.R., Lamanna, J.C., Rosenthal, M., Sick, T.J., 1981.Oxidative metabolic responses with recurrent seizures in rat
cerebral cortex: role of systemic factors. Brain Res. 218 (1-2),175—188.reisman, N.R., Sick, T.J., Rosenthal, M., 1983. Importance ofvascular responses in determining cortical oxygenation during
1
K
l
L
L
L
L
M
M
M
M
O
O
P
R
S
S
S
S
S
S
S
T
T
T
T
V
V
W
W
W
Z
Z
26
recurrent paroxysmal events of varying duration and frequencyof repetition. J. Cereb. Blood Flow Metab. 3 (3), 330—338.
reisman, N.R., Sick, T.J., Rosenthal, M., 1984. Concepts of brainoxygen sufficiency during seizures. Adv. Exp. Med. Biol. 180,192—381.
a Fougère, C., Rominger, A., Forster, S., Geisler, J., Bartenstein,P., 2009. PET and SPECT in epilepsy: a critical review. EpilepsyBehav. 15 (1), 50—55.
aufs, H., Duncan, J.S., 2007. Electroencephalography/functionalMRI in human epilepsy: what it currently can and cannot do.Curr. Opin. Neurol. 20, 417—423.
ee, H.W., Hong, S.B., Tae, W.S., 2000. Opposite ictal perfusion pat-terns of substracted SPECT. Hyperperfusion and hypoperfusion.Brain 123, 2150—2159.
eVan, P., Tyvaert, L., Moeller, F., Gotman, J., 2010. Independentcomponent analysis reveals dynamic ictal BOLD responses inEEG-fMRI data from focal epilepsy patients. Neuroimage 49,366—378.
loyd-Fox, S., Blasi, A., Elwell, C.E., 2010. Illuminating the devel-oping brain: the past, present and future of functional nearinfrared spectroscopy (review). Neurosci. Biobehav. Rev. 34,269—284.
eldrum, B.S., Brierly, J.B., 1973. Prolonged epileptic seizures inprimates: ischemic cell change and its relation to ictal physio-logical events. Arch. Neurol. 128, 10—17.
enzel, C., Grunwald, F., Klemm, E., Ruhlmann, J., Elger, C.E.,Biersack, H.J., 1998. Inhibitory efects of mesial temporal partialseizures onto frontal neocortical structures. Acta Neurol. Belg.98, 327—331.
oeller, F., Tyvaert, L., Nguyen, D.K., LeVan, P., Bouthillier, A.,Kobayashi, E., Tampieri, D., Dubeau, F., Gotman, J., 2009. EEG-fMRI: adding to standard evaluations of patients with nonlesionalfrontal lobe epilepsy. Neurology 73 (23), 2023—2030.
unakata, M., Haginoya, K., Ishitobi, M., Sakamoto, O., Sato,I., Kitamura, T., Hirose, M., Yokoyama, H., Iinuma, K., 2004.Dynamic cortical activity during spasms in three patients withWest syndrome: a multichannel near-infrared spectroscopictopography study. Epilepsia 45 (10), 1248—1257.
kada, E., Delpy, D.T., 2003a. Near-infrared light propagation inan adult head model. I. Modeling of low-level scattering in thecerebrospinal fluid layer. Appl. Opt. 42 (16), 2906—2914.
kada, E., Delpy, D.T., 2003b. Near-infrared light propagation in anadult head model. II. Effect of superficial tissue thickness on thesensitivity of the near-infrared spectroscopy signal. Appl. Opt.42 (16), 2915—2922.
enfield, W., Jasper, H., 1954. Epileptic Mechanisms (cortical circu-lation) (Chapter VI) in Epilepsy and the Functional Anatomy ofthe Human Brain. Little, Brown and Company Ed., Boston, pp.246—264.
abinowicz, A.L., Salas, E., Beserra, F., Leiguarda, R.C., Vazquez,S.E., 1997. Changes in regional cerebral blood flow beyond thetemporal lobe in unilateral temporal lobe epilepsy. Epilepsia 38,1011—1014.
aito, S., Yoshikawa, D., Nishihara, F., Morita, T., Kitani, Y., Amaya,T., Fujita, T., 1995. The cerebral haemodynamic response toelectrically induced seizures in man. Brain Res. 673, 93—100.
hin, W.C., Hong, S.B., Tae, W.S., Kim, S.E., 2002. Ictal hyperper-
fusion patterns according to the progression of temporal lobeseizures. Neurology 58 (3), 373—580.huhaiber, H., Bolton, S., Alfonso, I., 2004. Cerebral regionaloxygen fluctuations and decline during clinically silent focal
Z
D.K. Nguyen et al.
electroencephalographic seizures in a neonate. J. Child Neurol.19, 539—540.
okol, D.K., Markand, O.N., Daly, E.C., Luerssen, T.G., Malkoff,M.D., 2000. Near infrared spectroscopy (NIRS) distinguishesseizure types. Seizure 9, 323—327.
pencer, S.S., Williamson, P.D., Spencer, D.D., Mattson, R.H., 1987.Human hippocampal seizure spread studied by depth and sub-dural recording: the hippocampal commissure. Epilepsia 28,479—489.
teinhoff, B.J., Herrendorf, G., Kruth, C., 1996. Ictal near infraredspectroscopy in temporal lobe epilepsy: a pilot study. Seizure 5,97—101.
uh, M., Ma, H., Zhao, M., Sharif, S., Schwartz, T.H., 2006. Neu-rovascular coupling and oximetry during epileptic events. Mol.Neurobiol. 33, 181—197.
ae, W.S., Joo, E.Y., Kim, J.H., Han, S.J., Suh, Y-L., Kim, B.T.,Hong, S.C., Hong, S.B., 2005. Cerebral perfusion changes inmesial temporal lobe epilepsy: SPM analysis of ictal and interic-tal SPECT. Neuroimage 24, 101—110.
hornton, R.C., Rodionov, R., Laufs, H., Vulliemoz, S., Vaudano, A.,Carmichael, D., Cannadathu, S., Guye, M., McEvoy, A., Lhatoo,S., Bartolomei, F., Chauvel, F., Chauvel, P., Diehl, B., De Martino,F., Elwes, R.D.C., Walker, M.C., Duncan, J.S., Lemieux, L., 2010.Imaging haemodynamic changes related to seizures: compari-son of EEG-based general linear model, independent componentanalysis of fMRI and intracranial EEG. Neuroimage 53, 196—205.
ruccolo, W., Donoghue, J.A., Hochberg, L.R., Eskandar, E.N., Mad-sen, J.R., Anderson, W.S., Brown, E.N., Halgren, E., Cash, S.S.,2011. Single-neuron dynamics in human focal epilepsy. Nat. Neu-rosci. 14 (5), 635—641.
yvaert, L., LeVan, P., Dubeau, F., Gotman, J., 2009. Noninvasivedynamic imaging of seizures in epileptic patients. Hum. BrainMapp. 30, 3993—4011.
an Paesschen, W., Dupont, P., Van Driel, G., Van Billoen, H., Maes,A., 2003. SPECT perfusion changes in patients with hippocampalsclerosis. Brain 126, 1103—1111.
illringer, A., Planck, J., Stodieck, S., Boetzel, K., Schleinkofer, L.,Dirnagl, U., 1994. Noninvasive assessment of cerebral haemo-dynamics and tissue oxygenation during activation of brain cellfunction in human adults using near infrared spectroscopy. Adv.Exp. Med. Biol. 345, 559—565.
allois, F., Patil, A., Kongolo, G., Goudjil, S., Grebe, R., 2009.Haemodynamic changes during seizure-like activity in a neonate:a simultaneous AC EEG-SPIR and high-resolution DC EEG record-ing. Clin. Neurophysiol. 39, 217—227.
atanabe, E., Maki, A., Kawaguchi, F., Yamashita, Y., Koizumi, H.,Mayanagi, Y., 2000. J. Biomed. Opt. 5 (3), 287—290.
atanabe, E., Nagahori, Y., Mayanagi, Y., 2002. Focus diagnosis ofepilepsy using near-infrared spectroscopy. Epilepsia 43 (Suppl.9), 50—55.
hao, M., Suh, M., Ma, H., Perry, C., Geneslaw, A., Schwartz,T.H., 2007. Focal increases in perfusion and decreases inhemoglobin oxygenation precede seizure onset in spontaneoushuman epilepsy. Epilepsia 48 (11), 2059—2067.
hao, M., Ma, H., Suh, M., Schwartz, T.H., 2009. Spatiotemporaldynamics of perfusion and oximetry during ictal discharges inthe rat neocortex. J. Neurosci. 29 (9), 2814—2823.
ijlmans, M., Huiskamp, G., Hersevoort, M., Seppenwoolde, J.-H., va Huffelen, A.C., Leijten, F.S.S., 2007. EEG-fMRI inthe preoperative work-up for epilepsy surgery. Brain 130,2343—2353.
Copyright © 2022 FDOKUMEN