Effect of seizures on the cognitive and behavioral phenotypes ...
249
HAL Id: tel-02169202 https://tel.archives-ouvertes.fr/tel-02169202 Submitted on 1 Jul 2019 HAL is a multi-disciplinary open access archive for the deposit and dissemination of sci- entific research documents, whether they are pub- lished or not. The documents may come from teaching and research institutions in France or abroad, or from public or private research centers. L’archive ouverte pluridisciplinaire HAL, est destinée au dépôt et à la diffusion de documents scientifiques de niveau recherche, publiés ou non, émanant des établissements d’enseignement et de recherche français ou étrangers, des laboratoires publics ou privés. Effect of seizures on the cognitive and behavioral phenotypes of mouse models carrying the Scn1a gene mutation : implications for Dravet Syndrome Ana Rita Salgueiro Pereira To cite this version: Ana Rita Salgueiro Pereira. Effect of seizures on the cognitive and behavioral phenotypes of mouse models carrying the Scn1a gene mutation : implications for Dravet Syndrome. Agricultural sciences. Université Côte d’Azur, 2017. English. NNT : 2017AZUR4019. tel-02169202
-
Upload
khangminh22 -
Category
Documents
-
view
2 -
download
0
Transcript of Effect of seizures on the cognitive and behavioral phenotypes ...

HAL Id: tel-02169202https://tel.archives-ouvertes.fr/tel-02169202
Submitted on 1 Jul 2019
HAL is a multi-disciplinary open accessarchive for the deposit and dissemination of sci-entific research documents, whether they are pub-lished or not. The documents may come fromteaching and research institutions in France orabroad, or from public or private research centers.
L’archive ouverte pluridisciplinaire HAL, estdestinée au dépôt et à la diffusion de documentsscientifiques de niveau recherche, publiés ou non,émanant des établissements d’enseignement et derecherche français ou étrangers, des laboratoirespublics ou privés.
Effect of seizures on the cognitive and behavioralphenotypes of mouse models carrying the Scn1a gene
mutation : implications for Dravet SyndromeAna Rita Salgueiro Pereira
To cite this version:Ana Rita Salgueiro Pereira. Effect of seizures on the cognitive and behavioral phenotypes of mousemodels carrying the Scn1a gene mutation : implications for Dravet Syndrome. Agricultural sciences.Université Côte d’Azur, 2017. English. NNT : 2017AZUR4019. tel-02169202

Ecole Doctorale Sciences de la Vie et de la Santé Unité de recherche : UMR 7275
Thèse de doctorat
Présentée en vue de l’obtention du grade de docteur en Interactions Moléculaires et Cellulaires
de l’Université Côte d’Azur
par
Ana Rita Salgueiro Pereira
L’effet des crises épileptiques sur les fonctions cognitives et comportementales des modèles murins portant la mutation du gène Scn1a.
«Implications dans le Syndrome de Dravet »
Effect of seizures on the cognitive and behavioral phenotypes of
mouse models carrying the Scn1a gene mutation. “Implications for Dravet Syndrome”
Dirigée par Hélène Marie, CR1, CNRS
et codirigée par Ingrid Bethus, MCU, UNS
Soutenue le 7 avril 2017
Devant le jury composé de :
Docteur Ingrid BETHUS Maitre de Conférences, Nice (UNS, IPMC) Co- Directrice de thèse
Professeur René GARCIA Professeur Universitaire, Nice (UNS,INT) Président de Jury
Docteur Hélène MARIE Chargé de Recherche, Valbonne (IPMC) Directrice de thèse
Docteur Nadine RAVEL Directeur de Recherche, Lyon (CRNL) Rapporteur
Docteur Alfonso REPRESA Directeur de Recherche, Marseille (INMED) Rapporteur
Docteur Francesca SARGOLINI Maitre de Conférences, HDR, Marseille (LNC) Examinateur


This work is the result of a collaboration between Doctor Bethus/Doctor Marie
(from Dr.Marie’s team with expertise in behavior analysis and hippocampus slices
electrophysiology) and Dr. Mantegazza’s team (with expertise in sodium channels biology
and genetic epilepsies’ neuropathology and that contributed to the generation of the first
Dravet Syndrome mouse model). This project was funded by the DESIRE Consortium, a
2013-2018 FP7-HEALTH funded European project focused on Development & Epilepsy -
Strategies for Innovative Research to Improve Diagnosis, Prevention and Treatment In
children with Difficulty to treat Epilepsy (http://epilepsydesireproject.eu/)


RÉSUMÉ
Les mutations du gène SCN1A, codant pour le canal sodique de type 1 potentiel-
dépendant (Nav1.1), sont impliquées dans plusieurs formes d'épilepsie du nourrisson,
comme le Syndrome de Dravet (SD), une épilepsie rare et pharmaco-résistante ou
l’Epilepsie généralisée avec crises fébriles plus (GEFS+), une épilepsie plus légère. GEFS+
et SD sont associés à des crises épileptiques fébriles dès l’âge de 6 mois. Le SD constitue la
forme la plus grave où l’on voit apparaitre des retards mentaux mais également des déficits
moteurs, visuels, langagiers et mnésiques au cours de l’évolution de la maladie. L’impact
des crises épileptiques au cours de la petite enfance sur ces déficits cognitifs n’est pas
connu. Jusqu'à présent, le SD était considéré comme étant une encéphalopathie épileptique
où les crises étaient les principales responsables du phénotype à l’âge adulte. Cependant,
récemment, un rôle potentiel de la mutation dans les troubles cognitifs a été mis en évidence
changeant a priori la définition de SD d’encéphalopathie épileptique à une canalopathie
(Bender et al., 2013, 2016; Han et al., 2012a). Notre projet adresse la question suivante:
Quel est le rôle des crises épileptiques répétées présentées par les enfants SD sur les
fonctions cognitives à l’âge adulte? Pour cela nous avons utilisé un modèle murin de la
maladie portant une mutation faux-sens du gène Scn1a (R1648H), et qui présente une
pathologie très légère. Nous avons induit des crises épileptiques par hyperthermie à l’âge de
21 jours pendant 10 jours et testé les effets à long-terme sur ces animaux à l’âge adulte. Nos
résultats révèlent que l’induction de crises épileptiques par hyperthermie induit une
hyperactivité, des altérations dans les interactions sociales et des déficits en mémoire
hippocampo-dépendante et cortex préfronto-dépendante. Ces modifications
comportementales sont associées à des modifications de l’électrocorticogramme avec
apparition de crises spontanées et à d’importantes modifications de l’excitabilité neuronale
intrinsèque dans l’hippocampe. Même si le rôle possible du canal NaV1.1 dans le
dysfonctionnement neuronal et l’effet des crises répétées ne sont probablement pas
mutuellement distinctes, l’induction de crises répétées à un jeune âge semble donc
suffisante pour convertir un modèle léger portant la mutation du gène Scn1a en un modèle
sévère. Ainsi nous avons mis en évidence que les crises épileptiques répétées pendant le
développement ont un fort impact sur la fonction cérébrale et qu’il est donc capital de les
prévenir afin de diminuer, voir de prévenir, ces déficits.


ABSTRACT
Sodium voltage-gated channel alpha subunit 1 (SCN1A) gene code for type-I
voltage-gated sodium channels (NaV1.1) in human and rodent central nervous systems.
SCN1A mutations cause genetic epilepsies, as Generalized Epilepsy with Febrile Seizures
plus (GEFS+), a mild epileptic syndrome, or Dravet Syndrome (DS), a rare, severe and
drug-resistant epileptic encephalopathy (EE). DS children present multiform and intractable
seizures starting in the first year of life and severe cognitive, social and neurological deficits
that, according to the definition of EE, should be caused by the recurrent epileptic activity.
Yet, there are currently two main hypotheses that could explain behavioral and cognitive
outcome in DS children. The first hypothesis states that the Nav 1.1 mutation per se causes
neuron network functional alterations responsible for behavioral outcome. Recent work in
mice models of the disease supports this first hypothesis (Bender et al., 2013, 2016; Han et
al., 2012a). The other hypothesis, supported by the classical definition of EE, is that the
repeated seizures in early childhood cause the behavioral outcome. However, this second
hypothesis currently lacks experimental and clinical support. Identification of the
pathomechanisms responsible for disease progression is crucial for the development of
efficient treatments. We therefore tested this second hypothesis. We studied the implication
of repeated seizures during childhood to the later long-term modifications on
cognitive/behavioral and epileptic phenotypes by submitting the Scn1a mouse model
carrying the R1648H missense mutation and presenting mild phenotype to a protocol of
repeated seizures induction by hyperthermia (10 days/one seizure per day). We observed
that early life seizures can worsen the epileptic phenotype and induce cognitive/behavioral
defects notably by inducing hyperactivity, sociability deficits and hippocampus- and
prefrontal cortex-dependent memory deficits. These deficits are correlated with changes in
the intrinsic neuronal excitability in the hippocampus without major cytoarchitecture
changes or neuronal death.
Although the effect of NaV1.1 dysfuntion in altering brain synchrony and the effect
of repeated seizure activity in the young brain are not mutually exclusive, we thus conclude
that epileptic seizures are sufficient to convert a Scn1a mouse model carrying a mild
phenotype into a severe phenotype. This work points the necessity of treating the epileptic
seizures for a better long-term outcome in DS patients.


Aos meus pais… Porque esta conquista também é vossa.

AKNOWLEDGMENTS/REMERCIEMENT
S/AGRADECIMENTOS
Il y a tellement de gens que je souhaite remercier pour ces 41/2 merveilleuses années passées à l’IPMC. Je ne les oublierai jamais.
Premièrement à ma directrice de thèse, le docteur Hélène Marie d’avoir accepté que j’intègre son équipe lors de mon master alors qu’on ne s’est jamais vues. Merci pour toute la confiance dès le premier jour, merci de ne m’avoir jamais dit ‘non’ à ce que je demandais d’acheter ou faire et m’avoir poussée à aller toujours plus loin en m’encourageant à chaque avancée. Merci pour la liberté et autonomie que vous m’avez données dans la réalisation des expériences et dans les horaires de travail. Merci pour avoir permis que toutes les conditions de travail soient réunies pour la bonne réalisation de mon projet. Merci d’avoir été un exemple pour moi au niveau de ton organisation et efficacité. Je te l’ai déjà dit mais je n’ai jamais vu quelqu’un d’aussi efficace et j’espère le retenir de toi pour mon futur. Merci de m’avoir appris à faire de l’électrophysiologie sur tranches d’hippocampe, et pour toute ta patience. Merci pout toute ta précieuse aide dans les corrections des différents rapports au cours de ma thèse. Merci de t’être autant impliquée dans ce projet, pour moi et que je puisse avoir de bons résultats. Merci car tous tes enseignements ont contribué à me faire grandir scientifiquement. Merci.
Et premièrement à nouveau à ma co-directrice de thèse, le docteur Ingrid Bethus, merci pour avoir pleuré autant que moi le jour de mon départ en master. Merci d’avoir tout fait pour que je reste en thèse, car aujourd’hui je suis sûre que j’ai fait le bon choix. Merci de m’avoir transmis cette passion pour le comportement animal et la mémoire humaine. Tu sais qu’aujourd’hui je les aime autant que tu les aimes. Merci de m’avoir appris toutes les tâches comportementales, de m’avoir aidé à trouver et résoudre les problèmes et de m’avoir remplacée dans les expériences quand j’en ai eu besoin. Merci pour ton dévouement inconditionnel à notre projet et d’avoir célébrer chaque victoire avec moi. Et merci d’avoir été plus qu’une directrice de thèse une amie pour toute les fois où on s’est amusées ensemble au labo ou en congrès. Merci pour toute ta bienveillance et pour toutes les connaissances que tu m’as transmises. Merci, car avec Hélène vous avez contribué à me former scientifiquement et humainement. Merci.
Ma super équipe:
Paula, nunca te vou esquecer. Obrigada por tantos conselhos, sugestões e ensinamentos. Admiro a forma como descobres e exploras os resultados científicos que me fizeram compreende-los melhor. Lembrarei sempre o “é giro” que tanto te caracteriza. Obrigada por dedicares o teu tempo para fazeres as experiências para o meu projeto e por me transmitires um bocadinho da tua paixao pela electrofisiologia. Obrigado por me ensinares tao bem com os teus desenhos e por me transmitires a tua forma de fazer todas as coisas bem-feitas “bonitinhas”. Obrigada minha querida, foste o meu maior e mais seguro porto de abrigo no laboratório. Obrigada porque muito mais do que cientificamente me soubeste proteger sempre emocionalmente. Foste a minha irmã mais velha e nunca te vou esquecer. Obrigada pela tua genuinidade e sinceridade. Obrigada porque foi tao bom poder falar em português todos os dias no laboratório.
Scherazad, my everyday friend. Thank you for being there always for me. I will never forget the long nights in the lab together listening to beautiful songs. Thank you for all the help with mice, the experiments, the documents, formations, deadlines and everything. Thank you for all the sharing: work, personal life and friendship. We grew together during these 3 years and I am very proud of us. But I am even more proud of you, and to have assisted to your change in being much stronger while keeping your sincerity and honesty. These years were so nice and I would love spending more years with you all in the lab.

Sebastian, thank you for all the help with the different experiments (electrophysiology, graph pad, cameras in Animex, while manipulating the very dangerous compound, survival curves …etc). Thank you for so many times helping us while leaving your work for later. Thanks for all the advice, comments; help, critics and for always being honest…and for all the good times we had all together. You are such a nice person and your sense of humor has made our days better in the lab. You are the sun of the lab. I will miss us laughing all the time. You know that you changed us, making me and Scherazad say bad words and your main failure during these years was to make us more social, but still you tried hard (and if we didn’t… want we can go…). It was ok, we had a lot of fun because our team was full of stories every day.
Xavier merci pour toute ton aide précieuse au cours de ces années. Merci pour toute l’aide avec les commandes et les manips que tu m’as fournie. Merci pour ton sens de l’humour et toutes tes histoires. Merci pour ta gentillesse au cours de ces 3 années.
Jacques même si on n’est pas amis et que tu nous le répètes sans cesse ou que j’ai perdu la gentillesse au cours de ma thèse je te remercie beaucoup pour tous les conseils, toutes les discussions et ta bienveillance. Je t’admire beaucoup scientifiquement. Même si tout ce qui bouge doit disparaitre de devant toi quand tu fais des manips, tu es quelqu’un de très gentil. Merci beaucoup et bonne chance bientôt co-chef d’équipe.
Marie-Lise, Préci, et Loïc merci pour les bons moments passés dans le bureau. Merci pour votre bonne humeur et pour votre sincérité. Merci pour tous les sourires et encouragements. Merci à chacun de vous d’avoir partagé un petit peu de soi et m’avoir fait sentir à la maison au long de ces années.
Martine et Marion merci d’avoir fait un petit peu partie de mon projet. Merci pour toute votre aide et dévouement dans la réalisation des expériences. Vous êtes de super étudiantes.
Ma deuxième équipe:
Massimo, merci pour tout l’échange scientifique. Je t’admire beaucoup scientifiquement. Merci de me faire confiance et de me transmettre ton savoir. Merci de toujours savoir répondre à mes questions avec autant de patience et précision. Tu es quelqu’un de très important dans le domaine et j’espère que tu feras avancer la recherche sur le Syndrome de Dravet et qu’un jour tu puisses trouver le remède pour les patients.
Marraine Sandrine, merci d’avoir accepté d’intégrer le rôle de ma marraine de thèse et de l’avoir aussi bien exécuter. Merci de m’avoir accompagnée et d’être toujours aussi présente. Merci de surtout au début m’avoir aidée à résoudre les problèmes avec le protocole d’induction de crises. Merci pour ta douceur, pour ta gentillesse et bienveillance. Merci avoir été là pour me protéger de tous mes encadrants mais au final tout s’est bien passé.
Marion et Jenny, merci sincèrement les filles pour toutes les souris, génotypage, primers…etc. Désolé de vous avoir autant embêtées, votre aide a été précieuse à cours de ma thèse.
Fabrice, tu es exceptionnellement organisé et bricoleur. Tout ce que tu fais a un rendu parfait. Je t’admire beaucoup. Merci pour toute ton aide et pour être toujours disponible.
Alexandre, merci de m’avoir aidée avec les expériences de patch-clamp. Merci pour ton sens de l’humour et ta gentillesse.
Pour le support:
Lucien, merci de t’occuper aussi bien de toutes mes souris à Animex sans jamais te plaindre. Merci pour les petits (grands) mots d’encouragements quand ce n’était pas toujours facile pour moi d’être
enfermée à Animex sans voir la lumière du jour. Après avoir badgé plus de 400 fois en 6 mois, on s’est habitués à se voir souvent. Merci!
Thomas Lorivel, merci infiniment pour toutes les discussions scientifiques et pour toutes les fois où tu as consacré ton temps à m’aider avec les infinis problèmes à Animex (caméra, lampes, ordinateur…etc). Merci pour tous les partages lors des repas, cafés etc. Merci.
Doctor Battaglia and Doctor Dravet for this amazing experience in Rome. Thank you very much for being so patient in explaining me all the clinical aspects of Dravet Syndrome and making me feel part of the team. Thank you for giving me the opportunity to see the Dravet patients. Thank you very much.
Ao maior suporte emocional:
Meu amor, Talvez já te tenha dito, faço questão de voltar a dizer o quanto foste importante nestes 4 anos e desde sempre. O facto de te seguir e vir para França acabou por ser benéfico em todos os sentidos. Obrigada por me incentivares a fazer o doutoramento mesmo quando sabíamos que ia ser difícil e desgastante. Obrigada por nunca te queixares e sempre me apoiares quanto tinha que fazer horários prolongados e trabalhar muitos fins-de-semana seguidos. Obrigada porque a nossa casa foi o meu porto de abrigo, aquele em que me sentia segura e protegida. O teu amor e carinho foram essenciais para mim. “O amor move montanhas”. O meu sucesso hoje é tambémo teu sucesso e espero que possamos partilha-los mutuamente por muito tempo.
Meus Pais queridos, obrigada por me ensinarem a pescar, e não me darem o peixe. Obrigada pelo dever do trabalho, responsibilidade e independência que sempre me incutiram desde pequena. Esse dever pertiu-me duante esta caminhada enfrentar as mais variadas adversidades com garra e sem nunca baixar os braços. E hoje essa caminhada moldada por bases solidas permitiu-me alcançar os meus objectivos e chegar mais longe. O meu sucesso dedico-o a vos pois é graças a vos. Obrigada por acreditarem em mim sem nunca questionarem ou criticarem as minhas escolhas. Obrigada pelo conforto, amor e segurança que me transmitem que se tornaram essenciais em moldar a minha personalidade. “O amor move montanhas”.
À minha família, por todo o apoio especialmente tia e sana vos sabeis o amor que nos une. Mais forte do que simples tia ou prima amo-vos como se fosseis mae e irmã. Obrigada por todo o suporte, por todo o amor. Mesmo quando passamos juntas por momentos difíceis, mais uma vez “o amor move montanhas”. Sabes que fiz tudo o que pude por ti mesmo se às vezes foi difícil com o trabalho. Minha avo Idalina querida, infelizmente hoje não estas aqui para ver a minha caminhada, no entanto sei que estarás para sempre a olhar por mim. Dora e Abilio, por seres para mim como pais e me acolheres como filha. Obrigada por me amares tanto e me apoiares incondicionalmente nos mais diversos problemas. Obrigada por estares sempre presentes para nos ajudar e nos acompanhar. Obrigada por que foste essenciais na minha caminhada e o meu sucesso é também o vosso “O amor move montanhas”. Minhas queridas amigas Eliana e Soraia, obrigada pelas longas noitadas passadas juntas. Por toda a vossa amizade, estarei sempre aqui para tudo o que precisareis. Vos sabeis o quanto sois especiais para mim. “ a amizade certamente também move montanhas”


February 2017, Policlinico A. Gemmeli, Rome.
Doctor Charlotte Dravet and me
I am really glad to have been given the opportunity by Doctor Domenica Battaglia who
welcomed me in the Pediatric Phychiatric service to assist to the patients’ consultations with
Doctor Charlotte Dravet. The experimental research is very pleasant but it only becomes
gratefull when you see the reason of all your efforts. I will never forget those kids and the mix
of suffering and hope in their parents’ eyes.


TABLE OF CONTENTS
LIST OF TABLES ....................................................................................................................i
LIST OF FIGURES ............................................................................................................... iii
LIST OF ABBREVIATIONS ..................................................................................................v
LIST OF DEFINITIONS ...................................................................................................... vii
REVISION OF CONCEPTS ..................................................................................................ix
I- Introduction ..........................................................................................................................1
Chapter 1- Epilepsy and genetic epilepsies .............................................................................1
1. Historical, definition and epidemiology. ..................................................................1
2. Classification of Seizures, Epilepsies and comorbidities.........................................2
2.1 Seizures Definition and Classification ................................................................2
2.2 Co-morbidities in epilepsy ..................................................................................4
2.2.1 Epileptic Encephalopathies....................................................................5
2.3 Etiology of epilepsy ............................................................................................6
Chapter 2- Genetic epilepsies associated to SCN1A gene mutation........................................8
1. SCN1A gene and type-I voltage gated sodium channel............................................8
2. NaV 1.1 channel phenotypic/genotypic spectrum ..................................................13
2.1 A shared common feature: Febrile seizures ......................................................13
2.2 Epileptic syndromes associated to NaV1.1 channel mutation: genetic and
phenotypic variants. ...............................................................................................................14
2.2.1 Type of mutations and their localization in the SCN1A gene. .............15
2.2.2 Inherited transmission of SCN1A-DS mutations. The concept of
mosaicism. ................................................................................................................17
2.2.3 Phenotypic variability in GEFS+ and DS: genetic and environmental
factors. ......................................................................................................................17
3. Genetic epilepsy with febrile seizures plus (GEFS+) ............................................18
3.1 GEFS+ historical, definition and epidemiology ...............................................18
3.2 The genetics of GEFS+ .....................................................................................19
3.3 Clinical characterization of GEFS+:epileptic history .......................................19
3.4 Therapeutic strategy and long-term outcome....................................................20
4. Dravet Syndrome (DS) ...........................................................................................21
4.1 DS historical, Definition and Epidemiology.....................................................21

4.2 The genetics of DS ............................................................................................22
4.3 Clinical characterization of DS: Epileptic history ............................................22
4.4 Neuroimaging and neuropathology...................................................................24
4.5 Therapeutic strategy and long term outcome ....................................................24
Chapter 3- Behavioral and cognitive: Long-term outcome in Dravet Syndrome : ...............27
1. Neurological Abnormalities in Dravet syndrome ..................................................27
2. Cognitive delay and regression in Dravet syndrome .............................................28
3. Psychiatric/behavioral abnormalities in Dravet Syndrome ....................................29
Chapter 4- Animal models of epilepsy and seizures consequences on cognition .................31
1. Models of recurrent seizures at early-age on the developing brain and their
consequences on behavioral and cognitive phenotypes .........................................................32
1.1 Hyperthermia- induced seizures: the model of febrile seizures, its epileptic and
behavioral consequences........................................................................................................32
1.2 Flurothyl- induced seizures: its epileptic and behavioral consequences ...........34
2. Animal models harboring the Scn1a mutation .......................................................35
2.1 Using animal models of Scn1a mutation ..........................................................35
2.2 Impaired neuronal inhibition in Scn1a mouse models: Role of interneurons ...36
2.3 Strain and age dependent - phenotypic severity: mortality, seizure frequency
and electrophysiological properties. ......................................................................................39
2.4 Behavioral/cognitive phenotypes in mouse models of Scn1a gene mutation ...41
2.4.1 DS mouse model ..................................................................................42
2.4.2 GEFS+ mouse model ...........................................................................48
Chapter 5- Seizures and Cognitive phenotype in DS: Epileptic encephalopathy or
channelopathy?.......................................................................................................................51
1. Can seizure severity be correlated with cognitive/behavioral outcome in DS
patients? .................................................................................................................................51
2. Do NaV1.1 dysfunctional mice support the channelopathy theory?.......................53
II- PROBLEMATIC AND OBJECTIVES ............................................................................57
III- MATERIAL AND METHODS.......................................................................................61
1. Animal models , breeding and housing conditions ................................................61
1.1 Scn1a+/- (NaV1.1 knock-out): Dravet Syndrome’s mouse model:.....................61
1.2 Scn1aRH/+ (NaV 1.1 knock- in): GEFS+ mouse model .......................................61
1.3 Housing conditions ...........................................................................................62

2. Experimental timeline ............................................................................................62
2.1 Genotyping........................................................................................................63
2.1.1 DNA extraction....................................................................................63
2.1.2 DNA amplification ..............................................................................64
2.1.3 DNA revelation and sequencing ..........................................................64
2.2 Repeated Seizures induction .............................................................................66
2.2.1 Seizures induction by hyperthermia ....................................................66
2.2.2 Seizures induction by flurothyl............................................................66
2.2.3 Behavioral characterization of seizures ...............................................67
2.3 Electrocorticogram recordings ..........................................................................68
2.3.1 Electrods implantation .........................................................................68
2.3.2 Video Electrocorticogram recordings ..................................................69
2.3.3 Signal analysis .....................................................................................70
2.4 Electrophysiological recordings in the hippocampus .......................................70
2.4.1 Field potential recordings ....................................................................71
2.4.2 Patch-clamp recordings (performed by Doctor Pousinha) ..................72
2.5 Immunohistochemical analysis in brain slices..................................................73
2.5.1 Intracardiac paraformaldeyde perfusion ..............................................73
2.5.2 Antibody staining.................................................................................73
2.6 Behavioral analysis ...........................................................................................74
2.6.1 Openfield test .......................................................................................74
2.6.2 Dark↔light exploration test ................................................................75
2.6.3 Three-chamber social interaction ........................................................76
2.6.4 Morris water maze ...............................................................................78
2.6.5 Contextual-Fear conditioning ..............................................................80
2.6.6 Eight-arm radial maze..........................................................................81
2.6.7 Actimeter .............................................................................................83
3. Therapeutic effect of drug X in decreasing the spontaneous seizures frequency in
Scn1a+/- mouse model ............................................................................................................84
3.1 Drug X administration ......................................................................................84
3.2 Protocol of seizure induced by hyperthermia and monitoring ..........................84
4. Statistical Analysis .................................................................................................85
IV- RESULTS........................................................................................................................89

Chapter 1- Phenotypic characterization of Scn1a+/- (DS model) ..........................................89
1. Scn1a+/- (DS mouse model) in 129 background (Scn1a+/--129) .............................89
1.1 The Scn1a+/- mouse in 129 background show normal spatial learning and
memory in the Morris water maze task..................................................................................89
1.2 The Scn1a+/- mouse in the 129 background show normal contextual- fear
conditioning ...........................................................................................................................91
2. Scn1a+/- (DS mouse model) in B6:129 background ..............................................92
2.1 The Scn1a+/--B6:129 mouse display normal activity in the openfield ..............92
2.2 The Scn1a+/--B6:129 have normal circadian rhythm and activity ....................93
2.3 The Scn1a+/--B6:129 mouse have preserved social interaction skills ...............94
2.4 The Scn1a+/--B6:129 express normal spatial memory ......................................96
2.5 The Scn1a+/--B6:129 display normal contextual- fear memory .........................97
2.6 The Scn1a+/--B6:129 show normal working memory .......................................97
Chapter 2- Seizures induction by hyperthermia (SIH) in Scn1a+/--B6:129 and Scn1aRH/+-129:B6 mouse models ............................................................................................................99
1. Scn1a+/--B6:129 present high seizure severity and high mortality during the 10-
days protocol of seizures induction. .....................................................................................100
2. SIH protocol in Scn1aRH/+ -129:B6 mouse ...........................................................102
Chapter 3- Long-term effects of the 10-days seizures induction by hyperthermia protocol in Scn1aRH/+-129:B6 mice. .......................................................................................................105
1. SIH worsen the epileptic phenotype in Scn1aRH/+-129:B6 mutant mouse ...........105
2. Cellular and molecular alterations in hippocampus after SIH in Scn1aRH/+-129:B6
mouse model ........................................................................................................................106
2.1 Cytoarchitecture is preserved after seizures in Scn1aRH/+ mice in the
hippocampus ........................................................................................................................106
2.2 Long-term synaptic plasticity is maintained but not short-term synaptic
plasticity in the CA1 region of the hippocampus after SIH in Scn1aRH/+129:B6 mice........108
2.3 Scn1aRH/+ mice show an increase in firing frequency in granular cells in the
dentate gyrus but not in CA1 pyramidal neurons after SIH.................................................111
3. Seizures induced by hyperthermia induce long- lasting changes in the behavioral
and cognitive phenotypes in Scn1aRH/+-129:B6 mice. ........................................................112
3.1 Scn1aRH/+-129:B6 mice with SIH have a novelty-associated increase in activity
in the openfield and stereotyped behavior without changes in anxiety. ..............................112

3.2 The novelty-associated hyperactivity normalizes after habituation in the
actimeter in Scn1aRH/+-129:B6 SIH mice. ...........................................................................116
3.3 Scn1aRH/+-129:B6 SIH mice show impaired social interaction ability in the
three-chamber social interaction test....................................................................................118
3.4 Scn1aRH/+-129:B6 mice with SIH have impaired learning and memory in the
Morris water maze task. .......................................................................................................119
3.5 Scn1aRH/+-129:B6 mice show decreased contextual- fear conditioning...........124
3.6 Scn1aRH/+-129:B6 mice with SIH show an impairment in working memory. 125
Chapter 4- Is the Scn1a mutation implicated in the behavioral/cognitive effects caused by
seizures? Role of flurothyl- induced seizures. ......................................................................127
1. Flurothyl- induced seizures produce higher mortality in the Scn1aRH/+-129:B6
mice than in the WT-129:B6................................................................................................127
Chapter 5- Collaborative work using Scn1a+/-B6:129 (DS) mouse model (Doctor Inna
Slutsky , University of Tel Aviv, Israel) ..............................................................................130
1. Drug X decrease the mortality of Scn1a+/-B6:129 mouse but not the Spontaneous
GTC seizure frequency ........................................................................................................130
V- DISCUSSION .................................................................................................................135
1. The Scn1a+/- mutation per se is not responsible for the cognitive and behavioral
phenotype observed in DS patients. .....................................................................................135
2. DS mice display susceptibility to hyperthermia induced seizures with higher
mortality than GEFS+ mice in the 10-days protocol. ..........................................................138
3. Long-term effects of the 10-days seizures induction by hyperthermia protocol in
Scn1aRH/+-129:B6 mice. .......................................................................................................142
3.1 “Seizures beget seizures” in Scn1a RH/+ mice ..................................................142
3.2 SIH does not induce neuronal death in Scn1aRH/+mutant mouse ....................143
3.3 Increased firing properties of DG granule cells after SIH in Scn1a RH/+ mice.144
3.4 The behavioral phenotypes observed in Scn1aRH/+-129:B6 mice after SIH
correlate with Scn1a+/- DS mouse models ...........................................................................146
4. the mutation is required for the seizures effects (preliminary results) .................151
5. Is DS a channelopathy? ........................................................................................153
6. The importance of understanding the role of seizures for the development of
adequate treaments. ..............................................................................................................155
VI- CONCLUSION AND PERSPECTIVES ......................................................................159

VII- BIBLIOGRAPHY ........................................................................................................163
VIII- STATISTIC TABLES ................................................................................................185
1. RESULTS – Chapter 1 – Scn1a+/- -129 mice and Scn1a+/- -B6:129 ....................185
2. RESULTS – Chapter 2 – Scn1a+/- -B6:129 mice and Scn1aRH/+ ..........................189
3. RESULTS – Chapter 3 – Scn1aRH/+ -SIH.............................................................190
4. RESULTS – Chapter 4 – Scn1aRH/+ -FLUROTHYL ............................................201
5. RESULTS – Chapter 5 – Scn1a+/- -DRUG X Administration ..............................201

LIST OF TABLES
TABLE 1. LIST OF EPILEPTIC ENCEPHALOPATHIES ASSOCIATED TO NEONATAL PERIOD,
INFANCY AND CHILDHOOD (ADAPTED FROM CROSS AND GUERRINI, 2013). ..............................6
TABLE 2. VOLTAGE-GATED SODIUM CHANNELS SUBTYPES, ENCODING GENES AND
LOCALIZATION IN PRIMARY TISSUE. REVIEWED IN (MANTEGAZZA AND CATTERALL, 2012) ...10
TABLE 3. SCN1A MUTANT MOUSE/RAT MODELS (TYPE OF MUTATION, LOCATION, ASSOCIATED
DISEASE). ................................................................................................................................36
TABLE 4. BEHAVIORAL ABNORMALITIES OBSERVED IN YOUNG SCN1A-/-
HOMOZYGOUS MICE.42
TABLE 5. BEHAVIORAL AND COGNITIVE ALTERATIONS IN SCN1A+/-
MUTANT MICE IN PURE B6
BACKGROUND. REPORTED BY HAN ET AL.2012. .....................................................................44
TABLE 6. BEHAVIORAL ABNORMALITIES OBSERVED IN SCN1ARX/+
MICE IN ITO EL AL. 2013...46
TABLE 7. BEHAVIORAL CHARACTERIZATION OF THE SCN1ARH/+
MICE BY SAWYER ET AL. 2016
................................................................................................................................................49
TABLE 8. BEHAVIORAL CHARACTERIZATION OF THE SCN1ANH/NH
RAT BY OHMORI ET AL. 2014.................................................................................................................................................50
TABLE 9. EXPERIMENTAL TIMETABLE. ...................................................................................63
TABLE 10. PRIMERS USED FOR DNA AMPLIFICATION IN SCN1A MOUSE LINES. .......................64
TABLE 11. SEIZURES SEVERITY SCORING ADAPTED FOR SEIZURES WITH LIMBIC ORIGIN
(ADAPTED FROM VELISKOVA, 2007). ......................................................................................68
TABLE 12. AVERAGE SPEED (M/S) IN THE MWM FOR CUE TASK AND SPATIAL LEARNINGS. .122
TABLE 13. DISTANCE TRAVELLED (M) IN MWM FOR CUE TASK AND SPATIAL LEARNING
TRAINING DAYS. ....................................................................................................................122
TABLE 14. SIH CONVERTS A MILD SCN1A MOUSE MODEL INTO A SEVERE SCN1A MOUSE
MODEL. .................................................................................................................................151


LIST OF FIGURES
FIGURE 1. TAXONOMY OF HUMAN MEMORY (ADAPTED FROM SQUIRE AND KNOWLTON, 1995
FOR LONG TERM MEMORY AND ATKINSON AND SHIFFRIN, 1968 FOR SHORT TERM MEMORY).. XI
FIGURE 2. HIPPOCAMPUS STRUCTURAL ORGANIZATION IN MOUSE BRAIN. ............................ XII
FIGURE 3. STRUCTURE OF THE NEURON. .............................................................................. XIII
FIGURE 4. SCHEMATIC OF INTERNEURON DIVERSITY ACROSS THE BRAIN. FROM (KEPECS AND
FISHELL, 2014) ...................................................................................................................... XV
FIGURE 5. OPERATIONAL CLASSIFICATION OF SEIZURE TYPES BY THE INTERNATIONAL
LEAGUE AGAINST EPILEPSY (FISHER ET AL., 2016). .................................................................4
FIGURE 6. ACTION POTENTIAL INITIATION AND PROPAGATION IN NERVE CELLS.......................9
FIGURE 7. TRANSMEMBRANE ORGANIZATION OF NAV SUBUNITS AND 3-D STRUCTURE. ........11
FIGURE 8. SOME OF THE MUTATIONS OF THE DISEASE SPECTRUM FOR NAV1.1-ASSOCIATED
EPILEPSIES...............................................................................................................................16
FIGURE 9. EEG TRACE OF A GENERALISED TONIC-CLONIC SEIZURE IN AN 8-YEAR OLD DS
PATIENT. FROM (DRAVET AND GUERRINI, 2011) WITH JLE PUBLISHER AUTHORIZATION TO
REPRODUCE. ............................................................................................................................23
FIGURE 10. SURVIVAL, EPILEPTIC PHENOTYPE AND TIMING FOR NAV EXPRESSION IN THE
BRAIN. .....................................................................................................................................41
FIGURE 11. GENOTYPING REVELATION. .................................................................................65
FIGURE 12. ECOG RECODINGS SYSTEM. .................................................................................70
FIGURE 13. FIELD EXCITATORY POST-SYNAPTIC POTENTIALS IN THE HIPPOCAMPUS. .............72
FIGURE 14. OPENFIELD APPARATUS. ......................................................................................75
FIGURE 15. DARK↔LIGHT BOX APPARATUS. .........................................................................76
FIGURE 16. THREE-CHAMBER SOCIAL INTERACTION APPARATUS. ..........................................77
FIGURE 17. MORRIS WATER MAZE APPARATUS AND PROTOCOL TIMELINE. ............................79
FIGURE 18. CONTEXTUAL FEAR CONDITIONING PROCEDURE. .................................................81
FIGURE 19. RADIAL MAZE DIAGRAM AND PROTOCOL TIMELINE .............................................83
FIGURE 20. ACTIMETER DIMENSIONS. ....................................................................................84
FIGURE 21. SCN1A+/-
MICE IN 129 BACKGROUND SHOW PRESERVED SPATIAL LEARNING AND
MEMORY IN THE MWM TASK..................................................................................................90
FIGURE 22. THE SCN1A+/-
AND WT LITTERMATES SHOW SIMILAR FREEZING PERCENTAGE
AFTER 1 SHOCK OR 3 SHOCKS IN THE CFC...............................................................................91
FIGURE 23. SCN1A+/--B6:129 MICE HAVE NORMAL ACTIVITY AND ANXIETY IN THE OPENFIELD.
................................................................................................................................................93
FIGURE 24. SCN1A+/--B6:129 MICE HAVE NORMAL CIRCADIAN ACTIVITY IN THE ACTIMETER.
................................................................................................................................................94

FIGURE 25. SCN1A+/--B6:129 MICE SHOW NORMAL ACTIVITY IN THE HABITUATION PHASE
(A&B). THE SOCIAL PREFERENCE WAS NOT STRONG IN THE SOCIABILITY PHASE FOR THE WT
AND SCN1A+/--B6:129 MICE, BUT REACHED SIGNIFICANCE FOR THE SOCIAL NOVELTY
PREFERENCE IN THE SECOND PHASE (D) ..................................................................................95
FIGURE 26. SCN1A+/--B6:129 DISPLAY NORMAL LEARNING AND MEMORY IN THE MWM TASK.
................................................................................................................................................96
FIGURE 27. THE SCN1A+/--B6:129 MICE HAVE NORMAL CONTEXTUAL-FEAR MEMORY. .........97
FIGURE 28. WT AND SCN1A+/--B6:129 MICE SHOWED PRESERVED WORKING MEMORY IN THE
EIGHT-ARM RADIAL MAZE. ......................................................................................................98
FIGURE 29. SEIZURES INDUCTION BY HYPERTHERMIA IN SCN1A+/-
-B6:129 MICE. ................101
FIGURE 30. SEIZURES INDUCTION BY HYPERTHERMIA (SIH) IN SCN1ARH/+-129:B6 MICE. ...104
FIGURE 31. SIH PROTOCOL WORSENS THE EPILEPTIC PHENOTYPE IN SCN1ARH/+-129:B6
MUTANT MICE. ......................................................................................................................106
FIGURE 32. SIH DO NOT INDUCE IMPORTANT CYTOARCHITECTURE CHANGES IN THE
HIPPOCAMPUS IN SCN1ARH/+-129:B6 MUTANT MICE. .............................................................107
FIGURE 33. SHORT-TERM PRE-SYNAPTIC BUT NOT LONG-TERM POST-SYNAPTIC PLASTICITY IN
CA1 REGION OF THE HIPPOCAMPUS IS ALTERED IN SCN1ARH/+129:B6
MICE. .........................110
FIGURE 34. FIRING FREQUENCY OF EXCITATORY NEURONS IN THE DG BUT NOT IN THE CA1 IS
INCREASED IN THE SCN1ARH/+-129:B6 MICE SUBMITTED TO SIH. ..........................................111
FIGURE 35. SCN1ARH/+
-129:B6 SIH HAVE A NOVELTY ASSOCIATED INCREASE IN ACTIVITY
AND STEREOTYPED BEHAVIOR...............................................................................................113
FIGURE 36. THE SIH DOES NOT INDUCE ANXIETY IN SCN1ARH/+-129:B6 MUTANTS. .............114
FIGURE 37. SCN1ARH/+-129:B6 MUTANT MICE EXHIBIT A NOVELTY-ASSOCIATED INCREASE IN
REARING ACTIVITY IN THE ACTIMETER. .................................................................................117
FIGURE 38. SIH IMPAIRS SOCIABILITY IN SCN1ARH/+-129:B6
MICE. ......................................119
FIGURE 39. THE SCN1ARH/+-129:B6 SUBMITTED TO SIH DISPLAY IMPAIRED SPATIAL
LEARNING AND MEMORY IN THE MWM TASK. ......................................................................121
FIGURE 40. CONTEXTUAL FEAR CONDITIONING IS NOT CHANGED IN SCN1ARH/+-129:B6
MICE.
..............................................................................................................................................124
FIGURE 41. SCN1ARH/+-129:B6 MUTANT MICE SUBMITTED TO SIH EXHIBIT AN IMPAIRMENT IN
WORKING MEMORY. ..............................................................................................................126
FIGURE 42. FLUROTHYL-INDUCED SEIZURES IN WT-129:B6 AND SCN1ARH/+-129:B6 MICE. 128
FIGURE 43. BEHAVIORAL/COGNITIVE TASKS IN SEIZURES-INDUCED WITH FLUROTHYL
ANIMALS. ..............................................................................................................................129
FIGURE 44. DRUG X ADMINISTRATION IN SCN1A+/-B6:129 MOUSE DECREASES THE MORTALITY
DURING THE SIH PROTOCOL BUT NOT THE SPONTANEOUS SEIZURE FREQUENCY. ..................131
FIGURE 45. SPONTANEOUS SEIZURE ACTIVITY DURING THE 5 DAYS OF SIH WITH OR WITHOUT
DRUG TREATMENT IN SCN1A+/-B6:129 MICE. .........................................................................132
FIGURE 46. SCHEMATIC ILLUSTRATION OF THE STATE OF THE ART KNOWLEDGE AFTER OUR
STUDY. ..................................................................................................................................156

LIST OF ABBREVIATIONS AIS – Axon Initial Segment
Bp – Base pairs
CFC – Contextual fear conditioning
CNS – Central Nervous System
C57Bl/6-B6
DNA – Deoxyribonucleic acid
D – Day
DG – Dentate gyrus
DS – Dravet Syndrome
ECoG – Electrocorticogram
EEG - Electroencephalogram
fEPSP – field Excitatory Post Synaptic Potentials
FS – Febrile seizures episodes and Febrile Seizures disease
GEFS+ – Generalized epilepsy with febrile seizures plus
GTC- Generalized tonic-clonic
H – height
ILAE – International League Against Epilepsy
L – Length
LTP – Long-term potentiation
MWM – Morris Water Maze
Nav 1.1 – Type-I voltage gated sodium channel
PCR– Polymerase chain reaction
PFC–Prefrontal córtex
Post-natal Day-P
PV– Parvalbumin
RH–R1648H
sEPSC – spontaneous Excitatory Post Synaptic Currents
sIPSC – spontaneous Inhibitory Post Synaptic Currents
SCN1A – sodium voltage-gated channel alpha subunit 1
SCN1B – sodium voltage-gated channel beta subunit
SIH – Seizures induced by hyperthermia
SST – Somatostatin
SE–Status Epilepticus
W – Width
WT– Wild-type
129/SvJ-129


LIST OF DEFINITIONS
Some concepts are defined in this list and marked in the text with a *.
ELECTROENCEPHALOGRAPHY AND SEIZURES:
ICTAL ACTIVITY: Electroencephalogram record ing during a seizure.
INTERICTAL ACTIVITY: EEG activity between 2 seizure events.
DELTA WAVES: Usually slow waves, but the highest in amplitude. Frequency <4Hz
THETA WAVES: Seen normally in young children, or h igh relaxation states in humans (Frequency 4-7 Hz). The
theta frequency is the most prominent oscillation in the rat hippocampus when engaged in active motor
behavior such as walking or exp loratory sniffing, and also during REM (rapid eye movement) sleep.
GAMMA WAVES: Gamma rhythms are thought to represent binding of different populations of neurons
together into a network for the purpose of carrying out a certain cognitive or motor function. Frequency 30–
100Hz.
STATUS EPILEPTICUS: Seizures that last longer than 30 minutes.
GENERALIZED TO NIC CLONIC SEIZURES: Seizures involving both hemispheres of the brain and presenting a
clonic phase followed by a tonic phase. Also called “grand mal seizures”.
GENETICS:
MO SAICISM: Two or more cell types that carry different genotypes.Mutatios that are not present in all cells of
the same indiv idual.
HAPLO INSUFFICIENCY: Caused by a loss-of-function mutation, in which only one functional copy of the wild
type allele is not sufficient enough to express the wild type phenotype.
SPLICE MUTATIO NS: Mutations that inserts, deletes or changes nucleotides at the boundary of an exon and an
intron (splice site). This change can disrupt RNA splicing resulting in the loss of exons or the inclusion of
introns and an altered protein-coding sequence.
NO NSENSE/ TRUNCATION MUTATIO N: Mutations that prematurely stops the translation of messenger RNA
resulting in a polypeptide chain that ends prematurely and a protein product that is truncated and incomplete
and usually nonfunctional.
MISSENSE MUTATIO N: Point mutation where a single nucleotide is changed to cause substitution of a different
amino acid.
HETERO ZYGOSITY: Two d ifferent alleles for the same gene (in the case of our study one mutant allele - and
one WT allele +).
DO MINANT INHERITANCE: In the heterozygotic cells where both alleles are p resent but only one allele is
dominant, meaning responsible for the phenotype and transmitted to the progeny.


REVISION OF CONCEPTS
1.Role of prefrontal cortex and medial-temporal lobe in cognitive functions
1.THE PREFRONTAL CORTEX IN COGNITIVE FUNCTIONS
The prefrontal cortex (PFC) is involved in higher- level cognitive processes including
planning, motor control, language, reasoning, decision–making grouped under the more
general term of “executive functions”, personality and social interaction (Kesner and
Churchwell, 2011). Executive functions include the organization of the input from diverse
sensory modalities, the maintenance of attention, the monitoring of information in working
memory, and the coordination of goal-directed behaviors. From Baddeley’s definition,
working memory is characterized by a limited capacity system for maintaining and
manipulating information and it underpins the capacity for complex and flexible cognition
(Baddeley, 1996). Working memory requires attention processes for temporary maintenance
of domain-specific information over a brief period of time in a form that is fragile and
vulnerable to distractions (Fuster, 2004; Miller et al., 2014). Given all the cognitive
functions for which the PFC participates, it is not surprising that the PFC also contributes to
higher-order cognitive functions such as social cognition. The term social cognition can
encompass any cognitive process engaged to understand and interpret the self, others, and
the self- in-relation-to-others within the social environment. Human social interaction
requires knowledge and recognition of mental states, beliefs, desires, intentions in peers that
guide our own behavior (Fiske, 1993; Macrae and Bodenhausen, 2000).
2-THE MEDIAL-TEMPORAL LOBE IN COGNITIVE FUNCTION
The major breakthrough in neurology that helped the neurobiologists in defining the
role of medial- temporal function came in 1957 from a medical report written by Scoville
and Milner, 1957 on the most famous neurological patient ever, Henry Molaison known by
his initials H.M. This patient carried severe epileptic disease for several years. In an effort
to alleviate his disease, the medial temporal lobe area (including hippocampi and
parahippocampal girus) was removed, and the surgery could reduce considerably the seizure
frequency. However, following the surgery H.M. patient became severely amnesic in

selective memory types. This patient had severe anterograde amnesia and a partial
retrograde amnesia focus on episodic memory. The discovery of a “pure” memory deficit
following a selective brain damage also addressed how memory is compartmentalized in the
brain. Memory is the faculty of the brain by which information is encoded, stored, and
retrieved. The time between memory acquisition and retrieval will dissociate between
short-term and long-term memories: short time for working memory- memory-described in
previous paragraph- (usually few seconds or minutes) and long-time for long-term memory
(from hours to years) (Baddeley and Warrington, 1970). Squire and Knowlton, 1995 defined
a taxonomy of human long term memory that can be classified in explicit/declarative
(involving episodic and semantic memory) and implicit/non-declarative memory (involving
implicit learning as procedure, priming, conditioning) (Morris et al., 1986; O’Keefe et al.,
1998) (FIGURE 1).
Episodic memory characterizes episodes of personal life and its integration in a
spatial and temporal context (Tulving, 2002). Semantic memories are those that we acquire
by learning, like factual information and general knowledge. To distinguish between these
two memories, it can be said that episodic memory requires recollection of a prior
experience and semantic memory does not.
Non-declarative memory includes information that is acquired during skill learning,
habit formation, emotional learning, and other knowledge that is expressed through
performance rather than recollection. Non-declarative memory is dissociated into
procedural memory (required for the execution of integrated procedures involved in both
cognitive and motor skills : associated to striatum and cerebellum functions) (Knowlton et
al., 1996; Nagao and Kitazawa, 2008), priming memory (memory dependent on the
neocortex through which an initial exposure is expressed unconsciously by improved
performance at a later time) and conditioning memory (associated to emotional learning that
implicates the amygdala) (Adolphs et al., 2005).

FIGURE 1. TAXO NO MY O F HUMAN MEMORY (ADAPTED FRO M SQUIRE AND KNOWLTO N, 1995 FOR LONG
TERM MEMO RY AND ATKINSON AND SHIFFRIN, 1968 FO R SHORT TERM MEMO RY)
When a sensorial stimuli is received it can be converted in a short-term memory within a reduced period of
time (<60 minutes). It can then be transformed into long-term memory or not and last for hours, days or
years. Two type of long term memory have been proposed: explicit and implicit memory.
3. HIPPOCAMPUS: ROLE, ORGANIZATION AND SYNAPTIC PLASTICITY
The hippocampal formation (including the entorhinal cortex and hippocampal
system) has been implicated as the major structure in the encoding, storage and retrieval of
declarative memory (Eichenbaum, 2001; Morris et al., 1986; Squire, 1992). Also, the
hippocampus is highly implicated in spatial memory, which stores information regarding
the location of physical objects in space, in other words, the spatial properties of the
environment (Morris et al., 1986; O’Keefe et al., 1998).
The hippocampus is a complex structure of the brain located in the medial temporal
lobe. It belongs to the limbic system, closely associated with the cerebral cortex. Humans
and other mammals have two hippocampi, one in each side of the brain. The hippocampus
contains two parts: the Ammons horn, which contains CA1, CA2, CA3 and CA4, and the
dentate gyrus (DG) (FIGURE 2).
Sensorial Stimulus
Short-term memory
Long-term memory
Explicit / Declarative (facts,events)
Semantic (facts, concepts)
Episodic/spatial (events, experiences, places) Hippocampus
Implicit / Non-declarative
Procedural "skills and habits" (striatum and cerebellum)
Priming (neocortex)
Conditioning (Amygdala)

FIGURE 2. HIPPOCAMPUS STRUCTURAL ORGANIZATIO N IN MOUSE BRAIN. The flow of information from the EC is largely unidirectional, with signals propagation trough a series of tightly
packed cell layers, first to the dentate gyrus, then to the CA3 layer, then to the CA1 layer, then to the subinculum and
then out of the hippocampus to the EC. Image from (Deng et al., 2010).
Synaptic plasticity plays an important role in neurochemical foundations of learning
and memory. Hebb (1949) first said that memory formation is due to changes in the
synaptic efficiency and that storage is made by cellular junctions that associate among them.
In other words, synaptic plasticity is the ability of synapses between two neurons to change
in strength, in response to the transmission of synaptic inputs (two active neurons at the
same time strengthen their connection to ensure that future connections will be easier)
(Purves, 2005). Long-term potentiation (LTP) reflects the strengthening of synapses and is
believed to represent a major cellular mechanism at the basis of long term memory
formation. LTP was first described using artificial stimulation by (Bliss and Lomo, 1973).
Whitlock et al., 2006 first observed a naturally- induced long-term potentiation in the
hippocampus during a memory task in rats. LTP is now well admitted to represent a cellular
correlate of long term memory.
The association between the hippocampus and epilepsy has been often described,
notably in seizure generation, abnormal electrophysiological properties, abnormal
oscillatory rhythms and cognitive abnormalities. The effect of frequent early life seizures
and hippocampal-dependent cognition has been well studied in rodent models and support
the view that epileptic discharges disrupt normal development of hippocampal networks
(reviewed in Holmes, 2016). The hippocampus seems to be frequently involved in seizures,
even if they are not generated there. Also, the relatively simple histological construction and
lamellar organization of the hippocampus makes it a structure of choice for experimental
and clinical studies of epilepsy.

4. EXCITATORY AND INHIBITORY BALANCE IN EPILEPSY: ROLE OF INTERNEURONS
The brain balance is maintained through excitatory and inhibitory mechanisms
handled by the main excitatory neurotransmitter glutamate counterbalanced by the main
inhibitory neurotransmitter- γ-aminobutyric acid (GABA). The recurrent seizure activity is
an electrographic hallmark of epilepsy, and consists in an excessive synchronous discharge
of cerebral neurons, generated in one or more neuron populations. The electrical activity in
the epileptic network is in general associated with a deficit in excitatory/inhibitory
imbalance, which promotes neuronal hyperexcitability and hyper-synchronization, through
an increase in excitatory neurotransmission or a decrease in inhibitory neurotransmission or
both. Neurons are excitable cells that receive and transmit information trough electrical and
chemical signals. Those electrical signals, received at the dendrites, generate action
potentials at the axon initial segment (AIS) that are transmitted through the axon to the
terminals. There, the synaptic boutons communicate with the other cells forming synapses.
The structural organization of a neuron is represented in FIGURE 3. The work concerning
the epileptic syndromes we will study here, focused mostly on two types of neurons: the
excitatory neuron, releasing glutamate (eg hippocampal excitatory neurons described above)
and the inhibitory interneuron releasing the neurotransmitter GABA.
FIGURE 3. STRUCTURE O F THE NEURON.

We will briefly describe the interneurons, a neuron type that is crucial for Scn1a
mutant mouse models neurophysiopathology. Based on their network connectivity and
intrinsic properties, the interneurons generate and control the rhythmic output of large
populations of principal cells and other interneurons. In the central nervous system (CNS)
they are primarily inhibitory, and use GABA or glycine as main neurotransmitters. They
represent approximately 20-25% of cortical neurons and are highly diverse in morphology,
connectivity, neurochemical and physiological properties (Kepecs and Fishell, 2014; Petilla
Interneuron Nomenclature Group et al., 2008). FIGURE 4 represents the described subtypes
of interneurons in the brain.
The morphological appearance of interneurons is a source of important information
regarding their specific role in a neuronal circuit. Using immunohistochemical tools, they
can be marked by tagging the enzymes that synthesize GABA: GAD-65 and GAD-67.
Various populations of interneurons were found to contain different peptides (e.i.
somatostatin, cholecystokinin (CCK), calretinin, neuropeptide Y, parvalbumin, etc)
(FIGURE 4) and these peptides gave the name to the interneuron subtypes. This has resulted
in a neurochemical classification that is based on the cell-specific presence of these
markers. Moreover, using electrophysiological tools, the interneurons have also been
classified according to their firing properties and, for example, the termino logy fast spiking
PV+ basket cells combines electrophysiological, biochemical and morphological
characteristics.
Several GABAergic cell types contribute to feedback circuits in the hippocampus.
These include parvalbumin-positive (fast-spiking PV+) a major GABAergic type in
contributing to the pathology in Scn1a mutant mouse models.

FIGURE 4. SCHEMATIC O F INTERNEURO N DIVERSITY ACROSS THE BRAIN. FRO M (KEPECS AND FISHELL,
2014) .
They are mainly characterized according to morphology, type of connection, neuropeptide expressed and
electrophysiological p roperties.


A 17th-century epileptic patient being restrained by another man is taken to see a priest to
be blessed (in Madness (Porter, 2003).


Introduction


1
I- INTRODUCTION
Chapter 1- EPILEPSY AND GENETIC EPILEPSIES
1. HISTORICAL, DEFINITION AND EPIDEMIOLOGY.
Epilepsy is the most common neurological disorder affecting 65 million persons
worldwide and 0.5–1.0% of children younger than 16 years old (Shinnar and Pellock,
2002; Thurman et al., 2011). The word epilepsy was derived from greek words that
mean “seizure” or “attack” (Reynolds, 2002). The first known report of epilepsy was in
a Babylonian medical report written 3000 years ago. The Babylonians described the
seizures as invasions of the body by a particular evil spirit and characterized them
similarly in what can be correlated with the seizures we know nowadays (Wilson and
Reynolds, 1990). This supernatural view of the seizures has persisted until recently. In
the 5th century, Hippocrates challenged this view by stating: “I do not believe that the
Sacred Disease is any more divine than any other disease but, on the contrary, has
specific characteristics and a definite cause. Nevertheless because it is completely
different from other diseases it has been regarded as a divine visitation by those who,
being only human, view it with ignorance and astonishment... The brain is the seat of
this disease, as it is of other very violent diseases”. Interestingly, he already had some
notions that the disease could be on the rise if not treated and become chronic and
intractable, “Moreover it can be cured no less than other diseases so long as it has not
become inveterate and too powerful for the drugs which are given. When the malady
becomes chronic, it becomes incurable (Zanchin, 1992).” However Hippocrates’s view
of the supernatural disease was not taken into account until the 17 th and 18th centuries.
Thomas Wills, in 1961 first characterized epilepsy as a brain disorder (Willis and
Pordage, 1681) and during the next two centuries very important debates took place to
give rise to the first definitions of epilepsy in the 19th century. The works of Todd,
influenced by Faraday and Jackson were very important in defining the electrical basis
of seizures and in 1952, Hodgkin & Huxley (Hodgkin and Huxley, 1952) obtained the
Nobel Prize for discoveries of the ionic basis of Todd’s nervous polarity/force. Thanks
to the development of genetics, molecular biology, neurophysiology, functional imaging

2
and numerous neurochemical techniques for exploring the concepts of excitation,
inhibition, modulation, neurotransmission and synchronization, the 20th century
conferred the most important advance in epilepsy and seizures research.
2. CLASSIFICATION OF SEIZURES, EPILEPSIES AND COMORBIDITIES
2.1 Seizures Definit ion and Classif icat ion
Epilepsy is characterized by the presence of epileptic seizures. They can be
acutely provoked by head trauma or stroke (for example) or unprovoked as the result of
a pathological condition. In 2014, the International League Against Epilepsy (ILAE)
defined epilepsy as a “disease of the brain enduring predisposition to generate epileptic
seizures, and by the neurobiological, cognitive, psychological, and social consequences
of this condition.” An epileptic seizure is a “transient occurrence of signs and/or
symptoms due to abnormal excessive or synchronous neuronal activity in the brain”
(Fisher et al., 2014). The definition of epilepsy requires the occurrence of any of the
following conditions: at least two unprovoked (or reflex) seizures occurring 24h apart,
one unprovoked (or reflex) seizure and a probability of further seizures similar to the
general recurrence risk (at least 60%) after two unprovoked seizures, occurring over the
next 10 years, or a diagnosis of an epilepsy syndrome (Fisher et al., 2014).
Epileptic seizures arise from abnormal synchronization of neurons in the brain
that disrupts normal patterns of neuronal signaling and results in electric discharges in
the electroencephalogram (EEG). The brain hyperexcitability in epilepsy describes a
general increase in response to a particular stimulus or enhanced tendency to generate
repetitive synchronous neuronal discharges manifesting as a burst of population spikes.
It is a very harmful disease leading to discrimination, misunderstanding, social stigma
and the fear of living with a chronic unpredictable disease that can lead to loss of
autonomy for daily activities.
Seizures are divided in focal or generalized seizures according to the brain
structure involved in the seizure origin.
Focal (synonym=partial) seizures are those in which, in general, the first clinical
and EEG alterations indicate initial activation of a system of neurons limited to a part of
one cerebral hemisphere. The networks involved may be very discrete and highly
localized or more broadly distributed within the hemisphere. Focal seizures are

3
classified primarily on the basis of whether or not consciousness is impaired during the
attack (simple and complex respectively) and whether or not progression to generalized
convulsions occurs. They are divided into motor and non motor focal seizures (FIGURE
5).
Generalized (synonym = bilateral) seizure are those in which the first clinical
changes indicate initial involvement of both hemispheres. Consciousness may be
impaired and this impairment may be the initial manifestation. The ictal EEG patterns
are initially bilateral and presumably reflect neuronal discharge, which is widespread in
both hemispheres. Generalized seizures may be motor or absence seizures and vary
considerably. Motor manifestations of generalized seizures are bilateral. Motor
generalized seizures can be tonic-clonic (GTC) or (previously called ‘grand mal’
seizures), and are characterized by bilateral symmetric tonic contraction and then
bilateral clonic contraction of somatic muscles, usually associated with autonomic
phenomena and loss of awareness. Alternatively generalized seizures can be purely
tonic, purely atonic (sudden loss of muscle tone), purely myoclonic (sudden, brief (<100
ms), involuntary, single, or multiple contractions of muscles or muscle groups of
variable topography (axial, proximal limb, distal)), myoclonic-atonic (clonic seizures
that results in falls), pure myoclonic, clonic-tonic-clonic (one or a few jerks of limbs
bilaterally, followed by a tonic-clonic seizure) and epileptic spasms. Absence
generalized seizures (previously called ‘petit mal’ seizures) are seizures characterized
by a sudden onset, interruption of ongoing activities (a blank stare), and can be typical
(brief loss of consciousness, normal EEG pattern), atypical (last longer than typical and
can present irregular EEG pattern), myoclonic or characterized by eye- lid myoclonia
(jerking of the eyelids at frequencies at least 3 per second, commonly with upward eye
deviation) (FIGURE 5). Generalized seizures may be primarily (if they are generalized
from the onset) or secondarily generalized (if they are focal at the onset but progress to
generalized) (Berg, 2016; Berg et al., 2010; Blume et al., 2001; Fisher et al., 2014).
Unclassified epileptic seizures or those with unknown onset are seizure types
which cannot be classified because of inadequate or incomplete data (FIGURE 5).

4
FIGURE 5. OPERATIO NAL CLASSIFICATION OF SEIZURE TYPES BY THE INTERNATIO NAL LEAGUE
AGAINST EPILEPSY (FISHER ET AL., 2016).
The characterization of seizures types, origin and causes are the main focus of
epilepsy care, due to their devastating effects on the quality of life and increasing
stigmatism around the patients. Also, high epileptic activity confers a high risk of
sudden death in epilepsy, so it has to be taken seriously into account.
2.2 Co-morbidit ies in epilepsy
A good seizures control remains the main challenge in epilepsy. However, the
epilepsy-associated comorbidities are very disabling for patients and sometimes more
than seizures. Co-morbidities in epilepsy are pathological conditions that usually follow
the epileptic onset and are present in addition to epilepsy. They can precede epilepsy
and in this case are causative of the epilepsy (i.e. brain infection, trauma). However, in
the majority of the cases they are a consequence of epilepsy, and are caused by 1) the
negative effects of chronic epileptic abnormalities on brain development, 2) the anti-
epileptic drugs or 3) an independent effect of the physiological disturbances that
predispose the brain to seizures (Wei and Lee, 2015). Depression and anxiety are the

5
most common comorbidities in epilepsy, encountered in 1/3rd of epileptic patients and
are mainly caused by anti-epileptic drugs (Sankar and Mazarati, 2012). In children
between 4 and 15 years, additional co-morbidities have been reported in 40% of
patients. The co-morbidities identified in epileptic children are: neurological (cognitive
and language impairment, migraine and headache or sleep problems), psychological
(autism spectrum disorder, attention-deficit and hyperactivity disorder, mood disorders,
sociability problems) and physical (bone loss, immunological disturbances, body weight
retardation and others). Among them, the most common are intellectual disabilities,
speech and language difficulties or other specific cognitive disabilities (Holmes, 2015;
Mula and Sander, 2016). Children with epilepsy have lower performances in school
than children without epilepsy (Reilly et al., 2015) and their mental capacities tend to
regress over time (Bailet and Turk, 2000). The children’s immature brain seems to be
more prone to a poor cognitive outcome due to several reasons. The young age at
seizure onset, the effects of the chronic treatments with anti-epileptic drugs (AEDs) and
the presence of a symptomatic cause or epileptic encephalopathy are all negatively
contributing to abnormal cognitive or psychological development. However, whether
poorly controlled epileptic activity is associated with progressive cognitive deterioration
is still controversial, and this has been demonstrated only for some specific syndromes:
mesial temporal lobe epilepsy and epileptic encephalopathies (reviewed in Avanzini et
al., 2013).
2.2.1 Epileptic Encephalopathies
Epileptic encephalopathy (EE) carries the notion that “the epileptic activity itself
may contribute to severe cognitive and behavioral impairment above and beyond what
might be expected from the underlying pathology alone (e.g., cortical malformation),
and that these can worsen over time” (Berg et al., 2010). EE are a group of
heterogeneous brain disorders that occur in childhood and are characterized by
pharmaco-resistance, focal and generalized seizures and severe cognitive and
developmental delay often associated to premature death (Cross and Guerrini, 2013).
The frequent and intense epileptic activity in young children interferes with normal
brain development, induces delays in cognitive maturation and often cognitive
regression. It can also have psychiatric and behavioral consequences. The different
types of epileptic encephalopathies observed in children are listed in TABLE 1.

6
TABLE 1. LIST O F EPILEPTIC ENCEPHALOPATHIES ASSOCIATED TO NEO NATAL PERIO D, INFANCY AND
CHILDHOOD (ADAPTED FRO M CROSS AND GUERRINI, 2013).
Conversely, an important part of the concept of EE treatment is that amelioration
of epileptiform activity will improve the developmental consequences of the disorder
(Jehi et al., 2015). It has been observed that individuals with EEs who are successfully
treated with medications or surgery, display improvements in cognitive function. This
demonstrates that seizures and an abnormal EEG play an important role in cognitive
outcome (Asarnow et al., 1997; Lee et al., 2014; Matsuzaka et al., 2001).
However, many, if not most, of these disorders are not solely associated with
developmental or behavioral deterioration due to epileptiform activity. The term EE is
currently being reviewed and debated, because it does not fit to all the EEs. In
particular, whether Dravet Syndrome can be classified as an EE has been questioned
recently, because development delay may occur in a period were seizures are not very
frequent, so this suggests that this delay might have other underlying causes. In fact, the
ILAE has recently proposed the new term “development encephalopathy” for particular
EE cases (Scheffer et al., 2016).
2.3 Etiology of epilepsy
Etiology describes the origin or causation of a problem, in this case epilepsy.
The new classification recognizes three types of causes: 1) Genetic (idiopathic), 2)
Structural/Metabolic, and 3) Unknown (Baxendale and Thompson, 2016; Berg et al.,
2010). Genetic epilepsies (1) are those in which there is a known or presumed genetic
defect(s) and seizures are the symptoms of the disease. In structural/metabolic epilepsies
(2), seizures appear subsequent to brain condition (as stroke, trauma, infection,

7
poisoning. etc). This type of etiology might also have a genetic variation, but, it is the
brain condition that interferes between the genetic cause and epilepsy. Unknown
etiologies (3) are those that do not fit in the two previous characterizations, meaning
that they are caused by non- identified factors. The majority of the gene in which
mutations have been identified in epilepsy code for ion channels (Cossette, 2010). In my
thesis, I will focus in the genetic epilepsies associated to SCN1A gene mutation that is
the most commonly mutated gene in human epilepsies. Due to the high number of
mutations identified to date in SCN1A gene ( >900 different types), it has been referred
to as a ‘super culprit’ gene (Lossin, 2009).

8
Chapter 2- GENETIC EPILEPSIES ASSOCIATED TO SCN1A GENE MUTATION
Voltage-gated sodium channels (SCN) genes code for voltage-gated sodium
channels (NaV). In the first part of this chapter, I will review the importance of voltage-
gated channels in maintaining optimal neuronal excitability and introduce their different
sub-types and molecular organization. In the second part, I will focus on the voltage-
gated sodium channel alpha subunit 1 (SCN1A) gene and NaV1.1 channel and the
epileptic syndromes associated to this channel.
1. SCN1A GENE AND TYPE-I VOLTAGE GATED SODIUM CHANNEL
Excitation and electric signaling in the central nervous system involves the flow
of ions (sodium, potassium, calcium and chloride) through ion channels. Voltage-gated
ion channels underlie the electric properties of the neurons. They are membrane proteins
with highly selective pores that can be in open or closed states according to the
membrane electrical potential. Changes in membrane electrical potential induce
modifications in channel conformation that allow ion transition between the
extracellular and intracellular fluid - this property is called ion channel gating. Because
these channels allow the ion flux down their electrochemical gradient in response to
voltage-gating, they were called voltage-gated ion channels. There are three main types
of voltage-gated ion channels with very conserved function similarities, but high
selectivity for either sodium, potassium or calcium (Hille, 2001). They are composed by
polytopic, transmembrane, pore forming and voltage-sensing α or α1 subunits (Catterall,
1995). The work of Hodgkin and Huxley, 1952 was very important in the description of
the action potential’s propagation. Action potentials propagate by voltage-gated
activation of Na+ channels that conduct sodium ions inside neurons and allow for
activation of potassium-gated channels that reestablish membrane charges by carrying
K+ ions out of the cell (FIGURE 6). The authors defined three characteristics of sodium
channels: voltage-dependent activation, rapid inactivation and selective ion
conductance.
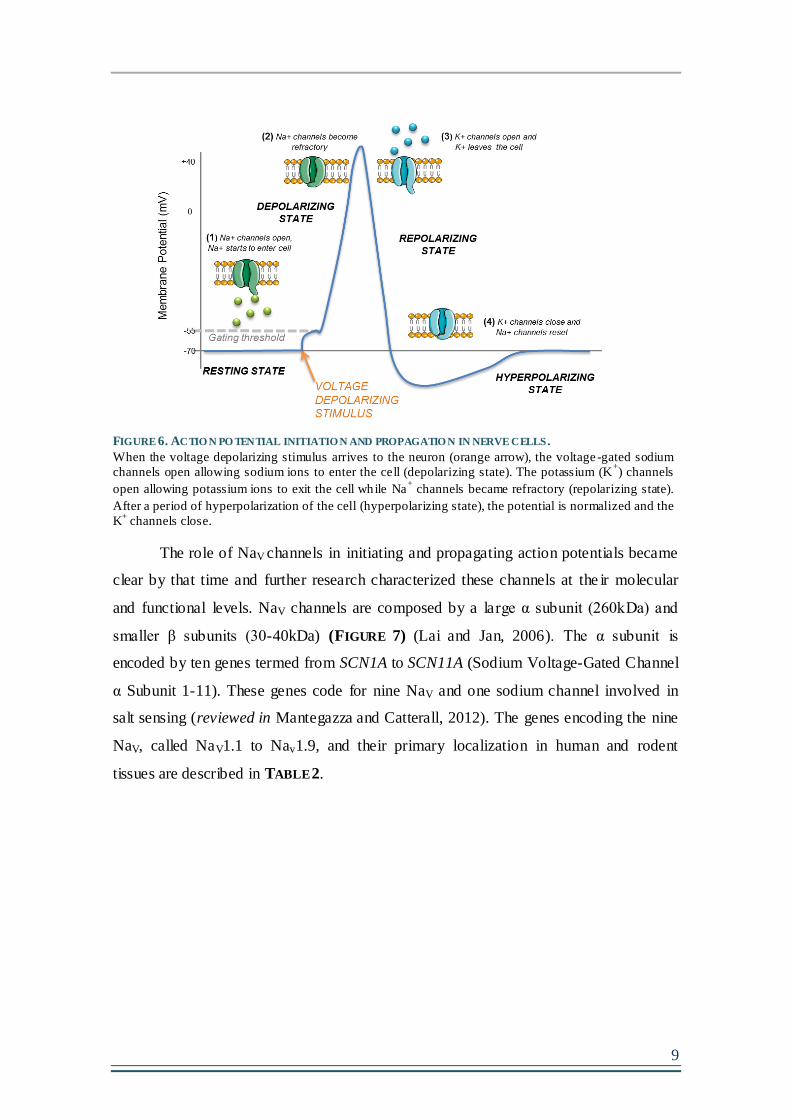
9
FIGURE 6. ACTIO N PO TENTIAL INITIATIO N AND PROPAGATIO N IN NERVE CELLS .
When the voltage depolarizing stimulus arrives to the neuron (orange arrow), the voltage -gated sodium
channels open allowing sodium ions to enter the cell (depolarizing state). The potassium (K+) channels
open allowing potassium ions to exit the cell while Na+ channels became refractory (repolarizing state).
After a period of hyperpolarization of the cell (hyperpolarizing state), the potential is normalized and the
K+ channels close.
The role of NaV channels in initiating and propagating action potentials became
clear by that time and further research characterized these channels at the ir molecular
and functional levels. NaV channels are composed by a large α subunit (260kDa) and
smaller β subunits (30-40kDa) (FIGURE 7) (Lai and Jan, 2006). The α subunit is
encoded by ten genes termed from SCN1A to SCN11A (Sodium Voltage-Gated Channel
α Subunit 1-11). These genes code for nine NaV and one sodium channel involved in
salt sensing (reviewed in Mantegazza and Catterall, 2012). The genes encoding the nine
NaV, called NaV1.1 to Nav1.9, and their primary localization in human and rodent
tissues are described in TABLE 2.

10
TABLE 2. VO LTAGE-GATED SODIUM CHANNELS SUBTYPES , ENCODING GENES AND LOCALIZATIO N IN
PRIMARY TISSUE. REVIEWED IN (MANTEGAZZA AND CATTERALL, 2012)
NaV1.1, Nav1.2, Nav1.3 and Nav1.6 are expressed in the central nervous system
(CNS), while Nav1.7, Nav1.8, and Nav1.9 act mainly at the peripheral nervous system.
Nav1.4 is found in the skeletal muscle and Nav1.5 is primary in the heart (Goldin, 1999).
Less subtypes of NaV β-subunits where identified (β1, β2, β3, β4) and are characterized
according to the type of ligation they present with the α subunit (noncovalent or
disulfide) (Morgan et al., 2000; Yu et al., 2003). The NaV channel α-subunit consists of
four domains (I–IV), with six transmembrane segments (S1–S6) each. The fourth
transmembrane segment of each domain contains positively charged amino-acid
residues in every third position that act as sensors for membrane depolarization and
initiation of channel activation. The loop between S5-S6 segments form the selective
pore domain through which sodium ions flow (FIGURE 7). One or more β-subunits,
which are single transmembrane proteins with an extracellular immunoglobulin- like
loop and an intracellular C terminus, co-assemble with the α-subunit and influence their
functional properties. β2 and β4-subunits are covalently attached to the α-subunit while
the β1 and β3-subunits are non-covalently attached (Messner and Catterall, 1985).

11
FIGURE 7. TRANSMEMBRANE O RGANIZATIO N O F NAV SUBUNITS AND 3-D STRUCTURE.
NaV α-subunits represent a single polypeptide that consists of four domains (D) (I–IV), with six
transmembrane segments (S1–S6) each. The fourth transmembrane segment (S4) of each domain contains
positively charged arginines (represented with + + + +) that are primarily responsible for voltage sensing,
as well as the S5-pore loop-S6 region, which forms the pore domain through which sodium ions flow.
The β subunits, β 1/3 and β 2/4, are single transmembrane proteins that co-assemble with the α subunit.
Three-dimentional structure of sodium channel (adapted from (Meisler and Kearney, 2005)).
SCN1A codes for the Nav1.1 channel and, along with the NaV1.2, NaV1.3 and
NaV1.6, it is primarily expressed in the CNS. As mutations in the SCN1A gene, and thus
perturbations in the function of Nav1.1, are strongly associated with epilepsy (Claes et
al., 2001), work has been carried out to deeply examine its developmental expression
profile. NaV 1.1 expression becomes detectable at post-natal day (P) 7 in rats and around
P10 in mice (Ogiwara et al., 2007) and at post-natal month one in humans (Cheah et al.,
2013a). They are predominantly localized in the caudal region and spinal cord (Gong et
al., 1999; Gordon et al., 1987; Ogiwara et al., 2007; Westenbroek et al., 1989). Previous
studies in rodents showed that high NaV1.1 expression was observed in the
hippocampus, notably on the soma of DG cells and throughout the dentate hilus, in the
stratum pyramidale of all hippocampal subfields, and within the stratum radiatum and
statum oriens of the CA1 region. Strong expression was also observed within the layer
V of the cortex and in the cerebellum (Westenbroek et al., 1989). Similar distribution of
NaV1.1 was found in human brain (Whitaker et al., 2001), indicating that the balance
and distribution of this particular Na+ channel is highly conserved and thus probably
important for brain function. At the microscopic level, the NaV1.1 was found primarily
in cell bodies (Whitaker et al., 2001) and later, in depth analysis revealed a specific
concentration of these channels at the axon initial segment (AIS) (proximal part of the
axon, and the primary site for initiation of action potentials in neurons (FIGURE 3)

12
reviewed in (Kole and Stuart, 2012)) and in myelinated fibers, clustered at the nodes of
Ranvier (Duflocq et al., 2008; Ogiwara et al., 2007). The creation of mouse models of
NaV1.1 mutations confirmed that the NaV1.1 channels play an important role in the
excitability of GABAergic interneurons (Ogiwara et al., 2007; Yu et al., 2006a) and
confirmed concentrated localization of these channels at the AIS in fast-spiking
parvalbumin basket cells (Hedrich et al., 2014) (FIGURE 4).
Few NaV1.2 mutations have been identified which are also causing epilepsy
(Howell et al., 2015; Misra et al., 2008; Ogiwara et al., 2009). Although even less
frequent, mutations in NaV1.3, NaV1.6 and NaV1.8 were also reported in epilepsies
(Estacion et al., 2014; Kambouris et al., 2016; Makinson et al., 2016; Malcolmson et al.,
2016; Meisler et al., 2001; Vanoye et al., 2014). For the purpose of this thesis, the next
sections will focus on NaV1.1 channel-associated epileptic syndromes.

13
2. NAV 1.1 CHANNEL PHENOTYPIC/GENOTYPIC SPECTRUM
2.1 A shared common feature: Febrile seizures
It is described that around 5-12% of the children experience febrile seizures (FS)
within the range of age 6-60 months with a peak at 2 years (Vestergaard and
Christensen, 2009). FS are GTC seizures that happen in childhood associated to an
increase in body temperature (~38,5ºC), without CNS infection. They occur in children
without history of epilepsy or neurological dysfunction and might be due to a particular
sensitivity to fever in the developing brain. It has been clearly demonstrated that there is
an increased risk of FS incidence shortly after childhood vaccinations caused by
vaccine- induced fever (Brown et al., 2007; Scheffer, 2015). Simple FS last usually less
than 15 minutes, are generalized with often loss of consciousness, shakes, and
movements in limbs on both sides of the body and do not occur more than once within a
24 hours period (Whelan et al., 2017). FS, first called benign but this term is not
accepted anymore by the ILAE, is considered a self- limited condition different from
epilepsy. Complex FS are classified in: 1) complex if they last between 15-30 minutes,
happen more than once in a period of 24 hours and are focal or localized to a specific
part of the brain or 2) febrile status epilepticus (SE) if they last more than 30 minutes
(Whelan et al., 2017). FS plus (FS+) were considered as a simple FS that can occur
more than once within a 24 hours period or that occur beyond the age of 6 (Grill and
Ng, 2013). In terms of duration, the principal ictal* event (seizure) can be confused with
the post-ictal events (tonic posture, eye deviation that last for some time post-seizure).
So, basically, without EEG recording it is hard to delimitate the end of the seizure. The
probability of recurrence after a simple FS is around 2%, while the probability is 2-3
times higher after a complex FS (Camfield and Camfield, 2015). These long-
lasting/complex FS are better candidates to cause important modifications in the brain
and epileptogenesis (Ellenberg and Nelson, 1978).
The mechanism by which FS are generated is unknown. Yet four theories have
been proposed for FS generation: 1) the neuronal hyperexcitability induced by the
increased temperature (Fisher and Wu, 2002), possibly by acting directly on NaV gating
at the AIS (Thomas et al., 2009), 2) the neuronal hyperexcitability caused by the release
of inflammatory mediators during fever (eg.: Il-1β) (Alheim and Bartfai, 1998; Dubé et
al., 2005), 3) the neuronal hyperexcitability caused by brain alkalosis during high
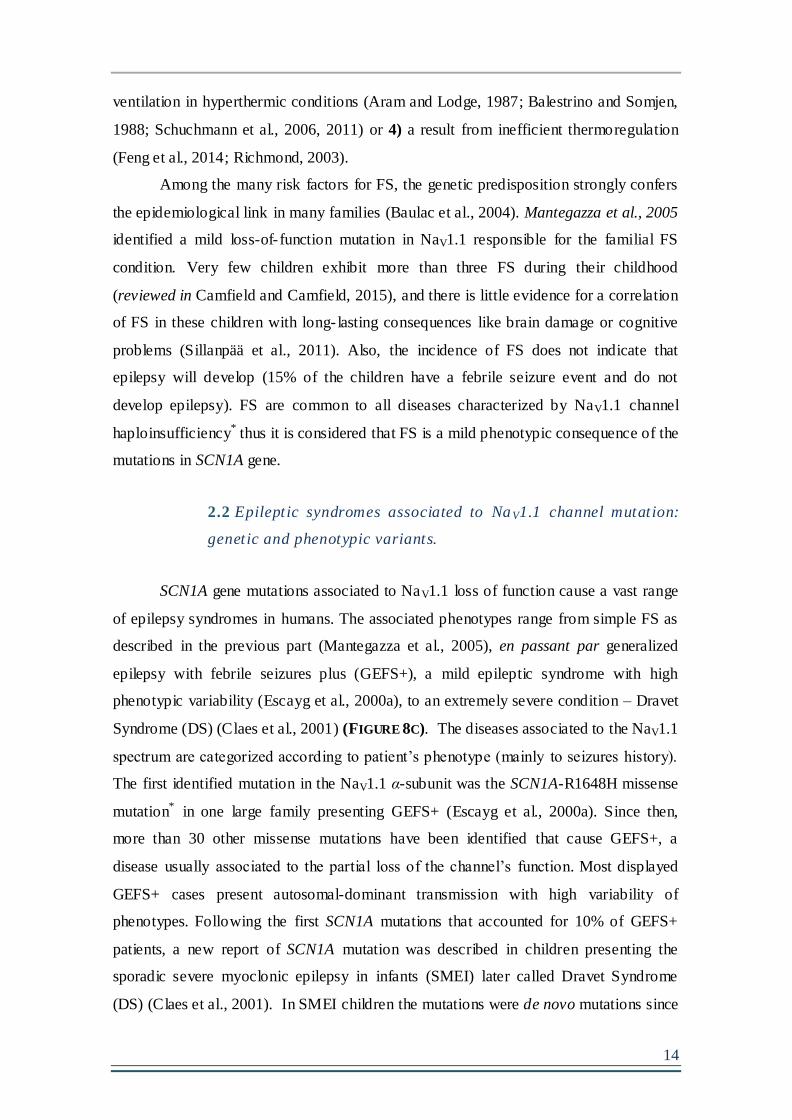
14
ventilation in hyperthermic conditions (Aram and Lodge, 1987; Balestrino and Somjen,
1988; Schuchmann et al., 2006, 2011) or 4) a result from inefficient thermoregulation
(Feng et al., 2014; Richmond, 2003).
Among the many risk factors for FS, the genetic predisposition strongly confers
the epidemiological link in many families (Baulac et al., 2004). Mantegazza et al., 2005
identified a mild loss-of- function mutation in NaV1.1 responsible for the familial FS
condition. Very few children exhibit more than three FS during their childhood
(reviewed in Camfield and Camfield, 2015), and there is little evidence for a correlation
of FS in these children with long- lasting consequences like brain damage or cognitive
problems (Sillanpää et al., 2011). Also, the incidence of FS does not indicate that
epilepsy will develop (15% of the children have a febrile seizure event and do not
develop epilepsy). FS are common to all diseases characterized by NaV1.1 channel
haploinsufficiency* thus it is considered that FS is a mild phenotypic consequence of the
mutations in SCN1A gene.
2.2 Epileptic syndromes associated to NaV1.1 channel mutation:
genetic and phenotypic variants.
SCN1A gene mutations associated to NaV1.1 loss of function cause a vast range
of epilepsy syndromes in humans. The associated phenotypes range from simple FS as
described in the previous part (Mantegazza et al., 2005), en passant par generalized
epilepsy with febrile seizures plus (GEFS+), a mild epileptic syndrome with high
phenotypic variability (Escayg et al., 2000a), to an extremely severe condition – Dravet
Syndrome (DS) (Claes et al., 2001) (FIGURE 8C). The diseases associated to the NaV1.1
spectrum are categorized according to patient’s phenotype (mainly to seizures history).
The first identified mutation in the NaV1.1 α-subunit was the SCN1A-R1648H missense
mutation* in one large family presenting GEFS+ (Escayg et al., 2000a). Since then,
more than 30 other missense mutations have been identified that cause GEFS+, a
disease usually associated to the partial loss of the channel’s function. Most displayed
GEFS+ cases present autosomal-dominant transmission with high variability of
phenotypes. Following the first SCN1A mutations that accounted for 10% of GEFS+
patients, a new report of SCN1A mutation was described in children presenting the
sporadic severe myoclonic epilepsy in infants (SMEI) later called Dravet Syndrome
(DS) (Claes et al., 2001). In SMEI children the mutations were de novo mutations since

15
none of the parents were affected. More than 80% of DS patients present SCN1A gene
mutations and more than 900 different types had been described by 2013 (Parihar and
Ganesh, 2013)(see also www.gzneurosci.com/scn1adatabase/). The types of mutation in DS
are: 1) severe truncating mutations* (and less often splicing* or deletion* mutations)
causing loss of NaV1.1 function or 2) severe missense mutations that prevent the
channel’s expression or severely impair its function (Brunklaus et al., 2014). The
duplication and deletion of sequences in the gene have also been pointed to impair the
channel’s function (Marini et al., 2009).
2.2.1 Type of mutat ions and the ir localizat ion in the SCN1A
gene.
FIGURE 8A&B represents some of the mutations found in GEFS+ and DS
patients, respectively (but by now they are many more). In FIGURE 8B one can observe
that the DS-causing missense mutations (green circles) are concentrated within the
transmembrane segment where they probably prevent the channel’s folding and
function. In fact, a recent study on large cohort of Japanese DS patients showed that the
missense mutations found in DS were in the majority concentrated at the S4 voltage
sensor and pore loops (S5 and S6) (Ishii et al., 2016). It was described that disease
phenotype is worse when there is a substantial change in the physicochemical properties
of the amino acids as measured by the Grantham score (A formula for the difference
between amino acids that correlate better with protein residues substitution frequencies:
composition, polarity, and molecular volume) (Grantham, 1974).
The heritability of SCN1A is complex in GEFS+ and DS patients. The mutations
reported for SCN1A-causing diseases were usually heterozygous as expected for a
dominantly inherited disorder such as GEFS+ or with mutations that appears de novo as
in DS. However, very interestingly, two new homozygous missense mutations of
SCN1A gene were identified in 4 patients born from consanguineous parents (Brunklaus
et al., 2015) and the phenotypic variability ranges from simple FS to DS. The
heterozygous mutation in parents was conservative (preventing the channel from
harboring functional changes) justifying why they remain unaffected. However, a
change on both alleles had a cumulative and detrimental effect on the homozygous
children. Basically, patients with heterozygous missense mutations can display a very
mild phenotype if the mutation does not induce important conformational and functional

16
changes to the channel (mutation position and type of amino acid change), or very
detrimental effects if it induces important modifications to the channel, justifying the
heterogeneity of phenotypes in GEFS+ and DS patients.
Another important feature is the possibly out-dated notion that inherited
mutations are associated to GEFS+ and de novo mutations are associated to DS. Indeed,
a recent study reported de novo mutations in 7 patients with GEFS+ (Myers et al.,
2017), again evidencing the importance of performing in depth genetic analysis in
GEFS+ patients potentially carrying the de novo SCN1A gene mutations. In parallel,
DS patients carrying inherited mutations were also observed and will be described it in
the next paragraph (Depienne et al., 2006).
FIGURE 8. SO ME O F THE MUTATIO NS O F THE DISEASE SPECTRUM FOR NAV1.1-ASSOCIATED EPILEPSIES .
A: Mutations in NaV1.1 channels in patients with generalized epilepsy with febrile seizures plus (GEFS+).
B: Mutations in NaV1.1 channels in patients with Dravet syndrome (DS). The loss-of-function hypothesis for
NaV1.1 genetic epilepsies (Mulley et al., 2005). C:Increasing severity of loss-of-function mutations of
NaV1.1 channels, noted above the arrow, causes progressively more severe epilepsy syndromes from
familial febrile seizures to GEFS+and finally DS, noted below the arrow. Adatped from (Catterall, 2014).

17
2.2.2 Inher ited transmiss ion o f SCN1A-DS mutat ions. The
concept of mosaic ism.
DS mutations are mainly de novo mutations meaning that they appear for the
first time in a given child and it is not transmitted from the parents. Another important
issue contributing to the phenotypic variability in SCN1A gene-related epilepsies (and
other types of genetic diseases) is the mosaicism*, phenomenon in which the person can
have more than one population of cells with different genotypes. First cases of mosaic
mutations were reported in DS families in 2006 (Depienne et al., 2006; Gennaro et al.,
2006; Marini et al., 2006, 2009) and it is now reported to account for 10% of all DS
mutations (Depienne et al., 2010). These studies described many families in which the
SCN1A mutation affected more than one sibling which led to genetic analysis of the
parents. For example, a recent report showed a family with two affected DS children,
and two unaffected parents. The in-depth genetic analyses of this family confirmed the
diagnosis of affected father with mosaic DS-mutation (Tuncer et al., 2015). Mosaic
parents of DS patients carry truncating mutations (Singh et al., 2001; Veggiotti et al.,
2001) and present phenotypes associated to the GEFS+ spectrum (explained by the
lower number of affected cells). Depienne et al., 2010 reported 19 families (of which 6
had GEFS+ spectrum) with inherited DS in the progeny (9 truncating, 9 missense and 1
whole gene deletion mutation). The 6 families with GEFS+ were not mosaic, but there
was one patient with DS in each family (Depienne et al., 2010). Mutations observed in
DS patients were also previously reported in a GEFS+ families (Annesi et al., 2003;
Escayg et al., 2000a). Therefore, truncating mutations cause DS in most of the cases if
there is complete penetrance (not mosaic), and missense mutations can cause GEFS+
and DS according to the type of missense mutation and genetic modifiers. The authors
therefore justify that DS disease can be at the severe end of the GEFS+ spectrum.
2.2.3 Phenotyp ic var iability in GEFS+ and DS: genetic and
environmenta l factors.
Genetic and environmental factors also contribute to phenotypic variability in
families with extreme phenotype distributions. Almost all the mutations in GEFS+ are
missense mutations (Claes et al., 2009) that usually do not lead to complete ablation of
channel function (Sugawara et al., 2002). However, complete truncating mutation can

18
cause GEFS+ or DS in two sibling brothers, indicating that genetic/environmental
factors play a crucial role (e.i. family 12 in (Depienne et al., 2010)). It is apparent that
the variability of phenotypes cannot be exclusively justified by the SCN1A mutation
type, as in the same family, patients with the same mutation can have different
phenotype severities (as observed in mutations transmitted from mosaic parents).
Moreover, the same study reported a DS patient carrying the mild R1648H missense
mutation first identified in the GEFS+ family (Depienne et al., 2010; Escayg et al.,
2000a). Several genes have been identified for their involvement as genet ic modifiers
(i.e. Scn8a in mice studies, SCN1B, SCN19, GABRG2 and CACNB4 in humans)
(Gaily et al., 2013; Ohmori et al., 2008, 2013; Singh et al., 2009), possibly by
compensating the NaV1.1 loss of function (Hawkins et al., 2016).
All the reported genetic variables will be crucial determinants for the age of
onset and the type/frequency of seizures that the patients present, and also in defining
the outcome of the disease. The epileptic history of the patients in Na V1.1 mutation
phenotypic spectrum is crucial for a correct diagnosis. It is therefore safe to assume that
the genotype ↔ phenotype correlation is not applicable to all the cases. Accord ing to
this assumption, the diagnosis classification for a disease associated to the SCN1A
mutation is given primarily according to the phenotypic spectrum, then taking into
account the epileptic history (age at seizure onset, sensitivity to febrile seizures,
type/duration of seizures and familial history of seizures) and the genetic profile (the
type of mutation, the location in the gene, the genetic and environmental modifiers and
the possibility of eventual mosaic caregivers). In the following section, an in-depth
description about GEFS+ and DS diseases will be provided.
3. GENETIC EPILEPSY WITH FEBRILE SEIZURES PLUS (GEFS+)
3.1 GEFS+ historical, def init ion and epidemiology
GEFS+ is the most variable syndrome of the SCN1A gene mutations spectrum
and its prevalence in the world is unknown to date, but hundreds of cases have been
reported in the literature. It was first described in 1997 by Scheffer and Berkovic, when
they observed important correlations between generalized epilepsy and FS within
several families, but with markedly different severity. The phenotypic spectrum in the
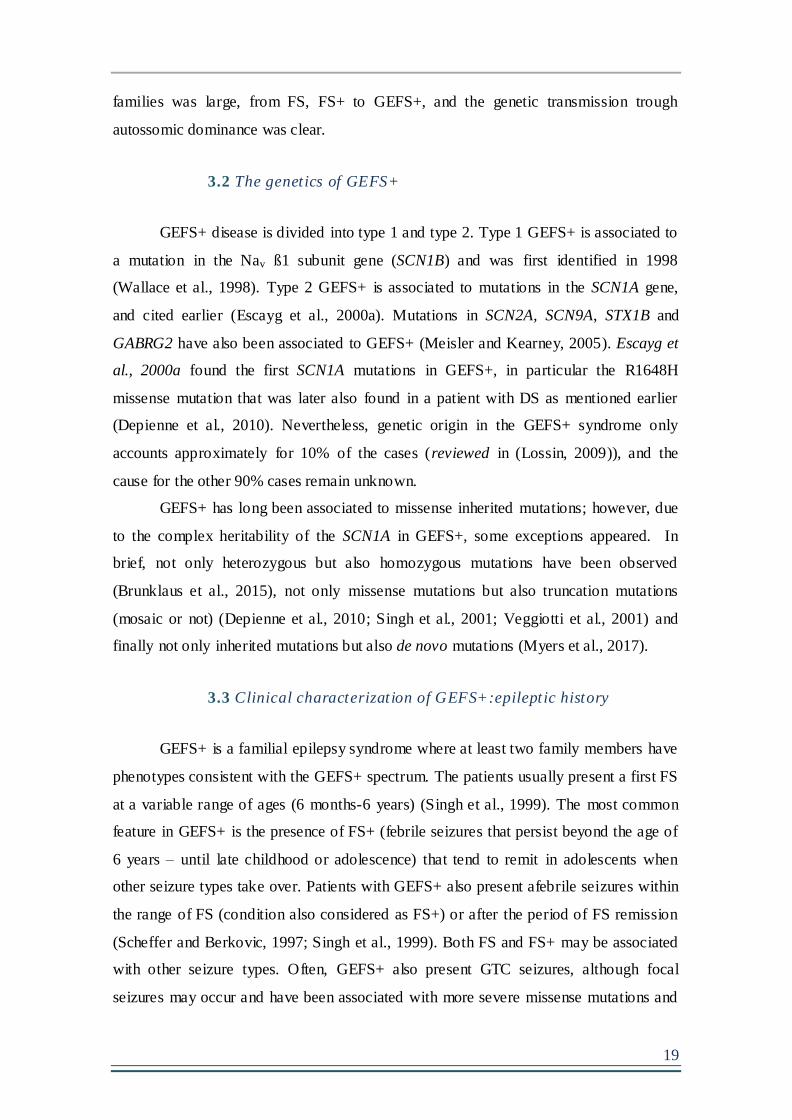
19
families was large, from FS, FS+ to GEFS+, and the genetic transmission trough
autossomic dominance was clear.
3.2 The genetics of GEFS+
GEFS+ disease is divided into type 1 and type 2. Type 1 GEFS+ is associated to
a mutation in the Nav ß1 subunit gene (SCN1B) and was first identified in 1998
(Wallace et al., 1998). Type 2 GEFS+ is associated to mutations in the SCN1A gene,
and cited earlier (Escayg et al., 2000a). Mutations in SCN2A, SCN9A, STX1B and
GABRG2 have also been associated to GEFS+ (Meisler and Kearney, 2005). Escayg et
al., 2000a found the first SCN1A mutations in GEFS+, in particular the R1648H
missense mutation that was later also found in a patient with DS as mentioned earlier
(Depienne et al., 2010). Nevertheless, genetic origin in the GEFS+ syndrome only
accounts approximately for 10% of the cases (reviewed in (Lossin, 2009)), and the
cause for the other 90% cases remain unknown.
GEFS+ has long been associated to missense inherited mutations; however, due
to the complex heritability of the SCN1A in GEFS+, some exceptions appeared. In
brief, not only heterozygous but also homozygous mutations have been observed
(Brunklaus et al., 2015), not only missense mutations but also truncation mutations
(mosaic or not) (Depienne et al., 2010; Singh et al., 2001; Veggiotti et al., 2001) and
finally not only inherited mutations but also de novo mutations (Myers et al., 2017).
3.3 Clinical characterizat ion of GEFS+:epilept ic history
GEFS+ is a familial epilepsy syndrome where at least two family members have
phenotypes consistent with the GEFS+ spectrum. The patients usually present a first FS
at a variable range of ages (6 months-6 years) (Singh et al., 1999). The most common
feature in GEFS+ is the presence of FS+ (febrile seizures that persist beyond the age of
6 years – until late childhood or adolescence) that tend to remit in adolescents when
other seizure types take over. Patients with GEFS+ also present afebrile seizures within
the range of FS (condition also considered as FS+) or after the period of FS remission
(Scheffer and Berkovic, 1997; Singh et al., 1999). Both FS and FS+ may be associated
with other seizure types. Often, GEFS+ also present GTC seizures, although focal
seizures may occur and have been associated with more severe missense mutations and

20
poorer prognosis (Pineda-Trujillo et al., 2005; Sugawara et al., 2001). Because of the
presence of focal seizures in some cases, the term was adapted to Genetic Epilepsy with
Febrile Seizures plus (GEFS+) (Scheffer and Berkovic, 1997). In terms of generalized
seizure types, absence seizures, myoclonic, atonic seizures, and myolonic-astatic are
also observed in addition to GTC seizures (Scheffer and Berkovic, 1997; Singh et al.,
1999). GEFS+ patients with a mild phenotype display normal cognition upon
neurological examination and normal EEG. However, more severe GEFS+ cases can
present generalized epileptiform abnormalities in a normal EEG background.
As far as we know, none had reported neuroimaging and neuropathological
examinations in GEFS+ patients probably due to the generally positive long-term
outcome in patients.
3.4 Therapeutic strategy and long-term outcome
The treatment is considered in the children if they have several individual
episodes of FS. In the cases reported by Scheffer and Berkovic, 1997, most had febrile
seizure onset in the first year of life and many had remittance of the seizures in the first
or second decades, although some had seizures into adulthood. The treatment window
and response can vary within the same family. It was reported that two GEFS+
mutations, that conferred a change in the NaV1.1 folding were partially rescued by
treatment with anti-epileptic drugs (Rusconi et al., 2007, 2009). This might be the cause
of successful treatment response in mild cases of GEFS+. However, GEFS+ patients
with more severe phenotypes can present pharmaco-resistance (Grant and Vazquez,
2005).
Long-term outcome in GEFS+ children is usually self- limited and favorable.
Seizures tend to decrease and in general, patients do not develop cognitive and
behavioral deficits (Scheffer and Berkovic, 1997). However, some cases have been
reported to exhibit mild psychiatric (Mahoney et al., 2009; Osaka et al., 2007) or
cognitive deficits (Myers et al., 2017). On one hand, seizure intensity and severity have
been pointed to contribute to the behavioral and cognitive outcomes, but on the other
hand, the mutation severity might also be involved. GEFS+ spectrum is comparable to
DS spectrum (Singh et al., 2001), and it has been suggested that DS could be a severe
end of GEFS+ spectrum.

21
4. DRAVET SYNDROME (DS)
4.1 DS historical, Definit ion and Epidemiology
Severe myoclonic epilepsy of infancy (SMEI) was first described in 1978 in a
French medical journal by doctor Charlotte Dravet, psychiatrist at Marseille Hospital
(Dravet, 1978). An increased evidence of common cases emerged from all around the
world, but myoclonic seizures were not always present in these patients (Ogino et al.,
1989; Yakoub et al., 1992). Also the disease was not limited to infants, because the
epilepsy persisted in adults. The name of the disease was then adapted to Dravet
Syndrome (DS) in 1989. DS is a rare and severe epileptic encephalopathy (Catarino et
al., 2011) affecting around 1/30 000 patients in France (Yakoub et al., 1992) and 1/15
000 in the USA (Wu et al., 2015). The gender incidence is equivalent, except for DS
caused by mutations in the PCHD19 gene that affects a small percentage of females
(Depienne et al., 2009).
The diagnosis for DS is based on a first febrile or prolonged afebrile clonic
seizure occurring during the first year of life in a normally developed child who can
have or not family history of FS. If the patient presents two seizures associated to an
increase in body temperature and if at least one of these seizures lasts more than five
minutes possibly evolving to status epilepticus (SE)*, a diagnosis of DS is suspected
and the genetic analysis is performed. Also, DS patients present sensitivity to fever and
light.
DS represents the epilepsy type with highest mortality incidence that can occur
at any age, but mainly in childhood. The exact mortality incidence was not homogenous
in all the studies. However, it varies from 5% to 10% at early age. The main causes of
death reported were the Sudden Unexpected Death in Epilepsy (SUDEP), SE, accident,
infection or unknown causes. SUDEP is generally defined as the sudden, unexpected,
witnessed or unwitnessed, nontraumatic, and non-drowning death in patients with
epilepsy with or without evidence for a seizure, and excluding documented SE, in which
postmortem examination does not reveal a structural or toxicologic cause for death
(Nashef, 1997). Mechanisms involved in SUDEP seem to be correlated with sudden
cardio-respiratory arrest and the main risk factor seems to be the high level of GTC
seizures (Hesdorffer et al., 2011; Sowers et al., 2013). It confers the highest reported

22
cause of death in DS, a condition that occurs mostly during sleep, in children who did
not show a recent aggravation of the disease and under controlled medication.
4.2 The genetics of DS
Since 2001, it is known that most of the DS cases are associated to SCN1A gene
mutations (Claes et al., 2001). DS is the most severe disease of the NaV1.1 mutation
spectrum, with 80% of the patients harboring a mutation in the SCN1A gene. Some
patients who remain negative in genetic analysis have deletions or chromosomal
rearrangements involving SCN1A. Mutations in other genes have also rarely been
associated with DS, especially PCDH19 mutations (Depienne et al., 2009). SCN1A
mutations arise usually de novo, but ~10% are inherited from mosaic parents, as
described above (Gennaro et al., 2006).
4.3 Clinical characterizat ion of DS: Epilept ic history
Contrarily to GEFS+ that present a large spectrum of phenotypic severity, DS
presents marked characteristics and a homogeneous phenotypic spectrum. The first
febrile or afebrile seizure usually appears before the age of 1 year, within a range of
ages from 2 to 12 months and the final diagnosis of DS disease is usually made between
2 and 3 years of age (Bureau and Dalla Bernardina, 2011). Some studies suggested a
correlation between the age of the first seizure with the severity o f the phenotype, i.e.
lower ages of onset correlating with poorer prognosis (Cetica et al., 2017; Ragona et al.,
2010). The disease progression can be divided in three phases: the febrile phase, the
worsening phase and the stabilization phase. The first seizure is usually clonic,
generalized or focal triggered by fever or body temperature elevation (after a bath or
high physical activity) and lasts longer than a simple FS (>15 minutes). The first seizure
might also be afebrile in some cases (Ragona et al., 2010), but this is still controversial
(Nieto-Barrera et al., 2000). These seizures can evolve into SE (seizures lasting longer
than 30 minutes) that occurs at least once in each patient (Chipaux et al., 2010). The SE
can be febrile (usually in the first year of life – duration >30 minutes) and obduntation
(non-convulsive) between 4-8 years of age – duration can last for days. Isolated cases of
focal myoclonic jerks were observed to precede the GTC seizures in a few children

23
(Dravet et al., 2005; Oguni et al., 2001). At the onset (febrile period), patients usually
experience an average of one seizure per month or even less.
Within the worsening seizure period, patients present multiple seizure types
including: GTC seizures, generalized clonic seizures, myoclonic seizures, atypical
absence seizures and simple and complex focal seizures (with or without secondary
generalization). The end of the active period can vary from on child to another, usually
until 3 years of life but sometimes extending up to 13 years of age. Later on, partial
seizures, myoclonic seizures, atypical absenses and SE tend to disappear. GTC seizures
persist, at least until reaching 25 years old when they tend to remit (Dravet, 2014). In
adults, seizure-free periods of 1-5 years are low (>10%) (Akiyama et al., 2010; Jansen
et al., 2006).
At the onset, the EEG of DS children has a normal background, during awake
and sleeping states. During GTC seizures patients show typical EEG pattern,
characterized by a transient postictal flattening, which is rapidly replaced by diffuse
delta waves (Bureau and Dalla Bernardina, 2011) (FIGURE 9).
FIGURE 9. EEG TRACE O F A GENERALISED TO NIC-CLONIC SEIZURE IN AN 8-YEAR OLD DS PATIENT.
FRO M (DRAVET AND GUERRINI, 2011) WITH JLE PUBLISHER AUTHO RIZATIO N TO REPRODUCE.
At the onset of the seizure, a brief burst of fast activity correlated to muscle tonus (R DELT, R EXT, L
DELT), the clonic jerks progressed to GTC seizure and, at the ictal end, it is possible to see the brief
flattening followed by low voltage theta* activity.
R DELT = Right deltoid muscle, R EXT= right extensor muscle, L DELT = Left deltoid muscle
With the disease progression, the EEG activity can be maintained at normal
background level during awake phases in some patients, while in the others the
background activity can become slower and poorly organized with presence of alpha-
rhythm, an increase in theta* activity and generalized or multifocal interictal spikes

24
(Bureau and Dalla Bernardina, 2011). During the night, the interictal* EEG is usually
abnormal, due to the persistence of higher ictal* events during sleep.
4.4 Neuroimaging and neuropathology
There are not many studies about imaging or neuropathological studies in DS.
No gross brain abnormalities using Magnetic Ressonance Imaging (MRI) or Computer
Tomography (CT) have therefore been detected in the published studies. Only Dalla
Bernardina et al., 1982 and Dravet et al., 2005 reported a few cases presenting brain
atrophy with increased white matter. In 2005, Dravet et al., reported that MRI changes
were observed in 4 out of 35 DS patients carrying SCN1A mutations, with one
presenting hippocampal atrophy and another cerebellar atrophy (Dravet et al., 2005).
Olivieri et al., 2016 analyzed a cohort of 20 patients, in which 4 patients presented
either ventricular enlargement with corpus callosum thining, hippocampus atrophy, mild
cerebellar atrophy or diffuse cortical atrophy. Neither seizures frequency, age at seizure
onset, nor the mutation was correlated with the neuroanatomical abnormalities in these
patients.
4.5 Therapeutic strategy and long term outcome
DS is an intractable disease characterized by high pharmaco-resistance. The first
therapeutical goal in DS consists of reducing the seizures frequency (in particular long-
lasting seizures - as SE) and to minimize the anti-epileptic drug toxicity. The second
goal is to reduce the associated co-morbidities (reviewed in (Wirrell, 2016)).
During the first years of DS progression, the seizures are extremely resistant to
all treatments available until now, and seizure-free patients have rarely been described
even after passing the worst epileptic period (Jansen et al., 2006).
Na+ channel blockers (carbamazepine, oxcarbazepine, phenytoin, lamotrigine)
have been used mainly before the SCN1A mutation identification, but appeared to
clearly exacerbate the seizure phenotype in DS patients (Ceulemans, 2011; Chipaux et
al., 2010; Guerrini et al., 1998; Wang et al., 1996). It was then suggested to stop using
them. Currently, first lines of treatments focus on benzodiazepines like clobazam,
clonazepam, diazepan to increase GABAergic function and decrease brain excitability.
Valproate is also used, but its mechanism of action is less specific including voltage-
25
gated sodium channel and NMDA receptors blocker and enhancer of GABAergic
function.
Stiripentol is used as a second- line drug. Its use has clearly reduced the number
of seizures including SE in patients, helping medical doctors to reduce the high
mortality incidence caused by these prolonged seizures. Stiripentol is considered as the
drug that, in combination with other drugs, has shown higher effectiveness in DS
patients (Chiron et al., 2000; De Liso et al., 2016; Kassaï et al., 2008). It acts by
increasing GABAergic function, but also increasing the effects of the other antiepileptic
drugs on the GABAergic system (Fisher, 2011). Stiripentol is usually combined with
topiramate that, as valproate, has a large spectrum of action (voltage-gated sodium
channels and AMPA receptors blocker and enhancer of GABAergic function). In
summary, the most common recent combined treatment comprises first of valproate
with or without a benzodiazepine, and then of stiripentol with topiramate (Wirrell,
2016).
Yet, the seizures tend to be resistant even though multiple medications exhibit
clinical evidence of efficacy (by reducing the number of seizures) in DS: stiripentol,
valproic acid, clobazam, bromide and topiramate.
Two recent treatments are in development (cannabidiol and fenfluramine).
Cannabidiol was highly mediatic in the press however the very few studies who
evaluated its efficacy in DS patients showed low level of responsiveness to the drug
(O’Connell et al., 2017; Press et al., 2015). A current study is being done to test its
efficacy.
Fenfluramine is an agent that releases serotonin by disrupting vesicular storage
and reversing serotonin transporter function, is actually on phase III of clinical trials,
after showing remarkable efficacy in DS at low-dose concentration in seizures reduction
(Ceulemans et al., 2016; Schoonjans et al., 2017). The effects of fenfluramide on
cognition have not been assessed yet.
Alternative non-pharmacological treatments have been proposed to combine
with the anti-epileptic drugs notably: vagus nerve stimulation and ketogenic diet. Vagus
nerve stimulation have been effective in treating several forms of refractory pediatric
epilepsy (Cersósimo et al., 2011). However, the studies done in DS patients were not
very promising (Zamponi et al., 2011). Only very recently, a new study showed
improvement in seizure frequency (>50% of patients reduced significantly the seizure
frequency) with behavioral and cognitive ameliorations in 75% of a small cohort of

26
patients submitted to vagus nerve stimulation in combination with anti-epileptic drugs
(Fulton et al., 2017). The studies using ketogenic diet in combination with anti-epileptic
drugs have been much more beneficial for patients than vagus nerve stimulation.
Several studies reported seizure reduction from 50 to 99% in patients (Caraballo et al.,
2011; Korff et al., 2007), and even with improvement in behavioral phenotypes in some
patients (Laux and Blackford, 2013; Nabbout et al., 2011)
Other alternative treatments as immunotherapy have been tried without reaching
significant conclusions to date (Chabardès et al., 2002).
No published reports compared the effects of different anti-epileptic drug
administration schedules for GTC seizures or SE in patients with DS. This could
probably explain some worsening in the phenotypes, mainly in cases where Na+ channel
blockers are still being administrated.
Seizures importantly decrease the quality of life of DS patients and their
relatives. In addition to seizures, important psychiatric, neurological and cognitive co-
morbidities are present in DS patients. To improve the comorbidities in DS, several
therapies are used notably, occupational and speech therapy, social work and others.

27
Chapter 3- BEHAVIORAL AND COGNITIVE: LONG-TERM OUTCOME IN DRAVET
SYNDROME :
The long-term outcome in DS patients is always unfavorable. The development
is normal in the first year of life (before the severe period of high seizures intensity) and
children can have a normal life. They usually start walking at normal age but then tend
to show progressive development delay and regress, becoming severely impaired.
Among the psychiatric and behavioral abnormalities shown in DS patients, it is always
hard to say which ones are consequences of the disease and which ones result as side
effects of the anti-epileptic drugs. DS patients develop neurological, psychiatric and
cognitive abnormalities.
1. NEUROLOGICAL ABNORMALITIES IN DRAVET SYNDROME
Neurological signs progressively appear in DS children. They are characterized
by hypotonia, ataxia, pyramidal signs, interictal myoclonus and “crouch” gait.
Hypotonia, meaning low muscle strength, is observed very early in DS children (around
one year of age). Patients have difficulty to stand up correctly and exhibit orthopedic
problems later on (Dalla Bernardina et al., 1982). In addition to muscle strength
abnormalities, DS children have also altered coordination of muscle movements.
Pyramidal signs are the results of the activity of pyramidal cells in the motor cortex. It is
usually present as voluntary, discrete and skilled movements that are observed in DS
children by spasticity or walking on tiptoes. The frequency of these events is not
continuous and is more frequent after severe seizure episodes (Caraballo and Fejerman,
2006; Dalla Bernardina et al., 1982). In addition to the “voluntary” abnormal
movements, the children also develop involuntary movements. Ataxia, the lack of
muscle coordination, is reflected in DS children when they start walking, at around 12-
18 months (sometimes delayed) (Dalla Bernardina et al., 1982; Dravet et al., 2005).
These neurological signs are observed in the majority of the patients and were
hypothetically correlated to a cerebellar co-factor in DS disease progression (Battaglia
et al., 2013). Additional involuntary movements are the interictal myoclonus
(myoclonic jerks that appear independently to seizure events) that are more frequent
after intense seizure activity and transitory in patients. They appear as involuntary facial
or limb movements (Nabbout et al., 2003). All these neurological signs and skeletal

28
abnormalities lead to a particular posture in DS patients. They usually maintain a
normal or nearly normal gait in the first 5 years of age that then evolves into a “crouch”
gait associated with skeletal misalignment in the lower limbs in the majority of patients
after 13 years of age (Rilstone et al., 2012). This handicap is degenerative and
irreversible prominently affecting all the motor skills which lead hence to the inability
to realize the patient’s daily- life needs.
2. COGNITIVE DELAY AND REGRESSION IN DRAVET SYNDROME
Cognitive decline in DS has no specific age of onset. Visual functions seem to
be primarily affected in DS children. Fine visuo-motor (i.e. object assembly, coding)
and visuo-spatial (i.e. block design) skills through eye-hand coordination seem to be
altered in the first year of life in children, even before the appearance of other cognitive
symptoms and clinical confirmation of the syndrome (Battaglia et al., 2016; Chieffo et
al., 2011a; Ricci et al., 2015; Wolff et al., 2006a). Moreover, language is delayed in DS
patients. The reported studies classify language capacities in three levels (average
speech, isolated words but not the ability to construct sentences and complete lack of
speech). These speech incapacities directly impact the school level of DS children, and
some with lower prognosis can not even attend the school (Caraballo and Fejerman,
2006; Fujiwara et al., 1992; Wolff et al., 2006a; Yakoub et al., 1992). Comparing to
visual capacities, language seems to be more conserved or partially recover in late
childhood in DS children (Chieffo et al., 2011b). However, Acha et al., showed that
visual processing was preserved in their cohort of 8-14 years old DS patients, while
verbal information was more affected (Acha et al., 2015).
Memory function has not been as explored in DS study cases as behavioral
phenotypes and visual skills, possibly due to the youth of patients. A study evaluating
memory processing shows that verbal working memory was importantly impaired
demonstrating, in the majority of DS children, an inability to integrate sensory serial
events (Battaglia et al., 2013). This could also be correlated with the lack of visual and
auditory attention demonstrated by the children, and other authors suggested a
cerebellar role (Gottwald et al., 2003). However, as mentioned above, the PFC plays a
crucial role in attention driven tasks (Clark et al., 2015), so alterations in the function of
this structure in DS patients could also explain impairments in working memory tasks.
Impaired executive function was reported in all the studies, which highlight an

29
important perturbation in the sequencing of activity plan (Acha et al., 2015; Chieffo et
al., 2011a; Olivieri et al., 2016), again pointing to alterations in brain structures driving
executive functions like the PFC.
Sleep disturbances can importantly affect the cognitive profile in DS children
but have been more controversial. There are not many studies that had a look into the
sleeping patterns of DS children. Chieffo et al., 2011a reported sleep problems in all 5
DS patients studied but did not specify the abnormalities observed. More recently,
Dhamija et al., 2014 observed non-REM sleep abnormalities typical of immature
cortical synaptic activity but no changes in the sleeping architecture in their cohort. The
many hypothetical reports about sleeping abnormalities in DS children can be possibly
due to the intense seizure activity during the night, and that certainly affects the norma l
sleeping cycle during the night, but probably not inducing important architectural
changes (Oguni et al., 2001). In sum, the major reports about cognitive dysfunctions in
DS patients are about vision (visio-spatial, visio-motor), language, attention, working
memory and executive functions, suggesting the role of PFC-mediated damage. Visuo-
spatial impairments were also reported (Chieffo et al., 2011b) indicating that the
hippocampus might be affected in these children.
3. PSYCHIATRIC/BEHAVIORAL ABNORMALITIES IN DRAVET SYNDROME
As mentioned above, attention deficits frequently appear during the second year
of life and are reflected in the many neuropsychological tests performed by clinicians.
Correlated to the lack of attention, DS patients show increased activity and stereotypies.
Thus, their attention deficits and hyperactivity reflect the poor eye-contact and the
social integration difficulties (Battaglia et al., 2013). Autistic traits are often observed in
DS patients, like difficulty to establish eye-contact, no emotional reciprocity, difficulty
to establish friendships and to deal with social rules (Chieffo et al., 2011a, 2011b;
Villeneuve et al., 2014). However, while many authors reinforce the fact that DS
children are not autistic but have severely impaired social contact (Li et al., 2011; Wolff
et al., 2006a), others promote autistic traits in these children (Berkvens et al., 2015).
Along the same line, DS patients tend to be repetitive in their activities and to have
obsessive attitudes. During adolescence, some DS cases can display internalized
behaviors : anxiety, depression or exhibit externalized behaviors: becoming aggressive,
hyperactive and rule-breaking (Akiyama et al., 2010; Battaglia et al., 2013; Olivieri et

30
al., 2016). Excessive familiarity with strangers, and poor danger awareness was reported
by Villeneuve et al., 2014. In adulthood, however, patients seem to be calmer, but still
maintain their tendency to perseverate, difficulty to communicate and exhibit motor
impairments that render them socially isolated. In summary, the main behavioral
features in DS patients are characterized by hyperactivity and social isolation and in
some cases internalized or externalized behaviors. In the studies that performed
continuous behavioral and cognitive analysis through life, there was high evidence that
the phenotype tends to get worse. In adulthood, fully independent patients have rarely
been reported, but some can become only partially dependent (Akiyama et al., 2010).

31
Chapter 4- ANIMAL MODELS OF EPILEPSY AND SEIZURES CONSEQUENCES ON
COGNITION
Several mouse and rat models of epilepsy have been developed and described in
the literature. There are two types of models: 1) models of acute or chronic seizure
induction in a normal brain that does not indicate the presence of an epileptogenic
condition and 2) models that are associated with permanent “epileptic” disturbances (i.e.
mice/rats carrying genetic mutations associated to epileptic phenotypes).
Although experimental studies using animal models are crucial to understand the
physiopathology of epilepsy and develop anti-epileptic drugs, they also have many
limitations. The seizure types in humans are very diverse, and some of them might be
hard to reproduce in the rodent models. Accordingly, different epileptic syndromes are
characterized by the typical seizures that the patients present. Although several mouse
models seem to reflect human epilepsies, it is impossible to imagine that the mouse
model will faithfully reflect all the aspects of the human epileptic syndrome
(Guillemain et al., 2012). In addition, the genetic heterogeneity of backgrounds
observed in human cohorts does not reflect the homogeneity of a particular group of
animals with very little genetic variability, under controlled house conditions in the
animal facility. Rodent models carrying genetic mutations found in epileptic patients
are still one of the most accepted models by the epilepsy scientific community (Frankel,
2009; Guillemain et al., 2012). They usually fulfill three criteria, namely face validity
(analogy to the human symptoms), construct validity (conceptual analogy to the cause
of the disease) and predictive validity (specific response to treatments in patients). The
rodent models of epilepsy have contributed to important advances and knowledge of
human epilepsies and the associated comorbidities, contributing to the drug-therapy
improvement and the more accuracy in the diagnosis.

32
1. MODELS OF RECURRENT SEIZURES AT EARLY-AGE ON THE DEVELOPING
BRAIN AND THEIR CONSEQUENCES ON BEHAVIORAL AND COGNITIVE
PHENOTYPES
1.1 Hyperthermia-induced seizures: the model of febrile seizures,
its epilept ic and behav ioral consequences
As stated earlier, FS are convulsions associated with fever and are typically
elicited by temperature higher than 38.5ºC in humans (Ellenberg and Nelson, 1978).
Fever, an adaptive host defense response to viral and bacterial infections, and other
inflammatory stimuli, relies on coordinated neuro- immune interactions between the
periphery and the brain (Alheim and Bartfai, 1998). Yet, FS are not identical to
hyperthermia- induced seizures, because febrile seizures occur in response to fever that
triggers the release of pro-inflammatory cytokines (interleukin (IL)-1, IL-6 and tumour
necrosis factor (TNF)-α) (Alheim and Bartfai, 1998). It was previously described that
inducing fever in rodents, through injection of established pyrogenic agents (i.e.
lypopolysacharide) to provoke an increase of body temperature of more than 1ºC (in an
inflammation context) is almost impossible (Cartmell et al., 1999; Fewell and Wong,
2002; Heida and Pittman, 2005). However, while children present FS, they are also
sensitive to hyperthermia in most cases. Moreover, FS and hyperthermic seizures share
common mechanisms trough cytokines as mediators (i.e. Il-ß) (Dubé et al., 2005; Gatti
et al., 2002).
The rat model of experimental FS was largely described in the literature (Baram
et al., 1997; Bender et al., 2003; Dubé et al., 2005, 2012). Simple FS, lasting less than
15 minutes, are known to be self- limited, not causing brain damage and cognitive
impairment (Berg and Shinnar, 1996). The effect of complex FS (lasting longer than
15minutes), however, is more controversial. Briefly, FS are induced in P10-11 rats and
P14-15 mice by elevating the body temperature at a rate of 0.5ºC every 2 minutes using
hot air. Seizures are usually triggered at an average of 41ºC. Animals are maintained in
hyperthermia (40-42ºC) from the initial behavioral sign of a seizure (time 0) to a total
duration of 15 minutes for simple FS or 30 minutes for complex FS. Neither type of FS
induces neuronal death (Bender et al., 2003; Chang et al., 2003).
The occurrence of FS increases the probability of recurrent FS in children
(Annegers et al., 1987) and in animal models (Dubé et al., 2010; McClelland et al.,

33
2011; Yagoubi et al., 2015). In animal models, the occurrence of further epileptic
seizures and the reduced thresholds to chemically induced seizures after one prolonged
FS episode indicate that FS lead to epileptogenesis in the immature brain (Dubé et al.,
2010).
Many studies in rodents addressed the neuropathological consequences of FS. It
was clearly showed that FS perturb the neuronal network of the hippocampus rending it
hyperexcitable throughout life without cell loss (Bender et al., 2003; Dube et al., 2000;
Dubé et al., 2010). However, fewer reports investigated the long-term effects of FS in
cognition. This can be associated to the benign or self- limited effect of these seizures in
young children and the controversies about their effects. One prolonged hyperthermic
seizure (~25-30 minutes) was shown to cause memory deficits in the spatial Morris
water maze test in rats, however the effects were usually moderate or transient (Dubé et
al., 2009; Rajab et al., 2014; Yagoubi et al., 2015). Also, the results in animal models of
FS are contradictory. Indeed, after one prolonged hyperthermic seizure (30 minutes) in
rats, some authors showed alterations in hippocampus synaptic plasticity (increased
LTP and reduced LTD) but no spatial memory deficits (Lemmens et al., 2009;
Notenboom et al., 2010). Interestingly, one study in mice has shown an age-dependent
effect of FS on cognition. While FS induced at P10 cause cognitive problems, when
induced at P14 they cause an enhancement in hippocampal-dependent memory
performance (Tao et al., 2016).
Simple episodes of hyperthermic seizures (5 minutes) have been induced
chronically in rats (1, 3 and 9 episodes over 1, 3 and 3 days respectively) at P10 and the
animals were tested for spatial memory at P35 and at P60. One simple FS did not
change memory performance at P35 or at P60, however the animals who experienced 3
or 9 seizures, respectively exhibited memory deficits at P35 and those where maintained
at P60 (adulthood) in the group which experienced 9 seizures, whereas it recovered in
the group with 3 seizures (Xiong et al., 2014).
Thus it was concluded that one episode of brief hyperthermia- induced seizure
(<15 minutes) does not cause memory deficits, but long- lasting or repeated episodes of
these seizures seem to affect normal brain development. The behavioral results seem to
indicate memory deficits caused by the seizures. Additional studies are however
required to confirm these findings.

34
1.2 Flurothyl-induced seizures: its epilept ic and behav ioral
consequences
Flurothyl, a GABAA antagonist, is a volatile chemoconvulsant that was
previously used to induce seizures in severely depressed patients as an alternative to
electroconvulsive therapy (Fink, 2014) and has been used to induce repeated seizures in
rats and mice (Holmes et al., 1998). It is a good model for repeated seizure induction,
due to the low mortality level and the rapid reestablishment of the animals following the
seizure episode.
Flurothyl is infused into a plexiglass closed chamber usually at a rate of
20µL/min, until the seizure occurs. The number of induced seizures usually varies.
Holmes et al, reports a seizure-induction protocol of a minimum of 25 seizures and a
maximum of 100 seizures induced during 5-10 days (5 -8 seizures p/day) (Holmes et al.,
1998). Seizures are induced at different ages from P1 to P70. A follow up study did not
report spontaneous seizures following the protocol of flurothyl- induced seizures in
neonatal rats (Holmes, 2009). However, recently, Kadiyala et al. 2016, induced seizures
for 1, 5 and 8 days, at 7 weeks of age in C57BL/6 mice and observed the appearance of
spontaneous seizures. The authors report that one single seizure does not induce the
appearance of subsequent GTC seizures, 5 seizures and 8 seizures induced subsequent
GTC seizures in 28% and 95% of mice respectively. These spontaneous seizures in
remitted within 1 month (Kadiyala et al., 2016)
At the neuronal network level, repeated flurothyl- induced seizures lead to
persistent decreases in GABA currents in the hippocampus and neocortex (Isaeva et al.,
2009, 2010, 2013), enhanced short-term plasticity and LTP alterations (Hernan et al.,
2013; Isaeva et al., 2013; Karnam et al., 2009a).
The effects of single or chronic induction of seizures by flurothyl during early
life on cognition were also evaluated. One single flurothyl- induced seizure at P6 does
not induce cognitive changes in rats in adulthood (Bo et al., 2004). Karnam et al.,
2009a induced seizures from P0 to P10 and P15 to P25 (5seizures/day and 50 seizures
in total) and the animals were tested for spatial memory 2 weeks following seizures.
The authors observed that neonatal seizures impaired spatial memory with no
differences between age of induction. Other studies used the following protocols: from
P1 to P10 (7-8 seizures p/day:75 seizures in total), from P15-P37 (4-5 seizures
p/day:100 seizures in total) or from P7-P11 (3 seizures p/day:15 seizures) and
35
behavioral testing was usually conducted 2 to 3 weeks following the seizures (P40). All
the protocols above induced cognitive impairment in the different behavioral tasks
tested (mainly spatial and working memory deficits) (Karnam et al., 2009b, 2009a;
Kleen et al., 2011; Nishimura et al., 2011; Zhou et al., 2007). When tested at P90,
almost 80 days following recurrent seizures induction from P0 to P9 (5seizures p/day –
total of 50 seizures) no behavioral changes were observed in seizure- induced rats
(Huang et al., 1999).
Together, the data on flurothyl induced-seizures indicate that recurrent neonatal
seizures (more than 15 seizures, and usually more than one seizure per day) induce
cognitive defects in adulthood, with no difference between the ages at induction in
childhood (P0-P10 or P15-P37), but that seizures induced in adulthood seem to be
reversible long-time after seizures induction.
The long-term effects of repeated seizures on the otherwise normally developing
brain are still controversial. While it is clear that they increase epileptogenesis and alter
neuronal circuits, their effects on cognition are not consistent. The majority of the
studies suggest hippocampus-dependent memory deficits even though these effects
seem to be transient or moderate.
2. ANIMAL MODELS HARBORING THE SCN1A MUTATION
2.1 Using animal models of Scn1a mutation
The first Scn1a+/- mutant mouse was created by (Yu et al., 2006a). This model
carries a Scn1a knock-out (KO) gene mutation obtained by target deletion of the last
coding exon of the Scn1a gene (encodes the domain 4 (D4) downstream of the segment
3 (S3) and the cytoplasmic tail). Following this model, other models of DS pathology
have been created (Miller et al., 2014; Ogiwara et al., 2007; Tsai et al., 2015) and two
models of GEFS+ have also been developed in 2010 and carry missense mutations
(Martin et al., 2010a; Mashimo et al., 2010) (TABLE 3). To more intensively describe
the neurophysiopathology and address specific neuronal populations in specific brain
areas, several conditional mouse models have been developed and are described in the
bottom part of TABLE 3.

36
TABLE 3. SCN1A MUTANT MOUSE/RAT MO DELS (TYPE O F MUTATIO N, LOCATION, ASSOCIATED
DISEASE).
2.2 Impaired neuronal inhibit ion in Scn1a mouse models: Role of
interneurons
The creation of the Scn1a+/- KO model by (Yu et al., 2006a), was very important
to better understand the neurophysiopathology in DS. The KO mutation caused the
reduction of NaV1.1 staining by half in heterozygous animals and to 100% in
homozygous animals. Homozygous mutant mice (Scn1a-/-) showed severe ataxia,
seizures beginning at day 9 (coinciding with the beginning of the channel’s expression)
and died by day 15 (Yu et al., 2006a), showing that NaV1.1 is essential for life. The
NaV1.1 staining was observed in pyramidal neurons and inhibitory interneurons in the
hippocampus but also in other brain areas. Using electrophysiogical tools, they showed
that the NaV1.1 driven sodium current of the hippocampus pyramidal cells was lower
than 10%, while it corresponded to approximately 75% in the interneurons. Moreover,
the number of interneurons was unaltered (anti-GAD antibody staining), and most of

37
them where positive for NaV1.1 in WT mice. The authors clearly illustrated a substantial
decrease in sodium current levels of interneurons in the Scn1a+/- and Scn1a-/- mutant
mice, correlated with a decrease in firing frequency (as seen by dec reased number of
action potentials for a given current injection) in those interneurons. The results
confirmed that NaV1.1 haploinsufficiency caused brain excitability rather than
inhibition. The excitability was thus associated to a loss of inhibition med iated by
interneurons, which suffered a massive NaV1.1 reduction. The excitability and sodium
currents in pyramidal cells were unaffected in Scn1a+/- mice (Yu et al., 2006a). This
study was a major discovery for the field because: 1) Scn1a+/- mice had striking
phenotypic similarities to human DS pathology that varies according to the genetic
background (as observed in humans), Thus, this model could be used in pre-clinical
investigation of pharmacological treatments; and 2) the electrophysiological studies
allowed the extrapolation of the cause of excitability and epileptic activity in DS
patients based on the interneuron physiopathology. In sum, NaV1.1 are preferentially
expressed in GABAergic neurons, although a small fraction was observed in the
excitatory cells and this suggests that DS disease is caused by a loss of GABAergic-
driven inhibition.
With the creation of other Scn1a mutant mouse models, these results were
further confirmed (Martin et al., 2010a; Ogiwara et al., 2007). While further
investigating the consequences of NaV1.1 reduction of function in the Scn1aRH/+ mouse
model (KI-missense mutation), Hedrich et al., 2014 showed that in addition to
previously reported reduction in Na+ current in the cortex, there was reduction in the
sodium current of GABAergic thalamus and hippocampus characterized by a deficit in
action potential firing at the AIS (Hedrich et al., 2014). Using the Scn1a+/- mice,
Kalume et al. 2007 observed that the firing rates of Purkinje neurons (a class of
GABAergic cells in the cerebellum) from mutant (-/- and +/-) mice were substantially
reduced, as seen previously in the hippocampus (Yu et al., 2006a), an alteration that
could be responsible for ataxia observed in these mice. Later, the same authors reported
reduced Na+ currents and action potential firing in GABAergic neurons of the reticular
nucleus of the thalamus potentially related with the sleep abnormalities observed in the
Scn1a+/- mice and reported in the same study (Kalume et al., 2015).
The Scn1a-KI mouse model created by Ogiwara et al., 2007 showed that Nav1.1
is primarily localized at the AIS, axons, and soma of parvalbumin (PV+) interneurons in
the developing neocortex and hippocampus.

38
In 2012, Cheah and her collaborators, created a conditional mouse model with
the specific ablation of NaV1.1 in the forebrain and observed that the mice had a severe
DS-like phenotype similar to the Scn1a+/-KO mouse created before by the same
laboratory (Cheah et al., 2012; Yu et al., 2006a).
While the studies with the KO mouse evaluated the effect of the specific deletion
on spontaneous seizures frequency and survival rate, the Scn1aRH/+ (model of GEFS+)
was used to evaluate the seizure susceptibility that characterized the model because
these mice do not otherwise present enough spontaneous seizures and the mortality is
inexistent. Dutton et al. 2013 suggested that the phenotype could be due to a specific
type of interneurons and studied the different contributions of the excitatory and
inhibitory neurons. They showed that, in the hippocampus and neocortex, 69% of
NaV1.1 immunoreactive neurons were also positive for PV. In contrast, 13% and 5% of
NaV1.1 positive cells in the hippocampus and neocortex, respectively, were found to co-
localize with excitatory cells. Next, they reduced the expression of Scn1a in either a
subset of interneurons (mainly PV interneurons) or excitatory cells by using conditional
ablation of Scn1a gene in mice and observed that the reduction in interneurons of the
neocortex and hippocampus was sufficient to reduce thresholds to induced-seizures,
whereas thresholds were unaltered following inactivation in excitatory cells (Dutton et
al., 2013).
Ogiwara et al., 2013, using the DS mouse model, showed that NaV1.1
haploinsufficiency in excitatory and inhibitory neurons are both involved in the
pathology of DS. By using three conditional mouse models that had the conditional
ablation of Nav1.1 specifically in forebrain interneurons, excitatory neurons or both,
they observed that: 1) the ablation of NaV1.1 specifically in excitatory neurons did not
change the phenotype; 2) the ablation of the NaV1.1 channel in the interneurons but not
in the excitatory neurons caused a more severe phenotype (higher letha lity and
spontaneous seizures) than observed before in the constitutive Scn1a-KI mouse model;
3) but the severe lethality was rescued in the model by additional Nav1.1 deletion in
excitatory neurons. Completing the results, the two major subtypes of interneurons in
layer V of the neocortex, PV+-expressing and somatostatin (SST)-expressing, had
impaired excitability, resulting in desinhibition of the cortical network (Tai et al., 2014).
An important role of the impaired GABAergic ininhition in the DG in the Scn1aE1099X/+
DS mouse model have been proposed recently by Tsai et al., 2015. They also showed
that the NaV1.1 staining is decreased in the DG at post-natal week 3, but not in CA1 or

39
CA3 areas, suggesting that the hippocampus gating might be primarily affected in these
models in the critic epileptic period (Tsai et al., 2015).
All together, the studies using animal models indicate that the neuronal cause for
DS is a widespread loss of sodium currents in the inhibitory GABAergic neurons. The
ablation of NaV1.1 in the forebrain is sufficient to cause the disease and while different
interneuron types have been implicated (Purkinje neurons, reticular nucleus of the
thalamus or SST, PV+ interneurons were consensually reported to play a major role in
DS pathology.
2.3 Strain and age dependent - phenotypic severity: mortality,
seizure frequency and electrophysiological propert ies.
As described in the previous part, the creation of the first Scn1a+/- mutant mice
(model of DS), revealed high dependency of the genetic strain to the severity of the
phenotype, as observed in DS patients. (Yu et al., 2006a). They observed that the
mortality was very high in Scn1a+/- mutant mice in pure C57BL/6 background and
almost inexistant in the 129/SvJ genetic background (FIGURE 10B), and that the mice in
the mixed 129:B6 hybrid background from F2 and F3 generations had an intermediate
phenotype (FIGURE 10A). Showing striking correlation with mortality the spontaneous
seizures were not observed in Scn1a+/- mutants in the 129 genetic background, but
frequent in the hybrid 129:B6 and very frequent C57BL/6 backgrounds (Yu et al.,
2006a). Thus, the Scn1a+/- mutation induced a severe DS-like phenotype in mouse
models with B6 background and a mild phenotype (cannot be considered DS) in the 129
background, possibly by compensatory genetic modifications. These results were
further confirmed in other DS mouse models (Miller et al., 2014; Ogiwara et al., 2013;
Tsai et al., 2015). In 2009, Oakley and his colleagues showed that the Scn1a+/- mutant
mice in pure B6 background were sensitive to seizures- induced by hyperthermia (SIH),
a phenomenon largely described in DS patients (Dravet et al., 2005). They saw that no
P17-18 Scn1a+/- had SIH, but practically all P20-22 and P30-46 Scn1a+/- mice had
myoclonic seizures followed by generalized seizures caused by elevated core body
temperature. The seizure susceptibility and severity was worse in the P30-46 mice
(Oakley et al., 2009a) (FIGURE 10C). In 2013, Cheah et al., interestingly showed that
the timing at increase in NaV1.1 channel staining correlated with the decrease in NaV1.3,
corresponds to the critical period of spontaneous seizure generation in Scn1a+/- channels

40
(around P20) (FIGURE 10D). The fact that the inefficient NaV1.1 activity is not able to
take over the role of NaV1.3 can be responsible for the brain hyperexcitability in these
mice. The same correlation was found in humans and corresponds to 5 months, the
average of seizure onset in DS the patients (FIGURE 10E) (Cheah et al., 2013a).
Spontaneous seizures start around P20-P21 in Scn1a+/- mice in pure B6 background
(Kalume et al., 2013; Yu et al., 2006a). In the electrocorticogram (ECoG) recordings for
spontaneous seizures in Scn1a+/- mice, studied in Kalume et al., 2013 the animals
presented an average of spontaneous seizures per day that varied from 3 for animals
who survived to 9 in animals who died following the intense seizure activity. They
confirmed a striking correlation between high seizure activity and death in those mice,
and a critical period of higher incidence of death from P23 to P27 (Cheah et al., 2013b).
Mistry et al., 2014 showed that preserved hippocampus sodium current density in
GABAergic interneurons contributes to the milder phenotype of Scn1a+/− 129 mutant
mice. Also they reinforced the observations made first by Ogiwara et al., 2013, showing
that excitatory pyramidal neurons contribute to severity of phenotype in Scn1a+/− mutant
mice. They observed an increase in the Na+ current in hippocampal pyramidal cells that
was age-dependent, and correlated with the higher spontaneous seizure activity in the
Scn1a +/- 129:B6 mutant mice (Mistry et al., 2014). Later, it was demonstrated that
Scn1a +/- 129 mice had a higher threshold for SIH, fewer myoclonic seizures when
compared to Scn1a +/- B6 mice, similar to patients with GEFS+. Consistent with this
mild phenotype, Scn1a+/- 129 mice had higher sodium currents in inhibitory GABAergic
neurons, indicating less impaired excitability of those neurons (Rubinstein et al.,
2015a). Concerning the Scn1a-RH mouse model created by Martin et al. 2010, the
authors observed that all the homozygous Scn1aRH/RH mice die by P25 following high
frequency of spontaneous seizures while the heterozygous and WT mice presented the
same survival proportion. The ECoG recordings for spontaneous seizures in the
heterozygous Scn1aRH/+ were done between 3-5 months and only few spontaneous
seizures were observed. However, they presented lower threshold for hyperthermia and
flurothyl- induced seizures when compared to WT controls (Martin et al., 2010a).

41
FIGURE 10. SURVIVAL, EPILEPTIC PHENO TYPE AND TIMING FO R NAV EXPRESSION IN THE BRAIN.
Survival percentage according to the genetic background in Scn1a+/-
mutant mice (A-mixed 129:B6
background, B-129 and B6 backgrounds) and age-dependent seizure susceptibility (C). Expression of
sodium channel proteins in developing mouse cerebral cortex (D).Expression of sodium channel proteins in
developing human cerebral cortex (E). From (Cheah et al., 2013b; Oakley et al., 2009b; Yu et al., 2006a).
All together, these studies showed a highly phenotypic correlation to the genetic
background confirmed by the severity of the phenotype, and also, an age-dependent
seizure susceptibility in the Scn1a+/- mutant mice.
2.4 Behav ioral/cognit ive phenotypes in mouse models of Scn1a
gene mutation
The Scn1a mouse models have striking similarities to human diseases GEFS+
and DS. They show sensitivity to SIH, spontaneous seizures and high mortality as
observed in DS patients. It was important to confirm if Scn1a mutant mice presented
behavioral abnormalities.

42
2.4.1 DS mouse mode l
The first behavioral observation in Scn1a mice was done in Yu et al., 2006 when
they observed dramatic behavioral abnormalities in homozygous Scn1a-/- mice, prior to
death (in the 3 genetic backgrounds:129; B6 and 129:B6) . From P9 the homozygous
mice started showing progressive epileptic seizures phenotype and could easily be
distinguished from the Scn1a+/- heterozygous and the WT mice. They develop severe
ataxia, with limb tremors, side-to-side swaying and complete loss of postural control.
The time to recover their righting reflex (between back and up-side position) was
significantly higher in Scn1a-/- mice, they were progressively immobile and did not feed
themselves leading to death by P15 (Yu et al., 2006b) (TABLE 4). In a later study, ataxic
phenotype was confirmed in Scn1a-/- mice further by impaired gait, coordination and
motor reflexes when compared to the Scn1a+/- and WT mice (Kalume et al., 2007a).
These findings reported on young Scn1a-/- mice (TABLE 4) were correlated with the low
firing rates of cerebellar Purkinje neurons, as mentioned earlier. Interestingly, the
Scn1a+/- had a similar phenotype to WT mice at this age. The same ataxia profile was
observed in the homozygous Scn1aRX/RX mice (Ogiwara et al., 2007).
TABLE 4. BEHAVIO RAL ABNORMALITIES OBSERVED IN YOUNG SCN1A-/-
HOMO ZYGOUS MICE.
In 2012, Han and his collaborators conducted a battery of behavioral and
cognitive tasks using the Scn1a+/- mutant mice in the pure B6 background at adulth age.
As illustrated in FIGURE 10B, the percentage of survival of these mice at 12 weeks is
43
20%. The animals were tested between 2 and 8 months of age. The authors reported
profound behavioral and cognitive alterations in these animals (Han et al., 2012b)
(TABLE 5). Scn1a+/- mice were hyperactive, anxious and presented stereotyped behavior
when compared to the WT littermates. They also reported important autistic- like traits
as social interaction deficits and social avoidance. To ensure that social deficits were not
correlated to olfactory perception, they conducted different tests. Using olfactory tests,
they showed that, while food perception and preference was not changed, they clearly
avoid social and aversive odors. Hippocampus-dependent memory was assessed using
the Barnes maze and contextual- fear conditioning (CFC) tests. The contextual- fear and
spatial memories were impaired (TABLE 5). A reduction in NaV1.1 staining was
confirmed in the Scn1a+/- animals in the medial prefrontal cortex, motor cortex, sensory
cortex, parietal cortex and hippocampus CA1 region (Han et al., 2012b). Using
electrophysiological recordings, they reported a deficit in GABAergic transmission,
observed by a decrease in spontaneous inhibitory post-synaptic current frequency
(sIPSC), and an increase in spontaneous excitatory post-synaptic current (sEPSC) in
pyramidal cells of the CA1 region of the hippocampus and prefrontal cortex. The
synaptic functions, measured with the miniature IPSP and EPSP, were unaltered.
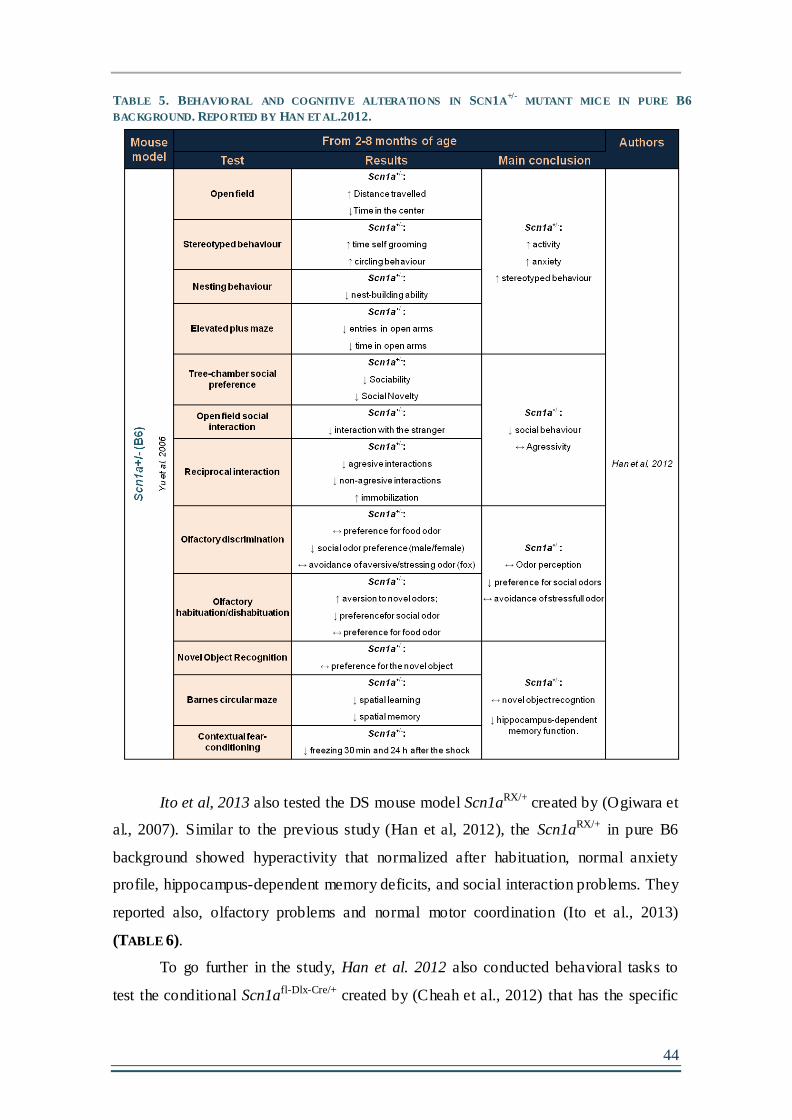
44
TABLE 5. BEHAVIO RAL AND COGNITIVE ALTERATIO NS IN SCN1A+/-
MUTANT MICE IN PURE B6
BACKGROUND. REPO RTED BY HAN ET AL.2012.
Ito et al, 2013 also tested the DS mouse model Scn1aRX/+ created by (Ogiwara et
al., 2007). Similar to the previous study (Han et al, 2012), the Scn1aRX/+ in pure B6
background showed hyperactivity that normalized after habituation, normal anxiety
profile, hippocampus-dependent memory deficits, and social interaction problems. They
reported also, olfactory problems and normal motor coordination (Ito et al., 2013)
(TABLE 6).
To go further in the study, Han et al. 2012 also conducted behavioral tasks to
test the conditional Scn1afl-Dlx-Cre/+ created by (Cheah et al., 2012) that has the specific

45
deletion of NaV1.1 in forebrain interneurons (represented in TABLE 3). The Scn1afl-Dlx-
Cre/+ mice with conditional NaV1.1 reduction showed similar behavior compared to the
Scn1a+/- with ubiquitous NaV1.1 ablation indicating that the GABAergic
interneuronopathy was responsible for the behavioral alterations observed. Using low-
dose clonazepan (enhancer of GABAergic transmission), they clearly rescued the social
deficits and the contextual fear conditioning impairment observed in the Scn1a+/- mutant
mice, without changing the hyperactive phenotype.

46
TABLE 6. BEHAVIO RAL ABNORMALITIES OBSERVED IN SCN1ARX/+
MICE IN ITO EL AL. 2013

47
Although sleep disorders are still controversial in DS patients and are mainly
attributed to side effects of anti-epileptic drugs, Kalume et al., 2015 showed sleep
abnormalities (reduced delta wave power, reduced sleep spindles, increased brief wakes,
and numerous interictal spikes in Non-Rapid-Eye-Movement sleep) in the Scn1a+/- DS
mice in pure B6 background without drug treatment. With electrophysiological tools,
they attributed those abnormalities to the GABAergic interneurons of the reticular
nucleus of the thalamus. In line with the previous findings, Rubinstein et al. 2015
recently published a work in which they dissected the contribution of two subclasses of
interneurons affected in Scn1a+/- DS model :the PV+ and SST+ interneurons (Tai et al.,
2014) to the behavioral abnormalities observed by Han et al., 2012b. They used
conditional mice with specific ablation of the Scn1a gene in the PV+, SST+ or both and
investigated the behavioral effects. Selective deletion of Na V1.1 in PV+ or SST+-
expressing interneurons increases susceptibility to thermally- induced seizures, with a
higher contribution of the PV+, and the deletion of both recapitulates the phenotype
observed in the Scn1a+/- mutant mice. They also observed that the reduced excitability
of PV-expressing neurons caused social interaction deficits, whereas impaired
excitability of SST-expressing neurons resulted in hyperactivity. Deletion in both PV
and SST interneurons impaired long-term spatial memory in context-dependent fear
conditioning, but was not sufficient to recapitulate the full extent of the cognitive
impairment observed in the Scn1a+/- mice by Han et al. 2012 (Rubinstein et al., 2015b).
The most recent published study was done to test the behavioral effects caused
by the genetic background in Scn1a+/- mice. As described earlier, the Scn1a+/- mutant
mice in the 129 pure background did not develop spontaneous seizure activity nor
premature death (Yu et al., 2006b) (FIGURE 10A). Rubinstein and her colleagues
showed that the Scn1a+/- in 129 background have higher threshold for hyperthermia-
induced seizures, increased inhibitory Na+ currents in the hippocampus and preserved
contextual- fear conditioning, when compared to the severe DS model in the B6
background (Rubinstein et al., 2015c). Thus, the phenotypic severity is clearly affected
by the genetic background.
In conclusion, as shown in this section, the Scn1a+/- mutant mice in B6
background present striking similarities to the human DS disease (Han et al., 2012a; Ito
et al., 2013; Kalume et al., 2015; Oakley et al., 2009; Rubinstein et al., 2015b; Yu et al.,
2006b) in terms of spontaneous seizure activity and important behavior and cognitive

48
abnormalities, while the same mutant in 129 background has a mild phenotype
comparable to GEFS+ patients (Rubinstein et al., 2015c; Yu et al., 2006a).
2.4.2 GEFS+ mouse model
The analysis of the behavioral phenotype in GEFS+ mouse models is more
recent (Ohmori et al., 2014; Papale et al., 2013; Sawyer et al., 2016). The GEFS+
mouse model carrying the human R1648H mutation was developed by Martin et al.,
2010a. This mutation was found in a large family of GEFS+ disease (Escayg et al.,
2000a) and in one DS patient (Depienne et al., 2010).
The Scn1aRH/+ mutant mice display a mild phenotype comparable to what is
observed in GEFS+ patients. Sleep abnormalities, characterized by increased
wakefulness and reduced non-rapid eye movement (NREM) and rapid eye movement
(REM) sleep amounts during the dark phase, were reported in these mice at 3-4 months
of age (Papale et al., 2013). Recently, Sawyer et al, had done a behavioral
characterization of the Scn1aRH/+ model and reported very mild behavioral abnormalities
when compared to WT controls. They observed that the Scn1aRH/+ mice have an
increase in activity in the openfield and slightly impaired spatial object recognition
memory and social interaction. They also reported an increase in the cued-fear
conditioning and decreased sensory gating (Sawyer et al., 2016). The behavioral tests
performed in the Scn1aRH/+ model are summarized in TABLE 7.

49
A rat carrying the homozygous Scn1a N1417H missense mutation in the third
pore of the NaV channel, induced by gene-driven N-ethyl-N-nitrosourea mutagenesis
(never observed in patients), was also generated (Mashimo et al., 2010). Homozygous
mutations are lethal in all the mouse models of Scn1a mutation without exception, but
this rat model survived normally. In humans, homozygous mutations have been reported
recently only in one patient with GEFS+ and one patient with DS (Brunklaus et al.,
2015). The electrophysiological studies in the Scn1aNH/NH rat model showed a decreased
inhibition in the GABAergic interneurons of the hippocampus. Also similar to the
previous models, they are sensitive to hyperthermia- induced seizures (Mashimo et al.,
2010). However, the authors did not observe spontaneous seizures using EEG
recordings from 5 weeks of age, suggestive of the mild phenotype carried by the model.
The behavioral analysis showed that the rats present a slight increase in activity in the
openfield and poorer spatial learning than the control WT. However, the anxiety level is
normal in the elevated plus maze, the sociability skills are preserved and they reach the
TABLE 7. BEHAVIO RAL CHARACTERIZATIO N O F THE SCN1ARH/+
MICE BY SAWYER ET AL. 2016

50
same level of performance in the last day of spatial learning as the controls. The
behavioral skills are only mildly affected in the rats (Ohmori et al., 2014) (TABLE 8).
TABLE 8. BEHAVIO RAL CHARACTERIZATIO N O F THE SCN1ANH/NH
RAT BY OHMORI ET AL. 2014.
As expected, the two GEFS+ models (Scn1aRH/+ and Scn1aNH/NH) show very
mild behavioral and cognitive abnormalities, as expected from animals with no
mortality, low or inexistent seizure activity and mild mutations that do not severely
impair the channels function. Compared to the Scn1a+/- mice in the B6 background
(model of DS and severe phenotype), GEFS+ models offer a good opportunity to
investigate the role of epileptic activity in cognitive and neurobiological outcomes
presented by DS patients (see Chapter 5 below).
The studies in animal models in the past 10 years have helped to clarify the
physiopathology behind the SCN1A-related diseases and confer an excellent tool to
investigate potential therapeutic strategies for patients.
51
Chapter 5- SEIZURES AND COGNITIVE PHENOTYPE IN DS: EPILEPTIC
ENCEPHALOPATHY OR CHANNELOPATHY?
While early- life seizures are the most striking feature of DS, the most
debilitating consequences of the disease are often the associated cognitive and
behavioral impairments. DS was classified as an EE; however there is still an ongoing
debate about the variables affecting phenotype in these children. The concept of EE has
recently been adapted to “the epileptic activity itself may contribute to severe cognitive
and behavioral impairment above and beyond what might be expected from the
underlying pathology alone”. Consequently, suppressing the seizures might have
benefic effects in improving cognition and behavioral abnormalities (Berg et al., 2010).
1. CAN SEIZURE SEVERITY BE CORRELATED WITH COGNITIVE/BEHAVIORAL
OUTCOME IN DS PATIENTS?
Evidence from different epileptic syndromes suggests that seizure frequency and
early age at onset could be crucial for cognitive delay. The main reason is that the
immature brains are most sensitive to seizures and are certainly less able to develop a
functional reserve capacity to cope with subsequent decline (reviewed in Hermann et al.,
2002). Also, the hypothesis that “seizures beget seizures” have been formulated in the
basis of the occurrence of brain function modifications following seizures and
consequently each seizure increases the risk for further seizures (Gowers, 1881).
However, this theory is still controversial (Allen Hauser and Lee, 2002; Ben-Ari et al.,
2008; Karoly et al., 2017).
It is possible but not clear that the SCN1A mutation confers a particular epileptic
profile in patients with DS. Nevertheless, the several seizure types inducing EEG
abnormalities (ictal and post ictal), the age at onset and duration of the seizures
observed in patients, the large therapeutic window applied and the high genotypic
variability of the SCN1A gene spectrum associated with the infinite possible genetic and
environmental modifiers accounting for the phenotypic variability, give rise to an
unclassifiable range of inconsistent outcomes.
Clinical studies have reported families carrying SCN1A gene mutations, where
amongst affected patients, those who had lower seizures number had normal cognition,
while those with intractable seizures were cognitively impaired (Guerrini et al., 2010;

52
Suls et al., 2010; Takayama et al., 2014) The age at seizure onset and the duration of the
seizures events seemed also to correlate with the worst outcomes in some cases (Acha et
al., 2015; Cetica et al., 2017; Wolff et al., 2006a). Moreover, it has been hypothesized
that more complex seizures, as myoclonic seizures, focal seizures, absence seizures and
prolonged SE could be responsible by worsening the phenotype (Ragona et al., 2011a).
Chipaux and collaborators observed three unusual cases of SE. In these patients the
long- lasting SE (2, 7 and 12 hours respectively), clearly caused persistent and severe
cognitive and motor deterioration following the event (Chipaux et al., 2010).
Yet, adding to the debate, many clinical studies failed to correlate the seizure
profile with the cognitive outcome and the reduction of seizures seems to not ameliorate
the phenotype (Akiyama et al., 2010, 2012; Nabbout et al., 2013; Riva et al., 2009;
Villeneuve et al., 2014). Some authors argue that the neurological signs observed in
patients (i.e. ataxia, crouching gait) can hardly be explained by the epileptic activity and
that mutations in PCDH19 do not cause this motor neuropathy. They better correlate
them to the channel dysfunction at the motor neuron axon initial segment (Duflocq et
al., 2008; Gitiaux et al., 2016). Guerrini and Striano, 2016 argued that this motor
impairment might have a complex origin, which also includes ataxia, in line with
evidence that SCN1A is also expressed in basal ganglia and cerebellar Purkinje neurons.
In addition, a possible detrimental effect of a high seizure frequency and multiple
anticonvulsants treatment should be taken into account (Guerrini and Striano, 2016).
Despite the fact that seizures reduction did not ameliorate the phenotypes, there
are very few “seizure- free” patients in response to therapy. Very few patients were
reported. One study reported a case carrying the SCN1A de novo truncation mutation,
and presenting a normal cognitive and developmental phenotype in adulthood after
considerable reduction of seizures events after the age of 4 years old (Buoni et al.,
2006). Another case presenting a de novo frameshit mutation in a patient presenting
refractory seizures until 5 years of age and who presented mild cognitive impairment at
2 years of age showed normal cognitive functions by 10 years of age (Jiang et al.,
2016).
With the exception of few truncation mutations found in patients presenting a
mild phenotype (as described previously), the most impacting mutations for the NaV1.1
function have been found in DS patients (Brunklaus et al., 2014). However, not many
studies have correlated the severity of the mutation with the cognitive outcome. The
presence of mosaicism and genetic modifiers make the correlations difficult to make.

53
Ricci et al, 2015 showed that visual functions can be affected shortly after
seizure onset in DS patients, even before the diagnosis and the strong epileptic period.
They reported that the language functions are more preserved in these children, and
suggest a possible role of the NaV1.1 haploinsufficiency in impairing these primitive
functions (Ricci et al., 2015). However, in this study only one patient (out of 5) had a
confirmed SCN1A mutation and had a rare late cognitive impairment appearance.
Nevertheless, the visual impairment was otherwise reported in the majority of DS
patients. Passamonti et al, 2015 reported one family carrying a splicing inherited
mutation in the SCN1A gene and a large heterogeneity of epileptic and
neuropsychological phenotypes (from non-affected to DS). All the affected patients
(having epileptic history) shared common visual problems, and one of the non affected
patients (never had a seizure, but carrying the mutation) had also mild visual problems
(Passamonti et al., 2015). Opposite observations (higher impairment in language than
visual function in DS patients) have also been reported by Acha et al., 2015, where they
correlate the worst epileptic phenotypes to the poorer cognitive outcomes.
To date, all these clinical observations provide controversy as to the origins of
the behavioral and cognitive deficits in DS. It would have been ideal to test whether
children have entirely normal cognitive skills before seizure onset to clarify this issue.
However, there are methodological limitations in planning prospective studies that
would unequivocally demonstrate complete integrity of early development. Studying
more simple/controlled models is crucial to understand the epileptic/cognitive and
genetic/cognitive correlations in DS patients.
2. DO NAV1.1 DYSFUNCTIONAL MICE SUPPORT THE CHANNELOPATHY THEORY?
The induction of repeated early- life seizures in the normal rodent brain have
suggested the appearance of important neuronal rearrangements and behavioral
modifications in those animals (reviewed in Barry and Holmes, 2016). These studies
suggest that seizures can induce long- lasting changes in an otherwise normally
developing brain.
Interestingly, the identical NaV1.1 truncation mutation is present in the B6 and
129 mice, however they present very different behavioral phenotypes. The DS mouse
model in the B6 background has striking similarities with the human DS disease,
however the same mutation in 129 background induce a mild phenotype (Rubinstein et

54
al., 2015c; Yu et al., 2006b). Han et al, 2012 and Ito et al, 2013 submitted the Scn1a+/-
mice in B6 background to a battery of behavioral tasks and observed important behavior
and cognitive impairment. Unfortunately, the behavioral deficits observed in these mice
cannot be dissociated from the negative impact of the strong recurrent epileptic activity
that these mice present throughout life. Han et al., rescued the phenotype by treating the
animals with GABAergic enhancer at low-dose to avoid sedation (Han et al., 2012b),
and suggested that the disease was a pure consequence of the network dysfunction
caused by NaV1.1 haploinsufficiency.
In addition, there is now evidence in mice that the mutation of the sodium
channel can result in cognitive deficits independent of seizures. Bender et al, 2013 used
an siRNA approach to knockdown NaV1.1 channels selectively in the basal forebrain
region, were they could target a learning and memory network while avoiding the
generation of spontaneous seizures. They showed that the reduction of NaV1.1
expression, without epileptic seizures in the medial septum and diagonal band of Broca
lead to a dysregulation of hippocampal oscillations in association with a spatial memory
deficit (Bender et al., 2013). Using the same technique, they later confirmed that NaV1.1
dysfunction impairs fast- and burst- firing properties of neurons in vivo altering brain
rhythms by decreasing theta frequency during a working memory task (Bender et al.,
2016).
These studies therefore strongly support the notion that NaV1.1 dysfunction per
se can alter neuronal networks and associated brain oscillations and thus affect memory
performance in DS. However these rodent models, in which the investigator can control
the majority of the variables, do not account for the DS phenotypic and genetic
variability and do not represent all the phenotypic spectrum present in patients. These
experiments need further confirmation.
It is clear that the genetic predisposition lead to seizures. However, it is not clear
whether the comorbidities present in DS are pure consequence of epilepsy, whether both
epileptic and cognitive phenotypes are pure consequences of the genetic defect or
whether both the genetic defect and the epileptic activity build the resulting outcome.
Thus, whether DS should be considered as an EE or a channelopathy remains an
outstanding question that needs to be resolved.

55
PROBLEMATIC
AND OBJECTIVES

56

57
II- PROBLEMATIC AND OBJECTIVES
Clinical studies failed to correlate the epileptic severity with the cognitive
outcome in DS (Battaglia et al., 2016; Chieffo et al., 2011b; Ragona et al., 2011a; Riva
et al., 2009; Suls et al., 2010). On another hand, genotype-phenotype correlations are
blurred by the occurrence of genetic and environmental modifiers and the presence of
genetic mosaicism.
Experimental studies, using Scn1a mutant mice, push the fact that the mutation
per se can be responsible for the long-term behavioral and cognitive outcome in DS
patients, challenging its definition as an EE. Yet, it was shown that recurrent seizures in
the first weeks of life result in considerable cognitive impairment in adolescent or adult
rodents (Holmes, 2009).
In this controversial context, we designed a study to investigate the effect of
seizures in the worsening of cognitive/behavioral phenotypes in mouse lines carrying
the Scn1a gene mutation, an issue that had not yet been addressed. Our goal was to
investigate if seizures in early life in DS and GEFS+ mutant mice can cause the
developmental delay and cognitive regression observed in DS patients. Answering this
question is crucial to adapt the definition of DS (as an EE or not) and for the
development of adequate treatments in DS and other EEs.
To do so, we used Scn1a mutant mice carrying mild phenotypes (no mortality
and no spontaneous seizures). We first tested if the mutation per se could alter the
behavioral and cognitive phenotypes. We then chronically induced seizures using
hyperthermia for 10 days at post-natal day 21 and evaluated the long-term effects on:
1) The evolution of the epileptic activity after the seizures induction protocol
using EcoG recordings, and understand if “seizures beget seizures”;
2) The long-term structural modifications in adulthood (P60) by analyzing
neuronal mortality using immunohistochemical analysis;
3) The long-term functional modifications in the hippocampus at later age
(P60) using field and patch-clamp electrophysiological recordings;
4) The cognitive and behavioral effects at later age (P60) using different
behavioral and cognitive tasks.

58

59
Material and Methods

60

61
III- MATERIAL AND METHODS
1. ANIMAL MODELS , BREEDING AND HOUSING CONDITIONS
1.1 Scn1a+/- (NaV1.1 knock -out): Dravet Syndrome’s mouse model:
The Scn1a+/- mice, model of Dravet Syndrome, and created by (Yu et al., 2006a)
was used initially in this study. Summarizing, the Scn1a+/- mouse was obtained by
disruption of the last coding exon of the gene that encodes for the NaV 1.1 channel
(Scn1a gene) with a replacement-type construct. This exon encodes for the domain IV
of the channel downstream of the S3 segment of the cytoplasmic tail. The mouse line
was generated from stem cell clones and the founding chimeric male was bred to
129/SvJ females in order to generate congenic Scn1a+/--129 SvJ mice. The line was then
backcrossed in 129 SvJ background for more than 12 generations. After receiving the
mutant males we crossed them with 129/SvJ females (Envigo, France) and used the
litters obtained (results chapter 1). After observing a very low breeding performance we
created a mixed 129/SvJ:C57BL/6 line in order to increase the number of animals to use
in the experiments. We backcrossed the Scn1a+/- mutant mouse in 129 SvJ background
with C57BL/6J females (Charles River, France) and used the F1 generation that were
hybrid and 50% 129/SvJ: 50% C57BL/6J (Results Chapter 1 and 5).
1.2 Scn1aRH/+ (NaV 1.1 knock-in): GEFS+ mouse model
The knock-in GEFS+ mouse model harboring the human SCN1A-R1648H
mutation was used in this study. This specific mutation was identified in a large and one
of the first families with GEFS+ disease (Escayg et al., 2000a). This model was
generated as described previously by Martin et al., 2010b. The targeting vector
containing the human SCN1A-R1648H mutation was knocked- in into the exon 26 of the
mouse Scn1a gene. The mutation resulted in the replacement of the arginine residue
with a histidine residue at the position 1648 of the gene (voltage sensor of domain 4).
The B6 - Scn1aRH/+ heterozygous mutant male, maintained in C57BL/6J background for
more than 10 generations was backcrossed with a 129/SvJ female. The F1 generation of
the hybrid mixed 129/SvJxC57BL/6J background mice was used for this study (results
chapter 3, 4).

62
1.3 Housing condit ions
All experiments were done according to policies on the care and use of
laboratory animals of European Communities Council Directive (2010/63). The
protocols we approved by the French Research Ministry following evaluation by a
specialized ethics committee (protocol number NCE/2014-216). All efforts were made
to minimize animal suffering and reduce the number of animals used. The animals were
housed under controlled laboratory conditions with a 12-h dark light cycle, a
temperature of 22 ± 2°C and 55±10% humidity. Mice had free access to standard rodent
diet and tap water. The number of animals per cage was maintained at 6 ± 1 containing
the four test groups.
2. EXPERIMENTAL TIMELINE
To study the effect of early life seizures induced by hyperthermia on the
phenotype of mouse models with Scn1a mutation, we organized the experimental
approach as shown in TABLE 9. From postnatal day 8 (P8) the animals were identified
and genotyped. At P21, after weaning, we induced seizures by hyperthermia (SIH) once
a day for 10 days. Following the protocol of SIH 4 different cohorts of animals were
prepared for: 1) Video electrocortigram (ECoG) recordings; 2) behavioral analysis; 3)
electrophysiological recordings and 4) Immunohistochemistry staining. For ECoG
recordings, electrophysiological recordings and immunohistochemistry males and
females were used, however for behavioral studies, only males were studied to avoid
hormonal interference. One cohort of animals was implanted with electrocortigram
electrods immediately following the end of the SIH protocol and recorded from P34 to
P90 to analyze the presence of spontaneous seizures. In parallel, SIH was also induced
in three other cohorts of animals, which were allowed to age in the stabulation room
before being tested at P60 (adulthood) (TABLE 9).

63
TABLE 9. EXPERIMENTAL TIMETABLE.
Sequence of experiments from P8 to P90. A ll g roups went through identification and genotyping, then SIH
protocol followed by: either ECoG recordings (from P32 to P90), behavioral analysis, electrophysiological
recordings or immunohistochemistry staining.
2.1 Genotyping
2.1.1 DNA extraction
Genotyping for mutation screening in the offspring was performed using DNA
obtained from tail biopsies acquired when the animals were identified (between P8-
P10). Tail biopsies were digested overnight at 56ºC and gentled shaking with lysis
buffer (50 mM Tris-HCl pH 8, 100 mM EDTA pH 8, 100 mM NaCl 1% SDS) and
proteinase K (10 mg/ML). After overnight incubation, samples were centrifuged for 10
minutes at 15000 g to get rid of undigested tissues and supernatants were transferred
into new eppendorf tubes. To lyse cells and access genomic DNA, saturated NaCl was
added to samples and incubated for 10 minutes on a rocking platform. Samples were
then centrifuged for 10 minutes at 15000g at 4ºC to get rid of cell debris. Supernatants
were transferred into new eppendorf tubes and DNA was precipitated with 2-propanol.
After centrifugation for 10 minutes at 15000g, the pellet was washed with 70% Ethanol.
After air drying the pellet, DNA was resuspended in TE buffer (100 mM Tris-HCl pH
7,5 and 1 mM EDTA). pThe DNA concentration of each sample was quantified by
spectrophotometry (A260 and A280) and stored at - 20ºC.

64
2.1.2 DNA amplificat ion
For PCR analysis, DNA was placed in PCR tubes and used as template for
amplification by adding the Master Mix solution (each primer (presented on TABLE 10),
ddH2O, Buffer 5X, dNTPS and Taq Polymerase). 268, 269 and 316 primers amplify
mutated NaV1.1 fragment from the Scn1a+/- mouse model, while 38S and 39S amplify
mutated NaV1.1 fragment fom the Scn1aRH/+ mouse model. All the primers were used at
10 µM concentration. For the Scn1a+/- mouse the following polymerase-chain reaction
(PCR) was used : denaturation of the DNA at 95ºC for 2 min, followed by 30 cycles of
amplification: 95ºC for 30 sec, 67ºC for 30 sec, 72ºC for 45 sec and a final extension
step at 72ºC for 7 min. The PCR-specific primers used are presented in (TABLE 10). For
the Ki mouse model the PCR was done with minor modifications: 94ºC for 2 min,
followed by 30 cycles of amplification: 94ºC for 30 sec, 56ºC for 30 sec, 72ºC for 45
sec and a final extension step at 72ºC for 7 min. Immediately following this reaction 1µl
was taken to a second reaction and mixed with ddH20, oligomers, DNA polymerase,
primer 39S and buffer to prepare for DNA sequencing (the mutant fragment is usually
obtained after EcoR1 cutting, but this reaction never worked in our hands so the entire
fragment surrounding the mutation had to be sequenced systematically). The PCR
reaction was the following: 96ºC for 1 min, followed by 30 cycles of amplification:
96ºC for 30 sec, 50ºC for 30 sec, 60ºC for 150 sec. The sequencing was done in a
platform in the institute. .
TABLE 10. PRIMERS USED FO R DNA AMPLIFICATION IN SCN1A MOUSE LINES .
2.1.3 DNA revelat ion and sequenc ing
For Scn1a+/- mouse model, PCR products were visualized on a 1.5% agarose gel
containing 2% of ethidium bromide to confirm the presence of DNA from the mutated
mouse models. To allow band size estimation, 100 bp DNA ladder was added, as

65
demonstrated in (FIGURE 11). Gel was run for 20 minutes at 100 volts in an
electrophoresis bath containing 1x Tris-Acetate-EDTA (TAE) buffer and then placed
under UV light for band visualization. FIGURE 11A shows a typical progeny genotyping
containing bands for mutant and WT mice. WT mice presents one single band of 291
base pair (bp) that corresponds to non-mutant amplified band (lanes 2,4), while Scn1a+/-
heterozygous mice exhibits two bands, one of 261bp (control band) and one at 141 bp
that corresponds to the mutant band (lanes 1,3,5). Scn1a+/+ positive (+/+) littermates
were used as controls (WT mice). After DNA sequencing the files were analysed and
we searched for the mutation at around base number 130. WT animals present the
sequence GAATCCTACG, while mutant animals have the sequence GAATYCTACR
as illustrated in FIGURE 11B.
FIGURE 11. GENO TYPING REVELATIO N.
A: Agarose gel contaning NaV 1.1 KO progeny. WT animals are illustrated in white (+/+) and mutants in
red (+/-). B: DNA sequencing of the Nav 1.1 KI progeny. On the left an example of the WT mouse and on
the right the presence of the R1648H mutation surrounded by the blue circle.

66
2.2 Repeated Seizures induction
2.2.1 Seizures induction by hyperthermia
Acute seizure induction by hyperthermia (SIH) have been described previously
(Oakley et al., 2009a). We optimized and developed a protocol of chronic SIH. SIH
protocol started at P21 (weaning time), once a day for 10 days. The time at which
seizures were induced during the day was randomized as well as the order for mice
having the seizure. SIH protocol was done as described previously for acute
hyperthermia induced seizures with minor modifications (Cheah et al., 2012). The
mouse was placed in an incubator (Dominique Dutscher, France) (width (w) 23cm,
length (l) 20cm, height (h) 20cm) and allowed to acclimatize for 10 minutes. The core
body temperature was continuously monitored with a rectal temperature probe (type
RET-4, Physitemp Instruments, Inc, USA) controlled by a temperature controller (type
TCAT-2, Physitemp Instruments, Inc, USA). The temperature was increased 0.5°C
every 2 minutes, until a seizure appearance or a maximum temperature of 42° was
reached. The animal was then removed from the incubator and the temperature was
decreased to 37°C before returning the mouse to the home cage. For mice having a
seizure, the temperature threshold and behavioral characterization were noted. WT and
Scn1aRH/+ mice were submitted to the protocol but only mutant animals had short-
lasting seizures (< 1 minute) at this temperature. Seizures were systematically video
recorded to allow off line analysis. WT and Scn1aRH/+ control animals followed the
same handling protocol but the temperature of the incubator was maintained at room
temperature.
2.2.2 Seizures induction by flurothyl
As an internal control, a convulsant known to perturb the GABAergic system
was used to induce seizures in WT and Scn1aRH/+ animals. Flurothyl (Bis 2,2,2-
trifluoroethyl ether) (Sigma-Aldrich) induced seizures were described previously
(Holmes et al., 1998). Animals were placed in a transparent plexiglas box (15 cm W, 10
cm L, 12 cm H). Liquid flurothyl was delivered using a syringe pump injector at a rate
67
of 10 µl/min and allowed to volatilize. The animals were removed after the appearance
of a generalized tonic clonic seizure. The latency to seizure was quantified.
2.2.3 Behaviora l characterizat ion o f seizures
The seizure characterization is important in order to fathom which brain areas
are involved in the seizure development. According to different methods of seizure
induction, the behavioral consequence in rodents will be different. SIH and Flurothyl-
induced seizures show common sequence and seizure type than seizures with limbic
origin (Hashimoto et al., 2006; Liautard et al., 2013). The origin of clonic seizures
(grade 1-4 TABLE 11) happens in the forebrain. The rapid and synchronized forelimb
clonus usually accompanied by head nodding indicates the activation of zones beyond
the limbic system (Velíšková et al., 2005). Following the forelimb clonus a tonic
component appears and the mouse loose balance having a twist of the body (failing) but
a rapid effort to get back happens (grade 5 TABLE 11). This phase indicates the
spreading of the seizure from the forebrain to brainstem. Seizures usually quickly
develop to more complex seizures called generalized tonic-clonic (GTC) seizures. The
GTC seizures that provoke the loss of consciousness announce the involvement of the
brainstem areas (grade 6 TABLE 11) (Browning, 1985). This seizure event is
characterized by wild run or jump with failing, followed by a tonic phase characterized
by tonic flexion presenting forelimb and hind limb extension (most severe part of the
seizure and sometimes culminating in death (grade 7 TABLE 11)) and finally long-
lasting clonus in all limbs. During all the GTC seizure phase the mouse doesn’t show
efforts to regain balance. After passing all the steps if the seizure completely develops,
the mouse regains the upright position.

68
TABLE 11. SEIZURES SEVERITY SCORING ADAPTED FO R SEIZURES WITH LIMBIC ORIGIN (ADAPTED FRO M
VELISKOVA, 2007).
2.3 Electrocort icogram recordings
After SIH protocol, the mice were implanted with ECoG electrods. The
electrods’ implantation and ECoG monitoring was done by Dr. Fabrice Duprat and Dr.
Ingrid Bethus.
2.3.1 Electrods imp lantat ion
The animals were anesthetized with ketamine (11.25 mg/kg) Virbac/ xylasine
(7.5 mg/kg) (Rompun 2%). After being placed in the stereotaxic support, ocular gel
(Dexpanthénol , Bausch Lomb) was put into the mouse’s eyes to protect them from
drying. The animals were maintained at 37ºC core body temperature for all the
procedure duration. The head’s hair was removed using depilatory cream. An incising
was done to access the scull and a local anesthetic was applied under the exposed area
(Lidocaïne 21,33 mg/ml, Xylovet). The skin was cleared using clippers. The bregma
position was measured in order to then calculate the distance of the wholes to it
(Antero-posterior; Lateral). Fives holes were made (diameter 0.95 mm) using a screw

69
driver (one placed in each hemisphere as recording electrodes and one placed above the
cerebellum as ground reference). The coordinates for the recording electrodes were:
electrode 1: AP : 0.0 mm / Lat : + 3 mm;
electrode 2 : AP : - 3.5 mm / Lat : +3 mm;
electrode 3: AP : 0.0 mm / Lat : - 3 mm;
electrode 4 : AP : - 3.5 mm / Lat : -3 mm;
Reference electrode: AP : -6.0 mm / Lat : ±0.2 mm.
The screws connected to the wires (Bilaney, Plastics One) were placed in the
holes. The screws were fixed to the skull with a resin (Super Bond, Sun Medical) and
the electrodes were placed in the connector and enveloped with dental cement
(Dentalon, Phymep) forming the hat above the mouse’s head. The mice were surveyed
until the recovering from anesthesia and then placed in their home cages with an anti-
inflammatory in the drinking-water (Ketofen 0.04 mg/mL of water).
2.3.2 Video Electrocorticogram recordings
After recovering from surgery, the animals were allowed to rest for 2 days. They
were individualized in the appropriate recording cages and connected to an amplifier
(Animal Bio Amp, AD Instruments) for ECoG recording. Each mouse was connected to
the amplifier through a cable and a swivel to allow the mouse to freely move in the
cage. The amplifiers were connected to an acquisition system (PowerLab 16/35, AD
nstruments) that converted the analogic signal into a numeric signal recorded, and
anlysed with the software (Labchart 8, ADInstruments). The system was equipped with
16 amplifiers that connected 16 electrodes, which allowed us to record simultaneously 4
mice with 4 recorded channels per mouse (FIGURE 12). Four infrared cameras
(Day&Night, Ganz) were connected and synchronized to the ECoG leading to the
analysis of the ECoG seizures and behavioral seizures, simultaneously. The animals
were recorded for 2 months in regular windows of 3-days periods.

70
FIGURE 12. ECOG RECO DINGS SYSTEM.
Top Figure: Recording cage.The mouse is connected to the signal collecting cable that has a rotator that
allows the animal to freely move. Bottom figure: 16 amplifiers allowed the recording of 8 mice
simultaneously. Photo from Doctor Lavigne PhD manuscript.
2.3.3 Signa l ana lys is
The recordings were analyzed with Labchart 8 (AD Instruments). ECoG traces
were screened manually to identify the signal with a typical seizure pattern, and the
generalized tonic-clonic seizure was confirmed by watching the corresponding video.
We quantified the seizures’ frequency (number of seizures divided by time recorded)
and their durations. All values were normalized to 24h in order to be compared.
2.4 Electrophysiological recordings in the hippocampus
Acute transverse hippocampal slices (350 µm thick for field recodings and 250
µm thick for whole cell recordings) were obtained from mice 60-70 days of age.
Animals were first anaesthetized with isoflurane and killed in accordance with the
European Communities Council Directive (80/609/EEC). Slices were cut on a
vibratome (Microm HM600V, Thermo Scientific) in ice-cold dissecting solution
containing (in mM): 234 sucrose, 2.5 KCl, 0.5 CaCl2, 10 MgCl2, 26 NaHCO3, 1.25

71
NaH2PO4 and 11 D-glucose, oxygenated with 95% O2 and 5% CO2, pH 7.4. Slices were
first incubated, for 60 min at 37°C, in an artificial CSF (aCSF) solution containing (in
mM): 119 NaCl, 2.5 KCl, 1.25 NaH2PO4, 26 NaHCO3, 1.3 MgSO4, 2.5 CaCl2 and 11 D-
glucose, oxygenated with 95% O2 and 5% CO2, pH 7.4. Slices were used after
recovering for another 30 min at room temperature. For all experiments, slices were
perfused with the oxygenated aCSF at 31 ± 1 °C. fEPSPs were recorded in the stratum
radiatum of the CA1 region using a glass electrode (RE) (filled with 1 M NaCl, 10 mM
HEPES, pH 7.4) and the stimuli (30% of maximal fEPSP) were delivered to the
Schaeffer Collateral pathway by a monopolar glass electrode (SE) (filled with ACSF)
(FIGURE 13A). Whole-cell recordings were made using borosilicate glass pipettes of 3–
6 MΩ resistance containing (in mM) K-gluconate 120, KCl 15, MgCl2 2, EGTA 0.2,
HEPES 10, QX-314 1.5, P-Creatine 20, GTP 0.2, Na2-ATP 2, leupeptin 0.1 and
adjusted to pH 7.3 with KOH and osmolarity between 290 and 300 mOsm. Slices were
visualized on an upright microscope with IR-DIC illumination and epi- fluorescence
(Scientifica, Ltd). After a tight seal (>1GΩ) on the cell body of the selected neuron was
obtained, whole-cell patch clamp configuration was established, and cells were left to
stabilize for 2-3 min before recordings began. ). The recordings were performed using a
Multiclamp 700B (Molecular Devices) amplifier, under the control of pClamp10
software (Molecular Devices).
2.4.1 Fie ld potentia l recordings
LTP was induced using a high-frequency stimulation protocol (HFS) protocol
with one pulse of 100 Hz or 4 pulses of 100Hz spaced by 5 minutes inter-stimulus
interval (ISI). For LTP analysis, the first third of the fEPSP slope (FIGURE 13B) was
calculated in baseline condition (20 minutes prior to induction protocol delivery and for
45-60 minutes post- induction). The average baseline value was normalized to 100% and
all values of the experiment were normalized to this baseline average (one minute bins).
The paired-pulse ratio (PPR) was obtained by stimulating the Schaeffer
collateral consecutively within a short-period of time. The PPR (P2/P1) was expressed as
the peak amplitude of the second response (P2) relative to that of the first response (P1)
at different ISI (150ms, 200ms, 250ms, 300ms, 350ms, 400ms, 450ms) (FIGURE 13C).
Experiments were pooled per condition and presented as mean±s.e.m.

72
FIGURE 13. FIELD EXCITATO RY POST-SYNAPTIC PO TENTIALS IN THE HIPPOCAMPUS .
A: Coronal hippocampus slice. The SE (stimulation electrode) stimulates at the sch (Schaeffer collateral)
and the signal is recorded by the RE (record ing electrode) in the CA1 pyramidal neurons. B: the fEPSPs
for baseline and post-LTP induction are calcu lated as slope (represented in orange) placed at 1/3 of the
peak amplitude of the response. C: The PPR are calculated as the rat io between the peak amplitude 2 and
the peak amplitude 1.
2.4.2 Patch-clamp recordings (performed by Doctor
Pousinha)
Current-clamp recordings were performed on CA1 pyramidal neurons or on
dentate gyrus (DG) granule cells. The resting (Vm) membrane potential was first
measured in the absence of any spontaneous firing, and only cells with Vm more
negative than -55mV were considered. To study the relationship between firing
frequency and current input, we first adjusted the membrane potential of CA1 pyramidal
neurons at Vh=-70 mV and of DG granule cells at Vh=-60 mV and then injected pulses
of increased intensity in steps of 20 pA (from 0 to 400 pA, 1 s duration).

73
2.5 Immunohistochemical analysis in brain slices
After SIH, the mice from all the groups were collected at P60 for later
immunohistochemical analysis. We fixed the brains with trans-cardiac perfusion of and
shipped the brains to our collaborators. All the immunohistochemical analysis on these
brains was done by Dr. Carolina Frassoni (team leader) and Dr. Cristina Regondi
(researcher) in Instituto Carlo Besta in Milan.
2.5.1 Intracardiac paraformaldeyde perfus ion
At 2 months of age the mice were anaesthetized with 11.25 mg/kg ketamine/7.5
mg/kg xylasine of body weight administered intraperitoneally, and then transcardially
perfused with 4% paraformaldehyde in 0.1M phosphate buffer (PB), pH 7.2, using a
peristaltic pump. The brains were removed from the skull, immersed overnight in 4%
paraformaldehyde in PB and then transferred to 0.1M PB in 0.001 NaN3.
2.5.2 Antibody staining
The brains were removed from the skull, immersed in 4% PFA in PB for 1 day,
cut into 50-μm-thick serial coronal sections in a Vibratome VT1000S (Leica,
Heidelberg, Germany), stored in PB and processed for immunohistochemistry. Selected
free-floating vibratome sections were incubated overnight at 4°C using the following
anti-neuronal nuclei (NeuN, 1:3000, Chemicon, Temecula, CA, USA) primary
antibody, in accordance with the standard immunoperoxidase protocol (Moroni et al.,
2008). After several rinses in PBS, the sections were incubated in biotinylated goat anti-
rabbit IgG (Vector Laboratories, Burlingame, CA, USA) diluted 1:200 in 1% NGS in
PBS. The avidin-biotin-peroxidase protocol (ABC; Vector) was followed, with 3, 3’-
diaminobenzidine tetrahydrochloride (DAB; Sigma) being used as chromogen. For
cytoarchitectonic analysis, selected sections were stained with Cresyl violet (2%).
Finally, the sections were mounted, dehydrated, and coverslipped with DPX (BDH,
Poole, Dorset, EN).

74
2.6 Behav ioral analysis
A battery of behavioral tasks was done to assess behavioral abnormalities
(anxiety, locomotor activity, sociability) and cognitive function (hippocampus and
prefrontal cortex memory). For Scn1a+/- mice, model of DS, only control WT and
mutant mice in one cohort of animals were tested. For Scn1aRH/+ mice the four groups of
animals (WT control, WT submitted to hyperthermia, Scn1aRH/+ control and Scn1aRH/+
with SIH) were obtained. We ran four cohorts of animals that we pooled. The order of
the memory tasks was counterbalanced between cohorts (Morris water maze-radial
maze-contextual fear conditioning; radial maze- Morris water maze-contextual fear
conditioning or Morris water maze- contextual fear conditioning- radial maze). The
openfield, dark/light and social interaction tests were always done at the beginning of
the test battery to avoid handling/habituation interferences and the placement for 72
consecutive hours in the actimeter was always done at the end of the testing to prevent
animal isolation-associated stress. For all the behavioral tasks’analysis the experimenter
was blind to genotype.
2.6.1 Openfie ld test
Apparatus
Hall, 1934 first described the openfield test (OF) to study emotionality in rats.
Nowadays, it is largely used to study novel environment exploration, general locomotor
activity, and provide an initial screen for anxiety-related behavior in rodents. The
reaction to novelty was assessed by studying the anxiety, locomotor activity and
stereotyped behaviors as previously described (Crawley et al., 1992). The apparatus
consisted in a white and opaque quadratic arena (40cm L (length) x40cm W (width) x30
cm H (height)) (FIGURE 14). An imaginary central area (20cm Lx 20W) and a peripheral
area (30 cm L, 10 cm W) were defined to study anxiety- like behavior. The light intensity
was set at 300 lux.

75
FIGURE 14. OPENFIELD APPARATUS .
Procedure
The mouse was placed in the center of the arena and allowed to explore for 10
minutes. The apparatus was cleaned with 70% ethanol and rinsed with water between
each animal. The trajectory of the animals was video recorded and tracked with
ANYmaze software (Stoelting, Wood Dale, Il). The total distance travelled and average
speeds were counted as measures of locomotor activity. The distance travelled in the
center (anxious area) was divided by the total distance travelled to assess anxiety level.
To evaluate stereotyped behaviors, the number of rearing episodes were scored
manually, while the circling behavior was scored automatically by the video tracking
software (ANYmaze software (Stoelting, Wood Dale, Il)). A complete 360-degree turn
of nose angle with respect to the body center was counted as one circling event.
2.6.2 Dark↔light exp lorat ion test
Apparatus:
The dark↔light paradigm has been extensively used for testing anxiolytic
properties of drugs in rodents (Crawley and Goodwin, 1980; Holmes et al., 2003). The
apparatus consisted of a white and black cage separated in two compartments (light and
dark) by a partition, which had a small opening at floor level. The dark/closed
compartment was made with black opaque walls (less anxious) cover by an opaque top
and a light/open compartment was made with white walls and was light exposed (more

76
anxious). The total dimensions of the box were 42 cm L, 18 cm W, 29 cm H, while the
light compartment represents 28 cm L and the black compartment 14 cm L (FIGURE 15).
The opening that allowed dark↔light transitions was 7cm L and 5 cm H. The open side
was illuminated by 300 lux light intensity.
FIGURE 15. DARK↔LIGHT BO X APPARATUS .
Procedure
The animals were released in the center of the light compartment and allowed to
explore the entire apparatus, notably entering and exiting the dark compartment for a
period of 5 minutes. The apparatus was cleaned with 70% ethanol and rinsed with water
between each animal. The dark compartment represents the protected area while the
light compartment represents the unprotected area. The test mouse has to deal with the
conflict of explore the bright area or be safe in the protected area. The time spent
(seconds) in the light compartment and the number of dark↔light transitions represent a
measure of anxiety and were counted manually.
2.6.3 Three-chamber social interact ion
Apparatus
Sociability and social novelty tests were performed as described previously with
minor modifications (Moy, 2004). The three-chamber apparatus consisted in a
rectangular non-transparent plexiglass box (60cm L x30 cm W). Two dividing walls
were made with clear plexiglass containing one circular opening each (4 cm diameter)
to allow the mouse to assess each chamber. Each chamber was 20 cm L, 30 cm W, 22

77
cm H (FIGURE 16). Light intensity was adjusted to 3.5 lux and the apparatus was
cleaned with 70% ethanol and water between each mouse. The wire cages were 11 cm
H, with a bottom diameter of 10.5 cm and bars spaced by 1cm (Galaxy Cup, Spectrum
Diversified Designs, Inc, Streetsboro, OH).
FIGURE 16. THREE-CHAMBER SOCIAL INTERACTION APPARATUS .
Procedure
The test consisted in three phases: 1) Habituation, 2) Sociability test and 3)
Social Novelty test. All the stages were recorded using a camera to allow offline
analysis. In the habituation phase the test mouse was placed in the empty box for 10
minutes, with the doors open in order to freely explore the 3 chambers and acclimated to
the environment. The time spent in each chamber, the distance travelled and the average
speed were measured using ANYmaze tracking software (Stoelting, Wood Dale, Il).
After the habituation period, the test mouse was restrained in the central chamber for the
time of the preparation of the next step. An unfamiliar mice (same strain/same age/same
gender) (M) was enclosed in the round wire cup, which allowed sensory but not
physical contact and placed in one of the side chambers and another empty wire cage
(EC) was placed in the opposite side chamber. Emplacements of the unfamiliar stranger
mouse cage and empty cage were counterbalanced between animals to avoid chamber
side preferences. A weighted bottle was placed on top of the wire cages to avoid
climbing from the test mouse. The test mouse was then allowed to explore for a 10-
minute session. After the sociability stage, the test mouse was again blocked in the
central chamber. For the last phase (the social novelty phase), a novel unfamiliar mouse

78
(nM) was placed in the cage that was previously empty. The doors were open and the
test mouse had now the opportunity to choose between the familiar mouse (fM)
(previously seen in the sociability phase) or the nM. The time spent interacting
with/exploring the cages (distance between the test mouse and the cage less than 2cm)
and also the time spent and the number of entries in each chamber was measured for the
sociability and social novelty phases.
2.6.4 Morris water maze
Apparatus:
The Morris Water Maze paradigm (MWM) was widely described for testing
spatial learning and memory (Morris 1981, Morris 1984). The apparatus consisted in a
circular tank (90 cm diameter) filled with opaque water (temperature 25°C±1). An
escape platform (8cm diameter) was submerged 1.0 cm below the water surface.
Extramaze cues were placed in the walls surrounding the maze to allow the animals to
create a spatial map and find the platform. Light intensity was set at 30 lux. Animals
were placed in the testing room 30 minutes prior to experiment in order to acclimatize.
Procedure
The testing consisted in 3 phases: 1) Cue task training (2 days) 2) Spatial
learning training (4 days) and 3) Long-term reference memory-probe test (1 day)
(FIGURE 17). For the cue task and spatial trainings, all the animals received 4 trials/day
with a maximum trial duration of 90 seconds (+30 seconds on the platform at the end of
each trial) and an inter-trial interval of 10 minutes. For each trial, the animals were
gently placed in the water facing the sidewalls in a different cardinal point (NWSE) and
randomized between animals and training days. If the animal did not find the platform
within the trial it was gently guided to it. All the trials were video recorded and tracked
using ANYmaze software (Stoelting, Wood Dale, IL).
1) Cued task training: Cued task was done prior to spatial learning training to
notice visual and motor problems and to accustom the mice to the testing rule (find the
platform to escape). A visible object was placed on top of the platform and the maze
was surrounded by opaque curtains. The mice were allowed to find the visible platform

79
for 2 consecutive days with 4 trials per day. If the animal did not find the platform
within the trial it was gently guided to it. The platform emplacement was changed every
day. The escape latency, average speed and distance travelled were recorded.
2) Spatial Training: For the spatial learning, the curtains and the object on top of
the platform were removed. The animals could guide their learning to find the hidden
and invisible platform based on the extramaze cues. If the animal did not find the
platform within the trial it was gently guided to it. The escape latency for each trial was
analysed.
3) Probe: A probe trial was run, 24 hours after training completion to assess the
strength of the memory for the platform location. The platform was removed and the
test mouse was allowed to search for it for 60s. The time spent in each quadrant (target,
left, right and opposite) were recorded. An imaginary zone was draw around the
platform –“platform zone” with 24cm diameter (3 x the platform diameter), and the
number of crosses in the “platform zone” were counted.
FIGURE 17. MO RRIS WATER MAZE APPARATUS AND PRO TOCOL TIMELINE.
A: Morris water maze apparatus. B: GEFS+ mouse trying to find the hidden platform. C: Scheduling of the task:
the animals went trough two days of cue task, followed by 4 days of spatial learn ing (4 trials per day) and a probe
day. Each day represents a 24 hours delay between them (D1 to D7 ). D= day
80
2.6.5 Contextua l-Fear condit ioning
The hippocampus plays an important role in the representation of contextual
information in the contextual- fear conditioning paradigm ) (Phillips and LeDoux, 1992).
In this test, the mice are placed in a conditioning chamber and receive pairings of a
conditioned stimulus (contextual chamber) and an aversive unconditioned stimulus (an
electric foot-shock). After a time delay, the mice are re-exposed to the same
conditioning chamber without receiving any shock and the freezing response observed
in the mice expresses the memory association between the contextual stimulus and the
foot-shock.
Apparatus:
The CFC apparatus consisted in a cubic box (25cm L x25cm W, 25cm H) with
black methacrylate walls, a transparent frond door and a metallic floor with bars spaced
by 0,6 cm. The floor was connected to the electric shock generator and a control unit of
signal amplification (Startel and Fear System, BIOSEB Allcat Instruments, France). The
3 shocks delivered in the conditioning phase had duration of 2 seconds and an intensity
of 0.7mA. The light intensity was maintained at 5lux for all the procedure duration. The
signal generated by animal’s movement was analyzed using the automatic freezing
software Panlab V1.3 (BIOSEB Allcat Instruments, France). All the experiments were
video recorded using a camera connected to the top of the chamber. The chamber was
cleaned between animals with 70% ethanol, water and finally wiped with paper towels.
Procedure
The experiment was done in two days: 1) conditioning (D1), 2) retrieval (D2) as
illustrated in FIGURE 18.
1) Condtioning: The mouse was placed in the conditioning box. After exploring
for 2 minutes, the first shock was delivered, followed by the two other shocks, at an
inter-stimulus interval of 1 minute. One minute after the last shock, the mouse was
returned to his home cage. The animal’s activity was recorded.

81
2) Test: Twenty-four hours after the conditioning, the animal was placed in the
CFC box (same context as in the previous fear conditioning) for 5 minutes and no
shocks were delivered.
The activity generated by the testing mice in the box (high and low activities and
freezing) was recorded using the floor sensors and the video recording. The cumulated
freezing time (s) was measured across the time.
2.6.6 Eight-arm radia l maze
The radial maze was developed by Olton and Samuelson, 1976 and is used to
test working memory in rodents The protocol used in this study was adapted from
(Etchamendy et al., 2003) and based in a win-shift strategy to discriminate between two
arms-choice.
FIGURE 18. CO NTEXTUAL FEAR CONDITIO NING PROCEDURE.
Top table: The description of the protocol t imeline. At day 1 the animals went trough the conditioning
phase. Here, after a period of 2 minutes of habituation the animals (as seen in the scheme in the bottom)
received 3 shocks with a duration of 2 seconds and spaced by 1 minute inter-stimulus interval.

82
Apparatus:
The apparatus consisted in a black plexiglass 8-arm radial maze (Viewpoint,
Lyon, France). The maze was placed in an infrared floor and connected to a video
recording camera and tracking software (Videotrack/Viewpoint). Distal and proximal
extramaze cues were placed respectively on the walls of the room and above the
infrared floor (between the arms). The central platform (diameter of 24 cm) and 8 arms
(35cm L, 5cm W, 2cm H) which project radially outward were elevated 8 cm above the
floor (see diagram FIGURE 19). Each arm had a transparent Plexiglass door, placed
between the end of the arm and the central area that could be open and closed according
to the protocol. A metallic and weighted food cup was placed at the end of each arm and
maintained there for all the protocol. The maze was cleaned with water between each
trial and light intensity was set at 3.5 lux. The procedure was divided in 2 phases:
habituation (3 days) and training (n days until reach the criterion). For the whole
protocol course the animals were food deprivated to motivate the mice in getting the
food reward. Chocoloops ® (1/6 of the cereal ring) were used as food reward.
1) Food deprivation: Food deprivation started one day before the first day of the
protocol. Daily feeding was adapted to maintain the level of 90% of the initial body
weight. Water was provided ad libitum.
2) Habituation: In the habituation phase the test mouse was placed in the center
of the maze, with the 8 doors opened and allowed to explore the entire maze. The bait
was initially available throughout the maze, but was gradually restricted to the food cup.
Three food rewards (1 – 1 – 1) were placed in all the arms at day one, two rewards at
day 2 (0 – 1 – 1) and 1 reward at day 3 (0 – 0 – 1) placed only in the food cup to
incentive the mouse to go to the end of the arm (see FIGURE 19)
3) Training: The protocol for the training was based in a win-shift strategy. We
presented a sequence of 7 pairs of arms that was changed every day. The animal was
placed in the center platform with all the arms closed for 30s. A first baited arm was
opened while the other 7 arms were closed. After this first forced choice, the mouse had
to return to the center for another 30s. For trial 2, the old arm and a new consecutive or
non-consecutive (never more than 90° angle between the 2 arms) were open at the same
time, allowing the choice between two arms of the maze. The previous (old) arm was
this time unbaited while the new one was baited. When the animal went to an incorrect
arm this one was immediately closed after returning to the center to avoid perseverance

83
errors. If his first choice is the correct arm, the two arms were immediately closed after
returning to the center and the trial is ended. The animal had to wait 30s before the next
trial. The protocol was repeated for 6 more trials for a total of 8 trials per day. The
animal had to retain the rule that if, in a given arm, it won the reward, it had to shift the
other one. The sequence was changed every day and the training was stopped when the
control animals reached the criterion of having an average of 75% of correct choices for
2 consecutive days (5.25 correct choices out of 7).
FIGURE 19. RADIAL MAZE DIAGRAM AND PRO TOCOL TIMELINE
A: Radial maze apparatus and proximal and d istal cues. B: Mouse returning to the center after having collected
the reward from the arm. C: Protocol timeline. Food deprivation started one day before habituation. Then the
animals went through habituation for 3 days with the 8 arms open (white arms),and food was d istributed across
the arms from D1 to D3 as illustrated in the diagram. Following habituation the training started until the
criterion was reached. Each training day had 8 trials, with the sequence of open arms changed everyday (an
example of a sequence is illustarted in the figure).
2.6.7 Actimeter
We placed the animals in the actimeter (Imetronic Apparatus, Pessac, France)
for 3 consecutive days (72 hours). The animals had free access to food and water and a
12 hours light cycle. The actimeter box (20 cm L, 11 cm W, and 18 cm H - FIGURE 20)

84
was equipped with infrared sensors to detect locomotor activity (horizontal and vertical)
and an infrared plane to detect rearing. The data was collected by bins of 30 minutes.
FIGURE 20. ACTIMETER DIMENSIONS .
3. THERAPEUTIC EFFECT OF DRUG X IN DECREASING THE SPONTANEOUS
SEIZURES FREQUENCY IN SCN1A+/-
MOUSE MODEL
3.1 Drug X administrat ion
The Scn1a+/- -B6-129 mice were used for this study and the treatment started at
P21. Drug X (name cannot be disclosed) was prepared at a concentration of 15 mg/kg in
5% DMSO and 95% PBS. Drug X was intraperitoneally administrated at a volume of
5.5 ml/kg once a day for 5 days (in parallel to the SIH protocol).
3.2 Protocol of seizure induced by hyperthermia and monitoring
Six hours after drug X administration, DS mice were submitted to the SIH
protocol in order to increase the spontaneous seizure frequency. The protocol was
repeated for 5 consecutive days. The threshold temperature for seizure induction and the
seizure severity were measured. The animals were then grouped by 2 and video
recorded to analyze the presence of spontaneous seizures. The seizures were detected
with custom-made software designed by ULLO society (la Joliette) for this experiment.

85
4. STATISTICAL ANALYSIS
All the data analysis was obtained and analyzed blind to genotype. Statistical
analyses were performed with GraphPad Prism V6.01 (La Jolla, CA 92037 USA). The
normality of the data distribution was verified with Shapiro-Wilk’s test.
Differences between groups were measured using two-tailed t-test, one way
analysis of variance (ANOVA), two-way ANOVA (Genotype x Treatment) or repeated
measures ANOVA in the protocol of consecutive dependent variables ( i.e. Training
days/time x Group (genotype-treatment)). The ANOVA was followed by Tukey’s (3 or
more comparisions) or Sidak’s (2 comparisions) post hoc test. The one-sample t-test
was used to compare the time spent in the target zone and the chance level (25%) and
also to compare training performance and the chance level in the radial maze training
(chance level = 3.5 correct choice). Survival curves were compared with Log-rank
(Mantel-Cox) test and the analysis of the data concerning the SIH protocol was done
with Kruskal-Wallis test. Details of each value and statistical test used are described in
the statistic tables (VIII-1,0,VIII-3,VIII-4,VIII-5 page 185). Error bars represent s.e.m.
Null hypotheses were rejected at the 0.05 level. Statistical significances are represented
by the following P-values in all figures: * p<0.05; ** p<0.01; ***, p<0.001;
****p<0.0001 and n=number of animals, n=number of fields for field electrophysiology
recordings, n=number of cells for patch clamp recordings.

86

87
Results

88
89
IV- RESULTS
Chapter 1- PHENOTYPIC CHARACTERIZATION OF SCN1A+/-
(DS MODEL)
1. SCN1A+/-
(DS MOUSE MODEL) IN 129 BACKGROUND (SCN1A+/--129)
The Scn1a+/--129 mouse, model of DS, is characterized as described previously,
with high variability of phenotypes according to the genetic background (Yu et al.,
2006a). Because of that, the model we chose preferentially was the Scn1a+/- in 129/SvJ
background, which present the mild phenotype (high survival and no spontaneous
seizures). We first wanted to see if the Scn1a+/- mutation per se affects the behavioral
phenotype. With the first littermates obtained, we behaviorally characterized the control
WT and mutant animals (this chapter). After getting the first results we could not get
enough animals to continue and validate the experiments. We decided to start breeding
the mutant line in a different background in order to increase the reproducibility. We
crossed the Scn1a+/--129 male with a C57BL/6 female to get the F1 generation of a 50%
B6:129 mice and increase the colony (results presented in the 2nd part of this chapter).
1.1 The Scn1a+/- mouse in 129 background show normal spatial
learning and memory in the Morris water maze task
We submitted the Scn1a+/--129 mice and littermate controls to the MWM task.
One of the most described cognitive perturbation in DS patients is the inability to
integrate visual-motor and visual-spatial information (Chieffo et al., 2011a; Ragona et
al., 2011b; Wolff et al., 2006a). It is believed that the visual function is affected before
the cognitive problems. In the cue task phase, ran to decipher visual and motor
problems the two groups showed a significant decrease in latency to find the platform
from day D1 to D2 with no difference in the average between the groups (RM-two way
ANOVA, main effect of Day). These first results allowed us to conclude that the
Scn1a+/--129 had no major visual or motor dysfunctions. Following the cue task, the cue
above the platform was removed and the animals had to learn the hidden platform
location based on the spatial extra-maze cues. The Scn1a+/--129 mice and the WT
controls showed no amelioration in learning performance from D1 to D2. However, the

90
latency significantly decreased from D2 to D3 (FIGURE 21). After D2, we could
conclude that this amelioration indicated that the two groups learnt the platform
emplacement (RM-two way ANOVA, main effect of Day). In line with the learning
curve results, when removed the platform 24 hours following the training end, the two
groups of mice persisted higher than chance in searching the platform in the target
quadrant (where the hidden platform has been positioned during training) than in the
other 3 quadrants (left, target, right, opposite) (FIGURE 21). The RM-two way ANOVA
showed a Quadrant x Genotype interaction with a significant main effect of quadrant,
and the Sidak’s post-hoc analysis revealed a better performance of the Scn1a+/--129
mice than the WT mice in the probe test because the persistence of the Scn1a+/--129
mice in the 60s probe is mainly focused in the target quadrant (presence in target
quadrant is significantly higher than in the 3 other quadrants: left, right, opposite) while
the WT animals could not significantly discriminate between the left and target
quadrants. With these results, we concluded that the spatial learning was preserved in
the Scn1a+/--129 mice and that both groups remembered the platform emplacement
though in the probe test, the memory strength was higher in Scn1a+/--129 mice.
FIGURE 21. SCN1A
+/- MICE IN 129 BACKGROUND SHOW PRESERVED SPATIAL LEARNING AND MEMO RY
IN THE MWM TASK.
A: Latency to findthe platform in the cue task (days 1&2) and train ing (days 1-4). B: Percentage of
presence in the four quadrants (left, target, right, opposite) in the probe test, 24 hours after the train ing
ended. *p<0.05; ***p<0.001, n=number of an imals
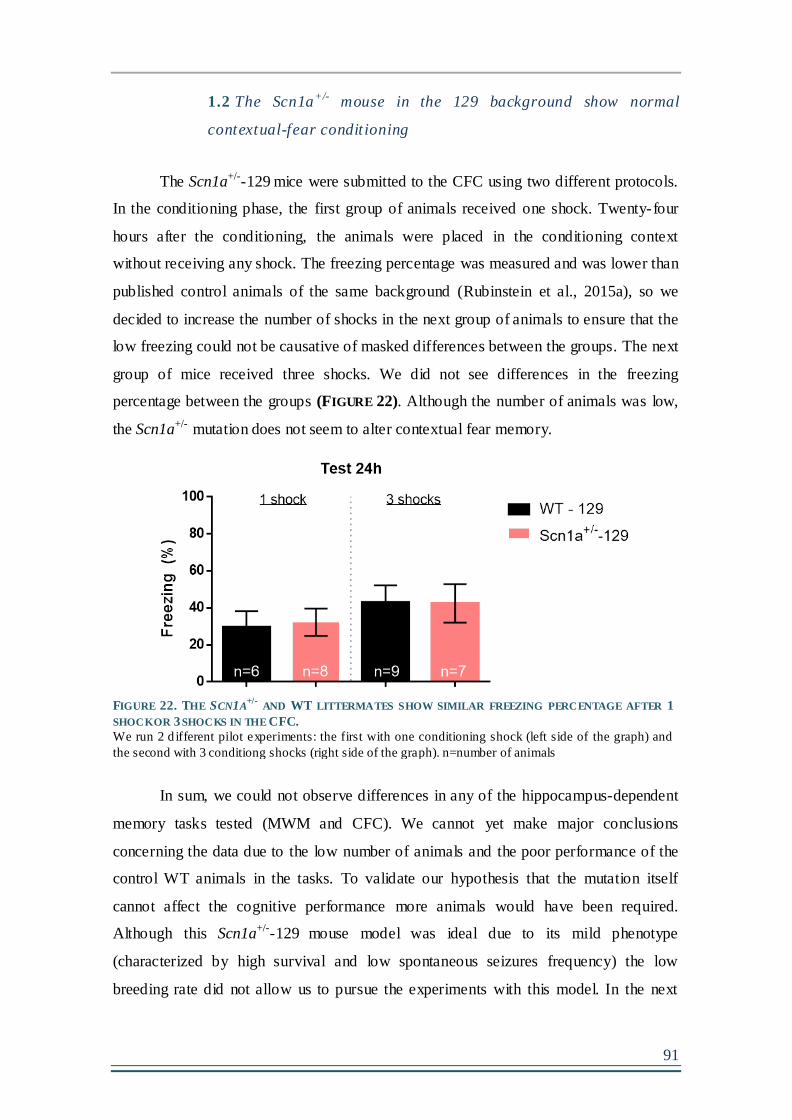
91
1.2 The Scn1a+/- mouse in the 129 background show normal
contextual-fear condit ioning
The Scn1a+/--129 mice were submitted to the CFC using two different protocols.
In the conditioning phase, the first group of animals received one shock. Twenty-four
hours after the conditioning, the animals were placed in the conditioning context
without receiving any shock. The freezing percentage was measured and was lower than
published control animals of the same background (Rubinstein et al., 2015a), so we
decided to increase the number of shocks in the next group of animals to ensure that the
low freezing could not be causative of masked differences between the groups. The next
group of mice received three shocks. We did not see differences in the freezing
percentage between the groups (FIGURE 22). Although the number of animals was low,
the Scn1a+/- mutation does not seem to alter contextual fear memory.
FIGURE 22. THE SCN1A
+/- AND WT LITTERMATES SHOW SIMILAR FREEZING PERCENTAGE AFTER 1
SHOCK OR 3 SHOCKS IN THE CFC.
We run 2 d ifferent pilot experiments: the first with one conditioning shock (left side of the graph) and
the second with 3 conditiong shocks (right side of the graph). n=number of animals
In sum, we could not observe differences in any of the hippocampus-dependent
memory tasks tested (MWM and CFC). We cannot yet make major conclusions
concerning the data due to the low number of animals and the poor performance of the
control WT animals in the tasks. To validate our hypothesis that the mutation itself
cannot affect the cognitive performance more animals would have been required.
Although this Scn1a+/--129 mouse model was ideal due to its mild phenotype
(characterized by high survival and low spontaneous seizures frequency) the low
breeding rate did not allow us to pursue the experiments with this model. In the next
92
paragraphs I will present the first preliminary results we obtained in this model. We
therefore decided to cross the Scn1a+/--129 mutant mouse with a C57BL/6J female and
use the F1 generation of the Scn1a+/- B6:129 mice (50% B6, 50% 129). In the next
paragraphs, I will present the results obtained with this Scn1a+/- B6:129 mice.
2. SCN1A+/-
(DS MOUSE MODEL) IN B6:129 BACKGROUND
The Scn1a+/- -B6:129 showed 100% survival from P0 to P90 if not submitted to
SIH (data not shown). We continued our investigation about the effect of the mutation
per se in affecting the phenotype. As the number of animals was sufficient, we ran
different behavioral and cognitive tasks.
2.1 The Scn1a+/--B6:129 mouse display normal act iv ity in the
openfield
After 10 minutes in the openfield, the automatic analysis allowed to us to
evaluate some parameters. For locomotor activity, the distance travelled and average
speeds were measured. The Scn1a+/--B6:129 mice had the same locomotor profile as the
WT-control (FIGURE 23A&B) suggesting that the mutation per se did not cause
changes in this parameter. The anxiety level was quantified by counting the time the test
mouse spent in the center of the openfield. The two groups spent similar time in the
center, suggesting again no changes in the anxiety profile induced by the mutation
(FIGURE 23 C).

93
FIGURE 23. SCN1A
+/--B6:129 MICE HAVE NORMAL ACTIVITY AND ANXIETY IN TH E OPENFIELD.
A: Distance travelled (m) in the openfield. B: Average speed (m/s). C: Time in the center area of the
openfield. n=number of animals.
2.2 The Scn1a+/--B6:129 have normal circadian rhythm and
act iv ity
The activity of Scn1a+/--B6:129 mice was normal in the openfield. However it
was previously reported that mice carrying the Scn1a mutation in the pure C57BL/6
background had sleep disturbances and exhibited increased activity (Han et al., 2012a;
Ito et al., 2013; Papale et al., 2013). To further confirm our results from the open field
and study the circadian rhythm and activity in the Scn1a+/--B6:129 mice, we placed the
animals in the actimeter for 72 consecutive hours.
The RM-two way ANOVA revealed a significant main effect o f Time for both
horizontal and vertical activities. This is clear in FIGURE 24A&B as the WT and
Scn1a+/--B6:129 mice present a preserved circadian cycle with low activity during the
light/resting phase and high activity during the dark/active phase, but no differences
between them were pointed by the post-hoc analysis. The increased activity reported in
previous studies (Han et al., 2012a; Ito et al., 2013; Papale et al., 2013), was not
observed in the Scn1a+/--B6:129, thus indicating that the mutation per se is not
responsible for the hyperactivity in the model.

94
FIGURE 24. SCN1A
+/--B6:129 MICE HAVE NORMAL CIRCADIAN ACTIVITY IN THE ACTIMETER .
A: Total horizontal activity for 72 consecutive hours. B: Total vertical activ ity (rearing episodes) for 72
consecutive hours. The timeline in g ray represents the dark phase (20h00 to 8h00). n=number of animals .
2.3 The Scn1a+/--B6:129 mouse have preserved social interact ion
sk ills
Social interaction skills are affected in Dravet Syndrome patients (Berkvens et
al., 2015; Olivieri et al., 2016). Also Han et al., 2012b and Ito et al., 2013 reported
severe social skill perturbations in Scn1a+/- mouse model in the pure C57BL/6
background, which exhibits a severe phenotype (high mortality, high spontaneous
seizures frequency). One day after the openfield test, the mice were tested for social
interaction skills in the three-chambered test. Before starting, the habituation trial was
run in order to detect if there was a preference for one of the chambers that could
interfere with the results. The two groups explored equally the two chambers (1 and 2)
being slightly longer time in the center (RM-Two way ANOVA, main Chamber effect)
(FIGURE 25 C). Confirming normal locomotor activity, the WT and mutant animals
presented similar average speed and distance travelled during the habituation phase
(FIGURE 25 A&B). In the sociability phase, the test mouse had to choose between an
unfamiliar mouse and the empty cage. A normal mouse is expected to interact
preferentially with the mouse than with the empty cage, though the WT showed an
important preference for the mouse, none of the groups significantly discriminate
between the two (FIGURE 25D) (RM-Two-way ANOVA, the Genotype effect is very
close to reach statistical significance but did not, and there is no Cage effect). We would
need to increase the number of animals to understand if the test was working for the

95
controls. In the next phase however, the two way ANOVA revealed a significant main
effect of cage and Tuckey’s post-hoc analysis showed that the two groups displayed
higher preference for the new mouse than the familiar mouse as expected (FIGURE
25E). We see that the empty cage and the mouse are not significantly discriminated,
anticipating sociability problems in the Nav 1.1 KO mice, however as the control
animals did not significantly discriminate the two cages very well, it does not allow us
to conclude for the impairment. A 2nd cohort of animals would allow us to conclude
about the validity of the test. In the second phase, both groups preferred the social
novelty than the social familiarity suggesting normal sociability skills in the Scn1a+/--
B6:129 mice.
FIGURE 25. SCN1A
+/--B6:129 MICE SHOW NORMAL ACTIVITY IN THE HABITUATIO N PHASE (A&B). TH E
SOCIAL PREFERENCE WAS NO T STRONG IN THE SOCIABILITY PHASE FO R THE WT AND SCN1A+/-
-B6:129
MICE, BUT REACHED SIGNIFICANCE FOR THE SOCIAL NOVELTY PREFERENCE IN THE SECOND PHASE
(D)
A,B&C Habituation phase: A: Average speed (m/s). B: Distance travelled (m). C: Time in the 3
chambers (s). D: Sociab ility phase: interaction time with the empty cage (EC) or the mouse (M). E:
Social novelty phase: time interacting with the familiar mouse (fM) or the novel mouse (nM). *p<0.05;
**<0.01;n=number of animals

96
2.4 The Scn1a+/--B6:129 express normal spatial memory
In this Scn1a+/--B6:129 mouse model, we went further in the behavior
characterization and assessed spatial memory in the MWM as described earlier. The
results illustrated in FIGURE 26 demonstrate that mice carrying the Scn1a+/- gene
mutation in the B6:129 background exhibit normal spatial learning and memory. In the
cue task, as we had observed for the 129/SvJ background, the two groups significantly
decreased their latencies from cue task D1 to cue task D2 being in the last day at a
latency lower than 5 seconds (RM-Two way ANOVA, main effect of cue task day).
Similarly, the training for spatial memory was achieved with success by the two groups
of animals (RM-Two way ANOVA, main effect of training day) (FIGURE 26 A). A
significant increase in performance was observed from training D1 to D2, suggesting
that the two groups learnt the platform location. Twenty-four hours after the end of the
training, the platform was removed and the long-term memory strength was measured.
Considering that the WT and Scn1a+/- mice swam persistently in the target quadrant
(FIGURE 26B RIGHT) where the hidden platform was normally located (higher than
chance), it was interesting to see that while the WT animals significantly discriminate
the target quadrant the Scn1a+/- mice did not show a preference between target and right
quadrants (RM-Two way ANOVA, main effect of quadrant) (FIGURE 26B RIGHT). The
same number of platform zone crosses again confirmed that both groups had preserved
spatial learning and memory in the MWM task (FIGURE 26B LEFT).
FIGURE 26. SCN1A
+/--B6:129 DISPLAY NORMAL LEARNING AND MEMO RY IN THE MWM TASK.
A: Average of the four trials latencies to find the platform in the cue task and training. In the cue task, the
platform is visible, while in the training the platform is hidden. B (left): 24 hours after training complet ion
the platform is removed and the persistance in the four quandrants of the MWM is measured. The target
quadrant (where the platform was located) is highlited with a different pattern. The persistence in the t arget
quadrant is compared to chance level (gray line) B (right): Number of crosses in the en larged p latform zone
were measured. **p<0.01;n=number of an imals.

97
2.5 The Scn1a+/--B6:129 display normal contextual-fear memory
The contextual fear conditioning was done in order to confirm that hippocampus-
dependent memories are preserved in the Scn1a+/- model. Twenty-four hours after
receiving three electric shocks, the animals were placed in the conditioning context. The
total freezing time over the 5 minutes of testing was counted and, as shown in FIGURE 27,
the two groups exhibited similar freezing behaviors, suggesting that the contextual- fear
memory is preserved.
FIGURE 27. THE SCN1A
+/--B6:129 MICE HAVE NORMAL CO NTEXTUAL-FEAR MEMO RY.
Freezing percentage showed during the 5 minutes test, 24 hours after the conditioning when replaced in the
same context. N=number of an imals.
Combining the two behavioral tasks that assessed hippocampus function, we
conclude that the heterozygous NaV1.1 loss of function cannot per se affect spatial
memory.
2.6 The Scn1a+/--B6:129 show normal work ing memory
DS patients were previously reported to display important working memory
deficits (Chieffo et al., 2011a; Ragona et al., 2011b). After food deprivation, we trained
the animals to learn the working memory rule in the radial maze. There were 7 trials per
day and the learning criterion was achieved when the animals had 75% of correct
choices (5.25) for two consecutive days. The RM-Two way ANOVA showed a
significant main effect of training day but no Training Day x genotype interaction. The

98
Sidak’s post-hoc analysis confirmed that the mutation per se was not inducing
differences between the 2 genotypes. The number of correct choices analysis showed
that the WT control animals passed the criterion at training D12 and the mutant animals
at training D11. Similarly, the WT controls behaved better than chance level from D8 to
the end while mutant animals were already better than chance at D7 (FIGURE 28). This
indicates that all mice learned the 8-arm radial maze rule, and that the mutants with
heterozygous loss of Scn1a gene showed no deficits in working memory compared with
WT mice.
FIGURE 28. WT AND SCN1A
+/--B6:129 MICE SHOWED PRESERVED WORKING MEMORY IN THE EIGHT-
ARM RADIAL MAZE.
The animals were trained in the radial maze to learn the working memory rule for n training days until
the criterion was reached. The chance level was 3.5 correct choices (gray line) and the criterion was 5.25
correct choices (burgundy line). The controls reached the criterion at train ing day 11. The statistical
difference from chance level is represented. **p<0.01;***p<0.001; D=training day, n=number of
animals
All together the data on the Scn1a+/- (DS mouse model) in the mixed B6:129
background indicates that DS mice present a similar cognitive phenotype to the WT,
strongly suggesting that the cognitive impairment is not related to the mutation per se.

99
Chapter 2- SEIZURES INDUCTION BY HYPERTHERMIA (SIH) IN SCN1A+/--B6:129 AND
SCN1ARH/+-129:B6 MOUSE MODELS
We wanted to induce seizures using hyperthermia at early age (developing brain)
in Scn1a+/- mutant mice to study the long-term effects in adulthood. The first febrile
seizure in Dravet patients occur at around 4-6 months of age (Chieffo et al., 2011a), and
in Scn1a+/- mutant mice with pure C57BL/6 background at P10 (Yu et al., 2006a). It has
been described previously that rat brain development at P10-15 might correspond to the
age at which human infants are most susceptible to febrile seizures (Dobbing and Sands,
1973). The corresponding age of the mouse brain is not clear (Andreollo et al., 2012;
Quinn, 2005; Romijn et al., 1991) but the data tend more to the hypothesis that a rodent
at P15 corresponds to one year of age in humans. As WT pups present SIH from P11-17
we wanted to use animals elder than this age to avoid WT animals submitted to
hyperthermia to have seizures (Hjeresen and Diaz, 1988).
SIH have been acutely induced in Scn1a mutant models (Cheah et al., 2012;
Martin et al., 2010b; Oakley et al., 2009a; Sawyer et al., 2016), but never chronically.
We were therefore confronted with an important range of optimizations to the protocol.
Our first question concerned the number of seizures that we should induce in the mice.
Dravet patients can have more than 30 seizures for a period of 1 month in average but
can have more than one seizure per day (Takayama et al., 2014). We first decided to
induce 2 seizures per day for 10 days. The high level of mortality, rapidly persuade us
to decrease the number of seizures previously established. We thus decided to induce
only one seizure per day for 10 days. The next troubles concerned the technical method
employed. Previous SIH were provoked using a red lamp heating, in a transparent
cylinder and the temperature was controlled by a mouse rectal probe connected to a
thermocouple (Oakley et al., 2009a). With the chronicity of the protocol, the mice
suffered from some injuries caused by the red lamp (i.e. burning of the tail and ears) and
we had to adapt the protocol by using a small incubator to cause hyperthermia.
Following all these adaptions we started the SIH protocol.
100
1. SCN1A+/--B6:129 PRESENT HIGH SEIZURE SEVERITY AND HIGH MORTALITY
DURING THE 10-DAYS PROTOCOL OF SEIZURES INDUCTION.
After confirming that the heterozygous loss of function of the Scn1a gene did
not seem to induce cognitive problems in this genetic background, our next goal was to
induce seizures by hyperthermia in this model. We observed that the survival
percentage of the Scn1a+/--B6:129 mice was 100% at post natal week 16 (data not
shown). We induced one seizure per day by hyperthermia for 10 days. The percentage
of mice alive after 10 days was 100% for control non-hyperthermia animals (WT-
B6:129 control and Scn1a+/--B6:129 control) (this animals underwent the same handling
procedure but no hyperthermia), 72.72% in WT-B6:129 animals submitted to
hyperthermia (WT B6:129 HYP) (WT mice, submitted to hyperthermia but did not
present seizures) and 36.76% for Scn1a+/--B6:129 mice (FIGURE 29 A). All the Scn1a+/-
mice presented seizures when submitted to hyperthermia and the seizures last usually
lower than 1 minute (short-lasting or simple hyperthermic seizures). The temperature
required to induce seizures at protocol day 1 (41.17±0.106ºC), FIGURE 29 B, was higher
than reported previously in mouse models with the same mutation (Scn1a+/--129,
Scn1a+/--B6, Scn1a+/--129:B6) (Kalume et al., 2007a; Oakley et al., 2009a; Rubinstein et
al., 2015a). When increasing the temperature to induce seizures in the incubator, the
animals were immediately removed after the appearance of the first behavioral signs of
a seizure (i.e. staring, head nodding and myoclonic jerks (grade 1-4) see TABLE 11 in
material and methods). At D1 the majority of the animals presented a clonic seizure
with a tonic component characterized by forelimb clonus with rearing and failing that
indicates forebrain activation and the beginning of the seizures spreading from forebrain
to brainstem. On the following days, the seizure severity significantly increased to GTC
seizures indicating that the seizure had reached the brainstem, and was maintained at the
same level for the following days (FIGURE 29C).
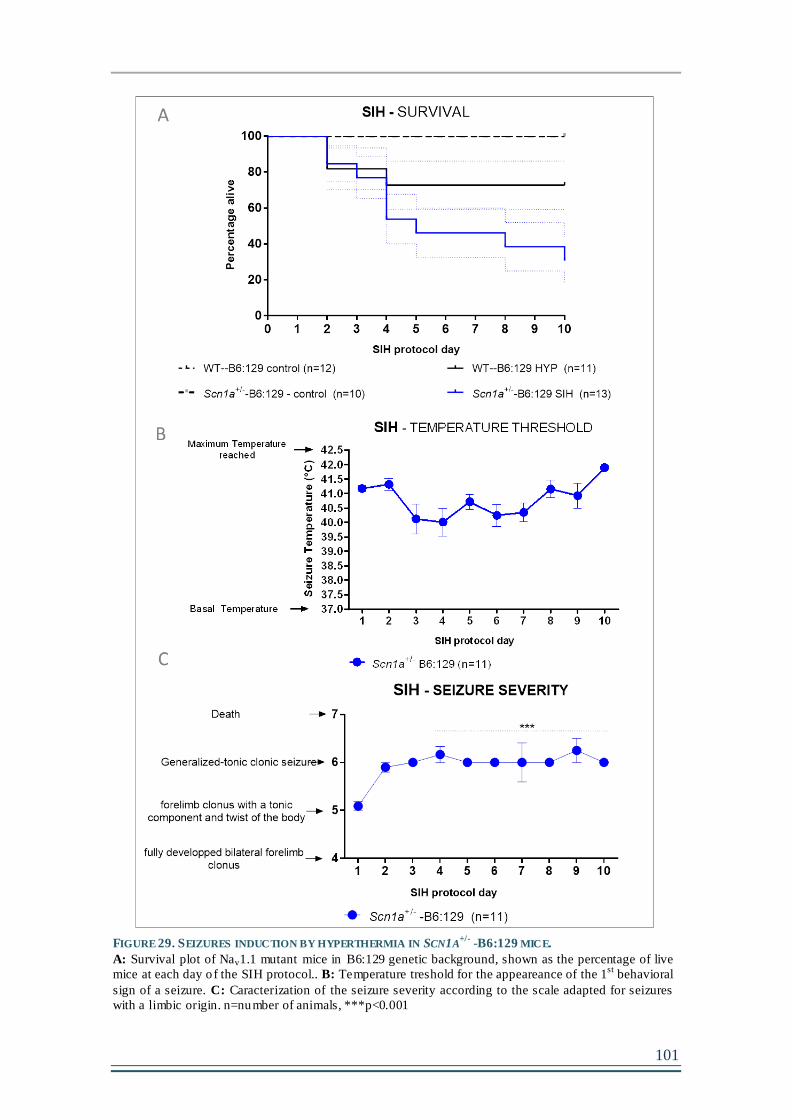
101
FIGURE 29. SEIZURES INDUCTION BY HYPERTHERMIA IN SCN1A
+/- -B6:129 MICE.
A: Survival plot of Nav1.1 mutant mice in B6:129 genetic background, shown as the percentage of live
mice at each day of the SIH protocol.. B: Temperature treshold for the appeareance of the 1st
behavioral
sign of a seizure. C: Caracterization of the seizure severity according to the scale adapted for seizures
with a limbic origin. n=number of animals, ***p<0.001

102
Due to the high level of mortality observed by Scn1a+/- mouse in B6:129
background after SIH, we could not obtain a sufficient number of mice to perform
behavioral tasks to test the effect of seizures on cognitive phenotype. As previously
described, the NaV1.1 channel phenotypic spectrum is large and while truncating
mutations are usually associated to the most severe phenotypes as DS, missense
mutations are described to confer the higher variability of the spectrum (Volkers et al.,
2011). Although missense mutations have been found preferentially in GEFS+ patients
they also cause DS (Escayg and Goldin, 2010), i.e. the R1648H missense mutation that
was originally found in two families with GEFS+ spectrum (Escayg et al., 2000a) was
present in one DS patient (Depienne et al., 2010). Thus, the R1648H mutation had
clinical relevance in GEFS+ and DS diseases.
We then decided to use the KI Scn1aRH/+ mouse, model of GEFS+, having the
heterozygous R1648H missense mutation (available in the laboratory). It was a good
alternative because, the Scn1aRH/+ mouse, created by Martin et al., 2010 present a mild
phenotype and almost no spontaneous seizures in the described pure C57BL/6
background. Moreover, these mice are sensitive to SIH so we could induce our protocol
as previously done in the Scn1a+/- mutant. Similar to Scn1a+/- mouse, (KO model) the
homozygous mutation is lethal in the Scn1a-/- mice. The Scn1aRH/+ model was available
in the pure C57BL/6 in the laboratory. To maintain the mixed background as in the
previous Scn1a+/- line, the Scn1aRH/+ male in the pure C57BL/6 background was crossed
with a 129/SvJ WT female and all the experiments were continued in this Scn1aRH/+ -
129:B6 model.
2. SIH PROTOCOL IN SCN1ARH/+ -129:B6
MOUSE
The SIH protocol was successful in the Scn1aRH/+ mutant. As described
previously in material and methods, there are 4 groups in this study. The WT and
Scn1aRH/+ control groups that underwent the same handling protocol but without
hyperthermia were used to evaluate the effect of the Scn1aRH/+ mutation per se. The WT
HYP mice were WT littermates that were submitted to the hyperthermia protocol (up to
42°C) but did not display seizures and were used to evaluate the effect of hyperthermia
per se when compared to WT control animals. Finally the Scn1aRH/+ SIH group was
analysed to evaluate the effect of the seizures in the mutant mice. At SIH protocol day
10 the percentage of Scn1aRH/+-129:B6 mice alive was 65.07%, while 92.06% for WT-

103
129:B6 HYP and 100% for WT-129:B6 and Scn1aRH/+-129:B6 control animals (FIGURE
30A). The Scn1aRH/+ mice presented seizures when submitted to hyperthermia and the
seizures last usually lower than 1 minute (short-lasting or simple hyperthermic
seizures). The temperature threshold to induce seizure at day 1 was 41.63±0.04 and
significantly increased at day 2 and 3 indicating an adaptive compensation in response
of the SIH. Passed day 3, the animals returned to temperature thresholds similar to day 1
for the following days (FIGURE 30 B). The seizure severity started at grade 5 for the
first day, meaning that the animals were having forelimb clonus with a tonic component
(rearing) and twist of the body (failing) – seizure with origin in the forebrain but
spreading to brainstem. The severity was increasing across the days (FIGURE 30 C). By
day 4, the majority of the animals were displaying GTC seizures (grade 6) indicating
that the seizure was involving to the brainstem structures (FIGURE 30 C).

104
FIGURE 30. SEIZURES INDUCTION BY HYPERTH ERMIA (SIH) IN SCN1A
RH/+-129:B6 MICE.
A: Percentage of mice alive during the 10-days of seizures induction by hyperthermia. B: Temperature
treshold for the appeareance of the 1st
behavioral sign of a seizure. C: Characterization of the seizure
severity according to the scale adapted for s eizures that resultt from the disruption of the GABAergic
system . n=number of animals, ***p<0.001

105
Chapter 3- LONG-TERM EFFECTS OF THE 10-DAYS SEIZURES INDUCTION BY
HYPERTHERMIA PROTOCOL IN SCN1ARH/+-129:B6 MICE.
Due to the reasonable reproduction and resistance of the Scn1aRH/+ -129:B6
mouse (GEFS+ model) to the SIH, we decided to pursue our research using this mutant
mouse and thus answer our main question i.e if seizures can worsen epileptic and
cognitive phenotypes in mouse models carrying the Scn1a gene mutation.
1. SIH WORSEN THE EPILEPTIC PHENOTYPE IN SCN1ARH/+-129:B6 MUTANT
MOUSE
It was previously reported that Scn1aRH/+ in C57BL/6J background present very
low level of spontaneous seizure activity (Martin et al., 2010b). We wanted to test if it
was the case for our animals that should exhibit even milder phenotype introduced by
the 129/SvJ background, as previously reported for other Scn1a mutants (Rubinstein et
al., 2015a; Yu et al., 2006a). For this we induced seizures by hyperthermia for 10 days
on the Scn1aRH/+-129:B6 mice, as reported in the previous chapter. The animals were
implanted with the 5 ECoG electrodes (FIGURE 31A) on the day following the last day
of the protocol. Two days after the surgery, the animals were connected to the ECoG
recording cables and recorded in time windows of three days during 2 months. The
analysis of the ECoG signal was done simply by quantifying the number of GTC
spontaneous seizures as illustrated in FIGURE 31B. We are conscious that a more
profound analysis of the signal would a revealed more events and we plan to perform
this analysis in due course.
FIGURE 31C shows the results obtained. We did not observe any spontaneous
GTC seizure in the Scn1aRH/+-129:B6 control mice during the period tested. It is
possible that they exhibited more subtle ECoG alterations that we did not observe using
our analysis method. However, it was clear that the SIH increased seizure frequency in
the mutant animals. We observed the appearance of 0.5 to 1 seizure in average per day
and per animal. We thus conclude that by inducing seizures for 10 days in the
Scn1aRH/+-129:B6 model that normally presented no (or very low) epileptic history, we
could convert its phenotype into a severe epileptic model.

106
FIGURE 31. SIH PRO TOCOL WORSENS THE EPILEPTIC PHENO TYPE IN SCN1A
RH/+-129:B6
MUTANT MICE.
A: Position of the elctrods implantation. B: ECoG signal showing a spontaneous GTC seizure, scale bars
2mV, 2.5s. C: Spontaneous seizures frequency recorded two days following the last day of SIH
(represented with the orange arrow) in Scn1aRH/+
-129:B6 mice after 10 days of SIH compared to control
WT-129:B6 and Scn1aRH/+
-129:B6 and WT-129:B6 HYP mice. LF (Feft frontal), RF (right frontal), LO
(Left occip ital) RO (right occipital), Ref: Reference electrode. N=number of animals.
2. CELLULAR AND MOLECULAR ALTERATIONS IN HIPPOCAMPUS AFTER SIH IN
SCN1ARH/+-129:B6 MOUSE MODEL
After successfully inducing the protocol of SIH, we wanted to first understand if
important cellular and molecular rearrangements had occurred during the post-SIH
resting time.
2.1 Cytoarchitecture is preserved after seizures in Scn1aRH/+ mice
in the hippocampus
We first explored if seizures could induce neuronal damage and important
cytoarchitecture changes. We induced seizures using the SIH protocol as described
previously and allowed the animals to rest until they reached P60. The brains were then
fixed, sliced and stained with Nissl and NeuN antibodies to evaluate neuronal integrity

107
and organization. The hippocampal formation receives the major excitatory input from
the entorhinal cortex via the perforant path to primarily terminate in the dentate gyrus.
Dentate axons, the mossy fibers, project to the CA3 region and from there the Schaffer
collaterals convey the processed input to the CA1 area. Thus, the dentate gyrus operates
as a gate at the entrance to the hippocampus, filtering incoming excitation from the
entorhinal cortex (Acsády and Káli, 2007; Henze et al., 2002). In other Scn1a mouse
models the hippocampus has been shown to participate in the seizure onset (Liautard et
al., 2013; Ohno et al., 2011) and it is also of major importance in memory processing
(Neves et al., 2008). Therefore, it is conceivable to speculate that seizures induction in a
mouse model carrying a Scn1aRH/+ mutation causes cellular alterations within the
hippocampus. However, the neuropathological evaluations (Nissl and NeuN staining)
showed no major cytoarchitecture modifications in the hippocampus of Scn1aRH/+-
129:B6 mice after the protocol of seizure induction.
FIGURE 32. SIH DO NO T INDUCE IMPORTANT CYTOARCHITECTURE CHANGES IN THE HIPPOCAMPUS IN
SCN1ARH/+
-129:B6 MUTANT MICE.
A,B: Photomicrographs illustrating Nissl staining in Scn1aRH/+
-129:B6 control and SIH mice. C,D: NeuN
immunolabelling in Scn1aRH/+
-129:B6 control and SIH mice and amplified to the dentate gyrus in E,F.

108
In conclusion, the seizures did not induce gross cytoarchitecture changes in the
hippocampus in the Scn1aRH/+129:B6, suggesting that the SIH did not induce major
neuronal death unlike other models of epilepsy (kainite, pilocarpine) (Kang et al., 2015;
Kim et al., 2011, 2015; Wang et al., 2015). The results are therefore in line with what
was observed in the Scn1a+/- mouse model in pure C57BL/6 background that present
high spontaneous seizure activity but no neuronal death (Yu et al., 2006a).
2.2 Long-term synaptic plast icity is maintained but not short -term
synaptic plast icity in the CA1 region of the hippocampus after SIH
in Scn1aRH/+129:B6 mice
Long-term potentiation (LTP) has been described to underlie the synaptic basis
of learning and memory in the hippocampus (Bliss and Collingridge, 1993; Morris et
al., 1986; Whitlock et al., 2006). We tested whether the SIH protocol affected the ability
of the CA1 neurons of the hippocampus to potentiate and maintain an LTP after a strong
stimulus. After inducing seizures at P21, we sacrificed the animals at P60 and evaluated
their synaptic properties in hippocampal slices. FIGURE 33A shows LTP of the field
excitatory post-synaptic potentials recorded at the CA3 to CA1 synapse. After obtaining
a stable baseline, averaged at 100%, a pulse of 100 Hz/1s was given to induce an LTP.
The immediate response (1st 2 minutes), reflecting post-tetanic potentiation, was
significantly increased in Scn1aRH/+-129:B6 mice submitted to SIH when compared to
the 3 control groups. LTP was maintained after 60 minutes post- induction. The four
groups showed similar LTPs with no changes in the LTP averages when measured
during the last 15 minutes of the recording (FIGURE 33B). However, using this
induction protocol (1 pulse at 100Hz/1s), the LTP obtained was not very strong (~115%
in control WT-129:B6 animals). We thus decided to induce LTP with a stronger
protocol (4 pulses of 100Hz/1s with 5 minutes inter stimulus interval (ISI)) to see if all
the groups could equally respond to a stronger stimulus. As shown in FIGURE 33C&D,
the LTP was higher (~150% in control WT-129:B6 animals) as compared to FIGURE
33A&B with the stronger protocol. Yet, also with this protocol, all the groups displayed
the same average LTP of fEPSP in the last 15 minutes of the recording. The increase in
the immediate response (post-tetanic potentiation) after LTP induction was not observed
this time, possibly due to the saturation after 20 minutes of the 1st induction pulse. As
alterations in post-tetanic potentiation is generally due to functional alterations at the

109
pre-synapse (Balakrishnan et al., 2010; Colino et al., 2002; Voronin, 1982), we decided
to also study paired-pulse facilitation, a measure of pre-synaptic plasticity (Zucker and
Regehr, 2002). The fEPSP were evoked at different short ISI in order to study the pre-
synaptic release facilitation. As expected, the PPR (quantified as the peak amplitude of
the 2nd response divided by the 1st) decreases with the increase of the ISI in all groups.
Interestingly, we observed an increase in the PPR at different ISI (150, 250, 300, 350,
400 ms) suggesting that SIH in Scn1aRH/+-129:B6 mice might alter the release
probability of the presynaptic neuron.
With these data we can conclude that SIH does not affect the LTP in CA1. We
planned to test the LTP in the dentate gyrus (DG) that acts as first gatekeeper of the
hippocampus (Acsády and Káli, 2007; Amaral et al., 2007; Treves et al., 2008), and has
been stressed to have major importance in epiloptogenesis studies (reviewed in Dudek
and Sutula, 2007). Also, Cheah et al., 2012 and Tsai et al., 2015 reported a higher
reduction of NaV 1.1 protein in the DG than in CA1 or CA3 areas of the hippocampus in
Scn1a mutant mice, and altered functional an structural properties of the DG region of
the hippocampus (Tsai et al., 2015). According to previous results from the laboratory,
reliable induction of LTP in the DG requires blocking the inhibitory function (Houeland
et al., 2010). We could indeed obtain LTP in the DG using the GABAergic blocker
picrotoxin (data not shown). Yet, this poised a conceptual problem regarding its use in
the context of the Scn1a gene mice. Indeed, Nav 1.1 channel’s mutations mainly affect
GABAergic neurons (Yu et al., 2006a), and the . It would thus have been more
appropriate to avoid blocking GABAergic function during the study of this mo use
model. Unfortunately, we could not obtain LTP in WT mice without picrotoxin leading
us to give up on this experiment (data not shown).

110
FIGURE 33. SHORT-TERM PRE-SYNAPTIC BUT NO T LONG-TERM POST-SYNAPTIC PLASTICITY IN CA1
REGION O F THE HIPPOCAMPUS IS ALTERED IN SCN1ARH/+
129:B6 MICE.
Long-term plasticity : A,B: LTP of fEPSP induced with one pulse of h igh-frequency stimulation at
100Hz/1s (orange arrow). B: Average of the last 15 minutes as % of baseline, from 45 minutes to 60
after LTP induction. C: LTP of fEPSP indcued with four pulses of high-frequency stimulat ion at
100Hz/1s with 5 min ISI (orange arrow). D: Average of the last 15 minutes as % of baseline, from 45
minutes to 60 after LTP induction. E: Short-term pre-synaptic plasticity. E: Paired-pulse rat io (P2/P1) at
different inter-stimulus intervals. Statistical significance is represented in vio let for difference between
Scn1aRH/+
control and SIH mice and in b lack for differences between Scn1aRH/+
SIH mice and WT-HYP.
* p<0.05; **p<0.01; ***p<0.001

111
2.3 Scn1aRH/+ mice show an increase in f iring frequency in
granular cells in the dentate gyrus but not in CA1 pyramidal
neurons after SIH
Field recordings of synaptic plasticity revealed the presence of modifications in
short-term plasticity in CA1 area of the hippocampus. In addition previous studies in
mouse models with Scn1a gene mutation had reported changes in DG granule cell’s
properties (Tsai et al., 2015). In collaboration with Dr Pousinha, we thus decided to
pursue the analysis of DG granule cells and CA1 pyramidal neurons by whole cell
current clamp recordings. We first examined their passive and intrinsic excitability
properties. The intrinsic excitability, as measured by the frequency of APs at a given
current injection, of CA1 pyramidal neurons from Scn1aRH/+ SIH was slightly increased,
though not statistically different, when compared to the other groups (FIGURE 34A). By
contrast, DG granule neurons from Scn1aRH/+ SIH were strongly hyperexcitable
(FIGURE 34B), than DG granule neurons from the other control groups. Importantly,
neither the mutation itself (compare WT control and Scn1aRH/+ control) nor the
hyperthermia induction (compare WT control and WT-HYP) affected, per se, the
intrinsic excitability properties of the two neuron populations (FIGURE 34). Other
membrane properties including resting membrane potential and membrane resistance
did not significantly differ between genotypes/treatments in both CA1 and DG
hippocampus regions (Statistic Table chapter VIII-3 page 190).
FIGURE 34. FIRING FREQ UENCY O F EXCITATO RY NEURO NS IN THE DG BUT NO T IN THE CA1 IS
INCREASED IN THE SCN1ARH/+
-129:B6 MICE SUBMITTED TO SIH.
Firing Frequency measured as the number of action potentials per second (Hz) when neurons were
depolarized by increasing current steps (20pA steps with 1s duration) in CA1 A and DG B . n= number of
animals, ***p<0.001.

112
3. SEIZURES INDUCED BY HYPERTHERMIA INDUCE LONG-LASTING CHANGES IN
THE BEHAVIORAL AND COGNITIVE PHENOTYPES IN SCN1ARH/+-129:B6
MICE.
As for the immunohistochemistry and electrophysiology analysis, another group
of animals submitted or not to SIH at P21 went through a battery of behavioral tasks at
P60. The order of the behavioral tasks was counterbalanced between cohorts of animals,
except for openfield, social interaction and dark- light tests that were done at the
beginning and for the analysis of activity in the actimeter that was done at the end.
3.1 Scn1aRH/+-129:B6 mice with SIH have a novelty-associated
increase in act iv ity in the openfield and stereotyped behav ior
without changes in anx iety.
Previously, Scn1a mutation’s carrying lines were reported to exhibit a novelty-
associated increase in activity (Han et al., 2012a; Ito et al., 2013; Purcell et al., 2013;
Sawyer et al., 2016). We placed the 4 groups in the openfield. The parameters analyzed
to evaluate locomotor activity were the speed of travelling and the distance travelled.
The two-way ANOVA of the distance travelled and average speed in the openfield
(treatment x genotype) revealed a significant main effect of genotype and treatment and
a significant interaction between treatment and genotype (all the statistical values are
described in the chapter VIII-page 185). Tuckey’s post hoc analysis showed that the
WT-129:B6 (control and HYP) and Scn1aRH/+-129:B6 control mice travelled similar
distances and at similar average speed. Scn1aRH/+-129:B6 mutants submitted to the SIH
protocol travelled a greater total distance and travelled at a higher average speed than
the 3 other groups FIGURE 35A&B. We could assume that the Scn1aRH/+ mutation per
se does not induce novelty-associated locomotor changes, however, after chronic
seizure induction by hyperthermia at early-age, the Scn1aRH/+-129:B6 was hyperactive
when exposed to a novel environment (illustrated in the track-plot report
FIGURE 35. SCN1ARH/+ -129:B6 SIH HAVE A NOVELTY associated increase in
activity and stereotyped behavior.D)
We wanted to go further in the analysis and we observed that the hyperactive
mice had some repetitive behaviors. We counted the number of rotations of the animal’s
body and the number of rearing episodes in the period tested. The ANOVA showed a
main effect of genotype and treatment for both measures with an interaction between
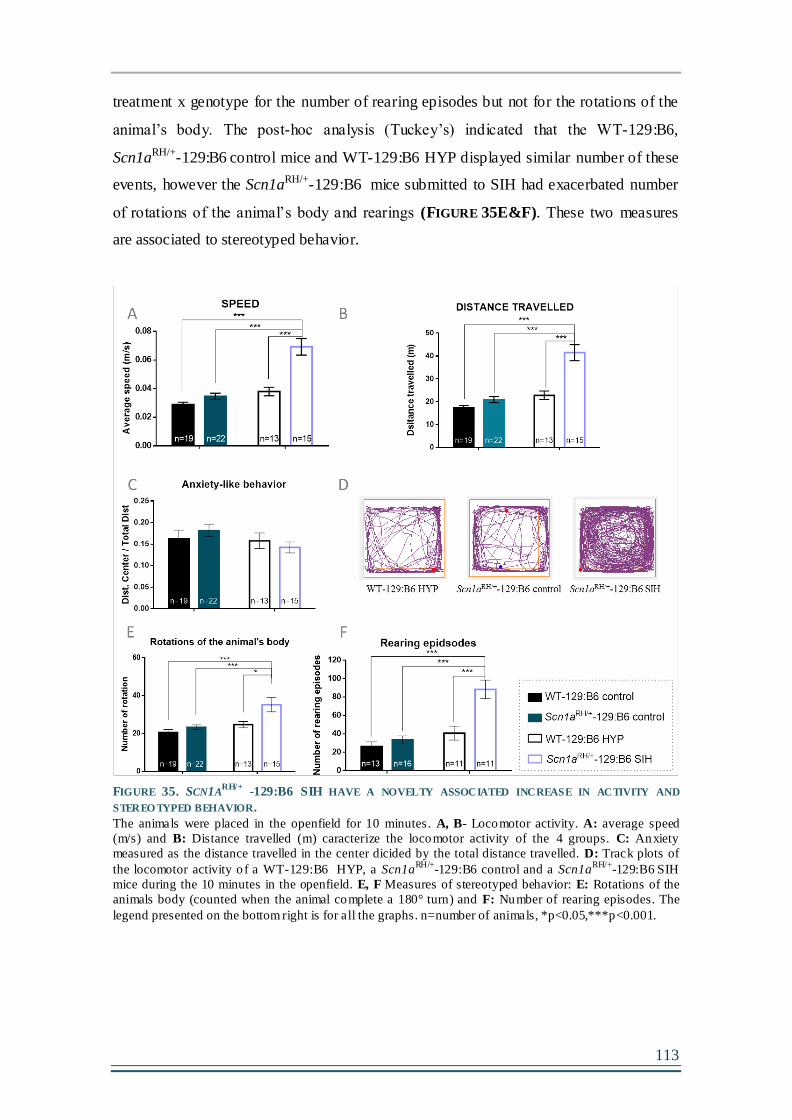
113
treatment x genotype for the number of rearing episodes but not for the rotations of the
animal’s body. The post-hoc analysis (Tuckey’s) indicated that the WT-129:B6,
Scn1aRH/+-129:B6 control mice and WT-129:B6 HYP displayed similar number of these
events, however the Scn1aRH/+-129:B6 mice submitted to SIH had exacerbated number
of rotations of the animal’s body and rearings (FIGURE 35E&F). These two measures
are associated to stereotyped behavior.
FIGURE 35. SCN1A
RH/+ -129:B6 SIH HAVE A NOVELTY ASSOCIATED INCREASE IN ACTIVITY AND
STEREO TYPED BEHAVIOR.
The animals were placed in the openfield for 10 minutes. A, B- Locomotor activity. A: average speed
(m/s) and B: Distance travelled (m) caracterize the locomotor activity of the 4 groups. C: Anxiety
measured as the distance travelled in the center dicided by the total distance travelled. D: Track plots of
the locomotor activity o f a WT-129:B6 HYP, a Scn1a
RH/+-129:B6 control and a Scn1a
RH/+-129:B6
SIH
mice during the 10 minutes in the openfield. E, F Measures of stereotyped behavior: E: Rotations of the
animals body (counted when the animal complete a 180° turn) and F: Number of rearing episodes. The
legend presented on the bottom right is for all the graphs. n=number of animals, *p<0.05,***p<0.001.

114
The openfield can be used as a first screen for anxiety in rodents however it
should be complemented with other paradigms (Prut and Belzung, 2003). This measure
can easily be obtained by quantifying the time spent in the center or the latency to first
entry in the center. However, the important changes in locomotion induce a bias in this
measure, proposing a decrease in anxiety in the Scn1aRH/+-129:B6 mice submitted to
SIH (data not shown). Another accepted measure for anxiety in the openfield is ratio:
distance travelled in the center divided by the total distance travelled. We observed that
all the groups had the same ratio of center exploration. This measure indicated that the
SIH did not induce anxiety in the Scn1aRH/+-129:B6 mice. (FIGURE 35C) and all groups
behaved equally. To complete the findings about anxiety obtained in the openfield we
ran a trial: the dark↔light box (used to study anxiety in rodents). FIGURE 36 shows the
time spent in the light compartment – more anxiogenic (A) and the number of entries in
the same compartment (B). The Two-way ANOVA revealed a significant interaction
between the treatment and genotype with a main effect of treatment for the number of
entries in the light zone but not for the time in the light zone. The post hoc analysis
show no differences between the groups for the time spent in the anxious light zone, but
a difference between the WT-129:B6 and WT-129:B6 HYP in the number of entries.
These results again suggest that there is no increase in anxiety caused by the seizures,
even if this test is not very convincible due to the very low time spent by the WT-
129:B6 control mice in the light side (lower than 10 %) possibly due to the high light
intensity used in the test and the large variability inside the groups as seen in the dot-
plot graphs.
FIGURE 36. THE S IH DO ES NO T INDUCE ANXIETY IN SCN1A
RH/+-129:B6 MUTANTS .
A: time in the light side of the dark↔light box. B: Number of entries in the light side of the dark↔light
box. n=numer of animals. **p<0.01.
We could conclude that by confronting the 4 four groups to a novel and stressful
environment, the WT-129:B6, WT-129:B6 HYP and Scn1aRH/+-129:B6 control mice

115
behave at the same level indicating that the mutation per se or the hyperthermia per se
do not affect the novelty reaction, while, the 10-days of SIH clearly changed the
reaction to novelty in Scn1aRH/+-129:B6 mice as demonstrated by a clear increase in
activity, exacerbated stereotyped behavior but no changes in anxiety.

116
3.2 The novelty-associated hyperactiv ity normalizes after
habituation in the act imeter in Scn1aRH/+-129:B6 SIH mice.
Our first worry concerning the hyperactivity induced by the SIH was: is it
associated to novelty or maintained chronically as home cage behavior? As we could
not record the animals in their home cages, we placed them in the actimeter for 72
hours. The sensors in the actimeter give the parameters represented in FIGURE 37. The
measures are represented in bins of 30 minutes period (A&B) and 12 hours period (C).
The animals were placed at 7 pm at day 1 and removed 3 days later. In FIGURE
37A the horizontal activity measures the activity on the actimeter’s floor (movements at
the back + movements in the front + number of crosses) of the 4 groups of animals.
RM-two way ANOVA revealed a significant interaction (genotype-treatment x time)
with a main effect of time but not genotype-treatment. This main effect is observed with
the clear circadian cycle observed by the four groups. As the WT-129:B6 animals, the
Scn1aRH/+-129:B6 control and Scn1aRH/+ -129:B6 SIH showed low activity during the
light/resting phase and higher activity during the dark/active phase with no differences
between the groups at any bin of time (pot-hoc analysis show no differences between
the groups). The vertical activity, measuring the number of rear ing episodes also
represents a measure of activity and it is illustrated in FIGURE 37A&B. The RM-Two-
way ANOVA of the vertical activity showed a significant main effect of time (as
previously) but also of genotype-treatment and a significant interaction between the
two. The four groups again showed a normal circadian cycle with low activity during
the resting- light phase and high activity during the active-dark phase, confirming that
neither the mutation nor the seizures induce important changes in the circadian cycle.
Tuckey’s post-hoc analysis showed a significant increase in the vertical activity for the
Scn1aRH/+-129:B6 SIH when compared to the 3 control groups during the first 12 hours
in the actimeter (1st day and night). This activity tended to normalize and became
similar to the controls for the following hours (FIGURE 37B), even if for 3 time points
during the active phase this activity remained significantly increased. In FIGURE 37C
the vertical activity is pooled in time bins of 12 hours and again we can see that the SIH
significantly increases significantly the activity in the Scn1aRH/+-129:B6 group but not
the mutation per se (no differences between the WT-129:B6 control and Scn1aRH/+-
129:B6 control). Yet, this increase in activity is temporary and normalizes within 24

117
hours, indicating that the hyperactivity in Scn1aRH/+-129:B6 with SIH is most probably
associated to novelty.
FIGURE 37. SCN1A
RH/+-129:B6 MUTANT MICE EXHIBIT A NOVELTY-ASSOCIATED INCREASE IN REARING
ACTIVITY IN THE ACTIMETER.
A: Total horizontal act ivity (sum of the activ ity at the front + back + front-back crosses) scored for 69
consecutive hours (data showed by half-an-hour periods). B: Total vertical activ ity (number of rearing
episodes) for 69 consecutive hours (data showed by half-an-hour periods). C: Total vertical activ ity
(number of rearing episodes) for 69 consecutive hours (data pooled by 12-hour periods). Statistical
significance is shown in violet when the Scn1aRH/+
-129:B6 SIH mice are different that Scn1aRH/+
-129:B6
control mice and WT-129:B6 HYP mice. *p<0.05, **p<0.01, ***p<0.001, n=number of an imals.

118
3.3 Scn1aRH/+-129:B6 SIH mice show impaired social interact ion
ability in the three-chamber social interact ion test.
The autistic- like phenotype of Scn1a mutation’s carrying mouse lines with
severe phenotypes has been stressed previously (Han et al., 2012a; Ito et al., 2013). We
then asked if the seizures could affect the sociability skills. The four groups were tested
in the three chamber test.
We first ran a 10-minutes habituation trial, in which the animals were placed in
the central chamber and had to explore the two side chambers. This trial was crucial in
order to detect chamber preferences and acclimatize the animals to the testing apparatus.
All groups explored equally the two-side chambers FIGURE 38A, but the two-way
ANOVA of distance travelled and speed in this phase showed a significant main effect
of treatment and genotype and a significant interaction between them. The post-hoc
analysis (Tuckey’s) highlighted that the Scn1aRH/+-129:B6 SIH mice travelled
significantly longer and at higher speed than the 3 other groups, confirming again the
novelty-associated increase in activity seen in the openfield and actimeter. This increase
in activity normalized and was comparable to other groups’ level during the sociability
and social novelty phases (data not shown, statistic values in the chapter VIII-page 185).
The sociability phase consisted in the choice between and empty wire cage or a
wire cage containing a stranger mouse. We analyzed the social interaction with a RM-
two way ANOVA and it revealed a significant main effect of the cage chosen for
exploration by the test mouse. The post hoc analysis (Sidak’s) indicated that the WT-
129:B6 control, WT-129:B6 HYP and Scn1aRH/+-129:B6 control mice interacted
significantly longer with the M than with the EC, demonstrating preserved sociability
skills. However, Scn1aRH/+-129:B6 with SIH had no preference between the EC and the
M, demonstrating a perturbation in the sociability skills after SIH (FIGURE 38D). In the
social novelty phase, again the analysis revealed a significant main effect of the cage,
and the post-hoc analysis showed that the WT-129:B6, WT-129:B6 HYP and the
Scn1aRH/+-129:B6 control interacted significantly longer with the nM as expected. For
Scn1aRH/+-129:B6 mice with SIH, the time exploring the nM and the fM was equivalent,
showing no preference between the nM (FIGURE 38E). These results of the two phases
demonstrate that the social skills were importantly affected after experiencing early life
seizures in this mouse model. All together these results show that seizures in infancy
can promote long- lasting alterations in social skills during adulthood.

119
FIGURE 38. SIH IMPAIRS SOCIABILITY IN SCN1A
RH/+-129:B6
MICE.
A, B & C: Habituation phase. A: Time spent by the test mouse in each empty chamber (C1- chamber 1,
C-center, C2- chamber 2). B: Average speed (m/s) during habituation phase. C: Distance travelled (m)
during habituation phase. D: Sociability phase. Time spent by the test mouse interacting with the empty
cage (EC) or the stranger mouse (M). E: Social novelty phase. Time spent by the test mouse interacting
with the familiar mouse (fM) or the novel mouse (nM). *p<0.05, **p<0.01, ***p<0.001, n=number of
animals. The bar legend is common for all the figures.
3.4 Scn1aRH/+-129:B6 mice with SIH have impaired learning and
memory in the Morris water maze task .
Mental retardation is a main consequence of DS disease progression (Olivieri et
al., 2016; Ragona et al., 2011b). We observed alteration in neuronal function in the
hippocampus so it was important to test the memory functions (FIGURE 33 ; FIGURE 34)
dependent on this structure. We submitted the control and hyperthermia/SIH mice to a
protocol of spatial learning and memory in the MWM apparatus. This test was divided
in two phases: the cue task to confirm no visual and motor impairment and the spatial

120
task (4 training days and a 24h probe) to test learning and long-term memory.
Scn1aRH/+-129:B6 SIH mice were initially impaired having higher latency to approach a
visible platform at cue task D1, but reached the same level of performance as Scn1aRH/+-
129:B6 control and WT groups by cue task D2. All groups significantly decreased the
latency to find the visible platform from D1 to D2 (RM-ANOVA with significant main
effect of Cue task day and Group), being all at an average of escape latency lower than
10 seconds (FIGURE 39A). The increased latency to find the cued/visible platform at D1
was associated to a significant increase in the distance travelled by the Scn1aRH/+-
129:B6 SIH mice (TABLE 13) with a decrease in the average speed when compared to
the WT-129:B6 HYP but not to the Scn1aRH/+-129:B6 control mice (TABLE 12), so we
could not say that the higher latency was justified by motor problems in the SIH
submitted mice. We did not observe the novelty-associated increase in locomotion in
the MWM (as in the openfield and actimeter) possibly of the water be something that
they never experience before, and probably they do not know how to reac t and try to
escape. This first observation indicated that even if the Scn1aRH/+-129:B6 SIH mice took
longer time to understand the rule (D1), by the end of the cue task they equalize to the
other groups latency’s and prove that they did not have sensorimotor problems that
could impede the animals to perform the MWM task. Only one animal of the Scn1aRH/+-
129:B6 SIH group that never escape by him self to the platform was removed from the
study.
The spatial training proceeded by removing the cue from the pla tform and
opening the curtains to expose the visual cues. The RM-two way ANOVA revealed a
significant main effect of training day and group, the group x training day interaction
did not, however, quite reach significance. The tuckey’s post-hoc analysis showed that
at training D1 the Scn1aRH/+-129:B6 SIH mice showed higher escape latency than the 3
control groups (FIGURE 39A). However, it is important to note that, as described in the
material and methods, each training day results in the average of 4 trials. We could
believe that in training 1 the Scn1aRH/+-129:B6 SIH group started from a higher latency
than the 3 other groups justifying why they never equalized their performance.
However, on trial 1 of training day 1 all 4 groups had the same latency to find the
platform suggesting that the Scn1aRH/+-129:B6 SIH had a similar behavior as the other
groups and that the within-day learning was not as good in this group as the 3 control
groups (FIGURE 39B).
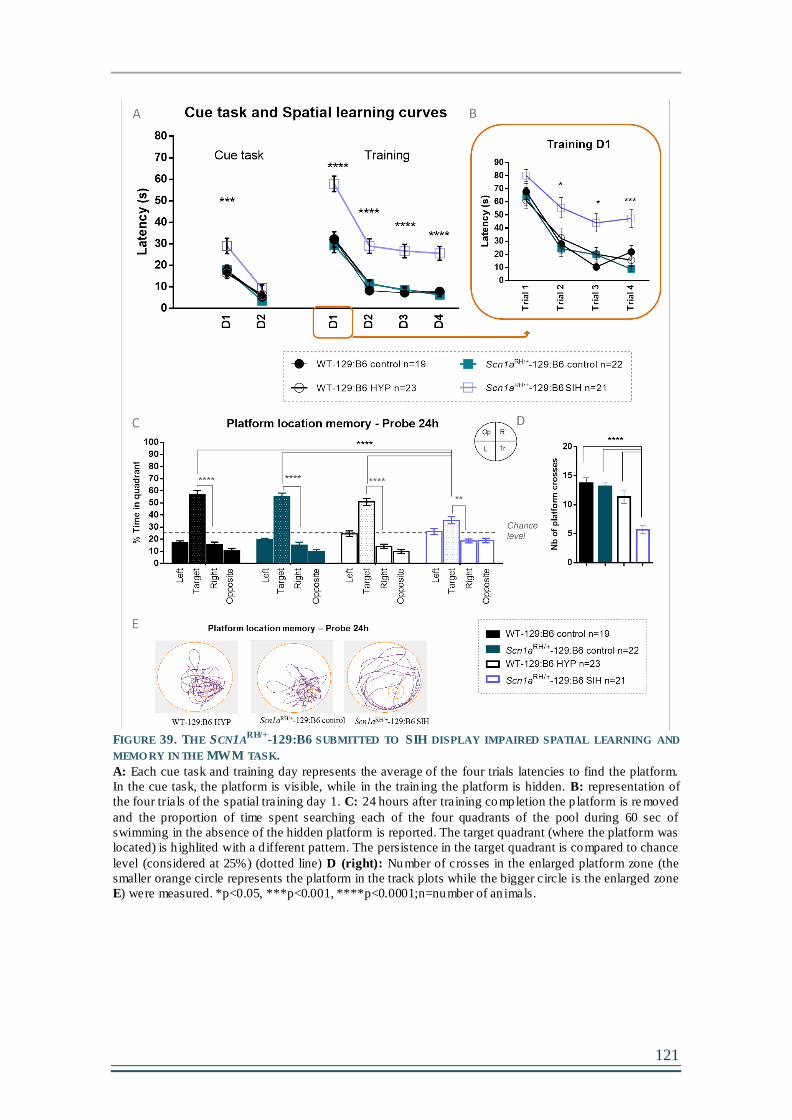
121
FIGURE 39. THE SCN1A
RH/+-129:B6 SUBMITTED TO SIH DISPLAY IMPAIRED SPATIAL LEARNING AND
MEMO RY IN THE MWM TASK.
A: Each cue task and training day represents the average of the four trials latencies to find the platform.
In the cue task, the platform is visible, while in the train ing the platform is hidden. B: representation of
the four trials of the spatial training day 1. C: 24 hours after training completion the p latform is re moved
and the proportion of time spent searching each of the four quadrants of the pool during 60 sec of
swimming in the absence of the hidden platform is reported. The target quadrant (where the platform was
located) is h ighlited with a d ifferent pattern. The persistence in the target quadrant is compared to chance
level (considered at 25%) (dotted line) D (right): Number of crosses in the enlarged platform zone (the
smaller orange circle represents the platform in the track plots while the bigger circle is the enlarged zone
E) were measured. *p<0.05, ***p<0.001, ****p<0.0001;n=number of an imals.

122
TABLE 12. AVERAGE SPEED (M/S) IN THE MWM FO R CUE TASK AND SPATIAL LEARNINGS .
Mean±S.E.M of the swim speed across the cue task and training days by the 4 groups. Statistical
significance is represented in the last column of the table. The 3 control groups did not differ in any day
so we represented the statistics when the Scn1aRH/+
-129:B6 SIH mice (co lumn in bold) are significantly
different than the WT-HYP or Scn1aRH/+
-129:B6 control groups. *p<0.05, **p<0.01, ***p<0.001.
TABLE 13. DISTANCE TRAVELLED (M) IN MWM FO R CUE TASK AND SPATIAL LEARNING TRAINING
DAYS.
Mean±S.E.M of the distance travelled across the cue task and training days by the 4 groups. Statistical
significance is represented in the last column of the table. The 3 control groups did not differ in any day
so we represented the statistics when the Scn1aRH/+
-129:B6 SIH mice (co lumn in bold) are significantly
different than the WT-HYP or Scn1aRH/+
-129:B6 control groups. *p<0.05, ***p<0.001
The post-hoc analysis also showed that all the groups significantly decreased
their latencies to find the platform from training D1 to D2, and then maintained their
performance levels (D2-D4). Even if this indicate that all the groups understood that
there was an escape rule to follow, the latency to escape was significantly higher in the
Scn1aRH/+-129:B6 SIH mice (FIGURE 39A) during the 4 training days. In addition, we
123
see in FIGURE 39A that by training D4 the WT-129:B6 control, WT-129:B6 HYP and
Scn1aRH/+-129:B6 control had an escape latency lower than 10 seconds as seen in the
cue task D2, while the Scn1aRH/+-129:B6 SIH did not (like they had a cue task D2). The
poorer performance of the Scn1aRH/+-129:B6 SIH mice is unlikely to be due to effects
on motor function as the swim speed was significantly increased when compared to the
Scn1aRH/+-129:B6 control mice for all the training days and to WT-129:B6 HYP at D1
and D4 (TABLE 12). The distance travelled was also increased during all the training
days (TABLE 13).
Twenty-four hours after training completion, we ran a probe trial to test the
strength of the long-term memory when removing the platform, as explained previously.
The one sample t-test comparing the percentage of time in the target zone, where the
platform was located, to the chance level (25%) indicated that all the groups persisted
longer than chance in this quadrant; By contrast, the Scn1aRH/+-129:B6 SIH persisted
lower time in this quadrant than the other 3 groups (FIGURE 39C) (RM-ANOVA main
effect of Quadrant and significant Group (treatment-genotype) x Quadrant interaction).
The post-hoc analysis of within group quadrant persistence revealed that the WT-
129:B6 and Scn1aRH/+-129:B6 controls persist significantly higher in the target quadrant
than in the other 3 quadrants (left, right and opposite). By contrast, the Scn1aRH/+-
129:B6 SIH mice did not significantly discriminate between the target and left
quadrants. In addition, we counted the number of crosses in the platform zone area. The
two-way ANOVA revealed a significant Genotype x Treatment interaction with main
effects of Genotype and Treatment. We observed that the number of crosses in the
platform zone was significantly decreased in the Scn1aRH/+-129:B6 SIH mice compared
to the other groups (FIGURE 39D). The tracking plots of the probe trial illustrated in
FIGURE 39E clearly indicate that the Scn1aRH/+-129:B6 SIH are less precise in
remembering the previous emplacement of the spatial platform.
We conclude that, although Scn1aRH/+ SIH mice showed a learning improvement
in the latency to find the platform from training D1 to D2, they show poorer learning
performance (within days and across days) and memory strength (long-term memory)
than the control WT-129:B6 and Scn1aRH/+-129:B6 and the WT-129:B6 HYP.
Accordingly, the results suggest that SIH protocol in the mutant mice also induce
perturbations in hippocampal learning and memory during adulthood.

124
3.5 Scn1aRH/+-129:B6 mice show decreased contextual-fear
condit ioning
On the first day of the CFC the animals were placed in the conditioning box.
After 2 minutes of habituation to the box, 3 consecutive shocks with 60s interval were
delivered. FIGURE 40A illustrates the freezing percentage during the 5 minutes of
conditioning. The RM-two way ANOVA (Genotype x Treatment) showed a significant
main effect of genotype but not of treatment. The Scn1aRH/+-129:B6 mutation seemed to
decrease the freezing percentage in the control and SIH mice when compared to the
controls. This decrease did not reach statistical significance when doing the post-hoc
analysis (FIGURE 40A). Twenty-four hours later, the mice were placed in the
conditioning box, but this time without receiving any shock. The RM-two way ANOVA
revealed a significant main effect of Genotype and Treatment but no significant
interaction between the 2. Considering this conditioning phase, it is interesting to see
that, in the test phase, the Scn1aRH/+-129:B6 control mice show reduced contextual- fear
memory that is excacerbated in the SIH mice, but did not reach statistical significance.
Nevertheless, this difference was not statistically significant when compared to the WT-
129:B6 control and WT-129:B6 HYP respectively, and between them (Scn1aRH/+-
129:B6 control vs. SIH) (FIGURE 40B). By analyzing the results, we cannot assume
perturbations in the contextual- fear conditioning for the Scn1aRH/+-129:B6 SIH because
the mutation per se seems to decrease the freezing response to fear, in the conditioning
and test phases.
FIGURE 40. CO NTEXTUAL FEAR CONDITIO NING IS NO T CHANGED IN SCN1A
RH/+-129:B6
MICE.
A: Freezing time (%) during the 5 minutes’ conditioning. B: Freezing time (%) during the 5 minutes of
testing, 24 hours after the conditioning. n=number of animals

125
3.6 Scn1aRH/+-129:B6 mice with SIH show an impairment in
work ing memory.
Short-term memory associated with attention deficits has been observed in DS
children at an early age (Villeneuve et al., 2014). To test this type of memory, we set up
a protocol to test working memory in an 8-arm radial maze, a test dependent of the pre-
frontal cortex. The protocol consisted in a choice between 2 arms (one rewarded and
one non-rewarded) in a sequence of 7 consecutive trials that was changed every day.
The training was continued until the control WT mice reached the criterion level,
meaning more that 75% correct choices (5.25) for 2 consecutive days. Chance level was
considered as 50% correct choices (3.5).
The first main observation we had was that the WT-129:B6 control, WT-129:B6
HYP and Scn1aRH/+-129:B6 control mice reached the criterion for two consecutive days
at training days D9 and D10 when the Scn1aRH/+-129:B6 SIH never did. The RM two-
way ANOVA revealed an interaction (training day x Group) with main effect of
Training day and Group. The post-hoc analysis indicated that at training D9 and D10
the 3 control groups had higher number of correct arm choices than the Scn1aRH/+-
129:B6 SIH mice (FIGURE 41A).
Also, the three control groups performed significantly higher than chance for the
2 last days of training. The RM two-way ANOVA revealed an interaction (training day
x Group) with main effect of Training day and Group. Considering the chance level,
using one sample t-test comparing to 3.5 correct choices, we observed that the 3 control
groups were importantly better than chance from D8 until the end of the protocol.
Considering the Scn1aRH/+-129:B6 with SIH, we observed that they were slightly better
than chance at training D8 and D10 but not at D9. This suggested that this group might
have started to learn the rule but with lower performance than the 3 control groups and
never reached the criterion for the 10 days tested.
Once again, the poor learning capacity of Scn1aRH/+-129:B6 with SIH was
apparent in this task, Indeed, for the same training duration, this group they had never
reached the criterion and their better performance than chance was not consistent,
meaning than their choices were mainly random during the protocol. Working memory
was therefore also clearly affected in the Scn1aRH/+-129:B6 mice after submission to
early- life seizures.

126
FIGURE 41. SCN1A
RH/+-129:B6 MUTANT MICE SUBMITTED TO SIH EXHIBIT AN IMPAIRMENT IN
WORKING MEMO RY.
A: Number o f correct choices per day during the working memory training. The pink dotted line
represents the criterion corresponding to 75% of 7 correct choices (5.25). Gray dotted line at chance level
corresponds to 50% of 7 choices (3.5). Statistical significance is represented with black stars for
differences between the Scn1aRH/+
-129:B6 SIH group and the 3 other control groups. Gray stars and
associated dotted traces correspond to the statistical significance between groups and the chance level.
N=number of animal, *p<0.05, **p<0.01 and p<0.001.
Together, these results allow us to conclude that the learning and memory
abilities of the hippocampus and the pre-frontal cortex are disrupted after experiencing
epileptic activity in Scn1aRH/+-129:B6 mice.

127
Chapter 4- IS THE SCN1A MUTATION IMPLICATED IN THE BEHAVIORAL/COGNITIVE
EFFECTS CAUSED BY SEIZURES? ROLE OF FLUROTHYL-INDUCED SEIZURES.
After observing important changes induced by the SIH in the mutant Scn1aRH/+
mice, many questions rose up. Notably, is the genetic background (i.e. Scn1a gene
mutation) necessary for early life seizure-induced cognitive impairments? Or could
early life seizures alone produce the same effect in WT animals? We could not test this
question using the SIH protocol because the WT-129:B6 animals that were submitted to
hyperthermia never presented seizures. However, we organized another experiment that
could answer this question. We submitted to WT-129:B6 and Scn1aRH/+-129:B6 mice to
a protocol that could induce seizures in the two genotypes, using flurothyl (a convulsant
known to act on GABAergic functions and used previously in the Scn1aRH/+ mice
(Martin et al., 2007, 2010b)). The WT-129:B6 group was first submitted to
hyperthermia to ensure that the effect that we observed in the Scn1aRH/+ SIH
(hyperthermia + seizures) was not an effect of seizures and exacerbated by the brain
consequences of hyperthermia. This group was called WT-129:B6-HYP-FLU. The
Scn1aRH/+-129:B6 FLU (Scn1aRH/+ with seizures induced by flurothyl) was not
submitted to hyperthermia because it would have developed additional seizures with the
increase in temperature. This chapter of results only presents very preliminary data.
These experiments were done in the end of my PhD when we had a very important lack
in breeding performance amplified by the fact that the 129/SvJ females (mothers of the
Scn1aRH/+-129:B6 mutant line) were not available commercially. We only obtained 5
WT-129:B6-HYP and 6 Scn1aRH/+ -129:B6 FLU males to test for behavior.
1. FLUROTHYL-INDUCED SEIZURES PRODUCE HIGHER MORTALITY IN THE
SCN1ARH/+-129:B6 MICE THAN IN THE WT-129:B6.
Our first worry was about the mortality that the seizures- induced by flurothyl
would cause. We induced seizures with flurothyl for 10 days from P21 to mimick as
closely as possible the SIH protocol. As one can see in FIGURE 42 88.23% of the WT-
129:B6 HYP-FLU survived comparing to only 61.53% for Scn1aRH/+-129:B6 FLU. The
log-rank (Mantel-Cox) test for curve comparison indicated that the survival curves were
not significantly different.

128
FIGURE 42. FLURO THYL-INDUCED SEIZURES IN WT-129:B6 AND SCN1A
RH/+-129:B6 MICE.
A: Percentage alive of WT-129:B6-HYP-FLU and Scn1aRH/+
-129:B6 FLU during the 10-days of sezure
induction.
Even if the number of mice tested was very limited, we ran 3 behavioral tasks to
see if major behavioral effects were appearing at P60 after P21 flurothyl- induced
seizures. We did not apply statistical analysis to the data because the number of animals
was very limited. We ran the openfield, social interaction test and MWM. FIGURE 43
shows the data obtained in the 3 tasks. In FIGURE 43-1 the average speed, distance
travelled and ratio distance travelled in the center/total distance in the openfield are
presented. The average speed and distance travelled seem to be increased in the
Scn1aRH/+-129:B6 FlU but not in the WT-129:B6-HYP FLU when compared to the
WT-129:B6-HYP controls. For the anxiety measure (ratio between the distance
travelled in the center and the total distance travelled) the 3 groups seem to have similar
ratio. For the social interaction task, the WT-129:B6 HYP mice clearly prefer the mouse
than the empty cage as shown in the previous chapter. The WT-129:B6-HYP-FLU mice
seem to prefer the mouse than the empty cage as well and the Scn1aRH/+-129:B6 FLU
explore the two equally. For the social novelty phase, the exploration difference
between the nM and the fM was higher in the WT-129:B6 HYP than in the Scn1aRH/+-
129:B6 FLU.

129
FIGURE 43. BEHAVIO RAL/COGNITIVE TASKS IN SEIZURES-INDUCED WITH FLURO THYL ANIMALS .
1.Openfield. A: Average speed (m/s). B: Distance travelled (m). C: Ratio d istance in the center/total
distance travelled. 2.Three-chamber social Interaction. D:Social interaction. E: Social novelty. 3. Morris
water maze. F:Cue task and spatial learning latencies. G: Probe retrieval memory. n=number of an imals.
1. O
P
2.
For the MWM task, the cue task is equivalent for the groups, even if at D1 the
Scn1aRH/+ FLU seem to have higher latency to escape to the platform. The spatial
learning curve indicates that the 3 groups decrease their latencies across the training
days. However from D1 to D2 the learning improvements appear to be more important
in the WT groups. Following the training, the probe task indicated that the WT-HYP
FLU persisted longer in the target quadrant than the other groups. The poor performance
of the WT HYP is due to the low number of animals, as we already demonstrated
previously the ability of this group in remembering the platform location. The Scn1aRH/+
FLU group did not seem to really discriminate between the left and target quadrants.
130
We cannot yet make hard conclusions from this very preliminary data. However,
all together, it seems that the flurothyl- induced seizures affect more importantly the
Scn1aRH/+ mutant animals than the WT animals.
Chapter 5- COLLABORATIVE WORK USING SCN1A+/-B6:129 (DS) MOUSE MODEL
(DOCTOR INNA SLUTSKY , UNIVERSITY OF TEL AVIV, ISRAEL)
In collaboration with Doctor Inna Slutsky, professor and principal investigator at
the University of Tel Aviv, Israel, we benefited from the SIH protocol we had
previously set up to run a pharmacological trial to try to reduce the epileptic phenotype
in DS mice (Scn1a+/- mouse model) (mixed B6:129 background). For intellectual
property reasons, I am unable to disclose the name of the drug studied and will therefore
call it X in this chapter.
1. DRUG X DECREASE THE MORTALITY OF SCN1A+/-B6:129 MOUSE BUT NOT
THE SPONTANEOUS GTC SEIZURE FREQUENCY
The drug injection started at P21 and delivered one time per day (10 AM) during
5 days In the first day of injection, 6 hours later, we started the SIH protocol for 5 days
to increase the phenotype severity and have a more challenging number of spontaneous
seizures (very low otherwise). The SIH protocol induced high mortality in the Scn1a+/-
B6:129 vehicle mice. However, the high mortality was prevented by the drug in the
treated animals (FIGURE 44A). The log-rank (Mantel-Cox) test to compare survival
curves indicated a significant difference between the curves.

131
FIGURE 44. DRUG X ADMINISTRATIO N IN SCN1A
+/-B6:129 MOUSE DECREASES THE MO RTALITY DURING
TH E SIH PRO TOCOL BUT NO T TH E SPONTANEOUS SEIZURE FREQ UENCY.
A: Percentage of vehicle and drug-treated Scn1a+/-
B6:129 alive during the SIH protocol. B: Temperature
threshold required to induce seizures by hyperthermia during the 5-days of the protocol.
The RM-two way ANOVA of the temperature threshold to induce the seizure
revealed a significant main effect of protocol day, as one can see the temperature
reaches the minimum level at induction D3, but no differences were observed between
the groups (FIGURE 44B).
We video-recorded the spontaneous seizures during all the SIH protocol days.
The animals were individualized and placed above an infrared floor connected to a
camera fixed on the ceiling. Using a C++ custom made software, designed by ULLO
SAS (la Rochelle, France) for this experiment, the number of seizures was
automatically counted and divided by bins of 12 hours-periods and per animal (day and
night; defined as D and N respectively). The RM-Two way ANOVA revealed a
significant main effect of Day and Treatment but no Treatment x Day interaction. No
differences were detected by the post-hoc analysis for the number of spontaneous GTCs
seizures across the days (FIGURE 45).

132
FIGURE 45. SPONTANEO US SEIZURE ACTIVITY DURING THE 5 DAYS O F SIH WITH OR WITHOUT DRUG
TREATMENT IN SCN1A+/-
B6:129 MICE.
A: Numer of generalized tonic-clonic seizures from D1 to N5 (day and night respectively). n=number of
animals. Seizures were detected with a custom made software designed by ULLO SAS (La Rochelle,
France).
The treatment clearly reduces the mortality in the Scn1a+/-B6:129 mice, however
the numbers of seizures seem to stay at the vehicle level and no differences in the
temperature threshold were also observed.

133
Discussion

134

135
V- DISCUSSION
Identifying the cause of the cognitive and behavioral comorbidities in DS
remains a major challenge for the field. While some studies investigated the role of
NaV1.1 dysfunction in neuronal networks and behavior, none had yet studied the role of
epileptic activity on Scn1a mutant mouse models. In this study, we wanted to
understand the role of epileptic activity on behavioral and cognitive phenotypes in
Scn1a mouse models. To address this question, we used mouse models carrying Scn1a
mutations and presenting mild epileptic phenotypes. We used the Scn1a+/-, model of DS,
in two genetic backgrounds (129 and B6-129) and observed that the mutation per se
does not impact cognition in these models. We then tested the Scn1aRH/+, model of
GEFS+, and confirmed that the mutation per se does not change the behavioral and
cognitive phenotypes in the model. We submitted the Scn1aRH/+ mice to the SIH
protocol during early life, once a day for 10 days, and observed a worsening in the
epileptic phenotype with the appearance of spontaneous seizures. In adulthood, the
Scn1aRH/+ mice submitted to SIH displayed an increase in activity, sociability
impairment and hippocampus and prefrontal cortex-dependent memory problems. Our
study thus demonstrates that hyperthermic seizures can change a mild GEFS+ mouse
model into a severe DS mouse model.
1. THE SCN1A+/-
MUTATION PER SE IS NOT RESPONSIBLE FOR THE COGNITIVE
AND BEHAVIORAL PHENOTYPE OBSERVED IN DS PATIENTS.
The SCN1A gene mutations are associated with a vast range of phenotypic
severity progressing from GEFS+ to DS. GEFS+ patients usually present missense
mutations and DS patients present missense and truncating mutations. While in GEFS+
the missense mutations cause the partial loss of the NaV1.1 function, in DS patients
these mutations severely impair or cause the complete loss of channel function. There
are many exceptions to this generality as described in the introduction (I-Chapter 2-2.2),
and the modifications introduced by different genetic backgrounds account for this
variability.
Our first goal was to understand if the Scn1a truncating mutation (that causes the
channel loss of function and is usually associated to DS) per se can be responsible for
the cognitive phenotype observed in DS mice, as suggested by other recent studies (Han

136
et al., 2012a; Ito et al., 2013). We first used the Scn1a+/- mouse model in the 129
background. As detailed in the introduction (I-Chapter 4-2.3), the Scn1a+/- -129 mice do
not present spontaneous seizures and exhibit a survival rate comparable to WT
littermates (Rubinstein et al., 2015d; Yu et al., 2006a). Due to its mild phenotype (no
mortality, no epileptic activity) in presence of a truncation mutation, and its sensibility
to SIH, this DS model was ideal to address our question. We observed that Scn1a +/--129
mice displayed similar performance to WT littermates in the MWM and the CFC tasks.
Rubinstein and colleagues showed similar results in the CFC (Rubinstein et al., 2015d).
Together, these results indicate that the mutation per se in this Scn1a mutant mouse is
not sufficient to induce cognitive problems.
The main observation arguing against a role of this truncation mutation per se in
the cognitive outcome in DS is the lack of behavioral phenotype observed in the DS-
129 mice. These mice do not show spontaneous seizures activity, which could suggest
that without the presence of epileptic seizures, the DS mice will not develop
comorbidities. However, we do not know the effects of the genetic modifiers in the 129
background that could compensate for the NaV1.1 loss of function in this model, so the
role of seizures had to be addressed separately.
Klassen et al., showed one control patient (no epileptic or behavioral
manifestations) carrying a severe missense mutation (associated with severe DS
phenotype) (Klassen et al., 2011). Similarly, truncating mutations have been detected in
patients with mild phenotypes comparable to the ones found in GEFS+ patients (Jiang et
al., 2016; Takaori et al., 2017). The mechanisms underlying phenotypic heterogeneity
within patients are not known. It may, however, involve variable expressivity of the
single causative gene (mosaicism), modifying genes (i.e. other voltage-gated channel
genes) or epigenetic factors.
Cognitive deficits and autistic- like behavior were reported before by Han et al.,
2012 and Ito et al., 2013 in the Scn1a+/- in the C57BL/6J background. Due to high
frequency of spontaneous seizures and important mortality level in this model (see
FIGURE 10), it is hard to dissociate between the role of seizures and mutation per se in
these mutant mice. Also it is hard to assume that the 20% surviving animals (the more
resilients), on which the behavior analysis was performed, are representative of the total
colony. As explained above, the Scn1a+/- mutation in the 129 background confers a mild
phenotype in the mouse model. This mouse model would have been ideal to understand
our question regarding the role of seizures when induced in these mice with the SIH, but

137
the low breeding performance led us to choose the B6:129 F1 background, which
allowed for better breeding. This model did not therefore behave as we expected,
according to the previous publications with this model (Kalume et al., 2007b; Yu et al.,
2006a). It was previously reported in Yu et al. 2006 that the Scn1a mutant mice
resulting from mixed B6 and 129 background crossings had an intermediate phenotype
(same mutant as used in our study). The authors report that these animals show 40%
mortality at post-natal week 16, however, they have used the 2nd and 3rd generations,
while we used the 1st generation and had no mortality (0%) in these animals when
comparing the same age. The different generations could have exp lained the phenotype
because of the genetic variability observed in generations 2 or 3. Kalume et al 2007
used the F1 generation (as used by us in this study) and reported subtle signs of ataxia at
P21 in Scn1a+/- mice. Before our study, behavior abnormalities were not further
explored in this mixed B6:129 genetic background.
Consistent with the absence of mortality in the Scn1a+/-B6:129 mice used in our
work, the behavioral and cognitive phenotypes in adulthood were normal. The Scn1a+/-
B6:129 that were not submitted to SIH had normal activity in the openfield as well as
normal circadian cycle in the actimeter. They also displayed normal spatial memory and
working memory. We could not conclude on the state of sociability skills because the
WT controls did not behave as expected. We would need to repeat this experiment to
conclude. Another important parameter missing in our study with Scn1a+/- B6:129 mice
is the analysis of the epileptic history at early-age by ECoG that could be correlated to
the adult behavioral/cognitive phenotype. We, however, did not perform this experiment
and it has never been reported by others in this genetic background before.
As in our study the Scn1a+/--B6:129 mice present a similar cognitive phenotype
to the WT, this strongly suggests that cognitive deficits in adulthood are not related to
the mutation per se. These data are in contrast to the previous report using the Scn1a+/-
in the B6 background, where seizure frequency is very high and not controlled (Han et
al., 2012c; Ito et al., 2013). Also, it is known that the Scn1a+/- mice have a seizure onset
at P20-21 and high seizure intensity at their fourth week of life that tend to regress
(Kalume et al., 2013), but no one has studied the later epileptic phenotype in these
models. As we could not test the effect of seizures on the Scn1a+/- mutant mice in the
129 background (low breeding performance) nor the B6:129 (high mortality in the SIH
protocol, described in next section), we used the Scn1aRH/+ mutant mice (GEFS+ model)

138
in the 129:B6 background presenting a mild phenotype and sensibility to SIH (described
in the next section).
We tested first the effect of the R1648H missense mutation per se on the
behavioral and cognitive phenotypes in mice not submitted to SIH. We did not except
behavioral abnormalities consistent with the favorable outcome as reported in the first
human family carrying this mutation by (Escayg et al., 2000b). Yet, one patient has
been described as having the same mutation and presenting DS (Depienne et al., 2010),
suggesting that in particular cases this mutation could be associated to bad cognitive
outcome. We observed that, in adulthood, the Scn1aRH/+-129:B6 mice exhibited normal
activity, social interaction and memory, similar to WT littermates.
Thus, when probing the Scn1a+/--B6:129 and the Scn1aRH/+-129:B6 mice in a
similar background, we evidence that neither the mild missense (Scn1aRH/+) nor the
truncation mutation (Scn1a+/-) per se induced behavioral/cognitive deficits. Sawyer et
al. 2016 had previously studied the behavioral phenotype of the Scn1aRH/+ mutant in the
pure B6 background (I-Chapter 4-2.4.2 Table 7). They reported a slight increase in
activity and mild spatial memory impairments, while the anxiety, the contextual fear
conditioning, the sociability skills and the olfactory and visual abilities were normal.
These subtle differences between this recent study and our results might be related to
the difference in the genetic background. Indeed, as discussed before, pure B6
background can significantly impact the behavioral phenotype in Scn1a mutants (Yu et
al., 2006b). All together, our results show that Scn1a mutations per se do not
significantly contribute to cognitive and behavioral modifications in the mouse models
carrying mild phenotypes. These data are arguing against the concept that DS could
fully be explained as a channelopathy.
2. DS MICE DISPLAY SUSCEPTIBILITY TO HYPERTHERMIA INDUCED SEIZURES
WITH HIGHER MORTALITY THAN GEFS+ MICE IN THE 10-DAYS PROTOCOL.
The protocol of repeated seizures induction by hyperthermia (SIH) in Scn1a
models presented here has not yet been published elsewhere. There are several types of
seizures induction in rodents, notably the two protocols of repeated seizures induction
described in the introduction: hyperthermia- induced seizures and flurothyl- induced
seizures. Other models of chemically (injection of piocarpine, kainate) or electrically
(implantation of electrodes in the brain that are then electrically stimulated)- induced

139
seizures have been extensively reported as models of acute and long- lasting seizure
induction more often classified into SE (i.e kainate, pilocarpine). As described in the
introduction (I-Chapter 2-2.1), FS represent typical hallmarks of epilepsies associated to
NaV1.1 mutations. Indeed, GEFS+ and DS patients usually display a FS at disease onset
and then febrile and afebrile seizures classified in different types. Therefore, the closest
seizure induction protocol to FS is the hyperthermia- induced seizure protocol. For this
reason, it was the model of choice for us to study the consequences of epileptic activity
in early life in the Scn1a mutant models. To control for hyperthermia side-effects that
could interfere with interpretation of our results, we systematically included a
hyperthermia WT group (WT-HYP) in our study.
We faced two major concerns while setting up the protocol. The first concern
was age of mice to be used at SIH onset. The second concern was the frequency of SIH
episodes that could be clinically relevant without causing drastic mortality.
Regarding our first concern, data comparing rodent and human brain
development are very limited. In addition, different brain regions develop at variable
rates and chronological ages, in terms of neurogenesis, migration, connectivity and
function, and these processes are not necessarily parallel in human and rodents.
However, some studies show that P14-P16 in mice correspond to approximately 6
months in humans, and P21 corresponds to 1-2 years in humans (Avishai-Eliner et al.,
2002; Dobbing and Sands, 1973; Gottlieb et al., 1977). To be closer to the earlier age at
onset of seizures in patients (5 to 11 months of age on average) we could have chosen
P14-15 as the age to start the SIH protocol. As described earlier, P14-15 WT rodents
have been used as models of FS, with efficient induction of seizures by hyperthermia
(Dubé et al., 2009). If we could induce seizures at P14 in WT as well as in Scn1a
mutant mice, these WT + seizure group would have been an ideal control to test for
combination of seizure ± Scn1a mutation on behavioral/cognitive outcome. Yet, for
several reasons, we decided to start the SIH protocol later, at P21. First, Martin et al.,
2010 induced seizures by hyperthermia in Scn1aRH/+ mice and WT controls at P14. The
mean temperature threshold for seizure in WT was 44°C and 43° in Scn1aRH/+. The mice
did not develop the typical GTC hyperthermic seizures, but only tonic hyperthermic
seizures. The high temperature threshold and the lack of GTC hyperthermic seizures
show the high resistance of the mice to hyperthermia- induced seizures at this age.
Second, body temperature higher than 43°C is known to provoke brain injury (Burger
and Fuhrman, 1964). Moreover, the previous results on the Scn1a+/- mouse model (in

140
the most severe background – B6) show that P17-18 mice do not show seizures under
hyperthermia conditions to a maximum temperature of 42.5°C. The authors reported
that the sensitivity to hyperthermia- induced seizures in Scn1a+/- mice coincides with the
appearance of spontaneous seizures at P20-21 (Kalume et al., 2013; Oakley et al.,
2009b). Finally, NaV1.1 expression rising and NaV1.3 failing in human and mice brain
correspond to seizure onset in both human and mouse species at 5 months of age and
P21, respectively, suggesting that the perfectly correlated timing of the channels
expression could be a better indication to accurately target NaV dysfunction- induced
brain susceptibility (Cheah et al., 2013b). For all the reasons cited above, we chose to
start the SIH protocol at P21.
Regarding our second concern, the average seizure frequency in DS patients is
usually categorized from “daily or more” in the more severe periods to “yearly or less”
when seizures tend to decrease. Patients can have several seizures per day. We first
decided to induce 2 seizures per day for 10 days. Due to the very high mortality in the
two mouse lines (data not shown), we decided to induce only one seizure per day for 10
days.
The Scn1a+/- -129 mice were not tested in the SIH protocol due to the very low
number of animals obtained from the breeding pairs. The Scn1a+/- -B6:129, however,
showed very high mortality (±70% after SIH protocol), leading to 30% of mice alive at
P31. The high mortality was provoked by SIH and spontaneous seizures in the night
during the 10 days of the protocol. The high mortality and increase in spontaneous
seizure frequency (as seen in vehicle-treated Scn1a+/- -B6:129 animals of the IV-Chapter
5-1- FIGURE 44, suggests that SIH brings this model closer to the Scn1a+/- B6 mice with
severe phenotype reported previously (Kalume et al., 2013; Yu et al., 2006b). The
observed phenomenon is very interesting. While it is possible that the genetic modifiers
introduced by the 129 background allow for a mild phenotype (100% survival and no
cognitive deficits) of the Scn1a+/-_B6:129 model, our data suggest that the induction of
repeated seizures by hyperthermia is enough to convert this into the more severe DS
mouse model (like a model of Scn1a+/- in pure B6 background). Can the seizures
episodes be the ON/OFF trigger to the severe phenotype observed in DS patients?
While we meant to fully address this question, we unfortunately could not pursue our
investigations in this model due to the high mortality observed in mice after SIH.
We therefore carried the final optimization of the SIH protocol on the Scn1aRH/+
129:B6 mice carrying the R1648H mutation present in the first identifies GEFS+ family

141
and in one DS patient. As discussed above, the model exhibited good sensitivity to
seizures and presented a mild phenotype without SIH. The SIH protocol in this model
conferred lower mortality rate at protocol day 10 (35 % mortality). In terms of seizure
severity, the Scn1a+/- B6:129 mice reached the severity score 6 (for GTC seizure) at D2,
while the Scn1aRH/+ 129:B6 mice only reached this threshold at day 4. The temperature
threshold to induce a seizure slightly increases until D3, possib ly indicating that some
compensations are taking place, and reaches a plateau from the following days to the
end of the protocol.
Intriguingly, we also observed higher mortality in the WT-HYP control group
from the Scn1a+/- B6:129 study than in the WT-HYP control group from the Scn1aRH/+
129:B6 study (92% survival and 72% survival, respectively). This difference could
have interfered with the interpretation of our results if we had succeeded in comparing
both sets of data in these two models after SIH (not done because of high mortality of
Scn1a+/- B6:129 group after SIH). This different outcome of the WT-HYP group after
SIH could be related to the fact that the two lines result from different breeding pairs,
even if both bred on 50:50 129/B6 mixed background,. Indeed, Scn1a+/-- B6:129 mice
were always born from a WT B6 mother, which generally harbors large litters but
provide little care leading to P21 pups rather weak and small in size. By contrast,
Scn1aRH/+-129:B6 mice were always born from a WT 129 mother, which generally
harbor small litters but provide better care than B6 mothers resulting in bigger/stronger
pups at P21. These differences in size of litters and maternal behavior displayed by B6
and 129 mothers have been reported previously (Champagne et al., 2007). Thus this
apparently trivial difference in the breeding strategy we adopted in the two models,
resulting in P21 pups with slightly different developmental profiles, could very well
account for the increased death toll observed in WT-HYP in the B6 background
(Banbury, 1997). Yet, we did not observe the occurrence of spontaneous seizures in
these WT-HYP mice, so we do not think that death was caused by seizures per se
provoked by SIH. Others causes of death might be associated with the negative
consequences of hyperthermia on brain function, as inflammation (Mcilvoy, 2005). We
did not try to pinpoint the accurate cause of death in these WT-HYP mice.
Together, the results of the SIH protocol survival rates suggest that this protocol
induced more severe consequences in mice presenting the complete loss of the function
(Scn1a+/- mice) than in the mice with reduced Nav1.1 function (Scn1aRH/+ mice). Also, it
is likely that the type of Scn1a mutation confers a differential modulatory effect on the

142
seizure severity induced by SIH. Indeed, it is possible that seizures acting on a brain
with a severe Nav1.1 mutation confer a worst survival outcome than seizures acting on a
brain carrying a milder Nav1.1 mutation. These data thus reveal the complexity of the
question addressed in this study, suggesting that both epileptic history and underlying
genetic profile intervene in phenotypic outcomes.
3. LONG-TERM EFFECTS OF THE 10-DAYS SEIZURES INDUCTION BY
HYPERTHERMIA PROTOCOL IN SCN1ARH/+-129:B6 MICE.
The behavioral and cognitive testing was done using the Scn1aRH/+-129:B6 mice
submitted to SIH and respective controls. We did not proceed to the behavioral testing
in Scn1a+/--B6:129 mice due to the low number of animals remaining after the SIH
protocol.
3.1 “Seizures beget seizures” in Scn1a RH/+ mice
We first wanted to clarify the epileptic profile of the Scn1aRH/+ controls and test
whether the SIH protocol changes the epileptic severity in this model. After the SIH
protocol, the animals were implanted for ECoG recordings (P34-35). Martin et al, 2010
reported the presence of few spontaneous seizures in the Scn1aRH/+ in pure B6
background (out of 14 mice aged 3-5 months they reported that two exhibited
spontaneous seizures). We did not observe any GTC seizures in the 4 control Scn1aRH/+
mice tested between 1-3 months of age. Lack of observed seizures in our conditions
might be justified by the introduction of 50% of the129 genetic background that has
been described in the Scn1a+/- to promote a milder phenotype or by the low number of
animals tested. It is also possible that these Scn1aRH/+ -129:B6 mice harbor milder
ECoG abnormalities that were not detected with our analysis. All the Scn1aRH/+
submitted to our SIH protocol, however, developed spontaneous GTCs, which persisted
until end of ECoG recordings (3 months of age). Previous literature supports the notion
that appearance of spontaneous seizures subsequent to seizure induction is generally
correlated to the intensity/duration of the induced seizures and to the age at which these
are induced in the rodent brain. Indeed, induction of seizures using kainate led to
spontaneous seizures in adult rats, while rats submitted to the same seizures at early age
did not develop spontaneous seizures (Stafstrom et al., 1993). Also, in the adult mouse

143
brain, repeated seizures induction using flurothyl led to appearance of spontaneous
seizures that then tended to remit after one month (Kadiyala et al., 2016). Concerning
early ages, studies have previously shown that induction of one prolonged FS (~24
minutes) in immature rats, led to appearance of spontaneous seizures in 37% of the
animals at later ages (Dubé et al., 2006). The results regarding outcome of short- lasting
febrile/flurothyl- induced seizures at early age on spontaneous seizure appearance are
more controversial and many studies show that these short- lasting protocols do not
cause the appearance of spontaneous seizures (Bender et al., 2004a; Liu et al., 1999). In
our model, we clearly show that a short- lasting (once a day, less than 1 minute) but
repeated SIH protocol at early-age triggers the appearance of GTCs, worsening the
epileptic severity in our model. While it is a very controversial notion in the epilepsy
scientific community, we thus observed that “seizures beget seizures” in the Scn1aRH/+
mouse model.
3.2 SIH does not induce neuronal death in Scn1aRH/+mutant mouse
Long- lasting seizure episodes as pilocarpine or kainate- induced SE have been
associated to important neuronal death in the hippocampus in mature rats (Deshpande et
al., 2008; Kim et al., 2011, 2015; Wang et al., 2015; Williams et al., 2009). However
the same seizures in young rats before postnatal day (P18) are less likely to cause cell
death or recurrent epileptic activity (Albala et al., 1984; Mlsna and Koh, 2013; Sperber
et al., 1991; Stafstrom et al., 1992). Our immunohistochemical investigation, performed
in collaboration with Dr. Frassoni in Milan, showed that SIH in Scn1aRH/+-129:B6 mice
does not induce neuronal death nor important cytoarchitectural changes in the
hippocampus. The results are consistent with previous findings in Scn1a mutant mouse
models. Indeed, There was no evidence of neuronal death in hippocampi of the Scn1a+/-
mouse model in pure B6 background, a model known to exhibit intense spontaneous
epileptic seizure activity, (Yu et al., 2006b). Moreover, repeated flurothyl- induced
seizures do no cause neuronal death (Liu et al., 1999) and similarly repeated or
prolonged FS have not been associated to neuronal death (Bender et al., 2004b) in WT
rodents.

144
3.3 Increased f iring propert ies of DG granule cells after SIH in
Scn1aRH/+ mice
The DG is seen as the first stage or “gate” into the trisynaptic circuit of the
hippocampus, leading to an increased focus in this sub-region of the hippocampus by
the epilepsy research (Dudek and Sutula, 2007). Sustained firing of GABAergic
inhibitory interneurons is critical to the ‘gate-keeper’ function of the DG in filtering
neocortical and entorhinal excitatory inputs that converge into the CA3 region (Buhl et
al., 1994; Lothman et al., 1992). Yet, while most of the hippocampus-related research in
Scn1a models focuses on the hippocampal CA1 area, the pathological consequence of
Scn1a dysfunction in the DG has been largely disregarded.
In human temporal lobe epilepsy, GABAergic neuronal cell loss and reduced
inhibition of granule cells in the DG are associated with enhanced susceptibility to
seizures (de Lanerolle et al., 1989). The loss of seizure-sensitive neuronal populations
can critically alter the balance of excitation and inhibition in the hippocampus.
However, whether hyperthermia- induced seizures or short- lasting repeated seizures
induction (that are not associated with neuronal loss) cause DG damage has been less
studied. Early- life FS have been associated to similar abnormalities in DG granule cells
(Kwak et al., 2008). Koyama et al. 2012 showed that after a prolonged FS, there was the
aberrant migration of neonatal-generated granule cells and altered GABA receptors
signaling (Koyama et al., 2012). In a similar experiment, Swijen et al, 2012 showed
reduced inhibitory currents in the DG 10 days after the FS event (Swijsen et al., 2012).
Interestingly the DG filter was shown to be disrupted (impaired synaptic integration and
increased excitability) 10 days following the FS seizure event but not later (Pathak et
al., 2007).
Following recurrent seizures (i.e. flurothyl- induced seizures), important synaptic
reorganization and impaired neurogenesis of DG granule cells have been observed
(Holmes et al., 1998; McCabe et al., 2001). The previous studies indicate that FS or
recurrent seizures events per se can be related to the abnormal properties of the DG.
However, recently, a study correlated the Scn1a-associated phenotype with DG
abnormalities. Indeed, Tsai et al, 2015 reported the first study using Scn1a models in
which the DG properties where investigated. The authors observed that, while at 4
weeks of age the Scn1aE1099X/+ in a mixed 129:B6 background mice (model of DS) had a
substantial reduction in NaV1.1-expressing neurons in CA1, CA3 and DG, at 3 weeks of

145
age (representing the critical epileptic period), there was a specific reduction of NaV1.1-
expressing neurons in the DG but not in other hippocampal areas (CA1 and CA3) when
compared to WT littermates. The number of GABAergic interneurons was unchanged in
any areas. Also, the electrophysiological properties in the DG PV+ GABAergic neurons
were altered in the Scn1aE1099X/+ mice (altered action potential kinetics, reduced
excitability, and fewer spontaneous inhibitory currents). In addition to these functional
deficits, they observed morphological abnormalities of DG granule cells.
In light of this literature regarding DG in epilepsy, we thus decided to
investigate the effects of repeated SIH in both CA1 and DG function in our Scn1aRH/+-
129:B6 mice at P60 and correlate these with behavioral abnormalities. We only
analysed the firing properties of the excitatory neurons, because of the difficulty in the
identification of the interneurons without markage ((GAD-67)-GFP). They present high
variability of types/shapes and organization within the hippocampus. However, it would
have been very relevant to analyse them due to their main role in Scn1a models
physiopathology. The firing properties of the pyramidal cells of the CA1 region of the
hippocampus were similar in the four groups (WT and Scn1aRH/+ control and submitted
to hyperthermia). By contrast, Scn1aRH/+ mice submitted to the SIH protocol exhibited a
strong increase in firing frequency in DG granule cells compared to other groups.
These data clearly revealed that SIH produces an increase in the excitability of the
“gate” region of the hippocampus. Thus, it is possible that the increase in DG firing
frequency observed in the Scn1aRH/+ after SIH underlies the impairment in the spatial
memory task we observed in these mice. Direct causality cannot, however, be proven
with our study. The exact role of the DG in subserving memory processes has been
controversial for many years. Recently it has been shown that the DG might be
associated to spatial pattern separation (dissociation between similar contexts) in tasks
like the eight-arm radial maze (Gilbert et al., 2001; Kesner and Rolls, 2015). However,
the majority of the studies published correlate a decrease in firing frequency with DG-
related memory problems. Blocking DG granule cells have been correlated with
impaired hippocampal-dependent memory aquisition and maintenance (Lassalle et al.,
2000; Lee and Kesner, 2004; Madroñal et al., 2016). Also, impaired synaptic
transmission and excitability in the DG have been associated to hippocampus-dependent
memory deficits (Morice et al., 2013). We observed an opposite effect, characterized by
increased excitability in DG granule cells. However, it is possible that this excitation in

146
the DG, characterized by an excitation/inhibition imbalance results in abnormal sensory
information reception and impaired memory formation within the hippocampus.
Still, as described previously, DS patients show visual-spatial memory deficits
indicating that the hippocampus functions might be altered in the patients (Chieffo et
al., 2011c) and animal models showed that seizure generation might initiate in the
hippocampus in the Scn1a+/- mouse model (Liautard et al., 2013). Thus, the alteration of
DG excitation profile we observed is in line with these previous observations.
3.4 The behavioral phenotypes observed in Scn1aRH/+-129:B6 mice
after SIH correlate with Scn1a+/- DS mouse models
For the behavioral and cognitive assessment following the SIH protocol in
Scn1aRH/+ mutant mice, we wanted to evaluate the largest panel of behavior and
cognitive parameters, perturbations of which are well described in DS patients. As
described in the introduction (I-Chapter 3-page 27), DS patients present neurological,
cognitive and psychiatric/behavioral abnormalities. The main observations pointed out
through the numerous DS clinical studies are the neurological problems: ataxia, lack of
motor coordination, crouch gait; the behavioral problems: hyperactivity and social
interaction problems; and the cognitive problems: language delay, visual deficits,
attention deficits, working memory and visual-spatial memory deficits.
No major motor/visual impairment in Scn1aRH/+ after SIH
We did not extensively address the neurological problems. However, through the
different behavioral tasks tested we were able to record and analyse the global
locomotor activity and speed in different contexts (openfield, actimeter, MWM, social
interaction test) and, there were no signs of ataxia or nor important abnormalities in
their posture and motor coordination. The only assessment of motor coordination and
visual function was done during the MWM task, when mice were submitted to the cue
task training. The cue task was done during two days with four trials per day, just before
the spatial training. The escape strategy was exclusively based on the swim speed and
visual integrity, as all the animals could identify the platform location marked with a
flag. We observed that the Scn1aRH/+ -SIH displayed higher latency to find the platform
on the first day, but rapidly normalized their performance on the second day. Similarly,

147
they swam as fast as the three other groups on the second day (see TABLE 12). These
results thus indicate that, during this cue task, the Scn1aRH/+-SIH mice took longer to
understand the escape rule. They surprisingly showed lower average speed in the D1 of
the cue task, and normalized by D2 where they swam as fast as the three other groups.
Yet, as their performance normalized rapidly, we can conclude that they do not exhibit
important motor or visual problems following the SIH protocol.
In the other tasks (openfield, social interaction), the Scn1aRH/+-SIH mice
travelled longer distances and with higher speed on average than the other 3 groups
indicating that they are definitely not affected by major motor problems. Kalume et al,
2007 observed a motor impairment in the P13-P21 Scn1a-/- and a mild motor
dyscoordination in Scn1a+/- mice, which they correlated with NaV1.1 loss of function
observed in the cerebellar purkinje interneurons. In patients, cerebellar dysfunctionhas
also been suggested to justify the motor impairment, language delay, attention-deficits
and working-memory problems observed in DS (Battaglia et al., 2013). Our Scn1aRH/+
mice submitted to SIH in early life do not show overt signs of important cerebellar
impairment at 2 months of age, indicating that SIH might not cause long- lasting
behavioral effects on this area. Similarly to our work, Ito et al. 2013 did not detect
motor impairment in Scn1aRX/+ mice (DS model) using the foot-print test and rotarod at
9 weeks of age (Ito et al., 2013). Visual dysfunction is another major characteristic in
DS patients. Yet, we observed normal performance of the Scn1aRH/+ -SIH mice on the
D2 of the cue task, arguing against major alterations in visual function after SIH.
However, this task cannot detect slight visual deficits, which could be addressed using
more specific techniques as tests for visual attention, optomotor function, infrared
photorefraction (Abdeljalil et al., 2005; Fitzpatrick et al., 2017; Schaeffel, 2008).
Hyperactivity but no anxiety profile following SIH in Scn1aRH/+
The development of behavioral abnormalities was the most obvious observation
made in Scn1aRH/+ mice following recurrent seizure activity. Hyperactivity was evident
as measured by the distance travelled in the openfield and during the habituation phase
in the three-chamber social interaction. The same increase in activity was reported in
DS mouse models in the openfield (Han et al., 2012c; Ito et al., 2013). We confirmed
the novelty-associetd hyperactivity by measuring the circadian activity at D1 in the
actimeter. Interestingly, we observed that this increased activity was particularly present

148
when the mice were first exposed to the actimeter (mainly first 24 hours), i.e. when
confronted to a novel environment, but their activity normalized after habituation. This
novelty-associated reaction was also observed in Scn1aRX/+ mice (model of DS), while
in a familiar environment these mice tended to exhibit lower activity than WT
littermates (Ito et al., 2013). Together, these data confirm that SIH induces a
hyperactive profile in our GEFS+ mouse model, mimicking a phenotype observed in DS
mouse models and DS patients. More specifically, the hyperactivity observed in
different tasks seems to be exacerbated in new environments which highlits the
neophobia present in these mice, probably related to a higher anxiety profile or
increased impulsive and risk-taking behavior. In the openfield (by measure of time in
the center), we observed that the Scn1aRH/+ did not present higher anxiety levels that the
three other groups. As said before the openfield measure of anxiety alone is not
sufficient to detect anxiety levels, we thus tested the animals in the dark- light paradigm.
Again the anxiety levels were unchanged in the Scn1aRH/+ with SIH. So in conclusion,
we observed that the Scn1aRH/+ submitted to SIH mice had a normal anxiety level when
compared to the three other groups, and even a tendency for lower anxiety levels in the
dark-light. The results were not in accordance with the study of Han et al, 2012 who
showed increased activity in the openfield and elevated-plus maze test. The results in
the Scn1aRX/+ by Ito et al, 2013 were not clear because they show an increase in anxiety
in the openfield (contrasting to our study) but a decrease in anxiety in the elevated-plus
maze (similar to our study even if not significant for our study FIGURE 36). The
tendency for a decrease in anxiety ans high activity can be associated to an increase in
impulsivity and risk-taking in the Scn1aRH/+-SIH mice. These measures could have been
assessed using the five-choice serial test however due the low number of animals that
we always had, we could not optimize the technique (reviewed in Dent and Isles, 2014).
Scn1aRH/+-SIH mice had an increase in stereotyped behavior
In addition to the hyperactivity, we observed, in the openfield test, an increase in
the number of body rotations and rearing events specifically in the Scn1aRH/+ –SIH
group. These measures are considered as stereotyped behaviors, motor responses that
are repetitive, invariant, and seemingly without purpose or goal in rodents (Kelley,
2001). Similarly, Han et al, 2012 reported an increase in the number of body rotations
and an increase in grooming time in the Scn1a+/--B6 mice. In addition to the repetitive

149
behavior, we observed that the Scn1aRH/+ had an impairment in social interaction after
experiencing SIH. Both measures are associated to measures of the autistic- like
spectrum (Berkvens et al., 2015). Again the social impairment is a typical characteristic
observed in DS mouse models (Han et al., 2012c; Ito et al., 2013). Han et al, 2012,
stressed the fact that the Scn1a+/- presented an autistic-like behavior. However, whether
or not DS patients are autistic is controversial. Clinical studies suggest that the autistic
traits are not complete in DS patients and their difficulties in socializing might be due to
their motor problems and language impairment (Li et al., 2011; Villeneuve et al., 2014;
Wolff et al., 2006b). Again, these data suggest that SIH in early life is sufficient to turn
a GEFS+ phenotype (neither stereotyped behaviors nor impairments in social
interations) into a more severe DS phenotype with these autistic- like traits. These traits
have been associated to PFC dysfunction, however more recently cerebellar function
has also been correlated to these types of behavioral alterations through the cerebellum-
PFC projections (Cupolillo et al., 2016; Wang et al., 2014). Thus, these two structures
could be implicated in the phenotypes observed. Instead of autistic- like behavior, the
phenotype observed, repetitive behaviors with hyperactivity can also be correlated to a
spectrum of attention-deficit hyperactivity disorder (Leo and Gainetdinov, 2013). More
analysis would have been required to address this issue.
Scn1aRH/+-SIH mice had working and spatial memory impairment
Regarding cognitive deficits, we tested the effects of SIH on long-term spatial
memory. We observed an impairment in spatial learning and long-term memory in the
MWM task, confirming that hippocampal function is importantly affected after SIH
protocol in Scn1aRH/+ mice. Again, the results were in accordance with the findings in
the DS mouse models reported previously (Han et al., 2012c; Ito et al., 2013).
Concerning CFC, Han et al. 2012 reported lower freezing in Scn1a+/- :B6 mice when
compared to controls, demonstrating contextual- fear memory impairment. At present,
we cannot conclude on our results obtained in the CFC. We observed lower freezing in
the Scn1aRH/+-SIH mice, but this trend was not significantly different from the other
groups, although the number of mice per group was already consequent. The lack o
memory impairment in the CFC task, after seeing changes in the spatial memory tasks,
can be associated with the participation of different complementar structures in addition
to the hippocampus in the memory tasks. The spatial memory in the MWM task, is

150
known to involve the hippocampus and upper cortical areas (Tse et al., 2011), whereas
the CFC recruits the hippocampus and subcortical areas like the hippocampus and the
amygdala (Phillips and LeDoux, 1992).
Finally, we tested the prefrontal cortex integrity using a working memory task.
We observed that the Scn1aRH/+-SIH mice exhibit lower working memory capacities and
never reach the performance level of the other three groups. The two published studies
using DS mouse models have not tested PFC dependent memory tasks so a comparison
to a DS phenotype in this task is not possible. However, in DS patients, working
memory problems have been reported in the majority of cases (Chieffo et al., 2011c;
Ragona et al., 2011a). The results obtained in the behavioral/cognitive tasks in the
Scn1aRH/+-SIH mouse model are summarized in TABLE 14 and compared to the results
published in the DS mouse models. All together, the results clearly illustrate that the
repeated SIH induction at early-age in a mild Scn1aRH/+ model induces long- lasting
behavioral/cognitive defects similar to those observed in the DS mouse models
presenting severe phenotypes.

151
TABLE 14. SIH CONVERTS A MILD SCN1A MOUSE MODEL INTO A SEVERE SCN1A MO USE MODEL.
Results observed in the battery of behavioral/cognitive tasks after SIH in the Scn1aRH/+
mouse and
comparison to the results published in DS mouse models with severe phenotype.
4. THE MUTATION IS REQUIRED FOR THE SEIZURES EFFECTS (PRELIMINARY
RESULTS)
After obtaining these very interesting results we were confronted with two main
questions.
Firstly, the only group which had seizures among the 4 groups tested was the
Scn1aRH/+ -SIH mice. Could the repeated seizures induce the same behavioral and
cognitive defects in the WT mice? In other words, is the Scn1aRH/+ mutation required for
the behavioral and cognitive effects observed in the Scn1aRH/+ -SIH mice? This is an
important point to address as result interpretation of our study will depend on its
answer.
Secondly, in many publications, it has been stressed that the effects of the
hyperthermia per se must be distinguished from those of the associated seizures (Bender

152
et al., 2004b; Dubé et al., 2009). The potential effects of hyperthermia may not be
inconsequential and, in some other epileptic models, hyperthermia enhances seizure
severity and neuronal loss induced by kainic acid (Liu et al., 1993). However, this is
controversial and no worsening of kainate-induced seizures have also been reported
following hyperthermia (Hamelin et al., 2014). Also, when extreme, hyperthermia can
result in neuronal injury by itself (Germano et al., 1996). Considering the hyperthermia
itself, we address this issue with the WT HYP group and we observed that, except for
the spatial probe test, where the WT control are significantly better than the WT-HYP,
the two groups did not differ in any of the other tasks tested. This slight decrease in
memory strength in the MWM in the WT HYP mice might be due to the hyperthermia
effects, however, this group still performed well in this task and considerably better than
the Scn1aRH/+-SIH group. Considering the Scn1aRH/+ -SIH group, we do not know if the
seizures effects are exacerbated by the hyperthermia itself.
To address these two important points, we thus organized an additional
experiment in which:
1) Seizures where induced by flurothyl in hyperthermia treated WT animals to
verify if seizures (worsened or not by hyperthermia) could cause long- lasting
behavioral/cognitive alterations in WT mice;
2) Flurothyl seizures where induced in Scn1aRH/+ mice in the absence of
hyperthermia to test if we could also observe long- lasting changes in the Scn1aRH/+ mice
using a different seizure induction protocol.
We first optimized the flurothyl/hyperthermia seizure induction protocol in our
lab to mimic as closely as possible the SIH protocol. Of note, in our hands, the seizures
induced by this new protocol are very similar to SIH induced seizures (i.e. behavioral
seizure phenotype – starting from head nodding, rearing and failing, forelimb clonus
and progression to GTC seizures).This is an ongoing experiment. However, the first
preliminary results indicate that the Scn1aRH/+ with flurothyl induced seizures exhibit
increased activity, lower sociability skills and poor memory performance, while WT
littermates submitted to flurothyl- induced seizures/ hyperthermia remain cognitively
and behaviorally intact (FIGURE 43). The results suggest that repeated seizures are not
sufficient to lead to important behavioral changes in the WT mice. If these results are
confirmed, this would strongly support the hypothesis that it is the combination of early
life epileptic activity + SCN1A mutation that is at the origin of behavioral/cognitive
deficits in DS patients. Also, our first data suggest that, similarly to Scn1aRH/+-SIH

153
mice, Scn1aRH/+ mice submitted to flurothyl- induced seizures seem to display impaired
behavioral and cognitive phenotypes. These results need to be confirmed but are very
interesting because they suggest that, while a normal young WT brain is able to cope
with the effect of repeated seizures, probably by somehow restoring homeostasis, an
NaV1.1-dysfonctional brain is not capable of coping with recurrent seizure activity
(independent of type of induction protocol), leading to behavioral and cognitive
abnormalities in adulthood.
5. IS DS A CHANNELOPATHY?
In our study, we observed that SIH, not only causes the appearance of
subsequent spontaneous seizures, worsening the epileptic phenotype, but also
importantly impairs the behavioral and cognitive functions in the Scn1aRH/+ mice.
The works of Han et al. 2012 and Ito et al. 2013 show that the Scn1a+/- and the
Scn1aRX/+ mouse models in pure B6 background exhibit very severe epileptic and
behavioral/cognitive phenotypes comparable to those observed in the DS patients.
Given these behavioral abnormalities, the two studies did not dissociate the strong
epileptic activity presented in these mice from the network abnormalities caused by the
mutation per se. Neither group investigated the epileptic profile of the animals from
early-age to the adulthood and during behavioral tasks.
With these results in Scn1a+/--B6 mice, Han et al. 2012 challenged the DS
definition of EE, suggesting that DS phenotype might solely be due to the SCNA1 gene
mutation i.e. a channelopathy, when they rescued some of the behavioral impairments
(CFC and social interaction deficits) with low-dose clonazepan without causing
sedation. However, the animals used in this study resulted from the 20% survivors
following recurrent spontaneous seizure activity. It is thus possible that these remaining
mice represent a sub-population of the colony most resilient to the seizures, which could
also be most receptive to pharmacotherapy. Moreover, benzodiazepines might be
effective in reducing the seizures in DS but rapidly become ineffective and the cognitive
deficits are not overcome via the use of benzodiazepines (Connolly, 2016; Genton et al.,
2011; Inoue et al., 2015).
Using a knock-down model to selectively reduce the NaV1.1 function without
causing seizures, Bender et al. 2013,2016 had shown network abnormalities (reduction
of neurons that fired phase-locked to hippocampal theta oscillations and dysruption of

154
medial septal regulation of theta rhythm) correlated with memory deficits, arguing again
for the notion that DS might actually rather be a channelopathy. However this knock-
down strategy was not sufficient to cover the severe behavioral/cognitive/neurological
abnormalities presented in DS patients, thus questioning the validity of this model as a
through DS model.
To date, there has been a general consensus that epileptic activity cannot be
excluded in accounting from the severity of the phenotype in DS (Guerrini and Striano,
2016; Guzzetta, 2011; Wolff et al., 2006b). And very recently, a study showed that age at
seizure onset appears to predict outcome better than mutation type in DS patients
carrying SCN1A gene muatations (Cetica et al., 2017). However, the correlation
between epileptic activity and behavioral/cognitive phenotype has never been fully
established (Nabbout et al., 2013; Villeneuve et al., 2014).
Considering the clinical studies, recent evidences point to a possible role of
network dysfunction to cause the very early visual impairments observed in DS patients
(arguing for the channelopathy theory). Indeed, the study proposed by Ricci et al. 2015
comprises five DS cases, that are visually impaired early in life, but only one patient
carries the SCN1A gene mutation. However, it is difficult to conclude on one patient
diagnosis. Also, a similar progressive neurocognitive decline was observed in two
children with DS, carrying de novo SCN1A truncations and different epileptic
phenotype severity (Riva et al., 2009). Passamonti et al. 2015 shows a family with
inherited transmission where all the members have visual problems, even one patient
who carries the mutation, but never had seizures. However, this patient was tested at 74
years of age, and the visual problems could be a consequence of normal aging
(Passamonti et al., 2015). No study thus far evaluated visual problems before the
appearance of the first febrile/afebrile seizure. Therefore, it is possible that the visual
impairment is the first behavioral consequence of seizures. Interestingly, however,
visual deterioration has rarely been reported following a GTC event (Subash et al.,
2010). In animal models, the visual-spatial memory is affected following neo-natal
seizures in normal brains (Holmes et al., 1998; Neill et al., 1996). Also attention
importantly influences visual perception (Sundberg et al., 2012) and attention deficits
(associated with PFC dysfunction) are present in DS children at the onset.
Thus as some studies pointed the possible role of the SCN1A gene mutation per
se in generating the behavioral and cognitive impairment in DS, it was important to
address the question in the opposite way i.e. could we exclude seizures as aggravating

155
factors in disease progression. Our data presented here strongly argument against this
possibility. Thus, we propose that DS is probably not only due to the effect of SCN1A
mutations on network dysfunction per se, arguing against DS as a channelopathy. We
argue that SCN1A mutations set the developing brain into a fragile condition probably
by altering network connection and synchronization upon which repeated seizures
during early life will provoke irreversible network alterations at the basis of long-term
behavioral and cognitive dysfunction. Thus, early life epileptic history is likely to play
a major role in the progression of the disease.
6. THE IMPORTANCE OF UNDERSTANDING THE ROLE OF SEIZURES FOR THE
DEVELOPMENT OF ADEQUATE TREAMENTS.
The NaV1.1 dysfunction, by rendering the brain fragile to epileptic insults, has
consequences in behavioral and cognitive phenotypes in DS. Indeed, it is clear from our
study that the lack of NaV1.1 causes the appearance of spontaneous seizures in mouse
models associated with hyper-sensitivity to hyperthermia- induced seizures. Some
studies show that more severe missense mutations (impacting changes in aminoacids
polarity – inducing higher Grantham Score) and truncating mutations might be
associated to earlier onset of seizures in DS (Brunklaus et al., 2014; Zuberi et al., 2011).
However the mutation severities per se have not been successfully correlated with the
behavioral and cognitive abnormalities in DS (Ishii et al., 2017; Jiang et al., 2016;
Takaori et al., 2017).
We observe that seizures aggravate the epileptic and cognitive phenotypes in the
Scn1aRH/+ mice carrying a missense mutation inducing a DS phenotype. One possibility
is that seizures might have more severe consequences for cognition and behavior in
patients carrying more severe mutations (we saw for example that the same SIH
protocols induce higher mortality in animals presenting a truncation mutation than a
missense mutation). Ishii, et. al 2016 suggested that the missense vs. truncation
mutations in DS might have independent ways to induce cognitive deficits. Truncation
mutations were associated with a more rapid rate of cognitive decline, regardless of age
at seizure onset, while the age at seizure onset was a predictor for the rate of cognitive
decline for missense mutations (Ishii et al., 2016).Yet, the fact that the mutations found
in DS can occasionally cause GEFS+ if present only in some neurons (Depienne et al.,
2006; Gennaro et al., 2006; Marini et al., 2006) and that mutations present in GEFS+

156
can cause DS (Depienne et al., 2010), as it is the case for the R1648H mutation, show
the limit between the clinical dissociation of GEFS+ and DS with respec t to mutation
type. Also, it reveals that DS and GEFS+ share major features, including FS, sensitivity
to hyperthermic seizures and polymorphous seizure types. Thus, these observations fit
well with our current data, demonstrating that DS disease could be a severe end of
GEFS+ (Scheffer et al., 2001; Singh et al., 2001; Veggiotti et al., 2001; Wallace et al.,
2003). The R1648H mutation was found in GEFS+ patients and in one DS patient,
suggesting that factors other than the mutation type account for the severity of the
phenotype. Thus, our study is the reflect of a clinical observation associated to the
R1648H mutation that confers two different phenotypes in the presence or absence of
epileptic activity. Indeed, our results clearly show that early life repeated seizures
worsen behavioral and cognitive phenotypes in the Scn1aRH/+, thus transforming a mild
GEFS+ model into a severe DS mouse model (schematized in FIGURE 46). Overall, this
work stresses the importance of treating the early life epileptic seizures for a better
outcome in DS patients.
FIGURE 46. SCHEMATIC ILLUSTRATIO N OF THE STATE O F THE ART KNOWLEDGE AFTER O UR STUDY.
The role of epileptic activity and NaV1.1 dysfunction in contributing to the cognitive and behavioral
phenotype in the DS mouse model (Left). The part ial loss of the NaV1.1 channel function and no
spontaneous epileptic act ivity do not induce behavioral and cogntitive changes in the Scn1aRH/+
mice, but
when challenged with early life SIH, is converted into the phenotype observed in DS mouse models.

157
Conclusion
and Perspectives

158

159
VI- CONCLUSION AND PERSPECTIVES
SCN1A gene mutations, encoding for NaV1.1, are associated to a large spectrum
of epileptic disorders. GEFS+, the milder syndrome, is usually caused by mild missense
mutations. The patients present seizures with no cognitive deficits and in general,
respond well to therapy. DS, the most severe disease of the spectrum, is a drug-resistant
EE. GEFS+ and DS share common mutations and the distinction between the two is
sometimes blurred. The cause of the cognitive decline in DS has never been proven
clinically, questioning the definition of EE. In particular, the definition of DS as an EE
has recently been challenged by experimental studies using animal models. In these
studies, it has been suggested that the mutation per se, irrespective of epileptic history,
causes the cognitive deficits in DS, thus proposing DS as a genetic channelopathy.
Understanding the origin of cognitive impairment in DS and other EE is crucial
for a better quality of treatment and daily life of patients and caregivers. The type of
mutation in the SCN1A gene is an important predictor of the seizure onset and
development of epilepsy in DS patients. However, the strong epileptic activity might
play a role in worsening the phenotype and in the appearance of the behavioral and
cognitive comorbidities in DS.
The main goal of our work was to study the effect of repeated seizures induced
by hyperthermia to the cognitive and behavioral phenotypes in mouse models carrying
Scn1a gene mutations observed in DS patients or in GEFS+ patients, but which display
little phenotypes in terms of spontaneous epileptic activity. Using the Scn1aRH/+ mice
(mouse model carrying a missense mutation that causes GEFS+ and DS in one patient),
we disclosed an important role of early life seizures in the appearance of subsequent
behavioral and cognitive phenotypes in adulthood. The results clearly indicate that early
life seizures can change a mild phenotype (similar to the one found in GEFS+ patients)
into a severe form (closer to DS patients), by increasing spontaneous seizure occurrence
and inducing important behavioral and cognitive abnormalities. We observed that the
same seizure induction protocol did not perturb WT animals. Finally, we observed
specific alterations in DG neuron function in the Scn1aRH/+ mice submitted to this
seizure induction protocol. These results indicate that a developing brain carrying the
Scn1aRH/+ mutation, when submitted to repeated early life seizures, is not able to cope
with seizures effects, thus developing DG neuron network abnormalities and additional

160
spontaneous seizures. These alterations change brain function inducing long- lasting
behavioral and cognitive changes.
Our findings indicate a negative role of early life epileptic seizures in the
progression/worsening of cognitive deficits in Scn1a mutant mice. It is therefore
important to develop treatments that can completely block the seizures in the patients in
order to expect better outcomes.
In terms of perspectives, the main perspective for now is to complete the
behavioral analysis in the flurothyl- induced seizures as it represents an important
control of our experiment. Flurothyl- induced seizures are also currently being induced
in WT and Scn1aRH/+ mice to investigate the development of spontaneous seizures using
ECoG recordings and the electrophysiological properties of DG granule cells to
complete our study.
We also need to complete the electrophysiological analysis by investigating the
interneurons’ properties in CA1 and DG areas of the hippocampus in the Scn1aRH/+SIH
and control mice, as play a key role in Scn1a mouse models neuropathology.
Later on, it would have been interesting to investigate if there is an age-
dependent effect of seizures to the phenotype (e.g. Induce SIH at earlier age P17-P18
and later age P30 or P60).
Another interesting investigation would have been to use the severe DS mouse
model in pure B6 background and block the spontaneous seizures from the very onset
(probably with stiripentol+clonazepan (Inoue et al., 2015) or fenfluramine (Ceulemans
et al., 2016; Schoonjans et al., 2017)) to evaluate if the animals still display behavioral
abnormalities at later ages.
Considering the long-term future perspective, it consists in understanding why
and how early life seizures can produce a severe phenotype in a model that was
previously normal. Understanding the cellular and molecular mechanisms implicated in
this conversion will provide new research avenues for innovative treatment therapies.

161
Bibliography

162

163
VII- BIBLIOGRAPHY
Abdeljalil, J., Hamid, M., Abdel-Mouttalib, O., Stéphane, R., Raymond, R., Johan, A., José, S., Pierre, C., and
Serge, P. (2005). The optomotor response: a robust first-line visual screening method for mice. Vis ion Res. 45,
1439–1446.
Acha, J., Pérez, A., Davidson, D.J., and Carreiras, M. (2015). Cognitive characterization of children with
Dravet syndrome: A neurodevelopmental perspective. Child Neuropsychol. 21, 693–715.
Acsády, L., and Káli, S. (2007). Models, structure, function: the transformation of cortical signals in the
dentate gyrus. Prog. Brain Res. 163, 577–599.
Adolphs, R., Tranel, D., and Buchanan, T.W. (2005). Amygdala damage impairs emotional memory for g ist
but not details of complex stimuli. Nat. Neurosci. 8, 512–518.
Akiyama, M., Kobayashi, K., Yoshinaga, H., and Ohtsuka, Y. (2010). A long -term fo llow-up study of Dravet
syndrome up to adulthood. Epilepsia 51, 1043–1052.
Akiyama, M., Kobayashi, K., and Ohtsuka, Y. (2012). Dravet syndrome: a genetic epileptic d isorder. Acta
Med. Okayama 66, 369–376.
Albala, B.J., Moshé, S.L., and Okada, R. (1984). Kain ic-acid-induced seizures: a developmental study. Brain
Res. 315, 139–148.
Alheim, K., and Bartfai, T. (1998). The interleukin-1 system: receptors, ligands, and ICE in the brain and their
involvement in the fever response. Ann. N. Y. Acad. Sci. 840, 51–58.
Allen Hauser, W., and Lee, J.R. (2002). Do seizures beget seizures? B. -P. in B. Research, ed. (Elsevier), pp.
215–219.
Amaral, D.G., Scharfman, H.E., and Lavenex, P. (2007). The dentate gyrus: fundamental neuroanatomical
organization (dentate gyrus for dummies). Prog. Brain Res . 163, 3–22.
Anagnostaras, S.G., Maren, S., and Fanselow, M.S. (1999). Temporally graded retrograde amnesia of
contextual fear after hippocampal damage in rats: within-subjects examination. J. Neurosci. Off. J. Soc.
Neurosci. 19, 1106–1114.
Andreollo, N.A., Santos, E.F. dos, Araújo, M.R., and Lopes, L.R. (2012). Rat’s age versus human’s age: what
is the relationship? Arq. Bras. Cir. Dig. ABCD Braz. Arch. Dig. Surg. 25, 49–51.
Annegers, J.F., Hauser, W.A., Sh irts, S.B., and Kurland, L.T. (1987). Factors prog nostic of unprovoked
seizures after febrile convulsions. N. Engl. J. Med. 316, 493–498.
Annesi, G., Gambardella, A., Carrideo, S., Incorpora, G., Labate, A., Pasqua, A.A., Civ itelli, D., Polizzi, A.,
Annesi, F., Spadafora, P., et al. (2003). Two novel SCN1A missense mutations in generalized epilepsy with
febrile seizures plus. Ep ilepsia 44, 1257–1258.
Aram, J.A., and Lodge, D. (1987). Epileptifo rm act ivity induced by alkalosis in rat neocortical slices: b lock by
antagonists of N-methyl-D-aspartate. Neurosci. Lett. 83, 345–350.
Asarnow, R.F., LoPresti, C., Guthrie, D., Elliott, T., Cynn, V., Shields, W.D., Shewmon, D.A., Sankar, R., and
Peacock, W.J. (1997). Developmental outcomes in children receiv ing resection surgery for medically
intractable infantile spasms. Dev. Med. Child Neuro l. 39, 430–440.
Avanzini, G., Depaulis, A., Tassinari, A., and de Curtis, M. (2013). Do seizures and epileptic activity worsen
epilepsy and deteriorate cognitive function? Epilepsia 54 Suppl 8, 14–21.
Avishai-Eliner, S., Brunson, K.L., Sandman, C.A., and Baram, T.Z. (2002). Stressed-out, or in (utero)? Trends
Neurosci. 25, 518–524.
Baddeley, A. (1996). The fractionation of working memory. Proc. Nat l. Acad. Sci. U. S. A. 93, 13468–13472.
Baddeley, A., and Warrington, E.K. (1970). Amnesia and the distinction between long- and short-term
memory. 176–189.
Bailet, L.L., and Turk, W.R. (2000). The impact of childhood epilepsy on neurocognitive and behavioral
performance: a prospective longitudinal study. Epilepsia 41, 426–431.

164
Balakrishnan, V., Srinivasan, G., and von Gersdorff, H. (2010). Post -tetanic potentiation involves the
presynaptic binding of calcium to calmodulin. J. Gen. Physiol. 136, 243–245.
Balestrino, M., and Somjen, G.G. (1988). Concentration of carbon dioxide, interstitial pH and synaptic
transmission in hippocampal formation of the rat. J. Physiol. 396, 247–266.
Banbury (1997). Mutant mice and neuroscience: recommendations concerning genetic background. Banbury
Conference on genetic background in mice. Neuron 19, 755–759.
Baram, T.Z., Gerth, A., and Schultz, L. (1997). Febrile seizures: an appropriate-aged model suitable for long-
term studies. Brain Res. Dev. Brain Res. 98, 265–270.
Barry, J.M., and Holmes, G.L. (2016). Why Are Children With Epileptic Encephalopathies Enceph alopathic?
J. Child Neurol. 31, 1495–1504.
Battaglia, D., Chieffo, D., Siracusano, R., Waure, C., Brogna, C., Ranalli, D., Contaldo, I., Tortorella, G.,
Dravet, C., Mercuri, E., et al. (2013). Cognit ive decline in Dravet syndrome: is there a cerebellar ro le?
Epilepsy Res 106, 211–221.
Battaglia, D., Ricci, D., Chieffo, D., and Guzzetta, F. (2016). Outlining a core neuropsychological phenotype
for Dravet syndrome. Epilepsy Res. 120, 91–97.
Baulac, S., Gourfinkel-An, I., Nabbout, R., Huberfeld, G., Serratosa, J., Leguern, E., and Baulac, M. (2004).
Fever, genes, and epilepsy. Lancet Neurol. 3, 421–430.
Baxendale, S., and Thompson, P. (2016). The new approach to epilepsy classification: Cognition and behavior
in adult epilepsy syndromes. Ep ilepsy Behav. 64, Part A, 253–256.
Ben-Ari, Y., Crepel, V., and Represa, A. (2008). Seizures beget seizures in temporal lobe ep ilepsies: the
boomerang effects of newly formed aberrant kainatergic synapses. Epilepsy Curr. 8, 68–72.
Bender, A.C., Natola, H., Ndong, C., Holmes, G.L., Scott, R.C., and Lenck-Santini, P.-P. (2013). Focal Scn1a
knockdown induces cognitive impairment without seizures. Neurobiol. Dis. 54, 297–307.
Bender, A.C., Luikart , B.W., and Lenck-Santini, P.-P. (2016). Cognit ive Deficits Associated with Nav1.1
Alterations: Involvement of Neuronal Firing Dynamics and Oscillat ions. PloS One 11, e0151538.
Bender, R.A., Dubé, C., Gonzalez-Vega, R., Mina, E.W., and Baram, T.Z. (2003). Mossy fiber plasticity and
enhanced hippocampal excitability, without hippocampal cell loss or altered neurogenesis, in an an imal model
of prolonged febrile seizures. Hippocampus 13, 399–412.
Bender, R.A., Dubé, C., and Baram, T.Z. (2004a). Febrile Seizures and Mechanisms of Epileptogenesis:
Insights from an Animal Model. Adv. Exp. Med. Bio l. 548, 213–225.
Bender, R.A., Dubé, C., and Baram, T.Z. (2004b). Febrile Seizures and Mechanisms of Epileptogenesis:
Insights from an Animal Model. Adv. Exp. Med. Bio l. 548, 213–225.
Berg, A.T. (2016). New classification efforts in epilepsy: Opportunities for clin ical neurosciences. Epilepsy
Behav. EB 64, 304–305.
Berg, A.T., and Shinnar, S. (1996). Unprovoked seizures in children with febrile seizures: short -term outcome.
Neurology 47, 562–568.
Berg, A.T., Berkovic, S.F., Brodie, M.J., Buchhalter, J., Cross, J.H., Van Emde Boas, W., Engel, J., French, J.,
Glauser, T.A., Mathern, G.W., et al. (2010). Rev ised termino logy and concepts for organizat ion of seizures
and epilepsies: Report of the ILAE Commission on Classification and Terminology, 2005–2009. Epilepsia 51,
676–685.
Berkvens, J.J., Veugen, I., Veendrick-Meekes, M.J., Snoeijen-Schouwenaars, F.M., Schelhaas, H.J.,
Willemsen, M.H., Tan, I.Y., and Aldenkamp, A.P. (2015). Autism and behavior in adult patients with Dravet
syndrome (DS). Epilepsy Behav 47, 11–16.
Bliss, T.V., and Collingridge, G.L. (1993). A synaptic model of memory: long -term potentiation in the
hippocampus. Nature 361, 31–39.
Bliss, T.V., and Lomo, T. (1973). Long-lasting potentiation of synaptic transmission in the dentate area o f the
anaesthetized rabbit following stimulat ion of the perforant path. J. Physiol. 232, 331–356.

165
Blume, W.T., Lüders, H.O., Mizrahi, E., Tassinari, C., van Emde Boas, W., and Engel, J. (2001). Glossary of
descriptive terminology for ictal semiology: report of the ILAE task force on classification and terminology.
Ep ilepsia 42, 1212–1218.
Bo, T., Jiang, Y., Cao, H., Wang, J., and Wu, X. (2004). Long-term effects of seizures in neonatal rats on
spatial learning ability and N-methyl-D-aspartate receptor expression in the brain. Brain Res. Dev. Brain Res.
152, 137–142.
Brown, N.J., Berkovic, S.F., and Scheffer, I.E. (2007). Vaccination, seizures and “vaccine damage.” Curr.
Opin. Neurol. 20, 181–187.
Browning, R.A. (1985). Role of the brain-stem reticu lar format ion in tonic-clonic seizures: lesion and
pharmacological studies. Fed. Proc. 44, 2425–2431.
Brunklaus, A., Ellis, R., Reavey, E., Semsarian, C., and Zuberi, S.M. (2014). Genotype phenotype associations
across the voltage-gated sodium channel family. J. Med. Genet. 51, 650–658.
Brunklaus, A., Ellis, R., Stewart, H., Aylett, S., Reavey, E., Jefferson, R., Jain, R., Chakraborty, S., Jayawant,
S., and Zuberi, S.M. (2015). Homozygous mutations in the SCN1A gene associated with genetic epilepsy with
febrile seizures plus and Dravet syndrome in 2 families. Eur. J. Paediatr. Neuro l. 19, 484–488.
Buhl, E.H., Halasy, K., and Somogyi, P. (1994). Diverse sources of hippocampal unitary inhibitory
postsynaptic potentials and the number of synaptic release sites. Nature 368, 823–828.
Buoni, S., Orrico, A., Galli, L., Zannolli, R., Burroni, L., Hayek, J., Fo is, A., and Sorrentino, V. (2006).
SCN1A (2528delG) novel truncating mutation with benign outcome of severe myoclonic epilepsy of infancy.
Neurology 66, 606–607.
Bureau, M., and Dalla Bernardina, B. (2011). Electroencephalographic characteristics of Dravet syndrome.
Epilepsia 52 Suppl 2, 13–23.
Burger, F.J., and Fuhrman, F.A. (1964). EVIDENCE OF INJURY BY HEAT IN MAMMALIAN TISSUES.
Am. J. Physiol. 206, 1057–1061.
Camfield, P., and Camfield, C. (2015). Febrile seizures and genetic epilepsy with febrile seizures p lus
(GEFS+). Epileptic Disord. Int. Epilepsy J. Videotape 17, 124–133.
Caraballo, R.H., and Fejerman, N. (2006). Dravet syndrome: a study of 53 patients. Epilepsy Res. 70 Suppl 1,
S231-238.
Caraballo, R., Vaccarezza, M., Cersósimo, R., Rios, V., Soraru, A., Arroyo, H., Agosta, G., Escobal, N.,
Demart ini, M., Maxit, C., et al. (2011). Long-term follow-up of the ketogenic diet for refractory epilepsy:
multicenter Argentinean experience in 216 pediat ric pat ients. Seizure 20, 640–645.
Cartmell, T., Luheshi, G.N., and Rothwell, N.J. (1999). Brain sites of act ion of endogenous interleukin -1 in
the febrile response to localized inflammat ion in the rat. J. Physiol. 518 ( Pt 2), 585–594.
Catarino, C.B., Liu, J.Y.W., Liagkouras, I., Gibbons, V.S., Labrum, R.W., Ellis, R., Woodward, C., Davis,
M.B., Smith, S.J., Cross, J.H., et al. (2011). Dravet syndrome as epileptic encephalopathy: evidence from
long-term course and neuropathology. Brain J. Neurol. 134, 2982–3010.
Catterall, W.A. (1995). Structure and function of voltage-gated ion channels. Annu. Rev. Biochem. 64, 493–
531.
Catterall, W.A. (2014). Sodium channels, inherited epilepsy, and antiepileptic drugs. Annu. Rev. Pharmacol.
Toxicol. 54, 317–338.
Cersósimo, R.O., Bartu luchi, M., Fort ini, S., Soraru, A., Pomata, H., and Caraballo, R.H. (2011). Vagus nerve
stimulat ion: effectiveness and tolerability in 64 paediatric patients with refractory epilepsies. Ep ileptic Disord.
Int. Epilepsy J. Videotape 13, 382–388.
Cetica, V., Chiari, S., Mei, D., Parrini, E., Grisotto, L., Marini, C., Pucatti, D., Ferrari, A., Sicca, F., Specchio,
N., et al. (2017). Clinical and genetic factors predict ing Dravet syndrome in infants with SCN1A mutations.
Neurology.
Ceulemans, B. (2011). Overall management of patients with Dravet syndrome. Dev. Med. Child Neurol. 53
Suppl 2, 19–23.
Ceulemans, B., Schoonjans, A.-S., Marchau, F., Paelinck, B.P., and Lagae, L. (2016). Five-year extended
follow-up status of 10 patients with Dravet syndrome treated with fenfluramine. Ep ilepsia 57, e129-134.

166
Chabardès, S., Kahane, P., Minotti, L., Koudsie, A., Hirsch, E., and Benabid, A. -L. (2002). Deep brain
stimulat ion in epilepsy with particular reference to the subthalamic nucleus. Ep ileptic Disord. Int. Ep ilepsy J.
Videotape 4 Suppl 3, S83-93.
Champagne, F.A., Curley, J.P., Keverne, E.B., and Bateson, P.P.G. (2007). Natural variat ions in postpartum
maternal care in inbred and outbred mice. Physiol. Behav. 91, 325–334.
Chang, Y.-C., Huang, A.-M., Kuo, Y.-M., Wang, S.-T., Chang, Y.-Y., and Huang, C.-C. (2003). Febrile
seizures impair memory and cAMP response-element binding protein activation. Ann. Neuro l. 54, 706–718.
Cheah, C.S., Yu , F.H., Westenbroek, R.E., Kalume, F.K., Oakley, J.C., Potter, G.B., Rubenstein, J.L., and
Catterall, W.A. (2012). Specific deletion of NaV1.1 sodium channels in inhibitory interneurons causes
seizures and premature death in a mouse model of Dravet syndrome. Proc. Natl. Acad. Sci. U. S. A. 109,
14646–14651.
Cheah, C.S., Westenbroek, R.E., Roden, W.H., Kalume, F., Oakley, J.C., Jansen, L.A., and Catterall, W.A.
(2013a). Correlat ions in timing of sodium channel expression, epilepsy, and sudden death in Dravet syndrome.
Channels 7, 468–472.
Cheah, C.S., Westenbroek, R.E., Roden, W.H., Kalume, F., Oakley, J.C., Jansen, L.A., and Catterall, W.A.
(2013b). Correlations in timing of sodium channel expression, epilepsy, and sudden death in Dravet syndrome.
Channels Austin Tex 7, 468–472.
Chieffo, D., Ricci, D., Baranello, G., Mart inelli, D., Veredice, C., Lettori, D., Battaglia, D., Dravet, C.,
Mercuri, E., and Guzzetta, F. (2011a). Early development in Dravet syndrome; visual function impairment
precedes cognitive decline. Ep ilepsy Res 93, 73–79.
Chieffo, D., Battaglia, D., Lettori, D., Del Re, M., Brogna, C., Dravet, C., Mercuri, E., and Guzzetta, F.
(2011b). Neuropsychological development in children with Dravet syndrome. Epilepsy Res 95, 86–93.
Chieffo, D., Ricci, D., Baranello, G., Mart inelli, D., Veredice, C., Let tori, D., Battaglia, D., Dravet, C.,
Mercuri, E., and Guzzetta, F. (2011c). Early development in Dravet syndrome; visual function impairment
precedes cognitive decline. Ep ilepsy Res. 93, 73–79.
Chipaux, M., Villeneuve, N., Sabouraud, P., Desguerre, I., Boddaert, N., Depienne, C., Chiron, C., Dulac, O.,
and Nabbout, R. (2010). Unusual consequences of status epilepticus in Dravet syndrome. Seizure 19, 190–
194.
Chiron, C., Marchand, M.C., Tran, A., Rey, E., d’Athis, P., Vincent, J., Dulac, O., and Pons, G. (2000).
Stiripentol in severe myoclonic ep ilepsy in infancy: a randomised placebo -controlled syndrome-dedicated
trial. STICLO study group. Lancet Lond. Engl. 356, 1638–1642.
Claes, L., Del-Favero, J., Ceulemans, B., Lagae, L., Van Broeckhoven, C., and De Jonghe, P. (2001). De novo
mutations in the sodium-channel gene SCN1A cause severe myoclonic ep ilepsy of infancy. Am. J. Hum.
Genet. 68, 1327–1332.
Claes, L.R.F., Deprez, L., Suls, A., Baets, J., Smets, K., Van Dyck, T., Deconinck, T., Jordanova, A., and De
Jonghe, P. (2009). The SCN1A variant database: a novel research and diagnostic tool. Hum. Mutat. 30, E904-
920.
Clark, K., Squire, R.F., Merrikhi, Y., and Noudoost, B. (2015). Visual attention: Linking prefrontal sources to
neuronal and behavioral correlates. Prog. Neurobio l. 132, 59–80.
Colino, A., Muñoz, J., and Vara, H. (2002). [Short term synaptic plasticity]. Rev. Neurol. 34, 593–599.
Connolly, M.B. (2016). Dravet Syndrome: Diagnosis and Long-Term Course. Can. J. Neurol. Sci. J. Can. Sci.
Neurol. 43 Suppl 3, S3-8.
Cossette, P. (2010). Channelopathies and juvenile myoclonic epilepsy. Ep ilepsia 51 Suppl 1, 30–32.
Crawley, J.N., Evers, J.R., and Paul, S.M. (1992). Polyamines inhibit N-methyl-d-aspartate antagonist-induced
darting behavior in the rat prefrontal cortex. Brain Res. 586, 6–11.
Cross, J.H., and Guerrini, R. (2013). The epileptic encephalopathies. Handb. Clin. Neurol. 111, 619–626.
Cupolillo, D., Hoxha, E., Faralli, A., De Luca, A., Rossi, F., Tempia, F., and Carulli, D. (2016). Autistic-Like
Traits and Cerebellar Dysfunction in Purkin je Cell PTEN Knock-Out Mice. Neuropsychopharmacol. Off.
Publ. Am. Coll. Neuropsychopharmacol. 41, 1457–1466.

167
Dalla Bernard ina, B., Capovilla, G., Gattoni, M.B., Colamaria, V., Bondavalli, S., and Bureau, M. (1982).
[Severe infant myoclonic epilepsy (author’s transl)]. Rev. Electroencephalogr. Neurophysiol. Clin. 12, 21–25.
De Liso, P., Chemaly, N., Laschet, J., Barnerias, C., Hully, M., Leunen, D., Desguerre, I., Ch iron, C., Dulac,
O., and Nabbout, R. (2016). Patients with dravet syndrome in the era o f stiripentol: A French cohort cross -
sectional study. Epilepsy Res. 125, 42–46.
Deng, W., Aimone, J.B., and Gage, F.H. (2010). New neurons and new memories: how does adult
hippocampal neurogenesis affect learning and memory? Nat. Rev. Neurosci. 11, 339–350.
Dent, C.L., and Isles, A.R. (2014). An overview of measuring impulsive behavior in mice. Curr. Protoc.
Mouse Bio l. 4, 35–45.
Depienne, C., Arzimanoglou, A., Trouillard, O., Fed irko, E., Baulac, S., Saint -Martin, C., Ruberg, M., Dravet,
C., Nabbout, R., Baulac, M., et al. (2006). Parental mosaicis m can cause recurrent transmission of SCN1A
mutations associated with severe myoclonic epilepsy of infancy. Hum. Mutat. 27, 389.
Depienne, C., Bouteiller, D., Keren, B., Cheuret, E., Poirier, K., Trouillard, O., Benyahia, B., Quelin, C.,
Carpentier, W., Julia, S., et al. (2009). Sporadic infantile ep ileptic encephalopathy caused by mutations in
PCDH19 resembles Dravet syndrome but mainly affects females. PLoS Genet. 5, e1000381.
Depienne, C., Trouillard, O., Gourfinkel-An, I., Saint-Martin, C., Bouteiller, D., Graber, D., Barthez-
Carpentier, M.A., Gautier, A., Villeneuve, N., Dravet, C., et al. (2010). Mechanisms for variable expressivity
of inherited SCN1A mutations causing Dravet syndrome. J Med Genet 47, 404–410.
Deshpande, L.S., Lou, J.K., Mian, A., Blair, R.E., Sombati, S., Attkisson, E., and DeLorenzo, R.J. (2008).
Time course and mechanism of hippocampal neuronal death in an in vitro model of status epilepticus: role of
NMDA receptor activation and NMDA dependent calcium entry. Eur. J. Pharmacol. 583, 73–83.
Dhamija, R., Erickson, M.K., St Louis, E.K., W irrell, E., and Kotagal, S. (2014). Sleep abnormalities in
children with Dravet syndrome. Ped iatr. Neurol. 50, 474–478.
Dobbing, J., and Sands, J. (1973). Quantitative growth and development of human brain. Arch. Dis. Child. 48,
757–767.
Dravet, C. (2014). Terminology and prognosis of Dravet syndrome. Epilepsia 55, 942–943.
Dravet, C., and Guerrin i, R. (2011). Dravet Syndrome (éd itions John LibbeyEurotext ).
Dravet, C., Bureau, M., Oguni, H., Fukuyama, Y., and Cokar, O. (2005). Severe myoclonic epilepsy in
infancy: Dravet syndrome. Adv Neurol 95, 71–102.
Dube, C., Chen, K., Eghbal-Ahmadi, M., Brunson, K., So ltesz, I., and Baram, T.Z. (2000). Prolonged febrile
seizures in the immature rat model enhance hippocampal excitability long term. Ann. Neuro l. 47, 336–344.
Dubé, C., Vezzani, A., Behrens, M., Bartfai, T., and Baram, T.Z. (2005). Interleukin -1beta contributes to the
generation of experimental febrile seizures. Ann. Neuro l. 57, 152–155.
Dubé, C., Richich i, C., Bender, R.A., Chung, G., Litt, B., and Baram, T.Z. (2006). Temporal lobe epilepsy
after experimental prolonged febrile seizures: prospective analysis. Brain J. Neuro l. 129, 911–922.
Dubé, C.M., Zhou, J.-L., Hamamura, M., Zhao, Q., Ring, A., Abrahams, J., McIntyre, K., Nalcioglu, O.,
Shatskih, T., Baram, T.Z., et al. (2009). Cognitive dysfunction after experimental febrile seizures. Exp .
Neurol. 215, 167–177.
Dubé, C.M., Ravizza, T., Hamamura, M., Zha, Q., Keebaugh, A., Fok, K., Andres, A.L., Nalcioglu, O.,
Obenaus, A., Vezzani, A., et al. (2010). Ep ileptogenesis provoked by prolonged experimental febrile seizures:
mechanis ms and biomarkers. J. Neurosci. Off. J. Soc. Neurosci. 30, 7484–7494.
Dubé, C.M., McClelland, S., Choy, M., Brewster, A.L., Noam, Y., and Baram, T.Z. (2012). Fever, febrile
seizures and epileptogenesis. In Jasper’s Basic Mechanisms of the Epilepsies, J.L. Noebels, M. Avoli, M.A.
Rogawski, R.W. Olsen, and A.V. Delgado-Escueta, eds. (Bethesda (MD): Nat ional Center for Biotechnology
Information (US)), p.
Dudek, F.E., and Sutula, T.P. (2007). Epileptogenesis in the dentate gyrus: a critical perspective. In Progress
in Brain Research, H.E. Scharfman, ed. (Elsevier), pp. 755–773.
Duflocq, A., Le Bras, B., Bullier, E., Couraud, F., and Davenne, M. (2008). Nav1.1 is predominantly
expressed in nodes of Ranvier and axon initial segments. Mol. Cell. Neurosci. 39, 180–192.

168
Dutton, S.B., Makinson, C.D., Papale, L.A., Shankar, A., Balakrishnan, B., Nakazawa, K., and Escayg, A.
(2013). Preferential inactivation of Scn1a in parvalbumin interneurons increases seizure susceptibility.
Neurobiol. Dis. 49, 211–220.
Eichenbaum, H. (2001). The hippocampus and declarative memory: cognitive mechanisms and neural codes.
Behav. Brain Res. 127, 199–207.
Ellenberg, J.H., and Nelson, K.B. (1978). Febrile seizures and later intellectual performance. Arch. Neurol. 35,
17–21.
Escayg, A., and Gold in, A.L. (2010). Sodium channel SCN1A and epilepsy: mu tations and mechanisms.
Ep ilepsia 51, 1650–1658.
Escayg, A., MacDonald, B.T., Meisler, M.H., Baulac, S., Huberfeld, G., An -Gourfinkel, I., Brice, A.,
LeGuern, E., Moulard, B., Chaigne, D., et al. (2000a). Mutations of SCN1A, encoding a neuronal sodium
channel, in two families with GEFS+2. Nat. Genet. 24, 343–345.
Escayg, A., De Waard, M., Lee, D.D., Bichet, D., Wolf, P., Mayer, T., Johnston, J., Baloh, R., Sander, T., and
Meisler, M.H. (2000b). Coding and noncoding variation of the human calcium-channel beta4-subunit gene
CACNB4 in patients with idiopathic generalized epilepsy and episodic ataxia. Am. J. Hum. Genet. 66, 1531–
1539.
Estacion, M., O’Brien, J.E., Conravey, A., Hammer, M.F., Waxman, S.G., Dib -Hajj, S.D., and Meisler, M.H.
(2014). A novel de novo mutation of SCN8A (Nav1.6) with enhanced channel activation in a ch ild with
epileptic encephalopathy. Neurobiol. Dis. 69, 117–123.
Etchamendy, N., Des medt, A., Cortes -Torrea, C., Marighetto, A., and Jaffard, R. (2003). Hippocampal lesions
and discrimination performance of mice in the radial maze: sparing or impairment depending on the
representational demands of the task. Hippocampus 13, 197–211.
Feng, B., Tang, Y.-S., Chen, B., Dai, Y.-J., Xu, C.-L., Xu, Z.-H., Zhang, X.-N., Zhang, S.-H., Hu, W.-W., and
Chen, Z. (2014). Dysfunction of thermoregulat ion contributes to the generation of hyperthermia -induced
seizures. Neurosci. Lett. 581, 129–134.
Fewell, J.E., and Wong, V.H. (2002). Interleukin-1beta-induced fever does not alter the ability of 5- to 6-day-
old rat pups to autoresuscitate from hypoxia-induced apnoea. Exp. Physiol. 87, 17–24.
Fink, M. (2014). The seizure, not electricity, is essential in convulsive therapy: the flurothyl experience. J.
ECT 30, 91–93.
Fisher, J.L. (2011). The effects of stiripentol on GABA(A) receptors. Ep ilepsia 52 Suppl 2, 76–78.
Fisher, R.S., and Wu, J. (2002). Chapter 16 - Basic Electrophysiology of Febrile Seizures A2 - Baram, Tallie
Z. In Febrile Seizures, S. Shinnar, ed. (San Diego: Academic Press), pp. 231–247.
Fisher, F., Cross, H., and French Jacqueline A. (2016). Operational Classification of Seizure Types by the
International League Against Epilepsy.
Fisher, R.S., Acevedo, C., Arzimanoglou, A., Bogacz, A., Cross, J.H., Elger, C.E., Engel, J., Forsgren, L.,
French, J.A., Glynn, M., et al. (2014). ILAE official report: a practical clinical definition of epilepsy. Ep ilepsia
55, 475–482.
Fiske, S.T. (1993). Controlling other people. The impact of power on stereotyping. Am. Psychol. 48, 621–628.
Fitzpatrick, C.M., Caballero-Puntiverio, M., Gether, U., Habekost, T., Bundesen, C., Vangkilde, S., Woldbye,
D.P.D., Andreasen, J.T., and Petersen, A. (2017). Theory of Visual Attention (TVA) applied to mice in the 5 -
choice serial reaction time task. Psychopharmacology (Berl.) 234, 845–855.
Frankel, W.N. (2009). Genetics of complex neuro logical disease: challenges and opportunities for modeling
epilepsy in mice and rats. Trends Genet. TIG 25, 361–367.
Fujiwara, T., Watanabe, M., Takahashi, Y., Higashi, T., Yagi, K., and Seino, M. (1992). Long-term course of
childhood epilepsy with intractable grand mal seizures. Jpn. J. Psychiatry Neuro l. 46, 297–302.
Fulton, S.P., Van Poppel, K., McGregor, A.L., Mudigoudar, B., and Wheless, J.W. (2017). Vagus Nerve
Stimulation in Intractable Epilepsy Associated With SCN1A Gene Abnormalit ies. J. Child Neurol.
0883073816687221.
Fuster, J.M. (2004). Patricia Shoer Goldman-Rakic (1937-2003). Am. Psychol. 59, 559–560.

169
Gaily, E., Anttonen, A.-K., Valanne, L., Liukkonen, E., Träskelin, A.-L., Polv i, A., Lommi, M., Muona, M.,
Eriksson, K., and Lehesjoki, A.-E. (2013). Dravet syndrome: new potential genetic modifiers, imaging
abnormalities, and ictal findings. Epilepsia 54, 1577–1585.
Gatti, S., Beck, J., Fantuzzi, G., Bartfai, T., and Dinarello, C.A. (2002). Effect of interleukin-18 on mouse core
body temperature. Am. J. Physiol. Regul. Integr. Comp. Physiol. 282, R702-709.
Gennaro, E., Santorelli, F.M., Bertini, E., Buti, D., Gaggero, R., Gobbi, G., Lin i, M., Granata, T., Freri, E.,
Parmeggiani, A., et al. (2006). Somatic and germline mosaicis ms in severe myoclonic ep ilepsy of infancy.
Biochem. Biophys. Res. Commun. 341, 489–493.
Genton, P., Velizarova, R., and Dravet, C. (2011). Dravet syndrome: the long -term outcome. Epilepsia 52
Suppl 2, 44–49.
Germano, I.M., Zhang, Y.F., Sperber, E.F., and Moshé, S.L. (1996). Neuronal migrat ion disorders increase
susceptibility to hyperthermia -induced seizures in developing rats. Epilepsia 37, 902–910.
Gilbert, P.E., Kesner, R.P., and Lee, I. (2001). Dissociating hippocampal sub regions: double dissociation
between dentate gyrus and CA1. Hippocampus 11, 626–636.
Git iaux, C., Chemaly, N., Quijano-Roy, S., Barnerias, C., Desguerre, I., Hully, M., Chiron, C., Dulac, O., and
Nabbout, R. (2016). Motor neuropathy contributes to crouching in patients with Dravet syndrome. Neuro logy
87, 277–281.
Goldin, A.L. (1999). Diversity of mammalian voltage-gated sodium channels. Ann. N. Y. Acad. Sci. 868, 38–
50.
Gong, B., Rhodes, K.J., Bekele-Arcuri, Z., and Trimmer, J.S. (1999). Type I and type II Na(+) channel alpha-
subunit polypeptides exhib it distinct spatial and temporal patterning, and association with auxiliary subunits in
rat brain. J. Comp. Neuro l. 412, 342–352.
Gordon, D., Merrick, D., Auld, V., Dunn, R., Goldin, A.L., Davidson, N., and Cat terall, W.A. (1987). Tissue-
specific expression of the RI and RII sodium channel subtypes. Proc. Nat l. Acad. Sci. U. S. A. 84, 8682–8686.
Gottlieb, A., Keydar, I., and Epstein, H.T. (1977). Rodent brain growth stages: an analytical review. Biol.
Neonate 32, 166–176.
Gottwald, B., Mihajlovic, Z., Wilde, B., and Mehdorn, H.M. (2003). Does the cerebellum contribute to
specific aspects of attention? Neuropsychologia 41, 1452–1460.
Gowers, W. (1881). Epilepsy and other chronic convulsive disorders. J Church illLo ndon.
Grant, A.C., and Vazquez, B. (2005). A Case of Extended Spectrum GEFS+. Epilepsia 46, 39–40.
Grantham, R. (1974). Amino acid difference formula to help exp lain protein evolution. Science 185, 862–864.
Grill, M.F., and Ng, Y.-T. (2013). “Simple febrile seizures plus (SFS +)”: More than one febrile seizure within
24 hours is usually okay. Ep ilepsy Behav. 27, 472–476.
Guerrini, R., and Striano, P. (2016). Dravet syndrome: Not just epilepsy. Neurology 87, 245–246.
Guerrini, R., Dravet, C., Genton, P., Belmonte, A., Kaminska, A., and Dulac, O. (1998). Lamotrigine and
seizure aggravation in severe myoclonic epilepsy. Ep ilepsia 39, 508–512.
Guerrini, R., Cellini, E., Mei, D., Metitieri, T., Petrelli, C., Pucatti, D., Marin i, C., and Zamponi, N. (2010).
Variable epilepsy phenotypes associated with a familial intragenic deletion of the SCN1A gene. Epilepsia 51,
2474–2477.
Guillemain, I., Kahane, P., and Depaulis, A. (2012). Animal models to study aetiopathology of epilepsy: what
are the features to model? Epileptic. Disord. 14, 217–225.
Guzzetta, F. (2011). Cognitive and behavioral characteristics of children with Dravet syndrome: an overview.
Epilepsia 52 Suppl 2, 35–38.
Hamelin, S., Pouyatos, B., Khalaf-Nazzal, R., Chabrol, T., Francis, F., David, O., and Depaulis, A. (2014).
Long-term modifications of epileptogenesis and hippocampal rhythms after prolonged hyperthermic seizures
in the mouse. Neurobiol. Dis. 69, 156–168.
Han, S., Tai, C., Westenbroek, R.E., Yu, F.H., Cheah, C.S., Potter, G.B., Rubenstein, J.L., Scheuer, T., de la
Iglesia, H.O., and Catterall, W.A. (2012a). Autistic-like behaviour in Scn1a+/- mice and rescue by enhanced
GABA-mediated neurotransmission. Nature 489, 385–390.

170
Han, S., Tai, C., Westenbroek, R.E., Yu, F.H., Cheah, C.S., Potter, G.B., Rubenstein, J.L., Scheuer, T., de la
Iglesia, H.O., and Catterall, W.A. (2012b). Autistic-like behaviour in Scn1a+/- mice and rescue by enhanced
GABA-mediated neurotransmission. Nature 489, 385–390.
Han, S., Tai, C., Westenbroek, R.E., Yu, F.H., Cheah, C.S., Potter, G.B., Rubenstein, J.L., Scheuer, T., de la
Iglesia, H.O., and Catterall, W.A. (2012c). Autistic-like behaviour in Scn1a+/- mice and rescue by enhanced
GABA-mediated neurotransmission. Nature 489, 385–390.
Hashimoto, Y., Araki, H., Suemaru, K., and Gomita, Y. (2006). Effects of drugs acting on the GABA-
benzodiazepine receptor complex on flurothyl-induced seizures in Mongolian gerbils. Eur. J. Pharmacol. 536,
241–247.
Hawkins, N.A., Zachwieja, N.J., Miller, A.R., Anderson, L.L., and Kearney, J.A. (2016). Fine Mapping of a
Dravet Syndrome Modifier Locus on Mouse Chromosome 5 and Candidate Gene Analysis by RNA -Seq.
PLoS Genet. 12, e1006398.
Hedrich, U.B.S., Liautard, C., Kirschenbaum, D., Pofahl, M., Lavigne, J., Liu, Y., Theiss, S., Slotta, J.,
Escayg, A., Dihné, M., et al. (2014). Impaired act ion potential init iation in GABAerg ic interneurons causes
hyperexcitable networks in an epileptic mouse model carry ing a human Na(V)1.1 mutation. J. Neurosci. Off.
J. Soc. Neurosci. 34, 14874–14889.
Heida, J.G., and Pittman, Q.J. (2005). Causal links between brain cytokines and experimental febrile
convulsions in the rat. Ep ilepsia 46, 1906–1913.
Henze, D.A., Wittner, L., and Buzsáki, G. (2002). Single granule cells reliab ly discharge targets in the
hippocampal CA3 network in vivo. Nat. Neurosci. 5, 790–795.
Hermann, B.P., Seidenberg, M., and Bell, B. (2002). The neurodevelopmental impact of childhood onset
temporal lobe epilepsy on brain structure and function and the risk of progressive cognitive effects. Prog.
Brain Res. 135, 429–438.
Hernan, A.E., Holmes, G.L., Isaev, D., Scott, R.C., and Isaeva, E. (2013). A ltered short -term plasticity in the
prefrontal cortex after early life seizures. Neurobiol. Dis. 50, 120–126.
Hesdorffer, D.C., Tomson, T., Benn, E., Sander, J.W., Nilsson, L., Langan, Y., Walczak, T.S., Beghi, E.,
Brodie, M.J., Hauser, A., et al. (2011). Combined analysis of risk factors for SUDEP. Epilepsia 52, 1150–
1159.
Hille, B. (2001). Ion channels of excitable membranes (Sinauer Sunderland).
Hodgkin, A.L., and Huxley, A.F. (1952). The dual effect of membrane potential on sodium conductance in the
giant axon of Loligo. J. Physiol. 116, 497–506.
Holmes, G.L. (2009). The long-term effects of neonatal seizures. Clin. Perinatol. 36, 901–914, vii–viii.
Holmes, G.L. (2015). Cognitive impairment in epilepsy: the role of network abnormalit ies. Epileptic Disord.
Int. Epilepsy J. Videotape 17, 101–116.
Holmes, G.L., Gairsa, J.L., Chevassus-Au-Louis, N., and Ben-Ari, Y. (1998). Consequences of neonatal
seizures in the rat: morphological and behavioral effects. Ann. Neurol. 44, 845–857.
Howell, K.B., McMahon, J.M., Carvill, G.L., Tambunan, D., Mackay, M.T., Rodriguez-Casero, V., Webster,
R., Clark, D., Freeman, J.L., Calvert, S., et al. (2015). SCN2A encephalopathy. Neurology 85, 958–966.
Huang, L., Cilio, M.R., Silveira, D.C., McCabe, B.K., Sogawa, Y., Stafstrom, C.E., and Holmes, G.L. (1999).
Long-term effects of neonatal seizures: a behavioral, electrophysiological, and histological study. Brain Res.
Dev. Brain Res. 118, 99–107.
Inoue, Y., Ohtsuka, Y., and STP-1 Study Group (2015). Long-term safety and efficacy of stiripentol for the
treatment of Dravet syndrome: A mult icenter, open-label study in Japan. Epilepsy Res. 113, 90–97.
Isaeva, E., Isaev, D., Khazipov, R., and Holmes, G.L. (2009). Long-term suppression of GABAergic activity
by neonatal seizures in rat somatosensory cortex. Ep ilepsy Res. 87, 286–289.
Isaeva, E., Isaev, D., Savrasova, A., Khazipov, R., and Holmes, G.L. (2010). Recurrent neonatal seizures
result in long-term increases in neuronal network excitability in the rat neocortex. Eur. J. Neurosci. 31, 1446–
1455.
Isaeva, E., Isaev, D., and Holmes, G.L. (2013). Alterat ion of synaptic plasticity by neonatal seizures in rat
somatosensory cortex. Epilepsy Res. 106, 280–283.
171
Ishii, A., Watkins, J.C., Chen, D., Hirose, S., and Hammer, M.F. (2016). Clin ical implications of SCN1A
missense and truncation variants in a large Japanese cohort with Dravet syndrome. Epilepsia.
Ishii, A., Watkins, J.C., Chen, D., Hirose, S., and Hammer, M.F. (2017). Clin ical implications of SCN1A
missense and truncation variants in a large Japanese cohort with Dravet syndrome. Epilepsia 58, 282–290.
Ito, S., Ogiwara, I., Yamada, K., Miyamoto, H., Hensch, T.K., Osawa, M., and Yamakawa, K. (2013). Mouse
with Nav1.1 haplo insufficiency, a model for Dravet syndrome, exhib its lowered sociability and learning
impairment. Neurobiol. Dis. 49, 29–40.
Jansen, F.E., Sadleir, L.G., Harkin, L.A., Vadlamudi, L., McMahon, J.M., Mulley, J.C., Scheffer, I. E., and
Berkovic, S.F. (2006). Severe myoclonic ep ilepsy of infancy (Dravet syndrome): recognition and diagnosis in
adults. Neurology 67, 2224–2226.
Jehi, L., Wyllie, E., and Devinsky, O. (2015). Ep ileptic encephalopathies: Optimizing seizure control and
developmental outcome. Epilepsia 56, 1486–1489.
Jiang, P., Shen, J., Yu, Y., Jiang, L., Xu, J., Xu, L., Yu , H., and Gao, F. (2016). Dravet syndrome with
favourable cognitive and behavioral development due to a novel SCN1A frameshift mutation. Clin. Neurol.
Neurosurg. 146, 144–146.
Kadiyala, S.B., Yannix, J.Q., Nalwalk, J.W., Papandrea, D., Beyer, B.S., Herron, B.J., and Ferland, R.J.
(2016). Eight Flurothyl-Induced Generalized Seizures Lead to the Rapid Evolution of Spontaneous Seizures in
Mice: A Model of Ep ileptogenesis with Seizure Remission. J. Neurosci. Off. J. Soc. Neurosci. 36, 7485–7496.
Kalume, F., Yu , F.H., Westenbroek, R.E., Scheuer, T., and Catterall, W.A. (2007a). Reduced sodium current
in Purkinje neurons from Nav1.1 mutant mice: implicat ions for ataxia in severe myoclonic epilepsy in infancy.
J. Neurosci. Off. J. Soc. Neurosci. 27, 11065–11074.
Kalume, F., Yu , F.H., Westenbroek, R.E., Scheuer, T., and Catterall, W.A. (2007b). Reduced sodium current
in Purkinje neurons from Nav1.1 mutant mice: implicat ions for ataxia in severe myoclonic epilepsy in infancy.
J. Neurosci. Off. J. Soc. Neurosci. 27, 11065–11074.
Kalume, F., Westenbroek, R.E., Cheah, C.S., Yu, F.H., Oakley, J.C., Scheuer, T., and Catterall, W.A. (2013).
Sudden unexpected death in a mouse model o f Dravet syndrome. J. Clin. Invest. 123, 1798–1808.
Kalume, F., Oakley, J.C., Westenbroek, R.E., Gile, J., de la Iglesia, H.O., Scheuer, T., and Catterall, W.A.
(2015). Sleep impairment and reduced interneuron excitability in a mouse model of Dravet Syndrome.
Neurobiol. Dis. 77, 141–154.
Kambouris, M., Thevenon, J., Soldatos, A., Cox, A., Stephen, J., Ben‐Omran, T., Al‐Sarraj, Y., Boulos, H.,
Bone, W., Mullikin, J.C., et al. (2016). Biallelic SCN10A mutations in neuromuscular d isease and epileptic
encephalopathy. Ann. Clin. Transl. Neurol. 4, 26–35.
Kang, D.H., Heo, R.W., Yi, C.-O., Kim, H., Choi, C.H., and Roh, G.S. (2015). High-fat diet-induced obesity
exacerbates kainic acid-induced hippocampal cell death. BMC Neurosci. 16, 72.
Karnam, H.B., Zhao, Q., Shatskikh, T., and Holmes, G.L. (2009a). Effect of age on cognitive sequelae
following early life seizures in rats. Ep ilepsy Res. 85, 221–230.
Karnam, H.B., Zhou, J.-L., Huang, L.-T., Zhao, Q., Shatskikh, T., and Holmes, G.L. (2009b). Early life
seizures cause long-standing impairment of the hippocampal map. Exp . Neurol. 217, 378–387.
Karoly, P.J., Nurse, E.S., Freestone, D.R., Ung, H., Cook, M.J., and Boston, R. (2017). Bursts of seizures in
long-term record ings of human focal epilepsy. Epilepsia.
Kassaï, B., Chiron, C., Augier, S., Cucherat, M., Rey, E., Gueyffier, F., Guerrin i, R., Vincent, J., Dulac, O.,
and Pons, G. (2008). Severe myoclonic epilepsy in infancy: a systematic rev iew and a meta -analysis of
individual patient data. Epilepsia 49, 343–348.
Kelley, A.E. (2001). Measurement of rodent stereotyped behavior. Curr. Protoc. Neurosci. Chapter 8, Unit
8.8.
Kepecs, A., and Fishell, G. (2014). Interneuron Cell Types: Fit to form and formed to fit. Nature 505, 318.
Kesner, R.P., and Churchwell, J.C. (2011). An analysis of rat prefrontal cortex in mediating executive
function. Neurobiol. Learn. Mem. 96, 417–431.
Kesner, R.P., and Rolls, E.T. (2015). A computational theory of hippocampal function, and tests of the theory:
new developments. Neurosci. Biobehav. Rev. 48, 92–147.
172
Kim, B.-S., Kim, M.-Y., and Leem, Y.-H. (2011). Hippocampal neuronal death induced by kain ic acid and
restraint stress is suppressed by exercise. Neuroscience 194, 291–301.
Kim, J.H., Lee, D.W., Choi, B.Y., Sohn, M., Lee, S.H., Choi, H.C., Song, H.K., and Suh, S.W. (2015).
Cytidine 5’-diphosphocholine (CDP-choline) adversely effects on pilocarp ine seizure-induced hippocampal
neuronal death. Brain Res 1595, 156–165.
Klassen, T., Davis, C., Goldman, A., Burgess, D., Chen, T., Wheeler, D., McPherson, J., Bourquin, T., Lewis,
L., Villasana, D., et al. (2011). Exome sequencing of ion channel genes reveals complex profiles confounding
personal risk assessment in epilepsy. Cell 145, 1036–1048.
Kleen, J.K., Sesqué, A., Wu, E.X., Miller, F.A., Hernan, A.E., Holmes, G.L., and Scott, R .C. (2011). Early-life
seizures produce lasting alterations in the structure and function of the prefrontal cortex. Ep ilepsy Behav. EB
22, 214–219.
Knowlton, B.J., Mangels, J.A., and Squire, L.R. (1996). A neostriatal habit learn ing system in humans.
Science 273, 1399–1402.
Kole, M.H.P., and Stuart, G.J. (2012). Signal processing in the axon initial segment. Neuron 73, 235–247.
Korff, C., Laux, L., Kelley, K., Goldstein, J., Koh, S., and Nordli, D. (2007). Dravet syndrome (severe
myoclonic epilepsy in infancy): a retrospective study of 16 patients. J. Child Neuro l. 22, 185–194.
Koyama, R., Tao, K., Sasaki, T., Ichikawa, J., Miyamoto, D., Muramatsu, R., Matsuki, N., and Ikegaya, Y.
(2012). GABAergic excitation after febrile seizures induces ectopic granule cells and adult epilepsy. Nat.
Med. 18, 1271–1278.
Kwak, S.-E., Kim, J.-E., Kim, S.C., Kwon, O.-S., Choi, S.-Y., and Kang, T.-C. (2008). Hyperthermic seizure
induces persistent alteration in excitability of the dentate gyrus in immature rats. Brain Res. 1216, 1–15.
Lai, H.C., and Jan, L.Y. (2006). The distribution and targeting of neuronal voltage -gated ion channels. Nat.
Rev. Neurosci. 7, 548–562.
de Lanerolle, N.C., Kim, J.H., Robbins, R.J., and Spencer, D.D. (1989). Hippocampal interneuron loss and
plasticity in human temporal lobe epilepsy. Brain Res. 495, 387–395.
Lassalle, J.M., Bataille, T., and Halley, H. (2000). Reversible inactivation of the hippocampal mossy fiber
synapses in mice impairs spatial learning, but neither consolidation nor memory ret rieval, in the Morris
navigation task. Neurob iol. Learn. Mem. 73, 243–257.
Laux, L., and Blackford , R. (2013). The ketogenic diet in Dravet syndrome. J. Child Neuro l. 28, 1041–1044.
Lee, I., and Kesner, R.P. (2004). Encoding versus retrieval of spatial memory: double dissociation between the
dentate gyrus and the perforant path inputs into CA3 in the dorsal hippocampus. Hippocampus 14, 66–76.
Lee, Y.-J., Lee, J.S., Kang, H.-C., Kim, D.-S., Shim, K.-W., Eom, S., and Kim, H.D. (2014). Outcomes of
epilepsy surgery in childhood-onset epileptic encephalopathy. Brain Dev. 36, 496–504.
Lemmens, E.M.P., Aendekerk, B., Schijns, O.E.M.G., Blokland, A., Beu ls, E.A.M., and Hoogland, G. (2009).
Long-term behavioral outcome after early -life hyperthermia-induced seizures. Ep ilepsy Behav. EB 14, 309–
315.
Leo, D., and Gainetdinov, R.R. (2013). Transgenic mouse models for ADHD. Cell Tissue Res. 354, 259–271.
Li, B.-M., Liu, X.-R., Yi, Y.-H., Deng, Y.-H., Su, T., Zou, X., and Liao, W.-P. (2011). Autism in Dravet
syndrome: prevalence, features, and relationship to the clinical characteristics of epilepsy and mental
retardation. Epilepsy Behav. EB 21, 291–295.
Liautard, C., Scalmani, P., Carriero, G., de Curt is, M., Franceschetti, S., and Mantegazza, M. (2013).
Hippocampal hyperexcitability and specific ep ileptiform activity in a mouse model of Dravet syndrome.
Epilepsia 54, 1251–1261.
Liu, Z., Gatt, A., Mikati, M., and Holmes, G.L. (1993). Effect of temperature on kainic acid -induced seizures.
Brain Res. 631, 51–58.
Liu, Z., Yang, Y., Silveira, D.C., Sarkisian, M.R., Tandon, P., Huang, L.T., Stafstrom, C.E., and Holmes, G.L.
(1999). Consequences of recurrent seizures during early brain development. Neuroscience 92, 1443–1454.
Lossin, C. (2009). A catalog of SCN1A variants. Brain Dev. 31, 114–130.

173
Lothman, E.W., Stringer, J.L., and Bertram, E.H. (1992). The dentate gyrus as a control point for seizures in
the hippocampus and beyond. Epilepsy Res. Suppl. 7, 301–313.
Macrae, C.N., and Bodenhausen, G.V. (2000). Social cognition: thinking categorically about others. Annu.
Rev. Psychol. 51, 93–120.
Madroñal, N., Delgado-García, J.M., Fernández-Guizán, A., Chatterjee, J., Köhn, M., Mattucci, C., Jain, A.,
Tsetsenis, T., Illarionova, A., Grinevich, V., et a l. (2016). Rap id erasure of hippocampal memory fo llowing
inhibit ion of dentate gyrus granule cells. Nat. Commun. 7.
Mahoney, K., Moore, S.J., Buckley, D., Alam, M., Parfrey, P., Penney, S., Merner, N., Hodgkinson, K., and
Young, T.-L. (2009). Variable neurologic phenotype in a GEFS+ family with a novel mutation in SCN1A.
Seizure 18, 492–497.
Makinson, C.D., Dutt, K., Lin, F., Papale, L.A., Shankar, A., Barela, A.J., Liu, R., Gold in, A.L., and Escayg,
A. (2016). An Scn1a epilepsy mutation in Scn8a alters seizure susceptibility and behavior. Exp . Neurol. 275
Pt 1, 46–58.
Malcolmson, J., Kleyner, R., Tegay, D., Adams, W., Ward, K., Coppinger, J., Nelson, L., Meisler, M.H.,
Wang, K., Robison, R., et al. (2016). SCN8A mutation in a child presenting with seizures and developmental
delays. Cold Spring Harb. Mol. Case Stud. 2.
Mantegazza, M., and Catterall, W.A. (2012). Voltage-Gated Na+ Channels: Structure, Function, and
Pathophysiology. In Jasper’s Basic Mechanisms of the Epilepsies, J.L. Noebels, M. Avoli, M.A. Ro gawski,
R.W. Olsen, and A.V. Delgado-Escueta, eds. (Bethesda (MD)), p.
Mantegazza, M., Gambardella, A., Rusconi, R., Schiavon, E., Annesi, F., Cassulini, R.R., Labate, A.,
Carrideo, S., Chifari, R., Canevini, M.P., et al. (2005). Identification of an Nav1. 1 sodium channel (SCN1A)
loss-of-function mutation associated with familial simple febrile seizures. Proc. Natl. Acad. Sci. U. S. A. 102,
18177–18182.
Marini, C., Mei, D., Helen Cross, J., and Guerrin i, R. (2006). Mosaic SCN1A mutation in familial severe
myoclonic epilepsy of infancy. Epilepsia 47, 1737–1740.
Marini, C., Scheffer, I.E., Nabbout, R., Mei, D., Cox, K., Dibbens, L.M., McMahon, J.M., Iona, X.,
Carp intero, R.S., Elia, M., et al. (2009). SCN1A duplications and deletions detected in Dravet syndrome:
implications for molecular diagnosis. Epilepsia 50, 1670–1678.
Martin, M.S., Tang, B., Papale, L.A., Yu, F.H., Catterall, W.A., and Escayg, A. (2007). The voltage -gated
sodium channel Scn8a is a genetic modifier of severe myoclonic ep ilepsy of infancy. Hum. Mol. Genet. 16,
2892–2899.
Martin, M.S., Dutt, K., Papale, L.A., Dubé, C.M., Dutton, S.B., de Haan, G., Shankar, A., Tufik, S., Meisler,
M.H., Baram, T.Z., et al. (2010a). A ltered function of the SCN1A voltage-gated sodium channel leads to
gamma-aminobutyric acid-erg ic (GABAerg ic) interneuron abnormalit ies. J. Biol. Chem. 285, 9823–9834.
Martin, M.S., Dutt, K., Papale, L.A., Dubé, C.M., Dutton, S.B., de Haan, G., Shankar, A., Tufik, S., Meisler,
M.H., Baram, T.Z., et al. (2010b). Altered function of the SCN1A voltage-gated sodium channel leads to
gamma-aminobutyric acid-erg ic (GABAerg ic) interneuron abnormalit ies. J. Biol. Chem. 285, 9823–9834.
Mashimo, T., Ohmori, I., Ouchida, M., Ohno, Y., Tsurumi, T., Miki, T., Wakamori, M., Ishihara, S., Yoshida,
T., Takizawa, A., et al. (2010). A missense mutation of the gene encoding voltage-dependent sodium channel
(Nav1.1) confers susceptibility to febrile seizures in rats. J. Neurosci. Off. J. Soc. Neurosci. 30, 5744–5753.
Matsuzaka, T., Baba, H., Matsuo, A., Tsuru, A., Moriuchi, H., Tanaka, S., and Kawasaki, C. (2001).
Developmental assessment-based surgical intervention for intractable epilepsies in infants and young children.
Ep ilepsia 42 Suppl 6, 9–12.
McCabe, B.K., Silveira, D.C., Cilio, M.R., Cha, B.H., Liu, X., Sogawa, Y., and Holmes, G.L. (2001). Reduced
neurogenesis after neonatal seizures. J. Neurosci. Off. J. Soc. Neurosci. 21, 2094–2103.
McClelland, S., Dubé, C.M., Yang, J., and Baram, T.Z. (2011). Epileptogenesis after prolonged febrile
seizures: mechanis ms, biomarkers and therapeutic opportunities. Neurosci. Lett. 497, 155–162.
Mcilvoy, L.H. (2005). The effect of hypothermia and hyperthermia on acute brain injury. AACN Clin. Issues
16, 488–500.
Meisler, M.H., and Kearney, J.A. (2005). Sodium channel mutations in epilepsy and other neurological
disorders. J. Clin. Invest. 115, 2010.

174
Meisler, M.H., Kearney, J., Escayg, A., MacDonald, B.T., and Sprunger, L.K. (2001). Sodium channels and
neurological disease: insights from Scn8a mutations in the mouse. Neurosci. Rev. J. Bringing Neurobiol.
Neurol. Psychiatry 7, 136–145.
Messner, D.J., and Catterall, W.A. (1985). The sodium channel from rat brain. Separation and characterization
of subunits. J. Biol. Chem. 260, 10597–10604.
Miller, A.R., Hawkins, N.A., McCollom, C.E., and Kearney, J.A. (2014). Mapping genetic modifiers of
survival in a mouse model of Dravet syndrome. Genes Brain Behav. 13, 163–172.
Misra, S.N., Kahlig, K.M., and George, A.L. (2008). Impaired NaV1.2 Function and Reduced Cell Surface
Expression in Benign Familial Neonatal-Infantile Seizures. Epilepsia 49, 1535–1545.
Mistry, A.M., Thompson, C.H., Miller, A.R., Vanoye, C.G., George, A.L., and Kearney, J.A. (2014). Strain -
and Age-dependent Hippocampal Neuron Sodium Currents Correlate with Epilepsy Severity in Dravet
Syndrome Mice. Neurobiol. Dis. 65, 1–11.
Mitchell, J.P., Macrae, C.N., and Banaji, M.R. (2006). Dissociable medial prefrontal contributions to
judgments of similar and dissimilar others. Neuron 50, 655–663.
Mlsna, L.M., and Koh, S. (2013). Maturation-dependent behavioral deficits and cell inju ry in developing
animals during the subacute postictal period. Epilepsy Behav. EB 29, 190–197.
Morgan, K., Stevens, E.B., Shah, B., Cox, P.J., Dixon, A.K., Lee, K., Pinnock, R.D., Hughes, J., Richardson,
P.J., Mizuguchi, K., et al. (2000). beta 3: an additional auxiliary subunit of the voltage -sensitive sodium
channel that modulates channel gating with distinct kinetics. Proc. Nat l. Acad. Sci. U. S. A. 97, 2308–2313.
Morice, E., Farley, S., Poirier, R., Dallerac, G., Chagneau, C., Pannetier, S., Hanauer, A., Davis, S., Vaillend,
C., and Laroche, S. (2013). Defective synaptic transmission and structure in the dentate gyrus and selective
fear memory impairment in the Rsk2 mutant mouse model of Coffin -Lowry syndrome. Neurobiol. Dis. 58,
156–168.
Moroni, R.F., Inverard i, F., Regondi, M.C., Panzica, F., Spreafico, R., and Frassoni, C. (2008). Altered spatial
distribution of PV-cortical cells and dysmorphic neurons in the somatosensory cortex of BCNU-treated rat
model of cort ical dysplasia. Epilepsia 49, 872–887.
Morris, R.G., Anderson, E., Lynch, G.S., and Baudry, M. (1986). Selective impairment of learn ing and
blockade of long-term potentiation by an N-methyl-D-aspartate receptor antagonist, AP5. Nature 319, 774–
776.
Mula, M., and Sander, J.W. (2016). Psychosocial aspects of epilepsy: a wider approach. BJPsych Open 2,
270–274.
Mulley, J.C., Scheffer, I.E., Petrou, S., Dibbens, L.M., Berkovic, S.F., and Harkin, L.A. (2005). SCN1A
mutations and epilepsy. Hum. Mutat. 25, 535–542.
Myers, K.A., Burgess, R., Afawi, Z., Damiano, J.A., Berkovic, S.F., Hildebrand, M.S., and Scheffer, I.E.
(2017). De novo SCN1A pathogenic variants in the GEFS+ spectrum: Not always a familial syndrome.
Epilepsia.
Nabbout, R., Gennaro, E., Dalla Bernard ina, B., Dulac, O., Madia, F., Bertin i, E., Capovilla, G., Chiron, C.,
Cristofori, G., Elia, M., et al. (2003). Spectrum of SCN1A mutations in severe myoclonic ep ilepsy of infancy.
Neurology 60, 1961–1967.
Nabbout, R., Copio li, C., Chipaux, M., Chemaly, N., Desguerre, I., Dulac, O., and Chiron, C. (2011).
Ketogenic diet also benefits Dravet syndrome patients receiving stiripentol: a prospective pilot study.
Ep ilepsia 52, e54-57.
Nabbout, R., Chemaly, N., Chipaux, M., Barcia, G., Bouis, C., Dubouch, C., Leunen, D., Jambaqué, I., Dulac,
O., Dellatolas, G., et al. (2013). Encephalopathy in children with Dravet syndrome is not a pure consequence
of epilepsy. Orphanet J. Rare Dis. 8, 176.
Nagao, S., and Kitazawa, H. (2008). [Role of the cerebellum in the acquisition and consolidation of motor
memory]. Brain Nerve Shinkei Kenkyu No Shinpo 60, 783–790.
Nashef, L. (1997). Sudden unexpected death in epilepsy: terminology and definitions. Ep ilepsia 38, S6-8.

175
Neill, J.C., Liu, Z., Sarkisian, M., Tandon, P., Yang, Y., Stafstrom, C.E., and Holmes, G.L. (1996). Recurrent
seizures in immature rats: effect on auditory and visual discrimination. Brain Res. Dev. Brain Res. 95, 283–
292.
Neves, G., Cooke, S.F., and Bliss, T.V.P. (2008). Synaptic plasticity, memory and the hippocampus: a neural
network approach to causality. Nat. Rev. Neurosci. 9, 65–75.
Nieto-Barrera, M., Lillo, M.M., Rodríguez-Collado, C., Candau, R., and Correa, A. (2000). [Severe myoclonic
epilepsy in childhood. Epidemiologic analytical study]. Rev. Neuro l. 30, 620–624.
Nishimura, M., Gu , X., and Swann, J.W. (2011). Seizures in early life suppress hippocampal dendrite growth
while impairing spatial learn ing. Neurobio l. Dis. 44, 205–214.
Notenboom, R.G.E., Ramakers, G.M.J., Kamal, A., Spruijt, B.M., and de Graan, P.N.E. (2010). Long-lasting
modulation of synaptic plasticity in rat hippocampus after early-life complex febrile seizures. Eur. J. Neurosci.
32, 749–758.
Oakley, J.C., Kalume, F., Yu , F.H., Scheuer, T., and Catterall, W.A. (2009a). Temperature- and age-dependent
seizures in a mouse model of severe myoclonic epilepsy in infancy. Proc. Nat l. Acad. Sci. U. S. A. 106, 3994–
3999.
Oakley, J.C., Kalume, F., Yu, F.H., Scheuer, T., and Catterall, W.A. (2009b). Temperature - and age-
dependent seizures in a mouse model of severe myoclonic epilepsy in infancy. Proc. Nat l. Acad. Sci. U. S. A.
106, 3994–3999.
O’Connell, B.K., Gloss, D., and Devinsk, O. (2017). Cannabinoids in treatment -resistant epilepsy: A review.
Epilepsy Behav. EB.
Ogino, T., Ohtsuka, Y., Yamatogi, Y., Oka, E., and Ohtahara, S. (1989). The epileptic syndrome sharing
common characteristics during early childhood with severe myoclonic ep ilepsy in in fancy. Jpn. J. Psychiatry
Neurol. 43, 479–481.
Ogiwara, I., Miyamoto, H., Morita, N., Atapour, N., Mazaki, E., Inoue, I., Takeuchi, T., Itohara, S.,
Yanagawa, Y., Obata, K., et al. (2007). Nav1.1 localizes to axons of parvalbumin -positive inhibitory
interneurons: a circu it basis for epileptic seizures in mice carrying an Scn1a gene mutation. J. Neurosci. Off. J.
Soc. Neurosci. 27, 5903–5914.
Ogiwara, I., Ito, K., Sawaishi, Y., Osaka, H., Mazaki, E., Inoue, I., Montal, M., Hashikawa, T., Sh ike, T.,
Fujiwara, T., et al. (2009). De novo mutations of voltage-gated sodium channel αII gene SCN2A in intractable
epilepsies. Neurology 73, 1046–1053.
Ogiwara, I., Iwasato, T., Miyamoto, H., Iwata, R., Yamagata, T., Mazaki, E., Yanagawa, Y., Tamamaki, N.,
Hensch, T.K., Itohara, S., et al. (2013). Nav1.1 haploinsufficiency in excitatory neurons ameliorates seizure -
associated sudden death in a mouse model of Dravet syndrome. Hum. Mol. Genet. 22, 4784–4804.
Oguni, H., Hayashi, K., Awaya, Y., Fukuyama, Y., and Osawa, M. (2001). Severe myoclonic ep ilepsy in
infants--a review based on the Tokyo Women’s Medical University series of 84 cases. Brain Dev. 23, 736–
748.
Ohmori, I., Ouchida, M., Miki, T ., Mimaki, N., Kiyonaka, S., Nishiki, T., Tomizawa, K., Mori, Y., and
Matsui, H. (2008). A CACNB4 mutation shows that altered Ca(v)2.1 function may be a genetic modifier of
severe myoclonic epilepsy in infancy. Neurobiol. Dis. 32, 349–354.
Ohmori, I., Ouchida, M., Kobayashi, K., Jitsumori, Y., Mori, A., Michiue, H., Nishiki, T., Ohtsuka, Y., and
Matsui, H. (2013). CACNA1A variants may modify the epileptic phenotype of Dravet syndrome. Neurobiol.
Dis. 50, 209–217.
Ohmori, I., Kawakami, N., Liu, S., Wang, H., Miyazaki, I., Asanuma, M., Michiue, H., Matsui, H., Mashimo,
T., and Ouchida, M. (2014). Methylphenidate improves learning impairments and hyperthermia -induced
seizures caused by an Scn1a mutation. Epilepsia 55, 1558–1567.
Ohno, Y., Ishihara, S., Mashimo, T., Sofue, N., Shimizu, S., Imaoku, T., Tsurumi, T., Sasa, M., and Serikawa,
T. (2011). Scn1a missense mutation causes limbic hyperexcitability and vulnerability to experimental febrile
seizures. Neurobio l. Dis. 41, 261–269.
O’Keefe, J., Burgess, N., Donnett, J.G., Jeffery, K.J., and Maguire, E.A. (1998). Place cells, navigational
accuracy, and the human hippocampus. Philos. Trans. R. Soc. Lond. B. Biol. Sci. 353, 1333–1340.

176
Olivieri, G., Battaglia, D., Chieffo, D., Rubbino, R., Ranalli, D., Contaldo, I., Dravet, C., Mercuri, E., and
Guzzetta, F. (2016). Cognitive-behavioral profiles in teenagers with Dravet syndrome. Brain Dev.
Olton, D.S., and Samuelson, R.J. (1976). Remembrance of places passed: Spatial memory in rats. J. Exp .
Psychol. Anim. Behav. Process. 2, 97–116.
Osaka, H., Ogiwara, I., Mazaki, E., Okamura, N., Yamashita, S., Iai, M., Yamada, M., Kurosawa, K.,
Iwamoto, H., Yasui-Furukori, N., et al. (2007). Patients with a sodium channel alpha 1 gene mutation show
wide phenotypic variation. Epilepsy Res. 75, 46–51.
Papale, L.A., Makinson, C.D., Christopher Ehlen, J., Tufik, S., Decker, M.J., Paul, K.N., and Escayg, A.
(2013). Altered sleep regulation in a mouse model of SCN1A-derived genetic epilepsy with febrile seizures
plus (GEFS+). Ep ilepsia 54, 625–634.
Parihar, R., and Ganesh, S. (2013). The SCN1A gene variants and epileptic encephalopathies. J. Hum. Genet.
58, 573–580.
Passamonti, C., Petrelli, C., Mei, D., Foschi, N., Guerrin i, R., Provinciali, L., and Zamponi, N. (2015). A
novel inherited SCN1A mutation associated with d ifferent neuropsychological phenotypes: is there a common
core deficit? Epilepsy Behav. EB 43, 89–92.
Pathak, H.R., Weissinger, F., Terunuma, M., Carlson, G.C., Hsu, F.-C., Moss, S.J., and Coulter, D.A. (2007).
Disrupted dentate granule cell chloride regulation enhances synaptic excitability during development of
temporal lobe epilepsy. J. Neurosci. Off. J. Soc. Neurosci. 27, 14012–14022.
Petilla Interneuron Nomenclature Group, Ascoli, G.A., A lonso-Nanclares, L., Anderson, S.A., Barrionuevo,
G., Benavides-Piccione, R., Burkhalter, A., Buzsáki, G., Cauli, B., Defelipe, J., et al. (2008). Petilla
terminology: nomenclature of features of GABAerg ic interneurons of the cerebral cortex. Nat. Rev. Neurosci.
9, 557–568.
Phillips, R.G., and LeDoux, J.E. (1992). Differential contribution of amygdala and hippocampus to cued and
contextual fear conditioning. Behav. Neurosci. 106, 274–285.
Pineda-Tru jillo, N., Carrizosa, J., Cornejo, W., Arias, W., Franco, C., Cabrera, D., Bedoya, G., and Ruíz -
Linares, A. (2005). A novel SCN1A mutation associated with severe GEFS+ in a large South American
pedigree. Seizure 14, 123–128.
Porter, R. (2003). Madness: A Brief History (Oxford, New York: Oxford University Press).
Press, C.A., Knupp, K.G., and Chapman, K.E. (2015). Parental reporting of response to oral cannabis extracts
for treatment of refractory epilepsy. Ep ilepsy Behav. EB 45, 49–52.
Prut, L., and Belzung, C. (2003). The open field as a paradigm to measure the effects of d rugs on anxiety -like
behaviors: a review. Eur. J. Pharmacol. 463, 3–33.
Purcell, R.H., Papale, L.A., Makinson, C.D., Sawyer, N.T., Schroeder, J.P., Escayg, A., and Weinshenker, D.
(2013). Effects of an epilepsy-causing mutation in the SCN1A sodium channel gene on cocaine-induced
seizure susceptibility in mice. Psychopharmacology (Berl.) 228, 263–270.
Quinn, R. (2005). Comparing rat’s to human’s age: how old is my rat in people years? Nutr. Burbank Los
Angel. Cty. Calif 21, 775–777.
Ragona, F., Brazzo, D., De Giorg i, I., Morb i, M., Freri, E., Teutonico, F., Gennaro, E., Zara, F., Binelli, S.,
Veggiotti, P., et al. (2010). Dravet syndrome: early clinical manifestations and cognitive outcome in 37 Italian
patients. Brain Dev. 32, 71–77.
Ragona, F., Granata, T., Dalla Bernard ina, B., Offred i, F., Darra, F., Battaglia, D., Morbi, M., Brazzo, D.,
Cappellett i, S., Chieffo, D., et al. (2011a). Cognitive development in Dravet syndrome: a retrospective,
multicenter study of 26 patients. Epilepsia 52, 386–392.
Ragona, F., Granata, T., Dalla Bernard ina, B., Offred i, F., Darra, F., Battaglia, D., Morbi, M., Brazzo, D.,
Cappellett i, S., Chieffo, D., et al. (2011b). Cognit ive development in Dravet syndrome: a retrospective,
multicenter study of 26 patients. Epilepsia 52, 386–392.
Rajab, E., Abdeen, Z., Hassan, Z., Alsaffar, Y., Mandeel, M., Al Shawaaf, F., Al-Ansari, S., and Kamal, A.
(2014). Cognitive performance and convulsion risk after experimentally -induced febrile-seizures in rat. Int. J.
Dev. Neurosci. Off. J. Int. Soc. Dev. Neurosci. 34, 19–23.

177
Reilly, C., Atkinson, P., Das, K.B., Chin, R.F.M., Aylett, S.E., Burch, V., Gillberg, C., Scott, R.C., and
Neville, B.G.R. (2015). Cognition in school-aged children with “active” epilepsy: A population-based study. J.
Clin. Exp. Neuropsychol. 37, 429–438.
Reynolds, E.H. (2002). Introduction: epilepsy in the world. Ep ilepsia 43 Suppl 6, 1–3.
Ricci, D., Chieffo, D., Battaglia, D., Brogna, C., Contaldo, I., De Clemente, V., Losito, E., Dravet, C.,
Mercuri, E., and Guzzetta, F. (2015). A prospective longitudinal study on visuo-cognitive development in
Dravet syndrome: Is there a “dorsal stream vulnerab ility”? Epilepsy Res 109, 57–64.
Richmond, C.A. (2003). The role of argin ine vasopressin in thermoregulation during fever. J. Neurosci. Nurs.
J. Am. Assoc. Neurosci. Nurses 35, 281–286.
Rilstone, J.J., Coelho, F.M., Minassian, B.A., and Andrade, D.M. (2012). Dravet syndrome: seizure control
and gait in adults with different SCN1A mutations. Ep ilepsia 53, 1421–1428.
Riva, D., Vago, C., Pantaleoni, C., Bulgheroni, S., Mantegazza, M., and Franceschetti, S. (2009). Progressive
neurocognitive decline in two children with Dravet syndrome, de novo SCN1A truncations and different
epileptic phenotypes. Am. J. Med. Genet. A. 149A, 2339–2345.
Romijn, H.J., Hofman, M.A., and Gramsbergen, A. (1991). At what age is the developing cerebral cortex of
the rat comparable to that of the full-term newborn human baby? Early Hum. Dev. 26, 61–67.
Rubinstein, M., Westenbroek, R.E., Yu, F.H., Jones, C.J., Scheuer, T., and Catterall, W.A. (2015a). Genetic
background modulates impaired excitability of inhib itory neurons in a mouse model of Dravet syndrome.
Neurobiol. Dis. 73, 106–117.
Rubinstein, M., Han, S., Tai, C., Westenbroek, R.E., Hunker, A., Scheuer, T., and Catterall, W.A. (2015b).
Dissecting the phenotypes of Dravet syndrome by gene deletion. Brain J. Neurol. 138, 2219–2233.
Rubinstein, M., Westenbroek, R.E., Yu, F.H., Jones, C.J., Scheuer, T., and Catterall, W.A. (2015c). Genetic
background modulates impaired excitability of inhib itory neurons in a mouse model of Dravet syndrome.
Neurobiol. Dis. 73, 106–117.
Rubinstein, M., Westenbroek, R.E., Yu, F.H., Jones, C.J., Scheuer, T., and Catterall, W.A. (2015d). Genetic
background modulates impaired excitability of inhib itory neurons in a mou se model of Dravet syndrome.
Neurobiol. Dis. 73, 106–117.
Rusconi, R., Scalmani, P., Cassulini, R.R., Giunti, G., Gambardella, A., Franceschetti, S., Annesi, G., Wanke,
E., and Mantegazza, M. (2007). Modulatory proteins can rescue a trafficking defective epileptogenic Nav1.1
Na+ channel mutant. J. Neurosci. Off. J. Soc. Neurosci. 27, 11037–11046.
Rusconi, R., Combi, R., Cestèle, S., Grioni, D., Franceschetti, S., Dalprà, L., and Mantegazza, M. (2009). A
rescuable folding defective Nav1.1 (SCN1A) sodium channel mutant causes GEFS+: common mechanism in
Nav1.1 related epilepsies? Hum. Mutat. 30, E747-760.
Sankar, R., and Mazarati, A. (2012). Neurobio logy of Depression as a Comorbid ity of Ep ilepsy. In Jasper’s
Basic Mechanisms of the Epilepsies, J.L. Noebels, M. Avoli, M.A. Rogawski, R.W. Olsen, and A.V. Delgado-
Escueta, eds. (Bethesda (MD): Nat ional Center for Biotechnology Information (US)), p.
Sawyer, N.T., Helv ig, A.W., Makinson, C.D., Decker, M.J., Neigh, G.N., and Escayg, A. (2016). Scn1a
dysfunction alters behavior but not the effect of stress on seizure response. Genes Brain Behav. 15, 335–347.
Schaeffel, F. (2008). Test systems for measuring ocular parameters and v isual function in mice. Front. Biosci.
J. Virtual Libr. 13, 4904–4911.
Scheffer, I.E. (2015). Vaccination Triggers, Rather Than Causes, Seizures. Ep ilepsy Curr. 15, 335–337.
Scheffer, I.E., and Berkovic, S.F. (1997). Generalized ep ilepsy with febrile seizures plus. A genetic disorder
with heterogeneous clinical phenotypes. Brain J. Neurol. 120 ( Pt 3), 479–490.
Scheffer, I.E., Wallace, R., Mulley, J.C., and Berkovic, S.F. (2001). Clin ical and molecular genetics of
myoclonic-astatic epilepsy and severe myoclonic epilepsy in infancy (Dravet syndrome). Brain Dev. 23, 732–
735.
Scheffer, I.E., French, J., Hirsch, E., Jain, S., Mathern, G.W., Moshé, S.L., Perucca, E., Tomson, T., W iebe,
S., Zhang, Y.-H., et al. (2016). Classification of the epilepsies: New concepts for discussion and debate—
Special report of the ILAE Classificat ion Task Force of the Commission for Classificat ion and Terminology.
Ep ilepsia Open 1, 37–44.

178
Schoonjans, A., Paelinck, B.P., Marchau, F., Gunning, B., Gammaitoni, A., Galer, B.S., Lagae, L., and
Ceulemans, B. (2017). Low-dose fenfluramine significantly reduces seizure frequency in Dravet syndrome: a
prospective study of a new cohort of patients. Eur. J. Neurol. 24, 309–314.
Schuchmann, S., Schmitz, D., Rivera, C., Vanhatalo, S., Salmen, B., Mackie, K., Sipilä, S.T., Voipio, J., and
Kaila, K. (2006). Experimental febrile seizures are precipitated by a hyperthermia-induced respiratory
alkalosis. Nat. Med. 12, 817–823.
Schuchmann, S., Hauck, S., Henning, S., Grüters -Kieslich, A., Vanhatalo, S., Schmitz, D., and Kaila, K.
(2011). Respiratory alkalosis in children with febrile seizures. Epilepsia 52, 1949–1955.
Scoville, W.B., and Milner, B. (1957). Loss of recent memory after bilateral hippocampal lesions. J. Neurol.
Neurosurg. Psychiatry 20, 11–21.
Shinnar, S., and Pellock, J.M. (2002). Update on the epidemio logy and prognosis of pediat ric epilepsy. J.
Child Neurol. 17 Suppl 1, S4-17.
Sillanpää, M., Suominen, S., Rautava, P., and Aromaa, M. (2011). Academic and social success in adolescents
with previous febrile seizures. Seizure 20, 326–330.
Singh, N.A., Pappas, C., Dahle, E.J., Claes, L.R.F., Pruess, T.H., De Jonghe, P., Thompson, J., Dixon, M.,
Gurnett, C., Peiffer, A., et al. (2009). A role of SCN9A in human epilepsies, as a cause of febrile seizures and
as a potential modifier of Dravet syndrome. PLoS Genet. 5, e1000649.
Singh, R., Scheffer, I.E., Crossland, K., and Berkovic, S.F. (1999). Generalized epilepsy with febrile seizures
plus: a common childhood-onset genetic epilepsy syndrome. Ann. Neurol. 45, 75–81.
Singh, R., Andermann, E., Whitehouse, W.P., Harvey, A.S., Keene, D.L., Sen i, M.H., Crossland, K.M.,
Andermann, F., Berkovic, S.F., and Scheffer, I.E. (2001). Severe myoclonic ep ilepsy of infancy: extended
spectrum of GEFS+? Epilepsia 42, 837–844.
Sowers, L.P., Massey, C.A., Gehlbach, B.K., Granner, M.A., and Richerson, G.B. (201 3). Sudden unexpected
death in epilepsy: fatal post-ictal respiratory and arousal mechanis ms. Respir. Physiol. Neurobiol. 189, 315–
323.
Sperber, E.F., Haas, K.Z., Stanton, P.K., and Moshé, S.L. (1991). Resistance of the immature h ippocampus to
seizure-induced synaptic reorganization. Brain Res. Dev. Brain Res. 60, 88–93.
Squire, L.R. (1992). Memory and the hippocampus: a synthesis from findings with rats, monkeys, and
humans. Psychol. Rev. 99, 195–231.
Squire, L.R., and Knowlton, B.J. (1995). Learn ing about categories in the absence of memory. Proc. Natl.
Acad. Sci. U. S. A. 92, 12470–12474.
Stafstrom, C.E., Thompson, J.L., and Holmes, G.L. (1992). Kainic acid seizures in the developing brain : status
epilepticus and spontaneous recurrent seizures. Brain Res. Dev. Brain Res. 65, 227–236.
Stafstrom, C.E., Chronopoulos, A., Thurber, S., Thompson, J.L., and Holmes, G.L. (1993). Age -dependent
cognitive and behavioral deficits after kainic acid seizures. Epilepsia 34, 420–432.
Subash, M., Sheth, H.G., Saihan, Z., and Plant, G.T. (2010). Transient visual loss after seizures. Clin.
Experiment. Ophthalmol. 38, 734–735.
Sugawara, T., Mazaki–Miyazaki, E., Ito, M., Nagafu ji, H., Fukuma, G., Mitsudome, A., Wada, K., Kaneko, S.,
Hirose, S., and Yamakawa, K. (2001). Nav1.1 mutations cause febrile seizures associated with afebrile partial
seizures. Neuro logy 57, 703–705.
Sugawara, T., Mazaki-Miyazaki, E., Fukushima, K., Shimomura, J., Fujiwara, T., Hamano, S., Inoue, Y., and
Yamakawa, K. (2002). Frequent mutations of SCN1A in severe myoclonic epilepsy in infancy. Neurology 58,
1122–1124.
Suls, A., Velizarova, R., Yordanova, I., Deprez, L., Van Dyck, T., Wauters, J., Guergueltcheva, V., Claes,
L.R.F., Kremensky, I., Jordanova, A., et al. (2010). Four generations of epilepsy caus ed by an inherited
microdelet ion of the SCN1A gene. Neurology 75, 72–76.
Sundberg, K.A., Mitchell, J.F., Gawne, T.J., and Reynolds, J.H. (2012). Attention influences single unit and
local field potential response latencies in visual cortical area V4. J. Neurosci. Off. J. Soc. Neurosci. 32,
16040–16050.

179
Swijsen, A., Avila, A., Brône, B., Janssen, D., Hoogland, G., and Rigo, J. -M. (2012). Experimental early-life
febrile seizures induce changes in GABA(A) R-mediated neurotransmission in the dentate gyrus. Epilepsia 53,
1968–1977.
Tai, C., Abe, Y., Westenbroek, R.E., Scheuer, T., and Catterall, W.A. (2014). Impaired excitability of
somatostatin- and parvalbumin-expressing cortical interneurons in a mouse model of Dravet syndrome. Proc.
Natl. Acad. Sci. U. S. A. 111, E3139-3148.
Takaori, T., Kumakura, A., Ishii, A., Hirose, S., and Hata, D. (2017). Two mild cases of Dravet syndrome with
truncating mutation of SCN1A. Brain Dev. 39, 72–74.
Takayama, R., Fujiwara, T., Sh igematsu, H., Imai, K., Takahashi, Y., Yamakawa, K., and Inoue, Y. (2014).
Long-term course of Dravet syndrome: a study from an epilepsy center in Japan. Epilepsia 55, 528–538.
Tao, K., Ichikawa, J., Matsuki, N., Ikegaya, Y., and Koyama, R. (2016). Experimental febrile seizures induce
age-dependent structural plasticity and improve memory in mice. Neuroscience 318, 34–44.
Thomas, E.A., Hawkins, R.J., Richards, K.L., Xu, R., Gazina, E.V., and Petrou, S. (2009). Heat opens axon
initial segment sodium channels: a febrile seizure mechanis m? Ann. Neuro l. 66, 219–226.
Thurman, D.J., Beghi, E., Begley, C.E., Berg, A.T., Buchhalter, J.R., Ding, D., Hesdorffer, D.C., Hauser,
W.A., Kazis, L., Kobau, R., et al. (2011). Standards for epidemiologic studies and surveillance of epilepsy.
Ep ilepsia 52 Suppl 7, 2–26.
Treves, A., Tashiro, A., Witter, M.P., and Moser, E.I. (2008). What is the mammalian dentate gyrus good for?
Neuroscience 154, 1155–1172.
Tsai, M.-S., Lee, M.-L., Chang, C.-Y., Fan, H.-H., Yu , I.-S., Chen, Y.-T., You, J.-Y., Chen, C.-Y., Chang, F.-
C., Hsiao, J.H., et al. (2015). Functional and structural deficits of the dentate gyrus network coincide with
emerging spontaneous seizures in an Scn1a mutant Dravet Syndrome model during development. Neurobiol.
Dis. 77, 35–48.
Tse, D., Takeuchi, T., Kakeyama, M., Ka jii, Y., Okuno, H., Tohyama, C., Bito, H., and Morris, R.G.M.
(2011). Schema-dependent gene activation and memory encoding in neocortex. Science 333, 891–895.
Tulving, E. (2002). Episodic memory: from mind to brain. Annu. Rev. Psychol. 53, 1–25.
Tuncer, F.N., Gormez, Z., Calik, M., A ltiokka Uzun, G., Sagiroglu, M.S., Yuceturk, B., Yuksel, B., Baykan,
B., Bebek, N., Iscan, A., et al. (2015). A clinical variant in SCN1A inherited from a mosaic father
cosegregates with a novel variant to cause Dravet syndrome in a consanguineous family. Ep ilepsy Res. 113,
5–10.
Vanoye, C.G., Gurnett, C.A., Holland, K.D., George, A.L., and Kearney, J.A. (2014). Novel SCN3A Variants
Associated with Focal Epilepsy in Children. Neurobiol. Dis. 62.
Veggiotti, P., Card inali, S., Montalenti, E., Gatti, A., and Lanzi, G. (2001). Generalized epilepsy with febrile
seizures plus and severe myoclonic ep ilepsy in infancy: a case report of two Italian families. Ep ileptic Disord.
Int. Epilepsy J. Videotape 3, 29–32.
Velíšková, J., Miller, A.M. , Nunes, M.L., and Brown, L.L. (2005). Reg ional neural activity within the
substantia nigra during peri-ictal flurothyl generalized seizure stages. Neurobiol. Dis. 20, 752–759.
Vestergaard, M., and Christensen, J. (2009). Reg ister-based studies on febrile seizures in Denmark. Brain Dev.
31, 372–377.
Villeneuve, N., Laguitton, V., Viellard, M., Lepine, A., Chabrol, B., Dravet, C., and Milh, M. (2014).
Cognitive and adaptive evaluation of 21 consecutive patients with Dravet syndrome. Epilepsy Behav 31, 143–
148.
Volkers, L., Kahlig, K.M., Verbeek, N.E., Das, J.H.G., van Kempen, M.J.A., Stro ink, H., Augustijn, P., van
Nieuwenhuizen, O., Lindhout, D., George, A.L., et al. (2011). Nav 1.1 dysfunction in genetic epilepsy with
febrile seizures-plus or Dravet syndrome. Eur. J. Neurosci. 34, 1268–1275.
Voronin, L.L. (1982). [Prolonged post-tetanic potentiation in hippocampus]. Usp. Fiziol. Nauk 13, 45–73.
Wallace, R.H., Wang, D.W., Singh, R., Scheffer, I.E., George, A.L., Ph illips, H.A., Saar, K., Reis, A.,
Johnson, E.W., Sutherland, G.R., et al. (1998). Febrile seizures and generalized epilepsy associated with a
mutation in the Na+-channel beta1 subunit gene SCN1B. Nat. Genet. 19, 366–370.

180
Wallace, R.H., Hodgson, B.L., Grinton, B.E., Gardiner, R.M., Robinson, R., Rodriguez-Casero, V., Sadleir,
L., Morgan, J., Harkin, L.A., Dibbens, L.M., et al. (2003). Sodium channel alpha1 -subunit mutations in severe
myoclonic epilepsy of infancy and infantile spasms. Neurology 61, 765–769.
Wang, C., Xie, N., Wang, Y., Li, Y., Ge, X., and Wang, M. (2015). Role of the Mitochondrial Calcium
Uniporter in Rat Hippocampal Neuronal Death After Pilocarpine-Induced Status Epilepticus. Neurochem. Res.
40, 1739–1746.
Wang, P.J., Fan, P.C., Lee, W.T., Young, C., Huang, C.C., and Shen, Y.Z. (1996). Severe myoclon ic epilepsy
in infancy: evolution of electroencephalographic and clinical features. Zhonghua Minguo Xiao Er Ke Yi Xue
Hui Za Zhi J. Zhonghua Minguo Xiao Er Ke Yi Xue Hui 37, 428–432.
Wang, S.S.-H., Kloth, A.D., and Badura, A. (2014). The cerebellum, sensitive periods, and autism. Neuron 83,
518–532.
Wei, S.-H., and Lee, W.-T. (2015). Comorbidity of ch ildhood epilepsy. J. Formos. Med. Assoc. Taiwan Yi Zhi
114, 1031–1038.
Westenbroek, R.E., Merrick, D.K., and Catterall, W.A. (1989). Differential subcellular localizat ion of the RI
and RII Na+ channel subtypes in central neurons. Neuron 3, 695–704.
Whelan, H., Harmelink, M., Chou, E., Sallowm, D., Khan, N., Patil, R., Sannagowdara, K., Kim, J.H., Chen,
W.L., Khalil, S., et al. (2017). Complex febrile seizures-A systematic review. Dis.--Mon. DM.
Whitaker, W.R., Faull, R.L., Waldvogel, H.J., Plumpton, C.J., Emson, P.C., and Clare, J.J. (2001).
Comparative d istribution of voltage-gated sodium channel proteins in human brain. Brain Res. Mol. Brain
Res. 88, 37–53.
Whitlock, J.R., Heynen, A.J., Shuler, M.G., and Bear, M.F. (2006). Learning induces long -term potentiation in
the hippocampus. Science 313, 1093–1097.
Williams, P.A., White, A.M., Clark, S., Ferraro, D.J., Swiercz, W., Staley, K.J., and Dudek, F.E. (2009).
Development of spontaneous recurrent seizures after kainate-induced status epilepticus. J. Neurosci. Off. J.
Soc. Neurosci. 29, 2103–2112.
Willis, T., and Pordage, S. (1681). An essay of the pathology of the brain and nervous stock: in which
convulsive diseases are treated of (London: Printed by J.B. for T. Dring ...).
Wilson, J.V., and Reynolds, E.H. (1990). Texts and documents. Translation and analysis of a cuneiform text
forming part of a Babylonian treatise on epilepsy. Med. Hist. 34, 185–198.
Wirrell, E.C. (2016). Treatment of Dravet Syndrome. Can. J. Neuro l. Sci. J. Can. Sci. Neuro l. 43 Suppl 3, S13-
18.
Wolff, M., Casse-Perrot, C., and Dravet, C. (2006a). Severe myoclon ic epilepsy of in fants (Dravet syndrome):
natural history and neuropsychological findings. Epilepsia 47 Suppl 2, 45–48.
Wolff, M., Cassé-Perrot, C., and Dravet, C. (2006b). Severe myoclonic ep ilepsy of infants (Dravet syndrome):
natural history and neuropsychological findings. Epilepsia 47 Suppl 2, 45–48.
Wu, Y.W., Sullivan, J., McDaniel, S.S., Meisler, M.H., Walsh, E.M., Li, S.X., and Kuzniewicz, M.W. (2015).
Incidence of Dravet Syndrome in a US Population. Pediatrics 136, e1310-1315.
Xiong, Y., Zhou, H., and Zhang, L. (2014). Influences of hyperthermia -induced seizures on learn ing, memory
and phosphorylative state of CaMKIIα in rat hippocampus. Brain Res. 1557, 190–200.
Yagoubi, N., Jomni, Y., and Sakly, M. (2015). Hyperthermia-Induced Febrile Seizures Have Moderate and
Transient Effects on Spatial Learn ing in Immature Rats. Behav. Neurol. 2015, 924303.
Yakoub, M., Dulac, O., Jambaqué, I., Chiron, C., and Plouin, P. (1992). Early diagnosis of severe myoclonic
epilepsy in infancy. Brain Dev. 14, 299–303.
Yu , F.H., Westenbroek, R.E., Silos-Santiago, I., McCormick, K.A., Lawson, D., Ge, P., Ferriera, H., Lilly, J.,
DiStefano, P.S., Catterall, W.A., et al. (2003). Sodium channel beta4, a new disulfide-linked auxiliary subunit
with similarity to beta2. J. Neurosci. Off. J. Soc. Neurosci. 23, 7577–7585.
Yu , F.H., Mantegazza, M., Westenbroek, R.E., Robbins, C.A., Kalume, F., Burton, K.A., Spain, W.J.,
McKnight, G.S., Scheuer, T., and Catterall, W.A. (2006a). Reduced sodium current in GABAerg ic
interneurons in a mouse model of severe myoclonic ep ilepsy in infancy. Nat. Neurosci. 9, 1142–1149.

181
Yu, F.H., Mantegazza, M., Westenbroek, R.E., Robbins, C.A., Kalume, F., Burton, K.A., Spain, W.J.,
McKnight, G.S., Scheuer, T., and Catterall, W.A. (2006b). Reduced sodium current in GABAerg ic
interneurons in a mouse model of severe myoclonic ep ilepsy in infancy. Nat Neurosci 9, 1142–1149.
Zamponi, N., Passamonti, C., Cappanera, S., and Petrelli, C. (2011). Clin ical course of young patients with
Dravet syndrome after vagal nerve stimulation. Eur. J. Paediatr. Neurol. EJPN Off. J. Eur. Paediatr. Neuro l.
Soc. 15, 8–14.
Zanchin, G. (1992). Considerations on “the sacred disease” by Hippocrates. J. Hist. Neurosci. 1, 91–95.
Zhou, J.-L., Shatskikh, T.N., Liu, X., and Holmes, G.L. (2007). Impaired single cell firing and long -term
potentiation parallels memory impairment following recurrent seizures. Eur. J. Neurosci. 25, 3667–3677.
Zuberi, S.M., Brunklaus, A., Birch, R., Reavey, E., Duncan, J., and Forbes, G.H. (2011). Genotype -phenotype
associations in SCN1A-related epilepsies. Neurology 76, 594–600.
Zucker, R.S., and Regehr, W.G. (2002). Short-term synaptic plasticity. Annu. Rev. Physiol. 64, 355–405.

182

183
Statistic Tables

184

185
VIII- STATISTIC TABLES
1. RESULTS – CHAPTER 1 – SCN1A+/-
-129 MICE AND SCN1A+/- -B6:129
Mouse
model and
genetic
backgroun
d
Experi
ment
MeasurmentProtocol
phaseGenotype
treatment/
protocolaverage S.E.M
#
values/sli
ces/cells
# animalsStatistical
test
Source of
variation
F(DFn,DFd) / t
(dF) value/U/χ²/Hp value Comparision
post
hoc test
t(dF) value /
q(dF) valuep value Figure
D1 33.250 4.343 24 12 Interaction F (1, 90) = 0,3028 0.5835
D2 13.010 2.576 24 12 Day F (1, 90) = 25,89 < 0,0001
D1 29.850 4.376 20 10
D2 13.560 3.351 20 10
WT 33.250 4.343 24 12 Interaction F (1, 90) = 0,3028 0.5835
Scn1a+/- 29.850 4.376 24 12 Day F (1, 90) = 25,89 < 0,0001
WT 13.010 2.576 20 10
Scn1a+/- 13.560 3.351 20 10
D1 54.931 4.540 48 12 WT: D1 vs. D2 t(258)=1,436 0.4779
D2 47.485 4.591 48 12 WT: D1 vs.D3 t(258)=4,666 < 0,0001
12 WT: D1 vs. D4 t(258)=5,761 < 0,0001
12 WT: D2 vs. D3 t(258)=3,23 0.0076
12 WT: D2 vs. D4 t(258)=4,325 0.0001
12 WT: D3 vs. D4 t(258)=1,095 0.6926
D1 53.220 5.239 40 10 Scn1a+/-:D1 vs. D2 t(258)=1,754 0.298
D2 43.258 5.022 40 10 Scn1a+/-:D1 vs.D3 t(258)=5,169 < 0,0001
10 Scn1a+/-:D1 vs. D4 t(258)=5,615 < 0,0001
10 Scn1a+/-:D2 vs. D3 t(258)=3,415 0.0041
10 Scn1a+/-:D2 vs. D4 t(258)=3,861 0.0008
10 Scn1a+/-:D3 vs. D4 t(258)=0,4464 0.9703
WT - 54.931 4.540 48 12
Scn1a+/- - 53.220 5.239 40 10
WT - 47.485 4.591 48 12
Scn1a+/- - 43.258 5.022 40 10
WT - 30.742 3.780 48 12
Scn1a+/- - 23.865 3.269 40 10
WT - 25.063 3.064 48 12
Scn1a+/- - 21.330 2.659 40 10
WT: LEFT - 25.916 3.690 12 12
WT: TARGET - 35.223 3.559 12 12
WT: RIGHT - 19.126 3.189 12 12
WT: OPPOSITE - 11.029 2.281 12 12
Scn1a+/-: LEFT - 13.335 1.489 10 10
Scn1a+/-: TARGET - 46.751 5.036 10 10
Scn1a+/-: RIGHT - 28.084 3.812 10 10
Scn1a+/-: OPPOSITE - 8.723 3.031 10 10
WT: LEFT - 25.916 3.690 12 12 WT: LEFT vs. TARGET t(60)=1,792 0.3866
Scn1a+/-: LEFT - 13.335 1.489 10 10 WT: TARGET vs. RIGHT t(60)=3,099 0.0176
WT: TARGET - 35.223 3.559 12 12
Scn1a+/-: TARGET - 46.751 5.036 10 10
WT: RIGHT - 19.126 3.189 12 12
Scn1a+/-: RIGHT - 28.084 3.812 10 10
WT: OPPOSITE - 11.029 2.281 12 12Scn1a+/-: TARGET vs.
RIGHTt(60)=3,281 0.0103
Scn1a+/-: OPPOSITE - 8.723 3.031 10 10Scn1a+/-: TARGET vs.
OPPOSITEt(60)=6,683 < 0,0001
WT - 35.223 3.559 12 12 -
Chance level - 25.000 - - - -
Nav 1.1 KO +/- - 46.751 5.036 10 10 -
Chance level - 25.000 - - - -
Morris Water Maze (MWM)
< 0,0001 WT vs. Scn1a+/- +/-
:RIGHT
< 0,0001
Genotype F (1, 20) = 2,126 0.1603
MW
M Probe
test
One
sample t-
test
t(11)=2,873 0.0152 - - - -
t(9)=4,319 0.0019 - - - -
Target
quadrant:Diff
erence to
chance level
MW
M Probe
test
RM-Two
Way
ANOVA
Interaction F (3, 60) = 4,144 0.0098
Sidak's
WT: TARGET vs.
OPPOSITEt(60)=4,658 0.0001
Quadrant F (3, 60) = 22,75 < 0,0001Scn1a+/-: LEFT vs.
TARGETt(60)=5,873
Presence in
quadrant (%)
Presence in
quadrant (%)
t(80)=2,395
t(80)=2,613
25.063 3.064
t(344)=0,6374
t(344)=1,174
t(344)=0,722
t(344)= 0,2922
Tuckey'sTwo-Way
RM ANOVADay
Genotype
MW
MM
WM
Genotype
SPATIAL-
latency
Scn1a+/-
0.1603
Scn1a+
/--1
29
Sidak's
SPATIAL-
latency
RM-Two
Way
ANOVA
0.0422
WT vs. Scn1a+/-+/-:
TARGET
D3
Day
Interaction
0.9488
0.6682
0.9215
0.9972
0.0738
< 0,0001
Quadrant
F (3, 258) = 29,10
D1
D2
D3
D4
t(80)=1,861 0.2405
Genotype
F (1, 86) = 1,413
Probe
test
F (1, 86) = 1,413
D1: WT vs. Scn1a+/-
Two-Way
RM ANOVA
Genotype
F (1, 90) = 0,1317
WT vs. Scn1a+/- +/-:
OPPOSITEt(80)=0,479 0.9819
Tuckey'sTwo-Way
RM ANOVA
2.65921.330
3.26923.865
0.2378F (1, 86) = 1,413
0.9278F (3, 258) = 0,1529
< 0,0001
F (3, 258) = 0,1529
0.2378
Day
Interaction
MW
M
D4
< 0,0001
Interaction
3.78030.742
D3
D4
Interaction F (3, 60) = 4,144 0.0098WT vs. Scn1a+/-+/-: LEFT
F (3, 258) = 29,10
F (3, 60) = 22,75
48
48
40
40
MW
M CUE TASK -
latency
WT
0.2378
F (3, 258) = 29,10
D4: WT vs. Scn1a+/-
D3: WT vs. Scn1a+/-
D2: WT vs. Scn1a+/-
F (1, 20) = 2,126
21B
21B
21B
RESULTS Chapter 1- Phenotypic characterization of Scn1a+/--129 (DS model)
-
-
MW
M CUE TASK -
latency
Two-Way
RM ANOVASidak's 21A
Genotype F (1, 90) = 0,1317 0.7176
21A
- Genotype D2: WT vs. Scn1a+/- t(180)=0,1039 0.9932
D1
D2
WT
Scn1a+/-
21A
21A
21A
-
-
WT: D1 vs. D2
Scn1a+/-: D1 vs. D2
t(90)=4,276 < 0,0001
0.0066t(90)=3,018
0.7176
-
Two-Way
RM ANOVA
D1: WT vs. Scn1a+/-
Sidak's
t(180)=0,6392 0.773
0.9278F (3, 258) = 0,1529
0.9278
Tuckey's
Mouse
model and
genetic
backgroun
Experime
ntMeasurment
Protocol
phaseGenotype
treatment
/protocolaverage S.E.M
#
values/sli
ces/cells
# animalsStatistica
l test
Source of
variation
F(DFn,DFd) / t
(dF)
value/U/χ²/H
p value Comparisionpost hoc
test
t(dF)
value /
q(dF)
value
p value Figure
WT - 29,530 8,770 6 6 - - - - -
Scn1a+/- - 32,230 7,362 8 8 - - - - -
WT - 43,010 9,192 9 9 - - - - -
Scn1a+/- - 42,470 10,340 7 7 - - - - -
0,9695
22
U=21,50 0,7799
t(14)=0,038
1 shock
3 shocksScn
1a
+/-
-12
9
Mann-
Withney
test
Unpaired
two-tailed
t-test
Freezing %
Freezing %
CFC
Contextual Fear-Conditioning (CFC)

186
Mouse
model and
genetic
backgroun
Experi
ment
MeasurmentProtocol
phaseGenotype
treatment
/protocolaverage S.E.M
#
values/sli
ces/cells
# animalsStatistica
l test
Source of
variation
F(DFn,DFd) / t
(dF)
value/U/χ²/H
p value Comparisionpost
hoc test
t(dF) value /
q(dF) valuep value Figure
WT - 75,330 4,540 - 12 - - - - -
Scn1a+/- - 74,790 2,819 - 10 - - - - -
Unpaired
two-tailed
t-test
t(20)=09533 0,925 27
Scn
1a
+/-
-
B6
:12
9
Co
nte
xtu
a
l F
ea
r
Co
nd
itio
ni
Conditioning
3 shocksFreezing %
Contextual Fear Conditioning
Mouse
model and
genetic
backgroun
Experi
ment
MeasurmentProtocol
phaseGenotype
treatment
/protocolaverage S.E.M
#
values/sli
ces/cells
# animalsStatistica
l test
Source of
variation
F(DFn,DFd) / t
(dF)
value/U/χ²/H
p value Comparisionpost
hoc test
t(dF) value /
q(dF) valuep value Figure
WT - 25,040 1,248 12 12 - - - - -
Scn1a+/- - 26,560 1,731 10 10 - - - - -
WT - 0,042 0,002 12 12 - - - - -
Scn1a+/- - 0,044 0,003 10 10 - - - - -
C1:WT - 167,800 14,390 12 12 WT: C1 vs. Centert(40)=3,605
0,0026
C:WT - 240,000 12,030 12 12 WT: C1 vs. C2t(40)=1,127
0,605
C2:WT - 190,400 15,380 12 12 WT: Center vs. C2t(40)=2,478
0,0517
C1: Scn1a+/- - 192,700 9,190 10 10 Scn1a+/-: C1 vs. Centert(40)=2,614
0,0372
C: Scn1a+/- - 250,000 8,510 10 10 Scn1a+/-: C1 vs. C2t(40)=1,648
0,2884
C2: Scn1a+/- - 156,600 6,930 10 10 Scn1a+/-: Center vs. C2 t(40)=4,262 0,0004
EC: WT - 92,218 10,069 11 11 Interaction F (1, 20) = 0,4825 0,4953
M:WT - 136,046 13,254 11 11 Genotype F (1, 20) = 4,335 0,0504
EC:Scn1a+/- - 118,067 9,197 9 9
M: Scn1a+/- - 142,000 18,660 9 9
familiar mouse: WT - 49,836 7,939 11 11 Interaction F (1, 18) = 0,4089 0,5306
novel mouse: WT - 87,273 9,653 11 11 Genotype F (1, 18) = 2,990 0,1009
familiar mouse: Scn1a+/- - 62,656 6,549 9 9
novel mouse: Scn1a+/- - 112,889 16,492 9 9
25E
25D
25C
25B
Sc
n1
a+
/--B
6:1
29
Th
ree
ch
am
be
r s
oc
ial in
tera
cti
o t
es
t
Unpaired
two-tailed
t-test
t(20)=0,7283
t(18)=2,303EC - M: WT
Sidak's
0,0668
Cage F (1, 20) = 2,429 0,1348 EC - M: Scn1a+/- t(18)=1,138 0,5404
Social
Novelty
phase
RM-Two
Way
ANOVA
fM - nM: WT
Sidak's
t(18)=2,789 0,0243
Cage F (1, 18) = 19,19 0,0004 fM - nM: Scn1a+/- t(18)=3,385 0,0066
Sociability
phase
0,4749
Unpaired
two-tailed
t-test
t(20)=0,7597 0,4653
Two-way
ANOVA
Interaction F (2, 40) = 2,114
RM-Two
Way
ANOVA
Tuckey's
Tuckey's
Chamber F (2, 40) = 14,15 < 0,0001
Genotype F (1, 20) = 2,034 0,1692
Distance
travelled (m)
Average
speed (m/s)
Time in the
room (s)
Interaction
time (s)
Interaction
time (s)
Habituation
phase
Habituation
phase
Habituation
phase
0,1341
25A
Three-chamber social
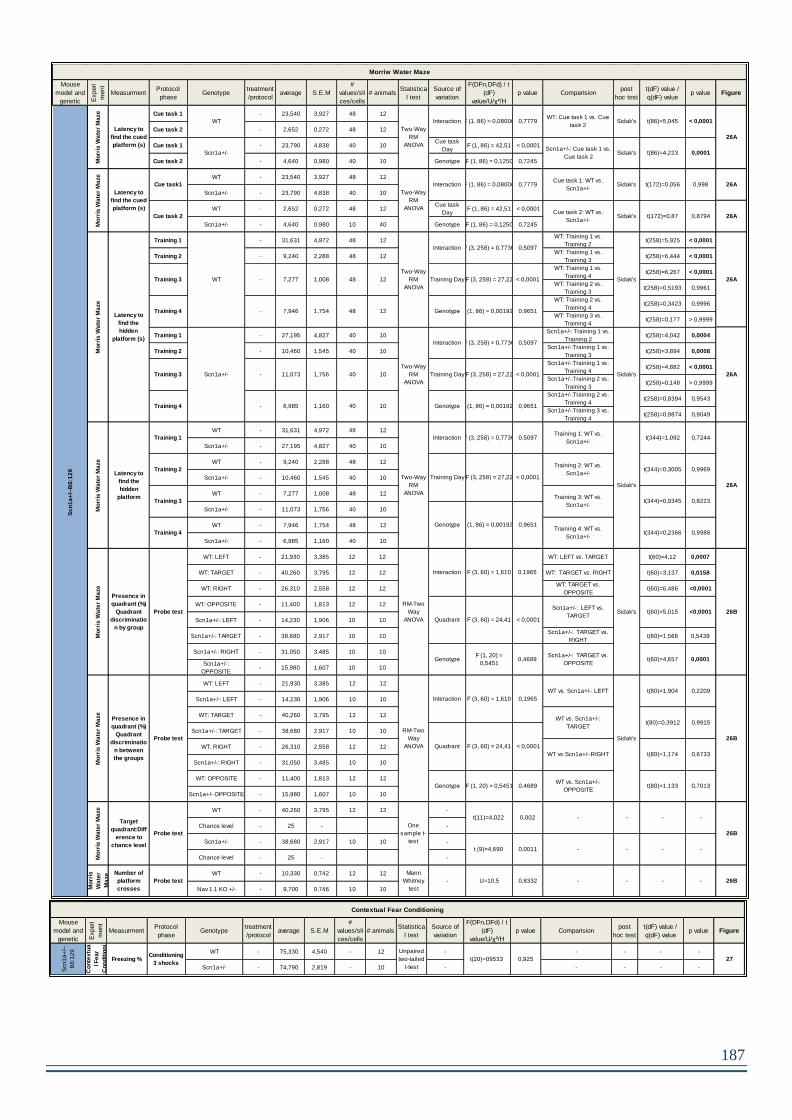
187
Mouse
model and
genetic
backgroun
Experi
ment
MeasurmentProtocol
phaseGenotype
treatment
/protocolaverage S.E.M
#
values/sli
ces/cells
# animalsStatistica
l test
Source of
variation
F(DFn,DFd) / t
(dF)
value/U/χ²/H
p value Comparisionpost
hoc test
t(dF) value /
q(dF) valuep value Figure
Cue task 1 - 23,540 3,927 48 12
Cue task 2 - 2,652 0,272 48 12
Cue task 1 - 23,790 4,838 40 10Cue task
DayF (1, 86) = 42,51 < 0,0001
Cue task 2 - 4,640 0,980 40 10 Genotype F (1, 86) = 0,1250 0,7245
WT - 23,540 3,927 48 12
Scn1a+/- - 23,790 4,838 40 10
WT - 2,652 0,272 48 12Cue task
DayF (1, 86) = 42,51 < 0,0001
Scn1a+/- - 4,640 0,980 10 40 Genotype F (1, 86) = 0,1250 0,7245
Training 1 - 31,631 4,972 48 12WT: Training 1 vs.
Training 2t(258)=5,925 < 0,0001
Training 2 - 9,240 2,288 48 12WT: Training 1 vs.
Training 3t(258)=6,444 < 0,0001
WT: Training 1 vs.
Training 4t(258)=6,267 < 0,0001
WT: Training 2 vs.
Training 3t(258)=0,5193 0,9961
WT: Training 2 vs.
Training 4t(258)=0,3423 0,9996
WT: Training 3 vs.
Training 4t(258)=0,177 > 0,9999
Training 1 - 27,195 4,827 40 10Scn1a+/-: Training 1 vs.
Training 2t(258)=4,042 0,0004
Training 2 - 10,460 1,545 40 10Scn1a+/-:Training 1 vs.
Training 3t(258)=3,894 0,0008
Scn1a+/-:Training 1 vs.
Training 4t(258)=4,882 < 0,0001
Scn1a+/-:Training 2 vs.
Training 3t(258)=0,148 > 0,9999
Scn1a+/-:Training 2 vs.
Training 4t(258)=0,8394 0,9543
Scn1a+/-:Training 3 vs.
Training 4t(258)=0,9874 0,9049
WT - 31,631 4,972 48 12
Scn1a+/- - 27,195 4,827 40 10
WT - 9,240 2,288 48 12
Scn1a+/- - 10,460 1,545 40 10
WT - 7,277 1,008 48 12
Scn1a+/- - 11,073 1,756 40 10
WT - 7,946 1,754 48 12
Scn1a+/- - 6,985 1,160 40 10
WT: LEFT - 21,930 3,385 12 12 WT: LEFT vs. TARGET t(60)=4,12 0,0007
WT: TARGET - 40,260 3,795 12 12 WT: TARGET vs. RIGHT t(60)=3,137 0,0158
WT: RIGHT - 26,310 2,558 12 12WT: TARGET vs.
OPPOSITEt(60)=6,486 <0,0001
WT: OPPOSITE - 11,400 1,813 12 12
Scn1a+/-: LEFT - 14,230 1,906 10 10
Scn1a+/-: TARGET - 38,680 2,917 10 10Scn1a+/-: TARGET vs.
RIGHTt(60)=1,566 0,5439
Scn1a+/-: RIGHT - 31,050 3,485 10 10
Scn1a+/-:
OPPOSITE- 15,980 1,607 10 10
WT: LEFT - 21,930 3,385 12 12
Scn1a+/-: LEFT - 14,230 1,906 10 10
WT: TARGET - 40,260 3,795 12 12
Scn1a+/-: TARGET - 38,680 2,917 10 10
WT: RIGHT - 26,310 2,558 12 12
Scn1a+/-: RIGHT - 31,050 3,485 10 10
WT: OPPOSITE - 11,400 1,813 12 12
Scn1a+/- OPPOSITE - 15,980 1,607 10 10
WT - 40,260 3,795 12 12 -
Chance level - 25 - -
Scn1a+/- - 38,680 2,917 10 10 -
Chance level - 25 - -
WT - 10,330 0,742 12 12
Nav 1.1 KO +/- - 9,700 0,746 10 10
26A
26A
Scn1a+/-
Training 3
Sidak's
Mo
rris
Wa
ter
Ma
ze
26A
t(344)=0,9345 0,8223
Genotype F (1, 86) = 0,001928 0,9651
Interaction F (3, 258) = 0,7736 0,5097
WT
Two-Way
RM
ANOVA
Interaction F (3, 258) = 0,7736 0,5097
Scn1a+/-
Two-Way
RM
ANOVA
0,9969
26B
26B
26A
26A
26B
26B
Two-Way
RM
ANOVA
F (1, 86) = 0,001928
-
Mo
rris
Wa
ter
Ma
ze
WT
Cue task1
Mo
rris
Wa
ter
Ma
ze
Probe test
RM-Two
Way
ANOVA
Interaction F (3, 60) = 1,610 0,1965
WT vs. Scn1a+/-: LEFT
Sidak's
t(80)=1,904 0,2209
WT vs. Scn1a+/-:
TARGETt(80)=0,3912 0,9915
Quadrant F (3, 60) = 24,41 < 0,0001
WT vs.Scn1a+/-:RIGHT t(80)=1,174 0,6733
GenotypeF (1, 20) =
0,54510,4689
WT vs. Scn1a+/-:
OPPOSITE
<0,0001
0,7013t(80)=1,133
-
Mo
rris
Wa
ter
Ma
ze
Probe test
RM-Two
Way
ANOVA
Interaction F (3, 60) = 1,610 0,1965
Quadrant F (3, 60) = 24,41 < 0,0001
Genotype F (1, 20) = 0,5451 0,4689
- -
0,0001t(60)=4,657
-
t (9)=4,690 0,0011 -
Mo
rris
Wa
ter
Ma
ze
Probe test
One
sample t-
test
t(11)=4,022 0,002 -
Sc
n1
a+
/--B
6:1
29
--
Sidak's t(60)=5,015
Presence in
quadrant (%)
Quadrant
discriminatio
n by group
Presence in
quadrant (%)
Quadrant
discriminatio
n between
the groups
Target
quadrant:Diff
erence to
chance level
Training 4Training 4: WT vs.
Scn1a+/-
Scn1a+/-: LEFT vs.
TARGET
Scn1a+/-: TARGET vs.
OPPOSITE
Mo
rris
Wa
ter
Ma
ze Mann
Whitney
test
0,8332U=10,5-
Training 3: WT vs.
Scn1a+/-
0,9651
Mo
rris
Wa
ter
Ma
ze
t(344)=0,3005
< 0,0001
Genotype F (1, 86) = 0,001928 0,9651
Training 3 - 7,277 1,008 12 Training Day F (3, 258) = 27,22
Sidak's
Mo
rris
Wa
ter
Ma
ze
Training 1
Training 2
Training Day F (3, 258) = 27,22 < 0,0001
Training 2: WT vs.
Scn1a+/-
11,073 1,756 10 Training Day F (3, 258) = 27,22 < 0,0001
Training 4 -
Latency to
find the cued
platform (s)
Training 4 - 7,946 1,754 12
Cue task 2
Training 3
---
48
48
40
40
Latency to
find the cued
platform (s)
Latency to
find the
hidden
platform (s)
Latency to
find the
hidden
platform
6,985 1,160 10 Genotype
t(344)=1,092Interaction F (3, 258) = 0,7736 0,5097Training 1: WT vs.
Scn1a+/-
Probe test
Number of
platform
crosses
0,7244
t(344)=0,2366
Sidak's-
0,9988
Two-Way
RM
ANOVA
0,7779F (1, 86) = 0,08006Interaction
Cue task 2: WT vs.
Scn1a+/-Sidak's t(172)=0,87 0,8794
0,998t(172)=0,056Sidak'sCue task 1: WT vs.
Scn1a+/-
0,0001
< 0,0001t(86)=5,045Sidak'sWT: Cue task 1 vs. Cue
task 2
26A
Two-Way
RM
ANOVA
0,7779F (1, 86) = 0,08006Interaction
Scn1a+/-: Cue task 1 vs.
Cue task 2Sidak's t(86)=4,223
Morriw Water Maze
Mouse
model and
genetic
backgroun
Experi
ment
MeasurmentProtocol
phaseGenotype
treatment
/protocolaverage S.E.M
#
values/sli
ces/cells
# animalsStatistica
l test
Source of
variation
F(DFn,DFd) / t
(dF)
value/U/χ²/H
p value Comparisionpost
hoc test
t(dF) value /
q(dF) valuep value Figure
WT - 75,330 4,540 - 12 - - - - -
Scn1a+/- - 74,790 2,819 - 10 - - - - -
Unpaired
two-tailed
t-test
t(20)=09533 0,925 27
Scn
1a
+/-
-
B6
:12
9
Co
nte
xtu
a
l F
ea
r
Co
nd
itio
ni
Conditioning
3 shocksFreezing %
Contextual Fear Conditioning

188
Mouse
model and
genetic Experi
ment
MeasurmentProtocol
phaseGenotype
treatm
ent/pro
tocol
average S.E.M
#
values/sli
ces/cells
#
animals
Statistical
testSource of variation
F(DFn,DFd) / t
(dF)
value/U/χ²/H
p value Comparisionpost
hoc test
t(dF) value /
q(dF) valuep value Figure
WT - 2.917 0.260 12 12
Scn1a+/- - 2.900 0.314 10 10
WT - 3.917 0.379 12 12
Scn1a+/- - 3.800 0.327 10 10
WT - 3.333 0.396 12 12
Scn1a+/- - 3.500 0.401 10 10
WT - 3.833 0.423 12 12
Scn1a+/- - 3.600 0.371 10 10
WT - 3.667 0.256 12 12
Scn1a+/- - 3.800 0.359 10 10
WT - 3.750 0.429 12 12
Scn1a+/- - 3.800 0.359 10 10
WT - 4.083 0.468 12 12
Scn1a+/- - 4.400 0.267 10 10
WT - 5.000 0.389 12 12
Scn1a+/- - 5.100 0.407 10 10
WT - 5.250 0.524 12 12
Scn1a+/- - 5.200 0.359 10 10
WT - 5.167 0.386 12 12
Scn1a+/- - 5.600 0.400 10 10
WT - 5.583 0.288 12 12
Scn1a+/- - 5.900 0.407 10 10
WT - 5.500 0.359 12 12
Scn1a+/- - 5.600 0.267 10 10
D1 WT - 2.917 0.260 12 12 D1 : WT vs. Chance level t(11)=2,244 0.0463 - - - -
D2 WT - 3.917 0.379 12 12 D2 : WT vs. Chance level t(11)=1,101 0.2945 - - - -
D3 WT - 3.333 0.396 12 12 D3 : WT vs. Chance level t(11)=0,4212 0.6817 - - - -
D4 WT - 3.833 0.423 12 12 D4 : WT vs. Chance level t(11)=0,7872 0.4478 - - - -
D5 WT - 3.667 0.256 12 12 D5 : WT vs. Chance level t(11)=0,6504 0.5288 - - - -
D6 WT - 3.750 0.429 12 12 D6 : WT vs. Chance level t(11)=0,5833 0.5715 - - - -
D7 WT - 4.083 0.468 12 12 D7 : WT vs. Chance level t(11)=1,246 0.2385 - - - -
D8 WT - 5.000 0.389 12 12 D8 : WT vs. Chance level t(11)=3,854 0.0027 - - - -
D9 WT - 5.250 0.524 12 12 D9 : WT vs. Chance level t(11)=3,339 0.0066 - - - -
D10 WT - 5.167 0.386 12 12 D10 : WT vs. Chance level t(11)=4,318 0.0012 - - - -
D11 WT - 5.583 0.288 12 12 D11 : WT vs. Chance level t(11)=7,244 < 0,0001 - - - -
D12 WT - 5.500 0.359 12 12 D12 : WT vs. Chance level t(11)=5,573 0.0002
Chance
level- 3.500 - - -
D1 Scn1a+/- - 2.900 0.314 10 10 D1 : Scn1a+/- vs. Chance level t(9)=1,908 0.0887 - - - -
D2 Scn1a+/- - 3.800 0.327 10 10 D2 : Scn1a+/- vs. Chance level t(9)=0,9186 0.3823 - - - -
D3 Scn1a+/- - 3.500 0.401 10 10 D3 : Scn1a+/- vs. Chance level t(9)=0,0 1 - - - -
D4 Scn1a+/- - 3.600 0.371 10 10 D4 : Scn1a+/- vs. Chance level t(9)=0,2694 0.7937 - - - -
D5 Scn1a+/- - 3.800 0.359 10 10 D5 : Scn1a+/- vs. Chance level t(9)=0,8356 0.425 - - - -
D6 Scn1a+/- - 3.800 0.359 10 10 D6 : Scn1a+/-vs. Chance level t(9)=0,8356 0.425 - - - -
D7 Scn1a+/- - 4.400 0.267 10 10 D7 : Scn1a+/- vs. Chance level t(9)=3,375 0.0082 - - - -
D8 Scn1a+/- - 5.100 0.407 10 10 D8 : Scn1a+/- vs. Chance level t(9)=3,932 0.0034 - - - -
D9 Scn1a+/- - 5.200 0.359 10 10 D9 : Scn1a+/- vs. Chance level (9)t=4,735 0.0011 - - - -
D10 Scn1a+/- - 5.600 0.400 10 10 D10 : Scn1a+/- vs. Chance level t(9)=5,250 0.0005 - - - -
D11 Scn1a+/- - 5.900 0.407 10 10 D11 : Scn1a+/-vs. Chance level t(9)=5,898 0.0002 - - - -
D12 Scn1a+/- - 5.600 0.267 10 10 D12 : Scn1a+/- vs. Chance level t(9)=7,875 < 0,0001
Chance
level- 3.500 - - -
Radial Maze
Number of
correct
choices
F (1, 20) = 0,2325
F (11, 220) =
13,69
F (11, 220) =
0,1394
D3:WT vs. Scn1a+/-
Scn1a+
/--B
6:1
29
Rad
ial M
aze
One
sample t-
test
Differences
to chance
level
-
D11:WT vs. Scn1a+/-
D10:WT vs. Scn1a+/-
D5:WT vs. Scn1a+/-
-- -
> 0,9999t(240)=0,218
> 0,9999t(240)=0,031
Rad
ial M
aze
Two-Way
RM ANOVA
Interaction
Training Day
Genotype
> 0,9999t(240)=0,591
> 0,9999t(240)=0,093
> 0,9999t(240)=0,249
> 0,9999t(240)=0,435
> 0,9999t(240)=0,311
t(240)=0,186
t(240)=0,591
0.9985
D9:WT vs. Scn1a+/-
D8:WT vs. Scn1a+/-
D7:WT vs. Scn1a+/-
Scn1a+
/--B
6:1
29
D12
D11
D10
D9
D8
D7
D6
D5
D4
D3
D2
D1
> 0,9999
> 0,9999
t(240)=0,809
> 0,9999t(240)=0,093
t(240)=0,186 > 0,9999
D2: WT vs. Scn1a+/-
D1: WT vs. Scn1a+/-
< 0,0001
0.9995
D6:WT vs. Scn1a+/-
D12:WT vs. Scn1a+/-
Sidak's
0.6349
28
28
D4:WT vs. Scn1a+/-
28
-
---

189
2. RESULTS – CHAPTER 2 – SCN1A+/- -B6:129 MICE AND SCN1A
RH/+
Mouse
model
and
genetic
Experime
nt
Measurm
ent
Protocol
phaseGenotype
treatment
/protocolaverage S.E.M
#
values/sli
ces/cells
# animalsStatistica
l test
Source of
variation
F(DFn,DFd) /
t (dF)
value/U/χ²/H
p valueComparis
ion
post hoc
test
t(dF)
value /
q(dF)
value
p value Figure
WT - 100,000 - 12 12
Scn1a+/- - 100,000 - 10 10
WT Hyperthermia 72,720 13,428 11 11
Scn1a+/- SIH 36,769 12,800 13 13
D1 41,173 0,106 11 11 1 vs. 2 - > 0,9999
D2 41,320 0,213 10 10 1 vs. 3 - > 0,9999
D3 40,122 0,514 9 9 1 vs. 4 - 0,624
D4 40,017 0,481 6 6 1 vs. 5 - > 0,9999
D5 40,717 0,257 6 6 1 vs. 6 - 0,6634
D6 40,240 0,385 5 5 1 vs. 7 - > 0,9999
D7 40,350 0,328 4 4 1 vs. 8 - > 0,9999
D8 41,160 0,308 5 5 1 vs. 9 - > 0,9999
D9 40,925 0,439 4 4
D10 41,900 0,058 3 3
D1 5,091 0,091 11 11 1 vs. 2 - 0,0004
D2 5,900 0,100 10 10 1 vs. 3 - < 0,0001
D3 6,000 0,000 9 9 1 vs. 4 - < 0,0001
D4 6,167 0,167 6 6 1 vs. 5 - 0,0007
D5 6,000 0,000 6 6 1 vs. 6 - 0,0018
D6 6,000 0,000 5 5 1 vs. 7 - 0,009
D7 6,000 0,408 4 4 1 vs. 8 - 0,0018
D8 6,000 0,000 5 5 1 vs. 9 - 0,0002
D9 6,250 0,250 4 4
D10 6,000 0,000 3 3
RESULTS Chapter 2- Seizures induction by hyperthermia (SIH) in Scn1a +/--B6:129 and Scn1a RH/+-129:B6 mouse models
Seizures Induced by hyperthermia (SIH) in Scn1a +/--B6:129
< 0,0001H(10)=39,29
Difference
s between
protocol
days
0,031H(10)=18,38
Difference
s between
protocol
days
0,7633-
- 0,0189
Su
rviv
al c
urv
e
co
mp
ari
sio
nT
em
pe
ratu
re t
hre
sh
old
fo
r s
eiz
ure
in
du
cti
on
Se
izu
re s
ev
eri
ty c
ara
cte
riza
tio
n
SIH
SIH
Scn1a+/-
Dunn's
Dunn's
1 vs. 10
1 vs. 10
Kruskal-
Wallis test
Kruskal-
Wallis test
Scn
1a
+/-
-B6
:12
9
Se
izu
res
In
du
cti
on
by
hy
pe
rth
erm
ia
29B
29A
29C
Scn
1a
+/-
-B6
:12
9
Se
izu
res
In
du
cti
on
by
hy
pe
rth
erm
ia
Survival
percenta
ge at day
10
Log-rank
(Mantel-
Cox) test
0,0001χ²(3)=17,52
Curve
comparisi
on
----
Se
izu
res
In
du
cti
on
by
hy
pe
rth
erm
ia
Scn
1a
+/-
-B6
:12
9
Scn1a+/-

190
3. RESULTS – CHAPTER 3 – SCN1ARH/+ -SIH
Mouse
model
and
genetic
Experime
nt
Measurm
ent
Protocol
phaseGenotype
treatment
/protocolaverage S.E.M
#
values/sli
ces/cells
# animalsStatistica
l test
Source of
variation
F(DFn,DFd) /
t (dF)
value/U/χ²/H
p valueComparis
ion
post hoc
test
t(dF)
value /
q(dF)
value
p value Figure
WT - 100,000 - 20 20
Scn1aRH/+ - 100,000 - 20 20
WT Hyperthermia 92,063 3,406 33 33
Scn1aRH/+ SIH 65,079 6,006 63 63
D1 41,632 0,049 63 63 1 vs. 2 - 0,0092
D2 41,918 0,057 56 56 1 vs. 3 - 0,0001
D3 42,042 0,048 57 57 1 vs. 4 - > 0,9999
D4 41,475 0,168 53 53 1 vs. 5 - > 0,9999
D5 41,486 0,130 50 50 1 vs. 6 - > 0,9999
D6 41,298 0,147 48 48 1 vs. 7 - > 0,9999
D7 41,292 0,108 48 48 1 vs. 8 - 0,8898
D8 41,200 0,132 45 45 1 vs. 9 - 0,7714
D9 41,240 0,120 43 43
D10 41,605 0,116 41 41
D1 4,804 0,059 46 46 1 vs. 2 - 0,968
D2 5,093 0,056 43 43 1 vs. 3 - < 0,0001
D3 5,581 0,089 43 43 1 vs. 4 - < 0,0001
D4 5,925 0,066 40 40 1 vs. 5 - < 0,0001
D5 5,865 0,079 37 37 1 vs. 6 - < 0,0001
D6 6,059 0,041 34 34 1 vs. 7 - < 0,0001
D7 5,971 0,029 34 34 1 vs. 8 - < 0,0001
D8 6,030 0,030 33 33 1 vs. 9 - < 0,0001
D9 6,032 0,032 31 31
D10 5,929 0,071 28 28
Se
izu
re s
ev
eri
ty c
ara
cte
riza
tio
n
Scn
1a
RH
/+-1
29
:B6
Se
izu
res
In
du
cti
on
by
hy
pe
rth
erm
ia
Scn
1a
RH
/+-1
29
:B6
Se
izu
res
In
du
cti
on
by
hy
pe
rth
erm
ia
Dunn's
1 vs. 10
Scn1aRH/+ SIH
Seizures Induced by hyperthermia (SIH) inScn1a RH/+-129:B6
< 0,0001
< 0,0001
H(10)=227,7
Difference
s between
protocol
days
H(10)=69,98
Difference
s between
protocol
days
Kruskal-
Wallis test
Kruskal-
Wallis test
Su
rviv
al c
urv
e c
om
pa
ris
ion
Log-rank
(Mantel-
Cox) test
Curve
comparisi
on
χ²(3)=27,19 < 0,0001 -
1 vs. 10
Survival
percenta
ge at day
10
-
Dunn's
Te
mp
era
ture
th
res
ho
ld f
or
se
izu
re in
du
cti
on
30C
30B
30A
- < 0,0001
-
Scn
1a
RH
/+-1
29
:B6
Se
izu
res
In
du
cti
on
by
hy
pe
rth
erm
ia
Scn1aRH/+ SIH
> 0,9999-
-
Mouse model
and genetic
background
Experi
ment
Measur
ment
Protocol
phaseGenotype
treatme
nt/proto
col
average S.E.M
#
values/sli
ces/cells
#
animal
s
Statistical
testSource of variation
F(DFn,DFd) / t
(dF) value/U/χ²/Hp value Comparision
post hoc
test
t(dF) value /
q(dF) valuep value Figure
Scn1aRH/+ - 0.00 0.00 4 4 - - - -
Scn1aRH/+ SIH 0.40 0.17 11 11 - - - -
Scn1aRH/+ - 0.00 0.00 4 4 - - - -
Scn1aRH/+ SIH 1.03 0.09 7 7 - - - -
Scn1aRH/+ - 0.00 0.00 4 4 - - - -
Scn1aRH/+ SIH 0.89 0.21 10 10 - - - -
Scn1aRH/+ - 0.00 0.00 4 4 - - - -
Scn1aRH/+ SIH 0.70 0.09 8 8 - - - -
Scn1aRH/+ - 0.00 0.00 4 4 - - - -
Scn1aRH/+ SIH 0.56 0.12 8 8 - - - -
Scn1aRH/+ - 0.00 0.00 4 4 - - - -
Scn1aRH/+ SIH 0.51 0.13 10 10 - - - -
Scn1aRH/+ - 0.00 0.00 4 4 - - - -
Scn1aRH/+ SIH 0.64 0.13 7 7 - - - -
Scn1aRH/+ - 0.00 0.00 3 3 - - - -
Scn1aRH/+ SIH 0.63 0.17 7 7 - - - -
Scn1aRH/+ - 0.00 0.00 3 3 - - - -
Scn1aRH/+ SIH 0.55 0.21 4 4 - - - -
Scn1aRH/+ - 0.00 0.00 3 3 - - - -
Scn1aRH/+ SIH 0.75 0.15 4 4 - - - -
t(12)=2,458
t(10)=3,217
t(10)=5,466
t(12)=2,570
t(9)=8,412
t(13)=1,370
Holm-Sidak correction for multiple
comparision31C
Post SIH
week 10
Post SIH
week 9
Post SIH
week 8
Post SIH
week 7
Post SIH
week 6
Post SIH
week 5
Post SIH
week 4
Post SIH
week 3
Post SIH
week 2
Post SIH
week 1
Scn1aR
H/+
-129:B
6
Sponta
neous S
eiz
ure
Activ
ity
Num
ber
of sponta
neous s
eiz
ure
s
Multiple T-
test
0.193622
< 0,0001
0.0245105
0.0002744
0.0092105
0.0301598
0.0050108
0.0512169
0.078416
0.0082818t(5)=4,225
t(5)=2,206
t(8)=2,290
t(9)=3,688
RESULTS Chapter 3- Long-term effects of the 10-days seizures induction by hyperthermia protocol in Scn1aRH/+
-129:B6 mice
Spontaneous seizure analysis in Scn1aRH/+ -129:B6

191
Mouse model
and genetic
background
Experi
mentM
easur
ment
Protocol
phaseGenotype
treatme
nt/proto
col
average S.E.M
#
values/sli
ces/cells
#
animal
s
Statistical
testSource of variation
F(DFn,DFd) / t
(dF) value/U/χ²/Hp value Comparision
post hoc
test
t(dF) value /
q(dF) valuep value Figure
WT - 202.61 9.79 14 7 WT control vs. Scn1aRH/+ control t(3840)=1.471 0.5996
Scn1aRH/+ - 215.63 9.50 11 8 WT control vs. WT HYP t(3840)=1.58 0.5168
WT HYP 215.73 11.52 14 8 Scn1aRH/+ control vs. Scn1aRH/+ SIH t(3840)=4.915 < 0.0001
Scn1aRH/+ SIH 259.85 20.28 13 8 WT HYP vs. Scn1aRH/+ SIH t(3840)=5.216 < 0.0001
WT - 192.56 10.77 14 7 WT control vs. Scn1aRH/+ control t(3840)=3.57 0.0022
Scn1aRH/+ - 224.15 12.66 11 8 WT control vs. WT HYP t(3840)=2.962 0.0183
WT HYP 217.16 12.75 14 8 Scn1aRH/+ control vs. Scn1aRH/+ SIH t(3840)=2.826 0.0281
Scn1aRH/+ SIH 249.58 25.66 13 8 WT HYP vs. Scn1aRH/+ SIH t(3840)=3.833 0.0008
WT - 166.06 5.91 14 7 WT control vs. Scn1aRH/+ control t(3840)=2.514 0.0698
Scn1aRH/+ - 188.31 8.92 11 8 WT control vs. WT HYP t(3840)=1.956 0.2674
WT HYP 182.30 9.45 14 8 Scn1aRH/+ control vs. Scn1aRH/+ SIH t(3840)=2.277 0.1296
Scn1aRH/+ SIH 208.79 21.24 13 8 WT HYP vs. Scn1aRH/+ SIH t(3840)=3.132 0.0105
WT - 153.78 4.79 14 7 WT control vs. Scn1aRH/+
control t(3840)=2.409 0.0924
Scn1aRH/+ - 175.11 7.44 11 8 WT control vs. WT HYP t(3840)=1.581 0.5163
WT HYP 166.91 7.77 14 8 Scn1aRH/+ control vs. Scn1aRH/+ SIH t(3840)=1.958 0.2665
Scn1aRH/+ SIH 192.72 17.57 13 8 WT HYP vs. Scn1aRH/+ SIH t(3840)=3.051 0.0137
WT - 147.60 4.60 14 7 WT control vs. Scn1aRH/+ control t(3840)=1.792 0.3661
Scn1aRH/+ - 163.46 6.23 11 8 WT control vs. WT HYP t(3840)=1.364 0.6795
WT HYP 158.93 8.02 14 8 Scn1aRH/+ control vs. Scn1aRH/+ SIH t(3840)=2.121 0.1874
Scn1aRH/+ SIH 182.55 15.89 13 8 WT HYP vs. Scn1aRH/+ SIH t(3840)=2.792 0.0311
WT - 117.91 5.31 14 7 WT control vs. WT HYP q(48)=1,669 0.6419
Scn1aRH/+ - 124.72 4.24 11 8 WT control vs. Scn1aRH/+ control q(48)=1,086 0.8684
WT HYP 127.91 6.58 13 8 Genotype F (1, 48) = 0,8656 0.3568 Scn1aRH/+ control vs. Scn1aRH/+ SIH q(48)=1,244 0.8155
Scn1aRH/+ SIH 132.51 7.17 14 8 Treatment F (1, 48) = 2,107 0.1532 WT HYP vs. Scn1aRH/+ SIH q(48)=0,7678 0.948
WT - 149.79 8.42 14 8 WT control vs. WT HYP q(54)=0,7188 0.9568
Scn1aRH/+ - 140.59 7.77 14 8 WT control vs. Scn1aRH/+ control q(54)=1,112 0.8603
WT HYP 155.64 9.06 15 8 Genotype F (1, 54) = 0,2123 0.6468 Scn1aRH/+ control vs. Scn1aRH/+ SIH q(54)=2,059 0.4706
Scn1aRH/+ SIH 157.35 7.11 15 8 Treatment F (1, 54) = 1,930 0.1705 WT HYP vs. Scn1aRH/+ SIH q(54)=0,2132 0.9988
Long-term potentiation in CA1 area of the hippocampus in Scn1aRH/+ -129:B6
3rd minute
PTP
2nd
minute
PTP
1st minute
PTP
33D
33B
33A
F (3, 48) = 2.736
< 0.0001F (79, 3792) = 133.9
0.0537
4x H
FS
-LT
P
Scn1aR
H/+
-129:B
6
last 15
minutes
< 0.0001F (237, 3792) = 1.841
1x H
FS
-LT
P
Sidak's
Scn1aR
H/+
-129:B
6
1x H
FS
-LT
P
fEP
SP
slo
pe (
% b
aselin
e)
RM Two-
way
ANOVA
Interaction
Time
Group (Treatment-
genotype)
Tuckey's
Tuckey's
Interaction
Interaction 0.8579F (1, 48) = 0,03241
F (1, 54) = 0,4493 0.5055
Two-way
ANOVA
fEP
SP
slo
pe (
%
baselin
e)
fEP
SP
slo
pe (
%
baselin
e)
last 15
minutes
Two-way
ANOVA
5th minute
PTP
4th minute
PTP

192
Mouse model
and genetic
background
Experi
ment
Meas
urme
nt
Protocol
phaseGenotype
treatme
nt/proto
col
average S.E.M
#
values/sli
ces/cells
#
animal
s
Statistical
test
Source of
variation
F(DFn,DFd) / t
(dF) value/U/χ²/Hp value Comparision
post hoc
test
t(dF) value /
q(dF) valuep value Figure
WT - 1.579 0.053 12 5 WT control vs. WT HYP q(43)=0,6265 0.9706
Scn1aRH/+ - 1.510 0.045 11 4 WT control vs. Scn1aRH/+ control q(43)=1,370 0.7676
WT HYP 1.548 0.032 12 5 Treatment F (1, 43) = 0,9651 0.3314 Scn1aRH/+ control vs. Scn1aRH/+ SIH q(43)=2,556 0.2839
Scn1aRH/+ SIH 1.639 0.062 12 4 Genotype F (1, 43) = 0,04681 0.8297 WT HYP vs. Scn1aRH/+ SIH q(43)=1,839 0.5678
WT - 1.473 0.047 12 6 WT control vs. WT HYP q(43)=0,4022 0.9919
Scn1aRH/+ - 1.457 0.021 12 6 WT control vs. Scn1aRH/+ control q(43)=0,4208 0.9907
WT HYP 1.488 0.039 12 5 Treatment F (1, 43) = 3,421 0.0712 Scn1aRH/+ control vs. Scn1a
RH/+ SIH q(43)=3,266 0.1118
Scn1aRH/+ SIH 1.584 0.044 11 5 Genotype F (1, 43) = 1,073 0.306 WT HYP vs. Scn1aRH/+ SIH q(43)=2,461 0.3161
WT - 1.380 0.030 12 6 WT control vs. WT HYP q(44)=1,578 0.6817
Scn1aRH/+ - 1.313 0.010 12 7 WT control vs. Scn1aRH/+ control q(44)=2,466 0.3138
WT HYP 1.338 0.024 12 5 Treatment F (1, 44) = 2,951 0.0928 Scn1aRH/+ control vs. Scn1aRH/+ SIH q(44)=5,014 0.005
Scn1aRH/+ SIH 1.450 0.037 12 5 Genotype F (1, 44) = 0,6886 0.4111 WT HYP vs. Scn1aRH/+ SIH q(44)=4,126 0.0274
WT - 1.256 0.025 13 7 WT control vs. WT HYP q(43)=0,4675 0.9874
Scn1aRH/+ - 1.252 0.026 12 6 WT control vs. Scn1aRH/+ control q(43)=0,1419 0.9996
WT HYP 1.269 0.033 12 6 Treatment F (1, 43) = 1,402 0.2429 Scn1aRH/+ control vs. Scn1aRH/+ SIH q(43)=1,855 0.5606
Scn1aRH/+ SIH 1.308 0.032 10 6 Genotype F (1, 43) = 0,3546 0.5547 WT HYP vs. Scn1a
RH/+ SIH q(43)=1,285 0.8002
WT - 1.210 0.021 12 7 WT control vs. WT HYP q(41)=2,008 0.4946
Scn1aRH/+ - 1.175 0.019 11 7 WT control vs. Scn1aRH/+ control q(41)=1,641 0.6548
WT HYP 1.168 0.021 12 6 Treatment F (1, 41) = 2,005 0.1643 Scn1aRH/+ control vs. Scn1aRH/+ SIH q(41)=4,617 0.0114
Scn1aRH/+ SIH 1.280 0.028 10 7 Genotype F (1, 41) = 3,009 0.0903 WT HYP vs. Scn1aRH/+ SIH q(41)=5,026 0.0052
WT - 1.132 0.014 12 5 WT control vs. WT HYP q(44)=0,1466 0.9996
Scn1aRH/+ - 1.116 0.015 11 7 WT control vs. Scn1aRH/+ control q(44)=0,9341 0.9113
WT HYP 1.130 0.012 13 7 Treatment F (1, 44) = 6,953 0.0115 Scn1aRH/+ control vs. Scn1aRH/+ SIH q(44)=5,307 0.0028
Scn1aRH/+ SIH 1.204 0.022 12 7 Genotype F (1, 44) = 3,338 0.0745 WT HYP vs. Scn1aRH/+ SIH q(44)=4,707 0.0093
WT - 1.103 0.021 12 8 WT control vs. WT HYP q(42)=0,3697 0.9936
Scn1aRH/+ - 1.101 0.017 11 6 WT control vs. Scn1aRH/+ control q(42)=0,08919 > 0,9999
WT HYP 1.110 0.015 12 6 Treatment F (1, 42) = 5,196 0.0278 Scn1aRH/+ control vs. Scn1aRH/+ SIH q(42)=4,109 0.0287
Scn1aRH/+ SIH 1.180 0.021 11 8 Genotype F (1, 42) = 3,344 0.0746 WT HYP vs. Scn1aRH/+ SIH q(42)=3,746 0.0531
WT - 1.088 0.019 12 7 WT control vs. WT HYP q(41)=1,117 0.8587
Scn1aRH/+ - 1.065 0.011 11 7 WT control vs. Scn1aRH/+ control q(41)=1,454 0.7341
WT HYP 1.105 0.016 11 6 Treatment F (1, 41) = 18,13 0.0001 Scn1aRH/+ control vs. Scn1aRH/+ SIH q(41)=7,333 < 0,0001
Scn1aRH/+ SIH 1.183 0.016 11 7 Genotype F (1, 41) = 2,939 0.094 WT HYP vs. Scn1aRH/+ SIH q(41)=4,816 0.0078
WT - 1.065 0.021 12 7 WT control vs. WT HYP q(45)=2,642 0.2562
Scn1aRH/+ - 1.069 0.018 11 5 WT control vs. Scn1a
RH/+ control q(45)=0,2418 0.9982
WT HYP 1.111 0.014 12 5 Treatment F (1, 45) = 10,82 0.002 Scn1aRH/+ control vs. Scn1aRH/+ SIH q(45)=3,944 0.0374
Scn1aRH/+ SIH 1.137 0.017 14 7 Genotype F (1, 45) = 0,7715 0.3844 WT HYP vs. Scn1aRH/+ SIH q(45)=1,555 0.6918
WT - 1.054 0.017 12 5 WT control vs. WT HYP q(44)=1,988 0.5025
Scn1aRH/+ - 1.047 0.014 11 6 WT control vs. Scn1aRH/+ control q(44)=0,4376 0.9896
WT HYP 1.085 0.011 12 5 Treatment F (1, 44) = 18,64 < 0,0001 Scn1aRH/+ control vs. Scn1aRH/+ SIH q(44)=6,639 0.0001
Scn1aRH/+ SIH 1.150 0.018 13 8 Genotype F (1, 44) = 3,559 0.0658 WT HYP vs. Scn1aRH/+ SIH q(44)=4,311 0.0196
33E
0.0017
Two-way
ANOVA
Two-way
ANOVA
Interaction F (1, 41) = 11,25
PP
R
150 ms
ISI
50 ms ISI
(P
2/P
1)
200 ms
ISI
Scn1aR
H/+
-129:B
6
250 ms
ISI
300 ms
ISI
350 ms
ISI
400 ms
ISI
450 ms
ISI
500 ms
ISI
100 ms
ISI
F (1, 44) = 5,443 0.0243
F (1, 43) = 2,108 0.1538
Two-way
ANOVA
Interaction
Interaction
Tuckey's
Two-way
ANOVA
Interaction
Interaction 0.1165
F (1, 45) = 0,3963 0.5322
0.0619
Tuckey's
Two-way
ANOVA
Interaction F (1, 41) = 9,940 0.003
Tuckey's
F (1, 43) = 2,566
Two-way
ANOVA
Interaction
Tuckey's
Tuckey's
F (1, 44) = 7,730 0.008
Tuckey's
Two-way
ANOVA
Interaction
0.4679
Tuckey's
Tuckey's
Two-way
ANOVA
F (1, 42) = 3,678
Tuckey's
Two-way
ANOVA
Interaction F (1, 44) = 10,87 0.0019
Tuckey's
Two-way
ANOVA
Interaction F (1, 43) = 0,5365
Paired-pulse ratio in CA1 area of the hippocampus in Scn1aRH/+ -129:B6

193
Mouse model
and genetic
background
Experi
ment
Meas
urme
nt
Protocol
phaseGenotype
treatme
nt/proto
col
average S.E.M
#
values/sli
ces/cells
#
animal
s
Statistical
test
Source of
variation
F(DFn,DFd) / t
(dF) value/U/χ²/Hp value Comparision
post hoc
test
t(dF) value /
q(dF) valuep value Figure
WT - 0.00 0.00 13 3 WT control vs. Scn1a RH/+ control q(1290)=0 > 0,9999
Scn1a RH/+ - 0.00 0.00 12 3 WT control vs. WT HYP q(1290)=0 > 0,9999
WT HYP 0.00 0.00 12 4 Scn1a RH/+ control vs. Scn1a RH/+ SIH q(1290)=0,077 > 0,9999
Scn1a RH/+ SIH 0.30 0.21 10 4 WT HYP vs. Scn1a RH/+ SIH q(1290)=0,077 > 0,9999
WT - 1.85 0.82 13 3 WT control vs. Scn1a RH/+ control q(1290)=0,02658 > 0,9999
Scn1a RH/+ - 1.75 1.22 12 3 WT control vs. WT HYP q(1290)=0,1116 0.9998
WT HYP 2.25 0.99 12 4 Scn1a RH/+ control vs. Scn1a RH/+ SIH q(1290)=1,305 0.7927
Scn1a RH/+ SIH 6.80 1.53 10 4 WT HYP vs. Scn1a RH/+ SIH q(1290)=1,176 0.8395
WT - 5.31 1.46 13 3 WT control vs. Scn1a RH/+ control q(1290)=0,4536 0.9886
Scn1a RH/+ - 3.67 1.52 12 3 WT control vs. WT HYP q(1290)=0,01595 > 0,9999
WT HYP 5.25 1.60 12 4 Scn1a RH/+ control vs. Scn1a RH/+ SIH q(1290)=2,154 0.4241
Scn1a RH/+ SIH 12.00 2.44 10 4 WT HYP vs. Scn1a RH/+ SIH q(1290)=1,744 0.6056
WT - 8.23 1.86 13 3 WT control vs. Scn1a RH/+ control q(1290)=0,7087 0.9588
Scn1a RH/+ - 5.67 1.70 12 3 WT control vs. WT HYP q(1290)=0,01772 > 0,9999
WT HYP 8.17 2.08 12 4 Scn1a RH/+ control vs. Scn1a RH/+ SIH q(1290)=2,722 0.2181
Scn1a RH/+ SIH 16.20 2.99 10 4 WT HYP vs. Scn1a RH/+ SIH q(1290)=2,076 0.4573
WT - 11.00 2.10 13 3 WT control vs. Scn1a RH/+ control q(1290)=0,8522 0.9312
Scn1a RH/+ - 7.92 1.94 12 3 WT control vs. WT HYP q(1290)=0,1612 0.9995
WT HYP 11.58 2.44 12 4 Scn1a RH/+ control vs. Scn1a RH/+ SIH q(1290)=3,252 0.0987
Scn1a RH/+ SIH 20.50 3.43 10 4 WT HYP vs. Scn1a RH/+ SIH q(1290)=2,304 0.3624
WT - 10.85 2.10 13 3 WT control vs. Scn1a RH/+ control q(1290)=0,349 0.9947
Scn1a RH/+ - 9.58 2.20 12 3 WT control vs. WT HYP q(1290)=0,8948 0.9215
WT HYP 14.08 2.98 12 4 Scn1a RH/+ control vs. Scn1a RH/+ SIH q(1290)=4,191 0.0164
Scn1a RH/+ SIH 25.80 3.97 10 4 WT HYP vs. Scn1a RH/+ SIH q(1290)=3,028 0.1408
WT - 12.38 2.49 13 3 WT control vs. Scn1a RH/+ control q(1290)=0,01417 > 0,9999
Scn1a RH/+ - 12.33 2.47 12 3 WT control vs. WT HYP q(1290)=1,091 0.8672
WT HYP 16.33 3.57 12 4 Scn1a RH/+ control vs. Scn1a RH/+ SIH q(1290)=4,385 0.0106
Scn1a RH/+ SIH 29.30 4.38 10 4 WT HYP vs. Scn1a RH/+ SIH q(1290)=3,351 0.0836
WT - 14.23 3.12 13 3 WT control vs. Scn1a RH/+ control q(1290)=0,1099 0.9998
Scn1a RH/+ - 13.83 2.70 12 3 WT control vs. WT HYP q(1290)=0,7424 0.9531
WT HYP 16.92 3.14 12 4 Scn1a RH/+ control vs. Scn1a RH/+ SIH q(1290)=4,772 0.0042
Scn1a RH/+ SIH 32.30 4.85 10 4 WT HYP vs. Scn1a RH/+ SIH q(1290)=3,975 0.0258
WT - 14.62 3.00 13 3 WT control vs. Scn1a RH/+ control q(1290)=0,4057 0.9918
Scn1a RH/+ - 16.08 2.92 12 3 WT control vs. WT HYP q(1290)=0,6821 0.963
WT HYP 17.08 3.10 12 4 Scn1a RH/+ control vs. Scn1a RH/+ SIH q(1290)=5,328 0.001
Scn1a RH/+ SIH 36.70 5.01 10 4 WT HYP vs. Scn1a RH/+ SIH q(1290)=5,069 0.002
WT - 17.00 3.42 13 3 WT control vs. Scn1a RH/+ control q(1290)=0,1843 0.9992
Scn1a RH/+ - 17.67 3.11 12 3 WT control vs. WT HYP q(1290)=0,4837 0.9862
WT HYP 18.75 3.61 12 4 Scn1a RH/+ control vs. Scn1a RH/+ SIH q(1290)=5,642 0.0004
Scn1a RH/+ SIH 39.50 5.05 10 4 WT HYP vs. Scn1a RH/+ SIH q(1290)=5,362 0.0009
WT - 18.46 3.74 13 3 WT control vs. Scn1a RH/+ control q(1290)=0,0567 > 0,9999
Scn1a RH/+ - 18.67 2.85 12 3 WT control vs. WT HYP q(1290)=0,1506 0.9996
WT HYP 17.92 3.66 12 4 Scn1a RH/+ control vs. Scn1a RH/+ SIH q(1290)=6,056 0.0001
Scn1a RH/+ SIH 42.10 4.90 10 4 WT HYP vs. Scn1a RH/+ SIH q(1290)=6,249 < 0,0001
WT - 19.08 3.90 13 3 WT control vs. Scn1a RH/+ control q(1290)=0,14 0.9997
Scn1a RH/+ - 19.58 2.75 12 3 WT control vs. WT HYP q(1290)=0,1134 0.9998
WT HYP 18.67 4.11 12 4 Scn1a RH/+ control vs. Scn1a RH/+ SIH q(1290)=6,336 < 0,0001
Scn1a RH/+ SIH 44.10 4.91 10 4 WT HYP vs. Scn1a RH/+ SIH q(1290)=6,572 < 0,0001
WT - 18.62 3.53 13 3 WT control vs. Scn1a RH/+ control q(1290)=0,6821 0.963
Scn1a RH/+ - 21.08 2.62 12 3 WT control vs. WT HYP q(1290)=0,815 0.9392
WT HYP 15.67 3.80 12 4 Scn1a RH/+ control vs. Scn1a RH/+ SIH q(1290)=6,051 0.0001
Scn1a RH/+ SIH 44.50 5.12 10 4 WT HYP vs. Scn1a RH/+ SIH q(1290)=7,451 < 0,0001
WT - 16.46 3.22 13 3 WT control vs. Scn1a RH/+ control q(1290)=1,485 0.72
Scn1a RH/+ - 21.83 2.50 12 3 WT control vs. WT HYP q(1290)=0,2658 0.9976
WT HYP 15.50 4.22 12 4 Scn1a RH/+ control vs. Scn1a RH/+ SIH q(1290)=5,16 0.0016
Scn1a RH/+ SIH 41.80 5.35 10 4 WT HYP vs. Scn1a RH/+ SIH q(1290)=6,796 < 0,0001
WT - 16.85 3.52 13 3 WT control vs. Scn1a RH/+ control q(1290)=1,448 0.7356
Scn1a RH/+ - 22.08 2.67 12 3 WT control vs. WT HYP q(1290)=0,3721 0.9936
WT HYP 15.50 4.72 12 4 Scn1a RH/+ control vs. Scn1a RH/+ SIH q(1290)=5,147 0.0016
Scn1a RH/+ SIH 42.00 6.36 10 4 WT HYP vs. Scn1a RH/+ SIH q(1290)=6,848 < 0,0001
WT - 16.15 3.53 13 3 WT control vs. Scn1a RH/+ control q(1290)=1,224 0.8225
Scn1a RH/+ - 20.58 2.97 12 3 WT control vs. WT HYP q(1290)=0,2959 0.9968
WT HYP 15.08 4.59 12 4 Scn1a RH/+ control vs. Scn1a RH/+ SIH q(1290)=4,94 0.0028
Scn1a RH/+ SIH 39.70 7.02 10 4 WT HYP vs. Scn1a RH/+ SIH q(1290)=6,361 < 0,0001
WT - 16.85 3.85 13 3 WT control vs. Scn1a RH/+ control q(1290)=0,8257 0.937
Scn1a RH/+ - 19.83 3.16 12 3 WT control vs. WT HYP q(1290)=0,6024 0.974
WT HYP 14.67 4.47 12 4 Scn1a RH/+ control vs. Scn1a RH/+ SIH q(1290)=5,134 0.0017
Scn1a RH/+ SIH 39.70 7.69 10 4 WT HYP vs. Scn1a RH/+ SIH q(1290)=6,469 < 0,0001
WT - 15.54 3.53 13 3 WT control vs. Scn1a RH/+ control q(1290)=0,9568 0.906
Scn1a RH/+ - 19.00 3.33 12 3 WT control vs. WT HYP q(1290)=0,0567 > 0,9999
WT HYP 15.33 4.99 12 4 Scn1a RH/+ control vs. Scn1a RH/+ SIH q(1290)=5,117 0.0018
Scn1a RH/+ SIH 38.80 8.12 10 4 WT HYP vs. Scn1a RH/+ SIH q(1290)=6,064 0.0001
WT - 16.77 4.17 13 3 WT control vs. Scn1a RH/+ control q(1290)=0,1329 0.9997
Scn1a RH/+ - 17.25 3.56 12 3 WT control vs. WT HYP q(1290)=0,8345 0.9351
WT HYP 13.75 4.41 12 4 Scn1a RH/+ control vs. Scn1a RH/+ SIH q(1290)=5,285 0.0011
Scn1a RH/+ SIH 37.70 8.70 10 4 WT HYP vs. Scn1a RH/+ SIH q(1290)=6,189 < 0,0001
WT - 15.00 3.91 13 3 WT control vs. Scn1a RH/+ control q(1290)=0,5989 0.9745
Scn1a RH/+ - 17.17 3.77 12 3 WT control vs. WT HYP q(1290)=0,8292 0.9362
WT HYP 12.00 3.93 12 4 Scn1a RH/+ control vs. Scn1a RH/+ SIH q(1290)=3,911 0.0294
Scn1a RH/+ SIH 32.30 8.37 10 4 WT HYP vs. Scn1a RH/+ SIH q(1290)=5,246 0.0012
WT - 13.23 3.77 13 3 WT control vs. Scn1a RH/+ control q(1290)=0,6272 0.9709
Scn1a RH/+ - 15.50 3.80 12 3 WT control vs. WT HYP q(1290)=0,5014 0.9847
WT HYP 11.42 3.57 12 4 Scn1a RH/+ control vs. Scn1a RH/+ SIH q(1290)=4,057 0.0218
Scn1a RH/+ SIH 31.20 8.40 10 4 WT HYP vs. Scn1a RH/+ SIH q(1290)=5,112 0.0018
WT - 10.92 3.08 13 3 WT control vs. Scn1a RH/+ control q(1290)=0,8274 0.9366
Scn1a RH/+ - 13.92 3.87 12 3 WT control vs. WT HYP q(1290)=0,4624 0.9879
WT HYP 9.25 2.66 12 4 Scn1a RH/+ control vs. Scn1a RH/+ SIH q(1290)=3,743 0.041
Scn1a RH/+ SIH 28.40 7.97 10 4 WT HYP vs. Scn1a RH/+ SIH q(1290)=4,949 0.0027
WT - 9.69 2.89 13 3 WT control vs. Scn1a RH/+ control q(1290)=1,122 0.8576
Scn1a RH/+ - 13.75 3.92 12 3 WT control vs. WT HYP q(1290)=0,652 0.9675
WT HYP 7.33 2.46 12 4 Scn1a RH/+ control vs. Scn1a RH/+ SIH q(1290)=3,088 0.1283
Scn1a RH/+ SIH 25.70 7.48 10 4 WT HYP vs. Scn1a RH/+ SIH q(1290)=4,746 0.0045
WT - 7.54 2.39 13 3 WT control vs. Scn1a RH/+ control q(1290)=1,51 0.7095
Scn1a RH/+ - 13.00 3.68 12 3 WT control vs. WT HYP q(1290)=0,010 > 0,9999
WT HYP 7.50 2.75 12 4 Scn1a RH/+ control vs. Scn1a RH/+ SIH q(1290)=2,429 0.3148
Scn1a RH/+ SIH 22.40 7.23 10 4 WT HYP vs. Scn1a RH/+ SIH q(1290)=3,85 0.0332
WT - 6.77 1.91 13 3 WT control vs. Scn1a RH/+ control q(1290)=1,63 0.6569
Scn1a RH/+ - 12.67 3.93 12 3 WT control vs. WT HYP q(1290)=0,1329 0.9997
WT HYP 7.25 2.81 12 4 Scn1a RH/+ control vs. Scn1a RH/+ SIH q(1290)=2,024 0.4799
Scn1a RH/+ SIH 20.50 6.30 10 4 WT HYP vs. Scn1a RH/+ SIH q(1290)=3,424 0.0736
WT - 5.69 1.59 13 3 WT control vs. Scn1a RH/+ control q(1290)=1,237 0.8181
Scn1a RH/+ - 10.17 3.24 12 3 WT control vs. WT HYP q(1290)=0,1541 0.9995
WT HYP 6.25 2.54 12 4 Scn1a RH/+ control vs. Scn1a RH/+ SIH q(1290)=2,309 0.3607
Scn1a RH/+ SIH 19.10 6.20 10 4 WT HYP vs. Scn1a RH/+ SIH q(1290)=3,321 0.0879
WT - 5.08 1.54 13 3 WT control vs. Scn1a RH/+ control q(1290)=1,084 0.8694
Scn1a RH/+ - 9.00 2.96 12 3 WT control vs. WT HYP q(1290)=0,3242 0.9958
WT HYP 6.25 2.93 12 4 Scn1a RH/+ control vs. Scn1a RH/+ SIH q(1290)=1,68 0.6347
Scn1a RH/+ SIH 15.50 5.57 10 4 WT HYP vs. Scn1a RH/+ SIH q(1290)=2,39 0.3292
WT - 4.85 1.31 13 3 WT control vs. Scn1a RH/+ control q(1290)=0,8717 0.9269
Scn1a RH/+ - 8.00 2.82 12 3 WT control vs. WT HYP q(1290)=0,2268 0.9985
WT HYP 5.67 2.42 12 4 Scn1a RH/+ control vs. Scn1a RH/+ SIH q(1290)=1,628 0.6578
Scn1a RH/+ SIH 14.30 6.43 10 4 WT HYP vs. Scn1a RH/+ SIH q(1290)=2,231 0.3918
WT - 4.77 1.29 13 3 WT control vs. Scn1a RH/+ control q(1290)=0,8009 0.9421
Scn1a RH/+ - 7.67 2.72 12 3 WT control vs. WT HYP q(1290)=0,06378 > 0,9999
WT HYP 5.00 2.29 12 4 Scn1a RH/+ control vs. Scn1a RH/+ SIH q(1290)=1,559 0.6881
Scn1a RH/+ SIH 13.70 6.43 10 4 WT HYP vs. Scn1a RH/+ SIH q(1290)=2,248 0.3848
WT - 4.15 1.05 13 3 WT control vs. Scn1a RH/+ control q(1290)=0,8327 0.9355
Scn1a RH/+ - 7.17 2.74 12 3 WT control vs. WT HYP q(1290)=0,01949 > 0,9999
WT HYP 4.08 1.61 12 4 Scn1a RH/+ control vs. Scn1a RH/+ SIH q(1290)=1,533 0.6993
Scn1a RH/+ SIH 13.10 6.42 10 4 WT HYP vs. Scn1a RH/+ SIH q(1290)=2,33 0.3523
Excitability in DG area of the hippocampus in Scn1aRH/+ -129:B6
Tuckey's
480 Tuckey's
500 Tuckey's
400 Tuckey's
420 Tuckey's
440
160 Tuckey's
180 Tuckey's
Tuckey's
80 Tuckey's
100 Tuckey's
120 Tuckey's
580 Tuckey's
Scn1aR
H/+
-129:B
6
Fre
qu
en
cy i
n D
G g
ran
ula
r cell
s
Nu
mb
er
of
acti
on
po
ten
tials
34 B
0 Tuckey's
20 Tuckey's
40 Tuckey's
60
520 Tuckey's
540 Tuckey's
560 Tuckey's
Tuckey's
460
< 0,0001F (87, 1247) = 1,774
380 Tuckey's
Two-way
ANOVA
Genotype
Treatment
Interaction
320 Tuckey's
340 Tuckey's
360 Tuckey's
< 0,0001F (29, 1247) = 27,58
0.0002F (3, 43) = 8,369
260 Tuckey's
280 Tuckey's
300 Tuckey's
200 Tuckey's
220 Tuckey's
240 Tuckey's
140 Tuckey's

194
Mouse model
and genetic
background
Experi
ment
Meas
urme
nt
Protocol
phaseGenotype
treatme
nt/proto
col
average S.E.M
#
values/sli
ces/cells
#
animal
s
Statistical
test
Source of
variation
F(DFn,DFd) / t
(dF) value/U/χ²/Hp value Comparision
post hoc
test
t(dF) value /
q(dF) valuep value Figure
WT - 0.00 0.00 13 3 WT control vs. Scn1a RH/+ control q(1290)=0 > 0,9999
Scn1a RH/+ - 0.00 0.00 12 3 WT control vs. WT HYP q(1290)=0 > 0,9999
WT HYP 0.00 0.00 12 4 Scn1a RH/+ control vs. Scn1a RH/+ SIH q(1290)=0,077 > 0,9999
Scn1a RH/+ SIH 0.30 0.21 10 4 WT HYP vs. Scn1a RH/+ SIH q(1290)=0,077 > 0,9999
WT - 1.85 0.82 13 3 WT control vs. Scn1a RH/+ control q(1290)=0,02658 > 0,9999
Scn1a RH/+ - 1.75 1.22 12 3 WT control vs. WT HYP q(1290)=0,1116 0.9998
WT HYP 2.25 0.99 12 4 Scn1a RH/+ control vs. Scn1a RH/+ SIH q(1290)=1,305 0.7927
Scn1a RH/+ SIH 6.80 1.53 10 4 WT HYP vs. Scn1a RH/+ SIH q(1290)=1,176 0.8395
WT - 5.31 1.46 13 3 WT control vs. Scn1a RH/+ control q(1290)=0,4536 0.9886
Scn1a RH/+ - 3.67 1.52 12 3 WT control vs. WT HYP q(1290)=0,01595 > 0,9999
WT HYP 5.25 1.60 12 4 Scn1a RH/+ control vs. Scn1a RH/+ SIH q(1290)=2,154 0.4241
Scn1a RH/+ SIH 12.00 2.44 10 4 WT HYP vs. Scn1a RH/+ SIH q(1290)=1,744 0.6056
WT - 8.23 1.86 13 3 WT control vs. Scn1a RH/+ control q(1290)=0,7087 0.9588
Scn1a RH/+ - 5.67 1.70 12 3 WT control vs. WT HYP q(1290)=0,01772 > 0,9999
WT HYP 8.17 2.08 12 4 Scn1a RH/+ control vs. Scn1a RH/+ SIH q(1290)=2,722 0.2181
Scn1a RH/+ SIH 16.20 2.99 10 4 WT HYP vs. Scn1a RH/+ SIH q(1290)=2,076 0.4573
WT - 11.00 2.10 13 3 WT control vs. Scn1a RH/+ control q(1290)=0,8522 0.9312
Scn1a RH/+ - 7.92 1.94 12 3 WT control vs. WT HYP q(1290)=0,1612 0.9995
WT HYP 11.58 2.44 12 4 Scn1a RH/+ control vs. Scn1a RH/+ SIH q(1290)=3,252 0.0987
Scn1a RH/+ SIH 20.50 3.43 10 4 WT HYP vs. Scn1a RH/+ SIH q(1290)=2,304 0.3624
WT - 10.85 2.10 13 3 WT control vs. Scn1a RH/+ control q(1290)=0,349 0.9947
Scn1a RH/+ - 9.58 2.20 12 3 WT control vs. WT HYP q(1290)=0,8948 0.9215
WT HYP 14.08 2.98 12 4 Scn1a RH/+ control vs. Scn1a RH/+ SIH q(1290)=4,191 0.0164
Scn1a RH/+ SIH 25.80 3.97 10 4 WT HYP vs. Scn1a RH/+ SIH q(1290)=3,028 0.1408
WT - 12.38 2.49 13 3 WT control vs. Scn1a RH/+ control q(1290)=0,01417 > 0,9999
Scn1a RH/+ - 12.33 2.47 12 3 WT control vs. WT HYP q(1290)=1,091 0.8672
WT HYP 16.33 3.57 12 4 Scn1a RH/+ control vs. Scn1a RH/+ SIH q(1290)=4,385 0.0106
Scn1a RH/+ SIH 29.30 4.38 10 4 WT HYP vs. Scn1a RH/+ SIH q(1290)=3,351 0.0836
WT - 14.23 3.12 13 3 WT control vs. Scn1a RH/+ control q(1290)=0,1099 0.9998
Scn1a RH/+ - 13.83 2.70 12 3 WT control vs. WT HYP q(1290)=0,7424 0.9531
WT HYP 16.92 3.14 12 4 Scn1a RH/+ control vs. Scn1a RH/+ SIH q(1290)=4,772 0.0042
Scn1a RH/+ SIH 32.30 4.85 10 4 WT HYP vs. Scn1a RH/+ SIH q(1290)=3,975 0.0258
WT - 14.62 3.00 13 3 WT control vs. Scn1a RH/+ control q(1290)=0,4057 0.9918
Scn1a RH/+ - 16.08 2.92 12 3 WT control vs. WT HYP q(1290)=0,6821 0.963
WT HYP 17.08 3.10 12 4 Scn1a RH/+ control vs. Scn1a RH/+ SIH q(1290)=5,328 0.001
Scn1a RH/+ SIH 36.70 5.01 10 4 WT HYP vs. Scn1a RH/+ SIH q(1290)=5,069 0.002
WT - 17.00 3.42 13 3 WT control vs. Scn1a RH/+ control q(1290)=0,1843 0.9992
Scn1a RH/+ - 17.67 3.11 12 3 WT control vs. WT HYP q(1290)=0,4837 0.9862
WT HYP 18.75 3.61 12 4 Scn1a RH/+ control vs. Scn1a RH/+ SIH q(1290)=5,642 0.0004
Scn1a RH/+ SIH 39.50 5.05 10 4 WT HYP vs. Scn1a RH/+ SIH q(1290)=5,362 0.0009
WT - 18.46 3.74 13 3 WT control vs. Scn1a RH/+ control q(1290)=0,0567 > 0,9999
Scn1a RH/+ - 18.67 2.85 12 3 WT control vs. WT HYP q(1290)=0,1506 0.9996
WT HYP 17.92 3.66 12 4 Scn1a RH/+ control vs. Scn1a RH/+ SIH q(1290)=6,056 0.0001
Scn1a RH/+ SIH 42.10 4.90 10 4 WT HYP vs. Scn1a RH/+ SIH q(1290)=6,249 < 0,0001
WT - 19.08 3.90 13 3 WT control vs. Scn1a RH/+ control q(1290)=0,14 0.9997
Scn1a RH/+ - 19.58 2.75 12 3 WT control vs. WT HYP q(1290)=0,1134 0.9998
WT HYP 18.67 4.11 12 4 Scn1a RH/+ control vs. Scn1a RH/+ SIH q(1290)=6,336 < 0,0001
Scn1a RH/+ SIH 44.10 4.91 10 4 WT HYP vs. Scn1a RH/+ SIH q(1290)=6,572 < 0,0001
WT - 18.62 3.53 13 3 WT control vs. Scn1a RH/+ control q(1290)=0,6821 0.963
Scn1a RH/+ - 21.08 2.62 12 3 WT control vs. WT HYP q(1290)=0,815 0.9392
WT HYP 15.67 3.80 12 4 Scn1a RH/+ control vs. Scn1a RH/+ SIH q(1290)=6,051 0.0001
Scn1a RH/+ SIH 44.50 5.12 10 4 WT HYP vs. Scn1a RH/+ SIH q(1290)=7,451 < 0,0001
WT - 16.46 3.22 13 3 WT control vs. Scn1a RH/+ control q(1290)=1,485 0.72
Scn1a RH/+ - 21.83 2.50 12 3 WT control vs. WT HYP q(1290)=0,2658 0.9976
WT HYP 15.50 4.22 12 4 Scn1a RH/+ control vs. Scn1a RH/+ SIH q(1290)=5,16 0.0016
Scn1a RH/+ SIH 41.80 5.35 10 4 WT HYP vs. Scn1a RH/+ SIH q(1290)=6,796 < 0,0001
WT - 16.85 3.52 13 3 WT control vs. Scn1a RH/+ control q(1290)=1,448 0.7356
Scn1a RH/+ - 22.08 2.67 12 3 WT control vs. WT HYP q(1290)=0,3721 0.9936
WT HYP 15.50 4.72 12 4 Scn1a RH/+ control vs. Scn1a RH/+ SIH q(1290)=5,147 0.0016
Scn1a RH/+ SIH 42.00 6.36 10 4 WT HYP vs. Scn1a RH/+ SIH q(1290)=6,848 < 0,0001
WT - 16.15 3.53 13 3 WT control vs. Scn1a RH/+ control q(1290)=1,224 0.8225
Scn1a RH/+ - 20.58 2.97 12 3 WT control vs. WT HYP q(1290)=0,2959 0.9968
WT HYP 15.08 4.59 12 4 Scn1a RH/+ control vs. Scn1a RH/+ SIH q(1290)=4,94 0.0028
Scn1a RH/+ SIH 39.70 7.02 10 4 WT HYP vs. Scn1a RH/+ SIH q(1290)=6,361 < 0,0001
WT - 16.85 3.85 13 3 WT control vs. Scn1a RH/+ control q(1290)=0,8257 0.937
Scn1a RH/+ - 19.83 3.16 12 3 WT control vs. WT HYP q(1290)=0,6024 0.974
WT HYP 14.67 4.47 12 4 Scn1a RH/+ control vs. Scn1a RH/+ SIH q(1290)=5,134 0.0017
Scn1a RH/+ SIH 39.70 7.69 10 4 WT HYP vs. Scn1a RH/+ SIH q(1290)=6,469 < 0,0001
WT - 15.54 3.53 13 3 WT control vs. Scn1a RH/+ control q(1290)=0,9568 0.906
Scn1a RH/+ - 19.00 3.33 12 3 WT control vs. WT HYP q(1290)=0,0567 > 0,9999
WT HYP 15.33 4.99 12 4 Scn1a RH/+ control vs. Scn1a RH/+ SIH q(1290)=5,117 0.0018
Scn1a RH/+ SIH 38.80 8.12 10 4 WT HYP vs. Scn1a RH/+ SIH q(1290)=6,064 0.0001
WT - 16.77 4.17 13 3 WT control vs. Scn1a RH/+ control q(1290)=0,1329 0.9997
Scn1a RH/+ - 17.25 3.56 12 3 WT control vs. WT HYP q(1290)=0,8345 0.9351
WT HYP 13.75 4.41 12 4 Scn1a RH/+ control vs. Scn1a RH/+ SIH q(1290)=5,285 0.0011
Scn1a RH/+ SIH 37.70 8.70 10 4 WT HYP vs. Scn1a RH/+ SIH q(1290)=6,189 < 0,0001
WT - 15.00 3.91 13 3 WT control vs. Scn1a RH/+ control q(1290)=0,5989 0.9745
Scn1a RH/+ - 17.17 3.77 12 3 WT control vs. WT HYP q(1290)=0,8292 0.9362
WT HYP 12.00 3.93 12 4 Scn1a RH/+ control vs. Scn1a RH/+ SIH q(1290)=3,911 0.0294
Scn1a RH/+ SIH 32.30 8.37 10 4 WT HYP vs. Scn1a RH/+ SIH q(1290)=5,246 0.0012
WT - 13.23 3.77 13 3 WT control vs. Scn1a RH/+ control q(1290)=0,6272 0.9709
Scn1a RH/+ - 15.50 3.80 12 3 WT control vs. WT HYP q(1290)=0,5014 0.9847
WT HYP 11.42 3.57 12 4 Scn1a RH/+ control vs. Scn1a RH/+ SIH q(1290)=4,057 0.0218
Scn1a RH/+ SIH 31.20 8.40 10 4 WT HYP vs. Scn1a RH/+ SIH q(1290)=5,112 0.0018
WT - 10.92 3.08 13 3 WT control vs. Scn1a RH/+ control q(1290)=0,8274 0.9366
Scn1a RH/+ - 13.92 3.87 12 3 WT control vs. WT HYP q(1290)=0,4624 0.9879
WT HYP 9.25 2.66 12 4 Scn1a RH/+ control vs. Scn1a RH/+ SIH q(1290)=3,743 0.041
Scn1a RH/+ SIH 28.40 7.97 10 4 WT HYP vs. Scn1a RH/+ SIH q(1290)=4,949 0.0027
WT - 9.69 2.89 13 3 WT control vs. Scn1a RH/+ control q(1290)=1,122 0.8576
Scn1a RH/+ - 13.75 3.92 12 3 WT control vs. WT HYP q(1290)=0,652 0.9675
WT HYP 7.33 2.46 12 4 Scn1a RH/+ control vs. Scn1a RH/+ SIH q(1290)=3,088 0.1283
Scn1a RH/+ SIH 25.70 7.48 10 4 WT HYP vs. Scn1a RH/+ SIH q(1290)=4,746 0.0045
WT - 7.54 2.39 13 3 WT control vs. Scn1a RH/+ control q(1290)=1,51 0.7095
Scn1a RH/+ - 13.00 3.68 12 3 WT control vs. WT HYP q(1290)=0,010 > 0,9999
WT HYP 7.50 2.75 12 4 Scn1a RH/+ control vs. Scn1a RH/+ SIH q(1290)=2,429 0.3148
Scn1a RH/+ SIH 22.40 7.23 10 4 WT HYP vs. Scn1a RH/+ SIH q(1290)=3,85 0.0332
WT - 6.77 1.91 13 3 WT control vs. Scn1a RH/+ control q(1290)=1,63 0.6569
Scn1a RH/+ - 12.67 3.93 12 3 WT control vs. WT HYP q(1290)=0,1329 0.9997
WT HYP 7.25 2.81 12 4 Scn1a RH/+ control vs. Scn1a RH/+ SIH q(1290)=2,024 0.4799
Scn1a RH/+ SIH 20.50 6.30 10 4 WT HYP vs. Scn1a RH/+ SIH q(1290)=3,424 0.0736
WT - 5.69 1.59 13 3 WT control vs. Scn1a RH/+ control q(1290)=1,237 0.8181
Scn1a RH/+ - 10.17 3.24 12 3 WT control vs. WT HYP q(1290)=0,1541 0.9995
WT HYP 6.25 2.54 12 4 Scn1a RH/+ control vs. Scn1a RH/+ SIH q(1290)=2,309 0.3607
Scn1a RH/+ SIH 19.10 6.20 10 4 WT HYP vs. Scn1a RH/+ SIH q(1290)=3,321 0.0879
WT - 5.08 1.54 13 3 WT control vs. Scn1a RH/+ control q(1290)=1,084 0.8694
Scn1a RH/+ - 9.00 2.96 12 3 WT control vs. WT HYP q(1290)=0,3242 0.9958
WT HYP 6.25 2.93 12 4 Scn1a RH/+ control vs. Scn1a RH/+ SIH q(1290)=1,68 0.6347
Scn1a RH/+ SIH 15.50 5.57 10 4 WT HYP vs. Scn1a RH/+ SIH q(1290)=2,39 0.3292
WT - 4.85 1.31 13 3 WT control vs. Scn1a RH/+ control q(1290)=0,8717 0.9269
Scn1a RH/+ - 8.00 2.82 12 3 WT control vs. WT HYP q(1290)=0,2268 0.9985
WT HYP 5.67 2.42 12 4 Scn1a RH/+ control vs. Scn1a RH/+ SIH q(1290)=1,628 0.6578
Scn1a RH/+ SIH 14.30 6.43 10 4 WT HYP vs. Scn1a RH/+ SIH q(1290)=2,231 0.3918
WT - 4.77 1.29 13 3 WT control vs. Scn1a RH/+ control q(1290)=0,8009 0.9421
Scn1a RH/+ - 7.67 2.72 12 3 WT control vs. WT HYP q(1290)=0,06378 > 0,9999
WT HYP 5.00 2.29 12 4 Scn1a RH/+ control vs. Scn1a RH/+ SIH q(1290)=1,559 0.6881
Scn1a RH/+ SIH 13.70 6.43 10 4 WT HYP vs. Scn1a RH/+ SIH q(1290)=2,248 0.3848
WT - 4.15 1.05 13 3 WT control vs. Scn1a RH/+ control q(1290)=0,8327 0.9355
Scn1a RH/+ - 7.17 2.74 12 3 WT control vs. WT HYP q(1290)=0,01949 > 0,9999
WT HYP 4.08 1.61 12 4 Scn1a RH/+ control vs. Scn1a RH/+ SIH q(1290)=1,533 0.6993
Scn1a RH/+ SIH 13.10 6.42 10 4 WT HYP vs. Scn1a RH/+ SIH q(1290)=2,33 0.3523
Excitability in DG area of the hippocampus in Scn1aRH/+ -129:B6
Tuckey's
480 Tuckey's
500 Tuckey's
400 Tuckey's
420 Tuckey's
440
160 Tuckey's
180 Tuckey's
Tuckey's
80 Tuckey's
100 Tuckey's
120 Tuckey's
580 Tuckey's
Scn1aR
H/+
-129:B
6
Fre
qu
en
cy i
n D
G g
ran
ula
r cell
s
Nu
mb
er
of
acti
on
po
ten
tials
34 B
0 Tuckey's
20 Tuckey's
40 Tuckey's
60
520 Tuckey's
540 Tuckey's
560 Tuckey's
Tuckey's
460
< 0,0001F (87, 1247) = 1,774
380 Tuckey's
Two-way
ANOVA
Genotype
Treatment
Interaction
320 Tuckey's
340 Tuckey's
360 Tuckey's
< 0,0001F (29, 1247) = 27,58
0.0002F (3, 43) = 8,369
260 Tuckey's
280 Tuckey's
300 Tuckey's
200 Tuckey's
220 Tuckey's
240 Tuckey's
140 Tuckey's
Mouse model
and genetic
background
Experi
ment
Measur
ment
Protocol
phaseGenotype
treatme
nt/proto
col
average S.E.M
#
values/sli
ces/cells
#
animal
s
Statistical
testSource of variation
F(DFn,DFd) / t
(dF) value/U/χ²/Hp value Comparision
post hoc
test
t(dF) value /
q(dF) valuep value Figure
WT - 17.375 1.012 19 19 WT control vs. Scn1aRH/+ control q(64)=2,064 0.4676
Scn1aRH/+ - 20.946 1.338 22 22 WT control vs. WT HYP q(64)=2,749 0.2203
WT HYP 22.841 1.808 13 13 Treatment F (1, 64) = 45,01 < 0,0001 Scn1aRH/+ control vs. Scn1aRH/+ SIH q(64)=10,88 < 0,0001
Scn1aRH/+ SIH 41.498 3.492 14 14 Genotype F (1, 64) = 32,85 < 0,0001 WT HYP vs. Scn1aRH/+ SIH q(64)=8,768 < 0,0001
WT - 0.029 0.002 19 19 WT control vs. Scn1aRH/+
control q(64)=62,033 0.4808
Scn1aRH/+ - 0.035 0.002 22 22 WT control vs. WT HYP q(64)=2,762 0.2167
WT HYP 0.038 0.003 13 13 Treatment F (1, 64) = 45,97 < 0,0001 Scn1aRH/+
control vs. Scn1aRH/+
SIH q(64)=11,01 < 0,0001
Scn1aRH/+ SIH 0.069 0.006 14 14 Genotype F (1, 64) = 33,20 < 0,0001 WT HYP vs. Scn1aRH/+ SIH q(64)=8,849 < 0,0001
WT - 20.632 1.575 19 19 WT control vs. Scn1aRH/+ control q(64)=1,463 0.7298
Scn1aRH/+ - 23.364 1.244 22 22 WT control vs. WT HYP q(64)=1,928 0.5266
WT HYP 24.769 1.680 13 13 Treatment F (1, 64) = 14,73 0.0003 Scn1aRH/+ control vs. Scn1aRH/+ SIH q(64)=5,85 0.0006
Scn1aRH/+ SIH 35.286 3.739 14 14 Genotype F (1, 64) = 10,02 0.0024 WT HYP vs. Scn1aRH/+ SIH q(64)=4,58 0.01
WT - 26.385 5.112 13 13 WT control vs. Scn1aRH/+ control q(47)=1,145 0.8495
Scn1aRH/+ - 33.500 4.350 16 16 WT control vs. WT HYP q(47)=2,118 0.4472
WT HYP 40.818 7.499 11 11 Treatment F (1, 47) = 27,00 < 0,0001 Scn1aRH/+ control vs. Scn1aRH/+ SIH q(47)=8,419 < 0,0001
Scn1aRH/+ SIH 88.364 10.098 11 11 Genotype F (1, 47) = 16,80 0.0002 WT HYP vs. Scn1aRH/+ SIH q(47)=6,702 0.0001
WT - 0.162 0.020 18 18 WT control vs. Scn1aRH/+ control q(64)=1,244 0.8155
Scn1aRH/+ - 0.181 0.014 23 23 WT control vs. WT HYP q(64)=0,2553 0.9979
WT HYP 0.158 0.018 13 13 Treatment F (1, 64) = 1,623 0.2072 Scn1aRH/+ control vs. Scn1aRH/+ SIH q(64)=2,37 0.3449
Scn1aRH/+ SIH 0.142 0.013 14 14 Genotype F (1, 64) = 0,01061 0.9183 WT HYP vs. Scn1aRH/+ SIH q(64)=0,8281 0.9361
35C
35F
35E
35A
35B
Distance
travelled
(m)
An
xie
ty
Rearing
episodes
Rotations
of the
animal's
body
Ste
reo
typ
ed
beh
avio
r
Distance
in the
center
(m)/total
distance(m
)
Scn1aR
H/+
-129:B
6
Op
en
field
Lo
co
mo
tor
Acti
vit
y
Average
speed
(m/s)
Interaction F (1, 64) = 15,13 0.0002
0.0039
Tuckey's
Interaction F (1, 64) = 15,58 0.0002
Two-way
ANOVA
Two-way
ANOVA
Two-way
ANOVA
Tuckey's
Tuckey's
F (1, 64) = 3,460 0.0675
F (1, 64) = 1,020 0.3164
Tuckey's
Two-way
ANOVA
Interaction
Two-way
ANOVA
Interaction
Interaction
Tuckey's
F (1, 47) = 9,191
Openfield in Scn1aRH/+ -129:B6

195
Mouse model
and genetic
background
Experi
mentM
easur
ment
Protocol
phaseGenotype
treatme
nt/proto
col
average S.E.M
#
values/sli
ces/cells
#
animal
s
Statistical
testSource of variation
F(DFn,DFd) / t
(dF) value/U/χ²/Hp value Comparision
post hoc
test
t(dF) value /
q(dF) valuep value Figure
WT - 4.621 2.049 8 8 WT control vs. Scn1aRH/+ control q(40)=2,893 0.1887
Scn1aRH/+ - 13.343 3.374 10 10 WT control vs. WT HYP q(40)=2,945 0.1764
WT HYP 13.031 2.347 13 13 Treatment F (1, 40) = 1,725 0.1965 Scn1aRH/+ control vs. Scn1a
RH/+ SIH q(40)=0,4277 0.9902
Scn1aRH/+ SIH 12.200 2.671 13 13 Genotype F (1, 40) = 2,035 0.1615 WT HYP vs. Scn1aRH/+ SIH q(40)=0,3332 0.9953
WT - 2.875 0.833 8 8 WT control vs. Scn1aRH/+ control q(40)=2,042 0.4802
Scn1aRH/+ - 7.100 1.616 10 10 WT control vs. WT HYP q(40)=5,181 0.0039
WT HYP 6.538 1.169 13 13 Treatment F (1, 40) = 8,361 0.0062 Scn1aRH/+ control vs. Scn1aRH/+ SIH q(40)=0,4486 0.9888
Scn1aRH/+ SIH 7.923 1.579 13 13 Genotype F (1, 40) = 0,05405 0.8174 WT HYP vs. Scn1aRH/+ SIH q(40)=2,985 0.1671
Interaction
Tuckey's
Tuckey's
36B
36A
An
xie
ty
Number of
entries in
the light
compartm
ent
Two-way
ANOVA
F (1, 40) = 6,042 0.0184
% Time in
the light
compartm
ent
An
xie
ty
Dark
-lig
ht
bo
x
Scn1aR
H/+
-129:B
6
Two-way
ANOVA
F (1, 40) = 2,982 0.0919Interaction
Dark-light in Scn1aRH/+ -129:B6
Mouse model
and genetic
background
Experi
ment
Measur
ment
Protocol
phaseGenotype
treatme
nt/proto
col
average S.E.M
#
values/sli
ces/cells
#
animal
s
Statistical
testSource of variation
F(DFn,DFd) / t
(dF) value/U/χ²/Hp value Comparision
post hoc
test
t(dF) value /
q(dF) valuep value Figure
WT - 11.378 2.046 5 5 D1:WT control vs. WT HYP q(162)=1,201 0.9519
Scn1aRH/+ - 16.495 4.277 8 8 D1:WT control vs. Scn1a
RH/+ control q(162)=1,636 0.8207
WT HYP 18.198 3.381 9 9 D1:WT HYP vs. Scn1aRH/+ SIH q(162)=7,625 < 0,0001
Scn1aRH/+ SIH 44.186 8.787 9 9 D1:Scn1aRH/+ control vs. Scn1aRH/+ SIH q(162)=7,376 < 0,0001
WT - 8.933 0.994 5 5 N1:WT control vs. WT HYP q(162)=1,306 0.9293
Scn1aRH/+ - 14.500 2.054 8 8 N1:WT control vs. Scn1aRH/+ control q(162)=2,182 0.5508
WT HYP 18.028 2.064 9 9 N1:WT HYP vs. Scn1aRH/+ SIH q(162)=4,996 0.0032
Scn1aRH/+ SIH 32.644 8.853 9 9 N1:Scn1aRH/+ control vs. Scn1aRH/+ SIH q(162)=4,148 0.0228
WT - 1.467 0.346 5 5 D2:WT control vs. WT HYP q(162)=0,2853 > 0,9999
Scn1aRH/+ - 2.682 0.583 8 8 D2:WT control vs. Scn1a
RH/+ control q(162)=0,4933 0.9996
WT HYP 3.523 0.749 9 9 D2:WT HYP vs. Scn1aRH/+ SIH q(162)=0,7185 0.9966
Scn1aRH/+ SIH 5.292 1.631 9 9 D2:Scn1aRH/+ control vs. Scn1aRH/+ SIH q(162)=0,502 0.9995
WT - 8.883 1.512 5 5 N2:WT control vs. WT HYP q(162)=0,8329 0.9924
Scn1aRH/+ - 12.432 1.509 8 8 N2:WT control vs. Scn1aRH/+ control q(162)=2,371 0.4525
WT HYP 18.769 3.980 9 9 N2:WT HYP vs. Scn1aRH/+ SIH q(162)=3,308 0.1172
Scn1aRH/+ SIH 24.444 4.954 9 9 N2:Scn1aRH/+ control vs. Scn1aRH/+ SIH q(162)=1,611 0.8308
WT - 1.583 0.433 5 5 D3:WT control vs. WT HYP 0.3032 > 0,9999
Scn1aRH/+ - 2.875 0.326 8 8 D3:WT control vs. Scn1a
RH/+ control 0.5897 0.9989
WT HYP 4.042 0.620 9 9 D3:WT HYP vs. Scn1aRH/+
SIH q(162)=0,02932 > 0,9999
Scn1aRH/+ SIH 2.981 0.552 9 9 D3:Scn1aRH/+ control vs. Scn1aRH/+ SIH q(162)=0,3009 > 0,9999
WT - 7.158 1.287 5 5 N3:WT control vs. WT HYP q(162)=1,083 0.9708
Scn1aRH/+ - 11.771 1.119 8 8 N3:WT control vs. Scn1aRH/+ control q(162)=1,339 0.9211
WT HYP 12.741 1.942 9 9 N3:WT HYP vs. Scn1aRH/+ SIH q(162)=1,813 0.741
Scn1aRH/+ SIH 18.356 2.967 9 9 N3:Scn1aRH/+ control vs. Scn1aRH/+ SIH q(162)=1,594 0.8376
ACTIMETER in Scn1aRH/+ -129:B6
37C
N2
D3
Scn1aR
H/+
-129:B
6
Vert
ical
acti
vit
y (
nu
mb
er
of
reari
ng
ep
iso
des)
12-h
ou
r fr
acti
on
of
tim
e
< 0,0001
Group (Treatment-genotype) 0.0022
0.0002Interaction F (15, 135) = 3,210
F (3, 27) = 6,318
F (5, 135) = 24,76
D1
N3
N1
D2
Tuckey's
Time
Acti
mete
r
RM-Two
Way
ANOVA
Tuckey's
Tuckey's
Tuckey's
Tuckey's
Tuckey's

196
Mouse model
and genetic
background
Experi
ment
Meas
urme
nt
Protocol
phaseGenotype
treatme
nt/proto
col
average S.E.M
#
values/sli
ces/cells
#
animal
s
Statistical
test
Source of
variation
F(DFn,DFd) / t
(dF) value/U/χ²/Hp value Comparision
post hoc
test
t(dF) value /
q(dF) valuep value Figure
WT - 20.718 1.470 13 13 Interaction F (1, 59) = 4,910 0.0306 WT control vs. WT HYP q(59)=0,5149 0.9833
Scn1aRH/+ - 26.629 1.373 16 16 Treatment F (1, 59) = 7,535 0.008 WT control vs. Scn1aRH/+ control q(59)=2,685 0.2398
WT HYP 21.909 1.530 17 17 WT HYP vs. Scn1aRH/+ SIH q(59)=7,555 < 0,0001
Scn1aRH/+ SIH 37.617 3.314 16 16 Scn1aRH/+ control vs. Scn1aRH/+ SIH q(59)=5,106 0.0034
WT - 0.035 0.002 13 13 Interaction F (1, 58) = 5,256 0.0255 WT control vs. WT HYP q(59)=0,5149 0.9833
Scn1aRH/+ - 0.044 0.002 16 16 Treatment F (1, 58) = 8,120 0.006 WT control vs. Scn1aRH/+ control q(59)=2,685 0.2398
WT HYP 0.036 0.003 17 17 WT HYP vs. Scn1aRH/+ SIH q(59)=7,555 < 0,0001
Scn1aRH/+ SIH 0.062 0.005 17 17 Scn1aRH/+ control vs. Scn1aRH/+ SIH q(59)=5,106 0.0034
C1:WT - 124.985 17.737 13 13
C:WT - 302.292 33.575 13 13
C2:WT - 169.739 21.850 13 13
C1: Scn1aRH/+ - 173.400 17.391 16 16
C: Scn1aRH/+ - 254.125 21.591 16 16
C2: Scn1aRH/+ - 168.594 11.535 16 16
C1:WT HYP 146.712 13.545 17 17
C:WT HYP 292.965 25.432 17 17
C2:WT HYP 152.106 15.605 17 17
C1: Scn1aRH/+ SIH 178.712 10.768 17 17
C: Scn1aRH/+ SIH 226.194 10.895 17 17
C2: Scn1aRH/+ SIH 188.824 9.170 17 17
EC:WT - 111.170 12.998 10 10
M:WT - 167.830 20.922 10 10
EC: Scn1aRH/+ - 96.100 9.994 15 15
M: Scn1aRH/+ - 144.840 12.114 15 15
EC:WT HYP 112.444 9.542 16 16
M:WT HYP 160.219 11.413 16 16
EC: Scn1aRH/+ SIH 147.471 18.404 14 14
M: Scn1aRH/+ SIH 146.186 12.129 14 14
WT - 0.038 0.002 10 10 Interaction F (1, 51) = 0,4221 0.5188 WT control vs. WT HYP q(51)=1,381 0.7633
Scn1aRH/+ - 0.045 0.003 15 15 Treatment F (1, 51) = 4,350 0.042 WT control vs. Scn1aRH/+ control q(51)=1,666 0.6431
WT HYP 0.043 0.002 16 16 WT HYP vs. Scn1aRH/+ SIH q(51)=2,854 0.1949
Scn1aRH/+ SIH 0.055 0.006 14 14 Scn1aRH/+ control vs. Scn1aRH/+ SIH q(51)=3,235 0.1143
fM:WT - 80.500 9.741 10 10
nM:WT - 117.360 9.051 10 10
fM: Scn1aRH/+ - 68.007 6.451 15 15
nM: Scn1aRH/+ - 103.000 7.704 15 15
fM:WT HYP 68.325 5.244 16 16
nM:WT HYP 100.725 6.523 16 16
fM: Scn1aRH/+ SIH 101.679 12.268 14 14
nM: Scn1aRH/+ SIH 102.336 11.979 14 14
WT - 0.050 0.008 10 10 Interaction F (1, 51) = 6,241 0.0157 WT control vs. WT HYP q(51)=2,689 0.2402
Scn1aRH/+ - 0.041 0.003 15 15 Treatment F (1, 51) = 0,08887 0.7668 WT control vs. Scn1aRH/+ control q(51)=1,994 0.4993
WT HYP 0.039 0.002 16 16 WT HYP vs. Scn1aRH/+ SIH q(51)=2,295 0.3751
Scn1aRH/+ SIH 0.050 0.003 14 14 Scn1aRH/+ control vs. Scn1aRH/+ SIH q(51)=3,069 0.1454
38D
38C
38B
38A
not shown
38E
not shown
Dis
tan
ce t
ravell
ed
(m
)A
vera
ge s
peed
(m
/s)
Tim
e i
n t
he c
ham
ber
(s)
Inte
racti
on
tim
e (
s)
Inte
racti
on
tim
e (
s)
Two-way
ANOVA
RM- Two
way
ANOVA
RM- Two
way
ANOVA
RM- Two
way
ANOVA
F (6, 177) = 3,213Interaction
0.9994F (3, 177) =
0,005712
Group
(Treatment-
genotype)
< 0,0001F (2, 177) = 46,72Chamber
F (3, 102) = 2,157 0.0977
Two-way
ANOVA
t(177)=0,4147
0.2957
0.9965
0.9947
0.9669
0.0051
WT HYP: C1 vs. C2
Scn1aRH/+ control : C1 vs. C2
WT control: C1 vs. C2 t(177)=1,605
t(177)=0,1912
t(177)=0,2212
Sidak's
Tuckey's
Tuckey's
< 0,0001F (1, 59) = 25,12Genotype
< 0,0001F (1, 58) = 25,59Genotype
Scn1aRH/+ SIH: C1 vs. C2
0.0457
0.0314
0.0286
0.1277F (3, 102) = 1,941
0.0001F (1, 102) = 15,79
0.2277F (3, 102) = 1,468
Scn1aRH/+ control : EC vs. M
WT HYP: EC vs. M
Scn1aRH/+ SIH: EC vs. M
Sidak's
t(102)=2,570
t(102)=2,707
t(102)=2,741
t(102)=0,069
Scn1aRH/+ SIH: fM vs. nM t(102)=0,05357 > 0,9999
Group
(Treatment-
genotype) > 0,9999
Sidak's
t(102)=2,540 0.0495
Scn1aRH/+ control : fM vs. nM t(102)=2,953 0.0155
WT HYP: fM vs. nM t(102)=2,824 0.0226
Interaction F (3, 102) = 1,905 0.1335
WT control: fM vs. nM
Cage F (1, 102) = 17,38 < 0,0001
Group
(Treatment-
genotype)
Avera
ge s
peed
(m
/s)
Two-way
ANOVATuckey's
Genotype F (1, 51) = 0,1591 0.6916
Avera
ge s
peed
(m
/s)
Two-way
ANOVATuckey's
Genotype F (1, 51) = 5,782 0.0199
Cage
Interaction
WT control: EC vs. M
Th
ree c
ham
ber
so
cia
l in
tera
cti
o t
est
Scn
1aR
H/+
-129:B
6
Habituati
on phase
Habituati
on phase
Habituati
on phase
Sociabilit
y phase
Sociabilit
y phase
Social
Novelty
phase
Three-chamber social interaction test in Scn1aRH/+ -129:B6
Social
Novelty
phase

197
Mouse model
and genetic
background
Experi
ment
Measur
ment
Protocol
phaseGenotype
treatme
nt/proto
col
average S.E.M
#
values/sli
ces/cells
#
animal
s
Statistical
testSource of variation
F(DFn,DFd) / t
(dF) value/U/χ²/Hp value Comparision
post hoc
test
t(dF) value /
q(dF) valuep value Figure
D1 17.554 2.501 76 19
D2 5.293 0.683 76 19
D1 16.296 2.391 92 23
D2 6.296 0.910 92 23
D1 17.810 2.353 88 22
D2 3.463 0.332 88 22
D1 29.068 3.569 84 21
D2 9.340 1.617 84 21
WT - 17.554 2.501 76 19 Cue task 1: WT control vs. WT HYP q(672)=0,6033 0.9739
Scn1aRH/+ - 17.810 2.353 88 22Cue task 1:WT control vs. Scn1aRH/+
controlq(672)=0,08600 > 0,9999
WT HYP 16.296 2.391 92 23 Cue task 1: WT HYP vs. Scn1aRH/+ SIH q(672)=6,290 < 0,0001
Scn1aRH/+ SIH 29.068 3.569 84 21Cue task 1: Scn1aRH/+ control vs.
Scn1aRH/+ SIHq(672)=5,485 0.0007
WT - 5.293 0.683 76 19 Cue task 2: WT control vs. WT HYP q(672)=0,4805 0.9865
Scn1aRH/+ - 3.463 0.332 88 22Cue task 2:WT control vs. Scn1aRH/+
controlq(672)=0,6144 0.6144
WT HYP 6.296 0.910 92 23 Cue task 2: WT HYP vs. Scn1aRH/+ SIH q(672)=1,499 0.7138
Scn1aRH/+ SIH 9.340 1.617 84 21Cue task 2: Scn1aRH/+ control vs.
Scn1aRH/+ SIHq(672)=2,864 0.1798
WT - 0.128 0.006 76 19 Interaction F (3, 336) = 0,5145 0.6726 Cue task 1: WT control vs. WT HYP q(672)=0,8557 0.9305
Scn1aRH/+ - 0.132 0.006 88 22 Cue task Day F (1, 336) = 5,212 0.0231Cue task 1:WT control vs. Scn1aRH/+
controlq(672)=0,5562 0.1121
WT HYP 0.134 0.006 92 23 Cue task 1: WT HYP vs. Scn1aRH/+ SIH q(672)=4,211 0.0159
Scn1aRH/+ SIH 0.104 0.006 84 21Cue task 1: Scn1aRH/+ control vs.
Scn1aRH/+ SIHq(672)=3,867 0.0324
WT - 0.146 0.009 76 19 Interaction F (3, 336) = 0,5145 0.6726 Cue task 2: WT control vs. WT HYP q(672)=1,016 0.8897
Scn1aRH/+ - 0.138 0.008 88 22 Cue task Day F (1, 336) = 5,212 0.0231Cue task 2:WT control vs. Scn1aRH/+
controlq(672)=1,068 0.8745
WT HYP 0.138 0.009 92 23 Cue task 2: WT HYP vs. Scn1aRH/+ SIH q(672)=2,460 0.3039
Scn1aRH/+ SIH 0.121 0.007 84 21Cue task 2: Scn1aRH/+ control vs.
Scn1aRH/+ SIHq(672)=2,370 0.3371
WT - 2.970763 0.4965251 76 19 Interaction F (3, 332) = 0,7880 0.5013 Cue task 1: WT control vs. WT HYP q(664)=0,7936 0.9435
Scn1aRH/+ - 2.653614 0.3747214 88 22 Cue task Day F (1, 332) = 57,91 < 0,0001Cue task 1:WT control vs. Scn1aRH/+
controlq(664)=0,7803 0.9461
WT HYP 2.644679 0.4470432 84 23 Cue task 1: WT HYP vs. Scn1aRH/+ SIH q(664)=4,279 0.0137
Scn1aRH/+ SIH 4.338921 0.6543971 88 21Cue task 1: Scn1aRH/+ control vs.
Scn1aRH/+ SIHq(664)=4,307 0.0129
WT - 1.223474 0.2069968 76 19 Interaction F (3, 332) = 0,7880 0.5013 Cue task 2: WT control vs. WT HYP q(664)=0,3639 0.994
Scn1aRH/+ - 0.5581932 0.075622 88 22 Cue task Day F (1, 332) = 57,91 < 0,0001Cue task 2:WT control vs. Scn1aRH/+
controlq(664)=1,637 0.654
WT HYP 1.073941 0.2038943 84 23 Cue task 2: WT HYP vs. Scn1aRH/+ SIH q(664)=1,62 0.6616
Scn1aRH/+ SIH 1.715159 0.3986418 88 21Cue task 2: Scn1aRH/+ control vs.
Scn1aRH/+ SIHq(664)=2,957 0.1571
D1 32.04473 3.67175 76 19 WT: Training 1 vs. Training 2 q(1008)=9,827 < 0,0001
D2 8.242105 0.8416948 76 19 WT: Training 1 vs. Training 3 q(1008)=10,24 < 0,0001
WT: Training 1 vs. Training 4 q(1008)=9,948 < 0,0001
WT: Training 2 vs. Training 3 q(1008)=0,4107 0.9915
WT: Training 2 vs. Training 4 q(1008)=0,1211 0.9998
WT: Training 3 vs. Training 4 q(1008)=0,2896 0.997
D1 32.22717 3.422416 92 23 WT HYP: Training 1 vs. Training 2 q(1008)=9,399 < 0,0001
D2 11.53696 1.807323 92 23 WT HYP: Training 1 vs. Training 3 q(1008)=10,77 < 0,0001
WT HYP: Training 1 vs. Training 4 q(1008)=11,46 < 0,0001
WT HYP: Training 2 vs. Training 3 q(1008)=1,374 0.7658
WT HYP: Training 2 vs. Training 4 q(1008)=2,061 0.4637
WT HYP: Training 3 vs. Training 4 q(1008)=0,6878 0.9621
D1 29.22955 3.296376 88 22Scn1aRH/+ control: Training 1 vs.
Training 2q(1008)=7,948 < 0,0001
D2 11.33977 1.36383 88 22Scn1aRH/+control: Training 1 vs.
Training 3q(1008)=9,127 < 0,0001
Scn1aRH/+ control: Training 1 vs.
Training 4q(1008)=10,2 < 0,0001
Scn1aRH/+ control: Training 2 vs.
Training 3q(1008)=1,179 0.8383
Scn1aRH/+ control: Training 2 vs.
Training 4q(1008)=2,254 0.3827
Scn1aRH/+ control: Training 3 vs.
Training 4q(1008)=1,074 0.8725
D1 57.88572 3.629017 84 21 Scn1aRH/+ SIH: Training 1 vs. Training 2 q(1008)=12,54 < 0,0001
D2 28.98571 3.359673 84 21 Scn1aRH/+ SIH: Training 1 vs. Training 3 q(1008)=13,56 < 0,0001
Scn1aRH/+ SIH: Training 1 vs. Training 4 q(1008)=14,02 < 0,0001
Scn1aRH/+ SIH: Training 2 vs. Training 3 q(1008)=1,014 0.8903
Scn1aRH/+ SIH: Training 2 vs. Training 4 q(1008)=1,472 0.7256
Scn1aRH/+ SIH: Training 3 vs. Training 4 q(1008)=0,4573 0.9883
WT -67.88421 6.222804 19 19
Interaction F (9, 246) = 1,007 P = 0,4351 Trial 1: WT control vs. WT HYP q(328)=1,16 0.845
Scn1aRH/+ -64 6.950537 22 22
Trial F (3, 246) = 58,27 P < 0,0001Trial 1: WT control vs. Scn1aRH/+
controlq(328)=0,6534 0.9672
WT HYP61.06087 6.284087 23 23
Trial 1: WT HYP vs. Scn1aRH/+ SIH q(328)=3,356 0.0844
Scn1aRH/+ SIH80.05454 4.602327 22 22
Trial 1: Scn1aRH/+ control vs. Scn1aRH/+
SIHq(328)=2,805 0.1962
t1-D167.88421 6.222804 19 19
t2-D127.94737 7.072909 19 19
t1-D164 6.950537 22 22
t2-D124.32727 5.898617 22 22
t1-D161.06087 6.284087 23 23
t2-D132.18696 7.241072 23 23
t1-D180.05454 4.602327 22 22
t2-D155.62727 7.725384 22 22
WT - 32.04473 3.67175 76 19 Training 1: WT control vs. WT HYP q(1344)=0,07479 > 0,9999
Scn1aRH/+ - 32.22717 3.422416 92 23Training 1: WT control vs. Scn1aRH/+
controlq(1344)=1,142 0.8508
WT HYP 29.22955 3.296376 88 22 Training 1: WT HYP vs. Scn1aRH/+ SIH q(1344)=10,8 < 0,0001
Scn1aRH/+ SIH 57.88572 3.629017 84 21 Training 1: Scn1aRH/+ control vs.
Scn1aRH/+ SIHq(1344)=11,94 < 0,0001
WT - 8.242105 0.8416948 76 19 Training 2: WT control vs. WT HYP q(1344)=1,351 0.775
Scn1aRH/+ - 11.53696 1.807323 92 23Training 2: WT control vs. Scn1aRH/+
controlq(1344)=1,257 0.8107
WT HYP 11.33977 1.36383 88 22 Training 2: WT HYP vs. Scn1aRH/+ SIH q(1344)=7,347 < 0,0001
Scn1aRH/+ SIH 28.98571 3.359673 84 21Training 2: Scn1aRH/+ control vs.
Scn1aRH/+ SIHq(1344)=7,351 < 0,0001
WT - 7.247368 1.002153 76 19 Training 3: WT control vs. WT HYP q(1344)=0,5188 0.9831
Scn1aRH/+ - 8.513043 1.087739 92 23Training 3:WT control vs. Scn1aRH/+
controlq(1344)=0,5834 0.9763
WT HYP 8.685227 1.229834 88 22 Training 3:WT HYP vs. Scn1aRH/+ SIH q(1344)=7,636 < 0,0001
Scn1aRH/+ SIH 26.64881 3.134997 84 21Training 3: Scn1aRH/+ control vs.
Scn1aRH/+ SIHq(1344)=7,483 < 0,0001
WT - 7.948684 1.358431 76 19 Training 4: WT control vs. WT HYP q(1344)=0,3893 0.9927
Scn1aRH/+ - 6.998913 1.016919 92 23Training 4: WT control vs. Scn1aRH/+
controlq(1344)=0,6824 0.963
WT HYP 6.267045 0.7822427 88 22 Training 4: WT HYP vs. Scn1aRH/+ SIH q(1344)=7,83 < 0,0001
Scn1aRH/+ SIH 25.59524 3.211734 84 21Training 4: Scn1aRH/+ control vs.
Scn1aRH/+ SIHq(1344)=8,051 < 0,0001
WT - 0.1731 0.0064 76 19 Training 1: WT control vs. WT HYP q(1296)=1,406 0.7528
Scn1aRH/+ - 0.1573 0.0058 88 22Training 1: WT control vs. Scn1a
RH/+
controlq(1296)=2,347 0.3455
WT HYP 0.1634 0.0069 80 20 Training 1: WT HYP vs. Scn1aRH/+ SIH q(1296)=4,189 0.0164
Scn1aRH/+ SIH 0.1915 0.0056 84 21 Training 1: Scn1aRH/+ control vs.
Scn1aRH/+ SIHq(1296)=5,224 0.0013
WT - 0.1398 0.0066 76 19 Training 2: WT control vs. WT HYP q(1296)=0,6093 0.9732
Scn1aRH/+ - 0.1388 0.0061 88 22Training 2: WT control vs. Scn1aRH/+
controlq(1296)=0,1489 0.9996
WT HYP 0.1440 0.0078 80 20 Training 2: WT HYP vs. Scn1aRH/+ SIH q(1296)=3,484 0.0662
Scn1aRH/+ SIH 0.1673 0.0063 84 21Training 2: Scn1aRH/+ control vs.
Scn1aRH/+ SIHq(1296)=4,361 0.0112
WT - 0.1197 0.0073 76 19 Training 3: WT control vs. WT HYP q(1296)=4,268 0.0138
Scn1aRH/+ - 0.1390 0.0067 88 22Training 3:WT control vs. Scn1aRH/+
controlq(1296)=2,881 0.175
WT HYP 0.1490 0.0079 80 20 Training 3:WT HYP vs. Scn1aRH/+ SIH q(1296)=3,127 0.1207
Scn1aRH/+ SIH 0.1699 0.0062 84 21Training 3: Scn1aRH/+ control vs.
Scn1aRH/+ SIHq(1296)=4,727 0.0047
WT - 0.1255 0.0065 76 19 Training 4: WT control vs. WT HYP q(1296)=2,341 0.3479
Scn1aRH/+ - 0.1299 0.0073 88 22Training 4: WT control vs. Scn1aRH/+
controlq(1296)=0,6571 0.9667
WT HYP 0.1416 0.0076 80 20 Training 4: WT HYP vs. Scn1aRH/+ SIH q(1296)=4,775 0.0042
Scn1aRH/+ SIH 0.1735 0.0057 84 21Training 4: Scn1aRH/+ control vs.
Scn1aRH/+ SIHq(1296)=6,674 < 0,0001
WT - 6.460737 0.7937213 76 19 Training 1: WT control vs. WT HYP q(1296)=0,4226 0.9907
Scn1aRH/+ - 5.556216 0.6823414 88 22Training 1: WT control vs. Scn1aRH/+
controlq(1296)=1,65 0.6481
WT HYP 6.23138 0.6989641 80 20 Training 1: WT HYP vs. Scn1aRH/+ SIH q(1296)=10,46 < 0,0001
Scn1aRH/+ SIH 11.68935 0.8374145 84 21 Training 1: Scn1aRH/+ control vs.
Scn1aRH/+ SIHq(1296)=11,62 < 0,0001
WT - 1.315329 0.1638174 76 19 Training 2: WT control vs. WT HYP q(1296)=1,384 0.7616
Scn1aRH/+ - 1.921886 0.2769157 88 22Training 2: WT control vs. Scn1aRH/+
controlq(1296)=1,106 0.8625
WT HYP 2.066435 0.364425 80 20 Training 2: WT HYP vs. Scn1aRH/+ SIH q(1296)=7,731 < 0,0001
Scn1aRH/+ SIH 6.10242 0.7526377 84 21Training 2: Scn1aRH/+ control vs.
Scn1aRH/+ SIHq(1296)=7,921 < 0,0001
WT - 1.139329 0.2044359 76 19 Training 3: WT control vs. WT HYP q(1296)=0,8549 0.9307
Scn1aRH/+ - 1.435739 0.2222679 88 22Training 3:WT control vs. Scn1aRH/+
controlq(1296)=0,5407 0.981
WT HYP 1.603261 0.2461549 80 20 Training 3:WT HYP vs. Scn1aRH/+ SIH q(1296)=8,188 < 0,0001
Scn1aRH/+ SIH 5.877432 0.7365466 84 21Training 3: Scn1aRH/+ control vs.
Scn1aRH/+ SIHq(1296)=8,416 < 0,0001
WT - 1.295526 0.2833215 76 19 Training 4: WT control vs. WT HYP q(1296)=0,1389 0.9997
Scn1aRH/+ - 1.025261 0.1717624 88 22Training 4: WT control vs. Scn1aRH/+
controlq(1296)=0,493 0.9855
WT HYP 1.22013 0.2120321 80 20 Training 4: WT HYP vs. Scn1aRH/+ SIH q(1296)=7,513 < 0,0001
Scn1aRH/+ SIH 5.142352 0.7405574 84 21Training 4: Scn1aRH/+ control vs.
Scn1aRH/+ SIHq(1296)=7,801 < 0,0001
WT: LEFT 17.11351 1.590523 19 19 WT: LEFT vs. TARGET q(243)=14,33 < 0,0001
WT: TARGET 56.76281 3.567275 19 19 WT: TARGET vs. RIGHT q(243)=14,91 < 0,0001
WT: RIGHT 15.52632 2.157894 19 19
WT: OPPOSITE 10.5 2.111683 19 19
WT: LEFT 24.55077 2.435804 23 23 WT HYP: LEFT vs. TARGET q(243)=10,46 < 0,0001
WT: TARGET 50.85536 2.845297 23 23 WT HYP: TARGET vs. RIGHT q(243)=14,58 < 0,0001
WT: RIGHT 14.20072 1.664953 23 23
WT: OPPOSITE 10.05507 1.590904 23 23
Scn1aRH/+: LEFT 19.53106 1.379024 22 22 Scn1aRH/+: LEFT vs. TARGET q(243)=13,82 < 0,0001
Scn1aRH/+:
TARGET55.06091 3.040268 22 22 Scn1aRH/+: TARGET vs. RIGHT q(243)=15,49 < 0,0001
Scn1aRH/+:
RIGHT15.24242 2.271501 22 22
Scn1aRH/+:
OPPOSITE10.03061 1.408996 22 22
Scn1aRH/+: LEFT 26.3889 2.395459 21 21 Scn1aRH/+ SIH: LEFT vs. TARGET q(243)=3,55 0.0608
Scn1aRH/+:
TARGET35.73079 2.968656 21 21 Scn1aRH/+ SIH: TARGET vs. RIGHT q(243)=6,508 < 0,0001
Scn1aRH/+:
RIGHT18.60619 1.648541 21 21
Scn1aRH/+:
OPPOSITE19.00603 1.901427 21 21
WT: TARGET - 56.76281 3.567275 19 19 Interaction F (9, 243) = 6,353 < 0,0001 Target: WT control vs. WT HYP q(324)=2,58 0.3488
Scn1aRH/+:
TARGET- 50.85536 2.845297 23 23 Quadrant F (3, 243) = 166,1 < 0,0001
Target: WT control vs. Scn1aRH/+
controlq(324)=0,7359 0.9961
WT: TARGET HYP 55.06091 3.040268 22 22 Target: WT HYP vs. Scn1aRH/+ SIH q(324)=6,786 < 0,0001
Scn1aRH/+:
TARGETSIH 35.73079 2.968656 21 21
Target: Scn1aRH/+ control vs. Scn1aRH/+
SIHq(324)=8,58 < 0,0001
WT - 56.76281 3.567275 19 19 -
Chance level 25.000 -
WT HYP 55.06091 3.040268 22 22 -
Chance level 25.000 -
Scn1aRH/+ - 50.85536 2.845297 23 23 -
Chance level 25.000 -
Scn1aRH/+ SIH 35.73079 2.968656 21 21 -
Chance level 25.000 -
WT - 13.737 0.908 19 19 Interaction F (1, 81) = 8,504 0.0046 WT control vs. WT HYP q(81)=2,722 0.2259
Scn1aRH/+ - 13.182 0.755 22 22 Treatment F (1, 81) = 32,03 < 0,0001 WT control vs. Scn1aRH/+ control q(81)=0,626 0.9709
WT HYP 11.348 1.055 23 23 WT HYP vs. Scn1aRH/+ SIH q(81)=6,593 < 0,0001
Scn1aRH/+ SIH 5.714 0.673 21 21 Scn1aRH/+ control vs. Scn1aRH/+ SIH q(81)=8,646 < 0,0001
39A
Morris Water Mazein Scn1aRH/+ -129:B6
39A
39D
39C
39C
39C
Table 13
Table 12
39A
39B
39A
Table 12
Table 13
Cue task Day
0.0814F (3, 336) = 2,259Interaction
Late
ncy t
o f
ind
th
e h
idd
en
pla
tfo
rm (
s)
- S
pati
al
learn
ing
HYPWT
D1
Two-Way
RM ANOVA
Interaction F (9, 972) = 1,543 0.1281
D3
D2
Late
ncy t
o f
ind
th
e h
idd
en
pla
tfo
rm -
SP
AT
IAL
LE
AR
NIN
G
Mo
rris
Wate
r M
aze
D4
Mo
rris
Wate
r M
aze
Avearg
e s
peed
(m
/s)
CU
ET
AS
KL
ate
ncy t
o f
ind
th
e c
ued
pla
tfo
rm (
s)
- C
UE
TA
SK
Mo
rris
Wate
r M
aze
Training Day
q(243)=6,356
D4 6.267045 0.7822427 88
Mo
rris
Wate
r M
aze
Avearg
e s
peed
(m
/s)
Mo
rris
Wate
r M
aze
Pre
sen
ce i
n q
uad
ran
t (%
)
Probe test
RM-Two
Way
ANOVA
Tuckey's
Training Day F (3, 1008) = 117,0 < 0,0001
Group (Treatment-genotype) F (3, 336) = 55,50
0.15F (3, 81) = 1,820
Mo
rris
Wate
r M
aze
D3 3.134997 84 21
D4 25.59524
F (9, 1008) = 1,063
Tuckey's
D1
< 0,0001
Scn1aRH/+: TARGET vs. OPPOSITE q(243)=17,52 < 0,0001
Scn1aRH/+SIH : TARGET vs.
OPPOSITE
0.0001
0.3877
< 0,0001
Two-Way
RM ANOVA
23
Tuckey's
Two-Way
RM ANOVA
Group (Treatment-genotype)
Scn1aRH/+
F (3, 336) = 7,057
< 0,0001F (1, 336) = 101,8
F (3, 336) = 55,50
8.513043 1.087739 92
3.211734 84 21
22
Scn1aRH/+
19761.0021537.247368
Tuckey's26.64881
D2
Tuckey's
SIH
- Tuckey's
Tuckey's
921.0169196.998913
Training Day
Interaction
8.685227
D3
Group (Treatment-genotype) F (3, 340) = 54,81 < 0,0001
D4
Two-Way
RM ANOVA
Interaction F (9, 1008) = 1,063 0.3877
D1
Tuckey's
Group (Treatment-genotype) F (3, 332) = 4,410 0.0047
Group (Treatment-genotype)
< 0,0001F (3, 1008) = 117,0
Tuckey's
P < 0,0001F (3, 82) = 15,95Seizures
Two-Way
RM ANOVA
WT D3
D4
D3 1.229834 88
D1
Tuckey's
Tuckey's
D2
F (3, 972) = 17,11 < 0,0001
D3
Group (Treatment-genotype) F (3, 324) = 20,77
Tuckey's
Tuckey's
22
23D4
-
D2Two-Way
RM ANOVATuckey's
Group (Treatment-genotype) F (3, 336) = 4,919 0.0023
Mo
rris
Wate
r M
aze
Dis
tan
ce t
ravell
ed
(m
) -C
UE
TA
SK
Seizures F (3, 332) = 4,410 0.0047
Two-Way
RM ANOVA
Pre
sen
ce i
n q
uad
ran
t (%
)
Probe test
D1
Tuckey's
Tuckey's
Tuckey's
Tuckey's
Two-Way
RM ANOVATuckey's
D2
< 0,0001q(243)=16,23WT HYP: TARGET vs. OPPOSITE
< 0,0001q(243)=16,72WT: TARGET vs. OPPOSITE
< 0,0001F (9, 243) = 6,353
Sidak's
Sidak's
Sidak's
Sidak's
Mo
rris
Wate
r M
aze
Late
ncy t
o f
ind
th
e h
idd
en
pla
tfo
rm (
s)
t1-D1 Tuckey's
-
Quadrant
Interaction
Group (Treatment-genotype)
Tuckey's
Tuckey's
Mo
rris
Wate
r M
aze
0.15F (3, 81) = 1,820
< 0,0001F (3, 243) = 166,1
Probe test
Mo
rris
Wate
r M
aze
Targ
et
qu
ad
ran
t:D
iffe
ren
ce t
o c
han
ce l
evel
One
sample t-
test
-
HYP
-
SIH
RM-Two
Way
ANOVA
Mo
rris
Wate
r M
aze
< 0,0001t(22)=9,087
< 0,0001t(18)=8,904 - -
- -
Dis
tan
ce t
ravell
ed
(m
)
D1
-
- -
-
t(21)=9,888 < 0,0001 -
Probe testTwo-Way
ANOVA
Genotype 0.0006
Nu
mb
er
of
pla
tfo
rm c
rosses
Two-Way
RM ANOVA
Interaction F (9, 1020) = 0,8253 0.5928
D2
Training Day F (3, 1020) = 99,83 < 0,0001
< 0,0001
D4
Sidak's
Tuckey's
D3
19761.3584317.948684
Two-Way
RM ANOVA
< 0,0001
Tuckey's
Scn
1aR
H/+
-129:B
6
Mo
rris
Wate
r M
aze
0.0814F (3, 336) = 2,259Interaction
Cue task Day
Group (Treatment-genotype)
Two-Way
RM ANOVA
Mo
rris
Wate
r M
aze
-
HYP
-
SIHScn1aRH/+
Scn1aRH/+
WT
WT
Late
ncy t
o f
ind
th
e c
ued
pla
tfo
rm (
s)
- C
UE
TA
SK
0.0001F (3, 336) = 7,057
< 0,0001F (1, 336) = 101,8
-
Group (Treatment-genotype)
Seizures F (3, 336) = 4,919 0.0023
t(20)=3,615 0.0017 - - -
- -
F (1, 81) = 12,63
Tuckey's
Scn1aRH/+ SIH: Cue task 1 vs. Cue
task 2Sidak's t(336)=7,042 < 0,0001
< 0,0001t(336)=5,242Sidak'sScn1aRH/+ control : Cue task 1 vs. Cue
task 2
t(336)=4,163 0.0002
0.0009t(336)=3,736Sidak'sWT HYP: Cue task 1 vs. Cue task 2
WT control : Cue task 1 vs. Cue task 2
q(246)=7,257
q(246)=6,789
0.0096
0.001
< 0,0001
< 0,0001
Late
ncy t
o f
ind
th
e h
idd
en
pla
tfo
rm (
s)
Mo
rris
Wate
r M
aze
SIHScn1aRH/+
HYPWT
-Scn1aRH/+
-WT
39BTwo-Way
RM ANOVA
Group (Treatment-genotype)
Trial
Interaction
P < 0,0001F (3, 82) = 15,95
P < 0,0001F (3, 246) = 58,27
P = 0,4351F (9, 246) = 1,007
WT control: Trial1 vs.Trial 2
Scn1aRH/+ control : Trial1 vs.Trial 2
WT HYP : Trial1 vs.Trial 2
Scn1aRH/+ SIH: Trial1 vs.Trial 2
Tuckey's
q(246)=4,468
q(246)=5,400
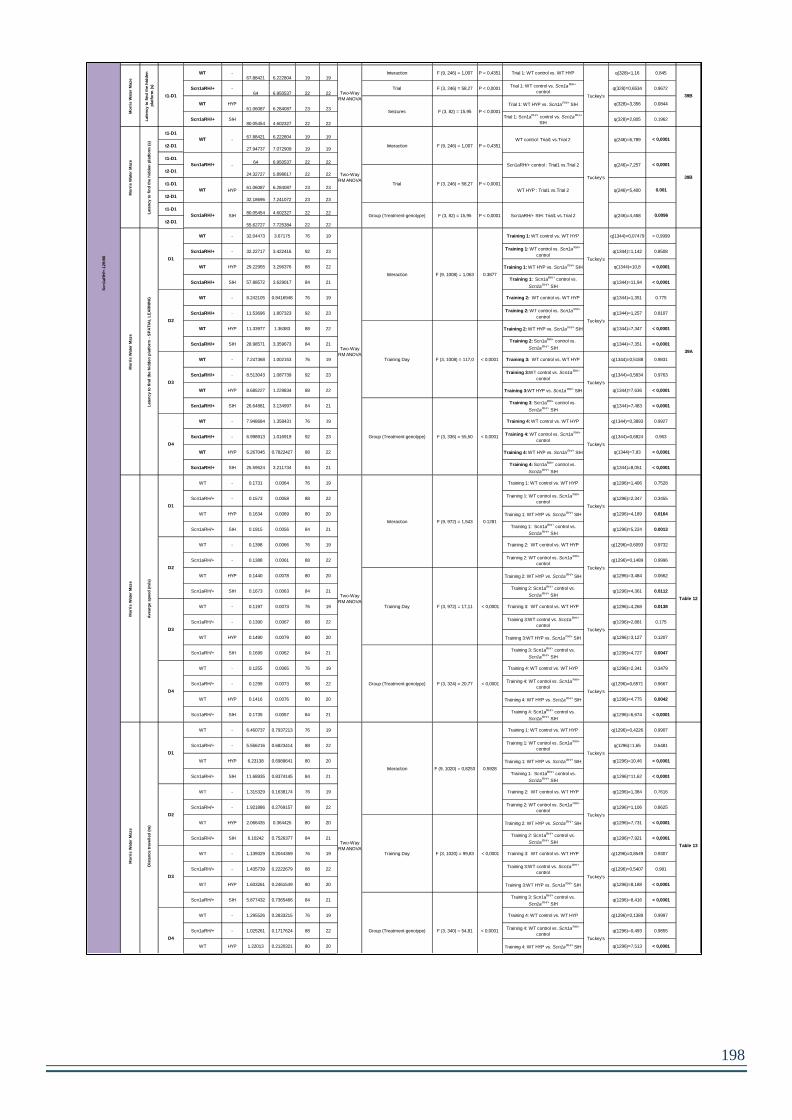
198
Mouse model
and genetic
background
Experi
ment
Measur
ment
Protocol
phaseGenotype
treatme
nt/proto
col
average S.E.M
#
values/sli
ces/cells
#
animal
s
Statistical
testSource of variation
F(DFn,DFd) / t
(dF) value/U/χ²/Hp value Comparision
post hoc
test
t(dF) value /
q(dF) valuep value Figure
D1 17.554 2.501 76 19
D2 5.293 0.683 76 19
D1 16.296 2.391 92 23
D2 6.296 0.910 92 23
D1 17.810 2.353 88 22
D2 3.463 0.332 88 22
D1 29.068 3.569 84 21
D2 9.340 1.617 84 21
WT - 17.554 2.501 76 19 Cue task 1: WT control vs. WT HYP q(672)=0,6033 0.9739
Scn1aRH/+ - 17.810 2.353 88 22Cue task 1:WT control vs. Scn1aRH/+
controlq(672)=0,08600 > 0,9999
WT HYP 16.296 2.391 92 23 Cue task 1: WT HYP vs. Scn1aRH/+ SIH q(672)=6,290 < 0,0001
Scn1aRH/+ SIH 29.068 3.569 84 21Cue task 1: Scn1aRH/+ control vs.
Scn1aRH/+ SIHq(672)=5,485 0.0007
WT - 5.293 0.683 76 19 Cue task 2: WT control vs. WT HYP q(672)=0,4805 0.9865
Scn1aRH/+ - 3.463 0.332 88 22Cue task 2:WT control vs. Scn1aRH/+
controlq(672)=0,6144 0.6144
WT HYP 6.296 0.910 92 23 Cue task 2: WT HYP vs. Scn1aRH/+ SIH q(672)=1,499 0.7138
Scn1aRH/+ SIH 9.340 1.617 84 21Cue task 2: Scn1aRH/+ control vs.
Scn1aRH/+ SIHq(672)=2,864 0.1798
WT - 0.128 0.006 76 19 Interaction F (3, 336) = 0,5145 0.6726 Cue task 1: WT control vs. WT HYP q(672)=0,8557 0.9305
Scn1aRH/+ - 0.132 0.006 88 22 Cue task Day F (1, 336) = 5,212 0.0231Cue task 1:WT control vs. Scn1aRH/+
controlq(672)=0,5562 0.1121
WT HYP 0.134 0.006 92 23 Cue task 1: WT HYP vs. Scn1aRH/+ SIH q(672)=4,211 0.0159
Scn1aRH/+ SIH 0.104 0.006 84 21Cue task 1: Scn1aRH/+ control vs.
Scn1aRH/+ SIHq(672)=3,867 0.0324
WT - 0.146 0.009 76 19 Interaction F (3, 336) = 0,5145 0.6726 Cue task 2: WT control vs. WT HYP q(672)=1,016 0.8897
Scn1aRH/+ - 0.138 0.008 88 22 Cue task Day F (1, 336) = 5,212 0.0231Cue task 2:WT control vs. Scn1aRH/+
controlq(672)=1,068 0.8745
WT HYP 0.138 0.009 92 23 Cue task 2: WT HYP vs. Scn1aRH/+ SIH q(672)=2,460 0.3039
Scn1aRH/+ SIH 0.121 0.007 84 21Cue task 2: Scn1aRH/+ control vs.
Scn1aRH/+ SIHq(672)=2,370 0.3371
WT - 2.970763 0.4965251 76 19 Interaction F (3, 332) = 0,7880 0.5013 Cue task 1: WT control vs. WT HYP q(664)=0,7936 0.9435
Scn1aRH/+ - 2.653614 0.3747214 88 22 Cue task Day F (1, 332) = 57,91 < 0,0001Cue task 1:WT control vs. Scn1aRH/+
controlq(664)=0,7803 0.9461
WT HYP 2.644679 0.4470432 84 23 Cue task 1: WT HYP vs. Scn1aRH/+ SIH q(664)=4,279 0.0137
Scn1aRH/+ SIH 4.338921 0.6543971 88 21Cue task 1: Scn1aRH/+ control vs.
Scn1aRH/+ SIHq(664)=4,307 0.0129
WT - 1.223474 0.2069968 76 19 Interaction F (3, 332) = 0,7880 0.5013 Cue task 2: WT control vs. WT HYP q(664)=0,3639 0.994
Scn1aRH/+ - 0.5581932 0.075622 88 22 Cue task Day F (1, 332) = 57,91 < 0,0001Cue task 2:WT control vs. Scn1aRH/+
controlq(664)=1,637 0.654
WT HYP 1.073941 0.2038943 84 23 Cue task 2: WT HYP vs. Scn1aRH/+ SIH q(664)=1,62 0.6616
Scn1aRH/+ SIH 1.715159 0.3986418 88 21Cue task 2: Scn1aRH/+ control vs.
Scn1aRH/+ SIHq(664)=2,957 0.1571
D1 32.04473 3.67175 76 19 WT: Training 1 vs. Training 2 q(1008)=9,827 < 0,0001
D2 8.242105 0.8416948 76 19 WT: Training 1 vs. Training 3 q(1008)=10,24 < 0,0001
WT: Training 1 vs. Training 4 q(1008)=9,948 < 0,0001
WT: Training 2 vs. Training 3 q(1008)=0,4107 0.9915
WT: Training 2 vs. Training 4 q(1008)=0,1211 0.9998
WT: Training 3 vs. Training 4 q(1008)=0,2896 0.997
D1 32.22717 3.422416 92 23 WT HYP: Training 1 vs. Training 2 q(1008)=9,399 < 0,0001
D2 11.53696 1.807323 92 23 WT HYP: Training 1 vs. Training 3 q(1008)=10,77 < 0,0001
WT HYP: Training 1 vs. Training 4 q(1008)=11,46 < 0,0001
WT HYP: Training 2 vs. Training 3 q(1008)=1,374 0.7658
WT HYP: Training 2 vs. Training 4 q(1008)=2,061 0.4637
WT HYP: Training 3 vs. Training 4 q(1008)=0,6878 0.9621
D1 29.22955 3.296376 88 22Scn1aRH/+ control: Training 1 vs.
Training 2q(1008)=7,948 < 0,0001
D2 11.33977 1.36383 88 22Scn1aRH/+control: Training 1 vs.
Training 3q(1008)=9,127 < 0,0001
Scn1aRH/+ control: Training 1 vs.
Training 4q(1008)=10,2 < 0,0001
Scn1aRH/+ control: Training 2 vs.
Training 3q(1008)=1,179 0.8383
Scn1aRH/+ control: Training 2 vs.
Training 4q(1008)=2,254 0.3827
Scn1aRH/+ control: Training 3 vs.
Training 4q(1008)=1,074 0.8725
D1 57.88572 3.629017 84 21 Scn1aRH/+ SIH: Training 1 vs. Training 2 q(1008)=12,54 < 0,0001
D2 28.98571 3.359673 84 21 Scn1aRH/+ SIH: Training 1 vs. Training 3 q(1008)=13,56 < 0,0001
Scn1aRH/+ SIH: Training 1 vs. Training 4 q(1008)=14,02 < 0,0001
Scn1aRH/+ SIH: Training 2 vs. Training 3 q(1008)=1,014 0.8903
Scn1aRH/+ SIH: Training 2 vs. Training 4 q(1008)=1,472 0.7256
Scn1aRH/+ SIH: Training 3 vs. Training 4 q(1008)=0,4573 0.9883
WT -67.88421 6.222804 19 19
Interaction F (9, 246) = 1,007 P = 0,4351 Trial 1: WT control vs. WT HYP q(328)=1,16 0.845
Scn1aRH/+ -64 6.950537 22 22
Trial F (3, 246) = 58,27 P < 0,0001Trial 1: WT control vs. Scn1aRH/+
controlq(328)=0,6534 0.9672
WT HYP61.06087 6.284087 23 23
Trial 1: WT HYP vs. Scn1aRH/+ SIH q(328)=3,356 0.0844
Scn1aRH/+ SIH80.05454 4.602327 22 22
Trial 1: Scn1aRH/+ control vs. Scn1aRH/+
SIHq(328)=2,805 0.1962
t1-D167.88421 6.222804 19 19
t2-D127.94737 7.072909 19 19
t1-D164 6.950537 22 22
t2-D124.32727 5.898617 22 22
t1-D161.06087 6.284087 23 23
t2-D132.18696 7.241072 23 23
t1-D180.05454 4.602327 22 22
t2-D155.62727 7.725384 22 22
WT - 32.04473 3.67175 76 19 Training 1: WT control vs. WT HYP q(1344)=0,07479 > 0,9999
Scn1aRH/+ - 32.22717 3.422416 92 23Training 1: WT control vs. Scn1aRH/+
controlq(1344)=1,142 0.8508
WT HYP 29.22955 3.296376 88 22 Training 1: WT HYP vs. Scn1aRH/+ SIH q(1344)=10,8 < 0,0001
Scn1aRH/+ SIH 57.88572 3.629017 84 21 Training 1: Scn1aRH/+ control vs.
Scn1aRH/+ SIHq(1344)=11,94 < 0,0001
WT - 8.242105 0.8416948 76 19 Training 2: WT control vs. WT HYP q(1344)=1,351 0.775
Scn1aRH/+ - 11.53696 1.807323 92 23Training 2: WT control vs. Scn1aRH/+
controlq(1344)=1,257 0.8107
WT HYP 11.33977 1.36383 88 22 Training 2: WT HYP vs. Scn1aRH/+ SIH q(1344)=7,347 < 0,0001
Scn1aRH/+ SIH 28.98571 3.359673 84 21Training 2: Scn1aRH/+ control vs.
Scn1aRH/+ SIHq(1344)=7,351 < 0,0001
WT - 7.247368 1.002153 76 19 Training 3: WT control vs. WT HYP q(1344)=0,5188 0.9831
Scn1aRH/+ - 8.513043 1.087739 92 23Training 3:WT control vs. Scn1aRH/+
controlq(1344)=0,5834 0.9763
WT HYP 8.685227 1.229834 88 22 Training 3:WT HYP vs. Scn1aRH/+ SIH q(1344)=7,636 < 0,0001
Scn1aRH/+ SIH 26.64881 3.134997 84 21Training 3: Scn1aRH/+ control vs.
Scn1aRH/+ SIHq(1344)=7,483 < 0,0001
WT - 7.948684 1.358431 76 19 Training 4: WT control vs. WT HYP q(1344)=0,3893 0.9927
Scn1aRH/+ - 6.998913 1.016919 92 23Training 4: WT control vs. Scn1aRH/+
controlq(1344)=0,6824 0.963
WT HYP 6.267045 0.7822427 88 22 Training 4: WT HYP vs. Scn1aRH/+ SIH q(1344)=7,83 < 0,0001
Scn1aRH/+ SIH 25.59524 3.211734 84 21Training 4: Scn1aRH/+ control vs.
Scn1aRH/+ SIHq(1344)=8,051 < 0,0001
WT - 0.1731 0.0064 76 19 Training 1: WT control vs. WT HYP q(1296)=1,406 0.7528
Scn1aRH/+ - 0.1573 0.0058 88 22Training 1: WT control vs. Scn1a
RH/+
controlq(1296)=2,347 0.3455
WT HYP 0.1634 0.0069 80 20 Training 1: WT HYP vs. Scn1aRH/+ SIH q(1296)=4,189 0.0164
Scn1aRH/+ SIH 0.1915 0.0056 84 21 Training 1: Scn1aRH/+ control vs.
Scn1aRH/+ SIHq(1296)=5,224 0.0013
WT - 0.1398 0.0066 76 19 Training 2: WT control vs. WT HYP q(1296)=0,6093 0.9732
Scn1aRH/+ - 0.1388 0.0061 88 22Training 2: WT control vs. Scn1aRH/+
controlq(1296)=0,1489 0.9996
WT HYP 0.1440 0.0078 80 20 Training 2: WT HYP vs. Scn1aRH/+ SIH q(1296)=3,484 0.0662
Scn1aRH/+ SIH 0.1673 0.0063 84 21Training 2: Scn1aRH/+ control vs.
Scn1aRH/+ SIHq(1296)=4,361 0.0112
WT - 0.1197 0.0073 76 19 Training 3: WT control vs. WT HYP q(1296)=4,268 0.0138
Scn1aRH/+ - 0.1390 0.0067 88 22Training 3:WT control vs. Scn1aRH/+
controlq(1296)=2,881 0.175
WT HYP 0.1490 0.0079 80 20 Training 3:WT HYP vs. Scn1aRH/+ SIH q(1296)=3,127 0.1207
Scn1aRH/+ SIH 0.1699 0.0062 84 21Training 3: Scn1aRH/+ control vs.
Scn1aRH/+ SIHq(1296)=4,727 0.0047
WT - 0.1255 0.0065 76 19 Training 4: WT control vs. WT HYP q(1296)=2,341 0.3479
Scn1aRH/+ - 0.1299 0.0073 88 22Training 4: WT control vs. Scn1aRH/+
controlq(1296)=0,6571 0.9667
WT HYP 0.1416 0.0076 80 20 Training 4: WT HYP vs. Scn1aRH/+ SIH q(1296)=4,775 0.0042
Scn1aRH/+ SIH 0.1735 0.0057 84 21Training 4: Scn1aRH/+ control vs.
Scn1aRH/+ SIHq(1296)=6,674 < 0,0001
WT - 6.460737 0.7937213 76 19 Training 1: WT control vs. WT HYP q(1296)=0,4226 0.9907
Scn1aRH/+ - 5.556216 0.6823414 88 22Training 1: WT control vs. Scn1aRH/+
controlq(1296)=1,65 0.6481
WT HYP 6.23138 0.6989641 80 20 Training 1: WT HYP vs. Scn1aRH/+ SIH q(1296)=10,46 < 0,0001
Scn1aRH/+ SIH 11.68935 0.8374145 84 21 Training 1: Scn1aRH/+ control vs.
Scn1aRH/+ SIHq(1296)=11,62 < 0,0001
WT - 1.315329 0.1638174 76 19 Training 2: WT control vs. WT HYP q(1296)=1,384 0.7616
Scn1aRH/+ - 1.921886 0.2769157 88 22Training 2: WT control vs. Scn1aRH/+
controlq(1296)=1,106 0.8625
WT HYP 2.066435 0.364425 80 20 Training 2: WT HYP vs. Scn1aRH/+ SIH q(1296)=7,731 < 0,0001
Scn1aRH/+ SIH 6.10242 0.7526377 84 21Training 2: Scn1aRH/+ control vs.
Scn1aRH/+ SIHq(1296)=7,921 < 0,0001
WT - 1.139329 0.2044359 76 19 Training 3: WT control vs. WT HYP q(1296)=0,8549 0.9307
Scn1aRH/+ - 1.435739 0.2222679 88 22Training 3:WT control vs. Scn1aRH/+
controlq(1296)=0,5407 0.981
WT HYP 1.603261 0.2461549 80 20 Training 3:WT HYP vs. Scn1aRH/+ SIH q(1296)=8,188 < 0,0001
Scn1aRH/+ SIH 5.877432 0.7365466 84 21Training 3: Scn1aRH/+ control vs.
Scn1aRH/+ SIHq(1296)=8,416 < 0,0001
WT - 1.295526 0.2833215 76 19 Training 4: WT control vs. WT HYP q(1296)=0,1389 0.9997
Scn1aRH/+ - 1.025261 0.1717624 88 22Training 4: WT control vs. Scn1aRH/+
controlq(1296)=0,493 0.9855
WT HYP 1.22013 0.2120321 80 20 Training 4: WT HYP vs. Scn1aRH/+ SIH q(1296)=7,513 < 0,0001
Scn1aRH/+ SIH 5.142352 0.7405574 84 21Training 4: Scn1aRH/+ control vs.
Scn1aRH/+ SIHq(1296)=7,801 < 0,0001
WT: LEFT 17.11351 1.590523 19 19 WT: LEFT vs. TARGET q(243)=14,33 < 0,0001
WT: TARGET 56.76281 3.567275 19 19 WT: TARGET vs. RIGHT q(243)=14,91 < 0,0001
WT: RIGHT 15.52632 2.157894 19 19
WT: OPPOSITE 10.5 2.111683 19 19
WT: LEFT 24.55077 2.435804 23 23 WT HYP: LEFT vs. TARGET q(243)=10,46 < 0,0001
WT: TARGET 50.85536 2.845297 23 23 WT HYP: TARGET vs. RIGHT q(243)=14,58 < 0,0001
WT: RIGHT 14.20072 1.664953 23 23
WT: OPPOSITE 10.05507 1.590904 23 23
Scn1aRH/+: LEFT 19.53106 1.379024 22 22 Scn1aRH/+: LEFT vs. TARGET q(243)=13,82 < 0,0001
Scn1aRH/+:
TARGET55.06091 3.040268 22 22 Scn1aRH/+: TARGET vs. RIGHT q(243)=15,49 < 0,0001
Scn1aRH/+:
RIGHT15.24242 2.271501 22 22
Scn1aRH/+:
OPPOSITE10.03061 1.408996 22 22
Scn1aRH/+: LEFT 26.3889 2.395459 21 21 Scn1aRH/+ SIH: LEFT vs. TARGET q(243)=3,55 0.0608
Scn1aRH/+:
TARGET35.73079 2.968656 21 21 Scn1aRH/+ SIH: TARGET vs. RIGHT q(243)=6,508 < 0,0001
Scn1aRH/+:
RIGHT18.60619 1.648541 21 21
Scn1aRH/+:
OPPOSITE19.00603 1.901427 21 21
WT: TARGET - 56.76281 3.567275 19 19 Interaction F (9, 243) = 6,353 < 0,0001 Target: WT control vs. WT HYP q(324)=2,58 0.3488
Scn1aRH/+:
TARGET- 50.85536 2.845297 23 23 Quadrant F (3, 243) = 166,1 < 0,0001
Target: WT control vs. Scn1aRH/+
controlq(324)=0,7359 0.9961
WT: TARGET HYP 55.06091 3.040268 22 22 Target: WT HYP vs. Scn1aRH/+ SIH q(324)=6,786 < 0,0001
Scn1aRH/+:
TARGETSIH 35.73079 2.968656 21 21
Target: Scn1aRH/+ control vs. Scn1aRH/+
SIHq(324)=8,58 < 0,0001
WT - 56.76281 3.567275 19 19 -
Chance level 25.000 -
WT HYP 55.06091 3.040268 22 22 -
Chance level 25.000 -
Scn1aRH/+ - 50.85536 2.845297 23 23 -
Chance level 25.000 -
Scn1aRH/+ SIH 35.73079 2.968656 21 21 -
Chance level 25.000 -
WT - 13.737 0.908 19 19 Interaction F (1, 81) = 8,504 0.0046 WT control vs. WT HYP q(81)=2,722 0.2259
Scn1aRH/+ - 13.182 0.755 22 22 Treatment F (1, 81) = 32,03 < 0,0001 WT control vs. Scn1aRH/+ control q(81)=0,626 0.9709
WT HYP 11.348 1.055 23 23 WT HYP vs. Scn1aRH/+ SIH q(81)=6,593 < 0,0001
Scn1aRH/+ SIH 5.714 0.673 21 21 Scn1aRH/+ control vs. Scn1aRH/+ SIH q(81)=8,646 < 0,0001
39A
Morris Water Mazein Scn1aRH/+ -129:B6
39A
39D
39C
39C
39C
Table 13
Table 12
39A
39B
39A
Table 12
Table 13
Cue task Day
0.0814F (3, 336) = 2,259Interaction
Late
ncy t
o f
ind
th
e h
idd
en
pla
tfo
rm (
s)
- S
pati
al
learn
ing
HYPWT
D1
Two-Way
RM ANOVA
Interaction F (9, 972) = 1,543 0.1281
D3
D2
Late
ncy t
o f
ind
th
e h
idd
en
pla
tfo
rm -
SP
AT
IAL
LE
AR
NIN
G
Mo
rris
Wate
r M
aze
D4
Mo
rris
Wate
r M
aze
Avearg
e s
peed
(m
/s)
CU
ET
AS
KL
ate
ncy t
o f
ind
th
e c
ued
pla
tfo
rm (
s)
- C
UE
TA
SK
Mo
rris
Wate
r M
aze
Training Day
q(243)=6,356
D4 6.267045 0.7822427 88
Mo
rris
Wate
r M
aze
Avearg
e s
peed
(m
/s)
Mo
rris
Wate
r M
aze
Pre
sen
ce i
n q
uad
ran
t (%
)
Probe test
RM-Two
Way
ANOVA
Tuckey's
Training Day F (3, 1008) = 117,0 < 0,0001
Group (Treatment-genotype) F (3, 336) = 55,50
0.15F (3, 81) = 1,820
Mo
rris
Wate
r M
aze
D3 3.134997 84 21
D4 25.59524
F (9, 1008) = 1,063
Tuckey's
D1
< 0,0001
Scn1aRH/+: TARGET vs. OPPOSITE q(243)=17,52 < 0,0001
Scn1aRH/+SIH : TARGET vs.
OPPOSITE
0.0001
0.3877
< 0,0001
Two-Way
RM ANOVA
23
Tuckey's
Two-Way
RM ANOVA
Group (Treatment-genotype)
Scn1aRH/+
F (3, 336) = 7,057
< 0,0001F (1, 336) = 101,8
F (3, 336) = 55,50
8.513043 1.087739 92
3.211734 84 21
22
Scn1aRH/+
19761.0021537.247368
Tuckey's26.64881
D2
Tuckey's
SIH
- Tuckey's
Tuckey's
921.0169196.998913
Training Day
Interaction
8.685227
D3
Group (Treatment-genotype) F (3, 340) = 54,81 < 0,0001
D4
Two-Way
RM ANOVA
Interaction F (9, 1008) = 1,063 0.3877
D1
Tuckey's
Group (Treatment-genotype) F (3, 332) = 4,410 0.0047
Group (Treatment-genotype)
< 0,0001F (3, 1008) = 117,0
Tuckey's
P < 0,0001F (3, 82) = 15,95Seizures
Two-Way
RM ANOVA
WT D3
D4
D3 1.229834 88
D1
Tuckey's
Tuckey's
D2
F (3, 972) = 17,11 < 0,0001
D3
Group (Treatment-genotype) F (3, 324) = 20,77
Tuckey's
Tuckey's
22
23D4
-
D2Two-Way
RM ANOVATuckey's
Group (Treatment-genotype) F (3, 336) = 4,919 0.0023
Mo
rris
Wate
r M
aze
Dis
tan
ce t
ravell
ed
(m
) -C
UE
TA
SK
Seizures F (3, 332) = 4,410 0.0047
Two-Way
RM ANOVA
Pre
sen
ce i
n q
uad
ran
t (%
)
Probe test
D1
Tuckey's
Tuckey's
Tuckey's
Tuckey's
Two-Way
RM ANOVATuckey's
D2
< 0,0001q(243)=16,23WT HYP: TARGET vs. OPPOSITE
< 0,0001q(243)=16,72WT: TARGET vs. OPPOSITE
< 0,0001F (9, 243) = 6,353
Sidak's
Sidak's
Sidak's
Sidak's
Mo
rris
Wate
r M
aze
Late
ncy t
o f
ind
th
e h
idd
en
pla
tfo
rm (
s)
t1-D1 Tuckey's
-
Quadrant
Interaction
Group (Treatment-genotype)
Tuckey's
Tuckey's
Mo
rris
Wate
r M
aze
0.15F (3, 81) = 1,820
< 0,0001F (3, 243) = 166,1
Probe test
Mo
rris
Wate
r M
aze
Targ
et
qu
ad
ran
t:D
iffe
ren
ce t
o c
han
ce l
evel
One
sample t-
test
-
HYP
-
SIH
RM-Two
Way
ANOVA
Mo
rris
Wate
r M
aze
< 0,0001t(22)=9,087
< 0,0001t(18)=8,904 - -
- -
Dis
tan
ce t
ravell
ed
(m
)
D1
-
- -
-
t(21)=9,888 < 0,0001 -
Probe testTwo-Way
ANOVA
Genotype 0.0006
Nu
mb
er
of
pla
tfo
rm c
rosses
Two-Way
RM ANOVA
Interaction F (9, 1020) = 0,8253 0.5928
D2
Training Day F (3, 1020) = 99,83 < 0,0001
< 0,0001
D4
Sidak's
Tuckey's
D3
19761.3584317.948684
Two-Way
RM ANOVA
< 0,0001
Tuckey's
Scn
1aR
H/+
-129:B
6
Mo
rris
Wate
r M
aze
0.0814F (3, 336) = 2,259Interaction
Cue task Day
Group (Treatment-genotype)
Two-Way
RM ANOVA
Mo
rris
Wate
r M
aze
-
HYP
-
SIHScn1aRH/+
Scn1aRH/+
WT
WT
Late
ncy t
o f
ind
th
e c
ued
pla
tfo
rm (
s)
- C
UE
TA
SK
0.0001F (3, 336) = 7,057
< 0,0001F (1, 336) = 101,8
-
Group (Treatment-genotype)
Seizures F (3, 336) = 4,919 0.0023
t(20)=3,615 0.0017 - - -
- -
F (1, 81) = 12,63
Tuckey's
Scn1aRH/+ SIH: Cue task 1 vs. Cue
task 2Sidak's t(336)=7,042 < 0,0001
< 0,0001t(336)=5,242Sidak'sScn1aRH/+ control : Cue task 1 vs. Cue
task 2
t(336)=4,163 0.0002
0.0009t(336)=3,736Sidak'sWT HYP: Cue task 1 vs. Cue task 2
WT control : Cue task 1 vs. Cue task 2
q(246)=7,257
q(246)=6,789
0.0096
0.001
< 0,0001
< 0,0001
Late
ncy t
o f
ind
th
e h
idd
en
pla
tfo
rm (
s)
Mo
rris
Wate
r M
aze
SIHScn1aRH/+
HYPWT
-Scn1aRH/+
-WT
39BTwo-Way
RM ANOVA
Group (Treatment-genotype)
Trial
Interaction
P < 0,0001F (3, 82) = 15,95
P < 0,0001F (3, 246) = 58,27
P = 0,4351F (9, 246) = 1,007
WT control: Trial1 vs.Trial 2
Scn1aRH/+ control : Trial1 vs.Trial 2
WT HYP : Trial1 vs.Trial 2
Scn1aRH/+ SIH: Trial1 vs.Trial 2
Tuckey's
q(246)=4,468
q(246)=5,400

199
Mouse model
and genetic
background
Experi
ment
Measur
ment
Protocol
phaseGenotype
treatme
nt/proto
col
average S.E.M
#
values/sli
ces/cells
#
animal
s
Statistical
testSource of variation
F(DFn,DFd) / t
(dF) value/U/χ²/Hp value Comparision
post hoc
test
t(dF) value /
q(dF) valuep value Figure
D1 17.554 2.501 76 19
D2 5.293 0.683 76 19
D1 16.296 2.391 92 23
D2 6.296 0.910 92 23
D1 17.810 2.353 88 22
D2 3.463 0.332 88 22
D1 29.068 3.569 84 21
D2 9.340 1.617 84 21
WT - 17.554 2.501 76 19 Cue task 1: WT control vs. WT HYP q(672)=0,6033 0.9739
Scn1aRH/+ - 17.810 2.353 88 22Cue task 1:WT control vs. Scn1aRH/+
controlq(672)=0,08600 > 0,9999
WT HYP 16.296 2.391 92 23 Cue task 1: WT HYP vs. Scn1aRH/+ SIH q(672)=6,290 < 0,0001
Scn1aRH/+ SIH 29.068 3.569 84 21Cue task 1: Scn1aRH/+ control vs.
Scn1aRH/+ SIHq(672)=5,485 0.0007
WT - 5.293 0.683 76 19 Cue task 2: WT control vs. WT HYP q(672)=0,4805 0.9865
Scn1aRH/+ - 3.463 0.332 88 22Cue task 2:WT control vs. Scn1aRH/+
controlq(672)=0,6144 0.6144
WT HYP 6.296 0.910 92 23 Cue task 2: WT HYP vs. Scn1aRH/+ SIH q(672)=1,499 0.7138
Scn1aRH/+ SIH 9.340 1.617 84 21Cue task 2: Scn1aRH/+ control vs.
Scn1aRH/+ SIHq(672)=2,864 0.1798
WT - 0.128 0.006 76 19 Interaction F (3, 336) = 0,5145 0.6726 Cue task 1: WT control vs. WT HYP q(672)=0,8557 0.9305
Scn1aRH/+ - 0.132 0.006 88 22 Cue task Day F (1, 336) = 5,212 0.0231Cue task 1:WT control vs. Scn1aRH/+
controlq(672)=0,5562 0.1121
WT HYP 0.134 0.006 92 23 Cue task 1: WT HYP vs. Scn1aRH/+ SIH q(672)=4,211 0.0159
Scn1aRH/+ SIH 0.104 0.006 84 21Cue task 1: Scn1aRH/+ control vs.
Scn1aRH/+ SIHq(672)=3,867 0.0324
WT - 0.146 0.009 76 19 Interaction F (3, 336) = 0,5145 0.6726 Cue task 2: WT control vs. WT HYP q(672)=1,016 0.8897
Scn1aRH/+ - 0.138 0.008 88 22 Cue task Day F (1, 336) = 5,212 0.0231Cue task 2:WT control vs. Scn1aRH/+
controlq(672)=1,068 0.8745
WT HYP 0.138 0.009 92 23 Cue task 2: WT HYP vs. Scn1aRH/+ SIH q(672)=2,460 0.3039
Scn1aRH/+ SIH 0.121 0.007 84 21Cue task 2: Scn1aRH/+ control vs.
Scn1aRH/+ SIHq(672)=2,370 0.3371
WT - 2.970763 0.4965251 76 19 Interaction F (3, 332) = 0,7880 0.5013 Cue task 1: WT control vs. WT HYP q(664)=0,7936 0.9435
Scn1aRH/+ - 2.653614 0.3747214 88 22 Cue task Day F (1, 332) = 57,91 < 0,0001Cue task 1:WT control vs. Scn1aRH/+
controlq(664)=0,7803 0.9461
WT HYP 2.644679 0.4470432 84 23 Cue task 1: WT HYP vs. Scn1aRH/+ SIH q(664)=4,279 0.0137
Scn1aRH/+ SIH 4.338921 0.6543971 88 21Cue task 1: Scn1aRH/+ control vs.
Scn1aRH/+ SIHq(664)=4,307 0.0129
WT - 1.223474 0.2069968 76 19 Interaction F (3, 332) = 0,7880 0.5013 Cue task 2: WT control vs. WT HYP q(664)=0,3639 0.994
Scn1aRH/+ - 0.5581932 0.075622 88 22 Cue task Day F (1, 332) = 57,91 < 0,0001Cue task 2:WT control vs. Scn1aRH/+
controlq(664)=1,637 0.654
WT HYP 1.073941 0.2038943 84 23 Cue task 2: WT HYP vs. Scn1aRH/+ SIH q(664)=1,62 0.6616
Scn1aRH/+ SIH 1.715159 0.3986418 88 21Cue task 2: Scn1aRH/+ control vs.
Scn1aRH/+ SIHq(664)=2,957 0.1571
D1 32.04473 3.67175 76 19 WT: Training 1 vs. Training 2 q(1008)=9,827 < 0,0001
D2 8.242105 0.8416948 76 19 WT: Training 1 vs. Training 3 q(1008)=10,24 < 0,0001
WT: Training 1 vs. Training 4 q(1008)=9,948 < 0,0001
WT: Training 2 vs. Training 3 q(1008)=0,4107 0.9915
WT: Training 2 vs. Training 4 q(1008)=0,1211 0.9998
WT: Training 3 vs. Training 4 q(1008)=0,2896 0.997
D1 32.22717 3.422416 92 23 WT HYP: Training 1 vs. Training 2 q(1008)=9,399 < 0,0001
D2 11.53696 1.807323 92 23 WT HYP: Training 1 vs. Training 3 q(1008)=10,77 < 0,0001
WT HYP: Training 1 vs. Training 4 q(1008)=11,46 < 0,0001
WT HYP: Training 2 vs. Training 3 q(1008)=1,374 0.7658
WT HYP: Training 2 vs. Training 4 q(1008)=2,061 0.4637
WT HYP: Training 3 vs. Training 4 q(1008)=0,6878 0.9621
D1 29.22955 3.296376 88 22Scn1aRH/+ control: Training 1 vs.
Training 2q(1008)=7,948 < 0,0001
D2 11.33977 1.36383 88 22Scn1aRH/+control: Training 1 vs.
Training 3q(1008)=9,127 < 0,0001
Scn1aRH/+ control: Training 1 vs.
Training 4q(1008)=10,2 < 0,0001
Scn1aRH/+ control: Training 2 vs.
Training 3q(1008)=1,179 0.8383
Scn1aRH/+ control: Training 2 vs.
Training 4q(1008)=2,254 0.3827
Scn1aRH/+ control: Training 3 vs.
Training 4q(1008)=1,074 0.8725
D1 57.88572 3.629017 84 21 Scn1aRH/+ SIH: Training 1 vs. Training 2 q(1008)=12,54 < 0,0001
D2 28.98571 3.359673 84 21 Scn1aRH/+ SIH: Training 1 vs. Training 3 q(1008)=13,56 < 0,0001
Scn1aRH/+ SIH: Training 1 vs. Training 4 q(1008)=14,02 < 0,0001
Scn1aRH/+ SIH: Training 2 vs. Training 3 q(1008)=1,014 0.8903
Scn1aRH/+ SIH: Training 2 vs. Training 4 q(1008)=1,472 0.7256
Scn1aRH/+ SIH: Training 3 vs. Training 4 q(1008)=0,4573 0.9883
WT -67.88421 6.222804 19 19
Interaction F (9, 246) = 1,007 P = 0,4351 Trial 1: WT control vs. WT HYP q(328)=1,16 0.845
Scn1aRH/+ -64 6.950537 22 22
Trial F (3, 246) = 58,27 P < 0,0001Trial 1: WT control vs. Scn1aRH/+
controlq(328)=0,6534 0.9672
WT HYP61.06087 6.284087 23 23
Trial 1: WT HYP vs. Scn1aRH/+ SIH q(328)=3,356 0.0844
Scn1aRH/+ SIH80.05454 4.602327 22 22
Trial 1: Scn1aRH/+ control vs. Scn1aRH/+
SIHq(328)=2,805 0.1962
t1-D167.88421 6.222804 19 19
t2-D127.94737 7.072909 19 19
t1-D164 6.950537 22 22
t2-D124.32727 5.898617 22 22
t1-D161.06087 6.284087 23 23
t2-D132.18696 7.241072 23 23
t1-D180.05454 4.602327 22 22
t2-D155.62727 7.725384 22 22
WT - 32.04473 3.67175 76 19 Training 1: WT control vs. WT HYP q(1344)=0,07479 > 0,9999
Scn1aRH/+ - 32.22717 3.422416 92 23Training 1: WT control vs. Scn1aRH/+
controlq(1344)=1,142 0.8508
WT HYP 29.22955 3.296376 88 22 Training 1: WT HYP vs. Scn1aRH/+ SIH q(1344)=10,8 < 0,0001
Scn1aRH/+ SIH 57.88572 3.629017 84 21 Training 1: Scn1aRH/+ control vs.
Scn1aRH/+ SIHq(1344)=11,94 < 0,0001
WT - 8.242105 0.8416948 76 19 Training 2: WT control vs. WT HYP q(1344)=1,351 0.775
Scn1aRH/+ - 11.53696 1.807323 92 23Training 2: WT control vs. Scn1aRH/+
controlq(1344)=1,257 0.8107
WT HYP 11.33977 1.36383 88 22 Training 2: WT HYP vs. Scn1aRH/+ SIH q(1344)=7,347 < 0,0001
Scn1aRH/+ SIH 28.98571 3.359673 84 21Training 2: Scn1aRH/+ control vs.
Scn1aRH/+ SIHq(1344)=7,351 < 0,0001
WT - 7.247368 1.002153 76 19 Training 3: WT control vs. WT HYP q(1344)=0,5188 0.9831
Scn1aRH/+ - 8.513043 1.087739 92 23Training 3:WT control vs. Scn1aRH/+
controlq(1344)=0,5834 0.9763
WT HYP 8.685227 1.229834 88 22 Training 3:WT HYP vs. Scn1aRH/+ SIH q(1344)=7,636 < 0,0001
Scn1aRH/+ SIH 26.64881 3.134997 84 21Training 3: Scn1aRH/+ control vs.
Scn1aRH/+ SIHq(1344)=7,483 < 0,0001
WT - 7.948684 1.358431 76 19 Training 4: WT control vs. WT HYP q(1344)=0,3893 0.9927
Scn1aRH/+ - 6.998913 1.016919 92 23Training 4: WT control vs. Scn1aRH/+
controlq(1344)=0,6824 0.963
WT HYP 6.267045 0.7822427 88 22 Training 4: WT HYP vs. Scn1aRH/+ SIH q(1344)=7,83 < 0,0001
Scn1aRH/+ SIH 25.59524 3.211734 84 21Training 4: Scn1aRH/+ control vs.
Scn1aRH/+ SIHq(1344)=8,051 < 0,0001
WT - 0.1731 0.0064 76 19 Training 1: WT control vs. WT HYP q(1296)=1,406 0.7528
Scn1aRH/+ - 0.1573 0.0058 88 22Training 1: WT control vs. Scn1a
RH/+
controlq(1296)=2,347 0.3455
WT HYP 0.1634 0.0069 80 20 Training 1: WT HYP vs. Scn1aRH/+ SIH q(1296)=4,189 0.0164
Scn1aRH/+ SIH 0.1915 0.0056 84 21 Training 1: Scn1aRH/+ control vs.
Scn1aRH/+ SIHq(1296)=5,224 0.0013
WT - 0.1398 0.0066 76 19 Training 2: WT control vs. WT HYP q(1296)=0,6093 0.9732
Scn1aRH/+ - 0.1388 0.0061 88 22Training 2: WT control vs. Scn1aRH/+
controlq(1296)=0,1489 0.9996
WT HYP 0.1440 0.0078 80 20 Training 2: WT HYP vs. Scn1aRH/+ SIH q(1296)=3,484 0.0662
Scn1aRH/+ SIH 0.1673 0.0063 84 21Training 2: Scn1aRH/+ control vs.
Scn1aRH/+ SIHq(1296)=4,361 0.0112
WT - 0.1197 0.0073 76 19 Training 3: WT control vs. WT HYP q(1296)=4,268 0.0138
Scn1aRH/+ - 0.1390 0.0067 88 22Training 3:WT control vs. Scn1aRH/+
controlq(1296)=2,881 0.175
WT HYP 0.1490 0.0079 80 20 Training 3:WT HYP vs. Scn1aRH/+ SIH q(1296)=3,127 0.1207
Scn1aRH/+ SIH 0.1699 0.0062 84 21Training 3: Scn1aRH/+ control vs.
Scn1aRH/+ SIHq(1296)=4,727 0.0047
WT - 0.1255 0.0065 76 19 Training 4: WT control vs. WT HYP q(1296)=2,341 0.3479
Scn1aRH/+ - 0.1299 0.0073 88 22Training 4: WT control vs. Scn1aRH/+
controlq(1296)=0,6571 0.9667
WT HYP 0.1416 0.0076 80 20 Training 4: WT HYP vs. Scn1aRH/+ SIH q(1296)=4,775 0.0042
Scn1aRH/+ SIH 0.1735 0.0057 84 21Training 4: Scn1aRH/+ control vs.
Scn1aRH/+ SIHq(1296)=6,674 < 0,0001
WT - 6.460737 0.7937213 76 19 Training 1: WT control vs. WT HYP q(1296)=0,4226 0.9907
Scn1aRH/+ - 5.556216 0.6823414 88 22Training 1: WT control vs. Scn1aRH/+
controlq(1296)=1,65 0.6481
WT HYP 6.23138 0.6989641 80 20 Training 1: WT HYP vs. Scn1aRH/+ SIH q(1296)=10,46 < 0,0001
Scn1aRH/+ SIH 11.68935 0.8374145 84 21 Training 1: Scn1aRH/+ control vs.
Scn1aRH/+ SIHq(1296)=11,62 < 0,0001
WT - 1.315329 0.1638174 76 19 Training 2: WT control vs. WT HYP q(1296)=1,384 0.7616
Scn1aRH/+ - 1.921886 0.2769157 88 22Training 2: WT control vs. Scn1aRH/+
controlq(1296)=1,106 0.8625
WT HYP 2.066435 0.364425 80 20 Training 2: WT HYP vs. Scn1aRH/+ SIH q(1296)=7,731 < 0,0001
Scn1aRH/+ SIH 6.10242 0.7526377 84 21Training 2: Scn1aRH/+ control vs.
Scn1aRH/+ SIHq(1296)=7,921 < 0,0001
WT - 1.139329 0.2044359 76 19 Training 3: WT control vs. WT HYP q(1296)=0,8549 0.9307
Scn1aRH/+ - 1.435739 0.2222679 88 22Training 3:WT control vs. Scn1aRH/+
controlq(1296)=0,5407 0.981
WT HYP 1.603261 0.2461549 80 20 Training 3:WT HYP vs. Scn1aRH/+ SIH q(1296)=8,188 < 0,0001
Scn1aRH/+ SIH 5.877432 0.7365466 84 21Training 3: Scn1aRH/+ control vs.
Scn1aRH/+ SIHq(1296)=8,416 < 0,0001
WT - 1.295526 0.2833215 76 19 Training 4: WT control vs. WT HYP q(1296)=0,1389 0.9997
Scn1aRH/+ - 1.025261 0.1717624 88 22Training 4: WT control vs. Scn1aRH/+
controlq(1296)=0,493 0.9855
WT HYP 1.22013 0.2120321 80 20 Training 4: WT HYP vs. Scn1aRH/+ SIH q(1296)=7,513 < 0,0001
Scn1aRH/+ SIH 5.142352 0.7405574 84 21Training 4: Scn1aRH/+ control vs.
Scn1aRH/+ SIHq(1296)=7,801 < 0,0001
WT: LEFT 17.11351 1.590523 19 19 WT: LEFT vs. TARGET q(243)=14,33 < 0,0001
WT: TARGET 56.76281 3.567275 19 19 WT: TARGET vs. RIGHT q(243)=14,91 < 0,0001
WT: RIGHT 15.52632 2.157894 19 19
WT: OPPOSITE 10.5 2.111683 19 19
WT: LEFT 24.55077 2.435804 23 23 WT HYP: LEFT vs. TARGET q(243)=10,46 < 0,0001
WT: TARGET 50.85536 2.845297 23 23 WT HYP: TARGET vs. RIGHT q(243)=14,58 < 0,0001
WT: RIGHT 14.20072 1.664953 23 23
WT: OPPOSITE 10.05507 1.590904 23 23
Scn1aRH/+: LEFT 19.53106 1.379024 22 22 Scn1aRH/+: LEFT vs. TARGET q(243)=13,82 < 0,0001
Scn1aRH/+:
TARGET55.06091 3.040268 22 22 Scn1aRH/+: TARGET vs. RIGHT q(243)=15,49 < 0,0001
Scn1aRH/+:
RIGHT15.24242 2.271501 22 22
Scn1aRH/+:
OPPOSITE10.03061 1.408996 22 22
Scn1aRH/+: LEFT 26.3889 2.395459 21 21 Scn1aRH/+ SIH: LEFT vs. TARGET q(243)=3,55 0.0608
Scn1aRH/+:
TARGET35.73079 2.968656 21 21 Scn1aRH/+ SIH: TARGET vs. RIGHT q(243)=6,508 < 0,0001
Scn1aRH/+:
RIGHT18.60619 1.648541 21 21
Scn1aRH/+:
OPPOSITE19.00603 1.901427 21 21
WT: TARGET - 56.76281 3.567275 19 19 Interaction F (9, 243) = 6,353 < 0,0001 Target: WT control vs. WT HYP q(324)=2,58 0.3488
Scn1aRH/+:
TARGET- 50.85536 2.845297 23 23 Quadrant F (3, 243) = 166,1 < 0,0001
Target: WT control vs. Scn1aRH/+
controlq(324)=0,7359 0.9961
WT: TARGET HYP 55.06091 3.040268 22 22 Target: WT HYP vs. Scn1aRH/+ SIH q(324)=6,786 < 0,0001
Scn1aRH/+:
TARGETSIH 35.73079 2.968656 21 21
Target: Scn1aRH/+ control vs. Scn1aRH/+
SIHq(324)=8,58 < 0,0001
WT - 56.76281 3.567275 19 19 -
Chance level 25.000 -
WT HYP 55.06091 3.040268 22 22 -
Chance level 25.000 -
Scn1aRH/+ - 50.85536 2.845297 23 23 -
Chance level 25.000 -
Scn1aRH/+ SIH 35.73079 2.968656 21 21 -
Chance level 25.000 -
WT - 13.737 0.908 19 19 Interaction F (1, 81) = 8,504 0.0046 WT control vs. WT HYP q(81)=2,722 0.2259
Scn1aRH/+ - 13.182 0.755 22 22 Treatment F (1, 81) = 32,03 < 0,0001 WT control vs. Scn1aRH/+ control q(81)=0,626 0.9709
WT HYP 11.348 1.055 23 23 WT HYP vs. Scn1aRH/+ SIH q(81)=6,593 < 0,0001
Scn1aRH/+ SIH 5.714 0.673 21 21 Scn1aRH/+ control vs. Scn1aRH/+ SIH q(81)=8,646 < 0,0001
39A
Morris Water Mazein Scn1aRH/+ -129:B6
39A
39D
39C
39C
39C
Table 13
Table 12
39A
39B
39A
Table 12
Table 13
Cue task Day
0.0814F (3, 336) = 2,259Interaction
Late
ncy t
o f
ind
th
e h
idd
en
pla
tfo
rm (
s)
- S
pati
al
learn
ing
HYPWT
D1
Two-Way
RM ANOVA
Interaction F (9, 972) = 1,543 0.1281
D3
D2
Late
ncy t
o f
ind
th
e h
idd
en
pla
tfo
rm -
SP
AT
IAL
LE
AR
NIN
G
Mo
rris
Wate
r M
aze
D4
Mo
rris
Wate
r M
aze
Avearg
e s
peed
(m
/s)
CU
ET
AS
KL
ate
ncy t
o f
ind
th
e c
ued
pla
tfo
rm (
s)
- C
UE
TA
SK
Mo
rris
Wate
r M
aze
Training Day
q(243)=6,356
D4 6.267045 0.7822427 88
Mo
rris
Wate
r M
aze
Avearg
e s
peed
(m
/s)
Mo
rris
Wate
r M
aze
Pre
sen
ce i
n q
uad
ran
t (%
)
Probe test
RM-Two
Way
ANOVA
Tuckey's
Training Day F (3, 1008) = 117,0 < 0,0001
Group (Treatment-genotype) F (3, 336) = 55,50
0.15F (3, 81) = 1,820
Mo
rris
Wate
r M
aze
D3 3.134997 84 21
D4 25.59524
F (9, 1008) = 1,063
Tuckey's
D1
< 0,0001
Scn1aRH/+: TARGET vs. OPPOSITE q(243)=17,52 < 0,0001
Scn1aRH/+SIH : TARGET vs.
OPPOSITE
0.0001
0.3877
< 0,0001
Two-Way
RM ANOVA
23
Tuckey's
Two-Way
RM ANOVA
Group (Treatment-genotype)
Scn1aRH/+
F (3, 336) = 7,057
< 0,0001F (1, 336) = 101,8
F (3, 336) = 55,50
8.513043 1.087739 92
3.211734 84 21
22
Scn1aRH/+
19761.0021537.247368
Tuckey's26.64881
D2
Tuckey's
SIH
- Tuckey's
Tuckey's
921.0169196.998913
Training Day
Interaction
8.685227
D3
Group (Treatment-genotype) F (3, 340) = 54,81 < 0,0001
D4
Two-Way
RM ANOVA
Interaction F (9, 1008) = 1,063 0.3877
D1
Tuckey's
Group (Treatment-genotype) F (3, 332) = 4,410 0.0047
Group (Treatment-genotype)
< 0,0001F (3, 1008) = 117,0
Tuckey's
P < 0,0001F (3, 82) = 15,95Seizures
Two-Way
RM ANOVA
WT D3
D4
D3 1.229834 88
D1
Tuckey's
Tuckey's
D2
F (3, 972) = 17,11 < 0,0001
D3
Group (Treatment-genotype) F (3, 324) = 20,77
Tuckey's
Tuckey's
22
23D4
-
D2Two-Way
RM ANOVATuckey's
Group (Treatment-genotype) F (3, 336) = 4,919 0.0023
Mo
rris
Wate
r M
aze
Dis
tan
ce t
ravell
ed
(m
) -C
UE
TA
SK
Seizures F (3, 332) = 4,410 0.0047
Two-Way
RM ANOVA
Pre
sen
ce i
n q
uad
ran
t (%
)
Probe test
D1
Tuckey's
Tuckey's
Tuckey's
Tuckey's
Two-Way
RM ANOVATuckey's
D2
< 0,0001q(243)=16,23WT HYP: TARGET vs. OPPOSITE
< 0,0001q(243)=16,72WT: TARGET vs. OPPOSITE
< 0,0001F (9, 243) = 6,353
Sidak's
Sidak's
Sidak's
Sidak's
Mo
rris
Wate
r M
aze
Late
ncy t
o f
ind
th
e h
idd
en
pla
tfo
rm (
s)
t1-D1 Tuckey's
-
Quadrant
Interaction
Group (Treatment-genotype)
Tuckey's
Tuckey's
Mo
rris
Wate
r M
aze
0.15F (3, 81) = 1,820
< 0,0001F (3, 243) = 166,1
Probe test
Mo
rris
Wate
r M
aze
Targ
et
qu
ad
ran
t:D
iffe
ren
ce t
o c
han
ce l
evel
One
sample t-
test
-
HYP
-
SIH
RM-Two
Way
ANOVA
Mo
rris
Wate
r M
aze
< 0,0001t(22)=9,087
< 0,0001t(18)=8,904 - -
- -
Dis
tan
ce t
ravell
ed
(m
)
D1
-
- -
-
t(21)=9,888 < 0,0001 -
Probe testTwo-Way
ANOVA
Genotype 0.0006
Nu
mb
er
of
pla
tfo
rm c
rosses
Two-Way
RM ANOVA
Interaction F (9, 1020) = 0,8253 0.5928
D2
Training Day F (3, 1020) = 99,83 < 0,0001
< 0,0001
D4
Sidak's
Tuckey's
D3
19761.3584317.948684
Two-Way
RM ANOVA
< 0,0001
Tuckey's
Scn
1aR
H/+
-129:B
6
Mo
rris
Wate
r M
aze
0.0814F (3, 336) = 2,259Interaction
Cue task Day
Group (Treatment-genotype)
Two-Way
RM ANOVA
Mo
rris
Wate
r M
aze
-
HYP
-
SIHScn1aRH/+
Scn1aRH/+
WT
WT
Late
ncy t
o f
ind
th
e c
ued
pla
tfo
rm (
s)
- C
UE
TA
SK
0.0001F (3, 336) = 7,057
< 0,0001F (1, 336) = 101,8
-
Group (Treatment-genotype)
Seizures F (3, 336) = 4,919 0.0023
t(20)=3,615 0.0017 - - -
- -
F (1, 81) = 12,63
Tuckey's
Scn1aRH/+ SIH: Cue task 1 vs. Cue
task 2Sidak's t(336)=7,042 < 0,0001
< 0,0001t(336)=5,242Sidak'sScn1aRH/+ control : Cue task 1 vs. Cue
task 2
t(336)=4,163 0.0002
0.0009t(336)=3,736Sidak'sWT HYP: Cue task 1 vs. Cue task 2
WT control : Cue task 1 vs. Cue task 2
q(246)=7,257
q(246)=6,789
0.0096
0.001
< 0,0001
< 0,0001
Late
ncy t
o f
ind
th
e h
idd
en
pla
tfo
rm (
s)
Mo
rris
Wate
r M
aze
SIHScn1aRH/+
HYPWT
-Scn1aRH/+
-WT
39BTwo-Way
RM ANOVA
Group (Treatment-genotype)
Trial
Interaction
P < 0,0001F (3, 82) = 15,95
P < 0,0001F (3, 246) = 58,27
P = 0,4351F (9, 246) = 1,007
WT control: Trial1 vs.Trial 2
Scn1aRH/+ control : Trial1 vs.Trial 2
WT HYP : Trial1 vs.Trial 2
Scn1aRH/+ SIH: Trial1 vs.Trial 2
Tuckey's
q(246)=4,468
q(246)=5,400
Mouse model
and genetic
background
Experi
ment
Measur
ment
Protocol
phaseGenotype
treatme
nt/proto
col
average S.E.M
#
values/sli
ces/cells
#
animal
s
Statistical
testSource of variation
F(DFn,DFd) / t
(dF) value/U/χ²/Hp value Comparision
post hoc
test
t(dF) value /
q(dF) valuep value Figure
WT - 21.09296 3.291269 18 18 Interaction F (1, 63) = 0,2228 0.6385 WT control vs. WT HYP q(63)=1,237 0.818
Scn1aRH/+ - 11.52091 2.292139 22 22 Treatment F (1, 63) = 0,6443 0.4252 WT control vs. Scn1aRH/+ control q(63)=3,373 0.0904
WT HYP 17.07436 4.300251 13 13 WT HYP vs. Scn1aRH/+ SIH q(63)=0,3415 0.995
Scn1aRH/+ SIH 10.47857 2.789497 14 14 Scn1aRH/+ control vs. Scn1aRH/+ SIH q(63)=1,918 0.5311
WT - 75.07111 4.162738 18 18 Interaction F (1, 64) = 0,1338 0.7157 WT control vs. WT HYP q(63)=1,633 0.4939
Scn1aRH/+ - 56.56424 4.336703 22 22 Treatment F (1, 64) = 7,673 0.0073 WT control vs. Scn1aRH/+ control q(63)=2,422 0.1048
WT HYP 60.77692 7.499846 13 13 WT HYP vs. Scn1aRH/+ SIH q(63)=2,316 0.1345
Scn1aRH/+ SIH 37.91956 8.232697 15 15 Scn1aRH/+ control vs. Scn1aRH/+ SIH q(63)=2,509 0.0848
Tuckey's
Tuckey'sCONDITIO
NING
TEST
Fre
ezin
g %
Two-Way
ANOVA
Two-Way
ANOVA
0.0009F (1, 64) = 12,10
Scn
1aR
H/+
-129:B
6
Co
nte
xtu
al F
ear
Co
nd
itio
nin
g
Contextual-fear conditioningin Scn1aRH/+ -129:B6
40B
40A
Genotype
F (1, 63) = 6,576 0.0127Genotype

200
Mouse model
and genetic
background
Experi
ment
Meas
urme
nt
Protocol
phaseGenotype
treatme
nt/proto
col
average S.E.M
#
values/sli
ces/cells
#
animal
s
Statistical
testSource of variation
F(DFn,DFd) / t
(dF) value/U/χ²/Hp value Comparision
post hoc
test
t(dF) value /
q(dF) valuep value Figure
WT - 3.308 0.1748 13 13 WT control vs. WT HYP q(600)=1,833 0.5658
Scn1aRH/+ - 3.5 0.3416 16 16 WT control vs. Scn1aRH/+ control q(600)=0,549 0.9801
WT HYP 3.941 0.2496 17 17 WT HYP vs. Scn1aRH/+ SIH q(600)=2,967 0.155
Scn1aRH/+ SIH 3 0.2915 18 18 Scn1aRH/+ control vs. Scn1aRH/+ SIH q(600)=1,551 0.6916
WT - 3.692 0.5705 13 13 WT control vs. WT HYP q(600)=1,492 0.7168
Scn1aRH/+ - 3.875 0.3276 16 16 WT control vs. Scn1aRH/+ control q(600)=0,5216 0.9829
WT HYP 3.176 0.2743 17 17 WT HYP vs. Scn1aRH/+ SIH q(600)=1,895 0.5376
Scn1aRH/+ SIH 3.778 0.2977 18 18 Scn1aRH/+ control vs. Scn1aRH/+ SIH q(600)=0,3016 0.9966
WT - 3.923 0.2878 13 13 WT control vs. WT HYP q(600)=1,65 0.6483
Scn1aRH/+ - 4 0.3873 16 16 WT control vs. Scn1aRH/+ control q(600)=0,2196 0.9987
WT HYP 3.353 0.2704 17 17 WT HYP vs. Scn1aRH/+ SIH q(600)=0,2369 0.9983
Scn1aRH/+ SIH 3.278 0.2532 18 18 Scn1aRH/+ control vs. Scn1aRH/+ SIH q(600)=2,241 0.3883
WT - 3.231 0.3608 13 13 WT control vs. WT HYP q(600)=2,736 0.2146
Scn1aRH/+ - 3.5 0.2739 16 16 WT control vs. Scn1aRH/+ control q(600)=0,7686 0.9483
WT HYP 4.176 0.2606 17 17 WT HYP vs. Scn1aRH/+ SIH q(600)=0,206 0.9989
Scn1aRH/+ SIH 4.111 0.3223 18 18 Scn1aRH/+ control vs. Scn1aRH/+ SIH q(600)=1,896 0.5373
WT - 3.846 0.3553 13 13 WT control vs. WT HYP q(600)=0,7462 0.9524
Scn1aRH/+ - 3.438 0.3648 16 16 WT control vs. Scn1aRH/+ control q(600)=1,167 0.8426
WT HYP 3.588 0.3644 17 17 WT HYP vs. Scn1aRH/+ SIH q(600)=1,154 0.847
Scn1aRH/+ SIH 3.222 0.384 18 18 Scn1aRH/+ control vs. Scn1aRH/+ SIH q(600)=0,6679 0.9651
WT - 3.077 0.5122 13 13 WT control vs. WT HYP q(600)=2,501 0.2898
Scn1aRH/+ - 4 0.3651 16 16 WT control vs. Scn1aRH/+ control q(600)=2,635 0.245
WT HYP 3.941 0.3685 17 17 WT HYP vs. Scn1aRH/+ SIH q(600)=1,916 0.5284
Scn1aRH/+ SIH 3.333 0.2425 18 18 Scn1aRH/+
control vs. Scn1aRH/+
SIH q(600)=2,068 0.4609
WT - 4 0.4385 13 13 WT control vs. WT HYP q(600)=2,893 0.1725
Scn1aRH/+ - 4.5 0.3291 16 16 WT control vs. Scn1aRH/+ control q(600)=1,427 0.744
WT HYP 5 0.3835 17 17 WT HYP vs. Scn1aRH/+ SIH q(600)=3,502 0.0647
Scn1aRH/+ SIH 3.889 0.3419 18 18 Scn1aRH/+ control vs. Scn1aRH/+ SIH q(600)=1,896 0.5373
WT - 4.923 0.3662 13 13 WT control vs. WT HYP q(600)=0,05237 > 0,9999
Scn1aRH/+ - 4.813 0.3561 16 16 WT control vs. Scn1aRH/+ control q(600)=0,3157 0.9961
WT HYP 4.941 0.3262 17 17 WT HYP vs. Scn1aRH/+ SIH q(600)=2,616 0.251
Scn1aRH/+ SIH 4.111 0.2668 18 18 Scn1aRH/+ control vs. Scn1aRH/+ SIH q(600)=2,176 0.4149
WT - 5.538 0.2912 13 13 WT control vs. WT HYP q(600)=0,995 0.8957
Scn1aRH/+ - 5.375 0.301 16 16 WT control vs. Scn1aRH/+ control q(600)=0,4667 0.9876
WT HYP 5.882 0.2556 17 17 WT HYP vs. Scn1aRH/+ SIH q(600)=6,459 < 0,0001
Scn1aRH/+ SIH 3.833 0.3547 18 18 Scn1aRH/+ control vs. Scn1aRH/+ SIH q(600)=4,783 0.0043
WT - 5.769 0.3028 13 13 WT control vs. WT HYP q(600)=1,034 0.8845
Scn1aRH/+ - 5.813 0.3319 16 16 WT control vs. Scn1aRH/+ control q(600)=0,1235 0.9998
WT HYP 5.412 0.3328 17 17 WT HYP vs. Scn1aRH/+ SIH q(600)=3,925 0.029
Scn1aRH/+ SIH 4.167 0.2712 18 18 Scn1aRH/+ control vs. Scn1aRH/+ SIH q(600)=5,106 0.0019
D1 WT - 3.308 0.1748 13 13 D1 : WT control vs. Chance level t(12)=1,100 0.293 - - - -
D2 WT - 3.692 0.5705 13 13 D2 : WT control vs. Chance level t(12)=0,3371 0.7419 - - - -
D3 WT - 3.923 0.2878 13 13 D3 : WT control vs. Chance level t(12)=1,470 0.1673 - - - -
D4 WT - 3.231 0.3608 13 13 D4 : WT control vs. Chance level t(12)=0,7462 0.4699 - - - -
D5 WT - 3.846 0.3553 13 13 D5 : WT control vs. Chance level t(12)=0,9743 0.3491 - - - -
D6 WT - 3.077 0.5122 13 13 D6 : WT control vs. Chance level t(12)=0,8260 0.4249 - - - -
D7 WT - 4 0.4385 13 13 D7 : WT control vs. Chance level t(12)=1,140 0.2765 - - - -
D8 WT - 4.923 0.3662 13 13 D8 : WT control vs. Chance level t(12)=3,886 0.0022 - - - -
D9 WT - 5.538 0.2912 13 13 D9 : WT control vs. Chance level t(12)=7,000 < 0,0001 - - - -
D10 WT - 5.769 0.3028 13 13 D10 : WT control vs. Chance level t(12)=7,493 < 0,0001 - - - -
3.500
D1 Scn1aRH/+ - 3.5 0.3416 16 16 D1 : Scn1aRH/+ control vs. Chance level t(15)=0,0 1 - - - -
D2 Scn1aRH/+ - 3.875 0.3276 16 16 D2 :Scn1aRH/+ control vs. Chance level t(15)=1,145 0.2702 - - - -
D3 Scn1aRH/+ - 4 0.3873 16 16 D3 :Scn1aRH/+ control vs. Chance level t(15)=1,291 0.2162 - - - -
D4 Scn1aRH/+ - 3.5 0.2739 16 16 D4 :Scn1aRH/+ control vs. Chance level t(15)=0,0 1 - - - -
D5 Scn1aRH/+ - 3.438 0.3648 16 16 D5 : Scn1aRH/+ control vs. Chance level t(15)=0,1713 0.8663 - - - -
D6 Scn1aRH/+ - 4 0.3651 16 16 D6 : Scn1aRH/+ control vs. Chance level t(15)=1,369 0.1911 - - - -
D7 Scn1aRH/+ - 4.5 0.3291 16 16 D7 : Scn1aRH/+ control vs. Chance level t(15)=3,038 0.0083 - - - -
D8 Scn1aRH/+ - 4.813 0.3561 16 16 D8 : Scn1aRH/+ control vs. Chance level t(15)=3,686 0.0022 - - - -
D9 Scn1aRH/+ - 5.375 0.301 16 16 D9 : Scn1aRH/+ control vs. Chance level t(15)=6,228 < 0,0001 - - - -
D10 Scn1aRH/+ - 5.813 0.3319 16 16 D10 : Scn1aRH/+ control vs. Chance level t(15)=6,968 < 0,0001 - - - -
3.500
D1 WT HYP 3.941 0.2496 17 17 D1 : WT HYP vs. Chance level t(16)=1,768 0.0962 - - - -
D2 WT HYP 3.176 0.2743 17 17 D2 : WT HYP vs. Chance level t(16)=1,179 0.2555 - - - -
D3 WT HYP 3.353 0.2704 17 17 D3 : WT HYPvs. Chance level t(16)=0,5439 0.594 - - - -
D4 WT HYP 4.176 0.2606 17 17 D4 : WT HYP vs. Chance level t(16)=2,596 0.0195 - - - -
D5 WT HYP 3.588 0.3644 17 17 D5 : WT HYP vs. Chance level t(16)=0,2421 0.8117 - - - -
D6 WT HYP 3.941 0.3685 17 17 D6 : WT HYP vs. Chance level t(16)=1,197 0.2487 - - - -
D7 WT HYP 5 0.3835 17 17 D7 : WT HYP vs. Chance level t(16)=3,912 0.0012 - - - -
D8 WT HYP 4.941 0.3262 17 17 D8 : WT HYP vs. Chance level t(16)=4,418 0.0004 - - - -
D9 WT HYP 5.882 0.2556 17 17 D9 : WT HYP vs. Chance level t(16)=9,322 < 0,0001 - - - -
D10 WT HYP 5.412 0.3328 17 17 D10 : WT HYP vs. Chance level t(16)=5,745 < 0,0001 - - - -
3.500
D1 Scn1aRH/+ SIH 3 0.2915 18 18 D1 : Scn1aRH/+ SIH vs. Chance level t(17)=1,715 0.1045 - - - -
D2 Scn1aRH/+ SIH 3.778 0.2977 18 18 D2 : Scn1aRH/+ SIH vs. Chance level t(17)=0,9332 0.3638 - - - -
D3 Scn1aRH/+ SIH 3.278 0.2532 18 18 D3 :Scn1aRH/+ SIHvs. Chance level t(17)=0,8778 0.3923 - - - -
D4 Scn1aRH/+ SIH 4.111 0.3223 18 18 D4 : Scn1aRH/+ SIHvs. Chance level t(17)=1,896 0.075 - - - -
D5 Scn1aRH/+ SIH 3.222 0.384 18 18 D5 : Scn1aRH/+ SIH vs. Chance level t(17)=0,7235 0.4792 - - - -
D6 Scn1aRH/+ SIH 3.333 0.2425 18 18 D6 : Scn1aRH/+ SIHvs. Chance level t(17)=0,6872 0.5012 - - - -
D7 Scn1aRH/+ SIH 3.889 0.3419 18 18 D7 :Scn1aRH/+ SIH vs. Chance level t(17)=1,137 0.2712 - - - -
D8 Scn1aRH/+ SIH 4.111 0.2668 18 18 D8 : Scn1aRH/+ SIH vs. Chance level t(17)=2,291 0.035 - - - -
D9 Scn1aRH/+ SIH 3.833 0.3547 18 18 D9 : Scn1aRH/+ SIH vs. Chance level t(17)=0,9397 0.3605 - - - -
D10 Scn1aRH/+ SIH 4.167 0.2712 18 18 D10 : Scn1aRH/+ SIH vs. Chance level t(17)=2,459 0.025 - - - -
3.500
Nu
mb
er
of
co
rrect
ch
oic
es
D1
Two-Way
RM ANOVA
D2
D3
D4
D5
F (3, 60) = 6,860Group (Treatment-genotype)
D6
D7
D8
D9
D10
One
sample t-
test
Tuckey's
Tuckey's
Tuckey's
Tuckey's
0.0005 Tuckey's
Tuckey's
Dif
fere
nces t
o c
han
ce level
Chance level
Chance level
Chance level
Chance level
One
sample t-
test
One
sample t-
test
One
sample t-
test
Tuckey's
Tuckey's
Tuckey's
Tuckey's
Interaction F (27, 540) = 1,922 0.0038
< 0,0001F (9, 540) = 18,75Training Day
Rad
ial M
aze
Scn1aR
H/+
-129:B
6S
cn1aR
H/+
-129:B
6
Rad
ial M
aze
41
41
Radial Maze in Scn1aRH/+ -129:B6
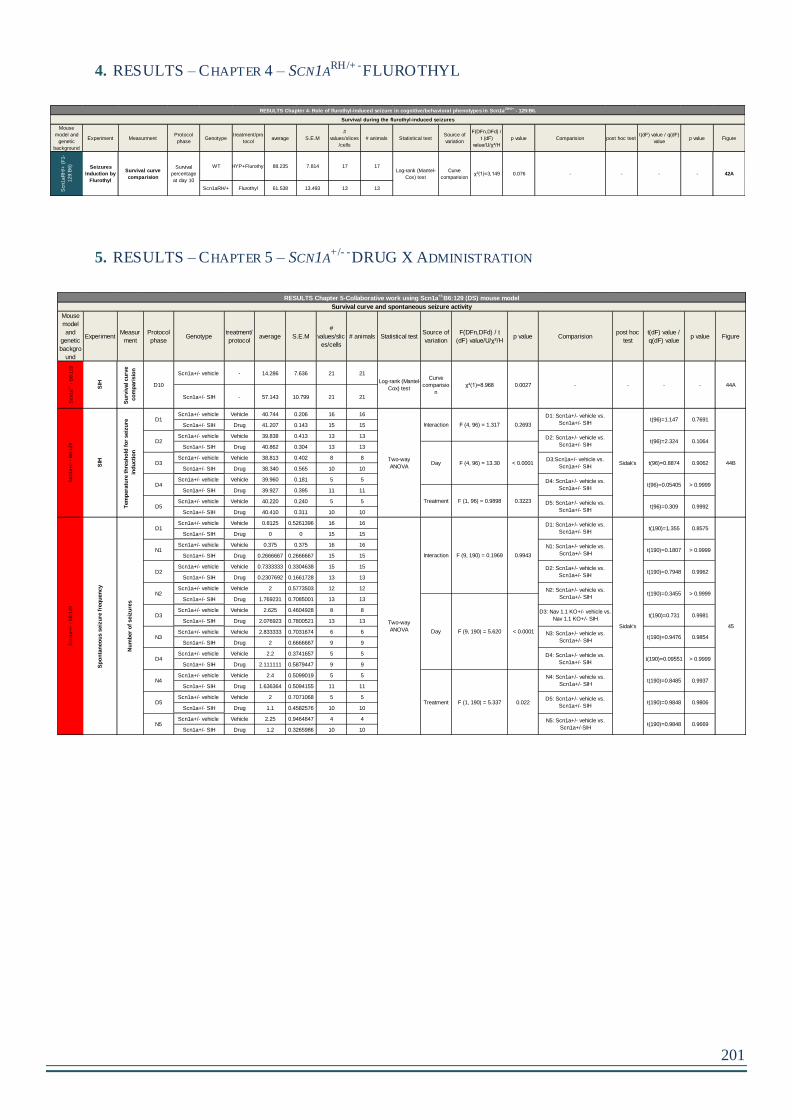
201
4. RESULTS – CHAPTER 4 – SCN1ARH/+ -FLUROTHYL
5. RESULTS – CHAPTER 5 – SCN1A+/- -DRUG X ADMINISTRATION
Mouse
model and
genetic
background
Experiment MeasurmentProtocol
phaseGenotype
treatment/pro
tocolaverage S.E.M
#
values/slices
/cells
# animals Statistical testSource of
variation
F(DFn,DFd) /
t (dF)
value/U/χ²/H
p value Comparision post hoc testt(dF) value / q(dF)
valuep value Figure
WT HYP+Flurothyl 88.235 7.814 17 17
Scn1aRH/+ Flurothyl 61.538 13.493 13 13Scn1aR
H/+
(F
1-
129:B
6)
Seizures
Induction by
Flurothyl
Survival curve
comparision
Survival
percentage
at day 10
Log-rank (Mantel-
Cox) test
Curve
comparision42Aχ²(1)=3,149 0.076 - - - -
RESULTS Chapter 4- Role of flurothyl-induced seizure in cognitive/behavioral phenotypes in Scn1a RH/+ - 129:B6.
Survival during the flurothyl-induced seizures
Mouse
model
and
genetic
backgro
und
ExperimentMeasur
ment
Protocol
phaseGenotype
treatment/
protocolaverage S.E.M
#
values/slic
es/cells
# animals Statistical testSource of
variation
F(DFn,DFd) / t
(dF) value/U/χ²/Hp value Comparision
post hoc
test
t(dF) value /
q(dF) valuep value Figure
Scn1a+/- vehicle - 14.286 7.636 21 21
Scn1a+/- SIH - 57.143 10.799 21 21
Scn1a+/- vehicle Vehicle 40.744 0.206 16 16
Scn1a+/- SIH Drug 41.207 0.143 15 15
Scn1a+/- vehicle Vehicle 39.838 0.413 13 13
Scn1a+/- SIH Drug 40.862 0.304 13 13
Scn1a+/- vehicle Vehicle 38.813 0.402 8 8
Scn1a+/- SIH Drug 38.340 0.565 10 10
Scn1a+/- vehicle Vehicle 39.960 0.181 5 5
Scn1a+/- SIH Drug 39.927 0.395 11 11
Scn1a+/- vehicle Vehicle 40.220 0.240 5 5
Scn1a+/- SIH Drug 40.410 0.311 10 10
Scn1a+/- vehicle Vehicle 0.8125 0.5261396 16 16
Scn1a+/- SIH Drug 0 0 15 15
Scn1a+/- vehicle Vehicle 0.375 0.375 16 16
Scn1a+/- SIH Drug 0.2666667 0.2666667 15 15
Scn1a+/- vehicle Vehicle 0.7333333 0.3304638 15 15
Scn1a+/- SIH Drug 0.2307692 0.1661728 13 13
Scn1a+/- vehicle Vehicle 2 0.5773503 12 12
Scn1a+/- SIH Drug 1.769231 0.7085001 13 13
Scn1a+/- vehicle Vehicle 2.625 0.4604928 8 8
Scn1a+/- SIH Drug 2.076923 0.7800521 13 13
Scn1a+/- vehicle Vehicle 2.833333 0.7031674 6 6
Scn1a+/- SIH Drug 2 0.6666667 9 9
Scn1a+/- vehicle Vehicle 2.2 0.3741657 5 5
Scn1a+/- SIH Drug 2.111111 0.5879447 9 9
Scn1a+/- vehicle Vehicle 2.4 0.5099019 5 5
Scn1a+/- SIH Drug 1.636364 0.5094155 11 11
Scn1a+/- vehicle Vehicle 2 0.7071068 5 5
Scn1a+/- SIH Drug 1.1 0.4582576 10 10
Scn1a+/- vehicle Vehicle 2.25 0.9464847 4 4
Scn1a+/- SIH Drug 1.2 0.3265986 10 10
D10
0.2693
Two-way
ANOVA
D5: Scn1a+/- vehicle vs.
Scn1a+/- SIH
D4: Scn1a+/- vehicle vs.
Scn1a+/- SIH
D3:Scn1a+/- vehicle vs.
Scn1a+/- SIH
D1D1: Scn1a+/- vehicle vs.
Scn1a+/- SIH
N1N1: Scn1a+/- vehicle vs.
Scn1a+/- SIH
D1
D2
D3
D4
D5
N4
D5
N5
0.9981
Two-way
ANOVA
0.9943
< 0.0001
0.022
N3: Scn1a+/- vehicle vs.
Scn1a+/- SIH
D4: Scn1a+/- vehicle vs.
Scn1a+/- SIH
0.9854
> 0.9999
0.9937
0.9806
0.9669
0.9962
> 0.9999N2N2: Scn1a+/- vehicle vs.
Scn1a+/- SIH
D3D3: Nav 1.1 KO+/- vehicle vs.
Nav 1.1 KO+/- SIH
D2D2: Scn1a+/- vehicle vs.
Scn1a+/- SIH
F (9, 190) = 0.1969
45
0.8575
> 0.9999
< 0.0001
0.3223
Sidak's
0.9992
> 0.9999
0.9062
0.1064
t(190)=0.9848
t(190)=0.7948
t(190)=0.3455
t(190)=0.731
Sidak's
t(190)=0.09551
t(190)=0.8485
t(190)=0.9848F (1, 190) = 5.337
Survival curve and spontaneous seizure activity
RESULTS Chapter 5-Collaborative work using Scn1a+/-
B6:129 (DS) mouse model
44A
44B
0.7691
Tem
pera
ture
th
resh
old
fo
r seiz
ure
ind
ucti
on
D2: Scn1a+/- vehicle vs.
Scn1a+/- SIH
D1: Scn1a+/- vehicle vs.
Scn1a+/- SIH
SIH
Curve
comparisio
n
χ²(1)=8.968 0.0027
Interaction
Day
Treatment
F (4, 96) = 1.317
Scn1a
+/-
- B
6:1
29
SIH
Su
rviv
al cu
rve
co
mp
ari
sio
n
Log-rank (Mantel-
Cox) test
t(96)=1.147
Scn1a+
/- -
B6:1
29
-
Sp
on
tan
eo
us s
eiz
ure
fre
qu
en
cy
- - -
Scn1a+
/- -
B6:1
29
t(190)=0.9476
F (1, 96) = 0.9898t(96)=0.309
t(96)=0.05405
t(96)=0.8874
t(96)=2.324
t(190)=1.355
t(190)=0.1807
F (4, 96) = 13.30
Nu
mb
er
of
seiz
ure
s
N3
D4
N4: Scn1a+/- vehicle vs.
Scn1a+/- SIH
D5: Scn1a+/- vehicle vs.
Scn1a+/- SIH
N5: Scn1a+/- vehicle vs.
Scn1a+/-SIH
Day
Treatment
Interaction
F (9, 190) = 5.620


RÉSUMÉ
Les mutations du gène SCN1A, codant pour le canal sodique de type 1 potentiel-
dépendant (Nav1.1), sont impliquées dans plusieurs formes d'épilepsie du nourrisson,
comme le Syndrome de Dravet (SD), une épilepsie rare et pharmaco-résistante ou
l’Epilepsie généralisée avec crises fébriles plus (GEFS+), une épilepsie plus légère.
GEFS+ et SD sont associés à des crises épileptiques fébriles dès l’âge de 6 mois. Le SD
constitue la forme la plus grave où l’on voit apparaitre des retards mentaux mais
également des déficits moteurs, visuels, langagiers et mnésiques au cours de l’évolution
de la maladie. L’impact des crises épileptiques au cours de la petite enfance sur ces
déficits cognitifs n’est pas connu. Jusqu'à présent, le SD était considéré comme étant
une encéphalopathie épileptique où les crises étaient les principales responsables du
phénotype à l’âge adulte. Cependant, récemment, un rôle potentiel de la mutation dans
les troubles cognitifs a été mis en évidence changeant a priori la définition de SD
d’encéphalopathie épileptique à une canalopathie (Bender et al., 2013, 2016; Han et al.,
2012a). Notre projet adresse la question suivante: Quel est le rôle des crises épileptiques
répétées présentées par les enfants SD sur les fonctions cognitives à l’âge adulte? Pour
cela nous avons utilisé un modèle murin de la maladie portant une mutation faux-sens
du gène Scn1a (R1648H), et qui présente une pathologie très légère. Nous avons induit
des crises épileptiques par hyperthermie à l’âge de 21 jours pendant 10 jours et testé les
effets à long-terme sur ces animaux à l’âge adulte. Nos résultats révèlent que l’induction
de crises épileptiques par hyperthermie induit une hyperactivité, des altérations dans les
interactions sociales et des déficits en mémoire hippocampo-dépendante et cortex
préfronto-dépendante. Ces modifications comportementales sont associées à des
modifications de l’électrocorticogramme avec apparition de crises spontanées et à
d’importantes modifications de l’excitabilité neuronale intrinsèque dans l’hippocampe.
Même si le rôle possible du canal NaV1.1 dans le dysfonctionnement neuronal et l’effet
des crises répétées ne sont probablement pas mutuellement distinctes, l’induction de
crises répétées à un jeune âge semble donc suffisante pour convertir un modèle léger
portant la mutation du gène Scn1a en un modèle sévère. Ainsi nous avons mis en
évidence que les crises épileptiques répétées pendant le développement ont un fort
impact sur la fonction cérébrale et qu’il est donc capital de les prévenir afin de
diminuer, voir de prévenir, ces déficits.