Determinants of asthma phenotypes in supermarket bakery workers
9
Determinants of asthma phenotypes in supermarket bakery workers R. Baatjies* ,# , A.L. Lopata ",+ , I. Sander 1 , M. Raulf-Heimsoth 1 , E.D. Bateman e , T. Meijster** ,## , D. Heederik ## , T.G. Robins "" and M.F. Jeebhay* ABSTRACT: While baker’s asthma has been well described, various asthma phenotypes in bakery workers have yet to be characterised. Our study aims to describe the asthma phenotypes in supermarket bakery workers in relation to host risk factors and self-reported exposure to flour dust. A cross-sectional study of 517 supermarket bakery workers in 31 bakeries used a questionnaire, skin prick tests, and specific immunoglobulin E to wheat, rye and fungal a- amylase and methacholine challenge testing. The prevalence of probable occupational asthma (OA, 13%) was higher than atopic (6%), nonatopic (6%) and work-aggravated asthma (WAA, 3%) phenotypes. Previous episodes of high exposure to dusts, fumes and vapours causing asthma symptoms were more strongly associated with WAA (OR 5.8, 95% CI 1.7–19.2) than OA (2.8, 1.4–5.5). Work-related ocular–nasal symptoms were significantly associated with WAA (4.3, 1.3–13.8) and OA (3.1, 1.8–5.5). Bakers with OA had an increased odds ratio of reporting adverse reactions to ingested grain products (6.4, 2.0–19.8). OA is the most common phenotype among supermarket bakery workers. Analysis of risk factors contributes to defining clinical phenotypes, which will guide ongoing medical surveillance and clinical management of bakery workers. KEYWORDS: Asthma phenotypes, bakery workers, determinants, risk factors, work-related asthma I t is well documented that exposure to flour dust increases the risk of respiratory diseases, particularly occupational asthma (OA). Studies conducted among bakery workers have reported the prevalence of baker’s asthma to be 5–17% [1]. Asthma is commonly due to sensitisation to wheat, rye and fungal a-amylase allergens present in flour. Asthma is generally not considered to be a single disease but rather a syndrome comprising a common set of symptoms. Different phenotypes of asthma are distinguished by variations in clinical features, trigger factors and differences in immu- nological and pathophysiological characteristics [2]. Age of onset, high numbers of eosinophils in the airways, atopic status, family history of asthma, early exposure to allergens and exposure to inhalation accidents (exposure to high levels of vapours, gas, dust or fumes) are important predictors of adult asthma phenotypes [2, 3]. While baker’s asthma has been well described in various workplaces, phenotypes of asthma among bakery workers in a common workplace setting have yet to be characterised. An evaluation of employment patterns in the baking industry worldwide over the past decade has demonstrated a significant rise in franchise (in-store) bakeries [4]. In South Africa, in-fran- chise employment has risen from 20% of all employment in the baking industry in 1995 to 44% in 2002 [5]. This shift has increased the potential for workers to develop baker’s allergy and asthma. The aim of our study is to describe various asthma phenotypes observed in supermarket bakery workers of a large chain store in relation to host risk factors and self-reported exposures to flour dust. Our study is part of a larger prospective inter- vention study aimed at reducing sensitisation to flour dust allergens in supermarket bakers. A detailed baseline environmental exposure assess- ment study was also conducted and is the subject of a separate communication. MATERIALS AND METHODS Study design, population and sampling A cross-sectional study was conducted on 517 workers currently employed in all 31 bakeries belonging to a supermarket chain store in the Western Cape province of South Africa during AFFILIATIONS *Centre for Occupational and Environmental Health Research Unit, School of Public Health and Family Medicine, University of Cape Town, " Division of Immunology, IIDMM, Faculty of Health Sciences, University of Cape Town, e University of Cape Town Lung Institute, # Dept of Environmental and Occupational Studies, Faculty of Applied Sciences, Cape Peninsula University of Technology, Cape Town, South Africa, + Royal Melbourne Institute of Technology, Allergy Research Group, Melbourne, Australia. 1 BGFA – Research Institute of Occupational Medicine, German Social Accident Insurance, Ruhr University Bochum, Bochum, Germany. **Dept of Food and Chemical Risk Analysis, TNO Quality of Life, Zeist, ## Institute for Risk Assessment Sciences, Utrecht University, Utrecht, The Netherlands. "" Dept of Environmental Health Sciences, University of Michigan, Ann Arbor, MI, USA. CORRESPONDENCE M.F. Jeebhay, Centre for Occupational and Environmental Health Research Unit, School of Public Health and Family Medicine, University of Cape Town, Room 4.44, Fourth Level, Falmouth Building, Anzio Road, Observatory, 7925 South Africa E-mail: Mohamed.Jeebhay@ uct.ac.za Received: Oct 30 2008 Accepted after revision: March 12 2009 First published online: May 14 2009 European Respiratory Journal Print ISSN 0903-1936 Online ISSN 1399-3003 EUROPEAN RESPIRATORY JOURNAL VOLUME 34 NUMBER 4 825 Eur Respir J 2009; 34: 825–833 DOI: 10.1183/09031936.00164408 CopyrightßERS Journals Ltd 2009 c
-
Upload
independent -
Category
Documents
-
view
1 -
download
0
Transcript of Determinants of asthma phenotypes in supermarket bakery workers

Determinants of asthma phenotypes in
supermarket bakery workersR. Baatjies*,#, A.L. Lopata",+, I. Sander1, M. Raulf-Heimsoth1, E.D. Batemane,T. Meijster**,##, D. Heederik##, T.G. Robins"" and M.F. Jeebhay*
ABSTRACT: While baker’s asthma has been well described, various asthma phenotypes in
bakery workers have yet to be characterised. Our study aims to describe the asthma phenotypes
in supermarket bakery workers in relation to host risk factors and self-reported exposure to flour
dust.
A cross-sectional study of 517 supermarket bakery workers in 31 bakeries used a
questionnaire, skin prick tests, and specific immunoglobulin E to wheat, rye and fungal a-
amylase and methacholine challenge testing.
The prevalence of probable occupational asthma (OA, 13%) was higher than atopic (6%),
nonatopic (6%) and work-aggravated asthma (WAA, 3%) phenotypes. Previous episodes of high
exposure to dusts, fumes and vapours causing asthma symptoms were more strongly associated
with WAA (OR 5.8, 95% CI 1.7–19.2) than OA (2.8, 1.4–5.5). Work-related ocular–nasal symptoms
were significantly associated with WAA (4.3, 1.3–13.8) and OA (3.1, 1.8–5.5). Bakers with OA had
an increased odds ratio of reporting adverse reactions to ingested grain products (6.4, 2.0–19.8).
OA is the most common phenotype among supermarket bakery workers. Analysis of risk factors
contributes to defining clinical phenotypes, which will guide ongoing medical surveillance and
clinical management of bakery workers.
KEYWORDS: Asthma phenotypes, bakery workers, determinants, risk factors, work-related
asthma
It is well documented that exposure to flourdust increases the risk of respiratory diseases,particularly occupational asthma (OA). Studies
conducted among bakery workers have reportedthe prevalence of baker’s asthma to be 5–17% [1].Asthma is commonly due to sensitisation to wheat,rye and fungal a-amylase allergens present in flour.
Asthma is generally not considered to be a singledisease but rather a syndrome comprising acommon set of symptoms. Different phenotypesof asthma are distinguished by variations in clinicalfeatures, trigger factors and differences in immu-nological and pathophysiological characteristics[2]. Age of onset, high numbers of eosinophils inthe airways, atopic status, family history of asthma,early exposure to allergens and exposure toinhalation accidents (exposure to high levels ofvapours, gas, dust or fumes) are importantpredictors of adult asthma phenotypes [2, 3].While baker’s asthma has been well described invarious workplaces, phenotypes of asthma amongbakery workers in a common workplace settinghave yet to be characterised.
An evaluation of employment patterns in thebaking industry worldwide over the past decade
has demonstrated a significant rise in franchise(in-store) bakeries [4]. In South Africa, in-fran-chise employment has risen from 20% of allemployment in the baking industry in 1995 to44% in 2002 [5]. This shift has increased thepotential for workers to develop baker’s allergyand asthma.
The aim of our study is to describe variousasthma phenotypes observed in supermarketbakery workers of a large chain store in relationto host risk factors and self-reported exposures toflour dust.
Our study is part of a larger prospective inter-vention study aimed at reducing sensitisation toflour dust allergens in supermarket bakers. Adetailed baseline environmental exposure assess-ment study was also conducted and is the subjectof a separate communication.
MATERIALS AND METHODSStudy design, population and samplingA cross-sectional study was conducted on 517workers currently employed in all 31 bakeriesbelonging to a supermarket chain store in theWestern Cape province of South Africa during
AFFILIATIONS
*Centre for Occupational and
Environmental Health Research Unit,
School of Public Health and Family
Medicine, University of Cape Town,"Division of Immunology, IIDMM,
Faculty of Health Sciences,
University of Cape Town,eUniversity of Cape Town Lung
Institute,#Dept of Environmental and
Occupational Studies, Faculty of
Applied Sciences, Cape Peninsula
University of Technology, Cape Town,
South Africa,+Royal Melbourne Institute of
Technology, Allergy Research Group,
Melbourne, Australia.1BGFA – Research Institute of
Occupational Medicine, German
Social Accident Insurance, Ruhr
University Bochum, Bochum,
Germany.
**Dept of Food and Chemical Risk
Analysis, TNO Quality of Life, Zeist,##Institute for Risk Assessment
Sciences, Utrecht University, Utrecht,
The Netherlands.""Dept of Environmental Health
Sciences, University of Michigan,
Ann Arbor, MI, USA.
CORRESPONDENCE
M.F. Jeebhay, Centre for
Occupational and Environmental
Health Research Unit, School of
Public Health and Family Medicine,
University of Cape Town, Room 4.44,
Fourth Level, Falmouth Building,
Anzio Road, Observatory, 7925 South
Africa
E-mail: Mohamed.Jeebhay@
uct.ac.za
Received:
Oct 30 2008
Accepted after revision:
March 12 2009
First published online:
May 14 2009
European Respiratory Journal
Print ISSN 0903-1936
Online ISSN 1399-3003
EUROPEAN RESPIRATORY JOURNAL VOLUME 34 NUMBER 4 825
Eur Respir J 2009; 34: 825–833
DOI: 10.1183/09031936.00164408
Copyright�ERS Journals Ltd 2009
c
the period June 2003 to June 2004. All permanent (n5318) andcasual workers (n5168) in the bakery and ex-bakers withasthma moved from the bakery section 2 yrs prior to our study(n531) were investigated. The protocol was approved by theUniversity of Cape Town (Cape Town, South Africa) and theInstitutional Review Board of the University of Michigan (AnnArbour, MI, USA) prior to the study being conducted.
QuestionnaireEach worker completed the standard European CommunityRespiratory Health Survey (ECRHS) questionnaire [6] designedfor the investigation of asthma. Additional questions relating tocurrent and previous employment and degrees of exposure toflour dust and tobacco smoke were included. Smoking statuswas classified into the following three categories: never-smoker(lifelong abstinence), ex-smoker (defined as having quitcompletely .1 month prior to the survey) and current smoker.Self-reported high exposures were ascertained based on apositive response to the question: ‘‘Has there ever been aninstance when you inhaled a large amount of vapour, gas, dustor fumes in any of these jobs that resulted in you developing atight chest, wheeze or cough?’’. Also included were questionson domestic flour dust exposures and, in particular, the practiceand frequency of baking activities in the home. For the purposesof our study, ocular–nasal symptoms were defined as a positiveresponse to the question: ‘‘Have you ever had any nose or eyeproblems or allergies such as hay fever?’’. Upper and lowerairway symptoms were considered to be work-related if theywere reported to worsen during the work shift and improvewhen away from work. Ingestion-related adverse reactionswere assessed based on responses to the question: ‘‘Have youchanged your diet or avoided certain grain products (e.g.wheat/rye/soya) because they do not agree with you when youeat them?’’.
Immunological tests
Skin prick tests
Skin prick tests (SPTs) were performed using the followingstandard common local aeroallergens (ALK-Abello A/S,Horsholm, Denmark): house dust mite (Dermatophagoidespteronyssinus), bermuda grass (Cynodon dactylon), rye grass(Lolium perenne), grass mix (Pollen III: Avena, Hordeum,Triticum, Secale), cockroach (Blattella germanica), cat (Felisdomesticus), dog (Canis familiaris), mould mix (Cladosporiumherbarum, Alternaria alternata, Fusarium) and Aspergillus(Aspergillus fumigatus). Commercially available SPTs of flours(wheat, rye, oat grain and barley grain) (Bencard, Neuss,Germany), soya and corn flour (Leti Alergia, Madrid, Spain),peanut and storage mite (Lepidoglyphus destructor), and fungala-amylase (ALK-Abello) were also used. For the analysis ofcorrelations between various allergens, SPT reactivity wasexpressed as the allergen histamine wheal ratio, i.e. the meanwheal diameter at the allergen site divided by the mean whealdiameter at the histamine site [7]. A positive SPT was regardedas a wheal read 15 min after testing that had a diameter (meanof two perpendicular measures) of o3 mm more than thenegative control. Areas of wheal were traced on clear tape andstored for later measurement. For the purposes of our study,atopy was considered to be present if the SPT to one or morecommon aeroallergens was positive.
Serum-specific immunoglobulin ESerum-specific immunoglobulin (Ig) E levels were measured in513 workers. The presence of atopy in workers who did notundergo SPTs (n510) was defined by a positive Phadiatop1
test (ImmunoCAP 100 System; Phadia, Uppsala, Sweden).Quantification of specific IgE antibodies to wheat (f4), rye (f5)and fungal a-amylase (k87) was performed using CAP-FEIA(fluorescence enzyme immunoassay) according to the manu-facturer’s instructions (Phadia). An ImmunoCAP result of.0.35 kU?L-1 was regarded as positive.
SpirometrySpirometry was performed using the Jaeger Aerosol ProvocationSystem (APS) Pro apparatus according to American ThoracicSociety guidelines [8]. Workers were required to refrain fromsmoking for 1 h, from using short-acting b2-agonist bronchodi-lators for 4 h, and from using oral asthma medications for 8 hprior to lung function testing. None were on long-actingbronchodilators. Pulmonary function reference values of theEuropean Community for Coal and Steel with lower limitscorresponding to the 95th percentile were used where appro-priate, and the locally derived reference equation for SouthAfrican university workers was applied [9, 10].
Methacholine challenge testingMethacholine challenge testing was performed on all workersby trained technologists according to an abbreviated protocolused in epidemiological surveys. The Medic Aid Pro Nebulizerdosimeter method involved a protocol of increasing numbersof breaths to achieve pre-defined cumulative doses ofmethacholine [11]. The doses were delivered by the JaegerAPS MedicAid Side Stream APS-Nebulizer (Sensormedics, CA,USA) according to the manufacturer’s instructions, commen-cing with the lowest dose of 0.026 mg. The dose was increasedto a maximum dose of 2.048 mg methacholine (the provocativedose of methacholine causing a o20% fall in forced expiratoryvolume in 1 s (FEV1); PD20 methacholine) if a positive end-point was not obtained. The results of the methacholinechallenge test were interpreted as follows: borderline 5 0.4 mg, PD20 methacholine ,1.0 mg; mild 5 0.08 mg . PD20
methacholine ,0.4 mg; moderate/severe 5 PD20 methacho-line ,0.08 mg. Borderline values for PD20 methacholine wereconsidered negative in the definition of nonspecific bronchialhyperresponsiveness (NSBH). These cut-offs for the APSsystem were based on the results from a validation studyperformed on 40 hyperresponsive bakery workers. This studyconfirmed a satisfactory correlation between the APS cumula-tive PD20 methacholine method and the standard VMAX(Sensormedics) method [11].
In subjects in whom PD20 methacholine was contraindicated,such as those with acute asthma symptoms or a baseline FEV1
,1.5 L or FEV1 ,70% predicted, a bronchodilator (400 mgsalbutamol dose) was administered instead. A change in FEV1
of o12% pred 10 min after administration of bronchodilatorwas considered suggestive of NSBH.
Among the 503 subjects who underwent normal spirometry,422 performed interpretable PD20 methacholine results. Twosubjects were unable to produce reproducible FEV1 man-oeuvres, 38 subjects underwent bronchodilator challenge (post-bronchodilator), since PD20 methacholine was contraindicated,
ASTHMA AND ALLERGY R. BAATJIES ET AL.
826 VOLUME 34 NUMBER 4 EUROPEAN RESPIRATORY JOURNAL

and 43 subjects had o10% decrease in FEV1 after administra-tion of saline diluent, and were therefore not considered forPD20 methacholine. The PD20 methacholine was discontinuedin three subjects; one requested the test to be stopped, and intwo subjects the test was stopped because of technicalproblems.
Operational definitions of asthma phenotypesAtopic asthma (AA) was defined as either having an asthmaattack or use of asthma medication in the past 12 months orpresence of NSBH, the presence of atopy, and the absence ofsensitisation to bakery dust allergens [3].
Nonatopic asthma (NAA) was defined as either having anasthma attack or use of asthma medication in the past12 months or the presence of NSBH, being nonatopic, andthe absence of sensitisation to bakery dust allergens.
Work-aggravated asthma (WAA) was defined as either havingan asthma attack or use of asthma medication in the past12 months or the presence of NSBH, work-related chestsymptoms, and the absence of sensitisation to bakery dustallergens.
Probable occupational asthma was defined as either having anasthma attack or use of asthma medication in the past12 months or the presence of NSBH, and sensitisation tobakery dust allergens [12].
Sensitivity to bakery dust allergens was defined as either apositive SPT to any cereal allergen (wheat, rye, oats, barley,soya or corn) or elevated serum IgE to wheat, rye or a-amylase.
Statistical analysisStatistical analysis was performed using STATA version 8(StataCorp, College Station, TX, USA). Both continuous andcategorical analyses were conducted. Key associations ofinterest were the relationships between host factor attributes(e.g. age, sex, smoking, past medical history, ingestion-relatedreactions to grain products and adult-onset asthma), and self-reported occupational exposures with asthma phenotypes.Multivariate logistic regression models adjusted for age, sexand smoking were used to determine the relationship betweenindividual asthma phenotypes and predictor variables.
RESULTSStudy populationA total of 517 workers from all 31 stores participated in ourstudy. The demographic characteristics of the study popula-tion are outlined in table 1. Almost half the participants (47%)were current smokers, with an average of 5 pack-yrs smokinghistory. Of the currently employed workers, 41% were bakersor assistant bakers, 27% counterhands and 10% confectioners.Among the workers with self-reported adverse reactions tograin products, a larger proportion (63%) attributed this to ryeproducts.
Immunological characteristicsThe prevalence of sensitisation to common inhalants were asfollows: house dust mite (D. pteronyssinus), 33%; rye grass (L.perenne), 20%; grass mix (Pollen III), 18%; cockroach (B. germanica),11%; bermuda grass (C. dactylon), 10%; dog (C. familiaris), 8%;mould mix (Cladosporium, A. alternate, Fusarium), 7%; cat
(F. domesticus), 4%; and aspergillus (A. fumigatus), 3%. The overallprevalence of atopy, defined as a positive SPT to one or morecommon aeroallergens, was 42%, while 12% were positive tomore than three aeroallergens. The prevalence of sensitisation toany of the bakery dust allergens was 33% (table 2). The mostcommon sensitisers on SPT were cereal flours wheat (16%) andrye (16%). However, higher proportions of workers (26 and 24%to wheat and rye flours, respectively) had elevated IgE levels toflours, but the prevalence of elevated IgE to a-amylase remainedlow (4%). A high degree of correlation was found for subjectssensitised to a number of the various cereal flours, especiallywheat, rye, barley and corn flour (Spearman’s r50.67–0.75,p,0.001). Comparison of wheat SPT versus wheat IgE, as well asrye SPT versus rye IgE, showed a high degree of correlation(Spearman’s r50.71–0.73, p,0.0001) between these two indices ofallergic sensitisation with the kappa statistic demonstrating
TABLE 1 Demographic characteristics of supermarketbakery workers
Demographic characteristics
Subjects n 517
Age yrs 32¡9
Sex F:M 51:49
Smoking status
Current smokers 47
Ex-smokers 10
Never-smokers 43
History of current smokers pack-yrs 5
Occupation
Baker/assistant baker 41
Counterhand 27
Confectioner 10
Manager 6
Supervisor 6
Ex-baker# 6
General worker 3
Cleaner 1
Duration of employment in bakery yrs 6¡5
Duration of employment in current job yrs 4¡4
Past history of lung disease (self-reported)
Repeated childhood chest infections 5
Previous treatment for tuberculosis 7
Previous treatment for chronic bronchitis 5
Family history of atopy" 54
Self-reported adverse reactions to grain products+ 3
Rye products 631
Whole-wheat products 191
White bread 121
Breakfast cereals 61
Baking activities at home 38
Training received on health risks of flour dust 8
Data are presented as % or mean¡SD, unless otherwise indicated. F: female;
M: male. #: removed from the bakery in the last 2 yrs due to baker’s asthma; ":
defined as positive answer to the question ‘‘Does any member of your family
(blood relatives) have any kind of allergies (e.g. hay fever, eczema, asthma)?’’;+: n516; 1: as a proportion of the sub-group (n516).
R. BAATJIES ET AL. ASTHMA AND ALLERGY
cEUROPEAN RESPIRATORY JOURNAL VOLUME 34 NUMBER 4 827

moderate to substantial agreement (kappa50.55–0.64) betweenthe tests. Workers sensitised to more than three aeroallergenswere more likely to be sensitised to occupational allergens (OR9.5, 95% CI 4.9–18.2).
Respiratory symptomsThe prevalence of work-related ocular–nasal symptoms (31%)was higher than work-related chest symptoms (17%; table 3).Over half the workers with doctor-diagnosed asthma (13%)reported adult-onset asthma, and 38% of these reported currentocular–nasal symptoms. 30 (6%) workers reported job changesprompted by work-related chest symptoms. Of these, 14 hadworked as bakers/assistant bakers, 10 as counterhands, four asconfectioners and two as a supervisor/controller prior to beingrelocated. A significantly higher proportion of females hadshortness of breath (10%), current asthma treatment or attacks(9%), but a lower proportion (8%) reported symptoms associatedwith episodes of high exposure to flour dust. An evaluation of thesensitivity and specificity of the questionnaire to predict asthmaand, more specifically, OA revealed that work-related chestsymptoms were highly specific (89%) for both outcomes, butwere not very sensitive (31–43%) in accurately predicting thepresence of NSBH and OA, respectively.
Pulmonary function and NSBHThe results of pulmonary function and nonspecific bronchialchallenge tests are presented in table 4. Using EuropeanCommunity of Coal and Steel reference values, 17% of workershad an FEV1 of ,80% pred, while only 7% had evidence ofairflow obstruction defined as a pre-bronchodilator FEV1/forcedvital capacity (FVC) ratio of ,0.70. Using an alternative set of
reference values according to WHITE et al. [10], the prevalence ofFEV1 ,80% pred was 9%. A total of 22% of workers had evidenceof bronchial hyperresponsiveness (19% positive on the methacho-line challenge test (PD20 methacholine ,0.4 mg)), and 3%positive on the basis of an increase in FEV1 of o12% after
TABLE 2 Allergic sensitisation profiles for potential occupational allergens among supermarket bakery workers
Occupational allergen Allergic sensitisation profiles
Overall Atopic Nonatopic
Total subjects 507 213 294
Skin prick test#
Wheat flour 79 (16) 52 (24) 27 (9)
Rye flour 82 (16) 55 (26) 27 (9)
Corn flour 73 (14) 51 (24) 22 (7)
Barley 59 (12) 40 (19) 19 (6)
Soya 42 (8) 32 (15) 10 (3)
Oats 41 (8) 31 (15) 10 (3)
Storage mite (Lepidoglyphus destructor) 73 (14) 67 (31) 6 (2)
Peanut 30 (6) 28 (13) 2 (1)
Fungal a-amylase 17 (3) 13 (6) 4 (1)
Specific IgE",+
Wheat flour 134 (26) 90 (42) 44 (15)
Rye flour 123 (24) 81 (38) 42 (14)
Fungal a-amylase 21 (4) 15 (7) 6 (2)
At least one bakery dust allergen (any cereal or
amylase)1
172 (33) 113 (52) 59 (20)
Data are presented as n and n (%). Each result represents sensitisation to an individual allergen, with some workers sensitised to more than one allergen. Ig:
immunoglobulin. #: test carried out on 507 subjects; ": test carried out on 513 subjects; +: serum-specific IgE .0.35 kU?L-1; 1: positive on skin prick test and/or elevated
IgE. Note: Chi-squared test between atopic versus nonatopics significant (p,0.0001) for all allergens, except for fungal a-amylase (p,0.01).
TABLE 3 Upper and lower respiratory symptoms amongsupermarket bakery workers
Symptom Prevalence
Subjects n 517
Asthma history
Doctor-diagnosed asthma 67 (13)
,17 yrs 30 (6)
o17 yrs 37 (7)
Current use of asthma medication 36 (7)
Asthma attack in the past year 31 (6)
Work-related asthma symptoms
Episode of high exposure causing tight chest, wheeze
or cough
67 (13)
Work-related chest symptoms 86 (17)
Job change due to work-related chest symptoms 30 (6)
Upper airway symptoms
Ocular–nasal symptoms 196 (38)
Work-related ocular–nasal symptoms 162 (31)
Data are presented as n (%), unless otherwise indicated.
ASTHMA AND ALLERGY R. BAATJIES ET AL.
828 VOLUME 34 NUMBER 4 EUROPEAN RESPIRATORY JOURNAL

bronchodilator), with a further 10% having ‘‘borderline’’ results(PD20 methacholine o0.4 mg and ,1.0 mg).
Correlation between lung function and wheat and rye-specific IgEThere was a significant negative correlation between PD20
methacholine and IgE levels with wheat (Spearman r5 -0.30,p,0.001) and rye (Spearman r5 -0.28, p,0.001) flour. Stratifyingthe IgE data by atopic status revealed similar inverse relation-ships between PD20 methacholine and IgE among atopics(Spearman r5 -0.26, p,0.001) and nonatopics (Spearmanr5 -0.21, p,0.001) for wheat and rye. The degree of airwayobstruction on baseline spirometry (FEV1/FVC) was alsoinversely correlated with wheat IgE (Spearman r5 -0.15,p50.001). However, no correlation was observed between FEV1
and wheat-specific IgE (Spearman r5 -0.07, p50.090). Similarpatterns of association were observed for rye flour (data notshown).
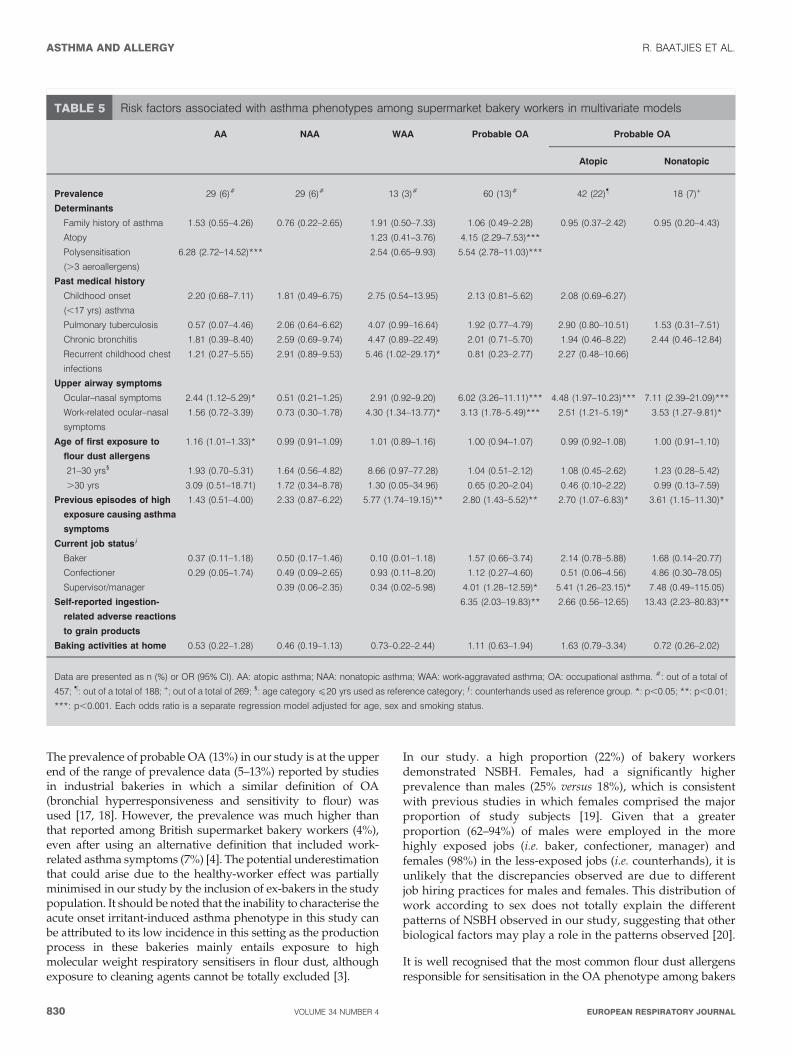
Asthma phenotypes in relation to risk factorsAmong the asthma phenotypes described, the prevalence ofprobable OA (13%) was much higher than AA (6%), NAA (6%)and WAA (3%) phenotypes (table 5). A large proportion (55(92%) out of 60) of workers with OA had NSBH, whilst only 55(12%) workers showed evidence of occupational rhinitiswithout asthma. In the multivariate logistic regression analy-sis, having recurrent chest infections as a child (OR 5.5) wassignificantly associated with WAA. Elevated odds ratios weredemonstrated for the associations between atopy and OA,particularly in individuals with polysensitisation to commonaeroallergens. Previous episodes of high exposure that causedasthma symptoms were associated more strongly withWAA (OR 5.8) than probable OA (OR 2.8). Those with OAwere significantly more likely to be supervisors or managers
(OR 4.0) at the time of the study. There was a six-fold increasedodds (OR 6.4) of self-reported ingestion-related adversereactions to grain products in OA, and more so in the NAAsubgroup. No association was found with baking at home andany of the asthma phenotypes. Using alternative definitions forprobable OA, which included subjective work-related symp-toms in this definition decreased the prevalence to 7%.However, the significant association with predictors of thisphenotype persisted and demonstrated higher odds ratios forocular–nasal symptoms (OR 13.0), previous episodes of highexposure causing asthma symptoms (OR 5.0), as well as self-reported ingestion-related adverse reactions to grain products(OR 13.3).
DISCUSSIONThis study of supermarket bakeries provides a useful insightinto the relative prevalence of and risk factors for differentphenotypes of asthma among workers in this emerging andrelatively poorly regulated industry. Asthma phenotypes weredefined on the basis of clinical asthma, airway hyperrespon-siveness, atopic status and sensitisation to occupationalallergens. This study has demonstrated that the prevalence ofprobable OA (13%) in the industry is considerably higher thanthat of both AA (6%) and NAA (6%) and the WAA phenotype(3%). Furthermore, the overall prevalence of AA in this cohortis at the lower end of the spectrum of adult asthma reported indeveloped countries (8–12%), but higher than the nationalaverage reported for South Africa (4%) [13, 14]. The higherprevalence of asthma observed in this group may be attributedto these bakeries being located in a highly urbanised province(Western Cape), which has a higher population prevalence(8%) of adult asthma [15]. This study also demonstrated that50% of the adult asthma phenotype is atopic, as has beenreported in previous studies [16].
TABLE 4 Pulmonary function indices among supermarket bakery workers
Pulmonary function indices# Overall Males Females p-value
Subjects n 503 243 260
FEV1 L 3.16¡0.77 3.63¡0.71 2.72¡0.52
FVC L 3.83¡0.88 4.45¡0.71 3.25¡0.57
FEV1 % pred 92¡14 91¡14 93¡14 0.002++
FVC % pred 95¡13 94¡12 97¡13 0.055++
FEV1/FVC 83¡9 81¡10 84¡8 0.019++
FEV1/FVC ,70% n 33 (7) 20 (8) 13 (5) 0.14411
FEV1,80% pred n 84 (17) 42 (17) 42 (16) 0.10711
FEV1 ,80% pred" n 43 (9) 25 (10) 18 (7) 0.17711
Bronchial hyperresponsiveness n
o12% FEV1 increase post-bronchodilator+ 16 (3) 7 (3) 9 (3) 0.08611
o10% FEV1 decrease post-saline diluent1 43 (9) 18 (7) 25 (10) 0.26911
Methacholine challenge test PD20 methacholine ,0.4 mge 94 (19) 37 (15) 57 (22) 0.01211
NSBH##,"" 110 (22) 44 (18) 66 (25) 0.03011
Data are presented as mean¡sd or n (%), unless otherwise indicated. FEV1: forced expiratory volume in 1 s; FVC: forced vital capacity; % pred: % predicted; PD20
methacholine: provocative dose of methacholine causing a o20% fall in FEV1; NSBH: nonspecific bronchial hyperresponsiveness. #: pre-bronchodilator values, unless
stated otherwise; ": using the locally derived reference equation for South African university workers; +: 38 completed the test; 1: 465 completed the test; e: 419 completed
the test; ##: 457 completed the test; "": NSBH defined as any of the following two criteria: PD20 methacholine ,0.4 or o12% increase in FEV1 after administration of a
bronchodilator; ++: two-sample unpaired t-test; 11: Chi-squared test with one degree of freedom.
R. BAATJIES ET AL. ASTHMA AND ALLERGY
cEUROPEAN RESPIRATORY JOURNAL VOLUME 34 NUMBER 4 829
The prevalence of probable OA (13%) in our study is at the upperend of the range of prevalence data (5–13%) reported by studiesin industrial bakeries in which a similar definition of OA(bronchial hyperresponsiveness and sensitivity to flour) wasused [17, 18]. However, the prevalence was much higher thanthat reported among British supermarket bakery workers (4%),even after using an alternative definition that included work-related asthma symptoms (7%) [4]. The potential underestimationthat could arise due to the healthy-worker effect was partiallyminimised in our study by the inclusion of ex-bakers in the studypopulation. It should be noted that the inability to characterise theacute onset irritant-induced asthma phenotype in this study canbe attributed to its low incidence in this setting as the productionprocess in these bakeries mainly entails exposure to highmolecular weight respiratory sensitisers in flour dust, althoughexposure to cleaning agents cannot be totally excluded [3].
In our study. a high proportion (22%) of bakery workersdemonstrated NSBH. Females, had a significantly higherprevalence than males (25% versus 18%), which is consistentwith previous studies in which females comprised the majorproportion of study subjects [19]. Given that a greaterproportion (62–94%) of males were employed in the morehighly exposed jobs (i.e. baker, confectioner, manager) andfemales (98%) in the less-exposed jobs (i.e. counterhands), it isunlikely that the discrepancies observed are due to differentjob hiring practices for males and females. This distribution ofwork according to sex does not totally explain the differentpatterns of NSBH observed in our study, suggesting that otherbiological factors may play a role in the patterns observed [20].
It is well recognised that the most common flour dust allergensresponsible for sensitisation in the OA phenotype among bakers
TABLE 5 Risk factors associated with asthma phenotypes among supermarket bakery workers in multivariate models
AA NAA WAA Probable OA Probable OA
Atopic Nonatopic
Prevalence 29 (6)# 29 (6)# 13 (3)# 60 (13)# 42 (22)" 18 (7)+
Determinants
Family history of asthma 1.53 (0.55–4.26) 0.76 (0.22–2.65) 1.91 (0.50–7.33) 1.06 (0.49–2.28) 0.95 (0.37–2.42) 0.95 (0.20–4.43)
Atopy 1.23 (0.41–3.76) 4.15 (2.29–7.53)***
Polysensitisation
(.3 aeroallergens)
6.28 (2.72–14.52)*** 2.54 (0.65–9.93) 5.54 (2.78–11.03)***
Past medical history
Childhood onset
(,17 yrs) asthma
2.20 (0.68–7.11) 1.81 (0.49–6.75) 2.75 (0.54–13.95) 2.13 (0.81–5.62) 2.08 (0.69–6.27)
Pulmonary tuberculosis 0.57 (0.07–4.46) 2.06 (0.64–6.62) 4.07 (0.99–16.64) 1.92 (0.77–4.79) 2.90 (0.80–10.51) 1.53 (0.31–7.51)
Chronic bronchitis 1.81 (0.39–8.40) 2.59 (0.69–9.74) 4.47 (0.89–22.49) 2.01 (0.71–5.70) 1.94 (0.46–8.22) 2.44 (0.46–12.84)
Recurrent childhood chest
infections
1.21 (0.27–5.55) 2.91 (0.89–9.53) 5.46 (1.02–29.17)* 0.81 (0.23–2.77) 2.27 (0.48–10.66)
Upper airway symptoms
Ocular–nasal symptoms 2.44 (1.12–5.29)* 0.51 (0.21–1.25) 2.91 (0.92–9.20) 6.02 (3.26–11.11)*** 4.48 (1.97–10.23)*** 7.11 (2.39–21.09)***
Work-related ocular–nasal
symptoms
1.56 (0.72–3.39) 0.73 (0.30–1.78) 4.30 (1.34–13.77)* 3.13 (1.78–5.49)*** 2.51 (1.21–5.19)* 3.53 (1.27–9.81)*
Age of first exposure to
flour dust allergens
1.16 (1.01–1.33)* 0.99 (0.91–1.09) 1.01 (0.89–1.16) 1.00 (0.94–1.07) 0.99 (0.92–1.08) 1.00 (0.91–1.10)
21–30 yrs1 1.93 (0.70–5.31) 1.64 (0.56–4.82) 8.66 (0.97–77.28) 1.04 (0.51–2.12) 1.08 (0.45–2.62) 1.23 (0.28–5.42)
.30 yrs 3.09 (0.51–18.71) 1.72 (0.34–8.78) 1.30 (0.05–34.96) 0.65 (0.20–2.04) 0.46 (0.10–2.22) 0.99 (0.13–7.59)
Previous episodes of high
exposure causing asthma
symptoms
1.43 (0.51–4.00) 2.33 (0.87–6.22) 5.77 (1.74–19.15)** 2.80 (1.43–5.52)** 2.70 (1.07–6.83)* 3.61 (1.15–11.30)*
Current job statuse
Baker 0.37 (0.11–1.18) 0.50 (0.17–1.46) 0.10 (0.01–1.18) 1.57 (0.66–3.74) 2.14 (0.78–5.88) 1.68 (0.14–20.77)
Confectioner 0.29 (0.05–1.74) 0.49 (0.09–2.65) 0.93 (0.11–8.20) 1.12 (0.27–4.60) 0.51 (0.06–4.56) 4.86 (0.30–78.05)
Supervisor/manager 0.39 (0.06–2.35) 0.34 (0.02–5.98) 4.01 (1.28–12.59)* 5.41 (1.26–23.15)* 7.48 (0.49–115.05)
Self-reported ingestion-
related adverse reactions
to grain products
6.35 (2.03–19.83)** 2.66 (0.56–12.65) 13.43 (2.23–80.83)**
Baking activities at home 0.53 (0.22–1.28) 0.46 (0.19–1.13) 0.73–0.22–2.44) 1.11 (0.63–1.94) 1.63 (0.79–3.34) 0.72 (0.26–2.02)
Data are presented as n (%) or OR (95% CI). AA: atopic asthma; NAA: nonatopic asthma; WAA: work-aggravated asthma; OA: occupational asthma. #: out of a total of
457; ": out of a total of 188; +; out of a total of 269; 1: age category f20 yrs used as reference category; e: counterhands used as reference group. *: p,0.05; **: p,0.01;
***: p,0.001. Each odds ratio is a separate regression model adjusted for age, sex and smoking status.
ASTHMA AND ALLERGY R. BAATJIES ET AL.
830 VOLUME 34 NUMBER 4 EUROPEAN RESPIRATORY JOURNAL
are cereal flours and synthetic enzymes [1]. This sensitisationpattern has also been observed in the current study, in whichsensitisation to wheat, rye and other related cereal flours on SPTwas high (16%), but less so for fungal enzyme a-amylase (4%).Preliminary data from the detailed exposure assessment studythat was conducted confirmed that bakers had the highestaverage (geometric mean) wheat allergen concentration(16.504 mg?m-3), followed by confectioners (7.307 mg?m-3), whilstcounterhands had the lowest exposures (0.84 mg?m-3). However,for most job titles, a-amylase concentrations were below the limitof detection (1.083 ng?m-3). While sensitisation to cereal flourswere highly correlated (r50.67–0.75), a very high degree ofcorrelation (r50.92) was observed between wheat and rye.Interestingly, a large proportion (33%) of workers reportedwork-related asthma symptoms specifically to rye flour, despitethis flour constituting a small proportion (,10%) of productshandled in these bakeries. It has been suggested that cross-reactivity between grain cereal allergens could be a possiblemechanism for these observations [21]. Cross-reactivity betweenrye flour allergens and rye grass allergens remains anotherpossibility, although this is unlikely as a very low correlation wasobserved between sensitisation to these allergens (r50.37). Whilethe response to rye may be immunologically mediated, thephysical properties of rye flour may also produce an additionalirritative effect, as demonstrated by its ability to produce a greaterbronchial response compared with wheat [22].
In our study, a modest inverse correlation was demonstratedbetween PD20 methacholine and specific IgE levels to wheat(Spearman r5 -0.30; p,0.001) and rye flour (Spearmanr5 -0.28; p,0.001) that, as far as we can establish, has notbeen previously reported. However, there have been a fewepidemiological studies among bakers that have reported anassociation between other markers of exposure (flour dust) andthe degree of NSBH following nonspecific challenge tests usingmethacholine. PRICHARD et al. [23] reported that 41% of bakersversus 21% of controls (slicers/wrappers) had a positivemethacholine challenge test (PD20 methacholine ,30 mmol).Similarly, MUSK et al. [24] showed the proportion of bakerswith a positive methacholine challenge test in less exposedbakers increased from 26% to 42% in the more exposed group.BOHADANA et al. [25] reported a significant dose–responserelationship with the duration of exposure to flour dust, whileCHOUDAT et al. [26] demonstrated that flour dust exposure andsmoking increase bronchial responsiveness, as measured bythe slope of the dose–response curve to methacholine.
In our population, atopy was identified as an importantcontributor to nonwork-related asthma as half of these subjectswere atopic. This is corroborated by the very high prevalence(54%) of a self-reported family history of atopy in the overallstudy population. Subjects with polysensitisation to commonaeroallergens also had a six-fold higher odds ratio ofpresenting with AA. Among the work-related asthma pheno-types, atopy was significantly associated (OR 4.1) withprobable OA but not WAA. This association between atopyand OA due to high molecular weight sensitisers, such asbakery allergens, has been well documented in the literature[27]. Polysensitised workers were also more likely to besensitised to occupational allergens (OR 9.5) and present withOA (OR 5.5). This is consistent with the findings of studiesamong subjects with nonwork-related asthma in adults as well
as children, in which only a small proportion of monosensi-tised individuals become symptomatic when compared withthe majority of symptomatic individuals that are polysensi-tised to common inhalant allergens [28].
In our study of bakery workers, a self-reported history ofrecurrent chest infections in childhood was a significantpredictor (OR 5.5) of only the WAA phenotype. The associa-tion between childhood infections and asthma has beenpreviously demonstrated by ARSHAD et al. [29] in their studyof children of 10 yrs of age with wheeze and asthma. A morerecent study among adults has also demonstrated that havingfrequent lower respiratory tract infections in childhood is asignificant contributory factor in predicting FEV1 decrementsin adulthood [30]. Our findings therefore suggest that a historyof recurrent infections in childhood could be used as anindicator to identify workers requiring more intensive surveil-lance, who might be at increased risk of developing WAA. Thepossibility of recall bias in our study cannot, however, beexcluded.
Upper airway symptoms and, more specifically, work-relatedocular–nasal symptoms were also significant predictors of AAand OA phenotypes in our study. Previous studies have shownthat overall 11.5% of subjects with occupational rhinitisdevelop OA, and specifically 11.6% of those exposed to flours,grains and fodders [31]. Comorbid rhinitis or rhino-conjuncti-vitis has been reported in a greater proportion (45–90%) ofsubjects suffering from IgE-associated OA and has beenattributable to various sensitisers including flour dust [27].Interestingly, work-related ocular–nasal symptoms also appearto be an important risk factor for WAA in our study, which, asfar as we can establish, has not been previously reported. Thecross-sectional nature of our study does not permit conclusionsabout the temporal relationship of ocular–nasal symptoms andthe development of asthma. Overall, however, these findingsare consistent with other reported studies in the literature thatindicate rhinitis to be a significant risk factor for adult-onsetasthma in both work-related and nonwork-related diseaseoutcomes, and that the appearance of ocular–nasal symptomscould be used to identify workers at greater risk of developingOA [31–33].
Self-reported work exposures, particularly episodes of highexposures, can be a useful marker in predicting recent onsetadult asthma. In our study, a past history of episodes of highexposure to dusts, fumes and vapours causing asthmasymptoms was a significant predictor for WAA and OAphenotypes among bakery workers. Interestingly, a strongerassociation was observed in workers with WAA (OR 5.8) thanthose with OA (OR 2.8). This finding is consistent with resultsfrom Finland in which 21% of respondents reported work-aggravated symptoms on a weekly basis in the past month inresponse to a number of factors including airborne dusts, gasesor fumes [34]. A recently published ECRHS article alsodemonstrated an increased asthma risk (OR 3.3) amongsubjects following acute symptomatic inhalation accidents[3]. These findings suggest that high exposures to sensitiserscan contribute substantially to new-onset asthma, and thatworkers with inhalation accidents should therefore be mon-itored closely over a longer period of time to identify this entityat an early stage. However, it needs to be borne in mind that
R. BAATJIES ET AL. ASTHMA AND ALLERGY
cEUROPEAN RESPIRATORY JOURNAL VOLUME 34 NUMBER 4 831

the definition used in our study, as outlined in the ECRHSprotocol, has its limitations as it does not specificallydifferentiate between flour dust and irritants.
In our study, current job status was a significant predictor of OAin that workers with OA were more likely to be supervisors/managers (OR 4.0). Although elevated odds ratios wereobtained for bakers (OR 1.6), this association was not significant.This is highly indicative of selection effects, as our pilotenvironmental exposure studies have shown that bakers havemuch higher exposures to inhalable dust than supervisors/managers. As the response rate of individual bakeries in ourstudy was high (90–100%), it is unlikely that nonresponse biasmay have affected the results. The ‘‘healthy worker effect’’ is amore likely explanation, in that we have noted that bakers withOA are more likely to be transferred from their high exposurejobs to less exposed jobs (supervisors/managers) rather than theleast exposed jobs (counterhands). This is due to the companypolicy on placement of workers that ensures these bakers, oftenhaving the longest service, are retained in the bakery workenvironment due to their experience, which is then utilised insupervisory and managerial duties.
One of the intriguing findings of our study was the strongassociation (OR 6.4) between self-reported ingestion-relatedadverse reactions to grain products and OA phenotype, whichwas particularly pronounced amongst nonatopic athmatics. Theevidence for an association between wheat-related food allergyand baker’s asthma is inconclusive. Some studies suggest thatinhalant wheat allergy is caused by water-soluble proteins(albumins and globulins) whereas ingestion-related wheatallergy is related to nonwater-soluble, thermo-resistant glutenfractions [35]. Other studies have suggested that similarallergens are responsible for symptoms following both ingestionand inhalation of cereals [36]. MITTAG et al. [37] demonstratedthat subjects with baker’s asthma and adults with food allergyhad intense IgE-reactivity to both the albumin/globulin andglutenin fraction of wheat proteins [37]. While this may explainthe association in the atopic group in our study, it is possiblethat the stronger associations observed in the nonatopic groupmay be due to other factors, such as water-insoluble proteins(wheat gliadins) [38], or nonimmune reactions, such as glutenintolerance. Further studies are currently being conducted toevaluate this differential response between atopic and nonatopicasthmatics with OA and ingestion-related reactions to grainproducts, as this may have important implications for dietarycounselling of workers with OA.
In conclusion, our study has demonstrated that OA is the mostcommon asthma phenotype among supermarket bakery work-ers in this region and is an important globally evolving trend.Analysis of risk factors contributes towards differentiatingbetween these various phenotypes. Defining various clinicalphenotypes using specific clinical criteria is important fordecisions regarding medical surveillance and clinical manage-ment of this high-risk group. Medical surveillance pro-grammes in bakeries can therefore use these criteria toidentify persons at risk at an early stage and intensifysurveillance and other workplace interventions. Furthermore,in view of the increase in baking activities in supermarketsglobally, measures to monitor and reduce exposures remain animportant priority.
SUPPORT STATEMENTFunding support was provided by research grants from the MedicalResearch Council of South Africa (Cape Town), National ResearchFoundation (Pretoria), Fogarty International Centre (Bethesda, MD,USA), the Allergy Society of South Africa (Cape Town) and Universityof Cape Town Research Committee (Cape Town) and the bakingindustry (Cape Town).
STATEMENT OF INTERESTA statement of interest for D. Heederik can be found at www.erj.ersjournals.com/misc/statements.dtl
ACKNOWLEDGEMENTSWe would like to acknowledge the special contribution of thefollowing individuals and institutions. R. Ehrlich and J. Myers andsupport staff of the Centre for Occupational and Environmental HealthResearch Unit, School of Public Health and Family Medicine,University of Cape Town. Research assistants, N. Viljoen and L.Ritchie, and F. Omar in conducting the fieldwork from the Centre forOccupational and Environmental Health Research Unit. V. Barnard, A.Olckers and technologists from the Dept of Respiratory Medicine andLung Institute, University of Cape Town Lung Institute, for thepulmonary function and methacholine challenge testing. J. vanNiekerk for data entry and management and R. Sayed and F. Little,from the Depts of Public Health and Statistical Sciences, University ofCape Town, for statistical advice and support. The contents of ourreport are solely the responsibility of the authors and do notnecessarily reflect the official views of these agencies. We would alsolike to acknowledge the staff and employees of the bakeries thatparticipated in this study.
REFERENCES1 Brisman J. Baker’s asthma. Occup Environ Med 2002; 59: 498–502.
2 Wenzel SE. Asthma: defining of the persistent adult phenotypes.Lancet 2006; 368: 804–813.
3 Kogevinas M, Zock JP, Jarvis D, et al. Exposure to substances in theworkplace and new-onset asthma: an international prospectivepopulation-based study (ECRHS-II). Lancet 2007; 370: 336–341.
4 Brant A, Berriman J, Sharp C, et al. The changing distribution ofoccupational asthma: a survey of supermarket bakery workers.Eur Respir J 2005; 25: 303–308.
5 Erasmus JC, Cownie PJ. Investigation into the development ofsmall and medium sized bakeries in South Africa. Human,Sciences Research Council & South African Chamber of Baking,Employment and Economic Policy Research Unit, Pretoria, SouthAfrica 2002.
6 Burney PG, Luczynska C, Chinn S, et al. The European CommunityRespiratory Health Survey. Eur Respir J 1994; 7: 954–960.
7 Aas K, Belin L. Standardization of diagnostic work in allergy. IntArch Allergy Immunol 1973; 45: 57–60.
8 American Thoracic Society, Standardization of spirometry – 1994update. Am J Respir Crit Care Med 1995; 152: 1107–1136.
9 Quanjer PH, Tammeling GJ, Cotes JE, et al. Lung volumes andforced ventilatory flows. Report Working Party Standardization ofLung Function Tests, European Community for Steel and Coal.Official Statement of the European Respiratory Society. Eur Respir J
1993; 6: Suppl. 16, 5–40.
10 White NW, Hanley JH, Lalloo UG, et al. Review and analysis ofvariation between spirometric values reported in 29 studies ofhealthy African adults. Am J Respir Crit Care Med 1994; 150: 348–355.
11 American Thoracic Society. American Thoracic Society (ATS)Guidelines for Methacholine and Exercise Challenge Testing –1999. Am J Resp Crit Care Med 2000; 16: 309–329.
12 Beach J, Russell K, Blitz S, et al. A systematic review of thediagnosis of occupational asthma. Chest 2007; 131: 569–578.
ASTHMA AND ALLERGY R. BAATJIES ET AL.
832 VOLUME 34 NUMBER 4 EUROPEAN RESPIRATORY JOURNAL
13 Variations in the prevalence of respiratory symptoms, self
reported asthma attacks, and use of asthma medication in the
European Community Respiratory Health Survey (ECRHS). Eur
Respir J 1996; 9: 687–695.
14 Ehrlich R I, White N, Norman R, et al. Wheeze, asthma diagnosis
and medication use: a national adult survey in a developing
country. Thorax 2005; 60: 895–901.
15 Jithoo A, Bateman ED, White NW, et al. Prevalence of adult lung
disease in a middle-to-low income urban area of South Africa:
Lung Health Survey 2002 (Abstract). S Afr Respir J 2003; 9: 127.
16 Pearce N, Pekkanen J, Beasley R. How much asthma is really
attributable to atopy? Thorax 1999; 54: 268–272.
17 Pavlovic M, Spasojevic M, Tasco Z, et al. Bronchial hyperactivity in
bakers and its relation to atopy and skin reactivity. Science of the
Total Environ 2001; 270: 71–75.
18 De Zotti R, Larese F, Bovenzi M, et al. Allergic airway disease in
Italian bakers and pastry makers. Occup Environ Med 1994; 51:
548–552.
19 Gautrin D, Infante-Rivard C, Dao TV, et al. Specific IgE-dependent
sensitization, atopy, and bronchial hyperresponsiveness in
apprentices starting exposure to protein-derived agents. Am J
Respir Crit Care Med 1997; 155: 1841–1847.
20 DunnGalvin A, Hourihane JO, Frewer L, et al. Incorporating a
gender dimension in food allergy research: a review. Allergy 2006;
61: 1336–1343.
21 Sandiford CP, Tee RD, Newman-Taylor AJ. Identification of cross
reacting wheat, rye, barley and soya flour allergens using sera
from individuals with wheat-induced asthma. Clin Exp Allergy
1995; 25: 340–349.
22 Bensefa L, Villette C, Tabka F, et al. Rye flour induces a stronger
early bronchial response than wheat flour in occupational asthma.
Allergy 2004; 59: 833–838.
23 Prichard MG, Ryan G, Musk AW. Wheat flour sensitisation and
airways disease in urban bakers. Br J Ind Med 1984; 41: 450–454.
24 Musk AW, Venables KM, Crook B, et al. Respiratory symptoms,
lung function, and sensitisation to flour in a British bakery. Br J Ind
Med 1989; 46: 636–642.
25 Bohadana AB, Massin N, Wild P, et al. Respiratory symptoms and
airway responsiveness in apparently healthy workers exposed to
flour dust. Eur Respir J 1994; 7: 1070–1076.
26 Choudat D, Bensefa L, Causse-Sounillac E, et al. Methacholinebronchial responsiveness and variations in lung function amongworkers exposed to flour. Scand J Work Environ Health 2005; 31: 59–64.
27 Nicholson PJ, Cullinan P, Newman Taylor AJ, et al. Evidence basedguidelines for the prevention, identification, and management ofoccupational asthma. Occup Environ Med 2005; 62: 290–299.
28 Bousquet J, Anto JM, Bachert C, et al. Factors responsible fordifferences between asymptomatic subjects and patients present-ing an IgE sensitization to allergens. A GA2LEN project. Allergy2006; 61: 671–680.
29 Arshad SH, Kurukulaaratchy RJ, Fenn M, et al. Early life riskfactors for current wheeze, asthma and bronchial hyperrespon-siveness at 10 years of age. Chest 2005; 127: 502–508.
30 Tennant PWG, Gibson GJ, Pearce MS. Lifecourse predictors ofadult respiratory function: results from the Newcastle ThousandFamilies Study. 2008; 63: 823–830.
31 Karjalainen A, Martokainen R, Klaukka T, et al. Risk of asthmaamong Finnish patients with occupational rhinitis. Chest 2003; 123:283–288.
32 Elliot L, Heederik D, Marshall S, et al. Progression of self-reportedsymptoms in laboratory animal allergy. J Allergy Clin Immunol
2005; 116: 127–132.33 Guerra S, Sherrill DL, Martinez FD, et al. Rhinitis as an
independent risk factor for adult-onset asthma. J Allergy Clin
Immunol 2002; 109: 419–425.34 Saarinen K, Karjalainen, Martikainen R, et al. Prevalence of work-
aggravated symptoms in clinically established asthma. Eur Respir J2003; 22: 305–309.
35 Moneret-Vautrin DA, Morisset M. Adult food allergy. Curr Allergy
Asthma Rep 2005; 5: 80–85.36 Armentia A, Rodriques R, Callejo A, et al. Allergy after ingestion
or inhalation of cereals involves similar allergens in different ages.Clin Exp Allergy 2002; 32: 1216–1222.
37 Mittag D, Niggemann B, Sander I, et al. Immunoglobulin E-reactivity of wheat-allergic subjects (baker’s asthma, food allergy,wheat-dependent, exercise-induced anaphylaxis) to wheat proteinfractions with different solubility and digestibility. Mol Nutr Food
Res 2004; 48: 380–389.38 Bittner C, Grassau B, Frenzel K, et al. Identification of wheat
gliadins as an allergen family related to baker’s asthma. J Allergy
Clin Immunol 2008; 121: 744–749.
R. BAATJIES ET AL. ASTHMA AND ALLERGY
EUROPEAN RESPIRATORY JOURNAL VOLUME 34 NUMBER 4 833