Modeling Multilevel Supply Chain Systems to Optimize Order ...
Upload
independentCategory
view
1download
0
Expert Systems with Applications 40 (2013) 6837–6847
Contents lists available at SciVerse ScienceDirect
Expert Systems with Applications
journal homepage: www.elsevier .com/locate /eswa
A case study on using evolutionary algorithms to optimize bakeryproduction planning
0957-4174/$ - see front matter � 2013 Elsevier Ltd. All rights reserved.http://dx.doi.org/10.1016/j.eswa.2013.06.038
⇑ Corresponding author. Tel.: +49 711 459 229 57; fax: +49 711 459 232 59.E-mail addresses: [email protected] (F.T. Hecker),
[email protected] (W.B. Hussein), [email protected](O. Paquet-Durand), [email protected] (M.A. Hussein), [email protected](T. Becker).
Florian T. Hecker a,⇑, Walid B. Hussein b, Olivier Paquet-Durand a, Mohamed A. Hussein b, Thomas Becker b
a Department of Process Analytics and Cereal Technology, University of Hohenheim, Garbenstraße 23, 70599 Stuttgart, Germanyb Center of Life and Food Sciences Weihenstephan, (Bio-)Process Technology and Process Analysis, Technische Universität München, Weihenstephaner Steig 20,85354 Freising, Germany
a r t i c l e i n f o
Keywords:Bakery production planningEvolutionary algorithmsParticle Swarm OptimizationAnt Colony OptimizationFlow-shop scheduling
a b s t r a c t
The production of bakery goods is strictly time sensitive due to the complex biochemical processes dur-ing dough fermentation, which leads to special requirements for production planning and scheduling.Instead of mathematical methods scheduling is often completely based on the practical experience ofthe responsible employees in bakeries. This sometimes inconsiderate scheduling approach often leadsto sub-optimal performance of companies. This paper presents the modeling of the production in baker-ies as a kind of no-wait hybrid flow-shop following the definitions in Scheduling Theory, concerning theconstraints and frame conditions given by the employed processes properties. Particle Swarm Optimiza-tion and Ant Colony Optimization, two widely used evolutionary algorithms for solving scheduling prob-lems, were adapted and used to analyse and optimize the production planning of an example bakery. Incombination with the created model both algorithms proved capable to provide optimized results for thescheduling operation within a predefined runtime of 15 min.
� 2013 Elsevier Ltd. All rights reserved.
1. Introduction
Many bakery goods contain yeast (Saccharomyces cerevisiae) as aproofing agent. This form of proofing is a fermentation performed bymicroorganisms in which sugars are metabolized to CO2 (amongother components), as can be seen in Fig. 1. Due to this fermentationprocess the production of such goods is not highly but strictly timesensitive from the point on, where the microorganisms get in con-tact with water and substrates under preferable conditions of tem-perature and humidity, as happens in the dough production process.
The upmost shown metabolism is the most influential and mostcommon in yeast containing doughs. Due to the common existenceof lactic-acid bacteria in dough the lactic fermentation also occursbut rather influences the aroma than the texture of dough. Theretention of CO2 produced by yeast is given by the dough matrixsurrounding the gas bubbles and leads to a desired volume in-crease. Over time the amount of CO2 increases due to yeast activityand thus the gas pressure in the gas bubbles increases likewise. Upto a certain degree the dough matrix can withstand the structuralstress induced by the increasing gas pressure, but after exceedingthe maximum gas retention ability the dough matrix and thus its
structure collapses more or less complete with respect to the pres-ent gas pressure and thus as a function of fermentation or proofingtime.
Cooling can be used to regulate or slow down the fermentationspeed of yeast but is costly and sometimes accompanied with neg-ative influence on the product quality. Due to this and the decreaseof product quality (up to the total loss of marketability) induced bya too long unregulated fermentation process, the time dependencyof the processing of yeast containing doughs has always to be con-sidered in the production scheduling.
Focusing on the German baking industry, the production plan-ning is almost completely based on the practical experience ofthe responsible employee(s) instead of the usage of mathematicalmethods like in Scheduling Theory. Combined with the high diver-sity of the product range that includes around 100 different prod-ucts in a common German bakery and the high complexity of thescheduling task induced therein, the performance of bakeries is of-ten sub-optimal.
The baking industry in Germany consists of approximately14,000 producing companies, reaching business volume of almost13.4 billion Euros per year and employs over 290,000 employees(Zentralverband des Deutschen Bäckerhandwerks e. V., 2012).Based on this general framework the increase of companies’ effi-ciency in respect of energy consumption or staff allocation andman working hours comprises high potential to decrease produc-tion costs in this industry.

6838 F.T. Hecker et al. / Expert Systems with Applications 40 (2013) 6837–6847
The use of evolutionary optimization algorithms like ParticleSwarm Optimization (PSO) or Ant Colony Optimization (ACO) tosolve the scheduling task might increase the efficiency of bakingcompanies by calculating an optimal production plan and thereforedetermine the exact time schedule and capacities of devicesneeded to reach the production goal. Thus idle times of machinescan be reduced or completely erased which leads to a reductionof energy consumption or the decrease in the makespan whichleads to a reduction of man working hours needed.
Kennedy and Eberhart (1995) invented PSO as an adaption ofthe movement and behavior of bird flocks or fish schools. As aswarm intelligence algorithm it mimics the behavior of suchswarming animals and iteratively searches the search space of a gi-ven optimization problem for the optimal solution. Since its inven-tion PSO was widely used to tackle numerous scheduling oroptimization problems in many different industry branches (Bank,Fatemi Ghomi, Jolai, & Behnamian, 2012; Eberhart & Shi, 2001; Li &Deng, 2012; Lian, Gu, & Jiao, 2008; Liao, Tjandradjaja, & Chung,2012; Liu, Wang, Liu, Qian, & Jin, 2010; Pan, Tasgetiren, & Liang,2008; Tang & Tang, 2012; Tasgetiren, Liang, Sevkli, & Gencyilmaz,2007; Wang & Yang, 2010).
Another animal behavior inspired and frequently used algo-rithm (Ahmadizar, 2012; Li, Baki, & Aneja, 2010; Tzeng & Chen,2012; Yagmahan & Yenisey, 2010) is the Ant Colony Optimization,initially proposed by Dorigo in his Ph.D. thesis (Dorigo, 1992). ACOfollows the mechanisms that help ants to find the shortest andthus optimal way between a food source and their formicary.
Since ACO and PSO both provide easy implementation, easymodification and the ability to solve complex scheduling optimiza-tion tasks in reasonable computational time, they are promisingmethods to solve bakery scheduling tasks. In the presented workboth methodologies were adapted to investigate the schedulingof an example bakery.
2. Material and methods
The developments and investigations presented in this paperwere performed on a ‘‘lenovo ThinkPad R500’’ with an ‘‘Intel Core2 Duo’’ 2.26 GHz processor, 2 GB RAM and Microsoft XP 2002 assystem software. The modeling and optimization were pro-grammed and performed with MATLAB 7.1 (The MathWorks, Inc.).
The production data used in this work including products, pro-cessing times and production stages are listed in Table A.1 inAppendix.
Fig. 1. Sugar metabolisms in dough. Mod
3. Modeling and optimization
Due to the high diversity of products in a German bakery it isnot possible to solve the scheduling task with exact methods, atleast not in reasonable computational time prior to the productionstart. Using exact methods to calculate the parameters of all possi-ble schedules would mean to calculate an enormous number ofcombinations given by the relation in Eq. (1), where n is the num-ber of jobs (products) and m is the number of machines or stagesused.
number of schedules ¼ ðn!Þm ð1Þ
It is obvious that this relation causes an unmanageable amount ofcombinations for the scheduling problem in German bakeries,where the normal range of products is commonly above 100 andthe machinery in operation approximately between 10 and 50(depending on the bakery’s size).
From the scheduling point of view the production in a bakerycan be described as a hybrid flow-shop according to the commondefinitions, e.g. in (Pinedo, 2008; Ruiz & Vazquez-Rodriguez,2010). In a manufacturing facility where a product, a job, has to un-dergo a series of operations or processing steps related to specificmachines set up in series and is processed on each of the consecu-tive machines, this manufacturing environment is referred to as aflow-shop. If a production step consists of several parallel ma-chines, this particular production step is referred to as a stage. Ifjobs have to be processed on only one of those machines in a stageor can bypass it, as is the case in a bakery, the machine environ-ment is referred to as a hybrid flow-shop.
The number of possible schedules can be reduced significantlyby considering the scheduling task in a bakery as a permutationflow-shop instead of a ‘normal’ hybrid flow-shop by adding the con-straint, that the order in which the jobs n pass through the produc-tion is fixed and does not change between production stages (Lianet al., 2008; Pinedo, 2008; Tasgetiren et al., 2007). Although thereal process in a bakery does not fulfil this requirements entirely,this model can be used and modified to match with the real pro-duction processes, where products can bypass other previouslystarted products and the sequence of products on the first produc-tion stage determines all subsequent process tasks, due to theaforementioned time dependence in bakery production. By doingso the number of possible combinations is reduced from (n!)m ton! and each schedule is a permutation of n (Perez-Gonzalez &Framinan, 2010). Each of those permutations is used to determine
ified after (Collado-Fernández, 2003).
F.T. Hecker et al. / Expert Systems with Applications 40 (2013) 6837–6847 6839
a sequence of products on the first production stage of the bakerythat is crucial for sequencing the work flow. Still n! differentschedules may easily lead to optimization problems unsolvablewith exact methods in reasonable computational time for highnumbers of n.
Additionally the scheduling in a bakery is subject to a no-waitconstraint due to the fact that there are very small tolerances forwaiting times of yeast containing doughs/products during the pro-duction process, as explained in Section 1.
3.1. Modeling of the production setup and processes
Prior to the actual optimization of the scheduling, the modelingof the production site and the compliance of the no-wait constraintare done.
A matrix A, that contains all processing times (PT) of the prod-ucts to be produced, is formed as first step. Processing times alsoinclude the dough rest since this is a defined and desired waitingtime, although the dough is not literally ‘‘processed’’ there accord-ing to being influenced by a worker or the use of a machine. Therows and columns of the matrix A represent the products andthe production stages respectively, such that, for example a2,3
would return the processing time of product 2 on stage 3, meaningin this case that the product ‘‘B’’ requires a dough rest of 30 min (cf.Table 1). The processing times are determined by the recipe andthe desired characteristics of the finished product. Basically allproducts follow the same way through the production on consec-utive stages, meaning that a product does not return to an alreadypassed stage. Fig. 2 shows the common progression of productionstages in a bakery.
Keeping in mind that some products do not require processingon a certain stage (e.g. if a product needs no dough rest) and there-fore skipping this step, a zero entry in matrix A indicates that theproduct skips the respective stage and is not processed there.The information contained in such a matrix A is given as an exam-ple in Table 1.
The starting times of all products on all stages are calculated forthe investigated sequence of products (which represents a particlein the PSO or an ant in ACO) based on matrix A and form a new ma-trix B.
To make sure that no product waiting times appear during thescheduling of each analysed product sequence (and the no-wait
Table 1Example of bakery production data.
Product/stage Kneading Dough rest Forming Proofing Baking
A 4 0 10 30 25B 6 30 15 45 55C 10 15 5 60 30D 5 25 20 60 60E 7 0 10 45 30F 3 5 15 30 55
Preparation of Ingredients Kneading
BakinDistribution
Fig. 2. Simple bakery pro
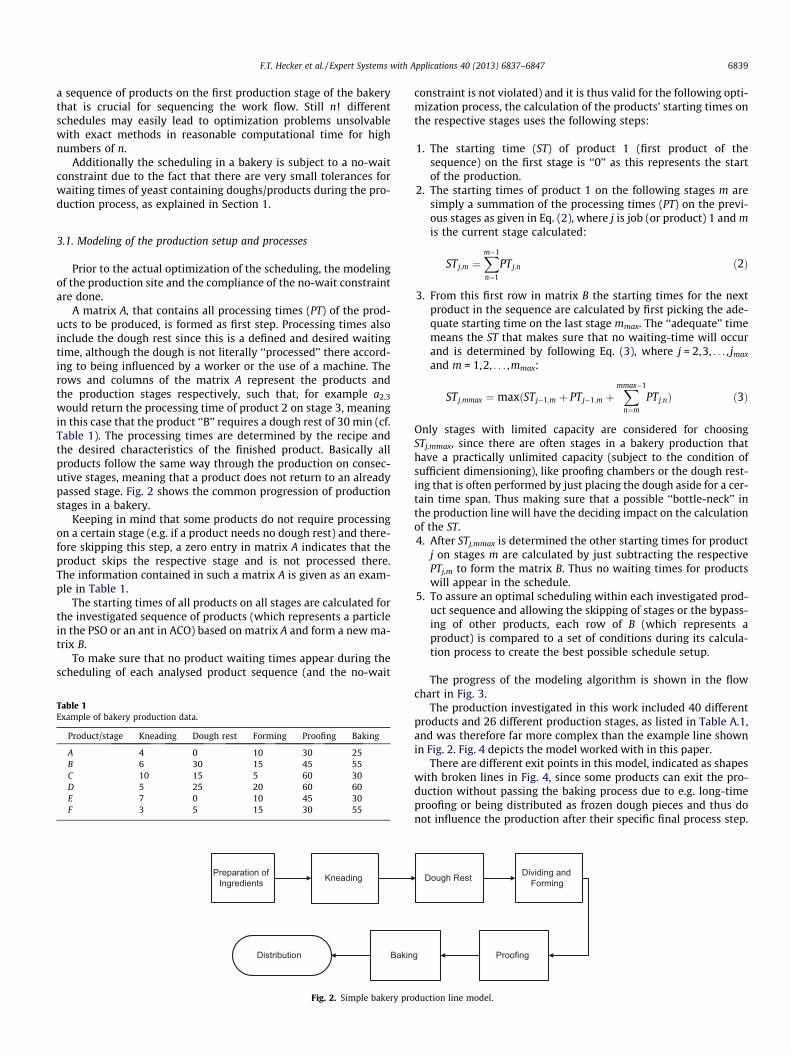
constraint is not violated) and it is thus valid for the following opti-mization process, the calculation of the products’ starting times onthe respective stages uses the following steps:
1. The starting time (ST) of product 1 (first product of thesequence) on the first stage is ‘‘0’’ as this represents the startof the production.
2. The starting times of product 1 on the following stages m aresimply a summation of the processing times (PT) on the previ-ous stages as given in Eq. (2), where j is job (or product) 1 and mis the current stage calculated:
Doug
g
duction
STj;m ¼Xm�1
n¼1
PTj;n ð2Þ
3. From this first row in matrix B the starting times for the nextproduct in the sequence are calculated by first picking the ade-quate starting time on the last stage mmax. The ‘‘adequate’’ timemeans the ST that makes sure that no waiting-time will occurand is determined by following Eq. (3), where j = 2,3, . . . , jmax
and m = 1,2, . . . ,mmax:
STj;mmax ¼maxðSTj�1;m þ PTj�1;m þXmmax�1
n¼m
PTj;nÞ ð3Þ
Only stages with limited capacity are considered for choosingSTj,mmax, since there are often stages in a bakery production thathave a practically unlimited capacity (subject to the condition ofsufficient dimensioning), like proofing chambers or the dough rest-ing that is often performed by just placing the dough aside for a cer-tain time span. Thus making sure that a possible ‘‘bottle-neck’’ inthe production line will have the deciding impact on the calculationof the ST.4. After STj,mmax is determined the other starting times for product
j on stages m are calculated by just subtracting the respectivePTj,m to form the matrix B. Thus no waiting times for productswill appear in the schedule.
5. To assure an optimal scheduling within each investigated prod-uct sequence and allowing the skipping of stages or the bypass-ing of other products, each row of B (which represents aproduct) is compared to a set of conditions during its calcula-tion process to create the best possible schedule setup.
The progress of the modeling algorithm is shown in the flowchart in Fig. 3.
The production investigated in this work included 40 differentproducts and 26 different production stages, as listed in Table A.1,and was therefore far more complex than the example line shownin Fig. 2. Fig. 4 depicts the model worked with in this paper.
There are different exit points in this model, indicated as shapeswith broken lines in Fig. 4, since some products can exit the pro-duction without passing the baking process due to e.g. long-timeproofing or being distributed as frozen dough pieces and thus donot influence the production after their specific final process step.
h Rest Dividing and Forming
Proofing
line model.

Pick Element of (STj,mmax)Calculation of STj,m:mmax-1
Inputs: Processing Times of Products on Machines (Matrix A)
Calculation of STj1,m1:mmax
Calculation of Possible STj,mmax
SchedulingConditions
Matrix B Completed
j=jmax
False
True(Next j)
Fig. 3. Flow Chart of Modeling Algorithm.
6840 F.T. Hecker et al. / Expert Systems with Applications 40 (2013) 6837–6847
The common way of a product would be to exit the production lineas a finished and baked good via the ‘‘Distribution’’ work step. Anyproduct following a long-time proofing procedure will be distrib-uted or baked after the current shift has finished and therefore ex-its at the ‘‘Long-time Proofing’’. And finally products that aredistributed frozen have to be stored in the freezer for a specifictime span and thus exit the model at the ‘‘Freezer 1’’ or ‘‘Freezer2’’ stage.
The production stages can be grouped into stages with limitedcapacity and stages with practically regarded unlimited capacity,meaning that stages of the second group can handle any amountof different products under common production conditions with-out blocking. The unlimited stages in the aforementioned modelare ‘‘Dough Rest’’, ‘‘Proofing 1’’, ‘‘Proofing 2’’, ‘‘Long-time Proofing’’,‘‘Stiffening’’, ‘‘Freezer 1’’, ‘‘Freezer 2’’ and ‘‘Depanning’’. ‘‘Baking 1’’has a limited capacity of two and ‘‘Baking 2’’ of six, meaning thatthese stages can process two and six products simultaneously.All other stages of the model have a limited capacity of one andcan thus process only one product at a time.
At least one cost or objective function to be optimized must bedefined prior to the actual optimization process. Two objectivefunctions were chosen in this work, the minimization of the make-span and the minimization of the total idle time of machines,respectively.
The makespan (Cmax) represents the required time to completethe given production goal and equals the highest end time (ET) ofthe products and thus can be easily retrieved from matrix B andmatrix A by summating each row in B element wise with itsrespective counterpart in A.
The idle time (IdTm) of a machine represents the time span amachine or stage is ready and free to process a job, but has to waitfor a product that has not finished its processing on a previous
stage yet. The total idle time of machines (TIdT) is the summationof all IdTm during the production. The calculation of IdTm and TIdT isshown in Eqs. (4) and (5) respectively:
IdTm ¼ ST1;m þXjmax
n¼2
ðSTn;m � ETn�1;mÞ > 0 ð4Þ
TIdT ¼Xmmax
m¼1
IdTm ð5Þ
To constrain computational time in a reasonable range that seemsto make the optimization procedure feasible for usage prior to awork shift in real production environment, it was decided to limitthe number of particles and ants to ten respectively and the numberof iterations to 100. Thus the computational time was kept below15 min for each separately started optimization run.
3.2. Particle Swarm Optimization
PSO is an iterative algorithm that mimics the behavior ofswarming animals like birds or fishes on the search for a foodsource. In such a swarm each individual member searches for afood source by itself while staying within a certain range to itsneighbors to maintain the swarm structure. Once a swarm mem-ber finds food it will move towards it, attracting other swarmmembers to move in the same direction. The more individualsmove to a food source and thus influencing the motion of theirswarm neighbors the whole swarm will move to a certain locationover time depending on the ratio of moving individuals comparedto the swarm size.
The ‘‘swarm’’ in PSO consists of particles, possible solutions (e.g. product sequences as in the presented work) of a given optimi-zation problem, that represent the individual swarm members innature. During the iterations of the algorithm the particles are ‘‘fly-ing’’ through the search space. Due to the frequent update andcomparison of the best sequence so far and each particle’s currentand so far best value of the cost function, the particles move to theoptimal solution of the given optimization problem.
The PSO algorithm adapted for the bakery scheduling problemworks as follows:
1. Input parameters for PSO: cost function to be optimized (Cmax orTIdT), number of particles (or swarm size), number of iterations(i).
2. Initialize a swarm of particles (xi) with random positions (pi)and velocities (vi). Each xi represents a possible productsequence and the predefined initial vi defines how each of thesesequences is changed from the initial to the next iteration.
3. Evaluate each particle’s fitness (cost function value).4. Compare particle’s fitness with its personal best value (pbest),
update pbest if current fitness value is better and set pbest posi-tion of the particle to the current position.
5. Compare particle’s fitness to swarm’s best value (gbest), updategbest if current fitness value is better and set gbest parametersto the according particle’s parameters.
6. Change particle’s velocity and position according to Eqs. (6) and(7) respectively:
v i ¼ v i þ C�1ðpbesti � xiÞ þ C�2ðgbest � xiÞ ð6Þ
xi ¼ xi þ v i ð7Þ
C1 and C2 are two positive constants in the original PSO and equal 1in the application presented here, since the velocity is used to createa new product sequence.7. Repeat 3–6 until an exit criterion (maximum i, time limit, result
quality, etc.) is met.

Preparationof
Ingredients
Kneader1
DoughRest
Dividing and Forming
(includes 7 possiblestages)
Proofing1
Baking1
Distribution
Kneader2
Kneader3
Proofing2
Freezer1
Long-timeProofing
Baking2
Baking3
StiffeningRefining2DepanningPackaging
Freezer2
Refining1
Fig. 4. Model of the investigated production.
F.T. Hecker et al. / Expert Systems with Applications 40 (2013) 6837–6847 6841
3.3. Ant Colony Optimization
ACO is, like PSO, a nature inspired iterative optimization algo-rithm. In this case the activities and mechanisms observable insedentary ant colonies are mimicked, not the behavior of fish orbird swarms. It is well known in biology that such ants find theshortest and thus optimal way between a food source and their for-micary over a certain time span. The mechanism behind this effectis also known and based on the special way of communication be-tween ants via pheromones, a special group of evaporative bio-chemical molecules. If a foraging and randomly wandering antfinds a food source it heads back to its formicary, laying down apheromone trail. Other ants crossing such a trail will stop wander-ing randomly and follow this trail to the food and start bringing itto the nest while also laying down pheromones and thus reinforc-ing the scent. With time the shortest and most frequently used waywill thus hold the highest pheromone concentration and attractsthe highest number of ants. Pheromones are not persistent andonce a food source is exhausted, the previously marked and rein-forced pheromone trails are less and less used and the scent dissi-pates over time.
In ACO an artificial ant ‘‘moves’’ by applying a local stochasticdecision and while moving builds a possible solution to the given
Fig. 5. Optimization
optimization problem, e. g. a product sequence as in the presentedwork. This ant’s ‘‘way’’ and cost function value is then used aspheromone information to direct the moves of ‘‘following’’ antsby influencing their stochastic decision making process.
The ACO algorithm applied in this paper works with the follow-ing steps:
1. Input parameters for ACO: cost function to be optimized (Cmax
or TIdT), number of ants (n), number of iterations (i), initialpheromone matrix (Pi).
2. Initialize an ant (an,i) with random starting position (posp). Thisposition represents the first product in the sequence.
3. Move an,i to the next position according to a probability factor(pfp) (where pfp for an already ‘‘visited’’ posp = 0) and the pher-omone trail in Pi.
4. Repeat 3. until all posp are ‘‘visited’’ and thus a possible solu-tion/product sequence is created for each an,i.
5. Evaluate each ant’s fitness (cost function value).6. The sequence of an,i with the best value (sbest) represents the
best way so far and is used to lay pheromone upon in its repre-sentation in Pi. Thus an,i in following iterations are moreattracted to this way/sequence.
7. Evaporate pheromone according to an evaporation factor (ef)with 0 < ef < 1 to update Pi into Pi+1 following Eq. (8):
results for Cmax.

6842 F.T. Hecker et al. / Expert Systems with Applications 40 (2013) 6837–6847
Piþ1 ¼ P�i ef ð8Þ
The value of ef influences how randomly an,i are searching for anoptimal product sequence. A low value will lead to a more randomcreation of new product sequences, a high value will lead to ratherpreserving the best sequence found so far and smaller changesthereof.8. Repeat 2–7 until an exit criterion (maximum i, time limit, result
quality, etc.) is met.
Fig. 6. Reduction of Cmax in % com
Fig. 7. Computational times fo
Fig. 8. Optimization
4. Results
4.1. Optimizing the makespan
The first cost function to be optimized in this work was themakespan (Cmax). Both optimization algorithms ACO and PSO wereseparately used, each with 21 optimization runs to find the productsequence providing the minimal Cmax. Fig. 5 shows the results forthe optimization of Cmax with ACO and PSO respectively.
The first run included no optimization and was made to deter-mine the initial Cmax, runs two to 22 were optimization runs to
pared to initial Cmax value.
r the optimization of Cmax.
results for TIdT.
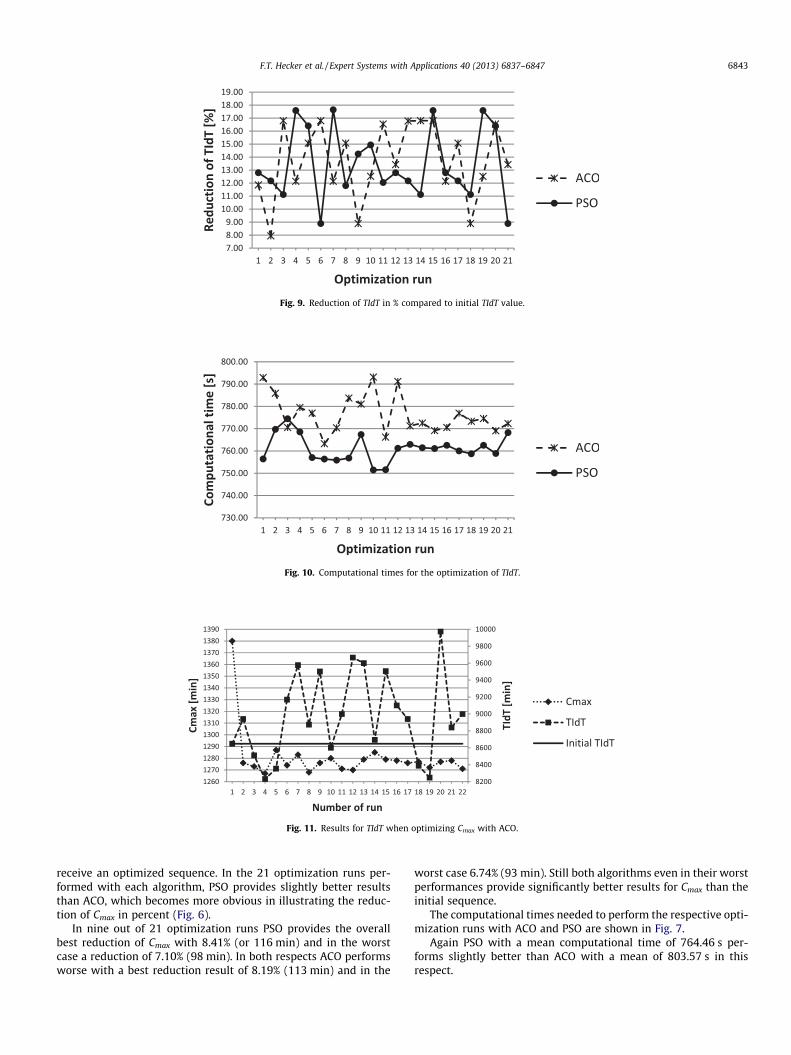
Fig. 9. Reduction of TIdT in % compared to initial TIdT value.
Fig. 10. Computational times for the optimization of TIdT.
Fig. 11. Results for TIdT when optimizing Cmax with ACO.
F.T. Hecker et al. / Expert Systems with Applications 40 (2013) 6837–6847 6843
receive an optimized sequence. In the 21 optimization runs per-formed with each algorithm, PSO provides slightly better resultsthan ACO, which becomes more obvious in illustrating the reduc-tion of Cmax in percent (Fig. 6).
In nine out of 21 optimization runs PSO provides the overallbest reduction of Cmax with 8.41% (or 116 min) and in the worstcase a reduction of 7.10% (98 min). In both respects ACO performsworse with a best reduction result of 8.19% (113 min) and in the
worst case 6.74% (93 min). Still both algorithms even in their worstperformances provide significantly better results for Cmax than theinitial sequence.
The computational times needed to perform the respective opti-mization runs with ACO and PSO are shown in Fig. 7.
Again PSO with a mean computational time of 764.46 s per-forms slightly better than ACO with a mean of 803.57 s in thisrespect.

Fig. 12. Results for TIdT when optimizing Cmax with PSO.
Fig. 13. Results for Cmax when optimizing TIdT with ACO.
Fig. 14. Results for Cmax when optimizing TIdT with PSO.
6844 F.T. Hecker et al. / Expert Systems with Applications 40 (2013) 6837–6847
4.2. Optimizing the total idle time of machines
As for the optimization of Cmax both evolutionary algorithmswere separately used to optimize TIdT and the results for 21respective optimization runs are displayed in Fig. 8.
Again the first run was made to receive the initial value of TIdTand runs two to 22 included the optimization routines. In contrastto the optimization of Cmax no tendency of one algorithm outper-forming the other can be investigated here. ACO and PSO provide
comparable optimization results. A more detailed overlook of theachieved reduction of TIdT is given in Fig. 9.
In four out of 21 runs PSO provided the best overall resultsreducing TIdT by 17.65% (1526 min) and producing a worst case re-sult of 8.89% (769 min). ACO performs quite similar but not reach-ing PSO with a best result of 16.80% (1453 min) and a reduction by7.94% (687 min) in its worst case. But as in the optimization of Cmax
both methods provided even in their worst performances signifi-cantly better results than the initial product sequence.
F.T. Hecker et al. / Expert Systems with Applications 40 (2013) 6837–6847 6845
Fig. 10 shows the respective computational times needed foreach run of the used algorithms.
Here again PSO shows slightly better results with a mean com-putational time of 761.11 s compared to ACO with a mean of776.40 s.
4.3. Influencing cost function one by optimizing cost function two
Since the optimization of Cmax and TIdT were performed sepa-rately and not as a multi-objective optimization task, the influ-ences of optimizing one of the cost functions with respect to theother were investigated. The results for the optimization of Cmax
and TIdT with ACO and PSO and the results for the respective notconsidered cost function, determined with the optimal sequenceof each run, are shown in Figs. 11–14. The initial value of the notconsidered cost function, meaning TIdT if Cmax was used as the costfunction to be minimized and vice versa, is depicted in each figureas the solid line for better visualization.
When optimizing Cmax only ACO provides better than the initialresults for TIdT in six out of 21 optimization runs, the results re-ceived with PSO show considerably increasing values for TIdT inall 21 runs.
The optimization of TIdT shows a positive effect on Cmax in mostoptimization runs. Only three optimization runs with ACO lead toincreased Cmax values compared to the initial sequence’s result, PSOleads in only one case to a slightly increased Cmax value (1383 mininstead of 1380 min). In most instances the optimization of TIdTleads to an optimization of Cmax regardless of the appliedalgorithm.
5. Discussion
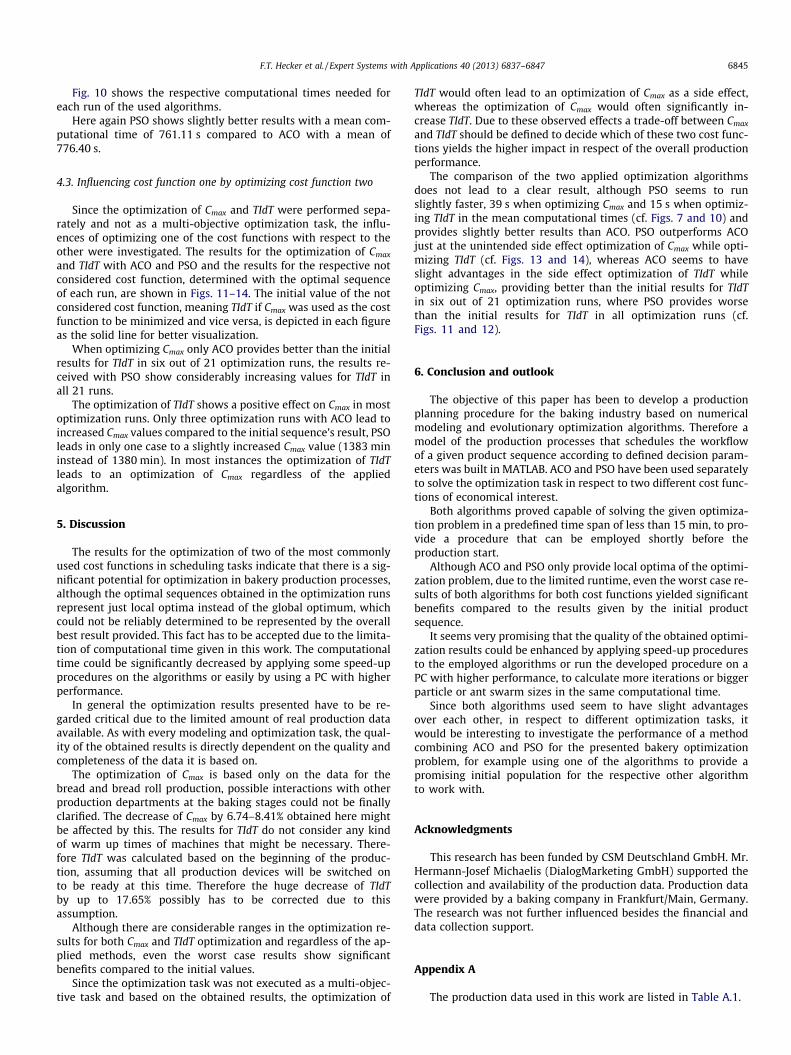
The results for the optimization of two of the most commonlyused cost functions in scheduling tasks indicate that there is a sig-nificant potential for optimization in bakery production processes,although the optimal sequences obtained in the optimization runsrepresent just local optima instead of the global optimum, whichcould not be reliably determined to be represented by the overallbest result provided. This fact has to be accepted due to the limita-tion of computational time given in this work. The computationaltime could be significantly decreased by applying some speed-upprocedures on the algorithms or easily by using a PC with higherperformance.
In general the optimization results presented have to be re-garded critical due to the limited amount of real production dataavailable. As with every modeling and optimization task, the qual-ity of the obtained results is directly dependent on the quality andcompleteness of the data it is based on.
The optimization of Cmax is based only on the data for thebread and bread roll production, possible interactions with otherproduction departments at the baking stages could not be finallyclarified. The decrease of Cmax by 6.74–8.41% obtained here mightbe affected by this. The results for TIdT do not consider any kindof warm up times of machines that might be necessary. There-fore TIdT was calculated based on the beginning of the produc-tion, assuming that all production devices will be switched onto be ready at this time. Therefore the huge decrease of TIdTby up to 17.65% possibly has to be corrected due to thisassumption.
Although there are considerable ranges in the optimization re-sults for both Cmax and TIdT optimization and regardless of the ap-plied methods, even the worst case results show significantbenefits compared to the initial values.
Since the optimization task was not executed as a multi-objec-tive task and based on the obtained results, the optimization of
TIdT would often lead to an optimization of Cmax as a side effect,whereas the optimization of Cmax would often significantly in-crease TIdT. Due to these observed effects a trade-off between Cmax
and TIdT should be defined to decide which of these two cost func-tions yields the higher impact in respect of the overall productionperformance.
The comparison of the two applied optimization algorithmsdoes not lead to a clear result, although PSO seems to runslightly faster, 39 s when optimizing Cmax and 15 s when optimiz-ing TIdT in the mean computational times (cf. Figs. 7 and 10) andprovides slightly better results than ACO. PSO outperforms ACOjust at the unintended side effect optimization of Cmax while opti-mizing TIdT (cf. Figs. 13 and 14), whereas ACO seems to haveslight advantages in the side effect optimization of TIdT whileoptimizing Cmax, providing better than the initial results for TIdTin six out of 21 optimization runs, where PSO provides worsethan the initial results for TIdT in all optimization runs (cf.Figs. 11 and 12).
6. Conclusion and outlook
The objective of this paper has been to develop a productionplanning procedure for the baking industry based on numericalmodeling and evolutionary optimization algorithms. Therefore amodel of the production processes that schedules the workflowof a given product sequence according to defined decision param-eters was built in MATLAB. ACO and PSO have been used separatelyto solve the optimization task in respect to two different cost func-tions of economical interest.
Both algorithms proved capable of solving the given optimiza-tion problem in a predefined time span of less than 15 min, to pro-vide a procedure that can be employed shortly before theproduction start.
Although ACO and PSO only provide local optima of the optimi-zation problem, due to the limited runtime, even the worst case re-sults of both algorithms for both cost functions yielded significantbenefits compared to the results given by the initial productsequence.
It seems very promising that the quality of the obtained optimi-zation results could be enhanced by applying speed-up proceduresto the employed algorithms or run the developed procedure on aPC with higher performance, to calculate more iterations or biggerparticle or ant swarm sizes in the same computational time.
Since both algorithms used seem to have slight advantagesover each other, in respect to different optimization tasks, itwould be interesting to investigate the performance of a methodcombining ACO and PSO for the presented bakery optimizationproblem, for example using one of the algorithms to provide apromising initial population for the respective other algorithmto work with.
Acknowledgments
This research has been funded by CSM Deutschland GmbH. Mr.Hermann-Josef Michaelis (DialogMarketing GmbH) supported thecollection and availability of the production data. Production datawere provided by a baking company in Frankfurt/Main, Germany.The research was not further influenced besides the financial anddata collection support.
Appendix A
The production data used in this work are listed in Table A.1.

Tabl
eA
.1Pr
oduc
tion
data
used
.
Prod
uct
/Sta
gePr
epar
atio
nK
nea
der
1K
nea
der
2K
nea
der
3D
ough
Res
tD
&F
1D
&F
2D
&F
3D
&F
4D
&F
5D
&F
6D
&F
7R
efin
ing
1Pr
oofi
ng
1Pr
oofi
ng
2Fr
eeze
r1
LT Proo
fin
gSt
iffe
nin
gR
efin
ing
2B
akin
g1
Bak
ing
2B
akin
g3
Dep
ann
ing
Pack
agin
gFr
eeze
r2
Dis
trib
uti
on
Flu
te5
00
2018
00
00
00
030
075
00
020
50
035
00
08
Flu
teh
albg
eb.(
Prod
)5
00
2042
00
00
00
030
075
00
020
50
024
015
10
Cia
batt
aB
rötc
hen
50
015
180
00
00
075
00
010
00
00
00
220
00
10K
orn
Eck
100
90
250
00
110
00
030
00
00
00
050
00
010
Din
kel-
Vol
lkor
n-b
rot
750
g8
09
030
00
016
00
00
450
00
00
500
00
00
8
Bag
uet
te25
0g
50
015
600
00
00
040
090
00
020
80
240
200
010
Bio
-Vie
lkor
n-b
rot
500
g10
90
020
00
016
00
00
500
00
04
060
00
00
8B
agu
ette
500
g5
00
1560
00
00
00
300
900
00
2010
035
015
00
10B
rot
1000
g5
09
020
00
016
00
00
500
00
00
00
630
00
8B
rot
1000
g5
09
020
00
016
00
00
500
00
00
00
630
00
8B
rot
1000
g5
09
020
00
016
00
00
500
00
00
00
630
00
8B
io-L
andb
rot
500
g10
130
045
00
00
023
00
400
00
07
00
450
00
8H
olzl
uck
en75
0g
50
90
150
00
210
00
00
700
00
00
055
00
08
Hol
zlu
cken
750
g5
09
015
00
021
00
00
070
00
00
00
550
00
8M
isch
brot
500
g5
08
015
00
026
00
05
600
00
00
00
530
00
8M
isch
brot
1000
g5
08
015
00
021
00
05
600
00
00
00
550
00
8M
isch
brot
1000
g5
08
015
00
021
00
05
600
00
00
00
550
00
8La
ndb
rot
1000
g5
00
1190
00
00
029
00
750
00
04
00
550
00
5La
ndb
rot
1000
g5
00
1190
00
00
029
00
750
00
04
00
550
00
5B
auer
nbr
ot50
0g
50
90
200
00
260
00
560
00
00
00
055
00
08
Bau
ern
brot
1000
g5
09
020
00
021
00
05
600
00
00
00
600
00
8B
agu
ette
-tei
glin
g25
0g
(Pro
d)5
00
1522
00
00
00
025
090
00
020
80
170
2035
112
Bes
tes
1000
g5
00
915
00
00
310
00
400
00
00
00
600
00
8B
este
s10
00g
50
09
150
00
031
00
040
00
00
00
060
00
08
Fitn
essb
rot
50
90
200
00
260
00
560
00
00
00
050
00
08
Kor
nac
ker
750
g10
00
915
00
00
310
00
300
00
00
00
530
00
10K
arto
ffel
-bro
t50
0g
80
150
200
00
210
00
040
00
00
40
045
00
05
Kü
rbis
kern
(GV
)5
00
140
030
00
00
00
00
10
00
00
00
00
0D
oppe
l-kr
ust
e5
09
020
00
026
00
05
600
00
00
00
400
00
8R
ogge
n(G
V)
50
014
00
300
00
00
00
00
10
00
00
00
00
Vol
lkor
n-b
rötc
hen
(GV
)5
00
140
030
00
00
00
00
01
00
00
00
00
0K
rust
i(G
V)
50
015
400
00
00
400
00
00
10
00
00
00
00
Euro
-Brö
tch
en(G
V)
514
00
00
250
00
00
00
00
10
00
00
00
00
Kör
ni
(GV
)5
00
140
030
00
00
00
00
01
00
00
00
00
0B
ioB
rötc
hen
(GV
)5
00
140
030
00
00
00
00
01
00
00
00
00
0Fr
anzo
sen
-brö
tch
en(G
V)
40
014
200
035
00
00
045
030
10
00
00
00
00
Was
ser-
wec
k(G
V)
40
014
200
025
00
00
045
030
10
00
00
00
00
Fitn
ess
Brö
tch
enTL
(GV
)4
140
015
200
00
00
00
00
101
00
00
00
00
0K
aise
r(G
V)
40
014
150
065
00
00
00
00
10
00
00
00
00
Kai
sert
eig-
lin
g(G
V)
40
014
150
020
00
00
00
00
10
00
00
00
00
6846 F.T. Hecker et al. / Expert Systems with Applications 40 (2013) 6837–6847

F.T. Hecker et al. / Expert Systems with Applications 40 (2013) 6837–6847 6847
References
Ahmadizar, F. (2012). A new ant colony algorithm for makespan minimization inpermutation flow shops. Computers & Industrial Engineering, 63, 355–361.
Bank, M., Fatemi Ghomi, S. M. T., Jolai, F., & Behnamian, J. (2012). Application ofparticle swarm optimization and simulated annealing algorithms in flow shopscheduling problem under linear deterioration. Advances in EngineeringSoftware, 47, 1–6.
Collado-Fernández, M. (2003). BREAD and dough fermentation. In B. Caballero (Ed.),Encyclopedia of food sciences and nutrition (2nd ed., pp. 647–655). Oxford:Academic Press.
Dorigo, M. (1992). Optimization, learning and natural algorithms. Ph.D. thesis,Politecnico di Milano, Italy.
Eberhart, R. C., & Shi, Y. (2001). Particle swarm optimization: Developments,applications and resources. In Proceedings of the IEEE conference on evolutionarycomputation, ICEC 1 (pp. 81–86).
Kennedy, J., & Eberhart, R. C. (1995). Particle swarm optimization. In IEEEinternational conference on neural networks – conference proceedings, 4 (pp.1942–1948).
Li, D., & Deng, N. (2012). Solving permutation flow shop scheduling problem with acooperative multi-swarm PSO algorithm. Journal of Information andComputational Science, 9(4), 977–987.
Li, X., Baki, M. F., & Aneja, Y. P. (2010). Flow shop scheduling to minimize the totalcompletion time with a permanently present operator: Models and ant colonyoptimization metaheuristics. Computers & Operations Research. http://dx.doi.org/10.1016/j.cor.2010.04.009.
Lian, Z., Gu, X., & Jiao, B. (2008). A novel particle swarm optimization algorithm forpermutation flow-shop scheduling to minimize makespan. Chaos, Solitons andFractals, 35, 851–861.
Liao, C.-J., Tjandradjaja, E., & Chung, T.-P. (2012). An approach using particle swarmoptimization and bottleneck heuristic to solve hybrid flow shop schedulingproblem. Applied Soft Computing, 12, 1755–1764.
Liu, B., Wang, L., Liu, Y., Qian, B., & Jin, Y.-H. (2010). An effective hybrid particleswarm optimization for batch scheduling of polypropylene processes.Computers and Chemical Engineering, 34, 518–528.
Pan, Q.-K., Tasgetiren, M. F., & Liang, Y.-C. (2008). A discrete particle swarmoptimization algorithm for the no-wait flowshop scheduling problem.Computers & Operations Research, 35, 2807–2839.
Perez-Gonzalez, P., & Framinan, J. M. (2010). Setting a common due data in aconstrained flowshop: A variable neighbourhood search approach. Computers &Operations Research, 37, 1740–1748.
Pinedo, M. L. (2008). Scheduling – theory, algorithms, and systems (3rd ed.). NewYork: Springer.
Ruiz, R., & Vazquez-Rodriguez, J. A. (2010). The hybrid flow shop schedulingproblem. European Journal of Operational Research, 205, 1–18.
Tang, Q., & Tang, L. (2012). Heuristic particle swarm optimization for batching andscheduling flowshop with sequence-independent setup time. Applied Mechanicsand Materials, 130–134, 2504–2507.
Tasgetiren, M. F., Liang, Y., Sevkli, M., & Gencyilmaz, G. (2007). A particle swarmoptimization algorithm for makespan and total flowtime minimization in thepermutation flowshop sequencing problem. European Journal of OperationalResearch, 177, 1930–1947.
Tzeng, Y.-R., & Chen, C.-L. (2012). A hybrid EDA with ACS for solving permutationflow shop scheduling. International Journal of Advanced ManufacturingTechnology, 60(9–12), 1139–1147.
Wang, Y., & Yang, Y. (2010). Particle swarm with equilibrium strategy of selectionfor multi-objective optimization. European Journal of Operational Research, 200,187–197.
Yagmahan, B., & Yenisey, M. M. (2010). A multi-objective ant colony systemalgorithm for flow shop scheduling problem. Expert Systems with Applications,37, 1361–1368.
Zentralverband des Deutschen Bäckerhandwerks e. V. (2012). http://www.baeckerhandwerk.de/baeckerhandwerk/zahlen-fakten, last accessed22.05.2013.
Copyright © 2022 FDOKUMEN