webMethods Optimize User's Guide - Software AG Documentation
204
webMethods Optimize User's Guide Version 10.7 October 2020
-
Upload
khangminh22 -
Category
Documents
-
view
3 -
download
0
Transcript of webMethods Optimize User's Guide - Software AG Documentation

webMethods Optimize User's Guide
Version 10.7
October 2020

This document applies to webMethods Optimize 10.7 and to all subsequent releases.
Specifications contained herein are subject to change and these changes will be reported in subsequent release notes or new editions.
Copyright © 2003-2022 Software AG, Darmstadt, Germany and/or Software AG USA, Inc., Reston, VA, USA, and/or its subsidiariesand/or its affiliates and/or their licensors.
The name Software AG and all Software AG product names are either trademarks or registered trademarks of Software AG and/orSoftware AGUSA Inc. and/or its subsidiaries and/or its affiliates and/or their licensors. Other company and product namesmentionedherein may be trademarks of their respective owners.
Detailed information on trademarks and patents owned by Software AG and/or its subsidiaries is located athttps://softwareag.com/licenses/.
Use of this software is subject to adherence to Software AG's licensing conditions and terms. These terms are part of the productdocumentation, located at https://softwareag.com/licenses/ and/or in the root installation directory of the licensed product(s).
This software may include portions of third-party products. For third-party copyright notices, license terms, additional rights orrestrictions, please refer to "License Texts, Copyright Notices and Disclaimers of Third Party Products". For certain specific third-partylicense restrictions, please refer to section E of the Legal Notices available under "License Terms and Conditions for Use of SoftwareAG Products / Copyright and Trademark Notices of Software AG Products". These documents are part of the product documentation,located at https://softwareag.com/licenses/ and/or in the root installation directory of the licensed product(s).
Document ID: OPT-UG-107-20220209

Table of Contents
About this Guide........................................................................................................................................7Document Conventions.....................................................................................................................8Online Information and Support.....................................................................................................8Data Protection...................................................................................................................................9
1 Concepts..................................................................................................................................................11webMethods Business Activity Monitoring (BAM) Components............................................12Implementation.................................................................................................................................12Data Collection..................................................................................................................................15Infrastructure Data Collector..........................................................................................................16Web Service Data Collector.............................................................................................................18Key Performance Indicators (KPI).................................................................................................19Business Processes............................................................................................................................21Rules...................................................................................................................................................21Optimize Home Page.......................................................................................................................22Users...................................................................................................................................................22
2 Business Visualization Concepts.......................................................................................................25Business Processes............................................................................................................................26Key Performance Indicators............................................................................................................27Dimensions........................................................................................................................................29KPI Instances.....................................................................................................................................30Trends.................................................................................................................................................31Rules...................................................................................................................................................31Events.................................................................................................................................................31KPI Data Display..............................................................................................................................32KPI Historical Average Values........................................................................................................33Event Display....................................................................................................................................35
3 Monitoring System Component and Business Process Performance.........................................37Overview of Monitoring System Component and Business Process Performance................38Viewing System Component and Business Process Problems..................................................39Viewing Problem Details.................................................................................................................41Using the Analytics Overview Page..............................................................................................44Viewing the Overall Status of Process Instances.........................................................................53Viewing Details for a Process Instance..........................................................................................65Viewing Process Metrics..................................................................................................................81
4 Improving the Long-Term Performance of a Process.....................................................................83Overview...........................................................................................................................................84What is Six Sigma?...........................................................................................................................84Understanding the Six Sigma Summary Page.............................................................................85Viewing Six Sigma Information about a Process.........................................................................87
webMethods Optimize User's Guide 10.7 iii

5 Viewing Information About Rules....................................................................................................89Viewing the Rule List.......................................................................................................................90Viewing Rule Instances....................................................................................................................92Viewing Details for Rules and Rule Violations............................................................................93Viewing a History of Rule Violations............................................................................................96Viewing Rule Audit Information...................................................................................................97
6 Defining Rules.......................................................................................................................................99Overview.........................................................................................................................................100Creating a Rule...............................................................................................................................102Setting Rule Attributes..................................................................................................................104Creating an Instant Rule................................................................................................................106Creating Rule Expressions............................................................................................................107Rule Alerts.......................................................................................................................................131Managing Rules..............................................................................................................................132Managing Rule Filters....................................................................................................................135
7 Responding to Problem Alerts.........................................................................................................141Responding to an E-mail Alert.....................................................................................................143Responding to Pager or Mobile Phone Text Message Alerts...................................................144
8 Analyzing Information about Key Performance Indicators.......................................................145Analyzing Information about Key Performance Indicators.....................................................146Performance Comparisons............................................................................................................146Historical Analyses........................................................................................................................146Scale and Units on the KPI Summary Page................................................................................147Data Formats on the KPI Instance Detail Page...........................................................................147Error Messages for Monitored Components..............................................................................148Understanding the KPI Summary Page......................................................................................148Using the KPI Summary Page......................................................................................................153Using the KPI Instance Detail Page.............................................................................................157
9 Process Analytics.................................................................................................................................167Overview.........................................................................................................................................168Process Metrics Panel.....................................................................................................................168Process Diagram Panel..................................................................................................................170Metrics Detail Panel.......................................................................................................................172Viewing Rule Violation Details in the Metrics Detail Panel.....................................................174Viewing Step Information from the Process Diagram Panel...................................................175Understanding Business Process Models...................................................................................176
10 Diagnostics.........................................................................................................................................181Viewing Diagnostic Information..................................................................................................182
A Optimize Icons...................................................................................................................................183
iv webMethods Optimize User's Guide 10.7
Table of Contents

About Optimize Icons....................................................................................................................184Status Icons......................................................................................................................................184Rule Icons........................................................................................................................................185SLA Rule Icons................................................................................................................................186Monitor/KPI Icon............................................................................................................................186Process Analytics Icon...................................................................................................................187Six Sigma Icon.................................................................................................................................187Diagnosis Trend Icons....................................................................................................................187Analytics Overview Icons.............................................................................................................188
B Glossary................................................................................................................................................191
webMethods Optimize User's Guide 10.7 v
Table of Contents

vi webMethods Optimize User's Guide 10.7
Table of Contents

About this Guide
■ Document Conventions .................................................................................................... 8
■ Online Information and Support ....................................................................................... 8
■ Data Protection ................................................................................................................. 9
webMethods Optimize User's Guide 10.7 7

This guide explains how to use webMethods Optimize to analyze system and business processes,monitor resource availability and events, establish thresholds, and respond to alerts.
Note that this guide covers bothOptimize for Process andOptimize for Infrastructure. Informationthat is specific to each version of the product is called out within the chapters as appropriate.
Important:Values entered into XML files are case sensitive, so they must be entered exactly as representedin this document.
Document Conventions
DescriptionConvention
Identifies elements on a screen.Bold
Identifies service names and locations in the format folder.subfolder.service, APIs,Java classes, methods, properties.
Narrowfont
Identifies:Italic
Variables for which you must supply values specific to your own situation orenvironment.New terms the first time they occur in the text.References to other documentation sources.
Identifies:Monospace font
Text you must type in.Messages displayed by the system.Program code.
Indicates a set of choices from which you must choose one. Type only theinformation inside the curly braces. Do not type the { } symbols.
{ }
Separates two mutually exclusive choices in a syntax line. Type one of thesechoices. Do not type the | symbol.
|
Indicates one or more options. Type only the information inside the squarebrackets. Do not type the [ ] symbols.
[ ]
Indicates that you can type multiple options of the same type. Type only theinformation. Do not type the ellipsis (...).
...
Online Information and Support
Software AG Documentation Website
You can find documentation on the Software AG Documentation website at http://documentation.softwareag.com.
8 webMethods Optimize User's Guide 10.7

Software AG Empower Product Support Website
If you do not yet have an account for Empower, send an email to [email protected] name, company, and company email address and request an account.
Once you have an account, you can open Support Incidents online via the eService section ofEmpower at https://empower.softwareag.com/.
You can find product information on the Software AG Empower Product Support website athttps://empower.softwareag.com.
To submit feature/enhancement requests, get information about product availability, and downloadproducts, go to Products.
To get information about fixes and to read early warnings, technical papers, and knowledge basearticles, go to the Knowledge Center.
If you have any questions, you can find a local or toll-free number for your country in our GlobalSupport Contact Directory at https://empower.softwareag.com/public_directory.aspx and give usa call.
Software AG TECHcommunity
You can finddocumentation and other technical information on the SoftwareAGTECHcommunitywebsite at http://techcommunity.softwareag.com. You can:
Access product documentation, if you have TECHcommunity credentials. If you do not, youwill need to register and specify "Documentation" as an area of interest.
Access articles, code samples, demos, and tutorials.
Use the online discussion forums, moderated by Software AG professionals, to ask questions,discuss best practices, and learn how other customers are using Software AG technology.
Link to external websites that discuss open standards and web technology.
Data Protection
SoftwareAGproducts provide functionalitywith respect to processing of personal data accordingto the EU General Data Protection Regulation (GDPR). Where applicable, appropriate steps aredocumented in the respective administration documentation.
webMethods Optimize User's Guide 10.7 9

10 webMethods Optimize User's Guide 10.7

1 Concepts
■ webMethods Business Activity Monitoring (BAM) Components ..................................... 12
■ Implementation ............................................................................................................... 12
■ Data Collection ............................................................................................................... 15
■ Infrastructure Data Collector .......................................................................................... 16
■ Web Service Data Collector ........................................................................................... 18
■ Key Performance Indicators (KPI) .................................................................................. 19
■ Business Processes ....................................................................................................... 21
■ Rules .............................................................................................................................. 21
■ Optimize Home Page ..................................................................................................... 22
■ Users .............................................................................................................................. 22
webMethods Optimize User's Guide 10.7 11

This chapter explains the components and concepts behindwebMethodsOptimize business activitymonitoring. It describes the architecture of the Optimize implementation, and the processes bywhich data is collected and processed in the Optimize application. In addition, it discusses theinteraction between Key Performance Indicators (KPIs), operational data, business processes, andrules in analyzing and displaying collected data. Finally, it describes the tasks that system andbusiness users perform and the roles that users can be assigned.
webMethods Business Activity Monitoring (BAM) Components
Optimize supports various levels of Business ActivityMonitoring (BAM) depending on customerneeds. Business activitymonitoring enables you to analyze real time businessmetrics information,including systemperformance, processmetrics, business activity volume and responsiveness, andother key performance indicators (KPIs). Aggregate analyticsworking in parallelwith instance-leveldata provide information that you can use to eliminate problems, increase efficiency, and takeadvantage of business opportunities.
Optimize uses data collectors to gather data from business sources and other webMethodscomponents, and this data supports business activitymonitoring. Note that Optimize runs withinthe My webMethods user interface and makes use of much of the standard functionality that isavailable through this interface.
Two different implementations of Optimize are available to customers: Optimize for Infrastructureand Optimize for Process.
Optimize for Infrastructure enables you to monitor system resources in real time. Resourcedata consists of data about equipment and applications, such as queue length and whether amanagedwebMethods component is online or offline. You canmonitor individual objects andthe overall status of your system. Optimize for Infrastructure contains two components:InfrastructureData Collector andOptimize. Optimize for Infrastructure uses the InfrastructureData Collector to collect system data.
Optimize for Process enables you tomonitor business processes, activities, and events as wellas other business related information. You can trackKPIs that relate to operational factors suchasmargin, revenue, customer satisfaction, and inventory levels.WithOptimize you can compareactual performance with rules you establish. If a monitored item goes out of compliance witha rule, Optimize alerts you so that you can address the problem. In addition, you can use SixSigma to analyze the business processes. Six Sigma is a disciplinedmethodology for improvingbusiness process performance by eliminating defects. Using thismethodology, you canmeasurethe number of defects in a process and systematically determine how to eliminate them.Optimize for Process also includes business visualization tools that provide at-a-glancemashupsof Optimize monitoring information.
Implementation
The following table lists the five main functions that the Optimize implementations perform.
SubcomponentFunction
One or more Web Service Data CollectorsData collection
12 webMethods Optimize User's Guide 10.7
1 Concepts

SubcomponentFunction
Infrastructure Data Collector, containing SNMP data collector
A JMS Server, usually either Software AG Universal Messaging orwebMethods Broker (deprecated)
Data communication
One or more Analytic EnginesData processing andanalysis
Database componentsData storage
My webMethods user interfaceData presentation
Each subcomponent can reside on its own separate host, or all subcomponents can reside on thesame host.
Typical Optimize Implementation
webMethods Optimize User's Guide 10.7 13
1 Concepts

Data CollectionOptimize collects data from other webMethods applications, through the Infrastructure DataCollector, or through theWeb ServiceData Collector(s). Formore information about data collection,see “Data Collection” on page 15.
Data Communication
Important:webMethods Broker has been deprecated.
Both Software AG Universal Messaging and webMethods Broker provide a Java Message Service(JMS) communication layer that allows data collected by the Data Collector to be fed into theOptimize Analytic Engine for processing. For more information about Software AG UniversalMessaging, see the Terracotta website. For more information about webMethods Broker, seewebMethods Broker Client Java API Programmer’s Guide.
Data Processing and Analysis
Optimize processes data by way of one or more Analytic Engines. The Analytic Engine receivesbusiness, system, and process data from the data collection engine, and saves the data in thedatabases. Optimize analyzes data, saves the analysis in the database, sends information aboutthe status of business and system activity to the My webMethods user interface, and performsother actions when problems occur, such as sending alerts to specified users.
An Analytic Engine contains the following things:
An event handler, which receives business and system data from the Infrastructure and WebService Data Collectors and from other webMethods products. Business data consists of theunderlying data that make up a business process, such as revenue and order number and isspecific toOptimize for Process. Systemdata consists of data about equipment or applications,such as queue length and whether a managed component is online or offline. The analyticengine writes this data to the database in a format that business intelligence software can useto generate reports.
A process tracker, which receives business process data from theWeb Service Data Collectorsand other webMethods products, and tracks the state of executing processes. As a processexecutes, the process tracker takesmeasurements about the process instance and its steps, suchas wait time and cycle time. This information can be used to track performance of a businessprocess or to alert you when certain conditions exist, such as performance degradation or afailure in process execution.
An analysis engine, which runs algorithms on the data.
A rules engine which compares the data it receives from the Analytic Engine to rules thatdetect when a process or resource requires user attention.
14 webMethods Optimize User's Guide 10.7
1 Concepts

A Web services layer, which sends the results of the analysis to the My webMethods Server.The My webMethods user interface presents the results, along with icons that indicate that arule violation has occurred or that Optimize has diagnosed a trend.
Data PresentationOptimize presents data by way of the My webMethods user interface. My webMethods enablesusers to log in to all webMethods components that are incorporated into My webMethods usinga single user name and password.
In addition to presenting data, theMywebMethods user interface provides access to administrativefunctions. Using theMywebMethods administrative functions, Optimize administrators can createusers, groups, and roles; grant access to My webMethods functions using Lightweight DirectoryAccess Protocol (LDAP) or other means; and configure system, business, and business processdata. Optimize users can use other functional areas ofMywebMethods to create rules for comparingdata, monitoring business and system data, and tracking business processes.
For more information about the MywebMethods user interface, seeWorking with My webMethods.
Database ComponentsOptimize stores data in relational databases. The Optimize database consists of four components:the Analysis, Process Tracker, Process Audit Log (PAL), and My webMethods Server (MWS)database components. Formore information about database components, see Part III, “ForDatabaseAdministrators,” in Administering webMethods Optimize.
Data Collection
Data collected frommanyparts of the enterprise infrastructure is fed into theOptimize environmentand stored. KPIs that represent information vital to the business are defined and applied to thedata. These KPIs are analyzed in real time in order to learn normal behavior and detect abnormalbehavior within the environment. Rules are applied to these KPIs and their analyses in order todefine conditions that represent problems and opportunities. Violations of these rules can bereported to the appropriate people and automated corrective actions can be taken. Further detailcan be provided about a particular violation to determine the true root cause of the situation. OnceOptimize has learned enough about the business, it can predict the occurrence of problems andthus allow staff to correct the problems even before they occur. Optimize also allows you tocorrelate information fromdisparate parts of the enterprise, such as the system and infrastructure,business processes and business data, and services. In addition, it provides analytic mashups,which are graphical overlays of correlated data such as business process information overlaidwith real-time statistics.
Optimize collects data from other webMethods applications, through the Infrastructure DataCollector, or through the Web Service Data Collector. The following diagram illustrates howOptimize collects, defines, stores, and analyzes data.
webMethods Optimize User's Guide 10.7 15
1 Concepts

Infrastructure Data Collector
The Infrastructure Data Collector is the primary method for collecting infrastructure and SNMPdata. The Infrastructure Data Collector uses the Monitoring API to pass operational data andmonitoringmodel data to theAnalytic Engine. TheMonitoringAPI is designed as a programmaticinterface to the systemsmonitoring functionality of a business integration platform. It communicatesover JMS, utilizing a JMS queue, to provide secure and reliable communications betweenOptimizeand the Infrastructure Data Collector.
The Infrastructure Data Collector lets you identify webMethods and ETS component resourcesthat you want to monitor and analyze. Using the Infrastructure Data Collector, you can monitorthe following:
AdabasWhen youmonitorAdabas, InfrastructureDataCollector canmonitor KPI definitions.Formore information, see “Monitored KPI Definitions” inAdministering webMethods Optimize.
Adabas SOAGatewayWhen youmonitorAdabas SOAGateway, InfrastructureDataCollectorcan monitor KPI definitions. For more information, see “Monitored KPI Definitions” inAdministering webMethods Optimize.
ApamaWhen youmonitor Apama, Infrastructure Data Collector canmonitor KPI definitions.Formore information, see “Monitored KPI Definitions” inAdministering webMethods Optimize.
16 webMethods Optimize User's Guide 10.7
1 Concepts

Broker ServerWhen youmonitor a Broker Server, Infrastructure Data Collector automaticallymonitors related items. Such items include Brokers, Custom Adapter (Broker Clients), andDocument Types that are running on the Broker Server.
Com-pleteWhen you monitor Com-plete, Infrastructure Data Collector can monitor KPIdefinitions. Formore information, see “MonitoredKPIDefinitions” inAdministeringwebMethodsOptimize.
Digital Event ServicesWhen youmonitor Digital Event Services, InfrastructureData Collectorcan monitor KPI definitions. For more information, see “Monitored KPI Definitions” inAdministering webMethods Optimize.
Event Routing (Deprecated) When you monitor Event Routing (deprecated), InfrastructureData Collector can monitor KPI definitions. For more information, see “Monitored KPIDefinitions” in Administering webMethods Optimize.
Integration ServerWhen you monitor an Integration Server, Infrastructure Data Collectorautomatically monitors related items as well. Such items include the Integration Serverrepository and all Integration Server ports; Trading Networks Server, if you have thatcomponent installed; packages that are running on the Integration Server; and the connections,polling notifications, and services of adapters that are running on the Integration Server. Tolessen the load on InfrastructureData Collector, you can choose tomonitor only certain serviceson an Integration Server.
My webMethods ServerWhen you monitor My webMethods Server, Infrastructure DataCollector canmonitor KPI definitions. Formore information, see “Monitored KPI Definitions”in Administering webMethods Optimize.
NaturalWhen youmonitorNatural, InfrastructureData Collector canmonitor KPI definitions.Formore information, see “Monitored KPI Definitions” inAdministering webMethods Optimize.
Natural forAjaxWhen youmonitorNatural forAjax, InfrastructureDataCollector canmonitorKPI definitions. For more information, see “Monitored KPI Definitions” in AdministeringwebMethods Optimize.
Presto version 9.9When you monitor Presto version 9.9, Infrastructure Data Collector canmonitorKPI definitions. Formore information, see “MonitoredKPIDefinitions” inAdministeringwebMethods Optimize.
TerracottaWhen you monitor Terracotta, Infrastructure Data Collector can monitor KPIdefinitions. Formore information, see “MonitoredKPIDefinitions” inAdministeringwebMethodsOptimize.
Software AGMashZone NextGenWhen you monitor a MashZone NextGen server,InfrastructureDataCollector canmonitorKPI definitions . Formore information, see “MonitoredKPI Definitions” in Administering webMethods Optimize.
SNMP agents Infrastructure Data Collector enables you to specify how often the SNMP datacollector discovery andmonitoring agents poll SNMP agents for variables and table instances.You can also specify how often the agents attempt to connect to SNMP agents when one ormore agents are down.
webMethods Optimize User's Guide 10.7 17
1 Concepts

webMethods adapters InfrastructureData Collector enables you tomonitor adapters installedon Integration Servers. When you start monitoring an Integration Server, Infrastructure DataCollector automatically starts monitoring all adapters that are installed on the IntegrationServer.
webMethodsApplinXWhen youmonitor ApplinX, InfrastructureData Collector canmonitorKPI definitions. For more information, see “Monitored KPI Definitions” in AdministeringwebMethods Optimize.
webMethods EntireXWhen you monitor EntireX, Infrastructure Data Collector can monitorKPI definitions. For more information, see “Monitored KPI Definitions” in AdministeringwebMethods Optimize.
Software AG Universal Messaging and Universal Messaging ClusterWhen you monitorUniversalMessaging andUMCluster, InfrastructureDataCollector canmonitorKPI definitions.Formore information, see “Monitored KPI Definitions” inAdministering webMethods Optimize.
Web Service Data Collector
The Web Service Data Collector is installed automatically with Optimize. Web services providean interface to Optimize through which client programs can send operational data aboutapplications or equipment in your enterprise (such as databases, printers, or disk drives), processdata (such as the start and end time of each step in process instances), or business data (such ascustomers, order quantities, and revenues). Optimize then displays the data in the form of systemKPI instances for operational data or business KPI instances for business process data.
Tip:You can use Software AG Designer to generate the client program and the SOAP messages forthe Web Service Data Collector automatically. For details, see the Software AG Designer help.
Depending on the size of your enterprise, you can distribute the load by deploying Web servicesto systems that host applications and processes you want to monitor. Web services gather thesummarized data and send them to the Analytic Engine, which in turn stores the data in thedatabase and displays it in the My webMethods user interface. In addition, the Analytic Engineruns algorithms on the data to produce a variety of diagnoses. These diagnoses enable Optimizeto automatically and continually compare summarized data with a baseline of historical behaviorand indicate when types of data are deviating from that baseline.
Note:You can provide your own definitions of what types of data are out of compliance by definingrules. Formore information about defining rules, see “Defining Rules” on page 99 in this guide.
If you havewebMethods Integration Server andDesigner, you can build Integration Server servicesthat useWeb services to gather data for Optimize. For example, you could do any of the following:
You can use Integration Server services to gather data aboutwebMethods components. Supposeyou are usingwebMethods Broker (deprecated). You could create an Integration Server servicethat uses Web services to create system KPI instances for types of data in certain Brokerdocuments, listens for those Broker documents, gets the appropriate field values from thedocuments, and uses Web services to push the data to the created system KPI instances in
18 webMethods Optimize User's Guide 10.7
1 Concepts

Optimize. Formore information, see the chapter titled “Configuring andUsing theWeb ServiceData Collector” in Administering webMethods Optimize.
You can use webMethods adapters with Integration Server services to gather data aboutresources in your enterprise. Suppose your enterprise includes an SAP system and you usethe webMethods Adapter for SAP to connect that resource to your webMethods components.You could create an Integration Server service that uses Web services to create system KPIinstances for types of data relating to the SAP system, uses the SAP Adapter to query the SAPsystem for the data at regular intervals, and uses Web services to push the data to the createdsystem KPI instances in Optimize.
In Optimize for Process, you can use Web services to gather data about business processes inyour enterprise. Suppose youwant tomonitor a business process. Youwould useWeb servicesto push data about each process instance toOptimize as the process instance executes. Typically,you would push data about the start and end of each step in the process instance and aboutprocess run-time events thatmight indicate that an error or awarning occurred during processexecution. You could obtain that data from a log file, from a database, or from the businessprocess code itself.
Also in Optimize for Process, you can use Web services to gather data about your enterprise'sbusiness transactions. If you are monitoring business data, you would use Web services topush data about each transaction instance to Optimize as the instance executes. Typically, youwould push data about customers, products, order quantities, and revenue.
Key Performance Indicators (KPI)
You can monitor quantitative business and system data by defining key performance indicators(KPIs). KPIs are quantifiablemeasurements that reflect the critical success factors of an organization.Optimize uses KPIs to monitor data for exceptions and trends and to help you answer questionssuch as the following:
What is the queue length for this operating system?
How many orders over $10,000 have completed for this process? (Optimize for Process)
What is the revenue for the southeast region? (Optimize for Process)
For example, when usingOptimize for Process, in an ordermanagement process, youmight defineKPIs for howmany orders were received, their dollar amounts, and whether they were processedsuccessfully. You can also define KPIs that compare volume by order channel or cycle time bycustomer type.
In Optimize, KPIs consist of the following things:
Dimensions, such as customer, region, dealer, or sales person
Event maps, which associate business data, such as dimensions, measures (measurable andmonitorable numeric quantities such as revenue), and transactional attributes, with a particularbusiness process
KPI definitions, which associate a measure with a dimension (a means for breaking out yourdata into slices), such as revenue by region or queue length by host
webMethods Optimize User's Guide 10.7 19
1 Concepts

Hierarchies, which determine how dimensions are related. Optimize uses these relationshipsto aggregate and organize data on My webMethods business process and system monitoringpages.
KPI Instances and KPIs
You can create a key performance indicator (KPI) for each type of data that the Web Service DataCollector collects. Optimize creates and stores data that corresponds to the KPI in a KPI instance.For example, for a KPI that tracks Broker client connection state, Optimize creates one KPI instancefor each tracked Broker. For more information about the Web Service Data Collector, see “ WebService Data Collector” on page 18.
When you create a KPI, you can specify a collection interval to summarize the data stored for theKPI instance associatedwith the KPI. The Analytic Engine runs algorithms on the data to producea variety of diagnoses. These diagnoses enable Optimize to automatically and continually comparesummarized data samples to a baseline of historical behavior and indicate when types of data aredeviating from that baseline.
Note:You can provide your own definitions of when types of data are out of compliance by definingrules. For more information about defining rules, see “Defining Rules” on page 99.
System KPI instances store data about applications, and business KPI instances store data aboutbusiness data and processes. In the My webMethods interface, each type of data that Optimizecollects is represented by the KPI instance in which the data is stored.
Each KPI instance performs a specific function for its data, as described in the following table.
FunctionKPI instance
Sums the data points collected over each collection interval. An example forthis type of KPI instance is to tally process step errors.
Sum
Calculates the average value of the data collected over each collection interval.An example for this type of KPI instance is to track CPU usage.
Average
Stores the value of the last data collected in the collection interval. An examplefor this type of KPI instance is to track the size of a queue.
Last Value
Stores the value of last data collected in each collection interval, where thepossible values are 1 (online) or 0 (offline). An example for this type of KPIinstance is to track the state of an application.
State
Stores the maximum value of the data collected in the collection interval.Max
Stores the minimum value of the data collected in the collection interval.Min
Counts the number of data points over each collection interval. An examplefor this type of KPI instance is to count the number of order events.
Count
20 webMethods Optimize User's Guide 10.7
1 Concepts

Business Processes
Optimize for Process can analyze and display status information for the following two types ofbusiness processes:
webMethods -executed processes (processes that are executed and tracked by thewebMethodsProcess Engine).
Externally-executed processes (processes that are not executed and tracked by thewebMethodsProcess Engine). For externally-executed processes, Optimize has no knowledge of the rulesand data that determine whether these transitions are valid. Therefore, for these processes,Optimize does not recognize invalid step transitions based on branch or split conditions anddoes not detect or report errors when such conditions occur.
You can use SoftwareAGDesigner to design business processmodels. Formore information aboutusing Software AG Designer to set up business processes and process steps, see the Software AGDesigner online help. For more information about setting up and identifying those businessprocesses you want Optimize to monitor, see the chapter titled “Configuring Business Processes”in Administering webMethods Optimize.
Rules
Optimize evaluates data against rules you define. A rule identifies a significant condition underwhich a process or resource becomes problematic, requires attention, or is of interest. A rule canbe configured to alert users or take programmatic action when the condition occurs. Rules canalso be configured to send user alerts when the process or resource returns to compliancy. Youcan define KPI rules and event rules.
When you define a rule, you identify the type of data to which to apply the rule (for example,Broker queue length). By default, Optimize then applies the rule to that type of data on all processesor applications (for example, all Brokers in your entire environment). However, you might wantto apply the rule to that type of data for specific processes or applications only (for example, forcertain Brokers only). In this case, you create a rule filter that identifies only the specific processesor applications. When you define the rule, you associate the rule filter with the rule.
During rule definition, you also identify the users towhom to send alertswhen the rule is violated,or you can specify other actions to perform when a rule violation occurs (for example, send anSNMP alert to an SNMP manager or invoke a Web service).
KPI Rules
KPI rules apply to KPIs that were created for business or system data. Optimize evaluates dataagainst a KPI rule over one or more intervals according to the collection interval specified whenthe KPI was first created.
webMethods Optimize User's Guide 10.7 21
1 Concepts

Event and Threshold Rules
Event rules and threshold rules differ fromKPI rules in that Optimize evaluates data points againstthe rule as they are collected (that is, in real time) rather than waiting for a KPI collection interval(that is, an aggregation of data points collected over an interval). Event and threshold rules generallyapply to types of data that require immediate response, such as an application unexpectedlyshutting down or CPU usage exceeding unacceptable limits. Optimize maintains state for eventrules so that you can track data overmultiple intervals, but it does notmaintain state for thresholdrules. On the other hand, for capturing any individual order with a size greater than a milliondollars, a threshold rule would be preferable to an event rule.
For more information on KPI, event, and threshold rules, see “Defining Rules” on page 99.
Optimize Home Page
The Optimize for Process Home page enables you to quickly navigate to important Optimize forProcess pages. The Optimize for Process Home page is located in MywebMethods: Applications> Monitoring > Business > Optimize for Process.
The Optimize for Process Home page contains links to frequently used pages related to businessprocesses, KPIs, rules, and problems under the “Whatwould you like to do?” heading. These linksare organized under three activity categories: View, Create, and Manage. When you click on alink in any category, the appropriate page is displayed.
In addition, the Home page contains aMore link under the activity categories. Click theMore linkto access a listing of all Optimize for Process pages.
The Server selection box in the upper right corner of the page specifies the server being used andenables you to change the current selection. The currently specified selection applies to all Optimizemonitoring pages.
Users
Optimize has two types of users: administrators and business analysts. Note that business analystis a type of user that exists only in the context of Optimize for Process.
AdministratorsAdministrators perform the following tasks:
Install Optimize.
Set up user access.
Identify the mail server to use to send alerts about problems to users.
Change interface and communication settings.
Specify settings for statistical intervals and statistical confidence.
22 webMethods Optimize User's Guide 10.7
1 Concepts

Define business and system data and identify processes and system objects to monitor.
Configure data collectors and create rule filters.
Define rules to use to evaluate collected data.
Set up logging.
Maintain KPI instances and the database.
Business Analysts
A business analyst is a type of user that exists only in the context of Optimize for Process. Businessanalysts perform the following tasks:
Define rules to use to evaluate collected data.
Scan for business and system problems.
View analytic mashups, and rule details to help locate the source of a problem.
Respond to alerts to resolve a problem.
Users, Groups, and Roles
Optimize Administrators can use theMywebMethods Roles, Groups, and Users pages (Navigate> Applications > Administration > User Administration) to create users, groups, and roles.Administrators can also grant access to My webMethods functions using Lightweight DirectoryAccess Protocol (LDAP) or data-level security. For more information on users, groups, and roles,see Administering My webMethods Server. For more information on data-level security, see thefollowing sections in Administering webMethods Optimize: “Enabling Data-Level Security” and“Granting User Access to KPIs”.
webMethods Optimize User's Guide 10.7 23
1 Concepts

24 webMethods Optimize User's Guide 10.7
1 Concepts

2 Business Visualization Concepts
■ Business Processes ....................................................................................................... 26
■ Key Performance Indicators ........................................................................................... 27
■ Dimensions ..................................................................................................................... 29
■ KPI Instances ................................................................................................................. 30
■ Trends ............................................................................................................................. 31
■ Rules .............................................................................................................................. 31
■ Events ............................................................................................................................ 31
■ KPI Data Display ............................................................................................................ 32
■ KPI Historical Average Values ........................................................................................ 33
■ Event Display .................................................................................................................. 35
webMethods Optimize User's Guide 10.7 25

This chapter provides a brief description of the following Business Visualization concepts:
business processes (in Optimize for Process)
key performance indicators (KPIs)
data aggregation
dimensions
hierarchies
KPI instances
trends
rules
events (rule violations).
For more information about concepts behind the Optimize business activity components, see“Concepts” on page 11.
Business Processes
This topic is specific toOptimize for Process. A business process is a series of inter-related businesstasks that are performed:
In a specific order
Using an associated set of business rules
By multiple systems, people, and partners
Examples of business processeswithin a corporationmight include preparing for a new employee,handling a purchase order, bringing a product from inception to market, delivering a timely andaccurate invoice, or enabling Vendor Managed Inventory.
The business process to prepare for a new employeemight include business tasks such as assigningoffice space for the new employee, enrolling the employee in the internal Human Resources (HR)system, notifying the external partner that handles payroll, and obtaining the necessary officeequipment (e.g., computer, phone).
Business process management is the ability to define, implement,manage, analyze, and optimizebusiness processes, which includes interactions between:
Systems within your own corporation (e.g., applications and information stores).
People in your corporation.
External business partners.
With business process management in place, the effort to prepare for a new employee can beautomated, including the required human interaction. For example, the HR department couldinitiate the business process by filling out and submitting an online form. Upon receiving the form,
26 webMethods Optimize User's Guide 10.7
2 Business Visualization Concepts

the business process would initiate and automatically update the internal HR system, as well assend a notification to the external partner that handles payroll. Additionally, that same singleaction by HR could result in the appropriate people and departments being notified about thenew employee, so they can ensure that office space is assigned and the necessary office equipmentis available by the employee's start date.
An automated business process usually also includes the actions to take should an error or exceptionoccur in the process. For example, if there is no office space available, the Facilities Manager couldbe notified to determine how to handle that situation.
You can use business process management to monitor and manage each instance of a businessprocess. For example, if you have three new employees starting, you can view details about thebusiness tasks that have been completed for each of the new employees; that is, you can determinewhether office equipment has been ordered or whether the payroll provider acknowledgednotification for all three employees.
You can have several instances of a business process running at the same time. For example, ifyou have six new employees starting, you would have six instances of the new employee setupprocess running.
As business processes run, Optimize tracks KPIs that enable you to improve business processperformance.
For information about setting up business processes you want Optimize to monitor, seeAdministering webMethods Optimize.
Key Performance Indicators
A key performance indicator (KPI) is a measurement of a business activity that is important to thesuccess of an organization. KPIs monitor metrics for quantitative business and system data, suchas revenue, volume of orders, queue length, and cycle time. KPIs help answer questions such asthe following:
How many orders over $10,000 have completed for this process?
What is the revenue for the Southeast Region?
What is the total available memory for the Integration Server?
In an order management process, KPIs might monitor how many orders were received, theirmonetary amounts, and whether they were processed successfully.
To measure business or system data, a KPI specifies:
A metric, which includes the following:
A unit of measure (such as dollars or minutes).
A calculation, which determines how to aggregate the data.
A data collection interval.
webMethods Optimize User's Guide 10.7 27
2 Business Visualization Concepts

Optimize supports nine KPI data collection intervals: 1minute, 5minutes, 10minutes, 15minutes,30 minutes, 1 hour, 2 hours, 4 hours, and 8 hours.
Optimize supports seven types of calculations.
The following table describes the calculations types.
FunctionCalculation
Sums the data points collected over each collection interval. A possible use forthis type of calculation is to tally process step errors.
Sum
Calculates the difference between the last data point collected in the previouscollection interval and the last data point collected in the current collection
Delta
interval. A possible use for this type of calculation is to compare Broker documentpublished counts.
Note:The delta calculation has been deprecated. It is supported in this release, butsupport will be discontinued in a future release.
Calculates the average value of the data collected over each collection interval.A possible use for this type of calculation is to track CPU usage.
Average
Stores the value of the last data collected in the collection interval. A possible usefor this type of calculation is to track the size of a queue.
Last Value
Stores the maximum value of the data collected in the collection interval.Max
Stores the minimum value of the data collected in the collection interval.Min
Stores the value of the last data collected in each collection interval, where thepossible values are 1 (online) or 0 (offline). A possible use for this type ofcalculation is to track the state of an application.
State
An intrinsic KPI is created by Optimize to monitor business process or system data. For example,Optimize creates KPIs to monitor Instance Count by Process, Cycle Time by Process, and ProcessError Count. Optimize also creates KPIs to monitor each error condition. There are hundreds ofpossible error conditions. For example, if a Step Timeout error occurs, Optimize creates a StepTimeout Error KPI to monitor all occurrences of the error.
A business or system KPI enables you to monitor business process or system data. Most of theKPIs discussed in this chapter, such as Revenue by Customer or Integration Server Total Memory,are business or system KPIs.
A composite KPI performs a mathematical operation (add, subtract, multiply, or divide) on twoother KPIs. For example, if individual KPIs monitor a product's operating costs and revenue, acomposite KPI can monitor the product's profit by subtracting the operating cost KPI from therevenueKPI. Both of the individual KPIsmustmeasure their data over the same collection interval(for example, one hour). The composite KPI has a calculation (sum, average, or last value) and aunit of measure.
28 webMethods Optimize User's Guide 10.7
2 Business Visualization Concepts

Data Aggregation
Data aggregation is the process of combining individual data values into summarized data values.To measure the revenue in dollars generated by the order management process, a Total OrderRevenueKPImight sum the dollar amounts of orders received during a ten-minute data collectioninterval. To measure the order cycle time in minutes, an Order Cycle Time KPI might average thetime required to process orders over a one-hour data collection interval. To measure availablememory, a Total Memory for Integration Server KPI might store the last value in kilobytes of theIntegration Server's available memory at the end of each one-minute interval.
Optimize aggregates data for KPIs that calculate sums differently from KPIs that calculatedifferences, averages, last values, and states. For example, a chart of KPI performance shows fourconsecutive data points: 5, 8, 7, and 4. You increase the time range until Optimize must aggregatethe four data points into one data point. For KPIs that calculate differences, averages, and lastvalues, the aggregated data point is the average of the four individual data points: 6. For KPIs thatcalculate sums, the aggregated data point is the sum of the four individual data points: 24. (ForKPIs that calculate states, the aggregated data point is also the average of the four individual datapoints, but the values of those individual data points would be 0 or 1.
In addition to aggregating all the data collected during the data collection interval, Optimizemusteventually aggregate data from multiple data collection intervals as the time range for datadisplayed on the KPI Summary page or KPI Instance Detail page increases.
Depending on the data display interval, the time range for the displayed data, a displayed datavalue may represent one data collection interval or multiple data collection intervals. For moreinformation, see “KPI Data Display” on page 32.
Dimensions
Measuring ametric like revenue or queue length by itself often does not provide all the informationneeded to analyze business or system performance. For example, an organization may want tomeasure:
Revenue by region and sales person in addition to total order revenue
Queue length by broker
To facilitatemeasuringmore complexmetrics, Optimize uses the concept of dimensions. A dimensionis a category, a way to analyze business or system data by slicing it into smaller components.Because dimensions are arbitrary and business-specific, organizations must define their owndimensions. Typical examples are:
Customer
Region and sales person
Product and manufacturer
Broker Server and Broker
webMethods Optimize User's Guide 10.7 29
2 Business Visualization Concepts

To understand the concept of a dimension, think of a metric like revenue as a cube. See the “KPIsand Dimensions” figure below.
Now imagine slicing that cube into layers based on customers. The resulting slices enable you tomeasure revenue by customer.
Another way to slice the cube is by region and sales person. The resulting slices enable you tomeasure revenue by region and by sales person within each region.
KPIs and Dimensions
A KPI can measure business or system data by slicing it into dimensions. In the examples above,you might have a Revenue by Customer KPI and a Revenue by Region and Sales Person KPI. Forsystem data, you might have a Queue Length by Broker Server and Broker KPI.
To analyze business or system data by slicing it into multiple dimensions such as region and salesperson, you must arrange dimensions within a hierarchy.
A hierarchy is an ordered ranking of dimensions. A hierarchy provides additional ways to slicedata into smaller components. For example, a sales hierarchy might consist of two dimensions:region and sales person. A queue length hierarchy might also consist of two dimensions: BrokerServer and Broker.
Organizations define their own hierarchies of dimensions. For example, one organization mighthave a product hierarchy in which manufacturer is the main category and product name is asub-category. Another organizationmight have a product hierarchy in which product name is themain category and product manufacturer is the sub-category.
KPI Instances
A KPI instance is a measurement of one slice of business or system event data.
A Total Order Revenue KPI, which is not sliced by dimensions, has one KPI instance.
A Revenue by Customer KPI, which slices revenue by the customer dimension, has multiple KPIinstances. Each KPI instance measures revenue for an individual customer.
A Revenue by Region and Sales Person KPI, which slices revenue by a sales hierarchy with twodimensions (region and sales person), has multiple KPI instances. Each KPI instance measuresrevenue for an individual sales person within a region.
30 webMethods Optimize User's Guide 10.7
2 Business Visualization Concepts

AQueue Length by Broker Server andBrokerKPI,which slices queue length by a broker hierarchywith twodimensions (Broker Server and Broker), also hasmultiple KPI instances. EachKPI instancemeasures queue length for an individual broker on a Broker Server.
The KPI Instance Detail page displays data for a KPI instance over any time period requested bya user. The default is the most recent four-hour period.
TheKPI Summary page displays data for up to five KPI instances over any time period requestedby a user. The default is the most recent four-hour period.
Trends
Optimize performs 16 different types of diagnoses (above normal, belownormal, staying in upwardtrend, staying in downward trend, etc.) on all KPI instances over the KPI’s collection interval. Youcan use this information towatch for trends in performance and to help determineways to improvebusiness processes and system components that continue to perform outside their normal range.
When Optimize diagnoses a trend, it places a trend icon (for example: ) on the listing for theKPI instance on the KPI Summary page aswell as on the KPI InstanceDetail page. Place themousepointer on a diagnosis trend icon to see a brief description of the trend.
For a complete list of trend icons, see “ Optimize Icons” on page 183.
Rules
A rule specifies conditions under which a business process or system resource requires userattention, either because a problem has occurred or because an opportunity exists. Optimizesupports two types of rules: KPI rules and event rules.
A KPI rule evaluates data over one or more KPI data collection intervals. For example, a GrossMargin Percent Severely Below Normal rule might specify that the gross margin percentagemust not go more than one sigma below the average Gross Margin KPI value for threeconsecutive Gross Margin KPI data collection intervals. A KPI rule takes dimensions intoaccount, tracks its state of compliance, and persists in the database.
An event rule evaluates data as it is collected rather thanwaiting until the end of a KPI collectioninterval. Like a KPI rule, an event rule takes dimensions into account, tracks its state ofcompliance, and persists in the database. In general, event rules evaluate data in situationsthat require immediate response. For example, an event rulemight trackwhether an applicationhas unexpectedly shut down.
Both types of rules evaluate data provided by KPIs.
Optimize uses a rule icon ( ) to indicate that one or more rules are evaluating the data providedby a KPI. Click the rule icon to select a rule and view its details.
Events
Optimize displays events and rule violations, based on user-defined rules on the following pages:
webMethods Optimize User's Guide 10.7 31
2 Business Visualization Concepts

The KPI Summary page
The KPI Instance Detail page
The Process Analytics page.
Rule Violations
Optimize uses a rule violation icon ( or ) to indicate when one or more rules evaluating dataprovided by a KPI have been violated. Click the rule violation icon to select a rule violation andview details about the rule.
KPI Data Display
As the time range for KPI data displayed on the KPI Summary page or the KPI Instance Detailpage increases, Optimize must eventually aggregate data from multiple data collection intervals.Optimize aggregates data on each page as described in the Data Aggregation tables on the KPISummary page and the KPI Instance Detail page.
Note:For KPIs that calculate differences, averages, last values, and states, the data values displayedon each page at a given data display interval will be similar, provided the data values receivedare similar, since the data values are averaged together over the collection interval. For KPIsthat calculate sums, however, the data values displayed on each page at a given display intervalmay differ significantly. For example, the display interval (time range) on each page is set attwo months. On the KPI Summary page, data is aggregated at 12-hour intervals. On the KPIInstance Detail page, data is aggregated at one-week intervals. The data values on the KPIInstance Detail page are approximately 14 times greater than the data values on the KPISummary page.
Data Aggregation on KPI Summary Page
The following table describes KPI data aggregation on the KPI Summary page.
Aggregated data valuesdisplay at
Optimize aggregates data forKPIs with these data collectionintervals
If the data display interval (timerange) is
Data collection intervalsNoneLess than or equal to 4 hours
5-minute intervals1 minuteGreater than 4 hours but lessthan or equal to 12 hours
15-minute intervals1 minute to 10 minutesGreater than 12 hours but lessthan or equal to 2 days
1-hour intervals1 minute to 30 minutesGreater than 2 days but less thanor equal to 1 week
32 webMethods Optimize User's Guide 10.7
2 Business Visualization Concepts

Aggregated data valuesdisplay at
Optimize aggregates data forKPIs with these data collectionintervals
If the data display interval (timerange) is
4-hour intervals1 minute to 2 hoursGreater than 1week but less thanor equal to 1 month
12-hour intervalsAllGreater than 1 month but lessthan or equal to 3 months
1-day intervalsAllGreater than 3 months but lessthan or equal to 6 months
1-week intervalsAllGreater than 6 months
Data Aggregation on KPI Instance Detail PageThe following table describes the data aggregation intervals.
Aggregated data valuesdisplay at
Optimize aggregates data forKPIs with these data collectionintervals
If the data display interval(time range) is
Data collection intervalsNoneLess than or equal to 12 hours
1-hour intervals1 minute to 30 minutesGreater than 12 hours but lessthan or equal to 2 days
4-hour intervals1 minute to 2 hoursGreater than 2 days but lessthan or equal to 2 weeks
1-day intervalsAllGreater than 2 weeks but lessthan or equal to 4 weeks
1-week intervalsAllGreater than 4 weeks
KPI Historical Average Values
The KPI Instance Detail page displays:
Actual readings. This is the same data that displays on the KPI Summary page. When dataaggregation is necessary for display purposes, Optimize aggregates the data on each pageusing different formulas. For more information, see “KPI Data Display” on page 32 above.
Historical average values.
Standard deviations of the actual readings from the historical average values.
Optimize displays historical average values based on a statistical interval.
webMethods Optimize User's Guide 10.7 33
2 Business Visualization Concepts

The following table describes how Optimize determines the statistical interval based on the datacollection interval and the data display interval.
Historical average values displayat these statistical intervals
And the data collectioninterval is
If the data display interval foractual readings is
1 hour1 minute to 30 minutesLess than or equal to 12 hours
No historical average valuesdisplay
1 hour to 8 hours
1 hour1 minute to 30 minutesGreater than 12 hours but less thanor equal to 2 days
No historical average valuesdisplay
1 hour to 8 hours
4 hours1 minute to 2 hoursGreater than 2 days but less thanor equal to 2 weeks
No historical average valuesdisplay
4 hours to 8 hours
1 dayAllGreater than 2weeks but less thanor equal to 4 weeks
No historical average valuesdisplay
1 minute to 30 minutes
1 hour to 8 hours
Greater than 4 weeks
1 week
Optimize plots the historical average value in the middle of each statistical interval. Example #1:the statistical interval is 1 hour. Optimize plots the average historical average value on the halfhour. Example #2: the statistical interval is 1 day. Optimize plots the historical average value at12:00 pm (noon).
Optimize supports three modes of operation for tracking historical average values:
Weekday and weekend, two different values, one combining the historical average values foreach day of the week (Monday through Friday) and another combining the historical averagevalues for each day of the weekend (Saturday and Sunday). This is the default.
Each day separate, seven different historical average values, one for each day of the week.
All days the same, one value combining the historical average values for all seven days of theweek.
Setting the Mode of OperationThe number of different historical average values that Optimize computes depends on the modeof operation and the statistical interval.
The following table lists the modes of operations and the statistical intervals.
34 webMethods Optimize User's Guide 10.7
2 Business Visualization Concepts

1-day, 1-week, or
4-week
statistical interval
4-hour
statistical interval
1-hour
statistical interval
Mode of operation
21248Weekday andweekend
742168Each day separate
1624All days the same
To set the mode of operation for KPI historical average values
1. In My webMethods:
Navigate > Applications > Administration > System-Wide > Environments > DefineEnvironments.
The Define Environments page is displayed.
2. Click the name of the configured environment forwhich youwant to set themode of operation.
The Edit Environment page is displayed.
3. Click the Configure Servers tab.
4. On the CONFIGURATION tree, find the Analytic Engine for which you want to set the modeof operation for KPI historical average values, and click Monitor Behavior Settings underthe name of the Analytic Engine.
5. Set the Default Days attribute as follows:
work (weekday and weekend)
day (each day separate)
all (all days the same)
Note:The Default Days attribute is case sensitive. Type it exactly as shown above. Do not typeany leading or trailing spaces.
Event Display
Optimize places event flags representing rule violations on the KPI performance chart (whichappears on the KPI Summary page and on the Process Analytics page) to indicate that one ormoreevents have occurred.
webMethods Optimize User's Guide 10.7 35
2 Business Visualization Concepts

The following table describes howOptimize assigns events to event flags based on the data displayinterval.
Event flags display atIf the data display interval (time range) is
5-minute intervalsLess than or equal to 2 hours
15-minute intervalsGreater than 2 hours but less than or equal to 6 hours
1-hour intervalsGreater than 6 hours but less than or equal to 24 hours
4-hour intervalsGreater than 24 hours but less than or equal to 4 days
1-day intervalsGreater than 4 days but less than or equal to 24 days
1-week intervalsGreater than 24 days
For example, the data display interval is four hours. Optimize displays an event flag for every15-minute interval during which one or more events occurred.
The event flag displays at the start of the interval. For example, the data display interval is thefour-hour period from 4:00 pm to 8:00 pm. Five events occurred during the period from 6:00 pmto 6:15 pm. Optimize displays one event flag for those five events. The flag displays at 6:00 pm onthe KPI performance chart.
When you change the data display interval as shown in the above table, Optimize reassigns eventsto event flags.
36 webMethods Optimize User's Guide 10.7
2 Business Visualization Concepts

3 Monitoring System Component and Business
Process Performance
■ Overview of Monitoring System Component and Business Process Performance ........ 38
■ Viewing System Component and Business Process Problems ...................................... 39
■ Viewing Problem Details ................................................................................................. 41
■ Using the Analytics Overview Page ................................................................................ 44
■ Viewing the Overall Status of Process Instances ........................................................... 53
■ Viewing Details for a Process Instance .......................................................................... 65
■ Viewing Process Metrics ................................................................................................ 81
webMethods Optimize User's Guide 10.7 37

Overview of Monitoring System Component and BusinessProcess Performance
The system component information in this section applies to both Optimize for Process andOptimize for Infrastructure, while the business process information is specific to Optimize forProcess.
A system component is any item of information technology (IT) infrastructure equipment in yourenvironment that can be monitored. An application is a webMethods program such as IntegrationServer that runs on a system component in your environment.
You can check the performance of applications and system components by viewing:
A list of all applications and system components that are out of compliance, on the Problemspage.
A summary of all KPI instances associatedwith applications and IT equipment, on theAnalyticsOverview page.
A business process model is an executable process that represents a series of interrelated businesstasks that are performed in a specific order by multiple systems, people, and partners. Examplesof business processes within a corporation are integrating a new employee, handling a purchaseorder, developing a product from inception to market, delivering a timely and accurate invoice,enabling vendor-managed inventory, or synchronizing item registries with UCCNET.
Each executable process started from a business processmodel is referred to as a process instance.For more information about business process models and instances, see webMethods BPM ProcessDevelopment Help and webMethods Monitor User’s Guide.
Using the Optimize components on the Navigation > Applications > Monitoring page of MywebMethods, you can view following information about your running business processes:
A summary of business process problems on the Problems page.
The status of processes and process stages at a high level on the Analytics Overview page.
Details about individual process instances on the Process Instances page.
Details about step execution in a process instance on the Process Instance Detail page.
Your systemadministrator can configure yourMywebMethods SystemSettings tomonitormultipleIntegration Servers or multiple Analytic Engines (see “Configuring Optimize to Use MultipleIntegration Servers and Analytic Engines” in Administering webMethods Optimize). You can selectwhich Integration Servers and Analytic Engines you want to monitor from the Server menu inthe top right corner of the My webMethods Monitoring pages. Only the processes, components,and applications on the selected server are displayed.
Note:The default server is set on the System Settings page. If you select a server on another MywebMethods page, that server is selected until you select a different server.
38 webMethods Optimize User's Guide 10.7
3 Monitoring System Component and Business Process Performance

Viewing System Component and Business Process Problems
You can scan for system component and business process problems on the Problems page in MywebMethods. The Problems page displays rule violations related to system components andbusiness processes. The page does not show threshold rule violations, because they have a closingdate. To display threshold rule violations on the Problems page, youmust first specify anAdvancedSearch date range.
To view system component and business process problems
1. In My webMethods: Navigate > Applications > Monitoring > System-Wide > Problems.
The Problems page lists the system components and business processes that are out ofcompliance.
The following table describes the information on the Problems panel.
DescriptionColumn
Indicates whether the system component or business process is out ofcompliance or statistically abnormal .
Status
Displays the name of the rule that is violated. Click this text to displaythe Problem Details page for this problem event. For more information
Description
about the Problem Details page, see “Viewing Problem Details” onpage 41.
Indicates if a severity label has been defined for this item. If no severitylabel has been defined, nothing is displayed.
Severity
Displays the name of the system component and business process towhich the problem event is related.
Related To
Displays the date and time that the system component and businessprocess violated a rule and went out of compliance.
Date/Time
Displays rule detail, KPI instance detail, process analytics, Six Sigma,and view detail icons, as appropriate.
Detail
2. To narrow the list of problems to a group of components, such as Brokers, click the Advancedtab on the Search panel and specify your search criteria.
For example, you can narrow the list to show only Brokers residing on a certain server byspecifying the broker component type and the host name and port number of that server.
The following table describes how to filter the list by problem type, duration, related problems,users to be notified, rule status, service level agreement (SLA), customer, or severity.
webMethods Optimize User's Guide 10.7 39
3 Monitoring System Component and Business Process Performance

Set This ValueIn the Operator ListIn the Field NameList
Select a duration in minutes, hours, or days fromthe list.
Greater Than/LessThan
Duration
Enter any text contained in the Related To fieldof the problem.
ContainsRelated To
Enter any text contained in the names of users tobe notified of this problem.
ContainsNotification Users
In Compliance or Out of Compliance.EqualsRule Status
With SLA or Without SLA.EqualsSLA
Type any text contained in the label used toidentify the customer associated with the rule.
ContainsCustomer
Type any text contained in the label used toidentify the severity of the rule.
ContainsSeverity
Click Add Row to specify additional set of filter criteria.
3. If the Detail column contains one or more icons, perform one of the actions that are describedin the following table.
Do thisIf the Detailcolumn contains
Click to view details about the rule associated with the problem.Rule,
For more information about interpreting rule details, see “DefiningRules” on page 99 in this guide.SLA Rule,
Rule Violation,or
SLA RuleViolation
Click to view KPI instance information for the associated KPIs.KPI Detail
For more information about interpreting KPI instance data, see“Analyzing Information about Key Performance Indicators” on page 145in this guide.
Click to view Six Sigma performance values for the problem associatedwith the rule, as well as information to help identify the root cause ofthe rule violation. This applies only to Optimize for Process.
Six Sigma
40 webMethods Optimize User's Guide 10.7
3 Monitoring System Component and Business Process Performance

Do thisIf the Detailcolumn contains
Formore information about interpreting Six Sigma process improvementdetails, see “Improving the Long-Term Performance of a Process” onpage 83 in this guide.
Click to display the Problem Details page for this problem event.View Detail
For more information about the Problem Details page, see “ViewingProblem Details” on page 41.
Viewing Problem Details
The Problem Detail page displays detailed information about a selected problem event. TheProblem Detail page consists of the Problem Information panel , the Contributing Events table,the Similar Problems table, and the KPI Instance Summary graph.
The following table describes the alternative ways to view the problem details.
Do thisTo view problemdetails from
In the Problems table, do either of the following:Problems page
Click the problem event Description.
Click View Detail in the Detail column.
Click the Problem Detail hyperlink in the e-mail message.E-mail alert
Click a red dot on the KPI instance detail graph.KPI Instance Detailpage
The Problem Information panel contains general information about the problem.
The following table provides more information about the configurable fields on the ProblemInformation panel.
DescriptionField
Name of the rule instance associated with the problem event.Description
Name of the system component or business process to which the problemevent is related.
Related To
webMethods Optimize User's Guide 10.7 41
3 Monitoring System Component and Business Process Performance

DescriptionField
Severity of the problem.Severity
Time when the problem event occurred.Date/Time
Time elapsed since this event first occurred.Duration
Status of the rule instance.Status
Icons that appeared on the Problems page.(various icons)
Contributing Events
TheProblem Detail page displays information about contributing events and helps you determineother factors that might be contributing to a problem event. The information in the ContributingEvents panel is dynamically generated based on the event map for the returned event and thespecific data that is returned.
Note:In an Optimize for Infrastructure environment that does not have running business processes,the Contributing Events panel is always empty.
Similar ProblemsTo help you identify processes, systemvariables, or other components associatedwith the problem,the Problem Detail page lists problem events related to the current problem’s rule in the SimilarProblems panel.
The following figure shows an example of the Similar Problems panel, and the subsequent tabledescribes the information displayed in this panel.
42 webMethods Optimize User's Guide 10.7
3 Monitoring System Component and Business Process Performance

The following table provides information about the fields on the Similar Problems panel.
DescriptionColumn
Displays if the problem event is out of compliance or if it is statisticallyabnormal.
Status column
Name of the rule instance that is associated with the similar problem. Clickthe name to view details of the event in a new instance of the ProblemDetailscreen.
Description
Optional user-defined characterization of rule violation. You can define theseverity on the Add/Edit/Copy Rule page.
Severity
Time when the problem occurred.Date/Time
Amount of time that has elapsed since the problem event was created.Duration
Displays one or more of the following icons:Detail
Click the icon to view Six Sigma performancevalues for the process associatedwith the rule, as
Six Sigma
well as information to help identify the cause ofthe rule violation. This applies only to Optimizefor Process.
webMethods Optimize User's Guide 10.7 43
3 Monitoring System Component and Business Process Performance

DescriptionColumn
Indicates that there is a service level agreementrule violation for a customer. Click to view theRule Detail page showing the relevant violation.
Service LevelAgreement
Click to view details about the rule that wasviolated.
Rule Violation
Click to view KPI information for the ruleviolation.
KPI Detail
Click to view the ProblemDetail page for the ruleviolation.
Problem Detail
KPI Instance Summary Graph for Problem Events
The KPI Instance Summary Graph on the Problem Detail page is a KPI summary (detail) graphof each KPI associated with the problem event's rule. This graph centers on the time the eventstarted, and shows multiple KPIs when possible. For events, it displays a scatter graph. For adetailed explanation of KPI Instance Summary graphs, see “Viewing Details for Rules and RuleViolations” on page 93. The default time range of the graph is 2 hours before and 2 hours afterthe problem occurred.
Using the Analytics Overview Page
On the Analytics Overview page in the Monitoring section of My webMethods, you can:
view the status of business and system components,
view information about process steps and step intrinsics,
view information about stages and stage intrinsics,
search components based on a variety of criteria.
Note:Business process data is specific to Optimize for Process.
By default, information displayed on the Analytics Overview page appears in built-in businessand systemviews, though you can also create customdata views using theOverviewConfigurationpage in My webMethods (Navigate > Applications > Administration > Analytics > OverviewConfiguration). These data views are referred to as configurations. For more information aboutsetting up configurations, see Administering webMethods Optimize .
To open the Analytics Overview page in My webMethods navigate to:
Navigate > Applications > Monitoring > System Wide > Analytics Overview.
The Overview Configuration field that is located at the top right side of the page displays thecurrently selected configuration. You can use the field to select from the default and custom
44 webMethods Optimize User's Guide 10.7
3 Monitoring System Component and Business Process Performance

configurations that exist. If no configuration has been selected for the Analytics Overview page,a message “No Configurations Found” is displayed.
The Status column ( ) to the left of each component in the Analytics Overview panel indicatesits current status. Additional icons beside each component indicate whether that component is aKPI, KPI instance, dimension, process, or a step. If a rule is violated, warning icons are displayedin the Detail column, and you can click them to view more information about the violation. TheDetail column displays a variety of icons to show statistical measurements, rule status, links toKPI details, and six sigma for processes. Other icons provide access to pages containing additionalinformation about trends, rules, and other pertinent issues. You can drill down into each KPI toview the KPI Instance Detail or KPI Summary page.
You can use the four radio buttons at the top of the Analytics Overview panel to customize thedata view on the page. This capability facilitates viewing data according to your specific needsand is especially useful with data models that entail large and complex data relationships. Thesebuttons and the corresponding views are as follows:
Complete Tree: This view is selected by default and displays all elements of the configuration.The tree is grouped by KPI type and individual KPI instances are further broken down bydimension.
Dimension Tree: This viewdisplays KPI instances grouped by dimension. It facilitates pullingtogether KPI instances that share common dimension values.
KPI Tree: This view is grouped by KPI instance name and displays only KPI instances withouttheir KPI type and dimension folders. This view is especially useful when KPI instance namesinclude dimensional values. It does not show KPI or dimension nodes.
Table View: This view displays all KPI instances in a tabular format with no hierarchy. Theview does not show the folder nodes. You can use the Export Readings button to export a.csv file with the data that is displayed in the table, or a .csv file that contains all readings fora specified time interval. For more information, see “Exporting KPI Readings for a SpecifiedTime Range” on page 52.
Regardless of the selected view, the Analytics Overview panel shows configuration information.
The following table describes the configuration information in the Analytics Overview panel.
DescriptionColumn
Indicates whether instances associated with the components are executingnormally, have a rule violation, or are statistically abnormal. Status indicatorsinclude the following:
Status
Rule violation
Statistical abnormality
Normal
No data is available
webMethods Optimize User's Guide 10.7 45
3 Monitoring System Component and Business Process Performance

DescriptionColumn
Formore information about these status indicators, see “ Optimize Icons” onpage 183 in this guide.
Lists all monitored business and system components. Click a componentname to display the KPI Instance Detail or KPI Summary page for that
Components
component. The icon adjacent to each node indicates whether the node is aprocess, a KPI instance, a KPI, a dimension, a stage, or a step.
The node is a KPI
The node is a KPI instance
The node is a dimension of a KPI
The node is a process
The node is a step in a process
The node is a stage
The node is a step in a stage
For more information about these icons, see “ Optimize Icons” on page 183in this guide.
Displays the value and unit of measure for the last aggregated data pointcollected for a KPI instance at the end of the collection interval.
Last Reading
Indicates the date and time of the last reading.Date/Time
Displays one or more KPI detail, rule status, Six Sigma, and diagnosis trendicons. For more information about these icons, see “ Finding Components
Detail
that are Out of Compliance” on page 50 and “ Optimize Icons” on page 183in this guide.
Searching for Components on the Analytics Overview PageThe Analytics Overview page includes four search tabs that enable you to search records basedon a variety of criteria. These search tabs are discussed in greater detail inWorking with MywebMethods, and the followingdescriptions provide specific information for theAnalyticsOverviewsearch.
The search functionality in the Analytics Overview page allows you to create customized searchesto find specific information about processes and components. You must enter your search queriesin the Search panel. Your search results appear in the Analytics Overview panel.
When you first activate the Analytics Overview page, the Keyword search tab is active and theAnalytics Overview panel shows the component tree for the selected configuration. The tree iscollapsed by default, and you can click the plus signs ( ) adjacent to folders to expand the branchesto expose specific components. Click to expand all branches of the tree.
46 webMethods Optimize User's Guide 10.7
3 Monitoring System Component and Business Process Performance

The Advanced search tab includes filters that enable you to locate un-monitored InfrastructureKPIs so that they can be displayed and selected for deletion in Admin Mode.
To search for components on the Analytics Overview page based on specific criteria
1. In My webMethods: Navigate > Applications > Monitoring > System Wide > AnalyticsOverview.
2. To narrow the list of components, click the Keyword tab to search by component name, orclick the Advanced search tab to search by any of the following:
To narrow your search to a range of last readings, select a range from the Last ReadingRange drop-down list, or create your own custom range.
To filter the list, in the Filter area, select one or more filters from the Field Name list. Youcan filter by process, status, rule, rule status, service level agreement (SLA), customer, orseverity. Click Add Row to append an additional filter.
The following table lists the filters that are available in the Filter area.
Set This ValueIn the OperatorList
In the FieldName List
Unassociated, or select a process name from the list.Equal To/NotEqual To
Process
Normal (green), Statistical Abnormality (yellow), orRule Violation (red)
Equal To/NotEqual To
Status
With Rules or Without RulesEqual ToRules
In Compliance or Out of ComplianceEqual ToRule Status
With SLA or Without SLAEqual ToSLA
Enter any text contained in the label used to identify thecustomer associated with the rule.
ContainsCustomer
Enter any text contained in the label used to identify theseverity of the rule.
ContainsSeverity
3. Click the Search.
4. To save a search, click the Save button and enter a name for the search in the Saved Searchdialog and then click OK. Saved searches are available on the Saved tab.
5. To view a saved search, click the Saved tab and select the desired search from the SavedSearch field.Note that theSaved Search field is displayed only if saved searches are available.
webMethods Optimize User's Guide 10.7 47
3 Monitoring System Component and Business Process Performance

Process Intrinsic Data Metrics
This section describes the intrinsicmetrics provided on theAnalytics Overview page for processes,stage sand steps. These KPI instances are included in the built-in business view and can be includedwith a process in a custom configuration.
The following table describes the intrinsic metrics (accumulated over one-minute intervals) thatOptimize monitors for processes.
DescriptionProcess Monitor
The number of process instances with an error status.Process ErrorCount
The number of process errors detected for each error type, including processesthat timed out before they completed successfully.
Process ErrorCountby Error Type
The number of times a process timed out before completing successfully.Process TimeoutCount
The total time required for a process to run from beginning to end, includingthe time spent waiting to be processed and the process execution time. Thisvalue is an average value.
Cycle Time byProcess
Note:Process instances in the canceled or suspended state do not contribute tocycle time. If a suspended process resumes and completes successfully, itwill contribute to the cycle time less the time spent suspended.
The number of process instances that completed successfully.Process SuccessCount
The total number of process instances that started during the interval,regardless of their status.
Instance Count byProcess
The number of process instances that have been stopped or suspendedduringthe interval.
Canceled
The following table describes the intrinsic metrics (accumulated over one-minute intervals) thatOptimize monitors for process stages.
DescriptionProcess Monitor
The number of stages thatwere breached during the interval. A breach occurswhen a stage rule is violated.
Stage BreachedCount
The number of stages that completed successfully during the interval.Stage CompletedCount
The number of stages that started during the interval.Stage StartedCount
48 webMethods Optimize User's Guide 10.7
3 Monitoring System Component and Business Process Performance

DescriptionProcess Monitor
The average duration of the stages completed during the interval.Stage ProcessingTime
The following table describes the intrinsic metrics (accumulated over one-minute intervals) thatOptimize monitors for process steps.
DescriptionStep Monitor
The amount of time required for a step to execute.Processing Time byStep
The number of times the step completed successfully.Step Successes
The number of times an error was generated for the step while the processwas active. Errors include duplicate processing, timeouts, and steps executedout of sequence.
Error Count by Step
Note:Out-of-sequence errors do not occur with webMethods BPM processes.
The number of step errors detected for each type of error, displayed by errortype.
Step Error Count byError Type
The number of times the step timed out before completing successfully.Step Timeout
The number of times the step executed.Instance Count byStep
The amount of time that the step spent waiting to run, calculated from theend of the previous step to the start of the current step.
Wait Time by Step
The number of times that this step executed more than once.Duplicate StepProcessing
The number of times that this step executed out of sequence. If a step executes(for example, step 2) and a previous step transition has not occurred (step 1is not complete), the step executing is marked as out of sequence.
Step Out ofSequence Count
Note:Out-of-sequence errors do not occur with webMethods BPM processes.
The number of times the step was processed, either successfully or witherrors, during the interval. When the step completes, Optimize updates thisStep Count along with one or more of the following:
Step Count
Step Successes, if the step completed successfully.
Error Count by Step, if errors were generated for the step.
Duplicate Step Processing, if the step executed more than once.
webMethods Optimize User's Guide 10.7 49
3 Monitoring System Component and Business Process Performance

DescriptionStep Monitor
Step Timeout Count, if the step timed out before completing.
StepOut of Sequence Count, for external processeswhose steps executedout of sequence.
The following table describes the intrinsic metrics (accumulated over one-minute intervals) thatOptimize monitors for transitions.
DescriptionTransitionMonitor
The number of times an error was generated for the transition while theprocess was active. Errors include timeouts.
Error Count byTransition
Finding Components that are Out of ComplianceThe Analytics Overview page helps you to quickly identify problem areas and enables you todrill-down to locate specific problem components. The icons in the Status column ( ) located tothe left of components identify problematic components, and icons in the Details column enableto you view more detailed information about the component to identify and resolve specificproblems.
Note that in tree views, status icons indicate problemswithin a branch. The status icon of a parentnode reflects the status of its KPI instance children. Youmust expand the tree and trace a problemthrough the branches to locate a specific problem as outlined in the following procedure.
To locate out of compliance or statistically abnormal components
1. In My webMethods: Navigate > Applications > Monitoring > System Wide > AnalyticsOverview.
2. In the Overview Configuration drop-down list, select the desired configuration to view inthe Analytics Overview panel:
Analytic Systems View
Analytic Business View
3. In the Analytics Overview window, select the appropriate view for your data.
Tip:To view a non-hierarchical list of components, click Table. This view contains the sameinformation and icons as the tree view but removes the hierarchical tree structure.
50 webMethods Optimize User's Guide 10.7
3 Monitoring System Component and Business Process Performance

4. If necessary, search for the desired components using the Search functions. Refer to “Searchingfor Components on the Analytics Overview Page” on page 46 for more information aboutconstructing a search.
5. Scan the Status column for components that are out of compliance. Components that are outof compliance display a red circle ( ) in the Status column. A yellow triangle ( ) indicates acomponent for which there is a statistical abnormality.
6. If branches of the tree are collapsed, you may need to expand the branches to find the specificproblem component. Expand (click ) the component you want to explore until you reach thespecific component that is out of compliance or has an abnormal diagnosis.
Tip:Click in the column heading to expand all components in the tree.
7. If theDetail column for the component contains one ormore icons, perform the correspondingaction, as described in the following table.
Do thisIf the Detail columncontains a
Rest the mouse pointer on the icon to see a brief description of thestatistical diagnosis that Optimize performed on the component. For
Diagnosis icon
a more detailed description of each diagnostic icon, see “ OptimizeIcons” on page 183 in this guide.
Rest the mouse pointer on the icon to see the rule type, status, andcustomer associatedwith the rule, if any. Click the icon to view detailsabout the rule.
Rule icon
identifies a rule that has not been violated.
identifies a rule that has been violated.
identifies an SLA rule that has not been violated.
identifies an SLA rule that has been violated.
If only one rule is associated with the component, Optimizedisplays the Rule Detail page when you click an icon.
If more than one rule is associated with the component, Optimizedisplays the Rule Summary page when you click an icon.
For more information about interpreting rule details, see“DefiningRules” on page 99 in this guide.
Click the icon to view process improvement information for thiscomponent. Formore information about interpreting Six Sigmaprocess
Six Sigma icon
webMethods Optimize User's Guide 10.7 51
3 Monitoring System Component and Business Process Performance

Do thisIf the Detail columncontains a
improvement details, see “Improving the Long-Term Performance ofa Process” on page 83 in this guide.
Click the icon to view KPI summary information (if the componenthas multiple KPI instances) or KPI instance detail information (if the
KPI Instance icon
component has only one KPI instance). For more information aboutinterpreting KPI data, see “Analyzing Information about KeyPerformance Indicators” on page 145 in this guide.
8. The Analytics Overview page enables you to select KPIs and view an overview of theirinformation on the KPI Summary page. To viewKPIs, click the check box in the Detail columnnext to each desired KPI instance, and then click the View KPI Summary button. The KPISummary page is displayed showing relevant information for the selected KPIs.
Using Admin Mode to Delete KPI Instances
For users with administrative privileges the Analytics Overview page displays an icon thatactivates a different version of the page, known as AdminMode. This mode enables users to viewand select specific KPI instances for deletion. You can also access Admin Mode as a standalonepage not linked to the Analytics Overview page from the My webMethods menu by clickingAdministration > Data Management > KPI Instance Deletion.
The standard Analytics Overview search functionality is available in Admin Mode, so you cansearch and filter KPI instances according to specified criteria. Also, Admin Mode offers the sameviewing options as the Analytics Overview page.
For more information about deleting KPI instances, see the Administering webMethods OptimizePDF publication.
Exporting KPI Readings for a Specified Time RangeOn the Analytics Overview page you can search for KPI readings for a specified time range andexport the results to a .csv file.
To export KPI readings for a specified time range
1. In My webMethods: Navigate > Applications > Monitoring > System Wide > AnalyticsOverview.
2. Click the Advanced search tab.
For more information about using the Advanced search tab, see “Searching for Componentson the Analytics Overview Page” on page 46.
52 webMethods Optimize User's Guide 10.7
3 Monitoring System Component and Business Process Performance

3. Select a predefined value from the Last Reading Range drop-down list, or specify auser-defined time period using the Start Date, End Date, Hour and Minute fields.
4. Click Search.
Optimize searches for KPI instances which have last readings in the specified Last ReadingRange.
5. In the Analytics Overview pane, select the Table view.
By default, the table lists up to 200 KPI instances which have last readings in the specified LastReading Range. To change the maximum number of KPI instances that are displayed in thetable, specify a value up to and including 5,000 in the Max Results field on the Options tabof the Search pane and click Save.
6. Click Export Readings.
The Export Readings dialog opens.
7. Select an export option.
The following table lists the export options.
Do thisTo
Select the Export All Readings check box.Export all KPI readings in the specified LastReading Range
Select the Include Zero Readings check box.Include the auto-generated zero values of theKPI readings in the specifiedLast ReadingRange
Select theExport All Readings and the IncludeZero Readings check boxes.
Export all KPI readings in the specified LastReading Range, including the auto-generatedzero values of the KPI readings
Leave theExport All Readings and the IncludeZero Readings check boxes unselected.
Export only the KPI readings that are listed inthe Table view of the Analytics Overview pane
8. Click Export.
Optimize generates a .csv file that lists the KPI readings.
Note:The maximum number of KPI readings that Optimize supports for extraction is 2,000,000.
Viewing the Overall Status of Process Instances
In Optimize for Process, the Process Instances page displays the current status of BAM and BPMprocesses, and it enables you to search process instances based on a variety of criteria. Note that
webMethods Optimize User's Guide 10.7 53
3 Monitoring System Component and Business Process Performance

some information displayed on this page applies to BAM and BPM processes and some is specificto BAM processes.
To view the Process Instances page, navigate the following path in My webMethods:
Navigate > Applications > Monitoring > Business > Process Instances
By default, the Process Instances page shows information about all process instances that areupdated today. The display is updated whenever you refresh the page or perform a search.
The following table describes the information on the Process Instances page.
DescriptionColumn
Displays the date and time thatOptimize last updated the process instance(that is, when Optimize last received data).
Last Updated
Displays the date and time that the process instance began.Start Date/Time
Identifies the name of the process.Process Name
For a webMethods-executed process, this indicates the version of theprocess model assigned by Software AG Designer. For an externallyexecuted process, this will display “N/A.”
Version
Identifies the process instance for each process listed in Process Name.Process Instance ID
For processes that contain custom information, Optimize displaysprocess-specific custom columns when you select a single webMethods
<Process-specificcolumns>
process to view. If multiple processes are displayed, the contents of thesecustom columns are concatenated within the Process Instance ID. Formore information about custom columns, see “Dynamically GeneratedCustom Columns” on page 64.
Tracks the progress of the process instance through its execution.Status
MeaningValue
The process has started, but not all steps havecompleted. A status of indicates that one or moresteps may be executing with errors.
Started
The process was canceled.Stopped
Either the process completed successfully ( ) or theprocess completed but one or more steps executedwith errors ( ).
Completed
Either the process stopped because one or more stepsexecuted with errors or the process is no longer being
Failed
tracked and is missing information. This status is notapplicable to external (BAM-only) processes.
54 webMethods Optimize User's Guide 10.7
3 Monitoring System Component and Business Process Performance

DescriptionColumn
Parent process takes control of the failed processinstance. The parent process receives notification of
Failed (Escalated)
the failed process instance and continues executing.You cannot resubmit a process instancewith this statusbecause the parent process is no longer waiting for aresponse.
Process execution was paused ( ). This status is notapplicable to external (BAM-only) processes.
Suspended
The process was suspended and has been resumed.This status is not applicable to external (BAM-only)processes.
Resumed
The processwas resubmitted after it failed. This statusis not applicable to external (BAM-only) processes.
Resubmitted
Indicates that a running process instance has beenupdated to a new process model version during
Revised
execution. When a process version is updated, thestatus of the running process instance is automaticallychanged to Revised regardless of its previous status.
Length of time a process instancewas active. Duration is calculated basedon the status of the process instance:
Duration
Active. Length of time the process instance has been executing.Duration is calculated by subtracting the start time of the processinstance from the current system time.
Inactive. Length of time the process instance was active. Duration iscalculated by subtracting the start time of the process instance fromthe time the process instance became inactive.
Timed out or stopped. Length of time the process instancewas active.Duration is calculated by subtracting the start time of the processinstance from the time the cancel or timeout action occurred.
Note:For steps that execute in parallel, Duration does not include theoverlapping execution time.
Displays icons to viewmore details about the steps in the process instanceand the KPI instances associated with the process instance. Click the
Detail
Instance Detail icon to display the Process Instance Detail page. Formore information about these details, see “Viewing Details for a ProcessInstance” on page 65. Click the KPI Summary icon to display the KPISummary page and operational metrics associated with the process
webMethods Optimize User's Guide 10.7 55
3 Monitoring System Component and Business Process Performance

DescriptionColumn
instance. Note that this functionality is available only for external (BAMonly) or analysis enabled webMethods(BPM) processes. For moreinformation about KPI instances, see “Analyzing Information about KeyPerformance Indicators” on page 145 in this guide.
The Process Instances page contains the same four search tabs (Keyword, Advanced, Saved,Options) that appear on the Business Processes page and other search-enabled pages throughoutMy webMethods. These tabs enable you to search for process instances using a variety of criteriaand to control the number of process instances displayed. Refer to “Using the Analytics OverviewPage” on page 44 in this guide for more information or toWorking with My webMethods.
For more information about resubmitting processes, see “Resubmitting Processes from a Step andOptionally Editing Pipeline Information” on page 60.
When you first access the Process Instances page, the Keyword tab is active and the page showsonly those process instances that have been started today.
To refresh the display of process instances, click the Search button, or to view instancescontaining a specific word, type the desired word into the Keyword field and click the Searchbutton. If no process instances have been started in the current day, no results are returned.To search for older process instances, click the Advanced tab. For more information, see“Searching for Process Instances” on page 56.
To save a search, click the Save button and enter a name for the search in the Saved Searchdialog box and then click OK. The search is now available on the Saved tab.
To view a saved search, click the Saved tab and select the desired search from the SavedSearch field. Note that the Saved Search drop-down list appears only if there are savedsearches available.
By default, the maximum number of process instances displayed on the Process Instancespanel is controlled by the Max Results field on the Options tab. The default setting in thisfield is 200, and you can change the setting by entering any number up to and including 5,000.To override the setting in the Max Results field, click the No Maximum check box on theOptions tab. If you select this check box, the page will display available results up to the 5,000item limit.
To export the search results, click the Export Table button in the Process Instances window.
Searching for Process InstancesTo view instances for other time ranges or for other criteria, refer to the following procedure thatdescribes how to use the Advanced search tab.
To use the Advanced tab to search for process instances
1. InMywebMethods:Navigate > Applications > Monitoring > Business > Process Instances.
56 webMethods Optimize User's Guide 10.7
3 Monitoring System Component and Business Process Performance

2. Click the Advanced tab on the Process Instances Search panel.
3. In the Process drop-down list, select a process whose instances you want to view.
The following table describes how to use the Advanced search tab to view a specific set ofprocess instances.
Do thisTo
For an easily defined time period, such as This month or Last month,select from the predefined time ranges in the Date Range drop-downlist.
View only theprocess instanceswithin a date andtime range
If none of the predefined time ranges fit your search, complete the StartDate,End Date, and Time fields. If you specifyStart Date andEnd Datefields, the Date Range drop-down list changes to Custom. The Hourand Minute time fields are optional and default to 12:00 am (midnight)and 11:59 pm.
Optionally, use the Filter By drop-down list to specifywhether youwantto viewprocess instances that startedwithin the specified date/time rangeor that were last updatedwithin the specified date/time range. The defaultin the Filter By field is Date Last Updated.
From the Status list, select the status you want to search for. You canmulti-select statuses from this drop-down list by holding down theCTRL
View only theprocess instanceswith a specificstatus
key while clicking. For example, you can view all process instances thathave not completed (started, failed, suspended).
In the Search Condition drop-down list, click AND or OR to specifyhow you want the search terms to be handled logically.
Specify the logicyouwant applied tothe defined terms
4. When you are finished specifying your search criteria, click Search.
About Resubmitting Process Instances and Process StepsYou can use the resubmit feature to repair and re-execute process instances that have failed, or tore-execute completed process instances. Note that only webMethods-executed processes can beresubmitted.
A key component of the resubmit feature is the ability to edit the pipeline associated with a stepwithin the process instance prior to the resubmit operation. This is useful for modifying pipelinedata that could be causing the failure.
You resubmit a process instance by resubmitting a stepwithin that process instance. The resubmittalprocedure varies depending on the status of the steps within the process:
webMethods Optimize User's Guide 10.7 57
3 Monitoring System Component and Business Process Performance

Aprocess instancewith a “Completed” statusmay be resubmitted fromany step in the instance,provided you have first enabled the step for resubmission before the process instance beganexecuting.
A process instance with a “Failed” status may be resubmitted from any process instance stepthat has failed. A failed step is automatically enabled for resubmission, and the pipeline at thepoint of failure is automatically logged by the Process Engine and made available forresubmittal. No manual configuration is needed. Process instances with Failed (Escalated)status cannot be resubmitted as the parent process is no longer waiting for a response.
Requirements for Submitting Process Instances
The following requirements apply to resubmitting completed or failed processes:
Only webMethods-executed processes can be resubmitted. You must have a BPM or a BPMand BAM server environment selected in the Server list at the top of the Process Instancespage.
For a completed process, the step fromwhich you want to resubmit the process instance mustbe enabled for resubmission before the process instance began executing. Formore informationabout resubmit enabling, see “Enabling and Disabling a Step for Resubmission” on page 58.
The logging level for the process model from which the instance was started must be set to alevel that will log the input pipelines for those steps. Logging levels can be set in Designer, formore information see the webMethods BPM Process Development Help, and can also be adjustedinMywebMethods. For more information, see the PDF publicationwebMethodsMonitor User’sGuide.
You must have privileges to resubmit process instances and any referenced processes that itmay call. For more information, see the PDF publication Administering webMethods Optimize.
An Integration Servermust be available. The resubmit buttons and their associated table checkboxes are displayed only when this is the case.
You have appropriate Integration Server ACL settings to resubmit the process instances to aremote Integration Server in a non-clustered environment. If not:
1. Create an ACL using Integration Server Administrator. Go to the Security > AccessControl Lists page and create a new ACL to specify which user groups can access theremote server.
2. Go to the Settings > Remote Servers > Create Alias page, select the ACL created in theprevious step from the Execute ACL list, and create a remote server alias.
When the Integration Servers are clustered, the process instance is resubmitted to the IntegrationServer configured for your BPM and BAM or BPM only environment.
Enabling and Disabling a Step for Resubmission
A process instance with a “Completed” status may be resubmitted from any step in the instance,provided you have first enabled the step for resubmission before the process instance began
58 webMethods Optimize User's Guide 10.7
3 Monitoring System Component and Business Process Performance

executing. This setting has no effect on process instances that are currently running or that havealready stopped running.
In addition to enabling steps for resubmission as described below, you can also enable steps forresubmission in Software AG Designer. For more information about enabling and disabling stepsfor resubmission in Designer, see webMethods BPM Process Development Help.
Note:If you want to be able to resubmit process instances at certain steps, you must set the processmodel logging level to a level that will log the input pipelines for those steps.
To enable or disable a step for resubmission
1. In My webMethods: Navigate > Applications > Administration > Business > BusinessProcesses.
2. On the Business Processes page, search for the process model that contains the steps youwant to enable.
3. In the search results, locate the process model you want to work with and click Edit.
4. On the Edit Process page, click the Step Settings tab, and then do either of the following:
Select the corresponding check box for a step you want to enable for resubmission.
Clear the corresponding check box for a step to disable resubmission capability.
Note:When a step is enabled for resubmission, the pipeline data for that step is saved. Extensiveuse of resubmittal enablement (for example, enabling all steps for all process models forresubmittal) may result in a reduction in performance.
5. Click Save.
Resubmittal Behavior in the Run Time
The behavior that occurswhen you click theResubmit button depends on the status of the processinstance itself.
For a process instance in "Failed" status, resubmitting a failed step in the instance:
Marks the process instance as "Resubmitted"
Executes that step with the available pipeline.
Leaves the instance iteration of the process instance unchanged.
Increments the step iteration of the resubmitted step from its previous iteration.
Executes the remainder of the process instance from the point of resubmission.
webMethods Optimize User's Guide 10.7 59
3 Monitoring System Component and Business Process Performance

For a process instance in "Completed" status, resubmitting a step in the instance:
Creates a completely new iteration of the process instance.
Increments the process instance iteration.
Executes the remainder of the process instance from the point of resubmission.
Resubmitting Processes from a Step and Optionally Editing Pipeline Information
To resubmit a step in a process instance and optionally edit pipeline information
1. InMywebMethods:Navigate > Applications > Monitoring > Business > Process Instances.
2. Search for the process instance you want to resubmit.
3. In the search results, locate the process instance that you want to resubmit and click Detail.
Note:If your process instance has failed inmultiple places, itmay be necessary to resubmitmultiplesteps to get the instance running correctly. If this is the case, repeat the resubmit proceduresfor each step that requires resubmission.
4. On the Step Summary window of the Process Instance Detail page, locate the step that youwant to resubmit and click Detail.
Note:At this point, you can view or save the step pipeline data in XML format for additionalanalysis. Click Save Pipeline To File, and then click Open to view the file or click Save tosave the file, then click OK.
5. To edit the input pipeline for a step on the Process Step Detail page:
a. In the Step Information window, click Edit Pipeline.
Important:After you update the pipeline, the changes you make are available onlywhile you arestill on the Process Step Detail page. If you leave this page, the changes you make arenot saved. If you want to edit the pipeline before resubmitting, you must make youredits and then immediately resubmit the process step.
Note:The pipeline for the original iteration of the step is left unchanged. The updated pipelineis logged with the new iteration of the step.
b. On the Edit Step page, for each field value you want to change:
60 webMethods Optimize User's Guide 10.7
3 Monitoring System Component and Business Process Performance

a. Click the hyperlinked field value that you want to change. If the value of a field is notdisplayed with an active hyperlink, you cannot change that field value.
b. Specify a new value for the field.
c. Click OK.
d. After you modify all the fields you want to change, click Save. Monitor returns to theProcess Step Detail page.
6. Click Resubmit.
Example Resubmittal Use Cases
The following use cases demonstrate the most common scenarios for resubmitting a processinstance.
Unhandled Exception
One of the most common use cases for resubmission is when a step in a process fails and there isno exception handler for that step, referred to as an unhandled exception. If an unhandled exceptionoccurs, both the step and process instance are marked as "Failed" in Monitor and the pipeline forthe failed step is saved at the point of failure.
The process instance continues to execute if there other tracks in the process that were executingprior to the failure, until the instance reaches a logical stopping point.
You can then locate the failed instance and step, edit the pipeline, and resubmit the failed step.The process instance will then continue executing from the point of the unhandled exception toits logical conclusion using the modified pipeline values.
Handled Exceptions
In this case, the process model implementation includes an exception handler. For example, youcan model a boundary error event that transitions to an error handler sequence flow in the eventof step failure at run-time. This is considered a handled exception.
The resubmit feature can still be used to resubmit failed steps in this case. However, this is not acommon pattern, as the purpose of the exception handler is to execute whatever logical behavioris needed to prevent the failure of the process instance in the event of a step failure.
In other words, if your exception handler is designed properly and working as expected, youwould not normally need to resubmit the process instance. If you have to resubmit failed steps inprocess instances with an exception handler, you are advised to modify your exception handlinglogic to correctly process the source of the failure.
Steps Enabled for Resubmission
Resubmission is not limited to steps that have failed. For example, you might want to resubmit asuccessfully completed step that is situated earlier in the process flow than the actual failed step
webMethods Optimize User's Guide 10.7 61
3 Monitoring System Component and Business Process Performance

to repair a failed process instance. Editing the pipeline at this previous, successfully completedstep might be necessary to enable the failed step to complete successfully.
This is supported only if the completed step you want to resubmit was previously enabled forresubmission. You must enable the step for resubmission prior to the execution of the processinstance. To enable a step for resubmission, see “Enabling and Disabling a Step forResubmission” on page 58.
Resubmitting Completed Processes
A less common but supported pattern is the resubmission of a successfully completed processinstance. Note that a successfully completed process can still contain a failed step, if the processmodel also contains an exception handler step that was able to complete the process successfully.In this case, you can resubmit either the failed step or any other step that is enabled forresubmission. A totally new instance of the process is started and execution begins from the pointof resubmission. Depending on the process model, it may be necessary to resubmit multiple stepsto complete the process.
Obtaining EDA (Deprecated) Event Information about ProcessStagesA process stage is a logical grouping of one or more process steps accompanied by a rule of somesort, such as a threshold for execution duration. Usually, the stage represents an important rolefrom a business perspective, and it is an object of interest for business process analysts. A stagecan be defined in any process model using the Process Development perspective for Software AGDesigner. After the process model is uploaded for analysis, the webMethods Process Trackercomponent picks up the process model and its stage definitions from the Process Audit database.
Whenever an event for process or step execution that marks the beginning of a stage is received,Process Tracker produces an ProcessStageInstanceChange event for the given stage, reporting thatthe stage status is “running”, and begins to evaluate the rule associated with this stage. If the ruleis violated, Process Tracker produces another ProcessStageInstanceChange event, reporting thecurrent stage status and the time when the rule was breached.When a process stage is completed,Process Tracker produces another ProcessStageInstanceChange event, reporting that the stagestatus is now “complete”. It also produces the ProcessStageInstanceDuration eventwhich containsthe actual stage execution duration.
When a process instance containing stages is completed or canceled, Process Tracker changes thestatus for all running stage instances to “incomplete”, then evaluates the rules associated withthose stage instances. If the rules are violated, Process Tracker sends ProcessStageInstanceChangeevents reporting that the stage instance status is “incomplete” and the time when the rule wasbreached.
The following table describes the EDA (deprecated) event types that Process Tracker produces.
DescriptionEvent Type
Events of this type are produced by Process Tracker every time it detects thatthe process execution passes through a point that has been defined as the
Process StageInstance Change
62 webMethods Optimize User's Guide 10.7
3 Monitoring System Component and Business Process Performance

DescriptionEvent Type
beginning or the end of a stage, and reports the change in state for therespective process stage. It also contains the breach time in case the ruleassociated with a stage instance has been breached.
Events of this type are produced by Process Tracker every time it detects thata stage has completed. The events contain the actual stage duration.
Process StageInstance Duration
For event schema definitions and other information about working with EDA (deprecated) eventtypes and processes, see the webMethods BPM Process Development Help.
The following table lists the process stage intrinsic KPIs.
DescriptionProcess Stage KPI
Counts the number of stages for which an associated rule has been breached.The KPI instance names conform to this template: "Breach Count by Process
Breach Count byStage
$Process.ProcessNameStage $Stage.StageName". For example: "BreachCountby Process PricingProcess Stage ValidatePricing". The aggregation intervalis one minute, and if there are no breached stage instances during theaggregation interval, a zero value is added.
Counts the stage instances generated by Process Tracker. The KPI instancename conforms to this template: “Instance Count by Process
Instance Count byStage
$Process.ProcessName Stage $Stage.StageName”. For example: “InstanceCount by Stage PricingProcess Stage ValidatePricing”. The aggregationinterval is one minute.
Counts the completed stage instances generated by Process Tracker. The KPIinstance name conforms to this template: “Complete Count by Process
Complete Count byStage
$Process.ProcessName Stage $Stage.StageName”. For example: “CompleteCount by Process PricingProcess Stage ValidatePricing”. These KPI instancesare populated only when the stage ending milestone is processed by theProcess Tracker. The aggregation interval is one minute, and no zero valuesare added if there are no stage instances finished during the aggregationinterval.
Counts the incompleted stage instances generated by Process Tracker. TheKPI instance name conforms to this template: “Incomplete Count by Process
Incomplete Countby Stage
$Process.ProcessNameStage $Stage.StageName”. For example: “IncompleteCount by Process PricingProcess Stage ValidatePricing”. These KPI instancesare populated when the process instance is complete before a stage endingmilestone is processed by Process Tracker. The aggregation interval is oneminute, and no zero values are added if there are no stage instances finishedduring the aggregation interval.
Measures the average execution time of the stage instances generated byProcess Tracker. TheKPI instance names conform to this template: "Processing
Process Time byStage
Time by Process $Process.ProcessName Stage $Stage.StageName". These KPI
webMethods Optimize User's Guide 10.7 63
3 Monitoring System Component and Business Process Performance

DescriptionProcess Stage KPI
instances are populated only when the stage ending milestone is processedby the Process Tracker. Process Tracker contains an early stage breachdetection mechanism that keeps track of the actual time passed from thebeginning of the stage instance and sets the state to Breached if the actualtime exceeds the time specified as a stage breach condition. Stage instancesmarked as Breached by the early stage breach detection mechanism will notbe a part of this measurement, because their actual execution time is stillunknown (the ending milestone has not been received yet). The aggregationinterval is one minute, and no zero values are added if there are no stageinstances finished during the aggregation interval.
Dynamically Generated Custom ColumnsOptimize displays the following standard set of information, with a set of standard columnheadings, for each process instance:
For processes that contain custom fields, Optimize can also display custom column headings todisplay custom information that has been added to the process.
If instances from multiple processes are displayed, the custom headings may need to beconcatenated and displayed within the standard Process Instance ID column.
64 webMethods Optimize User's Guide 10.7
3 Monitoring System Component and Business Process Performance
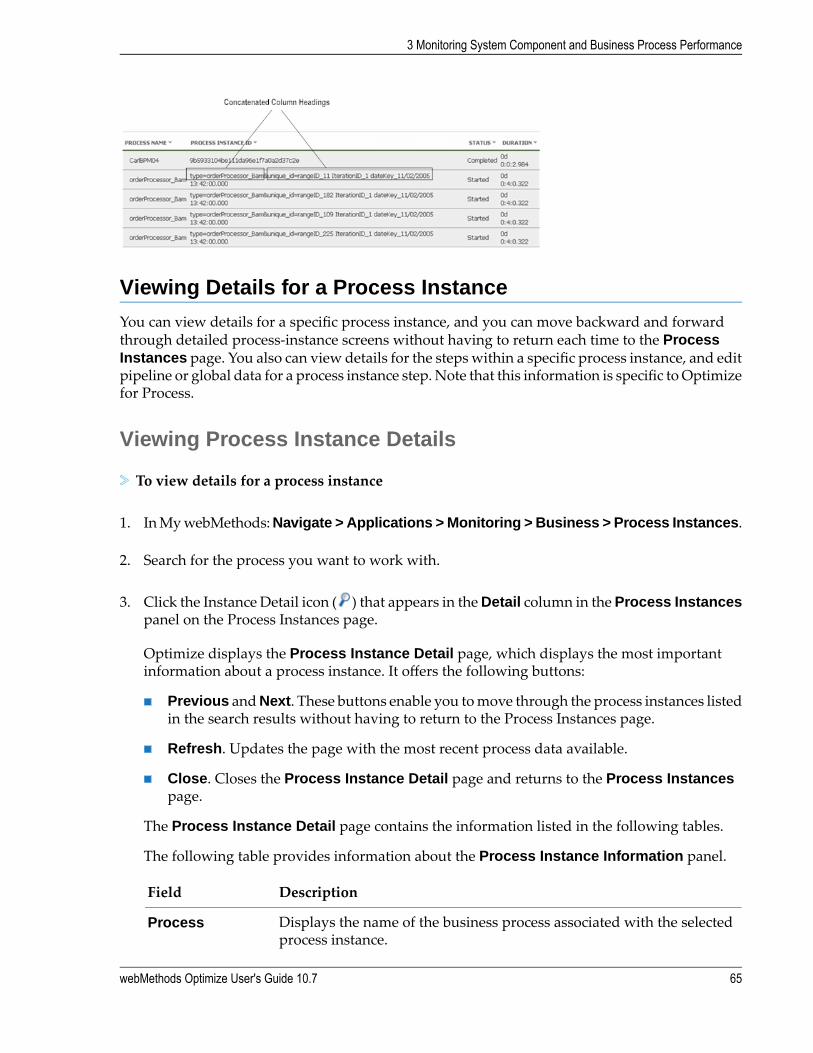
Viewing Details for a Process Instance
You can view details for a specific process instance, and you can move backward and forwardthrough detailed process-instance screens without having to return each time to the ProcessInstances page. You also can view details for the steps within a specific process instance, and editpipeline or global data for a process instance step. Note that this information is specific toOptimizefor Process.
Viewing Process Instance Details
To view details for a process instance
1. InMywebMethods:Navigate > Applications > Monitoring > Business > Process Instances.
2. Search for the process you want to work with.
3. Click the Instance Detail icon ( ) that appears in theDetail column in the Process Instancespanel on the Process Instances page.
Optimize displays the Process Instance Detail page, which displays the most importantinformation about a process instance. It offers the following buttons:
Previous andNext. These buttons enable you tomove through the process instances listedin the search results without having to return to the Process Instances page.
Refresh. Updates the page with the most recent process data available.
Close. Closes the Process Instance Detail page and returns to the Process Instancespage.
The Process Instance Detail page contains the information listed in the following tables.
The following table provides information about the Process Instance Information panel.
DescriptionField
Displays the name of the business process associated with the selectedprocess instance.
Process
webMethods Optimize User's Guide 10.7 65
3 Monitoring System Component and Business Process Performance

DescriptionField
For a webMethods-executed process, this indicates the version of theprocess model assigned by Software AG Designer. For an externallyexecuted process, this will display “N/A.”
Model Version
Indicates the date and time that the selected process instance started.Start Date/Time
Indicates the date and time that Optimize last updated the selectedprocess instance.
Last Updated
Displays the unique identifier for the process instance. If a processinstance ID consists of multiple parts (such as order numbers from two
Instance ID
ormore different order systems), Optimize creates one row for each partof the process instance ID.
For processes that contain custom information, Optimize displaysprocess-specific custom columns when you select a single webMethods
<Process-specificcolumns>
process to view. Ifmultiple processes are displayed, the contents of thesecustom columns are concatenated within the Process Instance ID. Formore information about custom columns, see “Dynamically GeneratedCustom Columns” on page 64.
Unique identifier for the parent process instance, if applicable. Providedonly for instances that have been started by other instances.
Parent Instance ID
Indicates the number of times the process instance was submitted.Instance Iteration
Indicates the status of the process instance, as described in “Using theAnalytics Overview Page” on page 44 in this guide.
Status
For active process instances (those with a status of Started, Resumed, orResubmitted), duration represents the length of time that this process
Duration
instance has been executing, calculated by subtracting the start time ofthe process from the current system time.
For inactive process instances (thosewith a status of Stopped, Completed,Failed, or Suspended), duration represents the length of time that theprocess instance was active, calculated by subtracting the start time ofthe process from the time the process became inactive.
For process instances that have timed out (status of either Stopped orCompleted) or have been canceled (status of Stopped), duration representsthe length of time that the process instance was active, calculated bysubtracting the start time of the process from the time the cancel ortimeout action occurred.
Note:For process instance steps that execute in parallel, this Duration valuedoes not include the overlapping execution time.
66 webMethods Optimize User's Guide 10.7
3 Monitoring System Component and Business Process Performance

DescriptionField
These buttons are available onlywhen a process instance is running (thatis, does not have a status of Completed).
Buttons:
Update. Available when a process instance is running and a newversion of the source process model has been enabled. This updatesthe running instance so that it uses the newly enabledmodel versionfor the rest of the process.
Suspend/Resume. Click to suspend or resume a process instance.
Stop. Click to stop the process instance.
The following table provides information about the Process Stage Timeline panel.
Process Stage Timeline Information
The Process Stage Timeline panel displays a graphical presentation of stage activity and statusover time. webMethods Optimize for Process must be installed to be able to view stage timelineinformation.
Note:When a process contains no stages, or if webMethods Optimize for Process is not installed, thiswindow is collapsed to show only the title bar. It cannot be expanded.
Note:Process stage logging does not occur instantaneously. This can result in a delay of up to fiveminutes between stage instance changes and the stage status displayed in the Stage Timelinewindow. For example, when viewing a recently executed process instance, stages may initiallyappear as not yet started. Click the Refresh button on the Process Instance Detail page toupdate the Stage Timeline window. For more information, see “About Process Generation andStage Status Display” in the Building and Uploading chapter of webMethods BPM ProcessDevelopment Help.
By default, stages of all statuses are displayed, as indicated by the stage status display checkboxes:
You can filter the list of displayed stages by clearing a stage status check box, which removesstages of that status from the display. Select a check box to display stages of that status. The stagelist provides the following information:
Note:Click on a column name to activate the sort controls for that column.
The following table provides information about the columns of the Process InstanceInformation panel.
webMethods Optimize User's Guide 10.7 67
3 Monitoring System Component and Business Process Performance

DescriptionColumn
The current status of the stage: Completed, Running, Incomplete, or NotStarted.
Status
The name assigned to the stage.Name
Cycle time is based on the status of the stage:Cycle Time
Completed. The length of time it took for the stage to run from start tocompletion.
Running. The length of time since the stage began executing.
Incomplete. The length of time it took for the stage to run from start tothe time it stopped running for any reason other than completion (forexample, step failure or process suspended).
Note:A stage will have incomplete status:
if it is still running when the process terminates for any reason.This can happen with normal process execution if the processinstance took a split branch that does not terminate.if the End Milestone of a stage is defined as the start or end of astep which is part of a subprocess.
Not Started. No cycle time is displayed.
Deviation is calculated only when the stage is breached. A value of +/- 0indicates no deviation. A stage that has breached its defined condition isindicated by an alarm icon .
Deviation
Thedeviation time is calculated by comparing theCycle Time to theConditionexpression defined for the stage. If the condition specifies <, then the stageis breached when the cycle time exceeds the specified time period. If thecondition specifies >, then the stage is breached when the cycle time is lessthan the specified time period. For example:
If the Condition expression is “< 2 seconds” and the stage completes in3 seconds, the deviation is 1 second, and the stage is breached.
If the Condition expression is “> 2 hours” and the stage completes in 1hour and 30 minutes, the deviation is -30 minutes, and the stage isbreached.
You can obtain additional stage information as follows:
Hover the cursor over any row in the stage list, or over the colored bar for a stage in chartarea to view the stage name and description as well as the following:
Status: The current status of the stage.
68 webMethods Optimize User's Guide 10.7
3 Monitoring System Component and Business Process Performance

Start Milestone: The point in the process where the stage starts.
End Milestone: The point in the process where the stage ends.
SLA Condition: The expected execution time specified in the stage’s Conditionexpression.
Stop Tracking On Breach: Indicates if this option is selected (Yes or No).
Clicking any row in the stage list does all of the following:
Displays the stage’s start milestone and stage endmilestone in the Process Diagramwindow. Only one stage can be displayed in the Process Diagram at any time. Clickanother row to display the milestones for another stage.
If you have selected the Stop Tracking On Breach check box for a stage and that stageexperiences a breach, all stage tracking ceases and any remaining stages in the processare marked as Incomplete. In this case, it is possible for the steps within the stage to beshown as Complete in the process diagram,while the stage that contains them is shownas Incomplete. This is expected behavior.
Filters the Step Summary list to display only those steps that executedwithin the stage'scycle time. Steps that are in a different path from the stage's start and end milestonesteps will also be included if the step’s execution time falls within the stage cycle time.
Filters the Logged Fields list to display only those logged fields that belong to a stepin the filtered Step Summary list.
Click Clear Selection in the Process Stage Timeline window to remove the milestoneicons and display all process steps in the Step Summary window and all logged fieldsin the Logged Fields window.
To set the time resolution for the chart, select from Year, Month, Week, Day, Hour, orMinute in the Time Unit list.
The Process diagram depicts the progression of steps in the process. If the process is awebMethods-executed process, status icons appear on the steps in the diagram.
The following table providesmore information about the status icons forwebMethods-executedprocesses.
DescriptionIcon
The step is running.
The step has completed.
The step has failed.
The step is waiting (for example, to receive an external document).
webMethods Optimize User's Guide 10.7 69
3 Monitoring System Component and Business Process Performance

In addition, you can display milestones for an individual stage by selecting the stage in thelist portion of the Process Stage Timeline window. See “Process Stage Timeline”, above, formore information. The following right-click options are available for process diagrams on theProcess Diagram panel.
Fit to screen - Resizes and re-centers the diagram based on the screen size.
Hide transition labels - Hides description and expression text on all transition lines in thediagram.
Show transition descriptions - Shows all applicable description text created in Designerfor all transitions on the diagram.
Show transition expressions - Shows applicable transition expressions created inDesignerfor all transitions on the diagram.
Note:External (BAM-only) processes can have only one status: “The step has Completed.” Noother statuses listed here are displayed for these processes.
The Step Summary panel displays information about the execution of the steps within theprocess instance.
Note:The list of steps can be filtered by stage by selecting the stage in the list portion of the ProcessStage Timeline panel. See “Process Stage Timeline”, above, for more information. ClickClear Selection in the Process Stage Timeline panel to display all process steps in the StepSummary panel.
The following table provides information about the panel.
DescriptionColumn
The step started successfully.<Status Icons>
The step has started and may include errors.
The step completed with errors.
Displays the name of the step.Step Name
Indicates the date and time that the step began executing.Start Date/Time
Indicates the date and time that the step stopped executing.Last Updated
ForwebMethods-executed processes orworkflows, identifies the numberof times the process or workflow executed, including re-submissions.For externally executed processes, this value will always be 1.
Instance Iteration
Displays the number of times the step executed.Step Iteration
Applies only to steps that can be configured for standard looping, suchas a subprocess step or a call activity step. A step executes a loop iteration
Loop Iteration
70 webMethods Optimize User's Guide 10.7
3 Monitoring System Component and Business Process Performance

DescriptionColumn
only when a loop condition is configured for the step and that conditionhas been met.
Note:A step can loop two ormore times until the loop condition is no longermet. A separate row exists for each loop iteration. Any time the stepiteration increments, the loop iteration count is reset and begins againwith 1.
Displays the status of the step.Status
MeaningValue
The step has started. The stepmay be executingwitherrors.
Started
The step was canceled. This status is not applicableto BAM-only processes.
Stopped
Either the step completed successfully or the stepcompleted but it executed with errors.
Completed
Either the step stopped because it executed witherrors or the step is no longer being tracked and is
Failed
missing information. This status is not applicable toBAM-only processes.
The time specified for the step in the process modelfor an event to occur expired before the event was
Expired
satisfied. For example, the time set for a joincondition expired before a document required bythe join condition arrived.
An attemptwasmade to execute the stepmore timesthan is specified.
Retries Exceeded
A join definition for the step has not been satisfied.That is, some incoming transitions have not arrived.
Unsatisfied Join
Step is waiting for an event to occur (for example,the step might be waiting for a document to arrive).
Waiting
The step has been interrupted by an interruptingboundary event.
Interrupted
For active steps (those with a status of Started), duration represents thelength of time that this step has been executing, calculated by subtractingthe start time of the step from the current system time.
Duration
webMethods Optimize User's Guide 10.7 71
3 Monitoring System Component and Business Process Performance

DescriptionColumn
For inactive steps (those with a status of Stopped, Completed, or Failed),duration represents the length of time that the stepwas active, calculatedby subtracting the start time of the step from the time the step becameinactive.
For steps that have timed out (status of either Stopped or Completed) orhave been canceled (status of Stopped), duration represents the lengthof time that the step was active, calculated by subtracting the start timeof the step from the time the cancel or timeout action occurred.
webMethods-referenced process or BPMN callable process that wasexecuted at run time for this step.
ReferencedProcesses
Displays the KPI Detail icon and the Step Detail icon. Click either iconto view more details about the step execution.
Detail
The Control Actions panel appears only when a control action (suspend, resume, resubmit,or stop) has been performed on a webMethods-executed process. This panel is available onlyfor BPM processes.
The following table provides information about the Control Actions panel.
DescriptionColumn
Displays the date and time that the control action was performed.Date/Time
Identifies the action taken on the process instance (suspend, resume,resubmit, or stop).
Action
Displays the process iteration upon which the control action was taken.Instance Iteration
Displays the name of the step, if applicable.Step Name
Displays the step iteration upon which the control action was taken.Step Iteration
Identifies the server on which the process instance executed.Server ID
Identifies the user associated with the control action.User
The Activity Messages panel appears only when a webMethods-executed process executeda service that logged user-defined messages. This panel is available only for BPM processes.
The following table provides information about the Activity Messages panel.
DescriptionColumn
Displays the date and time that the activity message was logged.Date/Time
Displays the name of the step.Step Name
72 webMethods Optimize User's Guide 10.7
3 Monitoring System Component and Business Process Performance

DescriptionColumn
Displays the type of message.Entry Type
Message. The message is informational and no action is needed.
Warning. The process can complete successfully even if the circumstancecausing the warning is not addressed.
Error. The process cannot complete successfully until the circumstancecausing the error is resolved.
Displays a shortened version of the message.Brief Message
Displays the full version of the message.Full Message
TheLogged Fieldspanel appears onlywhen the process has logged run-time values for certaininput, output, and global data document fields. For more information about custom loggedfields, see the webMethods BPM Process Development Help.
The following table provides information about the Logged Fields panel.
DescriptionColumn
Displays the date and time that the custom field was logged.Date/Time
Displays the name of the step.Step Name
ForwebMethods-executedprocesses orworkflows, identifies the numberof times that the process orworkflowexecuted, including re-submissions.For externally executed processes, this value will always be 1.
Instance Iteration
Displays the step iteration that was executingwhen the customfieldwaslogged.
Step Iteration
Applies only to steps that can be configured for standard looping, suchas a subprocess step or a call activity step. A step executes a loop iteration
Loop Iteration
only when a loop condition is configured for the step and that conditionhas been met.
Note:A step can loop two ormore times until the loop condition is no longermet. A separate row exists for each loop iteration. Any time the stepiteration increments, the loop iteration count is reset and begins againwith 1.
Indicateswhether the logged fieldwas defined to log from the step inputpipeline or the step output pipeline.
Input/Output
Displays the name of the custom logged field.Field Name
Displays the value of the custom logged field.Field Value
webMethods Optimize User's Guide 10.7 73
3 Monitoring System Component and Business Process Performance

The Process Errors panel displays information about process errors and step errors, sortedby time. Note that some fields are specific to either BAM or BPM processes.
The following table provides information about the Process Errors panel.
DescriptionColumn
Indicates the date and time that the error occurred.Date/Time
This column is empty for BPMprocesses. For BAMprocesses, it displaysthe name the user gave to the standardized or custom error types for the
Error
applicable process instance. See the “Configuring Business Processes”chapter inAdministeringwebMethodsOptimize formore information abouterrors.
For BAMprocess instances, errormessages provide the following detailsbased on the category of the error type:
Error Message
For Standardized error types, errormessages displaydetails regardingthe cause of the error (for timeouts, the time that was expired; fordimension-based timeouts, the dimension instance is listed).
ForCustomerror types, errormessages display the error text includedin the execution error received from the Monitor API.
For System error types, error messages display a detailed messageregarding the internal system error that occurred. In some cases, astack trace is included. This error message matches a similar errormessage logged to the Analytic Engine's error log file.
This field is applicable only to BPM processes. It provides additionalrun-time error text and, where applicable, a stack tracewith details aboutthe error.
Message Detail
Displays the name of the webMethods service that was invoked whenthe error occurred. This columnappears onlywhen awebMethods serviceis associatedwith the error. This field is applicable only to BPMprocesses.
Service Name
Number of times the step was executed as a result of:Step Iteration
A transition drawn to this step downstream step that causes the stepto execute multiple times during a single process execution.
The process was resubmitted, causing the step to execute again.
Displays the name of the step that was executing when errors occurredand lists all related errors. This field is empty for errors at a process level,such as a process timeout.
Step Name
Identifies the server on which the error occurred. This column appearsonly if a specific server is associatedwith the error. This field is applicableonly to BPM processes.
Server ID
74 webMethods Optimize User's Guide 10.7
3 Monitoring System Component and Business Process Performance

4. If you want to see more details about the execution of a particular step, click the Step Detailicon ( ) next to that step in the Step Summary panel and continue to “Process Instance StepDetails” on page 75.
5. If youwant to resubmit a step, see “About Resubmitting Process Instances and Process Steps” onpage 57 and “Resubmitting Processes from a Step and Optionally Editing PipelineInformation” on page 60.
Process Instance Step Details
To view details for a process instance step
1. InMywebMethods:Navigate > Applications > Monitoring > Business > Process Instances.
2. Search for the process youwant toworkwith, and in the search results in the Process Instanceswindow, click the Detail icon ( ) for the process instance to open the Process Instance Detailpage.
Note:The icon is not available for rows representing a subprocess or call activity loop iteration,as there is no additional information available.
3. Click the Step Detail icon ( ) to the right of a step in the Step Summary window.
Optimize displays theProcess Step Detail pagewhich provides additional information aboutthe step.
The following table describes the information that is displayed in the Step Information panel.
DescriptionColumn
Displays the name of the step.Step Name
Displays the date and time that the step began executing.Start Date/Time
Indicates the date and time that Optimize last updated the step.Last Updated
Number of times the process instance executed, including resubmissions.For externally executed processes, this value is always 1.
Instance Iteration
Displays the number of times the step executed.Step Iteration
Applies only to steps that can be configured for standard looping, suchas a subprocess step or a call activity step. A step executes a loop iteration
Loop Iteration
only when a loop condition is configured for the step and that conditionhas been met.
webMethods Optimize User's Guide 10.7 75
3 Monitoring System Component and Business Process Performance

DescriptionColumn
Note:A step can loop two ormore times until the loop condition is no longermet. A separate row exists for each loop iteration. Any time the stepiteration increments, the loop iteration count is reset and begins againwith 1.
Displays the status of the step. Values for this field are the same as theStatus values on the Process Instance Detail page described earlier inthis section.
Status
Displays the amount of time that the step took to execute, from thebeginning of the step to the end of the step.
Duration
For webMethods-executed processes, identifies whether the server is anIntegration Server or a Task Engine. For externally executed processes,this row reads External.
Server Type
For webMethods-executed processes, identifies the server on which thestep executed. This rowdoes not appear for externally executedprocesses.
Server ID
For webMethods-executed processes, identifies the service that the stepexecuted, if the step is a Flow step. This row does not appear fornon-service steps or externally executed processes.
Invoked Service
For task steps in a webMethods-executed processes, identifies the taskthat the step executed. This row does not appear for non-task steps orfor externally executed processes.
Task Detail
The following table describes the information that is displayed in the Step History panel.
DescriptionColumn
Displays the date and time recorded for the particular status.Date/Time
Displays each status logged for the step.Status
For webMethods-executed processes that involve webMethods TaskEngine for user interaction, identifies the user associated with this stepstatus. For externally executed processes, this column is empty.
User
For webMethods-executed processes that involve webMethods TaskEngine for user interaction, displays the role associated with this stepstatus. For externally executed processes, this column is empty.
Role
The following table describes the information that is displayed in theControl Actionswindow.
76 webMethods Optimize User's Guide 10.7
3 Monitoring System Component and Business Process Performance

DescriptionColumn
Displays the date and time that the control action was performed.Date/Time
Identifies the control action taken on the step (suspend, resume, resubmit,or stop).
Action
Displays the user associated with the specific control action performedon this step.
User
Identifies the server on which the step executed.Server ID
Note:The Control Actions window appears only when control actions (that is, suspend, resume,resubmit, or stop) have been performed on a step within a webMethods-executed process.
The following table describes the information that is displayed in the Activity Messageswindow.
DescriptionColumn
Displays the date and time that the activity message was logged.Date/Time
Displays one of the following types of messages.Entry Type
Message. The message is informational and no action is needed.
Warning. The step can complete successfully even if the circumstancecausing the warning is not addressed.
Error. The step cannot complete successfully until the circumstance causingthe error is resolved.
Displays a shortened version of the message.Brief Message
Displays the full version of the message.Full Message
Note:The Activity Messages window appears only when a webMethods-executed process stepran a service that logged user-defined messages.
The following table describes the information that is displayed in the Logged Fieldswindow.
DescriptionColumn
Displays the date and time that the custom field was logged.Date/Time
Displays the name of the custom logged field.Field Name
Displays the value of the custom logged field.Field Value
webMethods Optimize User's Guide 10.7 77
3 Monitoring System Component and Business Process Performance

Note:The Logged Fields window appears only when the process step logged run-time valuesfor certain input, output, and global data document fields. For more information aboutcustom logged fields, see webMethods Monitor User’s Guide.
The Step Errors window displays step errors (either standardized or customized) that havebeen defined by a user.
The following table describes the information that is displayed in the Step Errors window.
DescriptionColumn
Displays the date and time that the error occurred.Date/Time
Indicates the type of error that occurred. For BAM processes, it displaysthe name the user gave to the standardized or custom error types for the
Error Type
applicable process instance. See the “Configuring Business Processes”chapter inAdministeringwebMethodsOptimize formore information abouterrors.
For BAMprocess instances, errormessages provide the following detailsbased on the category of the error type:
Error Message
For Standardized error types, errormessages displaydetails regardingthe cause of the error (for timeouts, the time that was expired; fordimension-based timeouts, the dimension instance is listed).
ForCustomerror types, errormessages display the error text includedin the execution error received from the Monitor API.
For System error types, error messages display a detailed messageregarding the internal system error that occurred. In some cases, astack trace is included. This error message matches a similar errormessage logged to the Analytic Engine's error log file.
4. On the Process Step Detail page, perform any of the actions for BPM processes, as describedin the following table.
Do this on the Step Information panelTo
Click Edit Pipeline. For more information, see “Resubmitting Processesfrom a Step and Optionally Editing Pipeline Information” on page 60.
Edit pipeline datafor this step
Note:This button is available only for logged webMethods-executedprocesses that have completed, failed, or stopped.
Click Resubmit. For more information, see “Resubmitting Processesfrom a Step and Optionally Editing Pipeline Information” on page 60.
Resubmit this step
78 webMethods Optimize User's Guide 10.7
3 Monitoring System Component and Business Process Performance

Do this on the Step Information panelTo
Note:This button is available only for logged processes that have completed,failed, or stopped.
About Subprocess Detailed Information
When you create a processmodel on the SoftwareAGDesigner Process Development perspective,you can add one or more subprocesses to the model. In addition, you can add a subprocess to asubprocess, nesting asmany levels as you need. You can view detailed information for subprocesssteps in the Step Summary area, just like any other step. When a subprocess is configured forstandard looping, looping information is also available.
Note:Do not confuse a subprocess step with a webMethods-referenced process step or a BPMN callactivity step. Referenced processes and BPMNcallable processes execute another processmodel,with the process model name shown in the Referenced Process column of the Step Summaryarea.
To view the steps within a subprocess, see “Viewing Steps Within a Subprocess” on page 79.
Viewing Steps Within a Subprocess
Each subprocess typically contains one ormore steps.When a subprocess is configured for standardlooping, looping information is also available.
To view the steps within a subprocess
1. InMywebMethods:Navigate > Applications > Monitoring > Business > Process Instances.
2. Display detailed information for the process instance that contains the subprocess you wantto work with, as described in “Viewing Process Instance Details” on page 65.
3. In the Step Summary area, locate the subprocess you want to view and click the expansionicon next to the subprocess name. Monitor displays the steps within the subprocess in thetable.
If the subprocess is not configured for looping, a table entry is available for each step inthe process.
If the subprocess is a BPMNsubprocess configured for standard looping, each loop iterationof the subprocess is shown as a separate table entry. Click the expansion icon next to thesubprocess iteration to see the step summary information for each step in the processduring that loop iteration.
Note:
webMethods Optimize User's Guide 10.7 79
3 Monitoring System Component and Business Process Performance

Any time the parent subprocess step iteration increments, the loop iteration count isreset and begins again with 1.
4. Subprocess that contain any child subprocesses also display an expansion icon. Continueexpanding the subprocesses until you locate the step you want to view.
Tip:To expand and contract all subprocess instances in the table, click the expansion icon next tothe Step Name column title.
Note:This expandable/collapsible display is not available for deprecated webMethods subprocesses.In this case, all step entries are available at the top level of the table only.
About Subprocess and Call Activity Duration Time
The Step Summary area contains a Duration column, which displays the length of time that thestep took to execute. This value represents the time to execute for the activity:
For a subprocess, this is the time to execute all of the steps in the subprocess.
For a call activity, this is the time to execute the callable process.
Therefore, it would seem logical that the duration time of the subprocess or call activity wouldequal the sum of the durations of all the steps in the subprocess, or the duration of the callableprocess.
However, the duration may actually be greater than the sum of its internal objects. This is becausethe subprocess or call activity duration also includes communication time, as well as time takenby minor transport delays caused by network latency.
In addition, when theWaitForSubprocess value in the service pub.prt.SubprocessModel is set to falsefor a dynamic reference process, the call activity step in the parent is shown as ended as soon asthe child instance is started. Therefore, the duration for that step iteration in the parent is initiallyvery short. After the child instance completes, the duration value changes to the actual durationof the child instance. Monitor computes the duration from the start record to whatever the lastrecord is for a step.
In cases where you use the dynamic reference process method to initiate multiple instances of achild model, the duration value represents the duration of the longest of the child instances that wererun, and not the sum of all the durations of all the children.
Viewing a Call Activity Step
A call activity step starts an instance of another process model that exists outside of the currentprocess and, if desired, incorporates the results of that referenced process into the pipeline of thecurrent process. When a call activity is configured for standard looping, looping information isalso available.
80 webMethods Optimize User's Guide 10.7
3 Monitoring System Component and Business Process Performance

To view the results of a call activity
1. InMywebMethods:Navigate > Applications > Monitoring > Business > Process Instances.
2. Display detailed information for the process instance that contains the subprocess you wantto work with, as described in “Viewing Process Instance Details” on page 65.
3. In the Step Summary area, locate the call activity for which to view details.
If the call activity is not configured for looping, a table entry is displayed with the stepsummary information for the call activity.
If the call activity is configured for standard looping, each loop iteration of the call activityis displayed as a separate table entry. Click the expansion icon next to the call activityiteration to see the step summary information for each referenced process during that loopiteration.
Note:Any time the call activity step iteration increments, the loop iteration count is reset andbegins again with 1.
4. You can view the details of the referenced process (and from there, the summary informationfor the steps within it) in either of two ways:
In the Step Summary window, click the link in the Referenced Subprocess column.
In the ProcessDiagramwindow, click the + icon locatedwithin the referenced process step.
Click the Close button in the Process Details page for the referenced process to return to theparent process.
Viewing Process Metrics
You can viewmetrics for a specific process using the ProcessDashboards. You can viewdata aboutthe activity, alarms, and cycle time of the selected process, as well as similar information about itsprocess stages.
Viewing Metrics for a Process
To view metrics for a process
1. In webMethods Business Console, select Analytics.
2. Select the process you want to work with from the drop-down list.
The process metrics, such as process activity, process alarms, process cycle time, stage alarms,and stage cycle times are displayed.
webMethods Optimize User's Guide 10.7 81
3 Monitoring System Component and Business Process Performance

Note:For more information about webMethods Business Console, seeWorking with webMethodsBusiness Console. For more information about the Business Process Dashboards, seeWorkingwith Business Process Dashboards.
82 webMethods Optimize User's Guide 10.7
3 Monitoring System Component and Business Process Performance

4 Improving the Long-Term Performance of a
Process
■ Overview ........................................................................................................................ 84
■ What is Six Sigma? ........................................................................................................ 84
■ Understanding the Six Sigma Summary Page ............................................................... 85
■ Viewing Six Sigma Information about a Process ............................................................ 87
webMethods Optimize User's Guide 10.7 83

Overview
The material in this section relates to business processes and is specific to Optimize for Process.
Use the Six Sigma Summary page (available fromNavigate > Applications > Monitoring inMywebMethods) to see which critical processes or components are unstable, to identify the cause ofa process problem, and to determine where to focus efforts to achieve the greatest processimprovement. The Six Sigma Summary page uses Six Sigma metrics to quantify how a processis performing, and presents that information as a series of graphs.
When creating a rule, you can specify that it contributes to Six Sigmametrics. Formore information,see “Creating a Rule” on page 102.
If your system administrator has configured your My webMethods System Settings to monitormultiple Integration Servers and/or multiple Analytic Engines (see “Configuring Optimize to UseMultiple Integration Servers and Analytic Engines” in Administering webMethods Optimize), youcan select which Integration Servers and Analytic Engines you want to monitor from the Servermenu that appears in the top right corner of the Six Sigma page. Only Six Sigma metrics for theselected server will be displayed.
Note:The default server is set on the System Settings page. If you previously selected a server atanother My webMethods page, that server will remain selected until you select a differentserver.
What is Six Sigma?
The Six Sigma methodology is a disciplined approach for improving business performance. It isa measure of quality that strives for near perfection in the execution of a process. To achieve SixSigma quality, a process must produce no more than 3.4 defects per million opportunities. Anopportunity is defined as a chance for non-conformance with (that is, not meeting) the requiredspecifications. This means a key process must be nearly flawless in its execution to achieve SixSigma quality.
The following table describes the key concepts that the Six Sigma methodology involves.
MeaningConcept
A failure to meet a business rule (that is, a rule violation).Defect
A sigma value or percentage that reflects the number of times the processwas measured without defects divided by the total number of times it was
Process Capability
measured. The process sigma graph on the Six Sigma Summary page showscurrent and historical process capability.
The stability of a process. A stable process is onewithminimal variation. Theprocess sigma graph on the Six Sigma Summary page shows current and
Variation
historical variations in process performance, aswell as trends. A processwithlittle variation and a high sigma value on this graph indicates a stable process.
84 webMethods Optimize User's Guide 10.7
4 Improving the Long-Term Performance of a Process

MeaningConcept
Attributes identified to bemost important to the customer. The Pareto chartson the Six Sigma Summary page identify six areas that are critical to thesuccess of a business process.
Critical to Quality
A principle that states the majority of defects (80 percent) are caused by afew (20 percent) vital components. The Pareto charts on the Six Sigma
The ParetoPrinciple (also
Summary page highlight this principle by identifying the components thatare responsible for most of the rule violations.
known as the 80:20rule)
The underlying cause of a defect. Addressing the root cause rather than itssymptoms will prevent defects from recurring.
Root Cause
Understanding the Six Sigma Summary Page
The Six Sigma Summary page consists of three sections: the Filter tab, the Business ProcessSigma tab, and the Two-Week Business Process Sigma tab.
Filter Tab
Use the Filter tab to limit the data displayed on this page to show only that which occurred duringthe specified date range. By default, the current date is used as the end date, and the start date istwo weeks before the end date. Use the Start Date and End Date calendar icons to change thedate range of the displayed data.
Business Process Sigma Tab
The graph on the Business Process Sigma tab shows the Six Sigma value the process achievedfor each day. This value represents the percentage of readings that did not violate a rule.
The following table lists the percentages that the sigma scale represents.
%Of Readings Without ViolationsSigma
31.00001σ
69.61862σ
93.14893σ
99.37224σ
99.97665σ
99.99966σ
For example, in the following process sigma graph, the sigma value is 0.79, indicating that fewerthan 31 percent of the readings taken for all processes on December 5 did not violate a rule.
webMethods Optimize User's Guide 10.7 85
4 Improving the Long-Term Performance of a Process

Business Process Sigma graph
Two-Week Business Process Sigma Tab
The Two-Week Business Process Sigma tab located below the Business Process Sigma tabdisplays Pareto charts indicating the importance of different items in contributing to rule violations.Optimize groups contributing factors on each chart and lists them from highest contributor onthe left to the lowest on the right.
Optimize displays Pareto charts for each of the groups of contributing factors.
The following table describes the groups of contributing factors.
MeaningGroup
Indicates which business processes had the greatest number of violations.Business Process
Indicates which rules had the greatest number of violations.Rule
Indicates which hardware was associated with the greatest number ofviolations.
Infrastructure
Indicates which KPI was associated with the greatest number of violations.KPI
Indicates the day on which the greatest number of violations occurred.Day of Week
Indicates the hour in which the greatest number of violations occurred.Time of Day
The Pareto charts use the following conventions:
Number of times out of compliance: Each gray bar on the charts represents a business process,rule, KPI, infrastructure component, day of week, or time of day. The vertical axis to the leftof the chart indicates the number of times that items within that group violated a rule.
Percent contribution to rule violations: The orange line on each chart shows the rule violationsfor the relevant item, expressed as a cumulative percentage. For example, in the BusinessProcess chart, if the first process caused 65 percent of the rule violations, the orange line shows65 percent above the first bar. If the second process caused 25 percent of the rule violations,the orange line shows 90 percent above the second bar (65 percent plus 25 percent).
86 webMethods Optimize User's Guide 10.7
4 Improving the Long-Term Performance of a Process

The Pareto charts on this page show how important each component is in contributing to ruleviolations. Contributing factors are grouped together and listed fromhighest number of contributorson the left, and lowest on the right. This allows you to gauge the improvement of your businessprocesses over the course of time, and ensure that you are continuing to improve the quality ofthose processes.
Roll your mouse over the bars and lines on the chart to view their details. Where there is no dataavailable, a gray graph with the text No Data is displayed.
The Two Week Business Process Sigma shows your rate of problems over the course of the lasttwo weeks.
The following table lists how the problem rate corresponds to a Sigma value.
SigmaProblem Rate
61 rule violation in 1,000,000 evaluations
51 rule violation in 100,000 evaluations
41 rule violation in 10,000 evaluations
31 rule violation in 1,000 evaluations
21 rule violation in 100 evaluations
11 rule violation in 10 evaluations
Viewing Six Sigma Information about a Process
To view Six Sigma information about a process
1. View Six Sigma information about a rule violation for a single process or all monitoredprocesses.
The following table describes the actions you should perform to view Six Sigma informationabout a rule violation for a single process or all monitored processes.
Do thisTo view Six Sigmainformation about
Click the Six Sigma icon ( ) beside the rule on the Problems page.A rule violation fora single process
In My webMethods:All monitoredprocesses
Navigate > Applications > Monitoring > System-Wide > Six SigmaSummary
webMethods Optimize User's Guide 10.7 87
4 Improving the Long-Term Performance of a Process

Do thisTo view Six Sigmainformation about
For more information, see “Understanding the Six Sigma SummaryPage” on page 85.
2. To view more details about a business process or step:
a. In My webMethods:
Navigate > Applications > Monitoring > System-wide > Analytics Overview
b. Scan the Status column for processes, subprocesses, or metrics that are out of complianceor statistically abnormal.
c. To view KPI instance information about a process, subprocess, or metric, click the KPISummary icon ( ) in the Detail column.
3. View sigma information on the Business Process Sigma graph by doing the following:
a. In the Filter tab, select the reporting period for which you want sigma information, andclick the Go button.
b. Rest the mouse pointer on the point where the sigma value intersects the date to view theexact process sigma value and the sigma expressed as a percent. Note whether the sigmais at the desired level, trending up, trending down, or flat.
If the sigma is trending down, look at the Pareto charts on the Business Process Sigmatab to determine which group seems to be having the most impact.
4. View information on the Pareto charts by doing the following:
a. Rest the mouse pointer on a green bar within a chart to see which business process, rule,KPI, piece of equipment, IT infrastructure component, day of week, or time of day the barrepresents.
b. View details for the contributor as described earlier in this chapter and in “MonitoringSystem Component and Business Process Performance” on page 37 and “ViewingInformation About Rules” on page 89 to see what changes might need to be made to aprocess or system configuration to improve their future performance.
88 webMethods Optimize User's Guide 10.7
4 Improving the Long-Term Performance of a Process

5 Viewing Information About Rules
■ Viewing the Rule List ...................................................................................................... 90
■ Viewing Rule Instances .................................................................................................. 92
■ Viewing Details for Rules and Rule Violations ................................................................ 93
■ Viewing a History of Rule Violations ............................................................................... 96
■ Viewing Rule Audit Information ...................................................................................... 97
webMethods Optimize User's Guide 10.7 89
Optimize evaluates data collected against rules that you define. A rule specifies conditions underwhich a process or resource becomes problematic and requires user or programmatic attention.
When a rule has been created for an item, Optimize displays the or icon next to the item.When an item goes out of compliance, Optimize displays the or icon to indicate a rule wasviolated. And when a rule has been disabled, Optimize displays the or icon. These icons aredisplayed on several Optimize pages.
You can click these icons to view real-time and historical details about the rule, such as theexpression used to create the rule, the date and time a violation occurred, the rules andKPI instancesassociated with the rule, and the users who will be notified of a rule violation. You can use theRule Audit page to view auditing information about rules, including complete information aboutwho resolved an out-of-compliance rule, when a rule was enabled or disabled, and so on.
If your system administrator has configured your My webMethods System Settings to monitormultiple Integration Servers and/or multiple Analytic Engines (see “Configuring Optimize to UseMultiple Integration Servers and Analytic Engines” in Administering webMethods Optimize), youcan select which Integration Servers and Analytic Engines you want to monitor from the Servermenu that appears in the top right corner of these pages. Only the rule information for the selectedserver is displayed.
Note:The default server is set on the System Settings page. For eachMywebMethods user, the serverthe user was last working with on any My webMethods page will remain the selected serverfor that user until that user selects a different server.
Viewing the Rule List
The Rule List page displays a listing of all the rules defined for your system.
To display the rule list
1. Navigate the following path in My webMethods:
Navigate > Applications > Administration > Analytics > Rules > Rule List
Optimize displays theRule List pagewith the names of all rules defined for your system. Thispage contains the following buttons that enable you to work with rules:
Create Rule - Activates the Create Rule page which enables you to create a new rule. Formore information on creating rules, see “Creating a Rule” on page 102.
Delete - Deletes the selected rule or rules from the system.
Enable - Enables the selected rule or rules on the system.
Disable - Disables the selected rule or rules on the system.
The following table describes the information that is displayed on the Rule List page.
90 webMethods Optimize User's Guide 10.7
5 Viewing Information About Rules

DescriptionColumn
Name specified for the rule. Click the name to display the Edit Rule pagefor this rule.
Rule Name
Type of rule: KPI or Event. See “Types of Rules” on page 100 for details.Type
Yes = rule is “sticky” (stays in violation until it is manually resolved).Sticky
No = rule is not sticky.
Severity level specified for the rule. See “Setting Rule Attributes” onpage 104 for details.
Severity
Current state of the rule:Status
Rule Violation (plus Customer Name, if specified)
Rule - No Violation (plus Customer Name, if specified)
SLA Rule - No Violation (plus Customer Name, if specified)
SLA Rule Violation (plus Customer Name, if specified)
Rule Disabled
SLA Rule Disabled
Whether the rule definition is enabled:Enabled
Enabled (click to disable this rule)
Disabled (click to enable this rule)
Click to perform one of the following actions:Actions
View Rule Instances. Activates the Rule Instances page. See “ViewingRule Instances” on page 92 for details.
Generate Rule Violations. Initiates rule back population for thecorresponding rule, which generates historical rule violations. See“Managing Rules from the Rule List Page” on page 132 for details.
Copy Rule. Makes a copy of the rule to save you time in creating anew rule.
Edit Rule. Activates the rule on the Edit Rule page.
2. Refine the rule list by searching for a keyword in the rule name, or click the Advanced tab inthe Search panel to take advantage of more search criteria.
webMethods Optimize User's Guide 10.7 91
5 Viewing Information About Rules

To narrow the results list by action, user alert, service-level agreement (SLA), expression,customer, rule type, or status, select one or more of the options in the Filter area of theAdvanced tab in the Search panel.
The following table describes the options in the Filter area of the Advanced tab in the Searchpanel.
ValueOperatorField Name
SNMP Action, Event Action, or Web ServiceAction
EqualsAction
From the drop-down list, choose the users whoreceive alerts on the rules you want to list.
ContainsUser Alert
No or YesEqualsSLA
Type any value contained in the rule expression.ContainsExpression
Type any value contained in the rule’s customerentry.
ContainsCustomer
Event, KPI, or ThresholdEqualsRule Type
In Compliance or Out of ComplianceEqualsStatus
Note that you can also specify the search condition as either OR or AND.
Viewing Rule Instances
To view rule instances
1. At the Rule List page, click View Rule Instances.
The Rule Instances page is displayed. The name of the base rule is displayed at the top of theRule Instances page, and the Rule Instances table displays information about all instances ofthe rule.
The following table describes the information in the Rule Instances table.
DescriptionColumn
Name of the rule instance. Click the name to display theRule Detail pagefor this rule instance.
Instance Name
Current state of the rule:Status
Rule Violation
Rule - No Violation
92 webMethods Optimize User's Guide 10.7
5 Viewing Information About Rules

DescriptionColumn
Rule - Disabled
SLA Rule - No Violation, or
SLA Rule Violation
Whether the rule instance is enabled:Enabled
Enabled (click to disable this rule instance)
Disabled (click to enable this rule instance)
Click to enable all, or to disable all.
Click Rule Instance Detail to display the Rule Detail page for thisrule instance.
Detail
Viewing Details for Rules and Rule Violations
Use the Rule Detail page to view information about the rule instance of a rule that has beenviolated. You can also edit rules from this page when applicable.
To view details for a rule violation
1. Access the Rule Detail page in one of the following ways:
By clicking , , , or next to an item on a page that contains these icons.
If more than one rule is associated with the item, Optimize displays the Rule Summarypage containing a list of the rules associated with the item. Click a rule to display the RuleDetail page.
By clicking the name of the rule in the Rule Instances page (accessible from the Rule Listor Edit Rule page).
2. Use the information on the Rule Detail page to analyze the rule that has been violated.
The following table describes the information on the Rule Detail page.
DescriptionPanel
Displays the name of the rule, a short description of the rule, the rule'sseverity and status (that is, whether the rule was violated), and the dateand time since the rule has been in that status.
Rule Information
webMethods Optimize User's Guide 10.7 93
5 Viewing Information About Rules

DescriptionPanel
In addition, an Edit icon is displayed to allow users to edit the rule. Also,aResolve button is displayed for sticky rules that enables you to changethe status of the rule from violated to in compliance.
Provides the following information about the rule:Attributes
Rule Type - Indicates whether the rule is a KPI, Event, or Thresholdrule.
Enabled - Indicates whether the rule is enabled at this time.
Sticky - Indicates whether the rule is sticky, which means that therule remains in violation even when the data that triggered theviolation goes back into compliance until you manually resolve therule issue or edit the rule’s sticky setting.
Contributes to Six Sigma - Indicates whether or not the rulecontributes to the Six Sigma reports. For more information about SixSigma reports, see “Improving the Long-Term Performance of aProcess” on page 83 in this guide.
SLA - Indicates whether a service-level agreement is associated withthis rule (Yes or No).
Customer - Identifies the customer, if any, associated with this rule.
Provides the following information regardinguser alert andprogrammaticactions related to rules:
Alert and ActionSettings
Reminder Interval - Defines the time interval at which alerts are sentwhile the rule is out of compliance.
Send when back in compliance - Indicates whether alerts andactions are firedwhen the rule comes back into compliance followingviolation.
Displays the expression used to evaluate the rule.Rule Expression
Displays a chronological list of the last three rule violations, includingthe date and time the violation occurred and the criteria Optimize usedto evaluate the KPI instance reading.
Recent RuleViolations
Displays a graph for each KPI instance included in the rule that showsreadings taken during the past four hours for eachKPI instance associated
KPI InstanceSummary
with the rule. Hovering over points on the graphs displays actual valuesat those points; click Detail to display the KPI Instance Detail page foran instance.
94 webMethods Optimize User's Guide 10.7
5 Viewing Information About Rules

DescriptionPanel
See “Analyzing Information about Key Performance Indicators” onpage 145 in this guide for more information about the KPI InstanceSummary graphs.
For each KPI instance, this panel also displays icons that indicate ifOptimize performed a diagnosis on the KPI instance and if the KPIinstance is contributing to a rule violation.
Each graph also identifies the KPI instance ID and type, the unit ofmeasure used for the KPI instance, the value of the last data sample theKPI instance collected, the date and time the last reading was taken, andthe time zone in which the time is represented.
Actual Reading: The point is the aggregated reading for the particularKPI interval.
KPI InstanceSummary graphkey (only shown
Average Reading: The point is graphed based on the historical mean ofthe calculated baseline data of the KPI instance for the particular KPIinterval.
when the rule typeis KPI or Event)
Standard Deviation: Represents the upper and lower boundary rangeof readings, spanning between one standard deviation above the meanand one standard deviation below the mean for the particular interval.
Rule Violation: Indicates the point at which the rulewas first in violation.
Note:Data points for Average Reading and Standard Deviation both relyon the calculated baseline data of the KPI instance. The baselines arecalculated for time intervals based on the interval of the KPI instance,and depending on configuration, can be tracked per day of week, perworkday/weekend, andwithout reference to the day. For shorter-termKPI instances, readings are made hourly.
Lists the users to be notified when this rule is violated and the e-mailaddress that Optimize uses to send the alert. This section also indicates
Alerts
whether the alert is enabled for a particular user (that is, whether or notthe user will receive alerts when the rule is violated). The value of theGROUPED column indicateswhether the userswho receive the alert willbe grouped into a single email alert.
Lists the SNMP alert, Web service actions, and event actions associatedwith this rule and indicates whether the action is currently enabled ordisabled.
Actions
3. Perform any of the actions that are described in the following table.
webMethods Optimize User's Guide 10.7 95
5 Viewing Information About Rules

Do thisIf you want to
Click Resolve in the Rule Information area.Reset a sticky rule (that is, change itsstatus from violated to in compliance.)
Note:The Resolve button is available only when therule is a sticky rule that has been violated.
Click View History in the Recent Rule Violationsarea. For more information about historical rule
View a history of violations for this rule
information, see “Viewing a History of RuleViolations” on page 96 below.
Rest the mouse pointer on one of the points on thegraph.
View the numeric value of a reading onthe KPI Instance Summary graph
Click in the KPI Instance Summary panel todisplay the KPI Instance Detail page. For more
View details for a KPI instance
information about KPI instance details, see“Analyzing Information about Key PerformanceIndicators” on page 145 in this guide.
Rest the mouse pointer on the icon to see a briefdescription of the diagnosis thatOptimize performed
Interpret the meaning of the diagnosisicon (such as ) in the graph
on the item. For a more detailed description, see “Optimize Icons” on page 183 in this guide.
Click on the Rule Information panel to activatethe Rule edit page and edit the rule.
Edit details for a rule.
Viewing a History of Rule Violations
After you view details about a rule violation on the Rule Detail page, you can view the history ofthat rule to see howmany times the rule was violated during a specified time period. You can usethis information to help you determine patterns in the occurrence of rule violations and whetheryou can make improvements to reduce the number of violations in the future.
To view a history of rule violations
1. On the Recent Rule Violations panel on the Rule Detail page, click View History.
Optimize displays the Rule History page.
The following table describes the information on the Rule History page.
96 webMethods Optimize User's Guide 10.7
5 Viewing Information About Rules

DescriptionPanel
Displays the name of the rule, a short description of the rule, the rule'sstatus (that is, whether the rulewas violated), and the date and time sincethe rule has been in that status.
Rule Information
Displays a histogramdepicting the number of times the rulewas violatedeach day within the last 90 days.
Histogram forRule
Sets the date and time range for the Rule Violations for Date Rangedisplay. Allows you to specify the start and end times for display.
Filter
Displays the date and time the rule violation occurred for the selecteddate and time range specified in theFilterpanel. Also displays the number
Rule Violations forDate Range
of continuous intervals the rule has been in violation. If there is a breakin the collection of violations, such as a Analytic Engine shutdown, thenthe table will show separate violations. This section contains multiplerows if a rule was violated more than once within the specified daterange.
2. Perform one of the possible actions.
The following table describes the actions that you can perform on the Rule History page.
Do thisIf you want to
Rest the mouse pointer over the bar correspondingto that day in the histogram.
Display details about the rule violationsfor a particular day
In the Filter panel, complete the Start Date, EndDate, and Time boxes and then click Go.
Show historical data for a different daterange
Click any bar on the histogram.Show historical data for a specific dayin the histogram
The Rule Violations for Date Range panel isre-displayed with the data for that day.
Viewing Rule Audit Information
The Rule Audit page provides complete auditing details for every rule-related change in yoursystem. If more than one server (more than one Analytic Engine) is configured for your system,the Rule Audit page shows auditing details only for the currently selected server. You can changethe selected server using the Server drop-down menu that appears in the top-right corner of thepage. (If you do not see aServer drop-downmenu, only one server is configured for your system.)
To view rule audit details
webMethods Optimize User's Guide 10.7 97
5 Viewing Information About Rules

1. In My webMethods navigate to Navigate > Applications > Administration > Analytics >Rules > Rule Audit.
The following table describes the information on the Rule Audit page.
DescriptionColumn
The date and time that the rule-related change occurred.Audit Date/Time
The full name (first name, last name) of the My webMethods user whomade the change.
User
The name of the rule or the rule filter.Name
The field of the rule or the rule filter that was affected by the change,such as Severity, Description (of the rule or rule filter), or Enablement(whether the rule was enabled).
Field
The value of a specific rule field before a rule-related change occurred.The designation (Added) displays in this columnwhenever a rule or rulefilter is added to the system.
From
The value of a specific rule field after a rule-related change occurred. Forrule expressions that appear truncated in this column, you can get a
To
pop-up window that shows the full expression by resting the mousepointer on the truncated rule expression. The designation (Removed)displays in this column whenever a rule or rule filter is deleted.
Click to display theRule Audit Detail page, where you can see detailsabout the specific rule change.
Detail
Note:You can use the table Properties setting to customize the table’s displayed columns andappearance.
2. You can narrow the list of audit details by doing a keyword search.
Keyword input is searched in the following four fields on the Rule Audit page: Name, Field,From, andTo. For example, if youwant to specify a value for the data in a field, that informationis captured in the To and From fields.
3. You can click the Advanced tab in the Search panel to refine your search even further.
You can search for audit information using several predefined date ranges or a custom daterange. You also can search on any rule-related field and/or by user name. Note that you canspecify the search condition as OR or AND.
98 webMethods Optimize User's Guide 10.7
5 Viewing Information About Rules

6 Defining Rules
■ Overview ...................................................................................................................... 100
■ Creating a Rule ............................................................................................................ 102
■ Setting Rule Attributes .................................................................................................. 104
■ Creating an Instant Rule ............................................................................................... 106
■ Creating Rule Expressions ........................................................................................... 107
■ Rule Alerts .................................................................................................................... 131
■ Managing Rules ........................................................................................................... 132
■ Managing Rule Filters .................................................................................................. 135
webMethods Optimize User's Guide 10.7 99

Overview
A rule identifies a significant condition under which a process or resource becomes problematicor requires attention. You can apply a rule to a process or to a type of data. A rule can be configuredto alert users or take programmatic actionwhen the condition occurs. Rules can also be configuredto send user alerts when the process or resource returns to compliance.
Each rule contains a logical expression. Optimize enables you to create a simple rule expressionto test a single condition, or a complex expression that tests two or more conditions. Optimizeevaluates the expression to determine if it is true or false. If an expression evaluates to true,Optimize can be configured to send an e-mail alert and/or invoke aWeb service or Event or SNMPaction.Optimize identifies rule violations in variousMywebMethods locations, such as the ProblemReport and Analytics Overview pages.
To create a rule, you must do the following:
Name the rule and assign attributes to it.
Build the expressions that make up the rule.
Specify the users to notify or other actions to take when the data satisfies the rule expressions.
While you are building the rule expression, Optimize displays the KPI or Event data selectionsfor which you can write rules in My webMethods (Navigate > Applications > Administration> Analytics > Rules).
Note that Optimize enables you to edit active rules, but you must exercise great caution whenusing this feature. If you change fundamental aspects of a rule, such as the rule type or expression,all historical data (including rule violations) related to that rule are deleted. This functionality can,however, work to your advantage if you need to refine a rule definition to better reflect yourbusiness environment, because Optimize enables you to re-generate historical rule violations forupdated rule definitions.
Preset RulesOptimize for Infrastructure offers a set of preset rules for object failure notification, Brokers, BrokerServers, Integration Servers, enterprise adapters, and Trading Networks that accommodate bestpractices for these components. The preset rules are loaded as part of the installation of Optimizefor Infrastructure. You can view details about the rules, including the expression used to createthem, on the Optimize Add/Edit/Copy Rule page (see “Managing Rules” on page 132).
Types of RulesYou can create three types of rules: KPI rules, event rules, and threshold rules.
KPI rules evaluate a KPI’s aggregated data at the KPI’s collection interval. For example, supposeyou create a KPI that sums order amounts on a 5 minute interval. You could then create a rulethat sends an alert when the summed order amount exceeds a certain value. Formore informationabout creating KPIs, see Administering webMethods Optimize.
100 webMethods Optimize User's Guide 10.7
6 Defining Rules

Event rules evaluate data points as they are collected rather than waiting for a KPI collectioninterval. Optimize maintains state for event rules so that you can track data over multiple eventintervals (for example, you can define a rule that alerts you when a webMethods Broker is downfor three event intervals).
Threshold rules evaluate a single collected data point when it is collected (for example, queue sizegreater than 1000 or order amount less than $500). Optimize does not maintain state for thresholdrules.
KPI and Event rules differ from threshold rules in that theymaintain a state. When activated, theystay in violation until their expression condition returns to compliance. These expression conditionscan combine attributes from multiple KPIs and event types. Note that Event rules don't actuallyoperate on a KPI, but they are artificially tied to a KPI in a definition. This doesn't affect rulefunctionality, however.
Threshold rules, on the other hand, do not maintain state and cannot use multiple event types intheir expression. A threshold rule operates on a single event identified by an event map, whereasKPI and event rules operate on one or many KPIs. Threshold rules are activated whenever thethreshold condition defined by the rule expression is violated. The sticky function is not availablefor threshold rules because they donotmaintain state. In addition, threshold rules do not distinguishbetween event data dimensions. Finally, one or more of the expression arguments in a thresholdrule can be an event with transaction attributes.
Types of Rule ExpressionsYou can select one of the following three expression types when you create a logical expressionfor a rule:
A simple rule expression
A date-time rule expression
A compound rule expression
Simple Rule Expressions
A simple rule expression compares two operands through the use of a comparator. The comparatordefines the relationship of the two operands (for example, equal to, greater than) and returns atrue or false result. For example, you could create the following simple rule expressions to determineif data is out of compliance:
The KPI aggregated order amount is greater than two standard deviations above normal forthe collection interval.
A Broker queue length is greater than 100.
An adapter queue size has been trending up for 5 or more intervals.
Date-Time Rule Expressions
webMethods Optimize User's Guide 10.7 101
6 Defining Rules

Adate-time rule expression evaluates date or time values. For example, you could create date-timeexpressions that determine if the day is a Monday, or if the day is a workday, or if the time is after5:00 PM. Date-time expressions are commonly used within a compound rule to qualify the dateor time in conjunction with a data comparison, such as "consumed memory greater than 300 MBand the day is a workday".
Compound Rule Expressions
A compound rule expression is an expression that combines two nested expressions that aremadeup of any combination of simple, date-time, or compound rule expressions. You create compoundrule expressions using Boolean operators. For example, you could create an expression specifyingthat if the number of orders processed is less than or equal to 100 AND more than two errorsoccurred during the processing, the process is out of compliance. In Optimize for Infrastructure,a Date-Time Expression is mostly likely used within a compound rule expression: for example,“Broker queue size is greater than 100” AND “Broker queue size reading time is after 5:00 p.m.”
Custom Rule FiltersWhen you define the rule's expressions, you identify the type of data to which to apply the rule.You can select a rule filter to limit the data to which the rule applies. For example, if your rulerefers to Broker queue length, without a rule filter the rule will apply to all Brokers on all BrokerServers. To limit the scope of the rule to specific Brokers, you would specify a rule filter.
Creating a Rule
The Add/Edit/Copy Rule page enables you to create a rule. There are five sections on this pagein which you can define various characteristics of a rule. Note that because of the complexitiesinherent in creating a rule, you must configure a rule expression before you can create a namingtemplate for a rule.
Alternatively, Optimize enables you to create instant rules from the KPI Instance Detail page.These rules can be applied a selected KPI instance or to all instances of a KPI.
To create a rule
1. In My webMethods:
Navigate > Applications > Administration > Analytics > Rules > Rule List
Optimize displays the Rule List page.
2. Click Create Rule. Optimize displays the Add/Edit/Copy Rule page.
3. In the Rule Information panel, type the name and description to use for the rule in the RuleName and Description boxes. You can use any combination of characters and numbers. Therule name must be unique.
102 webMethods Optimize User's Guide 10.7
6 Defining Rules

4. If you want to specify text indicating the severity of this rule, type it in the Severity text box.Text entered here appears on the Problem Report page and the Analytics Overview page,where you can search and sort based on the severity values, and any alerts or actions generatedwhen this rule goes out of compliance can be configured to display the severity text. TheSeverity field can contain up to 20 characters and numbers.
5. Set attributes for the rule by following the steps in “Setting Rule Attributes” on page 104 below.
6. Build the rule's expression by following the steps in “Creating Rule Expressions” on page 107.
7. If you want to specify a naming template for instances of this rule, enter the name in theNaming Template field. Naming templates are only applicable for KPI and Event rules.
A naming template is used to generate a derived name for each rule instance. By default, arule instance name is composed of the base rule name plus the KPI hierarchy descriptions foreach KPI used in the rule. This can lead to a lengthy display name or a name that may not suityour purposes. For example, the default rule name:AE Consumed Memory GT 30mb AnalyticEngine.LogicalServerName.OptimizeAnalytic Engine.InternalMonitorQualifier.Name.Virtual Machine Stats.
consists of a base rule name (AE Consumed Memory GT 30mb) and twoKPI hierarchy descriptions(AnalyticEngine.LogicalServerName.Optimize Analytic Engine andInternalMonitorQualifier.Name.Virtual Machine Stats) arranged in this syntax:<base-rule-name> <hierarchy-desc1>.<hierarchy-descr2>.<dimensional-value>
If the Naming Template field is empty, all instances of the rule use the default rule name.When a naming template is specified, all rule instance names use the specified template togenerate a name.
The naming template can contain any descriptive text in combination with one or moredimension variables. Variables should be used to make the template distinctive for each ruleinstance. The syntax for using variables in a template is:
$DimensionName.AttributeName
where theDimensionName andAttributeNamepairing identify a dimensional value used by theKPI. Multiple pairs can be used, each separated by a space or other character. For example,the following template:AE Consumed Mem GT 30 - $InternalMonitorQualifier.Name
would result in the following distinctive displayed name:AE Consumed Mem GT 30 - Virtual Machine Stats
The dimension variables that can be used in a template depend on the KPI evaluated by therule. The Rule Editor provides tools to insert dimension variables and to view a sample of theinstance derived name. To use these tools, youmust first choose the KPI in the rule's expression.To determine what variables you can use, do the following:
webMethods Optimize User's Guide 10.7 103
6 Defining Rules

a. Type the desired descriptive text into the Naming Template field.
b. Place the cursor at a point where you want to add a dimension variable, and click theArrow icon to open a drop down list of available dimension variables.
c. Select the desire variable to add it to the cursor position in the Naming Template field.
d. Repeat the preceding two steps as desired to add additional variables to the derived namethat you are creating.
8. On the Alerts tab, identify the users to alert when the rule is violated by following the stepsin “Specifying Alert Recipients” on page 131.
9. On theActions tab, identify the actions to takewhen the rule is violated by following the stepsin “Specifying Alert Recipients” on page 131.
The Rule Instances panel shows the number of instances of the rule, the number of instancesout of compliance, and the number of instances enabled. This information is relevant only afterthe rule is created. If you are creating a new rule, jump to the final step in this sequence.
10. On the Rule Instances panel, click View Instances to display the Rule Instances page. See“Viewing Information About Rules” on page 89 in this guide for details.
11. Click Save on the Add/Edit/Copy Rule page to save your changes.
Setting Rule Attributes
The Attributes panel on the Add/Edit/Copy Rule page enables you to specify attributes for a rule.
To set attributes for a rule
In the Attributes panel, do the following:
1. From the Rule Type list, select one of the rule types.
Important:If you change the rule type for an existing rule, Optimize erases the rule expression. Also,if you change either the rule type or the rule expression itself, Optimize removes all previousrule instances and violations, and creates new rule instances for the rule to match the KPIinstances in the revised rule expression.
The following table describes the rule types.
DescriptionRule Type
Evaluates one or more KPIs at the KPI's collection interval. For moreinformation about creating KPIs, seeAdministering webMethods Optimize.
KPI
104 webMethods Optimize User's Guide 10.7
6 Defining Rules

DescriptionRule Type
Evaluates data points as they are collected rather than waiting for a KPIcollection interval.
Event
Evaluates a single collected data point at the time of collection.Threshold
See “Types of Rules” on page 100 for a complete description of these rule types.
2. If you want the rule to be enabled when you save it, select the Enabled check box. If you wantthe rule to be disabled when you save it, clear the check box.
3. If you want to make the rule sticky, select the Sticky check box. A sticky rule does notacknowledge that a violated rule's data has come back into compliance until the rule ismanuallyresolved as described in “Viewing Information About Rules” on page 89 in this guide. Youcan make a rule sticky to signal a serious violation that requires user attention to remedy thesituation. For example, if you create a rule to detect that a Broker Server is offline, definingthe rule as sticky causes the alert to occur once and the rule to remain in violation until therule is resolved by clicking Resolve on the Rule Detail page.
Important:If a sticky rule is violated again before being resolved, Optimize cannot detect thoseviolations.
4. If youwant this rule to contribute to the Six Sigma rule violation data displayed on the Improvepage, select the Contributes to Six Sigma check box.
5. To specify that this rule is associated with a Service Level Agreement (SLA), select SLA. Youcan search for SLA rules on the Problems and System Overview pages so that you can easilyfind problems and resources related to your SLA-specific rules.
6. Optionally specify the name of the customer associated with this rule (particularly useful ifthis is an SLA rule) in the Customer text box. You can also search for Customer on theProblems and System Overview pages so that you can easily find problems and resourcesrelated to your customer-specific rules.
7. If you want any specified alerts generated for this rule to be repeated, specify the number ofminutes between alerts in the Reminder Interval text box.
8. If you want to be notified when this rule comes back into compliance after being in violation,select Send alerts/actions when back in compliance.
Tip:You can sort rules by severity in the tables on theProblem Report andAnalytics Overviewpages. To ensure that rules with severity text sort appropriately, consider beginning theseverity text string either with a number that indicates the level of severity or with anidentical text string followed by a severity number. For example, you could use a severity
webMethods Optimize User's Guide 10.7 105
6 Defining Rules

text-string sequence such as 1 High, 2 Medium, 3 Low, and so on. Alternatively, you coulduse a severity text-string sequence such as Severity 1, Severity 2, Severity 3, and so on.
Creating an Instant Rule
The instant rule feature enables you to quickly create a KPI or event rule and apply it to a specificKPI instance or to all instances of a KPI. You create instant rules using theCreate Rule pagewhichis accessible from the KPI Instance Detail page.
Note that the following procedure assumes that you are already working from the KPI InstanceDetail page. See “Using the KPI Instance Detail Page” on page 157 for more information about theKPI Instance Detail page.
To create an instant rule
1. On the KPI Instance Detail page click in the upper right corner and select Create Rule.
The Create Rule page is displayed.
2. Complete the fields on the Create Rule page.
The following table describes the fields on the Create Rule page.
DescriptionField
Descriptive name for the rule you are creating.Name
Click the appropriate check box to indicate whether you want this ruleto apply to the selected KPI instance only or to all KPI instances.
Apply To
Enables you to specify a userwhowill receive an alert message if the ruleis violated. This field is unavailable if the currently logged in user hasn’tspecified an e-mail address in the user settings.
Send Alert To
Enables you to specify a system action to invoke automatically if the ruleis violated.
Action
Enables you to specify whether the rule should fire on a KPI interval(KPI-Aggregation Interval) or on an actual event (Event-Every EventOccurrence).
Execute On
Enables you to specify the type of expression to be used with this rule.The actual expression is defined in the Condition field below. TheExpression Type options are as follows:
Expression Type
Reading Value: Enables you to create a rule violation conditionstatement based on a user-selected comparator and value.
106 webMethods Optimize User's Guide 10.7
6 Defining Rules

DescriptionField
Normality: Enables you to create a rule violation condition statementbased on values being one or two standard deviations above or belowthe mean value.
Trending: Enables you to create a rule violation condition statementbased on a value that is trending up or down for a specified duration.
This field enables you to formulate the expression that determines thespecific conditions under which a rule will fire....
Condition
Complete these fieldsFor expression type
Choose a comparison operator from theComparison drop-down list and specify a valuein the Value field.
Reading Value
Choose the appropriate radio button.Normality
Choose either Trends Up or Trends Down andspecify a whole integer of intervals in theDuration field.
Trending
Click this check box if you want the system to go through all legacy dataand generate historical rule violations as appropriate.
Generatehistorical ruleviolations (may
CAUTION:If you elect to generate historical rule violations, be aware that theprocesswill likely consume significant system resources for some time.Be sure to plan accordingly.
take some time toprocess)
3. Click Save to save the rule configuration as specified.
Creating Rule Expressions
Rule expressions determine how a rule evaluates. You build expressions by selecting a ruleevaluation interval, selecting a rule filter to limit the data to which the rule applies, and theexpression components.
To create a rule expression
1. After you have selected a rule type, click Edit in the Rule Expression panel of theAdd/Edit/Copy Rule page. Optimize displays the Edit Rule Expression page.
webMethods Optimize User's Guide 10.7 107
6 Defining Rules

2. Select a rule evaluation interval. In the Intervals Before True box of the Rule Expressionpanel, type the number of consecutive intervals for which the rulemust evaluate to true beforeOptimize will consider the rule to be violated. For example, if you are writing a rule to detectwhen a queue length is trending toward being too large, you might specify that Optimizeshould not consider the rule violated unless the queue length trends upwards for five intervals.
Note:The “interval” evaluated in this case varies depending on whether the rule is an event rule,a threshold rule, or a KPI rule. If this is an event or threshold rule, the “interval” representseach event occurrence. If this is a KPI rule, the “interval” represents the KPI collectioninterval. Intervals for threshold rules are not adjustable. Also, note that consecutive intervalsfunctionality is not suitable for rules based on process standardized errors.
3. Select a rule filter from the Rule Filter list. Rule filters are not available for threshold rules. Ifyou have not yet created any rule filters, click theAdd Filter button and follow the instructionsin “Creating a Rule Filter” on page 135.
To apply the rule to all KPI instances or events, click None in the Rule Filter list.
To apply the rule to certain KPI instances or events only, click the appropriate rule filterthat identifies those processes or system objects.
To create a new rule filter, click Add Filter. For more information, see “Creating a RuleFilter” on page 135.
To edit the selected rule filter, click Edit Filter. For more information, see “Editing a RuleFilter” on page 137.
4. Create a simple rule expression, a date-time rule expression, or a compound rule expressionas described in one of the following sections:
“Creating a Simple Rule Expression” on page 109 below
“Creating a Date-Time Rule Expression” on page 120
“Creating a Compound Rule Expression” on page 130
108 webMethods Optimize User's Guide 10.7
6 Defining Rules

Creating a Simple Rule ExpressionA simple rule expression consists of two operands and a single logical comparator. For example,to detect a queue size greater than 1000, you would specify a queue size attribute as the firstoperand. Then you would specify the number 1000 as the second operand. Finally, you wouldselect “greater than” as the comparator.
The following task sections provide detailed steps for creating various types of simple ruleexpressions. The first task is a high-level view of the overall process for creating a simple ruleexpression, and the subsequent tasks go intomore detail about how to define the different operandsavailable when creating a simple rule expression.
To create a simple rule expression (high-level overview)
1. In the Expression list in the Rule Expression panel, click Simple Expression.
2. Define the first operand of the two operands that you want to compare in the simple ruleexpression. In the first Operand list, begin by selecting one of the operand types. Note thatthe available operands are determined by the Rule Type that you selected in the Attributespanel.
The following table describes the operand types and the corresponding rule types.
DescriptionAvailable forRule Type
Operand Type
The operand is an attribute of a type of KPI instance, asfollows:
KPIKPI Value
A data value, such as the last summarized data samplecollected.
A statistical value, such as the mean of a samplinginterval.
A diagnosis value, such as the last data point is greaterthan the previous data point (that is, data points aretrending up).
The operand is an attribute of a type of KPI instance.Real-time value of an event flowing into a KPI instance.
EventEvent Value
The operand is a KPI value that may be compared to a textoperand.
EventEvent Text
Use this operand to perform a mathematical operation onthe operand, such as add, subtract, multiply, or divide, usinga value that you specify.
KPIMath
webMethods Optimize User's Guide 10.7 109
6 Defining Rules

DescriptionAvailable forRule Type
Operand Type
The operand is an attribute of an eventmap. Examples: Dollaramount of a single order. Person who approves a purchase.
ThresholdThresholdValue
For details on how to define the first operand in a simple rule expression, see one of thefollowing group of tasks:
“Defining KPI Value as the First Operand” on page 110
“Defining Math as the First Operand” on page 115
“Defining Event Text or Event Value as the First Operand” on page 117
3. In the Comparator list, select the logical comparator (such as Equal To) to compare the twooperands of the simple rule expression (also referred to as a Boolean expression).
4. Define the second operand of the two operands that you want to compare.
For more information on how to define the second operand in a simple rule expression, seeone of the following tasks:
“Defining KPI Value as the First Operand” on page 110
“Defining Math as the First Operand” on page 115
5. Click Save to save the simple rule expression.
Defining KPI Value as the First Operand
The specific steps for defining each of the two operands in a simple rule expression depend onyour choice of operand types. The operand type determines the fields that appear in the RuleExpression panel on the Edit Rule Expression page. A specific set of fields is associatedwith eachoperand type, and whenever you change an operand type, the displayed fields changeautomatically. If you choose the KPI Value operand type for the first operand in a simple ruleexpression, Optimize displays the fields shown in the following figure and described in thesubsequent task.
110 webMethods Optimize User's Guide 10.7
6 Defining Rules

The following task assumes that you have already chosen KPI Value as the first operand in theRule Expression panel on the Edit Rule Expression page.
To define KPI Value as the first operand in a simple rule expression
1. In the Category list (in the Rule Expression panel on the Edit Rule Expression page), clickthe category of the KPI or KPI instance whose value you want to compare.
In addition to values supplied by categories that your system administrator created, the listcould include the options described in the following table.
DescriptionCategory
Provides data about theAnalytic Engines, such as JVMmemory consumedand thread count.
Analytic Engine
Provides generic data about your processes as identified on the Problemspage. For example, process cycle time (how long an instance takes to run)and step count (how many steps have completed successfully).
Intrinsic ProcessMetrics
Note:When creating a rule against the intrinsic process metrics Cycle TimebyProcess or Process Time against a ReadingValue, the unit ofmeasureis in milliseconds.
Additional optionsthat might appear
GarbageCollectionType
PersistenceQualifierin the Categorylist: Queue
Router
WebService
Process names
2. Once you have chosen a category, the KPI list displays the names of all KPIs in the categoryyou selected. Click the KPI whose value you want to compare.
3. In the Value list, click the value to use for the first operand of your simple rule expression. Fora KPI Value operand, you can choose from the following three types of values: reading values,statistical values, or diagnosis values.
The following table describes the Data values.
webMethods Optimize User's Guide 10.7 111
6 Defining Rules

Data Values
If chosen, second operand must beDescriptionValue
NumberCollected data value.Reading Value
Math
KPI Value (numeric)
NumberHighest event value within a givencollection interval for a KPI instance.
ReadingMaximum
MathThis value type should not be usedwith Composite KPIs. KPI Value (numeric)
NumberLowest event value within a givencollection interval for a KPI instance.
ReadingMinimum
MathThis value type should not be usedwith Composite KPIs. KPI Value(numeric)
TimeDate the KPI reading was collected(based on the time zone of theAnalyticEngine).
Reading Date
KPI Value (date)
Number expressed using 24-hourclock
Time that the KPI reading occurred(based on the time zone of theAnalyticEngine).
Reading Time
KPI Value (time)
TimeDay of the week that the KPI readingoccurred (based on the time zone ofthe Analytic Engine).
Reading Day
KPI Value (day)
Number of consecutive KPI intervals.KPI reading value or event value ishigher than the previously collectedvalue.
Reading TrendUp
Number of consecutive KPI intervals.KPI reading value or event value islower than the previously collectedvalue.
Reading TrendDown
The following table describes the Statistical values.
Statistical Values
The values described in this table represent statistical information about Optimize data.
If chosen, second operand must be...DescriptionValue
NumberHistorical mean for the KPI instanceand the statistical interval.
Statistic Mean
112 webMethods Optimize User's Guide 10.7
6 Defining Rules

Statistical Values
Math
KPI Value (numeric)
NumberMaximum historical value for the KPIinstance and the statistical interval.
StatisticMaximum
Math
KPI Value (numeric)
NumberMinimum historical value for the KPIinstance and the statistical interval.
StatisticMinimum
Math
KPI Value (numeric)
NumberStandard deviation for the KPIinstance and the statistical interval.
Statistic Stdev
Math
KPI Value (numeric)
NumberAn expression, represented by apercentage value between 0 and 1, of
StatisticConfidence
Maththe confidence that readings arewithinone standarddeviation of the statisticalmean. KPI Value (numeric)
The following table describes the Diagnosis values.
Diagnosis Values
The diagnosis values are based on trends that Optimize tracks automatically. Some diagnosisvalues evaluate against the number of consecutive KPI intervals or Event occurrences. Forexample, the expression Diagnosis Trending Up >= 3 would evaluate to “true” if the KPIreading value (or Event value) increased for 3 ormore consecutive intervals. Note that intervalbased expressions (like all other expressions) also use the expression’s Intervals Before Truesetting to determine the number of intervals before firing a rule by combining the intervalvalues (expressionIntervals + intervalsBeforeTrue – 1). For example, the expressionDiagnosisTrending Up >= 3 with Intervals Before True set to “4” would evaluate to “true” if the KPIreading value (or Event value) increased for 6 or more consecutive intervals.” This is becauseintervalsBeforeTrue = 1 when the expressionIntervals = 3, intervalsBeforeTrue = 2 when theexpressionIntervals = 4, intervalsBeforeTrue = 3 when the expressionIntervals = 5, andintervalsBeforeTrue = 4 when the expressionIntervals = 6 (when the rule fires).
You can exclude the zero-value KPI readings from the calculations of the Diagnosis AboveMean, Diagnosis BelowMean,DiagnosisAboveNormal, DiagnosisAboveNormal, DiagnosisSlope Above Normal, and Diagnosis Slope Below Normal by setting thestats.rules.calculations property in the wrapper.config file to false.
webMethods Optimize User's Guide 10.7 113
6 Defining Rules

Diagnosis Values
If chosen, second operand must be...DescriptionValue
Number of consecutive KPI intervals.KPI reading value or event value ishigher than the previously collectedvalue.
DiagnosisTrend Up
Number of consecutive KPI intervals.KPI reading value or event value islower than the previously collectedvalue.
DiagnosisTrend Down
Number of consecutive KPI intervals.KPI reading value is higher than thestatistical mean plus the number of
DiagnosisAbove Normal
standard deviations specified in therule expression. For example, if youhave a rule using Diagnosis AboveNormal with a value of 2, this part ofthe rule is satisfied when the readingvalue is more than two standarddeviations above the statistical mean.
Number of consecutive KPI intervals.KPI reading value is lower than thestatistical mean plus the number of
DiagnosisBelow Normal
standard deviations specified in therule expression. For example, if youhave a rule using Diagnosis BelowNormal with a value of 2, this part ofthe rule is satisfied when the readingvalue is more than two standarddeviations below the statistical mean.
NumberRate of change between the last andprevious KPI readings plus the
DiagnosisSlope AboveNormal Math
KPI Value (numeric)
number of standard deviationsspecified in the rule expression. Forexample, if you have a rule usingDiagnosis Slope Above Normal witha value of 2, this part of the rule issatisfied when the reading value ismore than two standard deviationsabove the statistical mean.
NumberRate of change between the last andprevious KPI readings is below
DiagnosisSlope BelowNormal Math
KPI Value (numeric)
normal, plus the number of standarddeviations specified in the ruleexpression. For example, if you havea rule using Diagnosis Slope BelowNormal with a value of 2, this part of
114 webMethods Optimize User's Guide 10.7
6 Defining Rules

Diagnosis Values
the rule is satisfied when the readingvalue is more than two standarddeviations below the statistical mean.
Ignored.This is a count based value that is usedin a rule expression with a specified
DiagnosisAbove Mean
number of standard deviations. Itcompares the number of successivereadings above the historical mean tothe average number of readings abovethe historical mean plus one standarddeviation.
Ignored.This is a count based value that is usedin a rule expression with a specified
DiagnosisBelow Mean
number of standard deviations. Itcompares the number of successivereadings below the historical mean tothe average number of readings belowthe historical mean plus one standarddeviation.
4. In the Comparator list, click the logical comparator (such as Equal To) to compare the twooperands in the simple rule expression (also known as a Boolean expression).
5. In the second Operand list, select an appropriate operand and complete the remaining fieldsto finish defining the simple rule expression. If you selectNumber as the second operand, thenin the related Value field, you would type the numeric constant that you want to compare tothe first operand. If your first operand is of type KPI Value, for example, the unit of measureof your numeric constant must be the same as the unit of measure used by the selected KPI(shown to the right of the KPI's Value selection). For example, if the unit of measure used bythe selected KPI is megabytes, Optimize interprets the literal in megabytes.
6. Click Save to save the simple rule expression.
Defining Math as the First Operand
The specific steps for defining each of the two operands in a simple rule expression depend onyour choice of operand types. The operand type determines the fields that appear in the RuleExpression panel on the Edit Rule Expression page. Each operand type has a specific set of fieldsassociated with it, and whenever you change an operand type, the displayed fields changeautomatically. If you choose theMath operand type for the first operand in a simple rule expression,Optimize displays the fields shown in the following figure and described in the subsequent task.
webMethods Optimize User's Guide 10.7 115
6 Defining Rules

Notice that when you choose Math as the first operand type, the first operand is composed of anoperator and two subordinate operands. The following task assumes that you have already chosenMath as the first operand type in the Rule Expression panel on the Edit Rule Expression page.
To define Math as the first operand type in a simple rule expression
1. In theOperator list (in theRule Expression panel on the Edit Rule Expression page), indicatewhich of the following arithmetical functions you want to perform on the two subordinateoperands of the Math operand type:
Add ([sub-operand 1] + [sub-operand 2])
Subtract ([sub-operand 1] - [sub-operand 2])
Multiply ([sub-operand 1] x [sub-operand 2])
Divide ([sub-operand 1] ÷ [sub-operand 2])
2. Specify each of the two subordinate operands and complete the remaining fields for eachsub-operand.
Important:At least one of the operands must be a KPI value.
Note:You can nest operands by selecting KPI Value or Math instead of Number as the operandtype for subordinate operands.
3. In the Comparator list, click the logical comparator (such as Equal To) to compare the two“primary” operands in the simple rule expression (also known as a Boolean expression).
4. In the second Operand list, select an appropriate operand and complete the remaining fieldsto finish defining the simple rule expression. If you selectNumber as the second operand, thenin the related Value field, you would type the numeric constant that you want to compare tothe first operand. If your first operand is of type KPI Value, for example, the unit of measure
116 webMethods Optimize User's Guide 10.7
6 Defining Rules

of your numeric constant must be the same as the unit of measure used by the selected KPI(shown to the right of the KPI's Value selection). For example, if the unit of measure used bythe selected KPI is megabytes, Optimize interprets the literal in megabytes.
5. Click Save to save the simple rule expression.
Defining Event Text or Event Value as the First Operand
The two Operand options Event Text and Event Value are available only for Event rule types.The specific steps for defining each of the two operands in a simple rule expression depend onyour choice of operand types. The operand type determines the fields that appear in the RuleExpression panel on the Edit Rule Expression page. A specific set of fields is associatedwith eachoperand type, and whenever you change an operand type, the displayed fields changeautomatically. If you choose either Event Text or Event Value as the operand type for the firstoperand in a simple rule expression, Optimize displays the fields shown in the following figureand described in the subsequent task.
The following task assumes that you have already chosen either Event Text or Event Value asthe first operand type in the Rule Expression panel on the Edit Rule Expression page.
To define Event Text or Event Value as the first operand in a simple rule expression
1. In the Category list (in the Rule Expression panel on the Edit Rule Expression page), clickthe category of the event you want to compare.
In addition to values supplied by categories that your system administrator created, the listcould include the options that are described in the following table.
DescriptionCategory
Provides data about theAnalytic Engines, such as JVMmemory consumedand thread count.
Analytic Engine
Provides generic data about your processes as identified on the Problemspage. For example, process cycle time (how long an instance takes to run)and step count (how many steps have completed successfully).
Intrinsic ProcessMetrics
webMethods Optimize User's Guide 10.7 117
6 Defining Rules

DescriptionCategory
Note:When creating a rule against the intrinsic process metrics Cycle TimebyProcess or Process Time against a ReadingValue, the unit ofmeasureis in milliseconds.
Additional optionsthat might appear
GarbageCollectionType
PersistenceQualifierin the Categorylist: Queue
Router
WebService
Process names
On the Edit Rule Expression page, the options for Event rule types are the same as the optionsfor KPI rule types, with the following two exceptions:
If you choose Event Text as the first operand, the second operand must be either Text orEvent Text.
If you chooseEvent Value as the first operand, the second operandmust be eitherNumberor Event Value.
2. In the Comparator list, click the logical comparator (such as Equal To) to compare the twooperands in the simple rule expression (also known as a Boolean expression).
3. In the second Operand list, select an appropriate operand to complete the expression. If youselect Number as the second operand, then in the related Value field, you would type thenumeric constant that youwant to compare to the first operand. If your first operand is of typeKPI Value, for example, the unit of measure of your numeric constant must be the same as theunit of measure used by the selected KPI (shown to the right of the KPI's Value selection). Forexample, if the unit of measure used by the selected KPI is megabytes, Optimize interprets theliteral in megabytes.
4. Click Save to save the rule expression.
Creating a Threshold Value Rule ExpressionThreshold value rule expressions are available only for Threshold expression types. The followingprocedure demonstrates how to create a threshold value rule expression in a simple rule expression.
To create a threshold value rule expression
1. Type a name for the rule expression in the Rule Name field in the Rule Information panel.
118 webMethods Optimize User's Guide 10.7
6 Defining Rules

2. Click the Down arrow to the right of the Rule Type field and select Threshold.
3. In the Expression list of the Rule Expression panel, click Simple Expression.
4. Choose Threshold Value as the first operand. The second operand must be either Number orThreshold Value
5. Click the box to the right of the Event field to display a pop up containing a list of events. Inthe Event list, Optimize displays a list of available event maps. This list contains bothsystem-defined and user-defined eventmaps. Your system administrator sets up user-definedevent maps (see “Configuring KPIs” in Administering webMethods Optimize). The followingtable describes some of the system-defined event maps listed.
DescriptionEvent Map
Describes the system health of the Analytic Engine.AnalyticEngineHealth
Indicates whenever an Optimize error occurs.Optimize Error
Describes the set of intrinsic values collected for performance data.Performance Metrics
Describes the set of intrinsic values collected for process data, suchas cycle time, or instance or error count.
Process Metrics
Describes the set of intrinsic values collected for process performancedata.
Process PerformanceMetrics
Describes the set of intrinsic values collected for query data.QueryMetrics
Describes the set of intrinsic values collected for queue data.QueueMetrics
Describes the set of intrinsic values collected for step data, such ascycle time, or instance or error count.
Step Metrics
Describes the set of intrinsic values collected for the Web serviceDCA.
WebServiceMetrics
6. In the Comparator list, click the logical comparator (such as Equal To) to compare the twooperands in the simple rule expression (also known as a Boolean expression).
7. Choose the second operand in the lower Operand field. The second operand must be eitherNumber or Threshold Value.
a. If you choose Threshold Value as the second operand, an Event field is displayed for thisoperand, and you must choose the event for it as you did for the first operand.
b. If you choose Number as the second operand, you need only supply a value in the Valuefield for the operand.
webMethods Optimize User's Guide 10.7 119
6 Defining Rules

8. Click Save to save the rule expression.
Creating a Date-Time Rule ExpressionA Date-Time rule expression compares two time-related operands for a KPI or Event rule. ADate-Time expression can be a simple expression or, more typically, it can be an element of acompound rule expression.Note that like other rule expressions, Date-Time expressions are subjectto logical restrictions based on operand selections, so you should familiarize yourself with operandfunctionality and consider what factors you are trying to evaluate before attempting to constructan expression. Also, refer to “Creating Rule Expressions” on page 107 in this chapter for generalinformation aboutworkingwith the rule expression editor before attempting to create aDate-Timeexpression.
For a Date-Time expression, the first operand can be either a KPI Value or Time value; the secondoperand can be values discussed in “Creating Rule Expressions” on page 107 of this chapter asapplicable for Date-Time expressions. Note that if theDate-Time expression is themain componentof an expression, at least one of the operands must be a KPI value. This is not required if theDate-Time rule expression is a member of a compound rule expression (for example: a rule thatfires when a KPI value represents total sales greater than $1M AND day-of-week is Monday).
While the Rule Expression editor enables you to create a standalone Date-Time expression, suchan expression rarelymakes sense in a realworld business environment.More typically, aDate-Timeexpression is used as a component of a simple expression or as an embedded expression withina compound rule expression. The examples in the following section of this chapter illustrate someof these typical usage patterns.
There are five basic types of Date-Time expressions you can create thatmake sense inmost businessenvironments.
Day ofWeek: This type of expression evaluateswhether an event or KPI reading occurs before,during, or after a particular day of the week.
Time of Day: This type of expression evaluates whether an event or KPI reading occurs beforeor after a particular time of the day.
Month: This type of expression evaluates whether an event or KPI reading occurs before,during, or after a particular month.
Simple expressions that use reading day: This somewhat special expression is a simpleexpression that uses a Date-Time component (reading day) to evaluate an event.
Reading Day expression structured as a Date-Time expression.
The following table provides a reference for choosing the appropriate symbol for a Time operandwhen creating a Date-Time expression.
ValueSymbol
Current day of the week as a number, where SUNDAY = 1 and SATURDAY= 7
Day of Week
120 webMethods Optimize User's Guide 10.7
6 Defining Rules

ValueSymbol
Current month as a number where JANUARY = 1 and DECEMBER = 12Month
Literal value = 1Sunday
Literal value = 2Monday
Literal value = 3Tuesday
Literal value = 4Wednesday
Literal value = 5Thursday
Literal value = 6Friday
Literal value = 7Saturday
Literal value can be 2, 3, 4, 5, or 6Workday
Literal value can be 1 or 7Weekend
Literal value = 1January
Literal value = 2February
Literal value = 3March
Literal value = 4April
Literal value = 5May
Literal value = 6June
Literal value = 7July
Literal value = 8August
Literal value = 9September
Literal value = 10October
Literal value = 11November
Literal value = 12December
The following procedure describes how to create a basic Date-Time expression. Note that whencreating aDate-Time expression, you cannot really consider each operand independently; instead,youmust think about logically relate to each other. For instance, if your first operand is Time, andyou need to specify a value, the same value must apply to both operands. Note also that thisprocedure is primarily for instructional purposes; in most cases, a simple, standalone Date-Timeexpression will have very limited real world applicability.
The examples that follow illustrate more practical Date-Time expressions that relate to real worldscenarios.
webMethods Optimize User's Guide 10.7 121
6 Defining Rules

To create a date-time rule expression
1. In the Expression list of the Rule Expression panel, click Date-Time Expression. Optimizedisplays the rule expression fields shown in the following figure.
2. In the firstOperand list, selectKPI Value orTime. The available fields below the firstOperandfield change based on your selection as described below.
If you select KPI Value as the first operand, you must select the appropriate category andspecific name for the KPI in the Category and KPI fields that appear. Refer to “DefiningKPI Value as the First Operand” on page 110 of this chapter for more information aboutKPI operands. Inmost cases for Date-Time expressions, youwill select one of the following:"Reading Day", "Reading Time", "Reading Date" or "Reading Value" (although ReadingValue should represent some date/time value). The second operand selection shouldlogically correspond with the first operand. For example, if "Reading Day" is the firstoperand, the second operand should be a day of the week equate to a day of the weeksymbol - "Reading Day" AT "WORKDAY".
If you select Time as the first operand, youmust select the appropriate unit from theSymbolfield: TIME OF DAY, DAY OF WEEK or MONTH. When you select the second operand,it must logically correspond to the Time selection. For example, if the first operand isReading Day, the second operand should be a day of the week that equates to a day of theweek symbol, i.e.: “ReadingDay”AT “WORKDAY”. See the table preceding this procedurefor information about the various time measures you can select.
3. In the Symbol list, click the date-related or time-related measure that you want to compareto the second operand.
The following table describes the time measures.
DescriptionTime Measure
The current day of the week represented as an integer where SUNDAY= 1 and SATURDAY = 7.
DAY OF WEEK
The current time represented as hours and minutes “hhmm”.TIME OF DAY
122 webMethods Optimize User's Guide 10.7
6 Defining Rules

DescriptionTime Measure
The current month represented as an integer where JANUARY = 1 andDECEMBER = 12.
MONTH
4. In theDate-Time list, click the time-related comparator to compare the two operands (Before,At, or After).
5. In the secondOperand list, select one of the following options (remember that this operandmust logically correspond to the value of first operand):
KPI Value: If you select KPI Value as the second operand, you must select the appropriatecategory and specific name for the KPI in the Category and KPI fields. Refer to “DefiningKPI Value as the First Operand” on page 110 of this chapter for more information aboutKPI operands.
Number: In the Value text box, enter a numeric value to compare to the first operand.
Time: Select an appropriate symbol to correspond to the first operand. Refer to theinformation in “Creating a Simple Rule Expression” on page 109 and to the table precedingthis procedure for information about the various time measures you can select.
Math: Construct a mathematical operation that resolves to a number which correspondsto the value of the first operand.
Important:Express all dates and times based on the time zone at the location of the Analytic Engine.
6. When you are finished working with your expression, click Save to save the rule expression.
Date-Time Expression ExamplesThe following examples illustrate somepotential typical usage scenarios forDate-Time expressions,based on the different types of Date-Time expressions that can be created (Day of Week, Time ofDay, Month, etc.). Note that the specific selections and values in these examples are probably notapplicable to any specific environment, but these can be adjusted as needed to fit real worldscenarios.
Day of Week ExampleThe following example, represented by the image of the rule expression editor that follows, showsa typical Day of Week Date-Time expression. This rule fires when Analytic Engine memoryconsumption exceeds 300 MB and the day of the week is prior to Tuesday. This example uses acompound expression to combine a Simple KPI expression with a Date-Time expression thatspecifies a day of the week. Note that the second operand of the Date-Time expression couldalternatively use the Number operand with a value of 2 to represent Tuesday.
webMethods Optimize User's Guide 10.7 123
6 Defining Rules

Time of Day ExampleThe following example illustrates a typical Date-Time expression using Time of Day. The rule isset to fire when the Analytic Engine memory consumption exceeds 300 MB, the reading day is aTuesday and the time is after 4:45 AM. This example uses two compound expressions to combinea Simple KPI expression with two Date-Time expressions, one to specify a day of the week andanother to specify the time of the day.
124 webMethods Optimize User's Guide 10.7
6 Defining Rules

Month ExampleThe following example shows aDate-Time expression that usesMonth. The rule is set to firewhenthe Broker Server disk space is less than 3000 MB and the month is before April. This exampleuses a compound expression to combines a Simple KPI expression with a Date-Time expressionthat specifies a month. Note that the second operand of the Date-Time expression could berepresented as a Number with a value of "4" for April.
webMethods Optimize User's Guide 10.7 125
6 Defining Rules

Reading Day ExampleThe following example shows a Reading Day Date-Time expression. Reading Day can be used ineither a Simple expression or a Date-Time expression. If used in a Date-Time expression, theReading Day is the day when the rule evaluation occurred. If used in a Simple expression (whichis tied to either an event or KPI reading), the ReadingDay is the daywhen the event or KPI Readingoccurred. When processing rules in real-time, there is no difference between the two usages;however when performing rule re-generation, the Date-Time expression usage will not evaluateas expected since the evaluation day would be the current day rather than the day when the eventor KPI reading day occurred.
ReadingDay can be compared to either a Time selection, such asMonday orWorkDay, or a numberliteral that matches the day of the week. The example that follows shows a compound expressionthat uses a simple KPI Value expression and an embedded Date-Time Reading Day expression.The rule fires when the KPI value is greater than 300 MB and the Reading Day is a workday andthe time of day is before 5:29 AM.
126 webMethods Optimize User's Guide 10.7
6 Defining Rules

Compound Rule ExpressionsA compound rule expression is created by combining two or more rule expressions. Theseexpressions can be simple expressions, Date-Time expressions or another compound expression.The two rule expressions are joined by a Boolean operator (AND,OR, or XOR). There are a numberof important considerations to be aware of when creating compound rule expressions to ensurethat they return relevant and coherent results. In addition, it is important for users to understandhow compound rules are evaluated so that they can be constructed in amanner to avoid unexpectedor irrational results.
Hierarchy Matching in Compound Rule ExpressionsYou can create a compound rule using a single event map or multiple event maps. In either case,however, in order for the rule to instantiate, the KPIs upon which the rule is defined must havecommon dimensional hierarchies, starting with the top-most dimension. Dimension hierarchiesmust match in dimension, attribute, and hierarchy order. KPIs that use the same hierarchy willalways match. The Rule Expression editor provides validation to ensure that matching KPIs areselected.
The following table describes the case of matching hierarchies.
webMethods Optimize User's Guide 10.7 127
6 Defining Rules

Hierarchy BHierarchy A
Dimension "host" Attribute "name"Dimension "host" Attribute "name"
Dimension "host" Attribute "name"
The following two tables describe the case when hierarchies do not match.
Hierarchy BHierarchy A
Dimension "host" Attribute "name"
Dimension "port" Attribute "number"Dimension "port" Attribute "number"
Hierarchy BHierarchy A
Dimension "host" Attribute "ipaddr"Dimension "host" Attribute "name"
The following examples provide additional information about howhierarchieswork in compoundrule expressions.
Compound Rule Expression Example 1:
KPI #1 dimension hierarchy: Customer
KPI #2 dimension hierarchy: Customer
Resulting rule instances: Those with common values for customer used to instantiate both KPI#1and KPI #2. A rule instance will not be created if customer Lucent exists for only one of the KPIs.Event data for customer Lucent must be sent in for both KPIs in order for a rule instance to becreated.
Compound Rule Expression Example 2
KPI #1 dimension hierarchy: Region, State, County
KPI #2 dimension hierarchy: Region
Resulting rule instances: Those with common values for region used to instantiate both KPI#1 andKPI #2.
Compound Rule Expression Example 3:
KPI #1 dimension hierarchy: Region, State, County
KPI #2 dimension hierarchy: Region, State, City
Resulting rule instances: None, because County and City do not match.
128 webMethods Optimize User's Guide 10.7
6 Defining Rules

Compound Rule Expression Example 4:
KPI #2 dimension hierarchy: State, County, Region
KPI #1 dimension hierarchy: Region, State, County
Resulting rule instances: None, because State does not match Region.
How Compound Rules Are EvaluatedA compound rule may be created as a threshold, event, or KPI rule type. However, irrespectiveof rule type, a compound rule is evaluated, to determine whether it is true or false, only when allof the sub-expressions have non-null data. This data may be new values/events/readings for themost recent collection interval or stored data from a previous collection interval if no data iscollected for the current interval. After a compound rule is successfully evaluated, thesub-expressions are reset and the compound expression again waits for all sub-expressions toreceive new data. In addition, compound rules only retain the last sub-expression data readings;whenever a reading is received, all previous readings are discarded.
The following example illustrates how all compound rules are evaluated. In this example, thecompound rule is configured to fire when the value for KPI #1 is greater than 50 and the value forKPI #2 is greater than 500. The KPI collection interval for KPI #1 is 1-minute and the KPI collectioninterval for KPI #2 is 1-hour.
The following table demonstrates the calculation of the KPI readings.
KPI #2KPI #1
N/A50
N/A8010:55 AM
N/A6010:56 AM
N/A3010:57 AM
N/A2010:58 AM
N/Anull10:59 AM
555null11:00 AM
In this example, the compound rule would be evaluated at 11:00 AM, since this is when bothsub-expression KPIs have non-null readings. This evaluation would occur based on a reading of20 from 10:58AM for KPI #1, and a reading of 555 at 11:00AM for KPI #2. Please note that althoughKPI #1 had two readings greater than 50 prior to 11:00 AM, the compound rule would not fire at11:00 AM, because only the last readings are retained for evaluation. Therefore the rule wouldevaluate at 11:00 AM as false.
As the preceding example illustrates, theKPI collection interval is not consideredwhen a compoundrule is evaluated. The evaluation of the compound rule simply occurswhenever both sub-expression
webMethods Optimize User's Guide 10.7 129
6 Defining Rules

readings can be evaluated. In the preceding example, the evaluation of the compound rule occursat 11:00 AM; however, if there is no reading for KPI #2 until 12:00 noon, 8:00 PM, the next day, oreven three days or three weeks later, the rule will not be evaluated until that time. Additionally,the last KPI reading for each KPI is used in the evaluation. In other words, the reading value of30 is used for KPI #1 in the example above, over-riding all reading values prior towhen the readingoccurs for KPI #2.
After a compound rule is evaluated, the sub-expressions are reset and againwait for new readings.Therefore, KPI #1will continue to receive new onminutes readings, but the compound expressionwill not be evaluated until KPI #2 receives a new reading at the next hour.
Given the considerations involving compound rules, the recommended scenario for using themis to ensure that all of the sub-expressions comprising the compound rule are evaluated regularlyand frequently. In the case of compound KPI rules, a common KPI collection interval for allsub-expressions, where each KPI is evaluated for every collection interval, would provide themost intuitive results.
Creating a Compound Rule Expression
To create a compound rule expression
1. In the Expression list in the Rule Expression panel, click Compound Expression.
Optimize displays the fields shown in the following figure.
2. In the first indented Expression list and the related fields, create the first rule expression usingthe instructions in “Creating a Simple Rule Expression” on page 109 and “Creating aDate-TimeRule Expression” on page 120.
3. In the Boolean list, select the comparator you want to use to join the two expressions.
130 webMethods Optimize User's Guide 10.7
6 Defining Rules

The following table describes when the rule evaluates to true depending on the comparatorthat you select.
Rule evaluates to true whenComparator
Both expression 1 and expression 2 are true.AND
Expression 1 is true, expression 2 is true, or both expressions are true.OR
Expression 1 is true but expression 2 is false, or expression 2 is true andexpression 1 is false.
XOR
4. In the second indented Expression list and the related fields, create the second rule expressionusing the instructions in “Creating a Simple Rule Expression” on page 109 and “Creating aDate-Time Rule Expression” on page 120.
5. Click Save to save the rule expression.
Rule Alerts
When a rule violation occurs, or when a rule returns to compliance, you can arrange to notify oneor more specified users, or to invoke a Web service or SNMP action. Rule alerts can take the formof e-mail messages, or you can specify SNMP or Web service alert actions.
Specifying Alert Recipients
To specify users to receive e-mail alerts about rule violations
1. In the Alerts portlet of the Add/Edit/Copy Rule page, click Add Alert.
Important:To activate theAdd Alert button youmust add one ormore users with a valid email addressinMywebMethods. Formore information, seeAddingUsers inWorkingwithMywebMethods.
A new role is added to the Alerts table.
2. Use the Name drop-down list to select the user to receive an alert when the rule goes out ofcompliance.
3. If you want to start sending alerts to the user as soon as a rule violation occurs, select theEnabled check box. If you do not want to start sending alerts to the user at this time, clear thecheck box.
4. If you want to send additional alerts to other users, or send an alert to the same user using adifferent method, repeat the previous steps.
5. If you want each user to see the other users who receive the email alert, select Group Users.
webMethods Optimize User's Guide 10.7 131
6 Defining Rules

Note:When you select Group Users, the individual Enabled settings are disabled.
All users who receive the email alert are listed on the To: row of the email.
Specifying Alert ActionsIn addition to sending alerts to specified users when a rule violation occurs, you can also specifySNMP alerts or Web service actions. For example, you can have Optimize send an SNMP alertwhen the rule is violated.
To specify additional actions to take when rule violations occur
1. In the Actions tab of the Add/Edit/Copy Rule page, click Add Action. Optimize adds a newrow to the Actions table.
Note:If actions have not been defined within Optimize, the message “No actions configured inthe system” appears in theActions tab. Actions are created and configured by theOptimizeadministrator. For more information, see Administering webMethods Optimize.
2. From the Action Name list, select the SNMP or Web service action to take when the rule isviolated.
3. If you want to take this action as soon as a rule violation occurs, select the Enabled check box.If you do not want to take this action at this time, clear the check box.
4. To delete an action, click the check box in front of the name and click Delete.
5. Click Save to add the actions to the rule.
Managing Rules
You can manage rules from the Rule List page, the Add/Edit/Copy Rule page, and the RuleInstances page.
Managing Rules from the Rule List Page
The following table describes how you can use the Rule List page to manage both rules that youhave created as well as pre-defined rules that come with Optimize.
Do thisIf you want to
Use the Search bar. You can search using any of the following searchcriteria: rule type, rule status, rule expression text, alert user's name,
Search for rules by rulename or description or byother search criteria
132 webMethods Optimize User's Guide 10.7
6 Defining Rules

Do thisIf you want to
action type, SLA, customer, or severity. For more information aboutusing the Search bar, seeWorking with My webMethods.
Click View Rule Instances in the Actions column to display theRule Instances page. See “Managing Rule Instances from the Add/Edit/Copy Rule Page” on page 134 for instructions.
Manage rule instances fromthe Rule List page
Click Disabled in the Enabled column for the rule. The iconchanges to Enabled. You can enable all rules at once by clicking
Enable a rule or a ruleinstance
and choosingSelect All from the displayedmenu and then clickingthe Enable button.
Note:Changing the enable status of a rule does not always alter theenable setting of its rule instances. For example, if a rule instancehas been enabled, disabling the rule will disable the rule instance,but will not change the rule instance's setting. Hence, when therule is re-enabled, the rule instance setting will prevent the ruleinstance from being enabled.
Click Enabled in the Enabled column for the rule. The iconchanges to . You can disable all rules at once by clicking and
Disable a rule or a ruleinstance
choosing Select All from the displayed menu and then clicking theDisable button.
Note:If you disable a rule that has a current violation against it, Optimizeresets the rule so that it is no longer in violation.
Note the information displayed in the Type and Sticky columns.You can also determine whether a rule violation has occurred by the
View attribute settings forrules
icon displayed in the Status column. See “Viewing the Rule List” onpage 90 for more information.
Click the edit icon ( ) in the Action column for the rule.Edit a rule
CAUTION:If you edit a rule definition, all rule instances associated with thatrule are deleted from the system.
If you edit a rule, you can populate the systemwith updated historicalinformation based on your edit using the icon as described below.
Click the icon to generate historical rule violations for a rule. Ifyou have edited a rule, when you click this button, Optimize
Generate Rule Violations
reevaluates all historical system data and generates rule violations
webMethods Optimize User's Guide 10.7 133
6 Defining Rules

Do thisIf you want to
according to the revised rule definition. This process is known asrule back population.
Note:Rule back population does not wok for rules defined on standarddeviation.
Click the copy icon ( ) in the Action column for the rule. The copiedrule name is appended with -COPY.
Copy a rule
Select the check box to the left of the rule and then click Delete.Delete a rule
Important:Deleting a rule removes all current and historical rule instancesassociated with that rule.
ClickExport Table. Formore information about exporting table data,seeWorking with My webMethods.
Export the list of rules to a*.csv (comma separatedvalue) file
Managing Rule Instances from the Add/Edit/Copy Rule Page
From the Add/Edit/Copy Rule page, you can display the Rule Instance page by clicking ViewInstances in the Rule Instances tab. From the Rule Instances page, you can enable or disableindividual rule instances, which directs Optimize to start or stop reporting rule violations againstthat instance.
To enable or disable individual rule instances
1. In the Rule Instances tab on the Add/Edit/Copy Rule page, click View Instances.
2. On the Rule Instances page, select a rule instance and do one of the following:
Enable a disabled rule instance by clicking Disabled. The icon changes to Enabled.
Disable an enabled rule instance by clicking Enabled. The icon changes to Disabled.
If you disable a rule instance that has a current violation against it, Optimize clears thisrule instance's violation state.
Enable all rule instances by clicking .
Disable all rule instances by clicking .
134 webMethods Optimize User's Guide 10.7
6 Defining Rules

Managing Rule Filters
When you define a KPI or event rule, you must identify the KPIs that gather the type of data towhich to you want to apply the rule (for example, Broker queue length). By default, Optimizeapplies the rule to all instances of the KPI (for example, all Brokers in your entire environment).However, you might want to apply the rule only to the KPI instances for specific dimensionality(for example, for specific Brokers). In this case, you create a rule filter that identifies the specificKPI dimensions to associate with a rule.
You can also edit and make changes to rule filters and delete ones you no longer need.
Viewing Rule Filters
To view existing rule filters
1. In My webMethods:
Navigate > Applications > Administration > Analytics > Rules > Rule Filters
Optimize displays the Rule Filters page.
2. If necessary, enter a search keyword and click Go.
Creating a Rule Filter
The Add Rule Filter page enables you to create new rule filters for rules. In addition, it containsthe Filter Dimensions panel which enables you to add new dimensions and dimension instances.
Note:A dimension must be part of the hierarchy specified in a KPI to be used in a rule filter for thatKPI.
webMethods Optimize User's Guide 10.7 135
6 Defining Rules

To create a rule filter
1. Do either of the following:
On the Rule Filters page, click Add Filter.
On the Edit Rule Expression page, click Add Filter in the Rule Expression panel.
Optimize displays the Add Rule Filter page.
2. Type a unique name for the rule filter in the Filter Name field.
3. Type a brief description of the filter in the Description field.
4. Click Add Dimension Definitions to choose the dimensions to which the rule filter applies.
5. Select one ormore dimension definitions from theAdd Dimension Definitions dialog (SHIFT+ click to select multiple contiguous definitions; CTRL + click to select multiple definitions thatare not contiguous), and click Add. The Add Dimension Definitions dialog closes and theselected dimension definition(s) are added to the Dimension Definitions panel in the AddRule Filter page.
6. To add specific dimension instances contained within a dimension definition, click the nameof the dimension definition, or click Edit beside the dimension definition, in the DimensionDefinitions panel on the Add Rule Filter page. The Add Dimension Instances dialog is
136 webMethods Optimize User's Guide 10.7
6 Defining Rules

displayed, and you can click on dimension instances to select them. A dimension definitionrequires that at least one dimension instance is selected.
7. Do one or more of the following in the Add Dimension Instances dialog:
Click theSelect All Pages button to select all dimensions, across all pages, in the dimensiondefinition. If you want to select all dimensions on the displayed page, press CTRL + A.
Click theDeselect All Pages to deselect all dimensions, across all pages, in the dimensiondefinition.
The Add Dimension Instances dialog includes a standard keyword search feature thatenables you to locate dimensions. Use the Filter field to enter your basic search criteria.The filter also includes options to use and/or and contains/not contains clauseswith respectto the filter’s keyword entry. After you have configured your search criteria, click Go toexecute a search.
8. ClickAdd to save changes to the dimension definition and close theAdd Dimension Instancesdialog, or click Cancel to close without saving.
9. If you want to delete one or more dimension definitions or dimension instances that you haveadded, select the check box before the items in the Dimension Definitions panel on the AddRule Filter page and click Delete.
10. Click Save to save the rule filter and return to the Rule Filters page.
Editing a Rule FilterYou can edit an existing rule filter to refine or enhance it. Changes to a rule filter may affect otherrules associated with the filter.
Note:Changes to an existing rule filter that is currently in use will purge the system of all related ruleinstances and their violations.
webMethods Optimize User's Guide 10.7 137
6 Defining Rules

To edit a rule filter
1. In My webMethods:
Navigate > Applications > Administration > Analytics > Rules > Rule Filters
2. Click the name of the rule filter, or click Edit in the Edit column.
Optimize displays the Add/Edit Rule Filter page.
3. Edit the details of the rule filter.
The following table describes the actions that you can perform on the Rule Filter Informationpanel.
Do thisIf you want to
Select the name of the rule filter in the Filter Name field and type a newname, or modify the existing name.
Rename the rulefilter.
Select the description in theDescriptionfield and type a newdescription,or modify the existing description.
Change the rulefilter description
The following table describes the actions that you can perform on the Dimension Definitionspanel.
Do thisIf you want to
Select the check box beside the dimension definition name and clickDelete.
Remove adimensiondefinition from therule filter.
Perform the following:Add, remove, orsearch for
a. In the Dimension Definitions list, click the dimension definitionname or click Edit beside the dimension definition name to activatethe Add Dimension Instances dialog.
dimensions in adimensiondefinitionassociated with therule filter.
b. Do one or more of the following on the Add Dimension Instancesdialog:
Click the Select All Pages button to include all dimensions,across all pages, in the dimension definition. If youwant to selectall dimensions on the displayed page, press CTRL + A.
Click the Deselect All Pages to exclude all dimensions, acrossall pages, in the dimension definition.
138 webMethods Optimize User's Guide 10.7
6 Defining Rules

Do thisIf you want to
TheAddDimension Instances dialog includes a standardkeywordsearch feature that enables you to locate dimensions. See “Creatinga Rule Filter” on page 135 for more information on using thissearch function.
c. Click Add to save changes to the dimension definition and close theAdd Dimension Instances dialog, or click Cancel to close withoutsaving.
The dimension definition is updated with the specified dimensions,and the Add/Edit Rule Filters page is displayed.
4. Click Save to save the rule filter with your changes and return to the Rule Filters page or theEdit Rule Expression page, or click Cancel to close the Add/Edit Rule Filter page withoutsaving.
Deleting a Rule FilterDeleting a rule filter removes it from the Optimize system.
To delete a rule filter
1. In My webMethods
Navigate > Applications > Administration > Analytics > Rules > Rule Filters
2. In the Rule Filters panel, select the check box to the left of the rule filter you want to deleteand then click Delete.
Applying Rule Filters to Rules
You apply rule filters to rules by selecting them from the Rule Filter list on the Edit RuleExpression page (see “Creating Rule Expressions” on page 107).
webMethods Optimize User's Guide 10.7 139
6 Defining Rules

140 webMethods Optimize User's Guide 10.7
6 Defining Rules

7 Responding to Problem Alerts
■ Responding to an E-mail Alert ..................................................................................... 143
■ Responding to Pager or Mobile Phone Text Message Alerts ....................................... 144
webMethods Optimize User's Guide 10.7 141

When an itemgoes out of compliance, Optimize notifies you of the problem in theMywebMethodsuser interface. Depending on your user profile, you can also be notified of problems by way ofe-mail or SNMP alerts. If you subscribe to a pager or mobile phone service that supports textmessaging to an e-mail address, you can also receive e-mail alerts on these devices. Your pageror mobile phone will display as much of the body of the e-mail as your service will allow. Thefollowing are examples of e-mail alerts.
Problem alert for an event rule in OptimizeFrom: ae0@test_clusterSent: Tuesday, November 07, 2006 10:47 PMTo: [email protected]: EVENT_Error_Count_by_Process_and_Error_TypeProcess.ProcessName.orderProcessorBam.ProcessError.ErrorType.custom process event4.-----------------------------------------------------------------Rule Details:
Name: EVENT_Error_Count_by_Process_and_Error_TypeInstance name: EVENT_Error_Count_by_Process_and_Error_Type
Process.ProcessName.orderProcessorBam.ProcessError.ErrorType.custom process event4.
Description: EVENT_Error_Count_by_Process_and_Error_Type_descr
Status: In complianceSeverity: Sev 1Definition: (Intrinsic Process Metrics/Error Count
by Process and Error Type/Reading_Value) = (1)
Evaluation: 1.0 compare.equalTo 1.0URL:
http://franklin:8080/webm.apps.mon.sys.rule.detail?wmp1=webm.apps.mon.sys.rule.detail.info.portlet&wmp1.ruleId=171
Rule type: EventSLA: YesCustomer: SLA Customer
-----------------------------------------------------------------Diagnosis Details:
Start date: 2006-11-07 21:47:03.504 PSTEnd date: unknownViolation count: 1Violation id: 12850
-----------------------------------------------------------------Event Details for KPI: Process Metrics
Monitor dimensions:Process: orderProcessorBamProcessError: custom process event4
Attributes:Process: orderProcessorBamProcess Error Count: 1.0ProcessInstanceDatabaseId: 1362074Process Error Type: custom process event4
Number of Processes: 1Process info:
Name: orderProcessorBamId: orderId=355&customer=CompanyZURL:
http://franklin:8080/webm.apps.mon.biz.process.instance.bamdetail?wmp1=webm.apps.mon.biz.process.instance.bamdetail.info&wmp1.modelId=orderProcessorBam&wmp1.deployVersion=5&wmp1.
142 webMethods Optimize User's Guide 10.7
7 Responding to Problem Alerts

instanceId=1362074&wmp1.modelType=3------------------------------------------------------------------
Problem alert for a KPI rule in OptimizeFrom: ae0@test_clusterSent: Tuesday, November 07, 2006 10:48 PMTo: [email protected]: KPI_Error_Count_by_ProcessProcess.ProcessName.orderProcessorBam.------------------------------------------------------------------Rule Details:
Name: KPI_Error_Count_by_ProcessInstance name: KPI_Error_Count_by_Process Process.ProcessName.
orderProcessorBam.Description: KPI_Error_Count_by_Process_descrStatus: In complianceSeverity: Sev 1Definition: (Intrinsic Process Metrics/Error Count by
Process/Reading_Value) > (1)Evaluation: compare.greaterThan 1.0URL:
http://franklin:8080/webm.apps.mon.sys.rule.detail?wmp1=webm.apps.mon.sys.rule.detail.info.portlet&wmp1.ruleId=167
Rule type: KPISLA: YesCustomer: SLA Customer
------------------------------------------------------------------Diagnosis Details:
Start date: 2006-11-07 21:47:00.0 PSTEnd date: unknownViolation count: 1Violation id: 12867
------------------------------------------------------------------Event Details for KPI: Error Count by Process
Monitor dimensions:Process: orderProcessorBam
Attributes:ProcessInstanceDatabaseId: 1362074ProcessInstanceDatabaseId: 1362074ProcessInstanceDatabaseId: 1362074
Number of Processes: 1Process info:
Name: orderProcessorBamId: orderId=355&customer=CompanyZURL:
http://franklin:8080/webm.apps.mon.biz.process.instance.bamdetail?wmp1=webm.apps.mon.biz.process.instance.bamdetail.info&wmp1.modelId=orderProcessorBam&wmp1.deployVersion=5&wmp1.
Responding to an E-mail Alert
To respond to an e-mail alert
1. Open the e-mail in your e-mail client.
webMethods Optimize User's Guide 10.7 143
7 Responding to Problem Alerts

2. To view details about the rule violation, click the link in the Rule Details section of the e-mail.
Responding to Pager or Mobile Phone Text Message Alerts
To respond to a pager or mobile phone text message alert
1. Log on to My webMethods.
2. To view details about a rule violation, click the link in the View Rules section of the e-mail.
3. To viewdetails about a business process or system component that has gone out of compliance,click the link in theView Process section of the e-mail. Formore information about interpretingthese details, see “Monitoring System Component and Business Process Performance” onpage 37.
144 webMethods Optimize User's Guide 10.7
7 Responding to Problem Alerts

8 Analyzing Information about Key Performance
Indicators
■ Analyzing Information about Key Performance Indicators ............................................ 146
■ Performance Comparisons ........................................................................................... 146
■ Historical Analyses ....................................................................................................... 146
■ Scale and Units on the KPI Summary Page ................................................................. 147
■ Data Formats on the KPI Instance Detail Page ............................................................ 147
■ Error Messages for Monitored Components ................................................................. 148
■ Understanding the KPI Summary Page ....................................................................... 148
■ Using the KPI Summary Page ...................................................................................... 153
■ Using the KPI Instance Detail Page ............................................................................. 157
webMethods Optimize User's Guide 10.7 145

Analyzing Information about Key Performance Indicators
You can analyze summary information about key performance indicators (KPIs) and detailedinformation about individual instances of KPIs.
Use theKPI Summarypage to view actionable data in order to solve problems and take advantageof opportunities. On this page, you can analyze the performance of KPIs and compare theperformance of up to five instances of KPIs on one graph. You can analyze historical performance.You can examine events such as rule violations as you analyze and compare KPIs. Based on thisanalysis, you can improve your business processes. For example, you can analyze order processingto identify and eliminate obstacles.
Use the KPI Instance Detail page to analyze data for a single instance of a KPI. In addition to theactual or aggregated data for a selected time range, the KPI Instance Detail page provides thehistorical mean value and standard deviation for all data points reported to date.
Performance Comparisons
On the KPI Summary page, you can compare the performance of up to five instances of KPIs onone graph.
Example #1: you want to investigate revenue by customer for three regions, East, Central, andWest, and compare them to the total revenue for all three regions. You can compare the instancesof the KPI for revenue from each customer region and the instance of the KPI that sums the revenuefrom all three regions. Using information available on that page, you can analyze revenue byregion and examine associated events such as rule violations.
Example #2: you want to investigate the relationship between order volume, order errors, andorder cycle time. You can compare the instances of the KPIs for order volume, order errors, andorder cycle time.
Example #3: you want to correlate operational events for your webMethods integrations to theservers and network they are running on. You can compare instances of KPIs for IS ServiceAverageService Request Time to the server CPU utilization on the server the IS Services are running on.
Example #4: you want to correlate your webMethods integrations to the infrastructure they arerunning on. You can compare the instances of the KPIs for Number of Successfully Completed ISService Requests on a specific IS, the Number of Documents Published of a specific DocumentType, and Number of Events Published on a specific Broker.
To view the scale values for a KPI instance, click the KPI instance's performance line or the KPIinstance name in the legend.
Historical Analyses
You can analyze the historical performance of a KPI over any time range for which you havehistorical data, and you can compare the historical data for up to five instances of KPIs on onegraph.
146 webMethods Optimize User's Guide 10.7
8 Analyzing Information about Key Performance Indicators

You can specify any time range. For example, you can analyze historical data for all of 2005, oryou can analyze historical data for 4 hours on 8/12/05.
Example:while investigating the relationship between order volume, order errors, and order cycletime, you observe that more errors occur within 24 hours of a holiday. You analyze the historicalperformance of the order errors KPI within 24 hours of the same holiday in previous years andwithin 24 hours of different holidays in the same year. Based on your analysis, you discover thatmore errors occur within 24 hours of all holidays. You then examine instances of the Revenue byRegion KPI and discover that the revenue for the central region decreases significantly within 24hours of holidays. By analyzing instances of the order process with errors, you link the increasein errors to the central region. Now you can manually investigate pre- and post-holiday orderprocessing differences between the central region and the other regions.
Scale and Units on the KPI Summary Page
The KPI performance chart scales each KPI instance over the maximum time range containingdata for the KPI instance so that the highest data point is near the top of the graph and the lowestdata point is near the bottom of the graph.
Time AxisThe KPI performance chart always displays scale values and units appropriate to the selected timerange along the chart's x axis.
Data AxisBecause Optimize can display instances of KPIs associated with different types of data such asmonetary values, bytes, percentages, and time on the same KPI performance chart, scale valuesand units do not display along the y axis. To display scale values for an instance of a KPI, click itsperformance line or its name in the legend below the performance chart. The units of measure foreach KPI performance line display in the legend.
Note:If all the KPI instances on a performance chart share the same type of data, scale values still donot display. You must click the KPI instance's performance line or its name in the legend to seeits scale values. Although the KPI instances share the same units, the scale values may differ.For example, one KPI instance's performancemay have a high point of 45 bytes and a low pointof 12 bytes. The KPI instance's scale values might range from 10 to 50. Another KPI instance'sperformancemay have a high point of 153 bytes and a low point of 86 bytes. That KPI instance'sscale values might range from 80 to 160.
Data Formats on the KPI Instance Detail Page
The KPI Instance Detail page can be displayed using two different data formats: graphical andtabular.
The graphical-format page displays a performance graph showing data points for the KPIinstance over a specified time range.
webMethods Optimize User's Guide 10.7 147
8 Analyzing Information about Key Performance Indicators

The tabular-format page displays a tablewith all of the data points plottedwithin the specifiedtime range and with any associated transaction data.
Both page-display formats include information about the KPI instance, the historical data for thetime of the last reading, and the readings in the last time period.
Error Messages for Monitored Components
Optimize displays error messages for system components monitored by the Infrastructure DataCollector in tabular format on the KPI Instance Detail page. See “Viewing KPI Instance Detailsin Tabular Format” on page 162. For more information about system components monitored bythe Infrastructure Data Collector, see Administering webMethods Optimize.
Understanding the KPI Summary Page
The KPI Summary page consists of two sections: the KPIs panel and the KPI Performance panel.
Optimize automatically refreshes the information on theKPIs panel every twominutes. Optimizedoes not automatically refresh the information on the KPI Performance panel.
KPI Summary page
KPIs PanelThe following table describes the information that the KPIs panel contains.
148 webMethods Optimize User's Guide 10.7
8 Analyzing Information about Key Performance Indicators

DescriptionColumn
Selects an instance of a KPI for display on the KPI performance chart.A maximum of five KPI instances can be selected. As soon as you
Check box
select a KPI instance, it displays on the KPI performance chart. Clickthe check box icon to sort the list by selected KPIs.
Performance is normal.Status column
A statistical abnormality has occurred.
A rule violation has occurred.
Displays the name of the KPI instance.KPI NAME
Displays the name of the process or event to which the KPI is related.Related To
Displays the KPI type according to the following list:KPI type
DescriptionType
Sums the data points collected over eachcollection interval.
Sum
Calculates the average value of the data collectedover each collection interval.
Average
Stores the value of the last data collected in thecollection interval.
Last Value
Stores the value of last data collected in eachcollection interval, where the possible values are1 (online) or 0 (offline).
State
Stores the maximum value of the data collectedin the collection interval.
Max
Stores the minimum value of the data collectedin the collection interval.
Min
Counts the number of data points over eachcollection interval.
Count
Displays the KPI’s data collection interval: 1 minute, 5 minutes, 10minutes, 15 minutes, 30 minutes, 1 hour, 2 hours, 4 hours, or 8 hours.
interval
Displays the KPI instance's last reading followed by the unit ofmeasure.
LAST READING
Indicates the date and time of the last reading.DATE/TIME
Displays one of the following:RULE
webMethods Optimize User's Guide 10.7 149
8 Analyzing Information about Key Performance Indicators

DescriptionColumn
One or more rules are evaluating data providedby the KPI. No rule violations have occurred.
Rule
One or more rules are evaluating data providedby the KPI. At least one rule violation hasoccurred.
Rule violation
Displays one or more of the following:DETAIL
Displays the KPI Instance Detail page. For moreinformation, see “Viewing KPI Instance Detailsin Graphical Format” on page 158.
KPI Performance PanelThe KPI Performance panel contains the following information:
KPI performance chart.
Event table.
KPI Performance panel
The following two tables describe the components shownon the illustration of theKPI performancepanel.
KPI Performance Chart
The following table describes the components of the KPI Performance Chart.
150 webMethods Optimize User's Guide 10.7
8 Analyzing Information about Key Performance Indicators

DescriptionComponent
Displays a time range that comprises all historical data for the selected KPIinstances up to the current date and time. The units are appropriate for thetime range (hours, days, months, etc.).
Time rangeselection bar
Selects the time range displayed in the graph area. The time period shownwithin the slider displays in the graph area.
Slider
Moving the slide bar changes the data shown in the graph area but does notchange the length of the time period. For example, if you are displaying four
Slide bar
hours of data, moving the slide bar lets you select another four-hour timeperiod.
Note:You can also change the data shown in the graph area by positioning themouse pointer anywhere in the graph area and dragging.
The diamond-shaped grabbers on each side of the slider let you grab thesides of the slider and drag them to change the time range of the data shown
Grabbers
in the graph area. For example, if you use the grabbers to expand the sliderfrom four hours to two days, two days of data display in the graph area.
Clicking one of the ten RANGE values below the date selection bar changesthe range of the data shown in the graph area and within the slider. The
RANGE values
values are: 1 hour, 4 hours, 8 hours, 12 hours, 1 day, 1week, 2weeks, 1month,3 months, and max (the maximum time range).
EachRANGE value displays themost recent data, regardless of the currentlyselected time range. For example, you are displaying data for a previousmonth and you click the 1 day RANGE value. The data for the most recent24-hour period displays.
Displays the time range for the data shown in the graph area.Time range selected
The graph area displays a performance line for each selected KPI instance.Performance line
If you move the mouse pointer horizontally across the graph area, the datapoint nearest the mouse pointer displays as a square on each KPI instance'sperformance line and the value of the data point displays beside the nameof each KPI instance in the legend below the performance chart.
If you select a KPI instance by clicking its performance line in the graph areaor its name in the legend:
The data scale values for the KPI instance display on the left and rightsides of the graph area.
The KPI instance's name, data value, and date/time in the legend areunderlined.
webMethods Optimize User's Guide 10.7 151
8 Analyzing Information about Key Performance Indicators

DescriptionComponent
The events associated with the KPI instance display on the Event list.The events associatedwith the other KPI instances are removed from theEvent list. For more information, see “Event Table” on page 153.
To un-select a KPI, click its performance line or name in the legend or clickanywhere in the graph area.
The graph area displays one or more event flags on the performance line ofeach KPI instance with events (rule violations). The event flags are the samecolor as the performance line to which they are attached.
event flag
Each event flag covers a time period based on the time range shown in thegraph area. If the time range in the graph area increases, the time periodcovered by each event flag also increases. When you change the time rangein the graph area, you change the time period covered by the event flags. Asthe time range changes, events may move from one event flag to another.For more information, see “Event Display” on page 35.
If you click an event flag, the description of each event represented by theevent flag as well as the date and time when each event occurred display onthe Event list. For more information, see “Event Table” on page 153.
Displays time scale values for the selected time range.Time axis
Note:To determine the display interval for data values shown in the graph area,check the times of two consecutive data values. For more informationabout display intervals, see “KPI Data Display” on page 32.
If you click a KPI instance's performance line, or click the KPI instance namein the legend, the data scale values for the selectedKPI instance display along
Data value axis
the data value axis on both sides of the graph area. For more information,see “Scale and Units on the KPI Summary Page” on page 147.
Displays the names of the KPI instances shown in the graph area in the orderthey were selected.
Legend
Beside the name of each KPI instance, the currently selected data point'svalue, unit of measure, and date/time are displayed.
You select the current data points for the KPI instances with the mousepointer. As you move the mouse pointer within the graph area, Optimizeselects each KPI instance's data point at the mouse pointer's position alongthe time axis.
When KPI instances are first displayed in the graph area and also when nodata value is selected, the legend shows the names of the KPI instanceswithout any values, units of measure, or times.
152 webMethods Optimize User's Guide 10.7
8 Analyzing Information about Key Performance Indicators

Event Table
The Event table contains events and rule violations that have occurred over the selected time rangefor the KPI instances displayed in the graph area. See the “KPI Performance Panel” on page 150illustration.
Until you click an event flag or performance line in the graph area, the Event table displays up toten of the most recent events.
When you click a KPI instance's performance line, the Event table displays all the events for thatKPI instance. The most recent events are shown first.
When you click an event flag on a KPI instance's performance line, or click the KPI instance namein the legend, the Event table displays all the events associated with that event flag. The mostrecent events are shown first. For more information about event flags displayed on the KPIperformance chart, see “KPI Performance Chart” on page 150.
The following table describes the components of the Event table.
DescriptionComponent
TheKPI indicator for an individual event in the Event table. This indicatormatches the color of the associated event flag and KPI performance linein the graph area.
Individual event flag
The name of the event (rule violation) as well as the date and time whenthe event occurred. If you click the name, the Problem Detail page isdisplayed.
Event name, date, andtime
When more than ten events are associated with a selected event flag, ascroll bar displays along the right side of the Event table.Move the scrollbar slider to display additional events.
Event scroll bar
Using the KPI Summary Page
You can display a graph that shows activity for up to five KPI instances for a selected businessprocess or system component.
Displaying the KPI Summary Page
To display the KPI Summary page
1. Open the KPI Summary page by performing one of the actions that are described in thefollowing table.
webMethods Optimize User's Guide 10.7 153
8 Analyzing Information about Key Performance Indicators

Do thisTo display the page from
Analytics Overview page a. In My webMethods select: Navigate > Applications >Monitoring > System-Wide > Analytics Overview.
b. Click beside a process component.
Problems page a. InMywebMethods:Navigate > Applications > Monitoring> System-Wide > Problems.
b. Click beside a problem.
Click beside a contributing instance.Problem Detail page
Process Instances page a. InMywebMethods:Navigate > Applications > Monitoring> Business > Process Instances.
b. Click beside a process instance.
Click beside a process instance.Process Instance Detail page
If information about two or more KPI instances displays in theKPI Instance Summary panel, click Compare.
Rule Detail page
The KPI Summary page displays a list of all KPI instances associated with the selected item.Until you select KPI instances, the KPI performance chart is blank. Formore information aboutthe KPI Summary page, see “Understanding the KPI Summary Page” on page 148.
Tip:The process or system component you select determines which KPIs display on the KPIspanel. To see all the instances of a KPI, select it on the Analytics Overview page. To see allKPI instances related to a step in a business process, select the step on theAnalyticsOverviewpage. If youwant to see all KPI instances related to a server, select the server on theAnalyticsOverview page. Don't select a process or system component withmany KPIs. If you do, youmust navigate through the list, and response time will be slow.
Selecting KPIs and Their Instances for ComparisonYou can select a KPI and compare the performance of its instances (up to a maximum of five) overa specified time period. You can also select up to five instances of different KPIs and comparetheir performance over a specified time period.
To select KPI instances for comparison
1. Select up to five KPI instances for display in the KPI performance chart by clicking the checkbox beside the name of the KPI instance.
The KPI performance chart displays a performance line for each selected KPI instance. Bydefault, the graph covers the most recent four hours of data.
154 webMethods Optimize User's Guide 10.7
8 Analyzing Information about Key Performance Indicators

Until you click an event flag, performance line in the graph area, or instance name in the legend,the Event list contains up to ten of the most recent events (rule violations).
2. Perform any of the actions that are listed in the following table.
Do thisIf you want to
Go to “Specifying theComparisonPeriod” onpage 155below.
Specify a time period for the KPIperformance chart.
Click . For more information, see “Using the KPIInstance Detail Page” on page 157.
View details about a KPI instance.
Click . Formore information about interpreting ruledetails, see “Viewing Information About Rules” onpage 89.
View details about one or more rules.
Click . Formore information about interpreting ruleviolations, see “Viewing InformationAbout Rules” onpage 89.
View details about one or more rulesthat have been violated.
Specifying the Comparison PeriodYou can compare KPI instances using standard time ranges or any time range that you specify.
The following table explains how to specify the comparison period.
Do thisTo specify
Click a RANGE value at the top of the KPI performance chart: 1 hour,4 hours, 8 hours, 12 hours, 1 day, 1 week, 2 weeks, 1 month, 3 months,or Max (the maximum time range).
A standard time range.
The slider adjusts to cover the time range you specified.
Each RANGE value displays the most recent data, regardless of thecurrently selected time range. For example, you are displaying data fora previous month and you click the 1 day RANGE value. The data forthe most recent 24-hour period displays.
Expand or shrink the slider by moving one or both of its grabbers.A non-standard timerange.
As youmove the grabbers, the display of the time range changes in theupper right corner of the KPI performance chart.
webMethods Optimize User's Guide 10.7 155
8 Analyzing Information about Key Performance Indicators

The time scale and units on the time axis of the graph area change after you select a standard timerange or adjust the grabbers.
Note:For information about how Optimize aggregates data when the time range changes, see “DataAggregation” on page 29.
The following table explains how to select data for the comparison.
Do thisTo select data for thecomparison
Move the slide bar along the time range selection bar.Using the slide bar.
Position themouse pointer anywhere in the graph area and dragto move the graph.
Using the mouse pointer.
If your mouse is equipped with a mouse wheel, you can movethe viewing period forward or back one time range at a time.
Using the mouse wheel.
Viewing Data Points and Events for KPIsYou can view data points and analyze events for KPIs throughout the comparison period.
Note:To identify whether an event is a rule violation, view basic information about the event. If thisinformation is not sufficient to identify it, view detail information.
The following table describes how to view data points and analyze events for KPIs throughoutthe comparison period.
Do thisIf you want to
Move the mouse pointer horizontally across the graph area.View data points for the KPIinstances displayed in the grapharea. For each displayed KPI instance, the data point nearest the
mouse pointer displays as a square on the performance lineand the value of the data point displays beside the name ofthe KPI instance in the legend below the performance chart.The data point's unit of measure and date/time are alsodisplayed.
Note:Values are rounded off to two decimal places.
Click the KPI instance's performance line or the name of theKPI instance on the legend.
View the data scale for a KPIinstance's performance line.
The data scale displays along the left and right sides of thegraph area.
156 webMethods Optimize User's Guide 10.7
8 Analyzing Information about Key Performance Indicators

Do thisIf you want to
The data scale may vary for each KPI instance displayed inthe graph area.
Click the KPI instance's performance line or the name of theKPI instance on the legend.
View events associated with a KPIinstance on the performance chart.
All events associated with the KPI instance are displayed onthe Event list. The events associated with the other KPIinstances are removed from the Event list.
Click the event flag on the performance chart.View events associated with anevent flag on the performance chart.
The description of each event represented by the event flagas well as the date and time when each event occurred aredisplayed on the Event list.
Click the event's name or KPI indicator on the Event list.View detail information about anevent.
The Rule Detail page appears. For more information aboutinterpreting rule details, see “Viewing Information AboutRules” on page 89.
Using the KPI Instance Detail Page
You can display detailed information about a KPI instance in graphical or tabular format. Also,you can create instant rules from a KPI Instance Detail page.
webMethods Optimize User's Guide 10.7 157
8 Analyzing Information about Key Performance Indicators

Viewing KPI Instance Details in Graphical Format
The example above shows a graph of a KPI instance for the brancher process, which is an arbitraryexample of a business process. Error Count by Process is an intrinsic KPI instance that gives youthe number of errors in a process. This KPI instance collects data at one-minute intervals. Thegraph covers a four-hour time period and it displays the data points (blue dots) at one-minuteintervals. The average reading values (green dots) for theKPI instance display at one-hour intervals.The green shaded area depicts the standard deviation for the one hour interval.
To view KPI instance details in graphical format
1. Open the KPI Instance Detail page.
The following table describes how to open the KPI Instance Detail page.
Do thisTo display the page from
Click .KPI Summary page
Click in the graph.Rule Detail page
The KPI Instance Detail panel displays a graph with data points for a selected time range (bydefault this range is the most recent four hours). The panel includes labels that identify thedata collection interval and the aggregated display interval.
158 webMethods Optimize User's Guide 10.7
8 Analyzing Information about Key Performance Indicators

TheKPI InstanceDetail page consists of three panels of information:KPI Instance Information,Historical Data for Last Reading in Displayed Time Range, and Readings in DisplayedTime Range.
The following table describes the components of KPI Instance Detail panel.
DescriptionComponent
The data points on the performance line for the KPI instance. Forinformation about howKPIs calculate data points, see “KeyPerformanceIndicators” on page 27.
Actual Reading
The historical average values for this KPI instance across all historicalreadings in the statistical interval. These values are based on the mode
Average Reading
of operation for KPI historical values. For more information, see “KPIHistorical Average Values” on page 33.
The standard deviation across all historical readings in the statisticalinterval. These readings are based on the mode of operation for KPI
Standard Deviation
historical values. For more information, see “KPI Historical AverageValues” on page 33.
Red dots (if any) indicate that rule violations occurred at the data point.Rule Violation
The KPI instance's data collection interval: 1 minute, 5 minutes, 10minutes, 15 minutes, 30 minutes, 1 hour, 2 hours, 4 hours, or 8 hours.
Collection Interval
The interval between the data points for the actual reading displayedin the graph area. Formore information, see “DataAggregation onKPIInstance Detail Page” on page 33.
Aggregated DisplayInterval
When icons appear, they indicate statistical abnormalities, ruleviolations, etc. For more information about these icons, see “ OptimizeIcons” on page 183.
KPI Instance Notes
The name of the KPI instance.KPI Instance
Identifier for the KPI instance.KPI Instance ID
The KPI's calculation type: sum, average, last value, min, max, state,or count. For a description of these calculation types, see “KeyPerformance Indicators” on page 27.
Calculation Type
The KPI's data collection interval. The minimum collection interval isone minute. The maximum is eight hours.
Collection Interval
The KPI's unit of measure (for example, steps or seconds).Unit of Measure
The value of the most recent aggregated data point collected for theKPI instance within the selected time period.
Last Reading
Optimize displays aggregated data collection points only for completeddisplay intervals. For example, the aggregated display interval is five
webMethods Optimize User's Guide 10.7 159
8 Analyzing Information about Key Performance Indicators

DescriptionComponent
minutes. Optimize does not display the aggregated data point for thefive-minute display interval until the interval ends.
Date and time when the most recent data point was calculated, withinthe selected time period.
Reading Date/Time
Unique identifier of the KPI instance used in the database.Internal ID
The following table describes the rows of the Historical Data for Last Reading in DisplayedTime Range panel.
DescriptionRow
For the selected time period, historical average values for theKPI instanceacross all historical readings in the statistical interval. These values are
Mean
based on the mode of operation for KPI historical values. Value is forthe most recent mean data point within the selected time period. Formore information, see “KPI Historical Average Values” on page 33.
For the selected time period, historical standard deviation across allhistorical readings in the statistical interval. These are values for themost
Standard Deviation
recent standard deviation data point within the selected time periodThese values are based on themode of operation for KPI historical values.For more information, see “KPI Historical Average Values” on page 33.(Not available if confidence is below threshold.)
One minus the statistical significance. The larger this value is, the morelikely that the difference between the last reading and the mean is dueto chance.
StatisticalConfidence
The following table describes the rows of the Readings in Displayed Time Range panel.
DescriptionRow
Total number of data points calculated in the selected time range.Number ofReadings
Mean value of data points calculated in the selected time range.Mean
Data point with the lowest value in the selected time range.Minimum
Data point with the highest value in the selected time range.Maximum
2. If you want to change the time range for which KPI instance details are displayed, do one ofthe following:
To select a specific time range, complete the Start Date, End Date, and Time boxes andthen click Go.
160 webMethods Optimize User's Guide 10.7
8 Analyzing Information about Key Performance Indicators

To select a predefined time range, select the desired range from the Display Range list.The displayed time range will end with the currently displayed end time.
To shift the currently displayed time range backward or forward by half of the currenttime range, click < or > respectively.
To shift the currently displayed time range backward or forward by the entire current timerange, click << or >> respectively.
To shift the currently displayed time range so that it ends at the current time, click theCurrent button. The time range is maintained.
Tip:The collection interval and the aggregated display interval are displayed below the KPIinstance graph in the KPI Instance Detail panel.
3. Perform any of the actions that are listed in the following table.
Do thisIf you want to
Rest the mouse pointer on the point.View a value for a point on the graph.
Note:Values are rounded off to two decimal places. Forgreater accuracy, view the data points in tabularformat.
Click in the upper right corner and select CreateRule. A dialog appears enabling you to create a new
Create a rule
rule against the KPI or the KPI Instance. For moreinformation about creating rules, see “Creating anInstant Rule” on page 106.
Click in the upper right corner and select GenerateMashZone Query. The generated query string,
Generate a MashZone query for thecurrently displayed KPI instanceinformation. containing data for the selected KPI instance, appears
in a dialog. Select the Generate MashZone Query forall KPI instances option to obtain a query string withdata for all KPI instances of the selected KPI.
Note:The information contained in the query string canbe copied and then pasted into the MashZoneapplication, where the data presentation can befurther processed. For more information aboutworking with Software AG MashZone, see theMashZone online help.
Click in the upper right corner and selectView Data.Formore information about KPI instance details in this
Display the value of the data plottedon the graph, in tabular format.
webMethods Optimize User's Guide 10.7 161
8 Analyzing Information about Key Performance Indicators

Do thisIf you want to
format, see “Viewing KPI Instance Details in TabularFormat” on page 162 below.
Rest the mouse pointer on the diagnosis trend (suchas ) to see a brief description of the diagnosis that
View information about the diagnosisperformed on the item.
Optimize performed on the item. For a more detaileddescription, see “ Optimize Icons” on page 183.
Click Rule - No Violation or SLA Rule - NoViolation. For more information about interpreting
View details about a rule.
rule details, see “Viewing InformationAbout Rules” onpage 89.
Click Rule Violation, or SLA Rule Violation.Position themouse pointer over the rule violation icon
View details about a rule violation.
to display rule instance information. For moreinformation about interpreting rule details, see“Viewing Information About Rules” on page 89.
Tip:For rule violations, you can also view rule detailsby clicking a red circle on the graph.
Viewing KPI Instance Details in Tabular Format
KPI Instance Detail data page
162 webMethods Optimize User's Guide 10.7
8 Analyzing Information about Key Performance Indicators

The example above shows processor times for the system component that has the KPI Instance IDof hostname.hostname.k2.processor time.
To view KPI instance details in tabular format
1. On the KPI Instance Detail graph page, click in the upper right corner and select View Data.
The KPI Instance Detail panel displays data for the KPI instance in tabular format. Each rowof the table represents either:
A data point plottedwithin the selected time range on the KPI Instance Detail Graph page.
Associated transaction data (if any).
Three panels of information also display: KPI Instance Information, Historical Data forTime of Last Reading, and Readings in Last Time Period.
The following table describes the columns of the KPI Instance Detail panel.
DescriptionColumn
The date and timewhen the data for the KPI instancewascollected or data for the associated transaction (if any)was recorded.
LAST UPDATED
webMethods Optimize User's Guide 10.7 163
8 Analyzing Information about Key Performance Indicators

DescriptionColumn
The data displays in reverse chronological order (startingwith the most recent data).
The data value collected for the KPI instance.Data value (formatted)
The column heading specifies the unit of measure.
Zero or more columns of transaction data attached to thebusiness or system data monitored by the KPI (forexample, order number and required ship date).
Name of transaction data (if any)
Note:In Optimize for Process, because aggregated business data is retained for a longer periodof time than non-aggregated business data by default, youmight notice some discrepanciesin the data displayed in the KPI Instance Detail panel. Use the graphical display formatinstead, or adjust the Business Days to Retain and Aggregated Days to Retain data purgeparameters (see “Configuring Data Purge” in Administering webMethods Optimize), to avoidthese discrepancies.
Below the table, the page also contains the KPI Instance Information, Historical Data forTime of Last Reading, and Readings in Last Time Period panels as described in “ViewingKPI Instance Details in Graphical Format” on page 158.
2. If you want to change the time range for which KPI instance details are reported, completethe Start Date, End Date, and Time boxes and then click Go.
3. Perform any of the actions that are listed in the following table.
Do thisIf you want to
Click Export Table. For more information aboutexporting table data, seeWorking with My webMethods.
Export the data in the table to acomma-delimited text file
Note:The export includes both formatted data and rawunformatteddata. The rawdata is provided to enhanceexternal analysis of the data.
Click the process instance ID. Formore information aboutprocess instance details, see “Monitoring System
View details about the processinstance (if any) that generated dataassociated with the KPI Component and Business Process Performance” on
page 37.
Click View Detail. For more information about KPIinstance details in this format, see “ViewingKPI InstanceDetails in Graphical Format” on page 158.
View KPI instance details ingraphical format
164 webMethods Optimize User's Guide 10.7
8 Analyzing Information about Key Performance Indicators

Creating Rules from the KPI Instance Detail PageThe KPI Instance Detail page enables you to quickly create rules from a KPI instance on the KPIInstance Detail page. This type of rule is sometimes referred to as an instant rule. You can createrules regardless of whether a KPI instance already has rules. Remember that only users who areauthorized to access the Rule List page can create rules as described in the following steps. Fordetailed information about rules, see “Defining Rules” on page 99.
To create a rule from a KPI instance
1. On the KPI InstanceDetail page (either graphical format or tabular format), click in the upperright corner and select Create Rule.
The Create Rule page is displayed.
2. Type a name for the rule in the Name field.
3. Click the appropriate check box adjacent to theApply To heading to indicate whether to applythe rule to all instances of this KPI or only to this instance.
4. If you want Optimize to send an alert to a designated user if the rule violates, select that userin the Send Alert To field.
Note:The Send Alert To field is unavailable if the currently logged in user hasn't specified ane-mail address in the user settings.
5. If you want the rule to send a Web service action or an SNMP action, choose the appropriateaction from the Action drop-down list.
6. In the Execute On field, select the appropriate check box to indicate whether to execute thisrule on an aggregation interval (a KPI rule) or on every event (an event rule).
7. Make the appropriate selections using the radio buttons beside theExpression Type heading.The selection you make here works with the fields under the Condition heading that followsand enables you to specify the type of expression to be used with this rule. The ExpressionType options are as follows:
Reading Value: Enables you to create a rule violation condition statement based on auser-selected comparator and value.
Normality: Enables you to create a rule violation condition statement based on values beingone or two standard deviations above or below the mean value.
Trending: Enables you to create a rule violation condition statement based on a value thatis trending up or down for a specified duration.
webMethods Optimize User's Guide 10.7 165
8 Analyzing Information about Key Performance Indicators

8. Complete the fields under theCondition heading to formulate the expression that determinesthe specific conditions under which the rule will fire. The fields available vary based on theselections you made under the Expression Type heading.
The following table describes the fields under the Expression Type heading.
Complete these fieldsFor expression type
Choose a comparison operator from the Comparison drop-downlist and specify a value in the Value field. The unit of measurement
Reading Value
for the value of the KPI instance is determined when the event mapis created.
Choose the appropriate radio button.Normality
Choose either Trends Up or Trends Down and specify a wholeinteger of intervals in the Duration field.
Trending
Note:The Normality expression type is available only for aggregation-interval (KPI) rules.
9. To back-populate historical data for this rule, check Generate historical rule violations.
10. Click Save to create the rule.
166 webMethods Optimize User's Guide 10.7
8 Analyzing Information about Key Performance Indicators

9 Process Analytics
■ Overview ...................................................................................................................... 168
■ Process Metrics Panel .................................................................................................. 168
■ Process Diagram Panel ................................................................................................ 170
■ Metrics Detail Panel ..................................................................................................... 172
■ Viewing Rule Violation Details in the Metrics Detail Panel ........................................... 174
■ Viewing Step Information from the Process Diagram Panel ......................................... 175
■ Understanding Business Process Models .................................................................... 176
webMethods Optimize User's Guide 10.7 167

Overview
The Process Analytics page (Monitoring > Business > Process Analytics) helps Optimize forProcess users to analyze business process activity over the current or previous day using a varietyof techniques. This page provides at a glance metrics on process and step volume, cycle time, andrule violations. In addition it enables you to view details about the specific process instances orrule violations related to the general metrics information. This page also displays a process modeldiagram for the selected processmodel, and enables you to drill down to viewmetrics for individualsteps within the model. Using the panels on this page, you can quickly assess the state of relevantprocesses and drill down to explore and develop solutions for relevant problems.
Initially, two panels are displayed on theProcess Analytics page. The upper panel is theProcessMetrics panel, and it displays process metric readings under the following headings: Volume,Cycle Time, Rule Violations. These readings represent critical metrics for the system during theapplicable time period. The lower panel is the Process Diagram panel, and it displays a diagramof the currently selected process model. This diagram shows each step of the process models aswell as the transition lines between each step. You can click on a step to view metric details forthat step. The default view shows the standard processmodel, but the panel contains radio buttonsthat enable you to change the view to show critical path for the process diagram and animatedswarm lines that represent path volume flowing through the diagram.
A third panel, theMetrics Detail panel, shows process instance or rule violation informationwhenyou click a selection from a Volume, Cycle Time, or Rule Violations metrics pop up. This panelcan also display step error information if you click a step in the process model diagram.
All information on the Process Analytics page applies for the currently selected process modelover the relevant time period, as configured in the browser's time zone. The currently selectedprocess is displayed in the Select a Process field. If you select a different process model, theProcess Analytics page displays the selected model for the duration of you current MywebMethods session.
You can customize the time period that is applied to the currently selected process model on theProcess Analytics page by using the Date Range drop-down list and the icon. Either selecta time range from the predefined time ranges in theDate Range drop-down list, or specify valuesin the Start Date, End Date, and Time fields to define your own time range. When you specify astart and end date, and time, the Date Range drop-down list changes to Custom.
To refresh the page with the latest data from the Analytic Engine, click the Refresh button. Youcan also set an automatic refresh to the Process Analytics page by selecting one of the valuesfrom the Refresh Rate drop-down list. When you set an automatic refresh, the page refreshesperiodically with the selected rate. If you click Refresh while the Refresh Rate is set to a value,different from None, this will refresh the contents of the Process Analytics page and reset theautomatic refresh timer. The automatic refresh timer will also reset if you change the selectedprocess model or date range.
Process Metrics Panel
The ProcessMetrics panel is displayed in the upper part of theProcess Analytics page and showsimportant metrics under the following headings: Volume, Cycle Time, and Rule Violations.
168 webMethods Optimize User's Guide 10.7
9 Process Analytics

Under each heading, this panel displays a large number and a small number within a box, as wellas a horizontal line or an arrow. The large numbers represent the applicable process metrics forthe current time period, beginning at 12:00 AM for the current day and ending at the current time;while the small numbers represent metrics for the previous time range starting at 12:00 AM andending at the same time of day as the current time range. Using these two numbers, you cancompare performance for the current day to performance for the previous day. Lines or arrowsto the left of the large numbers indicate the trending change for eachmetric frommidnight throughthe current time today. Lines indicate a steady state, while arrows up or down indicate an increaseor decrease of the metric value.
The time ranges on this panel, and the entire Process Analytics page, are static until the userrefreshes the page by using the page's Refresh button, by selecting a new process or by navigatingaway from the page.
The following table describes the Process Metrics panel metrics.
DescriptionMetric
The total number of process instances thatwere active during the applicabletime range.
Volume
The total time it took for a process to run from beginning to end. This valueis the average for all process instances that completed during the applicabletime range.
Cycle Time
Note:Process instances in the canceled or suspended state do not contributeto cycle time. If a suspendedprocess resumes and completes successfully,it will contribute to the cycle time less the time spent suspended.
The total number of rule violations that occurred for the specified processduring the applicable time range. This includes all violations related tothe process including step and transition violations.
Rule Violations
TheProcess Metrics panel enables you to viewdetailed information about the displayedmetrics.If you click a current or previous Volume, Cycle Time, or Rule Violation metric reading, a popup menu appears that shows a breakdown of the metric and enables you to select a particularaspect of it for which to view details. When you click one of the pop-up selections, a new detailpanel is displayed below the Process Metrics panel containing the relevant detail information.The contents of this panel vary depending on your selection.
The following table explains the selections for the different Process Metrics pop ups.
Volume
Displays the total number of process instances forwhichthere was activity during the applicable time range.
All
Displays all process instances that started during theapplicable time range.
Started
webMethods Optimize User's Guide 10.7 169
9 Process Analytics

Displays the total number of process instances thatwereactive but not completed during the applicable timerange.
In Progress
Displays all process instances that completed during theapplicable time range.
Completed
Cycle Time
Displays the average cycle time for all process instancescompleted during the applicable time range.
Average
Displays the maximum cycle time for all processinstances within the applicable time range.
Maximum
Displays theminimumcycle time for all process instanceswithin the applicable time range.
Minimum
Rule Violations
Displays all rule violations that occurred during theapplicable time range.
All Violations
Displays all rule violations that are currently open at theend of the applicable time range.
Open Violations
Process Diagram Panel
The lower part of the Process Analytics page includes the Process Diagram panel that displaysthe process diagram for the selected process. By default the Process Diagram panel showsinformation for the first process in the list of available models for your system. You can select adifferentmodel by clicking the drop down for theSelect a Process field at the top of theProcessAnalytics page.
For more information about workingwith process model diagrams, see “Understanding BusinessProcess Models” on page 176.
Working with the Process DiagramThe Process Diagram panel displays a visual representation of the currently selected processmodel. This diagram shows all elements of the process aswell as the various paths that interconnectthe process model steps.
There are three display options for the Process Diagram: Standard, Path Volumes, and CriticalPath. These options are explained below:
Standard - This option shows all elements of the selected model as well as all available pathsthrough the model components.
170 webMethods Optimize User's Guide 10.7
9 Process Analytics

Path volumes - This option displays animation, known as swarm lines, that indicates therelative volume between steps. A color gradient is used to identify higher or lower volumes.Volumes are calculated over the applicable time range.
Critical Path - This option highlights the critical path through the specified process model inyellow. The critical path is path most frequently traversed. It is calculated over the applicabletime range.
Process Diagram panel
Click the step to display the step metrics in a new version of the Process Metrics panel. Click thediagram background to dismiss the step metrics data.
The following table describes the elements of the Process Diagram panel.
DescriptionComponent
Adjusts the size of the process diagram.Zoom control
Plus (+) button
Minus (,) button
1:1 buttonZooms in to view details of the process. Each click enlarges the size of theprocess diagram 20 percent.
Zooms out to view a larger portion of the process. Each click reduces thesize of the process diagram by 20 percent.
Returns the default size of the process diagram.
Note:The scroll wheel on the mouse also zooms in and out.
Note:The process diagram height that you configure is stored for the currentuser.
Displays a diagramof thewhole business process or a portion of the businessprocess.
Diagram area
webMethods Optimize User's Guide 10.7 171
9 Process Analytics

DescriptionComponent
For information about the components of the business process shown in thediagram area, see “Understanding Business Process Models” on page 176.
For information about the view-specific components of the business processshown in the diagram area, see the following table.
The Process Model diagram provides visual information about a business process model, asdescribed in the following table.
DescriptionAnnotation
Indicates that the step is selected.
selected step
Minimizes a subprocess container. For moreinformation, see “Containers” on page 178.
container minimize
Represents a subprocess container that has beenminimized. Double-click the icon to expand thecontainer.container icon
Note:For nested containers, minimizing a containeralso minimizes all containers nested in it.
Represents a referenced process. For moreinformation, see “Referenced Process” on page 179.
Referenced process
Indicates the volume of the process instances thatare executed between the business process steps.The color of the swarm line dots indicates therelative volume of process instances. Use the swarmline colors for volume reference.
swarm line
swarm line colors
Metrics Detail Panel
The Metrics Detail panel is displayed when you select a Process or Step Metrics Panel pop-upmenu option. The Metrics Detail panel shows relevant process instances or rule violations in a
172 webMethods Optimize User's Guide 10.7
9 Process Analytics

tabular format that varies according to the selected metric. Also, the Metrics Detail panel displaysstep information for a process model step if you click on a step in the Process Model diagram.
Viewing Volume or Cycle Time Details in the Metrics DetailPanel
The following table describes the information that is displayed for all Volume and Cycle Timepop-up menu Process and Step metric detail selections.
DescriptionColumn
Displays the date and time that Optimize last updated the process instance(that is, when Optimize last received data).
LAST UPDATED
Displays the date and time when the process instance began.STARTDATE/TIME
The process instances are sorted by DATE/TIME in descending order whendisplaying process instance volumes and average cycle time details. Whendisplaying cycle times minimum or maximum details, the table is sorted bycycle time, ascending or descending respectively.
Identifies the process instance.PROCESSINSTANCE ID
Indicates the most recent execution status of the process instance. One of thefollowing values displays:
TRACKINGSTATUS
MeaningValue
The process has started, but not allsteps have completed.
Started
The process was canceled.Stopped
Either the process completedsuccessfully, or the process completed
Completed
but one or more steps executed witherrors.
The previous three statuses apply to both webMethods-executed processesand externally-executed processes.
The total time required for a process to run from beginning to end, includingthe time spent waiting to be processed and the process execution time.
CYCLE TIME
Note:Process instances in the canceled or suspended state do not contribute tocycle time. If a suspended process resumes and completes successfully, itwill contribute to the cycle time less the time spent suspended.
webMethods Optimize User's Guide 10.7 173
9 Process Analytics

DescriptionColumn
Click to display the Process Instance Detail page. For more information,see “Monitoring System Component and Business Process Performance” onpage 37.
DETAIL
Note:The order and specific information displayed varies according to your selection from the pop-upmenus. Note that the Display Process Instances radio buttons above the table enable you toselect whether the table displays All, Started, In Progress or Completed process instances.
Viewing Rule Violation Details in the Metrics Detail Panel
The following table describes the information that is displayed for all Process and Step Metricspanel Rule Violation pop-up menu selections.
DescriptionColumn
Displays if the rule violation has been resolved. Displays if the rule is inviolation if it is statistically abnormal.
Status column
Displays the date and time when the rule violation occurred.DATE/TIME
The rule violations are sorted by DATE/TIME in descending order (mostrecent to earliest).
Displays the name of the rule instance that triggered the violation.RULEVIOLATION
Optional user-defined characterization of rule violation. Severity is definedon the Add/Edit/Copy Rule page.
SEVERITY
DETAILIndicates a rule that was previouslyout of compliance but is now currentlyin compliance.
Click to viewdetails about the rule thatwas violated.
Indicates an SLA rule that waspreviously out of compliance but isnow currently in compliance.
Indicates an SLA rule that has beenviolated.
Click to view KPI information for therule violation. For more informationabout interpreting KPI data, see
174 webMethods Optimize User's Guide 10.7
9 Process Analytics

DescriptionColumn
“Analyzing Information about KeyPerformance Indicators” on page 145in this guide.
Click to display the Rule Detail page.Formore information, see “MonitoringSystem Component and BusinessProcess Performance” on page 37.
TheDisplay radio buttons above the Rule Violations for Process table enable you to select whetherthe table displays All Violations (both those that are resolved and those that are unresolved) oronly Open Violations (those that are currently unresolved).
Viewing Step Information from the Process Diagram Panel
When you click a step in the process diagram, aStep Metrics panel is displayed, showingVolume,Cycle Time, and Rule Violation information for that step.
This panel is similar to the Process Metrics panel in that it shows large and small numbers thatcorrespond to metrics for the current and previous day. If you click on one of these numbers,pop-ups with detail options are displayed just as for the Process Metrics panel.
The following table provides information about the detail options in the pop-ups.
Volume
Displays the total number of step instances for whichthere was activity during the applicable time range.
All
Displays all step instances that started during theapplicable time range.
Started
Displays the total number of step instances that wereactive but not completed during the applicable timerange.
In Progress
Displays all step instances that completed during theapplicable time range.
Completed
Cycle Time
Displays the average cycle time for all step instancescompleted during the applicable time range.
Average
Displays the maximum cycle time for all step instanceswithin the applicable time range.
Maximum
Displays the minimum cycle time for all step instanceswithin the applicable time range.
Minimum
webMethods Optimize User's Guide 10.7 175
9 Process Analytics

Rule Violations
Displays all rule violations that occurred on the selectedstep during the applicable time range.
All Violations
Displays all rule violations that are currently open forthe step at the end of the applicable time range.
Open Violations
When you select one of these Step Metrics Detail options, the Metrics Detail panel is displayed,in the same manner as how it is displayed for Process Metrics Detail options. For informationabout the Volume and Cycle Time step detail information, refer to “Viewing Volume or CycleTime Details in the Metrics Detail Panel” on page 173 in this chapter. For information about RuleViolations step detail information, refer to “Viewing Rule Violation Details in the Metrics DetailPanel” on page 174 in this chapter.
The Step Instance Detail Panel
If you click one of the pop-up detail selections, the Step Instance Detail panel is opened.
Understanding Business Process Models
The Process Analytics page displays a visual overview diagram or model of an entire businessprocess. Business processmodels are created in SoftwareAGDesigner. The following figure showsa sample business process model on the Process Analytics page.
Sample business process model
A business process model consists of:
Steps
Transitions
Pools (optional)
176 webMethods Optimize User's Guide 10.7
9 Process Analytics

Swimlanes (optional)
Subprocesses (optional)
Containers (optional)
Referenced processes (optional)
The following right-click options are available in the Process Model diagram area of all ProcessAnalytics pages.
Fit to screen - Resizes and re-centers the diagram based on the screen size.
Hide transition labels - Hides description and expression text on all transition lines in thediagram.
Show transition descriptions - Shows all applicable description text created in Designerforall transitions on the diagram.
Show transition expressions - Shows applicable transition expressions created inDesignerforall transitions on the diagram.
Truncate transition expressions/descriptions label - Shortens description and expressiontext on all transition lines in the diagram.
Expand transition expressions/descriptions label - Expands description and expressiontext on all transition lines in the diagram to their full length.
Steps
A step is the basic unit of work in a business process. A step can represent an automated process,a manual step performed by a person, or a visual aid that identifies a task that an externalorganization performs. Steps can also depict a service that executes if an error or timeout occursin the process.
Transitions
A transition shows the flow of data and control from one step to another. There are two basic typesof transitions:
A control flow moves data directly from one step to another through the execution of anautomated process. A solid line indicates a control flow.
A message flow sends a message from one step to another, for example, from a step in aninternal process to a step in an external process. A dotted line indicates a message flow.
Pools
A pool is a set of associated steps in a business process. A pool of steps represents either an internalprocess or an external process. Each process model can have one internal pool and any numberof external pools. A pool might represent the steps in a departmental process. For example, there
webMethods Optimize User's Guide 10.7 177
9 Process Analytics

might be an accounting pool and a human resources pool. Pools are represented by shadedrectangles in the process model.
Swimlanes
A swimlane is a set of associated steps within a pool. Swimlanes are represented by backgroundsof different colors within a pool.
Subprocesses
A subprocess is a process within another process. The subprocess is treated like a step within theprocess that contains it. The subprocess cannot run on its own; it runs as part of the process thatcontains it.
The steps in a subprocess may be automated or manual, and the subprocess may loop or repeatmultiple times until specified conditions are met.
Containers
A container holds the set of steps that comprise a subprocess.
A container can be minimized to display as an icon within the process, and the container icon canbe expanded to re-display the subprocess within the container.
Subprocess containers can be nested one within another.
A control flow transition cannot cross the boundaries of a container. It can connect to the containeras a whole but not to a step within the container.
A message flow transition, which sends a message, can cross the boundaries of a container andconnect to a step within the container.
Pools, swimlanes, and containers
178 webMethods Optimize User's Guide 10.7
9 Process Analytics

Referenced Process
A referenced process is a separate process that displays as a step within another process. Unlikea subprocess, a referenced process is self-contained. It can run on its own.
On the Process Analytics page, a referenced process displays as an icon. Unlike a subprocesscontainer, a referenced process cannot be expanded on the Process Analytics page. To displaythe referenced process on the Process Analytics page, select the referenced subprocess from the"Select a Process" drop down list.
webMethods Optimize User's Guide 10.7 179
9 Process Analytics

180 webMethods Optimize User's Guide 10.7
9 Process Analytics

10 Diagnostics
■ Viewing Diagnostic Information .................................................................................... 182
webMethods Optimize User's Guide 10.7 181

Viewing Diagnostic Information
The Diagnostics page provides a report of information to assist in troubleshooting issues withevent maps, dimensions, hierarchies, KPIs, and rules.
To view diagnostic information
1. In My webMethods:
Navigate > Applications > Administration > Analytics > Diagnostics
Optimize displays the Diagnostics page with a report of diagnostic information.
2. View the information on the Diagnostics page.
The following table describes the information on the Diagnostics page.
DescriptionColumn
This column lists the area of the system that is connected to the issue. Thelisted area can be an event map, a dimension, a measure, a dimensionhierarchy, a KPI, or a rule.
TYPE
This column lists the measure name or the dimension name connected tothe issue.
ITEM
This column describes the issue.ISSUE
As indicated by the up or down triangle beside each column head, you can sort issues by eachcolumn. Once you have sorted a column, the other two columns show either a (2) or a (3),indicating that column is either the secondary sort key or the tertiary sort key, respectively.
182 webMethods Optimize User's Guide 10.7
10 Diagnostics

A Optimize Icons
■ About Optimize Icons ................................................................................................... 184
■ Status Icons .................................................................................................................. 184
■ Rule Icons .................................................................................................................... 185
■ SLA Rule Icons ............................................................................................................. 186
■ Monitor/KPI Icon ........................................................................................................... 186
■ Process Analytics Icon ................................................................................................. 187
■ Six Sigma Icon ............................................................................................................. 187
■ Diagnosis Trend Icons .................................................................................................. 187
■ Analytics Overview Icons ............................................................................................. 188
webMethods Optimize User's Guide 10.7 183

About Optimize Icons
Optimize displays summary and detailed information about business process and system statusin tabular and graphical format. Optimize uses icons to visually indicate status andwhether moreinformation is available for an item. Remember that all icons related to business processes arespecific to Optimize for Process.
Optimize icons include the following types:
Status icons,which indicatewhether a business process or system component is in compliance,out of compliance, or statistically abnormal. For process instances, they indicate whether theprocess step executed successfully or with errors. For example, next to the name of a systemcomponent indicates that the component is out of compliance.
Rule icons,which indicate that a rule exists for the item and whether the rule was violated.For example, indicates that a rule violation exists. You can click this icon to view detailsabout the rule.
Monitor, or KPI, icon( ), which indicates that one or more KPIs (monitors) are associatedwith the item.
Process Analytics icon ( ), which indicates that process analytics information is availablefor an item.
Six Sigma icon ( ), which indicates that Six Sigma error related information is available foran item.
Diagnosis trend icons,which indicate that Optimize made a trending diagnosis for the item.For example, indicates that data samples remain in an upward trend.
Business process and system tree icons,which indicate whether a tree node is a monitor, aprocess, or a step and let you expand or collapse nodes beneath a business process or systemtree. For example:
This category also includes an icon that indicates whether Six Sigma process improvementinformation is available for a process. See “Six Sigma Icon” on page 187. Note that business processicons are specific to Optimize for Process.
Some Optimize pages contain graphs that plot data points over a period of time. You can rest themouse pointer on any data point to view the numeric value of that reading.
Status Icons
For business processes, KPIs, applications, and equipment components, status icons identifywhether these items are in compliance, out of compliance, or statistically abnormal. For processinstances, these icons identify whether process steps are executing normally or with errors.
The icons appear to the left of a tracked item.
The following table explains the meaning of the status icons.
184 webMethods Optimize User's Guide 10.7
A Optimize Icons

Meaning for process statusMeaning for rule compliance andstatistical diagnosis
Icon
The step executed normally.The item is in compliance (normal status)and is statistically normal. The item hasnot violated a rule.
An error occurred during the execution of aprocess step.
The item is out of compliance and hasviolated a rule.
On the Process Instances page, you can restthe mouse pointer on this icon to see a list ofall errors that occurred for the process.
A warning occurred during the execution ofa process step.
The item is statistically abnormal.
On the Process Instances page, you can restthe mouse pointer on this icon to see a list ofall warnings that occurred for the process.
No data is available.No data is available.
On the Process Instances page, this iconindicates that the step has not yet executed.
Rule Icons
Rule icons indicate whether a rule exists for a monitored item and whether the rule has beenviolated. You can view details about the rule by clicking the icon. If there is a customer associatedwith the rule, the customer name displays when you position the mouse pointer over the icon.
The following table explains the meaning of the rule icons.
MeaningIcon
One or more rules are associated with this item.
If more than one rule is associated with this item, clicking this icon displays the RuleSummary page identifying all of the rules associated with this item.
If only one rule is associated with this item, clicking this icon displays the Rule Detailpage containing details about the rule.
A rule violation exists for one or more rules associated with this item.
If more than one rule is associated with this item, clicking this icon displays the RuleSummary page identifying the rules associated with this item.
If only one rule is associated with this item, clicking this icon displays the Rule Detailpage containing details about the rule violation.
webMethods Optimize User's Guide 10.7 185
A Optimize Icons

MeaningIcon
One or more rules associated with this item has been disabled.
SLA Rule Icons
SLARule icons identify rules that are related to Service Level Agreements, and they have a distinctappearance so that they can be easily distinguished from other rule icons. If there is a customerassociated with the rule, the customer name displays when you position the mouse pointer overthe icon.
The following table explains the meaning of the SLA Rule icons.
MeaningIcon
One or more SLA rules are associated with this item.
If more than one rule is associated with this item, clicking this icon displays the RuleSummary page identifying all of the rules associated with this item.
If only one rule is associatedwith this item, clicking this icon displays the Rule Detailpage containing details about the rule.
A rule violation exists for one or more rules associated with this item.
If more than one rule is associated with this item, clicking this icon displays the RuleSummary page identifying the rules associated with this item.
If only one rule is associatedwith this item, clicking this icon displays the Rule Detailpage containing details about the rule violation.
One or more SLA rules associated with this item has been disabled.
Monitor/KPI Icon
The Monitor/KPI icon indicates that KPI summary or KPI instance detail information is availablefor an item.
The following table explains the meaning of the Monitor/KPI icon.
MeaningIcon
Monitor, or KPI, information is available for this item. Click the icon to display thisinformation.
If more than one monitor (KPI) is associated with this item, the KPI Summary pagedisplays containing a summary of all monitors (KPIs).
186 webMethods Optimize User's Guide 10.7
A Optimize Icons

MeaningIcon
If only one monitor is associated with this item, KPI instance detail information isavailable. Click the icon to display the KPI Instance Detail page containing thisinformation.
Process Analytics Icon
The Process Analytics icon indicates that process analytics information is available for an item.
The following table explains the meaning of the Process Analytics icon.
MeaningIcon
Process Analytics information is available for this item. Click the icon to display theProcess Analytics page for the process.
Six Sigma Icon
The Six Sigma icon indicates that detail information is available for an item.
The following table explains the meaning of the Six Sigma icon..
MeaningIcon
Six Sigma information is available for this item. Click the icon to display thisinformation on the Improve (Six Sigma) page.
Diagnosis Trend Icons
Optimize performs a diagnosis on all monitors associated with a KPI, according to the collectioninterval specified when the KPI was created. You can use this information to watch for trends inperformance and to help determine ways to improve processes and system components thatcontinue to perform outside of their normal range.
You can rest themouse pointer on these icons on anyOptimize page to display a short description.
The following table explains the meaning of the Diagnosis Trend icons.
MeaningDescriptionIcon
Last summarized data sample collected is between one andthree standard deviations above the historical mean for thecurrent statistical interval.
Staying Above Mean
webMethods Optimize User's Guide 10.7 187
A Optimize Icons

MeaningDescriptionIcon
Last summarized data sample collected is between one andthree standard deviations above normal for the currentstatistical interval.
Above Normal
Rate of change between the last and previous summarizeddata samples collected is between one and three standarddeviations above normal for the current statistical interval.
Slope Above Normal
Last data point or summarized data sample collectedrepresents an upward trend.
Staying in Upward Trend
Last summarized data sample collected is between one andthree standard deviations below the historical mean for thecurrent statistical interval.
Staying Below Mean
Last summarized data sample collected is between one andthree standard deviations below normal for the currentstatistical interval.
Below Normal
Rate of change between the last and previous summarizeddata samples collected is between one and three standarddeviations below normal for the current statistical interval.
Slope Below Normal
Last data point or summarized data sample collectedrepresents a downward trend.
Staying in DownwardTrend
Analytics Overview Icons
Analytics Overview icons appear on theAnalytics Overviewpage to expand or collapse tree nodesand to indicate whether a node is a KPI, a process, or a step.
The following table explains the meaning of the Analytics Overview icons.
MeaningIcon
Expand (show) nodes beneath the tree.
Collapse (hide) nodes beneath the tree.
The node is a KPI
The node is a KPI instance.
The node is a dimension of a KPI.
The node is a tracked process instance.
The node is an process instance.
The node is a step in a process.
188 webMethods Optimize User's Guide 10.7
A Optimize Icons

MeaningIcon
On the Problems page, this icon indicates that Six Sigma process improvementinformation is available for a process. Click the icon to view this information.
Detailed information is available for a process instance or process step. Click the iconto display a list of process instances associated with an item that is out of compliance.
webMethods Optimize User's Guide 10.7 189
A Optimize Icons

190 webMethods Optimize User's Guide 10.7
A Optimize Icons

B Glossary
alert
1. A notification triggered by a rule violation. Rule violation alerts can take the form of e-mailmessages, or you can specify SNMP alert actions or Web service alert actions.
2. In anOracle database environment, a notification triggeredwhen theOracle purge operationcompletes or encounters an error.
analysis engineAn Analytic Engine component that runs algorithms on business, system, and process data.
Analytic EngineAn Optimize core function that handles the following tasks:
Receives business, system, and process data from Infrastructure Data Collector.
Analyzes the data.
Saves the data and the analysis in the database.
Sends information about the status of business and system activity to theMywebMethodsuser interface.
Performs other actions when problems occur, such as sending alerts to specified users.
APIApplication programming interface.
applicationA webMethods program such as Integration Server running on a system component in yourenvironment.
assetA container object with connection data. Previously called an object.
BAMBusiness Activity Monitoring. BAM allows you to analyze real-time information about theperformance of your business, including the volume of business activity and its responsiveness,serious errors that may have occurred, and other KPIs. Using this actionable data, you caneliminate problems and take advantage of business opportunities.
BAM-only process
webMethods Optimize User's Guide 10.7 191

See externally-executed process.
base ruleA rule. The term base rule is used to distinguish a rule from a rule instance.
BPELBusiness Process Execution Language.
BPMBusiness Process Management.
BPM-only processSee webMethods-executed process.
Broker (deprecated)
1. An entity that resides on a Broker Server (deprecated). When a client connects to a BrokerServer (deprecated), the client specifies the Broker (deprecated) with which it wants tointeract.
2. See webMethods Broker (deprecated).
Broker Server (deprecated)The run-time component of webMethods Broker (deprecated) with which publishers andsubscribers interact. It performs the communication-related work of receiving client requests,dispatching requests to the requested resource, and returning responses to clients.
business dataData that make up a business process, such as revenue and order number.
business KPIAKPI created by a user tomonitor business process data. For example, users can create businessKPIs to monitor Revenue by Customer. A business KPI differs from an intrinsic KPI, which iscreated by Optimize.
business processA series of interrelated business tasks that are performed in a specific order, using an associatedset of business rules; and by multiple systems, people, and partners. Examples of businessprocesses within a corporation might include the following procedures:
Preparing for a new employee.
Handling a purchase order.
Bringing a product from inception to market.
Delivering a timely and accurate invoice.
Enabling Vendor Managed Inventory.You canmonitor two types of processes fromMywebMethods: awebMethods-executed processor an externally-executed process.
business process management
192 webMethods Optimize User's Guide 10.7
B Glossary

The ability to define, implement, manage, analyze, and optimize business processes, whichincludes interactions between systems within your own corporation (e.g., applications andinformation stores), people in your corporation, and external business partners.
business process treeA listing of business process components with branches and nodes that are displayed on theAnalytics Overview page in Optimize.
Business VisualizationA set of Optimize analysis functions that present business data as images. Business Visualizationprovides users with actionable data by highlighting patterns and trends in business processesand key performance indicators (KPIs).
calculation typeOne of the following five methods for data aggregation: sum, average, count, last value, min,max, and state.
CDCCommonDatabaseConfiguration. Platform containing thewebMethods database components.
CCSCentral Configuration System. See Central Configurator.
Central ConfiguratorA webMethods tool that provides a graphical user interface for configuration, enabling you toconfigure your installation in a central location without manually editing configuration files.
composite KPIAKPI that performs a mathematical operation (add, subtract, multiply, or divide) on two otherKPIs. For example, if individual KPIs monitor a product's operating costs and revenue, acomposite KPI can monitor the product's profit by subtracting the operating cost KPI from therevenue KPI.
containerA set of steps that comprise a subprocess within a business process. Subprocess containers canbe nested one within another.
control flowA transition that moves data directly from one step to another through the execution of anautomated business process.
custom errorAn error that originates in an external system. Examples of custom errors include applicationfailure and database failurewhen the application or database is external to the system.A customerror can occur at either the process or step level.
data aggregationThe process of combining individual data values into summarized data values. To measure therevenue in dollars generated by the order management process, a Total Order Revenue KPImight sum the dollar amounts of orders received during a ten-minute data collection interval.
data collection intervalA time interval during which Optimize collects data for a KPI.
webMethods Optimize User's Guide 10.7 193
B Glossary

database componentA grouping of database objects deployed as a single or set of database SQL scripts. It is thelowest-level grouping of a set of scripts. A database component is defined by a databasecomponent definition file.
database component definitionAn XML file that defines all the information related to a specific database component. Eachdatabase component has one and only one XML file.
database connection poolA collection of pre-established connections to a database. A database connection pool avoidsthe overhead involved inmaking a newdatabase connection every time an application or serverrequires access to the database.
DCAData collection agent.
DCCDatabaseComponentConfigurator. A Java programused to install database components foundin the Common Database Configuration (CDC) platform by executing SQL commands over aJDBC connection. This includes creation, removal, andmigration of database components. Thisprogram replaces the Database Component Installer (DCI).
DCIDatabase Component Installer. This program has been replaced by the DCC (DatabaseComponent Configurator).
defectA failure to meet a business rule (that is, a rule violation).
derived nameA user-defined name applied to all instances of a rule. If a derived name is specified in the RuleInformation settings for the rule, all instance nameswill be derived from this name.Use variablesin the derived name definition to keep all instances of the rule from having the same name.
destination stepA destination step relates to wait-time standardized error types. For a complete description,see wait-time standardized error type.
dimensionA category, or a way to analyze business data or system data by slicing the data into smallercomponents. Organizations define their own dimensions. Typical examples of dimensions arecustomer, region and sales person, product and manufacturer, and Broker Server and Broker.
dimension hierarchy (formerly KPI hierarchy)See hierarchy.
discoveryA collection of instructions used by the Infrastructure Data Collector to discover assets.
display intervalThe displayed aggregation interval used on KPI Instance graphs. Data is aggregated to thedisplay interval to accommodate larger time frames on the graph.
194 webMethods Optimize User's Guide 10.7
B Glossary

environmentA grouping of webMethods product components that share common configuration settings. Adefault Optimize environment contains the following logical servers:
An Analytic Engine
A Web Service Data Collector
A webMethods Broker (deprecated) or Universal Messaging
A My webMethods ServerYou can use Central Configurator to set up and configure an environment.
event
1. A simple structure containing a set of data attributes.
2. In Business Visualization, a rule violation.
event handlerAn Analytic Engine component that receives business data and system data from the WebService Data Collectors and other webMethods products. The Analytic Engine writes this datato the database in a format that business intelligence software can use to generate reports.
event mapThe knowledge ofwhat each attribute in an event (definition 1)means. An eventmap associatesbusiness data, such as dimensions, with a particular business process.
event ruleA rule that evaluates data as it is collected rather than waiting until the end of a KPI datacollection interval. An event rule takes dimensions into account, tracks its state of compliance,and persists in the database. In general, event rules evaluate data in situations that requireimmediate response. For example, an event rule might track whether an application hasunexpectedly shut down.
externally-executed processAbusiness process that ismodeled andmonitored usingwebMethods-provided tools; however,the process is executed by an external application. Compare to webMethods-executed process.
global dataNo longer applicable. Global data was deprecated in Optimize version 7.1.2.
hierarchyIn Optimize, an ordered ranking of dimensions. A hierarchy provides additional ways to slicedata into smaller components. For example, a sales hierarchymight consist of the twodimensionsof region and salesperson. As another example, a queue-length hierarchy might consist of thetwo dimensions of Broker Server and Broker.
infrastructureA set of system components (Integration Server, Broker, SNMP agents).
Infrastructure Data Collector
webMethods Optimize User's Guide 10.7 195
B Glossary

ABAMcomponent thatmonitors the system and operational data associatedwithwebMethodsrun-time components, such as Integration Servers, Broker Servers, Brokers, and adapters, andreports the status of these components on Optimize for Infrastructure or other external tools.
Integration ServerSee webMethods Integration Server.
intrinsic KPIAKPI created by Optimize to monitor business process or system data. For example, Optimizecreates KPIs to monitor Instance Count by Process, Cycle Time by Process, and Process ErrorCount.
KPIKey performance indicator. Ameasurement of a business activity that is important to the successof an organization. KPIsmonitormetrics, quantitative business and systemdata, such as revenue,volume of orders, queue length, and cycle time. KPIs help answer questions such as, “Howmany orders over $10,000 are stuck in this process?” A KPI defines a way to aggregate event(definition 1) data.
Note:InOptimize, KPIs (more specifically, KPI instances) are sometimes referred to as “monitors.”
KPI definitionThe characteristics of a KPI, as distinct from a KPI instance.
KPI instanceAmeasurement of one slice of business data or system data. A Total Order Revenue KPI, whichis not sliced by dimensions, has one KPI instance. A Revenue by Customer KPI, which slicesrevenue by the customer dimension, has multiple KPI instances. With a Revenue by CustomerKPI, each KPI instance measures revenue for an individual customer. A Revenue by Regionand Sales Person KPI, which slices revenue by a sales hierarchy with two dimensions (regionand sales person), hasmultiple KPI instances. For the Revenue by Region and Sales Person KPI,each KPI instance measures revenue for an individual sales person within a specific region.
KPI ruleA rule that evaluates data over one or more KPI data collection intervals. For example, a GrossMargin Percent Severely Below Normal rule might specify that the gross margin percentagemust not go more than one sigma below the average Gross Margin KPI value for threeconsecutive Gross Margin KPI collection intervals. A KPI rule takes dimensions into account,tracks its state of compliance, and persists in the database.
LDAPLightweightDirectoryAccess Protocol. An Internet protocol for accessing information directoriescontaining names, phone numbers, addresses, etc. It allows client programs to query LDAPdirectory servers about entries using their attributes.
logical serverA representation of a webMethods product component. Each logical server containssubcomponents that can be configured using the Central Configurator tool. During theenvironment configuration process, each logical server is mapped to one or more physicalservers.
mashup196 webMethods Optimize User's Guide 10.7
B Glossary

AWeb application that integrates content frommultiple sources into a seamless user experience.
measure (formerly fact)A metric with a set of attributes including a unit of measure and a calculation type.
message flowA transition that sends a message from one step to another. For example, a message flowmightsend a message from a step in an internal business process to a step in an external businessprocess.
modelA visual overview diagram of an entire business process. Business process models are createdin Software AG Designer or other external tools.
monitor
1. A KPI instance.
2. The mechanism Optimize uses to store data for a KPI instance.
MonitorSee webMethods Monitor.
monitor repositoryThe total number of monitors and the current queue size of the Analytic Engine. A large queuesize might indicate that the Analytic Engine is attempting to process too much data.
monitored componentA system component monitored by Infrastructure Data Collector.
monitoring APIAn interface to Optimize that provides a standardizedmeans for loadingmonitor, process, andmetadata into Optimize's Analytic Engine within the webMethods product suite.
My webMethodsAWeb-based monitoring and administration user interface for managing all products in awebMethods integration environment. When you log in to My webMethods, you are loggingin to all webMethods products that are incorporated into My webMethods.
My webMethods ServerThe core set of components and services required to host the Web interface for webMethodsproducts including Optimize. Formerly known as Portal.
OptimizeSee webMethods Optimize.
Optimize for InfrastructureABAMcomponent that enables you to access the resource information collected by InfrastructureData Collector. You useOptimize for Infrastructure tomonitor the status of individualmanagedobjects as well as the overall status of your system.
Optimize for ProcessABAMcomponent thatmonitors business processes, in addition tomanaged objects and systemstatus, by tracking KPIs that relate to operational factors such as margin, revenue, customer
webMethods Optimize User's Guide 10.7 197
B Glossary

satisfaction, and inventory levels. Optimize for Process enables you to use Six Sigma on yourbusiness processes. Optimize for Processmeasures the number of defects in a process and helpsyou systematically determine how to eliminate them. Optimize for Process includes BusinessVisualization tools that provide at-a-glance mashups of Optimize monitoring information.
Pareto principleA principle that states that the majority of defects (80 percent) are caused by a few (20 percent)vital components.
pipeline dataData available onlywithin a given process, rather than retrieved fromor sent to external sources.Specifically, pipeline data is all information (documents and other data types) that is availableto any given step because that data was introduced upstream in the process.
pool
1. A set of associated steps in a business process. A pool of steps represents either an internalprocess or an external process.
2. See database connection pool.
portletInterchangeable user interface components that are managed and displayed in a Web portal.Portlets produce fragments of markup code that are aggregated into a portal page. Typically aportal page is displayed as a collection of non-overlapping portlet windows,where each portletwindow displays a portlet. Hence, a portlet (or collection of portlets) resembles a Web-basedapplication that is hosted in a portal.
Process AnalyticsAn Optimize function that helps users analyze information about the performance of businessprocesses and rules.
process errorAnerror that originateswithin a business process and applies to the process as awhole. Examplesof process errors include processes that timed out before they completed successfully as wellas processes that completed with errors.
process eventAn event that specifies what should happen when an external process encounters a particularsituation. For example, if a process contains a manual review step and the system determinesthat the data it receives in that step is corrupt, a process event might cause Optimize to stopanalyzing the process.
process instanceAn execution of a business process. In an order process, each order that goes through the stepsin the process is a process instance.
Process TrackerAn Analytic Engine component that receives business process data from the Web Service DataCollectors and other webMethods products, and tracks the state of executing processes. As aprocess executes, the Process Tracker takes measurements about the process instance and itssteps, such as wait time and cycle time. This information can be used to track performance of
198 webMethods Optimize User's Guide 10.7
B Glossary

a business process or to alert youwhen certain conditions exist, such as performance degradationor a failure in process execution.
referenced subprocessA separate subprocesses that displays as a step within its parent process but is not part itsworkflow.
reminder intervalThe number of minutes between alerts. If you want alerts specified for a rule to be repeated,specify this interval in the Attributes settings for the rule.
ruleA condition or set of conditions you apply to a process or to a type of data. You can create arule to notify youwhen a process or resource becomes problematic and requires user attention.You can also create a rule to notify you when a business opportunity exists. Optimize supportsthe following two types of rules: KPI rules, event rules, and threshold rules.
rule evaluation intervalThe number of consecutive intervals for which a rule must evaluate to true before Optimizewill consider the rule to be violated. For example, if you are writing a rule to detect when aqueue length is trending toward being too large, you might specify that Optimize should notconsider the rule violated unless the queue length trends upward for five intervals.
rule expressionA logical expression contained in a rule. A simple expression tests a single condition; a complexexpression tests two ormore conditions.Optimize evaluates the expression to determinewhetherit is true or false. If the expression evaluates to true, Optimize generates a rule violation.
rule filterA filter that identifies specific processes, dimensions, or system objects that a rule shouldmonitor.
rule instanceAn occurrence of a rule. For example, a rule specifies that revenue by region requires attentionwhen the revenue drops below $10,000 over a 12-hour period. One instance of that rule occursduring the process of monitoring revenue for a specific region at each 12-hour period.
rule violationA rule instance that meets the conditions specified by a rule. Under these conditions, a businessprocess or system resource requires user attention, either because a problem has occurred orbecause an opportunity exists.
rules engineAn Analytic Engine component that compares the data it receives from the Analytic Engine torules that detect when a process or resource requires user attention.
severityAuser-defined text field associatedwith a rule. If text is entered into this field, that text appearswith the rule in the rule list, and any alerts generated for that rule can be configured to displaythe severity text.
Six SigmaAdisciplinedmethodology for improving business process performance by eliminating defects.
webMethods Optimize User's Guide 10.7 199
B Glossary

SLAService Level Agreement. An agreement between two parties on the level of service to beprovided.
SNMPSimple Network Management Protocol. A protocol for monitoring and controlling networkdevices. It has nearly universal use in TCP/IP networks.
SNMP alertA user-configured SNMP message sent to a defined SNMP manager upon a rule violation.
SNMP data collectorAcomponent of InfrastructureData Collector specifically configured to collect operational datafrom defined SNMP Agents.
SOAPSimple Object Access Protocol.
source stepA source step relates to wait-time standardized error types.
SQLStructuredQuery Language.Adatabase query language that interfaceswith relational databases.
Standardized errorUser-definedprocess error tracked byOptimize. Standardized errors use built-in error conditionsthat can be configured in the Add Standardized Error page error builder.
statistical intervalThe time range for historical average KPI values.
stepThe basic unit of work in a business process. A step can represent an automated process, amanual step performed by a person, or a visual aid that identifies a task that an externalorganization performs.
Step Absolute Wait TimeSee wait-time standardized error type.
step errorAn error that applies to a step within a business process. Examples of step errors includeduplicate step processing, step timeouts, and steps executed out of sequence.
Step Relative Wait TimeSee wait-time standardized error type.
sticky ruleA rule that when violated does not return to compliance until the rule is manually resolved.You can make a rule sticky to signal a serious violation that requires user attention to remedythe situation. For example, if you create a rule to detect that a Broker Server is offline, definingthe rule as sticky causes the alert to occur once and the rule to remain in violation until theserver is restarted and the rule is resolved.
subprocess
200 webMethods Optimize User's Guide 10.7
B Glossary

A process within another business process. The steps within a subprocess are often groupedwithin a container. The subprocess is treated like a step within the process that contains it.
swarm lineA transition that shows the relative volume of process instances traveling down a path in abusiness process. The number of dots in the swarm line indicates the relative volume movingalong the transition.
swimlaneA set of associated steps within a pool.
system componentAny item of information technology (IT) infrastructure equipment in your environment thatcan be monitored.
system dataData about equipment or applications, such as queue length andwhether amanaged componentis online or offline.
system errorBuilt-in error that is automatically associated with a process by Process Tracker.
system KPIA KPI created by a user to monitor system data. For example, users can create system KPIs tomonitor Integration Server Total Memory. A system KPI differs from an intrinsic KPI, whichis created by Optimize.
system treeA listing of system components with branches and nodes that is displayed on the AnalyticsOverview page in Optimize.
threshold ruleA rule that evaluates data as it is collected (for example, queue size greater than 1000 or orderamount less than $500). A threshold rule does not take dimensions into account, does not trackits state of compliance, and does not persist in the database. A threshold rule is like a triggerthat produces an alert.
transitionThe flow of data and control from one step to another in a business process. The two basic typesof transitions are control flow and message flow.
transaction(In an event map) An attribute that you do not want to measure but would like to store in thedatabase to use in a rule expression or to associate with a fact that arrives with the same event.
trendIn Optimize, one of 16 different types of diagnoses (above normal, below normal, staying inupward trend, staying in downward trend, etc.) on all KPI instances over theKPI's data collectioninterval. You can use this information towatch for trends in performance and to help determineways to improve business processes and system components that continue to perform outsidetheir normal range.
wait-time standardized error type
webMethods Optimize User's Guide 10.7 201
B Glossary

Wait-time error types are intended for configuring errors related to the time that elapses leadingto the start of a specified step in a process instance (the destination step). Wait-time error typesare always applied to the destination step. The two available wait-time error types are StepRelative Wait Time and Step Absolute Wait Time. A Step Relative Wait Time error type relatesto the time that elapses between the completion of one step in a process instance (the sourcestep) and the start of a subsequent, specified step in that same process instance (the destinationstep). A StepAbsoluteWait Time error type relates to the time that elapses between the beginningof a process instance and the start of a specified step in that process instance.
Web servicesSelf-contained applications that exchange data over theWeb or another network and are basedon open standards such as SOAP, TCP/IP, HTTP, Java, and XML.
Web Service Data CollectorAlso referred to as WSDC. An interface to Optimize through which client programs can sendany of the following information:
Process and operational data about applications or IT equipment in your enterprise, suchas databases, printers, or disk drives.
Process data, such as the start and end time of each step in process instances.
Business data, such as customers, order quantities, and revenues.
Web services layerAn Analytic Engine component that sends the results of the analysis to the My webMethodsServer. The My webMethods user interface presents the results, along with icons that indicatethat a rule violation has occurred or that Optimize has diagnosed a trend.
webMethods Broker (deprecated)The deprecated “message backbone” product in awebMethods integration environment. Broker(deprecated) facilitates asynchronous, message-based communication using thepublish-and-subscribe model.
webMethods Integration ServerThe central run-time product in a webMethods integration environment. Integration Serverprovides an environment for the orderly, efficient, and secure execution of business processesand services.
webMethods MonitorAn administrative tool used to examine instances of running or completed business processes,services, integrations, anddocuments.Monitor allows you to viewdata about business processes,services, and documents that other webMethods products have previously logged.
webMethods OptimizeThe Business Activity Monitoring (BAM) product in a webMethods integration environment.Optimize facilitates real-time insight into key business process and system resource activities,and provides actionable information that enables business users to make informed decisions,quickly address problems, and enhance business operations through continuous processimprovement.
webMethods-executed process
202 webMethods Optimize User's Guide 10.7
B Glossary

A business process that is modeled, executed, and monitored using webMethods-providedtools. Compare to externally-executed process.
WSDCSee Web Service Data Collector.
XMLExtensibleMarkup Language. A flexiblemarkup language for structuring, storing, and sendinginformation.
webMethods Optimize User's Guide 10.7 203
B Glossary

204 webMethods Optimize User's Guide 10.7
B Glossary