
Analysis of task-evoked systemic interference in fNIRS measurements: insights from fMRI
15
Analysis of task-evoked systemic interference in fNIRS measurements: Insights from fMRI Sinem B. Erdoğan a, ⁎, Meryem A. Yücel b , Ata Akın c a Institute of Biomedical Engineering, Bogazici University, Kandilli, 34684 Istanbul, Turkey b Athinoula A. Martinos Center for Biomedical Imaging, Department of Radiology, Massachusetts General Hospital, Harvard Medical School, Charlestown, MA, USA c Department of Genetics and Bioengineering, Istanbul Bilgi University, 34060 Istanbul, Turkey abstract article info Article history: Accepted 12 October 2013 Available online 19 October 2013 Keywords: Hemodynamic response Systemic interference Functional near infrared spectroscopy Magnetic resonance imaging Physiological artifact removal Cognitive task Functional near infrared spectroscopy (fNIRS) is a promising method for monitoring cerebral hemodynamics with a wide range of clinical applications. fNIRS signals are contaminated with systemic physiological interferences from both the brain and superficial tissues, resulting in a poor estimation of the task related neuronal activation. In this study, we use the anatomical resolution of functional magnetic resonance imaging (fMRI) to extract scalp and brain vascular signals separately and construct an optically weighted spatial average of the fMRI blood oxygen level-dependent (BOLD) signal for characterizing the scalp signal contribution to fNIRS measurements. We introduce an extended superficial signal regression (ESSR) method for canceling physiology-based systemic interference where the effects of cerebral and superficial systemic interference are treated separately. We apply and validate our method on the optically weighted BOLD signals, which are obtained by projecting the fMRI image onto optical measurement space by use of the optical forward problem. The performance of ESSR method in removing physiological artifacts is compared to i) a global signal regression (GSR) method and ii) a superficial signal regression (SSR) method. The retrieved signals from each method are compared with the neural signals that represent the ‘ground truth’ brain activation cleaned from cerebral systemic fluctuations. We report significant improvements in the recovery of task induced neural activation with the ESSR method when compared to the other two methods as reflected in the Pearson R 2 coefficient and mean square error (MSE) metrics (two tailed paired t-tests, p b 0.05). The signal quality is enhanced most when ESSR method is applied with higher spatial localization, lower inter-trial variability, a clear canonical waveform and higher contrast-to-noise (CNR) improvement (60%). Our findings suggest that, during a cognitive task i) superficial scalp signal contribution to fNIRS signals varies significantly among different regions on the forehead and ii) using an average scalp measurement together with a local measure of superficial hemodynamics better accounts for the systemic interference inherent in the brain as well as superficial scalp tissue. We conclude that maximizing the overlap between the optical pathlength of superficial and deeper penetration measurements is of crucial importance for accurate recovery of the evoked hemodynamic response in fNIRS recordings. © 2013 Elsevier Inc. All rights reserved. Introduction Functional near infrared spectroscopy (fNIRS) is a non-invasive imaging technique that utilizes near-infrared light for monitoring hemodynamic changes associated with evoked brain activity (Franceschini and Boas, 2004; Gibson et al., 2005; Obrig and Villringer, 2003). Over the past 15 years, fNIRS has become a complementary and alternative technique to functional magnetic resonance imaging (fMRI) with a high potential of use for clinical studies, cognitive, behavioral and neuroscience research (Boas and Dale, 2005; Lloyd-Fox et al., 2010; May et al., 2011). The advantages of fNIRS for studying brain activation include cost efficiency, possibility of use at the bedside, good temporal resolution, measurement of both oxy- (HbO) and deoxyhemoglobin (HbR) and use of non-ionizing radiation while the limitations include modest spatial resolution, lack of absolute quantification in continuous wave systems and limited penetration depth (Boas et al., 2004; Villringer and Chance, 1997). A major concern with fNIRS measurements is the presence of strong spontaneous fluctuations or physiology-based systemic interferences in the signal due to cardiac pulsation (around 1 Hz), respiration (around 0.2 to 0.3 Hz) and a variety of spontaneous low frequency oscillations (LFOs) occurring in the range of 0.01–0.1 Hz (Obrig et al., 2000; Payne et al., 2009; Toronov et al., 2000). LFOs include the spontaneous oscillations in local vascular tone known as vasomotion (Gustafsson, 1993; Mayhew et al., 1996) and the systemic oscillations in arterial NeuroImage 87 (2014) 490–504 ⁎ Corresponding author at: Institute of Biomedical Engineering, Bogazici University, Kandilli Kampusu, Cengelkoy, Istanbul, Turkey. Fax: +90 216 516 3479. E-mail addresses: [email protected], [email protected] (S.B. Erdoğan). 1053-8119/$ – see front matter © 2013 Elsevier Inc. All rights reserved. http://dx.doi.org/10.1016/j.neuroimage.2013.10.024 Contents lists available at ScienceDirect NeuroImage journal homepage: www.elsevier.com/locate/ynimg
-
Upload
hms-harvard -
Category
Documents
-
view
3 -
download
0
Transcript of Analysis of task-evoked systemic interference in fNIRS measurements: insights from fMRI
NeuroImage 87 (2014) 490–504
Contents lists available at ScienceDirect
NeuroImage
j ourna l homepage: www.e lsev ie r .com/ locate /yn img
Analysis of task-evoked systemic interference in fNIRS measurements: Insightsfrom fMRI
Sinem B. Erdoğan a,⁎, Meryem A. Yücel b, Ata Akın c
a Institute of Biomedical Engineering, Bogazici University, Kandilli, 34684 Istanbul, Turkeyb Athinoula A. Martinos Center for Biomedical Imaging, Department of Radiology, Massachusetts General Hospital, Harvard Medical School, Charlestown, MA, USAc Department of Genetics and Bioengineering, Istanbul Bilgi University, 34060 Istanbul, Turkey
⁎ Corresponding author at: Institute of Biomedical EnKandilli Kampusu, Cengelkoy, Istanbul, Turkey. Fax: +90
E-mail addresses: [email protected], berdoga
1053-8119/$ – see front matter © 2013 Elsevier Inc. All rihttp://dx.doi.org/10.1016/j.neuroimage.2013.10.024
a b s t r a c t
a r t i c l e i n f oArticle history:Accepted 12 October 2013Available online 19 October 2013
Keywords:Hemodynamic responseSystemic interferenceFunctional near infrared spectroscopyMagnetic resonance imagingPhysiological artifact removalCognitive task
Functional near infrared spectroscopy (fNIRS) is a promisingmethod formonitoring cerebral hemodynamicswith awide range of clinical applications. fNIRS signals are contaminated with systemic physiological interferences fromboth the brain and superficial tissues, resulting in a poor estimation of the task related neuronal activation. Inthis study, we use the anatomical resolution of functional magnetic resonance imaging (fMRI) to extract scalpand brain vascular signals separately and construct an optically weighted spatial average of the fMRI blood oxygenlevel-dependent (BOLD) signal for characterizing the scalp signal contribution to fNIRS measurements. Weintroduce an extended superficial signal regression (ESSR) method for canceling physiology-based systemicinterference where the effects of cerebral and superficial systemic interference are treated separately. We applyand validate our method on the optically weighted BOLD signals, which are obtained by projecting the fMRIimage onto optical measurement space by use of the optical forward problem. The performance of ESSR methodin removing physiological artifacts is compared to i) a global signal regression (GSR) method and ii) a superficialsignal regression (SSR) method. The retrieved signals from each method are compared with the neural signalsthat represent the ‘ground truth’ brain activation cleaned from cerebral systemic fluctuations.We report significantimprovements in the recovery of task inducedneural activationwith the ESSRmethodwhen compared to the othertwo methods as reflected in the Pearson R2 coefficient and mean square error (MSE) metrics (two tailedpaired t-tests, p b 0.05). The signal quality is enhanced most when ESSR method is applied with higherspatial localization, lower inter-trial variability, a clear canonical waveform and higher contrast-to-noise(CNR) improvement (60%). Our findings suggest that, during a cognitive task i) superficial scalp signalcontribution to fNIRS signals varies significantly among different regions on the forehead and ii) using anaverage scalp measurement together with a local measure of superficial hemodynamics better accountsfor the systemic interference inherent in the brain as well as superficial scalp tissue. We conclude thatmaximizing the overlap between the optical pathlength of superficial and deeper penetration measurementsis of crucial importance for accurate recovery of the evoked hemodynamic response in fNIRS recordings.
© 2013 Elsevier Inc. All rights reserved.
Introduction
Functional near infrared spectroscopy (fNIRS) is a non-invasiveimaging technique that utilizes near-infrared light for monitoringhemodynamic changes associated with evoked brain activity(Franceschini and Boas, 2004; Gibson et al., 2005; Obrig and Villringer,2003). Over the past 15 years, fNIRS has become a complementary andalternative technique to functional magnetic resonance imaging (fMRI)with a high potential of use for clinical studies, cognitive, behavioraland neuroscience research (Boas and Dale, 2005; Lloyd-Fox et al., 2010;
gineering, Bogazici University,216 516 [email protected] (S.B. Erdoğan).
ghts reserved.
May et al., 2011). The advantages of fNIRS for studying brain activationinclude cost efficiency, possibility of use at the bedside, good temporalresolution, measurement of both oxy- (HbO) and deoxyhemoglobin(HbR) and use of non-ionizing radiation while the limitations includemodest spatial resolution, lack of absolute quantification in continuouswave systems and limited penetration depth (Boas et al., 2004;Villringer and Chance, 1997).
A major concern with fNIRS measurements is the presence of strongspontaneous fluctuations or physiology-based systemic interferences inthe signal due to cardiac pulsation (around 1 Hz), respiration (around0.2 to 0.3 Hz) and a variety of spontaneous low frequency oscillations(LFOs) occurring in the range of 0.01–0.1Hz (Obrig et al., 2000; Payneet al., 2009; Toronov et al., 2000). LFOs include the spontaneousoscillations in local vascular tone known as vasomotion (Gustafsson,1993; Mayhew et al., 1996) and the systemic oscillations in arterial
491S.B. Erdoğan et al. / NeuroImage 87 (2014) 490–504
blood pressure known as Mayer waves which typically occur at 0.1Hz(Julien, 2006). Such systemic interferences are present in both thecerebral and superficial layers (i.e. scalp and skull) of the head andreduce the accuracy of fNIRS for detecting brain activation (Tian et al.,2011). The contribution of systemic interference to fNIRS signal isintensified due to the back reflection geometry of the measurements(i.e., light is both emitted and received at the scalp surface) whichincreases the sensitivity of fNIRSmeasurements to systemic oscillationsoccurring in the superficial scalp tissue. Besides, while blood flowwithin the brain is stabilized by partial autonomic neural control(Zhang et al., 2002), blood flow at the scalp tissue is not regulated bythis buffer mechanism and is influenced by systemic physiologicalchanges to a greater extent. The accurate identification and reliableelimination of the physiological noise embedded in the fNIRS signalscan improve the signal-to-noise ratio, and/or can enable the samesignal-to-noise ratio with a shorter stimulus period. This goal issignificant, as with decreased acquisition time and increased signalquality; larger subject populations including young children andhospitalized patients can be monitored in a shorter time while theeffects of fatigue and adaptation are minimized (Gregg et al., 2010;Saager et al., 2011).
Several methods have been proposed in the literature to reduce thesystemic interference in fNIRS signals. Low pass filtering is the mostcommonapplication, as it can effectively removehigh frequency systemicoscillations such as heart beat (Franceschini et al., 2003; Jasdzewskiet al., 2003). However, the frequency spectrum of physiology-basedsystemic interferences such as respiration, LFOs, and very low frequencyoscillations (VLFOs) significantly overlap with the frequency spectrum offunctional hemodynamic response to brain activation. Frequency-basedremoval of these interferences can therefore, distort the temporalcharacteristics of the recovered brain activity signal. Other methodsfor removing systemic interference include adaptive subtraction of acardiac waveform (Gratton and Corballis, 1995), direct subtraction ofa “nonactivated” fNIRS waveform (Franceschini et al., 2003), state spaceestimation (Diamond et al., 2006; Kolehmainen et al., 2003; Princeet al., 2003), wavelet filtering (Jang et al., 2009; Lina et al., 2008, 2010;Matteau-Pelletier et al., 2009) and principal components analysis(Franceschini et al., 2006; Zhang et al., 2005). There are also studiesinvestigating the partial optical path lengths via Monte Carlo simulationsof a layered human headmodel for multi-distancemeasurement set-ups(Umeyama and Yamada, 2009a,b; Yamada et al., 2009).
An extension to multi-distance measurement methods includes theuse of additional short source-detector (SD) distance (usually less than1 cm) channels together with typical long SD distance (about 3 cm)channels which are sensitive to both cerebral and extracerebral tissues.Short SD distance channel measurements probe superficial, extracerebraltissue only and aredominated byphysiology-based systemic interference.To isolate and extract brain specific hemodynamic changes, these shortSD distance channel measurements have been used to remove systemicinterference from the long SD distance channel measurements with theassumption that a common systemic interference is present in bothchannel measurements (Gagnon et al., 2012; Gregg et al., 2010; Saagerand Berger, 2005; Saager et al., 2011). Using multiple SD separations,an adaptive cancelation method has also been recently proposed andvalidated (Zhang et al., 2007a,b; Zhang et al., 2009). In contrast to thenecessity of using short SD distance measurements, superficial hemo-dynamics can also be estimated by exploiting the photon time-of-flight distribution in time-domain NIRS at the expense of high-costequipment (Aletti et al., 2012; Liebert et al., 2004).
Most of the above-mentionedmethods are based on the assumptionthat systemic interference in fNIRS measurements is spatially homoge-neous across the surface of the scalp. In the present study, we hypo-thesize that the spontaneous oscillations occurring in the brain tissuehave a spatially global distribution, while the systemic interferencecoming from superficial scalp tissue has a more pronounced andlocalization-dependent effect on the fNIRS measurements. We treat
both effects separately and propose an extended superficial signalregression method for canceling physiology-based systemic interferencethat is known to obscure the functional response to brain activation. Totest our hypothesis, we apply our method on an optically weightedspatial average of the fMRI blood oxygen level-dependent (BOLD) signalwhich is obtained by combining weighted contributions from each voxelthat coincide with the photon migration path. More specifically, for eachsubject and SD pair, once subject specific headmodels are obtained fromstructural MRI, photon-migration theory and Monte Carlo simulationsare used to estimate the spatial sensitivity profile of light absorptionchanges that occur within different anatomical compartments of thehead (as described in Boas et al., 2002). The overlap of this opticalsensitivity profile with the voxels in each tissue layer (i.e. scalp, skull,CSF, gray matter and white matter) provides a means of predicting aspatially weighted BOLD response as a hemodynamic correlate of thefNIRS signal.
We evaluate the efficacy of removing systemic interference thatoccurs both in the brain and at the scalp tissuewith our extended superfi-cial signal regression (ESSR) method and compare its performance ofphysiological noise removal to i) a superficial signal regression (SSR)method where only superficial scalp interference is removed and ii) aglobal signal regression (GSR) methodwhere it is assumed that systemicinterference across all measurements is spatially global as proposed bymost studies (Saager and Berger, 2005; Umeyama and Yamada, 2009b;Zhang et al., 2007a,b).
Although the data acquisition methods and signals in fNIRS and fMRIare different, it iswell known that bothmethods are sensitive to the samehemodynamic changes. A number of studies involving concurrent fNIRSand fMRI recordings have shown that during functional brain activation,there is a strong correspondence between the local hemodynamicresponses recorded by the two modalities (Huppert et al., 2006;Sassaroli et al., 2006; Steinbrink et al., 2006; Strangman et al., 2002;Toronov et al., 2001). Unlike fNIRS, fMRI has the advantage of probingbrain tissue independent of the overlying scalp and skull layers. Signalsfrom brain voxels are not mixed with superficial contamination butstill are subject to cerebral systemic fluctuations interfering the brainfunctional response. To date, there have been no studies that haveattempted to i) use scalp superficial interference measured by fMRI toconstruct a spatially weighted BOLD signal in which the true brainactivity is embedded and ii) test the performance of various interferencecancelation methods on such a hemodynamic correlate of the fNIRSsignal.
Background
Photon migration theory
Near infrared imaging of the brain is based on measuring spatio-temporal variations in light absorption of the tissues between a sourceand a detector. Light is injected at the surface of the scalp, travelsthrough extracerebral scattering tissues (i.e. scalp, skull and CSF) intothe brain and again is received at the surface of the scalp. The photonsemitted from the light source follow a statistical pattern and cross thescalp twice before being collected at the detector. In the wavelengthrange between 650 and 950nm, the dominant absorbent chromophoresare oxy- (HbO) and deoxyhemoglobin (HbR). Variations in the local con-centrations of HbO and HbR (denoted as [HbO] and [HbR] respectively)modulate absorption properties of the brain in a wavelength dependentmanner. The absorption coefficient at a given wavelength (λ) is linearlyrelated to [HbO] and [HbR] through the equation:
μa λð Þ ¼ εHbO λð Þ HbO½ � þ εHbR λð Þ HbR½ � ð1Þ
where εHbO(λ) and εHbR(λ) denote the wavelength dependent extinctioncoefficients of each chromophore (Strangman et al., 2003). A change inthese chromophore concentrations due to brain activation alters the

492 S.B. Erdoğan et al. / NeuroImage 87 (2014) 490–504
absorption coefficient and hence the detected light intensity. Accordingto the modified Lambert–Beer law (MBLL), a small change in absorptioncoefficient is related to the change in measured optical density by thefollowing formula:
ΔOD t;λð Þ ¼ − logΦ t;λð ÞΦ0 λð Þ
� �¼ Δμa t;λð ÞL λð Þ ð2Þ
where Φ(t,λ) is the average intensity of detected light, Φ0(λ) is theaverage intensity of incident light and L(λ) is the effective averagepathlength of light through the tissue (Arridge et al., 1992; Boas et al.,2004; Cope and Delpy, 1988; Delpy et al., 1988). The effective pathlengthis wavelength dependent but time-invariant when temporal absorptionchangeswithin the tissue are small. For a set of discrete volume elements(i.e., voxels) with each of them experiencing a different absorptionchange, the MBLL can be formulated as follows:
ΔOD t;λð Þ ¼XNvoxj¼1
Δμa; j t;λð ÞLi; j λð Þ ð3Þ
where Li,j(λ) is the effective pathlength of light for the ith measurementin the jth voxel (Boas et al., 2004). The spatial sensitivity profile of thephotons can be determined with knowledge of the complex distributionof absorption and scattering properties of the tissues by empiricalmethods such as Monte Carlo based modeling (Boas et al., 2002; Wangand Jacques, 1995; Wang et al., 1995). For each channel, Eq. (3) can bewritten in matrix form as
y λð Þ ¼ A λð Þ � δx λð Þ ð4Þ
where y represents the time-series of optical signal changes withrespect to baseline, δx(λ) represents the changes in absorptioncoefficient for each voxel, and A is a three-point Green's functionmatrixwhich describes the linear transformation from absorption changes ofthe underlying media to the measured optical signal change at eachchannel. The A matrix can be referred to as the ‘photon absorptionsensitivity profile’ describing the spatial distribution of light travelingfrom a particular source to a detector (Arridge, 1999), and usually hasa ‘banana-shape’ profile (a cross section of sensitivity profile is shownin Fig. 2).
Subjects and study design
fMRI data were collected from 18 healthy subjects during a mentalarithmetic task. 3 subjects were excluded due to excessive motionartifacts and the results for 15 healthy subjects will be shown here foranalysis (ten males aging 28.4 ± 3 and five females aging 28 ± 3.2).The study was approved by the Ethics Committee of Bogazici Universityand written informed consents were obtained from all subjects aftercomplete description of the study prior to the first session. DuringfMRI measurements, subjects were positioned supine and asked torefrain from excessive movements and stay motionless. Instructionsabout the protocol were given from a screen over the subject's head.Each session started with a 30 second rest followed by a stimulationblock of 39 s during which subjects were asked to serially subtract a2-digit number from a 3-digit number (e.g., 146–84) and this block wasfollowed by a 60 s of rest. This cycle was repeated 4 times. The arith-metic operations were displayed centrally in white color against ablack background on a screen over the subjects' head. To avoid headmovements, subjects were instructed to perform all tasks mentally,without vocalization or any movement of body.
fMRI data acquisition
A Philips 1.5 T MR system (Philips Systems, Best, The Netherlands)was used to acquire T1 weighted images using a gradient echo planar
imaging (EPI) sequence with repetition time (TR) = 3000 ms, echotime (TE)=50ms, flip angle=90°, matrix size=64×64, 30 axial slicesand voxel size=3.59mm×3.59mm×2mm. Structural scans were alsotaken from each subject using a T1 weighted magnetization-preparedrapid acquisition gradient echo (MPRAGE) sequence (0.9 mm ×0.9mm×1.2mmresolution) to perform segmentation and coregistration.A time series of 142 scans were collected for each subject.
fMRI data processingwas performed as follows: preprocessing stepsconsisting of motion and slice timing correction and temporal filteringwith linear trend removal were performed on functional scansusing SPM8 software (http://www.fil.ion.ucl.ac.uk/spm/, WellcomeDepartment of Imaging Neuroscience, UCL). The anatomical imagewas segmented into 5 tissue layers (gray matter, white matter, CSF,skull and scalp) and the segmented layers were unified to form a newanatomical image onto which the functional image is coregistered(Fig. 3).
The fNIRS probe (ARGES Cerebro, Hemosoft Inc., Turkey), for whichwe run photon migration simulations, contains 4 dual wavelength LEDlight sources and 10 photo-detectors arranged in a rectangular geometry.The sources and detectors are equidistantly placed on the probe with anearest source-detector separation of 2.5 cm. Only SD pairs withminimum distance were considered resulting in 16 channels. DuringfMRI measurements, we placed a sponge-like probe housing on eachsubject's forehead with all the LEDs and detectors removed and theirpositions replaced with vitamin E gel capsules to mark source anddetector locations on the MRI images (See Fig. 1).
Monte Carlo simulations of light transport in extra-cerebral and brain tissue
The forward matrix A (Eq. (4)) is a linear operator that projectsabsorption changes occurring at each volume element, to the measuredoptical signal between each SD pair. In our study, the A matrix is derivedfor each subject and channel and is used to estimate the contribution ofhemodynamic changes occurring at each voxel to the total signal changeobserved at each particular SD pair. This forward model was formerlyused to translate the hemodynamic changes observed within the fMRIspace to the hemodynamic changes observed in the opticalmeasurementspace in a study by Huppert et al. (2006).
We performedMonte Carlo simulations of light transport on subject-specific tissue segmented anatomical MR images with optical propertiestaken from Strangman et al. (2003). The absorption (μa) and scatteringcoefficients (μs) at 760 nm were taken as 0.0177/0.73 (scalp), 0.0125/0.93 (skull), 0.0021/0.01 (CSF), 0.0195/1.18 (GM), and 0.0195/1.18mm(WM). Anisotropy factor (0.9) and refract index (1.4) were assumedto be the same in all segmented tissues. The simulations were run bythe program named Monte Carlo eXtreme (Fang and Boas, 2009),provided to the public by the Photon Migration Imaging Laboratory atMassachusetts General Hospital (http://mcx.sourceforge.net/cgi-bin/index.cgi).
To characterize absorption and scattering processes on realistic headmodels, source anddetector positionswere determinedby identifying thelocation of vitamin E fiducial markers that were placed on the emptiedspots of the fNIRS probe prior to the MPRAGE scans. After registeringthe locations of sources and detectors, Monte Carlo simulations of lighttransport were applied to the segmented anatomical head modelsgenerated for each subject and SD pair as described in Boas et al.(2002). The optical properties of white matter were set to those of graymatter due to the fact that changes in white matter properties have anegligible effect on the results (Boas and Dale, 2005). For each sourceand detector position, the trajectories of 108 photons were simulated at760-nm in order to predict the spatial distribution of light travelingfrom a source position to a detector position. The spatial sensitivitymatrices were calculated only for the closest SD pairs. Fig. 2 illustratesthe spatial sensitivity profile of photon migration from a light source toa detector on an anatomical MRI image. The forward equation (Eq. (4))sums voxel-wise changes in fMRI-BOLD signal over the volume using

493S.B. Erdoğan et al. / NeuroImage 87 (2014) 490–504
the weights of the sensitivity matrix A to predict the measurementsbetween each source-detector pair.
fMRI projection
The absolute BOLD signal intensity changes measured from eachvoxel aremultiplied by the corresponding element of the optical forwardmatrix (A) projected onto the functional space. This is established byregistering the forward matrices obtained within the high resolutionanatomical image space to the lower resolution functional image space.Amaskwith an intensity of 1 for voxelswith an optical sensitivity greaterthan the threshold (taken as 60 dB signal loss of the maximum sensi-tivity) and zero elsewhere is formed for each SD pair. BOLD signalsfrom voxels within the intersection of this mask and scalp tissue arescaled with the corresponding optical weight and their summation isdenoted as optically weighted scalp BOLD signal under that SD pair. Thesame procedure with gray matter mask is followed to calculate theoptically weighted brain BOLD signal. Although we report results usingthe Green's function at 760 nm, the results were nearly identical whenoptical properties at 690 and 830nm were used.
Signal model
Most neuroimaging techniques employ a standard analysis offunctional brain activity signals with the assumption of a linear additionof hemodynamic changes (for further discussion, see Friston, 2007).BOLD signal from each SD pair contains the desired brain signal obscuredby physiological noise. We will refer to the spatially and optically
A
B
Fig. 1. (A) Location of fNIRS source and detectors on the constructed anatomical image.(B) Probe design. The fNIRS probe (ARGES Cerebro, Hemosoft Inc., Turkey) for which werun photon migration simulations contains 4 dual wavelength LED light sources and 10photo-detectors arranged in a rectangular geometry. The source and detectors areequidistantly placed on the probe with an SD distance of 2.5 cm. During fMRI measure-ments, a sponge probe housingwas placed on each subject's forehead with all the sourcesand detectors removed and their positions replaced with vitamin E gel capsules to marksource and detector locations on the MRI images.
weighted BOLD signal for each SD pair as ‘Sum’ signal and model it as:
YSUM¼ YBRAINþYSUPERFICIAL:
We investigated the possibility that the brain signal can be furtherdecomposed into two components: one related with task inducedneural activation (‘neural signal’) and one reflecting the effects of globalsystemic physiology (‘global signal’) occurring in the brain.Wemodeledbrain signal for each SD pair as YBRAIN=YNEURAL+YGLOBAL. Hence, thephysiological noise embedded in the Sum signal can be defined as
YNOISE¼ YSUPERFICIALþYGLOBAL:
Regressing the superficial and global components from the Sumsignalfor each SD pair should then, in principle, produce a more accuratemeasure of the task induced neural activation: YSUM−YNOISE=YNEURAL(Gregg et al., 2010). As an example, the contribution of superficial noiseregressor is removed by regression YR=YSUM−αYSUPERFICIAL where YRis the residual signal after noise removal and α≡ (YSUM · YSUPERFICIAL) /(YSUPERFICIAL · YSUPERFICIAL) is the scaling coefficient that minimizes theroot mean square of YR (Saager and Berger, 2008).
For each SD pair, an optically and spatially weighted sum of BOLDabsolute signal intensity changes taken from scalp voxels along thephoton migration path is used to construct a measure of hemodynamicchanges localized to the superficial tissue layers (YSUPERFICIAL) whereas anoptically and spatially weighted sum of BOLD absolute signal intensitychanges from brain voxels within the photon migration path is usedto construct a measure of hemodynamic changes occurring in thebrain (YBRAIN). We scale the optically weighted scalp BOLD signalswith a proportionality constant of 4/5 taking into consideration the
Fig. 2. Photon absorption sensitivity profile for an SD pair separated by 2.5 cm. For eachsubject, first a 3D realistic head model is generated, and then Monte Carlo simulations oflight propagation are performed to obtain the spatial sensitivity profiles. The contour overlayis shown in logarithmic scale and contours are presented for each order of magnitude. Thered star at the inset figure shows the location of this axial slice relative to the opticalprobe. The optically weighted Sum signal is obtained by multiplying BOLD activation ateach voxel with the corresponding element of the sensitivity matrix A.

Fig. 3. Processing steps for functional and anatomical data. The anatomical images are coregistered and segmented into a five-layered model (skin, skull, CSF and gray and white matter).This image is used to perform Monte Carlo simulations to determine the light propagation through the head. The sensitivity weights obtained for each voxel are then used to scale eachvoxel's data and sum them for gray matter and scalp masks separately.
494 S.B. Erdoğan et al. / NeuroImage 87 (2014) 490–504
fact that i) BOLD signals obtained from the scalp mainly arise fromintravascular signal changes, ii) they are affected in a more pronouncedmanner by the venous blood volume change rather than HbRconcentration change and iii) at a magnetic field strength of 1.5T withTE=50ms and assuming a venous oxygen saturation of 70%, the changein venous blood volumewith activation is estimated to contributewith aweight of ~4/5 to the total BOLD signal change observed in the scalptissue (the details are discussed in Physics and physiology of brain andscalp fMRI signals and their relation to tissue absorbance measuredwith fNIRS section). Prior to formation of the Sum signals, motionparameters obtained from the preprocessing step are regressed outfrom all scalp and brain signals for a fair test of the three regressionmethods.
For each subject and SD pair, we simulated a ‘short distance detector’placed close to the light sourcewith a SD distance of approximately 1cm.The position of each ‘short distance detector’was arranged to maximizetheoverlap between the corresponding 2.5cmdistance SDmeasurementand the simulated short distance channel measurement. We thendefined a region of interest (ROI) in the scalp tissue beneath the shortdistance detector and the source for each simulated short distancechannel. The fMRI signals extracted from the voxels in each scalp ROIwere averaged and denoted as ‘superficial signals’. The average of all
simulated superficial signals for each subject was denoted as ‘globalsignal’ and calculated as
G tð Þ ¼ 1N
XNn−1
Sn tð Þ ð5Þ
where G(t) is a column vector representing the global signal change,Sn(t) represents the superficial scalp signal change for the nth SD pairand N represents the total number of SD pairs for a subject (N=16).
We attempt to quantify whether regressing the global or superficialsignals alone is sufficient in retrieving the task induced neural signal. Toexplore the extent to which the Sum signal can be explained by thesuperficial signal, the Sum signalswere regressedwith the correspondingsuperficial signals for each subject. We call this method of eliminatingsuperficial noise ‘superficial signal regression’ (SSR). In the secondmethod, we regressed out the global signal from every Sum signal andcalled this method ‘global signal regression’ (GSR).
Last, we evaluate both SSR and GSR on Sum signals and name thismethod ‘extended superficial signal regression’ (ESSR). The residualtime series vi can be obtained by;
YSUM tð Þ ¼ G tð ÞS tð Þ½ �βþ vi tð Þ ð6Þ
495S.B. Erdoğan et al. / NeuroImage 87 (2014) 490–504
where YSUM(t) is the Sum data for a particular SD pair, G(t) and S(t)represent the global and superficial signals respectively, β is a vectorof regression coefficients and vi is the corresponding time seriesrecovered after the global and superficial systemic signals are removed.
Data analysis
The performance of each regression method is determined by i) thePearson correlation coefficient (R2) and ii) themean squared error (MSE)between task-related neural signal (neural) and the retrieved signal aftereach regression method. We also demonstrate the R2 and MSE metricsbetween brain signal and the retrieved signals for comparison. Theaverage of Pearson R2 coefficients was calculated after applying theFisher's r-to-z transformation and the resulting average is then backtransformed (Devore, 1995). R2 coefficient shows how well the twosignals co-vary independent of scale. Because this metric is not anindicator of how well the amplitude of the retrieved signal matchesthat of the neural signal, we also interpreted the MSE metrics.
To compare the quality of the signals retrieved after each regres-sion method, we evaluated the contrast-to-noise ratio (CNR) of theretrieved hemodynamic response. Contrast is defined as the peak-height of response (averaged over multiple stimulus presentations).We characterized measurement noise through the standard deviationin the pre-stimulus baseline. We judged each method's effectivenessby its improvement in CNR with respect to original Sum signal. CNRimprovement is defined as
100 � 1−CNRAð ÞCNRB
ð7Þ
where CNRB represents CNR for original Sum signal and CNRA is the CNRof the signal after the listed regression method is applied.
In addition, the variation among four activation blocks ismeasured bycalculating coefficients of variation (CV), denoted as CV ¼ σ
μ where σ isthe standard deviation across blocks and μ is the mean of each activationblock.
We also investigated the effects of superficial noise and cerebralsystemic physiology on the Sum signal by generating topographicmaps of functional activation and analyzed their spatial patterns. Thechannel-wise hemodynamic responses during peak activation (takenas 14 s after stimulus onset) for each stimulus block are mapped ontoforehead probe at the midpoint between each SD pair. The inversedistances calculated between each midpoint are used as weight factorsto interpolate the peak responses over forehead. An image map isformed as shown in Fig. 5. We quantified the resemblance of eachmethod's map to the neural activation map by calculating the meansquare error between images as
MSEmethod ¼ 1M
� 1N
XMi¼1
XNj¼1
Ii; jneural−Ii; jmethod
� �2ð8Þ
whereN is the number of activation blocks (4 in this case),M representsthe number of subjects, Ineural
i,j represents the peak activation mapobtained from neural signals for subject i, block j and Imethod
i,j representsthe peak activationmap obtained from listedmethod for subject i, block j.
Results
Fig. 4 presents time traces of the hemodynamic response to themental arithmetic task from a single representative SD pair before andafter optically weighting the scalp and brain signals (Figs. 4A and Brespectively). The optically weighted Sum signal for each SD pair isassumed to be the fMRI correlate of the corresponding fNIRS signalwhile the optically weighted brain and scalp signals represent thestimulus related brain functional response and overlying superficialscalp physiological fluctuations respectively. Notice how the scalp signal
is enhanced in terms of magnitude and how the brain signal is obscuredby it in the Sum signal after weighing BOLD data from voxels along thephoton migration path with the sensitivity matrix (Figs. 4C and D).
In Fig. 5, we examine the effect of applying GSR, SSR and ESSR onretrieving the time traces of the evoked brain hemodynamic response.A representative case of applying GSR, SSR and ESSR is shown in Fig. 5B.The original Sum signal fails to show a canonical response (Fig. 5A) dueto superficial and cerebral systemic interferences. When only globalsignal is removed (GSR), it is difficult to distinguish individual activationepochs whereas application of SSR or ESSR results in a consistentcanonical hemodynamic response. Task-evoked activations are apparenteven before block averaging when either SSR or ESSR method is used(Fig. 5B); however ESSR results in higher response amplitudes. ApplyingSSR or ESSR decreases block-to-block variation while improving signalquality (Fig. 5C) whereas with GSR only, it is difficult to observe task-evoked activation even in the block-averaged data. Block averaged ESSRdata has improved statistical significancewithmore time points showinga significant rise relative to baseline (Fig. 5C, asterisksmark sample pointswith a statistically significant deviation from prestimulus baseline of 5 s,p b 0.05 with a two-tailed t-test.). In this representative measurement,GSR did not yield a significant improvement in the CNR or qualityof the hemodynamic response. SSR improved CNR by 60% whereasESSR resulted in a CNR improvement of 240%. These traces (Figs. 5B–C) show the ability of ESSR to reduce noise and increase statisticalsignificance.
The above-mentioned results can be generalized to the group data(N=240) demonstrating a consistent increase in CNR and decrease incoefficient of variability (CV) as global and superficial signals areremoved consecutively (Fig. 6A). The CNR values obtained using theESSR method are significantly higher than those obtained using theGSR and SSR methods (two tailed paired t-test, p b 0.05). Moreover,the CNR values obtained for the original Sum signals are significantlylower than the CNR values obtained using the SSR and ESSR methods(two tailed paired t-test, p b 0.05). The CNR values obtained with theGSR method do not demonstrate a statistically significant differencefrom the CNR values obtained for the original Sum signals (two tailedpaired t-test, p b 0.05). Similarly, CV values obtained using the ESSRmethod are significantly lower than those obtained with the GSRand SSR methods. Moreover, the CV values obtained for the originalSum signals are significantly higher than the CV values obtainedusing the ESSR method (two tailed paired t-test, p b 0.05). Howeverno significance is observed between the CV values obtained using SSRand GSR methods.
Comparing %CNR improvement of the three methods shows thatthere are ameliorations in signal quality through the use of SSR or GSRalone, with SSR showing about 53% improvement while GSR results inan improvement of 24% among subjects showing positive improvement(Fig. 6B). There is a synergistic effect of utilizing both methods with thesignal quality being highest after ESSR (60%). The %CNR improvementsobtained for the original SSR and ESSR applied signals are significantlyhigher than the %CNR improvements obtained using the GSR method(two tailed paired t-test, pb0.05).
Fig. 7 shows the summary of R2 (A) and MSE (B) statistics over allsubjects and measurements in a bar graph for each regression method.Correlation of scalp, brain and neural signals with corresponding Sumsignals and the retrieved signals after each regression method is shownin Fig. 7A. Without any of the regression methods applied, scalp andSum signals are highly correlated (R2 = 0.98, p b 0.05) due to highsensitivity dominance of the scalp layer on the Sum signals. This findingis in accordance with a previous study by Takashi et al. (2011) who alsoshowed a correlation of greater than 0.9 between near (5mm) and far(30mm) distance optical measurements which allowed them to probeskin, and a mixture of skin and brain measurements separately duringa verbalfluency task. After the global signal is removed,mean correlationbetween Sum and scalp signals decreases to 0.68. This result indicatesthat the recovered signals after GSR still contain a common effect with
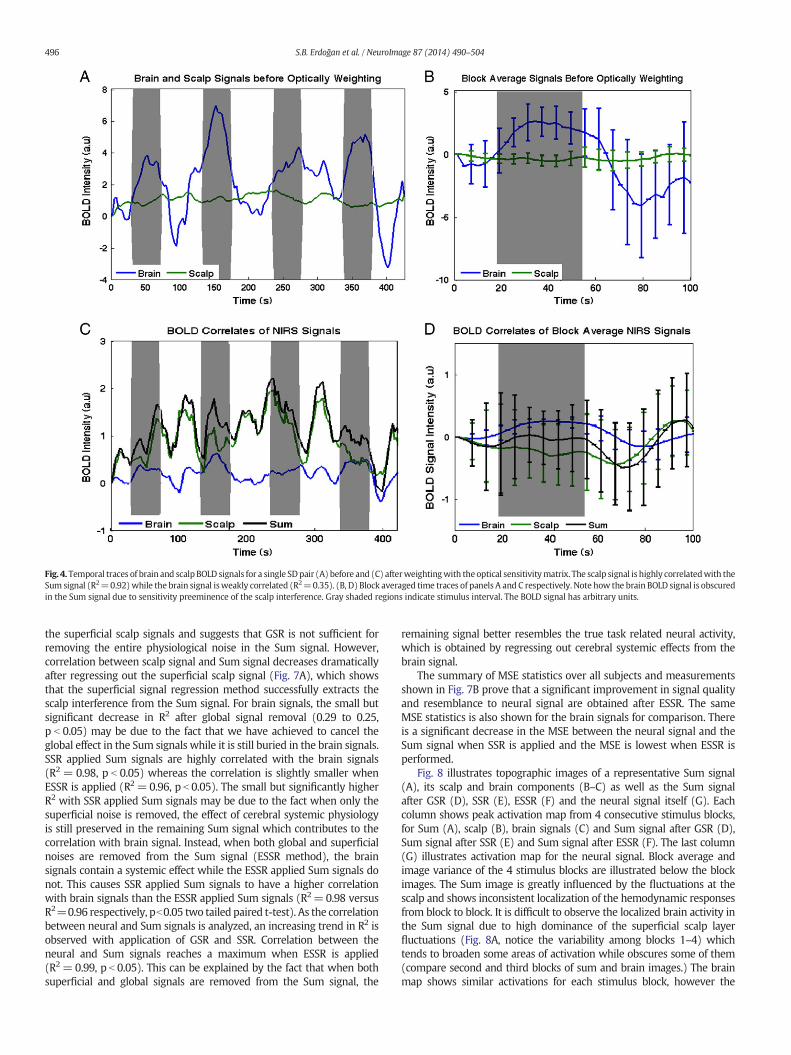
Fig. 4.Temporal traces of brain and scalp BOLD signals for a single SDpair (A) before and (C) afterweightingwith the optical sensitivitymatrix. The scalp signal is highly correlatedwith theSum signal (R2=0.92)while the brain signal isweakly correlated (R2=0.35). (B, D) Block averaged time traces of panels A and C respectively. Note how the brain BOLD signal is obscuredin the Sum signal due to sensitivity preeminence of the scalp interference. Gray shaded regions indicate stimulus interval. The BOLD signal has arbitrary units.
496 S.B. Erdoğan et al. / NeuroImage 87 (2014) 490–504
the superficial scalp signals and suggests that GSR is not sufficient forremoving the entire physiological noise in the Sum signal. However,correlation between scalp signal and Sum signal decreases dramaticallyafter regressing out the superficial scalp signal (Fig. 7A), which showsthat the superficial signal regression method successfully extracts thescalp interference from the Sum signal. For brain signals, the small butsignificant decrease in R2 after global signal removal (0.29 to 0.25,p b 0.05) may be due to the fact that we have achieved to cancel theglobal effect in the Sum signals while it is still buried in the brain signals.SSR applied Sum signals are highly correlated with the brain signals(R2 = 0.98, p b 0.05) whereas the correlation is slightly smaller whenESSR is applied (R2=0.96, p b 0.05). The small but significantly higherR2 with SSR applied Sum signals may be due to the fact when only thesuperficial noise is removed, the effect of cerebral systemic physiologyis still preserved in the remaining Sum signal which contributes to thecorrelation with brain signal. Instead, when both global and superficialnoises are removed from the Sum signal (ESSR method), the brainsignals contain a systemic effect while the ESSR applied Sum signals donot. This causes SSR applied Sum signals to have a higher correlationwith brain signals than the ESSR applied Sum signals (R2=0.98 versusR2=0.96 respectively, pb0.05 two tailed paired t-test). As the correlationbetween neural and Sum signals is analyzed, an increasing trend in R2 isobserved with application of GSR and SSR. Correlation between theneural and Sum signals reaches a maximum when ESSR is applied(R2=0.99, p b 0.05). This can be explained by the fact that when bothsuperficial and global signals are removed from the Sum signal, the
remaining signal better resembles the true task related neural activity,which is obtained by regressing out cerebral systemic effects from thebrain signal.
The summary of MSE statistics over all subjects and measurementsshown in Fig. 7B prove that a significant improvement in signal qualityand resemblance to neural signal are obtained after ESSR. The sameMSE statistics is also shown for the brain signals for comparison. Thereis a significant decrease in the MSE between the neural signal and theSum signal when SSR is applied and the MSE is lowest when ESSR isperformed.
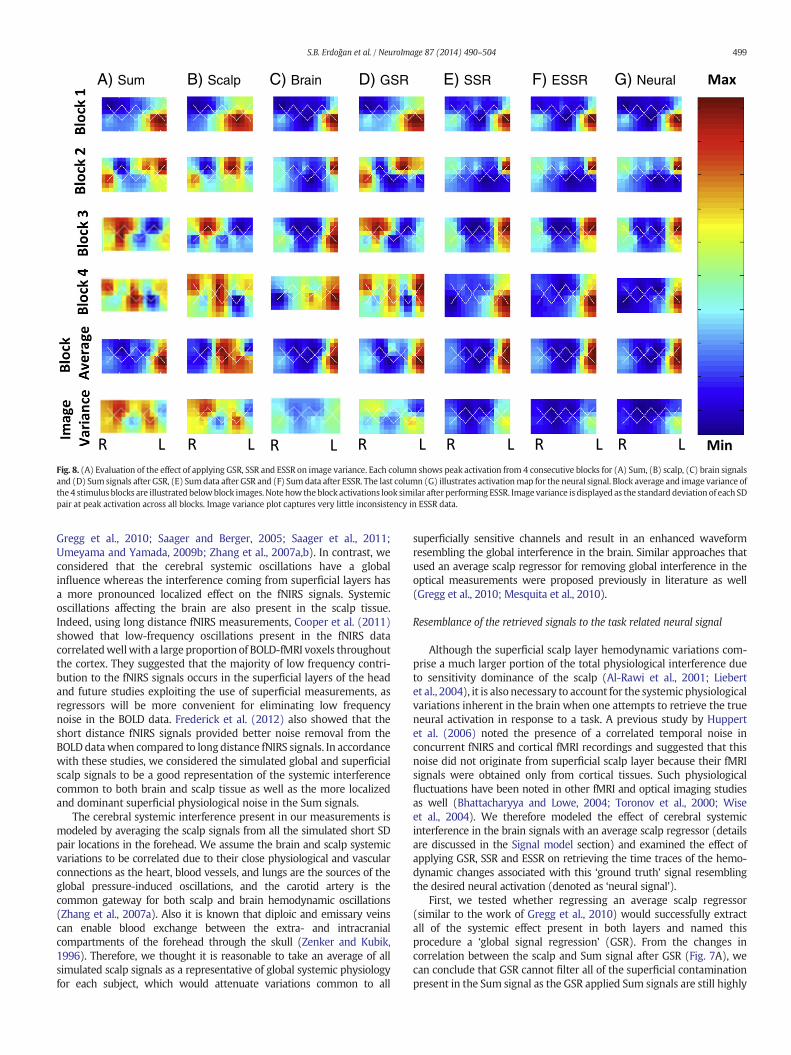
Fig. 8 illustrates topographic images of a representative Sum signal(A), its scalp and brain components (B–C) as well as the Sum signalafter GSR (D), SSR (E), ESSR (F) and the neural signal itself (G). Eachcolumn shows peak activation map from 4 consecutive stimulus blocks,for Sum (A), scalp (B), brain signals (C) and Sum signal after GSR (D),Sum signal after SSR (E) and Sum signal after ESSR (F). The last column(G) illustrates activation map for the neural signal. Block average andimage variance of the 4 stimulus blocks are illustrated below the blockimages. The Sum image is greatly influenced by the fluctuations at thescalp and shows inconsistent localization of the hemodynamic responsesfrom block to block. It is difficult to observe the localized brain activity inthe Sum signal due to high dominance of the superficial scalp layerfluctuations (Fig. 8A, notice the variability among blocks 1–4) whichtends to broaden some areas of activation while obscures some of them(compare second and third blocks of sum and brain images.) The brainmap shows similar activations for each stimulus block, however the

Fig. 5. Evaluation of the effect of GSR, SSR and ESSR on a representative Sum signal. Time traces of the Sum, global and superficial signals from 4 consecutive stimulus blocks (gray shadedregions) are illustrated in panel A. (B) Regressing out superficial noise signal from Sum signal produces SSR data whereas regressing out global noise signal produces GSR data. Regressingout both superficial and global signals produces ESSR data. (C) Block averaged time traces of panel B. The shape of activation becomes cleaner with SSR and ESSRwhile applying GSR onlydoes not produce a pronounced effect (B, C). Error barsmark standard deviation and asterisks show statistically significant deviation frombaseline (C). Variation among 4 blocks decreaseswhile CNR is enhanced after applying ESSR. Note the reduced standard deviation and improved number of sample points showing statistically significant rise after ESSR method whencompared to SSR and GSR methods.
497S.B. Erdoğan et al. / NeuroImage 87 (2014) 490–504
neural map presents a more localized pattern of activation (compareblocks 1–4of Figs. 8C andE). The ESSR images resemble the neural imagesmost with the lowestmean square error. Themean square error (Eq. (8))for Sum, GSR, SSR and ESSR images are 0.55, 0.43, 0.025 and 0.008respectively.
Fig. 6. (A) Grand average of the CNR and CV obtained for Sum data and after GSR, SSR and ESSRstandard deviation across all measurements (N=240). Statistically significant differences from
Discussion
The major goal of our study is to compare the efficacy of removingphysiological artifacts by performing i) a global signal regression (GSR),ii) a superficial signal regression (SSR) and iii) an extended superficial
are applied. (B) %CNR improvement observed relative to Sum signal. The error bars showthe Sum Data are marked with an asterisk (2 tailed paired t-test, p b 0.05).
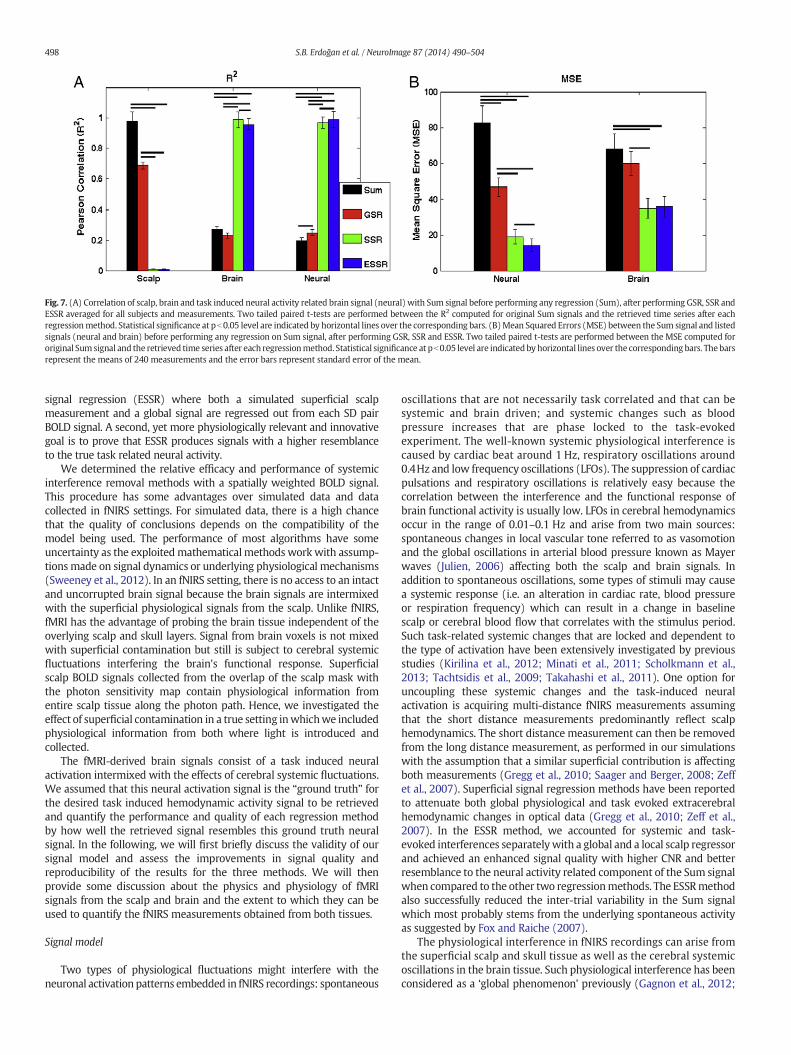
Fig. 7. (A) Correlation of scalp, brain and task induced neural activity related brain signal (neural) with Sum signal before performing any regression (Sum), after performing GSR, SSR andESSR averaged for all subjects and measurements. Two tailed paired t-tests are performed between the R2 computed for original Sum signals and the retrieved time series after eachregressionmethod. Statistical significance at pb0.05 level are indicated by horizontal lines over the corresponding bars. (B)Mean Squared Errors (MSE) between the Sum signal and listedsignals (neural and brain) before performing any regression on Sum signal, after performing GSR, SSR and ESSR. Two tailed paired t-tests are performed between the MSE computed fororiginal Sum signal and the retrieved time series after each regressionmethod. Statistical significance at pb0.05 level are indicated by horizontal lines over the corresponding bars. The barsrepresent the means of 240 measurements and the error bars represent standard error of the mean.
498 S.B. Erdoğan et al. / NeuroImage 87 (2014) 490–504
signal regression (ESSR) where both a simulated superficial scalpmeasurement and a global signal are regressed out from each SD pairBOLD signal. A second, yet more physiologically relevant and innovativegoal is to prove that ESSR produces signals with a higher resemblanceto the true task related neural activity.
We determined the relative efficacy and performance of systemicinterference removal methods with a spatially weighted BOLD signal.This procedure has some advantages over simulated data and datacollected in fNIRS settings. For simulated data, there is a high chancethat the quality of conclusions depends on the compatibility of themodel being used. The performance of most algorithms have someuncertainty as the exploitedmathematical methods work with assump-tions made on signal dynamics or underlying physiological mechanisms(Sweeney et al., 2012). In an fNIRS setting, there is no access to an intactand uncorrupted brain signal because the brain signals are intermixedwith the superficial physiological signals from the scalp. Unlike fNIRS,fMRI has the advantage of probing the brain tissue independent of theoverlying scalp and skull layers. Signal from brain voxels is not mixedwith superficial contamination but still is subject to cerebral systemicfluctuations interfering the brain's functional response. Superficialscalp BOLD signals collected from the overlap of the scalp mask withthe photon sensitivity map contain physiological information fromentire scalp tissue along the photon path. Hence, we investigated theeffect of superficial contamination in a true setting inwhichwe includedphysiological information from both where light is introduced andcollected.
The fMRI-derived brain signals consist of a task induced neuralactivation intermixed with the effects of cerebral systemic fluctuations.We assumed that this neural activation signal is the “ground truth” forthe desired task induced hemodynamic activity signal to be retrievedand quantify the performance and quality of each regression methodby how well the retrieved signal resembles this ground truth neuralsignal. In the following, we will first briefly discuss the validity of oursignal model and assess the improvements in signal quality andreproducibility of the results for the three methods. We will thenprovide some discussion about the physics and physiology of fMRIsignals from the scalp and brain and the extent to which they can beused to quantify the fNIRS measurements obtained from both tissues.
Signal model
Two types of physiological fluctuations might interfere with theneuronal activation patterns embedded in fNIRS recordings: spontaneous
oscillations that are not necessarily task correlated and that can besystemic and brain driven; and systemic changes such as bloodpressure increases that are phase locked to the task-evokedexperiment. The well-known systemic physiological interference iscaused by cardiac beat around 1 Hz, respiratory oscillations around0.4Hz and low frequency oscillations (LFOs). The suppression of cardiacpulsations and respiratory oscillations is relatively easy because thecorrelation between the interference and the functional response ofbrain functional activity is usually low. LFOs in cerebral hemodynamicsoccur in the range of 0.01–0.1 Hz and arise from two main sources:spontaneous changes in local vascular tone referred to as vasomotionand the global oscillations in arterial blood pressure known as Mayerwaves (Julien, 2006) affecting both the scalp and brain signals. Inaddition to spontaneous oscillations, some types of stimuli may causea systemic response (i.e. an alteration in cardiac rate, blood pressureor respiration frequency) which can result in a change in baselinescalp or cerebral blood flow that correlates with the stimulus period.Such task-related systemic changes that are locked and dependent tothe type of activation have been extensively investigated by previousstudies (Kirilina et al., 2012; Minati et al., 2011; Scholkmann et al.,2013; Tachtsidis et al., 2009; Takahashi et al., 2011). One option foruncoupling these systemic changes and the task-induced neuralactivation is acquiring multi-distance fNIRS measurements assumingthat the short distance measurements predominantly reflect scalphemodynamics. The short distance measurement can then be removedfrom the long distance measurement, as performed in our simulationswith the assumption that a similar superficial contribution is affectingboth measurements (Gregg et al., 2010; Saager and Berger, 2008; Zeffet al., 2007). Superficial signal regression methods have been reportedto attenuate both global physiological and task evoked extracerebralhemodynamic changes in optical data (Gregg et al., 2010; Zeff et al.,2007). In the ESSR method, we accounted for systemic and task-evoked interferences separatelywith a global and a local scalp regressorand achieved an enhanced signal quality with higher CNR and betterresemblance to the neural activity related component of the Sum signalwhen compared to the other two regressionmethods. The ESSRmethodalso successfully reduced the inter-trial variability in the Sum signalwhich most probably stems from the underlying spontaneous activityas suggested by Fox and Raiche (2007).
The physiological interference in fNIRS recordings can arise fromthe superficial scalp and skull tissue as well as the cerebral systemicoscillations in the brain tissue. Such physiological interference has beenconsidered as a ‘global phenomenon’ previously (Gagnon et al., 2012;
A) Sum B) Scalp C) Brain D) GSR E) SSR F) ESSR G) Neural
Fig. 8. (A) Evaluation of the effect of applying GSR, SSR and ESSR on image variance. Each column shows peak activation from 4 consecutive blocks for (A) Sum, (B) scalp, (C) brain signalsand (D) Sum signals after GSR, (E) Sumdata after GSR and (F) Sumdata after ESSR. The last column (G) illustrates activationmap for the neural signal. Block average and image variance ofthe 4 stimulus blocks are illustrated belowblock images. Note how theblock activations look similar after performing ESSR. Image variance is displayed as the standard deviation of each SDpair at peak activation across all blocks. Image variance plot captures very little inconsistency in ESSR data.
499S.B. Erdoğan et al. / NeuroImage 87 (2014) 490–504
Gregg et al., 2010; Saager and Berger, 2005; Saager et al., 2011;Umeyama and Yamada, 2009b; Zhang et al., 2007a,b). In contrast, weconsidered that the cerebral systemic oscillations have a globalinfluence whereas the interference coming from superficial layers hasa more pronounced localized effect on the fNIRS signals. Systemicoscillations affecting the brain are also present in the scalp tissue.Indeed, using long distance fNIRS measurements, Cooper et al. (2011)showed that low-frequency oscillations present in the fNIRS datacorrelatedwellwith a large proportion of BOLD-fMRI voxels throughoutthe cortex. They suggested that the majority of low frequency contri-bution to the fNIRS signals occurs in the superficial layers of the headand future studies exploiting the use of superficial measurements, asregressors will be more convenient for eliminating low frequencynoise in the BOLD data. Frederick et al. (2012) also showed that theshort distance fNIRS signals provided better noise removal from theBOLDdatawhen compared to long distance fNIRS signals. In accordancewith these studies, we considered the simulated global and superficialscalp signals to be a good representation of the systemic interferencecommon to both brain and scalp tissue as well as the more localizedand dominant superficial physiological noise in the Sum signals.
The cerebral systemic interference present in our measurements ismodeled by averaging the scalp signals from all the simulated short SDpair locations in the forehead. We assume the brain and scalp systemicvariations to be correlated due to their close physiological and vascularconnections as the heart, blood vessels, and lungs are the sources of theglobal pressure-induced oscillations, and the carotid artery is thecommon gateway for both scalp and brain hemodynamic oscillations(Zhang et al., 2007a). Also it is known that diploic and emissary veinscan enable blood exchange between the extra- and intracranialcompartments of the forehead through the skull (Zenker and Kubik,1996). Therefore, we thought it is reasonable to take an average of allsimulated scalp signals as a representative of global systemic physiologyfor each subject, which would attenuate variations common to all
superficially sensitive channels and result in an enhanced waveformresembling the global interference in the brain. Similar approaches thatused an average scalp regressor for removing global interference in theoptical measurements were proposed previously in literature as well(Gregg et al., 2010; Mesquita et al., 2010).
Resemblance of the retrieved signals to the task related neural signal
Although the superficial scalp layer hemodynamic variations com-prise a much larger portion of the total physiological interference dueto sensitivity dominance of the scalp (Al-Rawi et al., 2001; Liebertet al., 2004), it is also necessary to account for the systemic physiologicalvariations inherent in the brain when one attempts to retrieve the trueneural activation in response to a task. A previous study by Huppertet al. (2006) noted the presence of a correlated temporal noise inconcurrent fNIRS and cortical fMRI recordings and suggested that thisnoise did not originate from superficial scalp layer because their fMRIsignals were obtained only from cortical tissues. Such physiologicalfluctuations have been noted in other fMRI and optical imaging studiesas well (Bhattacharyya and Lowe, 2004; Toronov et al., 2000; Wiseet al., 2004). We therefore modeled the effect of cerebral systemicinterference in the brain signals with an average scalp regressor (detailsare discussed in the Signal model section) and examined the effect ofapplying GSR, SSR and ESSR on retrieving the time traces of the hemo-dynamic changes associated with this ‘ground truth’ signal resemblingthe desired neural activation (denoted as ‘neural signal’).
First, we tested whether regressing an average scalp regressor(similar to the work of Gregg et al., 2010) would successfully extractall of the systemic effect present in both layers and named thisprocedure a ‘global signal regression’ (GSR). From the changes incorrelation between the scalp and Sum signal after GSR (Fig. 7A), wecan conclude that GSR cannot filter all of the superficial contaminationpresent in the Sum signal as the GSR applied Sum signals are still highly
500 S.B. Erdoğan et al. / NeuroImage 87 (2014) 490–504
correlated with scalp signals (R2 = 0.68, p b 0.05). Moreover, thecontrast to noise ratio is not enhanced significantly after GSR, and it isdifficult to observe a canonical response in most of the measurements.Next, we tested the efficacy of removing the local superficial scalp signalfrom eachmeasurement.We observed a substantial improvement in thesignal quality as reflected in the CNR, R2 and MSE metrics. When thesuperficial scalp signal is removed, the variation among blocks decreases(notice the decrease in CV in Fig. 6A and the error bars in Fig. 5C) to abetter extent and it is easy to detect the canonical response at stimulusintervals for most of the measurements (an example is shown inFig. 5B) even before block averaging.
By comparing the effects produced by GSR and SSR alone, weconclude that superficial scalp signal contribution to fNIRS signals variessignificantly among different regions in the forehead and a localmeasurement is necessary for canceling the effects of superficial signalcontamination adequately. A single global regressor did not containthe exact superficial noise information constrained to the overlyingstructures for each SD pair and was not able to recover the desiredneural response accurately (note theMSE and R2 statistics). This findingis in accordance with two recent studies which showed that thesystemic interference in fNIRS measurements is not homogeneouslydistributed across the surface of the scalp (Gagnon et al., 2012) andthe superficial task-evoked artifacts are more localized in the scalpdraining veins (Kirilina et al., 2012). For the neural signals, a smallincrease in R2 is accompanied by a small decrease in MSE with GSRapplied Sum signals (Figs. 7A and B). Instead, there is a sharpincrease in R2 and a sharp decrease in MSE for SSR applied Sumsignals. These results also demonstrate that superficial layer interfer-ence is the major component of the total systemic interference that isin accordance with the simulation and human subject findings byZhang et al. (2007a,b).
In our study, we hypothesized that the cerebral systemic oscillationshave a global effect whereas the superficial oscillations have a spatiallyheterogeneous effect. We accounted for both types of noise separatelyin the ESSR method and compared the retrieved signal with the neuralsignal that is considered to represent the ‘ground truth’ brain activationfree from cerebral systemic oscillations. The correlation between neuraland ESSR applied Sum signals is the highest while the MSE is thesmallest when compared to the other two methods. The signal qualityis enhanced most when ESSR method is applied with decreasedvariation among stimulus blocks, a clear canonical waveform, highestCNR improvement and a better resemblance to the ground truth neuralactivation signal. Application of ESSR method improves signal quality,reduces inter-trial variability by effectively canceling superficial scalpcontamination as well as systemic interference inherent in the braineffectively. These improvements compared to GSR and SSR methodsalso suggest that our assumption of characterizing cerebral systemicphysiology with the average of all scalp regressors is suitable fordiscarding the systemic components of the brain signal. The CNR andMSE metrics illustrate that we were able to recover the neural signalto a good extent. These results also show that ESSR method can reduceboth spontaneous oscillations inherent in the brain and task-evokedextracranial effects during the mental arithmetic task.
Improvements in activity localization
We also investigated the effects of superficial noise and cerebralsystemic physiology on the Sum signal by generating topographicmaps of functional activation and their spatial patterns. We assessedthe improvements in activation localization with the application ofthe above-mentioned regression methods. The Sum image is greatlyinfluenced by the fluctuations at the scalp and shows inconsistentresponses from block to block due to high dominance of thesuperficial scalp layer fluctuations (Fig. 5A, notice the variabilityamong blocks 1–4). The effects of global and superficial systemicinterference tend to blur the areas of activation (Fig. 8A). Such
superficial scalp effects have been shown to worsen the signal-to-noise ratio, or be incorrectly interpreted as cerebral hemodynamicchanges, resulting in false positives in fNIRS experiments previously aswell (Kirilina et al., 2012; Minati et al., 2011; Tachtsidis et al., 2009;Takahashi et al., 2011).
The brain map shows similar activation patterns for each block.However, the neuralmappresents amore localized pattern of activation(compare blocks 1–4 of Figs. 8C and E). This improvement in localiza-tion of activity is most probably due to the cancelation of the globalnoise buried in the brain. Applying ESSR method reduces the effect ofboth the superficial scalp fluctuations and cerebral systemic physiologyand gives rise to maps that very well resemble the neural maps.Although all activation maps appear similar after block-averaging(fifth row of Fig. 8), the greater noise in the Sum and scalp signals canbe easily reflected in an image of variance map over multiple trials(sixth row of Fig. 8).
Comparison with other methods
In our study, we have implemented a computationally simpleregression procedure for removing the effects of global and superficialinterference during a cognitive task. Ourwork provides complementaryinformation to previous fNIRS studies, which tested the efficacy ofadaptive filtering and linear regression of scalp measurements duringvisual activation (Gregg et al., 2010; Saager et al., 2011; Zhang et al.,2009). Although adaptive filtering is a more powerful method thanlinear regression, Zhang et al. (2009) observed a mean improvementof 60% for 71% of their HbO2 measurements and no CNR improvementswere observed for HbR. Similarly, Saager et al. (2011) reported that 75%of the channels showed a CNR improvement while Gregg et al. (2010)observed an improvement of about 200% in CNR across all hemoglobinspecies in more than 80% of their subjects with linear regression. Inour study, we observed a positive improvement in CNR for 62% ofour measurements with a mean improvement of 60% with ESSR.The amplitude of the cerebral hemodynamic response in theprefrontal cortex during a cognitive stimulation may be smallerwhen compared to hemodynamic responses obtained from primarysensory or motor cortex during activation (Kirilina et al., 2012). Forthis reason, the CNR improvement obtained in our study may besmaller when compared to the CNR improvements observed duringmotor or visual stimulation in previous studies. Stimulus correlatedsystemic changes (e.g., increase in cardiac rate, arterial blood pressure,respiration frequency), can induce a false positive effect on CNR andregressing it out may result in an impairment of the CNR. Potentialreasons behind the lower CNR improvement should be investigated indetail. Comparable performance of the ESSR method suggests thateffective filtering can be obtained with simple, easily implementedalgorithms.
The acceptance of fNIRS in clinical applications requires the deliveryof reliable and robust signals from a greater percentage of subjectsincluded in the studies. By canceling the effects of global and superficialsystemic physiology, shorter studies with increased signal quality canbe conducted on a greater number of subjectswhile the effects of fatigueand adaptation are minimized.
Physics and physiology of brain and scalp fMRI signals and their relation totissue absorbance measured with fNIRS
Although our study relies on the similarity between fMRI and fNIRSsignal changes observed during cognitive stimulation, there are severalpoints to be considered when signals from the scalp and from the brainare compared for both modalities. fMRI signals from the brain havebeen shown to be sensitive to similar underlying hemodynamicchanges with fNIRS signals (Toronov et al., 2000, 2003). However,regarding fMRI signals from the scalp, neither the biophysical originnor how they can be related to scalp optical signals have been well-
501S.B. Erdoğan et al. / NeuroImage 87 (2014) 490–504
investigated. In the following, we will discuss the physics andphysiology of fMRI signals from the scalp and brain and how they canbe related to temporal evolution of tissue oxygenation changesmeasuredwith fNIRS.
The most established theories of fMRI attribute the physiologicalorigin of the BOLD signal to changes in local HbR content and bloodvolume (Boxerman et al., 1995; Buxton et al., 1998; Ogawa et al.,1993). The amplitude S of a single voxel MRI signal obtained with agradient echo sequence with echo time TE can be related to tissuewater content Mv and relaxation time (T2⁎) as
S∼Mv � exp − TET�
2
!: ð9Þ
There exist some fundamental differences when the theoreticalframeworks used for interpreting brain and scalp fMRI signals areconsidered. The BOLD effect in the brain mainly arises from changes inlocal [HbR] which is reflected in venous blood relaxation time (T2⁎). Incontrast, the scalp fMRI signals are thought to be primarily determinedby venous blood volume Mv in a voxel. At 1.5T field strength, while theextravascular contribution to the brain fMRI signals is responsible forhalf of the signal change (Buxton, 2002), the extravascular contributionto the scalp fMRI signals can be neglected due to low signal intensity.The tissue relaxation time (T2⁎) for skin is substantially shorter(~12 ms for the dermis) (Song et al., 1997; Weiss et al., 2001) than(T2⁎) of isolated blood (N80 ms) (Chien et al., 1994; Li et al., 1998;Silvennoinen et al., 2003). The intrinsically low scalp tissue signal isattributed to the short relaxation time of the skin layers (Richardet al., 1991; Song et al., 1997) and low effective proton density (Barralet al., 2010;Weiss et al., 2001) which can be regarded as a consequenceof the fact that a significant portion of water molecules in the dermisis bound to collagen and not free (Richard et al., 1993). Therefore,task-related changes observed in the scalp fMRI signal reflect intravas-cular changes which may originate from a change in venous bloodoxygenation and the related change in blood relaxation time T2 or achange in venous water volume Mv or a combination of both (Kirilinaet al., 2012). At a magnetic field strength of 1.5 T with TE=50ms andassuming a venous oxygen saturation of 70%, the relative contributionof these biophysical mechanisms to the fractional BOLD signal changeinduced by activation can be estimated with the integrated modelproposed by Uludag et al. (2009) as
ΔSS
≈1:26ΔX
HbOXHbOþ
XHbR
þ 0:4ΔX
HbRXHbOþ
XHbR
ð10Þ
where S is the venous MRI signal, ∑HbO and ∑HbR represent thebaseline amounts of HbO and HbR, respectively, and ΔS, Δ∑HbO andΔ∑HbR represent the task-related changes of each quantitywith respectto baseline. The reader is referred to Appendix 2 of Kirilina et al. (2012)andUludag et al. (2009) for the derivation of Eqs. (9) and (10) and detailsof the underlying assumptions. Eq. (10) shows that for a single voxelscalp fMRI signal, changes in HbO content contribute with a weightingfactor of 1.26, while changes in HbR content contribute with a weightingfactor that is three times smaller. Kirilina et al. (2012) showed that, thescalp fMRI signals obtained during different cognitive tasks were highlycorrelatedwith scalpHbO concentration changeswhereas they exhibitedno significant correlation with HbR. Similarly, with simultaneousfNIRS and laser Doppler flowmetry recordings, Takahashi et al. (2011)demonstrated that blood flow and volume increased in the foreheadscalp during performance of a verbal fluency task. However, no signif-icant change in scalp HbR concentration was observed. The relativeconcentration changes of HbO and HbR measured by fNIRS correspondto the total change of Δ∑HbO and Δ∑HbR in the cutaneous veinswhich influence the fMRI signal according to Eq. (10). The fNIRS resultsobtained by the above-mentioned two former studies let us assume that
for the scalp compartment Δ≈∑HbR≈ 0. Thus, the second term inEq. (10) can be neglected and the venous volume change is reduced to
Δ∑HbOΔ∑HbOþΔ∑HbR
. To sum up, we infer that i) the scalp fMRI signal is
directly proportional to venous volume change and ii) venous volumechange is reflected in the scalp fMRI signal with a scaling factor of1.26. For example, a 5% increase in scalp fMRI signal corresponds to avenous blood volume increase of about 4%.
Quantification of fNIRS signals with a spatially weighted fMRI signal
The fMRI-BOLD signal change originates primarily from the localconcentration change of paramagnetic HbR molecules which results inan alteration of themagnetic susceptibility of blood and createsmagneticfield inhomogeneities. Therefore, one would expect a correspondencebetween fNIRS-HbR and fMRI-BOLD signals. Numerous studies havebeen performed to explore correlations between fMRI and fNIRS signalsboth spatially and temporally (Huppert et al., 2005, 2006; Sassaroliet al., 2006; Strangman et al., 2002; Toronov et al., 2001, 2007). Althoughmost theoretical approaches suggest a strong correlation between HbRand BOLD, experimental validation is a controversial issue. Some studiesreported a better temporal correspondence between HbO and BOLDsignals (Hoshi et al., 2001; Strangman et al., 2002), while other studieshave shown a better correspondence between HbR and BOLD signals(MacIntosh et al., 2003; Siegel et al., 2003; Toronov et al., 2001). Thisdiscrepancy in literature may be related to the differential sensitivity ofBOLD signal to vascular compartments in the presence of stronger orweaker static magnetic field (Boas et al., 2004; Cui et al., 2011).Nonetheless, a synthesis of the results from these studies indicates that,there is a strong correspondence between signals measured with fNIRSand fMRI.
By using the approach of BOLD signal projection through the opticalsensitivity profile as performed in our study, the spatial and temporalcorrelation between the fNIRS and fMRI measurements could beexamined with strong statistical temporal and spatial correlation inprevious studies (Huppert et al., 2005; Sassaroli et al., 2006; Toronovet al., 2007). Huppert et al. (2005) indeed showed that the fNIRS-HbRand BOLD activation patterns are qualitatively consistent with oneanother after projecting the BOLD absolute image intensity signalfrom each voxel coinciding the photon migration path through theforward matrix that was found by the Monte Carlo simulations.Moreover, partial volume effects were avoided and the discrepancyin activation observed between fNIRS and fMRI recordings wascorrected. Similarly, Sassaroli et al. (2006) found that a weightedaverage of the standard BOLD signal showed a strong spatial andtemporal correlation with both HbO and HbR concentration changesmeasured with NIRS during a hand-tapping protocol. These studiessupport the spatiotemporal correspondence hypothesized to existbetween the brain component of the spatially weighted Sum signal andthe fNIRS signals.
Relative changes of the fMRI signal contain at least two contributions:one resulting from the tissue blood volume changes and the secondresulting from tissue oxygenation changes. The fMRI signal changes dueto the first mechanism are expected to be positively correlated withsum of concentration changes of HbO and HbR as measured with fNIRS.Taking into consideration i) the fact that task evoked superficial signalchanges in the forehead during cognitive tasks were observed for HbObut not HbR (Kirilina et al., 2012; Takahashi et al., 2011), and ii) thestriking similarity observed between the time courses of scalp fMRI andfNIRS HbO signals in a previous study (Kirilina et al., 2012), we suggestthat fMRI signal changes observed in the scalp for our study may betterrepresent the NIRS HbO or total hemoglobin (HbT) signal. Attributingthe scalp fMRI signal changes to blood volume change is in accordancewith the study of Drummond (1997) who reported an increase inforehead scalp blood flow during mental arithmetic, and suggested thatthe vasodilation is mediated by à-adrenoceptors. The scalp HbR content

502 S.B. Erdoğan et al. / NeuroImage 87 (2014) 490–504
is expected to be less affected by the task since task performance shouldnot influence the metabolic demand of scalp. Consequently, we suggestthat task-related hemodynamic changes in the forehead scalp duringthe mental arithmetic task may be due to the vasodilation mechanism.Some previous NIRS studies demonstrated significant changes in HbOsignal from prefrontal cortex during mental arithmetic tasks. Hoshi andTamura (1993) observed pronounced changes in HbO signal but notHbR during mental arithmetic in a 30-year-old male subject. Similarly,in the work of Tanida et al. (2004), mental arithmetic task causedincreases in HbO and HbT concentration accompanied by a decreasein HbR in the right and left prefrontal cortices of all subjects. Theseresults suggest that the brain component of the Sum signal might alsobetter correlate with HbO or HbT changes measured with fNIRS. Wetherefore suggest that the spatially weighted Sum signal in our studymay show better correspondence to the HbO or HbT signals measuredwith fNIRS.
Limitations of the study and recommendations for future work
One major limitation of our study is that we did not include anyfNIRS measurements in the present work. Our analysis relies on asimilarity between the time courses of fNIRS and fMRI signals insteadof a quantitative comparison of the two modalities. Although thehemodynamic response measured with the two modalities mightdiffer in terms of amplitude, the time course of the measured scalphemodynamics has been shown to be very similar (Kirilina et al.,2012). A quantitative analysis of concurrent fMRI and fNIRS scalpmeasurements can help us elucidate the effect of task-related scalphemodynamics on long distance NIRS measurements and will beour objective for future studies.
The systemic physiological parameters, especially the power of LFOsmeasured during an fMRI session might differ compared to the sameparameters obtained in a sitting position during an fNIRS session(Heinzel et al., 2013; Tachtsidis et al., 2004). In the sitting position, thepower of LFOs in both the scalp and brain tissue will be higher thanthat during the supine position. However, the majority of the low-frequency contribution to the fNIRS signal will still be from thesuperficial tissue as discussed in previous studies (Cooper et al., 2011;Tong and Frederick, 2010). Further studies on how posture affects theperformance of the ESSR method in an fNIRS setting are necessaryalthough we believe it is reasonable to assume that the superficial andglobal regressors obtained from the scalp measurements will still serveas a good modeling waveform for physiological noise during bothpostures.
One of the advantages of the ESSRmethod is its ease of use with anymulti-distance fNIRS probe design, but this simplicity comes at the costof making assumptions. One limitation is that there are likely severalsources that contribute to themeasured noise and that amultiple linearregression method combined with direct measurements of othersystemic signals such as cardiac beat, breathing rate, and arterial bloodpressure, may provide a better insight to understanding the effects ofsuperficial and global interferences. Previous published work with1.5T field strength has shown that fMRI andNIRS are sensitive to similarunderlying hemodynamic changes (Toronov et al., 2000, 2003).However, we should also note that fMRI signals obtained with 1.5 TMRI systemsmainly reflect hemodynamic changes in venules and largerveins but not capillaries (Seiyema et al., 2004). fMRI data collected athigher magnetic field strengths (≥4 T) will improve the sensitivity tocapillaries and accuracy of proposed method.
The ESSR method is chosen for examination of task-evoked neuralactivity during a cognitive task; care should be taken in choosing theappropriate noise removal method for each experiment. As notedearlier, alternative methods for modeling the systemic physiology basedinterference in fNIRS recordings have been proposed in the literature.Each method is based upon different assumptions about the systemicnoise present in fNIRS signals. While we tested only 3 methods for a
single type of cognitive stimulation, a detailed study testing whichinterference cancelation method works best for which type of stimuliwill be a valuable future contribution.
Conclusion
In this study, we have shown that treating superficial interferencelocally and cerebral interference globally with the ESSR method resultsin amore accurate recovery of the task-induced hemodynamic responsewith higher spatial localization and lower inter-trial variability whencompared to theGSR and SSRmethods. Using an average scalp regressortogether with a local measure of superficial hemodynamics (ESSRmethod) better accounted for the systemic interference inherent in thebrain. Our fMRI results demonstrate that i) superficial scalp interferenceis the major component of the total systemic interference and is nothomogeneously distributed among different regions on the forehead,and ii) optical measurements of the brain hemodynamics are greatlyinfluenced by interference of superficial origin. We conclude thatmaximizing the overlap between the optical path of the superficialmeasurements and the longer distance measurements is of crucialimportance for accurate recovery of the evoked hemodynamic responsein fNIRS recordings. A short optode (probing local scalp hemodynamics)placed close to each source and detector would be, in principle, ideal foraccurate recovery of the evoked hemodynamic response in fNIRSrecordings at the expense of impracticality. Future studies are neededto design optimal multi-distance probe geometries that account forsuperficial interference properly with the least number of short optodemeasurements.
Acknowledgments
This study is sponsored in part by BURF Project No.: 11XD4 and inpart by TUBITAK Project No.: 112E034. Authors would like to thankDeniz Nevsehirli, Yasemin Keskin Ergen and Ali Bayram for their helpin fMRI data collection, and the Photon Migration Imaging Laboratoryat Massachusetts General Hospital for the Monte Carlo simulation code.
References
Aletti, F., Re, R., Pace, V., Contini, D., Molteni, E., Cerutti, S., Maria Bianchi, A., Torricelli, A.,Spinelli, L., Cubeddu, R., Baselli, G., 2012. Deep and surface hemodynamic signal fromfunctional time resolved transcranial near infrared spectroscopy compared to skinflowmotion. Comput. Biol. Med. 42, 282–289.
Al-Rawi, P.G., Smielewski, P., Kirkpatrick, P.J., 2001. Evaluation of a near-infraredspectrometer (NIRO 300) for the detection of intracranial oxygenation changes inthe adult head. Stroke 32, 2492–2500.
Arridge, S.R., 1999. Optical tomography in medical imaging. Inverse Probl. 15, 14–93.Arridge, S.R., Cope,M., Delpy, D.T., 1992. The theoretical basis for the determination of optical
pathlengths in tissue: temporal and frequency analysis. Phys. Med. Biol. 37, 1531–1560.Barral, J.K., Bangerter, N.K., Hu, B.S., Nishimura, D.G., 2010. In vivo high-resolution
magnetic resonance skin imaging at 1.5 T and 3 T. Magn. Reson. Med. 63, 790–796.Bhattacharyya, P.K., Lowe, M.J., 2004. Cardiac-induced physiologic noise in tissue is a direct
observation of cardiac-induced fluctuations. Magn. Reson. Imaging 22 (1), 9–13.Boas, D., Dale, A.M., 2005. Simulation study of magnetic resonance imaging-guided
cortically constrained diffuse optical tomography of human brain function. Appl.Opt. 44 (10).
Boas, D.A., Culver, J.P., Stott, J.J., Dunn, A.K., 2002. Three dimensional Monte Carlo code forphoton migration through complex heterogeneous media including the adult humanhead. Opt. Express 10, 159–170.
Boas, D., Dale, A.M., Franceschini, M.A., 2004. Diffuse optical imaging of brain activation:approaches to optimizing image sensitivity, resolution and accuracy. Neuroimage23, S275–S288.
Boxerman, J.L., Bandettini, P.A., Kwong, K.K., Baker, J.R., Davis, T.L., Rosen, B.R., Weisskoff,R.M., 1995. The intravascular contribution to fMRI signal change: Monte Carlomodeling and diffusion-weighted studies in vivo. Magn. Reson. Med. 34, 4–10.
Buxton, R., 2002. Introduction to Functional Magnetic Resonance Imaging: Principles andTechniques. Cambridge University Press.
Buxton, R.B., Wong, E.C., Frank, L.R., 1998. Dynamics of blood flow and oxygenationchanges during brain activation: the balloon model. Magn. Reson. Med. 39, 855–864.
Chien, D., Levin, D.L., Anderson, C.M., 1994. MR gradient echo imaging of intra-vascularblood oxygenation: T2* determination in the presence of flow. Magn. Reson. Med. 32,540–545.
503S.B. Erdoğan et al. / NeuroImage 87 (2014) 490–504
Cooper, R.J., Gagnon, L., Goldenholz, D., Boas, D.A., Greve, D.N., 2011. The utility of near-infrared spectroscopy in the regression of low-frequency physiological noise fromfunctional magnetic resonance imaging data. NeuroImage 59, 3128–3138.
Cope, M., Delpy, D.T., 1988. System for long-term measurement of cerebral blood flowand tissue oxygenation on newborn infants by infrared transillumination. Med.Biol. Eng. Comput. 26, 289–294 (PubMed: 2855531).
Cui, X., Bray, S., Bryant, D.M., Glover, G.H., Reiss, A.L., 2011. A quantitative comparison ofNIRS and fMRI across multiple cognitive tasks. NeuroImage 54, 2808–2821.
Delpy, D.T., Cope, M., van der Zee, P., Arridge, S., Wray, S., Wyatt, J., 1988. Estimation ofoptical pathlength through tissue from direct time of flight measurement. Phys.Med. Biol. 33, 1433–1442 (PubMed: 3237772).
Devore, J.L., 1995. Probability and statistics for engineering and the sciences. SimpleLinear Regression and Correlation. Vol. 4th ed. Wadsworth Inc, Belmont, California,pp. 474–522.
Diamond, S.G., Huppert, T.J., Kolehmainen, V., Franceschini, M.A., Kaipio, J.P., Arridge, S.R.,Boas, D.A., 2006. Dynamic physiological modeling for functional diffuse opticaltomography. Neuroimage 30, 88–101.
Drummond, P.D., 1997. The effect of adrenergic blockade on blushing and facial blushing.Psychophysiology 34, 163–168.
Fang, Q., Boas, D.A., 2009. Monte Carlo simulation of photon migration in 3D turbidmediaaccelerated by graphics processing units. Opt. Express 17, 20178–20190.
Fox, M.D., Raichle, M.E., 2007. Spontaneous fluctuations in brain activity observed withfunctional magnetic resonance imaging. Nat. Rev. Neurosci. 8, 700–711.
Franceschini, M.A., Boas, D.A., 2004. Noninvasive measurement of neuronal activity withnear-infrared optical imaging. Neuroimage 21, 372–386.
Franceschini, M., Fantini, S., Thompson, J., Culver, J., Boas, D., 2003. Hemodynamic evokedresponse of the sensorimotor cortex measured noninvasively with near-infraredoptical imaging. Psychophysiology 40 (4), 548–560.
Franceschini, M., Joseph, D.K., Huppert, T.J., Diamond, S.G., Boas, D., 2006. Diffuse opticalimaging of the whole head. J. Biomed. Opt. 11 (5), 054007.
Frederick, B., Hocke, L.M., Tong, Y., 2012. Physiological denoising of BOLD fMRI data usingRegressor Interpolation at Progressive Time Delays (RIPTiDe) processing of concurrentfMRI and near-infrared spectroscopy (NIRS). Neuroimage 60, 1913–1923.
Friston, K.J., 2007. Statistical Parametric Mapping: The Analysis of Functional Brain Images.Academic, London.
Gagnon, L., Cooper, R.J., Yücel, M.A., Perdue, K.L., Greve, D.N., Boas, D.A., 2012. Shortseparation channel location impacts the performance of short channel regression inNIRS. Neuroimage 59, 2518–2528.
Gibson, A.P., Hebden, J.C., Arridge, S.R., 2005. Recent advances in diffuse optical imaging.Phys. Med. Biol. 50, R1–R43.
Gratton, G., Corballis, P.M., 1995. Removing the heart from the brain: compensation forthe pulse artifact in the photon migration signal. Psychophysiology 32, 292–299.
Gregg, N.M.,White, B.R., Zeff, B.W., Berger, A.J., Culver, J.P., 2010. Brain specificity of diffuseoptical imaging: improvements from superficial signal regression and tomography.Front. Neuroenergetics 2 (14), 1–8.
Gustafsson, H., 1993. Vasomotion and underlying mechanisms in small arteries. Anin vitro study of rat blood vessels. Acta Physiol. Scand. (Suppl. 614), 1–44.
Heinzel, S., Haeussinger, F.B., Hahn, T., Ehlis, A.C., Plichta, M.M., Fallgatter, A.J., 2013.Variability of (functional) hemodynamics as measured with simultaneous fNIRSand fMRI during intertemporal choice. Neuroimage 71C, 125–134.
Hoshi, Y., Tamura, M., 1993. Detection of dynamic changes in cerebral oxygenationcoupled to neuronal function during mental work in man. Neurosci. Lett. 150 (1),5–8.
Hoshi, Y., Kobayashi, N., Tamura, M., 2001. Interpretation of near-infrared spectroscopysignals: a study with a newly developed perfused rat brain model. J. Appl. Physiol.90, 1657–1662.
Huppert, T.J., Hoge, R.D., Franceschini, M.A., Boas, D.A., 2005. A spatial-temporalcomparison of fMRI and NIRS hemodynamic responses to motor stimuli in adulthumans. Optical Tomography and Spectroscopy of Tissue VI, Proc. SPIE 5693,p. 191. http://dx.doi.org/10.1117/12.612143 (May 05, 2005).
Huppert, T.J., Hoge, R.D., Diamond, S.G., Franceschini, M.A., Boas, D.A., 2006. A temporalcomparison of BOLD, ASL, and NIRS hemodynamic responses to motor stimuli inadult humans. Neuroimage 29 (2), 368–382.
Jang, K.E., Tak, S., Jung, J., Jang, J., Jeong, Y., Ye, J.C., 2009. Wavelet minimumdescription length detrending for near-infrared spectroscopy. J. Biomed. Opt.14 (3), 034004.
Jasdzewski, G., Strangman, G., Wagner, J., Kwong, K.K., Poldorack, R.A., Boas, D.A.,2003. Differences in the hemodynamic response to event-related motor andvisual paradigms as measured by near-infrared spectroscopy. Neuroimage 20(1), 479–488.
Julien, C., 2006. The enigma of Mayer waves: facts andmodels. Cardiovasc. Res. 70, 12–21.Kirilina, E., Jelzow, A., Heine, A., Niessing, M., Wabnitz, H., Brühl, R., Ittermann, B., Jacobs,
A.M., Tachtsidis, I., 2012. The physiological origin of task-evoked systemic artefacts infunctional near infrared spectroscopy. Neuroimage 61 (1), 70–81.
Kolehmainen, V., Prince, S., Arridge, S.R., Kaipio, J.P., 2003. State-estimation approach tothe nonstationary optical tomography problem. J. Opt. Soc. Am. A Opt. Image Sci.Vis. 20, 876–889 (PubMed: 12747435).
Li, D., Wang, Y., Waight, D.J., 1998. Blood oxygen saturation assessment in vivo using T2⁎
estimation. Magn. Reson. Med. 39, 685–690.Liebert, A., Wabnitz, H., Steinbrink, J., Obrig, H., Möller, M., Macdonald, R., Villringer, A.,
Rinneberg, H., 2004. Time-resolved multidistance near-infrared spectroscopy of theadult head: intracerebral and extracerebral absorption changes from moments ofdistribution of times of flight of photons. Appl. Opt. 43, 3037–3047.
Lina, J.-M., Dehaes, M., Matteau-Pelletier, C., Lesage, F., 2008. Complex waveletsapplied to diffuse optical spectroscopy for brain activity detection. Opt. Express16 (2), 1029–1050.
Lloyd-Fox, S., Blasi, A., Elwell, C.E., 2010. Illuminating the developing brain: the past,present and future of functional near infrared spectroscopy. Neurosci. Biobehav.Rev. 34, 269–284.
MacIntosh, B.J., Klassen, L.M., Menon, R.S., 2003. Transient hemodynamics during a breathhold challenge in a two part functional imaging study with simultaneous near-infrared spectroscopy in adult humans. NeuroImage 20, 1246–1252.
Matteau-Pelletier, C., Dehaes, M., Lesage, F., Lina, J.-M., 2009. 1/f noise in diffuse opticalimaging and wavelet-based response estimation. IEEE Trans. Med. Imaging 28,415–422.
May, L., Byers-Heinlein, K., Gervain, J., Werker, J.F., 2011. Language and the newbornbrain: does prenatal language experience shape the neonate neural response tospeech? Front. Lang. Sci. 2, 222. http://dx.doi.org/10.3389/fpsyg.2011.00222.
Mayhew, J.E.W., Askew, S., Zheng, Y., Porrill, J., Westby, G.W.M., Redgrave, P., Rector, D.M.,Harper, R.M., 1996. Cerebral vasomotion: a 0.1-Hz oscillation in reflected lightimaging of neural activity. Neuroimage 4, 183–193.
Mesquita, R.C., Franceschini, M.A., Boas, D.A., 2010. Resting state functionalconnectivity of the whole head with near-infrared spectroscopy Biomed. Opt.Express 1, 324–336.
Minati, L., Kress, I.U., Visani, E., Medford, N., Critchley, H.D., 2011. Intra- and extra-cranialeffects of transient blood pressure changes on brain near-infrared spectroscopy(NIRS) measurements. J. Neurosci. Methods 197, 283–288.
Obrig, H., Villringer, A., 2003. Beyond the visible — imaging the human brain with light.J. Cereb. Blood Flow Metab. 23, 1–18.
Obrig, H., Neufang, M., Wenzel, R., Kohl, M., Steinbrink, J., Einhaupl, K., Villringer, A., 2000.Spontaneous low frequency oscillations of cerebral hemodynamics and metabolismin human adults. Neuroimage 12 (6), 623–639.
Ogawa, S., Menon, R.S., Tank, D.W., Kim, S.G., Merkle, H., Ellermann, J.M., Ugurbil, K., 1993.Functional brain mapping by blood oxygenation level-dependent contrast magneticresonance imaging. A comparison of signal characteristics with a biophysical model.Biophys. J. 64, 803–812.
Payne, S., Selb, J., Boas, D.A., 2009. Effects of autoregulation and CO2 reactivity on cerebraloxygen transport. Ann. Biomed. Eng. 37 (11), 2288–2298.
Prince, S., Kolehmainen, V., Kaipio, J.P., Franceschini, M.A., Boas, D., Arridge, S.R., 2003.Time-series estimation of biological factors in optical diffusion tomography. Phys.Med. Biol. 48, 1491–1504 (PubMed: 12817933).
Richard, S.B., Querleux, B.G., Bittoun, J., Idy-Peretti, I., Jolivet, O., Cermakova, E., Leveque, J.-L.,1991. In vivo proton relaxation times analysis of the skin layers by magnetic resonanceimaging. J. Invest. Dermatol. 97, 120–125.
Richard, S.B., Querleux, B.G., Bittoun, J., Jolivet, O., Idy-Peretti, I., de Lacharriere, O.,Leveque, J.-L., 1993. Characterization of the skin in vivo by high resolution magneticresonance imaging: water behaviour and age-related effects. J. Invest. Dermatol. 100,705–709.
Saager, R.B., Berger, A.J., 2005. Direct characterization and removal of interferingabsorption trends in two-layer turbid media. J. Opt. Soc. Am. A 22, 1874–1882.
Saager, R.B., Berger, A.J., 2008. Measurement of layer-like hemodynamic trends in scalpand cortex: implications for physiological baseline suppression in functional near-infrared spectroscopy. J. Biomed. Opt. 13, 034017.
Saager, R.B., Telleri, N.L., Berger, A.J., 2011. Two-detector Corrected Near InfraredSpectroscopy (C-NIRS) detects hemodynamic activation responses more robustlythan single-detector NIRS. Neuroimage 55, 1679–1685.
Sassaroli, A., de Blaise, F.B., Tong, Y., Renshaw, P.F., Fantini, S., 2006. Spatiallyweighted BOLD signal for comparison of functional magnetic resonance imagingand near-infrared imaging of the brain. Neuroimage 33 (2), 505–514 (PubMed:16945553).
Scholkmann, F., Gerber, U., Wolf, M., Wolf, U., 2013. End-tidal CO2: an important parameterfor a correct interpretation in functional brain studies using speech tasks. Neuroimage66, 71–79.
Seiyama, A., Seki, J., Tanabe, H.C., Sase, I., Takatsuki, A., Miyauchi, S., Eda, H., Hayashi, S.,Imaruoka, T., Iwakura, T., Yanagida, T., 2004. Circulatory basis of fMRI signals:relationship between changes in the hemodynamic parameters and BOLD signalintensity. NeuroImage 21, 1204–1214.
Siegel, A.M., Culver, J.P., Mandeville, J.B., Boas, D.A., 2003. Temporal comparison offunctional brain imaging with diffuse optical tomography and fMRI during ratforepaw stimulation. Phys. Med. Biol. 48, 1391–1403.
Silvennoinen, M.J., Clingman, C.S., Golay, X., Kauppinen, R.A., van Zijl, P.C.M., 2003.Comparison of the dependence of blood R2 and R2
⁎ on oxygen saturation at 1.5 and4.7 Tesla. Magnetic Resonance in Medicine 49, 47–60.
Song, H.K., Wehrli, F.W., Ma, J., 1997. In vivo MR microscopy of the human skin. Magn.Reson. Med. 37, 185–191.
Steinbrink, J., Villringer, A., Kempf, F., Haux, D., Boden, S., Obrig, H., 2006. Illuminating theBOLD signal: combined fMRI–fNIRS studies. Magn. Reson. Imaging 24, 495–505.
Strangman, G., Culver, J.P., Thompson, J.H., Boas, D.A., 2002. A quantitative comparison ofsimultaneous BOLD fMRI and NIRS recordings during functional brain activation.Neuroimage 17, 719–731.
Strangman, G., Franceschini, M.A., Boas, D.A., 2003. Factors affecting the accuracy of near-infrared spectroscopy concentration calculations for the focal changes in oxygenationparameters. Neuroimage 18 (4), 865–879 (PubMed: 12725763).
Sweeney, K., Ayaz, H., Ward, T., Izzetoglu, M., McLoone, S., Onaral, B., 2012. Amethodology for validating artifact removal techniques for physiological signals.IEEE Trans. Inf. Technol. Biomed. 16 (5), 918–926.
Tachtsidis, I., Elwell, C.E., Leung, T.S., Lee, C.W., Smith, M., Delpy, D.T., 2004. Investigationof cerebral haemodynamics by near-infrared spectroscopy in young healthyvolunteers reveals posture-dependent spontaneous oscillations. Physiol. Meas. 25,437–445.
Tachtsidis, I., Leung, T.S., Chopra, A., Koh, P.H., Reid, C.B., Elwell, C.E., 2009. False positivesin functional near infrared topography. In: Liss, P., Hansell, P., Bruley, D.F., Harrison,
504 S.B. Erdoğan et al. / NeuroImage 87 (2014) 490–504
D.K. (Eds.), Oxygen Transport to Tissue XXX. Advances in Experimental Medicine andBiology. Springer, US, pp. 307–314.
Takahashi, T., Takikawa, Y., Kawagoe, R., Shibuya, S., Iwano, T., Kitazawa, S., 2011.Influence of skin blood flow on near-infrared spectroscopy signals measured on theforehead during a verbal fluency task. Neuroimage 57, 991–1002.
Tanida, M., Sakatani, K., Takano, R., Tagai, K., 2004. Relation between asymmetry ofprefrontal cortex activities and the autonomic nervous system during a mentalarithmetic task: near infrared spectroscopy study. Neurosci. Lett. 369, 69–74.
Tian, F., Niu, H., Khan, B., Alexandrakis, G., Behbehani, K., Liu, H., 2011. Enhanced functionalbrain imaging by using adaptive filtering and a depth compensation algorithm indiffuse optical tomography. IEEE Trans. Med. Imaging 30 (6), 1239–1251.
Tong, Y., Frederick, B.D., 2010. Time lag dependent multimodal processing of concurrentfMRI and near-infrared spectroscopy (NIRS) data suggests a global circulatory originfor low-frequency oscillation signals in human brain. Neuroimage 53, 553–564.
Toronov, V., Franceschini, M., Filiaci, M., Fantini, S., Wolf, M., Michalos, A., Gratton, E., 2000.Near-infrared study of fluctuations in cerebral hemodynamics during rest and motorstimulation: temporal analysis and spatial mapping. Med. Phys. 27 (4), 801–815.
Toronov, V., Webb, A., Choi, J.H., Wolf, M., Michalos, A., Gratton, E., Hueber, D., 2001.Investigation of human brain hemodynamics by simultaneous near-infraredspectroscopy and functional magnetic resonance imaging. Med. Phys. 28, 521.
Toronov, V., Walker, S., Gupta, R., Choi, J.H., Gratton, E., Hueber, D., Webb, A., 2003. Theroles of changes in deoxyhemoglobin concentration and regional cerebral bloodvolume in the fMRI BOLD signal. NeuroImage 19, 1521–1531.
Toronov, V.Y., Zhang, X., Webb, A.G., 2007. A spatial and temporal comparison ofhemodynamic signals measured using optical and functional magnetic resonanceimaging during activation in the human primary visual cortex. Neuroimage 34,1136–1148.
Uludag, K., Müller-Bierl, B., Ugurbil, K., 2009. An integrative model for neuronal activity-induced signal changes for gradient and spin echo functional imaging. Neuroimage48, 150–165.
Umeyama, S., Yamada, T., 2009a. New method of estimating wavelength-dependentoptical path length ratios for oxy- and deoxyhemoglobin measurement using near-infrared spectroscopy. J. Biomed. Opt. 14 (5), 054038.
Umeyama, S., Yamada, T., 2009b. Monte Carlo study of global interference cancellation bymultidistance measurement of near-infrared spectroscopy. J. Biomed. Opt. 14 (6),064025.
Villringer, A., Chance, B., 1997. Non-invasive optical spectroscopy and imaging of humanbrain function. Trends Neurosci. 20, 435–442.
Wang, L., Jacques, S.L., 1995. Monte Carlo modeling of light transport in tissues. In: Welch,A.J., Van Gemert, M.J.C. (Eds.), Optical–Thermal Response of Laser-irradiated Tissue.Plenum, New York.
Wang, L., Jacques, S.L., Zheng, L., 1995. MCML — Monte Carlo modeling of light transportin multi-layered tissues. Comput. Methods Programs Biomed. 47, 131–146 (PubMed:7587160).
Weiss, J., Ericsson, A., Astrom, G., Szomolanyi, P., Hemmingsson, A., 2001. High-resolutionspectroscopic imaging of the human skin. Magn. Reson. Imaging 19, 275–278.
Wise, R.G., Ide, K., Poulin, M.J., Tracey, I., 2004. Resting fluctuations in arterial carbondioxide induce significant low frequency variations in BOLD signal. Neuroimage 21(4), 1652–1664.
Yamada, T., Umeyama, S., Matsuda, K., 2009. Multidistance probe arrangement toeliminate artifacts in functional near-infrared spectroscopy. J. Biomed. Opt. 16 (4),06434.
Zeff, B.W.,White, B.R., Dehghani, H., Schlaggar, B.L., Culver, J.P., 2007. Retinotopicmappingof adult human visual cortex with high-density diffuse optical tomography. Proc.Natl. Acad. Sci. U.S.A. 104 (29), 12169–12174.
Zenker, W., Kubik, S., 1996. Brain cooling in humans—anatomical considerations. Anat.Embryol. 193.
Zhang, R., Zuckerman, J.H., Iwasaki, K., Wilson, T.E., Crandall, C.G., Levine, B.D., 2002.Autonomic neural control of dynamic cerebral autoregulation in humans. Circulation106 (14), 1814–1820.
Zhang, Q., Brooks, D.H., Franceschini, M.A., Boas, D.A., 2005. Eigenvector-based spatialfiltering for reduction of physiological interference in diffuse optical imaging.J. Biomed. Opt. 10 (1), 011014.
Zhang, Q., Brown, E., Strangman, G., 2007a. Adaptive filtering for global interferencecancellation and real-time recovery of evoked brain activity: a Monte Carlo simulationstudy. J. Biomed. Opt. 12 (4), 044014 (Jul.–Aug).
Zhang, Q., Brown, E., Strangman, G., 2007b. Adaptive filtering to reduce global interference inevoked brain activity detection: a human subject case study. J. Biomed. Opt. 12 (6),064009 (Nov.–Dec. 2007b).
Zhang, Q., Strangman, G., Ganis, G., 2009. Adaptive filtering to reduce global interferencein non-invasive NIRS measures of brain activation: howwell and when does it work?Neuroimage 45 (3), 788–794.