Nickson Severian.pdf - of SUA IR
69
FARM SIZE AND AGRICULTURAL PRODUCTIVITY ACROSS MAIZE CROPPING SYSTEMS IN MAIZE PRODUCING DISTRICTS IN TANZANIA MAINLAND SEVERIAN, NICKSON A DISSERTATION SUBMITTED IN PARTIAL FULFILMENT OF THE REQUIREMENTS FOR THE DEGREE OF MASTER OF SCIENCE IN AGRICULTURAL ECONOMICS OF SOKOINE UNIVERSITY OF AGRICULTURE. MOROGORO, TANZANIA. 2019
-
Upload
khangminh22 -
Category
Documents
-
view
2 -
download
0
Transcript of Nickson Severian.pdf - of SUA IR

FARM SIZE AND AGRICULTURAL PRODUCTIVITY ACROSS
MAIZE CROPPING SYSTEMS IN MAIZE PRODUCING DISTRICTS
IN TANZANIA MAINLAND
SEVERIAN, NICKSON
A DISSERTATION SUBMITTED IN PARTIAL FULFILMENT OF
THE REQUIREMENTS FOR THE DEGREE OF MASTER OF
SCIENCE IN AGRICULTURAL ECONOMICS OF
SOKOINE UNIVERSITY OF AGRICULTURE.
MOROGORO, TANZANIA.
2019

ii
ABSTRACT
The evidence over a negative relationship between farm size and productivity in large
global literature is largely dependent on a narrow range of farm sizes excluding medium
and large scale farms. This study was carried out to determine the relationship between
farm size and agricultural productivity over a wider range of farm sizes across maize
cropping systems in maize producing districts of Tanzania Mainland. Specifically, the
study attempts to: (i) estimate the farmers‟ total factor productivity level across maize
cropping systems, (ii) determine the relationship between farm size and total factor
productivity level across maize cropping systems and (iii) identify factors other than farm
size which influence agricultural productivity across maize cropping systems in the study
districts. OLS Regression technique was employed to determine the relationship between
farm size and the level of total factor productivity. Data for the study comprised of 1001
observations randomly selected from ASPIRES Project data set of 1200 observations
comprising of small, medium and large scale farms. The data were collected during the
2015/16 cropping season from eight maize producing districts namely Mvomero,
Kilombero, Njombe, Kiteto, Magu, Moshi Rural, Mkuranga and Liwale in Tanzania
Mainland. The findings indicate variation in the level of total factor productivity (TFP)
across maize cropping systems, ranging from 1.22 for maize-pure stand and 1.64 for
maize-legumes intercropping systems. Contrary to the evidence in favour of inverse
relationship between farm size and productivity, the regression results in this study
indicate a significant and positive relationship between farm size and total factor
productivity level across maize cropping systems. Moreover, other factors including
household size, land slope, source of water and measurement errors had significant
influence on the farm-level productivity across farm size categories and cropping
systems. The study recommends review of the existing agricultural related policies,

iii
strategies and/ or programmes to ensure that medium and large scale farms are also
promoted instead of the currently emphasis on smallholder-lead agricultural growth as
pathway to economic development in the country. Also the following are recommended
in order to improve agricultural productivity and hence increase marketable surplus which
is essential for ensuring adequate supply of raw materials for the agro-industries as the
country is striving to become an industrialized and middle income country: (i) Review of
the National Agriculture Policy 2013 and the Agricultural Sector Development
Programme (ASDP II), (ii) Promoting land productivity enhancing mixed cropping
systems, (iii) Promoting family planning strategies and actions, (iv) supporting low-cost
irrigation strategies and programmes, (v) hastening the process of formalization of land
rights and (vi) providing education on and promoting appropriate farming practices on
hilly/high slope land.

iv
DECLARATION
I, NICKSON SEVERIAN do at this moment declare to the Senate of the Sokoine
University of Agriculture that this dissertation is my original work done within the period
of registration and that it has neither been submitted nor being concurrently submitted in
any other institution.
_________________________ _______________________
Nickson Severian Date
(MSc. Candidate)
The above declaration is confirmed by
_________________________ _______________________
Prof. Ntengua, S.Y.Mdoe Date
(Supervisor)

v
COPYRIGHT
No part of this dissertation may be reproduced, stored in any retrieval system, or
transmitted in any form or by any means without prior written permission of the author or
Sokoine University of Agriculture in that behalf.

vi
ACKNOWLEDGMENTS
I thank God for providing me with the strength, guidance, patience throughout my study
period. I understand without Him this would not be accomplished. Firstly I would like to
express my sincere appreciation to ASPIRES PROJECT-TANZANIA for financing this
study. Special thanks are directed to my research supervisor Prof. Ntengua S.Y. Mdoe of
the Sokoine University of Agriculture (SUA) for his wise advice, constructive comments,
and tireless guidance. Without his efforts to making close follow-ups, my academic career
goals would not be achieved. I am thankful to Prof. Gilead I. Mlay of the SUA for his
valuable support particularly on modeling issues just at the start of data analysis. I also
extend my sincere thanks to Prof. Milu Muyanga of Michigan State University (MSU) for
his constructive comments especially on the methodology section which improved the
analysis and the study in general. I express my sincere appreciation to my family and
friends for their prayers and good advice from the first step up to the last point of this
study.

vii
DEDICATION
This valuable work is dedicated to my beloved parents who laid down the foundation of
my education which made me be the person I am today.

viii
TABLE OF CONTENTS
ABSTRACT .................................................................................................................. ii
DECLARATION ......................................................................................................... iv
COPYRIGHT ............................................................................................................... v
ACKNOWLEDGMENTS ........................................................................................... vi
DEDICATION ............................................................................................................ vii
TABLE OF CONTENTS .......................................................................................... viii
LIST OF TABLES ...................................................................................................... xii
LIST OF FIGURES ................................................................................................... xiii
LIST OF APPENDICES ........................................................................................... xiv
LIST OF ABBREVIATIONS ..................................................................................... xv
CHAPTER ONE ........................................................................................................... 1
1.0 INTRODUCTION................................................................................................ 1
1.1 Background Information ........................................................................................ 1
1.2 Problem Statement and Justification ....................................................................... 4
1.3 Objectives of the Study .......................................................................................... 5
1.3.1 Overall objective ......................................................................................... 5
1.3.2 Specific objectives of the study ................................................................... 5
1.4 Study Hypotheses .................................................................................................. 6
CHAPTER TWO .......................................................................................................... 7
2.0 LITERATURE REVIEW .................................................................................... 7
2.1 Theoretical Framework .......................................................................................... 7
2.2 Empirical Studies on Farm size-Productivity Relationship ..................................... 9

ix
2.2.1 Studies which support the IR hypothesis ..................................................... 9
2.2.2 Studies refuting the IR hypothesis ............................................................. 13
2.3 Lessons Learned and the Study Gap from the Reviewed Literature ...................... 14
CHAPTER THREE .................................................................................................... 15
3.0 METHODOLOGY ............................................................................................ 15
3.1 Theoretical Model ................................................................................................ 15
3.1.1 Specifying the Cobb-Douglas production function and TFP ...................... 15
3.2 Empirical Model Specification and Estimation ..................................................... 15
3.2.1 Estimation of the relationship between TFP, farm size and other socio-
economic factors hypothesized to influence TFP ...................................... 16
3.3 A priori Expectations for the Explanatory Variables in the Model ......................... 18
3.4 Data, Data Processing and Analysis ...................................................................... 21
3.4.1 Data……… .............................................................................................. 21
3.4.2 Data processing and analysis ..................................................................... 21
CHAPTER FOUR ...................................................................................................... 23
4.0 RESULTS AND DISCUSSION ......................................................................... 23
4.1 Socio-economic Characteristics of the Sample Households and Household
Heads .................................................................................................................. 23
4.2 Farm (field) characteristics ................................................................................... 24
4.3 Land Area Planted and Measurement Errors ........................................................ 27
4.4 Relationship between Productivity and Farm Size ................................................ 28
4.4.1 Total factor productivity across farm size categories ................................. 28
4.4.2 Relationship between TFP and land area under maize ............................... 28

x
4.4.2.1 Graphical analysis of the relationship between TFP and
maize area planted ...................................................................... 28
4.4.2.2 Total factor productivity and area planted across maize
cropping systems ........................................................................ 30
4.4.2.3 Validity of the results of the TFP and farm size across maize
cropping systems ........................................................................ 30
4.5 Results of Econometric Analyses ......................................................................... 32
4.5.1 Relationship between farm size and productivity across various
plot size categories ................................................................................... 32
4.6 Relationship of Farm Size and Total Factor Productivity across Maize
Cropping Systems................................................................................................ 35
4.7 Summary of the Key Findings .............................................................................. 38
CHAPTER FIVE ........................................................................................................ 40
5.0 CONCLUSIONS, CONTRIBUTION OF THE STUDY,
RECOMMENDATIONS AND SUGGESTIONS FOR FURTHER
STUDIES ........................................................................................................... 40
5.1 Conclusions ......................................................................................................... 40
5.2 Contribution of the Study ..................................................................................... 41
5.3 Recommendations ................................................................................................ 42
5.3.1 Review of the current National Agriculture Policy and the
Agricultural Sector Development Programme (ASDPII) .......................... 42
5.3.2 Promoting land productivity enhancing mixed cropping systems ............... 42
5.3.3 Promoting family planning strategies and programmes ............................. 43
5.3.4 Supporting low cost irrigation strategies and programmes ......................... 43
5.3.5 Hastening the process of formalizing land property rights ......................... 43

xi
5.3.6 Providing education on and promoting appropriate farming
practices on hilly/slope land ..................................................................... 44
5.3.7 Building Capacity for Extensive use of Geographical Information
Systems and Technology (GIS/GIT) ......................................................... 44
5.4 Suggestions for Further Studies ............................................................................. 45
REFERENCES ........................................................................................................... 46
APPENDICES ............................................................................................................ 54

xii
LIST OF TABLES
Table 1: Definition, measurement and expected signs for the variables
in the model .............................................................................................. 19
Table 2: Socio-economic characteristics of sample households and
household heads by farm size .................................................................... 23
Table 3: Farm (field) characteristics across farm size categories.............................. 25
Table 4: Land area planted and area measurement errors by farm size
categories .................................................................................................. 27
Table 5: Average total factor productivity across farm size categories ..................... 28
Table 6: Average total factor productivity and area under maize across
maize cropping systems............................................................................. 30
Table 7: OLS regression estimates for total factor productivity across
farm size categories ................................................................................... 33
Table 8: OLS regression estimates for total factor productivity across
maize cropping systems............................................................................. 36

xiii
LIST OF FIGURES
Figure 1: Relationship between Farm Size and Productivity ...................................... 29

xiv
LIST OF APPENDICES
Appendix 1: Dummies for Maize Cropping Patterns ...................................................... 54

xv
LIST OF ABBREVIATIONS
AfDB African Development Bank
ASDP Agricultural Sector Development Programme
ASPIRES Agricultural Sector Policy and Institutional Reform Strengthening
DEA Data Envelopment Approach
GPS Global Positioning System
Ha Hectare
IR Inverse Relationship
KG Kilogram
NBS National Bureau of Statistics
PFP Partial Factor Productivity
SFA Stochastic Frontier Analysis
SPSS Statistical Package for Social Sciences
SSA Sub-Saharan Africa
TFP Total Factor Productivity
UNCTAD United Nations Center for Trade and Development
UNDP United Nations Development Programme
URT United Republic of Tanzania

1
CHAPTER ONE
1.0 INTRODUCTION
1.1 Background Information
Small farms hold most of the economic livelihoods in Africa and the world at large. It is
estimated that about 500 million farms in the world are no more than 2 hectares and these
control about 98% of all farms and 53% of total agricultural land (UNCTAD, 2015;
Lowder et al., 2016). Similarly, majority of food production in Asia and the Pacific
region is done on small farms of 2 hectares accounting for 80% of total farm land where
as in Africa, Europe and Latin America, food produced on the small farms of 2 ha
accounts for 8%, 4% and 1%, respectively (Graeub et al., 2016).
In sub-Saharan Africa, Jayne et al. (2016) found that only 20%, 32%, 39% and 50% of
total farmland in Kenya, Ghana, Tanzania and Zambia respectively is within a range of 5-
100 ha. Since small-scale farms constitute a huge number of farms in Africa and since
majority of the region‟s rural population obtain their livelihoods from farming,
government leaders and agricultural economists have for decades conventionally believed
and adopted a smallholder-led strategy as the best pathway to economic development in
Africa (Hazell et al., 2007; Graeub et al., 2016). Conversely, some researchers like
Collier and Dercon (2014) have raised concerns on the sustainability of a smallholder-led
growth strategy in Africa following the current efforts of African governments to
transform their traditional agricultural sectors into more modern sectors to enhance
economic transformation (African Development Bank, 2017). This has led to the
emergence of medium-and large-scale farms with at least five hectares (Jayne et al.,
2016), leaving majority of the farmers with their small plots and limited opportunity for
expansion and productivity.

2
Based on yield per land size as a common measure of land productivity in most studies,
the evidence indicates that majority of small farms‟ productivity in most of developing
countries including Tanzania, is still the lowest, despite various programs like the
Agricultural Sector Development Programs (ASDPs) in Tanzania, perpetuated to boost
smallholder farmers (URT, 2010; UNDP and URT, 2014). As of recent, the yields for the
major crops in Tanzania stand at only 1.2 t/ha for maize, paddy (1.7 t/ha), sorghum (0.8
t/ha), wheat (0.9 t/ha) and beans (0.6 t/ha) compared to 4.9 t/ha for maize globally
(Karugia et al., 2013; NBS, 2017). These yield data seem incongruent with the evidence
on the inverse farm size-productivity relationship that is revealed in most studies. It has
been generally found that small farms' productivity is higher than that of large farms
(collectively referred to as farm size-productivity IR).
However, major observations in those studies constitute small-sized farms usually
between zero and five hectares (Carletto et al., 2013). Since rapid changes in farm
structure are being revealed in most parts of Sub-Saharan Africa (Jayne et al., 2016),
further studies to test the farm size-productivity relationship need to at least incorporate
the medium farms with 5-100 ha and large farms with 100 ha and above to guide policy
decisions.
Moreover, various cropping systems including mixed and sole cropping, are being
practiced in Africa (Mkonda and He, 2016). The reasons for the choice of these cropping
systems include agroecological factors like weather changes, proneness to infestations
and soil fertility and economic factors like maximization of returns (Amos, Chikwendu
and Nmadu, 2004; Sigh and Yadav, 2014; Arce and Caballero, 2015). This may lead to
variation in land productivity across the cropping systems. While there is limited evidence
particularly in Tanzania, on the influence of cropping systems on land productivity, this

3
study contributes to fill this gap by studying the relationship between farm size and
agricultural productivity across maize cropping systems in Tanzania Mainland.
Several studies in Africa have examined farm size-productivity relationship based on data
that are generally considered representative of smallholder farms (Carletto et al., 2013:
2015). Their findings in favor of IR hypothesis deserve recognition, but with caution as
such studies can no longer address land and agricultural policy concerns about land
distribution that are debated in Africa today.
For that matter, this study brings in empirical evidence to enrich the on-going debate on
farm size-productivity IR in two major ways. First, the farm size-productivity relationship
is studied over a relatively wide range of farm sizes including small-, medium-, and large-
scale farms. Second, unlike most IR studies, the current study utilizes total factor
productivity (TFP), an approach arguably considered more eloquent as it measures the
returns on all factors of production and incorporates the production costs. The study uses
data extracted from ASPIRES-Tanzania project data set comprising of 600 small scale
farmers and 600 medium and large scale farmers, collected from eight maize producing
districts of Tanzania Mainland.
Besides, the study estimates the influence of measurement errors on the relationship
between farm size and productivity and finally, it provides evidence on-farm size-
productivity relationship across maize cropping systems thought to influence farm size
and its relationship with land productivity.

4
1.2 Problem Statement and Justification
A smallholder lead-growth development strategy has been key for development in most
developing countries following the evidence that small farms constitute the majority and
contribute significantly to the economies' well-being. However, some evidence from other
areas are against the small farms' strategy and suggest that both farm sizes are crucial for
sustainable development. Additionally, various measures of agricultural productivity have
been used depending on the data constraints. Measures such as yield in kilograms per unit
land area cultivated and/ or net value of output per unit land area cultivated, are some of
the most common ones. However, the former has been widely used due to the challenges
encountered in obtaining accurate price data for the majority of smallholder producers
which limit the latter.
Moreover, smallholder farmers especially in rural Tanzania, practice multiple or mixed
cropping systems and /or enterprise rotations as a strategy to mitigate production risks or
improving the income portfolio. This makes use of crop yields less useful especially when
the farm level aggregate measure of performance is desired. To this stance, total factor
productivity (TFP) as opposed to partial factor productivity (PFP) per unit land area
cultivated improves the productivity measurement.
Since mixed cropping systems embrace varied sources of livelihoods (Mdoe et al., 2015),
their corresponding farm-level productivities will also vary accordingly (Dixon et al.,
2014; Baksiene et al., 2014). However, there is little empirical evidence if any, on the
analysis of farm size-productivity relationship across different cropping systems in SSA
(Lokina et al., 2011; Wineman and Jayne, 2018). Furthermore, there is limited empirical
evidence on how measurement errors and soil quality variability across various cropping
systems influence the IR of farm size- productivity (Savastano and Scandizzo, 2017).

5
To address this problem, this study calculates measurement discrepancies using self-
reported and Global Positioning System (GPS) data on farm size to estimate their
corresponding influence on farm/plot level productivity across a range of farm sizes and
maize cropping systems.
Nonetheless, soil quality dummy variable is included in the analysis to capture the soil
quality bias. Hence, the study‟s outcomes add to the existing empirical evidence on-farm
size-productivity relationship across maize cropping systems and thereby providing useful
information to stakeholders in the agricultural sector in determining the best routes to
boost agricultural productivity.
1.3 Objectives of the Study
1.3.1 Overall objective
The overall objective of the study was to determine the relationship between farm size
and agricultural productivity across maize cropping systems in eight maize producing
districts of Tanzania Mainland.
1.3.2 Specific objectives of the study
The specific objectives of the study were to:
i. Estimate the farmers‟ total factor productivity level across maize cropping systems
in the study districts,
ii. Determine the relationship between farm size and total factor productivity level
across maize cropping systems in the study districts and
iii. Identify other factors than farm size which influence agricultural productivity across
maize cropping systems in the study districts.
6
1.4 Study Hypotheses
The study has three hypotheses stated as follows:
H01: The farmers‟ total factor productivity level across maize cropping systems in the
study districts does not vary significantly.
H02: Farm size has no influence on total factor productivity level across maize cropping
systems in the study districts.
H03: Factors other than farm size do not influence the level of total factor productivity
across maize cropping systems in the study districts.

7
CHAPTER TWO
2.0 LITERATURE REVIEW
2.1 Theoretical Framework
The study of agricultural productivity has its foundation in the theory of the firm with the
assumption that economic entities are rational decision-makers. In this case, farmers are
assumed to be rational in the way they make enterprise mix and production decisions in
using their resource endowments. If they are more efficient or productive, they are
expected to use fewer resources as possible without compromising their ultimate goal (s)
including food self-sufficiency, profit maximization and/ or cost minimization. However,
the measurement of efficiency depends on whether parametric or non-parametric
approaches are used and whether a partial or total measure of productivity is used.
By controlling for cropping systems, this study adopted the parametric approach to
estimate the TFP level as it depicts the overall measure of farmers‟ performance. This is
illustrated using a two-input production function. The inputs are Capital (K) and Labour
(L), and the corresponding output level is Q resulting from the combination of K and L
and A is the efficiency of using the inputs as presented in equation (1).
( ) ( )
Where; A measures the level of agricultural productivity (TFP) resulting from other
factors than the growth or improvement in the level of use of inputs such as K and L, f(.)
represents the functional form appropriate for the production of Q from K and L.
The literature provides two common approaches to estimate TFP in (1) above namely,
parametric/econometric and non-parametric approaches. The major difference in these
approaches is the assumption made about technical efficiency. While the latter assumes

8
that production is always at the frontier, the former account for inefficiency which may
influence the level of output. Also, there are two methods used to estimate TFP
corresponding to the above approaches namely, Stochastic Frontier Analysis (SFA) and
Data Envelopment Approach (DEA).
The SFA uses the econometric approach which accounts for the inefficiencies associated
with measurement errors or noise in the system. The DEA, however, assumes that one can
easily identify the best farmer from which others will be compared. Also, unlike the SFA,
the DEA approach does not account for the possibility of other factors beyond farmers'
control which may have a consequence on the level of TFP. Moreover, due to its ability to
incorporate into the analysis of the inefficiency factor, the SFA in the parametric
approach was chosen for this study. In the parametric approach, the Cobb-Douglass (C-D)
and/ or Trans-log functional approaches are widely adopted as it conforms to most of the
agricultural settings in the developing countries (Goksel and Ozden, 2007; Mburu et al.,
2014). Owing to this, the C-D function under the SFA approach was adopted in this study
to estimate the farmers‟ level of TFP across maize cropping systems in the maize
producing districts of Tanzania Mainland.
Borrowing from Goksel and Ozden (2007) and assuming that a production technology
follows a conventional Cobb-Douglass production function, and that the gross values of
output per household obtained using at least three basic inputs: land, labor and
intermediate input (materials) could be calculated, the TFP index assuming zero time-
variant (i.e. t = 0), was derived as in equations (2)-(5) below:

9
( )
∑
( )
Where „A‟ in equations 2 and 3 measures the efficiency (TFP) with which inputs (land
(L), man-days worked (D) and material inputs (M) were transformed into a gross value of
total output per farm per household (Q) and „u‟ accounts for the inefficiency factor (s).
The parameters α, β, and γ are output elasticities estimated using equations 4 and 5 below:
(4)
( ) (5)
Equation (5) implies that TFP is an increase in output not accounted for by the increase in
the level of inputs usage and systematic error in the measurement as highlighted above.
Under the above framework, the most productive farmer was expected to have a TFP
level of 1 unit and any deviations accounted for inefficiencies.
2.2 Empirical Studies on Farm size-Productivity Relationship
2.2.1 Studies which support the IR hypothesis
The negative relationship between farm size and productivity has been a subject of debate
among scholars for many decades now. This phenomenon is generally termed as farm
size/plot size-productivity Inverse Relationship (IR). In this section, studies which
confirmed negative relationship between farm size and productivity are reviewed. The
pioneering work by Chayanov (1926) deserves recognition as being the first to observe
that small farms in Russia tended to obtain higher crop yields per unit of land cultivated
than large farms do. This evidence was then reinforced by Sen (1962: 1964) who also
found similar results using Land Management Survey data of Asian Agriculture.
Afterwards, there have been various attempts to test the farm size-productivity IR

10
hypothesis across diverse studies as briefly presented below. Sial et al. (2012) tested the
existence of inverse relationship between farm size and productivity by using yield
approach and OLS estimation technique and a small data set with 302 observations from
Central Punjab, comprising of small farms and large farms. A strong inverse relationship
was confirmed in the small farms group and positive relationship was observed for the
large farms group. Similar results were found Kian (2008) in Pakistanian agriculture he
found a strong inverse relationship between yield and unit of land cultivated.
Additionally, Assuncao and Braido (2007) tested the relationship between yield per unit
area cultivated and farm size using the ICRISAT/VLS survey data and found that the IR
was upheld after controlling for modes of production and supervision costs which were
formerly theorized to remove IR in farm size –productivity estimates. Concurrently, a
strong negative relationship between farm size and productivity measured as yield per
unit of land cultivated was upheld in rural Rwanda at least with studies of Ansoms et al.
(2008); Ali and Deininger (2015) and Nilsson (2018). Moreover, the negative relationship
between output per unit of land cultivated and farm size was also revealed in studies
conducted in Zambia, Uganda, Malawi and Rural Ethiopia (Kimhi, 2006; Carletto et al.,
2013; Holden and Fisher, 2017; Desiere and Jollife, 2018).
Apart from the above studies, Msangi and Mdoe (2018) examined the Inverse
Relationship between Farm Size and Technical Efficiency in Tanzanian Agriculture
using National Panel Survey (NPS) data for 2008/09, 2010/11 and 2012/2013. Their
findings confirmed the existence of inverse relationship between farm size and technical
efficiency in Tanzanian agriculture. However, the strength of IR between farm size and
technical efficiency decreased after controlling for soil quality and when GPS farm size
were used instead of farmer reported farm size data. Likewise, Boulay (2018) used

11
agricultural survey data on Tanzania, and introduced a crop/plot level analysis to test
whether an inverse relationship exists for crops grown on a given plots. Various
propositions including the statistical fallacy and cropping practices were controlled in the
estimated models to see if the IR hypothesis could be reduced or eliminated. The findings
revealed a strong inverse relationship across all crops studied including maize.
However, various explanations have been raised in favour of the IR hypothesis including
omission of input costs particularly family labor, existence of imperfect factor markets in
rural agriculture, costs of supervising hired labor relative to own family labor, presence of
regular measurement errors and omitted variable issues, are often times been associated
with the existing IR between farm size and productivity.
It has been argued that family labor are intensively used in small farms in developing
economies and thus a low imputed opportunity cost of the same amplifies the net value of
output per unit of land cultivated than the case in large farms (Hazell et al., 2010), hence
an inverse farm size-productivity relationship (IR).
Additionally, as residual petitioners to farm profits or outputs, owner-operators (family
labor) tend to exert more efforts on managing and operating the farm than hired large
farm managers. As Assuncao and Braido (2007) explained, the owner-operators tend to
have a better knowledge of local soil and climatic conditions being accumulated over
generations which give small farm operations an advantage over non-family operated
large farms. Moreover, food self-sufficiency motive being accompanied by imperfect land
and labour markets prevalent in rural areas, explain in part the existing IR between farm
size and productivity (Ansoms et al. (2008). The other reason believed to explain the IR
in farm size and productivity estimations is statistical fallacy or bad data especially on
12
land size and farm output. Assunção and Braido (2007) and Boulay (2018) were of the
view that, the lack of land quality issues amplifies the existence of inverse relationship
between farm size and productivity. It is also argued that small farms appear to be more
productive because owner-operators tend to farm their highest quality land and sell or rent
out less fertile land (Larson et al., 2013). However, the IR consistently still holds even
after controlling for land quality and unobserved effects using panel data (Barrett et al.,
2010; Foster and Rosenzweig, 2017).
The differences in land fragmentations, edge effect, cropping intensity and farm watering
systems may explain in part the existence of farm/plot size-output IR (Imai et al., 2015;
Bevis and Barret, 2016; Reuben et al., 2017). Moreover, other studies associate the
prevalence of inverse farm size-productivity relationship with the edge effect that is
dominant in most of the farming practices (Nkonde et al., 2015). Foster and Rosenzweig
(2017) found that intensive use of modern technology like mechanization and precision
farming relevant in large farms may reverse the inverse farm size-productivity
relationship.
Furthermore, Carletto et al. (2013); Dillon et al. (2016) and Gollin (2017) and found that
regular measurement errors in respondent-reported plot sizes explain in part the
prevalence of IR hypothesis. However, Savastano et al. (2017) and Boulay (2018) used
GPS plot data of rural Ethiopia and Tanzania, respectively, which were believed to be
superior to self –reported plot data and still the slope for the relationship between farm
size and productivity was steeper when GPS data was used than the case for self-reported
data. However, most of the evidence in favour of IR hypothesis in farm size productivity
studies is largely based on smallholder farmers.

13
2.2.2 Studies refuting the IR hypothesis
Besides the existing body of evidence in favour of the IR hypothesis, several studies have
found positive relationship between farm size and productivity including (Kiani, 2008;
Mburu et al., 2014; Singh and Yadav, 2014; Srinivasulu et al., 2015; Nilsson, 2018 and
Muyanga and Jayne, 2019). In particular, Muyanga and Jayne (2019) used a relatively
wider range of farm sizes in Kenya to test the inverse relationship hypothesis by using
three different measures of productivity including profit per hectare and total factor
productivity and found a strong positive relationship between farm size and productivity
emerging within the 5 to 70 hectare range of farm sizes. However, across all the range of
farm sizes studies, farms in the range of 20 to 70 hectares were found to be more
productive than farms under 5 hectares.
On the other hand, other studies found a U-shaped relationship between farm size and
productivity like Kimhi (2006), Foster and Rosenzweig (2017) and Milu and Jayne (2019)
while other studies showed weaker inverse relationship including Desiere and Jollife
(2018).
Despite the existing differences in methods and data leading to the above findings, these
studies agree in common that IR can shield off if the data is large enough to cover for
various farm sizes, and also if the estimation strategy is well formed based on theory.
Other explanations underlying the above conclusions over the relationship between farm
size and productivity particularly in this sub-section can be as similar as those of section
2.2.1 above. This study utilizes ASPIRES data collected from 600 small scale and 600
medium/large scale farmers across eight maize producing districts of Tanzania Mainland
to examine whether the IR hypothesis is upheld even after controlling for cropping
systems in maize farms.

14
2.3 Lessons Learned and the Study Gap from the Reviewed Literature
The existing evidence suggests a combination of SFA based on econometric theory and
DEA based on optimization theory has been used in estimating agricultural productivity
across farms. The choice of the two depends on the underlying assumptions about the
distribution of the stochastic component and/ or functional forms under which the
production process fits. However, in economic reality, stochastic noise, as well as
measurement discrepancies are inevitable. Recognizing this fact, SFA has been superior
over DEA in analyzing the farm size-productivity relationship.
On the farm size-productivity relationship, the evidence is largely mixed, suggesting
differences in data, research methods, and modeling issues. Also, most of the previous
studies on farm size-productivity have been inclined on partial productivities such as land
and/or labour- productivity which may end up with biased conclusions especially in
multiple or diverse cropping systems prevalent in rural SSA.
Furthermore, most of the evidence on-farm size-productivity relationship are based on
national aggregates which do not capture differences in productivity across farming
systems and/or cropping systems in various agro-ecological zones. However, even for the
little evidence at the regional or district level, none have analyzed farm size-productivity
relationship across maize cropping systems and with a considerable range of farm sizes.
Therefore, the current study seeks to fill this gap by contributing empirical evidence on-
farm size-productivity relationship across a range of farm sizes and maize cropping
system in eight maize producing districts in Tanzania Mainland using the total factor
productivity (TFP) approach.

15
CHAPTER THREE
3.0 METHODOLOGY
3.1 Theoretical Model
Referring to section 3.1.1 in Chapter Three, the C-D functional form, as opposed to any
others forms, was used in this study to estimate the level of TFP since it is easy to handle
and above all, it conforms to the theory, data and design of the study. Equations (6-10)
show how the TFP was estimated under the framework of the C-D production function.
3.1.1 Specifying the Cobb-Douglas production function and TFP
Cobb-Douglas production function was generally expressed as;
(6).
Where A measures the efficiency or TFP, Q is the gross aggregated value of maize output
per season per year per farm unit. X is the vector of inputs used by the household per unit
of the farm in the year of study and β is the vector of parameter coefficients which
measure partial output elasticities while „u' account for a stochastic component that may
deter the efficiency with which Q is produced. From eq. (6) above, TFP of the ith
farmer
was generated as in equation 7.
∑
( )
Thus, the magnitude of A in (7) above was thought to be 1 for the most efficient farmers
and any deviations amounted to inefficiencies.
3.2 Empirical Model Specification and Estimation
The simple Cobb-Douglas function in equation 6 above was used to “estimate farmer‟s
TFP level across maize cropping systems” and was expanded to include four variables

16
denoted as Xi1 to Xi4 as indicated in equation 8. The TFP level of the ith
farmer was then
estimated as in equations 9 and 10 below. The selected explanatory variables in the above
models are supported by the existing empirical literature and the available data.
(8).
( ) ( ) ( ) ( ) ( ) ( )
( ) ( ) ( ) ( ) ( ) ( ).
Where Ln is the natural log and Ai is the efficient parameter (i.e. TFP) that was estimated
as β0 in (10). Qit is the aggregated gross value of maize output (in Tanzanian Shillings
(TZS) for the ith
farmer grown in the main season for the year 2015/2016 and X1 to X4 are
the planted acres, amount of labour supply (adult equivalent man-days), cost of seeds
(TZS) and cost of fertilizer (TZS) used in the production process while β1 to Β4 is the
estimated output elasticities. The term νi is a random error term assumed to be
independent and identically normally distributed with μ= 0 and δv2 and υi>=0 is the
inefficiency parameter which is also assumed to be independent but half-normally
distributed with μ= 0 and δv2. If the i
th farmer attains a maximum potential output Q at a
given production technology, the value of υi was assumed to be zero in absolute terms. So
the presence of inefficiencies lowers the productive efficiency (i.e. TFP).
3.2.1 Estimation of the relationship between TFP, farm size and other socio-
economic factors hypothesized to influence TFP
Equation (11) shows the empirical model estimated the relationship between TFP, farm
size and socio-economic factors hypothesized to influence TFP.

17
( )
In equation (11) above, TFPij is the jth
farm plot level TFP for the ith
maize farmer in the
main farming season 2015/16, is the land area under maize planted in acres measured
both as farmer-reported and GPS based plot size. The sign of the estimated parameter of
the area planted (θ1) was thought to explain the strength and magnitude of the relationship
between the land area under maize and farm size. Ei1 stands for the difference between
GPS based-and the farmer‟s self-reported measures maize plot in acres which control for
measurement errors in the estimation of the farm size-productivity relationship. Di1… Di10
are dummies to control for cropping systems, farm-level characteristics as well as
household heads' characteristics (see Table 1 and Appendix 1).
The parameters ϕ1 and ϕ2 were estimated to control for the possible interactions between
cropping patterns and farm size in the estimation of TFP and the effects of other
explanatory variables were estimated through parameters αi. The terms HH Size, WT and
MF stand for the household members, walking time in minutes from home to the farm,
and months worked on the farm by the household head, respectively. The term εi is the
error term incorporating random errors and inefficiency factors as explained in 3.2 above.
Table 2 in appendix 1 shows the expected signs of the estimated parameters which are
explained in section 3.3 below;

18
3.3 A priori Expectations for the Explanatory Variables in the Model
Table 1 shows the definition, measurement and expected signs for the variables included
in the empirical model. The maize planted area measured in acres was used as farm size
in this study to measure its relationship with farm level productivity measured as total
factor productivity (TFP). Usually, a positive relationship between farm size and
productivity is expected, however, the existing empirical evidence suggests mixed signs.
Since the ignorance of land measurement errors has been associated with the existing
farm size-productivity IR, this study incorporated the measurement discrepancy (bias) as
explained in section 3.2.1 above, to estimate its influence on farm-level productivity. The
positive bias implies an underestimation of self-reported measures of land area planted
(acres) and may accelerate the positive relationship between farm size and farm-level
productivity and the opposite case for the negative bias.
Besides, if crops are grown on fertile soil under good conservation practices and being
timely planted, then higher crop productivity per unit of land planted is expected.
Additionally, it is expected that farms located near the homesteads will have close
monitoring and minimum or no cases of crop losses due to theft and animal attacks and
hence would produce higher levels of productivity, holding other factors constant.

19
Table 1: Definition, measurement and expected signs for the variables in the
model
Variables Definition and Measurement Expected
Signs
Planted land area (X1) Land planted with maize in acres +/-
Land measurement error (Ei1) Measured as the difference between self-
reported farm size and GPS farm size
+/-
Age of Household head (Age) Measured as number of years since birth -
Household size (Size) Number of persons in a household -/+
Months worked in farm
(Months)
Number of months the head of household
worked on the family farm.
+
Base/reference cropping
system (Di0)
Cropping system_1 (Di1)
Cropping system_2 (Di2)
Maize pure stand cropping system was
treated as the reference cropping system
System dummy1: 1 if mixed maize with
legumes, 0 otherwise
System dummy2: 1 if mixed maize with
non- legumes, 0 otherwise
+/_
_/+
Sex of household head (Di2) Dummy variable: 1 if male, 0 otherwise +
Education of household head
(Di3)
Dummy variable: 1 if completed primary
and above, 2 if otherwise
Group membership of the
household head (Di4)
Dummy variable: 1 if Yes, 0 if No +
Time taken from home to the
farm in minutes (W_t)
Walking distance in minutes from
homesteads to the farm
_
Use of fertilizer (Di5) Dummy variable: 1 if applicant of
fertilizer, 0 if non applicant
+
Slope of the farm (Di6) Dummy variable: 1 if flat/moderate slope,
0 if other slope patterns
+/_
Fertility status (Di7) Dummy variable: 1 if fertile, 0 if not +
Tenure status (Di8) Dummy variable: 1 if the farm is owned, 0
otherwise
+
Source of water for the maize
crops (Di9)
Dummy variable: 1 if rain-fed, 0 if other
sources like irrigation by pipes, gravity,
manual or both rainfall and irrigation were
used
_
Experience on crop losses
(Di10)
Dummy variable: 1 if the farm field ever
experienced any crop losses, 0 if not
_
Moreover, if the farm fields are used to experience crop losses or shocks, then the
resulting level of productivity per farm/plot will be low and vice versa for the case when
there are limited or no cases of crop losses due to either failure, drought, heavy winds,
floods, crop theft or unlawful animal grazing (Madau, 2011; Mburu et al., 2014). Also,

20
practicing mixed cropping systems reduces the risk of crop failures which then brings a
positive influence on farm-level productivity.
Moreover, farms of household heads allocating enough time to work on their farms are
expected to perform better in terms of productivity than their counterparts. Hence, under
ceteris paribus, the more months a farmer allocates to work on his or her farm the higher
the gross value of the resulting output and hence higher level of total factor productivity.
Similarly, the increase in the expenditure on intermediate inputs like fertilizers and seeds
reduces farmer's efficiency in terms of profitability which then discourage input
acquisitions to investment in farm production and hence low level of productivity
(Madau, 2011). Additionally, the household head‟s age used as the proxy for farming
experience, is expected to have positive influence on productivity that is the older the
farmer the higher the efficiency in farming and hence higher productivity.
Conversely, the larger the household size the lower the efficiency in farming due to the
increased cost of taking care of the family, ceteris paribus (Madau, 2011). Additionally,
Rangel and Thomas (2012) and Mukasa and Salami (2015) and hold the view that farms
of households headed by male perform better in terms of efficiency than their female
counterparts due to the differences in social and economic roles they play. If this is
maintained, the current study findings are thought to give similar results.
Furthermore, if farmers are adequately educated/trained on the best farm practices, they
will have proper knowledge and skills to enable them improve farm productivity.
Likewise, this study expects a positive relationship between the level of education a
farmer has and level of farm productivity, holding other influential factors the same.

21
3.4 Data, Data Processing and Analysis
3.4.1 Data
The study utilized the data set of ASPIRES project-Tanzania established in 2016. The
data comprised of 600 small scale farmers and 600 medium/large scale farmers randomly
selected from eight maize producing districts, namely Mvomero, Kilombero, Njombe,
Kiteto, Magu, Moshi Rural, Mkuranga and Liwale of Tanzania Mainland. The data set
comprises of socio-demographics as well as economic information that were important in
this study. It also comprises of farm size measurements as reported by farmers at the
household level as well as GPS estimates believed to control for possible measurement
errors associated with the estimation by farmers. Since this study is concerned with farm
size and productivity relationship in maize cropping systems, the sample for the study
involved only 1001 farmers out of the 1200 farmers equivalent to 83.42% as they reported
to have grown maize in the 2015/2016 main season. The data processing and analyses
were manifested in various soft wares as outlined in the subsection below.
3.4.2 Data processing and analysis
The ASPIRES data set were stored in the SPSS file from where it was downloaded for
various data manipulations/analyses. In order to estimate the total factor productivity
(TFP) per household, the gross value of maize output was calculated as the sum of total
maize harvested in kilograms per household multiplied by average farm gate price per
kilogram as received by farmers in the 2015/2016 main farming season. Costs for seed,
fertilizer, labour and land as major inputs used in production were considered in this
study. The cost for seeds and fertilizer used in production, reported per acre of land
cultivated were multiplied by the total area cultivated to get the total costs. Also, the cost
of land cultivated were taken as the average imputed value of land cultivated per acre as
reported by farmers multiplied by total area cultivated by an individual household in the

22
sample. The labour input cost was calculated as the sum of household labour cost and
hired cost per activity per acre cultivated multiplied by the total area under maize in acres
per household. All the costs computations were manifested in the SPSS software and
were reported in Tanzania Shillings (TZS). Moreover, the regression models as specified
in the section 3.2 and sub-section 3.2.1 above were run using the SPSS commands and the
results are presented in the following chapter.

23
CHAPTER FOUR
4.0 RESULTS AND DISCUSSION
4.1 Socio-economic Characteristics of the Sample Households and Household
Heads
Table 2 shows that household heads in the large maize farms category had an average age
of 53.3 years which is higher than the rest of farm size categories. As it was expected,
older household heads were found to own large farms than young household heads,
probably because of having various savings and knowledge that were accumulated over
time. Also, the results indicate that the mean months worked by the household head in the
family‟s farm in the large farms' category was approximately 1 month lower than the rest
of farm size categories. This may be because large farms use modern equipment (capital-
intensive) compared to small farms which are labour-intensive.
Table 2: Socio-economic characteristics of sample households and household heads
by farm size
Farm size categories (acres (A))
Variables A<=2.5 2.5<A<=12.
5
12.5<
A<=50
A>50 Full
sample
Observations 308 487 181 25 1001
Age of HH head 50.09 48.7 48.1 53.3 49.63
Months worked in farm 6.95 7.3 6.7 6.05 6.75
Household Size 7.7 8.4 8.4 8.76 8.2
Sex of HH head: Male
Female
93.5%
6.5%
93.4%
6.6%
96.1%
3.9%
96.0%
4.0%
94.0%
6.0%
Education of HH head:
Primary and above
Other levels
59.3%
40.7%
60.4%
39.6%
63.0%
37.0%
68.0%
32.0%
60.8%
39.2%
Membership in farmer
group: Yes
No
69.5%
30.5%
63.9%
36.1%
59.7%
40.3%
56.0%
44.0%
64.6%
35.4%

24
Similarly, the average household size across all farm size categories of 8.76 persons
corresponding to large farmers (with farms of over 50 acres) is about 1 person more the
size of the very small farmers (with farms between 0 and 2.5 acres). Moreover, it was
found that male heads dominated all groups of farm size by over 93%, which implies that
most of the farm activities are controlled by male heads and this may lead to higher farm
productivity as males are expected to have more time to invest on management and
control of the farm resources to improve farm productivity than female households heads
who normally have other roles to play in the family compared to male heads.
On the other hand, 68% of household heads in the large farm category reported to have
completed primary education and above compared to 63%, 60% and 59% corresponding
to medium, small and very small farms categories, respectively. The relatively high
literacy level observed in the large farm category may be implied in the relationship
between farm size and productivity that will be accounted for later in this study.
Furthermore, 69.5% of household heads of very small farms were members of farmer
groups/associations compared to 63.9-, 57.9-, 56% for small farms, medium and large
farms, respectively. This means that the majority of heads in the study area have chances
to learn from others and gain new knowledge through various training programs which
may boost their farm performance in terms of productivity.
4.2 Farm (field) Characteristics
Irrespective of farm size categories, Table 3 shows that, over 90% of the sample farmers
owned the land they cultivated in 2015/2016 farming season. This is important especially
in increasing interest over investing in good land management practices that may result in
improved land productivity for the current and future use of the same. On the other hand,
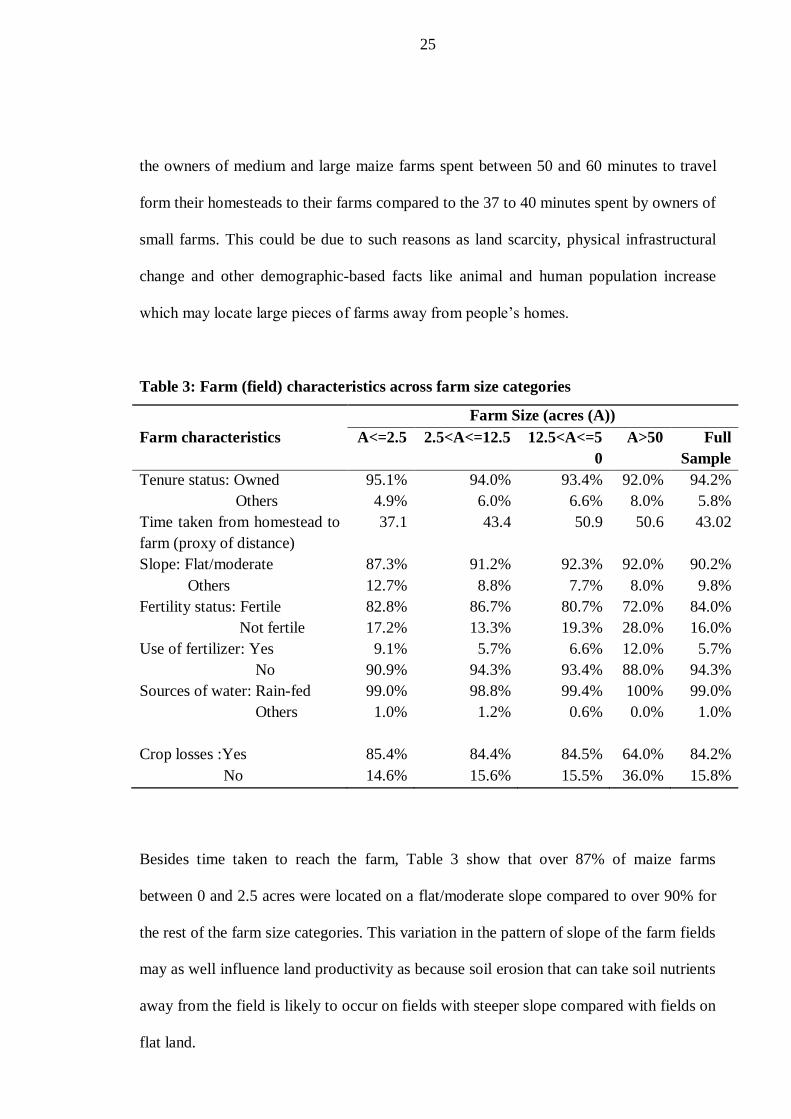
25
the owners of medium and large maize farms spent between 50 and 60 minutes to travel
form their homesteads to their farms compared to the 37 to 40 minutes spent by owners of
small farms. This could be due to such reasons as land scarcity, physical infrastructural
change and other demographic-based facts like animal and human population increase
which may locate large pieces of farms away from people‟s homes.
Table 3: Farm (field) characteristics across farm size categories
Farm Size (acres (A))
Farm characteristics A<=2.5 2.5<A<=12.5 12.5<A<=5
0
A>50 Full
Sample
Tenure status: Owned
Others
95.1%
4.9%
94.0%
6.0%
93.4%
6.6%
92.0%
8.0%
94.2%
5.8%
Time taken from homestead to
farm (proxy of distance)
37.1
43.4 50.9 50.6 43.02
Slope: Flat/moderate
Others
87.3%
12.7%
91.2%
8.8%
92.3%
7.7%
92.0%
8.0%
90.2%
9.8%
Fertility status: Fertile
Not fertile
82.8%
17.2%
86.7%
13.3%
80.7%
19.3%
72.0%
28.0%
84.0%
16.0%
Use of fertilizer: Yes
No
9.1%
90.9%
5.7%
94.3%
6.6%
93.4%
12.0%
88.0%
5.7%
94.3%
Sources of water: Rain-fed
Others
99.0%
1.0%
98.8%
1.2%
99.4%
0.6%
100%
0.0%
99.0%
1.0%
Crop losses :Yes
No
85.4%
14.6%
84.4%
15.6%
84.5%
15.5%
64.0%
36.0%
84.2%
15.8%
Besides time taken to reach the farm, Table 3 show that over 87% of maize farms
between 0 and 2.5 acres were located on a flat/moderate slope compared to over 90% for
the rest of the farm size categories. This variation in the pattern of slope of the farm fields
may as well influence land productivity as because soil erosion that can take soil nutrients
away from the field is likely to occur on fields with steeper slope compared with fields on
flat land.

26
Like the field slopes, fertility status of the fields varies across farm size categories, from
72% in the large farm size category to about 87% in the farm size category of between 2.5
and 12.5 acres. This is contrary to the expectation because the field slopes in the small
farm size category were steeper compared to those in the large farm size category which
are flats with the high likelihood of retaining soil nutrients. With the exception of the
large farm size category, however, there is no significant difference in fertility status of
fields in the rest the farm size categories of 50 acres and below. It can therefore be
generalized that majority of the farms in the study districts were regarded as being
naturally fertile and hence limited need for productivity enhancing technologies. As
observed in Table 3, 12% of the household heads in the large farm size category reported
to have applied fertilizer on their farms compared to less than 10% reported in other farm
size categories with relatively high fertile farms.
With regard to source of water for the maize crop, majority of the farmers irrespective of
the farm size category depended on rainfall as the source of water for their maize crops.
This poses risk of reducing maize output and hence low productivity during seasons with
little or low rainfall regimes.
Besides source of water for the maize crop, famers were asked to indicate if they
experienced any crop losses in the 2015/16 farming season. As can be seen from Table 3,
farmers with farms falling under farm size categories of 50 acres and below reported
higher rate of experiencing crop losses which is above 80% compared to 64% of farmers
with farms in the farm size category of above 50 acres. These losses were due to either
natural calamities like floods, drought and diseases, or some unfair practices by
neighbours like grazing on others‟ farms by pastoralists or on farm crop theft. Whatever

27
the cause, these losses lead to reduction in crop harvest and consequently low farm
productivity.
4.3 Land Area Planted and Measurement Errors
The findings in Table 4 indicate that, an average farmer in the first, second, third and
fourth farm size categories in the study districts planted 1.63, 6.09, 24.83 and 107.63
acres of maize, respectively. While farmers with farm sizes falling in the first and second
farm size category were the majority, these results imply that the small farms are likely to
influence the resulting farm size-productivity relationship. Taking into account the
measurement discrepancies across farmers‟ categories, the study found that on average
very small farmers with farms between 0 and 2.5 acres underestimated their farm sizes by
5.49 acres compared to 1.17 acres for small farmers with farms between 2.5 and 12.5
acres. On the contrary, maize farmers in the medium-scale (12.5-50 acres) overestimated
their plots' size by only 0.06 acres compared to 15.24 acres for large farmers (with farms
above 50 acres). This may have implications on the relationship between acres planted
and productivity as observed in the next section.
Table 4: Land area planted and area measurement errors by farm size categories
Farm Size Category Average area planted
with maize (acres)
Acreage measurement
errors (acres)
Less than 2.5 acres 1.63 -5.49
Between 2.5 and 12.5 acres 6.09 -1.17
Between 12.5 and 50.0 acres 24.83 0.06
50 acres and above 107.63 15.24
Whole Sample 10.64 -1.87

28
4.4 Relationship between Productivity and Farm Size
4.4.1 Total factor productivity across farm size categories
The findings presented in Table 5 indicate that on average, the TFP of farmers who
planted at least 50 acres of maize was 5.23 which is more than five times for those who
planted at most 12.5 acres, and close to three times and five times for those who planted
12.5 to 50 acres and the whole sample, respectively. This implies that medium farmers
with 12.5 to 50 acres of land owned and large farmers with farms of over 50 acres, who
constituted about 20% of all observations, were more productive than their counterparts.
These findings are contrary to the previous evidence over inverse relationship between
productivity and farm size.
Table 5: Average total factor productivity across farm size categories
Farm size categories Total Factor Productivity
Less than 2.5 acres 0.4
Between 2.5 to 12.5 acres 0.93
Between 12.5 to 50 acres 1.85
50 acres and above 5.23
Whole sample 1.04
4.4.2 Relationship between TFP and land area under maize
4.4.2.1 Graphical analysis of the relationship between TFP and maize area planted
The graphical presentation in Figure 1 shows different patterns in the relationship
between the mean TFP and land area under maize (acres). The figure portrays a zig-zag
pattern for maize areas of 0 to 80 acres for farmer-based data and 0 to 60 acres for the
GPS based data. A gentle increase and sharp increase in TFP occur for farm sizes ranging
from 100 to 200 acres for the farmer-based data while for the GPS data, a gentle decline
in TFP is displayed for farm sizes in the range of 130 to 200 acres. Also using the same

29
GPS data, the figure shows that farmers in the range of 120 to 200 acres recorded almost
no change in TFP despite the increase in farm size.
Figure 1: Relationship between Farm Size and Productivity
It is interesting to note that, the inverse relation between productivity and farm size occurs
in farm sizes above 200 acres when the farmer-based data is used. This is probably due to
diseconomies of scale resulting from inefficiency in management of farm resources. The
findings presented here are close to those of Larson et al. (2013) and Carletto et al.
(2013). Unlike the graphical evidence, the Pearson correlation coefficient (ρ=.513) for
farmer-based data indicates that maize productivity (TFP) and area under maize (acres)
are positively correlated while for the GPS data, the correlation coefficient (ρ=-.017) is
negative though it is weak (see Figure 1). This evidence has shown that examining farm
size-productivity relationship across a range of farm sizes, improves the prior inverse
relation hypothesis and even refuting it.
-5
0
5
10
15
20
25
30
-50 0 50 100 150 200 250 300 350
HH
_T
ota
l F
acto
r P
roduct
ivit
y
Reported acres planted GPS_acres planted
30
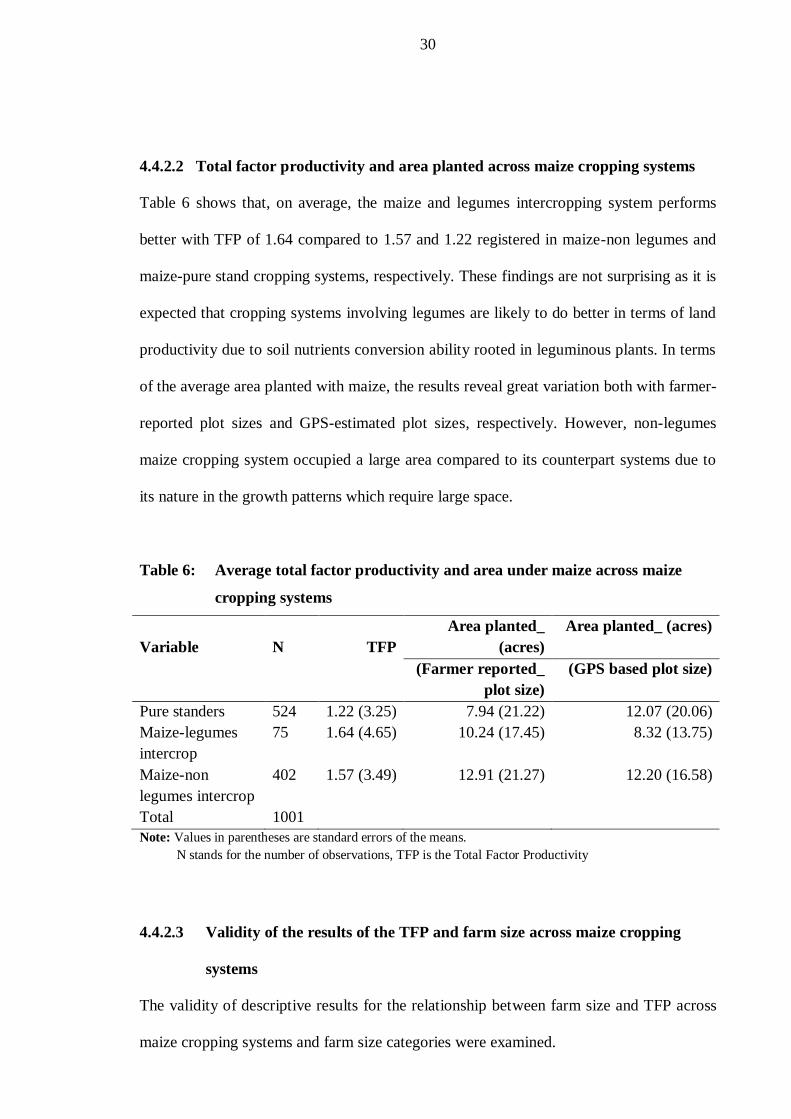
4.4.2.2 Total factor productivity and area planted across maize cropping systems
Table 6 shows that, on average, the maize and legumes intercropping system performs
better with TFP of 1.64 compared to 1.57 and 1.22 registered in maize-non legumes and
maize-pure stand cropping systems, respectively. These findings are not surprising as it is
expected that cropping systems involving legumes are likely to do better in terms of land
productivity due to soil nutrients conversion ability rooted in leguminous plants. In terms
of the average area planted with maize, the results reveal great variation both with farmer-
reported plot sizes and GPS-estimated plot sizes, respectively. However, non-legumes
maize cropping system occupied a large area compared to its counterpart systems due to
its nature in the growth patterns which require large space.
Table 6: Average total factor productivity and area under maize across maize
cropping systems
Variable
N
TFP
Area planted_
(acres)
Area planted_ (acres)
(Farmer reported_
plot size)
(GPS based plot size)
Pure standers 524 1.22 (3.25) 7.94 (21.22) 12.07 (20.06)
Maize-legumes
intercrop
75 1.64 (4.65) 10.24 (17.45) 8.32 (13.75)
Maize-non
legumes intercrop
402 1.57 (3.49) 12.91 (21.27) 12.20 (16.58)
Total 1001
Note: Values in parentheses are standard errors of the means.
N stands for the number of observations, TFP is the Total Factor Productivity
4.4.2.3 Validity of the results of the TFP and farm size across maize cropping
systems
The validity of descriptive results for the relationship between farm size and TFP across
maize cropping systems and farm size categories were examined.

31
The tests carried out include test of the normality and homogeneity assumptions and the
following are the outcomes.
First, the assumption of normality of data was evaluated for the estimates of TFP across
cropping systems. A Shapiro-Wilk‟s test with (ρ>.05) was tenable for both maize-non
legumes and maize-legumes intercrop patterns. The assumption of homogeneity of error
variance for the dependent variable (log of TFP) was found tenable using Levene‟s test, F
(2, 998) =1.569, ρ=0.209. However, it was unfortunate that the overall ANOVA was
statistically insignificant, F (2, 998) =.452, ρ=.637 implying that there were no statistically
significant differences among mean TFP across the three cropping systems.
Second, the normality assumption was evaluated for the farm size categories. A Shapiro-
Wilk‟s test (ρ>.05) was tenable for the first three farm-size categories (less than 2.5 acres,
between 2.5 to 12.5 acres and between 12.5 to 50 acres) and a visual inspection of their
histograms, normal Q-Q plots and box-plots showed that the household means levels of
TFP were approximately normally distributed. A one-way analysis of variance was
conducted to evaluate the null hypothesis that there is no significant difference among
means of TFP across farm size categories. The independent variable, farm size categories
had four groups: (below 2.5 acres, N=308), (between 2.5 to 12.5 acres, N=487), (between
12.5 to 50 acres, N=181) and (50 acres and above, N=25). The homogeneity assumption
was also tested and found tenable using Levene‟s test, F (3, 997) =.526, ρ=.664. The overall
ANOVA was significant, F (3, 997) =65.002, ρ=.000, η2=.164. Thus, it suffices to conclude
that there are significant differences among mean TFP levels across groups of farm sizes.
However, the actual difference in mean scores between the groups is relatively small
(16.4%).

32
4.5 Results of Econometric Analyses
4.5.1 Relationship between farm size and productivity across various plot size
categories
The results in Table 7 indicate that, at 1% level of significance, the true mean maize
productivity (TFP) in the study area is estimated to increase by 0.608%, 0.690%, 0.572%,
and 0.750% respectively, if the area under maize in the farm size categories of between 0
and 2.5 acres, 2.5 and 12.5 acres, 12.5 to 50 acres and above 50 acres is increased by 1%,
ceteris paribus. For the whole sample, the findings show that a 1% increase in area under
maize will increase the estimated mean productivity (TFP) by 0.774%, holding all other
factors the same. The estimated impact of area under maize on the mean TFP for the
whole sample is higher by almost 0.1% for the first three farm size categories (Between 0
and 2.5 acres, 2.5 and 12.5 acres, and 12.5 to 50 acres) and lower by 0.6% for maize
farms greater than 50 acres.
The above evidence shows that the estimated relationship between area under maize
(acres) and productivity (TFP) is positive when each farm size category is analyzed
separately and when observations are combined. The above findings are consistent with
the recently published work by Desiere and Jollife (2018) and Muyanga and Jayne (2019)
and inconsistent to Msangi and Mdoe (2018). Also, this study found that 1% increase in
farm size measurement errors will respectively lower the estimated mean TFP by 0.45%,
0.52%, 0.69% and 0.56% across farm size categories, and by 0.53% for the whole sample
(see Table 7), keeping other factors unchanged. This implies that if farm size
measurement systems are improved in the study area such that errors in farm sizes are
significantly reduced, the estimates of productivity per unit of land will improve
accordingly, ceteris paribus.

33
Table 7: OLS regression estimates for total factor productivity across farm size
categories
Variables
Farm size categories (acres (A)
Model1
(A<=2.5)
Model2
(2.5<A<=12.5)
Model3
(12.5<A<=50)
Model4
(A>50)
Full
sample
Intercept -0.248 -0.419 4.332** 0.225 0.139
Log_acres planted 0.608*** 0.690*** 0.572*** 0.750*** 0.774***
Log_measure_discrep. -0.453*** -0.526*** -0.691*** -0.564*** -0.533***
Log_walk_time (min.) -0.052 0.034 -0.065 0.003 -0.016
Log_months in farm 0.052 0.019 0.055 0.048 0.046
Log_household size -0.290* -0.325** 0.113 -0.219* -0.240**
Log_age of HH head 0.268 0.117 -0.542 -0.045 0.028
Dummy_sex of HH head -0.182 0.293 0.637 0.311 0.167
Dummy_HH head educ. 0.161 0.060 -0.011 0.044 0.078
Dummy_apply fertilizer -0.061 -0.675** -0.907** -0.807*** -0.810***
Dummy_slope pattern -0.653*** -0.266 -0.152 -0.222 -0.370***
Dummy_fertility status 0.086 0.257 -0.317 0.101 0.089
Dummy_tenure status 0.062 -0.323 0.991** -0.024 0.004
Dummy_watering syst. -0.446 -0.656 -3.680** -0.985* -0.815*
Dummy_shock/loss exp. -0.657*** 0.145 -0.390 -0.040 -0.226*
Observations 308 487 181 25 1001
R Square 0.186 0.185 0.321 0.271 0.320
F statistic 4.446*** 7.110*** 5.211*** 16.816*** 30.963***
Note: *** significant at 1%, ** significant at 5%; * significant at 10%
A is planted maize area in acres
Additionally, the results show that, other factors than farm size namely; household size,
status of fertilizer application, slope pattern, tenure status, source of water, and crop
losses were also found to significantly influence the estimated level of TFP across farm
size categories as it is explained here. In particular, the estimated mean TFP is estimated
to decrease by .29% (ρ*>0.1), .325% (ρ*>0.05) and .219% (ρ*>0.1) if the household size
for farmers with farm size of between 0 to 2.5 acres, 2.5 to 12.5 acres and above 50 acres
increased by 1%, holding other factors the same. This implies that the larger the
household size the lower the level of TFP at least across the above farm size groups.
Similarly, at 5% significance level and maintaining levels of other factors, farmers who
planted between 2.5 and 12.5 acres of maize and applied fertilizer (9.1%) were found to
attain 49.08% of the mean TFP than non-fertilizer applicants who attained 90.9%, while
farmers with farms of 12.5 to 50 acres and above 50 acres planted with maize were

34
respectively found to attain 59.62% and 55.38% of mean TFP than that of their
counterparts. Likewise, when considering the full sample, the true estimated mean TFP of
farmers who applied fertilizer is 55.51% (ρ>0.01) lower than farmers who did not apply
fertilizer, holding everything else fixed. These results seem unusual at least in this study
probably because the farmers who reported to have applied fertilizer on their farms did
not have adequate skills on the proper use of fertilizer given soil characteristics and other
management practices of the crop under the field. It seems also that non-fertilizer
applicants were used to believe on the natural soil fertility of their farms and other organic
methods to improve soil fertility which earned them an edge in terms of productivity than
their counterpart farmers who depended on inorganic fertilizers.
Furthermore, farms below 2.5 acres and located on a flat or moderate slope were found to
produce 47.95% lower mean of TFP compared to similar farms located on other slope
patterns like terraces, steep or up land slopes. Likewise, when the whole sample is
analysed, the findings reveal that, farms located on a flat/moderate slope attained 30.93%
lower mean of TFP compared to farms in other slope patterns. This implies that for the
farmers with very small plots to realize higher productivity of maize they should consider
cultivating on upland or terraced sloped land to increase productivity of their farms.
Moreover, at 5% level of significance and fixed levels of other factors, the study found
that owned farms of maize with 12.5 to 50 acres attained over 169% of mean TFP than
non-owned farms. This means that farmers who own farms have more control of their
farms which give them ample chance to improve the land quality and hence productivity
as compared to farmers renting in land. On contrary, at 5% and 10% levels of
significance, rain-fed maize farms with 12.5 to 50 acres and 50 acres and above were
estimated to produce 97.43% and 62.66% lower mean ratio of TFP, respectively than

35
those farms which depended on other sources of water, holding other factors fixed. These
findings are important especially now when the government of Tanzania is promoting
industrialization policy of which most of the raw materials or inputs for the agro-
industries will be derived from agriculture. Nonetheless, as expected the experience on
crop losses especially on the field reduced estimated mean TFP for the small scale maize
farms (below 2.5 acres) by 48.16% at the level of significance of 1% compared to 20.23
% at the level of significance of 10% for the whole sample, ceteris paribus. This means
that maize crop losses either due to rodents, unlawful animal grazing as well as natural
hazards like floods, drought and diseases contribute to reducing total farm productivity.
4.6 Relationship of Farm Size and Total Factor Productivity across Maize
Cropping Systems
The OLS regression results in Table 8 indicate a positive and significant relationship
between acres under maize and Total Factor Productivity (TFP) across both cropping
systems and the whole sample. It is estimated that the true mean TFP among maize
farmers would increase by 0.783%, 0.849%, and 0.834%, respectively if the land area
under maize-pure stand-, maize-legumes- and maize-non legumes-intercropping systems
are each increased by 1%, holding other factors fixed.
For the whole sample, the evidence reveals that a 1% increase in the area planted with
maize leads to an increase in the estimated mean TFP by 0.745%, holding other factors
unaltered. As expected, the estimated impact of an area under maize on the mean TFP for
the whole sample is lower than when the three cropping systems are analyzed separately.
On the contrary, a 1% increase in the farm size discrepancy leads to a decrease in the
estimated mean TFP by 0.449% (p*>0.01) for pure stand, 0.452% (p*>0.01) for maize-
legumes intercrop, 0.654% (p*>0.01) for maize-non legumes intercrop and 0.534%

36
(p*>0.01) for the whole sample, leaving other factors the same. Hence, the increase of
accuracy in measuring farm-plot sizes will improve the farm level productivity (TFP),
ceteris paribus.
Also, this study found that holding everything the same, a 1% increase in the number of
persons in a household practicing maize pure stand system reduces the estimated mean
TFP by 0.365% which is 0.137% less than the estimated mean TFP for the whole sample.
Also, it is estimated that the mean TFP for male-headed households is 54.8 % higher than
that of female headed households in the maize pure stand intercropping system, holding
other factors fixed.
Table 8: OLS Regression Estimates for Total Factor Productivity across Maize
Cropping Systems
Variable
Observations
Coefficients
MPS
524
Coefficients
ML
75
Coefficients
MNL
402
Coefficients
Full sample
1001
Intercept -0.997 2.788 0.921 0.243
Log_acres planted 0.783*** 0.849*** 0.834*** 0.745***
Log_measurement discrep. -0.449*** -0.452** -0.654*** -0.534***
Log_walk time (minutes.) -0.024 0.046 -0.011 -0.018
Log_month worked in farm -0.035 -0.035 0.037 0.042
Log_family size (no. persons) -0.365*** -0.566 -0.083 -0.228***
Log_HH head‟s age 0.293 -0.165 -0.127 0.012
Dummy_sex of HH head 0.437* 0.667 -0.274 -0.149
Dummy_HH head's Educ. 0.082 0.318 0.032 -0.315**
Dummy_HH head‟s assoc. 0.051 -0.497 0.114 0.067
Dummy_apply fertilizer -1.001*** -2.255* 0.855 -0.855***
Dummy_slope pattern -0.424*** -1.036 -0.157 -0.354***
Dummy_fertility status 0.185 -0.179 -0.056 0.101
Dummy_tenure status -0.154 -1.435 0.258 0.004
Dummy_watering system -0.489 -0.069 -1.558 -0.770*
Dummy_shock/loss experience -0.193 -0.579 -0.203 -0.208*
Maize-legumes dummy_ D1 -0.149
Maize-non legumes dummy_ D2 -0.315**
Dummy1_cross_acres planted 0.056
Dummy2_cross _acres planted 0.109
R2 0.33 0.37 0.36 0.32
F statistic 16.67*** 2.354*** 14.68*** 24.67***
Note: *, ** and *** stands for 10%, 5% and 1% level of significance, respectively.
MPS stands for Maize pure stand, ML stands for Maize-legumes intercrop and MNL Stands for Maize-non
legumes intercrop

37
Additionally, at fixed levels of other factors, it is estimated that the mean TFP for farmers
who applied inorganic fertilizer is 63.24%, 89.51%, 57.47% of those who did not apply
the same in the maize pure stand, maize and legumes intercrop and for the whole sample,
respectively. These findings are not expected, probably because most farmers (close to
90%) did not apply any fertilizers and therefore depended on the natural soil fertility of
their farms and other indigenous field-crop management practices which gave them an
edge over those who depended on inorganic fertilizer to improve fertility of their farms.
The other reason for the unexpected influence of fertilizer on productivity could be lack
of proper skills on soil characteristics and fertilizer attributes among fertilizer applicants.
Moreover, holding other factors fixed and at a 1% significance level, it is estimated that
flat or moderate sloped maize farms attained 34.56% and 29.81% of the mean TFP than
farms located in other slope patterns for maize pure stand cropping system and the full
sample, respectively. This means that maize cultivated as a stand-alone crop on
hilly/slope or terraced land had more chances to perform better in terms of higher
productivity level per unit land area than those in flat/moderate slope within the same
locality.
However, it was also found that, at fixed levels of other factors and 10% level of
significance, the estimated mean TFP for rain-fed farms and which experienced crop
losses is 53.69% and 18.78% of their counterpart systems, respectively for the whole
sample. This means that if all other factors are held constant, maize farmers depending on
rains as the source of water attain lower levels of productivity (mean TFP) than those
farmers depending on various sources like irrigation by pipes, gravity, manual, or both
(irrigation and rains). Also good management of the maize crop from field to market
reduces crop losses and hence ensures higher levels of productivity.

38
Furthermore, farmers practicing mixed maize farming system with non-legumes intercrop
are estimated to attain 27.02% of mean TFP which is lower than farmers in pure stand
system. This means that holding everything the same, farmers growing maize in pure
stand system are estimated to perform better in terms of TFP than those in the maize and
non-legumes intercropping system.
4.7 Summary of the Key Findings
The findings from this study reveal that more than 79% of maize farms are between 0 to
12.5 acres, suggesting that the majority of the farmers in 2015/2016 season were small
scale farmers. The findings show existence of variability in Total Factor Productivity
(TFP) across farm size categories with mean TFP of 0.40, 0.85, 1.85 and 5.23
corresponding to farms in farm size categories of between 0 to 2.5 acres, 2.5 to 12.5 acres,
and 12.5 to 50 acres and above 50 acres, respectively.
Similarly, mean TFP across cropping systems were found to vary considerably with
maize mixed with legumes cropping system recording higher levels of TFP of 1.64
compared to 1.57 and 1.22 for pure stand cropping system and maize mixed with the non-
legumes cropping system. The relationship between farm size (measured as acres planted
with maize) and productivity (measured as TFP) was significantly positive both across a
range of farm size categories and across maize cropping systems and therefore refuting
the inverse relation (IR) hypothesis. However, the graphical analysis (Figure 1) shows
mixed patterns of relationships including; a zig-zag pattern for farms of 0 to 80 acres, U-
shaped pattern for farms in the range of 100 to 200 acres and an inverse relationship for
farms beyond 200 acres when the farmer-based data was used while for the GPS based
data a zig-zag pattern was noted for farms of 0 to 60 acres and an inverse relationship was
noted for farms of 130 to 200 acres. This means that the well-established inverse farm

39
size-productivity relationship does not generally hold when a wide range of farm sizes
including a mixture of small, medium and large farmers is considered.
The farm size measurement discrepancy determined by comparing farmer based and GPS
based data was found to reduce the mean TFP by 0.45%, 0.52%, 0.69% for farms of 0-2.5
acres, 2.5-12.5 acres, and 12.5-50 acres, respectively, compared with 0.53% for the whole
sample with average farm size of 10.64 acres. Likewise, if land planted with maize is not
accurately measured, then a 1% increase in errors of planted area would reduce estimated
TFP by 0.449%, 0.452%, and 0.654% in pure stand, maize-legumes and maize-non
legumes-intercropping systems, respectively. This implies that land size measurement
errors lead to lower reported productivity per farm/plot and hence inaccurately supporting
the IR hypothesis.
Apart from farm size, other factors like household size, sex of household head, use of
fertilizer, land slope pattern, tenure system, source of water and crop losses incurred
significantly influence the farm level productivity (mean TFP) both across farm size
categories and cropping systems, respectively.

40
CHAPTER FIVE
5.0 CONCLUSIONS, CONTRIBUTION OF THE STUDY,
RECOMMENDATIONS AND SUGGESTIONS FOR FURTHER STUDIES
5.1 Conclusions
This study was carried out to determine the relationship between farm size and
agricultural productivity across a range of farm sizes and maize cropping systems in
Tanzania Mainland. It was motivated by the existing conventional wisdom of Inverse
Relation (IR) hypothesis for land productivity and farm size and the fact that despite the
numerous studies carried out using different methods to measure farm efficiency, little
evidence is provided on the magnitude and strength of the relationship between farm size
and productivity across cropping systems.
The study tested three hypotheses as they are restated hereunder. Firstly, to test whether
the farmers‟ total factor productivity level across maize cropping systems in the study
districts does not vary significantly. Secondly, to test if farm size has no influence on total
factor productivity level across maize cropping systems and lastly, to test if factors other
than farm size do not influence total factor productivity level across the maize cropping
systems in the study districts in Tanzania Mainland.
The first hypothesis was rejected. Contrary to the hypothesized relations, the findings of
the study show variation of TFP by both cropping system and farm size. Regarding
variation across cropping systems, the maize-legumes cropping system stood out with
higher levels of TFP followed by maize and non-legumes and maize pure stand cropping
systems. Similarly the second hypothesis was rejected. Contrary to the hypothesis that
farm size has no influence on farm productivity, the study found that the relationship

41
between farm size and TFP was significantly positive across maize cropping systems.
These findings contribute to the emerging empirical evidence on positive relationship
between farm size productivity which is contrary to the IR hypothesis that has been
supported by several studies for many decades. Like the other two hypotheses, the third
hypothesis that factors other than farm size do not influence the total factor productivity
level across the maize cropping systems, the findings of the study show that household
size, sex of household head, use of fertilizer and slope of the farm influenced significantly
the mean TFP across the maize cropping systems.
5.2 Contribution of the Study
The study contributes to the on-going debate on IR between farm size and efficiency or
productivity in terms of empirical evidence in four different ways. Firstly, the study
defied the presence of the inverse relationship between farm size and maize productivity
(TFP) using cross-sectional data from a wide range of farms including small, medium and
large farms in eight maize producing districts in Tanzania Mainland. While most of the
previous evidence on IR was based on a narrow range of small scale farms, this study has
revealed various patterns of relationship across the wide range of farm sizes including
zig-zag, inverse and positive relationships.
Secondly, using the cross-sectional data set, the study provides empirical evidence on
influence of cropping systems on farm-level productivity. It was found that mixed maize-
legume cropping system performs better in terms of TFP than other cropping systems.
Thirdly, the study enforces the existing empirical evidence on the influence of farm size
measurement errors on productivity both across a range of farm sizes and cropping
systems. The study found that, farm size measurement discrepancy reduces the estimated
mean TFP, implying that ignorance of errors in measurement of farm size may lead to

42
inappropriate conclusions. Lastly, unlike most of the previous IR studies, this study used
TFP approach to test the IR hypothesis arguably more eloquent than use of partial
productivity measures such as yield or gross margin per unit of land or labour.
5.3 Recommendations
Based on the major findings of the study and conclusion, the recommendations and
suggestions for further studies are put forward:
5.3.1 Review of the current National Agriculture Policy and the Agricultural Sector
Development Programme (ASDPII)
The evidence of a positive relationship between farm size and agricultural productivity
across a range of farm sizes suggests that the current agricultural policy and the
Agricultural Sector Development Program (ASDPII) which are largely emphasizing
promotion of small-scale agriculture in the country should be reviewed. While supporting
smallholder farmers who are the majority, the country‟s agricultural land policies and
programmes should also promote medium and large scale farms which have large
multiplier and employment effect as well as the potential to produce surplus of
agricultural products required as raw materials for the agro-based industries and hence
enable the country to realize its vision of becoming and industrialized and middle income
country by 2025.
5.3.2 Promoting land productivity enhancing mixed cropping systems
The maize-legume cropping system was found to have higher TFP than the maize pure
stand and maize-non legume cropping systems. In order to ensure higher crop
productivity levels, the government should provide education on mixed cropping systems
that enhance land productivity such as the cereal-legume cropping system. Adoption of

43
these cropping systems mutual could be promoted through Farmer Field Schools (FFS)
and farmer managed demonstration trials facilitated the government extension officers at
the ward and village levels.
5.3.3 Promoting family planning strategies and programmes
The findings of the study show inverse relationship between household size and
productivity in maize production i.e. the larger the household, the low the productivity.
Therefore, public health interventions and programmes to promote family planning
should be supported in rural areas with the aim of controlling the number of dependents
per household. This will ensure use of available household resources on improving farm
productivity instead of spending them of family care.
5.3.4 Supporting low cost irrigation strategies and programmes
It was found that farmers who depended solely on rains as the source of water for their
maize farms had lower levels of productivity compared to farmers who depended on
other sources of water like surface irrigation, manual irrigation, sprinkler irrigation (for
medium and large scale farms) and sprinkler irrigation (for medium and large scale
farms)n and ran-fed). It is therefore recommended here that, the government should
support strategies and programmes that promote low cost and hence sustainable
improvement of agricultural productivity.
5.3.5 Hastening the process of formalizing land property rights
The findings of the study show that maize farmers owning land attained higher
productivity (TFP) levels compared to farmers who rented similar farm size fields. Since
the normal process of land surveys for formalizing land rights expensive and relatively
slow, the government in collaboration with other stakeholders should ensure that the

44
process of formalizing land rights through the Customary Rights of Occupancy (CRO) of
land stipulated in the Village Land Act No. 4 of 1999 is hastened and widely used to
ensure security of land for farming in the rural areas.. This will encourage farmers to
invest in good land management practices that would improve productivity.
5.3.6 Providing education on and promoting appropriate farming practices on
hilly/slope land
The findings show unexpected negative relationship between the slope of the farm and
productivity in maize production for pure stand cropping system. Therefore, education on
the appropriate land management practices including terraces, cover crops, need to be
provided to farmers especially those in highlands whose majority of their maize farms are
on hilly/slope land to reduce soil erosion and loss of soil nutrients and ensure sustainable
higher productivity. These land management practices should be promoted through
various famer managed farm trials to show the benefits of adopting these practices.
5.3.7 Building Capacity for Extensive use of Geographical Information Systems
and Technology (GIS/GIT)
The study found a significant negative influence of the farm size measurement error on
farm productivity. Therefore, the National Bureau of Statistics (NBS) need to build
capacity among staff so that they may extensively use the GIS/GIT especially on
collecting information on farm size among the agricultural households in Tanzania
Mainland. This would improve the farm size data used for research as well providing
implications from the research findings which would then help to make better policy
decisions.

45
5.4 Suggestions for Further Studies
With the current evidence, the study recommends that forthcoming studies in the area of
farm size-productivity relationship should consider various cropping systems and a wider
range of crops to improve the existing empirical evidence on farm size-productivity
relationship as well as bringing more evidence that may serve as cornerstones for further
policy interventions.

46
REFERENCES
African Development Bank. (2017). Feed Africa: The Road to Agricultural
Transformation in Africa. High Five Brief #2, African Development Bank.
Ali, D. A. and Deininger, K. (2015). Is There a Farm Size–Productivity Relationship in
African Agriculture? Evidence from Rwanda. Land Economics 91(2):
317–343.
Amos, T.T., Chikwendu, O.D. and Nmadu, J. (2004). Productivity, technical efficiency
and cropping patterns in the Savanna zone of Nigeria. Food, Agriculture and
Environment 22: 173-176.
Ansoms, A., Verdoodt, A. and Van Ranst, E. (2008). The inverse relationship between
farm size and productivity in rural Rwanda, (January). pp. 1–36.
Arce, C.E. and Caballero, J. (2015). Tanzania: Agricultural Sector Risk Assessment.
Washington, DC. 45pp.
Assunção, J. J. and Braido, L. H. B. (2007). Testing household-specific explanations for
the inverse productivity relationship. American Journal of Agricultural
Economics 89(4): 980–990.
Baksiene, E., Razukas, A., Repeckiene, J. and Titova, J. (2014). Influence of different
farming systems on the stability of low productivity soil in Southeast
Lithuania. Zemdirbyste-Agriculture 101(2): 115–124.

47
Barrett, C. B., Bellemare, M. F. and Hou, J.Y. (2010). “Reconsidering Conventional
Explanations of the Inverse Productivity-Size Relationship.” World
Development 38 (1): 88-97.
Bevis, L. E. M. and Barrett, C. B. (2016). Close to the Edge : Do Behavioral Explanations
Account for the Inverse Productivity Relationship? 1–82.
Boulay, B. (2018). Revisiting the old debate: on the relationship between size and
productivity in Tanzania. 56pp.
Carletto, B. C., Savastano, S. and Zezza, A. (2016). Measurement, Farm Size and
Productivity How Does Use GPS Data Affect Yield. 879pp.
Carletto, C., Gourlay, S. and Winters, P. (2015). “From Guess estimates to GPS
estimates: Land Area Measurement and Implications for Agricultural
Analysis,” Journal of African Economies 24 (5): 593–628.
Carletto, C., Savastano, S. and Zezza, A. (2013). “Fact or Artifact: The Impact of
Measurement Errors on the Farm Size Productivity Relationship.” Journal of
Development Studies 103: 254-261.
Chayanov, A. V. ([1926] 1991). The Theory of Peasant Co-operatives. Columbus: Ohio
State University Press. 45pp.
Collier, P. and Dercon, S. (2014). “African Agriculture in 50 Years: Smallholders in a
Rapidly Changing World?” World Development 63: 92-101.

48
Desiere, S. and Jolliffe, D. (2018). Land productivity and plot size: Is measurement error
driving the inverse relationship? Journal of Development Economics
130(August 2016): 84–98.
Dillon, A. Gourlay, S., McGee, K. and Oseni, G. (2016). “Land Measurement Bias and its
Empirical Implications: Evidence from a Validation Exercise.” World Bank
Working Paper, Washington, DC. 67pp.
Dixon, J., Stringer, L. and Challinor, A. (2014). Farming System Evolution and Adaptive
Capacity: Insights for Adaptation Support. Resources 3(1): 182–214.
Foster, A.D. and Rosenzweig M.R. (2017). Are There Too Many Farms in the World?
Labor-Market Transaction Cost, Machine Capacities and Optimal Farm Size.
Yale University. Economic Growth Center Discussion Paper No.1059.
Goksel, A. and Altug, O. (2007). Determinations of Total Factor Productivity with Cobb-
Douglas Production Function in Agriculture: The Case of Aydin-
Turkey. Journal of Applied Sciences 7: 499-502.
Gollin, D. (2017). Heterogeneity, Measurement Error, and Misallocation : Evidence from
African Agriculture. 77pp.
Graeub, B. E., Chappell, M. J., Wittman, H., Ledermann, S., Kerr, R. B. and Gemmill-
Herren, B. (2016). The State of Family Farms in the World. World
Development 87: 1–15.

49
Hazell, P., Dorward, A., Poulton, C. and Wiggins, S. (2007). “The Future of Small
Farms for Poverty Reduction and Growth.” Discussion Paper No. 42,
International Food Policy Research Institute 2020, IFPRI, Washington, DC.
89pp.
Hazell, P., Poulton, C., Wiggins, S. and Dorward, A. (2010). “The Future of Small Farms:
Trajectories and Policy Priorities.” World Development 38(10): 1349-1361.
Holden, S.T. and Fisher, M. (2017). Can Area Measurement Error Explain the Inverse
Farm Size Productivity Relationship ? Centre for Land Tenure Studies
Working Paper. Agricultural Economics 45(3): 355-367.
Imai, K. S., Hasan, M. F. and Porreca, E. (2015). Do Agricultural Extension Programmes
Reduce Poverty and Vulnerability? Farm Size, Agricultural Productivity and
Poverty in Uganda. 46pp.
Jayne, T. S., Chamberlin, J., Traub, L., Sitko, N., Muyanga, M., Yeboah, F. K., Kachule,
R. (2016). Africa‟s changing farm size distribution patterns: the rise of
medium-scale farms. Agricultural Economics (United Kingdom) 47: 197–214.
Karugia, J., Massawe, S., Guthiga, P. and Macharia, E. (2013). Agricultural Productivity
in the EAC Region (1965-2010) Trends and Determinants. International
Symposium and Exhibition on the Agricultural Development in the EAC
Partner States at the 50 Years of Independence. 4th
to 8th
November 2013
Kampala, Uganda. 89pp.

50
Kiani, A. K. (2008). Farm size and productivity in Pakistan. European Journal of Social
Sciences 7(2): 42–52.
Kimhi, A. (2006). “Plot Size and Maize Productivity in Zambia: Is there an Inverse
Relationship?” Agricultural Economics 35(1): 1-9.
Larson, D., Otsuka, K., Matsumoto, T. and Kilic, T. (2013). "Should African rural
development strategies depend on smallholder farms? An exploration of the
inverse productivity hypothesis." Policy Research Working Paper 6190.
Washington, DC. World Bank.78pp.
Lokina, R., Nerman, M. and Sandefur, J. (2011). Poverty and Productivity : Small-Scale
Farming in Tanzania, 1991-2007. Working paper 8/0896: 1–56.
Lowder, S. K., Skoet, J. and Raney, T. (2016). The Number, Size and Distribution of
Farms, Smallholder Farms and Family Farms Worldwide. World
Development 87: 16–29.
Madau, F. A. (2011). Parametric estimation of technical and scale efficiencies in Italian
citrus farming. Agricultural Economics Review 12(1): 91–111.
Mburu, S., Ackello-Ogutu, C. and Mulwa, R. (2014). Analysis of Economic Efficiency
and Farm Size: A Case Study of Wheat Farmers in Nakuru District, Kenya.
Economics Research International 2014: 1–10.

51
Mdoe, N.S.Y., Mlay, G.I. and Kadigi, M.L. (2015). Farming Systems in Tanzania:
Empirical Evidence of Changes in Livelihood Patterns and Poverty among
Smallholder Farmers. In: Lal R., Singh B., Mwaseba D., Kraybill D., Hansen
D., Eik L. (eds) Sustainable Intensification to Advance Food Security and
Enhance Climate Resilience in Africa. Springer, Cham 67pp.
Mkonda, M. Y. and He, X. (2016). Production Trends of Food Crops: Opportunities,
Challenges, and Prospects to Improve Tanzanian Rural Livelihoods. Natural
Resources and Conservation 4(4): 51–59.
Msangi, H. and Mdoe, N.S.Y. (2018). Examining the Inverse Relationship between Farm
Size and Technical Relationship in Tanzanian Agriculture. 167pp.
Mukasa, A. N., Salami, A. O., Kayizzi-mugerwa, S. and John, C. (2015). Gender
productivity differentials among smallholder farmers in Africa : A cross-
country comparison (231): 45.
Muyanga, M. and Jayne, T. S. (2019). Revisiting the Farm Size-Productivity Relationship
Based on a Relatively Wide Range of Farm Sizes: Evidence from Kenya.
American Journal of Agricultural Economics 101(4): 1140–1163.
NBS (2017). National Panel Survey Wave 4, 2014 – 2015, (February): 1–104.
Nilsson, P. (2019). The Role of Land Use Consolidation in Improving Crop Yields among
Farm Households in Rwanda. Journal of Development Studies 55(8): 1726–
1740.

52
Nkonde, C., Jayne, T.S. Richardson, R.B. and Place, F. (2015). Testing the farm size-
productivity relationship over a wide range of farm sizes: Should the
relationship be a decisive factor in guiding Agricultural Development and
land policies in Zambia? Journal of the International Society for Southeast
Asian Agricultural Sciences 18(1): 49–61.
Rangel, M. A. and Thomas, D. (2012). Gender, Production and Consumption : Allocative
Efficiency within Farm Households. Redistribution: Toward Greater
Consensus, Washington D.C.: World Bank. 44pp.
Reuben, M. J. K., Japhet, J. K., Agnes, S., Felix, K., Anna, S. and Winfred, M. (2017).
Land fragmentation, agricultural productivity and implications for agricultural
investments in the Southern Agricultural Growth Corridor of Tanzania
(SAGCOT) region, Tanzania. Journal of Development and Agricultural
Economics 9(2): 26–36.
Savastano, S. and Scandizzo, P. L. (2017). Farm Size and Productivity: A “Direct-
Inverse-Direct” Relationship. Global Indicators Group, Development
Economics, (June). pp. 78-97.
Sen, A. K. (1962). An aspect of Indian agriculture. Economic Weekly 14(4-6): 243-246.
Sen, A. K. (1964). Size of Holdings and Productivity. The Economic Weekly, (February):
pp.323–326.

53
Sial, M. H., Iqbal, S. and Sheikh, D. (2012). “Farm size – productivity” relationship.
Recent evidence from Central Punjab 50(2): 139–162.
Singh, J. and Yadav. H.S. (2014). Farm Size, Cropping Pattern and Productivity Variation
in Punjab: The Analysis of Mansa and Jalandhar Districts. International
journal of management and information technology 7(3): 22-37.
Srinivasulu, R., Victor, A. S., Daniel, K. K., Richard, M., Dannie, R., Magesa, A. M.,
Radegunda, F. K. (2015). Technical efficiency of traditional African
vegetable production: A case study of smallholders in Tanzania. Journal of
Development and Agricultural Economics 7(3): 92–99.
UNCTAD (2015). Evolution of the international trading system and its trends from a
development perspective. The role of smallholder farmers in sustainable
commodities production and trade. 23pp.
UNDP and URT (2014). Tanzania Human Development Report 2014. Economic
Transformation for Human Development. [https://doi.org/978-9987-770-00-
7]. Site visited on 3/2/2019.
URT (2010). National Strategy for Growth and Reduction of Poverty II: NSGRP II.
Ministry of Finance and Economic Affairs Tanzania, (July). 168pp.
Wineman, A. and Jayne, T. S. (2018). Factor Market Activity and the Inverse Farm Size-
Productivity Relationship in Tanzania. Conference, July 28-August 2, 2018,
Vancouver, British Columbia 277030, International Association of
Agricultural Economists. 47pp.

54
APPENDICES
Appendix 1: Dummies for Maize Cropping Patterns
Type of Pattern Dummy Description
Maize pure stand Di0 This is the base/reference group
Maize and legumes Di1 1 if maize cropped with legumes, 0
otherwise
Maize and non-legumes Di2 1 if maize cropped with non-legumes, 0
otherwise