NI 43-101 Technical Report Preliminary Economic ...
384
NI 43-101 Technical Report Preliminary Economic Assessment Marmato Project Colombia Effective Date: July 31, 2019 Report Date: November 27, 2019 Report Prepared for Gran Colombia Gold Marmato S.A.S. Calle 3, SUR 43 A 52 Piso 6 of 608 Medellín, Antioquia, Colombia Report Prepared by SRK Consulting (U.S.), Inc. 1125 Seventeenth Street, Suite 600 Denver, CO 80202 SRK Project Number: 544400.020 Signed by Qualified Persons: Ben Parsons, MSc, MAusIMM (CP) – Principal Consultant (Resource Geologist) Cristian Pereira Farias, SME-RM – Senior Consultant (Hydrogeologist) David Bird, PG, SME-RM – Associate Principal Consultant (Geochemistry) David Hoekstra, Bs, PE, NCEES, SME-RM – Principal Consultant (Water Resource Engineering) Eric Olin, MSc, Metallurgy, MBA, SME-RM, MAusIMM – Principal Consultant (Metallurgy) Fernando Rodrigues, BS Mining, MBA, MAusIMM, MMSAQP – Principal Consultant (Mining Engineer) Jeff Osborn, BEng, Mining, MMSAQP – Principal Consultant (Mining Engineer) Joanna Poeck, BEng Mining, SME-RM, MMSAQP – Principal Consultant (Mining Engineer) John Tinucci, PhD, PE, ISRM – Principal Consultant (Geotechnical Engineer) Mark Allan Willow, MSc, CEM, SME-RM – Principal Consultant (Environmental) Joshua Sames, BSc Civil, PE – Senior Consultant (Civil Engineering) Reviewed by: Peter Clarke, BSc Mining, MBA, Peng – Principal Consultant (Mining Engineer) Berkley J. Tracy, MSc Geology, PG, CPG, PGeo – Senior Consultant (Resource Geologist)
-
Upload
khangminh22 -
Category
Documents
-
view
1 -
download
0
Transcript of NI 43-101 Technical Report Preliminary Economic ...

NI 43-101 Technical Report Preliminary Economic Assessment Marmato Project Colombia
Effective Date: July 31, 2019 Report Date: November 27, 2019
Report Prepared for
Gran Colombia Gold Marmato S.A.S. Calle 3, SUR 43 A 52
Piso 6 of 608
Medellín, Antioquia, Colombia
Report Prepared by
SRK Consulting (U.S.), Inc.
1125 Seventeenth Street, Suite 600
Denver, CO 80202
SRK Project Number: 544400.020
Signed by Qualified Persons:
Ben Parsons, MSc, MAusIMM (CP) – Principal Consultant (Resource Geologist)
Cristian Pereira Farias, SME-RM – Senior Consultant (Hydrogeologist)
David Bird, PG, SME-RM – Associate Principal Consultant (Geochemistry)
David Hoekstra, Bs, PE, NCEES, SME-RM – Principal Consultant (Water Resource Engineering)
Eric Olin, MSc, Metallurgy, MBA, SME-RM, MAusIMM – Principal Consultant (Metallurgy)
Fernando Rodrigues, BS Mining, MBA, MAusIMM, MMSAQP – Principal Consultant (Mining Engineer)
Jeff Osborn, BEng, Mining, MMSAQP – Principal Consultant (Mining Engineer)
Joanna Poeck, BEng Mining, SME-RM, MMSAQP – Principal Consultant (Mining Engineer)
John Tinucci, PhD, PE, ISRM – Principal Consultant (Geotechnical Engineer)
Mark Allan Willow, MSc, CEM, SME-RM – Principal Consultant (Environmental)
Joshua Sames, BSc Civil, PE – Senior Consultant (Civil Engineering)
Reviewed by:
Peter Clarke, BSc Mining, MBA, Peng – Principal Consultant (Mining Engineer)
Berkley J. Tracy, MSc Geology, PG, CPG, PGeo – Senior Consultant (Resource Geologist)

SRK Consulting (U.S.), Inc. NI 43-101 Technical Report – Marmato Project Page ii
MMS/KD Marmato_PEA_NI43-101_544400.020_Rev31_KD.docx November 2019
Table of Contents
1 Summary ....................................................................................................................... 1
1.1 Property Description and Ownership .................................................................................................. 1
1.2 Geology and Mineralization ................................................................................................................ 2
1.3 Status of Exploration, Development and Operations .......................................................................... 3
1.4 Mineral Processing and Metallurgical Testing .................................................................................... 4
1.5 Mineral Resource Estimate ................................................................................................................. 4
1.6 Mineral Reserve Estimate ................................................................................................................... 9
1.7 Mining Methods ................................................................................................................................... 9
1.7.1 Upper Mine .............................................................................................................................. 9
1.7.2 Marmato MDZ Project ........................................................................................................... 11
1.7.3 Hydrogeology ........................................................................................................................ 14
1.7.4 Geotechnical ......................................................................................................................... 15
1.8 Recovery Methods ............................................................................................................................ 16
1.9 Project Infrastructure ......................................................................................................................... 17
1.10 Tailings Management Facilties ......................................................................................................... 18
1.11 Environmental Studies and Permitting .............................................................................................. 19
1.12 Capital and Operating Costs ............................................................................................................. 21
1.12.1 Marmato Upper Zone Capital Costs ...................................................................................... 21
1.12.2 MDZ Capital Costs ................................................................................................................ 22
1.12.3 Marmato Operating Costs ..................................................................................................... 24
1.13 Economic Analysis ............................................................................................................................ 24
1.14 Conclusions and Recommendations ................................................................................................ 27
1.15 Conclusions and Recommendations ................................................................................................ 27
1.15.1 Mineral Resources ................................................................................................................ 28
1.15.2 Geotechnical ......................................................................................................................... 28
1.15.3 Tailings Management Facilities ............................................................................................. 28
1.15.4 Mining .................................................................................................................................... 28
1.15.5 Metallurgy and Mineral Processing ....................................................................................... 28
1.15.6 Recovery Methods ................................................................................................................ 28
1.15.7 Infrastructure ......................................................................................................................... 29
1.15.8 Hydrogeology ........................................................................................................................ 29
1.15.9 Environmental Studies and Permitting .................................................................................. 29
1.15.10 Project Economics ............................................................................................................ 29
2 Introduction ................................................................................................................ 30
2.1 Terms of Reference and Purpose of the Report ............................................................................... 30

SRK Consulting (U.S.), Inc. NI 43-101 Technical Report – Marmato Project Page iii
MMS/KD Marmato_PEA_NI43-101_544400.020_Rev31_KD.docx November 2019
2.2 Qualifications of Consultants (SRK) .................................................................................................. 30
2.3 Details of Inspection .......................................................................................................................... 32
2.4 Sources of Information ...................................................................................................................... 32
2.5 Effective Date .................................................................................................................................... 33
2.6 Units of Measure ............................................................................................................................... 33
3 Reliance on Other Experts ........................................................................................ 34
4 Property Description and Location .......................................................................... 35
4.1 Property Location .............................................................................................................................. 35
4.2 Mineral Titles ..................................................................................................................................... 35
4.2.1 Nature and Extent of Issuer’s Interest ................................................................................... 39
4.3 Royalties, Agreements and Encumbrances ...................................................................................... 39
4.4 Environmental Liabilities and Permitting ........................................................................................... 39
4.4.1 Environmental Liabilities........................................................................................................ 39
4.4.2 Required Permits and Status ................................................................................................ 40
4.5 Other Significant Factors and Risks .................................................................................................. 40
5 Accessibility, Climate, Local Resources, Infrastructure and Physiography ........ 41
5.1 Topography, Elevation and Vegetation ............................................................................................. 41
5.2 Accessibility and Transportation to the Property .............................................................................. 41
5.3 Climate and Length of Operating Season ......................................................................................... 43
5.4 Sufficiency of Surface Rights ............................................................................................................ 43
5.5 Infrastructure Availability and Sources.............................................................................................. 43
5.5.1 Power .................................................................................................................................... 43
5.5.2 Water ..................................................................................................................................... 43
5.5.3 Mining Personnel ................................................................................................................... 43
5.5.4 Existing and Potential Tailings Storage Facilities ................................................................. 43
5.5.5 Potential Waste Disposal Areas ............................................................................................ 44
5.5.6 Potential Processing Plant Sites ........................................................................................... 44
6 History ......................................................................................................................... 45
6.1 Prior Ownership and Ownership Changes ....................................................................................... 45
6.2 Exploration and Development Results of Previous Owners ............................................................. 46
6.3 Historic Mineral Resource and Reserve Estimates .......................................................................... 46
6.4 Historic Production ............................................................................................................................ 47
7 Geological Setting and Mineralization ..................................................................... 48
7.1 Regional Geology .............................................................................................................................. 48
7.2 Local Geology ................................................................................................................................... 50
7.3 Property Geology .............................................................................................................................. 50
7.3.1 Structure ................................................................................................................................ 54

SRK Consulting (U.S.), Inc. NI 43-101 Technical Report – Marmato Project Page iv
MMS/KD Marmato_PEA_NI43-101_544400.020_Rev31_KD.docx November 2019
7.3.2 Alteration ............................................................................................................................... 55
7.4 Significant Mineralized Zones ........................................................................................................... 56
8 Deposit Type .............................................................................................................. 57
8.1 Mineral Deposit ................................................................................................................................. 57
8.2 Geological Model .............................................................................................................................. 57
9 Exploration ................................................................................................................. 59
9.1 Relevant Exploration Work ............................................................................................................... 59
9.1.1 Imagery and Topography ...................................................................................................... 59
9.1.2 Surface Geochemistry ........................................................................................................... 59
9.1.3 Geophysics ............................................................................................................................ 59
9.1.4 Geological Mapping ............................................................................................................... 59
9.1.5 Underground Mapping ........................................................................................................... 59
9.2 Sampling Methods and Sample Quality ............................................................................................ 60
9.3 Significant Results and Interpretation ............................................................................................... 61
10 Drilling ......................................................................................................................... 63
10.1 Type and Extent ................................................................................................................................ 63
10.2 Procedures ........................................................................................................................................ 65
10.2.1 Summary ............................................................................................................................... 65
10.2.2 Collar Surveys ....................................................................................................................... 66
10.2.3 Drilling Orientation ................................................................................................................. 67
10.3 Interpretation and Relevant Results .................................................................................................. 69
11 Sample Preparation, Analysis and Security ............................................................ 71
11.1 Security Measures ............................................................................................................................ 71
11.2 Sample Preparation for Analysis ....................................................................................................... 71
11.2.1 Historical Sample Preparation (Pre 2010) ............................................................................. 71
11.2.2 Sample Preparation (2010 – 2017) ....................................................................................... 72
11.2.3 Sample Preparation (2017 – Current) ................................................................................... 74
11.3 Sample Analysis ................................................................................................................................ 75
11.4 Quality Assurance/Quality Control Procedures ................................................................................ 76
11.4.1 Standards .............................................................................................................................. 78
11.4.2 Blanks .................................................................................................................................... 82
11.4.3 Reassays ............................................................................................................................... 87
11.4.4 Check Analysis ...................................................................................................................... 89
11.5 Opinion on Adequacy ........................................................................................................................ 91
12 Data Verification ......................................................................................................... 92
12.1 Procedures ........................................................................................................................................ 92
12.1.1 Verifications by GCM ............................................................................................................. 92

SRK Consulting (U.S.), Inc. NI 43-101 Technical Report – Marmato Project Page v
MMS/KD Marmato_PEA_NI43-101_544400.020_Rev31_KD.docx November 2019
12.1.2 Verification by SRK ............................................................................................................... 93
12.2 Limitations ......................................................................................................................................... 93
12.3 Opinion on Data Adequacy ............................................................................................................... 94
13 Mineral Processing and Metallurgical Testing ........................................................ 95
13.1 Introduction ....................................................................................................................................... 95
13.2 Metallurgical Sample Characterization ............................................................................................. 95
13.3 Mineralogy ......................................................................................................................................... 97
13.4 Comminution Testwork ..................................................................................................................... 97
13.5 Metallurgical Testwork ...................................................................................................................... 98
13.5.1 Whole-Ore Cyanidation ......................................................................................................... 98
13.5.2 Gravity Concentration .......................................................................................................... 100
13.5.3 Cyanidation of Gravity Tailing ............................................................................................. 100
13.5.4 Flotation from Gravity Tailing .............................................................................................. 103
13.5.5 Cyanidation of Flotation Concentrates ................................................................................ 103
13.6 Cyanide Detoxification .................................................................................................................... 104
13.7 Solid-Liquid Separation ................................................................................................................... 106
13.7.1 Flocculant Screening ........................................................................................................... 106
13.7.2 Static Thickening ................................................................................................................. 106
13.7.3 Dynamic Thickening ............................................................................................................ 106
13.7.4 Rheology on Thickener Underflow ...................................................................................... 107
13.8 Gold and Silver Recovery Estimate ................................................................................................ 108
13.9 Significant Factors ........................................................................................................................... 111
14 Mineral Resource Estimate ..................................................................................... 112
14.1 Drillhole Database ........................................................................................................................... 112
14.2 Geologic Model ............................................................................................................................... 113
14.2.1 Topographic Wireframes ..................................................................................................... 113
14.2.2 Lithological Wireframes ....................................................................................................... 114
14.2.3 Fault Network ...................................................................................................................... 114
14.2.4 Vein Models ......................................................................................................................... 115
14.2.5 Splay Veins ......................................................................................................................... 117
14.2.6 Porphyry Model ................................................................................................................... 118
14.2.7 MDZ ..................................................................................................................................... 118
14.3 Domains .......................................................................................................................................... 121
14.4 Assay Capping and Compositing .................................................................................................... 122
14.4.1 Outliers ................................................................................................................................ 122
14.4.2 Compositing ........................................................................................................................ 131
14.5 Density ............................................................................................................................................ 133

SRK Consulting (U.S.), Inc. NI 43-101 Technical Report – Marmato Project Page vi
MMS/KD Marmato_PEA_NI43-101_544400.020_Rev31_KD.docx November 2019
14.6 Variogram Analysis and Modeling .................................................................................................. 136
14.7 Block Model ..................................................................................................................................... 137
14.7.1 Protoype Definition .............................................................................................................. 137
14.7.2 Model Codes ....................................................................................................................... 138
14.8 Estimation Methodology .................................................................................................................. 138
14.9 Model Validation .............................................................................................................................. 140
14.9.1 Visual Comparison .............................................................................................................. 140
14.9.2 Comparative Statistics ......................................................................................................... 142
14.9.3 Swath Plots ......................................................................................................................... 143
14.10 Resource Classification .................................................................................................................. 146
14.11 Depletion ......................................................................................................................................... 147
14.12 Mineral Resource Statement .......................................................................................................... 148
14.13 Mineral Resource Sensitivity ........................................................................................................... 150
14.14 Comparison to Previous Estimates ................................................................................................. 157
14.15 Relevant Factors ............................................................................................................................. 162
15 Mineral Reserve Estimate ........................................................................................ 163
16 Mining Methods ........................................................................................................ 164
16.1 Current Mining Methods .................................................................................................................. 164
16.1.1 Mine Layout ......................................................................................................................... 165
16.1.2 Reconciliation ...................................................................................................................... 166
16.1.3 Dilution................................................................................................................................. 167
16.2 Geotechnical ................................................................................................................................... 167
16.2.1 Engineering Geology ........................................................................................................... 167
16.2.2 Vein Zone ............................................................................................................................ 170
16.2.3 MDZ Stope Stability ............................................................................................................. 171
16.2.4 MDZ Sill Pillar Design .......................................................................................................... 173
16.2.5 Ground Support ................................................................................................................... 175
16.3 Upper Mine Mining .......................................................................................................................... 176
16.3.1 Cut-off Grade Calculations .................................................................................................. 176
16.3.2 Hydrogeology and Mine Dewatering ................................................................................... 177
16.3.3 Stope Optimization .............................................................................................................. 182
16.3.4 Mine Design ........................................................................................................................ 185
16.3.5 Mine Plan Resource ............................................................................................................ 186
16.3.6 Production Schedule ........................................................................................................... 187
16.3.7 Mining Operations ............................................................................................................... 190
16.3.8 Ventilation ............................................................................................................................ 192
16.3.9 Mine Services ...................................................................................................................... 193

SRK Consulting (U.S.), Inc. NI 43-101 Technical Report – Marmato Project Page vii
MMS/KD Marmato_PEA_NI43-101_544400.020_Rev31_KD.docx November 2019
16.3.10 Recommendations .......................................................................................................... 194
16.4 MDZ Mining ..................................................................................................................................... 195
16.4.1 Cut-off Grade Calculations .................................................................................................. 196
16.4.2 Hydrogeology and Mine Dewatering ................................................................................... 198
16.4.3 Stope Optimization .............................................................................................................. 200
16.4.4 Mine Design ........................................................................................................................ 201
16.4.5 Mine Plan Resource ............................................................................................................ 204
16.4.6 Production Schedule ........................................................................................................... 205
16.4.7 Mining Operations ............................................................................................................... 208
16.4.8 Ventilation ............................................................................................................................ 211
16.4.9 Mine Services ...................................................................................................................... 218
17 Recovery Methods ................................................................................................... 223
17.1 Marmato Process Plant (Current Operations) ................................................................................ 223
17.1.1 Crushing Circuit ................................................................................................................... 226
17.1.2 Grinding and Gravity Concentration Circuit ......................................................................... 226
17.1.3 Flotation and Concentrate Regrind Circuit .......................................................................... 226
17.1.4 Cyanidation and Counter-Current-Decantation (CCD) Circuit ............................................ 226
17.1.5 Merrill-Crowe Circuit and Smelter ....................................................................................... 227
17.1.6 Process Plant Consumables ............................................................................................... 227
17.1.7 Operating Performance ....................................................................................................... 228
17.1.8 Operating Costs .................................................................................................................. 228
17.2 MDZ Process Plant ......................................................................................................................... 230
17.2.1 Crushing Circuit ................................................................................................................... 233
17.2.2 Grinding, Classification and Gravity Circuit ......................................................................... 233
17.2.3 Grinding Control Thickener ................................................................................................. 234
17.2.4 Leach and Carbon Adsorption Circuit ................................................................................. 234
17.2.5 Elution and Gold Room Operations .................................................................................... 235
17.2.6 Carbon Safety Screen ......................................................................................................... 236
17.2.7 Cyanide Destruction Circuit ................................................................................................. 236
17.2.8 Tailings Disposal ................................................................................................................. 236
17.3.1 Lime ..................................................................................................................................... 237
17.3.2 Sodium Cyanide .................................................................................................................. 237
17.3.3 Activated Carbon ................................................................................................................. 237
17.3.4 Flocculant ............................................................................................................................ 237
17.3.5 Copper Sulfate .................................................................................................................... 238
17.3.6 Sodium Metabisulfite ........................................................................................................... 238
17.3.7 Grinding Media .................................................................................................................... 238

SRK Consulting (U.S.), Inc. NI 43-101 Technical Report – Marmato Project Page viii
MMS/KD Marmato_PEA_NI43-101_544400.020_Rev31_KD.docx November 2019
17.5.1 Labor ................................................................................................................................... 239
17.5.2 Consumables ...................................................................................................................... 239
17.5.3 Power .................................................................................................................................. 240
17.5.4 Maintenance Supplies ......................................................................................................... 240
17.5.5 Laboratory Cost ................................................................................................................... 240
18 Project Infrastructure............................................................................................... 242
18.1 General Site Access........................................................................................................................ 242
18.2 Marmato Existing Operations Infrastructure ................................................................................... 243
18.2.1 Existing Project Access ....................................................................................................... 243
18.2.2 Existing Project Facilities ..................................................................................................... 244
18.2.3 Energy Supply and Distribution - Existing Marmato Project ............................................... 246
18.2.4 Site Water Supply ................................................................................................................ 248
18.3 MDZ Project Infrastructure .............................................................................................................. 248
18.3.1 MDZ Access ........................................................................................................................ 251
18.3.2 MDZ Project Surface Facilities ............................................................................................ 251
18.3.3 MDZ Energy Supply and Distribution .................................................................................. 251
18.3.4 Water Supply ....................................................................................................................... 251
18.4 Tailings Management Facilities ....................................................................................................... 252
18.4.1 Existing Tailings Facilities ................................................................................................... 253
18.4.2 Tailings Storage Facility Siting Study .................................................................................. 253
18.4.3 Dry Stack Tailings Storage Facility ..................................................................................... 253
18.4.4 Design Criteria ..................................................................................................................... 254
18.4.5 Rock Starter Embankments ................................................................................................ 255
18.4.6 Tailings Stacking ................................................................................................................. 256
18.4.7 Underdrain and Surface Water Management ..................................................................... 256
18.4.8 Access Road ....................................................................................................................... 257
18.4.9 Reclamation ........................................................................................................................ 257
18.5 Off-Site Infrastructure and Logistics Requirements ........................................................................ 257
18.5.1 Port ...................................................................................................................................... 258
18.5.2 Rail ...................................................................................................................................... 258
19 Market Studies and Contracts ................................................................................ 259
19.1 Commodity Price Projections .......................................................................................................... 259
19.2 Contracts and Status....................................................................................................................... 259
20 Environmental Studies, Permitting and Social or Community Impact ................ 260
20.1 Environmental Studies and Management ....................................................................................... 260
20.1.1 Environmental Setting ......................................................................................................... 261
20.1.2 Water Quality and Monitoring .............................................................................................. 261

SRK Consulting (U.S.), Inc. NI 43-101 Technical Report – Marmato Project Page ix
MMS/KD Marmato_PEA_NI43-101_544400.020_Rev31_KD.docx November 2019
20.1.3 Air Quality and Monitoring ................................................................................................... 262
20.1.4 Environmental Procedures and Permissions ...................................................................... 262
20.1.5 Environmental Management ............................................................................................... 264
20.1.6 Geochemistry ...................................................................................................................... 264
20.2 Mine Waste Management ............................................................................................................... 266
20.2.1 Waste Rock Management ................................................................................................... 266
20.2.2 Tailings Management .......................................................................................................... 266
20.2.3 Site Monitoring .................................................................................................................... 268
20.2.4 General Water Management ............................................................................................... 268
20.2.5 Off-Site Impacts ................................................................................................................... 268
20.3 Project Permitting ............................................................................................................................ 268
20.3.1 General Mining Authority ..................................................................................................... 268
20.3.2 Environmental Authority ...................................................................................................... 269
20.3.3 Environmental Regulations and Impact Assessment .......................................................... 270
20.3.4 Water Quality and Water Rights .......................................................................................... 270
20.3.5 Air Quality ............................................................................................................................ 271
20.3.6 Fauna and Flora Protection ................................................................................................. 271
20.3.7 Protection of Riparian Areas and Drainages ....................................................................... 271
20.3.8 Protection of Cultural Heritage or Archaeology ................................................................... 272
20.3.9 Marmato Permitting ............................................................................................................. 272
20.3.10 Performance and Reclamation Bonding ......................................................................... 273
20.4 Social Management ........................................................................................................................ 273
20.4.1 Stakeholder Engagement .................................................................................................... 273
20.4.2 Artisanal and Small-Scale Mining Operations ..................................................................... 274
20.5 Mine Closure and Reclamation ....................................................................................................... 275
20.5.1 Reclamation and Closure Costs .......................................................................................... 276
21 Capital and Operating Costs ................................................................................... 277
21.1 Capital Cost Estimates .................................................................................................................... 277
21.1.1 Marmato Upper Zone .......................................................................................................... 277
21.1.2 Marmato Deeps Zone .......................................................................................................... 279
21.2 Operating Cost Estimates ............................................................................................................... 283
21.2.1 Basis for Operating Cost Estimates .................................................................................... 284
22 Economic Analysis .................................................................................................. 286
22.1 External Factors .............................................................................................................................. 286
22.2 Production Assumptions ................................................................................................................. 286
22.3 Taxes, Royalties and Other Interests .............................................................................................. 292
22.4 Results ............................................................................................................................................ 292

SRK Consulting (U.S.), Inc. NI 43-101 Technical Report – Marmato Project Page x
MMS/KD Marmato_PEA_NI43-101_544400.020_Rev31_KD.docx November 2019
22.5 Sensitivity Analysis .......................................................................................................................... 296
23 Adjacent Properties ................................................................................................. 298
24 Other Relevant Data and Information ..................................................................... 299
25 Interpretation and Conclusions .............................................................................. 300
25.1 Property Description and Ownership .............................................................................................. 300
25.2 Exploration ...................................................................................................................................... 300
25.3 Mineral Resource Estimate ............................................................................................................. 301
25.4 Mining and Mineral Reserve Estimate ............................................................................................ 302
25.5 Metallurgy and Processing .............................................................................................................. 302
25.6 Infrastructure ................................................................................................................................... 302
25.7 Environmental Studies and Permitting ............................................................................................ 303
25.8 Projected Economic Outcomes ....................................................................................................... 304
25.9 Foreseeable Impacts of Risks ......................................................................................................... 305
25.9.1 Water Supply ....................................................................................................................... 305
25.9.2 Mining .................................................................................................................................. 306
25.9.3 Infrastructure ....................................................................................................................... 306
26 Recommendations ................................................................................................... 308
26.1 Recommended Work Programs and Costs .................................................................................... 308
26.1.1 Mineral Resources .............................................................................................................. 308
26.1.2 Geotechnical ....................................................................................................................... 308
26.1.3 Tailings Management Facilities ........................................................................................... 309
26.1.4 Mining .................................................................................................................................. 309
26.1.5 Metallurgy and Mineral Processing ..................................................................................... 310
26.1.6 Recovery Methods .............................................................................................................. 310
26.1.7 Infrastructure ....................................................................................................................... 310
26.1.8 Hydrogeology ...................................................................................................................... 310
26.1.9 Environmental Studies and Permitting ................................................................................ 311
26.1.10 Project Economics .......................................................................................................... 312
26.1.11 Costs ............................................................................................................................... 312
27 References ................................................................................................................ 313
28 Glossary .................................................................................................................... 315
28.1 Mineral Resources .......................................................................................................................... 315
28.2 Mineral Reserves ............................................................................................................................ 315
28.3 Definition of Terms .......................................................................................................................... 316
28.4 Abbreviations .................................................................................................................................. 317

SRK Consulting (U.S.), Inc. NI 43-101 Technical Report – Marmato Project Page xi
MMS/KD Marmato_PEA_NI43-101_544400.020_Rev31_KD.docx November 2019
List of Tables Table 1-1: SRK Mineral Resource Statement for the Marmato Project, Dated July 31, 2019*, Within All Licences
............................................................................................................................................................... 7
Table 1-2: SRK Mineral Resource Statement for the Marmato Project, Dated July 31, 2019*, Breakdown by Mining Areas .......................................................................................................................................... 8
Table 1-3: Upper Mine - Mine Plan Resource Classification – Vein and Level 21 Material (1) ......................... 10
Table 1-4: Upper Mine Production Schedule – Vein and Level 21 Material ..................................................... 10
Table 1-5: MDZ Mine Plan Resource Classification (1) ..................................................................................... 12
Table 1-6: MDZ Annual Mining Schedule ......................................................................................................... 13
Table 1-7: Summary of Marmato Plant Operating Performance ...................................................................... 17
Table 1-8: Marmato Upper Zone Sustaining Capital (LoM) .............................................................................. 21
Table 1-9: Marmato Upper Zone Sustaining Capital (2019 to 2026) ($000’s) ................................................. 22
Table 1-10: Marmato Upper Zone Sustaining Capital (2027 to 2034) ($000’s) ............................................... 22
Table 1-11: Marmato Deeps Zone Construction Capital ($000’s) .................................................................... 23
Table 1-12: Marmato Deeps Zone Sustaining Capital (LoM) ........................................................................... 23
Table 1-13: Marmato Deeps Zone Sustaining Capital (2023 to 2030)($000’s) ................................................ 23
Table 1-14: Marmato Deeps Zone Sustaining Capital (2031 to 2038) ($000’s) ............................................... 24
Table 1-15: Marmato Upper Zone Operating Costs Summary ......................................................................... 24
Table 1-16: Marmato Deeps Zone Operating Costs Summary ........................................................................ 24
Table 1-17: Marmato Indicative Economic Results .......................................................................................... 27
Table 1-18: LOM All-in Sustaining Cost Breakdown ........................................................................................ 27
Table 2-1: Site Visit Participants ....................................................................................................................... 32
Table 6-1: Ownership History at Marmato ........................................................................................................ 45
Table 6-2: Gold Production from the Municipality of Marmato 2004 to December 2018 ................................. 47
Table 10-1: Summary of Drilling Completed by Company ............................................................................... 63
Table 11-1: Summary Of QA/QC Sample Submissions During 2018 Submissions To SGS And ALS Laboratories ......................................................................................................................................... 77
Table 11-2: Summary Of QA/QC Sample Submissions During 2019 Submissions To SGS And ALS Laboratories (Up to MT-IU-031) .......................................................................................................... 78
Table 11-3: Summary of CRM’s Submitted During Routine Assay Submissions ............................................ 79
Table 11-4: Summary Statistics for Field Duplicates to SGS laboratory .......................................................... 85
Table 11-5: Summary Statistics for Coarse Duplicates to SGS and ALS Submissions (Au g/t) ...................... 86
Table 11-6: Summary Statistics for Coarse Duplicates to SGS and ALS Submissions (Au g/t) ...................... 86
Table 11-7: Summary Statistics for 2018 Reassays Program to SGS vs ALS Submissions (Au g/t) .............. 87
Table 11-8: Summary Statistics for 2019 Reassays Program to SGS vs ALS Submissions (Au g/t) .............. 88
Table 13-1: Drillholes and Intervals for MDZ Metallurgical Composites .......................................................... 95
Table 13-2: Head Analyses for MDZ and Marmato Test Composites .............................................................. 96
Table 13-3: Comminution Test Results on MDZ and Marmato Test Samples ................................................. 97

SRK Consulting (U.S.), Inc. NI 43-101 Technical Report – Marmato Project Page xii
MMS/KD Marmato_PEA_NI43-101_544400.020_Rev31_KD.docx November 2019
Table 13-4: Whole-Ore Cyanidation Test Results on MDZ Test Composite .................................................... 99
Table 13-5: Summary of Gravity Concentration Testwork on MDZ and Marmato Composites (1) ................. 100
Table 13-6: MDZ Gravity Tailing Leach Conditions ........................................................................................ 101
Table 13-7: Gravity Concentration + Gravity Tailing Cyanidation Test Results ............................................. 101
Table 13-8: Summary of Gravity Concentration + Gravity Tailing Cyanidation (Variability Composites) ...... 103
Table 13-9: Summary of Rougher Flotation Tests on Gravity Tailings from MDZ and Marmato Composites ........................................................................................................................................................... 103
Table 13-10: Summary of Flotation Concentrate Cyanidation Test Results .................................................. 104
Table 13-11: Summary of Cyanide Detoxification Testwork on MDZ Composite Leach Residue ................. 105
Table 13-12: Static Thickener Test Conditions .............................................................................................. 106
Table 13-13: Summary of Dynamic Thickener Test Results .......................................................................... 106
Table 13-14: Results of Rheology Testwork on MDZ Thickener Underflow Sample ..................................... 107
Table 13-15: Estimated Gold and Silver Recoveries for Flowsheet Options ................................................. 110
Table 14-1: Summary of Geological Database Information Available by Sample Type and Company ......... 113
Table 14-2: Summary of Domain Coding Used in the 2017 Mineral Resource Estimate .............................. 121
Table 14-3: Comparison of Raw vs. Capped Composite Statistics ................................................................ 130
Table 14-4: Summary of Density Values ........................................................................................................ 133
Table 14-5: Summary of Density Values Used in 2019 Mineral Resource .................................................... 135
Table 14-6: Summary of Semi-Variogram Parameters Used in the 2019 Estimation Process ...................... 136
Table 14-7: Summary of Block Model Parameters used for Geological Model .............................................. 138
Table 14-8: Summary of Block Model Fields and Description........................................................................ 138
Table 14-9: Summary of Final Ordinary Kriging Parameters for Gold at Marmato ........................................ 140
Table 14-10: Comparison of Raw, Declustered Composites vs. OK, ID2 and NN Statistics (1) ..................... 143
Table 14-11: Summary of Cut-Off Grade Assumptions at Marmato Based on Assumed Costs (Averaged for All Mining Styles) .................................................................................................................................... 149
Table 14-12: SRK Mineral Resource Statement for the Marmato Project, Dated July 31, 2019 ................... 150
Table 14-13: SRK Mineral Resource Statement for the Marmato Project, Dated July 31, 2019*, Breakdown by Mining Areas ...................................................................................................................................... 151
Table 14-14: Grade Tonnage Curve Measured and Indicated - Vein Domains (Group 1000 to 3000) ......... 152
Table 14-15: Grade Tonnage Curve Measured and Indicated - Porphyry Domain (Group 4000) ................. 152
Table 14-16: Grade Tonnage Curve Measured and Indicated - MDZ Domain (Group 5000) ........................ 153
Table 14-17: Grade Tonnage Curve Inferred - Vein Domains (Group 1000 - 3000) ..................................... 153
Table 14-18: Grade Tonnage Curve Inferred- Porphyry Domain (Group 4000) ............................................ 154
Table 14-19: Grade Tonnage Curve Inferred - MDZ Domain (Group 5000) .................................................. 154
Table 14-20: Mineral Resource Comparison of 2017 vs. 2019 Roll Forward Numbers for Marmato(1) ......... 160
Table 16-1: 2015 to 2019* Production ............................................................................................................ 164
Table 16-2: Rock Mass Quality ...................................................................................................................... 168
Table 16-3: Stope Design Parameters Marmato Deep .................................................................................. 172

SRK Consulting (U.S.), Inc. NI 43-101 Technical Report – Marmato Project Page xiii
MMS/KD Marmato_PEA_NI43-101_544400.020_Rev31_KD.docx November 2019
Table 16-4: Summary of Support Requirements by Excavation Type ........................................................... 176
Table 16-5: Cut-Off Grade Parameters for Veins Material ............................................................................. 176
Table 16-6: Cut-Off Grade Parameters for Level 21 Material ........................................................................ 177
Table 16-7: 2012 Campaign Piezometers and Boreholes .............................................................................. 177
Table 16-8: Upper Mine – Mine Plan Resource Classification – Vein and Level 21 Material(1) ..................... 187
Table 16-9: GCM Reported Historical Grades................................................................................................ 187
Table 16-10: Productivity Rates ..................................................................................................................... 188
Table 16-11: Marmato Upper Mine Total Production Schedule ..................................................................... 189
Table 16-12: Marmato Upper Mine Production Schedule by Veins and Level 21.......................................... 189
Table 16-13: Manpower by Department ......................................................................................................... 194
Table 16-14: Marmato Equipment List ........................................................................................................... 194
Table 16-15: Underground Cut-off Grade Calculation .................................................................................... 196
Table 16-16: MDZ Mine Plan Resource Classification (1) ............................................................................... 205
Table 16-17: Productivity Rates ..................................................................................................................... 205
Table 16-18: MDZ Annual Mining Schedule ................................................................................................... 206
Table 16-19: Production Schedule Totals by Activity Type ............................................................................ 206
Table 16-20: Trucks and Haul Distance for Mineralized Material .................................................................. 210
Table 16-21: Equipment Load and Airflow Requirement for 0.09 m3/s/kW Dilution Rate .............................. 213
Table 16-22: Equipment Load and Airflow Requirement for 0.06 m3/s/kW Dilution Rate .............................. 214
Table 16-23: Reduced Equipment Load for Decline Development ................................................................ 215
Table 16-24: Suggested Auxiliary Ventilation System for Decline Development ........................................... 215
Table 16-25: Main Body Stope Ventilation Airflow and Equipment ................................................................ 215
Table 16-26: Main Body Stope Auxiliary Ventilation System ......................................................................... 216
Table 16-27: Fringe Stope Auxiliary Ventilation System ................................................................................ 216
Table 16-28: Fringe Stope Haulage Airflow Requirement .............................................................................. 216
Table 16-29: Fringe Stope Haulage Auxiliary Ventilation System .................................................................. 216
Table 16-30: Stope Auxiliary Ventilation System Summary ........................................................................... 217
Table 16-31: Exhaust Fan Pressure, Airflow, and Power Summary (0.09 m3/s/kW) ..................................... 218
Table 16-32: Exhaust Fan Pressure, Airflow, and Power Summary (0.06 m3/s/kW) ..................................... 218
Table 16-33: Typical Mining Labor by Shift .................................................................................................... 220
Table 16-34: Mobile Equipment Life of Mine Summary ................................................................................. 221
Table 16-35: Mine Surface Equipment and Facilities Summary .................................................................... 222
Table 16-36: Underground Facilities and Equipment ..................................................................................... 222
Table 17-1: Equipment List for Marmato Process Plant ................................................................................. 225
Table 17-2: Marmato Process Plant Consumables ........................................................................................ 227
Table 17-3: Summary of Marmato Plant Operating Performance .................................................................. 228
Table 17-4: Summary of Marmato 2019 Process Plant Operating Costs (January to July) ......................... 229

SRK Consulting (U.S.), Inc. NI 43-101 Technical Report – Marmato Project Page xiv
MMS/KD Marmato_PEA_NI43-101_544400.020_Rev31_KD.docx November 2019
Table 17-5: Preliminary Design Criteria for the MDZ Process Plant .............................................................. 232
Table 17-6: Preliminary Major Equipment List ............................................................................................... 233
Table 17-7: MDZ Process Plant Consumables .............................................................................................. 237
Table 17-8: Operating Cost Summary MDZ Process Plant ............................................................................ 238
Table 17-9: MDZ Process Plant Manpower Schedule and Labor Cost Estimate ........................................... 239
Table 17-10: MDZ Process Plant Consumable Operating Cost Estimate ...................................................... 240
Table 17-11: Preliminary Process Capital Cost Estimate ............................................................................... 241
Table 18-1: DSTF Design Criteria .................................................................................................................. 255
Table 18-2: Stormwater Diversion Channel Summary for 100-yr 24-hr Storm .............................................. 256
Table 19-1: Marmato Price Assumptions ....................................................................................................... 259
Table 19-2: Marmato Net Smelter Return Terms ........................................................................................... 259
Table 20-1: Water Discharges ........................................................................................................................ 262
Table 20-2: Stationary Emission Sources ...................................................................................................... 262
Table 20-3: Environmental Procedures .......................................................................................................... 263
Table 20-4: Environmental Management Budget ........................................................................................... 264
Table 20-5: Surface Water Concessions ........................................................................................................ 271
Table 21-1: Marmato Upper Zone Sustaining Capital (LoM) .......................................................................... 277
Table 21-2: Marmato Upper Zone Sustaining Capital (2019 to 2026)($000’s) .............................................. 278
Table 21-3: Marmato Upper Zone Sustaining Capital (2027 to 2034)($000’s) .............................................. 278
Table 21-4: Marmato Upper Zone Capital Development Unit Costs .............................................................. 278
Table 21-5: Marmato Upper Zone Capital Development Meters (2019 to 2026)($000’s) .............................. 279
Table 21-6: Marmato Upper Zone Capital Development Meters (2027 to 2034)($000’s) .............................. 279
Table 21-7: Marmato Deeps Zone Construction Capital ($000’s) .................................................................. 280
Table 21-8: Marmato Deeps Zone Pre-Production Development Unit Costs (Contractor)($000’s) ............... 281
Table 21-9: Marmato Deeps Zone Pre-Production Development Meters ...................................................... 281
Table 21-10: Marmato Deeps Zone Sustaining Capital (LoM) ....................................................................... 282
Table 21-11: Marmato Deeps Zone Sustaining Capital (2023 to 2030)($000’s) ............................................ 282
Table 21-12: Marmato Deeps Zone Sustaining Capital (2031 to 2038)($000’s) ............................................ 282
Table 21-13: Marmato Deeps Zone Development Sustaining Capital Unit Costs ......................................... 283
Table 21-14: Marmato Deeps Zone Development Sustaining Capital Meters (2023 to 2030)($000’s) ......... 283
Table 21-15: Marmato Deeps Zone Development Sustaining Capital Meters (2031 to 2037)($000’s) ......... 283
Table 21-16: Marmato Upper Zone Operating Costs Summary..................................................................... 283
Table 21-17: Marmato Deeps Zone Operating Costs Summary .................................................................... 284
Table 21-18: Marmato Upper Zone Operating Development Unit Costs ....................................................... 284
Table 21-19: Marmato Upper Zone Operating Development Meters (2019 to 2027) .................................... 285
Table 21-20: Marmato Upper Zone Operating Development Meters (2028 – 2035) ..................................... 285
Table 21-21: Marmato Deeps Zone Operating Development Unit Costs ....................................................... 285

SRK Consulting (U.S.), Inc. NI 43-101 Technical Report – Marmato Project Page xv
MMS/KD Marmato_PEA_NI43-101_544400.020_Rev31_KD.docx November 2019
Table 21-22: Marmato Deeps Zone Operating Development Meters (2023 to 2030) .................................... 285
Table 21-23: Marmato Upper Zone Operating Development Meters (2031 to 2037) .................................... 285
Table 22-1: Marmato Net Smelter Return Terms ........................................................................................... 286
Table 22-2: Marmato Production Summary .................................................................................................... 286
Table 22-3: Marmato Yearly (2019 to 2026) Mine Production Assumptions .................................................. 288
Table 22-4: Marmato Yearly (2027 to 2034) Mine Production Assumptions .................................................. 289
Table 22-5: Marmato Yearly (2035-2038) Mine Production Assumptions ..................................................... 290
Table 22-6: Marmato Upper Zone LoM Mill Production Assumptions ............................................................ 291
Table 22-7: Marmato Deeps Zone LoM Mill Production Assumptions ........................................................... 292
Table 22-8: Marmato Indicative Economic Results ........................................................................................ 295
Table 22-9: Marmato LoM Annual Production and Revenues ....................................................................... 296
Table 22-10: LOM All-in Sustaining Cost Breakdown .................................................................................... 296
Table 25-1: Marmato Indicative Economic Results ........................................................................................ 305
Table 26-1: Summary of Costs for Recommended Work ............................................................................... 312
Table 28-1: Definition of Terms ...................................................................................................................... 316
Table 28-2: Abbreviations ............................................................................................................................... 317
List of Figures
Figure 1-1: Summary Breakdown of Mining Areas for Study ............................................................................. 8
Figure 1-2: Marmato After-Tax Free Cash Flow, Capital and Metal Production .............................................. 25
Figure 1-3: Marmato Operating Cost Break-Down ........................................................................................... 26
Figure 4-1: Location Map .................................................................................................................................. 35
Figure 4-2: Land Tenure Map(s) ....................................................................................................................... 36
Figure 4-3: Summary of Gap in Licenses Within the Current Operations, with Associated Applications ........ 38
Figure 5-1: Marmato Project, Looking Northwest Towards Cerro El Burro ...................................................... 42
Figure 7-1: Regional Geology Map ................................................................................................................... 49
Figure 7-2: Local Geology Map ........................................................................................................................ 50
Figure 7-3: Cross-Section of the Marmato Gold Deposit Looking NW Showing the Intrusions P1 to P5 ........ 51
Figure 7-4: Examples from Drill Core of the Different Mineralization Styles .................................................... 52
Figure 7-5: Schematic Cross-Section of the Marmato Gold Deposit, Showing the Two Principal Zones and the Vertical Zonation of Mineralization ...................................................................................................... 53
Figure 7-6: Telluris Consulting Interpretation of Vein Orientations at Mineros Nacionales .............................. 55
Figure 8-1: Conceptual Model for the Marmato Deposit, Showing Two Principal Mineralization Zones ......... 58
Figure 9-1: Example of Level Plan from Gran Colombia Gold Marmato (Level 20) ......................................... 60
Figure 9-2: 2D Plan View of Sampling Data Versus Vein Interpretations, Showing New Sample Data Highlighted in Red, Versus Plan Section of Veins in Blue (Level 1250 M) ......................................... 62
Figure 10-1: Location Map Showing Drillholes Completed at Marmato by Company ...................................... 64

SRK Consulting (U.S.), Inc. NI 43-101 Technical Report – Marmato Project Page xvi
MMS/KD Marmato_PEA_NI43-101_544400.020_Rev31_KD.docx November 2019
Figure 10-2: 3D View of Sampling Data, Showing New Sample Data Highlighted in Red (Looking North) .... 65
Figure 10-3: Core Storage Facility at Marmato Constructed in 2010, and Current Status 2019 ..................... 66
Figure 10-4: Plan Showing Primary Drilling Orientation to the South and Southwest Relative to the Main Mineralization Orientation at Depth ..................................................................................................... 68
Figure 10-5: Cross Section (Orientated Looking Northeast), Showing Orientation of Drilling Relative to the Deep Mineralization, and Horizontal Drilling in the Current Operation ................................................ 69
Figure 11-1: Sample Preparation at Mine Laboratory Showing New Equipment (Crusher and Pulverizer) .... 73
Figure 11-2: Sample Preparation Facilities at ACME Laboratories in Medellín ............................................... 74
Figure 11-3: Summary Of CRM Submissions To ALS In 2018/2019 Program, Showing All Submissions (Left), And CRM’s Below 8.0 G/T Au (Right) ................................................................................................. 80
Figure 11-4: Summary of CRM Submissions To SGS In 2018/2019 Program, Showing All Submissions (Left), And CRM’s Below 8.0 G/T Au (Right) ................................................................................................. 81
Figure 11-5: Example of Timeline Review Of CRM G315-2 and SK94 Submissions ...................................... 82
Figure 11-6: ALS Coarse Blank Submissions .................................................................................................. 83
Figure 11-7: SGS Coarse Blank Submissions ................................................................................................. 83
Figure 11-8: ALS Fine Blank Submissions ....................................................................................................... 84
Figure 11-9: SGS Fine Blank Submissions ...................................................................................................... 84
Figure 11-10: Summary of Field Duplicate Inserted with SGS Submissions ................................................... 85
Figure 11-11: Summary of Coarse Duplicate Submissions to SGS (left) and ALS (right) ............................... 86
Figure 11-12: Summary of Pulp Duplicate Submissions to SGS (left) and ALS (right) .................................... 87
Figure 11-13: Summary of 2019 Reassay (secondary laboratory) Submissions from SGS (left) and ALS (right) ............................................................................................................................................................. 88
Figure 11-14: Comparison of 2019 Reassays from ALS (primary) Submissions, Showing All Data and Values Below 16.0 g/t Au ................................................................................................................................. 89
Figure 11-15: Summary of Check Assays Completed on Pulp Material (Quarterly Checks), Showing Values Less Than 18.0 g/t (Left) and Full Dataset (Right) .............................................................................. 90
Figure 11-16: Summary of Check Assays Completed on Reject Material (Quarterly Checks), Showing Values Less Than 18.0 G/T (Left) and Full Dataset (Right) ............................................................................ 90
Figure 13-1: Drillhole Locations ........................................................................................................................ 96
Figure 13-2: Gold Extraction Versus Retention Time (MDZ Gravity Tailings) ................................................ 102
Figure 13-3: Yield Stress Versus Thickener Underflow Slurry Density .......................................................... 108
Figure 14-1: Summary of Fault Network Plan as Used in the Marmato Geological Model ............................ 115
Figure 14-2: Level Plan Showing SRK Validation Versus Mining Geological Mapping ................................. 116
Figure 14-3: Plan Showing Location of Splays (Blue) vs Veins Interpretation (Transparent) ........................ 117
Figure 14-4: Summary of the Process Used to Define the MDZ Model in Leapfrog ...................................... 120
Figure 14-5: Cross-Section Showing SRK Domained Model ......................................................................... 122
Figure 14-6: Capping Analysis Veins Domain Au (g/t) – (KZONE<9000) ...................................................... 124
Figure 14-7: Capping Analysis Veins Domain Au (g/t) – (KZONE>9000) ...................................................... 125
Figure 14-8: Capping Analysis Splays Domain Au (g/t) – (Group = 3000)..................................................... 126
Figure 14-9: Capping Analysis Porphyry Domain Au (g/t) – (Group = 4000) ................................................. 127

SRK Consulting (U.S.), Inc. NI 43-101 Technical Report – Marmato Project Page xvii
MMS/KD Marmato_PEA_NI43-101_544400.020_Rev31_KD.docx November 2019
Figure 14-10: Capping Analysis MDZ Sub-domains Domain Au (g/t) – (Group = 5000) ............................... 128
Figure 14-11: Histogram of Sample Lengths Within the Various Domains .................................................... 132
Figure 14-12: Summary of Review by Rocktype of Density Values at Marmato ............................................ 134
Figure 14-13: Log Probability Plot of Density Measurements Logged as Vein .............................................. 135
Figure 14-14: Example of Semi-Variogram Analysis for Veins Domain (Group 1000) .................................. 137
Figure 14-15: Example of Visual Validation of Grade Distribution for Gold (Top) and Silver (Bottom) .......... 141
Figure 14-16: Comparison of Au Grade Within Deeps Domain Between Boreholes and Estimates ............. 142
Figure 14-17: Example of Swath Analysis Used During Validation, Showing Vein Au (g/t) ........................... 144
Figure 14-18: Example of Swath Analysis Used During Validation, Showing MDZ (High-Grade) Au (g/t) .... 145
Figure 14-19: Cross Section Showing Classification Systems at Marmato ................................................... 147
Figure 14-20: 3D View Example of Depletion Model Created by SRK for Marmato ...................................... 148
Figure 14-21: Summary Breakdown of Mining Areas for Study ..................................................................... 151
Figure 14-22: Grade Tonnage Curves Showing Sensitivity to Changes in Cut-Off for Measured and Indicated Mineralized Material ........................................................................................................................... 156
Figure 14-23: Grade Tonnage Curves Showing Sensitivity to Changes in Cut-Off for Inferred Mineralized aterial ........................................................................................................................................................... 157
Figure 14-24: Waterfall Chart Showing Changes from 2017 to 2018 Mineral Resources with Impact of Key Changes ............................................................................................................................................ 161
Figure 16-1: Marmato Zona Baja Cross Section Looking NE with Active Levels ........................................... 165
Figure 16-2: Marmato Level 18 with Main Haulage ........................................................................................ 166
Figure 16-3: Total Dilution .............................................................................................................................. 167
Figure 16-4: Rock Mass Rating Histogram for the MDZ ................................................................................ 169
Figure 16-5: Barton’s Q’ Histogram for the MDZ ............................................................................................ 169
Figure 16-6: Uniaxial Compressive Strength Histogram ................................................................................ 170
Figure 16-7: Estimated Support Categories Based on Q Index ..................................................................... 175
Figure 16-8: Location of Piezometers from 2012 Campaign .......................................................................... 178
Figure 16-9: Scheme of Current Dewatering System ..................................................................................... 179
Figure 16-10: Measured Mine Water Discharge ............................................................................................ 180
Figure 16-11: Local Geological Map ............................................................................................................... 182
Figure 16-12: Stope Optimization Results in Green and Mined Out Area in Purple (Looking Northwest) ..... 183
Figure 16-13: Example of Stope Optimization Results in Green and Mined Out Area in Purple for “Veta Exploracion NW” (Looking North) ...................................................................................................... 183
Figure 16-14: Stope Optimization Results ...................................................................................................... 184
Figure 16-15: Stope Optimization Results with Pillars Removed ................................................................... 184
Figure 16-16: Comparison of Level 21 Stopes (magenta) and Vein Stopes (green) ..................................... 184
Figure 16-17: Level 21 Stope Design Dimensions ......................................................................................... 185
Figure 16-18: Plan View of Level 21 Development Design ............................................................................ 186
Figure 16-19: Rotated View of Level 21 Development Design ....................................................................... 186
Figure 16-20: Production Schedule Colored by Time Period ......................................................................... 190

SRK Consulting (U.S.), Inc. NI 43-101 Technical Report – Marmato Project Page xviii
MMS/KD Marmato_PEA_NI43-101_544400.020_Rev31_KD.docx November 2019
Figure 16-21: Production Schedule Colored by AuEq Grade......................................................................... 190
Figure 16-22: Marmato Cut and Fill Mining Method ....................................................................................... 191
Figure 16-23: Marmato Backfill System .......................................................................................................... 192
Figure 16-24: MDZ General Layout ................................................................................................................ 196
Figure 16-25: MDZ Block Model and Mineralization Extents ......................................................................... 197
Figure 16-26: MDZ Grade/Tonne Curve Based on Au Cut-Off ...................................................................... 198
Figure 16-27: Cross Section from Marmato Mine to Cauca River.................................................................. 199
Figure 16-28: Location of Proposed Piezometers .......................................................................................... 200
Figure 16-29: Stope Optimization Results at Various Cut-offs (Looking Towards the Northeast) ................. 201
Figure 16-30: Stope Cross Section ................................................................................................................ 202
Figure 16-31: Typical Level Section ............................................................................................................... 203
Figure 16-32: Completed Mine Design (Looking Towards the Southwest) .................................................... 203
Figure 16-33: Mine Design Colored By Au Grade g/t (Looking Towards the Northeast) ............................... 204
Figure 16-34: Mine Production Schedule Colored by Year, Rotated View Looking Toward the Footwall (Northeast) ......................................................................................................................................... 207
Figure 16-35: Mine Production Schedule Colored by Year, Rotated View Looking Toward the Hangingwall (Southwest) ........................................................................................................................................ 208
Figure 16-36: Portal and Ventilation Drift Locations ....................................................................................... 209
Figure 16-37: General Ventilation Layout ....................................................................................................... 212
Figure 17-1: Marmato Process Flowsheet ...................................................................................................... 224
Figure 17-2: MDZ Conceptual Process Flowsheet ......................................................................................... 231
Figure 18-1: Marmato Project Location .......................................................................................................... 242
Figure 18-2: Marmato General Access and Major Facilities .......................................................................... 243
Figure 18-3: Marmato Existing Project Site Map ............................................................................................ 245
Figure 18-4: Marmato Electrical System Schematic ...................................................................................... 247
Figure 18-5: Marmato MDZ General Infrastructure Location ......................................................................... 248
Figure 18-6: MDZ Processing and Mine Portal Site General Arrangement ................................................... 250
Figure 18-7: Makeup and Demand at the MDZ Process Plant ...................................................................... 252
Figure 18-8: Preferred DSTF Locations ......................................................................................................... 254
Figure 18-9: DSTF Haul Roads ...................................................................................................................... 257
Figure 22-1: Marmato Upper Zone Mine Production Profile ........................................................................... 290
Figure 22-2: Marmato Deeps Zone Mine Production Profile .......................................................................... 291
Figure 22-3: Marmato After-Tax Free Cash Flow, Capital and Metal Production .......................................... 293
Figure 22-4: Marmato Operating Cost Break-Down ....................................................................................... 294
Figure 22-5: Marmato NPV Sensitivity ........................................................................................................... 297

SRK Consulting (U.S.), Inc. NI 43-101 Technical Report – Marmato Project Page xix
MMS/KD Marmato_PEA_NI43-101_544400.020_Rev31_KD.docx November 2019
Appendices Appendix A: Certificates of Qualified Persons
Appendix B: Capping
Appendix C: Swath Plots
Appendix D: Annual TEM

SRK Consulting (U.S.), Inc. NI 43-101 Technical Report – Marmato Project Page 1
MMS/KD Marmato_PEA_NI43-101_544400.020_Rev31_KD.docx November 2019
1 Summary This report was prepared as a Preliminary Economic Assessment-level (PEA) National Instrument 43-
101 (NI 43-101) Technical Report (Technical Report) for Gran Colombia Gold Marmato S.A.S. (GCM
or Company and formerly Mineros Nacionales S.A.S.) by SRK Consulting (U.S.), Inc. (SRK) on the
Combined Marmato Mine (Upper Mine) and Marmato Deeps Mine (MDZ or Project). GCM is an indirect
wholly-owned subsidiary of Gran Colombia Gold Corp. (Gran Colombia).
1.1 Property Description and Ownership
The Marmato Concession is located between latitudes and longitudes 5°28’24”N and 5°28’55”N, and
75°35’57”W and 75°38’55”W, respectively; with altitudes ranging from approximately 1,156 to 1,705 m.
Marmato is made up of three separate areas within a historic mining district, named Zona Alta (upper
zone), Zona Baja (lower zone) and Echandia (northern portion of the Project), all of which are 100%
owned by GCM. GCM is currently in the process of extending the duration of the Zona Baja mining
contract for which the current 30-year term expires in October 2021.
On October 4, 2019, Gran Colombia entered into a letter of intent with Bluenose Gold Corp.
(Bluenose). A TSXV-listed company, in respect of the proposed acquisition by Bluenose of certain
mining assets (the Mining Assets) held by the Company at Marmato. The Mining Assets principally
comprise the existing producing underground gold mine, including the right to mine in the lower portion
of the Echandia license area, the existing 1,200 tonnes per day (tpd) processing plant and the area
encompassing the Deeps mineralization, all located within the mining license area referred to as Zona
Baja. The acquisition will be completed through a reverse takeover transaction (RTO Transaction) with
the newly created entity, to be named Caldas Gold Corp. (Caldas), owning the Zona Baja Mining
Assets. The proposed mining plan contained herein focuses exclusively on the Mineral Resources in
Zona Baja. Gran Colombia will retain ownership of the areas at the Marmato Project referred to as
Zona Alta and Echandia.
SRK notes within the transfer of licenses from the previous owner, there is a gap between the existing
licenses for Zona Baja and Echandia. This ground is under application from the Company with the
Colombia government for formal approval to continue mining. SRK has reviewed the application within
the government website and notes that the status is defined as “in progress”, which has been in place
since September 30, 2009. The Company is taking steps to get the approval finalized.
Mining by GCM within this area has historically been conducted through the current operations and it
has been reported to SRK that this area is under application for adjustment of the status for inclusion
in the current mining operations of GCM. As the area represented by this gap contains approximately
8.7% of Measured & Indicated resources in Zona Baja and 1.9% of Inferred resources in Zona Baja,
SRK recommends that GCM accelerate its effort to obtain government resolution on this gap as it
could potentially result in loss of Mineral Resources (and future Reserves). Only approximately 2.3%
of the total LOM gold production included in the proposed mine plan for Zona Baja contained herein is
sourced from the area represented by this gap.

SRK Consulting (U.S.), Inc. NI 43-101 Technical Report – Marmato Project Page 2
MMS/KD Marmato_PEA_NI43-101_544400.020_Rev31_KD.docx November 2019
1.2 Geology and Mineralization
The mineralization in the current mine consists of three distinct phases, a first phase characterized by
the mesothermal vein/veinlet mineralization which defines the MDZ, followed by an epithermal low
sulfidation style, superimposed by an epithermal intermediate sulfidation phase. Gold‐silver
mineralization is mainly hosted by a pyrite+sphalerite vein to veinlet system fitting in a sinistral
transpressional shearing system, associated with intermediate argillic alteration within the host
porphyryitic rocks. Approximately 92% of the gold/silver-bearing particles are intergrown with
sulphides, or occur at sulphide – gangue grain boundaries. Current mining in the area is via narrow
underground stoping of the higher-grade vein mineralization.
The MDZ mineralization consists of a network of thin, less than 5 centimeters, sulfide veinlets, mainly
pyrrhotite+chalcopyrite, hosted in weak argillic and deeper potassic alteration which is related to a
previous event and rimmed by a thin sodium-calcitic alteration halo, which is related to the
mineralization. Recent geological reports on MDZ (Sillitoe, 2019) concluded:
• Gold grade distribution in the Zona Baja (MDZ) mineralized orebody is unrelated to the
presence of distinct porphyry phases and is entirely dependent on the intensity of structurally
localized veinlets;
• Potassic alteration, represented chiefly by biotite, is progressively better preserved at depth in
the Zona Baja, raising the possibility that early potassic alteration could also be gold bearing,
but further work is required to confirm this theory;
• Gold distribution appears to be exclusively a product of veinlet intensity and orientation related
to structural controls during orogenesis. The veinlets responsible for much of the Zona Baja
gold are those containing quartz, pyrrhotite and traces of chalcopyrite and having prominent
albite alteration halos; and
• The presence of visible gold is also noted in the core and, as expected, relates to increased
assay values when present.
The mineralization occurs in parallel, sheeted and anastomosing veins (“vein domain”), all of which
follow a regional structural control, with minor veins forming splays of the main structures (“splays”)
which often have limited strike or dip extent. The upper vein domain intersects broader zones of intense
veinlet mineralization (termed “porphyry domain” in this Technical Report) that is hosted by a lower
grade mineralized porphyry stock. In addition, a discrete, relatively high-grade core (“feeder zone”) to
the main deeper mineralization (MDZ) identified by GCM.
The upper portion of the MDZ has been exposed in Level 21 of the existing GCM mining operations,
while deeper sections have been observed in drillcore, both of which have been confirmed as different
styles of mineralization. The lowest levels of the mine have currently intersected a combination of the
porphyry domain, where the gold is associated with pyrite veinlets, and the MDZ where gold is
associated with pyrrhotite. There is a transition zone exists between the two domains, which is
observed to some extent in the current mine workings with overprinting of the epithermal system on
the MDZ. The vertical extent of the transition is not clearly defined from the current drilling. Currently,
underground mining at the GCM-operated mine remains focused on the vein structures located in the
central portion (Zona Baja) of the Marmato deposit.

SRK Consulting (U.S.), Inc. NI 43-101 Technical Report – Marmato Project Page 3
MMS/KD Marmato_PEA_NI43-101_544400.020_Rev31_KD.docx November 2019
The updated drilling database indicates that the veins typically range between 0.5 and 5 m wide and
extend for 250 to 1,000 m along strike, and 150 to 750 m down dip. These observations are supported
by underground mining which has confirmed that individual vein structures have good geological
continuity and can extend for 100 to 800 m along strike and 100 to at least 300 m down dip. Between
2017 and 2019, GCM has worked on updating the quantity of the underground channel sampling
captured in the database, which has increased the information available to model the vein domains.
The broad zones of veinlet mineralization in the porphyry domain modelled initially by SRK in 2017
typically varied from 10 to 230 m wide, reaching up to 340 m wide in areas of significant veinlet
accumulation, while extending with good geological continuity for between 200 m and approximately
950 m along strike, and between 100 and 900 m down dip. SRK has updated these domains during
the 2019 geological modelling process using more discrete zones and application of an indicator grade
shell approach using a 0.5 grams per tonne (g/t) gold (Au) cut-off grade (CoG).
At depth within the central portion of the deposit, SRK has noted a zone of elevated grades which has
been referred to as the higher grade MDZ (more than 2.0 g/t Au). This zone is indicated to be
continuous along strike for approximately 500 m and has a confirmed down dip extent that reaches up
to 800 m, with a thickness that varies between 35 and 150 m. It is possible that the main MDZ
mineralization is bounded within a series of faults but limited drilling at the edges of the deposit make
confirmation difficult to assess at this stage. To avoid the potential for volumetric “blow-outs”, SRK has
used the faults as a hard boundary in the geological domaining process.
1.3 Status of Exploration, Development and Operations
There has been a significant increase (100%) in the channel sampling and underground drilling
completed by the Company operated mine as part of routine grade control procedures, since the
previous model. There are an additional 12,765 channel samples as part of the on-going validation
and capture of historical sampling, and current grade control practices. In addition to the channel
sampling, there has been an increase in the drilling database of 152 additional holes, which is split
between 35 exploration holes (16,076 m) and 117 mine holes (9,172 m) inclusive of grade control
sampling.
The latest sampling has comprised selective infill drilling targeting the MDZ to a spacing of 50 to 100
m, and additional underground channel sampling within the Company operated mine, which extends
from Levels 16 to 21.
Drillholes have been drilled from four purpose-built underground drilling stations with two contractor
rigs being used to date (a third rig started drilling in early September 2019 to assist in completing the
designed program). Three of the drilling stations are located on Level 20 with a single station
established on Level 21. Drillholes have been drilled in a fan pattern and dip -60 and -75 degrees
predominantly to the southwest.
All samples were prepared and fire assayed by SGS Laboratories in their facility in Medellin. The
results of the drilling have validated aspects of the previous interpretation, but also provided additional
information which has led to further confirmation of the geological model initially created during the
2017 Mineral Resource Estimate.

SRK Consulting (U.S.), Inc. NI 43-101 Technical Report – Marmato Project Page 4
MMS/KD Marmato_PEA_NI43-101_544400.020_Rev31_KD.docx November 2019
1.4 Mineral Processing and Metallurgical Testing
A metallurgical program was conducted by SGS Lakefield on test composites from the MDZ. The
metallurgical program included comminution testwork, mineralogical studies and an evaluation of
several different flowsheet options including:
• Whole-ore cyanidation;
• Gravity concentration followed by cyanidation of the gravity tailing; and
• Gravity concentration followed by gold flotation from the gravity tailing and cyanidation of the
flotation concentrate.
The following significant metallurgical and mineral processing factors have been identified:
• Metallurgical testwork was conducted on a test composite representing the average material
from the MDZ as well as variability composites from East, Central and West Zones of the MDZ
deposit;
• Native gold was by far the predominant gold carrier and the majority (more than 99%) of the
gold particles occurred within mineral structures that would be readily accessible by leaching
solutions. Gold particles were not often in direct contact with sulfides, yet very commonly
pyrrhotite, chalcopyrite, and bismuth minerals were found in close vicinity to the gold
mineralization;
• The SAG mill comminution (SMC) tests were conducted on the East, West and Center MDZ
and the reported Axb values ranged from 28 to 31 and averaged 29, indicating that the material
is very hard with respect to SAG mill impact grinding. Bond ball mill work indices (BWi)
conducted on the MDZ composites ranged from 19.0 to 20.7 kilowatt hour per tonne (kWh/t)
indicating that the MDZ material is very hard with respect to ball mill grinding. The MDZ
material is much harder than the current Marmato material which was reported to have a BWi
of 15.7 kWh/t;
• The MDZ material responded very well to each of the process flowsheet options tested with
gold recoveries estimated at 94 to 96% and silver recoveries estimated at 38 to 44%;
• Cyanidation leach residues can be detoxified to less than 10 milligrams per liter (mg/L)
Cyanide Weak Acid Dissociable (CNWAD) using the industry-standard Sulphur dioxide
(SO2)/Air process; and
• Additional testwork should be conducted during the next phase of study to fully define the
process design criteria and operating parameters.
1.5 Mineral Resource Estimate
The Mineral Resource model presented herein represents an updated resource evaluation prepared
for the Marmato Project. The resource estimation methodology involved the following procedures:
• Database compilation and verification;
• Construction of wireframe models for the fault networks and centerlines of mining development
per vein;
• Definition of resource domains;
• Data conditioning (compositing and capping) for statistical and geostatistical analysis;
• Variography;
• Block modelling and grade interpolation;

SRK Consulting (U.S.), Inc. NI 43-101 Technical Report – Marmato Project Page 5
MMS/KD Marmato_PEA_NI43-101_544400.020_Rev31_KD.docx November 2019
• Resource classification and validation;
• Assessment of “reasonable prospects for economic extraction” and selection of appropriate
reporting CoGs; and
• Preparation of the Mineral Resource Statement.
The resource evaluation work was completed by Mr. Benjamin Parsons, MAusIMM (CP#222568), with
assistance from Mr Giovanny Ortiz, FAusIMM (#304612). The effective date of the Mineral Resource
Statement is July 31, 2019, which is the last date assays were provided to SRK.
The Mineral Resource estimation process was a collaborative effort between SRK and GCM staff.
GCM provided SRK with an exploration database with flags of the main veins as interpreted by GCM.
In addition to the database, GCM has also supplied a geological interpretation comprising preliminary
3D digital files (DXF) through the areas investigated by core drilling for each of the main veins.
SRK imported the geological information into Seequent Leapfrog® Geo (Leapfrog®) to complete the
geological model. Leapfrog® has been selected due to the ability to rapidly create accurate geological
interpretations, which interact with a series of geological conditions and data types.
SRK has produced block models using Datamine™ Studio RM Software (Datamine™). The procedure
involved import from Leapfrog™Geo of wireframe models for the fault networks, veins, definition of
resource domains (e.g. high-grade sub-domains), data conditioning (compositing and capping) for
statistical analysis, geostatistical analysis, variography, block modelling and grade interpolation
followed by validation. Grade estimation for the veins has been based on block dimensions of 5 m by
5 m by 5 m for the Porphyry and MDZ units. Sub-blocking to 0.5 m by 1 m by 1 m has been allowed
to reflect the narrow nature of the geological model. The block size reflects the relatively close-spaced
underground channel sampling and spacing within veins compared to the wider drilling spacing, with
the narrower block size used in the MDZ at depth to reflect the proposed geometry of the mineralization
(i.e. steeply dipping feeder zone).
SRK reviewed and updated the geostatistical properties of the domains. Gold grades have been
interpolated using nested three-pass estimates within Datamine™, using an Ordinary Kriging (OK)
routine. SRK has also run Inverse Distance Weighted (IDW2) and Nearest Neighbor (NN) estimates
for validation purposes.
The search ellipses follow the typical orientation of the mineralized structures, and where appropriate,
were aligned along the mineralized veins, as detailed below:
• Dynamic searches were used for the vein mineralization domains. Within these domains, the
true dip and true dip direction has been calculated on a block by block basis;
• In comparison, given the relatively short strike and dip of the splay, SRK has elected to use
an average dip and strike for each structure;
• For the porphyry domain, SRK has generated a default dip and dip-direction to orientate the
search volume along the main regional trend;
• For the MDZ, a single dip and strike has been used with the search ranges orientated along
the main dip and strike of the domain;
• All contacts between the veins have been treated as hard boundaries for domaining with only
coded samples from any given vein used in the estimation of that domain; and

SRK Consulting (U.S.), Inc. NI 43-101 Technical Report – Marmato Project Page 6
MMS/KD Marmato_PEA_NI43-101_544400.020_Rev31_KD.docx November 2019
• Statistical characteristics such as search volume used, kriging variance, and number of
samples used in an estimate, were also computed and stored in each individual block for
descriptive evaluations.
SRK has validated the block model using a combination of visual checks, statistical comparison of
composite grades to all three estimation methods, and via swath plot analysis. SRK considered the
estimates to be representative of the underlying data.
Block model quantities and grade estimates for the Project were classified according to the CIM
Definition Standards for Mineral Resources and Reserves (CIM, 2014). SRK developed a classification
strategy which considers the confidence in the geological continuity of the mineralized structures, the
quality and quantity of exploration data supporting the estimates, and the geostatistical confidence in
the tonnage and grade estimates. Data quality, drillhole spacing and the interpreted continuity of
grades controlled by the veins have allowed SRK to classify portions of the veins in the Measured,
Indicated and Inferred Mineral Resource categories.
Measured: Measured Resources are limited to vein material within the current levels being mined by
the Company and estimated within the first search volume which required a minimum of five
composites and a maximum of 20 composites. These areas are considered to have strong geological
knowledge as they have been traced both down-dip and along strike via mapping, plus underground
channel samplings provided sufficient data populations to define internal grade variability.
Indicated: SRK has delineated Indicated Mineral Resources at Marmato primarily between Level 16
to 21 currently in operation at Mineros Nacionales license zone. Indicated Mineral Resources have
been given at the following approximate data spacing, as a function of the confidence in the grade
estimates and modelled variogram ranges. SRK has expanded the limits of the Indicated classification
to also cover areas within Echandia Licence where:
• 50 m by 50 m (XY) from the nearest drillhole;
• Enabled multiple holes to be used during the estimation process; and
• Support from both diamond drilling and channel sampling present.
Inferred: In general, Inferred Mineral Resources have been limited to within areas of reasonable grade
estimate quality and sufficient geological confidence, and are extended no further than 150 m from
peripheral drilling on the basis of modelled variogram ranges.
SRK has defined the proportions of Mineral Resource to have potential for economic extraction for the
Mineral Resource based on different CoGs relating to the mineralization style (i.e. vein versus
porphyry) and potential differences in selective underground mining methods.
The estimation domains have been grouped for the Mineral Resource statement into veins, porphyry
and MDZ mineralization. The veins account for the veins, halos and splay material and have used a
1.7 g/t Au cut-off, while all other domains (grade-shell, Deeps, porphyry) have used a lower cut-off of
1.2 g/t to account for the larger bulk mining methods involved. The Mineral Resource statement for the
Project is shown in Table 1-1.

SRK Consulting (U.S.), Inc. NI 43-101 Technical Report – Marmato Project Page 7
MMS/KD Marmato_PEA_NI43-101_544400.020_Rev31_KD.docx November 2019
Table 1-1: SRK Mineral Resource Statement for the Marmato Project, Dated July 31, 2019*, Within All Licences
Category Quantity
Grade Metal
Au Ag Au Ag
Mt gpt gpt 000'oz 000'oz
Underground Vein**
Measured 2.7 5.0 25.5 433 2,190
Indicated 10.8 4.5 20.5 1,579 7,133
Measured and Indicated 13.5 4.6 21.5 2,013 9,323
Inferred 8.6 4.2 19.3 1,154 5,330
Underground Porphyry**
Measured
Indicated 3.7 2.9 26.4 350 3,149
Measured and Indicated 3.7 2.9 26.4 350 3,149
Inferred 3.0 4.3 48.0 420 4,680
Underground Deeps***
Measured
Indicated 6.4 2.6 4.7 537 978
Measured and Indicated 6.4 2.6 4.7 537 978
Inferred 41.2 2.1 2.7 2,812 3,609
Underground Combined
Measured 2.7 5.0 25.5 433 2,190
Indicated 21.0 3.7 16.7 2,466 11,260
Measured and Indicated 23.6 3.8 17.7 2,899 13,450
Inferred 52.9 2.6 8.0 4,387 13,619
* Mineral resources are not mineral reserves and do not have demonstrated economic viability. All figures are rounded to reflect the relative accuracy of the estimate. All composites have been capped where appropriate. ** Porphyry and Vein mineral resources are reported at a CoG of 1.9 g/t. CoGs based on a price of US$1,500 per ounce of gold, suitable benchmarked technical and economic parameters and gold recoveries of 95 percent for underground resources, without considering revenues from other metal. *** Deeps mineral resources are reported at a CoG of 1.3 g/t. CoGs based on a price of US$1,500 per ounce of gold, suitable benchmarked technical and economic parameters and gold recoveries of 95 percent for underground resources, without considering revenues from other metal.
The proposed mining plan is predicated on splitting the above Mineral Resources into three styles of
mineralization within two distinct areas. The three styles of mineralization are based on the key
geological types defined in the Mineral Resources of Veins, Porphyry and Deeps (MDZ). The mining
areas are split into Zona Alta and Zona Baja based on the presence of the existing mining
infrastructure, with Zona Alta representing material above the existing mines, and Zona Baja as all
material, including the Echandia Licences, below an elevation of 1,340 masl. The proposed mining
plan focuses exclusively on the Mineral Resources in Zona Baja. This PEA does not concern itself
with an evaluation of the Zona Alta mining zone.
A summary of the breakdown for the Mineral Resources as used in the current study is shown in Figure
1-1, and with the tonnages, grades, Au metal and Ag metal presented in Table 1-2. It is important to
note that pursuant to the RTO Transaction described in Section 1.1, the Mining Assets which
encompass the Mineral Resources in Zona Baja in Figure 1-1 and Table 1-2 are being spun out to
Caldas. Gran Colombia will retain ownership of the mining titles encompassing the Mineral Resources
in Zona Alta in Figure 1-1 and Table 1-2.

SRK Consulting (U.S.), Inc. NI 43-101 Technical Report – Marmato Project Page 8
MMS/KD Marmato_PEA_NI43-101_544400.020_Rev31_KD.docx November 2019
Source: SRK, 2019
Figure 1-1: Summary Breakdown of Mining Areas for Study
Table 1-2: SRK Mineral Resource Statement for the Marmato Project, Dated July 31, 2019*, Breakdown by Mining Areas
Licence Grouping Zona Alta (1) Zona Baja (2) and Deeps Zone Total
Type Veins Porphyry Total Veins Porphyry Deeps Total
Measured
Tonnes (kt) 0.6 0.6 2.1 2.1 2.7
Grade Au (g/t) 5.6 5.6 4.9 0.1 5.0
Ag (g/t) 33.2 5.6 23.2 4.9 25.5
Metal Au (koz) 109 109 325 325 433
Ag (koz) 648 648 1,543 1,543 2,190
Indicated
Tonnes (kt) 3.6 2.1 5.7 7.2 1.6 6.4 15.2 21.0
Grade Au (g/t) 4.6 3.1 4.1 4.5 2.7 2.6 3.5 3.7
Ag (g/t) 25.3 38.9 4.1 18.1 10.1 4.7 3.5 16.7
Metal Au (koz) 542 210 752 1,037 140 537 1,714 2,466
Ag (koz) 2,966 2,622 5,588 4,167 527 978 5,672 11,260
Measured & Indicated
Tonnes (kt) 4.2 2.1 6.3 9.2 1.6 6.4 17.3 23.6
Grade Au (g/t) 4.8 3.1 4.2 4.6 2.7 2.6 3.7 3.8
Ag (g/t) 4.8 3.1 4.2 4.6 2.7 2.6 3.7 17.7
Metal Au (koz) 650 210 860 1,362 140 537 2,039 2,899
Ag (koz) 3,614 2,622 6,236 5,709 527 978 7,214 13,450
Inferred
Tonnes (kt) 5.3 2.7 7.9 3.3 0.3 41.2 44.9 52.9
Grade Au (g/t) 4.1 4.5 4.2 4.4 3.1 2.1 2.3 2.6
Ag (g/t) 4.1 4.5 4.2 4.4 3.1 2.1 2.3 8.0
Metal Au (koz) 688 386 1,074 466 34 2,812 3,312 4,387
Ag (koz) 3,753 4,573 8,326 1,577 107 3,609 5,293 13,619
Source: SRK, 2019
1) Zona Alta includes mineral resources from the Echandia license above 1,340 masl. 2) Zona Baja includes mineral resources from the Echandia license below 1,340 masl and above 1,025 masl and are accessible from the
current mining operation.
Zona Alta/Echandia (Zona Alta)
Zona Baja
Zona BajaMarmato Deeps Zone
Level 21
Au > 1.7 g/t Indicator
Mining Upper Zone
Mining Deeps Zone

SRK Consulting (U.S.), Inc. NI 43-101 Technical Report – Marmato Project Page 9
MMS/KD Marmato_PEA_NI43-101_544400.020_Rev31_KD.docx November 2019
1.6 Mineral Reserve Estimate
No Mineral Reserves have been estimated for the Project.
1.7 Mining Methods
The Project has been in operation in various forms since the mid-1500s. GCM (formerly known as
Mineras Nacionales (MN) was awarded the contract for the concessions in 1989. The Project was
originally developed as a 300 tpd underground project in 1997 and has expanded through the years
to the existing 1,200 tpd capacity operation. The mine is currently developed to the 1,025 m elevation.
A transition is occurring from narrow vein mineralization to large porphyry mineralized areas (gold
associated with pyrrhotite veinlets). For this PEA, there are three different mining methods, separated
into three distinct zones.
• The first zone is the mineralized material between 1,025 m (meters) elevation to 1,350 m
elevation, referred to as the Veins. This is the current mine and will be mined using the current
conventional cut and fill stope method.
• The second zone is the wider porphyry material between 1,025 m elevation and 1,070 m
elevation, referred to as Level 21. This material is on Level 21 with some development
accesses already in place. A modified longhole stoping method will be used in this area. The
stope size is 10 m wide by 15 m high with varying length of up to 26 m. 5 m dip pillars are left
due to the use of unconsolidated hydraulic fill.
• The third zone is the porphyry material below 1,025 m elevation, referred to as MDZ. There is
a sill pillar left in-situ between the MDZ and Level 21. The MDZ material is mined using a
longhole stoping method with stope sizes that are 10 m wide by 25 m high with varying of up
to 20m. The MDZ area is currently not developed.
The first two zones are considered the Upper Mine of Zona Baja, and the material is processed in the
existing processing facility. The third zone is considered the MDZ and the material is envisioned to be
sent to a new processing facility. Separate mine plans are presented for the Upper Mine and MDZ
areas of Zona Baja.
1.7.1 Upper Mine
Mining is being conducted in the Zona Baja area that extends approximately 300 m vertically and
900 m along the vein structure. The mine layout has development typically on 50 m levels and there
are currently six production levels. Portal access is utilized with a main haulage level established with
rail haulage, ore passes, and apiques (inclined shaft) hoist systems used to move personnel and
materials.
Mine design using Vulcan software was completed based on an AuEq cut-off grade (CoG). Stope
optimizations were performed based on a calculated CoG and served as the basis for the design.
Parameters were assumed similar to that currently being mined, with the exception of Level 21, where
the design was modified to utilize dip pillars to allow mining with the sand backfill available from the
current plant.
The underground mine design for the Marmato Zona Baja Upper Mine (Veins and Level 21 blocks)
results in a mine plan resource of 5.5 Mt (diluted) with an average grade of 3.82 g/t Au and 15.39 g/t
Ag. This estimate is based on a 2.81 g/t AuEq cut-off, a 90% mining recovery and a 20% dilution for

SRK Consulting (U.S.), Inc. NI 43-101 Technical Report – Marmato Project Page 10
MMS/KD Marmato_PEA_NI43-101_544400.020_Rev31_KD.docx November 2019
the veins. Level 21 blocks are based on a 2.05 g/t AuEq cut-off, a 90% mining recovery and a 15%
dilution. A 5% allowance is added to the development for overbreak. The mined material summary is
detailed in Table 1-3.
Table 1-3: Upper Mine - Mine Plan Resource Classification – Vein and Level 21 Material (1)
Description Tonnes (kt) Au (g/t) Ag (g/t) Contained Au Oz (koz) Contained Ag Oz (koz)
Measured 802 3.94 17.95 102 463
Indicated 4,308 3.84 14.64 532 2,028
Inferred 433 3.34 18.06 46 251
Total 5,543 3.82 15.39 680 2,742
Source: SRK, 2019 (1) Includes Measured, Indicated and Inferred material based on CoG of 2.81g/t AuEq for the veins, and 2.05 g/t AuEq for
Level 21 material.
The Mineral Resource presented has been reported following CIM guidelines. The PEA is preliminary
in nature, in that it includes a level of engineering precision and assumptions which are currently
considered too speculative to have the economic considerations applied to them that would enable
Mineral Resources to be categorized as Mineral Reserves. Mineral Resources that are not Mineral
Reserves do not have demonstrated economic viability. There is no certainty that the PEA will be
realized.
A production schedule, shown in Table 1-4, was developed using iGantt from the mine design. The
production schedule is based on 350 days per year, with two eight hour shifts per day. Scheduling
targeted 700 tonnes per day (tpd) (245,000 tonnes per year [tpy]) from the vein stopes from 2019 to
2021, then increasing to 1,000 tpd (350,000 tpy) for the rest of the mine life. Level 21 stopes are
producing at 50 tpd (17,500 tpy), 300 tpd (105,000 tpy) and 450 tpd (157,500 tpy) for years 2019, 2020
and 2021 respectively.
Table 1-4: Upper Mine Production Schedule – Vein and Level 21 Material
Marmato (Unit) Mineralized Tonnes (kt)
Waste Tonnes (kt)
Au (g/t)
Ag (g/t)
Development Length (m)
Backfill Volume (m3)
2019 109 28 3.94 14.32 1,385 36,876
2020 350 43 3.77 12.16 2,718 118,997
2021 402 30 3.53 10.95 2,247 140,420
2022 350 21 3.64 14.41 1,984 120,942
2023 350 19 3.63 15.28 1,811 120,772
2024 350 17 3.64 15.06 1,685 120,489
2025 350 25 3.75 14.81 2,269 120,603
2026 350 22 3.92 15.29 2,068 120,301
2027 350 11 4.08 15.57 1,280 120,015
2028 350 16 4.08 16.42 1,790 119,101
2029 350 29 3.89 17.68 2,671 120,204
2030 350 17 3.58 16.33 1,730 120,978
2031 350 13 3.82 17.04 1,431 120,163
2032 350 4 4.04 18.08 660 119,090
2033 350 4 4.03 17.28 618 119,050
2034 350 4 3.95 16.14 521 119,180
2035 130 3.54 13.57 28 44,045
Totals 5,543 301 3.82 15.39 26,895 1,901,227
Source: SRK, 2019

SRK Consulting (U.S.), Inc. NI 43-101 Technical Report – Marmato Project Page 11
MMS/KD Marmato_PEA_NI43-101_544400.020_Rev31_KD.docx November 2019
Mining is completed by a cut and fill (CAF) stope mining method with sand backfill from tailing material
from the processing plant. The CAF panels are typically 35 m long by 50 m high, with varying thickness
depending on the vein. The panels are accessed from 2.2 m by 2.2 m haulage levels on the top and
bottom. Raises are developed along the vein to break the panel into discreet mining stopes as well as
to provide ventilation. Sub-levels are then driven horizontally along strike. Once the sublevel is opened,
vertical holes are drilled up at a length of approximately 1.7 m to 2.3 m over the width of the vein. After
blasting, the mineralized material is mucked using either slushers, bobcats or mini-scoops and loaded
into trains and hauled out. Once mucking is complete, concrete walls are built on either end of the
stope and the stope is filled with hydraulic fill. When the fill is sufficiently drained, the next slice of
mineralized material can be mined.
At the bottom of Zona Baja on level 21, a transition zone has been encountered with material consistent
with MDZ. A modified stoping method is being employed that is planned to increase productivity reduce
costs. The stopes will be 15 m wide by 15 m high and vary in length depending on mineralized material
geometry. The design uses a bottom up stoping method with a primary/secondary stoping sequence.
Access drifts are planned to be 3.5 m by 3.5 m with a 3.5 m by 3.5 m decline driven at -13% for access
to the different levels.
There are currently approximately 777 people working on the underground mining operation with and
increase to 910 people expected by 2023.
The mine has a ventilation system that moves approximately 139 thousand cubic feet per hour (kCFM)
of fresh air through the portals from Level 17 and Level 18 via 50 hp fans. The fresh air moves down
the apiques (inclined shafts) to the levels and out to raises at the end of the level drifts where it is
exhausted on Level 16.
A staged pumping system is installed that removes groundwater and backfill water from the mine at
rates that average 37 L/s with a range from 26.8 L/s to 46.4 L/s.
1.7.2 Marmato MDZ Project
The MDZ area of Zona Baja is currently in the exploration phase and has not been developed.
Mineralization is located approximately 600 to 1,200 m below the surface (530 m elevation to 1,015 m
elevation). Based on geomechanical information and mineralization geometry an underground
longhole stoping method (LHS) is suitable for the deposit and vein mining can continue to occur above
the MDZ area.
The stopes will be 10 m wide and stope length will vary based on mineralization grade. A spacing of
25 m between levels has been used. The deposit is mined in blocks where mining within a block occurs
from bottom to top with the use of paste backfill. Sill pillars are left in situ between blocks. The backfill
will have sufficient strength to allow for mining adjacent to filled stopes, thus eliminating the need for
dip pillars. In the top mining block a higher grade core is extracted first, mined from bottom to top.
Subsequently additional stopes are mined from the bottom of the block up, mining adjacent to (but not
underneath) backfilled stopes.
The mine will be drift access, mineralization will be transported from stopes to the surface by
underground trucks. Internal intake and exhaust raises will be developed using raisebore machines
and air will flow into dedicated intake and exhaust ventilation drifts to surface.

SRK Consulting (U.S.), Inc. NI 43-101 Technical Report – Marmato Project Page 12
MMS/KD Marmato_PEA_NI43-101_544400.020_Rev31_KD.docx November 2019
The mine design process involved using stope optimization within Vulcan™ software to determine the
potentially mineable areas calculated CoG. The underground mine design process for the MDZ area
results in mine plan resources of 20.8 million tonnes (Mt) (diluted) with an average grade of 2.5 grams
per tonne (g/t) gold (Au) and 3.38 g/t silver (Ag). This estimate is based on a mine design using a
1.75 g/t Au CoG for the design of stopes and applying a 1.5 g/t Au CoG to material within the design.
These numbers include a 93% to 100% mining recovery based on type of opening (stope,
development, etc.) to the designed wireframes in addition to a 0% to 7% unplanned waste dilution. An
additional development allowance of 15% was applied to main ramps to account for detail currently
not in the design. Dilution for stopes was applied at zero grade (Table 1-5).
Table 1-5: MDZ Mine Plan Resource Classification (1)
Description Tonnes (kt) Au (g/t) Ag (g/t) Contained Au Oz (koz) Contained Ag Oz (koz)
Indicated 3,360 2.80 4.66 302 503
Inferred 17,462 2.45 3.14 1,374 1,761
Total 20,821 2.50 3.38 1,677 2,264
Source: SRK, 2019 (1) Includes Indicated and Inferred material reported using a 1.5g/t Au cut-off.
The Mineral Resource presented has been reported following CIM guidelines. The PEA is preliminary
in nature, that it includes a level of engineering precision and assumptions which are currently
considered too speculative to have the economic considerations applied to them that would enable
Mineral Resources to be categorized as Mineral Reserves. Mineral Resources that are not Mineral
Reserves do not have demonstrated economic viability. There is no certainty that the PEA will be
realized.
A process facility of 4,000 tpd (1.4 million tonnes per year [Mtpy]) is used for the target mine production
scheduling. The annual production rate schedule is based on unit rates developed by SRK consistent
with industry norms. Backfill has been sequenced and typically includes a 14-day lag prior to mining
stopes adjacent to backfill. The backfill sequence needs further refinement and detail at the next level
of study.
The mining operation schedule is based on 365 days per year, seven days per week, with two 12 hour
shifts each day. A production rate of 4,000 tpd was targeted with ramp-up to full production as quickly
as possible. Development drifts begin in January of 2021 and production commences mid-year 2023.
Table 1-6 shows the annual production schedule completed using iGantt scheduling software based
on these assumptions.

SRK Consulting (U.S.), Inc. NI 43-101 Technical Report – Marmato Project Page 13
MMS/KD Marmato_PEA_NI43-101_544400.020_Rev31_KD.docx November 2019
Table 1-6: MDZ Annual Mining Schedule
Year Mineralized
Tonnes (kt)
Waste Tonnes
(kt)
Mineralization Au
(g/t)
Mineralization Ag
(g/t)
Development Length
(m)
Backfill Volume
(m3)
2021 - 180 - - 2,790 -
2022 52 375 2.96 3.17 6,987 -
2023 831 318 3.21 3.79 9,966 222,594
2024 1,400 172 3.08 3.73 4,339 528,620
2025 1,401 67 3.48 4.09 2,273 536,495
2026 1,400 129 3.16 4.65 4,490 519,407
2027 1,397 242 2.59 3.57 5,968 514,815
2028 1,342 292 2.30 4.20 7,143 494,940
2029 1,400 214 2.26 5.19 6,272 511,787
2030 1,400 189 2.16 4.67 5,842 504,879
2031 1,400 175 2.05 2.49 5,780 502,542
2032 1,400 86 2.09 1.64 3,757 520,709
2033 1,400 92 2.18 1.79 3,871 516,445
2034 1,400 77 2.18 2.02 3,531 517,480
2035 1,400 55 2.22 2.82 3,261 522,577
2036 1,400 76 2.36 3.27 4,090 502,255
2037 1,205 2 2.47 3.06 122 488,351
2038 592 - 2.57 3.14 - 246,480
Totals 20,821 2,739 2.50 3.38 80,482 7,650,376
Source: SRK, 2019
Stope lengths vary throughout the deposit ranging from 5 m to a maximum of 20 m giving a range of
approximately 3,000 to 12,500 t per stope. After bottom and top accesses are established a slot raise
will be developed at the far end of the stope (hangingwall side). Drilling will continue with the longhole
drill using a fan shaped pattern. Holes will be loaded with bulk emulsion and stope blasting will
commence in the slot and subsequently rings will be blasted retreating toward the level access. The
mining will commence in a primary/secondary stoping sequence that includes time for the paste backfill
to be placed and cure to a minimum strength requirement. The lag between backfill and production on
the adjacent stope is typically 14 days. Mine development will be ongoing with development of the
main ramps and footwall access continuing ahead of mining.
The mine ground support plan will include bolting per the ground support plan supplementing with wire
mesh, shotcrete, and additional support where required. Cable bolts are expected to be utilized on the
brows of the stopes and in certain larger intersections or infrastructure locations where warranted.
The ventilation system will include fresh air down the main haulage decline and a new fresh air decline
located near the existing Marmato operation. The air will flow across the main access levels and out
through air raises at the ends of the stope level. The exhaust air will then exit the mine through two
new exhaust declines located near the existing Marmato operation. Fans will be located in the two
exhaust declines. Total air requirements are estimated at 370.5 m3/s.
The mine pumping system will include a portable staged system for development and permanent
pumping stations located at the base of the MDZ upper zone and the bottom of the MDZ bottom zone.
The pumping systems will be designed to handle 220 L/s and operate at 110 L/s.

SRK Consulting (U.S.), Inc. NI 43-101 Technical Report – Marmato Project Page 14
MMS/KD Marmato_PEA_NI43-101_544400.020_Rev31_KD.docx November 2019
The mine will have emergency egress through the fresh air intake at the Marmato operation site,
through the existing Marmato mine and an emergency hoist located at the bottom of the MDZ bottom
zone. A stench gas system will also be available for use in the MDZ mine. Additionally, multi-person
refuge chambers are included that will be located in active working areas over the life of mine (LoM).
A new MDZ Project main project substation will provide power to feed a new mine substation located
on the surface near the MDZ portal. The mine substation will feed the underground electrical systems,
infrastructure, and equipment power down the main haulage decline via a 13.2 kV feed line. The 13.2
kV power will feed throughout the mine to main load centers where the power will be stepped down to
480 V for underground equipment use. Feeds will be provided at 220 V for auxiliary use in the shops
and for smaller loads such as fans, pumps, and auxiliary lighting. A diesel backup generator at the
surface will supply backup power for the required ventilation systems to maintain minimum ventilation
requirements in the case of emergency.
There will be a staff of approximately 324 people operating the mine. These include approximately 25
technical and management personnel and 299 mine operating and shift personnel. There will be
approximately 99 people on site during a typical day shift and 74 during a night shift.
The mine will operate with a large mechanical fleet of equipment including the typical equipment for a
longhole stoping operation including longhole drills, two boom jumbos, 17t LHDs, 50 t trucks,
explosives charges, cable and mechanical bolters, and transmixer truck and shotcrete equipment.
Support equipment includes a grader, small skidsteers, telehandlers, maintenance equipment, scissor
lifts, and employee transport equipment.
1.7.3 Hydrogeology
The mine area is located in the hydrogeological regional area of Magdalena Cauca, specifically in The
Cauca River catchment (Celdas Department). The region is comprised of igneous and metamorphic
rocks with limited groundwater storage capacity and hydraulic conductivity (IDEAM, 2013). The
porphyry units represent the main hydrogeological units in the mine area, with a low hydraulic
conductivity and limited groundwater storage capacity. Groundwater flow is compartmentalized within
structural blocks with limited hydraulic communication across fault boundaries due to fault gouge,
weathering, or an offset of geological units (Knight Piésold, 2012).
A hydrogeological field investigation was conducted in 2011 to 2012 (Knight Piésold, 2012). The
investigation included hydraulic tests performed in the porphyry intrusion units and the construction of
three piezometers in the underground mine and 11 in the ground surface.
Water levels recorded thru 2012 show elevations from to 661 to 2,022 m elevation, following the
topography at 100 m depth. A depressurization zone was detected in the underground piezometers
where the water levels have a horizontal trend. The shape or extent of the depressurization zone is
currently unknown. In a more regional scale, the groundwater flows West to East, following the
topographical gradient to the Cauca River, located at 668 m elevation, which represents the main
discharge for the hydrogeological system.
105 and 41 Lugeon test in porphyry units were conducted in underground angled holes and vertical
peripherical piezometers respectively, also 9 Le Franc tests were performed in saprolitic units (Knight
Piésold, 2012). As a result, the geometrical mean of hydraulic conductivity values ranges from 1.4 x10-
2 m/d to 6.4 x10⁻² m/d in the porphyry units and approximately 5.9 x10⁻² m/d in the saprolite. It is

SRK Consulting (U.S.), Inc. NI 43-101 Technical Report – Marmato Project Page 15
MMS/KD Marmato_PEA_NI43-101_544400.020_Rev31_KD.docx November 2019
important to note several of the hydraulic tests mentioned above were completed in unsaturated
conditions and/or into the shallow portion of the intrusive units or into the development mine zone area,
consequentially the hydraulic conductivity values could be considered overestimated and not
representative of the groundwater flow conditions toward the underground mine.
Mine Dewatering
The measured monthly average of total dewatering in the Marmato mine is 37 L/s, varying from 26.8
L/s to 46.4 L/s. Strong seasonal trends were not observed, however a decrease of approximately 20
L/s can be observed in the last 12 months. A major structure zone with significant water flow (7 to 8
L/s) was detected at levels 17 and 21 to the north of the Criminal Fault.
The dewatering flow is a combination of groundwater inflows and water content in the backfill material
(50% of water). According to Marmato operational personnel, the contribution of the back-fill material
is 7 to 14 L/s, depending on the number of hydraulic backfill equipment in operation. Therefore, the
average fresh groundwater inflow into the mine could vary from 23 to 30 L/s.
A preliminary analytical model was used for estimating groundwater flow into the future mine. A Theis
solution method corrected for an unconfined aquifer was implemented and calibrated using the current
water discharge condition. As a result, a total of 70 L/s and 110 L/s were estimated from mine
sequence from level 765 and 430 respectively.
The bottom of the mine will be located 262 m below and 2.5 km to the east of the Cauca River. There
is a risk of water intrusion from the river bed. Structural features similar to those detected to the north
of the Criminal Fault could connect mine developments with the river. Further hydrogeological
investigations of this area are required to evaluate potential significant increments in groundwater
inflow.
1.7.4 Geotechnical
Preliminary indications are that the rock mass characteristics are similar between the upper vein
mining areas with the lower MDZ mining areas and thus, for this PEA SRK treated them as similar.
These two mining areas are planned to utilize different mining methods because of the nature of the
mineralization, however, the same geotechnical design methodologies would apply given the similar
nature of the rock mass.
At the time of this report, GCM has drilled 35 drillholes, totaling close to 8,800 m, to characterize the
MDZ area. For the vein zone, a rock mass characterization program was completed by Knight Piésold
in March 2012 (Knight Piésold, 2012), including 15 coreholes drilled from the surface for a total of
about 6,300 m of core. Additional drillholes are in progress. The field investigation included
geotechnical core logging and core sample collection for laboratory strength testing.
Based on the rock mass strength parameters determined from the characterization for the PEA study,
SRK completed an empirical stope stability assessment, sill pillar design and ground support
requirements for the MDZ area. Based on Mathews’ method, the recommended stope dimensions for
all levels are:
• Stope height: 25 m;
• Stope width: 10 m; and
• Stope length: 20 m.

SRK Consulting (U.S.), Inc. NI 43-101 Technical Report – Marmato Project Page 16
MMS/KD Marmato_PEA_NI43-101_544400.020_Rev31_KD.docx November 2019
Dilution into the stopes was estimated using an empirical design chart for Equivalent Linear
Overbreak/Slough (ELOS). For the stope parameters specified above, the ELOS chart estimates about
0.35 m of sloughing. Assuming dilution in the near vertical stopes comes from both the hangingwall
and footwall rock.
To determine adequate sill pillar dimensions, SRK considered two different empirical methodologies;
the Scaled Span Method (1990) and the Lunder and Pakalnis Empirical Method (1997). Based on
these results, SRK recommends a sill pillar thickness of 10 m, assuming short-term mine exposure
and that the stopes will be tightly backfilled.
Ground support requirements were estimated using empirical support charts developed by Barton
(1974). SRK considers that empirical methods are acceptable for a PEA level study. However, for
further stages of the Project, SRK recommends that a numerical model is built to reevaluate stope
stability for the different portions of the mine, and to verify sill pillar dimensions and ground support
requirements. The proposed stope and sill pillar designs are valid for a PEA level only and cannot be
applied for construction.
1.8 Recovery Methods
GCM operates a 1,200 tpd process plant to recover Au and Ag values from material produced from
current Marmato mining operations in the Upper Zone. In addition, GCM is evaluating the development
of the MDZ, which is below the current mining operations, and the construction of a new 4,000 tpd
plant to process material soley from the MDZ.
The existing Marmato process plant flowsheet incorporates unit operations that are standard to the
industry and includes:
• Three-stage crushing;
• Closed circuit ball mill grinding;
• Gravity concentration;
• Flotation;
• Flotation and gravity concentrate regrind;
• Cyanidation of the flotation and gravity concentrates;
• Counter-current-decantation;
• Merrill-Crowe zinc precipitation; and
• Smelting of precipitates to produce final dore’ product.
The current Marmato process plant performance is summarized in Table 1-7 for the period from 2013
to 2019 (January to July). During this period mineralized tonnes processed has increased from
274,191 to 338,902 tpy while grades have declined slightly from 2.90 g/t Au in 2013 to 2.45 g/t Au in
2019 and silver grades have ranged from 12.36 to 9.13 g/t Ag. Overall gold recovery has ranged from
89.0 to 83.7% and has averaged about 86.5% over the past three years. Silver recovery has ranged
from 41.1 to 31.5% and has averaged 33.2% over the past three years. Gold production has increased
from 22,566 ounces in 2013 to 24,909 ounces in 2018.

SRK Consulting (U.S.), Inc. NI 43-101 Technical Report – Marmato Project Page 17
MMS/KD Marmato_PEA_NI43-101_544400.020_Rev31_KD.docx November 2019
Table 1-7: Summary of Marmato Plant Operating Performance
Parameter 2013 2014 2015 2016 2017 2018 2019 (Jan to Jul)
Mineralized Tonnes 274,191 295,023 303,279 341,309 365,119 338,902 211,817
Mineralization Grade
Au (g/t) 2.90 2.85 2.79 2.56 2.48 2.67 2.45
Ag (g/t) 12.36 9.13 9.33 9.24 9.61 10.53 10.41
Metal Recovery
Au (%) 88.6 89.0 88.0 83.7 86.8 85.5 87.2
Ag (%) 36.6 41.1 37.9 35.8 34.9 33.2 31.5
Metal Produced
Au (Ounces) 22,566 24,113 23,954 23,449 25,163 24,909 14,538
Ag (Ounces) 39,916 34,753 34,490 36,318 39,524 37,522 22,878
Source: GCM, 2019
Metallurgical testwork was conducted to evaluate three different process flowsheet options for
processing material from the MDZ in the new plant including:
• Whole-ore cyanidation;
• Gravity concentration followed by cyanidation of the gravity tailing; and
• Gravity concentration followed by Au and Ag flotation from the gravity tailing and cyanidation
of the flotation concentrate.
After conducting a trade-off study, a process flowsheet that includes gravity concentration followed by
cyanidation of the gravity tailing was selected for processing MDZ material as this flowsheet option
offers higher overall Au recoveries along with lower estimated capital and operating costs. The process
flowsheet will incorporate process unit operations that are standard to the industry, including: primary
crushing; SAG mill/ball mill grinding; agitated cyanide leaching; Au and Ag carbon-in-pulp (CIP)
adsorption onto activated carbon; gold and silver desorption; and electrowinning and refining.
Process operating costs for the new 4,000 tpd process plant are estimated at US$13.34/t processed.
The major contributors to operating cost are labor, reagents, comminution consumables and power.
The capital cost for the 4,000 tpd process plant is estimated at US$65.6 million and is considered at a
PEA level with a +/-50% level of accuracy.
1.9 Project Infrastructure
The existing Marmato Project has a mature and functioning infrastructure system including all the
necessary facilities and supporting utilities to produce at the planned production levels. The current
facilities include a security checkpoint that provides access to the office and administrative office area.
The facilities include employee motorcycle parking, meeting area, cafeteria, multiple shops and
warehouses, a camp with cafeteria, exercise and sports field, equipment storage yards, compressor
station, welding shop, a 500 kW backup generator, processing plant, underground mine, explosives
storage a short distance from the mine that is managed by the military, main power substation and
distribution powerlines with motor control centers at key loads. The site has three portals that access
the mine workings. The site is considering additional water supply from the Cauca River to supplement
water availability during the dry season.
The MDZ Project infrastructure will be developed on a separate greenfield site approximately 2.7 km
north of the existing Project. The new site will require a new access road off the existing El Llano
access road to access a new processing facility and mine portal with access to the MDZ. The new

SRK Consulting (U.S.), Inc. NI 43-101 Technical Report – Marmato Project Page 18
MMS/KD Marmato_PEA_NI43-101_544400.020_Rev31_KD.docx November 2019
infrastructure will include a substation that ties into local power system and local distribution to the
mine substation and processing facility. Mine surface facilities include the mine portal, truck shop, tire
pad, fuel storage and fuel distribution system, mine waste rock storage, paste backfill plant, and run
of mine (RoM) stockpile. Explosives storage is planned to be at the existing mine explosives storage.
The mill will have a crushing area with a surge stockpile feeding the main processing plant. Support
facilities will include warehousing, shops, offices, and laydown yards. Parking will be provided near
the entrance to the MDZ site and a security gate for restricted access will be constructed at the
entrance to the facility. An expansion camp near the existing camp is planned to house the additional
employees at the MDZ Project. Water will be supplied by mine dewatering, recycled water from the
tailings storage facilities, and from supplemental water drawn from the Cauca River as needed.
The area already supports a significant mining population and skilled labor will be available from the
region.
1.10 Tailings Management Facilties
The existing Marmato tailings storage facility is estimated to provide three to four years of additional
capacity, after which new dry stack tailings storage facilities (DSTF) would need to accommodate
tailings through the currently-estimated 16-year LoM. Currently the tailings are sent to two unlined
settling ponds. The underdrain water from these ponds are treated with flocculant and either sent back
to the plant for user in the process or discharged under permit to the nearby stream. The tailings are
excavated from the settling ponds once sufficiently dewatered and hauled via trucks to the existing
tailings storage facilities (TSF).
To provide capacity for continued mining in the Upper Zone and expansion into the MDZ and based
on the results of a preliminary siting study completed as part of PEA preparation, two separate DSTFs
would be required to provide capacity for tailings produced through the currently estimated 16-year
LoM. DSTF-1 and DSTF-2 were identified as the most feasible locations for DSTF construction and
consideration in PEA preparation. GCM is currently evaluating additional siting options that may
require evaluation at later project stages.
DSTF-1 would be constructed and receive dewatered tailings from both the Upper and the MDZ for
the first one to two years after commissioning of the facility. Filter presses were incorporated into the
design to achieve a target moisture content of 15% and facilitate tailings management within the
relatively steep and confined valleys at the site. After the filter plant installation, tailings generated from
mining in the MDZ would be filtered, trucked and stacked at DSTF-1 until it reaches capacity at
approximately year 7, at which time filtered tailings would be hauled to DSTF-2 adjacent to the plant
location.
Rock starter embankments would be constructed at DSTF-1 and DSTF-2 using waste rock generated
from underground mining or from a nearby suitable borrow source. Filtered tailings would be trucked
to the DSTF, spread using a dozer, mixed with 0.5%-1% cement and compacted in thin lifts with
vibratory or sheepsfoot compaction equipment.
The DSTF would be constructed with underdrain systems consisting of central header pipes and
connecting transverse drains to manage any seeps, springs or upwelling groundwater within the
proposed DSTF footprints. It is currently assumed that the DSTF’s would not be lined with
geomembrane due the tailings being dewatered via filter presses and amended with cement.
Stormwater channels and geomembrane-lined top-deck transfer ponds would be constructed to

SRK Consulting (U.S.), Inc. NI 43-101 Technical Report – Marmato Project Page 19
MMS/KD Marmato_PEA_NI43-101_544400.020_Rev31_KD.docx November 2019
manage SRK and GCM are currently coordinating a geotechnical field program to characterize
foundation conditions, potential rock starter embankment construction materials, and filtered tailings.
Laboratory testing will also be completed to develop design criteria and determine required cement
amendment requirements.
1.11 Environmental Studies and Permitting
The existing Marmato Project predates the regulatory requirements to prepare an environmental
impact assessment as part of the permitting process. Instead, the operations were authorized through
the approval of an Environmental Management Plan (“Plan de Manejo Ambiental”) (PMA). The PMA
for Marmato was approved by the regional environmental authority (Corporación Autónoma Regional
del Caldas or Corpocaldas) on October 29, 2001 under Resolution 0496, File No. 616. The site-specific
PMA covers environmental studies and required management procedures and practices.
Routine monitoring is conducted on permitted domestic wastewater discharges, industrial wastewater
discharges, and air quality emissions from stationary sources. The results of this monitoring is reported
to Corpocaldas. Environmental management programs for the current Marmato operations total
approximately US$425,200 annually.
With respect to environmental geochemistry at Marmato:
• Acid-generating sulfide minerals identified in the deposit include pyrite, arsenopyrite, iron-
bearing sphalerite, pyrrhotite, and chalcopyrite (SRK, 2017);
• Samples of groundwater discharging into the underground are predominantly acidic;
• The underground water samples contain elevated metal(loid) concentrations; and
• Geochemical properties of current and future waste rock and tailings are currently unknown.
Very little waste rock is generated by the underground operations at Marmato. What little waste rock
is generated is used as structural backfill in the underground workings or on the surface for small
construction projects, such as maintenance of roads. Since so little, if any, waste rock is brought to
the surface, a comprehensive geochemical characterization program is probably not warranted on this
surface located material, and only opportunistic sampling and testing of construction materials is
probably necessary. At the moment, Corpocaldas does not require the testing of mine waste materials;
only effluent discharges. This is likely to change in the future, as source control becomes more of the
norm in this jurisdiction.
Tailings from the cyanide leach circuit are detoxified before being sent to dewatering ponds for later
drystacking disposal. The clarified overflow water from these ponds is pumped back to the plant for
use in the process. Excess water, not needed at the plant, is discharged under permit to the adjacent
stream, Quebrada Cascabel. Monitoring of the residual tailings to determine whether or not they are
classifiable as ‘hazardous’ is accomplished through Corrosive, Reactive, Explosive, Toxic,
Inflammable, Pathogen [biological] (CRETIP) analyses. Toxicity analyses were carried out by the
Universidad Pontificia Bolivariana on cyanides (CN) and metals (chromium, mercury and lead). The
results support the classification of the tailings as non-toxic for the metals based on comparisons to
the maximum concentration thresholds established by Decree 4741 of 2005. The analyses also
showed that total CN was below the threshold allowed in Decree 1594 of 1984 for water discharges.
For the MDZ expansion of the Marmato Project, GCM intends to continue with a similar approach to
tailings and tailings water management. However, rather than using less efficient settling ponds, the

SRK Consulting (U.S.), Inc. NI 43-101 Technical Report – Marmato Project Page 20
MMS/KD Marmato_PEA_NI43-101_544400.020_Rev31_KD.docx November 2019
tailings will be filter pressed. The “dry” tailings will be transported to the new disposal facility, mixed
with cement, and stacked in a configuration that minimizes surface runoff. To the extent practicable,
contact water collected on the deck of the DSTF will be reused in the process; excess water will be
discharged under permit. A critical driver of environmental impacts from tailings is whether contact
water will be contained. The current and predicted future quality of contact water needs to be
determined. Two components of potential chemical loading need to be estimated:
• Loading to surface water due to TSF runoff; and
• Loading to groundwater through seepage from the base of the TSF.
The Marmato Project is authorized under a number of resolutions issued by Corpocaldas in the name
of GCM (previously named Mineros Nacionales S.A.S.) These include, among others:
• Environmental Management Plan or PMA (Resolution No. 0496);
• Various water concessions; and
• Discharge permits (Resolutions 270 and 255).
According to GCM, all of the resolutions for operation of the existing Marmato Project are current and
valid, or in the process of being renewed. Most will need to be amended as part of the authorization
of the deep zone expansion of the Marmato Project to include the increases in tonnage to be mined,
new process facilities, and tailings management area.
The current PMA authorizes the mining and processing of up to 1,500 tpd of ore. The current
processing plant has capacity of 1,200 tpd. The PMA will need to be modified to allow for the proposed
MDZ expansion project, which envisions a rate of an extra 4,000 tpd in a second processing plant to
be constructed. By regulation, the total of mined material (including waste and material) cannot exceed
2 Mtpy in order for Corpocaldas (regional Environmental Authority) to remain as the permitting
authority. If more than 2 Mtpy is mined, then the PMA will need to be submitted to and authorized by
the federal authority, ANLA (Environmental License National Authority). During construction, Channel
Occupancy Permits will most likely need to be obtained for the new tailings site, the tailings pipeline
corridor, the process plant site, and the site of the underground portal (bocamina). Likewise, a Forest
Exploitation Permit may be needed for areas of proposed surface disturbance with trees (diameter at
breast height [DBH] more than 10 cm).
Additional baseline data collection will need to be completed on the new areas proposed for the plant
site, portal, ancillary facilities, and tailings disposal area(s). GCM is currently in the process of bidding
out the baseline programs, and also the modifications to the PMA to an environmental consultant
(under a single contract). The plan is to award this contract in Q4 2019, with an anticipated completion
by end of Q1 2020 and submittal to Corpocaldas.
The 2001 PMA for Marmato specifically requires the management of the social component of the
Project. GCM is required to maintain records of all community activities (including number of
participants, topics, duration, etc.), which is to be turned over to Corpocaldas as part of the ongoing
monitoring programs. As part of the social management and monitoring program, GCM has developed
a social investment model which seeks to promote the development of communities in the area of
influence, with the purpose of contributing to the consolidation of society and fostering economic
development (Economic Development), guaranteeing the care and respect for the environment
(Environmental Development), and supporting and participating in actions aimed at improving the

SRK Consulting (U.S.), Inc. NI 43-101 Technical Report – Marmato Project Page 21
MMS/KD Marmato_PEA_NI43-101_544400.020_Rev31_KD.docx November 2019
quality of life and well-being of its inhabitants (Social Development and Promotion of Solidarity
Actions).
Article 209 of Law 685 of 2001 requires that the concession holder, upon termination of the agreement,
shall undertake the necessary environmental measures for the proper reclamation and closure of the
operation. To ensure that these activities are carried out, the Environmental Insurance Policy shall
remain in effect for three years from the date of termination of the contract. Little else regarding the
specifics of mine closure is provided in the Law. Decree 2820 Article 40 Paragraph 2 of 2010
specifically indicates that the concession holder must submit a plan for dismantling and abandonment
of the Project.
Reclamation and closure costs for the current operation are provided in the May 2019 reclamation and
closure plan. These costs are based on percentages of costs to build the facilities. The plan does not
provide the basis for the percentages. The reclamation and closure cost estimate provided totals
20,128,000,000 pesos (US$5.8 million based on exchange rate of 3,455 to 1). A requirement for long-
term post-closure water treatment, if any, would significantly increase this estimate.
Given the conceptual design nature of the MDZ expansion of the Marmato Project, a detailed closure
cost assessment cannot be made at this time. However, it is not unreasonable to assume that the
closure cost would be 1.5 to 2 times the current estimate, given the increase in production anticipated
for the new operations and the construction of a new plant and tailings disposal area(s). A cost of
US$6.1 million was included in the technical economic model to account for a second tailings disposal
facility. These costs will need to be revisited more accurately during the PFS phase of project
development.
1.12 Capital and Operating Costs
1.12.1 Marmato Upper Zone Capital Costs
As the Marmato Upper Zone is a currently operating underground mine, the estimate of capital includes
only sustaining capital to maintain the equipment and all supporting infrastructure necessary to
continue operations until the end of the projected production schedule. The cost estimate is based on
budgetary estimates prepared by Marmato and reviewed by SRK. The estimate indicates that the
Project requires sustaining capital of US$40.5 million to support the projected production schedule
throughout the LoM. Table 1-8 summarizes the LoM sustaining capital estimate and Table 1-9 and
Table 1-10 present the same estimate by year.
Table 1-8: Marmato Upper Zone Sustaining Capital (LoM)
Description LoM ($000’s)
Drilling 1,450
Development 19,501
Mine Equipment 11,545
Other Mine 2,690
Surface 4,330
Plant 1,010
Total 40,526
Source: Gran Colombia/SRK, 2019

SRK Consulting (U.S.), Inc. NI 43-101 Technical Report – Marmato Project Page 22
MMS/KD Marmato_PEA_NI43-101_544400.020_Rev31_KD.docx November 2019
Table 1-9: Marmato Upper Zone Sustaining Capital (2019 to 2026) ($000’s)
Description 2019 2020 2021 2022 2023 2024 2025 2026
Drilling 100 100 100 100 100 100 100 100
Development 1,186 2,014 1,374 1,545 1,395 1,268 1,873 1,623
Mine Equipment 920 2,155 1,640 725 580 515 450 645
Other Mine 280 550 720 250 330 300 80 -
Surface 220 480 300 330 250 250 350 250
Plant 50 50 50 50 50 50 50 260
Total 2,756 5,349 4,184 3,000 2,705 2,483 2,903 2,878
Source: Gran Colombia/SRK, 2019
Table 1-10: Marmato Upper Zone Sustaining Capital (2027 to 2034) ($000’s)
Description 2027 2028 2029 2030 2031 2032 2033 2034
Drilling 100 100 100 100 100 100 50 -
Development 816 1,159 2,096 1,284 966 315 289 297
Mine Equipment 410 540 470 550 565 590 390 400
Other Mine 130 - - 50 - - - -
Surface 350 250 250 150 250 250 150 250
Plant 50 50 50 50 50 50 50 50
Total 1,856 2,099 2,966 2,184 1,931 1,305 929 997
Source: Gran Colombia/SRK, 2019
1.12.2 MDZ Capital Costs
The MDZ is a lower part of the deposit that is undeveloped. Before Marmato can exploit this part of
the deposit it will have to expand the existing operation. The expansion is planned to be executed
between the years of 2021 and 2022 and the following areas will require an investment of capital for
the following areas:
• Exploration Drilling;
• Mine Development;
• Mining Equipment;
• Surface Facilities and Equipment;
• Underground Facilities and Equipment;
• Power Supply;
• Access Road;
• Camp;
• Other Supporting Infrastructure;
• Mineral Processing Plant; and
• Tailings Storage Facility.
The capital cost estimates prepared for the expansion into this mining area also include estimates for
Engineering, Procurement and Construction Management (EPCM) and the owner’s cost to manage it.
The cost estimate is based on cost models prepared by SRK with site specific inputs from Marmato.
The estimate indicate that the expansion will require an investment of US$268.9 million, including an
estimated capital of US$215.1 million plus 25% contingency of US$53.8 million. Table 1-11
summarizes the expansion capital estimate.

SRK Consulting (U.S.), Inc. NI 43-101 Technical Report – Marmato Project Page 23
MMS/KD Marmato_PEA_NI43-101_544400.020_Rev31_KD.docx November 2019
Table 1-11: Marmato Deeps Zone Construction Capital ($000’s)
Description Total 2021 2022
Exploration Drilling 2,600 1,300 1,300
Development 52,021 14,790 37,232
Mining Equipment 26,956 923 26,033
Surface Facilities and Equipment 12,114 1,264 10,850
UG Facilities and Equipment 499 - 499
Power Supply 675 169 506
Access Road 225 169 56
Camp 750 188 563
Pump Station 200 - 200
Process Plant 65,551 26,221 39,331
Tailings Storage Facility 35,953 - 35,953
EPCM 7,562 268 7,294
Owners 10,000 5,000 5,000
Sub-Total 215,107 50,291 164,816
Contingency (25%) 53,777 12,573 41,204
Total 268,884 62,864 206,020
Source: Gran Colombia/SRK, 2019
Additionally, the MDZ will require sustaining capital to maintain the equipment and all supporting
infrastructure necessary to continue operations until the end of its projected production schedule. The
estimates indicate that the Project requires a sustaining capital of US$140.7 million to support the
projected production schedule through the LoM. Table 1-12 summarizes the LoM sustaining capital
estimate Table 1-13 and Table 1-14 present the same estimate by year.
Table 1-12: Marmato Deeps Zone Sustaining Capital (LoM)
Description LoM ($000s)
Drilling 14,500
Development 55,848
Mine Equipment 22,245
UG Facilities and Equipment 8,150
Surface 280
Plant 7,000
Tailings 22,804
Other Sustaining 3,812
Project Closure 6,100
Total 140,739
Source: Gran Colombia/SRK, 2019
Table 1-13: Marmato Deeps Zone Sustaining Capital (2023 to 2030)($000’s)
Description 2023 2024 2025 2026 2027 2028 2029 2030
Drilling 1,000 1,000 1,000 1,000 1,000 1,000 1,000 1,000
Development 9,701 5,878 829 877 8,385 10,434 6,486 5,866
Mine Equipment 5,727 800 3,564 3,536 935 2,318 2,352 1,004
UG Facilities and Equipment 4,603 1,440 463 375 200 75 920 75
Surface 280 - - - - - - -
Plant - 500 500 500 500 500 500 500
Tailings 842 842 842 871 842 842 7,608 5,730
Other Sustaining 219 237 242 247 250 251 262 263
Project Closure - - - - - - - -
Total 22,371 10,696 7,440 7,406 12,112 15,419 19,128 14,438
Source: Gran Colombia/SRK, 2019

SRK Consulting (U.S.), Inc. NI 43-101 Technical Report – Marmato Project Page 24
MMS/KD Marmato_PEA_NI43-101_544400.020_Rev31_KD.docx November 2019
Table 1-14: Marmato Deeps Zone Sustaining Capital (2031 to 2038) ($000’s)
Description 2031 2032 2033 2034 2035 2036 2037 2038
Drilling 1,000 1,000 1,000 1,000 1,000 1,000 500 -
Development 6,010 1,029 353 - - - - -
Mine Equipment 1,004 1,004 - - - - - -
UG Facilities and Equipment - - - - - - - -
Surface - - - - - - - -
Plant 500 500 500 500 500 500 500 -
Tailings 1,245 871 842 842 585 - - -
Other Sustaining 263 263 263 263 263 263 263 -
Project Closure - - - - - - - 6,100
Total 10,023 4,668 2,958 2,605 2,348 1,763 1,263 6,100
Source: Gran Colombia/SRK, 2019
1.12.3 Marmato Operating Costs
SRK and Marmato prepared the estimate of operating costs for the PEA’s production schedule. These
costs were subdivided into the following categories:
• Mining Operating Expenditure;
• Processing Operating Expenditure; and
• Site G&A Operating Expenditure.
Marmato Upper Zone LoM cost estimate is presented in Table 1-15 and MDZ LoM cost estimate is
presented in Table 1-16.
Table 1-15: Marmato Upper Zone Operating Costs Summary
Description LoM (US$/t-Ore) LoM (US$000’s)
Mining 46.71 258,918
Process 15.88 88,003
G&A 11.85 65,667
Total Operating 74.44 412,587
Source: Gran Colombia/SRK, 2019
Table 1-16: Marmato Deeps Zone Operating Costs Summary
Description LoM (US$/t-Ore) LoM (US$000’s)
Mining 32.43 675,150
Process 16.14 336,005
G&A 3.46 72,000
Total Operating 52.02 1,083,155
Source: Gran Colombia/SRK, 2019
1.13 Economic Analysis
The valuation results of the Marmato Project indicate that the Project has an after-tax Net Present
Value (NPV) of approximately US$206.8 million, based on a 5% discount rate, gold price of
US$1,300/oz and silver price of US$17.00/oz. The operation is projected to have negative cash flows
during the years 2021 and 2022, when the MDZ is installed, with payback for the expansion expected
by 2026. The annual free cash flow profile of the Project is presented in Figure 1-2. The full annual
TEM is in Appendix D.

SRK Consulting (U.S.), Inc. NI 43-101 Technical Report – Marmato Project Page 25
MMS/KD Marmato_PEA_NI43-101_544400.020_Rev31_KD.docx November 2019
Source: SRK, 2019
Figure 1-2: Marmato After-Tax Free Cash Flow, Capital and Metal Production
Indicative economic results are presented in Table 1-17. The Project is a gold operation with a sub-
product of silver, where gold represents 99% of the total projected revenue and silver the remaining
1%. The underground mining cost is the heaviest burden on the operation representing 63% of the
operating cost, as presented in Figure 1-3.
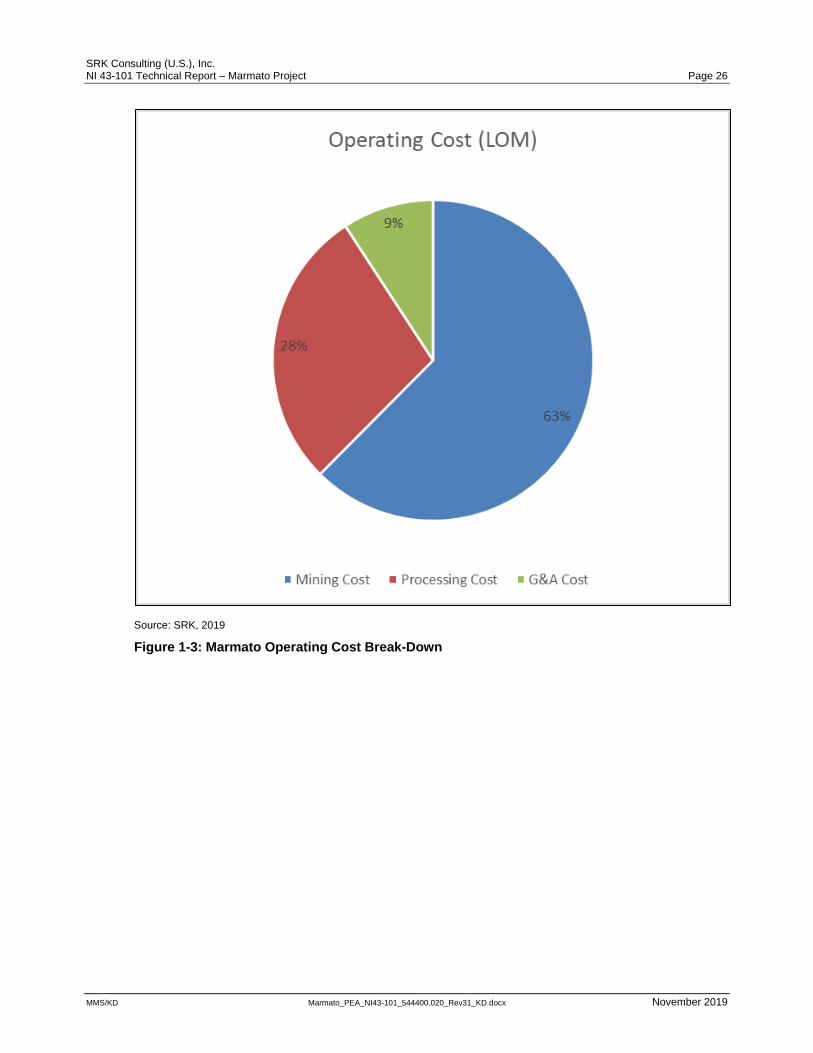
SRK Consulting (U.S.), Inc. NI 43-101 Technical Report – Marmato Project Page 26
MMS/KD Marmato_PEA_NI43-101_544400.020_Rev31_KD.docx November 2019
Source: SRK, 2019
Figure 1-3: Marmato Operating Cost Break-Down

SRK Consulting (U.S.), Inc. NI 43-101 Technical Report – Marmato Project Page 27
MMS/KD Marmato_PEA_NI43-101_544400.020_Rev31_KD.docx November 2019
Table 1-17: Marmato Indicative Economic Results
LoM Cash Flow
Total Revenue USD 2,851,475,063
Mining Cost USD (934,068,009)
Processing Cost USD (424,007,603)
G&A Cost USD (137,666,667)
Total Opex USD (1,495,742,278)
Operating Margin USD 1,355,732,785
Operating Margin Ratio % 48%
Taxes Paid USD (195,035,875)
Free Cashflow USD 717,096,368
LoM Capital
Expansion CAPEX USD (268,884,037)
Sustaining CAPEX USD (181,264,836)
Total LOM CAPEX USD (450,148,872)
Before Tax
Free Cash Flow USD 643,248,206
NPV @ 5% USD 322,995,835
NPV @ 8% USD 214,836,234
NPV @ 10% USD 163,296,934
IRR % 28%
After Tax
Free Cash Flow USD 448,212,331
NPV @ 5% USD 206,821,360
NPV @ 8% USD 126,595,938
NPV @ 10% USD 88,893,940
IRR % 20%
Payback Year 2026
Source: SRK, 2019
The estimated All-in Sustaining Costs (AISC), including sustaining capital, is US$882/Au-oz.
Table 1-18 presents the breakdown of the Marmato cash costs.
Table 1-18: LOM All-in Sustaining Cost Breakdown
Description Unit Value
Mining USD/Au 428
Processing USD/Au 194
G&A USD/Au 63
Refining USD/Au 6
Royalty USD/Au 120
Sustaining Capital USD/Au 83
Silver Credit USD/Au (14)
AISC USD/Au 882
SRK’s standard Cash Cost reporting methodology for NI 43-101 reports includes smelting/refining costs; whereas Gran Colombia’s basis of reporting treats these costs as a reduction of realized gold price (the refinery discounts the selling price by a factor to cover these charges) and excludes them from its reported “total cash cost per ounce”. Source: SRK, 2019
1.14 Conclusions and Recommendations
1.15 Conclusions and Recommendations
The Project requires a PFS level design effort to complete tradeoff studies and further evaluate the
feasibility and viability of the Project.

SRK Consulting (U.S.), Inc. NI 43-101 Technical Report – Marmato Project Page 28
MMS/KD Marmato_PEA_NI43-101_544400.020_Rev31_KD.docx November 2019
1.15.1 Mineral Resources
SRK is currently working with GCM’s geologists to optimize the remainder of the 2019 drilling program,
with a focus on increasing the confidence in the MDZ. The technical studies will aim to infill the drilling
spacing to a 50 by 50 m grid in the upper portions of the MDZ, and potentially increase the Inferred
Resources at the end. SRK is also working on a number of engineering studies to support the future
development of potential maiden Mineral Reserves for the Project. SRK anticipates the drilling to be
completed during Q4 2019 with an updated Mineral Resource produced during the same time period.
1.15.2 Geotechnical
The current geotechnical design parameters are based on characterization data from 35 diamond
drillholes, for which six were drilled deep in the orebody. Continued geotechnical work to further
characterize the geotechnical characteristics of the deposit in preparation for PFS is recommended.
1.15.3 Tailings Management Facilities
During the next phase of study, the DSTF footprints need to be finalized and detailed characterization
of the proposed DSTF foundations and the tailings material itself needs to be completed, in addition
to identifying and testing a suitable borrow source for rock starter embankment construction and outer
slope cladding for erosion protection. The ability to filter the tailings and achieve a target moisture
content of about 15% by weight must be established. The depth to groundwater and the source(s) of
perennial water within each DSTF footprint must be determined, and the ability to permit the DSTFs
without a base liner in natural drainages at the site must be established.
1.15.4 Mining
SRK recommends review of the mining parameters for the project in order to optimize the mining plan
for the deposit. Work to increase resolution on ventilation, geotechnical and hydrogeological aspects
of the project is required for completion of a PFS. This information will provide a basis for a PFS level
mine design.
1.15.5 Metallurgy and Mineral Processing
Additional metallurgical studies will need to be conducted during the next phase of study. This work
has commenced and is being done at SGS Canada. This work is being conducted on master
composites and variability composites that are reprensentative of the MDZ. These studies are directed
at optimizing process parameters for the selected process flowsheet and establish the process design
criteria for the process plant.
1.15.6 Recovery Methods
During the next phase of study, process plant engineering and design will need to be conducted by a
qualified engineering design based on process design criteria developed during the metallurgical
program. This work has commenced and is being conducted by Ausenco. Process engineering and
design will be conducted to a level of detail that will support capital and operating cost estimates at a
+/-25% level of accuracy.

SRK Consulting (U.S.), Inc. NI 43-101 Technical Report – Marmato Project Page 29
MMS/KD Marmato_PEA_NI43-101_544400.020_Rev31_KD.docx November 2019
1.15.7 Infrastructure
GCM is currently working on retaining a third party engineering firm for completion of PFS level
infrastructure engineering. GCM has estimated that a third party firm will be selected and contracted
by the end of 2019.
1.15.8 Hydrogeology
A work program for development of PFS level hydrogeological parameters is planned as part of the
next phase of work.
1.15.9 Environmental Studies and Permitting
The next phase of work should include the development of a detailed closure plan to inform closure
cost estimate. Hydrogeological, surface water and geochemical work programs should be pursued to
inform the development of the next level of study for the project. Baseline studies and the regulations
impacting the proposed operations should be completed and reviewed in detail.
1.15.10 Project Economics
Preparation of a PFS level estimate of capital and operating costs will occur in the next phase of work.
In addition, a program of tradeoff studies should be completed in an effort to optimize the economic
result of the project.

SRK Consulting (U.S.), Inc. NI 43-101 Technical Report – Marmato Project Page 30
MMS/KD Marmato_PEA_NI43-101_544400.020_Rev31_KD.docx November 2019
2 Introduction
2.1 Terms of Reference and Purpose of the Report
This report was prepared as a PEA level NI 43-101 Technical Report for GCM by SRK on Marmato
mine.
The quality of information, conclusions, and estimates contained herein is consistent with the level of
effort involved in SRK’s services, based on: i) information available at the time of preparation, ii) data
supplied by outside sources, and iii) the assumptions, conditions, and qualifications set forth in this
report. This report is intended for use by GCM or its assignee of the Project, subject to the terms and
conditions of its contract with SRK and relevant securities legislation. The contract permits GCM or its
assignee of the Project to file this report as a Technical Report with Canadian securities regulatory
authorities pursuant to NI 43-101, Standards of Disclosure for Mineral Projects. Except for the
purposes legislated under provincial securities law, any other uses of this report by any third party is
at that party’s sole risk. The responsibility for this disclosure remains with GCM. The user of this
document should ensure that this is the most recent Technical Report for the property as it is not valid
if a new Technical Report has been issued.
The PEA is preliminary in nature, that it includes Inferred Mineral Resources that are considered too
speculative geologically to have the economic considerations applied to them that would enable them
to be categorized as Mineral Reserves, and there is no certainty that the PEA will be realized. Mineral
Resources that are not Mineral Reserves do not have demonstrated economic viability.
This report provides Mineral Resource estimates, and a classification of resources prepared in
accordance with the Canadian Institute of Mining, Metallurgy and Petroleum (CIM) Standards on
Mineral Resources and Reserves: Definitions and Guidelines, May 10, 2014 (CIM, 2014).
2.2 Qualifications of Consultants (SRK)
The Consultants preparing this technical report are specialists in the fields of geology, exploration,
Mineral Resource and Mineral Reserve estimation and classification, underground mining,
geotechnical, environmental, permitting, metallurgical testing, mineral processing, processing design,
capital and operating cost estimation, and mineral economics.
None of the Consultants or any associates employed in the preparation of this report has any beneficial
interest in GCM, The Consultants are not insiders, associates, or affiliates of GCM. The results of this
Technical Report are not dependent upon any prior agreements concerning the conclusions to be
reached, nor are there any undisclosed understandings concerning any future business dealings
between GCM and the Consultants. The Consultants are being paid a fee for their work in accordance
with normal professional consulting practice.
The following individuals, by virtue of their education, experience and professional association, are
considered Qualified Persons (QP), as defined in the NI 43-101 standard, for this report, and are
members in good standing of appropriate professional institutions. QP certificates of authors are
provided in Appendix A. The QP’s are responsible for specific sections as follows:

SRK Consulting (U.S.), Inc. NI 43-101 Technical Report – Marmato Project Page 31
MMS/KD Marmato_PEA_NI43-101_544400.020_Rev31_KD.docx November 2019
• Ben Parsons, Principal Consultant (Resource Geologist) is the QP responsible for data
verification, preparation of the geological model and the mineral resource estimate. Sections
4 through 12, 14, 23 and portions of Sections 1, 24, 25 and 26 summarized therefrom, of this
Technical Report.
• Eric Olin, Principal Consultant (Metallurgy) is the QP responsible for Metallurgy Sections 13,
17, and portions of Sections 1, 24, 25 and 26 summarized therefrom, of this Technical Report.
• Fernando Rodrigues, Principal Consultant (Mining Engineering) is the QP responsible for
Upper Zone Mining and Economics and related portions Sections 16.1, 16.3 (except for
section 16.3.2), 19 and 22, and portions of Sections 1, 24, 25 and 26 summarized therefrom,
of this Technical Report.
• Jeff Osborn, Principal Consultant (Mining Engineering) is the QP responsible for Infrastructure
and Cost Estimation Sections 18.1, 18.2, 18.3, 18.5 and 21, and portions of Sections 1, 24,
25 and 26 summarized therefrom, of this Technical Report.
• Joanna Poeck, Principal Consultant (Mining Engineering) is the QP responsible for Section 15
and Section 16.4, and portions of Sections 1, 24, 25 and 26 summarized therefrom, of this
Technical Report.
• John Tinucci, Principal Consultant (Geotechnical Engineering) is the QP responsible for
Geotechnical Section 16.2 and portions of Sections 1, 24, 25 and 26 summarized therefrom,
of this Technical Report.
• Joshua Sames, Senior Consultant (Civil Engineering) is the QP responsible for Tailings
Section 18.4, and portions of Sections 1, 24, 25 and 26 summarized therefrom, of this
Technical Report.
• Cristian Pereria, Senior Consultant (Hydrogeology) is the QP responsible for Hydrogeology
Sections 16.3.2 and 16.4.2, and portions of Sections 1, 24, 25 and 26 summarized therefrom,
of this Technical Report.
• David Hoekstra, Principal Consultant (Water Resource Engineering) is the QP responsible for
Hydrology Section 20.2.4, and portions of Sections 1, 24, 25 and 26 summarized therefrom,
of this Technical Report.
• David Bird, Associate Principal Consultant (Geochemistry) is the QP responsible for
Geochemistry Sections 20.1.6, and portions of Sections 1, 24, 25 and 26 summarized
therefrom, of this Technical Report.
• Mark Willow, Principal Consultant (Environmental) is the QP responsible for Environmental
Section 20 (except section 20.1.6), and portions of Sections 1, 24, 25 and 26 summarized
therefrom, of this Technical Report.

SRK Consulting (U.S.), Inc. NI 43-101 Technical Report – Marmato Project Page 32
MMS/KD Marmato_PEA_NI43-101_544400.020_Rev31_KD.docx November 2019
2.3 Details of Inspection
Table 2-1: Site Visit Participants
Personnel Company Expertise Date(s) of Visit Details of Inspection
Ben Parsons SRK Mineral Resources June 11 to June 13, 2019 August 17, 2017 and March 12 to March 14, 2012
Underground Site visit levels 18 – 21, review latest drilling intersections, Underground Site visit levels 17 – 20, review latest drilling intersections, Underground Site visit, review latest drilling intersections.
Jeff Osborn SRK Mining/Infrastructure
July 16 to July 18, 2019 Surface Facilities and New MDZ location
August 22 and 23, 2017
Underground and Surface Facilities including TSF as well as core shack area
Fernando Rodrigues
SRK Mining/Reserves August 22 and 23, 2017
Underground and Surface Facilities including TSF as well as core shack area
John Tinucci SRK Geotechnical August 22 and 23, 2017
Underground and Surface Facilities including TSF as well as core shack area
Mark Willow SRK Environmental December 1, 2016 Environmental Impact review
Cristian Pereira
SRK Hydrogeology August 12 to August 13, 2019
Hydrogeology review
Source: SRK, 2019
2.4 Sources of Information
The sources of information include data and reports supplied by GCM personnel as well as documents
cited throughout the report and referenced in Section 27.
SRK has been supplied with numerous technical reports and historical technical files. SRK’s report is
based upon:
• Numerous technical review meetings held at GCM’s offices in Medellín, Colombia;
• Discussions with directors, employees and consultants of the Company;
• Data collected by the Company from historical exploration on the Project;
• Access to key personnel within the Company, for discussion and enquiry;
• A review of data collection procedures and protocols, including the methodologies applied in
determining assays and measurements;
• Gran Colombia Gold Marmato S.A.S. for the site-specific closure plan and cost estimate
presented in Plan de Cierre y Abandono de Mina La Maruja (May 2019);
• Site Environmental Manager, Ing. Adrián Quintero Jiménez, and corporate Environmental
Manager, Erwin Wolff Carreño, for information on permits, monitoring programs and data, and
the environmental management budget estimate;
• Knight Piésold (2012) for information on the geochemistry of the deposit;

SRK Consulting (U.S.), Inc. NI 43-101 Technical Report – Marmato Project Page 33
MMS/KD Marmato_PEA_NI43-101_544400.020_Rev31_KD.docx November 2019
• Existing reports provided to SRK, as follows:
o NI 43-101 Mineral Resource Estimate on the Marmato Project, Colombia, June 21, 2012;
o NI 43-101 Mineral Resource Estimate on the Marmato Project, Colombia, June 16, 2017;
o Geochronology, Geochemistry and Magmatic-Hydrothermal Oxide Characterization of the
Marmato Gold Deposit, Colombia;
o Lead isotopic compositions of the gold mineralization of Marmato, Colombia:
Characterization of the transition domain in epithermal - porphyry systems; and
o Further Geological Observations on The Lower Zone Gold Deposit at Marmato, Colombia,
Richard H Sillitoe, July 2019.
• Data files provided by the Company to SRK as follows:
o Topographic grid data in digital format;
o Drillhole database, including collar, survey, geology, and assay;
o QA/QC data including details on duplicates, blanks and certified reference material
(CRM); and
o DXF files, including geological interpretation, vein domain digitized 2D section
interpretations, stope outlines and mined depletions.
2.5 Effective Date
The effective date of this report is July 31, 2019.
2.6 Units of Measure
The metric system has been used throughout this report. Tonnes are metric of 1,000 kg, or 2,204.6 lb.
All currency is in U.S. dollars (US$) unless otherwise stated.

SRK Consulting (U.S.), Inc. NI 43-101 Technical Report – Marmato Project Page 34
MMS/KD Marmato_PEA_NI43-101_544400.020_Rev31_KD.docx November 2019
3 Reliance on Other Experts The Consultant’s opinion contained herein is based on information provided to the Consultants by:
• Site Environmental Manager, Ing. Adrián Quintero Jiménez, and corporate Environmental
Manager, Erwin Wolff Carreño, for information on permits, monitoring programs and data, and
the environmental management budget estimate;
• Knight Piésold (2012) and SRK Geochemist, David Bird, for information on the geochemistry
of the deposit; and
• Gran Colombia Gold Marmato S.A.S. for the site-specific closure plan and cost estimate
presented in Plan de Cierre y Abandono de Mina La Maruja (May 2019).
SRK has relied upon the work of other consultants in the project areas in support of this Technical
Report.
SRK has not performed an independent verification of land title and tenure as summarized in Section 4
of this report. SRK did not verify the legality of any underlying agreement(s) that may exist concerning
the permits or other agreement(s) between third parties, but have relied on the Company and its legal
advisor for land title issues.
The Consultants used their experience to determine if the information from previous reports was
suitable for inclusion in this technical report and adjusted information that required amending. This
report includes technical information, which required subsequent calculations to derive subtotals, totals
and weighted averages. Such calculations inherently involve a degree of rounding and consequently
introduce a margin of error. Where these occur, the Consultants do not consider them to be material.
These items have not been independently reviewed by SRK and SRK did not seek an independent
legal opinion of these items.

SRK Consulting (U.S.), Inc. NI 43-101 Technical Report – Marmato Project Page 35
MMS/KD Marmato_PEA_NI43-101_544400.020_Rev31_KD.docx November 2019
4 Property Description and Location
4.1 Property Location
The Marmato Project is located in the Municipality of Marmato, Department of Caldas, Republic of
Colombia and is approximately 125 kilometers (km) due south of the city of Medellín, the capital of the
Department of Antioquia (Figure 4-1).
The property sits between latitudes and longitudes 5⁰28’24”N and 5⁰28’55”N, and 75⁰35’57”W and
75⁰38’55”W respectively. The Project can be accessed from Medellín via paved roads on the Medellín
to Cali highway which forms part of the Pan America Highway.
Source: SRK, 2012
Figure 4-1: Location Map
4.2 Mineral Titles
The current Marmato Project area has historically been divided into three main zones with numerous
license boundaries defined within. The Project is made up of three separate concessions (Figure 4-2),
named Zona Alta, Zona Baja and Echandia. Prior to ownership by GCM each of these licenses have
changed owners a number of times. The following section briefly describes the three license areas.

SRK Consulting (U.S.), Inc. NI 43-101 Technical Report – Marmato Project Page 36
MMS/KD Marmato_PEA_NI43-101_544400.020_Rev31_KD.docx November 2019
Source: Mineros Nacionales, 2010
Figure 4-2: Land Tenure Map(s)
The horizontal division (Zona Alta and Zona Baja) of mining rights at Marmato is unique in Colombia
and was created in 1954 by Decree 2223 to enable concession contracts to be defined by horizontal
mine levels. This is defined as an Aporte Minero Mine (Mining Contribution 1017 for precious metals),
which was granted in 1981. The Zona Alta concession is further subdivided into three levels. The
Upper Level (Nivel Superior) is located above the 1,500 m contour to the hilltop at about 1,705 m; the
Intermediate Level (Nivel Intermedio) is between the 1,500 m and 1,363 m contours; and the Lower
Level (Nivel Inferior) is between the 1,363 m contour and the top of the Zona Baja (Lower Zone). The
top of the Zona Baja is defined in Contract 014-89 with Mineros Nacionales S.A. (Mineros Nacionales)
and coincides with the road and varies from 1,207 m to 1,298.3 m in elevation.
The Zona Alta portion of the Marmato Project hosted a large number of individual small mines. During
2009 to 2010 the Company focused work on consolidating the various licenses (including surface
rights) to create a single project area for the entire Marmato deposit, which has now been completed.
SRK has not reviewed all the legal documents to confirm the completion of this process at this given
time, however GCM senior management confirmed that any outstanding consolidation would not
impact the three main licenses. Some minor licenses have lapsed but this will not materially impact
the current Mineral Resource or the ability to continue the current mining process.

SRK Consulting (U.S.), Inc. NI 43-101 Technical Report – Marmato Project Page 37
MMS/KD Marmato_PEA_NI43-101_544400.020_Rev31_KD.docx November 2019
The Zona Baja license lies below the Marmato Zona Alta property and is adjacent to Echandia. Zona
Baja extends east to the River Cauca. The license is bounded vertically by the Zona Alta and Cerro El
Burro in Marmato, but in the other parts it continues to surface. The license continues vertically to
depth in all parts.
The Zona Baja contract was owned by Mineros Nacionales, a private Colombian corporation which
was owned 94.5% by Mineros S.A. (Mineros), a Colombian corporation whose shares are traded on
the Colombian stock exchange (BVG – Bolsa de Valores de Colombia). The remaining 5.5% of
Mineros Nacionales was owned by a number of private and juridical persons. The contract registration
number is 014-89M and the mining title registration number is GAFL-11. It covers a surface area of
952.5830 ha. The Zona Baja contract was awarded to Mineros Nacionales, since renamed GCM, in
October 1991 and is valid for 30 years until October 2021. In October 2017, GCM commenced the
process to renew the contract for another 30-year term.
On February 15, 2010 Medoro Resources Ltd. (Medoro) acquired all of the issued and outstanding
ordinary shares of Mineros Nacionales S.A. from Mineros S.A., for total cash consideration of US$35
million. With this acquisition, Medoro acquired 100% of Mineros Nacionales' interests in the Zona Baja
concession (the Zona Baja property). Medoro merged into Gran Colombia Gold in 2011.
The Echandia property lies to the north east of the Zona Alta limit, and extends to depth (Figure 4-2).
The Echandia has contract number RPP 357 and registry number EDMN-01. The Reconocimiento de
Propiedad Privada (RPP) type of contract translates as Recognition of Private Property. RPPs were
created by Law 20 of 1969. The law respected prior mining and land rights and required that proof be
submitted of mining. Echandia is an old freehold property dating from the 19th century. The RPP titles
grant surface and subsurface rights in perpetuity.
Exploitation is required in order to maintain the validity of an RPP license. Mining on a relatively small
scale is being maintained in the area of contract number RPP 357
There is an overlap of mining license applications in a triangular area at Cien Pesos in the south-east
part of the Echandia license. This was the result of a surveying error in the Mining Registry which
erroneously excluded the triangular area from Echandia, and is understood to have been later
corrected. 25 mining license applications have been made in this area by small miners. Some of these
were granted contracts by Minercol and its predecessors (described below), but they have not been
signed and cannot be registered due to the overlap with the Echandia license. Medoro, though Minera
de Caldas, has bought 10 of these licenses. SRK has not viewed the legal documents in line with
these licenses but in discussions with senior management it was confirmed that this would not impact
the three main licenses.
On February 8, 2010, Medoro (previous owners), announced that it has acquired all of the issued and
outstanding ordinary shares of Colombia Gold plc (Colombia Gold). A total of 33,333,238 common
shares of Medoro were issued to former shareholders of Colombia Gold pursuant to the offer. With
this acquisition, Medoro acquired 100% of Colombia Gold interests in the Echandia concession (the
Echandia property) which adjoins the Zona Alta property.
Effective June 10, 2011, GCM completed a merger with Medoro and the combined company continued
under the name Gran Colombia Gold Corp. As a result, GCM acquired 100% of Medoro’s interest in
the Marmato Project.

SRK Consulting (U.S.), Inc. NI 43-101 Technical Report – Marmato Project Page 38
MMS/KD Marmato_PEA_NI43-101_544400.020_Rev31_KD.docx November 2019
SRK notes within the transfer of licenses from the previous owner, there is a gap between the existing
licenses for Zona Baja and Echandia. This ground is under application from the Company with the
Colombia government for formal approval to continue mining. SRK has reviewed the application within
the government website and notes that the status is defined as “in progress”, which has been in place
since September 30, 2009. The Company is taking steps to get the approval finalized.
Mining by GCM within this area has historically been conducted through the current operations and it
has been reported to SRK that this area is under application for adjustment of the status for inclusion
in the current mining operations of GCM. As the area represented by this gap contains approximately
8.7% of Measured & Indicated resources in Zona Baja and 1.9% of Inferred resources in Zona Baja,
SRK recommends that GCM accelerate its effort to obtain government resolution on this gap as it
could potentially result in loss of Mineral Resources (and future Reserves). Only approximately 2.3%
of the total LOM gold production included in the proposed mine plan for Zona Baja contained herein is
sourced from the area represented by this gap.
A summary of the location of the area of concern is shown in Figure 4-3. It is expected that this will not
limit the current mining operation. SRK estimates within this area on a global basis for the Mineral
Resources approximately 6% of the Measured and Indicated Mineral Resources and approximately
1% of the Inferrred material.
Level 1,050 m, area in green is under application but has been historically mined. Source: SRK, 2019
Figure 4-3: Summary of Gap in Licenses Within the Current Operations, with Associated Applications
Area under Application
No# KIU-11401 Original Application: 9/30/2009Status: Under Review RPP_357
014_89m

SRK Consulting (U.S.), Inc. NI 43-101 Technical Report – Marmato Project Page 39
MMS/KD Marmato_PEA_NI43-101_544400.020_Rev31_KD.docx November 2019
4.2.1 Nature and Extent of Issuer’s Interest
In regard to surface rights within Zona Alta, GCM compiled a GIS database of surface rights ownership
within a 6 km radius of Marmato. Each of the properties was reviewed to determine discrepancies
between legal descriptions and actual ownership. The Mining Law allows for expropriation of land if
negotiations among subsurface and surface owners are unsuccessful.
SRK is not aware of any other restrictions which impact the current mining operations within the Zona
Baja (Mineros Nacionales) and Echandia areas of the Project.
4.3 Royalties, Agreements and Encumbrances
In 1991, Mineros Nacionales entered into an agreement with Ecominas (a State Industrial and
Commercial Organization) for the exploration and exploitation of Mining Title No.014-89M. The
mentioned title was previously granted by the Colombian State to Ecominas. It was agreed by the
parties that Mineros Nacionales would pay a royalty to Ecominas (now referred to as Agencia Nacional
de Mineria) equal to 6% on gold revenue and 8% on silver revenue as economic compensation.
Besides that, Mineros Nacionales is bound by law to pay the Colombian State a 4% royalty.
GCM also pays a royalty of 4% on gold and silver revenue to an associated company owned by Gran
Colombia, Minera Croesus S.A.S. (“Croesus”), in respect of production sourced from the neighbouring
Echandia mining title owned by Croesus. This royalty obligation will remain in place after the RTO
Transaction described in Section 1.1.
4.4 Environmental Liabilities and Permitting
The main environmental details for the Project are covered in Section 20 of this report.
4.4.1 Environmental Liabilities
The existing Marmato Project is authorized through the approval of a PMA. The PMA for Marmato was
approved by Corpocaldas on October 29, 2001 under Resolution 0496, File No. 616. The PMA and its
requisite environmental management procedures and practices amount to approximately US$425,200
annually. This amount is likely to increase with the proposed expansion project.
The 2001 Mining Code requires the concession holder to obtain an Insurance Policy to guarantee
compliance with mining and environmental obligations which must be approved by the relevant
authority, annually renewed, and remain in effect during the life of the Project and for three years from
the date of termination of the concession contract. The value to be insured will be calculated as follows:
• During the exploration phase of the Project, the insured value under the policy must be 5% of
the value of the planned annual exploration expenditures;
• During the construction phase, the insured value under the policy must be 5% of the planned
investment for assembly and construction; and
• During the exploitation phase, the insured value under the policy must be 10% of the value
resulting from the estimated annual production multiplied by the pithead price established
annually by the Government.
According to the Code, the concession holder is liable for environmental remediation and other
liabilities based on actions and/or omissions occurring after the date of the concession contract, even

SRK Consulting (U.S.), Inc. NI 43-101 Technical Report – Marmato Project Page 40
MMS/KD Marmato_PEA_NI43-101_544400.020_Rev31_KD.docx November 2019
if the actions or omissions occurred at a time when a third-party was the owner of the concession title.
The owner is not responsible for environmental liabilities which occurred before the concession
contract, from historical activities, or from those which result from non-regulated mining activity, as has
occurred on and around the Marmato Project site.
As noted above, given the tenure of the current operations, the Environmental Insurance Policy is not
required for the Marmato operation. Current liabilities at the site are generally associated with the
reclamation and closure of the mining facilities and tailings disposal areas. Given the extensive impacts
associated with artisanal mining in the area, a clear delineation between possible environmental
liabilities attributable to the GCM and those from unregulated mining activities is not possible; however,
GCM has been making a concerted effort to deal with legacy environmental issues in order to better
make that separation. The social issues related to mining in Colombia, especially the interactions
between mining companies and artisanal operators, have been violent at times, and could continue to
pose a health and safety liability for GCM employees and the neighboring communities.
4.4.2 Required Permits and Status
Discussion related to mining in Colombia, the Mining and Environmental Codes, as well as the permits
and authorizations necessary for mineral exploration and exploitation is provided in Section 20.3.
4.5 Other Significant Factors and Risks
There are no legal restrictions that affect access, title or right or ability to perform work on the property
with the exception of the pending license approval. In light of past experience, social issues may cause
issues from time to time within the Zona Alta region of the Project.

SRK Consulting (U.S.), Inc. NI 43-101 Technical Report – Marmato Project Page 41
MMS/KD Marmato_PEA_NI43-101_544400.020_Rev31_KD.docx November 2019
5 Accessibility, Climate, Local Resources, Infrastructure and Physiography
5.1 Topography, Elevation and Vegetation
The Marmato Project is located in an area of steep mountainous terrain with a relief of approximately
1,600 m (Figure 5-1). The Project is bound to the east by the Cauca River at 600 m elevation, and
otherwise surrounded by the peaks of the nearby mountains that reach up to 2,200 m elevation and
are commonly incised through landslide activity. Despite the abrupt relief, the landscape is in general
well vegetated and supports crop cultivation and livestock. The dominant land use in the area of
Marmato is cattle grazing, coffee, sugar cane, citrus fruit, bananas, and mining. The Middle Cauca
region, where Marmato is located, was occupied for two thousand years before the Spanish conquest
by farmers, potters, gold miners and goldsmiths of the Quimbaya culture (500 BC to 1600 AD).
The ecological zones defined on the Holdridge Life Zone climatic classification system are zoned by
elevation (Municipio de Marmato, 2004; Correa, 2006; Cia Minera de Caldas, 2008):
• Premontane (subtropical) wet forest transitional to tropical moist forest and dry forest; defined
as temperatures >24°C, annual rainfall of 1,500 to 2,800 mm, and elevation of 700 to 1,000
m. This area includes the Cauca River valley and the lower part of El Llano town.
• Premontane (subtropical) wet forest defined as temperatures of 18°C to 24°C, rainfall of 2,000
mm to 4,000 mm, and elevation of 1,000 to 1,900 m. The main areas of mining and exploration
are in this zone.
• Lower montane (warm temperate) wet forest defined as temperatures of 12°C to 18°C, rainfall
of 2,000 to 4,000 mm, and elevation of 1,900 m to 2,900 m.
Much of the original forest cover has been cleared for agriculture and grazing, especially at lower
elevations. Land is used for cattle grazing, coffee, sugar cane, citrus fruit, bananas, and mining in
Marmato.
5.2 Accessibility and Transportation to the Property
The Project is in the Municipality of Marmato in Caldas. The concessions of the Marmato Project are
located on the eastern side of the Western Cordillera (Cordillera Occidental) of Colombia on the west
side of the Cauca River.
Marmato is 200 km west of the Pacific Ocean and 300 km south of the Caribbean Sea and Atlantic
Ocean. The nearest port is Buenaventura on the Pacific Ocean (320 km by the Pan American
Highway).
The property is a three-hour drive from Medellín, via the Medellín to Cali highway which is part of the
Pan American Highway. The route from Medellín is via Itaguí (7 km), Caldas (12 km), Alto de Minas
(13 km), Santa Barbara (27 km), La Pintada (26 km), La Guaracha del Rayo (32 km), and then a turn
onto a secondary road to an 8 km long partially asphalted road to Marmato. There is an international
airport located in Medellín with flights to the USA, Panamá, Venezuela, Spain and Peru, and a national
airport in Manizales with flights to Medellín and Bogotá.

SRK Consulting (U.S.), Inc. NI 43-101 Technical Report – Marmato Project Page 42
MMS/KD Marmato_PEA_NI43-101_544400.020_Rev31_KD.docx November 2019
Source: SRK, 2012
Figure 5-1: Marmato Project, Looking Northwest Towards Cerro El Burro

SRK Consulting (U.S.), Inc. NI 43-101 Technical Report – Marmato Project Page 43
MMS/KD Marmato_PEA_NI43-101_544400.020_Rev31_KD.docx November 2019
5.3 Climate and Length of Operating Season
Climate at the site is typical of the equatorial zone, with the region falling within the Köppen
classification zone of Am, described as moist tropical climates with high temperatures year-round and
short dry seasons in a monsoon cycle. Average annual precipitation was estimated as 1,889
millimeters per year (mm/y) (Knight Piésold, 2012) with two drier periods around January and July and
wetter periods around April-May and October-November. Temperatures are warm year-round, with
maximum temperatures ranging from 28.7°C to 31.6°C and minimum temperatures in the range of
17.4°C to 18.7°C (Knight Piésold, 2012). Relative humidity at the site is typically in the 70 to 80%
range. The climate allows year-round operations.
5.4 Sufficiency of Surface Rights
Refer to Section 4.2 of this report.
5.5 Infrastructure Availability and Sources
5.5.1 Power
Power is available through the Colombian power supplier Central Hidroeléctrica de Caldas (CHEC), a
subisidiary of Empresas Públicas de Medellín (EPM) through existing local substations. The power
system feeding the Project has a 40 MVA capacity. Substantial transmission capacity is available in
the region around the Project, with energy provided over the transmission system by the third largest
electricity producer in Colombia, ISAGEN.
5.5.2 Water
External water supplies are available from both groundwater and surface water sources. Dewatering
for the underground mine is currently being utilized as a water supply for the existing operations, and
withdrawals from the nearby Cascabel river have been utilized as well. Additional dewatering flows
are expected to be produced as a result of dewatering the MDZ Project. Water is also available from
the nearby Cauca River.
5.5.3 Mining Personnel
The region has historically and currently had a strong mining presence with around 1,200 people
working at the current Marmato Project and a substantial number of artisanal miners in the area close
to the mine. Skilled personnel should be available from the local miners as well as supplemented from
the other nearby areas to support the workforce as needed.
Field personnel for the exploration program have been employed from the towns of Marmato and El
Llano and neighboring municipalities. In the long term, personnel currently working on the large
number of small scale mines and from the surrounding region would be able to supply the basic
workforce for any future mining operation.
5.5.4 Existing and Potential Tailings Storage Facilities
The existing Marmato tailings storage facility is estimated to provide three to four years of additional
capacity, after which new dry stack tailings storage facilities (DSTF) would need to accommodate

SRK Consulting (U.S.), Inc. NI 43-101 Technical Report – Marmato Project Page 44
MMS/KD Marmato_PEA_NI43-101_544400.020_Rev31_KD.docx November 2019
tailings through the currently-estimated 16-year LoM. A siting study was completed as part of PEA
preparation and two preferred locations were evaluated to satisfy this requirement.
5.5.5 Potential Waste Disposal Areas
Waste is typically returned to the stopes in the existing mine. At the MDZ Project, a waste rock storage
area is designated near the portal. Other locations are available if needed.
5.5.6 Potential Processing Plant Sites
The Project is an operating mine with an existing plant site. An additional plant location has been
identified for use for the MDZ Project approximately 2.7 km from the existing plant with minimal
population on the site or in close proximity to the site.

SRK Consulting (U.S.), Inc. NI 43-101 Technical Report – Marmato Project Page 45
MMS/KD Marmato_PEA_NI43-101_544400.020_Rev31_KD.docx November 2019
6 History Colombian gold production between 1514 and 1934 has been estimated at 49 million ounces (Moz)
which makes Colombia number one in South America with 38% of the total historical production
(Emmons, 1937). Two-thirds of the gold production was from placer deposits. Subsequent Colombian
production is estimated at 30 Moz by the Banco de la Republica (Shaw, 2000), which gives Colombia
a total recorded historical gold production of approximately 80 Moz. 75% of this production came from
the Departments of Antioquia and Caldas, with the Marmato Project located near the border between
the two departments.
6.1 Prior Ownership and Ownership Changes
Marmato is one of the most important historical gold properties in Colombia and lies in the heart of the
main historical gold producing region (dating back to 500 BC). The location name is derived from
“marmato” or “marmaja”, an old Spanish term for pyrite. The property has a long and complex
ownership history, summarized in Table 6-1.
Table 6-1: Ownership History at Marmato
Date Ownership History
1525 Colonization of Colombia and first references to Marmato
1634 First larger scale workings begin; and first gold mill
1798 Silver mines located at Echandia, with two near surface veins exploited
1819 to 1925 Various English companies mine gold at Marmato
1925 to 1938 Mines were expropriated and initially remained closed, then later leased to contractors
1954 Marmato was divided into two zones (Decree 2223), Alta (Upper) and Baja (Lower)
1981 to 2004 Marmato becomes part of the Aporte Minero scheme and was managed by a succession of state mining companies
1984 to 1985 Minera Phelps Dodge de Colombia S.A. (Minera Phelps Dodge) explores the Zone Baja of Marmato
1991 Contract for the Zona Baja is awarded to Mineros Nacionales in October 1991 for a period of 30 years by the state entity Empresa Colombiana de Minas (Ecominas); the contract is now administered by Agencia Nacional de Mineria (National Mining Agency or ANM)
1996 to 2000
Conquistador Mines Ltd. (Conquistador), a Vancouver listed junior company (now called Orsa Ventures Corp), explored the Project through its Colombian subsidiary Corona Goldfields S.A. (Corona Goldfields). Conquistador had an option to explore the Zona Baja over 4 years and to acquire 50.1% of Mineros Nacionales (it bought 13.15% which it later sold in 2001), and acquired several mines in the Zona Alta.
1995 to 1997 Gran Colombia Resource Inc. (unrelated to GCM and now defunct) carried out exploration at Echandia and Chaburquia properties on the northern portion of the Marmato System
2005 - 2008 Minera de Caldas began exploration of Marmato and surrounding areas with the aim of identifying bulk mineable targets of low grade gold and silver. Colombia Goldfields Limited (CGL), began acquisition of property within Zona Alta, plus completed 46,000 m of drilling
2009 - 2010 Medoro purchased CGL (Zona Alta), Colombia Gold (Echandia) and Mineros Nacionales (Zona Baja), which consolidated the three primary gold properties at Marmato
2011 - Present GCM and Medoro Resources Ltd merged to create the largest underground gold and silver producer in Colombia, under the name of Gran Colombia Gold Corp..
Source: SRK, 2019

SRK Consulting (U.S.), Inc. NI 43-101 Technical Report – Marmato Project Page 46
MMS/KD Marmato_PEA_NI43-101_544400.020_Rev31_KD.docx November 2019
6.2 Exploration and Development Results of Previous Owners
Modern exploration at Marmato began in the mid-1980s and has continued into the present day under
various entities. The exploration and development results of prior owners are listed below:
1984 to 1985: Minera Phelps Dodge explored the Zona Baja of Marmato, with the objective of defining
a 300 tpd underground operation. It completed surface and underground sampling and drilled seven
underground core holes, and defined a Proven reserve of 102,900 t at 7.83 g/t gold and 24 g/t silver,
and a total reserve (Proven, Probable and Possible) of 754,600 t at the same grade.
1993: Mineros Nacionales began mining the Maruja mine via a 300 tpd underground operation under
contract (No. 041-89M). Mineros S.A. acquired 51.75% of Mineros Nacionales and upgraded the mine
and mill. Mineros subsequently increased ownership of Mineros Nacionales to 94.5%. Further
exploration was completed through the 1990s with 24 underground core holes drilled and three reverse
circulation (RC) holes drilled. The plant was expanded to a capacity of 800 tpd.
1996 to 2000: Conquistador drilled 44 holes (14,873 m), 30 from surface (11,496 m) and 14
underground diamond holes (3,377 m), plus 1,147 channel samples totaling 2,847 m from surface
trenches and underground cross-cuts. Conquistador also commissioned MRDI to complete a resource
estimate and scoping study in 1998, but carried out no further work on the Project due to the expiration
of the option contract.
1995 to 1997: Gran Colombia Resource Inc. conducted soil surveys, surface magnetic and
geophysical surveys, channel samples (La Negra, La Felicia and La Palma adits) and completed 75
diamond drillholes (surface and underground) totaling 15,000 m. A scoping study was made by
Geosystems International, Denver, in 1997 which concluded that there was not sufficient grade
continuity for a bulk-tonnage resource and mining operation, and no further work was carried out.
2005: Minera de Caldas began exploration of Marmato and surrounding areas with the aim of
identifying bulk mineable targets of low grade gold and silver. CGL carried out underground sampling,
surveying and mapping, preliminary metallurgical test work and diamond drilling to define a mineral
resource. CGL carried out 46,000 m of drilling in 2007 and 2008.
2010: Medoro commenced infill drilling of the Project via surface and underground diamond drilling
with view of producing a prefeasibility study in 2011.
2011 to 2017: GCM completed further infill drilling from surface and underground locations, plus
channel sampling of existing cross-cuts.
2017 to 2019: GCM exploration has focused drilling on defining and infilling the MDZ, plus on-going
exploration within the current mining operations and cross-cuts on levels 20 and 21.
6.3 Historic Mineral Resource and Reserve Estimates
A qualified person has not done sufficient work to classify the historical estimate as a current Resource
Estimate or Mineral Reserve and the issuer is not treating the historical estimate as a current Resource
Estimate.

SRK Consulting (U.S.), Inc. NI 43-101 Technical Report – Marmato Project Page 47
MMS/KD Marmato_PEA_NI43-101_544400.020_Rev31_KD.docx November 2019
6.4 Historic Production
Production has occurred from the Marmato property since pre-colonial times, but there are no
published historical records of the actual gold and silver production for all periods since mining
commenced, however sporadic records for different periods have been noted.
To give an indication of the current mining activity at the deposit SRK has reproduced a summary
(Table 6-2) of the total produced gold and silver at Marmato on an annual basis between 2004 and
2011. The figures also represent only the official declared gold recovered and does not include illegal
mining which persists at Marmato even to present times.
Table 6-2: Gold Production from the Municipality of Marmato 2004 to December 2018
Year Ore Tonnes
(t) Grade Au
(g/t) Au Produced
(oz)
2004 186,330 3.60 21,583
2005 231,540 3.30 24,541
2006 262,517 3.10 26,171
2007 300,756 3.22 31,127
2008 254,474 2.95 24,138
2009 250,638 3.51 24,372
2010 252,136 3.39 23,318
2011 250,553 3.19 22,715
2012 268,137 2.85 21,717
2013 274,190 2.90 22,566
2014 295,023 2.85 24,116
2015 303,279 2.79 23,954
2016 341,308 2.55 23,447
2017 366,485 2.46 25,162
2018 340,052 2.67 24,951
Source: GCM, 2019
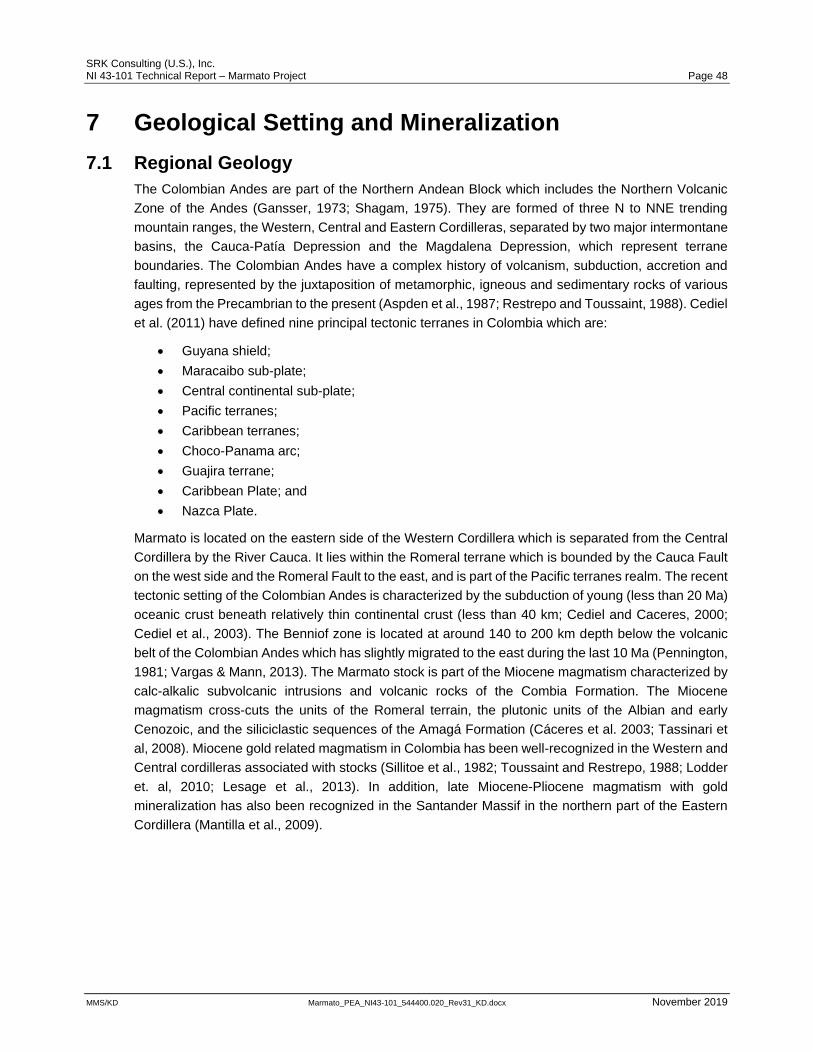
SRK Consulting (U.S.), Inc. NI 43-101 Technical Report – Marmato Project Page 48
MMS/KD Marmato_PEA_NI43-101_544400.020_Rev31_KD.docx November 2019
7 Geological Setting and Mineralization
7.1 Regional Geology
The Colombian Andes are part of the Northern Andean Block which includes the Northern Volcanic
Zone of the Andes (Gansser, 1973; Shagam, 1975). They are formed of three N to NNE trending
mountain ranges, the Western, Central and Eastern Cordilleras, separated by two major intermontane
basins, the Cauca-Patía Depression and the Magdalena Depression, which represent terrane
boundaries. The Colombian Andes have a complex history of volcanism, subduction, accretion and
faulting, represented by the juxtaposition of metamorphic, igneous and sedimentary rocks of various
ages from the Precambrian to the present (Aspden et al., 1987; Restrepo and Toussaint, 1988). Cediel
et al. (2011) have defined nine principal tectonic terranes in Colombia which are:
• Guyana shield;
• Maracaibo sub-plate;
• Central continental sub-plate;
• Pacific terranes;
• Caribbean terranes;
• Choco-Panama arc;
• Guajira terrane;
• Caribbean Plate; and
• Nazca Plate.
Marmato is located on the eastern side of the Western Cordillera which is separated from the Central
Cordillera by the River Cauca. It lies within the Romeral terrane which is bounded by the Cauca Fault
on the west side and the Romeral Fault to the east, and is part of the Pacific terranes realm. The recent
tectonic setting of the Colombian Andes is characterized by the subduction of young (less than 20 Ma)
oceanic crust beneath relatively thin continental crust (less than 40 km; Cediel and Caceres, 2000;
Cediel et al., 2003). The Benniof zone is located at around 140 to 200 km depth below the volcanic
belt of the Colombian Andes which has slightly migrated to the east during the last 10 Ma (Pennington,
1981; Vargas & Mann, 2013). The Marmato stock is part of the Miocene magmatism characterized by
calc-alkalic subvolcanic intrusions and volcanic rocks of the Combia Formation. The Miocene
magmatism cross-cuts the units of the Romeral terrain, the plutonic units of the Albian and early
Cenozoic, and the siliciclastic sequences of the Amagá Formation (Cáceres et al. 2003; Tassinari et
al, 2008). Miocene gold related magmatism in Colombia has been well-recognized in the Western and
Central cordilleras associated with stocks (Sillitoe et al., 1982; Toussaint and Restrepo, 1988; Lodder
et. al, 2010; Lesage et al., 2013). In addition, late Miocene-Pliocene magmatism with gold
mineralization has also been recognized in the Santander Massif in the northern part of the Eastern
Cordillera (Mantilla et al., 2009).

SRK Consulting (U.S.), Inc. NI 43-101 Technical Report – Marmato Project Page 49
MMS/KD Marmato_PEA_NI43-101_544400.020_Rev31_KD.docx November 2019
Source: Modified from the Geological Map of Colombia, 1:1 million scale, Colombian Geological Survey, 2015
Figure 7-1: Regional Geology Map

SRK Consulting (U.S.), Inc. NI 43-101 Technical Report – Marmato Project Page 50
MMS/KD Marmato_PEA_NI43-101_544400.020_Rev31_KD.docx November 2019
7.2 Local Geology
The Marmato gold deposit is hosted by the porphyritic andesitic to dacitic Marmato stock which is 18
km long and 3 to 6 km wide and is elongated north to south (Calle et al., 1984). It intrudes the Arquía
Complex and Amagá Formation on the east side in the Cauca Valley, and the Combia Formation on
the west side. The Marmato gold deposit is hosted in a multiphase porphyry suite, the Marmato
Porphyry Suite, which is about 3.0 km long by 1.6 to 2.5 km wide and is located near the southern end
of the larger Marmato Stock. Five main porphyry pulses have been identified in the Marmato Porphyry
Suite by cross-cutting relationships in core logging and named P1 to P5 from oldest to youngest,
respectively. The ages of the intrusions have been reported recently between 6.58 ± 0.07 Ma to 5.74
± 0.14 Ma by U-Pb LA-ICP-MS of zircon (GCM, 2016, dating carried out by the Brasilia University
Isotope Geochronology Laboratory, Brasil). The Aguas Claras Porphyry Suite is located 3 km
southwest of the Marmato Porphyry Suite and also has five porphyry pulses identified from cross-
cutting relationships in core logging named AP1 to AP5 from oldest to youngest. Two intrusions of the
Marmato Porphyry Suite, P3 and P5, cross-cut the Aguas Claras Porphyry Suite as dikes. There is no
previous dating of the Aguas Claras Porphyry Suite. The local geology map is presented in Figure 7-2.
Source: GCM, 2017
Figure 7-2: Local Geology Map
7.3 Property Geology
The Marmato gold deposit consists of a structurally-controlled epithermal vein system with a mineral
assemblage dominated by pyrite, arsenopyrite, black Fe-rich sphalerite (the type locality for
“marmatite”, Boussingault, 1830), pyrrhotite, chalcopyrite and electrum in the upper zone, and a
mesothermal veinlet system with a mineral assemblage dominated by pyrrhotite, chalcopyrite, bismuth
minerals and visible gold in the MDZ.

SRK Consulting (U.S.), Inc. NI 43-101 Technical Report – Marmato Project Page 51
MMS/KD Marmato_PEA_NI43-101_544400.020_Rev31_KD.docx November 2019
Dacitic and andesitic intrusions at Marmato are characterized by quartz, hornblende, biotite and zoned
plagioclase phenocrysts in a finely crystalline quartz-plagioclase groundmass, with variations in
phenocryst proportion and sizes between intrusions. Intrusion P1 is a main dacitic porphyry stock in
the Marmato Porphyry Suite and is characterized by large β quartz phenocrysts >7 mm. It is cross-cut
by intrusion P2 which corresponds to a porphyry dacite intrusion with fewer and smaller phenocrysts.
Intrusion P3 forms dikes of andesitic porphyry with plagioclase megacrysts >10 mm, and cross-cuts
intrusions P1 and P2 (Figure 7-3). Intrusion P4 is an andesitic porphyry stock which cross-cuts P1, P2
and P3, and is characterized by smaller plagioclase phenocrysts. The youngest porphyry P5 is dacitic
and forms dikes cross-cutting P1. It is characterized by large quartz phenocrysts and elongate
plagioclase phenocrysts. Mineralization is hosted mainly by stocks P1 to P4, while is absent in P5.
Source: GCM, 2019 The deposit outcrops on El Burro Hill and Echandía Hill
Figure 7-3: Cross-Section of the Marmato Gold Deposit Looking NW Showing the Intrusions P1 to P5
Gold mineralization occurs in veins and veinlets with dominant NW and W/NW trends. The deposit
mainly comprises sulfide-rich veinlets and veins composed of minor quartz, carbonate, pyrite,
arsenopyrite, Fe-rich sphalerite (i.e. marmatite), pyrrhotite, chalcopyrite and electrum in the epithermal
upper zone, and quartz, pyrrhotite, chalcopyrite, bismuth sulfide and telluride minerals and free gold
in the mesothermal lower zone. Pervasive early propylitic alteration is over-printed principally by phyllic
and intermediate argillic alteration related to the gold mineralized veins of low to intermediate
sulfidation epithermal type, with weak and patchy potassic (biotite) alteration at depth.

SRK Consulting (U.S.), Inc. NI 43-101 Technical Report – Marmato Project Page 52
MMS/KD Marmato_PEA_NI43-101_544400.020_Rev31_KD.docx November 2019
(a) Low to intermediate sulfidation epithermal style mineralization
(b) Mesothermal style mineralization
Source: GCM, 2017
Figure 7-4: Examples from Drill Core of the Different Mineralization Styles
SRK considers the change in the mineralization style between the higher epithermal style of
mineralization (gold‐silver mineralization mainly hosted by a sheeted pyrite±sphalerite veins) to the

SRK Consulting (U.S.), Inc. NI 43-101 Technical Report – Marmato Project Page 53
MMS/KD Marmato_PEA_NI43-101_544400.020_Rev31_KD.docx November 2019
deeper mesothermal veinlet style (i.e. pyrrhotite±chalcopyrite) to be an important distinction (Figure
7-5). Further drilling and study of the transition zone and deeper areas will be required to increase the
understanding and confidence in the mesothermal geological model to aid estimation to higher levels
of confidence (Indicated and Measured).
In November 2018, a geological site visit was completed to review the MDZ mineralization (Sillitoe,
2019), which concluded the following key aspects:
• Gold grade distribution in the Lower Zone orebody is unrelated to the presence of distinct
porphyry phases and is entirely dependent on the intensity of structurally localised veinlets;
• The only geological parameter than can be used to constrain the grade model is veinlet
intensity, although the presence of visible native gold also acts as a useful grade indicator;
• Potassic alteration, represented chiefly by biotite, is progressively better preserved at depth in
the Lower Zone orebody, raising the possibility that early potassic alteration could also be gold
bearing; however, this possibility remains to be demonstrated; and
• The exclusive structural control of the Lower Zone orebody implies that additional examples
could exist elsewhere within the P1 stock and that they represent a priority exploration target.
Source: GCM, 2017
Figure 7-5: Schematic Cross-Section of the Marmato Gold Deposit, Showing the Two Principal Zones and the Vertical Zonation of Mineralization

SRK Consulting (U.S.), Inc. NI 43-101 Technical Report – Marmato Project Page 54
MMS/KD Marmato_PEA_NI43-101_544400.020_Rev31_KD.docx November 2019
7.3.1 Structure
The dominant northwest and east-west trends of the veins are interpreted to be due to regional tectonic
forces and may have formed as tension fractures related to northwest-southeast compression and
sinistral strike-slip movement on the north-south trending Cauca and Romeral Faults which lie on either
side of the deposit.
In April 2010, the Company commissioned Telluris Consulting Ltd (TCL) to complete a review of the
local and regional geology to define a structural-hydrothermal model for the Marmato deposit. TCL
defined the Marmato deposit as a series of north-northwest to east-west trending steep to moderately
dipping, gold-bearing, sulfide-rich veins hosted in a north-south trending late Miocene porphyry
complex. TCL noted that the porphyry complex was emplaced in folded and thrusted Paleozoic and
Mesozoic metamorphic and sedimentary sequences adjacent to the eastern margin of the broadly
north-south trending Cauca-Romeral terrane accompanied by east northeast to northwest-southeast
compression. This resulted in north-south trending thrust and transpressional structures along with
steep northwest and northeast conjugate fault zones.
Within the relatively young intrusive rocks of the Marmato deposit there are principally two deformation
stages recognized from the TCL study:
• Syn-mineralization west northwest-east southeast compression that reactivated some of the
basement structures as well as generating a range of second order shear and extensional
structures along north northwest to east-west trends as well as north northeast trending
thrusts; and
• Continued post-mineralization compression into the late-Pliocene, (approximately 2 Ma) that
resulted in uplift due to renewed thrusting along the main terrane boundaries forming thrust-
bounded intermontane basins such as the Cauca-Patia depression.
Within the Marmato area, there four principal trends of mineralized structures:
• Northwest trending steep to sub-vertical faults/fractures (140° to 150°N);
• West-northwest trending steep to moderately inclined structures (110° to 120°N);
• East-west trending structures (100° to 090°N) that tend to have moderate to relatively low-
angle dips; and
• East-northeast to northeast-trending structures (065° to 080°N) that show a range of dips.
In addition to these ore-bearing structures, there is a set of north-northeast trending structures of
varying dips that appear to represent different components of a reverse/thrust fault system. Both the
west-northwest and east-west veins tend to splay from the main northwest structures which is
consistent with extensional and Riedel shear components to a sinistral shear system. TCL reported
that kinematic indicators show that mineralization accompanied a phase of west-northwest to east-
southeast orientated compression (Figure 7-6). The north-northeast trending reverse faults and
conjugate fractures reflect this compression component.

SRK Consulting (U.S.), Inc. NI 43-101 Technical Report – Marmato Project Page 55
MMS/KD Marmato_PEA_NI43-101_544400.020_Rev31_KD.docx November 2019
Source: TCL, 2010
Figure 7-6: Telluris Consulting Interpretation of Vein Orientations at Mineros Nacionales
The TCL report suggests the presence of north northeast trending thrust structure at the northwest
limit of the Mineros Nacionales workings which needs further work to be confirmed where possible via
underground access to the structure or considered when interpreting drilling data.
Post-mineral faulting is observed on the margins of some veins and veinlets with alteration to soft,
white clay gouge with ground pyrite (logged as fault gouge, FLG). In some places there is later, coarse
euhedral pyrite in the clay gouge. Brittle fault breccias with no clay gouge are also observed (BXF). In
the Mineros Nacionales mine workings of the Zona Baja it is observed that the northwest trending
veins have competent wall rocks and require no mine support, whereas the east-west trending veins
have faulted wall rock with soft clay fault gouge and require support.
Supergene white clay (intermediate argillic) alteration occurs in the superficial parts of the deposit as
a result of the weathering of propylitic alteration.
Unconsolidated Quaternary sedimentary deposits have been noted from drill data but not modelled in
the current update. These comprise rock scree and landslides, and coarse alluvial gravel in creeks
which include waste rock from artisanal mining. Landslides and alluvial flows are a geological hazard,
especially on the steep southeast face of Cerro El Burro above the town of Marmato. There is saprolitic
weathering and little rock exposure on the higher ground to the north west of Cerro El Burro.
7.3.2 Alteration
Two stages of pervasive alteration have been recognized: early propylitic and later intermediate
argillic. These affect all types of porphyry, although alteration is weak in P5. The propylitic alteration is
characterized by epidote replacement of plagioclase cores, albite replacement of plagioclase rims and
matrix, chlorite replacement of mafics, with disseminated pyrite and pyrrhotite, and varies in intensity

SRK Consulting (U.S.), Inc. NI 43-101 Technical Report – Marmato Project Page 56
MMS/KD Marmato_PEA_NI43-101_544400.020_Rev31_KD.docx November 2019
from veinlet-halo to pervasive. Calcite partially replaces plagioclase where propylitic alteration is
weakly developed. Cross-cutting relationships show evidence for multiple events of propylitic alteration
related to each phase of intrusion.
Intermediate argillic alteration overprints the propylitic alteration and varies in intensity from vein-
/veinlet-halo to pervasive, associated to the intermediate sulfidation mineralization style and replaces
epidote, chlorite and albite. There is a strong but generally narrow halo of white to green illite or sericite
alteration related to veins and veinlets of the mesothermal mineralization event which grades outwards
to pervasive illite, with smectite in distal parts. The main disseminated sulfide is pyrite, although
pyrrhotite and iron-rich sphalerite also occur, which to some extent formed the basis for the previous
model domains.
Additionally, weak and patchy potassic alteration, represented chiefly by biotite occurs at depth in the
MDZ. Progressively better preservation of early potassic alteration at depth may indicate the possibility
of early gold-bearing phases.
7.4 Significant Mineralized Zones
Gold and silver mineralization within the MDZ has been confirmed based on the 2018 and 2019 drilling
programs. The drilling completed to date has defined mineralization at depth within the central portion
of the deposit. SRK has noted a zone of elevated grades which has been referred to as the higher
grade MDZ (more than 2.0 g/t Au). This zone is indicated to be continuous along strike for
approximately 500 m and has a confirmed down dip extent that reaches up to 800 m, with a thickness
that varies between 35 and 150 m. The higher grade MDZ is still open to the east and at depth. It is
possible that the main MDZ mineralization is bounded within a series of faults but limited drilling at the
edges of the deposit make confirmation difficult to assess at this stage

SRK Consulting (U.S.), Inc. NI 43-101 Technical Report – Marmato Project Page 57
MMS/KD Marmato_PEA_NI43-101_544400.020_Rev31_KD.docx November 2019
8 Deposit Type
8.1 Mineral Deposit
The alteration and mineralization in the Upper Zone at Marmato evolved through early stage, higher-
temperature propylitic alteration to later, lower-temperature intermediate argillic alteration, with most
of the gold and silver being deposited in the later stage.
The gold-silver and base metal association in the Upper Zone at Marmato is typical of the intermediate
sulfidation epithermal type. The veins lack typical epithermal textures and the mineralization has a
relatively high depth and temperature of formation, and straddles the deep epithermal to mesothermal
transition as defined by the original classification of Lindgren (1922) and by estimates of formation
temperature of 300°C (Heald et al., 1987). The Marmato deposit lacks known shallow and surface
epithermal features such as lithocaps, sinters and crustiform banded veins.
Mineralization is interpreted to be genetically related to the host porphyritic rocks, as shown by the
inter-mineral timing of the porphyry phases cross-cutting earlier stages of propylitic alteration, the late-
mineral timing of the final dacite P5, and miarolitic cavities lined with propylitic-stage minerals. The
veins and veinlets are structurally controlled and did not form a multi-directional porphyry stockwork
or breccia related to hydro-brecciation. In this model, the host stocks might be considered as late-
mineral intrusions with respect to a postulated porphyry gold-copper-molybdenum centers.
The upper portion of the MDZ has been exposed in Level 21 of the existing GCM mining operations,
while deeper sections have been observed in drillcore, both of which have been confirmed as separate
styles of mineralization. The lowest levels of the mine have currently intersected a combination of the
porphyry domain, where the gold is associated with pyrite veinlets, and the MDZ where gold is
associated with pyrrhotite. Gold grade distribution in the Lower Zone orebody is unrelated to the
presence of distinct porphyry phases and is entirely dependent on the intensity of structurally localised
veinlets. Sillitoe (2019) concluded, that the only geological parameter than can be used to constrain
the grade model is veinlet intensity, although the presence of visible native gold also acts as a useful
grade indicator.
8.2 Geological Model
As part of the updated Mineral Resource, GCM and SRK initially focused on the creation of a more
complete geological model (i.e., one encompassing the major geological features inclusive of the
current veins being mined). The main geological units and entities identified are:
• Vein;
• Porphyry intrusions (P1 to P4);
• Major fault network; and
• Schist country rock.
Drilling during 2011/2012, along with check logging of the drill core by the Company and SRK, has
confirmed the presence of a high-grade feeder zone at the core of the main mineralization (termed the
MDZ). Recent drilling supports the presence of the MDZ and this zone was also incorporated in the
updated model; a schematic diagram of the conceptual model is shown in Figure 8-1.

SRK Consulting (U.S.), Inc. NI 43-101 Technical Report – Marmato Project Page 58
MMS/KD Marmato_PEA_NI43-101_544400.020_Rev31_KD.docx November 2019
Source: SRK, 2019
Figure 8-1: Conceptual Model for the Marmato Deposit, Showing Two Principal Mineralization Zones
Py, Apy, Sph, electrum Au
Py, Mrc, Po, Ccp, electrum Au, native Au
Po, Ccp,Bi, BiXelectrum Au, native Au
SW NE
Epithermal (upper zone)
Limited between epithermal and mesothermal veinlet mineralization
(transition zone)
Inferred boundary of the mesothermal
veinlet mineralization (Deeps Zone)
SRK Consulting (U.S.), Inc. NI 43-101 Technical Report – Marmato Project Page 59
MMS/KD Marmato_PEA_NI43-101_544400.020_Rev31_KD.docx November 2019
9 Exploration This section summarizes the exploration work completed at Marmato to date which varies for the
different zones of the Project due to the different ownership prior to being amalgamated by the
Company. No major regional exploration has been completed since the previous NI 43-101 Technical
Report and therefore this section provides a summary of the historical work completed.
9.1 Relevant Exploration Work
9.1.1 Imagery and Topography
A high-resolution Ikonos satellite image and detailed topographic map with 2 m contour intervals was
produced in early 2007. This map provided a detailed base map for improved accuracy when plotting
the results of the exploration programs. An extension to the Ikonos image and topographic map was
commissioned in 2008 and received in late 2008, and was stitched to the original image and map to
provide seamless products. The extensions were to cover areas for evaluation for possible mining
infrastructure for the Marmato Project, such as waste rock and tailing storage areas, and exploration
drill targets in the Caramanta Project.
9.1.2 Surface Geochemistry
GCM collected 1,880 rock chip samples and 700 soil samples on surface in Echandia, for a total of
2,580 samples. The geochemical samples identified anomalies coincident with low magnetic
anomalies covering an area of about 800 m by 1,100 m in size.
9.1.3 Geophysics
During 2007 and 2008 a helicopter survey which included both magnetic and radiometrics was
completed.
9.1.4 Geological Mapping
Geological mapping at 1:1,000 scale has been carried out on surface, although outcrop exposures are
limited away from the steep face of Cerro El Burro above Marmato.
9.1.5 Underground Mapping
Detailed surveying (total station or theodolite) and geological mapping of the accessible underground
workings within the Zona Alta has been completed where access was available.
GCM which is currently working within the Zona Baja area supplied AutoCAD drawings of mine level
plans and sections for all veins currently being mined. SRK has been supplied with this information for
the current update and utilized the information during the construction of the geological model. The
level plans and information have a degree of time lag as they are not updated on a routine basis (6
monthly) but based on the current production levels at GCM. It is not anticipated that any changes will
have a significant impact on the Mineral Resource Estimate. SRK has used these underground level
maps (Level 16 – Level 21) as the basis for the current interpretation of the veins, which has been
supplemented with information from mining where available. An example of a Level plan is shown in
Figure 9-1.

SRK Consulting (U.S.), Inc. NI 43-101 Technical Report – Marmato Project Page 60
MMS/KD Marmato_PEA_NI43-101_544400.020_Rev31_KD.docx November 2019
Source: GCM, 2019
Figure 9-1: Example of Level Plan from Gran Colombia Gold Marmato (Level 20)
9.2 Sampling Methods and Sample Quality
Two stages of exploration have been completed at Zona Alta. The initial phase used basic hammer
and chisel techniques to cut channels 2 m long and 5 cm wide by 1 cm deep. Due to the relatively poor
quality of sampling, many of these samples were repeated during a second stage of exploration using
a hand-held core saw.
Where access was not possible due to poor ground conditions, the original hand-cut samples have
been retained in the database, but are considered of lower quality for classification purposes. The
Zona Alta area is currently mined by small multiple small-scale mining operations, and the Company
does not have input into the sampling processes user by the miners, or compile an active database of
any sampling within these areas.

SRK Consulting (U.S.), Inc. NI 43-101 Technical Report – Marmato Project Page 61
MMS/KD Marmato_PEA_NI43-101_544400.020_Rev31_KD.docx November 2019
The Company has carried out detailed mapping and sampling of a number of crosscuts within the
current GCM operation. Continuous channel samples were taken where possible. Samples were
initially marked up on the face using paint into 0.5 to 2 m sample intervals. A rock-saw was then used
to create two horizontal parallel cuts across the length of the sample about 6 to 8 cm apart and 2 cm
deep. Then a series of vertical cuts 10 cm apart were made to facilitate breaking the rock. After these
cuts were completed the rock sample was broken using a hammer and chisel, and collected in a
sample bag. The sample width and depth were designed to give a sample weight similar to a split HQ
drill core sample. All samples were logged using the same logging codes as utilized in the diamond
drilling procedures.
SRK reviewed the sampling locations of a large continuous cross-cut during an underground site visit
and is satisfied that the sampling procedures used are in line with industry best practice and no
evidence of selective sampling of higher grade vein material was evident. SRK has therefore accepted
the results from the channel sampling program as acceptable for the definition of Mineral Resources
at Marmato. In the updated database, SRK notes some channel samples from the mine have been
limited to the vein only and are not supported by other channels. It is SRK’s view that these could
impact on the geological model and estimation and therefore should be considered as having lower
confidence. In any underground operation routine sampling compared to selective sampling will
provide the best confidence for the geological models, as it is just as important to know where low
grade exists for mine planning requirements.
All GCM verification sample points were surveyed using either total station of theodolite. A total of
4,285 samples (over 6,699 m) have been taken over 1,431 channels. SRK has integrated these
channels into the database and treated them as horizontal drillholes, with samples cut to sufficient size
to relate to that of a diamond drillhole. SRK considers this approach to be acceptable and has used
this data in producing the resource estimates presented here.
9.3 Significant Results and Interpretation
SRK has reviewed the sampling methods and sample quality for the Marmato Project and is satisfied
that the results are representative of the geological units seen and that acceptable minimal biases
have been identified.
SRK has reviewed the methods employed by the Company during the underground sampling of Zona
Baja which showed clearly marked sampling intervals and associated check sampling. It is SRK’s view
that the sampling intervals and density of samples are adequate for the definition of a compliant Mineral
Resource Estimate. SRK recommends the Company continue with the current underground sampling
program on the lower levels of the GCM mine as per the current exploration program.
There has been a significant increase (100%) in the channel sampling and underground drilling
completed by the Company operated mine as part of the routine grade control procedures, since the
previous model. There are an additional 12,765 channel samples as part of the on-going validation
and capture of historical sampling, and current grade control practices. The increased database allows
for improved details in the geological definition of the veins models, for which it has formed the basis
(Figure 9-2).
The inclusion of the grade control channel samples has aided in the estimation of the vein domains
but has caused a number of issues in the previous methodology used to define the porphyry domain
(within the pyrite zone). The impact of additional short sampling which have been logged typically with

SRK Consulting (U.S.), Inc. NI 43-101 Technical Report – Marmato Project Page 62
MMS/KD Marmato_PEA_NI43-101_544400.020_Rev31_KD.docx November 2019
the lithology “P1”, within the larger indicator-based grade shells could potentially result in the over-
estimation of grade and therefore require further restriction. SRK tested a number of scenarios and
has made additional adjustments for the estimation procedures within the porphyry sampling by
applying filters on the information used during geological modelling and the estimation process. The
adjustments have resulted in a reduction of both tonnage and contained metal within this zone. SRK
has discussed these issues with the GCM geology team and will work on a method to improve the
modelling of these domains in future estimates.
Source: SRK, 2019
Figure 9-2: 2D Plan View of Sampling Data Versus Vein Interpretations, Showing New Sample Data Highlighted in Red, Versus Plan Section of Veins in Blue (Level 1250 M)

SRK Consulting (U.S.), Inc. NI 43-101 Technical Report – Marmato Project Page 63
MMS/KD Marmato_PEA_NI43-101_544400.020_Rev31_KD.docx November 2019
10 Drilling
10.1 Type and Extent
Drillholes, where regularly spaced, are inclined -60 and -75 degrees predominantly to the southwest,
with occasional scissor holes towards the northeast. Fan drilling has been utilized both at surface and
from underground, which are also typically orientated towards the southwest, with a small number of
less extensive fans orientated towards the northeast.
A technical report completed by SRK on September 4, 2011, titled “A NI 43-101 Mineral Resource
Estimate on the Marmato Project, Colombia”, provides in depth detail on the historic drilling programs
(Table 10-1).
For the purpose of the current drilling program the Zona Alta, Zona Baja and Echandia licenses are
referred to collectively as the Marmato license, given the understanding these areas have now largely
been consolidated into a single license (Figure 10-1). New sample data is shown in Figure 10-2.
Table 10-1: Summary of Drilling Completed by Company
Company Series Number of Holes Total Meters
Zona Alta
Compañía Minera de Caldas CMdC 205 46,518.8
Minerales Andinos de Occidente MAdO 150 47,733.6
Zona Alta Subtotal 355 94,252.4
Echandia
Colombia Gold CGD 20 5,937.1
Gran Colombia Resources CGD-GCL 75 11,186.7
Minerales Andinos de Occidente MAdO 65 25,770.2
Echandia Subtotal 160 42,893.9
Zona Baja
Mineros Nacionales CNQ 47 14,873.6
Mineros Nacionales CNQ-MNL 25 1,803.4
Minera Phelps Dodge CNQ-PDG 6 696.0
Minerales Andinos de Occidente MAdO 127 48,286.3
Mineros Nacionales MNL 557 47,078.4
Gran Colombia Exploration GCM 32 14,531.5
Zona Baja Subtotal 794 127,269.0
Grand Total 1,309 264,415.3
Source: SRK, 2019

SRK Consulting (U.S.), Inc. NI 43-101 Technical Report – Marmato Project Page 64
MMS/KD Marmato_PEA_NI43-101_544400.020_Rev31_KD.docx November 2019
Source: SRK 2019
Figure 10-1: Location Map Showing Drillholes Completed at Marmato by Company

SRK Consulting (U.S.), Inc. NI 43-101 Technical Report – Marmato Project Page 65
MMS/KD Marmato_PEA_NI43-101_544400.020_Rev31_KD.docx November 2019
Source: SRK, 2019
Figure 10-2: 3D View of Sampling Data, Showing New Sample Data Highlighted in Red (Looking North)
10.2 Procedures
10.2.1 Summary
All surface hole collars have been surveyed using a Differential Global Positioning System (DGPS)
and have been surveyed to a high degree of confidence in terms of the XY location. Underground
drilling collars have been surveyed by the mines survey department and verified against existing
development.
Down-hole directional surveys were conducted using a GyroSmart digital gyro tool, manufactured by
Flexit Navigation A.B. (Flexit) and Imego A.B. (Imego) of Sweden, which was purchased from Ingetrol.
Prior to the purchase of this instrument in 2007, down-hole directional surveys were conducted using
a Flexit Multishot tool supplied by Terramundo.
GCM constructed a core storage facility at Marmato during 2010 (Figure 10-3), and acts as the main
exploration facility with logging and offices setup also located at the facility. SRK has visited the core
storage facility during multiple site visits and found the facility to be organized and clean, with sufficient
space for the ongoing exploration.

SRK Consulting (U.S.), Inc. NI 43-101 Technical Report – Marmato Project Page 66
MMS/KD Marmato_PEA_NI43-101_544400.020_Rev31_KD.docx November 2019
Source: SRK, 2019
Figure 10-3: Core Storage Facility at Marmato Constructed in 2010, and Current Status 2019
During the drilling campaigns and sample preparation phases several procedures to ensure sample
integrity were employed, including:
• A geological staff member was assigned to each diamond drilling rig;
• A trained technician was assigned to each coring rig to record core recoveries and RQD and
to ensure that core was properly handled and packed after each core run;
• All transport of samples from drill site to the Marmato sample Logging, Preparation and
Storage facility was undertaken by a staff member;
• All splitting and sampling were supervised;
• Prior to sending samples to the laboratory, all sample bags and number strings were checked
for continuity and sample bag integrity;
• All diamond cores were photographed as a routine documentation of samples; and
• Drill core was stored in locally constructed wooden core boxes with painted labels on the end
of each core box detailing box number, drillhole number and sampling intervals.
To confirm that no bias has been introduced, a test program was completed whereby samples of the
cuttings were taken from the core saw tray and sludge samples were taken from the sumps used to
settle out fine solids from the drill water. The settling tanks were installed as part of the environmental
management plan for drilling. The core intervals to which these samples correspond were recorded so
that the cuttings and sludge sample grades can be compared with the average grade for the interval.
10.2.2 Collar Surveys
All hole collars have been surveyed using a DGPS and have been surveyed to a high degree of
confidence in terms of the XY location. Data has been provided to SRK in digital format using UTM
grid coordinates.

SRK Consulting (U.S.), Inc. NI 43-101 Technical Report – Marmato Project Page 67
MMS/KD Marmato_PEA_NI43-101_544400.020_Rev31_KD.docx November 2019
Drillhole collar elevations have been adjusted for errors based on projections on a digital terrain model
(dtm) surveys based on the Ikonos satellite imagery, which gives contour levels every 2 m. It is SRK’s
view that even given the extreme topography found at Marmato that the current procedures site the
collar locations with a sufficient degree of confidence
10.2.3 Drilling Orientation
During the initial exploration, drillholes were regularly spaced and orientated -60 and -75 degrees
predominantly to the south west, with occasional scissor holes towards the north east. More recently
with the focus on the MDZ, the Company has used fan drilling from underground adits, which are also
typically orientated towards the south-west, with a smaller number of less extensive fans orientated
towards the north-east.
Drillholes have been drilled from four purpose-built underground drilling stations with two contractor
rigs being used to date. Three of the drilling stations are located on Level 20 with a single station
established on Level 21. Drillholes have been drilled in a fan pattern and dips ranging from -20 to -75
degrees predominantly to the southwest (ranging from 151º to 255º). Holes targeting the upper
portions of the MDZ have shallower angles while the deeper targeted holes longer (>400 m) and
steeper (Figure 10-4 and Figure 10-5).
In addition to the drilling completed by the GCM exploration team (MT-IU series), the current operating
mine has also completed routine exploration drilling ahead of mining. The routine exploration is
typically completed using horizontal drilling from the existing drives to aid in the mapping and
delineation of the known veins prior to mining.

SRK Consulting (U.S.), Inc. NI 43-101 Technical Report – Marmato Project Page 68
MMS/KD Marmato_PEA_NI43-101_544400.020_Rev31_KD.docx November 2019
Source: SRK, 2019
Figure 10-4: Plan Showing Primary Drilling Orientation to the South and Southwest Relative to the Main Mineralization Orientation at Depth
LegendVeinsFaultsHistorical DrillingNew Drilling
Primary orientation of deep mineralization

SRK Consulting (U.S.), Inc. NI 43-101 Technical Report – Marmato Project Page 69
MMS/KD Marmato_PEA_NI43-101_544400.020_Rev31_KD.docx November 2019
Source: SRK, 2019
Figure 10-5: Cross Section (Orientated Looking Northeast), Showing Orientation of Drilling Relative to the Deep Mineralization, and Horizontal Drilling in the Current Operation
10.3 Interpretation and Relevant Results
The updated drilling database indicates that the veins typically range between 0.5 and 5 m wide and
extend for 250 to 1,000 m along strike, and 150 to 750 m down dip. This is supported by underground
mining which has confirmed that individual vein structures have good geological continuity and can
extend for 100 to 800 m along strike and 100 to at least 300 m down dip. Between 2017 and 2019,
GCM has worked on updating the quantity of the underground channel sampling captured in the
database, which has increased the information available to model the vein domains.
The broad zones of veinlet mineralization in the porphyry domain modelled initially by SRK in 2017
typically varied from 10 to 230 m wide, reaching up to 340 m wide in areas of significant veinlet
accumulation, while extending with good geological continuity for between 200 m and approximately
950 m along strike, and between 100 and 900 m down dip. SRK has updated these domains during
the 2019 geological modelling process using more discrete zones and application of an indicator grade
shell approach using a 0.5 g/t Au CoG.
LegendVeinsFaultsHistorical DrillingNew Drilling

SRK Consulting (U.S.), Inc. NI 43-101 Technical Report – Marmato Project Page 70
MMS/KD Marmato_PEA_NI43-101_544400.020_Rev31_KD.docx November 2019
At depth within the central portion of the deposit, SRK has noted a zone of elevated grades which has
been referred to as the higher grade MDZ (more than 2.0 g/t Au). This zone is indicated to be
continuous along strike for approximately 500 m and has a confirmed down dip extent that reaches up
to 800 m, with a thickness that varies between 35 and 150 m. It is possible that the main MDZ
mineralization is bounded within a series of faults but limited drilling at the edges of the deposit make
confirmation difficult to assess at this stage.

SRK Consulting (U.S.), Inc. NI 43-101 Technical Report – Marmato Project Page 71
MMS/KD Marmato_PEA_NI43-101_544400.020_Rev31_KD.docx November 2019
11 Sample Preparation, Analysis and Security
11.1 Security Measures
The Chain of Custody procedures for sample security were set up for the Company by Dr. Stewart
Redwood in December 2005 (with the latest update in August 2009). During the initial exploration
(2005 to 2006), sample numbers were created in the field based on a combination of the sample
location, sample type and sample point, with descriptions of each sample noted in a field book and
later transcribed. While providing useful information, the decision was taken in 2006 to change to a
sequential numbering system based on preprinted sample tickets. In both cases the sample numbers
have been transcribed on the sample bags to avoid errors (e.g. lost tickets).
At the drill rig, the drilling contractors are responsible for removing the core from the core barrel (using
manual methods), and placing the core in prepared core trays (3 m length). The core is initially cleaned
to remove drilling additives, but attempts are made to ensure fine material is not lost. Once completed,
the core tray is closed with a wooden lid, hammered shut, and GCM geologists or technicians take
possession. The drill core is then transported to the core shed for selection of sampling intervals and
initial sample preparation. On receipt at the core shed, GCM geologists and technicians follow the
logging and sampling procedures laid out in Section 11.2. Once completed and the half core has been
photographed, the core boxes are again sealed and then transported to the onsite core storage facility.
The core storage facility is within a secure area with a single access gate controlled by a 24-hour
security guard.
In preparation for shipment, samples were packed into nylon rice sacks with approximately five
samples per rice sack. The shipments were accompanied with the laboratory submittal forms and were
transported to Medellín. Samples were accumulated at sample dispatch (in the case of historical holes
this was a warehouse in Medellín) until a hole was completed. Drillholes were only submitted in their
entirety once sampling was completed. The samples were transported by GCM employees to the
preparation facilities. Upon reception at the sample preparation facility, the laboratory company
checked that the samples received matched the work order and signed that it had accepted the
samples.
Once the sample preparation was completed, the laboratory dispatched the sample pulps by courier
to selected overseas laboratories. The laboratories were instructed to retain excess sample pulps after
analysis which can be used in the event that check analyses are requested by GCM.
The coarse sample rejects and sample pulps from the preparation facilities in Medellín were picked up
by GCM technicians during routine sample shipments to the preparation facilities. The coarse rejects
and pulps were returned to the GCM core shed at Marmato for long-term storage.
11.2 Sample Preparation for Analysis
11.2.1 Historical Sample Preparation (Pre 2010)
Prior to the opening of the Inspectorate and SGS sample preparation laboratories in Medellín in
August 2006 and November 2007, respectively, there were no internationally certified sample
preparation laboratories for mineral exploration in Colombia. At the start of exploration work by GCM,
all samples had to be sent to other countries to be prepared and analyzed. Entire rock samples were
sent by air to Inspectorate in Sparks, Nevada (ISO 9001:2000 and ISO 9002:1994 certified) for

SRK Consulting (U.S.), Inc. NI 43-101 Technical Report – Marmato Project Page 72
MMS/KD Marmato_PEA_NI43-101_544400.020_Rev31_KD.docx November 2019
preparation and analysis, or to ALS Chemex in Quito, Ecuador (ISO 9001:2000 and ISO 17025:2005
certified) for preparation, with analysis by ALS Chemex in Lima. ALS Chemex in Reno, Nevada was
also used for some check analyses.
The Sparks analytical laboratory was used until late 2007; however, considerable QA/QC problems
were experienced during 2007 as well as long delays in turnaround time, and since late 2007 to 2010
the Lima analytical laboratory was used. The analyses from Inspectorate’s Sparks laboratory which
failed QA/QC were repeated. Other samples analyzed initially at Inspectorate’s Sparks laboratory were
re-analyzed at Inspectorate’s Lima, Peru laboratory. Only sample batches that passed QA/QC were
accepted and stored in the final database.
The secondary laboratory used was SGS (ISO 9001 certified) at a sample preparation facility in
Medellín, and at their analytical laboratory run by SGS del Perú S.A.C., El Callao, Lima. Inspectorate
is used as the laboratory for check on any SGS submissions and replicate assays of samples analyzed
initially at SGS del Peru S.A.C in Callao, Lima, Peru.
The sample preparation at the Inspectorate laboratory in Medellín consisted of drying the entire sample
and crushing it to >70% passing -10 mesh by jaw crusher and roll mill. This was later changed to >85%
passing -10 mesh using a TM Terminator Jaw Crusher. A split of 250 to 500 g was then obtained using
a Jones splitter and was pulverized to >80% passing -150 mesh with Labtech LM2 pulverizing ring
mill. Tested barren silica sand was used as a clean wash between each sample in pulverization.
The sample preparation procedures at the SGS laboratory in Medellín and SGS Colombia S.A. facility
in Barranquilla, comprised drying the sample, crushing the entire sample in two stages to -6 mm and
-2 mm by jaw crusher (>95% passing), riffle splitting the sample to 250 to 500 g, and pulverizing the
split to >95% passing -140 mesh in 800 cm3 chrome steel bowls in a Labtech LM2 pulverizing ring mill
(preparation code 321).
The sample preparation method at the Inspectorate laboratory in Sparks, Nevada was to dry and crush
the entire sample to >85% passing -10 mesh by TM Terminator Jaw Crusher, spilt 250 g to 300 g using
a Jones splitter and pulverize this to >90% passing -150 mesh with a Labtech LM2 pulverizing ring
mill. Tested barren silica sand was used as a clean wash between each sample in pulverization (rock
chip 0 to 10 lb method).
The sample preparation procedure at the ALS Chemex laboratory in Quito was to log the sample into
the tracking system, weigh, dry, crush the entire sample to >70% passing 2 mm, split off up to 1.5 kg
and then pulverize the split to >85% passing 75 microns (code PREP-32).
11.2.2 Sample Preparation (2010 – 2017)
The sample preparation method at the internal GCM mine laboratory comprise drying the sample,
crushing the entire sample to minus 5 mm by jaw crusher (>95% passing), riffle splitting a sub-sample
of 200 to 300 g, and pulverizing the sub-sample in a disc mill to >80% passing -200 mesh. SRK visited
the facility during the 2017 site inspection, and noted new equipment had been purchased and was
not currently in use at the time of visit (Figure 11-1). The new equipment was consistent with those
used at the third-party commercial laboratory. One issue noted during the site inspection is the stacking
of sample trays (full) prior to pulverizing, which SRK does not consider to be best practice as this could
result in cross contamination of samples. Ideally sample should be stacked on individual trays on a
trolley as shown in Figure 11-1.

SRK Consulting (U.S.), Inc. NI 43-101 Technical Report – Marmato Project Page 73
MMS/KD Marmato_PEA_NI43-101_544400.020_Rev31_KD.docx November 2019
Since January 2010, the primary laboratory used for the exploration samples in the drill and
underground sampling programs was ACME Laboratories for sample preparation in Medellín, and
analytical laboratories in Sparks, Nevada, USA and Lima, Peru. The 2011 drill program utilized the
ACME sample preparation laboratory in Medellín and the ACME assay laboratory in Santiago, Chile.
In addition, the SGS laboratory in Lima, Peru was used as a check laboratory.
SRK visited the ACME sample preparation facilities on November 4, 2010. The sample preparation
method at ACME, Medellín was to dry the sample in large controlled and crush the entire sample to
>85% passing -10 mesh by TM Terminator Jaw Crusher (Figure 11-2).
The sample is then spilt to 250 to 300 g using a Jones splitter and pulverized to >90% passing -150
(75 µm) mesh with a Labtech LM2 pulverizing ring mill.
Tested barren silica sand was used as a clean wash between each sample in the crushing and
pulverization stages (rock chip 0 to 10 lb method).
Source: SRK, 2017
Figure 11-1: Sample Preparation at Mine Laboratory Showing New Equipment (Crusher and Pulverizer)

SRK Consulting (U.S.), Inc. NI 43-101 Technical Report – Marmato Project Page 74
MMS/KD Marmato_PEA_NI43-101_544400.020_Rev31_KD.docx November 2019
Showing: (a) Terminator Jaw Crusher; (b) Jones Riffle Splitter; (c) LM2 Mill; and (d) Final Bar-Coded Sample Pulp. Source: SRK, 2010
Figure 11-2: Sample Preparation Facilities at ACME Laboratories in Medellín
11.2.3 Sample Preparation (2017 – Current)
Since 2017 GCM has used SGS Laboratories in Medellin is the primary labatory for both sample
preparation and analyzing all exploration drilling core samples. All GCM mine drilling have undergone
preparation and analysis at ALS Laboratory, to ensure sample quality. GCM has incorporated routine
check analysis on each laboratory with secondary assays at ALS for the SGS submissions and vice-
versa.
(a) (b)
(c) (d)

SRK Consulting (U.S.), Inc. NI 43-101 Technical Report – Marmato Project Page 75
MMS/KD Marmato_PEA_NI43-101_544400.020_Rev31_KD.docx November 2019
Samples sent to SGS were prepared using method PRP93, which involved drying in oven at 100°C
followed by jaw crushing. The sample was crushed to 90% passing -10 mesh size. The crusher was
cleaned with compressed air between samples. A 250 g split, using a Jones splitter, was pulverized to
95% passing -140 mesh using a ring and puck pulverizer
11.3 Sample Analysis
The ACME laboratory in Santiago analyzed the samples (from the 2010-2012 drill programs) for gold
by fire assay (FA) with atomic absorption spectrophotometer (AAS) finish. Samples over 10 g/t Au
were assayed by FA with gravimetric finish. Silver was assayed by aqua regia digestion and AAS
finish. Silver samples above 100 g/t were assayed by FA with gravimetric finish.
The historical samples by Conquistador (one of the previous owners) have been assayed by Barringer
for gold by FA with atomic absorption (AA) finish, and checks by gravimetric finish for some high grade
samples. Silver was determined by acid digestion with AA finish.
A detailed description of the sample analytical procedure undertaken for the 2011 SRK Mineral
Resource Estimate (January 2011) and is provided, given the incorporation of these samples in to the
current estimate:
The Inspectorate laboratory in Lima analyzed the samples for gold by FA with an AA finish (detection
limits 0.005 ppm to 3 ppm, method FA/AAS). Silver was analyzed by aqua regia digestion and AA
finish (method AA, detection limits 0.2 to 200 ppm). Over-limit gold assays (above 3,000 ppb or 3.0
ppm) were repeated by FA (1 assay ton, 29.2 g) with gravimetric finish (method Au FA/GRAV).
Samples above a 200 g/t silver upper limit of detection were repeated by FA (1 assay ton, 29.2 g) with
gravimetric finish (method Ag FA/GRAV). Samples were analyzed for multiple elements by aqua regia
digestion and inductively coupled plasma (ICP) finish (32 Element ICP Package for Ag, Al*, As, Ba*,
Bi, Ca*, Cd, Co, Cr*, Cu, Fe, Hg, K*, La*, Mg*, Mn, Mo, Na*, Ni, P, Pb, S*, Sb*, Se, Sn*, Sr*, Te*, Ti,
Tl*, V, W, Zn). Inspectorate states that for elements marked * the digestion is partial in aqua regia in
most silicate matrices and the analysis is partial. Over-limit zinc and lead analyses (more than 10,000
ppm) were rerun by aqua regia digestion and AA. Multi-element analyses were not carried out on the
final batches of samples.
The Inspectorate laboratory in Sparks, Nevada analyzed samples for gold and silver by FA with an AA
finish for gold (detection limits 2 ppb to 3,000 ppb) and AA finish for silver (detection limits 0.1 ppm to
200 ppm) (method Au, Ag FA/AA/AAS). Over-limit gold assays (above 3,000 ppb or 3.0 g/t) were
repeated by FA with gravimetric finish (method Au FA/GRAV). Samples above a 200 ppm silver upper
limit of detection were repeated by FA with gravimetric finish (method Ag FA/GRAV). Samples were
analyzed for multi-elements by aqua regia digestion and ICP finish (30 Element ICP Package for Ag,
Al*, As, B*, Ba*, Bi, Ca*, Cd, Co, Cr*, Cu, Fe, Hg, K*, La*, Mg*, Mn, Mo, Na, Ni, P, Pb, Sb*, Se, Sr*,
Ti, Tl*, V, W, Zn). Inspectorate states that for elements marked * the digestion is partial in aqua regia
in most silicate matrices and the analysis is partial. Over-limit zinc and lead analyses (>10,000 ppm)
were rerun by aqua regia digestion and AA.
SGS del Perú S.A.C. analyzed samples for gold by FA (30 g sample) with an AA finish (code FAA313;
detection limits 0.005 ppm to 10 ppm), and for silver with an aqua regia digestion and an AAS finish
(code AAS12CP), or three acid digestion with AAS finish (code AAS42C); detection limits in both are
0.3 ppm to 500 ppm). Multi-element geochemical analyses were done by two different methods. One
method (ICM40B) uses a four acid digestion and both ICP-AES and ICP-MS for 50 elements (Ag, Al,

SRK Consulting (U.S.), Inc. NI 43-101 Technical Report – Marmato Project Page 76
MMS/KD Marmato_PEA_NI43-101_544400.020_Rev31_KD.docx November 2019
As, Ba*, Be*, Bi, Ca*, Cd, Ce, Cr*, Co, Cs, Cu, Fe*, Ga*, Ge*, Hf*, In*, K*, La*, Li*, Lu*, Mg*, Mn*, Mo,
Na*, Nb*, Ni*, P*, Pb, Rb*, S*, Sb, Sc*, Se, Sn*, Sr*, Ta*, Tb, Te*, Th*, Ti*, Tl*, U*, V*, W*, Y*, Yb*,
Zn*, Zr*), elements marked * the digestion is partial.
The second method (ICP12B) uses a two acid (HNO3 and HCl) digestion and both ICP-AES and ICP-
MS for 38 elements (Ag, Al, As, Ba*, Be*, Bi, Ca*, Cd, Co, Cr*, Cu, Fe*, Ga*, Hg, K*, La*, Mg*, Mn*,
Mo, Na*, Nb*, Ni*, P*, Pb, S*, Sb, Sc*, Sn*, Sr*, Ti*, Tl*, V*, W*, Y*, Zn*, Zr*), elements marked * the
digestion is partial. SGS indicates that the analysis is partial for elements marked * and depends on
the mineralogy. Over limit gold values were repeated by FA with a gravimetric finish (method FAG303)
and a lower limit of detection of 0.02 g/t. Silver grades above 100 ppm and zinc grades above 1% were
repeated by four acid digestion and AA (method AAS41B). Gold and silver for some samples was by
FA with gravimetric finish on 30 g (method FAG323 with lower limit of detection of 0.03 g/t gold and
0.03 g/t silver).
Since 2017 GCM has used SGS Laboratories in Medellin is the primary labatory for both sample
preparation and analyzing all exploration drilling core samples. Samples have been analysed at each
laboratory for gold and silver by FA. At SGS the assaying using a Au 30 g AAS (method FAA313). All
GCM mine drilling have undergone preparation and analysis at ALS Laboratory, to ensure sample
quality. GCM has incorporated routine check analysis on each laboratory with secondary assays at
ALS for the SGS submissions and vice-versa.
The GCM channel samples have been assayed at an onsite internal mine laboratory for gold and silver
by FA with gravimetric finish. SRK reviewed the laboratory and noted some areas of improvement
relating to the state of the equipment. The mine has recently purchased new sample preparation
equipment, which should result in improved assay quality. SRK recommends GCM complete routine
check analysis between the Mine Laboratory and an independent commercial laboratory in Medellín.
SRK recommends that all exploration samples are kept clear of the mine laboratory to avoid any
potential contamination.
11.4 Quality Assurance/Quality Control Procedures
SRK completed a detailed review of the Quality Assurance/Quality Control (QA/QC) procedures and
results as part of the 2012 MRE. The results are summarized in the current report as limited drilling
has been completed between 2012 and 2017.
The routine QA/QC program at Marmato comprises certified standard reference materials (CRM),
quartz blanks, preparation duplicates (PD), Coarse Duplicates (CD), field duplicates (FD) and check
and replicate assays. The CRM, quartz sand blanks and Duplicate samples make up that portion of
the QA/QC program which provides ongoing monitoring of the geochemical laboratories. The check
assay and replicate assay samples are submitted at longer time intervals (less frequently) and provide
a secondary control on the accuracy of the geochemical data.
Sampling protocols suggest the following submission rates:
• For the CRM, five random numbers are generated between 1 and 100;
• For the FD samples, two random numbers are generated between 1 and 100;
• For the PD samples, two random numbers are generated between 1 and 100; and

SRK Consulting (U.S.), Inc. NI 43-101 Technical Report – Marmato Project Page 77
MMS/KD Marmato_PEA_NI43-101_544400.020_Rev31_KD.docx November 2019
• In contrast, the blanks are inserted at points within the sample stream where, based on the
geology, the geologist believes that there is a high likelihood of significant mineralization, and
therefore potential for contamination.
GCM employed a database administrator of the QA/QC program at Marmato, during this period. SRK
held discussions with the database administrator during the site visit to review how the data was
captured.
SRK has been supplied with a complete QA/QC assay database for the Project in two separate excel
files which summarize the submissions in 2018 and 2019 (up to borehole MT-IU-031). Within the
2018/2019 exploration period when the majority of the drilling has been completed by GCM a total of
510 certified standards, 412 blanks and 624 duplicates, representing approximately 15% of total
routine sample submissions for the GCM drilling programs at Marmato to SGS. Additionally GCM a
total of 73 certified standards, 58 blanks and 57 duplicates, representing approximately 13 % of total
sample routine submissions for the GCM drilling programs at Marmato to ALS. In addition to the
duplicates a series of reassays and check assays have been completed using alternative laboratories
(SGS vs ALS). In 2018 a total of 188 assays along with associated QA/QC were re-assayed from SGS
submissions, and 42 reassays from ALS submissions. In 2019 a total of 33 re-assays have been
selected to date from SGS submissions. The pulp and reject check programs represent a total of 475
and 476 submissions respectively. SRK considers the level of QA/QC submissions to be of acceptable
levels for the current stage of the Project.
A summary of the breakdown per sample type and laboratory are shown in Table 11-1 (2018) and
Table 11-2 (2019).
Table 11-1: Summary Of QA/QC Sample Submissions During 2018 Submissions To SGS And ALS Laboratories
Marmato Exploration
Original Shipments
Sent Shipments Received Analysis QAQC
Laboratory Shipments Samples Shipments Samples Standard Blanks Duplicates
SGS 29 4530 29 4530 224 178 275
ALS 10 909 10 909 46 36 36
Re-Analysis Shipments
Sent Shipments Received Analysis QAQC
Laboratory Shipments Samples Shipments Samples Standard Blanks Duplicates
SGS 6 203 6 203 12 0 1
ALS 3 46 3 46 3 0 1
Source: GCM, 2018

SRK Consulting (U.S.), Inc. NI 43-101 Technical Report – Marmato Project Page 78
MMS/KD Marmato_PEA_NI43-101_544400.020_Rev31_KD.docx November 2019
Table 11-2: Summary Of QA/QC Sample Submissions During 2019 Submissions To SGS And ALS Laboratories (Up to MT-IU-031)
Marmato Exploration
Original Shipments
Sent Shipments Received Analysis QAQC
Laboratory Shipments Samples Shipments Samples Standard Blanks Duplicates
SGS 48 5848 48 5848 286 234 349
ALS 7 526 7 526 27 22 21
Re-Analysis Shipments
Sent Shipments Received Analysis QAQC
Laboratory Shipments Samples Shipments Samples Standard Blanks Duplicates
SGS 3 36 3 36 3 0 0
ALS 2 21 2 21 1 1 2
Source: GCM, 2019
11.4.1 Standards
In the 2018/19 program, 510 Certified Reference Material (Standards) were submitted during routine
summissions to SGS and 73 with ALS submissions.
A summary of the submissions is shown in Table 11-3. In the submissions to SGS, SRK concluded
the majority of standards had a greater number of overestimations than underestimations. The
discrepancies noted are likely to be due to occasional laboratory issues, however this has not resulted
in a material bias overall.
SRK has reviewed the CRM results and is satisfied that they demonstrate a high degree of accuracy
at the assaying laboratory and hence give sufficient confidence in the assays for these to be used to
derive a Mineral Resource estimate. GCM has utilized CRM from Geostats Pty Ltd., Rocklabs, and
OREAS. In 2018/19, 22 CRM’s were inserted into the sample stream; of these, four (10.5%) were
identified by GCM as being erroneous (i.e., values exceeded three standard deviations from the
recommended value).

SRK Consulting (U.S.), Inc. NI 43-101 Technical Report – Marmato Project Page 79
MMS/KD Marmato_PEA_NI43-101_544400.020_Rev31_KD.docx November 2019
Table 11-3: Summary of CRM’s Submitted During Routine Assay Submissions
STM_NAME StdValue SD1Low SD1High SD2Low SD2High SD3Low SD3High
G310-6 0.65 0.61 0.69 0.57 0.73 0.53 0.77
G312-4 5.3 5.08 5.52 4.86 5.74 4.64 5.96
G313-1 1 0.95 1.05 0.9 1.1 0.85 1.15
G313-2 2.04 1.97 2.11 1.9 2.18 1.83 2.25
G314-1 0.75 0.71 0.79 0.67 0.83 0.63 0.87
G314-5 5.29 5.12 5.46 4.95 5.63 4.78 5.8
G315-2 0.98 0.94 1.02 0.9 1.06 0.86 1.1
G914-6 3.21 3.09 3.33 2.97 3.45 2.85 3.57
G914-9 16.77 16.29 17.25 15.81 17.73 15.33 18.21
G915-5 17.95 17.09 18.81 16.23 19.67 15.37 20.53
G915-6 0.67 0.63 0.71 0.59 0.75 0.55 0.79
OREAS-15Pc 1.61 1.571 1.649 1.532 1.688 1.493 1.727
OREAS-60P 2.6 2.56 2.64 2.52 2.68 2.48 2.72
OREAS-62Pa 9.64 9.56 9.72 9.48 9.8 9.4 9.88
OREAS-67A 2.238 2.142 2.334 2.046 2.43 1.95 2.526
SH35 1.323 1.279 1.367 1.235 1.411 1.191 1.455
SH82 1.333 1.306 1.36 1.279 1.387 1.252 1.414
SJ80 2.656 2.599 2.713 2.542 2.77 2.485 2.827
SK94 3.899 3.815 3.983 3.731 4.067 3.647 4.151
SN91 8.679 8.485 8.873 8.291 9.067 8.097 9.261
SP73 18.17 17.75 18.59 17.33 19.01 16.91 19.43
SQ88 39.723 38.776 40.67 37.829 41.617 36.882 42.564
Source: SRK, 2019
SRK has reviewed the results with the majority of the assays reporting within the desired two standard
deviation limits which have been summarized in Figure 11-3 and Figure 11-4 below. SRK has analyzed
each CRM in both summary and timeline form (example shown in Figure 11-5). The charts indicate
that in general the laboratories have performed within the 2 standard deviation warning lines for each
of the different CRM’s, with no evidence of any high or low bias.

SRK Consulting (U.S.), Inc. NI 43-101 Technical Report – Marmato Project Page 80
MMS/KD Marmato_PEA_NI43-101_544400.020_Rev31_KD.docx November 2019
Source: SRK, 2019
Figure 11-3: Summary Of CRM Submissions To ALS In 2018/2019 Program, Showing All Submissions (Left), And CRM’s Below 8.0 G/T Au (Right)
0
2
4
6
8
10
12
14
16
18
20
0 2 4 6 8 10 12 14 16 18 20
Ass
ay
Au
(g/
t)
Expected Value Au (g/t)
Summary of CRM Submissions to ALS (2018/19)
Assay
- 2 SD
+2 SD
0.0
1.0
2.0
3.0
4.0
5.0
6.0
7.0
8.0
0.0 1.0 2.0 3.0 4.0 5.0 6.0 7.0 8.0
Ass
ay
Au
(g/
t)
Expected Value Au (g/t)
Summary of CRM Submissions to ALS (2018/19) - Less than 8.0 g/t
Assay
- 2 SD
+2 SD
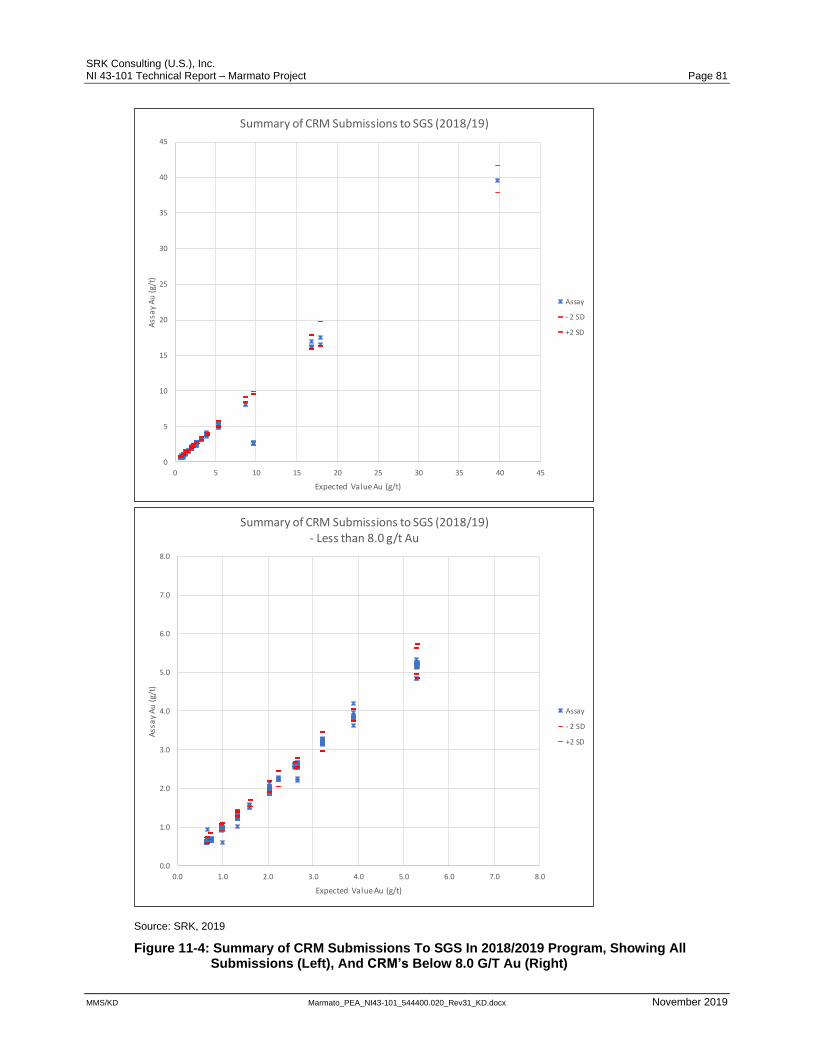
SRK Consulting (U.S.), Inc. NI 43-101 Technical Report – Marmato Project Page 81
MMS/KD Marmato_PEA_NI43-101_544400.020_Rev31_KD.docx November 2019
Source: SRK, 2019
Figure 11-4: Summary of CRM Submissions To SGS In 2018/2019 Program, Showing All Submissions (Left), And CRM’s Below 8.0 G/T Au (Right)
0
5
10
15
20
25
30
35
40
45
0 5 10 15 20 25 30 35 40 45
Ass
ay
Au
(g/
t)
Expected Value Au (g/t)
Summary of CRM Submissions to SGS (2018/19)
Assay
- 2 SD
+2 SD
0.0
1.0
2.0
3.0
4.0
5.0
6.0
7.0
8.0
0.0 1.0 2.0 3.0 4.0 5.0 6.0 7.0 8.0
Ass
ay
Au
(g/
t)
Expected Value Au (g/t)
Summary of CRM Submissions to SGS (2018/19) - Less than 8.0 g/t Au
Assay
- 2 SD
+2 SD

SRK Consulting (U.S.), Inc. NI 43-101 Technical Report – Marmato Project Page 82
MMS/KD Marmato_PEA_NI43-101_544400.020_Rev31_KD.docx November 2019
Source: SRK, 2019
Figure 11-5: Example of Timeline Review Of CRM G315-2 and SK94 Submissions
11.4.2 Blanks
Blanks are inserted at points within the sample stream where, based on the geology, the geologist
believes that there is a high likelihood of significant or high-grade mineralization, and therefore
potential for contamination. Coarse and Fine blank samples are submitted (412 in total) to both SGS
and ALS (Figure 11-6 to Figure 11-9) the results have been reviewed to check for any potential
evidence of contamination. SRK comments that no evidence has been noted with limited samples
reporting above a value of 0.02 g/t Au.
0.00
0.20
0.40
0.60
0.80
1.00
1.20
Co
nce
ntr
atio
n
Assay Number
CRM Example
Result Value Std Value 2 Std Dev 3 Std Dev
0.00
0.50
1.00
1.50
2.00
2.50
3.00
3.50
4.00
4.50
Co
nce
ntr
atio
n
Assay Number
CRM Example
Result Value Std Value 2 Std Dev 3 Std Dev

SRK Consulting (U.S.), Inc. NI 43-101 Technical Report – Marmato Project Page 83
MMS/KD Marmato_PEA_NI43-101_544400.020_Rev31_KD.docx November 2019
Source: SRK, 2019
Figure 11-6: ALS Coarse Blank Submissions
Source: SRK, 2019
Figure 11-7: SGS Coarse Blank Submissions
0.00
0.02
0.04
0.06
0.08
0.10
0.12
0.14
0.16
0.18
0.20
Co
nce
ntr
atio
n
Assay DateExample%
Result Value Blk Value 2DL 5DL
ALS Submissions
0.00
0.02
0.04
0.06
0.08
0.10
0.12
0.14
0.16
0.18
0.20
Co
nce
ntr
atio
n
Assay DateExample%
Result Value Blk Value 2DL 5DL
SGS Submissions

SRK Consulting (U.S.), Inc. NI 43-101 Technical Report – Marmato Project Page 84
MMS/KD Marmato_PEA_NI43-101_544400.020_Rev31_KD.docx November 2019
Source: SRK, 2019
Figure 11-8: ALS Fine Blank Submissions
Source: SRK, 2019
Figure 11-9: SGS Fine Blank Submissions
The Company has submitted three different types of duplicates during the routine sample submissions.
The three different types have been defined as Field Duplicates, Coarse Duplicates and Pulp
Duplicates. The field duplicates have only been submitted with the exploration drilling submitted to
SGS with no duplicates in the mine drilling programs to ALS. A total of 223 field duplicates have been
analyzed. The difference in the mean grades from the two data populations is 4% higher in the
0.00
0.02
0.04
0.06
0.08
0.10
0.12
0.14
0.16
0.18
0.20
Co
nce
ntr
atio
n
Assay DateExample%
Result Value Blk Value 2DL 5DL
ALS Submissions
0.00
0.02
0.04
0.06
0.08
0.10
0.12
0.14
0.16
0.18
0.20
Co
nce
ntr
atio
n
Assay DateExample%
Result Value Blk Value 2DL 5DL
SGS Submissions
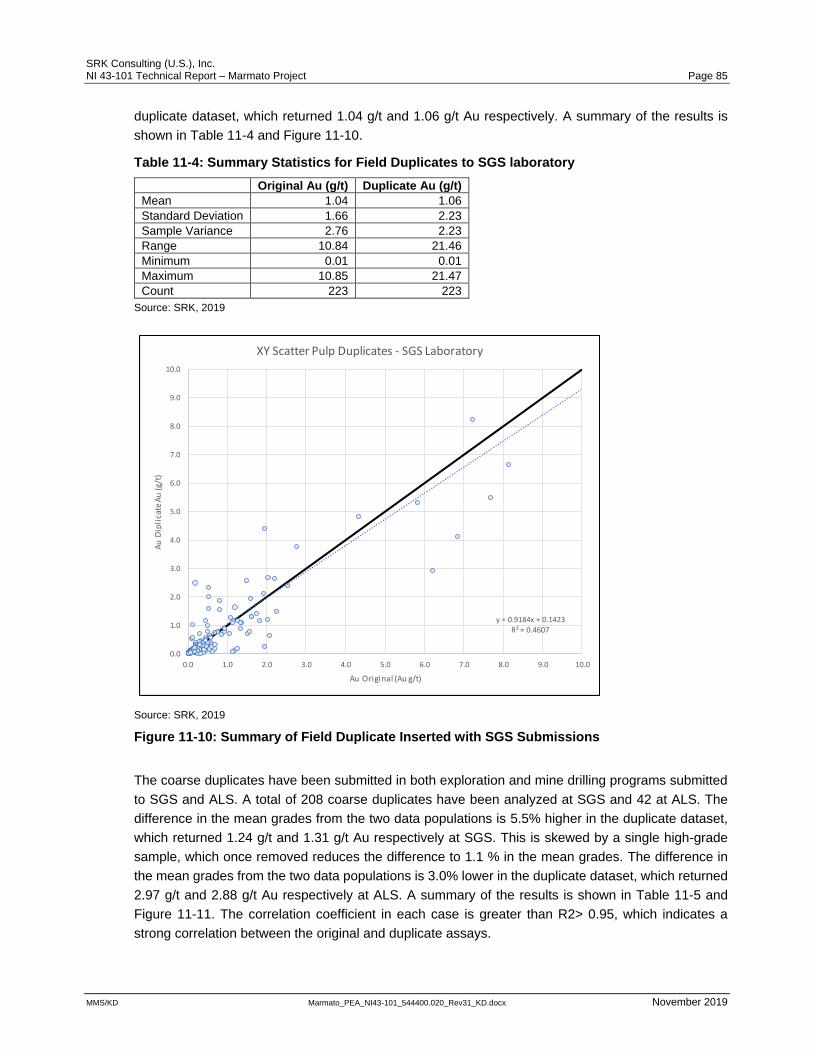
SRK Consulting (U.S.), Inc. NI 43-101 Technical Report – Marmato Project Page 85
MMS/KD Marmato_PEA_NI43-101_544400.020_Rev31_KD.docx November 2019
duplicate dataset, which returned 1.04 g/t and 1.06 g/t Au respectively. A summary of the results is
shown in Table 11-4 and Figure 11-10.
Table 11-4: Summary Statistics for Field Duplicates to SGS laboratory
Original Au (g/t) Duplicate Au (g/t)
Mean 1.04 1.06
Standard Deviation 1.66 2.23
Sample Variance 2.76 2.23
Range 10.84 21.46
Minimum 0.01 0.01
Maximum 10.85 21.47
Count 223 223
Source: SRK, 2019
Source: SRK, 2019
Figure 11-10: Summary of Field Duplicate Inserted with SGS Submissions
The coarse duplicates have been submitted in both exploration and mine drilling programs submitted
to SGS and ALS. A total of 208 coarse duplicates have been analyzed at SGS and 42 at ALS. The
difference in the mean grades from the two data populations is 5.5% higher in the duplicate dataset,
which returned 1.24 g/t and 1.31 g/t Au respectively at SGS. This is skewed by a single high-grade
sample, which once removed reduces the difference to 1.1 % in the mean grades. The difference in
the mean grades from the two data populations is 3.0% lower in the duplicate dataset, which returned
2.97 g/t and 2.88 g/t Au respectively at ALS. A summary of the results is shown in Table 11-5 and
Figure 11-11. The correlation coefficient in each case is greater than R2> 0.95, which indicates a
strong correlation between the original and duplicate assays.
y = 0.9184x + 0.1423R² = 0.4607
0.0
1.0
2.0
3.0
4.0
5.0
6.0
7.0
8.0
9.0
10.0
0.0 1.0 2.0 3.0 4.0 5.0 6.0 7.0 8.0 9.0 10.0
Au
Dip
lica
te A
u (
g/t)
Au Original (Au g/t)
XY Scatter Pulp Duplicates - SGS Laboratory

SRK Consulting (U.S.), Inc. NI 43-101 Technical Report – Marmato Project Page 86
MMS/KD Marmato_PEA_NI43-101_544400.020_Rev31_KD.docx November 2019
Table 11-5: Summary Statistics for Coarse Duplicates to SGS and ALS Submissions (Au g/t)
SGS Submissions ALS Submissions
Original Au
(g/t) Duplicate Au (g/t) Original Au (g/t) Duplicate Au (g/t)
Mean 1.24 1.31 2.97 2.88
Standard Deviation 2.42 2.87 4.16 4.11
Sample Variance 5.87 8.21 17.27 16.90
Range 17.48 28.68 20.86 20.14
Minimum 0.00 0.00 0.04 0.06
Maximum 17.48 28.68 20.90 20.20
Sum 258.36 272.69 124.75 120.98
Count 208 208 42 42
Source: SRK, 2019
Source: SRK, 2019
Figure 11-11: Summary of Coarse Duplicate Submissions to SGS (left) and ALS (right)
The pulp duplicates have been submitted in both exploration and mine drilling programs submitted to
SGS and ALS. A total of 209 pulp duplicates have been analyzed at SGS and 46 at ALS. The difference
in the mean grades from the two data populations is 1.2% higher in the duplicate dataset, which
returned 1.03 g/t and 1.04 g/t Au respectively at SGS. The difference in the mean grades from the two
data populations is 1.3% lower in the duplicate dataset, which returned 1.44 g/t and 1.42 g/t Au
respectively at ALS. A summary of the results is shown in Table 11-6 and Figure 11-12.
Table 11-6: Summary Statistics for Coarse Duplicates to SGS and ALS Submissions (Au g/t)
SGS Submissions ALS Submissions
Original Au (g/t) Duplicate Au (g/t) Original Au (g/t) Duplicate Au (g/t)
Mean 1.03 1.04 1.44 1.42
Standard Deviation 1.83 1.80 2.27 2.28
Sample Variance 3.33 3.24 5.17 5.22
Range 17.14 16.57 10.61 11.76
Minimum 0.01 0.01 0.04 0.04
Maximum 17.15 16.58 10.65 11.80
Sum 214.35 217.00 66.24 65.38
Count 209 209 46 46
Source: SRK, 2019
y = 1.137x - 0.1013R² = 0.924
y = 0.9817x + 0.0338R² = 0.9844
0.0
2.0
4.0
6.0
8.0
10.0
12.0
14.0
16.0
18.0
0.0 2.0 4.0 6.0 8.0 10.0 12.0 14.0 16.0 18.0
Au
Dip
lica
te A
u (
g/t)
Au Original (Au g/t)
XY Scatter Coarse Duplicates - SGS Laboratory
y = 0.9675x + 0.0067R² = 0.9566
0.0
2.0
4.0
6.0
8.0
10.0
12.0
14.0
16.0
18.0
20.0
22.0
0.0 2.0 4.0 6.0 8.0 10.0 12.0 14.0 16.0 18.0 20.0 22.0
Au
Dip
lica
te A
u (
g/t)
Au Original (Au g/t)
XY Scatter Coarse Duplicates - ALS Laboratory

SRK Consulting (U.S.), Inc. NI 43-101 Technical Report – Marmato Project Page 87
MMS/KD Marmato_PEA_NI43-101_544400.020_Rev31_KD.docx November 2019
Source: SRK, 2019
Figure 11-12: Summary of Pulp Duplicate Submissions to SGS (left) and ALS (right)
11.4.3 Reassays
The Company has completed two reassay programs on the 2018 and 2019 submissions respectively.
These represent resubmission of samples to a secondary laboratory (SGS to ALS and vice-versa). In
2018 a total of 188 sample pulp were reanalyzed from SGS samples which returned similar values
across all grade ranges. A total of 42 ALS submissions were reassayed during the same period which
return similar results.
The difference in the mean grades from the two data populations is 1.6 % lower in the reassay dataset,
which returned 1.09 g/t and 1.08 g/t Au respectively in the original and reassays. Both results return
very similar high-grades (205.79 g/t Au versus 202.42 g/t Au), and the correlation coefficient was
R2>0.98, which is considered an indication of no bias during this period at SGS. In the ALS reassays
the mean grades returned 1.85 g/t and 1.82 g/t Au which is a reduction of 1.5 %, which SRK does not
consider to be material during this time period. A summary of the results are shown in Table 11-7 and
Figure 11-13.
Table 11-7: Summary Statistics for 2018 Reassays Program to SGS vs ALS Submissions (Au g/t)
SGS Submissions (Primary) ALS Submissions (Primary)
Original Au (g/t) Duplicate Au (g/t) Original Au (g/t) Duplicate Au (g/t)
Mean 1.09 1.08 1.85 1.82
Standard Deviation 2.09 2.07 2.94 2.80
Sample Variance 4.36 4.30 8.67 7.82
Range 14.48 14.01 11.78 12.03
Minimum 0.01 0.01 0.02 0.02
Maximum 14.49 14.02 11.80 12.05
Sum 205.79 202.42 77.50 76.30
Count 188 188 42 42
Source: SRK, 2019
y = 0.9818x + 0.0314R² = 0.9904
0.0
2.0
4.0
6.0
8.0
10.0
12.0
14.0
16.0
18.0
0.0 2.0 4.0 6.0 8.0 10.0 12.0 14.0 16.0 18.0
Au
Dip
lica
te A
u (
g/t)
Au Original (Au g/t)
XY Scatter Pulp Duplicates - SGS Laboratory
y = 0.991x - 0.0058R² = 0.9728
0.0
2.0
4.0
6.0
8.0
10.0
12.0
14.0
16.0
18.0
0.0 2.0 4.0 6.0 8.0 10.0 12.0 14.0 16.0 18.0
Au
Dip
lica
te A
u (
g/t)
Au Original (Au g/t)
XY Scatter Pulp Duplicates - ALS Laboratory

SRK Consulting (U.S.), Inc. NI 43-101 Technical Report – Marmato Project Page 88
MMS/KD Marmato_PEA_NI43-101_544400.020_Rev31_KD.docx November 2019
Source: SRK, 2019
Figure 11-13: Summary of 2019 Reassay (secondary laboratory) Submissions from SGS (left) and ALS (right)
In 2019 a total of 33 sample pulp were reanalyzed from SGS samples which returned similar values
across all grade ranges. A total of 72 ALS submissions were reassayed during the same period which
returned similar results.
The difference in the mean grades from the two data populations is 1.6% lower in the reassay dataset,
which returned 1.24 g/t and 1.25 g/t Au respectively in the original and reassays. While the mean
grades show similar results the correlation coefficient was poor, which could be a result of the low
sample population but should continue to be monitored during the remaining 2019 drilling programs.
In the ALS reassays the mean grades returned 3.94 g/t and 4.31 g/t Au which is an increase of 9.2%.
The results are influenced by a single high grade assays which impacts both the correlation and the
comparative statistics. Review of the assays below values of 16.0 g/t Au, show a significant
improvement in the comparison. After completing this analysis SRK does not consider it to be material
during this time period. A summary of the results are shown in Table 11-8 and Figure 11-14.
Table 11-8: Summary Statistics for 2019 Reassays Program to SGS vs ALS Submissions (Au g/t)
SGS Submissions (Primary) ALS Submissions (Primary)
Original Au (g/t) Duplicate Au (g/t) Original Au (g/t) Duplicate Au (g/t)
Mean 1.24 1.25 3.94 4.31
Standard Deviation 2.15 2.11 8.53 10.54
Sample Variance 4.63 4.47 72.70 111.01
Range 11.96 11.46 59.57 79.48
Minimum 0.04 0.07 0.03 0.02
Maximum 12.00 11.52 59.60 79.50
Sum 40.97 41.16 283.89 309.96
Count 33 33 72 72
Source: SRK, 2019
y = 0.988x - 0.0047R² = 0.9889
0.0
2.0
4.0
6.0
8.0
10.0
12.0
14.0
16.0
18.0
0.0 2.0 4.0 6.0 8.0 10.0 12.0 14.0 16.0 18.0
Re
assa
y A
u (g
/t)
Au Original Au (g/t)
Reasssays 2018 (SGS Laboratory)
y = 0.9343x + 0.0927R² = 0.9669
0.0
2.0
4.0
6.0
8.0
10.0
12.0
14.0
16.0
18.0
0.0 2.0 4.0 6.0 8.0 10.0 12.0 14.0 16.0 18.0
Re
assa
y A
u (g
/t)
Au Original Au (g/t)
Reasssays 2018 (ALS Laboratory)

SRK Consulting (U.S.), Inc. NI 43-101 Technical Report – Marmato Project Page 89
MMS/KD Marmato_PEA_NI43-101_544400.020_Rev31_KD.docx November 2019
Source: SRK, 2019
Figure 11-14: Comparison of 2019 Reassays from ALS (primary) Submissions, Showing All Data and Values Below 16.0 g/t Au
11.4.4 Check Analysis
In addition to the reassay program GCM also complete check analysis on pulps and reject material on
a quarterly basis. A total of 475 sample pulp were reanalyzed from SGS samples which returned
similar values across all grade ranges. A total of 476 rejects submissions were reassayed during the
same period which returned similar results.
The difference in the mean grades from check pulps is 4.4 % lower in the check dataset, which returned
3.55 g/t and 3.39 g/t Au respectively in the original and check assays. Both results return very similar
high-grades (62.97 g/t Au versus 59.60 g/t Au), and the correlation coefficient was R2>0.87, which is
considered an indication of no significant bias in the pulps. After completing this analysis SRK does
not consider it to be material during this time period. A summary of the results are shown in Figure
11-15.
In comparison the difference in the mean grades from rejects is 1.9% lower in the check dataset, which
returned 3.54 g/t and 3.48 g/t Au respectively in the original and check assays. SRK notes that the
y = 1.2198x - 0.5281
R² = 0.9735
y = 1.0144x + 0.0415
R² = 0.9678
0.0
2.0
4.0
6.0
8.0
10.0
12.0
14.0
16.0
18.0
0.0 2.0 4.0 6.0 8.0 10.0 12.0 14.0 16.0 18.0
Re
assa
y A
u (g
/t)
Au Original Au (g/t)
Reasssays 2019 (ALS Laboratory)
AuRe-assay
X=Y
Outlier Removed
Linear (AuRe-assay)
Linear (Outlier Removed)

SRK Consulting (U.S.), Inc. NI 43-101 Technical Report – Marmato Project Page 90
MMS/KD Marmato_PEA_NI43-101_544400.020_Rev31_KD.docx November 2019
correlation coefficient is improved within the reject check analysis with R2>0.92, A summary of the
results are shown in Figure 11-16.
Source: SRK, 2019
Figure 11-15: Summary of Check Assays Completed on Pulp Material (Quarterly Checks), Showing Values Less Than 18.0 g/t (Left) and Full Dataset (Right)
Source: SRK, 2019
Figure 11-16: Summary of Check Assays Completed on Reject Material (Quarterly Checks), Showing Values Less Than 18.0 G/T (Left) and Full Dataset (Right)
y = 0.8955x + 0.2145R² = 0.8711
0.0
2.0
4.0
6.0
8.0
10.0
12.0
14.0
16.0
18.0
0.0 2.0 4.0 6.0 8.0 10.0 12.0 14.0 16.0 18.0
Au
Dip
lica
te A
u (
g/t)
Au Original (Au g/t)
Au Dup (ppm)
y = 0.8955x + 0.2145R² = 0.8711
0.0
5.0
10.0
15.0
20.0
25.0
30.0
35.0
40.0
45.0
50.0
0.0 5.0 10.0 15.0 20.0 25.0 30.0 35.0 40.0 45.0 50.0
Au
Dip
lica
te A
u (
g/t)
Au Original (Au g/t)
Au Dup (ppm)
y = 0.9898x - 0.0312R² = 0.9241
0.0
2.0
4.0
6.0
8.0
10.0
12.0
14.0
16.0
18.0
0.0 2.0 4.0 6.0 8.0 10.0 12.0 14.0 16.0 18.0
Au
Dip
lica
te A
u (
g/t)
Au Original (Au g/t)
Au Dup (ppm)
y = 0.9898x - 0.0312R² = 0.9241
0.0
5.0
10.0
15.0
20.0
25.0
30.0
35.0
40.0
45.0
50.0
0.0 5.0 10.0 15.0 20.0 25.0 30.0 35.0 40.0 45.0 50.0
Au
Dip
lica
te A
u (
g/t)
Au Original (Au g/t)
Au Dup (ppm)

SRK Consulting (U.S.), Inc. NI 43-101 Technical Report – Marmato Project Page 91
MMS/KD Marmato_PEA_NI43-101_544400.020_Rev31_KD.docx November 2019
11.5 Opinion on Adequacy
It is the opinion of SRK that the frequency of QA/QC sample inserted in the 2018 and 2019 campaign
is at an acceptable rate as stipulated in the Company’s internal guidelines (approximately 11%).
In general, it is the opinion of SRK that the results of the QA/QC analysis display a reasonably good
correlation to the original assays and are acceptable for use in defining compliant Mineral Resource
Estimates.
In the opinion of SRK, the sampling preparation, security and analytical procedures used by GCM are
consistent with generally accepted industry best practices and are therefore adequate.

SRK Consulting (U.S.), Inc. NI 43-101 Technical Report – Marmato Project Page 92
MMS/KD Marmato_PEA_NI43-101_544400.020_Rev31_KD.docx November 2019
12 Data Verification
12.1 Procedures
12.1.1 Verifications by GCM
GCM has completed a number of verification sampling programs during the history of the Marmato
Project. The work completed has ensured sample integrity and allowed SRK to have confidence to
use the combined historical and GCM data as supplied by the Company. The work completed by GCM
can be sub-divided into the validation and verification of the on-going exploration drilling programs,
and the validation of underground channel sampling from the operating mine.
GCM employs a Database & GIS Manager who is responsible for tracking the samples through the
laboratory. The Sample Order Form is given to the Database Manager. A Microsoft® Excel
spreadsheet is used to track Company reference number, lab order number, date of delivery to lab,
date of receipt of assays by email, date of receipt of certificate and date of receipt of invoice.
The Database & GIS Manager is responsible for receiving the assay results and importing these into
the database. This is the only person with authority to do this in order to maintain integrity and quality
control of the database.
On receipt of each batch of assays for the exploration drilling, the QA/QC samples are checked to
accept or reject the batch. If there is a problem the Chief Geologist is notified and he requests that the
laboratory identify and solve the problem, if possible, or carry out re-analyis, as necessary. If re-assay
is required, either the whole batch or the sample tray between the good QC samples on either side is
re-analyzed. Microsoft® Excel or Access spreadsheets and graphs are used to check QC results and
update these with each batch so that the whole program is monitored progressively.
The laboratory also carries out its own internal QA/QC samples and the results for these are requested
and monitored on an ongoing basis by GCM.
On-going validation included a detailed survey of historical collar positions using a DGPS which
highlighted a number of minor discrepancies (typically less than 10 m). Based on the new survey data,
the database has been updated accordingly and the interpretations adjusted to the new drillhole
positions.
The on-going validation of the underground channel sampling database has been a considerable task,
which has required capture of the sampling information from the mines operating long-sections into a
3D database. The program continued between 2017 and 2019, which has resulted in an increase of
approximately 100% in the size of the channel sample database. To complete the task, GCM has
completed surveys of the existing development to ensure accuracy of the placement of sampling on
the main levels. GCM geologists have then created collar, survey and assay database for each sample
relative to the strike of the deposit using the assumption that sampling has been completed
perpendicular to the vein, as per the mines sampling procedure.

SRK Consulting (U.S.), Inc. NI 43-101 Technical Report – Marmato Project Page 93
MMS/KD Marmato_PEA_NI43-101_544400.020_Rev31_KD.docx November 2019
12.1.2 Verification by SRK
In accordance with NI 43-101 guidelines, Mr. Parsons of SRK most recently visited the Marmato
Project on June 11, 2019. The main purpose of the site visit was to:
• Witness the extent of the exploration work completed to date;
• Complete an underground site inspection to understand the changes in the geological settings
and possible exposure of the Marmato Deeps style mineralization;
• Inspect core logging and sample storage facilities;
• Discuss geological interpretation and inspect drill core;
• Assess logistical aspects and other constraints relating to the exploration property;
• Review data for the assay database; and
• Hold discussions with personnel involved in the current and historical exploration activities.
SRK did not complete an independent visit to the SGS Laboratory facility during the recent site visit,
but visited the facility previously during the November 2011 site visit also completed by Ben Parsons.
SRK has been working with the GCM geological team between 2017 and through 2019, when data
has been captured from the mine to generate a detailed geological model. For the most recent iteration
of the database, in addition to the site inspection, SRK has completed a series of technical meetings
with GCM geologists to review the on-going capture of the underground channel sampling program
and integration into the database. SRK reviewed the capture and geo-referencing of the underground
development with existing geological maps for each of the mining levels.
SRK has undertaken basic validation for all tabulated data in both Leapfrog and Datamine.
Additionally, in order to independently verify the information incorporated within the latest drill program,
SRK has:
• Completed a review of selected drill core for selected holes, to confirm both geological and
assay values stored in the database show a reasonable representation of the Project;
• Verified the digital database against the original issued assay certificates;
• Visited underground workings to check the continuity of vein and veinlet mineralization at
depth, including a site inspection to levels 19 through 21 to understand changes in the
mineralization styles;
• Verified the quality of geological and sampling information and developed an interpretation of
gold grade distributions appropriate to use in the resource model; and
• Reviewed the QA/QC database for the recent drilling and channel sampling programs.
12.2 Limitations
SRK has reviewed the data acquired for the Project and held a number of technical meetings at the
Company office in Medellín to review the progress on the data validation. The efforts should remain
ongoing and a lack of definition in portions of the 3D survey of the mines has limited the ability to
accurately place all the samples in their “true” location. SRK notes that the information for the raise
sampling shows the most significant variations from SRK geological interpretation using mapping
between levels.
SRK has highlighted to GCM upon the validation phase, there still remains a large number of data
points which contain significant mineralization that require constraining which lie outside of the revised

SRK Consulting (U.S.), Inc. NI 43-101 Technical Report – Marmato Project Page 94
MMS/KD Marmato_PEA_NI43-101_544400.020_Rev31_KD.docx November 2019
2019 vein interpretations. SRK noted a number of areas where, based on short channel samples, the
geological model would likely result in overstating the tonnage if left unconstrained. Additionally, where
these occur, the grade in any subsequent estimate will overstate grade locally with possible vein or
veinlet material being incorrectly projected into the lower grade porphyry style domains.
The current structure of the database and naming convention for the underground channel sampling
results in some limitations on generating an automated process to update the geological model.
Isolated sampling of veins without surrounding samples can led to overstating the tonnage when using
Leapfrog® and therefore caution has been required to review intersections on a case by case basis.
Additionally, in a number of cases long cross-cut drift sampling has been logged as individual
Hole_ID’s, so restrictions based on length cannot be applied.
Regarding the significant rise in the amount of channel sampling, some of which has not been captured
in the veins or splay model, it is the opinion of SRK that there is potential for over-estimation. SRK has
noted this risk and therefore applied filters to the database to minimize these risks in the porphyry
domain estimates. SRK considers this approach to be conservative, and it has resulted in a reduction
in the contained metal within the domains if estimated with no filter; however, these estimates provide
a more reasonable base case for classification. Further work is recommended between SRK and GCM
to improve the database structure and geological modelling of this domain, prior to any consideration
for use in a mining study.
SRK completed a series of test models, which removed the influence of any of these samples from
the database, using filters on logging codes and channel length, which is considered a more
conservative approach by discounting the influence of short channel samples. The resultant
interpretation contained approximately half the volume of the optimistic scenario for the porphyry
mineralization. Due to the uncertainty in the impact of these domains, SRK has therefore excluded this
material from the current mining assessment. If a solution can be found in the short term to improve
the confidence in the geological continuity, this may represent upside potential. SRK recommends
follow-up work from GCM which includes mapping and verification of the presence of the porphyry-
style mineralization and additional sampling (drilling if required), prior to inclusion in the mine plan.
12.3 Opinion on Data Adequacy
Based on the validation work completed by SRK, the database has been accepted as provided by
GCM’s Resource Geologist. SRK is satisfied with the quality of assays returned from the laboratory
for the latest drilling program and that there is no evidence of bias within the current database which
would materially impact on the estimate.
While there are areas for potential improvement, SRK is of the opinion that the exploration and assay
data is sufficiently reliable to support evaluation and classification of Mineral Resources in accordance
with generally accepted CIM Estimation of Mineral Resources and Reserves: Definitions and
Guidelines (CIM, 2014).

SRK Consulting (U.S.), Inc. NI 43-101 Technical Report – Marmato Project Page 95
MMS/KD Marmato_PEA_NI43-101_544400.020_Rev31_KD.docx November 2019
13 Mineral Processing and Metallurgical Testing
13.1 Introduction
A metallurgical program was conducted by SGS Lakefield on test composites from the MDZ and the
results of this program are fully documented in SGS’s report, “The Recovery of Gold from Marmato
Deposit Samples” dated April 16, 2019. The metallurgical program included comminution testwork,
mineralogical studies and an evaluation of several different flowsheet options including:
• Whole-ore cyanidation;
• Gravity concentration followed by cyanidation of the gravity tailing; and
• Gravity concentration followed by gold flotation from the gravity tailing and cyanidation of the
flotation concentrate.
The test program also included solid-liquid separation and cyanide detoxification studies.
13.2 Metallurgical Sample Characterization
The test program was conducted on test samples prepared from drill core from the East, West and
Central MDZ and a Master MDZ composite was formulated on a weighted basis from the East, West
and Central MDZ samples. In addition, a composite representing the current Marmato material was
also tested. The drill holes and intervals used to formulate the test composites are shown in Table
13-1 and the location of each drillhole is shown in Figure 13-1. Head analyses for each of the test
composites are shown in Table 13-2.
Table 13-1: Drillholes and Intervals for MDZ Metallurgical Composites
Location Drill Hole From (m) To (m)
East Zone MT-IU-001 138.3 148.0 MT-IU-004 152.4 182.2 MT-1445 562.0 589.0
Central Zone
MT-IU-002 146.0 179.3 MT-IU-003 209.4 256.5 MT-IU-006 252.5 292.8 MT-1498 334.0 386.0
West Zone MT-IU-007 159.4 173.7 MT-IU-008 251.0 266.6 MT-IU-011 129.3 144.6
Source: SGS Lakefield, 2019

SRK Consulting (U.S.), Inc. NI 43-101 Technical Report – Marmato Project Page 96
MMS/KD Marmato_PEA_NI43-101_544400.020_Rev31_KD.docx November 2019
Source: SRK, 2019
Figure 13-1: Drillhole Locations
Table 13-2: Head Analyses for MDZ and Marmato Test Composites
Element MDZ West MDZ Center MDZ East MDZ Master Marmato Comp
Au (S.M.) g/t 1.54 2.69 2.65 2.32 5.48
Au (Calc.) g/t 1.30 2.61 1.80 2.36 4.83
Ag g/t 0.90 3.9 6.7 4.2 19.6
S % 1.22 2.04 2.20 1.95 10.5
Te g/t <4 <4 <4 <4 <4
Hg g/t 0.3 <0.3 <0.3 <0.3 <0.3
Source: SGS, 2019

SRK Consulting (U.S.), Inc. NI 43-101 Technical Report – Marmato Project Page 97
MMS/KD Marmato_PEA_NI43-101_544400.020_Rev31_KD.docx November 2019
13.3 Mineralogy
A mineralogical evaluation was conducted on a single sample from the MDZ Center Zone by Terra
Mineralogical Services Inc. The results of this evaluation are fully documented in the report,
“Determination of Gold Deportment in one Master Composite Sample from the Top of the Deep
Marmato Deposit, Colombia” by Giovanni Di Prisco dated March 2, 2019. Key findings included the
following:
• Native gold was by far the predominant gold carrier;
• The majority (>99%) of the gold particles occurred in locations that would be readily accessible
by leaching solutions;
• The gold grains were predominately associated with silicate gangue minerals. Gold particles
were not often in direct contact with sulfides, yet very commonly pyrrhotite, chalcopyrite, and
bismuth minerals were found in close vicinity to the gold mineralization; and
• The average grain size of the gold particle identified could be best defined as very fine grained
(<6 μm), yet a small amount of coarse gold particles also existed.
13.4 Comminution Testwork
Comminution testwork included SMC (SAG mill comminution), BWi (Bond ball mill work index) and Ai
(Abrasion index) tests, the test results are shown in Table 13-3. The SMC tests were conducted on
the East, West and Center MDZ and the reported Axb values ranged from 28 to 31 and averaged 29,
indicating that the material is very hard with respect to SAG mill impact grinding. The BWi tests were
conducted on all test composites using a 150 mesh (105 µm) closing screen, the MDZ composites
ranged from 19.0 to 20.7 kWh/t and averaged 19.8 kWh/t. Indicating that the MDZ material is very hard
with respect to ball mill grinding. It is also noted that the MDZ material is much harder than the current
Marmato material which was reported to have a BWi of 15.7 kWh/t. The abrasion tests indicate that
the MDZ material is very abrasive with abrasion indices ranging from 0.626 to 0.731 and averaging
0.678. The MDZ material is much more abrasive than the current Marmato material, which has a
reported Ai of 0.199. Relatively high consumption of wear materials can be expected when processing
MDZ material.
Table 13-3: Comminution Test Results on MDZ and Marmato Test Samples
Sample Relative Density JK Parameters
BWI (kWh/t) AI (g) A x b ta SCSE
Marmato Material - - - - 15.7 0.199
MDZ Comp - - - - 20.7 0.652
Zone Center 2.65 31.0 0.30 11.0 19.0 0.704
Zone East 2.64 28.0 0.27 11.6 20.3 0.626
Zone West 2.69 28.0 0.27 11.7 19.0 0.731
Average 2.66 29.0 0.28 11.4 19.0 0.582
Source: SGS, 2019

SRK Consulting (U.S.), Inc. NI 43-101 Technical Report – Marmato Project Page 98
MMS/KD Marmato_PEA_NI43-101_544400.020_Rev31_KD.docx November 2019
13.5 Metallurgical Testwork
13.5.1 Whole-Ore Cyanidation
Two whole-ore cyanidation tests were completed on the MDZ composite. The tests were conducted
at a grind size of 80% passing (P80) 60 µm with a maintained cyanide concentration of 1 gram per liter
(g/L) sodium cyanide (NaCN) and evaluated the impact of pre-aeration and dissolved oxygen
concentration on gold extraction and leach kinetics. The results of these tests are summarized in
Table 13-4. These tests showed that without preaeration and air injection to maintain the dissolved
oxygen concentration during leaching at 5 to 8 milligrams per liter (mg/L) that 98% of the gold could
be extracted after 72 hours of leaching with sodium cyanide consumption reported at 1.83 kilograms
per tonne (kg/t). However, with inclusion of preaeration for two hours and oxygen injection sufficient to
maintain the dissolved oxygen concentration during leaching at 20 mg/L, sodium cyanide consumption
was reduced to 0.66 kg/t and leach kinetics were significantly increased with gold leaching complete
after 24 to 48 hours.

SRK Consulting (U.S.), Inc. NI 43-101 Technical Report – Marmato Project Page 99
MMS/KD Marmato_PEA_NI43-101_544400.020_Rev31_KD.docx November 2019
Table 13-4: Whole-Ore Cyanidation Test Results on MDZ Test Composite
CN Test No.
Feed Size P80,
µm
Aeration Conditions Reagent Cons. kg/t of
CN Feed Au Extraction (%) Au Residue (g/t) Au Head (g/t)
Pre-air Leach NaCN CaO 8 h 24 h 48 h 72 h A B Avg. Calc. Direct
5 56 n/a Air, ~5-8 ppm 1.83 1.52 40.0 70.4 88.7 98.3 0.04 0.05 0.05 2.65 2.32
9 61 2 h O2 O2, ~20 ppm 0.66 1.29 93.5 95.6 ~99 98.2 0.04 0.04 0.04 2.26
Source: SGS, 2019

SRK Consulting (U.S.), Inc. NI 43-101 Technical Report – Marmato Project Page 100
MMS/KD Marmato_PEA_NI43-101_544400.020_Rev31_KD.docx November 2019
13.5.2 Gravity Concentration
Gravity concentration tests were conducted on the MDZ, West Zone, Center Zone, East Zone and
Marmato composites at a grind sizes ranging from P80 70 to 223 µm with a Knelson MD-3 centrifugal
gravity concentrator followed by upgrading on a Mozley table. The results of these tests are shown in
Table 13-5. This testwork demonstrated that the MDZ material (including West, Center and East Zone
composites) is highly amenable to gravity concentration with gold recoveries ranging from 50.6 to
69.0% and silver recoveries ranging from 14.6 to 24.7% into gravity concentrates containing 0.05 to
0.16 weight percent (wt%) and 1,575 to 2,494 g/t Au and 182 to 1,432 g/t Ag. The Marmato test
composite was also very responsive to gravity concentration with Au recoveries ranging from 56.9 to
57.9% and Ag recoveries of 11.6% into gravity concentrates containing 0.13 to 0.17 wt% and 1,586 to
2,192 g/t Au and 1,278 to 1,668 g/t Ag.
Table 13-5: Summary of Gravity Concentration Testwork on MDZ and Marmato Composites (1)
Test No.
Composite
Grind Size
Assay Head Calc. Head Gravity Concentrate Distribution
(%)
P80
µm Au
(g/t) Ag
(g/t) Au
(g/t) Ag
(g/t) Mass
(%) Au (g/t
Ag (g/t)
Au Ag
G-1 MDZ 223 2.32 4.2 2.31 3.9 0.07 1,815 1,006 55.1 17.9
G-3 MDZ 223 2.32 4.2 2.27 4.5 0.05 2,494 1,432 50.6 14.6
G-9 MDZ 112 2.32 4.2 2.51 4.0 0.10 1,575 921 63.7 23.6
G-6 West Zone 88 1.54 0.9 1.30 1.2 0.16 531 182 66.1 24.7
G-7 Center Zone 94 2.69 3.9 2.61 4.3 0.12 1,498 752 69.0 21.0
G-8 East Zone 99 2.65 6.7 1.80 8.1 0.11 831 1,149 51.7 15.9
G-4 Marmato 70 5.48 19.6 4.67 18.8 0.17 1,586 1,278 57.9 11.6
G4R Marmato 78 5.48 19.6 4.98 18.5 0.13 2,192 1,668 56.9 11.6
Note: 1 Marmato test G-2 not shown due to high variance between assay and calculated head Source: SGS Lakefield, 2019
13.5.3 Cyanidation of Gravity Tailing
MDZ Master Composite
Cyanidation tests were conducted on the gravity tailings from the MDZ composite. The leach
conditions are shown in Table 13-6 and the test results are summarized in Table 13-7. Tests were
conducted over a range of grind sizes and cyanide concentrations, both with and without preaeration
and oxygen injection. These tests demonstrated that overall gold extractions
(gravity concentration + gravity tailing cyanidation) of about 97 to 98% could be achieved. A grind size
of about P80 100 µm appeared optimum with a cyanide concentration of 0.5 g/L NaCN. Cyanide
consumption under these conditions was very low at about 0.15 kg/t NaCN. It should be noted that the
tests conducted at an initial cyanide concentration of 0.5 g/L (CN-22 an CN-23) allowed the initial
cyanide concentration to attenuate throughout the test with no additional cyanide added. The results
were very similar to the other tests and indicated that maintaining the cyanide concentration at 0.5 g/L
throughout the leach cycle was not required for the MDZ gravity tailing. Tests CN-12, 13, and 14 were
designed to evaluate grind size over the range from P80 138 to 76 μm. The residue gold grades for
these tests were 0.08 g/t, 0.06 g/t, and 0.06 g/t indicating an optimum grind size of about P80 100 μm.
The leach kinetics for all tests are shown in Figure 13-2 and indicate a leach retention time of about
30 hours is sufficient to maximize gold extraction. Preaeration appears to be beneficial in reducing

SRK Consulting (U.S.), Inc. NI 43-101 Technical Report – Marmato Project Page 101
MMS/KD Marmato_PEA_NI43-101_544400.020_Rev31_KD.docx November 2019
cyanide consumption, but the need for lead nitrate requires further evaluation. Additionally, the need
for oxygen injection requires further evaluation.
Table 13-6: MDZ Gravity Tailing Leach Conditions
CN Test No.
Feed
Feed Size P80,
µm
Aeration Conditions Lead Nitrate 100 g/t
Cyanide Concentration
g/L NaCN
Reagent Addition kg/t of CN Feed
Reagent Cons. kg/t of
CN Feed
Pre-air Leach NaCN CaO NaCN CaO
3 G-1 223 n/a Air, ~5-8
ppm N 1.0 1.65 1.09 0.83 1.09
4 G-1 70 n/a Air, ~5-8
ppm N 1.0 2.27 1.09 1.55 1.09
12 G-3 138 4 h, O2
O2, ~20
ppm N 1.0 1.23 1.22 0.24 1.18
13 G-3 96 4 h, O2
O2, ~20
ppm N 1.0 1.24 1.27 0.22 1.23
14 G-3 76 4 h, O2
O2, ~20
ppm N 1.0 1.24 1.32 0.25 1.30
15 G-3 80 2 h, O2
O2, ~20
ppm Y 1.0 1.24 1.20 0.28 1.17
21 G-3 99 4 h, O2
O2, ~20
ppm N 0.75 0.75 1.10 0.19 1.09
22 G-3 98 4 h, O2
O2, ~20
ppm N 0.50 0.50 1.11 0.16 1.08
23 G-3 97 4 h, O2
O2, ~20
ppm Y 0.50 0.50 1.13 0.14 1.11
Source: SGS Lakefield, 2019
Table 13-7: Gravity Concentration + Gravity Tailing Cyanidation Test Results
CN Test No.
Feed
Au Extraction/Recovery, % Au Residue, g/t Au Calc.
Head g/t CN (Unit)
Grav Grav +CN 8 h 24 h 48 h 72 h A B Avg.
3 G-1 58.6 79.9 85.8 55.1 93.6 0.12 0.18 0.15 1.06
4 G-1 88.2 95.6 55.1 98.0 0.07 0.06 0.07 1.48
12 G-3 87.3 93.8 93.2 93.3 50.6 96.7 0.08 0.08 0.08 1.19
13 G-3 89.8 96.1 94.7 95.1 50.6 97.6 0.06 0.05 0.06 1.13
14 G-3 87.8 95.6 95.2 95.0 50.6 97.5 0.05 0.06 0.06 1.10
15 G-3 90.7 95.1 97.0 95.9 50.6 98.0 0.04 0.05 0.05 1.08
21 G-3 80.3 90.1 92.6 93.1 50.6 96.6 0.08 0.07 0.08 1.08
22 G-3 83.1 93.3 92.9 93.4 50.6 96.7 0.07 0.07 0.07 1.06
23 G-3 91.5 95.9 95.2 95.4 50.6 97.7 0.05 0.06 0.06 1.21
Source SGS Lakefield, 2019

SRK Consulting (U.S.), Inc. NI 43-101 Technical Report – Marmato Project Page 102
MMS/KD Marmato_PEA_NI43-101_544400.020_Rev31_KD.docx November 2019
Source: SGS Lakefield, 2019
Figure 13-2: Gold Extraction Versus Retention Time (MDZ Gravity Tailings)
Variability Composites
The individual East, Center and West Zone composites and the Marmato composite were subjected
to gravity concentration followed by cyanidation of the gravity tailings using the following test
conditions:
• Grind size: ~ P80 of 100 μm
• Preaeration: 4 hours with oxygen
• Dissolved O2: 20 mg/L
• NaCN: 1.0 g/L (maintained)
• Retention Time: 48 hours
• Slurry Density: 50% solids
The results of these tests are summarized in Table 13-8, which show that overall gold recoveries for
the West, Center and East Zone composites were very similar to the results obtained from the MDZ
composite and ranged from 96.7 to 97.9% with cyanide consumption ranging from 0.19 to 0.34 kg/t.
Overall gold recovery from the Marmato composite was about 92% with cyanide consumption at about
0.50 kg/t.

SRK Consulting (U.S.), Inc. NI 43-101 Technical Report – Marmato Project Page 103
MMS/KD Marmato_PEA_NI43-101_544400.020_Rev31_KD.docx November 2019
Table 13-8: Summary of Gravity Concentration + Gravity Tailing Cyanidation (Variability Composites)
Gravity Test Cyanidation Test Composite Grind Size Au Distribution (%)
P80 µm Gravity Grav. + Cyan.
G-6 CN-18 West Zone 88 66.1 97.3
G-7 CN-19 Center Zone 94 69.0 97.9
G-8 CN-20 East Zone 99 51.7 96.7
G-4 CN-16 Marmato 70 57.9 92.0
G4R CN-16R Marmato 78 56.9 91.8
Source: SGS Lakefield, 2019
13.5.4 Flotation from Gravity Tailing
Rougher flotation tests were conducted on gravity tailings from the MDZ and Marmato composites
using flotation conditions provided by Gran Colombia. All tests were conducted at natural pH with 20
minutes of retention time and used potassium amyl xanthate (PAX) and MX5160 as the collectors,
copper sulfate as a sulfide mineral activator and Dowfroth 250 as the frother. The results of selected
tests are shown in Table 13-9. Overall gold recoveries (gravity concentration + rougher flotation) of
96% to 97% were reported for the MDZ composite and 97.4% for the Marmato composite. Rougher
flotation concentrate grades produced from the MDZ composites ranged from 10 to about 13 g/t Au.
The rougher flotation concentrate produced from the Marmato composite contained 43.6 g/t Au.
Although generally high overall gold recoveries were reported, it should be noted that the gold grade
of the final flotation tailing produced from the MDZ composite was significantly higher than the
cyanidation leach residues (0.09 g/t Au versus 0.06 g/t Au).
Table 13-9: Summary of Rougher Flotation Tests on Gravity Tailings from MDZ and Marmato Composites
Composite Test Grind P80 µm Au Recovery (%) Au Grade (g/t)
Grav Flot (unit) Flot + Grav Flot Conc Flot Tail
MDZ G1/F2 74 55.1 93.4 97.0 9.57 0.08
MDZ G1/F4 63 55.1 91.9 96.4 13.1 0.09
MDZ G1/F5 63 55.1 90.8 95.9 12.1 0.10
Average 67 55.1 92.0 96.4 11.6 0.09
Marmato G-2/F3 210 11.5 97.1 97.4 43.6 0.39
Source: SGS Lakefield, 2019
13.5.5 Cyanidation of Flotation Concentrates
Cyanidation tests were conducted on the rougher flotation concentrates that had been reground to
about 22 µm. Cyanidation tests were conducted at 1 g/L NaCN for 48 hours and the results are
summarized in Table 13-10. These tests demonstrate that about 98% of the gold contained in the
flotation concentrates could be extracted by cyanidation. It is important to note that the 98% gold
extraction from the flotation concentrate implies an overall gold recovery of about 95% to 96% from a
gravity + flotation + cyanidation flowsheet. This is about 2% lower gold recovery than by the gravity +
gravity tailing cyanidation flowsheet.

SRK Consulting (U.S.), Inc. NI 43-101 Technical Report – Marmato Project Page 104
MMS/KD Marmato_PEA_NI43-101_544400.020_Rev31_KD.docx November 2019
Table 13-10: Summary of Flotation Concentrate Cyanidation Test Results
CN Test No.
Sample Feed
Au Extraction, % CN (Unit)
Au Residue (g/t) Au Calc. Head (g/t)
8 h 24 h 48 h A B Avg.
1 MDZ G-1/F-1 95.4 97.1 98.1 0.22 0.20 0.21 11.1
2 MDZ G-1/F-2 93.3 95.4 98.2 0.17 0.17 0.17 9.57
10 MDZ G-1/F-4 93.0 95.1 97.2 0.38 0.36 0.37 13.1
11 MDZ G-1/F-5 94.2 95.9 98.1 0.24 0.23 0.24 12.1
7 Marmato G-2/F-3 56.6 92.4 98.0 0.87 0.84 0.86 43.6
Source: SGS, 2019
13.6 Cyanide Detoxification
The cyanidation leach residue produced from the MDZ composite under optimized leach conditions
was subjected to cyanide detoxification testing using the industry-standard SO2/Air process to reduce
the weak acid dissociable cyanide (CNWAD) to less than 10 mg/L. The main parameters adjusted during
the testwork were sodium metabisulphite and copper addition rates. The results of the detoxification
testwork are shown in Table 13-11. The initial leach residue contained 150 mg/L CNT, which was
subsequently reduced to 8.95 CNWAD (Test 1-7) with the addition of 8.05 g SO2/g CNWAD and 0.22 g
Cu/g CNWAD. This testwork established that the following operating conditions will achieve a discharge
CNWAD concentration of <10 mg/L.
• Slurry density: 50% solids (w/w)
• SO2 addition: 8 g SO2 /g CNWAD
• Cu addition: 0.22 g Cu /g CNWAD
• pH: 8.5 (with lime added as needed (~0.5 kg/t)
• Retention time: 90 minutes
It should be noted that aging the detoxified sample for one to five days further attenuated the CNWAD
to approximately 2.5 mg/L or less. Additional cyanide detoxification testwork should be completed in
the next phase of study to further optimize process requirements.

SRK Consulting (U.S.), Inc. NI 43-101 Technical Report – Marmato Project Page 105
MMS/KD Marmato_PEA_NI43-101_544400.020_Rev31_KD.docx November 2019
Table 13-11: Summary of Cyanide Detoxification Testwork on MDZ Composite Leach Residue
Test
Test Duration
Reten. Time
Product (Solution Phase) Reagent Addition
Min Min pH
CNT CNWAD by Cu Fe g/g CN WAD g/L Feed Pulp kg/t Solids
mg/L Ana. Lab
mg/L
Picric Acid mg/L
Aged Picric
Acid mg/L
mg/L mg/L SO2
Equiv. Lime Cu (1)
SO2 Equiv.
Lime Cu (1) SO2
Equiv. Lime Cu (1)
Feed (CN-24) … 10.6 150 151 … … 26.6 2.56 … … … … … … … … …
Batch Test 270 8.5 … … 1.12 … … … 11.1 9.71 0.070 1.23 1.08 0.007 1.67 1.46 0.011
CND 1 270
Continuous Tests 8.5 … … 55.6 … … … 6.98 0.54 0.000 0.78 0.061 0.000 1.05 0.081 0.000
1-1 94 60
1-2 90 55 8.7 5.7 <0.1 14.7 1.14* 0.70 1.7 6.12 0.11 0.070 0.68 0.013 0.007 0.92 0.02 0.011
1-3 90 60 8.5 … … 50.2 … 7.95 4.84 0.070 0.88 0.55 0.007 1.20 0.73 0.011
1-4 60 55 8.5 … … 30.5 … … … 7.31 3.60 0.130 0.81 0.41 0.015 1.10 0.54 0.020
1-5 115 59 8.5 2.5 <0.1 9.88 2.51** 4.3 1.2 7.57 2.19 0.220 0.88 0.26 0.025 1.14 0.33 0.033
1-6 120 59 8.5 … … 18.3 … … … 7.37 2.38 0.350 0.86 0.28 0.041 1.11 0.36 0.053
1-7 100 89 8.5 … … 8.95 … … … 8.05 3.62 0.220 0.94 0.43 0.026 1.21 0.55 0.033
1-8 170 91 8.5 <0.1 <0.1 6.45 … 14.7 <0.1 10.7 4.66 0.240 1.19 0.53 0.026 1.61 0.70 0.036
… No sample submitted for assays (1) Cu added using CuSO4, 5H2O, SO2 added using sodium metabisulphite * CND1-2 aged five-day sample ** CND1-5 aged one day sample Bold red values indicate a key parameter that has changed Source: SGS Lakefield, 2019

SRK Consulting (U.S.), Inc. NI 43-101 Technical Report – Marmato Project Page 106
MMS/KD Marmato_PEA_NI43-101_544400.020_Rev31_KD.docx November 2019
13.7 Solid-Liquid Separation
Thickening and rheological studies were conducted on a cyanidation leach residue at a P80 105 µm
grind size that had adjusted to pH 8.5 with lime to simulate the detoxified slurry pH.
13.7.1 Flocculant Screening
Flocculant screening tests identified BASF Magnafloc 10, which is a very high molecular weight,
slightly anionic polyacrylamide flocculant, as a suitable flocculant for this application at an application
rate of 40 g/t. Both static and dynamic thickening testwork were conducted with this flocculant.
13.7.2 Static Thickening
Preliminary static settling tests were performed in two-liter graduated cylinders which were fixed with
rotating picket-style rakes. Static settling test results were used to determine the starting conditions for
subsequent dynamic thickening tests. The selected conditions based on these tests are summarized
in Table 13-12, and indicated a thickener settling area of 0.11 square meter per tonne per day
(m2/[t/day]) with an underflow density of 62% solids and an overflow containing 61 mg/L of total
suspended solids (TSS).
Table 13-12: Static Thickener Test Conditions
Sample ID
Flocculant Dose (g/t)
Feed %w/w
U/F %w/w
Unit Area m2/(t/day)
ISR m3/m2/day
Supernatant Clarity
TSS mg/L
MDZ Comp
40 8.0 62 0.11 833 Hazy 61
Source: SGS Lakefield, 2019
13.7.3 Dynamic Thickening
Dynamic thickening testwork was initiated with a 50 g/t dosage of BASF Magnafloc 10 flocculant at a
feedwell slurry density of 8%w/w solids. The dynamic thickening test responded very differently to the
static thickening test under these conditions with a very turbid overflow with TSS measured at
450 mg/L. In order to improve the overflow clarity, BASF Magnafloc 1687 coagulant was applied to the
diluted thickener feed prior to flocculant dosing. A series of additional tests established a dosage of
Magnafloc 1687 at 15 g/t followed by a dosage of 25 g/t of Magnafloc 10 as optimal. The result of
dynamic thickener tests conducted over a range of unit settling areas (m2/[t/d]) are summarized in
Table 13-13.
Table 13-13: Summary of Dynamic Thickener Test Results
1687 Dosage (g/t)
10 Dosage (g/t)
Unit Area m2/(t/d)
Solids Loading (t/m2/h)
Net Rise Rate (m3/m2/d)
Underflow %w/w solids
Overflow TSS (mg/L)
Residence Time (h)
U/F Yield Stress (Pa)
15 25 0.13 0.32 84.2 64.1 54 1.36 60
15 25 0.11 0.38 99.5 62.9 57 1.15 49
15 25 0.09 0.46 121.7 61.7 43 0.94 52
15 25 0.07 0.60 156.4 59.5 58 0.73 38
Underflow extended for 30 minutes: 65.1 93
Note: Bed height was maintained around 160 mm Source: SGS Lakefield, 2019

SRK Consulting (U.S.), Inc. NI 43-101 Technical Report – Marmato Project Page 107
MMS/KD Marmato_PEA_NI43-101_544400.020_Rev31_KD.docx November 2019
13.7.4 Rheology on Thickener Underflow
The results of rheology testwork on the thickener underflow are summarized in Table 13-14. A Critical
Solids Density (CSD) of approximately 61% solids was established, which corresponds to
approximately 20 pascals (Pa) on the unsheared yield test and 13 Pa on the sheared yield test. As
shown in Figure 13-3, CSD is the solids density at which a small increase of the solids density causes
a significant decrease of the flowability of the slurry. The CSD value is also predictive of the maximum
underflow solids density achievable in a commercial thickener.
Table 13-14: Results of Rheology Testwork on MDZ Thickener Underflow Sample
Test Code
Solids %w/w
Unsheared Sample Sheared Sample
Observations Ɣ ƮyВ ɳP Ɣ ƮyВ ɳP
Range, 1/s
Pa mPa.s Range,
1/s Pa mPa.s
CSD= ~61% solids, corresponding to ~20 Pa unsheared and 13 Pa sheared yield stress.
T1 65.8 Plug Flow 73 -- 200-400 26 50 Thixotropic
T2 64.2 200-400 50 3.9 200-400 20 36 Thixotropic
T3 62.1 200-400 28 15 200-400 15 24 Thixotropic
T4 60.3 200-400 17 16 200-400 12 17 Thixotropic
T5 58.3 200-400 12 15 200-400 8.9 15 Minor Thixotropic, minor settling
T6 54.2 200-400 5.1 13 200-400 4.8 13 Minor settling
T7 50.3 200-400 2.3 10 200-400 2.1 15 Moderate settling, dilatant after 425 1/s
Notes: The MDZ Comp underflow samples contained 15 g/t BASF Magnafloc 1687 coagulant and 25 g/t BASF Magnafloc 10 flocculant The values are based on data produced by the unsheared and sheared slurry sample. Variable shearing was produced in the 0 to 600 s-1 range, increasing and decreasing (up and down curves). Constant shearing was produced by subjecting the slurry sample to a constant rotation at 300 1/s for 180 seconds. Bingham Plastic parameters: yield stress (ƮyВ) and plastic viscosity (ɳP) values, for the specified Ɣ range. Ɣ – Shear rate range at which the rheological parameters were calculated. Source: SGS Lakefield, 2019

SRK Consulting (U.S.), Inc. NI 43-101 Technical Report – Marmato Project Page 108
MMS/KD Marmato_PEA_NI43-101_544400.020_Rev31_KD.docx November 2019
Source: SGS, 2019
Figure 13-3: Yield Stress Versus Thickener Underflow Slurry Density
13.8 Gold and Silver Recovery Estimate
As shown in Table 13-15, SRK has estimated achievable gold and silver recoveries from the MDZ for
each of the process flowsheet options tested based on the reported results from selected tests
conducted on the MDZ composite. SRK recommends discounting laboratory-reported gold
extractions/recoveries by 2% and silver extractions/recoveries by 5% to account for inherent plant
inefficiencies. As such, the following gold and silver recoveries are projected for each of the flowsheet
options based on the testwork conducted to-date:
Flowsheet Gold Recovery Silver Recovery
• Whole-ore cyanidation 96% 38%
• Gravity + cyanidation 95% 41%
• Gravity + flotation + cyanidation 94% 44%

SRK Consulting (U.S.), Inc. NI 43-101 Technical Report – Marmato Project Page 109
MMS/KD Marmato_PEA_NI43-101_544400.020_Rev31_KD.docx November 2019
It should be noted that the whole-ore cyanidation testwork was conducted at a finer grind, and with
more aggressive leach conditions than were used in the gravity + cyanidation testwork. Overall gold
recoveries from either the whole-ore cyanidation or the gravity + cyanidation flowsheets operated
under similar conditions can be expected to be similar. It should also be noted that no cyanidation
tests were conducted to assess gold and silver extractions from the gravity concentrates. Generally,
gold extractions from gravity concentrates in plant practice are very high (>98%) and it is assumed
that the 2% adjustment to overall gold recovery adequately accounts for gold losses that may occur
during intensive leaching of the gravity concentrates. Gold and silver cyanidation extraction from
gravity concentrates should be evaluated during the next phase of study.

SRK Consulting (U.S.), Inc. NI 43-101 Technical Report – Marmato Project Page 110
MMS/KD Marmato_PEA_NI43-101_544400.020_Rev31_KD.docx November 2019
Table 13-15: Estimated Gold and Silver Recoveries for Flowsheet Options
Flowsheet Test
Gravity Recovery (%)
Unit Flotation Recovery (%)
Unit Cyan. Extraction (%)
Overall Recovery (%)
Adjusted
Overall Recovery (%)
Au Ag Au Ag Au Ag Au Ag Au Ag
Whole-Ore Cyanidation CN-5 98.3 39.8 98.3 39.8 96 35
Whole-Ore Cyanidation CN-6 98.2 45.2 98.2 45.2 96 40
Average 98.3 42.5 96 38
Gravity + Cyanidation G-3/CN-21 50.6 14.6 93.1 34.6 96.6 44.1 95 39
Gravity + Cyanidation G-3/CN-22 50.6 14.6 93.4 37.9 96.7 47.0 95 42
Average 96.7 45.6 95 41
Gravity + Flot + Cyan G1/F2 55.1 17.9 93.4 86.8 98.2 44.8 96.3 49.8 94 45
Gravity + Flot + Cyan G1/F4 55.1 17.9 91.9 83.4 97.2 42.3 95.2 46.9 93 42
Gravity + Flot + Cyan G1/F5 55.1 17.9 90.8 83.9 98.1 46.8 95.1 50.1 93 45
Average 95.5 48.9 94 44
Gold Adjustment Factor 2
Silver Adjustment Factor 5
Source: SGS Lakefield and SRK, 2019

SRK Consulting (U.S.), Inc. NI 43-101 Technical Report – Marmato Project Page 111
MMS/KD Marmato_PEA_NI43-101_544400.020_Rev31_KD.docx November 2019
13.9 Significant Factors
The following significant metallurgical and mineral processing factors have been identified:
• Metallurgical testwork was conducted on a test composite representing the average material
from the MDZ as well as variability composites from East, Central and West Zones of the MDZ
deposit;
• Native gold was by far the predominant gold carrier and the majority (>99%) of the gold
particles occurred within mineral structures that would be readily accessible by leaching
solutions. Gold particles were not often in direct contact with sulfides, yet very commonly
pyrrhotite, chalcopyrite, and bismuth minerals were found in close vicinity to the gold
mineralization;
• The SAG mill comminution (SMC) tests were conducted on the East, West and Central MDZ
and the reported Axb values ranged from 28 to 31 and averaged 29, indicating that the material
is very hard with respect to SAG mill impact grinding. Bond ball mill work indices conducted
on the MDZ composites ranged from 19.0 to 20.7 kWh/t indicating that the MDZ material is
very hard with respect to ball mill grinding. The MDZ material is much harder than the current
Marmato material which was reported to have a BWi of 15.7 kWh/t;
• Metallurgical testwork was conducted to evaluate three different flowsheet options that
included:
o Whole-ore cyanidation;
o Gravity concentration followed by cyanidation of the gravity tailing; and
o Gravity concentration followed by flotation and cyanidation of the flotation concentrate.
• The MDZ material responded very well to each of the process flowsheet options tested with
gold recoveries estimated at 94 to 96% and silver recoveries estimated at 38 to 44%;
• Cyanidation leach residues can be detoxified to < 10 mg/L CNWAD using the industry-standard
SO2/Air process; and
• Additional testwork should be conducted during the next phase of study to fully define the
process design criteria and operating parameters.

SRK Consulting (U.S.), Inc. NI 43-101 Technical Report – Marmato Project Page 112
MMS/KD Marmato_PEA_NI43-101_544400.020_Rev31_KD.docx November 2019
14 Mineral Resource Estimate The Mineral Resource Statement presented herein represents the latest mineral resource evaluation
prepared for the Marmato Project reported in accordance with the standard adopted for the reporting
of Mineral Resources of the CIM guidelines, and with NI 43-101 disclosure standards.
SRK has been supplied with electronic databases covering the sampling at the Project, all of which
have been validated by the Company. The databases comprise of a combination of historical and
recent diamond core and underground channel samples. In total, there are 1,165 diamond drillholes
for a combined length of 240,855 m; plus 13,489 individual underground channel samples, inclusive
of current mine sampling contained in the databases.
The resource estimation was completed by Ben Parsons, MSc, MAusIMM (CP), Membership Number
222568, an appropriate “independent qualified person” as this term is defined in National Instrument
43-101. The Effective Date of the resource statement is July 31, 2019.
The database used to estimate the Marmato Project mineral resources was audited by SRK. SRK is
of the opinion that the current drilling information is sufficiently reliable to interpret with confidence the
boundaries for gold and silver mineralization and that the assay data are sufficiently reliable to support
mineral resource estimation.
Leapfrog® (version 4.5.1) was used to generate the geological and mineralization models used to
define the 2017 Marmato model. Datamine™ Studio RM (version 1.5.62.0) was used to construct the
geological solids, prepare assay data for geostatistical analysis, construct the block model, estimate
metal grades and tabulate mineral resources. Snowden Supervisor software (version 8.7.1) was used
for the statistical/geostatistical analysis and variography.
The estimation methodology involved the following procedures:
• Database compilation and verification;
• Construction of wireframe models for the boundaries of the veins;
• Construction of wireframe models for the boundaries of the main other domains including, fault
network, mineralized porphyry, low-grade porphyry, deeps/feeder structures;
• Definition of resource domains;
• Data conditioning (compositing and capping) for statistical analysis, geostatistical analysis,
and variography;
• Block grade interpolation;
• Resource classification and validation;
• Assessment of “reasonable prospects for economic extraction” and selection of appropriate
reporting CoGs; and
• Preparation of the Mineral Resource Statement.
14.1 Drillhole Database
SRK was supplied with ASCII files (.csv) containing the latest drilling and sampling information, in the
form of collar, survey, lithology and assay files. The database provided included all sampling from the
combined drilling database and channel sampling programs. A summary of the database used in the
final estimate is detailed in Table 14-1.

SRK Consulting (U.S.), Inc. NI 43-101 Technical Report – Marmato Project Page 113
MMS/KD Marmato_PEA_NI43-101_544400.020_Rev31_KD.docx November 2019
SRK reviewed the database and imported into both Leapfrog® and Datamine™ RM which have
validation steps included as part of the importing routine. These include reviewing absent collar or
survey information, plus overlapping sampling intervals, conflicting data logging and absent data in
intervals.
SRK is satisfied with the quality of the database for use in the construction of the geological block
model and associated Mineral Resource Estimate
Table 14-1: Summary of Geological Database Information Available by Sample Type and Company
Summary of Channel Sampling Database by Company
Count Minimum
Length (m) Maximum
Length (m) Average Length
(m) Sum Length
(m)
Company
CGD 165 0.0 14.0 1.0 168
CMdC 918 0.0 58.2 3.0 2,764
CNQ 39 1.3 154.8 22.3 871
MAdO 308 1.3 102.2 9.6 2,962
MNL 24,824 0.0 122.2 1.4 35,115
Channel Subtotal 26,254 0.0 154.8 1.6 41,881
Summary of Drilling Sampling Database by Company
Count Minimum
Length (m) Maximum
Length (m) Average Length
(m) Sum Length
(m)
Company
CGD 20 50.9 559.6 296.9 5,937
CGD-GCL 75 16.8 527.4 149.2 11,187
CMdC 205 1.2 587.3 226.9 46,519
CNQ 47 39.2 600.2 316.5 14,874
CNQ-MNL 25 14.0 180.0 72.1 1,803
CNQ-PDG 6 70.6 175.0 116.0 696
GCM 35 127.2 705.5 459.3 16,076
MAdO 342 12.8 1012.1 356.1 121,790
MNL 562 4.0 400.4 84.5 47,509
Drillhole Subtotal 1,317 1.2 1012.1 202.3 266,390
Grand Total 27,571 0.0 1012.1 11.2 308,271
Source: SRK, 2019
SRK notes, in the tables presented, three additional holes (MT-IU-032, MT-IU-033, MT-IU-034), were
included but did not have complete datasets and therefore were excluded from the final PEA model,
and will be included in the next update.
14.2 Geologic Model
14.2.1 Topographic Wireframes
GCM commissioned a detailed topographic map with 2 m contour intervals derived from Ikonos
satellite imagery which was received in early 2007. The new topographic map provides a detailed base
map for improved accuracy when plotting the results of the exploration programs, as well as a high-
resolution satellite image. The topography was converted to a solid model in Vulcan™ to limit the
grade estimate to the surface. This model has been supplied to SRK by the Company.

SRK Consulting (U.S.), Inc. NI 43-101 Technical Report – Marmato Project Page 114
MMS/KD Marmato_PEA_NI43-101_544400.020_Rev31_KD.docx November 2019
14.2.2 Lithological Wireframes
As part of the updated Mineral Resource, GCM and SRK initially focused on the creation of a more
complete geological model (i.e., one encompassing the major geological features inclusive of the
current veins being mined). The main geological units and entities modelled for the resource were:
• Major Fault Network;
• Meta Schist;
• Porphyry (P1 – P4);
• Vein; and
• MDZ.
Drilling during 2011/2012, along with check logging of the drill core by the Company, SRK has
confirmed the presence of a high-grade feeder zone at the core of the main mineralization (MDZ),
which SRK initially modelled based on interpretations provided by the GCM geologists.
14.2.3 Fault Network
GCM geological staff undertook a structural interpretation for the deposit using logged faults and
breccia in drill core, underground mapping and surface traces from the digital topography. A series of
fault wireframes were provided to SRK, which were generally localized around areas of structural data.
SRK has extruded these wireframes to surface using regional mapping and underground development
as a guide, and subsequently clipped these to the topography to create a fault network which has been
used to review the vein interpretations during the geological modelling (Figure 14-1). Where possible,
SRK has attempted to tie the fault interpretations into the latest geological logging.
The final fault network consists of five faults used in the geological model are named:
• Fault Obispo;
• Fault Criminal;
• Fault Sur;
• Fault 2; and
• Fault 4.

SRK Consulting (U.S.), Inc. NI 43-101 Technical Report – Marmato Project Page 115
MMS/KD Marmato_PEA_NI43-101_544400.020_Rev31_KD.docx November 2019
Source: SRK, 2019
Figure 14-1: Summary of Fault Network Plan as Used in the Marmato Geological Model
14.2.4 Vein Models
The vein models have been updated using a combination of the drillhole information, channel
sampling, geological mapping and the initial depletion shapes provided by GCM. The process has
been a collaboration between SRK and GCM to ensure accuracy to the geological conditions mapped
underground are considered. To complete the process GCM geologists supplied SRK with an updated
underground channel database based on the procedures discussed in Section 11.2 of this report.
Additionally, GCM created an initial stope model based on the average dip and strike taken from the
underground long-sections produced by the mine.
SRK imported all the available information into Leapfrog® to aid in the generation of the vein model.
The vein model was created via a staged process. SRK has made a number of modifications to the
geological modelling process in the 2019 update. The changes included combining the vein and halos
domains used during the 2017 process. The decision to combine these domains was based on the
mining methods typically taking both and therefore a single domain will account for some of the edge
dilution, although not all due to minimum mining widths. Also, the incremental gain from the model was
not deemed to add value, and therefore a single pass combining both mineralization domains was
preferred.
The position of the vein within the channel sampling was based on a combination of lithology logging,
gold grade, geological mapping and (base of) stope wireframe data, with interpretation for the vein in
Fault Obispo
Fault Sur
Fault Criminal
Fault 2Fault 4

SRK Consulting (U.S.), Inc. NI 43-101 Technical Report – Marmato Project Page 116
MMS/KD Marmato_PEA_NI43-101_544400.020_Rev31_KD.docx November 2019
less well-informed areas guided by visually evident step changes in the gold grade and characteristics
of the vein (i.e., position, thickness and grade continuity) shown in adjacent samples.
The additional channel (VEN) samples have been sub-divided per GCM ‘VEIN’ code in to three types:
• Vein samples that influence the wireframe. These were deemed by SRK to be visually spatially
positioned correctly with respect to geological mapping, mining development/stope data and
surrounding drillhole assays and logging and have the following ‘Veins_F’ code: ‘V_XXX’;
• Vein samples that do not influence the wireframe, but have a code corresponding to the
relevant structure for use in statistics and grade estimation. These are visually spatially offset
with respect to other geological data (which if incorporated would result in ‘pull points’ to the
vein wireframes and potentially overstate the tonnage) and have the following ‘Veins_F’ code:
‘V_XXX_STM’; and
• Vein samples that were provided by GCM with a structure code, but are (based on visual
review) more likely to be located in discontinuous splay veins in the HW or FW of the modelled
vein. These are left unassigned in the background ‘Veins_F’ coding, and have been
considered for the SPLAY domain.
The process was initially completed on the areas with strong geological control in the mine and then
expanded into the upper and lower levels of the deposit which are predominantly supported by drilling
information only.
SRK has validated the vein model using a series of level plans from the current mining operation for
Levels 16 – 20, and reviewed by GCM geologists for approval (Figure 14-2).
Source: SRK, 2019
Figure 14-2: Level Plan Showing SRK Validation Versus Mining Geological Mapping
SRK Veins

SRK Consulting (U.S.), Inc. NI 43-101 Technical Report – Marmato Project Page 117
MMS/KD Marmato_PEA_NI43-101_544400.020_Rev31_KD.docx November 2019
14.2.5 Splay Veins
As discussed in Section 12, there are a number of intersections left after the definition of the veins
which still have the logging code for “VEN”. SRK has reviewed these samples along with the geological
mapping to identify a number of small splays of the main structures. SRK identified a total of 52
structures which show some degree of geological continuity to be able to define wireframes. SRK
considers the splays to have lower geological confidence to the main veins and further sampling will
be required to confirm potential prior to mining. The wireframe has been created using the vein tools
in Leapfrog® which the boundaries to limit the model defined using polylines by SRK to crop the veins
as appropriate to the main structures (Figure 14-3).
Source: SRK, 2019
Figure 14-3: Plan Showing Location of Splays (Blue) vs Veins Interpretation (Transparent)

SRK Consulting (U.S.), Inc. NI 43-101 Technical Report – Marmato Project Page 118
MMS/KD Marmato_PEA_NI43-101_544400.020_Rev31_KD.docx November 2019
14.2.6 Porphyry Model
The modelling of the porphyry mineralization within the pyrite zone has also undertaken a number of
changes from the previous SRK model. The key changes have been to sub-divide the domain into a
number of major fault blocks, which have been modelled independently. An Indicator shell has been
created in using a 0.5 g/t Au CoG, and an iso-value of 0.45 using 2 m composites. Due to the issue of
the increase in the channel sampling database, with many short channel samples located outside of
the vein models, a restriction has been placed on the samples used during the process. The restriction
has removed any samples logged with a vein or splay code, plus any samples which have a geological
logging code of “VEN, VNA, VNS or VOI”, or have a channel sampling length of less than 3 m (typical
maximum width of mining). SRK has worked under the assumption that the porphyry mineralization
will have some relationship to the orientation of the epithermal vein systems which cross-cut the
porphyry, and that any veinlets would likely be structurally controlled. To apply this condition, SRK has
used a structural trend within Leapfrog when generating the Indicator Grade Models. In order to
generate the structural trends, SRK identified key veins and orientations so not to overload the process
with the complete library of structural features. Structural trends are then based on the orientations of
these veins and structural orientations and are applied to new interpolants to force anisotropy along
these trends.
The resultant wireframes have shown a significant reduction in volume. SRK considers the revised
model more representative and a reasonable interpretation of the geology.
14.2.7 MDZ
In the 2017 model, the MDZ was modelled using a broad outline and an approximate cut-off of 0.7 g/t
Au, but limited geological knowledge restricted the ability produce any sub-domains. In the 2019
models, it is known that the high-grades are typically associated with areas of increase veinlet density
as highlighted by Stillitoe (2019). SRK initially attempted to model the geological continuity of the areas
logged with higher frequency of veinlets, but due to inconsistency in the logging of the historical holes
abandoned this approach for the current model. SRK has provided GCM with a list of holes which will
require relogging to enable further investigation prior to the PFS update. A comparison of the vein
frequency and indicator grade shells showed a strong correlation in the areas of new drilling between
core with a frequency of greater than 20 veinlets per m and a grade shell of 1.7 g/t Au. SRK has
therefore used grade as a pseudo-geological control to produce a higher-grade core within the MDZ.
A summary of the process is shown in Figure 14-4.
To create the Indicator model the following assumptions have been used:
• Only drillholes have been used to define the domain to remove potential errors or overstating
tonnage related to isolated short channel sampling;
• All holes have been composited to 5.0 m, with samples lengths less than 0.5 m at the end of
holes appended to the previous sample;
• CoG of 0.7 and 1.7 g/t were used to define the outer limit of the mineralization, which
represents 13.1% of the database being assigned and indicator value of 1, with all other values
assigned an indicator of 0;
• The general trend for the search ellipse has been orientated to a Dip 85⁰, to a Dip Azimuth of
195⁰, with the ratio set for the ellipse of 5 by 3 by 1.5 in the maximum, intermediate and
minimum directions; and

SRK Consulting (U.S.), Inc. NI 43-101 Technical Report – Marmato Project Page 119
MMS/KD Marmato_PEA_NI43-101_544400.020_Rev31_KD.docx November 2019
• A spherical model has been used using a sill of 0.2 and a nugget of 0.03, using a base range
of 150 m for the interpolant.
An ISO (probability) value of 0.40, with a grid resolution of 5 m has been used to define the wireframes.
Upon review SRK was concerned of potential blow-outs within the 0.7 g/t indicator models at the edge
of the model where limited data exists. SRK has utilized the use of control lines and minimum distances
to restrict the high-grades from artificially increasing the tonnage. These areas are also reviewed
during the classification to limit the chances of over estimation by applying a limit to the Inferred
boundary.

SRK Consulting (U.S.), Inc. NI 43-101 Technical Report – Marmato Project Page 120
MMS/KD Marmato_PEA_NI43-101_544400.020_Rev31_KD.docx November 2019
Source: SRK, 2019
Figure 14-4: Summary of the Process Used to Define the MDZ Model in Leapfrog
Fault
Sur
Fault
Criminal
Fault
Obispo
Fault 4
(new fault)
Fault 3
(new fault)
Fault 2 (Not
Used in current model)
Main
Mineralizaton in Deeps
PY Zone
PO ZoneNote:
Internal PY included in PO Zone if PO
logged as secondary
mineral
15 veins per m
Corridor of
Higher-frequency veins
20 veins per m
25 veins per m 0.7 g/t Au Zone
PO Zone
1.7 g/t
Au Zone

SRK Consulting (U.S.), Inc. NI 43-101 Technical Report – Marmato Project Page 121
MMS/KD Marmato_PEA_NI43-101_544400.020_Rev31_KD.docx November 2019
14.3 Domains
All geological surfaces were cut to the topography, and the final geological model has been reviewed
by the Company for approval and has been deemed acceptable by SRK for use in determining the
Mineral Resource Estimate. Using the wireframes, SRK has coded the drilling and block model
information into five domains which are stored in the block model under the field “GROUP” and
“KZONE” to distinguish between mineralization style and individual mineralized structure. A list of the
domains used is shown in Table 14-2 and in cross section in Figure 14-5.
Table 14-2: Summary of Domain Coding Used in the 2017 Mineral Resource Estimate
Group No
Subdomains Wireframe Domain Description
1000 75 Group1000.dxf Vein High grade sulfide veins
2000 0 Group2000.dxf Halo Not used in the current model and combined with veins in areas of mining to reflect current mining procedures
3000 59 Group3000.dxf Splays Splays of main structure within limited continuity
4000 5 Group4000.dxf- Grade Shell
Mineralized porphyry material (contained within veinlet), characterized by a mixed population of higher grade above an elevation of 850 m, low grade and barren material, marks the default unit for all material, split by fault domain
5000 3 Group5000.dxf Deeps
High grade core or feeder zone to the main mineralization. Located at depth within the porphyry system with limited veinlet mineralization, split into low, medium (0.7 g/t) and high (1.7 g/t).
Source: SRK, 2019
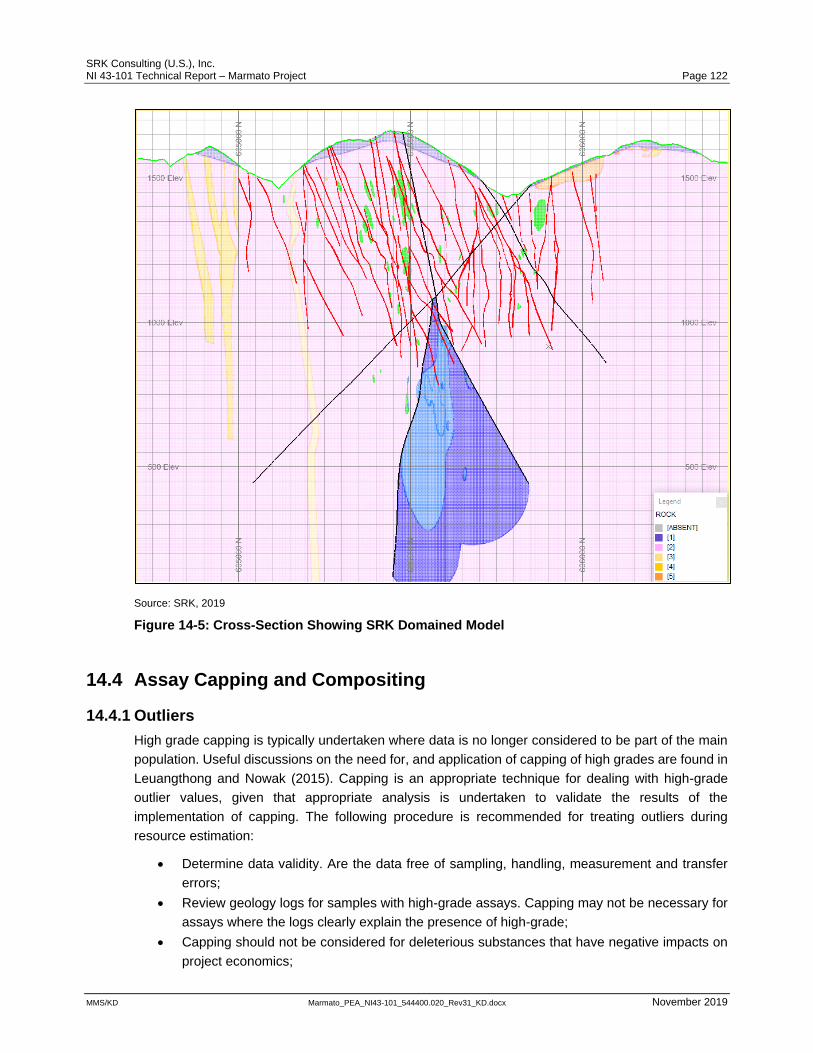
SRK Consulting (U.S.), Inc. NI 43-101 Technical Report – Marmato Project Page 122
MMS/KD Marmato_PEA_NI43-101_544400.020_Rev31_KD.docx November 2019
Source: SRK, 2019
Figure 14-5: Cross-Section Showing SRK Domained Model
14.4 Assay Capping and Compositing
14.4.1 Outliers
High grade capping is typically undertaken where data is no longer considered to be part of the main
population. Useful discussions on the need for, and application of capping of high grades are found in
Leuangthong and Nowak (2015). Capping is an appropriate technique for dealing with high-grade
outlier values, given that appropriate analysis is undertaken to validate the results of the
implementation of capping. The following procedure is recommended for treating outliers during
resource estimation:
• Determine data validity. Are the data free of sampling, handling, measurement and transfer
errors;
• Review geology logs for samples with high-grade assays. Capping may not be necessary for
assays where the logs clearly explain the presence of high-grade;
• Capping should not be considered for deleterious substances that have negative impacts on
project economics;

SRK Consulting (U.S.), Inc. NI 43-101 Technical Report – Marmato Project Page 123
MMS/KD Marmato_PEA_NI43-101_544400.020_Rev31_KD.docx November 2019
• Decide if capping should be considered before or after compositing;
• Keep capping to a necessary minimum. If high-grade assays unduly affect overall grade
average, cap them; and
• Restrict influence of very high-grade assays during the estimation process if required.
Upon review of the domained samples, SRK elected to apply the capping post compositing for the
current estimate. To define the appropriate capping levels, SRK completed analysis of the grade
distributions using log probability plots, raw and log histograms Figure 14-6 to Figure 14-10 (with the
selected caps highlighted in yellow) to distinguish the grades at which samples have significant
impacts on the local estimation and whose effect is considered extreme. Full details of the capping
analysis and comparison historgrams are shown in Appendix B.

SRK Consulting (U.S.), Inc. NI 43-101 Technical Report – Marmato Project Page 124
MMS/KD Marmato_PEA_NI43-101_544400.020_Rev31_KD.docx November 2019
Column Cap Capped Percentile Capped% Lost
Total% Lost CV%
Count Min Max Mean Variance CV
AU 53839 0 891 4.88 160.2 2.6
AU 200 36 99.90% 0.10% 1.40% 15% 53839 0 200 4.81 113.9 2.22
AU 100 169 99.80% 0.30% 3.70% 25% 53839 0 100 4.70 84.02 1.95
AU 75 284 99.60% 0.50% 5.30% 30% 53839 0 75 4.62 71.28 1.83
AU 62 402 99.40% 0.70% 6.60% 33% 53839 0 62 4.56 63.4 1.75
AU 50 579 99.20% 1.10% 8.30% 36% 53839 0 50 4.47 54.87 1.66
AU 40 861 98.70% 1.60% 10% 40% 53839 0 40 4.37 46.71 1.56
AU 40 861 98.70% 1.60% 10% 40% 53839 0 40 4.37 46.71 1.56
AU 33 1188 98.30% 2.20% 12% 43% 53839 0 33 4.27 40.09 1.48
AU 20 2739 95.90% 5.10% 20% 51% 53839 0 20 3.92 25.14 1.28
AU 15 4236 93.50% 7.90% 25% 55% 53839 0 15 3.66 18.19 1.16
AU AU > 50 579 50.1 891 98.13 5907 0.78
AU AU <= 50 53260 0 50 4.09 37.67 1.50
Source: SRK, 2019
Figure 14-6: Capping Analysis Veins Domain Au (g/t) – (KZONE<9000)
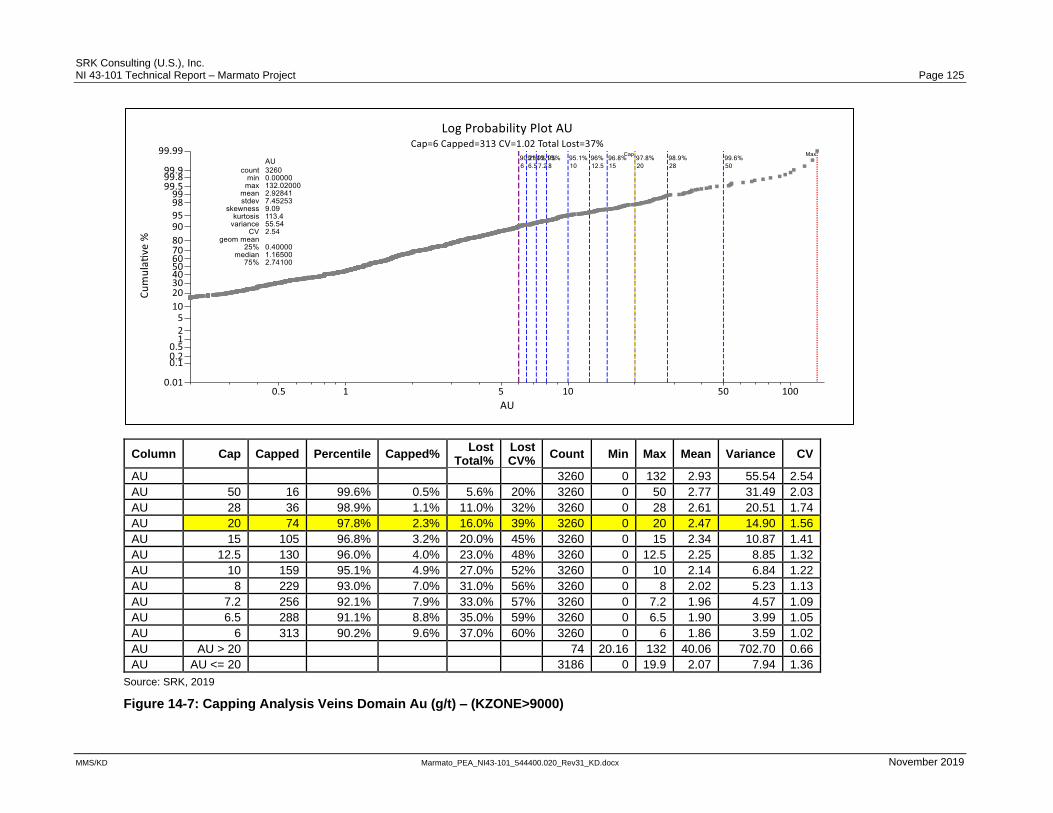
SRK Consulting (U.S.), Inc. NI 43-101 Technical Report – Marmato Project Page 125
MMS/KD Marmato_PEA_NI43-101_544400.020_Rev31_KD.docx November 2019
Column Cap Capped Percentile Capped% Lost
Total% Lost CV%
Count Min Max Mean Variance CV
AU 3260 0 132 2.93 55.54 2.54
AU 50 16 99.6% 0.5% 5.6% 20% 3260 0 50 2.77 31.49 2.03
AU 28 36 98.9% 1.1% 11.0% 32% 3260 0 28 2.61 20.51 1.74
AU 20 74 97.8% 2.3% 16.0% 39% 3260 0 20 2.47 14.90 1.56
AU 15 105 96.8% 3.2% 20.0% 45% 3260 0 15 2.34 10.87 1.41
AU 12.5 130 96.0% 4.0% 23.0% 48% 3260 0 12.5 2.25 8.85 1.32
AU 10 159 95.1% 4.9% 27.0% 52% 3260 0 10 2.14 6.84 1.22
AU 8 229 93.0% 7.0% 31.0% 56% 3260 0 8 2.02 5.23 1.13
AU 7.2 256 92.1% 7.9% 33.0% 57% 3260 0 7.2 1.96 4.57 1.09
AU 6.5 288 91.1% 8.8% 35.0% 59% 3260 0 6.5 1.90 3.99 1.05
AU 6 313 90.2% 9.6% 37.0% 60% 3260 0 6 1.86 3.59 1.02
AU AU > 20 74 20.16 132 40.06 702.70 0.66
AU AU <= 20 3186 0 19.9 2.07 7.94 1.36
Source: SRK, 2019
Figure 14-7: Capping Analysis Veins Domain Au (g/t) – (KZONE>9000)

SRK Consulting (U.S.), Inc. NI 43-101 Technical Report – Marmato Project Page 126
MMS/KD Marmato_PEA_NI43-101_544400.020_Rev31_KD.docx November 2019
Column Cap Capped Percentile Capped% Lost Total%
Lost CV%
Count Min Max Mean Total Variance CV
AU 2683 0 405.6 5.46 14637 253.8 2.92
AU 60 25 99.10% 0.90% 10% 36% 2683 0 60 4.89 13131 82.8 1.86
AU 50 43 98.40% 1.60% 13% 40% 2683 0 50 4.77 12788 70.09 1.76
AU 40 51 98.10% 1.90% 16% 44% 2683 0 40 4.60 12336 56.54 1.64
AU 30 75 97.30% 2.80% 20% 49% 2683 0 30 4.37 11734 42.97 1.5
AU 25 96 96.40% 3.60% 23% 52% 2683 0 25 4.21 11305 35.59 1.42
AU 20 136 94.90% 5.10% 27% 55% 2683 0 20 4.00 10739 27.88 1.32
AU 18 163 93.90% 6.10% 29% 56% 2683 0 18 3.89 10437 24.49 1.27
AU 15 205 92.40% 7.60% 33% 59% 2683 0 15 3.68 9878 19.22 1.19
AU 12.5 242 90.90% 9.00% 36% 62% 2683 0 12.5 3.48 9323 15.02 1.12
AU 11.5 270 89.90% 10.10% 38% 63% 2683 0 11.5 3.38 9066 13.39 1.08
AU AU > 40 51 40.09 405.6 85.13 4341 5286 0.85
AU AU <= 40 2632 0 39.72 3.91 10296 32.87 1.47
Source: SRK, 2019
Figure 14-8: Capping Analysis Splays Domain Au (g/t) – (Group = 3000)

SRK Consulting (U.S.), Inc. NI 43-101 Technical Report – Marmato Project Page 127
MMS/KD Marmato_PEA_NI43-101_544400.020_Rev31_KD.docx November 2019
Column Cap Capped Percentile Capped% Lost
Total% Lost CV%
Count Min Max Mean Variance CV
AU 11119 0.001 365.1 2.51 77.75 3.52
AU 90.0 11 99.90% 0.10% 4.80% 32% 11119 0.001 90 2.39 32.82 2.40
AU 60.0 21 99.80% 0.20% 6.30% 37% 11119 0.001 60 2.35 27.45 2.23
AU 45.0 43 99.60% 0.40% 8% 41% 11119 0.001 45 2.31 23.26 2.09
AU 30.0 100 99.10% 0.90% 12% 47% 11119 0.001 30 2.21 16.77 1.85
AU 20.1 167 98.50% 1.50% 16% 54% 11119 0.001 20.07 2.10 11.57 1.62
AU 14.7 256 97.70% 2.30% 20% 58% 11119 0.001 14.71 2.00 8.57 1.47
AU 11.5 367 96.70% 3.30% 24% 62% 11119 0.001 11.51 1.91 6.61 1.35
AU 7.6 639 94.20% 5.70% 31% 67% 11119 0.001 7.6 1.74 4.05 1.16
AU 6.0 865 92.20% 7.80% 35% 70% 11119 0.001 6 1.63 2.96 1.06
AU 5.0 1076 90.30% 9.70% 38% 72% 11119 0.001 5 1.54 2.27 0.98
AU AU > 30 100 30.08 365.1 62.74 3937.00 1.00
AU AU <= 30 11019 0.001 29.8 1.96 9.85 1.60
Source: SRK, 2019
Figure 14-9: Capping Analysis Porphyry Domain Au (g/t) – (Group = 4000)

SRK Consulting (U.S.), Inc. NI 43-101 Technical Report – Marmato Project Page 128
MMS/KD Marmato_PEA_NI43-101_544400.020_Rev31_KD.docx November 2019
Column Cap Capped Percentile Capped% Lost Lost
Count Min Max Mean Variance CV Total% CV%
AU KZONE 0 = Raw 6828 0 262.9 0.60 17.97 7.09
AU 15 18 99.70% 0.30% 18% 65% 6828 0 15 0.49 1.47 2.48
AU 10 29 99.60% 0.40% 21% 69% 6828 0 10 0.47 1.11 2.22
AU 9 34 99.50% 0.50% 22% 70% 6828 0 9 0.47 1.02 2.16
AU 8 45 99.30% 0.70% 23% 71% 6828 0 8 0.46 0.93 2.08
AU 7.5 52 99.30% 0.80% 23% 71% 6828 0 7.5 0.46 0.87 2.04
AU 6.5 62 99.10% 0.90% 25% 73% 6828 0 6.5 0.45 0.77 1.94
AU 5.5 82 98.70% 1.20% 26% 74% 6828 0 5.5 0.44 0.65 1.83
AU 4 115 98.30% 1.70% 30% 77% 6828 0 4 0.42 0.47 1.63
AU 3 159 97.70% 2.30% 33% 79% 6828 0 3 0.40 0.35 1.48
AU 2 267 96.10% 3.90% 38% 82% 6828 0 2 0.37 0.23 1.29
AU KZONE = 0 - AU > 7.5 52 7.52 262.9 25.71 1691 1.6
AU KZONE = 0 - AU <= 7.5 6776 0 7.44 0.41 0.5 1.74
AU KZONE 1 = Raw 5393 0.001 345.9 1.73 42.33 3.77
AU 60 5 99.90% 0.10% 5.40% 42% 5393 0.001 60 1.63 12.58 2.17
AU 30 17 99.70% 0.30% 8.70% 52% 5393 0.001 30 1.58 7.99 1.79
AU 20 30 99.40% 0.60% 11% 57% 5393 0.001 20 1.53 6.07 1.61
AU 12 74 98.70% 1.40% 15% 63% 5393 0.001 12 1.46 4.07 1.38
AU 10 100 98.20% 1.90% 17% 65% 5393 0.001 10 1.43 3.47 1.3
AU 8 138 97.40% 2.60% 20% 68% 5393 0.001 8 1.39 2.8 1.21
AU 7 176 96.70% 3.30% 21% 69% 5393 0.001 7 1.36 2.45 1.15
AU 6 216 96% 4% 23% 71% 5393 0.001 6 1.32 2.07 1.09
AU 5 292 94.60% 5.40% 26% 73% 5393 0.001 5 1.28 1.68 1.02
AU 4 398 92.60% 7.40% 30% 75% 5393 0.001 4 1.21 1.27 0.93
AU KZONE = 1 - AU > 3.5 474 3.508 345.9 9.82 404.3 2.05
AU KZONE = 1 - AU <= 3.5 4919 0.001 3.5 0.95 0.59 0.81
AU KZONE 2 = Raw 2073 0.001 246.5 4.08 90.65 2.33
AU 62 5 99.80% 0.20% 5.20% 34% 2073 0.001 62 3.87 35.45 1.54
AU 30 25 98.80% 1.20% 9.30% 45% 2073 0.001 30 3.70 22.61 1.28
AU 25 28 98.70% 1.40% 11% 48% 2073 0.001 25 3.64 19.57 1.22
AU 19 52 97.50% 2.50% 14% 52% 2073 0.001 19 3.53 15.55 1.12
AU 15 76 96.30% 3.70% 17% 56% 2073 0.001 15 3.41 12.3 1.03
AU 12 104 95% 5% 20% 59% 2073 0.001 12 3.27 9.66 0.95
AU 11 126 93.90% 6.10% 21% 61% 2073 0.001 11 3.22 8.75 0.92
AU 10 148 92.90% 7.10% 23% 62% 2073 0.001 10 3.15 7.79 0.89
AU 9 174 91.60% 8.40% 25% 64% 2073 0.001 9 3.08 6.82 0.85
AU 8 207 90% 10% 27% 65% 2073 0.001 8 2.99 5.82 0.81
AU KZONE = 2 - AU > 30 25 30.09 246.5 61.64 3110 0.9
AU KZONE = 2 - AU <= 30 2048 0.001 29.88 3.38 14.33 1.12
Source: SRK, 2019
Figure 14-10: Capping Analysis MDZ Sub-domains Domain Au (g/t) – (Group = 5000)

SRK Consulting (U.S.), Inc. NI 43-101 Technical Report – Marmato Project Page 129
MMS/KD Marmato_PEA_NI43-101_544400.020_Rev31_KD.docx November 2019
SRK reviewed and updated the capping/composite strategy at Marmato as part of the 2019 Mineral
Resource update. In 2019, the selected capping limits are as follows:
• Veins: A 50 g/t Au cap in the major veins with large numbers of samples, dropping to 20 g/t
Au in veins with lower sampling density. A standard cap for all veins of 150 g/t Ag has been
selected;
• Splay: A 40 g/t Au and 80 g/t silver (Ag) cap for all splays has been used;
• Porphyry: A 15 g/t Au cap has been used for all material, but the silver capping has been split
based on the assumption of higher silver grades within the Echandia area of 120 g/t and 550
g/t Ag respectively; and
• MDZ: A sliding cap related to the varying grade shells used to model at depth has been applied
with a cap ranging from 7.5 g/t Au, to 12.0 g/t Au and 30 g/t Ag cap, for the low, medium and
higher grade components.
Overall, these levels remain consistent with the capping levels used previously, with application of the
capping restrictions supported by improvements in the definition of the grade populations for the veins
from the channel sampling.
In general, SRK aims to limit the impact of the capping to less than 5% change in the mean value,
however in some cases with extreme outliers, the change in the mean exceeds 5%. The highly
positively skewed nature of the gold distributions and the very high values seen in the population result
in the significant changes in the mean values. A comparison of the raw versus capped values is shown
in Table 14-3.

SRK Consulting (U.S.), Inc. NI 43-101 Technical Report – Marmato Project Page 130
MMS/KD Marmato_PEA_NI43-101_544400.020_Rev31_KD.docx November 2019
Table 14-3: Comparison of Raw vs. Capped Composite Statistics
Element GROUP KZONE Number Values
Minimum (g/t) Maximum (g/t) Mean (g/t) Variance Standard Deviation
Coefficient of Variation
Difference (%)
Au Raw 1000 All 54,179 0.001 891.03 4.67 154.74 12.44 2.67
Au Raw 3000 All 2,716 0.001 405.62 4.81 222.03 14.90 3.10
Au Raw 4000 All 7,508 0.001 306.41 1.46 19.13 4.37 3.00
Au Raw 5000 0 6,827 0.001 262.94 0.31 3.20 1.79 5.76
Au Raw 5000 1 5,393 0.001 345.92 1.42 21.66 4.65 3.28
Au Raw 5000 2 2,073 0.001 246.50 3.69 58.33 7.64 2.07
Ag Raw 1000 All 53,892 0.001 1,995.00 25.09 1,242.74 35.25 1.41
Ag Raw 3000 All 2,583 0.001 432.00 21.48 765.70 27.67 1.29
Ag Raw 4000 All 7,444 0.001 5,613.00 14.30 8,559.22 92.52 6.47
Ag Raw 5000 0 6,828 0.001 316.08 1.66 33.78 5.81 3.49
Ag Raw 5000 1 5,391 0.001 258.92 2.57 36.65 6.05 2.36
Ag Raw 5000 2 2,073 0.001 162.06 5.00 81.91 9.05 1.81
Au Comp 1000 all 21,893 0.001 50.00 4.54 35.89 5.99 1.32 -2.8%
Au Comp 3000 all 1,093 0.001 40.00 4.40 33.98 5.83 1.33 -8.6%
Au Comp 4000 all 5,733 0.001 15.00 1.44 3.48 1.86 1.30 -1.2%
Au Comp 5000 0 5,714 0.003 7.50 0.32 0.45 0.67 2.11 2.8%
Au Comp 5000 1 3,683 0.003 12.00 1.46 2.75 1.66 1.14 3.0%
Au Comp 5000 2 1,215 0.005 30.00 3.52 12.59 3.55 1.01 -4.7%
Ag Comp 1000 all 21,893 0.001 150.00 24.62 535.67 23.14 0.94 -1.9%
Ag Comp 3000 all 1,093 0.001 80.00 20.78 311.72 17.66 0.85 -3.2%
Ag Comp 4000 all 5,693 0 550.00 12.71 1,433.50 37.86 2.98 -11.1%
Ag Comp 5000 0 5,714 0.005 30.00 1.66 11.19 3.34 2.02 -0.3%
Ag Comp 5000 1 3,683 0.001 30.00 2.66 11.32 3.36 1.27 3.4%
Ag Comp 5000 2 1,215 0.005 30.00 4.69 29.06 5.39 1.15 -6.3%
Source: SRK, 2019

SRK Consulting (U.S.), Inc. NI 43-101 Technical Report – Marmato Project Page 131
MMS/KD Marmato_PEA_NI43-101_544400.020_Rev31_KD.docx November 2019
14.4.2 Compositing
Prior to the undertaking of grade interpolation, samples need to be composited to equal lengths for
constant sample volume, honoring sample support theories.
SRK has undertaken a sample composite analysis for gold in order to determine the optimal sample
composite length for grade interpolation. This investigated both changes in composite length and
minimum composite lengths for inclusion. The analysis compared the resultant mean grade against
the length weighted raw sample mean grades, and the percentage of samples excluded when applying
the minimum composite length. In addition to the analysis completed, SRK has reviewed the
histograms of the raw sampling lengths within the various domains (Figure 14-11). During the review
SRK noted the following:
• A review of the sample lengths indicated that the mean sample length is approximately 0.5 m
veins, but 45% of the samples are between 0.5 to 1.0 m, with a further 5% between 1.0 to
2.0 m.
• The average length of the raw sampling in the porphyry and deep mineralization is 1.0 m, with
the majority of the samples ranging between 1.0 to 2.0 m.
Given the narrow nature of the veins, it is SRK’s view that increasing the sample lengths to 2.0 m is
preferred so only a single composite will exist across in the vein in narrow areas. SRK has elected to
also use the 2.0 m composite lengths in porphyry and deep zones.

SRK Consulting (U.S.), Inc. NI 43-101 Technical Report – Marmato Project Page 132
MMS/KD Marmato_PEA_NI43-101_544400.020_Rev31_KD.docx November 2019
Source: SRK, 2019
Figure 14-11: Histogram of Sample Lengths Within the Various Domains

SRK Consulting (U.S.), Inc. NI 43-101 Technical Report – Marmato Project Page 133
MMS/KD Marmato_PEA_NI43-101_544400.020_Rev31_KD.docx November 2019
14.5 Density
Density measurements are made routinely by GCM geologists during core logging and sample
preparation. Each geologist tries to make one density measurement daily and to complete the
calculation the following procedure has been used:
• A piece of unbroken core is selected;
• A 14 to 15 cm long piece of core from the interval of interest is cut;
• As the core is cut, the geologist must ensure that the cut is perpendicular to the core axis and
does not result in the loss of any material along the cut line;
• The length of the core is measured and the diameter of the core is determined with a digital
caliper at 3 to 4 cm intervals and the average diameter is calculated; and
• The core is weighed on a digital balance and the density is calculated as follows:
o Pi * core diameter * core length = core volume; and
o Core weight / core volume = density.
SRK completed a statistical review of the density measurements in the database provided up to
drillhole MT-IU-031. The database included a total of 3,289 samples with results ranging from 2.01 to
4.75 g/cm3. The majority of the samples have been taken within the various phases of porphyry
mineralization which have a range of 2.04 to 3.85 g/cm3. The highest measured density based on the
drillcore is taken from the vein material which returned an average of 3.39 g/cm3, but also contained
the highest variability. A summary of the measured density per major rocktype is shown in Table 14-4
and Figure 14-13.
Table 14-4: Summary of Density Values
Domain Count Min Max Mean Total Variance StDev CV
3289 2.01 4.75 2.69 8857 0.03 0.177 0.07
AP 48 2.42 2.89 2.71 130 0.01 0.076 0.03
BX 18 2.62 2.95 2.74 49.36 0.01 0.093 0.03
FLT 4 2.5 2.8 2.68 10.7 0.02 0.126 0.05
P1 1743 2.1 3.42 2.67 4650 0.01 0.099 0.04
P2 1012 2.04 3.85 2.68 2709 0.01 0.11 0.04
P3 54 2.29 2.81 2.64 142.3 0.01 0.092 0.04
P4 201 2.18 3.18 2.70 541.9 0.01 0.093 0.03
P5 25 2.49 2.78 2.60 65.03 0.01 0.075 0.03
SCH 113 2.24 3.44 2.82 318.4 0.03 0.161 0.06
VEN 71 2.01 4.75 3.39 240.4 0.44 0.66 0.19
Source: SRK 2019

SRK Consulting (U.S.), Inc. NI 43-101 Technical Report – Marmato Project Page 134
MMS/KD Marmato_PEA_NI43-101_544400.020_Rev31_KD.docx November 2019
Source: SRK, 2019
Figure 14-12: Summary of Review by Rocktype of Density Values at Marmato
In the 2017 Mineral Resource, the density has been grouped into three main units, which are
comprised of the porphyry, schist and vein rocktypes. SRK has compared these values to the 2017
model and discussed with the current mining operations team. The porphyry domain has been kept at
the same value as the 2017 block model which used an average density of 2.7 g/cm3. SRK still
considers this to be reasonable but comments that it could fluctuate between 2.65 to 2.70 g/cm3, and
should therefore be reviewed within the Marmato Deeps Zone based on the results of the current on-
going infill drilling program being completed by the Company for preparation for a future PFS. If a lower
density is applied, it would impact the overall tonnage less than 2%.
The mine reported that it currently uses a lower density for the vein material based on the feed at the
plant closer to 2.7 to 2.9 g/cm3 range and that there could be risk of overstating the tonnage using a
3.4 g/cm3 as shown from the statistical analysis. The basis for the lower density is likely due to
favorable sampling of higher sulphides in the core which do not reflect the mined stope widths.
Therefore, to provide a more relatistic assessment of the density, SRK completed a statistical review
of the vein samples using histograms and log-probability plots which still indicates a density of over
3.0 g/cm3 is reasonable based even on extreme cappinig of values greater than 3.25 g/cm3.
2.7 g/cm3 2.8 g/cm3 3.3 g/cm3

SRK Consulting (U.S.), Inc. NI 43-101 Technical Report – Marmato Project Page 135
MMS/KD Marmato_PEA_NI43-101_544400.020_Rev31_KD.docx November 2019
Cap Capped Percentile Capped% Count Min Max Mean
71 2.01 4.75 3.386
4.622 1 99% 1.40% 71 2.01 4.622 3.384
4.549 2 98% 2.80% 71 2.01 4.549 3.383
4.516 3 97% 4.20% 71 2.01 4.516 3.382
4.495 3 96% 4.20% 71 2.01 4.495 3.381
4.485 4 95% 5.60% 71 2.01 4.485 3.38
4.475 5 94% 7.00% 71 2.01 4.475 3.38
4.461 5 93% 7.00% 71 2.01 4.461 3.379
4.453 6 92% 8.50% 71 2.01 4.453 3.378
4.407 7 91% 9.90% 71 2.01 4.407 3.374
4.336 8 90% 11.30% 71 2.01 4.336 3.366
3.25 33 53.50% 46.50% 71 2.01 3.25 3.029
DEN_MAJOR = VEN - DENSITY > 3.25 33 3.4 4.75 4.018
DEN_MAJOR = VEN - DENSITY <= 3.25 38 2.01 3.25 2.837
Source: SRK, 2019
Figure 14-13: Log Probability Plot of Density Measurements Logged as Vein
To reflect density values more consistent with the mining, SRK has updated the statisitical analysis to
using a sub-set of the density database and the veins wireframes generated from the geological model
using a halo of 0.5 m either side of the veins and rerun the analysis. The results of the analysis returned
a mean density of 2.97 g/cm3 (rounded to 2.95 g/cm3). In discussion with the GCM geological team it
was felt this was a more reasonable represention of the density for the vein domain. In summary, the
final density values used in the 2019 Mineral Resources are presented in Table 14-5 which also
compares them to the density values used in the 2017 block model.
Table 14-5: Summary of Density Values Used in 2019 Mineral Resource
Rock Type No. Samples 2017 2019
Density (gcm3) Density (gcm3)
Vein 71 3.5 2.95
Porphyry 2,857 2.7 2.7
Schist 97 2.8 2.8
Source: SRK, 2019

SRK Consulting (U.S.), Inc. NI 43-101 Technical Report – Marmato Project Page 136
MMS/KD Marmato_PEA_NI43-101_544400.020_Rev31_KD.docx November 2019
14.6 Variogram Analysis and Modeling
The composite drillhole database was imported into Snowden Supervisor software for the
geostatistical analysis. Semi-variograms have been completed for both gold and silver values. The
resultant experimental semi-variogram models produced were poor in terms of definition to fit a
statistical model. In order to define variograms of sufficient clarity to be modelled, the data has been
calculated using pairwise relative variograms, which removes the influence of some of the variability.
Following the pairwise transformation, the next stage was to define the nugget effect from down-hole
variogram and then to model the longer variogram ranges from longer lag directional variograms in
the three principle directions, downdip (N0), along-strike (D90) and perpendicular to the bedding plane
(N90). An example of the semi-variograms is shown in Figure 14-14. SRK noted poor continuity in the
initial analysis of the directional semi-variograms so has elected to use omni-directional models for the
current estimate (Table 14-6). Further infill drilling is required to improve the distance between samples
at depth to improve the variography.
Table 14-6: Summary of Semi-Variogram Parameters Used in the 2019 Estimation Process
Domain Vein Splay Porphyry Deeps
Element Au Ag Au Ag Au Ag Au_0.7 Au_1.7 Ag
Ref Number 1001 1002 3001 3002 4001 4002 5001 5002 5003
Nugget 0.35 0.25 0.35 0.25 0.99 0.5 0.48 0.24 0.36
Range 1 (m) 3.6 9.4 1.6 2.3 7 19 15 15 15
Sill 1 0.277 0.341 0.181 0.178 0.09 0.53 0.47 0.5 0.26
Range 2 (m) 22 56.1 15.4 11.7 35 73 80 65 60
Sill 2 0.295 0.32 0.091 0.153 0.26 0.14 0.26 0.26 0.42
Range 3 (m) 139.5 384.5 55.2 54.8 70
Sill 3 0.078 0.089 0.378 0.419 0.14
Source: SRK, 2019

SRK Consulting (U.S.), Inc. NI 43-101 Technical Report – Marmato Project Page 137
MMS/KD Marmato_PEA_NI43-101_544400.020_Rev31_KD.docx November 2019
Source: SRK, 2019
Figure 14-14: Example of Semi-Variogram Analysis for Veins Domain (Group 1000)
14.7 Block Model
14.7.1 Protoype Definition
SRK has produced a parent block model with block dimensions of 5 by 5 by 5 m (X,Y,Z), as a function
of the sample spacing within the veins, Previous test work undertaken for block variance suggested a
10 by 10 by 10 m block size was appropriate, but the smaller block size was preferred with the increase
in the information within the vein domains, and reflect potential for selectivity for mining. SRK
acknowledges a larger block size could be more appropriate, but the decision was taken to use a
uniform block size across the deposit in conjunction with the mining team. SRK is recommending a
more detailed study be completed during a future prefeasibility study to test the sensitivity of this
assumption. Sub-blocking has been allowed to a resolution 0.5 m along strike, 0.5 m across strike and
1 m in the vertical direction to provide an appropriate geometric representation.
Given the orientation of the orebody striking to the northwest, the decision was made to rotate the
database (for block model grade interpolation) from UTM coordinates through 55 degrees into a

SRK Consulting (U.S.), Inc. NI 43-101 Technical Report – Marmato Project Page 138
MMS/KD Marmato_PEA_NI43-101_544400.020_Rev31_KD.docx November 2019
north-south local grid orientation, to enable an improved representation of grade continuity along strike.
To rotate the interpretation the “CDTRAN” Datamine™ command has been utilized.
The details of the block model origin, rotation and local dimensions are shown in Table 14-7.
Table 14-7: Summary of Block Model Parameters used for Geological Model
Dimension Origin (UTM)
Origin (Local)
Block Size
Number of Blocks
Rotation Min Sub-blocking
(m)
X 433,250 0 5 420 - 0.5
Y 604,250 0 5 460 - 0.5
Z 100 100 5 400 -55 1
Source: SRK, 2019
14.7.2 Model Codes
Using the wireframes created and described in Section 14.2 several codes have been developed to
describe each of the major geological properties of the rock types. Table 14-8 summarizes geological
fields created within the geological model and the codes used.
Table 14-8: Summary of Block Model Fields and Description
Field Name Description
SVOL Search Volume reference (range from 1 to 3)
KV Kriging Variance
SLOPE Slope of regression
NS Number of samples used to estimate the block
AU Final Gold Estimate using for Reporting
AG Final Silver Estimate using for Reporting
AUOK Gold Estimate using OK
AGOK Silver Estimate using OK
AUIDW Gold Estimate using IDW (Power 2)
AGIDW Silver Estimate using IDW (Power 2)
AUNN Gold NN Methodology
AGNN Silver NN Methodology
CLASS Classification
GROUP Mineralized structures grouped by domain
VEIN Vein coding for individual mineralized structure GROUP1000 coding
SPLAY Vein coding for individual mineralized structure GROUP3000 coding
DENSITY Density of the rock
DEPLETE Mined out areas
ROCK Coding for Major Rock type
Source: SRK, 2019
14.8 Estimation Methodology
A Kriging Neighborhood Analysis (KNA) exercise has been completed for gold, in order to optimize
the parameters used in the estimation and kriging calculations. Initial grade estimation was undertaken
in Datamine™. To complete the exercise, a number of scenarios were tested using various estimation
and kriging parameters. Different input parameters have been changed and the differences in the
slope of regression, kriging variances, and block estimates recorded.
To complete the analysis, SRK ran different estimates for Au, changing the following parameters:
• Search ellipse sizes;
• Minimum and maximum number of samples; and

SRK Consulting (U.S.), Inc. NI 43-101 Technical Report – Marmato Project Page 139
MMS/KD Marmato_PEA_NI43-101_544400.020_Rev31_KD.docx November 2019
• Orientation of search ellipse.
In order to assess the best grade estimate, the following data fields were analyzed in most detail:
kriging variance; number of samples; and proportion of blocks estimated in each search volume.
Additional fields monitored included the resultant grade in comparison with the sample data. To test
the optimum search volume to be used, SRK has selected a first pass minimum and maximum number
of samples and adjusted the expansion factor of the semi-variogram range used per estimate per zone.
The optimum parameters selected allowed an appropriate proportion of block estimates in the initial
search volumes, whilst achieving a reduction in variance and a relative increase in slope of regression
(in SVOL 1 and 2) without excessive smoothing.
Based on the outcome of the validation process, SRK has selected to use either OK algorithm, or ID2
estimates to compile the final grade estimates. Typically zones with larger sample populations are
supported by OK, while zones with less data are supported by ID2, which has been used for the
primary interpolation within anisotropic elliptical search ranges using suitable parameters. The search
distances used for the interpolations were based upon an expansion factor of the semi-variogram
ranges. Individual searches were specified for each data field.
In completing a detailed review of the vein and the veinlet style mineralization, SRK concluded that
given the presence of two principal strike and dip directions a bias could be introduced if a single
search orientation was selected per zone. To ensure the block model reflects the nature of the vein
mineralization as accurately as possible, SRK therefore utilized the wireframe interpretation to aid in
determining the search orientations used during the kriging equations on a block by block basis. This
has been done using the dynamic anisotropy function in Datamine™.
In addition to varying the number of samples, second and third radius factored search volumes have
been used for all estimation domains. The first search represents an optimized search distance
(selected from a kriging sensitivity analysis), ensuring (in general) that block estimates use a minimum
of two drillholes, whilst the second and third search volumes use expansion factors that produce more
smoothed block estimates, appropriate to the limit of geological continuity.
The third expansion volume was sufficient to ensure that all appropriate blocks (in areas with
reasonable geological confidence) were assigned grade values. These blocks were generally
classified with lower confidence.
SRK tested the estimation sensitivity of the gold grade distribution and mean grade and tonnage of
the MDZ using a progressively steepening (dip) of the search ellipse. In general, the global mean
grade and tonnage of MDZ shows only limited sensitivity to variation in dip of the search ellipse, whilst
the visual gold grade distribution appears to most accurately honor the dip continuity of the sample
grades at a dip of 80°.
The final kriging parameters selected for gold and silver are presented in Table 14-9. A discretization
grid of 3 by 3 by 3 has been used within each parent block during the estimation. The discretization
grid ensures that single blocks near the edge of each estimation zone are assigned a grade that is
characteristic of the modelled domain and not just those values at the block midpoint.

SRK Consulting (U.S.), Inc. NI 43-101 Technical Report – Marmato Project Page 140
MMS/KD Marmato_PEA_NI43-101_544400.020_Rev31_KD.docx November 2019
Table 14-9: Summary of Final Ordinary Kriging Parameters for Gold at Marmato
Group
Rotation Axis Search Range Number Samples
Octants Angle 1
Axis Angle
2 Axis
Angle 3
Axis Along Strike
Down Dip
Across Strike
Min Max Max Per
Hole
Max Per Octant
First Range
1000 Dynamic 50 50 50 5 20 na 4 Yes
3000 Dynamic 50 50 50 5 20 na 4 Yes
4000 15 Z -80 X 0 Y 35 35 15 6 12 4 na No
5000 30 Z 85 X 0 Y 75 75 15 4 12 3 na No
Second Range
1000 Dynamic 250 250 250 5 10 na 4 Yes
3000 Dynamic 250 250 250 5 10 na 4 No
4000 15 Z -80 X 0 Y 70 70 40 4 12 3 na No
5000 30 Z -80 X 0 Y 150 150 30 4 8 3 na No
Third Range
1000 Dynamic 250 250 250 1 8 na 4 Yes
3000 Dynamic 250 250 250 1 8 na 4 Yes
4000 15 Z -80 X 0 Y 140 140 80 1 8 3 No
5000 30 Z -80 X 0 Y 300 300 60 1 8 3 No
Source: SRK: 2019
14.9 Model Validation
SRK has undertaken a thorough validation of the resultant interpolated model in order to confirm the
estimation parameters, to check that the model represents the input data on both local and global
scales and to check that the estimate is not biased. SRK has undertaken this using a number of
different validation techniques:
• Visual inspection of block grades in comparison with drill hole data;
• Inspection of block grades in plan and section and comparison with drillhole grades;
• Statistical validation of declustered means versus block estimates;
• Comparison of estimates using different estimation methods (NN, IDW, OK); and
• Swath plots of the mean block and sample grades.
The geology model, geostatistical analysis, variography, selection of resource estimation parameters,
and construction of the block model work were completed by SRK. The current drilling information is
sufficiently reliable to interpret with confidence the boundaries of the various veins, and the assaying
data is sufficiently reliable to support Mineral Resource estimation.
14.9.1 Visual Comparison
Visual validation provides a local validation of the interpolated block model on a local block scale,
using visual assessments and validation plots of sample grades versus estimated block grades. A
thorough visual inspection of cross-sections, long-sections and bench/level plans, comparing the
sample grades with the block grades has been undertaken, which demonstrates good comparison
between local block estimates and nearby samples, without excessive smoothing in the block model.
Figure 14-15 and Figure 14-16 show examples of the visual validation checks and highlights the overall
block grades corresponding with raw samples grades.

SRK Consulting (U.S.), Inc. NI 43-101 Technical Report – Marmato Project Page 141
MMS/KD Marmato_PEA_NI43-101_544400.020_Rev31_KD.docx November 2019
Source: SRK, 2019
Figure 14-15: Example of Visual Validation of Grade Distribution for Gold (Top) and Silver (Bottom)

SRK Consulting (U.S.), Inc. NI 43-101 Technical Report – Marmato Project Page 142
MMS/KD Marmato_PEA_NI43-101_544400.020_Rev31_KD.docx November 2019
Source: SRK, 2019
Figure 14-16: Comparison of Au Grade Within Deeps Domain Between Boreholes and Estimates
14.9.2 Comparative Statistics
SRK has completed a statistical validation of the block estimates (NN, OK and ID2) versus the mean
of the composite samples per zone. In general, the results indicate a reasonable comparison (Table
14-10) between the sample mean grades (declustered) and the block estimates.
SRK notes that the comparison between the mean grades and the raw samples often exceeds the
desired levels of error, but this is often a function of the clustering within the dataset from either channel
sampling, or the fan drilling. SRK has therefore focused on using a comparison to the declustered
mean grades, which have been determined within Snowden Supervisor, by testing multiple
declustering block sizes ranging between 0 to 50 m, and selecting points where the mean stabilizes.
In the case of the higher grade domains such as the veins or the high-grades MDZ, this typically
represents a reduction in the average grades, while the lower grade domains have typically been under
sampled and therefore there is a slight increase in the average grades within these zones.
For the comparison SRK has compared the grouped statistics for the veins, splays, and porphyry
material, but has broken out the MDZ into the three main sub-domains. The zones show satisfactory
correlations between the composite and block estimates, with the highest errors noted within the
splays. This is minor domain and reducing limiting the study to the higher confidence blocks estimated
within the first estimation pass reduces the average differences from ± 25% to less than 15%. SRK
notes these differences which have subsequently been accounted for during the classification process.

SRK Consulting (U.S.), Inc. NI 43-101 Technical Report – Marmato Project Page 143
MMS/KD Marmato_PEA_NI43-101_544400.020_Rev31_KD.docx November 2019
Table 14-10: Comparison of Raw, Declustered Composites vs. OK, ID2 and NN Statistics (1)
Statistic Points Mean Standard Deviation
Variance Coefficient of Variation
% Difference (raw)
% Difference (decluster)
Group 1000
Composites 21,893 4.82 6.51 42.42 1.35
Declustered 21,893 3.59 5.57 31.04 1.55
OK 3,556,735 3.63 2.91 8.48 0.8 -24.78 1.16
ID2 3,556,735 3.61 3.41 11.65 0.95 -25.19 0.59
NN 3,556,735 3.53 5.37 28.83 1.52 -26.79 -1.55
Group 3000
Composites 1,092.00 4.75 6.50 42.26 1.37
Declustered 1,092.00 4.47 6.20 38.48 1.39
OK 138212 3.42 3.21 10.30 0.94 -27.90 -23.38
ID2* 138212 3.44 3.41 11.61 0.99 -27.59 -23.05
NN 138212 3.32 6.09 37.13 1.84 -30.04 -25.65
Group 4000
Composites 7,682 1.77 2.45 6.00 1.38
Declustered 7,682 1.67 2.30 5.28 1.38
OK 724,536 1.58 1.50 2.24 0.95 -10.98 -5.45
ID2 724,536 1.58 1.53 2.35 0.97 -10.82 -5.29
NN 724,536 1.71 3.33 11.10 1.95 -3.45 2.54
Group 5000 - KZONE=0 (<0.7 g/t)
Composites 6237 0.29 0.66 0.43 2.24
Declustered 6237 0.33 0.65 0.42 1.97
OK 453408 0.39 0.28 0.08 0.73 32.22 18.47
ID2 453408 0.39 0.29 0.08 0.75 32.05 18.31
NN 453408 0.40 0.65 0.43 1.65 35.03 20.98
Group 5000 - KZONE=1 (0.7 - 1.7 g/t)
Composites 4100 1.32 1.65 2.72 1.25
Declustered 4100 1.35 1.65 2.73 1.22
OK 566499 1.45 0.59 0.35 0.41 9.93 7.17
ID2 566499 1.47 0.61 0.37 0.41 11.48 8.68
NN 566499 1.39 1.57 2.48 1.14 5.40 2.75
Group 5000 - KZONE=0 (>1.7 g/t)
Composites 1245 3.52 3.67 13.44 1.04
Declustered 1245 3.33 3.54 12.50 1.06
OK 158057 3.25 1.16 1.35 0.36 -7.58 -2.22
ID2 158057 3.37 1.23 1.51 0.37 -4.29 1.25
NN 158057 3.13 3.00 8.98 0.96 -11.01 -5.86
Source: SRK, 2019
14.9.3 Swath Plots
As part of the validation process, the input composite samples were compared to the block model
grades within a series of coordinates. The results of this were then displayed on graphs to check for
visual discrepancies between grades. Figure 14-17 and Figure 14-18, show the results for the gold
grades for the Marmato vein domain and MDZ high-grade domains respectively, based on all three
principal directions. The graph shows the block model grades (black line), ID2 (grey), NN (yellow) and
the declustered composite grades (blue line). A copy of the swath validation study per zone is
contained in Appendix C.

SRK Consulting (U.S.), Inc. NI 43-101 Technical Report – Marmato Project Page 144
MMS/KD Marmato_PEA_NI43-101_544400.020_Rev31_KD.docx November 2019
Source: SRK, 2019
Figure 14-17: Example of Swath Analysis Used During Validation, Showing Vein Au (g/t)

SRK Consulting (U.S.), Inc. NI 43-101 Technical Report – Marmato Project Page 145
MMS/KD Marmato_PEA_NI43-101_544400.020_Rev31_KD.docx November 2019
Source: SRK, 2019
Figure 14-18: Example of Swath Analysis Used During Validation, Showing MDZ (High-Grade) Au (g/t)

SRK Consulting (U.S.), Inc. NI 43-101 Technical Report – Marmato Project Page 146
MMS/KD Marmato_PEA_NI43-101_544400.020_Rev31_KD.docx November 2019
14.10 Resource Classification
Block model quantities and grade estimates for the Project were classified according to the CIM
Definition Standards for Mineral Resources and Mineral Reserves (May 2014).
Mineral Resource classification is typically a subjective concept. Industry best practices suggest that
classification should consider the confidence in the geological continuity of the mineralized structures,
the quality and quantity of exploration data supporting the estimates, and the geostatistical confidence
in the tonnage and grade estimates. Appropriate classification criteria should aim to integrate both
concepts to delineate regular areas at similar resource classification.
Data quality, drillhole spacing and the interpreted continuity of grades controlled by the veins have
allowed SRK to classify portions of the veins in the Measured, Indicated and Inferred Mineral Resource
categories.
SRK’s classification system differs from the previous estimate which used very broad classification as
it was based on the assumption of mining adjustments based on increased knowledge of the deposit
from on-going mine planning support.
Measured: Measured Resources are limited to vein material within the current levels being mined by
the Company and estimated within the first search volume which required a minimum of five
composites and a maximum of 20 composites. These areas are considered to have strong geological
knowledge as they have been traced both down-dip and along strike via mapping, plus underground
channel samplings provide sufficient data populations to define internal grade variability.
Indicated: For the 2017 Mineral Resource estimate, SRK has delineated Indicated Mineral Resources
at Marmato primarily between Level 16 to 21 currently in operation at Mineros Nacionales. Indicated
Mineral Resources have been given at the following approximate data spacing, as a function of the
confidence in the grade estimates and modelled variogram ranges. SRK has expanded the limits of
the Indicated to also cover areas within Echandia where:
• Spacing of 50 m by 50 m (XY) existed from the nearest drillhole;
• Multiple holes were enabled to be used during the estimation process; and
• Support from both diamond drilling and channel sampling was present.
Inferred: In general, Inferred Mineral Resources have been limited to within areas of reasonable grade
estimate quality and sufficient geological confidence, and are extended no further than 150 m from
peripheral drilling on the basis of modelled variogram ranges.
A summary of the classification at Marmato is shown in Figure 14-19.

SRK Consulting (U.S.), Inc. NI 43-101 Technical Report – Marmato Project Page 147
MMS/KD Marmato_PEA_NI43-101_544400.020_Rev31_KD.docx November 2019
Source: SRK, 2019
Figure 14-19: Cross Section Showing Classification Systems at Marmato
14.11 Depletion
To define the Mineral Resource SRK has created a block model to represent the depletion for the
veins. In order to complete this task SRK has used a combination of AutoCAD™ polylines provided by
GCM and generated Vulcan™ (.00t) files by projecting the strings in perpendicular to the strike. These
wireframes have subsequently been used to copy out the assigned vein. The process is manual and
labor intensive and requires each vein to be individually assessed.
This process may result in some errors of over or under depletion at the edges but given the size of
the deposits is not considered to be material. Once the block model has been established the model
has been combined with the final geological model to code all the blocks for depletion.
It is recommended that GCM work towards generating a 3D digital layout of the mine which has the
depletion assigned to each of the main structures, but this will take time to initially set-up and was
beyond the scope of the current Project.
An example of the resultant model used is shown in Figure 14-20.

SRK Consulting (U.S.), Inc. NI 43-101 Technical Report – Marmato Project Page 148
MMS/KD Marmato_PEA_NI43-101_544400.020_Rev31_KD.docx November 2019
Source: SRK, 2019
Figure 14-20: 3D View Example of Depletion Model Created by SRK for Marmato
14.12 Mineral Resource Statement
CIM Definition Standards for Mineral Resources and Mineral Reserves (May 2014) defines a Mineral
Resource as:
“(A) concentration or occurrence of diamonds, natural solid inorganic material, or natural solid
fossilized organic material including base and precious metals, coal, and industrial minerals in or on
the Earth’s crust in such form and quantity and of such a grade or quality that it has reasonable
prospects for economic extraction. The location, quantity, grade, geological characteristics and
continuity of a Mineral Resource are known, estimated or interpreted from specific geological evidence
and knowledge”.
The “reasonable prospects for eventual economic extraction” requirement generally imply that the
quantity and grade estimates meet certain economic thresholds and that the Mineral Resources are
reported at an appropriate CoG taking into account extraction scenarios and processing recoveries. In
order to meet this requirement, SRK considers that portions of the vein system to be amenable for
underground mining.
To determine the potential for economic extraction SRK has used the following key assumptions for
the costing but notes that the deposit has variable mining costs depending on the mining types
N
200 m

SRK Consulting (U.S.), Inc. NI 43-101 Technical Report – Marmato Project Page 149
MMS/KD Marmato_PEA_NI43-101_544400.020_Rev31_KD.docx November 2019
resulting in a range of CoGs (Table 14-11). A metallurgical recovery of 95.0% Au has been assumed
based on the current performance of the operating plant.
Table 14-11: Summary of Cut-Off Grade Assumptions at Marmato Based on Assumed Costs (Averaged for All Mining Styles)
Units Vein Mining 2017 Averaged
CoG Deeps Option (Long Hole) Averaged
CoG
Assumptions
Gold Price US$/oz $1,500 $1,500
Gold Price US$/g $48.23 $48.23
Au Recovery % 95% 95%
Operating Costs
Mining US$/t mined
$48.00 $32.00
Processing US$/t ore $14.97 $14.35
Royalties US$/t ore $9.20 $9.20
G&A and Other US$/t ore $14.0 $5.00
Other US$/t ore $0.00 $0.00
Subtotal US$/t $86.17 $60.55
CoG - Head Grade
g/t 1.9 1.3
Source: SRK, 2019
SRK has defined the proportions of Mineral Resource to have potential for economic extraction for the
Mineral Resource based on two separate CoGs, relating to the different mining methods involved. The
initial cut-off is based on the mining of the veins using the current mining processes and assumed
costs, with a second method (longhole) defined for mining the MDZ and potentially areas of wider
porphyry mineralization in the upper levels.
The estimation domains have therefore been grouped for the Mineral Resource Statement into veins,
porphyry and MDZ mineralization. The veins account for the veins, halos and splay material and have
used a 1.9 g/t Au cut-off, while all other domains (grade-shell, deeps, porphyry) have used a lower cut-
off of 1.3 g/t to account for the larger bulk mining methods involved.
The Mineral Resource Statement for the Project is shown in Table 14-12.

SRK Consulting (U.S.), Inc. NI 43-101 Technical Report – Marmato Project Page 150
MMS/KD Marmato_PEA_NI43-101_544400.020_Rev31_KD.docx November 2019
Table 14-12: SRK Mineral Resource Statement for the Marmato Project, Dated July 31, 2019
Category Quantity
Grade Metal
Au Ag Au Ag
Mt gpt gpt 000'oz 000'oz
Underground Vein**
Measured 2.7 5.0 25.5 433 2,190
Indicated 10.8 4.5 20.5 1,579 7,133
Measured and Indicated 13.5 4.6 21.5 2,013 9,323
Inferred 8.6 4.2 19.3 1,154 5,330
Underground Porphyry***
Measured
Indicated 3.7 2.9 26.4 350 3,149
Measured and Indicated 3.7 2.9 26.4 350 3,149
Inferred 3.0 4.3 48.0 420 4,680
Underground MDZ***
Measured
Indicated 6.4 2.6 4.7 537 978
Measured and Indicated 6.4 2.6 4.7 537 978
Inferred 41.2 2.1 2.7 2,812 3,609
Underground Combined
Measured 2.7 5.0 25.5 433 2,190
Indicated 21.0 3.7 16.7 2,466 11,260
Measured and Indicated 23.6 3.8 17.7 2,899 13,450
Inferred 52.9 2.6 8.0 4,387 13,619
* Mineral resources are not mineral reserves and do not have demonstrated economic viability. All figures are rounded to reflect the relative accuracy of the estimate. All composites have been capped where appropriate. ** Vein and Porphyry mineral resources are reported at a CoG of 1.9 g/t. CoGs based on a price of US$1,500 per ounce of gold, suitable benchmarked technical and economic parameters and gold recoveries of 95 percent for underground resources, without considering revenues from other metal. *** MDZ mineral resources are reported at a CoG of 1.3 g/t. CoGs based on a price of US$1,500 per ounce of gold, suitable benchmarked technical and economic parameters and gold recoveries of 95 percent for underground resources, without considering revenues from other metal in the pit shell. Source: SRK, 2019
14.13 Mineral Resource Sensitivity
The proposed mining plan focuses on splitting the above Mineral Resources into three styles of
mineralization within two distinct areas. The three styles of mineralization are based on the key
geological types defined in the Mineral Resources of Veins, Porphyry and MDZ. The mining areas are
split into Zona Alta and Zona Baja based on the presence of the existing mining infrastructure, with
Zona Alta representing material above the existing mines, and Zona Baja as all material, including the
Echandia Licences, below an elevation of 1,340 masl.
A summary of the breakdown for the Mineral Resources as used in the current study is shown in Figure
14-21, and with the tonnages and grades presented in Table 14-13.

SRK Consulting (U.S.), Inc. NI 43-101 Technical Report – Marmato Project Page 151
MMS/KD Marmato_PEA_NI43-101_544400.020_Rev31_KD.docx November 2019
Source: SRK, 2019
Figure 14-21: Summary Breakdown of Mining Areas for Study
Table 14-13: SRK Mineral Resource Statement for the Marmato Project, Dated July 31, 2019*, Breakdown by Mining Areas
Licence Grouping Zona Alta Zona Baja Total
Type Veins Porphyry Total Veins Porphyry Deeps Total
Measured
Tonnes (kt) 0.6 0.6 2.1 2.1 2.7
Grade Au (g/t) 5.6 5.6 4.9 0.1 5.0
Ag (g/t) 33.2 5.6 23.2 4.9 25.5
Au Metal Au (koz) 109 109 325 325 433
Ag (koz) 648 648 1,543 1,543 2,190
Indicated
Tonnes (kt) 3.6 2.1 5.7 7.2 1.6 6.4 15.2 21.0
Grade Au (g/t) 4.6 3.1 4.1 4.5 2.7 2.6 3.5 3.7
Ag (g/t) 25.3 38.9 4.1 18.1 10.1 4.7 3.5 16.7
Au Metal Au (koz) 542 210 752 1,037 140 537 1,714 2,466
Ag (koz) 2,966 2,622 5,588 4,167 527 978 5,672 11,260
Measured & Indicated
Tonnes (kt) 4.2 2.1 6.3 9.2 1.6 6.4 17.3 23.6
Grade Au (g/t) 4.8 3.1 4.2 4.6 2.7 2.6 3.7 3.8
Ag (g/t) 4.8 3.1 4.2 4.6 2.7 2.6 3.7 17.7
Au Metal Au (koz) 650 210 860 1,362 140 537 2,039 2,899
Ag (koz) 3,614 2,622 6,236 5,709 527 978 7,214 13,450
Inferred
Tonnes (kt) 5.3 2.7 7.9 3.3 0.3 41.2 44.9 52.9
Grade Au (g/t) 4.1 4.5 4.2 4.4 3.1 2.1 2.3 2.6
Ag (g/t) 4.1 4.5 4.2 4.4 3.1 2.1 2.3 8.0
Au Metal Au (koz) 688 386 1,074 466 34 2,812 3,312 4,387
Ag (koz) 3,753 4,573 8,326 1,577 107 3,609 5,293 13,619
Source: SRK, 2019
The mineral resource given above is sensitive to the selection of the reporting CoG. To illustrate the
sensitivity the block model quantities and grade estimates
Zona Alta/Echandia (Zona Alta)
Zona Baja
Zona BajaMarmato Deeps Zone
Level 21
Au > 1.7 g/t Indicator
Mining Upper Zone
Mining Deeps Zone

SRK Consulting (U.S.), Inc. NI 43-101 Technical Report – Marmato Project Page 152
MMS/KD Marmato_PEA_NI43-101_544400.020_Rev31_KD.docx November 2019
The reader is cautioned that the figures presented in the tables should not be misconstrued with a
Mineral Resource Statement. Figure 14-22 and Figure 14-23 are only presented to show the sensitivity
of the block model estimates to the selection of cut-off grade. The following tables (Table 14-14 to
Table 14-19) have been split by the mineralization style and classification (Measured and Indicated
have been combined for ease of reporting).
Table 14-14: Grade Tonnage Curve Measured and Indicated - Vein Domains (Group 1000 to 3000)
Cut-Off (Au g/t)
Tonnes (kt)
Au (g/t)
Ag (g/t)
Au (koz)
Ag (koz)
0.00 19,077 3.6 18.9 2,235 11,565
0.50 18,701 3.7 19.1 2,232 11,495
1.00 17,472 3.9 19.8 2,201 11,126
1.20 16,704 4.0 20.2 2,173 10,831
1.30 16,249 4.1 20.3 2,155 10,624
1.50 15,342 4.3 20.7 2,114 10,227
1.70 14,433 4.5 21.1 2,068 9,792
1.80 13,966 4.5 21.3 2,041 9,553
1.90 13,483 4.6 21.5 2,013 9,323
2.00 13,021 4.7 21.7 1,984 9,092
2.20 12,095 4.9 22.1 1,921 8,592
2.50 10,894 5.2 22.7 1,830 7,935
2.70 10,094 5.4 23.0 1,763 7,477
3.00 9,058 5.7 23.6 1,669 6,866
3.50 7,407 6.3 24.6 1,497 5,865
4.00 6,094 6.8 25.4 1,339 4,986
4.50 5,028 7.4 26.2 1,193 4,240
5.00 4,203 7.9 26.9 1,068 3,629
Source: SRK, 2019
Table 14-15: Grade Tonnage Curve Measured and Indicated - Porphyry Domain (Group 4000)
Cut-Off (Au g/t)
Tonnes (kt)
Au (g/t)
Ag (g/t) Au (koz)
Ag (koz)
0.00 21,077 1.4 11.6 976 7,884
0.50 20,735 1.5 11.8 972 7,846
1.00 13,830 1.8 13.8 791 6,130
1.20 10,433 2.0 15.6 671 5,230
1.30 8,980 2.1 16.7 613 4,835
1.50 6,614 2.4 19.6 507 4,160
1.70 4,894 2.7 23.0 418 3,625
1.80 4,299 2.8 24.7 385 3,409
1.90 3,711 2.9 26.4 350 3,149
2.00 3,258 3.1 27.7 322 2,903
2.20 2,547 3.3 30.9 274 2,529
2.50 1,714 3.8 35.0 211 1,931
2.70 1,362 4.1 38.0 182 1,665
3.00 1,063 4.5 40.7 154 1,392
3.50 691 5.2 46.7 116 1,039
4.00 473 5.9 46.2 89 704
4.50 307 6.8 45.1 67 446
5.00 192 8.0 49.3 49 305
Source: SRK, 2019

SRK Consulting (U.S.), Inc. NI 43-101 Technical Report – Marmato Project Page 153
MMS/KD Marmato_PEA_NI43-101_544400.020_Rev31_KD.docx November 2019
Table 14-16: Grade Tonnage Curve Measured and Indicated - MDZ Domain (Group 5000)
Cut-Off (Au g/t)
Tonnes (kt)
Au (g/t)
Ag (g/t) Au (koz)
Ag (koz)
0.00 23,407 1.1 2.9 795 2,150
0.50 12,673 1.8 3.9 716 1,588
1.00 8,637 2.2 4.4 618 1,217
1.20 7,057 2.5 4.6 562 1,047
1.30 6,434 2.6 4.7 537 978
1.50 5,410 2.8 4.9 491 858
1.70 4,651 3.0 5.1 452 762
1.80 4,308 3.1 5.2 433 716
1.90 3,984 3.2 5.2 413 668
2.00 3,732 3.3 5.3 397 631
2.20 3,254 3.5 5.4 365 560
2.50 2,684 3.7 5.4 322 469
2.70 2,314 3.9 5.4 292 403
3.00 1,817 4.2 5.4 246 317
3.50 1,189 4.7 5.4 181 208
4.00 806 5.2 5.5 135 142
4.50 531 5.7 5.6 97 95
5.00 354 6.2 5.4 70 62
Source: SRK, 2019
Table 14-17: Grade Tonnage Curve Inferred - Vein Domains (Group 1000 - 3000)
Cut-Off (Au g/t)
Tonnes (kt)
Au (g/t)
Ag (g/t)
Au (koz)
Ag (koz)
0.00 16,680 2.7 16.0 1,448 8,567
0.50 15,777 2.8 16.6 1,439 8,431
1.00 13,541 3.2 18.0 1,384 7,825
1.20 12,440 3.4 18.5 1,345 7,388
1.30 11,926 3.5 18.7 1,324 7,175
1.50 10,669 3.7 19.1 1,268 6,565
1.70 9,633 3.9 19.2 1,214 5,940
1.80 9,119 4.0 19.3 1,186 5,645
1.90 8,591 4.2 19.3 1,154 5,330
2.00 8,149 4.3 19.4 1,126 5,090
2.20 7,247 4.6 19.5 1,066 4,535
2.50 6,065 5.0 20.3 977 3,958
2.70 5,467 5.3 20.7 927 3,634
3.00 4,732 5.7 21.5 860 3,275
3.50 3,852 6.2 22.4 768 2,770
4.00 3,064 6.8 23.2 673 2,286
4.50 2,473 7.5 24.0 593 1,907
5.00 2,039 8.0 24.9 527 1,630
Source: SRK, 2019

SRK Consulting (U.S.), Inc. NI 43-101 Technical Report – Marmato Project Page 154
MMS/KD Marmato_PEA_NI43-101_544400.020_Rev31_KD.docx November 2019
Table 14-18: Grade Tonnage Curve Inferred- Porphyry Domain (Group 4000)
Cut-Off (Au g/t)
Tonnes (kt)
Au (g/t)
Ag (g/t)
Au (koz)
Ag (koz)
0.00 14,791 1.8 19.0 847 9,034
0.50 14,539 1.8 19.3 844 9,004
1.00 10,111 2.3 24.5 732 7,969
1.20 7,880 2.6 29.2 654 7,400
1.30 6,981 2.8 32.0 617 7,174
1.50 5,304 3.2 39.2 542 6,681
1.70 3,906 3.8 40.9 471 5,135
1.80 3,438 4.0 44.3 445 4,893
1.90 3,030 4.3 48.0 420 4,680
2.00 2,694 4.6 49.9 399 4,325
2.20 2,172 5.2 47.1 364 3,290
2.50 1,725 6.0 44.0 331 2,441
2.70 1,572 6.3 46.0 318 2,325
3.00 1,410 6.7 49.3 303 2,234
3.50 1,139 7.5 56.1 275 2,055
4.00 936 8.3 64.8 250 1,950
4.50 773 9.2 74.4 228 1,850
5.00 674 9.8 82.2 213 1,780
Source: SRK, 2019
Table 14-19: Grade Tonnage Curve Inferred - MDZ Domain (Group 5000)
Cut-Off (Au g/t)
Tonnes (kt)
Au (g/t)
Ag (g/t)
Au (koz)
Ag (koz)
0.00 122,708 1.1 2.0 4,418 7,931
0.50 84,035 1.5 2.3 4,067 6,169
1.00 59,142 1.8 2.5 3,473 4,765
1.20 46,957 2.0 2.6 3,042 3,981
1.30 41,237 2.1 2.7 2,812 3,609
1.50 31,542 2.3 2.9 2,378 2,979
1.70 24,753 2.5 3.2 2,029 2,515
1.80 22,005 2.6 3.3 1,875 2,313
1.90 19,555 2.8 3.4 1,729 2,123
2.00 17,350 2.9 3.5 1,591 1,945
2.20 13,656 3.1 3.7 1,343 1,627
2.50 9,878 3.3 4.0 1,058 1,272
2.70 7,772 3.5 4.2 882 1,049
3.00 5,289 3.9 4.6 656 778
3.50 2,684 4.5 4.9 386 425
4.00 1,528 5.0 5.4 248 267
4.50 960 5.5 5.9 171 183
5.00 598 6.0 6.4 116 124
Source: SRK, 2019
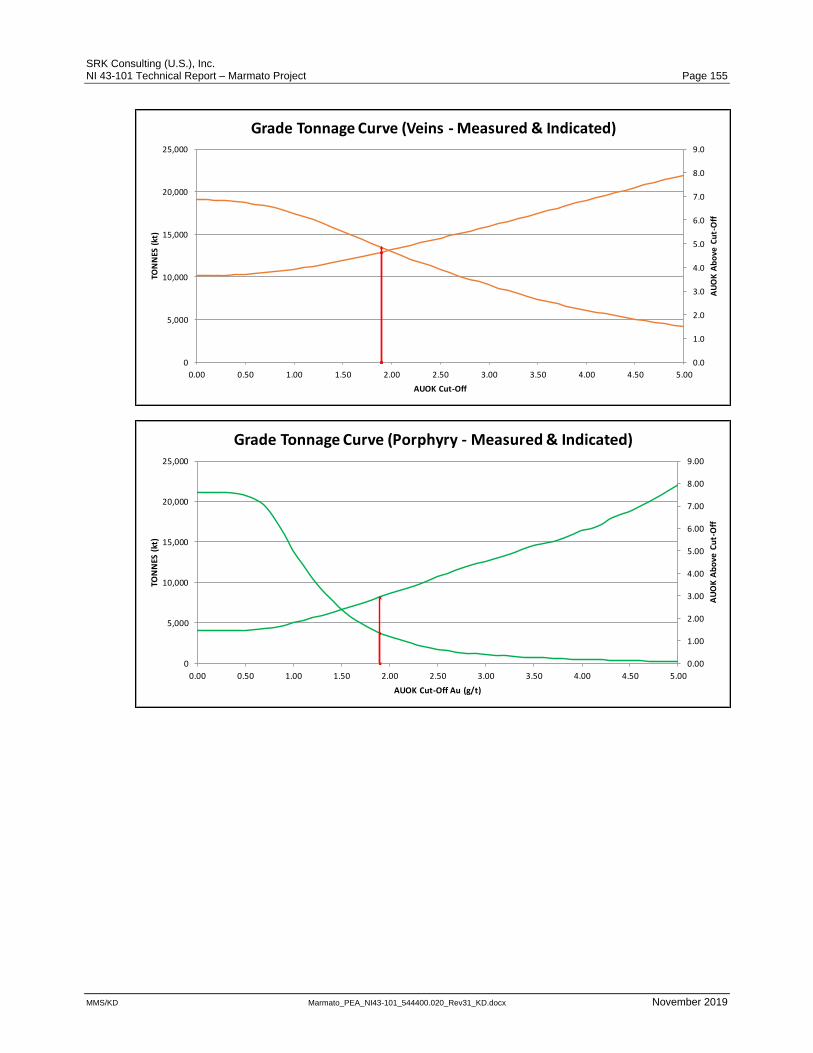
SRK Consulting (U.S.), Inc. NI 43-101 Technical Report – Marmato Project Page 155
MMS/KD Marmato_PEA_NI43-101_544400.020_Rev31_KD.docx November 2019
0.0
1.0
2.0
3.0
4.0
5.0
6.0
7.0
8.0
9.0
0
5,000
10,000
15,000
20,000
25,000
0.00 0.50 1.00 1.50 2.00 2.50 3.00 3.50 4.00 4.50 5.00
AU
OK
Ab
ove
Cu
t-O
ff
TON
NES
(kt
)
AUOK Cut-Off
Grade Tonnage Curve (Veins - Measured & Indicated)
0.00
1.00
2.00
3.00
4.00
5.00
6.00
7.00
8.00
9.00
0
5,000
10,000
15,000
20,000
25,000
0.00 0.50 1.00 1.50 2.00 2.50 3.00 3.50 4.00 4.50 5.00
AU
OK
Ab
ove
Cu
t-O
ff
TON
NES
(kt
)
AUOK Cut-Off Au (g/t)
Grade Tonnage Curve (Porphyry - Measured & Indicated)

SRK Consulting (U.S.), Inc. NI 43-101 Technical Report – Marmato Project Page 156
MMS/KD Marmato_PEA_NI43-101_544400.020_Rev31_KD.docx November 2019
Source: SRK, 2019
Figure 14-22: Grade Tonnage Curves Showing Sensitivity to Changes in Cut-Off for Measured and Indicated Mineralized Material
0.00
1.00
2.00
3.00
4.00
5.00
6.00
7.00
0
5,000
10,000
15,000
20,000
25,000
0.00 0.50 1.00 1.50 2.00 2.50 3.00 3.50 4.00 4.50 5.00
AU
OK
Ab
ove
Cu
t-O
ff
TON
NES
(kt
)
AUOK Cut-Off Au (g/t)
Grade Tonnage Curve (MDZ - Measured & Indicated)
0.00
1.00
2.00
3.00
4.00
5.00
6.00
7.00
8.00
9.00
0
2,000
4,000
6,000
8,000
10,000
12,000
14,000
16,000
18,000
0.00 0.50 1.00 1.50 2.00 2.50 3.00 3.50 4.00 4.50 5.00
AU
OK
Ab
ove
Cu
t-O
ff
TON
NES
(kt
)
AUOK Cut-Off Au (g/t)
Grade Tonnage Curve (Veins - Inferred)

SRK Consulting (U.S.), Inc. NI 43-101 Technical Report – Marmato Project Page 157
MMS/KD Marmato_PEA_NI43-101_544400.020_Rev31_KD.docx November 2019
Source: SRK, 2019
Figure 14-23: Grade Tonnage Curves Showing Sensitivity to Changes in Cut-Off for Inferred Mineralized aterial
14.14 Comparison to Previous Estimates
A comparison to the previous (2017) Mineral Resource Estimate for the Marmato Project demonstrates
a limited overall change in the global estimates for the Project but some significant adjustment within
the sub-categories of the Mineral Resource statement.
SRK urges caution that it will be important that these changes are clearly explained in any future press
release to avoid potential issues of investor confidence.
The main changes in the Mineral Resource Statement can be defined as follows:
0.00
2.00
4.00
6.00
8.00
10.00
12.00
0
2,000
4,000
6,000
8,000
10,000
12,000
14,000
16,000
0.00 0.50 1.00 1.50 2.00 2.50 3.00 3.50 4.00 4.50 5.00
AU
OK
Ab
ove
Cu
t-O
ff
TON
NES
(kt
)
AUOK Cut-Off Au (g/t)
Grade Tonnage Curve (Porphyry - Inferred)
0.00
1.00
2.00
3.00
4.00
5.00
6.00
7.00
0
20,000
40,000
60,000
80,000
100,000
120,000
140,000
0.00 0.50 1.00 1.50 2.00 2.50 3.00 3.50 4.00 4.50 5.00
AU
OK
Ab
ove
Cu
t-O
ff
TON
NES
(kt
)
AUOK Cut-Off Au (g/t)
Grade Tonnage Curve (MDZ- Measured & Indicated)

SRK Consulting (U.S.), Inc. NI 43-101 Technical Report – Marmato Project Page 158
MMS/KD Marmato_PEA_NI43-101_544400.020_Rev31_KD.docx November 2019
• Reduction in the Mineral Resources contained within the Porphyry domain within the current
operating mine, which have reduced from 27.0 Mt at a grade of 2.1 g/t (1,861 koz) to 3.7 Mt
at a grade of 2.9 g/t Au (350 koz), within the Indicated category, and 13.5 Mt at a grade of 1.8
g/t (786 koz) to 3.0 Mt at 4.3 g/t Au (420 koz), within the Inferred.
• A significant portion of the reduction has been due to an increase in the CoG used to define
the mineral resource from 1.2 g/t to 1.9 g/t Au, which is more consistent with the current
operating mining cut-off. This reduced the 2017 Mineral Resource from 27.0 Mt at a grade of
2.1 g/t (1,861 koz) to 12.4 Mt at a grade of 2.9 g/t Au (1,158 koz), within the Indicated category,
and 13.5 Mt at a grade of 1.8 g/t (786 koz) to 4.2 Mt at 2.5 g/t Au (340 koz), within the Inferred.
• Using a direct comparison of the cut-offs the reduction in the contained metal is in the order
of 800 koz from the Indicated portion and an increase of 80 koz in the Inferred category
• SRK attributes these differences to the following:
o Reassignment of a portion of the porphyry pyrite domains to the MDZ based on new
geological information; and
o Application of a more restrictive sample selection criteria’s during the geological modelling
and estimation stage to only use information from drilling in grade estimation. This has
eliminated potential upside of known mineralization within channel sampling taken from
cross-cuts, but the database structure does not enable filters between short grade control
channel sampling and more detailed exploration channel sampling of cross cuts and
development. If SRK and GCM can define a suitable methodology during the coming
months there remains potential to add additional material to this domain for the PFS. This
may also provide additional feed to the current plant and therefore should be considered
a priority for future studies.
• There has been an increase in the Indicated portion of the MDZ from 0.9 Mt at 2.0 g/t (60 koz),
to 6.4 Mt at 2.6 g/t (537 koz) on the basis of infill drilling and better understanding of the
geological controls;
• There has been an increase in the Inferred portion of the MDZ from 29.3 Mt at 2.3 g/t (2,142
koz), to 41.2 Mt at 2.1 g/t (2,812 koz);
• SRK highlights there was an increase in the CoG from 1.2 g/t to 1.3 g/t between the 2017 and
2019 Mineral Resource statements, which accounts for some of the increase in the grade;
• The overall increase within the MDZ is due to some of the reclassification of the porphyry
material but primarily can be accounted for by the additional drilling completed to date.
• There is limited change within the veins models between 2017 and 2019, with the only change
being a 10% reduction in the contained metal within the Inferred category, which may be a
result of combining the Halo and vein mineralization domains during the geological modelling
stage.
To provide GCM with a clear summary of the impact of these changes, SRK has completed a
reconciliation between the 2017 and 2019 Mineral Resource statements. The 2017 Mineral Resource
statement had a combined 41.2 Mt at a grade of 2.9 g/t Au for 3.90 Moz, which has been reduced to
23.6 Mt at 3.8 g/t Au for 2.90 Moz, when reviewing the Indicated portion of the Mineral Resource for
all material. This represents a reduction of approximately 20% in the contained metal. SRK attributes
the majority of this change due to the increase in the cut-off of the porphyry domain. When compared
at the same CoGs the comparison of the Indicated Mineral Resources is 26.5 Mt at a grade of 3.7 g/t
for 3.20 Moz Au, which has reduced to 23.6 Mt at 3.8 g/t for 2.90 Moz Au which is a reduction of

SRK Consulting (U.S.), Inc. NI 43-101 Technical Report – Marmato Project Page 159
MMS/KD Marmato_PEA_NI43-101_544400.020_Rev31_KD.docx November 2019
approximately 9% in contained metal. Within the Inferred category there has been an increase in the
Mineral Resources from 40.0 Mt at 2.8 g/t for 3.65 Moz Au to 52.9 Mt at 2.6 g/t for 4.38 Moz Au,
which is an increase of 16%.
A direct comparison of the Mineral Resource statements using the 2019 CoG is shown in Table 14-20.

SRK Consulting (U.S.), Inc. NI 43-101 Technical Report – Marmato Project Page 160
MMS/KD Marmato_PEA_NI43-101_544400.020_Rev31_KD.docx November 2019
Table 14-20: Mineral Resource Comparison of 2017 vs. 2019 Roll Forward Numbers for Marmato(1)
Category Quantity
Grade Metal Quantity
Grade Metal Difference
Au Ag Au Ag Au Ag Au Ag Au Ag
Mt gpt gpt 000'oz 000'oz Mt gpt gpt 000'oz 000'oz 000'oz 000'oz
Underground Vein(2)
Measured 2.6 4.7 21.3 396 1,774 2.7 5.0 25.5 433 2,190 37 416
Indicated 10.7 4.6 22.3 1,583 7,663 10.8 4.5 20.5 1,579 7,133 -4 -530
Measured and Indicated 13.3 4.6 22.1 1,979 9,437 13.5 4.6 21.5 2,013 9,323 33 -114
Inferred 9.5 4.2 18.9 1,285 5,765 8.6 4.2 19.3 1,154 5,330 -130 -435
Underground Porphyry(3)
Measured 0 0
Indicated 12.4 2.9 19.3 1,158 7,690 3.7 2.9 26.4 350 3,149 -808 -4,542
Measured and Indicated 12.4 2.9 19.3 1,158 7,690 3.7 2.9 26.4 350 3,149 -808 -4,542
Inferred 4.3 2.5 23.8 340 3,258 3.0 4.3 48.0 420 4,680 80 1,422
Underground Deeps(4)
Measured 0 0
Indicated 0.8 2.2 8.3 55 211 6.4 2.6 4.7 537 978 482 768
Measured and Indicated 0.8 2.2 8.3 55 211 6.4 2.6 4.7 537 978 482 768
Inferred 26.3 2.4 2.9 2,024 2,410 41.2 2.1 2.7 2,812 3,609 789 1,199
Underground Combined
Measured 2.6 4.7 21.3 396 1,774 2.7 5.0 25.5 433 2,190 37 416
Indicated 23.9 3.6 20.2 2,796 15,564 21.0 3.7 16.7 2,466 11,260 -330 -4,304
Measured and Indicated 26.5 3.7 20.3 3,192 17,338 23.6 3.8 17.7 2,899 13,450 -293 -3,888
Inferred 40.0 2.8 8.9 3,649 11,433 52.9 2.6 8.0 4,387 13,619 738 2,186 (1) The 2017 and 2019 mineral resources have been reported at a CoGs of 1.9 and 1.3 g/t. CoGs based on a price of US$1500 per ounce of gold, without considering revenues from other metal within a limiting pit shell. (2) Vein mineral resources have been reported at a CoG of 1.9 g/t. (3) Porphyry mineral resources are reported at a CoG of 1.9 g/t. The 2017 Mineral Resources statement has been restated at the higher cut-off to account for the significant change due to the increase in CoGs and allow direct comparison and gold recoveries of 90 percent for underground resources, without considering revenues from other metal. (4) Deeps mineral resources are reported at a CoG of 1.3 g/t. CoGs based on a price of US$1,500 per ounce of gold, suitable benchmarked technical and economic parameters and gold recoveries of 95 percent for underground resources, without considering revenues from other metals.

SRK Consulting (U.S.), Inc. NI 43-101 Technical Report – Marmato Project Page 161
MMS/KD Marmato_PEA_NI43-101_544400.020_Rev31_KD.docx November 2019
SRK completed a high-level reconciliation of the 2017 to 2019 Mineral Resource Statements to show
the key drivers in the differences. The 2019 Mineral Resource represents a number of changes in the
defined Mineral Resource due to the following key factors:
• Increased CoGs used to report the porphyry domain from 1.2 g/t to 1.9 g/t Au, which is in line
with the current CoGs used for the veins within the same areas. There is potential this could
be reduced in the future with more detailed mining studies, but these areas have been
excluded from the current study due to uncertainty in the database;
• Additional Deeps Mineralization (MDZ) has been defined in the 2019 model as a result of infill
drilling. This has been the focus of the current study and represents the potential future of the
Project.
SRK highlights that the current MDZ mineralization represents a notable change in the style of
mineralization and considerations for mining methods at the Project. The largest gains in the Mineral
Resources have been a result of the current drilling on the MDZ (Figure 14-24).
Source: SRK, 2019
Figure 14-24: Waterfall Chart Showing Changes from 2017 to 2018 Mineral Resources with Impact of Key Changes

SRK Consulting (U.S.), Inc. NI 43-101 Technical Report – Marmato Project Page 162
MMS/KD Marmato_PEA_NI43-101_544400.020_Rev31_KD.docx November 2019
14.15 Relevant Factors
SRK is not aware of any Environmental, permitting, legal, title, taxation marketing or other factors that
could affect resources, however SRK considers that there may be some degree of sensitivity for the
potential to extract mineralization based on the various mining domains.
At Marmato there are currently a number of small scale operations working in the upper portion of the
deposit (Zona Alta). While the mineralization within these areas current falls within the concessions
owned by Gran Colombia, due to social issues the GCM mining operation currently does not extract
material from within these areas.
SRK Consulting (U.S.), Inc. NI 43-101 Technical Report – Marmato Project Page 163
MMS/KD Marmato_PEA_NI43-101_544400.020_Rev31_KD.docx November 2019
15 Mineral Reserve Estimate No Mineral Reserves have been estimated for the Project.

SRK Consulting (U.S.), Inc. NI 43-101 Technical Report – Marmato Project Page 164
MMS/KD Marmato_PEA_NI43-101_544400.020_Rev31_KD.docx November 2019
16 Mining Methods The Project has been in operation in various forms since the mid-1500s. Mineras Nacionales (MN)
was awarded the contract for the concessions in 1989. The Project was originally developed as a 300
tpd underground project in 1997 and has expanded through the years to the existing 1,200 tpd capacity
operation. Table 16-1 shows the production from 2015 to June 2019.
Table 16-1: 2015 to 2019* Production
Year Unit 2015 2016 2017 2018 2019*
Tonnes of Mineral Processed t 303,279 341,309 365,117 338,909 181,800
Recovered Gold g 745,044 729,352 782,661 772,438 387,897
oz 23,954 23,449 25,163 24,834 12,471
*First six months of 2019 Source: GCM, 2019
The mine is currently developed to the 1,025 m elevation. A transition is occurring from narrow vein
mineralization to large porphyry mineralized areas (gold associated with pyrrhotite veinlets). For this
PEA, there are three different mining methods, separated into three distinct zones.
• The first zone is the mineralized material between 1,025 m elevation to 1,350 m elevation,
referred to as the Veins. This is the current mine and will be mined using the current
conventional cut and fill stope method.
• The second zone is the wider porphyry material between 1,025 m elevation and 1,070 m
elevation, referred to as Level 21. This material is on Level 21 with some development
accesses already in place. A modified longhole stoping method will be used in this area. The
stope size is 10 m wide by 15 m high with varying length of up to 26 m. 5 m dip pillars are left
due to the use of unconsolidated hydraulic fill.
• The third zone is the porphyry material below 1,025 m elevation, referred to as MDZ. There is
a sill pillar left in-situ between the MDZ and Level 21. The MDZ material is mined using a
longhole stoping method with stope sizes that are 10 m wide by 25 m high, varying lengths of
up to 20 m. The MDZ area is currently not developed.
The first two zones are considered the Upper Mine, and the material is processed in the existing
processing facility. The third zone is considered the MDZ and the material is envisioned to be sent to
a new processing facility. Separate mine plans are presented for the Upper Mine area and MDZ area.
16.1 Current Mining Methods
GCM currently mines the vein material using a conventional cut and fill (CAF) stope mining technique
that supplies approximately 950 tpd of material to a 1,200 tpd capacity processing facility. The CAF
panels are typically 35 m long by 50 m high, with varying thicknesses depending on the vein. The
panels are accessed from 2.2 m by 2.2 m haulage levels on the top and bottom. Raises are developed
along the vein to break the panel into discreet mining stopes as well as to provide ventilation. Sub-
levels are then driven horizontally along strike. Once the sublevel is opened, vertical holes are drilled
up at a length of approximately 1.7 m to 2.3 m over the width of the vein. After blasting, the mineralized
material is mucked using either slushers, bobcats or mini-scoops and loaded into trains and hauled
out. Once mucking is complete, concrete walls are built on either end of the stope and the stope is

SRK Consulting (U.S.), Inc. NI 43-101 Technical Report – Marmato Project Page 165
MMS/KD Marmato_PEA_NI43-101_544400.020_Rev31_KD.docx November 2019
filled with hydraulic fill. When the fill is sufficiently drained, the next slice of mineralized material can
be mined.
16.1.1 Mine Layout
The current Zona Baja mining extends approximately 300 m vertically and approximately 900 m along
the vein structure. The mine has been developed with level accesses proceeding horizontally from the
main portal at the surface to horizontal cross cuts that provide access to the veins. There are currently
six production levels, the highest being Level 16 and the lowest level being Level 21 (Figure 16-1).
Each level is spaced 50 m apart vertically, with the exception of Level 20, which is 60 m from Level
19.
Source: SRK, 2019
Figure 16-1: Marmato Zona Baja Cross Section Looking NE with Active Levels

SRK Consulting (U.S.), Inc. NI 43-101 Technical Report – Marmato Project Page 166
MMS/KD Marmato_PEA_NI43-101_544400.020_Rev31_KD.docx November 2019
Level 18 is the main haulage level and the primary access for the mine and is shown in Figure 16-2.
A track drift provides the main haulage for all material. The trains exit via the south portal, unload at
the mill area and enter the mine via the north portal. Personnel and material enter via the north portal
only. All levels can be reached via ladder-ways. Level 16 and Level 17 also have adit accesses from
surface, mainly for ventilation. A rail decline from Level 18 to Level 19 provides the ability to move
material and supplies between levels. Levels below 18 are accessed by an apique (inclined shaft) hoist
and skip system that allows transport of material. There are other apiques that transport supplies to
the lower levels.
Source: SRK, 2019
Figure 16-2: Marmato Level 18 with Main Haulage
16.1.2 Reconciliation
Reconciliation information was not provided at this time and is not carried out on a regular basis. SRK
recommends that production information is reconciled to the mine plan on a regular basis to ensure
the mine plan is predicting appropriate grades. Within a known mining area, the tonnes/grades mined
should be compared to the tonnes/grades in the block model. If there are continuous discrepancies
between the mined material and the predicted mine plan, modifications to the mine plan process
should be made to more accurately predict future mining.

SRK Consulting (U.S.), Inc. NI 43-101 Technical Report – Marmato Project Page 167
MMS/KD Marmato_PEA_NI43-101_544400.020_Rev31_KD.docx November 2019
16.1.3 Dilution
Dilution data is provided by GCM and summarized in Figure 16-3. The total dilution has increased
since 2006 to a high of 31.6% in 2017. GCM has introduced better drilling practices and training to
control dilution. Since 2017, the total dilution has decreased with 2019 June year-to-date at 21.7%.
Source: GCM, 2019
Figure 16-3: Total Dilution
16.2 Geotechnical
SRK evaluated expected ground conditions and provided design parameters based on the available
geotechnical data. This information included core logging, laboratory testing and field observations
from a site visit completed in July 2019. This section summarizes the main findings.
16.2.1 Engineering Geology
GCM has conducted a preliminary field geotechnical characterization program that included field data
collection and laboratory testing. SRK conducted a site visit to the Marmato mine operation in July
2019 to visually observe ground conditions and reviewed data collection procedures and protocols. In
addition, SRK conducted traverse mapping on the 19 and 20 levels to validate the rock mass quality
and strength parameters as determined by GCM.
At the time of this report, the geotechnical field investigation consisted of 35 drillholes (~8,800 m). Data
from these holes have been used for rock mass characterization. The holes were positioned to
examine rock mass fabric in and around the mineralized zone at different depths and orientations
necessary to collect data on discontinuities. Holes were drilled at varying orientations into the
hangingwall, footwall, and mineralized rock. The field investigation included geotechnical core logging
and core sample collection for laboratory strength testing.
The laboratory testing program included 70 unconfined compression strength (UCS) tests, 36 triaxial
compression strength (TCS) tests, and 14 direct shear strength (DSS) tests of rock joints. A set of 70

SRK Consulting (U.S.), Inc. NI 43-101 Technical Report – Marmato Project Page 168
MMS/KD Marmato_PEA_NI43-101_544400.020_Rev31_KD.docx November 2019
static and dynamic elastic moduli measurements, and 13 Brazilian tensile strength (BTS) tests were
conducted. The laboratory tests were used to develop discontinuity shear strength parameters and
estimates of the static and dynamic elastic properties.
During the July site visit, SRK observed that GCM has followed industry standards and the
International Rock Mechanic Society (ISRM) suggested methods and the ASTM standards. In SRK’s
opinion, the data collected and the quantity of laboratory tests are consistent with the industry
standards for a PEA level design.
Based on the GCM data collected and the laboratory tests provided to SRK, a statistical assessment
was conducted to determine variations in rock mass strength parameters of the MDZ area of the
Marmato Project. SRK has grouped all lithological units into one geotechnical domain for this PEA
level study due to the lack of rock unit specific data. Table 16-2 summarizes the rock mass quality in
terms of Rock Mass Rating (RMR89) (Bieniawski, 1989), Barton’s Q’ system and Rock Quality
Designation (RQD). SRK understands that there might be differences in rock mass quality between
the different lithologies, and this should be evaluated for the next level of study.
Preliminary indications are that the rock mass characteristics are similar between the upper vein
mining areas with the lower MDZ mining areas and thus, for this PEA, SRK treated them as similar.
These two mining areas plan to utilize different mining methods because of mineralization shape,
however, the same geotechnical design methodologies apply given the similar nature of the rock mass.
Figure 16-4 shows the statistical distribution of RMR89 calculated values. SRK understands that more
drillholes are in progress to support a PFS level design, and this additional data may introduce some
changes to the rock mass distribution. It is reasonable to accept the present statistical distribution for
the PEA level design as a representative indicator of the rock mass quality.
Table 16-2: Rock Mass Quality
Parameter Wt. Avg Std. dev CV 25th Percentile 33rd Percentile 50th Percentile
RMR 66 10 0.15 63 65 68
Q’ 4.67 6.07 1.30 1.56 1.95 2.72
RQD Rating 17.5 4.82 0.28 17 17 20
Spacing Rating 10.91 3.20 0.29 10 10 10
Strength Index Rating 8.95 3.21 0.36 7.00 7 7
Joint Condition Rating 12.85 3.10 0.24 11.00 12 13
Source: SRK, 2019

SRK Consulting (U.S.), Inc. NI 43-101 Technical Report – Marmato Project Page 169
MMS/KD Marmato_PEA_NI43-101_544400.020_Rev31_KD.docx November 2019
Source: SRK, 2019
Figure 16-4: Rock Mass Rating Histogram for the MDZ
SRK has estimated the Barton’s Q’ index (Barton, 1974) for each run, which was used for the design
of stopes, pillars and ground support. Figure 16-5 shows the statistical distribution of the Q’ index. The
average value for Q’ corresponds to 4.2, while the mode value was 2.7. SRK considers that a Q’ value
of 2.7 is more adequate to represent the rock mass quality for the PEA design.
Source: SRK, 2019
Figure 16-5: Barton’s Q’ Histogram for the MDZ
Figure 16-6 shows a histogram of UCS values obtained from laboratory testing completed by GCM.
SRK observes two different statistic populations in the intact rock strength testing results (i.e., below
and above 100 MPa). SRK estimates that most of the observable rock is in the R5 range ISRM strength
index (100-200 MPa) based on field observations and in-situ hammer tests completed during the site
visit. This would correspond to the second population. The average UCS is 151 MPa and the 25th
percentile strength is 128 MPa. SRK considers that a 25th percentile value is adequate for a PEA
stability assessment, which has been used for the analyses. SRK recommends increasing the number
of laboratory tests for a PFS level study.

SRK Consulting (U.S.), Inc. NI 43-101 Technical Report – Marmato Project Page 170
MMS/KD Marmato_PEA_NI43-101_544400.020_Rev31_KD.docx November 2019
Source: SRK, 2019
Figure 16-6: Uniaxial Compressive Strength Histogram
16.2.2 Vein Zone
A rock mass characterization program was completed by Knight Piésold in March 2012 (KP, 2012) for
the previous open pit conceptual study. Data gathered from this program was from coreholes that
adequately covered the upper vein area of the mine. SRK has used this data for the PEA level design
of the upper vein areas.
The Knight Piésold drilling program included drilling 15 coreholes from the surface for a total of about
6,300 m of core. The geotechnical activities included geotechnical core logging, sample collection and
laboratory testing. Core logging included recording RQD and RMR89.
The Knight Piésold program also included a laboratory testing program consisting of 35 unconfined
compression strength (UCS) tests, 30 triaxial confined compression strength (TCS) tests, and 33
Brazilian tensile strength (BTS) test measurements that were performed by the Rock Mechanics
Laboratory of the Robert M. Buchan Department of Mining, Queen’s University at Kingston. SRK has
reviewed the raw database, and is of the opinion that the laboratory tests and characterization logging
have been conducted in accordance with industry standards and results are appropriate for PEA
geotechnical design for the upper vein region.
Knight Piésold reported an average RQD of 85, which suggests that the intact rock can be considered
massive/blocky. The RMR89 ranges between 60 to 70, with an average of 65 and standard deviation
of about 3. This suggests that rock quality can be expected to be Good Quality (Class II). The RMR89
ranges of 60 to 70 represents the 30% and 70% percentile of the data.
The vein zone area has been mainly mined using conventional cut and fill mining method, and in some
limited areas using open stoping mining methods. Ground conditions are routinely assessed to
address ground support needs. Typical ground conditions include:
• Fair Quality – Rock type III - (RMR89: 40-60);
• Poor Quality – Rock type IV (RMR89: 20-40); and
• Very Poor Quality – Rock type V (RMR89: <20).

SRK Consulting (U.S.), Inc. NI 43-101 Technical Report – Marmato Project Page 171
MMS/KD Marmato_PEA_NI43-101_544400.020_Rev31_KD.docx November 2019
Knight Piésold observed that most of the reduced rock quality is the consequence of joint weathering,
especially in fault zones that includes veins and their cross jointing.
At the time of the geotechnical site visit, SRK did not have access to all the mine areas in this zone
and could not verify the ground conditions. The stope optimization shown in Section 16.3.3 proposed
by SRK are based on limited data. However, in wide vein areas it is assumed for this PEA level study
that the same analyses are applicable.
SRK has identified an opportunity for optimizing the stope design at a PFS level, once more
geotechnical data becomes available. SRK understands that GCM is currently completing a
geotechnical investigation and database. SRK recommends for PFS level design that a numerical
stability model be conducted for verifying the proposed optimized design and a review of the interaction
between the Veins and MDZ mining be carried out. SRK also recommends carrying out stress
measurements to improve the confidence in the numerical model results.
16.2.3 MDZ Stope Stability
For the MDZ area, a stope stability assessment was conducted according to the Matthews’ empirical
method. The stability graph method (Mathews et al., 1981; Potvin, 1988; Potvin and Milne, 1992 and
Nickson, 1992) is an empirical relationship that has been developed for open stope design based on
the depth of mining, rock mass quality and stope span. The stability graph is a plot of stope Hydraulic
Radius (HR) versus Modified Stability Number (N’). Stopes plotted on the graph are classified as
stable, unstable, stable with support or caved. A stable stope will exhibit little or no wall deterioration
during its mining cycle, while an unstable stope will exhibit limited wall deterioration (30% of face area)
and a caved stope will exhibit unacceptable failure (Hutchinson and Diederichs, 1996). The stability
number, N’, is defined as:
N’ = Q’xAxBxC
Where:
Q’ = the modified Q rock mass classification;
A = the rock stress factor (value between 0.1 to 1.0);
B = the joint orientation adjustment factor (value between 0.2 to 1.0); and
C = the gravity adjustment factor (values between 0 and 10).
The Q’ is a modified version of the Q rock mass classification formula that has the stress reduction
factor (SRF) equal to one, which represents a moderately clamped but not overstressed rock mass
and the joint water reduction (Jw) factor equal to one, representing a dry excavation for underground
stopes. Therefore, the Q’ represents the inherent characteristic of the rock mass (block size and joint
properties). The rock mass rating that has been calculated for the MDZ has been based on the RMR
rock mass classification system. The groundwater factor in the RMR calculation assumed dry
conditions (i.e., depressurized)
The HR used in the stability graph is defined as the stope area/stope perimeter. The HR is calculated
for the stope face (width = strike) and the end walls (width = hangingwall to footwall) and is defined by
the following equation:
HR = stope width x stope height/2(stope width + stope height)

SRK Consulting (U.S.), Inc. NI 43-101 Technical Report – Marmato Project Page 172
MMS/KD Marmato_PEA_NI43-101_544400.020_Rev31_KD.docx November 2019
The rock stress factor (A) replaces the SRF factor calculated in Q. The A factor is the ratio of intact
rock strength (UCS) to induced stress (stress acting parallel to the exposed stope wall or roof). The
UCS values are based on the laboratory tests discussed before.
The vertical stress is estimated to be the weight of the overlying rock (0.027 MN/m3) which is defined
as follows:
σV = 0.027 MN/m3 x Z (vertical depth in m).
The horizontal stress values (σH1 and σH2) have been estimated to be equal and a ratio of the
vertical stress using the following relationship:
σH1 = 1.0 x σV and
σH2 = 1.0 x σV.
Due to the range of vertical depth of mining, three stress ranges have been analyzed assuming depths
of 200 m, 400 m and 600 m. The deepest is the approximate depth to the lowest level in the mine.
Based on Matthews Method, Table 16-3, summarizes the Mathews approach applied to the MDZ area.
Table 16-3: Stope Design Parameters Marmato Deep
Area Depth (m) Q' Index Factor
Stability Number N' H (m) W (m) L (m) A B C
Back
200
2.74 0.74 0.20 2.00 0.80
25 10 20
Sidewall 2.74 0.74 0.20 8.00 3.20
Hangingwall 2.74 0.74 0.20 8.00 3.20
Footwall 2.74 0.74 0.20 8.00 3.20
Back
400
2.74 0.30 0.20 2.00 0.3
Sidewall 2.74 0.30 0.20 8.00 1.3
Hangingwall 2.74 0.30 0.20 8.00 1.3
Footwall 2.74 0.30 0.20 8.00 1.3
Back
600
2.74 0.15 0.20 2.00 0.2
Sidewall 2.74 0.15 0.20 8.00 0.7
Hangingwall 2.74 0.15 0.20 8.00 0.7
Footwall 2.74 0.15 0.20 8.00 0.7
A = the rock stress factor (value between 0.1 to 1.0); B = the joint orientation adjustment factor (value between 0.2 to 1.0); and C = the gravity adjustment factor (values between 0 and 10). Source: SRK, 2019

SRK Consulting (U.S.), Inc. NI 43-101 Technical Report – Marmato Project Page 173
MMS/KD Marmato_PEA_NI43-101_544400.020_Rev31_KD.docx November 2019
Dilution into the stopes has been estimated using an empirical design chart for ELOS based on work
completed by Pakalnis (1986). For the stope parameters specified above, the ELOS chart estimates
about 0.35 m of sloughing. Assuming dilution in the near vertical stopes comes from both the
hangingwall and footwall rock.
SRK considers that an empirical method is acceptable for a PEA level study. However, for further
stages of the Project, SRK recommends that a numerical model is built to reevaluate stope stability for
the different portions of the mine. This approach would account for the variable stress conditions
through the mining sequence, and the effect of backfill on stability. The proposed stope design is valid
for a PEA level only and cannot be applied for construction.
16.2.4 MDZ Sill Pillar Design
SRK considered two different empirical methodologies to determine adequate sill pillar dimensions,
which are detailed below.
Scaled Span Method (1990)
The characterization data has been reviewed for the rock mass above the mine. The top of mining is
planned to begin at about 400 m below ground. The sill pillar stability assessment was conducted
using the empirical Scaled Span Method. The concept for a scaled span for defining crown pillar
stability was proposed by Golder in a CANMET report (Golder, 1990). The concept was formulated
based on back-analysis of historic crown pillar failure and review of precedence experience.
For any given geometry and rock quality, the crown pillar stability is estimated empirically by plotting
rock mass quality, Q, against a scaled pillar span index, CS, according to the following equation:
𝐶𝑆 = 𝑆 {𝛾
𝑡(1+𝑆𝑅)(1−0.4∗cos(𝑑𝑖𝑝))}
0.5
Where:
S = sill pillar span;
= density of rock mass (t/m3);
t = thickness of crown pillar;
SR = span ratio = S/L (crown pillar span / crown pillar length); and
Dip = dip of the orebody or foliation in degrees.
The effects of groundwater and clamping stresses are included in the determination of rock mass
quality (Carter, 1992).
With the rock quality, Q, known, an estimate of the maximum stable span can be made by reference
to the critical span, SC, as follows:
𝑆𝑐 = 3.3 ∗ 𝑄0.43 ∗ sinh 𝑄0.0016
The sill pillar can be considered stable when Cs > Sc, assuming the crown pillar has not been artificially
reinforced by bolting, cabling or tight backfilling of stopes. The ratio of Sc/Cs = Fc can be considered
equivalent to a pillar stability Factor of Safety (FOS).
For the MDZ area the assumed values include the following:
• Sill Pillar span, S = 10 m;

SRK Consulting (U.S.), Inc. NI 43-101 Technical Report – Marmato Project Page 174
MMS/KD Marmato_PEA_NI43-101_544400.020_Rev31_KD.docx November 2019
• Density, g = 2.7 ton/m3;
• Sill Pillar length, L =20;
• Dip structural, Dip =30;
• Barton Q = 2.7;
• Span Ratio, Sr = 0.5;
• Critical Span, Sc = 5.3; and
• Span Index, Cs = 3.5.
According to this empirical method, the required sill pillar thickness is in the 10 to 13 m range, assuming
short-term mine exposure and that the stopes will be tightly backfilled.
Lunder and Pakalnis Empirical Method (1997)
SRK completed an additional assessment for sill pillar thickness based on the work completed by
Lunder and Pakalnis (1997), who compiled an extensive database of hard-rock pillar failures, including
178 case histories. While many of these pillars were rib or sill pillars from steeply dipping ore bodies,
most of them were in the Canadian Shield. The authors developed an empirical formula based on
these case studies. The proposed 'Confinement Formula" for estimating hard rock pillar strength was
defined as follows:
𝜎𝑝𝑠 = 0.44 ∗ 𝑈𝐶𝑆 ∗ (0.68 + 0.52 ∗ 𝑘𝑎𝑝𝑝𝑎)
where: 𝑈𝐶𝑆 = the unconfined compressive strength of intact pillar material (MPa),
kappa = the mine pillar fiction term, which is defined through the following equation:
𝑘𝑎𝑝𝑝𝑎 = tan [cos−11 − 𝑐𝑝𝑎𝑣
1 + 𝑐𝑝𝑎𝑣]
The average pillar confinement (𝑐𝑝𝑎𝑣) is defined as the ratio of the average minor to the average major
principal stress at the mid-height of a pillar. The average pillar confinement can be estimated with the
following expression:
𝑐𝑝𝑎𝑣 = 0.46 ∗ [𝑙𝑜𝑔 (𝑊𝑝
ℎ+ 0.75)]
1.4𝑊𝑝
ℎ
where: 𝑊𝑝 = Pillar width
ℎ = Pillar height
The parameters used by SRK for the calculation of the sill pillar thickness are listed below:
• Sill pillar depth = 500 m;
• Sill Pillar span = 10 m;
• K ratio = 1.0;
• Density = 2.7 ton/m3; and
• UCS = 128 MPa.
With this methodology, the required sill pillar thickness was estimated in the 9.5 to 10.5 m range,
provided the stopes will be tightly backfilled. Considering that the two approaches resulted in similar
values, SRK determined that a sill pillar with a thickness of 10 m is adequate with the available
information.

SRK Consulting (U.S.), Inc. NI 43-101 Technical Report – Marmato Project Page 175
MMS/KD Marmato_PEA_NI43-101_544400.020_Rev31_KD.docx November 2019
SRK recommends that additional data is collected to confirm the input parameters used in the analyses
and validate the PEA recommended pillar dimensions. Additionally, a numerical model should be built
for future studies to properly assess the effect of the mining sequence and stress redistribution on
pillar stability.
16.2.5 Ground Support
Ground support requirements were estimated using empirical support charts developed by Barton
(1974). The method relates the rock mass quality (Q) to the equivalent dimension of the excavation
(De). De is the ratio of the excavation width (D) to the excavation support ratio (ESR) index. The ESR
value required depends on the use for t the excavation. Values ranges from 0.8 rating for underground
public storage facilities to 3 to 5 rating for temporary mining excavations.
The equivalent dimension is determined from the formula:
𝐷𝑒 =𝐷
𝐸𝑆𝑅
Table 16-4 shows the ground support requirements as a function of Barton’s Q’ index and the
equivalent dimension. Estimated support categories for the various development types are shown in
Figure 16-7.
Source: SRK, 2019 Adopted from Barton
Figure 16-7: Estimated Support Categories Based on Q Index

SRK Consulting (U.S.), Inc. NI 43-101 Technical Report – Marmato Project Page 176
MMS/KD Marmato_PEA_NI43-101_544400.020_Rev31_KD.docx November 2019
Table 16-4: Summary of Support Requirements by Excavation Type
Excavation Type ESR De [m] Support Category
Ramp 1.0 3.5 Q<0.8: Category 5 0.8<Q<3: Category 4 Q>3: Category 1
Access tunnels 1.3 2.7 Q<0.6: Category 5 0.6<Q<2: Category 4 Q>2: Category 1
Permanent mine openings, drifts 1.6 2.2 Q<0.8: Category 4 Q>0.8: Category 1
Permanent mine openings, drifts 2.0 1.8 Q<0.5: Category 4 Q>0.5: Category 1
Note: The excavation dimensions were assumed to be 3.5 by 3.5 meters. Source: SRK, 2019
The support categories shown in the previous tables are summarized below:
• Support category 1: Unsupported;
• Support category 4: Systematic bolting, unreinforced shotcrete 4 to 10 cm; and
• Support category 5: Fiber reinforced shotcrete and bolting, 5 to 9 cm.
16.3 Upper Mine Mining
The following sections outline mining in the Veins and Level 21 area. The material is between
elevations of 1,025 m and 1,350 m.
16.3.1 Cut-off Grade Calculations
SRK was provided with the cost structure for GCM for their current operations. This information was
summarized to calculate an AuEq CoG for veins material as shown in Table 16-5. AuEq is calculated
using the following formula:
𝐴𝑢𝑒𝑞 =
𝑡𝑜𝑛𝑛𝑎𝑔𝑒 ∗ 𝐴𝑔 𝑔𝑟𝑎𝑑𝑒 ∗ 𝐴𝑔 𝑟𝑒𝑐𝑜𝑣𝑒𝑟𝑦 ∗ 𝐴𝑔 𝑝𝑟𝑖𝑐𝑒𝐴𝑢 𝑝𝑟𝑖𝑐𝑒
+ 𝑡𝑜𝑛𝑛𝑎𝑔𝑒 ∗ 𝐴𝑢 𝑔𝑟𝑎𝑑𝑒 ∗ 𝐴𝑢 𝑟𝑒𝑐𝑜𝑣𝑒𝑟𝑦
𝑡𝑜𝑛𝑛𝑎𝑔𝑒 ∗ 𝐴𝑢 𝑟𝑒𝑐𝑜𝑣𝑒𝑟𝑦
Table 16-5: Cut-Off Grade Parameters for Veins Material
Parameter Amount Unit
Mining Cost 48.11 US$/t
Process cost 14.97 US$/t
G&A 14.00 US$/t
Royalties 8.10 US$/t
Total Cost* 85.18 US$/t
Gold Price 1,300.00 US$/oz
Silver Price 17.00 US$/oz
Gold Recovery 87.00 %
Silver Recovery 40.00 %
AuEq CoG 2.34 g/t
* Cost is based on GCM 2018 costs Source: SRK, 2019
From these vein material costs, SRK developed costs and cut-off information for the Level 21 mining
method as shown in Table 16-6.

SRK Consulting (U.S.), Inc. NI 43-101 Technical Report – Marmato Project Page 177
MMS/KD Marmato_PEA_NI43-101_544400.020_Rev31_KD.docx November 2019
Table 16-6: Cut-Off Grade Parameters for Level 21 Material
Parameter Amount Unit
Mining Cost 42.00 US$/t
Process cost 13.08 US$/t
G&A 14.00 US$/t
Royalties 8.10 US$/t
Total Cost 77.18 US$/t
Gold Price 1,300.00 US$/oz
Silver Price 17.00 US$/oz
Gold Recovery 90.00 %
Silver Recovery 40.00 %
AuEq CoG 2.05 g/t
Source: SRK, 2019
16.3.2 Hydrogeology and Mine Dewatering
The mine area is located in the hydrogeological regional area of Magdalena Cauca. The region is
comprised of igneous and metamorphic rocks with limited groundwater storage capacity and hydraulic
conductivity (IDEAM, 2013). Specifically, the Marmato mine area is connected to an emplacement of
dacite and andesite porphyry stocks of the Late Miocene age and is hosted by a sheeted pyrite veinlet
system associated with intermediate argillic and propylitic alteration in the porphyry intrusions. The
upper portion of the Marmato district (Zona Alta) has been historically mined by artisanal mines. The
lower portion of the Marmato district (Zona Baja) is located below 1,207 m amsl to 1,298 m amsl
(Wilson, 2010).
Hydrogeological Field Data
A hydrogeological field investigation was completed by Knight Piésold from October 2011 to March
2012 (Knight Piésold, 2012). The investigation included hydraulic tests performed in the porphyry
intrusion units and the construction of three piezometers completed from the underground mine and
11 piezometers completed from the ground surface (Table 16-7 and Figure 16-8).
Table 16-7: 2012 Campaign Piezometers and Boreholes
Borehole ID ID 2 Easting
(m) Northing
(m) Elevation (m amsl)
Total Depth (m)
Dip (Degrees)
Diameter Water level
(m amsl) Date
BH-06 1 MG-026 432,213 607,734 1885 100.1 90 HQ 1,855.6 3/21/2012
BH-07 1 MG-027 435,651 607,603 722 76 90 HQ 691.4 3/20/2012
BH-08 MG-021 434,107 606,706 1457 72.5 90 HQ 1,431.2 3/21/2012
BH-09A MG-024 431,818 605,653 2083 301.9 90 HQ/NQ 2,021.8 3/25/2012
BH-10A - 434,151 605,675 1201 30.5 90 HQ dry 2012
BH-10B - 434,326 605,632 1157 30.5 90 HQ dry 2012
BH-10C - 434,335 605,470 1120 29.5 90 HQ dry 2012
BH-10D - 434,473 605,427 1112 30.5 90 HQ dry 2012
BH-10E MG-016 434,460 605,176 1124 93 90 HQ 1,028.5 3/20/2012
BH-11 MG-022 434,056 604,828 1050 45.4 90 HQ 1,043.1 3/20/2012
BH-13 MG-028 435,698 603,941 726 100.3 90 HQ/NQ 660.8 3/24/2012
BH-14 1 MG-023 434,098 603,327 1102 74.1 90 HQ/NQ 1,044.6 3/20/2012
GT-04 MG-015 433,348 605,572 1186.9 301.5 63 HQ 1,099.6 3/16/2012
GT-08 MG-012 433,034 605,725 1192 250.6 65 HQ 1,092.0 3/16/2012
GT-14 MG-014 433,432 605,834 1188.4 200.5 65 HQ 1,089.8 3/16/2012
KP-TSF-11-03 1 MG-029 437,779 602,194 935 Unknown 90 Unknown 889.3 3/18/2012
KP-TSF-11-05 1 MG-030 440,343 601,816 1037 Unknown 90 Unknown 1,004.7 3/18/2012
Source: Knight Piésold, 2012 (1) Piezometer located out of area of interest)

SRK Consulting (U.S.), Inc. NI 43-101 Technical Report – Marmato Project Page 178
MMS/KD Marmato_PEA_NI43-101_544400.020_Rev31_KD.docx November 2019
Source: Knight Piésold, 2012
Figure 16-8: Location of Piezometers from 2012 Campaign
Water levels recorded until 2012 show elevations from to 661 to 2,022 masl. Ground surface
piezometers show water levels following the topography within 100 m depth. The underground
piezometers present water levels from 1,051 to 1,119 masl with depths varying from 7 to 94 m.
In the underground mine, a total of 105 Lugeon tests were conducted in five geotechnical borehole
(angled) drilled into andesite/dacite porphyry and basalt (Knight Piésold, 2012). The geometric mean
of the hydraulic conductivity for these intrusive units is 1.4 x 10⁻² m/d, being slightly higher in the dykes
and slightly lower in the basalt. 41 Lugeon tests were performed in five vertical boreholes surrounding
the mine area additionally, most of which were conducted at less than 100 m depth within the same
porphyry units. The results of the tests showed a geometric mean of 6.4 x 10⁻² m/d. Nine Le Franc
tests were conducted in the same vertical boreholes within the saprolite, and the results showed a
hydraulic conductivity of 5.9 x10⁻² m/d as geometric mean. It is important to note than several of the
hydraulic tests were completed in unsaturated conditions and into the shallow part of the intrusive units
or into the development mine zone area; therefore, the hydraulic conductivity values may be
overestimated and not representative of the groundwater flow conditions toward the underground
mine, values around 0.01 m/d could be considered more representative. SRK has not completed
comprehensive review of the hydraulic tests conducted during the 2012 campaign to validate the field
procedures and analysis. It should be completed as part of PFS.

SRK Consulting (U.S.), Inc. NI 43-101 Technical Report – Marmato Project Page 179
MMS/KD Marmato_PEA_NI43-101_544400.020_Rev31_KD.docx November 2019
Mine Dewatering
The mine has a series of pumps and tanks from Level 22 to Level 19, where the water is pumped to
the processing plant to be used as makeup water. Each Level collects the water produced in its
developments in addition to infiltration coming from Levels above. The water is briefly stored in a tank
and pumped to the next Level above. Water from Level 16 and Level 17 is collected by gravity,
discharges to Level 18 and through to the process plant. Figure 16-9 shows a simplified scheme of
the current dewatering system.
Source: Grand Colombia Mine, 2019
Figure 16-9: Scheme of Current Dewatering System
Preliminary flow measurements were conducted at mine adits and are presented in the environmental
baseline report prepared by GCM (date unknown). The measurement values vary from a total of 6.3
to 15.9 L/s in summer and winter. However, there is no information about which mine levels were in
operation during the flow measurements.
A measurement record of total mine water discharge is available from January 2017. The measured
monthly average of total dewatering in Marmato mine is 37 L/s, varying from 26.8 to 46.4 L/s. Strong
seasonal trends were not observed; however, a decrease of approximately 16 L/s can be detected in
the last 12 months. Figure 16-10 shows the total water discharge from the Marmato mine.
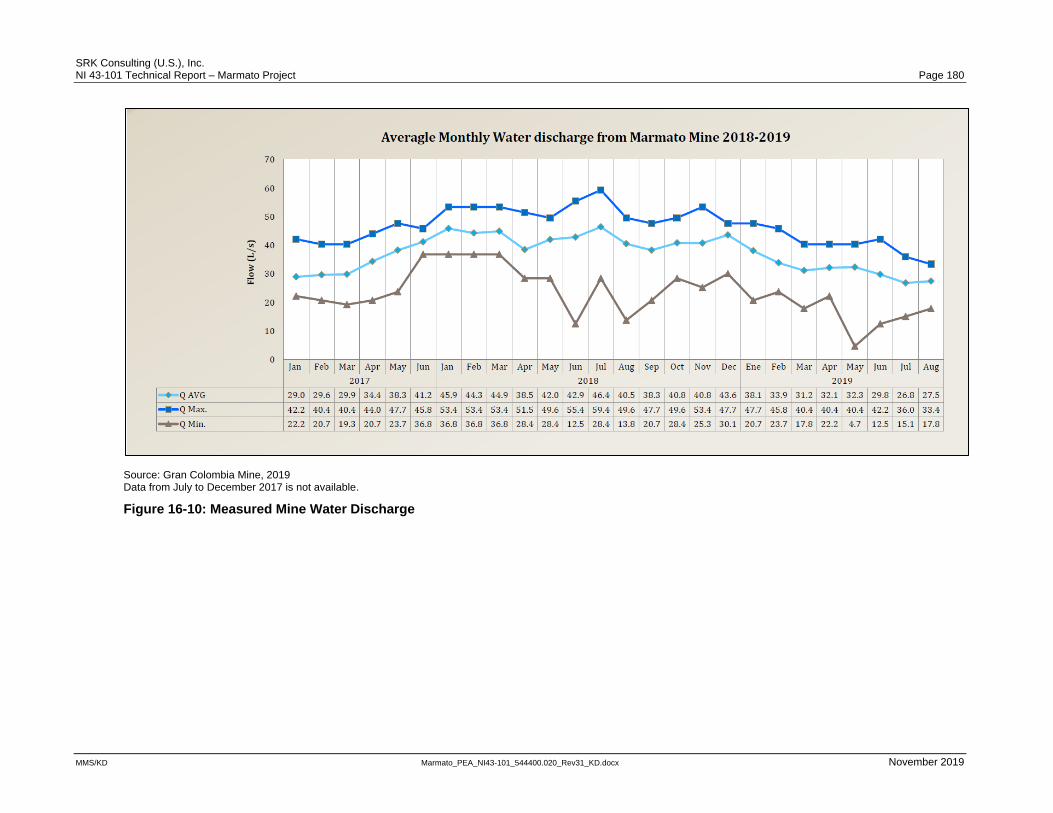
SRK Consulting (U.S.), Inc. NI 43-101 Technical Report – Marmato Project Page 180
MMS/KD Marmato_PEA_NI43-101_544400.020_Rev31_KD.docx November 2019
Source: Gran Colombia Mine, 2019 Data from July to December 2017 is not available.
Figure 16-10: Measured Mine Water Discharge

SRK Consulting (U.S.), Inc. NI 43-101 Technical Report – Marmato Project Page 181
MMS/KD Marmato_PEA_NI43-101_544400.020_Rev31_KD.docx November 2019
The dewatering flow is a combination of groundwater inflows and water content in the backfill material
(60-65% of water). According to Marmato operational personnel, the contribution of the backfill material
is 7 to 14 L/s, depending on the number of hydraulic backfill equipment in operation. Therefore, the
average fresh groundwater inflow into the mine could vary from 23 to 30 L/s. A significant amount of
groundwater flow comes from the north section of Level 17 (crossing the Criminal Fault) where
horizontal boreholes contribute 7 to 8 L/s.
The existed dewatering system fits the current needs for the mine operations at Marmato mine.
Hydrogeological Conceptual Model
Saprolitic coverage and intrusive fracture rock are the two major hydrogeological units defined in the
Marmato mine area: The saprolite is formed by clay material that has weathered on the top of intrusive
rock units. It can reach over 10 m in some locations and is usually dry in the mine area. Subsurface
flow can be observed as part of the recharge process from runoff and direct the precipitation. The
intrusive fractured rock corresponds to dacite and andesite porphyry stocks and a sheeted pyrite
veinlet system associated with intermediate argillic and propylitic alteration. As shown in Figure 16-7
the groundwater level is located approximately 100 m below the surface. However, the
depressurization effect around the underground mine produces a more horizontal water table following
the mine levels. This effect creates two water levels separated by the zone of depressurization as
result of underground mine dewatering.
In a more regional scale, the groundwater flows west to east toward to the Cauca River, located at 668
m amsl, which represents the main discharge for the hydrogeological system. The water table follows
surface topography. Given the high correlation between the topography and the groundwater levels,
the hydrological and hydrogeological basins are the same. However, the effect of the mine
dewatering/depressurization on the groundwater boundaries is currently unknown.
Groundwater flow is compartmentalized with structural blocks with limited hydraulic communication
across fault boundaries due to fault gouge, weathering, or offset of geological units (Knight Piésold,
2012). This is evident in the Criminal Fault, which is located to the north of Cerro los Burros and runs
toward Cauca River on Quebrada Los Pentanes. The fault represents a contact point between the
Dacite Porphyry P1 in Cerro Lo Burros and Dacite Porphyry P2 and Graphitic Schist exposed to the
north. The Criminal Fault is 15 m to 20 m wide, has a clayey alteration, and has a low water filtration
flow. However, to the north of this contact, horizontal boreholes produce water flow from 7 to 8 L/s in
Level 17. Also, water flow has been reported in the same location on Level 21. Figure 16-11 shows
the geological units and faults described above.

SRK Consulting (U.S.), Inc. NI 43-101 Technical Report – Marmato Project Page 182
MMS/KD Marmato_PEA_NI43-101_544400.020_Rev31_KD.docx November 2019
Source: GCM, 2017
Figure 16-11: Local Geological Map
Since 1527 (492 years of mining), mining has affected the natural drainage and facilitated groundwater
infiltration through the mine workings. Currently, there is no detailed recharge estimate into the
Marmato mine area. However, preliminary estimates of infiltration from precipitation present values of
30% of annual precipitation (1,868.7 mm/y El Descanso Met. Station [Hatch, 2012]). A preliminary
estimate of the recharge area for the current Marmato mine developments varies from 260 to 350 ha.
Therefore, the recharge would represent 45 to 60 L/s of fresh groundwater inflow into the mine.
However, measured values of mine water discharge indicate flowrates of 23 to 30 L/s for 2018 to 2019
mining conditions. Under this last consideration, the recharge in the mine area would vary from 15%
to 20% of the annual precipitation.
16.3.3 Stope Optimization
Stope optimization was completed on the veins material using Maptek Vulcan’s implementation of
Alford Mining Systems’ Stope Optimization program and the resource block model used is discussed
in Section 14 of this report.
Vein Stope Optimization
Vein area optimization parameters are as follows:
• CoG of 2.34 g/t AuEq;
• 1 m minimum mining width;
• 10 m and 25 m block heights;
• 17.5 m block length along strike;
• Angled stopes based on vein geology; and
• Elevation between 1,025 m and 1,350 m.

SRK Consulting (U.S.), Inc. NI 43-101 Technical Report – Marmato Project Page 183
MMS/KD Marmato_PEA_NI43-101_544400.020_Rev31_KD.docx November 2019
The optimization results for the 10 m and 25 m high blocks are assessed and combined to form 35m
long by 50 m high stopes. Figure 16-12 and Figure 16-13 show the results of the optimization.
Optimization was performed for various cut-offs ranging from 2.00 g/t AuEq to 2.60 g/t AuEq. There
was little difference in the results between the various cut-offs.
Source: SRK, 2019
Figure 16-12: Stope Optimization Results in Green and Mined Out Area in Purple (Looking Northwest)
Source: SRK, 2019
Figure 16-13: Example of Stope Optimization Results in Green and Mined Out Area in Purple for “Veta Exploracion NW” (Looking North)
Level 21 Stope Optimization
Level 21 area optimization parameters are as follows:
• Cut-off of 2.05 g/t AuEq;
• 25 m to 26 m mining length;
• 15 m block heights;
• 15 m block width;
• Angled stopes based on vein geology; and
• Elevation 1,025 m to 1,070 m.

SRK Consulting (U.S.), Inc. NI 43-101 Technical Report – Marmato Project Page 184
MMS/KD Marmato_PEA_NI43-101_544400.020_Rev31_KD.docx November 2019
Figure 16-14 shows the optimization results for Level 21. A sensitivity for different cut-offs was not
completed for this study due to time constraint. Due to the use of unconsolidated hydraulic fill, 5 m dip
pillars need to be left in-situ as shown in Figure 16-15. The stope size and pillar locations should be
optimized for the next level of study.
Source: SRK, 2019
Figure 16-14: Stope Optimization Results
Source: SRK, 2019
Figure 16-15: Stope Optimization Results with Pillars Removed
Figure 16-16 shows the results of the vein optimizations and the Level 21 optimizations. The Level 21
stopes are located in a single area and make up approximately 5% of the total material tonnes.
Source: SRK, 2019
Figure 16-16: Comparison of Level 21 Stopes (magenta) and Vein Stopes (green)
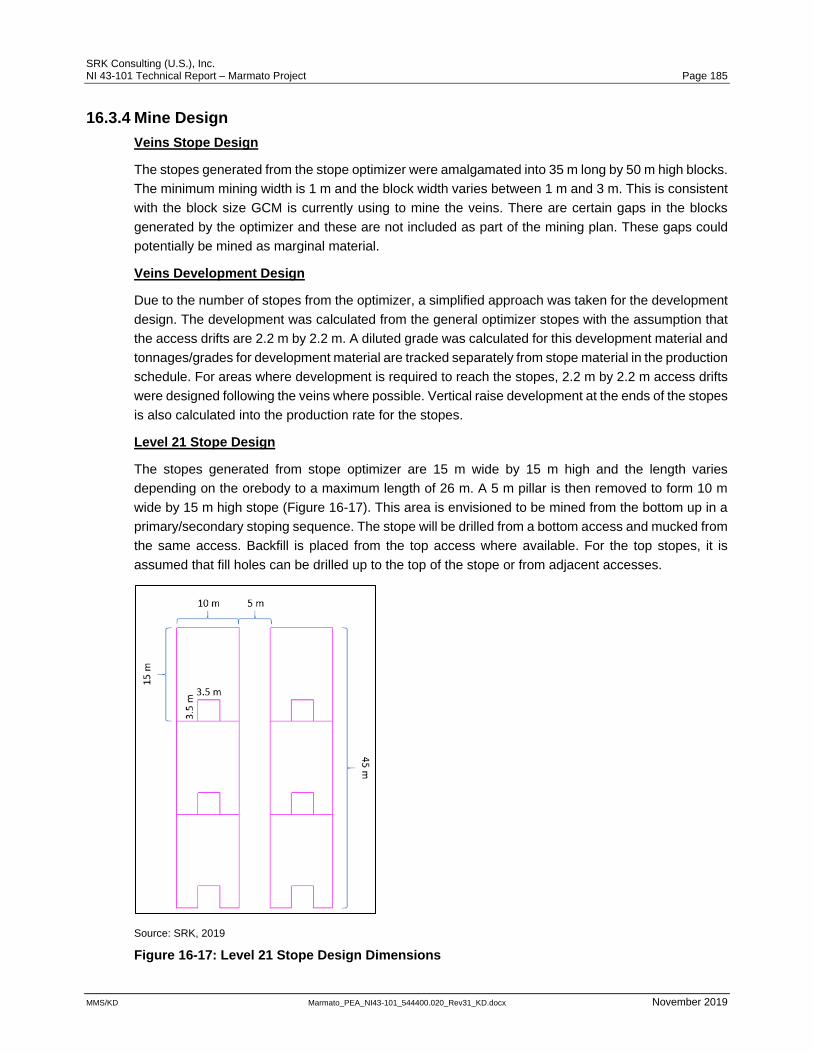
SRK Consulting (U.S.), Inc. NI 43-101 Technical Report – Marmato Project Page 185
MMS/KD Marmato_PEA_NI43-101_544400.020_Rev31_KD.docx November 2019
16.3.4 Mine Design
Veins Stope Design
The stopes generated from the stope optimizer were amalgamated into 35 m long by 50 m high blocks.
The minimum mining width is 1 m and the block width varies between 1 m and 3 m. This is consistent
with the block size GCM is currently using to mine the veins. There are certain gaps in the blocks
generated by the optimizer and these are not included as part of the mining plan. These gaps could
potentially be mined as marginal material.
Veins Development Design
Due to the number of stopes from the optimizer, a simplified approach was taken for the development
design. The development was calculated from the general optimizer stopes with the assumption that
the access drifts are 2.2 m by 2.2 m. A diluted grade was calculated for this development material and
tonnages/grades for development material are tracked separately from stope material in the production
schedule. For areas where development is required to reach the stopes, 2.2 m by 2.2 m access drifts
were designed following the veins where possible. Vertical raise development at the ends of the stopes
is also calculated into the production rate for the stopes.
Level 21 Stope Design
The stopes generated from stope optimizer are 15 m wide by 15 m high and the length varies
depending on the orebody to a maximum length of 26 m. A 5 m pillar is then removed to form 10 m
wide by 15 m high stope (Figure 16-17). This area is envisioned to be mined from the bottom up in a
primary/secondary stoping sequence. The stope will be drilled from a bottom access and mucked from
the same access. Backfill is placed from the top access where available. For the top stopes, it is
assumed that fill holes can be drilled up to the top of the stope or from adjacent accesses.
Source: SRK, 2019
Figure 16-17: Level 21 Stope Design Dimensions

SRK Consulting (U.S.), Inc. NI 43-101 Technical Report – Marmato Project Page 186
MMS/KD Marmato_PEA_NI43-101_544400.020_Rev31_KD.docx November 2019
Level 21 Development Design
There are existing development accesses on Level 21 near planned stopes. A level access drift , 3.5
m by 3.5 m, is planned to be driven with transverse drifts perpendicular to it to access the stope for
drilling and mucking as shown in Figure 16-18. The next lift/level of stopes is accessed through a 3.5
m by 3.5 m ramp, driven at a 13% grade as shown in Figure 16-19.
Source: SRK, 2019
Figure 16-18: Plan View of Level 21 Development Design
Source: SRK, 2019
Figure 16-19: Rotated View of Level 21 Development Design
16.3.5 Mine Plan Resource
The underground mine design for the Marmato veins and Level 21 blocks results in a mine plan
resource of 5.5 Mt (diluted) with an average grade of 3.82 g/t Au and 15.39 g/t Ag (Table 16-8). This

SRK Consulting (U.S.), Inc. NI 43-101 Technical Report – Marmato Project Page 187
MMS/KD Marmato_PEA_NI43-101_544400.020_Rev31_KD.docx November 2019
estimate is based on a 2.81 g/t AuEq cut-off, a 90% mining recovery and a 20% dilution for the veins.
Level 21 blocks are based on a 2.05 g/t AuEq cut-off, a 90% mining recovery and a 15% dilution.
A 5% allowance is added to the development for overbreak.
Table 16-8: Upper Mine – Mine Plan Resource Classification – Vein and Level 21 Material(1)
Description Tonnes (kt) Au (g/t) Ag (g/t) Contained Au Oz (koz) Contained Ag Oz (koz)
Measured 802 3.94 17.95 102 463
Indicated 4,308 3.84 14.64 532 2,028
Inferred 433 3.34 18.06 46 251
Total 5,543 3.82 15.39 680 2,742
Source: SRK, 2019 (2) Includes Measured, Indicated and Inferred material based on CoG of 2.81g/t AuEq for the veins, and 2.05 g/t AuEq for
Level 21 material.
The grades reported here are reported from the mine design that is based on economic areas above
a CoG. This grade is higher than the as-mined reported grades from Marmato (Table 16-9) due to
factors such as Marmato mining outside of the planned areas, mining of marginal areas below the
CoG, and uncontrolled dilution.
Table 16-9: GCM Reported Historical Grades
Year GCM Grade (g/t Au)
2006 3.64
2007 3.32
2008 3.44
2009 3.51
2010 3.39
2011 3.18
2012 2.85
2013 2.90
2014 2.85
2015 2.79
2016 2.56
2017 2.46
2018 2.67
Source: GCM, 2019
The mine plan presented here assumes that GCM will focus mining only in planned areas and will
minimize dilution going forward.
The Mineral Resource presented has been reported following CIM guidelines. The PEA is preliminary
in nature, that it includes a level of engineering precision and assumptions which are currently
considered too speculative to have the economic considerations applied to them that would enable
Mineral Resources to be categorized as Mineral Reserves. Mineral Resources that are not Mineral
Reserves do not have demonstrated economic viability. There is no certainty that the PEA will be
realized.
16.3.6 Production Schedule
The production schedule is based on the productivity rates shown in Table 16-10.

SRK Consulting (U.S.), Inc. NI 43-101 Technical Report – Marmato Project Page 188
MMS/KD Marmato_PEA_NI43-101_544400.020_Rev31_KD.docx November 2019
Table 16-10: Productivity Rates
Activity Type Dimension Rate (1)
Veins Stopes with Development 15 tpd
Veins Stopes without Development 19 tpd
Level 21 Stopes 500 tpd
Backfill (Veins and Level 21) 715 m3/d
Development 2.2 m x 2.2 m 1 m/d
Level 21 Level Access 3.5 m x 3.5 m 3.5 m/d
Level 21 Ramp 3.5 m x 3.5 m 3.5 m/d
Apique widening 2 m x 4 m 0.56 m/d
Source: SRK, 2019 (1) All rates are per face. Multiple areas/faces are mined together to generate the production schedule.
Stopes with development rate include the development of a 2.2 m by 2.2 m drift at the bottom of the
stope, mining (raising, drilling, blasting and mucking) of the stope and backfilling. The rate for stopes
without development includes mining the stope and backfill. Level 21 rates include mining of the stope.
Backfill for Level 21 uses the same system as the veins and is filled at 715 m3/d.
The LoM for the Upper Mine area is 15 years at 350,000 tpy for a total of 5.5 Mt of mineralized material.
The average grade is 3.82 g/t Au and 15.39 g/t Ag for an average of 43 koz of Au per year.
Scheduling targeted 700 tpd (245,000 tpy) from the vein stopes from 2019 to 2021, then increasing to
1,000 tpd (350,00 tpy) for the rest of the mine life. Level 21 stopes are producing at 50 tpd (17,500
tpy), 300 tpd (105,000 tpy) and 450 tpd (157,500 tpy) for years 2019, 2020 and 2021 respectively. The
production schedule is based on 350 days per year, with two eight hour shifts per day. Table 16-11
and Table 16-12 show the annual production schedule based on these assumptions. The annual
schedule was completed using iGantt scheduling software. Figure 16-20 and Figure 16-21 show the
production schedule colored by time period and AuEq grade.

SRK Consulting (U.S.), Inc. NI 43-101 Technical Report – Marmato Project Page 189
MMS/KD Marmato_PEA_NI43-101_544400.020_Rev31_KD.docx November 2019
Table 16-11: Marmato Upper Mine Total Production Schedule
Marmato Unit 2019 2020 2021 2022 2023 2024 2025 2026 2027 2028 2029 2030 2031 2032 2033 2034 2035 Totals
Mineralized Tonnes kt 109 350 402 350 350 350 350 350 350 350 350 350 350 350 350 350 130 5,543
Waste Tonnes kt 28 43 30 21 19 17 25 22 11 16 29 17 13 4 4 4 - 301
Au g/t 3.94 3.77 3.53 3.64 3.63 3.64 3.75 3.92 4.08 4.08 3.89 3.58 3.82 4.04 4.03 3.95 3.54 3.82
Ag g/t 14.32 12.16 10.95 14.41 15.28 15.06 14.81 15.29 15.57 16.42 17.68 16.33 17.04 18.08 17.28 16.14 13.57 15.39
Development Length m 1,385 2,718 2,247 1,984 1,811 1,685 2,269 2,068 1,280 1,790 2,671 1,730 1,431 660 618 521 28 26,895
Backfill Volume m3 36,876 118,997 140,420 120,942 120,772 120,489 120,603 120,301 120,015 119,101 120,204 120,978 120,163 119,090 119,050 119,180 44,045 1,901,227
Source: SRK, 2019
Table 16-12: Marmato Upper Mine Production Schedule by Veins and Level 21
Marmato Unit 2019 2020 2021 2022 2023 2024 2025 2026 2027 2028 2029 2030 2031 2032 2033 2034 2035 Totals
Veins Mineralized Tonnes kt 98 237 238 321 343 343 343 343 343 340 340 343 343 345 345 347 130 5,143
Veins Au g/t 4.00 4.02 3.71 3.70 3.64 3.65 3.76 3.93 4.09 4.10 3.90 3.59 3.84 4.05 4.04 3.95 3.54 3.86
Veins Ag g/t 15.17 15.59 14.33 15.00 15.37 15.12 14.91 15.32 15.60 16.46 17.70 16.32 17.09 18.15 17.34 16.17 13.59 16.00
Level 21 Mineralized Tonnes kt 5 95 151 22 - - - - - - - - - - - - - 272
Level 21 Au g/t 3.24 3.13 3.23 2.84 - - - - - - - - - - - - - 3.17
Level 21 Ag g/t 4.96 4.43 5.78 6.55 - - - - - - - - - - - - - 5.36
Veins Development Mineralized Tonnes kt 4 8 6 7 7 7 7 7 7 10 10 7 7 5 5 3 0.4 108
Veins Development Au g/t 3.65 3.73 3.16 3.16 3.25 3.35 3.06 3.47 3.64 3.49 3.45 3.25 2.95 3.04 3.37 3.42 2.56 3.34
Veins Development Ag g/t 9.72 11.43 10.99 11.58 10.9 11.98 10.06 13.94 14.01 15.01 16.99 16.46 14.41 13.33 13.58 13.44 8.09 13.22
Level 21 Development Mineralized Tonnes kt 2 11 7 - - - - - - - - - - - - - - 20
Level 21 Development Au g/t 3.63 4.03 4.01 - - - - - - - - - - - - - - 3.98
Level 21 Development Ag g/t 5.54 5.28 6.98 - - - - - - - - - - - - - - 5.91
Source: SRK, 2019 Note: Numbers may not sum due to rounding.

SRK Consulting (U.S.), Inc. NI 43-101 Technical Report – Marmato Project Page 190
MMS/KD Marmato_PEA_NI43-101_544400.020_Rev31_KD.docx November 2019
The Mineral Resource presented has been reported following CIM guidelines. The PEA is preliminary
in nature, that it includes a level of engineering precision and assumptions which are currently
considered too speculative to have the economic considerations applied to them that would enable
Mineral Resources to be categorized as Mineral Reserves.
Source: SRK, 2019
Figure 16-20: Production Schedule Colored by Time Period
Source: SRK, 2019
Figure 16-21: Production Schedule Colored by AuEq Grade
16.3.7 Mining Operations
Stoping
Cut and fill stopes are mined using stopers and jacklegs. Once the level access is driven, raises
(tambores) are driven on either side of the stope. A sublevel is driven laterally and used as a drilling
platform, where 1.7 m to 2.3 m slices are drilled up into the back. After blasting and bolting, the stope
is mucked out either using slushers for higher grade stopes or bobcats/mini-scoops for lower grade
blocks. Once the stope is mucked out, concrete barricades are built on either side of the stope and
filled with unconsolidated hydraulic fill. Figure 16-22 shows the typical cut and fill mining sequence:

SRK Consulting (U.S.), Inc. NI 43-101 Technical Report – Marmato Project Page 191
MMS/KD Marmato_PEA_NI43-101_544400.020_Rev31_KD.docx November 2019
• Drilling and blasting;
• Mucking or slushing to a raise and removing the mineralized material from the raise and
hauling by train along the production level;
• Sand backfill; and
• Repeat the cycle on top of the sandfill.
Source: GCM, 2019
Figure 16-22: Marmato Cut and Fill Mining Method
Level 21 blocks are 10 m by 15 m blocks and will be mined using a modified longhole stoping method
in a general bottom up orientation. The block is drilled with upholes from the bottom access using a
Muki long hole drilling rig. A slot will first be drilled and blasted, before the rest of the block is slashed
into the slot. The material will be mucked from the bottom using a remote scoop. The blocks will be
backfilled using unconsolidated hydraulic fill from the existing plant.
Development
Development is completed using jacklegs. Level accesses are 2.2 m by 2.2 m, sublevels vary
depending on the width of the vein.
A 3.5 m by 3.5 m ramp is used to access the Level 21 blocks. The level access and transverse drifts
are the same size as the ramp. Development for the Level 21 blocks is done using a jumbo.

SRK Consulting (U.S.), Inc. NI 43-101 Technical Report – Marmato Project Page 192
MMS/KD Marmato_PEA_NI43-101_544400.020_Rev31_KD.docx November 2019
Haulage
All materials are hauled using rail haulage on the level. Material from levels below Level 18 are hauled
up using the apique hoist.
Backfilling
Backfilling is completed using unconsolidated hydraulic backfill from the plant. Currently,
approximately 70% of the mill tailings are returned to the mine as backfill. There are four tailings
pipelines going underground to different levels with each pipeline having a capacity of 290 m3/d. The
plant’s backfill capacity is 715 m3/d. One limitation of the backfill system is the lack of a surge tank, so
there is limited catch up possibility should a delay occur. Waste rock generated underground that is
not hauled out is used as backfill. The backfill system is shown in Figure 16-23. The backfill system
also has a positive displacement pump that moves backfill materials to the levels above Level 18 that
is not shown in Figure 16-23.
Source: GCM, 2019
Figure 16-23: Marmato Backfill System
16.3.8 Ventilation
Ventilation requirement, as provided by GCM, is 41 kCFM for personnel and 94 kCFM for diesel
equipment, for a total of 135 kCFM. A ventilation model was not provided to SRK for review, however,
the following information was provided by GCM, 139 kCFM of fresh air enters through the portals from
Level 17 and Level 18 via 50 hp fans. 96 kCFM is exhausted from the portals on Level 16. There is a

SRK Consulting (U.S.), Inc. NI 43-101 Technical Report – Marmato Project Page 193
MMS/KD Marmato_PEA_NI43-101_544400.020_Rev31_KD.docx November 2019
43 kCFM difference in the intake and exhaust which GCM attributes to leakage in the system and the
artisanal mining up above. For levels below 18, including Level 21, the fresh air is pulled down the
apiques using 30 hp fans onto the level. Secondary ventilation is provided by 15 hp fans and vent
tubing to the face. The flow in the level is mainly controlled by vent doors. In each level, the air flows
west to an exhaust raise, where the air goes up to Level 16.
16.3.9 Mine Services
Pumping
The mine has an operating system of ditches, sumps, and small pumps that control water on the
individual mine level and pump water to the main pump system.
The main pumping system used in the mine is a staged system of 10,000 to 15,000 liter sumps/tanks
and pumps that move water from lowest levels of the mine at Level 21 up to the mine portal where the
water is used in the mine processing plant. On Level 21, at the bottom of the currently developed mine,
there is a storage tank with three Krebs pumps that pump through two-4 inch and one-6 inch pipelines
up to Level 20. On Level 20, another tank and pump system with three pumps moves the water to
Level 19 to a concrete lined sump with two Goulds 5500 slurry pumps that pump through 4 inch
pipelines to the portal Level 18 to the process plant water tank. There is redundancy built into the
system with extra pumps on Level 19 and additional locations to place pumps on Level 20. The pump
system handles on average 37 L/s with a range from 26.8 L/s to 46.4 L/s.
Electrical Supply
The existing project electrical system includes an 8.1 MVA main project substation with six
transformers that provide power to the mine and mill. The mine system power is provided at 33 kV
through three transformers transform power for secondary transformers that feed the mine surface
and underground facilities. The three mine related transformers and loads they feed are summarized
as follows:
• Transformer 1 (2000 KVA) steps the 33kV power down to 13.2kV and feeds the three mine
substations that in turn feed the compressors, pumps and offices/shops 440 VAC;
• Transformer 2 (2000 KVA) feeds the mine at 13.2kV through three separate mine transformers
that in turn feed the various mine levels, hoists, pumps, and mine equipment. The equipment
operates on 440 VAC; and
• Transformer 4 (1250 KVA) and 5 (630 KVA) feeds two compressors each at 440VAC.
The largest loads at the mine are the compressors, pumps, and hoists which currently account for an
approximate total of 65% percent of the mine load.
Health and Safety
The mine has a mine phone system and emergency egress is provided through stairs in the apique
declines and a series of ladders to the surface portal level. The mine has a health and safety response
plan and miner safety training sessions for instruction on proper work procedures and safe work
activities.
Manpower
Currently there are 1,158 personnel working at the site, this includes, underground staff, process plant
staff and other support staff. The mining staff is approximately 67% of the total staffing. GCM projects

SRK Consulting (U.S.), Inc. NI 43-101 Technical Report – Marmato Project Page 194
MMS/KD Marmato_PEA_NI43-101_544400.020_Rev31_KD.docx November 2019
an increase in manpower primarily in the mine underground operations over the next 5 years (Table
16-13).
Table 16-13: Manpower by Department
Department 2019 2020 2021 2022 2023
Underground Operations 777 868 890 910 910
Process Plant 34 34 34 34 34
Support 217 217 217 217 217
Administration 59 59 59 59 59
Others 71 71 71 71 75
Total 1158 1249 1271 1291 1295
Source: GCM, 2019
Equipment
The mine utilizes a large number jackleg drills and small electric and air operated equipment. There
are also small diesel microscoops and bobcats. The mine is adding additional small drills and
microscoops in the future.
Table 16-14 shows the current equipment list as provided by GCM.
Table 16-14: Marmato Equipment List
Equipment Amount
Bobcat 27
Jacklegs/Stopers 313
Microscoops 6
Locomotives 27
Mine Pumps 18
Hydraulic Fill Pump 18
Winches 5
Slushers 91
Fans 83
Railcars 215
Compressors 9
Pumps 33
Transformers 12
Electric Grid 6
Total Equipment 863
Source: GCM, 2019
16.3.10 Recommendations
The following recommendation and opportunities have been identified:
• Using 3D modeling software and block model to generate mine design;
• Apply a 3D Gantt type scheduling software to generate a mine plan. This will more accurately
show times of potential higher and lower grade in the mine plan;
• Reconciliation of mining plan and actual production data to improve the accuracy of the mine
plan and dilution estimates;
• Develop a ventilation model for the current mine; and
• Optimizing shift schedule to improve overall efficiency.

SRK Consulting (U.S.), Inc. NI 43-101 Technical Report – Marmato Project Page 195
MMS/KD Marmato_PEA_NI43-101_544400.020_Rev31_KD.docx November 2019
16.4 MDZ Mining
The MDZ area is currently in the exploration phase and has not been developed. Mineralization is
located approximately 600 to 1,200 m below the surface (530 masl to 1,015 masl). Based on
geomechanical information and mineralization geometry an underground longhole stoping method
(LHS) is suitable for the deposit and vein mining can continue to occur above the MDZ area.
The stopes will be 10 m wide and stope length will vary based on mineralization grade. A spacing of
25 m between levels has been used. The deposit is mined in blocks where mining within a block occurs
from bottom to top with the use of paste backfill. Sill pillars are left in situ between blocks. The backfill
will have sufficient strength to allow for mining adjacent to filled stopes, thus eliminating the need for
dip pillars. In the top mining block a higher grade core is extracted first, mined from bottom to top.
Subsequently additional stopes are mined from the bottom of the block up, mining adjacent to (but not
underneath) backfilled stopes.
The mine will be drift access, mineralization will be transported from stopes to the surface by
underground trucks. Internal intake and exhaust raises will be developed using raisebore machines
and air will flow into dedicated intake and exhaust ventilation drifts to surface.
The mine design process involved using stope optimization within Vulcan™ software to determine
potentially mineable areas based on a CoG and minimum mining dimensions. Dilution and recovery
were added to the designed tonnage to account for unplanned stope dilution and unrecoverable
material within the stope.
A process facility of 4,000 tpd (1.4 Mtpy) is used. Access and infrastructure development underground
was designed to support the mining method and sized based on mining equipment and production
rate requirements. Surface infrastructure and tailings were designed to fit the mine plan resource. The
general layout of the mine and mill is shown in Figure 16-24.

SRK Consulting (U.S.), Inc. NI 43-101 Technical Report – Marmato Project Page 196
MMS/KD Marmato_PEA_NI43-101_544400.020_Rev31_KD.docx November 2019
Source: SRK, 2019
Figure 16-24: MDZ General Layout
16.4.1 Cut-off Grade Calculations
Current estimated project costs and the calculated Au CoG are shown in Table 16-15. An Au cut-off
of 2 g/t was targeted for design work and stopes were extended to a 1.75 g/t cut-off where no additional
development was required. For reporting within the design, a minimum cut-off of 1.5 g/t Au was used.
A silver recovery of 40% is expected however was not used for the CoG calculation.
Table 16-15: Underground Cut-off Grade Calculation
Parameter Amount Unit
Mining cost (1) 30.00 US$/t
Process cost 17.75 US$/t
G&A, Other 6.50 US$/t
Royalty 9.2% %
Total Cost $59.75 US$/t
Gold price 1,300.00 US$/oz
Au Mill Recovery 95% CoG 1.50 g/t
Source: SRK (1) Includes Backfill
The basis for the mine plan resource work is the MDZ model described in Section 14. Figure 16-25
shows the block model orientation and mineralized blocks.

SRK Consulting (U.S.), Inc. NI 43-101 Technical Report – Marmato Project Page 197
MMS/KD Marmato_PEA_NI43-101_544400.020_Rev31_KD.docx November 2019
Source: SRK, 2019
Figure 16-25: MDZ Block Model and Mineralization Extents
Figure 16-26 shows a grade-tonnage curve for the MDZ area (below an elevation of 1,126 m). The
underground Mineral Resources shown are classified as Indicated and Inferred.

SRK Consulting (U.S.), Inc. NI 43-101 Technical Report – Marmato Project Page 198
MMS/KD Marmato_PEA_NI43-101_544400.020_Rev31_KD.docx November 2019
Source: SRK, 2019
Figure 16-26: MDZ Grade/Tonne Curve Based on Au Cut-Off
16.4.2 Hydrogeology and Mine Dewatering
The planned mine will reach 765 m amsl in the first year of excavation. 10 levels will be mined above
this elevation over the next seven years. The bottom of the mine will reach 430 m amsl at the end of
the seventh year and will continue the mine upward for the next 11 years.
A preliminary analytical model was used to estimate the groundwater flow into the planned mine. A
Theis solution method corrected for an unconfined aquifer and presence of bounded conditions (Q=0)
was implemented and calibrated using the current water discharge condition. Assumptions used in the
analytical model are as follows:
• Hydraulic conductivity: 0.01 m/d;
• Specific storage: 1 x 10⁻⁶ 1/m;
• Mine radius: 300 m;
• Aquifer thickness: 800 m;
• Aquifer radius (distance to no flow boundary): 2,000 km;
• Zero inflow contribution within the aquifer radius; and
• Recharge contribution to the inflows not simulated by analytical formula and added to total
inlfow: 30 L/s.
Preliminary predicted inflows into the planned mine will be approximately 70 L/s in the first seven years
of mining (765 m amsl and above) and up to 110 L/s in the last 11 years of mining (430 m amsl and
above).
The bottom of the mine will be 262 m below and 2.5 km to the east of the Cauca River. There is a risk
of water intrusion from the river through the river bed sediments (Figure 16-27). Structures with
features similar to those detected to the north of the Criminal Fault could connect mine developments

SRK Consulting (U.S.), Inc. NI 43-101 Technical Report – Marmato Project Page 199
MMS/KD Marmato_PEA_NI43-101_544400.020_Rev31_KD.docx November 2019
with the river. Further hydrogeological investigations of the area are required to evaluate potential
sources of groundwater inflow into proposed underground mine.
Source: SRK, 2019
Figure 16-27: Cross Section from Marmato Mine to Cauca River
Based on the current understanding of hydrogeological conditions, a minimum data set will be needed
to meet a PFS-level hydrogeological analysis, SRK recommends the following work plan:
• Verify the field status of the 2012 piezometers presented in Table 16-7 and conduct a detailed
QA/QC of the hydraulic tests performed in 2012. Based on the verification findings, a detailed
work plan will be designed. The following preliminary tasks are strongly recommended:
o Conduct short-term hydraulic tests (airlift test, slug test constant head test, etc.) in the
available standpipe piezometers.
o Conduct shutdown tests in the piezometers located La Macha Tank (Level 17).
o Construct multiple VWP and/or standpipe piezometers upstream and low stream of
planned underground mine (proposed Hydro 001 and 002).
o Hydraulic testing of three NQ exploration/geotechnical holes from Level 21, (packer tests,
flow/shut-in testing if flowing conditions or slug testing if water level is below underground
developments) with a bottom target from 421 to 635 m amsl (boreholes SRK 3, SRK 13
and SRK 16).
o Install piezometers/monitoring wells in three geotechnical holes (SRK 13 and SRK 16) for
water level measurements (string of vibrating wire piezometers, VWPs, to define vertical
hydraulic gradient or install pressure transducers in standpipes).
o Install two deep-VWP targeting potential structures with connection to the Cauca River.
(Hydro 3 Hydro 4).
o Collecting groundwater samples in proposed piezometers.
• Continue monitor flow (total, from different levels). Surveying underground developments by
collecting groundwater seepage rates, seepage-water strike elevations and water quality data.
Figure 16-28 shows the location of the proposed piezometers.

SRK Consulting (U.S.), Inc. NI 43-101 Technical Report – Marmato Project Page 200
MMS/KD Marmato_PEA_NI43-101_544400.020_Rev31_KD.docx November 2019
Source: SRK, 2019
Figure 16-28: Location of Proposed Piezometers
16.4.3 Stope Optimization
Stope optimization within Vulcan software was used to determine potentially economically minable
material. Stope sizes used in the optimization ranges from 5 m wide and 10 m high to 15 m wide and
25 m high, with a minimum length of 5 m. Stope walls were vertical and wall dilution was not applied
at the optimization stage. A 10 m width by 25 m height stope size was selected to maximize stope size
yet keep dilution to a minimum. Optimizations were run using various CoG to identify higher grade
mining areas and understand the sensitivity of the deposit to CoG. Results show large quantities of
lower grade material where a small increase/decrease in CoG has a material impact on the material
available for design. Figure 16-29 shows stope optimization results for cut-offs of 3.0 g/t, 2.0 g/t, and
1.5 g/t using a stope size of 10 m wide by 20 m high.
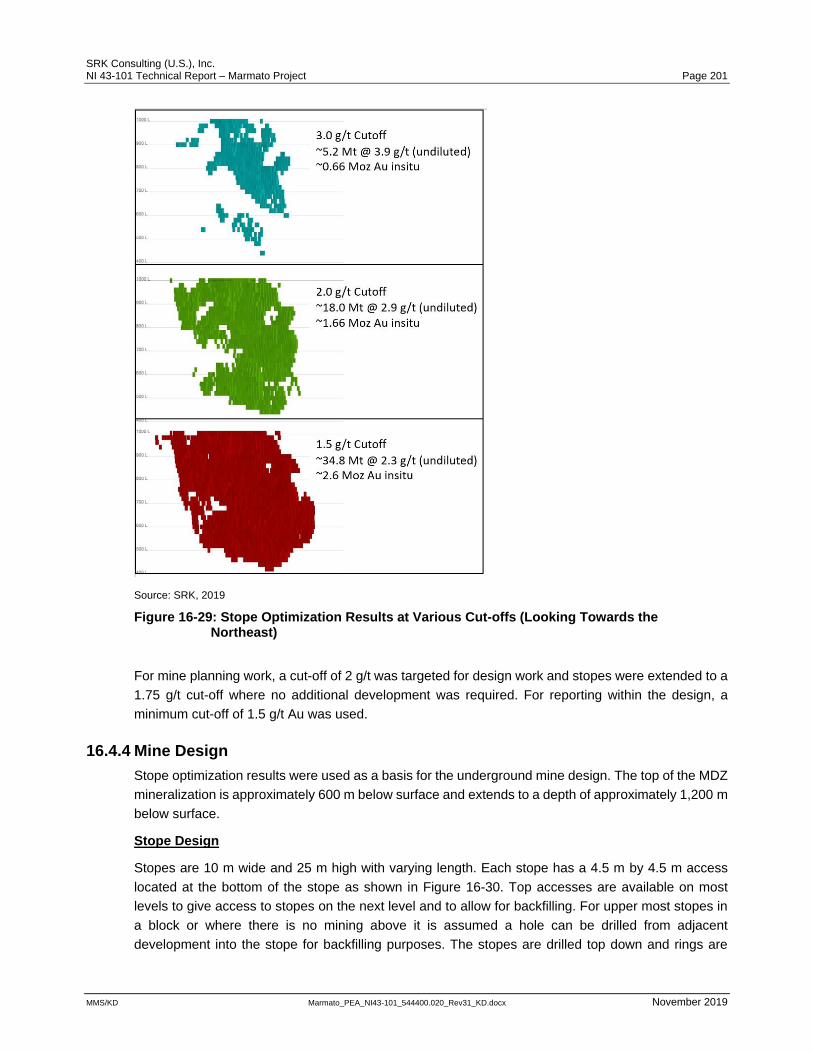
SRK Consulting (U.S.), Inc. NI 43-101 Technical Report – Marmato Project Page 201
MMS/KD Marmato_PEA_NI43-101_544400.020_Rev31_KD.docx November 2019
Source: SRK, 2019
Figure 16-29: Stope Optimization Results at Various Cut-offs (Looking Towards the Northeast)
For mine planning work, a cut-off of 2 g/t was targeted for design work and stopes were extended to a
1.75 g/t cut-off where no additional development was required. For reporting within the design, a
minimum cut-off of 1.5 g/t Au was used.
16.4.4 Mine Design
Stope optimization results were used as a basis for the underground mine design. The top of the MDZ
mineralization is approximately 600 m below surface and extends to a depth of approximately 1,200 m
below surface.
Stope Design
Stopes are 10 m wide and 25 m high with varying length. Each stope has a 4.5 m by 4.5 m access
located at the bottom of the stope as shown in Figure 16-30. Top accesses are available on most
levels to give access to stopes on the next level and to allow for backfilling. For upper most stopes in
a block or where there is no mining above it is assumed a hole can be drilled from adjacent
development into the stope for backfilling purposes. The stopes are drilled top down and rings are

SRK Consulting (U.S.), Inc. NI 43-101 Technical Report – Marmato Project Page 202
MMS/KD Marmato_PEA_NI43-101_544400.020_Rev31_KD.docx November 2019
blasted from the end of a stope toward the access. The blasted material is remotely mucked from the
stope access. A typical level is made up of approximately 40 stopes along strike.
Source: SRK, 2019
Figure 16-30: Stope Cross Section
A primary/secondary stoping sequence will be used, where on any given level, primary stopes must
be separated by a secondary stope. Extraction of the secondary stope can only occur after the two
immediately adjacent primary stopes have been mined, backfilled, and have had time to cure.
Backfilling will be an integral part of the LHS mining cycle and a shorter cure time (7 to 14 days) is
planned.
Development Design
The stope accesses are connected to a level access which is offset approximately 20 m away from
the end of stopes. Each stope access typically connects to the level access except in cases where
stopes are small and long development is required to reach the stope. In those instances, a connection
from an adjacent stope is included in the design. This minimizes the amount of development, however
it limits the sequencing order.
The level accesses connect to the main ramp which is offset at least 75 m from stoping into the footwall.
On the northeast side of each level, the level access connects to an intake air ventilation raise and on
the southeast side connects to an exhaust air raise. Figure 16-31 shows a typical level section.

SRK Consulting (U.S.), Inc. NI 43-101 Technical Report – Marmato Project Page 203
MMS/KD Marmato_PEA_NI43-101_544400.020_Rev31_KD.docx November 2019
Source: SRK, 2019
Figure 16-31: Typical Level Section
Infrastructure items underground, such as shops, sumps, etc. have not been designed at this time.
Figure 16-32 shows the completed mine design.
Source: SRK, 2019
Figure 16-32: Completed Mine Design (Looking Towards the Southwest)

SRK Consulting (U.S.), Inc. NI 43-101 Technical Report – Marmato Project Page 204
MMS/KD Marmato_PEA_NI43-101_544400.020_Rev31_KD.docx November 2019
Figure 16-33 shows the mine design colored by Au grade. There is a distinct higher grade area in the
upper mining block. This higher grade core will be sequenced first in the production schedule.
Source: SRK, 2019
Figure 16-33: Mine Design Colored By Au Grade g/t (Looking Towards the Northeast)
16.4.5 Mine Plan Resource
The underground mine design process for the MDZ area results in mine plan resources of 20.8 Mt
(diluted) with an average grade of 2.5 g/t Au and 3.38 g/t Ag. This estimate is based on a mine design
using a 1.75 g/t Au cut-off for the design of stopes and applying a 1.5 g/t Au cut-off to material within
the design. These numbers include a 93% to 100% mining recovery based on type of opening (stope,
development, etc.) to the designed wireframes in addition to a 0% to 7% unplanned waste dilution. An
additional development allowance of 15% was applied to main ramps to account for detail currently
not in the design. Dilution for stopes was applied at zero grade.

SRK Consulting (U.S.), Inc. NI 43-101 Technical Report – Marmato Project Page 205
MMS/KD Marmato_PEA_NI43-101_544400.020_Rev31_KD.docx November 2019
Table 16-16 summarizes the MDZ mine plan resources.
Table 16-16: MDZ Mine Plan Resource Classification (1)
Description Tonnes (kt) Au (g/t) Ag (g/t) Contained Au Oz (koz) Contained Ag Oz (koz)
Indicated 3,360 2.80 4.66 302 503
Inferred 17,462 2.45 3.14 1,374 1,761
Total 20,821 2.50 3.38 1,677 2,264
Source: SRK, 2019 (1) Includes Indicated and Inferred material reported using a 1.5g/t Au cut-off.
The Mineral Resource presented has been reported following CIM guidelines. The PEA is preliminary
in nature, in that it includes a level of engineering precision and assumptions which are currently
considered too speculative to have the economic considerations applied to them that would enable
Mineral Resources to be categorized as Mineral Reserves. Mineral Resources that are not Mineral
Reserves do not have demonstrated economic viability. There is no certainty that the PEA will be
realized.
16.4.6 Production Schedule
The production schedule is based on the rate assumptions shown in Table 16-17.
Table 16-17: Productivity Rates
Activity Type Dimensions Rate (1)
Main Ramps (single headings) 5.5 m by 5.5 m 4.6 m/d
Footwall Accesses (single headings) 5 m by 5 m 4.9 m/d
Stope Drifts (multiple headings) 4.5 m by 4.5 m 6.0 m/d
Ventilation Drifts (single headings) 4.5 m by 4.5m 6.0 m/d
Stoping (2) - 2,125 tpd
Raisebored Raise 5.0 m diameter 3.4 m/d
Blasted Raise 4 m by 4 m 7.5 m/d
Backfilling - 2,000 m3/d
Source: SRK, 2019 (1) All rates are per face. Multiple areas/faces are mined together to generate the production schedule. (2) Includes drilling, blasting, and mucking.
Backfill has been sequenced and typically includes a 14-day lag prior to mining stopes adjacent to backfill. The backfill sequence needs further refinement and detail at the next level of study.
The mining operation schedule is based on 365 days per year, seven days per week, with two 12 hour
shifts each day. A production rate of 4,000 tpd was targeted with ramp-up to full production as quickly
as possible.
Development drifts begin in January of 2021 and production commences mid-year 2023. Table 16-18
presents the annual mining schedule based on these assumptions. The annual schedule was
completed using iGantt scheduling software.

SRK Consulting (U.S.), Inc. NI 43-101 Technical Report – Marmato Project Page 206
MMS/KD Marmato_PEA_NI43-101_544400.020_Rev31_KD.docx November 2019
Table 16-18: MDZ Annual Mining Schedule
Year Mineralized
Tonnes (kt)
Waste Tonnes
(kt)
Mineralization Au
(g/t)
Mineralization Ag
(g/t)
Development Length
(m)
Backfill Volume
(m3)
2021 - 180 - - 2,790 -
2022 52 375 2.96 3.17 6,987 -
2023 831 318 3.21 3.79 9,966 222,594
2024 1,400 172 3.08 3.73 4,339 528,620
2025 1,401 67 3.48 4.09 2,273 536,495
2026 1,400 129 3.16 4.65 4,490 519,407
2027 1,397 242 2.59 3.57 5,968 514,815
2028 1,342 292 2.30 4.20 7,143 494,940
2029 1,400 214 2.26 5.19 6,272 511,787
2030 1,400 189 2.16 4.67 5,842 504,879
2031 1,400 175 2.05 2.49 5,780 502,542
2032 1,400 86 2.09 1.64 3,757 520,709
2033 1,400 92 2.18 1.79 3,871 516,445
2034 1,400 77 2.18 2.02 3,531 517,480
2035 1,400 55 2.22 2.82 3,261 522,577
2036 1,400 76 2.36 3.27 4,090 502,255
2037 1,205 2 2.47 3.06 122 488,351
2038 592 - 2.57 3.14 - 246,480
Totals 20,821 2,739 2.50 3.38 80,482 7,650,376
Source: SRK, 2019
The Mineral Resource presented has been reported following CIM guidelines. The PEA is preliminary
in nature, that it includes a level of engineering precision and assumptions which are currently
considered too speculative to have the economic considerations applied to them that would enable
Mineral Resources to be categorized as Mineral Reserves.
Table 16-19 summarizes the production schedule totals by development type.
Table 16-19: Production Schedule Totals by Activity Type
Develop/Production Type Length (m) Total Tonnes (kt)
Main Ramp (5.5x5.5) 8,671 615
Footwall Access (5x5) 10,091 681
Stope Drift (4.5x4.5) 55,894 3,056
Ventilation Drift (4.5x4.5) 4,171 228
Raisebore 1,458 74
Ventilation Slot Raise 102 4
Stoping 18,896
Total 23,555
Source: SRK, 2019
Figure 16-34 and Figure 16-35 show the mine production schedule colored by year.

SRK Consulting (U.S.), Inc. NI 43-101 Technical Report – Marmato Project Page 207
MMS/KD Marmato_PEA_NI43-101_544400.020_Rev31_KD.docx November 2019
Source: SRK, 2019
Figure 16-34: Mine Production Schedule Colored by Year, Rotated View Looking Toward the Footwall (Northeast)

SRK Consulting (U.S.), Inc. NI 43-101 Technical Report – Marmato Project Page 208
MMS/KD Marmato_PEA_NI43-101_544400.020_Rev31_KD.docx November 2019
Source: SRK, 2019
Figure 16-35: Mine Production Schedule Colored by Year, Rotated View Looking Toward the Hangingwall (Southwest)
16.4.7 Mining Operations
Stoping
Stope lengths vary throughout the deposit ranging from 5 m to a maximum of 20 m giving a range of
approximately 3,000 to 12,500 t per stope. After bottom and top accesses are established a slot raise
will be developed at the far end of the stope (hangingwall side). Drilling will continue with the longhole
drill using a fan shaped pattern. Holes will be loaded with bulk emulsion and stope blasting will
commence in the slot and subsequently rings will be blasted retreating toward the level access.

SRK Consulting (U.S.), Inc. NI 43-101 Technical Report – Marmato Project Page 209
MMS/KD Marmato_PEA_NI43-101_544400.020_Rev31_KD.docx November 2019
Remote mucking will be required for the majority of stope mucking so the load-haul-dump (LHD)
operator can remain behind the brow of the stope. Stope material will be mucked primarily into a muck
bay near the level access or the adjacent stope access. The material will then be loaded into trucks
and hauled to surface. Once the stope is emptied a bulkhead will be placed in the 4.5 m by 4.5 m
access and the stope void will be filled with paste backfill from the top access or via a drillhole at the
top of the stope.
Development
Main ramps as 5.5 m by 5.5 m openings with an arched back. Footwall accesses are 5.0 m by 5.0 m
with a flat back. Stope accesses and ventilation drifts are sized as 4.5 m by 4.5 m flat back openings.
These dimensions provide enough room for equipment, ventilation ducting, and utilities where
necessary. Main ramps are typically a single heading environment. Level accesses are also typically
single heading environments. Stope accesses are multiple heading environments. All development
will be mined using a double boom jumbo taking 4 m rounds. Blasted material will typically be mucked
into a muck bay near the heading. The waste muck will subsequently be loaded into trucks and
transported to surface or for disposal in the secondary stopes. As some stope access development is
in mineralized material grade control will be required to determine material destination on a round by
round basis.
The ramp system is designed at a maximum gradient of 14%. A turning radius of 30 m was used which
is suitable for any underground truck.
Mine Access
The underground MDZ area will be accessed via a ramp from the process area facility. Three additional
dedicated ventilation drifts will be developed from near the existing veins process facility as shown in
Figure 16-36.
Source: SRK, 2019
Figure 16-36: Portal and Ventilation Drift Locations

SRK Consulting (U.S.), Inc. NI 43-101 Technical Report – Marmato Project Page 210
MMS/KD Marmato_PEA_NI43-101_544400.020_Rev31_KD.docx November 2019
An emergency escape system (bullet hoist) is envisioned in the fresh air raise system. The main ramp
connects to existing workings and could also be used for emergency egress.
Haulage
The mine will incorporate the use of four 17 t load-haul-dump (LHD) loaders that muck material from
stopes and development headings to either a muck bay or into 50 t underground trucks for haulage to
surface. Early in the mine life average one-way haulage distances are approximately 2,000 m and five
trucks are required. As haulage distance increases the truck count increases to nine. Where possible,
waste material from development will be moved from muck bays and hauled to secondary stopes as
backfill in conjunction with the pastefill.
Table 16-20 shows the maximum one-way haul distance by mining block and the number of trucks
required. Note that the truck count includes waste haulage.
Table 16-20: Trucks and Haul Distance for Mineralized Material
Block Max. One-Way Haul Distance (m) Number of Trucks
Lower Portion of Upper Block 1,825 5
Upper Portion of Upper Block 3,230 7
Lower Portion of Lower Block 4,205 9
Source: SRK, 2019
Backfilling
A paste backfill plant will be located on surface and the paste backfill product will be made from tailings
and using cement will be produced by the backfill plant and then placed underground through a piping
system that will place the pastefill directly into the stopes. Barricades will be constructed in the stopes
prior to placement. The primary/secondary extraction sequence requires the primaries to be backfilled
with cemented pastefill having a minimum 14-day UCS strength of 1.0 MPa for a single face fill
exposure during mining of the adjacent secondary stope in high-stress conditions. In lower stress
conditions the minimum 14-day UCS strength can be 0.5 MPa. In secondary stopes where the backfill
will never be exposed only sufficient binder is required to prevent liquefication of the backfill during
mining operations. The paste backfill plant has been designed to fill 2,000 m3/day when operating. Any
waste rock mined underground and not hauled to surface will also be used as backfill material.
Ground Support
The current knowledge of the geotechnical characteristics indicates that ground support will be
required in the ramps and primary access drifts as well as some of the stope access drifts. The ground
support plan will use split set bolts as a standard. The bolting will be supplemented with wire mesh,
shotcrete, and additional support where required. Cable bolts are expected to be utilized on the brows
of the stopes and in certain larger intersections or infrastructure locations where warranted. A standard
bolter and cable bolter will be utilized as normal practice and shotcrete equipment and transmixer are
included in the estimate.
Grade Control
As the main ramp is developed, drill stations from the main ramp allow for fan drilling of the deposit
prior to developing levels. This confirmatory drilling should be used to update the long-term block
model and provide confidence in expected tonnage and grades prior to level development.
SRK Consulting (U.S.), Inc. NI 43-101 Technical Report – Marmato Project Page 211
MMS/KD Marmato_PEA_NI43-101_544400.020_Rev31_KD.docx November 2019
Once a level is being developed, level and stope accesses will be sampled to determine material
destination. Once stope accesses are developed vertical holes will be drilled through the anticipated
stopes and cuttings will be sampled to determine stope extents and estimated stope grades. Any
samples tested in the lab should be used to update short term planning block models to better estimate
tonnages and grades in the short term mine plan.
16.4.8 Ventilation
The overall ventilation design is developed to meet the Colombian mining regulations and general best
practices. The main regulations for this mine are identified in in “Reglamento de Suguridad en Las
Labores Mineras Subterraneas, Decreto 1886 del 21 de Septembre de 2015”. Main relevant points
from this regulation are:
• Article 56 identifies the maximum allowable air velocity in an area where personnel are working
or transiting through as 6 m/s. This is used to develop the dimensions of the main access
decline and to provide the split between the fresh air system and the ramp air system.
• Article 54 dictates an airflow requirement for 0.09 m3/s/kW (for newer low CO producing
diesels). The MDZ Project envisions the implementation of a new equipment fleet consisting
of Tier 3 or Tier 4 equipment and a lower dilution value of 0.06 m3/s/kW may be considered.
A variance would need to be applied for and as such, this PEA aligns with the higher airflow
requirement.
• Article 42 states that the separation between intake and exhaust portals should be no less
than 50 m.
The ventilation system has been initially developed for this PEA as an isolated system. The existing
upper workings will only be connected to the lower workings for the purposes of egress and the access
points will be isolated with air doors.
Ventilation Layout
The layout of the MDZ area below the existing workings is shown in Figure 16-37. Four new accesses
will be developed; one 5.5 m by 5.5 m haulage/access decline to the middle of the deposit, and three
4.5 m by 4.5 m declines to the top of the MDZ area.

SRK Consulting (U.S.), Inc. NI 43-101 Technical Report – Marmato Project Page 212
MMS/KD Marmato_PEA_NI43-101_544400.020_Rev31_KD.docx November 2019
Source: SRK, 2019
Figure 16-37: General Ventilation Layout
Two exhaust fan installations are required, one in each of the upper access declines either on the
surface with vertical discharges or in the decline. The exhaust system will have a transfer drift so that
both systems will operate in parallel.
Equipment Load and Airflow Requirement
The equipment list is based on other similar mining operations with a basic airflow requirement of 0.09
m3/s/kW (370.5 m3/s) as per Colombian regulations. These values are shown in Table 16-21.
A separate calculation was performed for a dilution rate of 0.06 m3/s/kW (261.7 m3/s) as per Canadian
and European requirements, shown in Table 16-22. These values are shown but would require a
variance from Colombian regulators. With the high-power demand required for the system, it may be
practical to investigate the variance for the next phase of study.
Existing
Workings

SRK Consulting (U.S.), Inc. NI 43-101 Technical Report – Marmato Project Page 213
MMS/KD Marmato_PEA_NI43-101_544400.020_Rev31_KD.docx November 2019
Table 16-21: Equipment Load and Airflow Requirement for 0.09 m3/s/kW Dilution Rate
Equipment Type Number of
Pieces Number of Personnel
Power (kW)
Availability Operating on the Surface
(Diesel) Operating in the Mine
(Diesel) Applied Power in the Mine
(Diesel) Airflow Requirement
(m3/s)
Drill Longhole In the Hole - Sandvik DU 412i 1 130 85% 10% 11 1.0
Drill Longhole Top Hammer - Sandvik DL 431 1 110 85% 10% 9 0.8
Explosives Charger (large)-Stopes/Raises - Orica MaxiCharger 5344 1 120 85% 20% 20 1.8
LHD (14T/6.2m3) - Sandvik LH 514 4 256 85% 75% 653 58.8
Drill Jumbo - 2 Boom - Sandvik DD 422i 4 119 85% 10% 40 3.6
Explosives Charger (small)-Drifts - Orica Handiloader 1120 (U100) 1
Bolter - Sandvik DS 411 Mechanical Bolter 3 110 85% 10% 28 2.5
Scissor Lift - Getman A64 2 129 85% 10% 22 2.0
Haul Truck (50T) - Sandvik TH550 8 405 85% 40% 60% 1652 148.7
Cable Bolter - Atlas Copco Cabletec L 1 120 85% 10% 10 0.9
LHD (7T) - Sandvik LH307 3 160 85% 75% 306 27.5
Boom Truck - Getman A64 1 129 85% 20% 22 2.0
Lube Truck - Getman A64 1 129 85% 20% 22 2.0
Fuel Truck - Getman A64 1 129 85% 20% 22 2.0
Flat Bed - Getman A64 (for small explosives charger and misc. use) 1 129 85% 10% 11 1.0
Shotcrete Sprayer Trailer - (38.2 m3/hr) 1
Transmixer Truck - Getman A64 HD R60 1 129 85% 50% 55 4.9
Telehandler - CAT 1255D 1 106 85% 20% 18 1.6
Skid Steer - CAT 272D 2 73 85% 10% 12 1.1
Personnel Carriers - Kubota RTV 1120D 10 19 85% 50% 81 7.3
Personnel Carrier - Getman A64 (16 person) 1 129 85% 10% 11 1.0
Underground Core Drill - Sandvik DE130i or equivalent 2 0 85% 10% 0 0.0
Grader - CAT UG20M 1 105 85% 10% 9 0.8
Light Vehicles (4x4 Pickup Trucks, included in surface) 5 75 85% 10% 32 2.9
982M CAT Front End Loader - 6.7m3/8.75 dy3 1 325 85% 75% 207 18.6
Charger base - Getman A64 (for small and large chargers) 2 129 85% 20% 44 3.9
Total Airflow Required for Diesel Dilution (0.09 m3/s/kW) 3298 296.8
Personnel (0.05 m3/s/person) 200 10.0
Shop/Facilities 30.0
Leakage (10%) 33.7
Total Airflow Requirement 370.5
Source: SRK, 2019

SRK Consulting (U.S.), Inc. NI 43-101 Technical Report – Marmato Project Page 214
MMS/KD Marmato_PEA_NI43-101_544400.020_Rev31_KD.docx November 2019
Table 16-22: Equipment Load and Airflow Requirement for 0.06 m3/s/kW Dilution Rate
Equipment Type Number of
Pieces Number of Personnel
Power (kW)
Availability Operating on the Surface
(Diesel) Operating in the Mine
(Diesel) Applied Power in the Mine
(Diesel) Airflow Requirement
(m3/s)
Drill Longhole In the Hole - Sandvik DU 412i 1 130 85% 10% 11 0.7
Drill Longhole Top Hammer - Sandvik DL 431 1 110 85% 10% 9 0.6
Explosives Charger (large)-Stopes/Raises - Orica MaxiCharger 5344 1 120 85% 20% 20 1.2
LHD (14T/6.2m3) - Sandvik LH 514 4 256 85% 75% 653 39.2
Drill Jumbo - 2 Boom - Sandvik DD 422i 4 119 85% 10% 40 2.4
Explosives Charger (small)-Drifts - Orica Handiloader 1120 (U100) 1
Bolter - Sandvik DS 411 Mechanical Bolter 3 110 85% 10% 28 1.7
Scissor Lift - Getman A64 2 129 85% 10% 22 1.3
Haul Truck (50T) - Sandvik TH550 8 405 85% 40% 60% 1652 99.1
Cable Bolter - Atlas Copco Cabletec L 1 120 85% 10% 10 0.6
LHD (7T) - Sandvik LH307 3 160 85% 75% 306 18.4
Boom Truck - Getman A64 1 129 85% 20% 22 1.3
Lube Truck - Getman A64 1 129 85% 20% 22 1.3
Fuel Truck - Getman A64 1 129 85% 20% 22 1.3
Flat Bed - Getman A64 (for small explosives charger and misc. use) 1 129 85% 10% 11 0.7
Shotcrete Sprayer Trailer - (38.2 m3/hr) 1
Transmixer Truck - Getman A64 HD R60 1 129 85% 50% 55 3.3
Telehandler - CAT 1255D 1 106 85% 20% 18 1.1
Skid Steer - CAT 272D 2 73 85% 10% 12 0.7
Personnel Carriers - Kubota RTV 1120D 10 19 85% 50% 81 4.8
Personnel Carrier - Getman A64 (16 person) 1 129 85% 10% 11 0.7
Underground Core Drill - Sandvik DE130i or equivalent 2 0 85% 10% 0 0.0
Grader - CAT UG20M 1 105 85% 10% 9 0.5
Light Vehicles (4x4 Pickup Trucks, included in surface) 5 75 85% 10% 32 1.9
982M CAT Front End Loader - 6.7m3/8.75 dy3 1 325 85% 75% 207 12.4
Charger base - Getman A64 (for small and large chargers) 2 129 85% 20% 44 2.6
Total Airflow Required for Diesel Dilution (0.09 m3/s/kW) 3298 197.9
Personnel (0.05 m3/s/person) 200 10.0
Shop/Facilities 30.0
Leakage (10%) 23.8
Total Airflow Requirement 261.7
Source: SRK, 2019

SRK Consulting (U.S.), Inc. NI 43-101 Technical Report – Marmato Project Page 215
MMS/KD Marmato_PEA_NI43-101_544400.020_Rev31_KD.docx November 2019
Main Decline Auxiliary Ventilation System
A reduced ventilation load, with a single haul truck operating in the decline, was considered with
equipment specified in Table 16-23. A service vehicle is assumed to be in the decline because of the
slower use of the haul trucks.
Table 16-23: Reduced Equipment Load for Decline Development
Equipment Power (kW) Airflow (m3/s)
Haul Truck TH550 405 36.5
LHD Sandvik LH307 160 14.4
Service Equipment 129 11.6
Source: SRK, 2019
This places the delivered airflow requirement at 62.5 m3/s for a diesel dilution rate of 0.09 m3/s/kW.
The required ventilation system is shown in Table 16-24.
Table 16-24: Suggested Auxiliary Ventilation System for Decline Development
Area Quantity Duty Point Length Diameter
(m3/s) (kPa) (kW) (m) (m)
Main Decline 2 40.9 7.4 465 1800 1.6
Source: SRK, 2019
A total of four fans will be required at 40.9 m3/s at 3.7kPa, 41 m3/s, 200 kW. The fan system could be
applied in two different configurations; all fan pressure could be applied at the surface outside of the
portal, or the fan pressure could be applied in two locations (outside the portal and approximately 1/3
of the way into the drift). The staged approach would be preferred because the reduced differential
pressure across the duct would provide a decreased level of leakage. By installing the separated fans,
the duct between the portal and the second fan will need to be rigid; either steel, fiberglass, or
reinforced plastic duct.
Stope Ventilation Systems
The stope ventilation systems are identified for two different orientations; main body, and fringe area,
with the difference being the length of the auxiliary ventilation systems. The main body stopes would
take airflow from the footwall directly, the fringe stopes have a longer access and require a longer duct.
Haul trucks are assumed to be loaded on the footwall which is naturally ventilated in the main area,
however, the footwall is not directly ventilated from the fresh air raise which will require the installation
of a separate auxiliary system.
The auxiliary ventilation system required in the main area is assumed to ventilate three stopes off of a
single ventilation duct. The general length of the access is assumed to be approximately 100 m. The
general operating equipment load for a stope area is assumed as shown in Table 16-25.
Table 16-25: Main Body Stope Ventilation Airflow and Equipment
Equipment Power (kW) Airflow (m3/s)
LHD Sandvik LH307 160 14.4
Service Equipment 129 11.6
Drilling/Support 10.0
Source: SRK, 2019

SRK Consulting (U.S.), Inc. NI 43-101 Technical Report – Marmato Project Page 216
MMS/KD Marmato_PEA_NI43-101_544400.020_Rev31_KD.docx November 2019
This places the delivered airflow requirement at 36 m3/s for a diesel dilution rate of 0.09 m3/s/kW. This
equipment load represents a maximum configuration with the simultaneous operation of the
equipment. There will be other configurations representing different parts of the mining cycle; bolting,
blasting, etc.
The required ventilation system for this area is shown in Table 16-26
Table 16-26: Main Body Stope Auxiliary Ventilation System
Scenario Fan
Pressure (kPa)
Fan Airflow Modelled
Leakage (m3/s)
Additional 15% Leakage (m3/s)
Total Duct Airflow at Fan
(m3/s)
Fan Power at 75% efficiency
(kW)
Single 1.3m Duct
1.4 40.0 75
Source: SRK, 2019
The fringe stope areas have a longer than average access length which will likely require ventilation
to support the operation of haul trucks in the footwall in addition to the stope production equipment.
The auxiliary ventilation system required for a series of stopes is assumed to ventilate three stopes off
of a single ventilation duct
This places the delivered airflow requirement at 36 m3/s for a diesel dilution rate of 0.09 m3/s/kW. The
average length of the extended accesses would be approximately 200 m. The required ventilation
system for this area is shown in Table 16-27.
Table 16-27: Fringe Stope Auxiliary Ventilation System
Scenario Fan Pressure
(Kpa) Total Duct Airflow at Fan
(M3/S) Fan Power at 75% Efficiency
(Kw)
Single 1.3m Duct
2.4 42.3 140
Source: SRK, 2019
An additional auxiliary ventilation system is required to support the operation (loading) of a haul truck
in the long fringe access as shown in Table 16-28. This auxiliary system would be used in addition to
the auxiliary ventilation system for the stope ventilation. The system could be turned on or off
depending upon the operation of the haul truck.
Table 16-28: Fringe Stope Haulage Airflow Requirement
Equipment Power (kW) Airflow (m3/s)
Haul Truck TH550 405 36.5
Source: SRK, 2019
This places the delivered airflow requirement at 36.5 m3/s for a diesel dilution rate of 0.09 m3/s/kW.
The auxiliary ventilation system required for the haul trucks in the fringe drive is shown in Table 16-29.
Table 16-29: Fringe Stope Haulage Auxiliary Ventilation System
Scenario Fan
Pressure (kPa)
Fan Airflow Modelled
Leakage (m3/s)
Additional 15% Leakage (m3/s)
Total Duct Airflow at Fan
(m3/s)
Fan Power at 75% efficiency
(kW)
Single 1.3m Duct
3.3 36.8 5.5 42.3 190
Source: SRK, 2019

SRK Consulting (U.S.), Inc. NI 43-101 Technical Report – Marmato Project Page 217
MMS/KD Marmato_PEA_NI43-101_544400.020_Rev31_KD.docx November 2019
It is assumed that there would be four active areas in the main body and four active areas in the
extended or fringe areas. A summary of the systems is shown in Table 16-30.
Table 16-30: Stope Auxiliary Ventilation System Summary
Area Quantity Duty Point Length Diameter
(m3/s) (kPa) (kW) (m) (m)
Main Zone Stope 4 40.0 1.4 75 100 1.3
Fringe Area Stope 4 42.3 2.4 140 200 1.3
Fringe Area Haulage 4 42.3 3.3 190 200 1.3
Source: SRK, 2019
Main Ventilation System
The pressure losses through the ventilation system were determined by calculating the basic
resistance of the ventilation route and applying the square to the system with a generalized airflow
distribution. Two levels of airflow were analyzed based on different diesel dilution.
The primary system was based on the higher level of diesel dilution. All airways were sized based on
this criterion. When considering the lower airflow criteria, the raises and level drift dimensions were
held constant with the only change being the airflow quantity.
The pressure losses along the highest resistance circuit are summed together to determine the fan
operating pressure. The parallel airways that have a lower pressure loss would be controlled by the
addition of a regulator to the level which would balance the pressures between circuits. This represents
a very basic analysis for the determination of the fan operating pressure. An additional 15% was added
to the calculated operating pressure to account for additional shock losses and transient conditions. It
is assumed that the fans will be installed underground for both control, security and for the minimization
of surface structures. An additional 750 Pa was added to the operating pressure to account for entry
and discharge losses for the fan installation. It was assumed that inlet bells and discharge cones would
be added to each installation. The actual value of this loss would be calculated based on the fan
diameter and discharge air velocity.
Two analyses were developed and are summarized in Table 16-31 and Table 16-32. The two
summaries relate to the two different diesel dilution criteria. For the PEA the higher diesel dilution
criteria should be used, however, the utilization of a lower criteria should be considered for the next
level of the study (PFS).
It was assumed that the fan efficiency would be approximately 75%, and an additional leakage of 5%
of the total airflow would be drawn from the upper mine workings.

SRK Consulting (U.S.), Inc. NI 43-101 Technical Report – Marmato Project Page 218
MMS/KD Marmato_PEA_NI43-101_544400.020_Rev31_KD.docx November 2019
Table 16-31: Exhaust Fan Pressure, Airflow, and Power Summary (0.09 m3/s/kW)
Category Pressure (Pa)
Fresh Air Side
System Pressure 896
15% Additional Loss 134
Total 1,030
Exhaust Air Side
System Pressure 1,723
15% Additional Loss 258
Total 1,982
Total Fan Pressure (Pa) 3,012
Installation Losses (Pa) 750
Fan Airflow (m3/s) 389
Fan Power (kW) Total 1,951
Source: SRK, 2019
With two fans mounted in parallel drifts (one for each of the two exhaust portals) each fan would be
required to provide 195 m3/s at 3.76 kPa and have a power capacity of at least 975 kW.
Table 16-32: Exhaust Fan Pressure, Airflow, and Power Summary (0.06 m3/s/kW)
Category Pressure (Pa)
Fresh Air Side
System Pressure 896
15% Additional Loss 134
Total 1,030
Exhaust Air Side
System Pressure 839
15% Additional Loss 126
Total 965
Total Fan Pressure (Pa) 1,995
Installation Losses (Pa) 750
Fan Airflow (m3/s) 275
Fan Power (kW) Total 1,006
Source: SRK, 2019
For the lower diesel dilution criteria two fans are required to be mounted in parallel with each fan
required to provide 138 m3/s at 2.75 kPa and have a power capacity of at least 500 kW.
16.4.9 Mine Services
Pumping
Based on the water inflow work discussed in section 16.4.2, a 220 L/s (3,200 gpm) capacity, 110 L/s
1600 gpm) operating, dewatering system is planned.
The system will be built in phases as the mine develops and consists of a portable development system
and permanent level pump stations that will be constructed above the sill levels as the mine production
levels are constructed. The system will pump from the underground workings through steel and SDR11
8-inch HDPE pipes to the MDZ plant where the water will be used at the processing plant.
The portable development system will be used from the portal to the level of Upper Block. Once the
permanent pump system is completed on the MDZ upper zone base level and piping out through the

SRK Consulting (U.S.), Inc. NI 43-101 Technical Report – Marmato Project Page 219
MMS/KD Marmato_PEA_NI43-101_544400.020_Rev31_KD.docx November 2019
decline to the surface is completed, the portable system will be removed from the decline and utilized
for the development decline progressing to the MDZ lower zone. A second permanent pump station
will be established on the base of the MDZ lower zone that will pump from the MDZ lower zone level
to the MDZ upper zone base permanent pumping sump, where the MDZ upper zone level pumps will
pump the water to the surface for discharge to the processing plant.
The portable development system will consist of four complete pump skid stations that provide 110 L/s
(1,600 gpm) at 59 m each with a 28.4 m3 capacity tank with electrical motor control center (MCC)
mounted on the skid.
Permanent pump stations will be established at the bottom of the first mine block near the bottom of
the initial access ramp and at the bottom of the bottom block once development is complete in that
area.
Face pumps will be employed at the development faces and will pump to the stage pumping skids that
feed the main block sump.
Electrical Supply
All surface facilities will be supplied by power from a new MDZ Project main substation that will tie into
an existing power infrastructure in the area. The main surface substation will be located near the new
plant facility and will feed a new mine substation located on the surface near the portal. The mine
substation will feed the underground electrical systems, infrastructure, and equipment power down the
main haulage decline via a 13.2 kV feed line. The 13.2 kV power will feed throughout the mine to main
load centers where the power will be stepped down to 480v for underground equipment use. Feeds
will be provided at 220v for auxiliary use in the shops and for smaller loads such as fans, pumps, and
auxiliary lighting.
A diesel backup generator at the surface will supply backup power for the required ventilation systems
to maintain minimum ventilation requirements in the case of emergency.
Health & Safety
The mine design incorporates Colombian safety standards and includes emergency egress through
the fresh air ventilation decline at the upper MDZ zone of the mine as well as access into the active
mine above. The MDZ bottom zone egress plan will include an emergency hoist in the return air raise.
A stench air system will be available to notify employees of the need to exit the mine. Additionally,
multi-person refuge chambers are included that will be located in active working areas over the LoM.
The mine will have a communications system that has both mine phones and wireless communication
through a leaky feeder system. The mine safety program will integrate with local providers in case of
any mine emergency. A stench gas emergency warning system will be installed in the mine’s intake
ventilation system. This system can be activated to warn underground employees of a fire situation or
other emergency whereupon emergency procedures will be followed.

SRK Consulting (U.S.), Inc. NI 43-101 Technical Report – Marmato Project Page 220
MMS/KD Marmato_PEA_NI43-101_544400.020_Rev31_KD.docx November 2019
Workforce
Workforce levels are estimated based on the production schedule and equipment needs. The
productivities used reflect a mix of local and skilled labor with an experienced management team.
Manpower levels are estimated based on the production schedule and equipment needs. The
productivities used reflect a mix of local and skilled labor with an experienced management team.
The estimate is based on owner mining using an operating schedule consisting of 12 hours per shift,
two shifts per day, and seven days per week. The 12 hour shift is supported by a four crew rotation.
The management and technical team are planned to work five 8 hour days per week.
Table 16-33 shows the estimated MDZ mine workforce. The rotating crews will have a split of 66
people underground and 8 people on the surface. It is expected that the maximum personnel
underground would be 72 per shift. The workforce will increase over time through the addition of staff
to operate additional equipment.
Table 16-33: Typical Mining Labor by Shift
Day Shift (salaried) Days
Mine Superintendent 3
Mine Planner 2
Maintenance Superintendent 1
Maintenance Planner 2
Maintenance Technician 1
Senior Mining Engineer 1
Geotechnical Engineer 2
Mine Planning Engineer 3
Surveyor 3
Mine Technologist 2
Geologist 5
Total 25
Rotating Shift (hourly) Per Shift Total
Mine Supervisor/Shift Boss 3 15
Grade Control Geologist 2 8
Geotechnical Engineer 2 8
Safety/Mine Rescue/Training Supervisor 2 8
Surface Equipment Operator 2 8
Blasters 4 16
Ground Support, Hanging Services 6 24
Fuel/Lube/Boom/Grader/Telehandler 2 8
LHD & Truck Operator 8 32
Longhole and Jumbo Operator 4 16
Laborer 4 16
Diamond Driller 4 16
Backfill Crew - Bulkheads, Piping, Monitor 6 24
Paste Backfill Plant Operators-Surface 2 8
Mine Maintenance Supervisor/Lead Hand 1 4
Mechanic 6 24
Mechanic Helper 6 24
Electrician 4 16
Total 74 299
Grand Total 99 324
Source: SRK, 2019

SRK Consulting (U.S.), Inc. NI 43-101 Technical Report – Marmato Project Page 221
MMS/KD Marmato_PEA_NI43-101_544400.020_Rev31_KD.docx November 2019
Equipment
The underground equipment used, shown in Table 16-34, is typical for a sublevel stoping mining
method with the number of pieces of equipment calculated from the production rates and typical
availabilities for underground mines. The later years include additional trucks and LHDs due to
increasing haul distance.
Table 16-34: Mobile Equipment Life of Mine Summary
Type 2021 2022 2023 2024 2025 2026 2027 Total Units
Drill Longhole In the Hole - Sandvik DU 421 1 1 2
Explosives Charger (large)-Stopes/Raises - Orica MaxiCharger 5344 1 1
LHD (17T/7.3m3) - Sandvik LH 517 3 1 4
Drill Jumbo - 2 Boom - Sandvik DD 422i 3 1 4
Explosives Charger (small)-Drifts - Orica Handiloader 1120 (U100) 1 1
Bolter - Sandvik DS 411 Mechanical Bolter 2 1 3
Scissor Lift - Getman A64 2 2
Haul Truck (50T) - Sandvik TH551i 4 1 2 2 9
Cable Bolter - Sandvik DS421 1 1
LHD (7T) - Sandvik LH307 2 1 3
Boom Truck - Getman A64 1 1
Lube Truck - Getman A64 1 1
Fuel Truck - Getman A64 1 1
Flat Bed - Getman A64 (for small explosives charger and misc. use) 1 1
Shotcrete Sprayer Trailer - (38.2 m3/hr) 1 1
Transmixer Truck - Getman A64 HD R60 1 1
Telehandler - CAT 1255D 1 1
Skid Steer - CAT 272D 2 2
Personnel Carriers - Kubota RTV 1120D 5 5 10
Personnel Carrier - Getman A64 (16 person) 2 2
Underground Core Drill - Sandvik DE130i or equivalent 2 2
Mobile Trailer Compressors (350cfm) 2 Grader - CAT UG20M 1 1
Light Vehicles (4x4 Pickup Trucks, included in surface) 2 5 7
982M CAT Front End Loader - 6.7m3/8.75 dy3 1 1
Charger base - Getman A64 (for small and large chargers) 1 1 2
Source: SRK, 2019
The mine will also have surface equipment and facilities that is summarized in Table 16-35. The
underground facilities and equipment are summarized in Table 16-36.

SRK Consulting (U.S.), Inc. NI 43-101 Technical Report – Marmato Project Page 222
MMS/KD Marmato_PEA_NI43-101_544400.020_Rev31_KD.docx November 2019
Table 16-35: Mine Surface Equipment and Facilities Summary
Surface Facilities and Equipment
Portal
Power Supply and Mine Substation
Preproduction Fan System
Shipping Container Storage
Engineering Equipment Allowance
Main power line to UG yard (estimate 1km)
Mine Substation
Backup Generator for ventilation system
Dry and Office Building
Maintenance Shop (Truck Shop)
Tool Allowance for Shop
Communications Infrastructure and Mine automation
Mine Water Tank
Paste Backfill Plant
Source: SRK, 2019
Table 16-36: Underground Facilities and Equipment
UG Shop
Tool allowance for UG Shop
Main Ventilation Fans and Install
Refuge Chambers (12 person)
Refuge Chambers (8 person)
Mobile 200 amp welders
Mobile 400 amp welder
Portable Power Center 500 kVA (for mobile equipment)
Portable Power Center 1500 kVA (for pump stations - use 2 for portal)
Pump System for main level
Pump System for level -bottom of mine
Pump Skid System during development
Stope Fans
Ventilation misc (air doors, regulators, bulkheads)
Misc. Piping
Paste Backfill Piping and System
Powder and Primer Magazines
Fuel Delivery System (lines and pump system)
Source: SRK, 2019

SRK Consulting (U.S.), Inc. NI 43-101 Technical Report – Marmato Project Page 223
MMS/KD Marmato_PEA_NI43-101_544400.020_Rev31_KD.docx November 2019
17 Recovery Methods GCM operates a 1,200 tpd process plant to recover gold and silver values from material produced
from current Marmato mining operations in the Upper Zone. In addition, GCM is evaluating the
development of the MDZ, which is below the current mining operations and the construction of a new
4,000 tpd plant to process material soley from the MDZ. Recovery methods currently in use for
processing Marmato material and recovery methods being evaluated for processing MDZ material are
presented and discussed in this section.
17.1 Marmato Process Plant (Current Operations)
The Marmato process plant flowsheet incorporates unit operations that are standard to the industry
and includes:
• Three-stage crushing;
• Closed circuit ball mill grinding;
• Gravity concentration;
• Flotation;
• Flotation and gravity concentrate regrind;
• Cyanidation of the flotation and gravity concentrates;
• Counter-current-decantation;
• Merrill-Crowe zinc precipitation; and
• Smelting of precipitates to produce final dore’ product.
The Marmato process plant flowsheet is shown in Figure 17-1 and a list of major equipment is shown
in Table 17-1. Each of the process unit operations is briefly described in this section.

ROM OreCrushing Circuit
Primary Grinding Circuit
Flotation Circuit
Regrind and 1st StageCyanidation Circuit
Flotation Tails
2nd Stage Cyanidation Circuit
Merrill-Crowe Circuit
CCD Circuit
Cyanidation Tails
Final Doré Product
To the water recirculation system
Figure 17-1: Marmato Process Flowsheet

SRK Consulting (U.S.), Inc. NI 43-101 Technical Report – Marmato Project Page 225
MMS/KD Marmato_PEA_NI43-101_544400.020_Rev31_KD.docx November 2019
Table 17-1: Equipment List for Marmato Process Plant
Flowsheet No. Equipment Description Quantity Hp
1 Mine rail cars 1.5 t
2 Pre-hopper 100 t 1
3 Winch 2 60
4 Feed hopper 5 m x 7 m 1
5 Feed hopper with hydraulic gate 1
6 Hydraulic gate feeder 1
7 Vibrating grizzly 5 ft x 13 ft (5/16") 1 20
8 Primary jaw crusher 25" x 40" 1 125
9 Conveyor belt 30" 1 25
10 Vibrating screen (double-deck) 20 ft x 8 ft (7/8" x 3/8") 1 40
11 Conveyor belt 24" x 14 m 1 12
12 Secondary cone crusher Omincone -1352 1 250
13 Conveyor belt 24" x 14 m 1 12
14 Tertiary cone crusher HP300 1 300
15 Fine ore bin 7 m x 5.8 m 1
16 Spiral Classifier 30" x 17 ft 1 7.5
17 Conveyor belt 24" x 7 m 1 7
18 Conveyor belt (with belt scale) 24" x 9 m 1 7
19 Primary ball mill (Allis Chalmers) 9.5 ft x 14 ft 1 600
20 Tapezoidal jig 17 ft2 1 7
21 Cyclone feed pump 6" x6" 2 75
22 Hydrocyclone 20" 2
23 Flash flotation cell SK-80 1 20
24 Secondary ball mill 7.5 ft x 10 ft 1 300
25 Gravity concentrate pumps 3" x 3" 6 20
26 Flotation conditioner 12 ft x 12 ft 1 30
27 Rougher flotation cell KCF/KYF 30 1 75
28 Scavenger flotation cell (circular) 10 ft x 10 ft 3 30
29 Cleaner flotation cell 2 m x 2 m 2 7.5
30 Thickener 24 ft x 10 ft 4 3
31 Regrind cyclone feed pump Wilfley 5K 2 60
32 Regrind ball mill (Hardinge) 7 ft x 5 ft 1 200
33 Regrind hydrocyclone 6" 2
34 Pretreatment agitated tank 12 ft x 12 ft 2 12
35 Leach tank 20 ft x 20 ft 2 30
36 Thickener 30 ft x 10 ft 2 5
37 Leach tank 12 ft x 12 ft 6 12
38 PLS tank 12 ft x 12 ft 2
39 Clarifier 1
40 Deaeration tower 1
41 Precipitate filter feed pump 1 25
42 Zinc dust dosing cone 2
43 Vacuum pump 1 12
44 Precipitate filter press 1
45 Precipitate receiving tray 1
46 Flux mixing tray 1
47 Precipitate smelting furnace 1
48 Ingot molds 2
49 Dore’
50 Barren solution tank 12 ft x 12 ft 1
51 Thickener 12 ft x 35 ft 1
Source: GCM, 2019

SRK Consulting (U.S.), Inc. NI 43-101 Technical Report – Marmato Project Page 226
MMS/KD Marmato_PEA_NI43-101_544400.020_Rev31_KD.docx November 2019
17.1.1 Crushing Circuit
RoM material is hauled by rail from the mine and dumped into a hopper where a slusher is used to
move the material to a 5 m by 7 m feed hopper that feeds a vibrating grizzly to remove the -3/8 inch
material prior to feeding the primary jaw crusher. The discharge from the jaw crusher is conveyed to a
double-deck vibrating screen fitted with a 7/8 inch upper deck and a 3/8 inch lower deck. The screen
oversize from both decks is conveyed to a Nordberg HP300 cone crusher, which is operated in closed
circuit with the vibrating screen. The -3/8 inch screen undersize discharges to the fines bin. The -3/8
inch undersize from the vibrating grizzly is further classified in a spiral classifier. The classifier oversize
is fed directly into the primary ball mill and the classifier undersize is thickened and then pumped to
the primary hyrocyclones. A Nordberg Omincone 1352 serves as a standby secondary cone crusher.
17.1.2 Grinding and Gravity Concentration Circuit
Crushed material (-3/8 inch) is fed from the fines bin and then transported on a conveyor fitted with a
belt scale to the primary ball. The primary ball mill discharges to a jig which serves to recover coarse
gravity recoverable gold. The jig tailing is pumped to the cyclones where a size separation at P50 75
µm is made. The cyclone underflow discharges to the secondary ball mill, which is operated in closed
circuit with the cyclones and the overflow advances to the flotation circuit. The jig concentrate is
combined with the flotation concentrates prior to advancing to the regrind and cyanidation circuits.
17.1.3 Flotation and Concentrate Regrind Circuit
The cyclone overflow from the grinding circuit is advanced to the flotation circuit where it is first
conditioned with the required flotation reagents and then subjected to one stage of rougher flotation
followed by one stage of scavenger flotation, which provides a total flotation retention time of 40
minutes to recover the contained gold and silver values. The scavenger flotation concentrate is
upgraded in one stage of cleaner flotation and combined with the rougher flotation concentrate. The
rougher+scavenger cleaner flotation concentrates are combined with the gravity concentrate, and then
thickened to about 55% solids and reground to about 80% passing (P80) 44 µm. A portion of the
flotation tailings are pumped to an agitated storage tank and then pumped back underground with a
positive displacement pump for use as hydraulic backfill in the mine.
17.1.4 Cyanidation and Counter-Current-Decantation (CCD) Circuit
The reground gravity and flotation concentrates are re-thickened and then advanced to a conventional
two-stage cyanidation circuit which provides a total of 30 hours of leach retention time. The first stage
of leaching consists of two 20 foot (ft) by 20 ft agitated leach tanks operated in series at a cyanide
concentration of 700 mg/L NaCN and at a pH of 10.5 adjusted with lime. The second-stage leach
circuit consists of six 12 ft by 12 ft agitated leach tanks in which the cyanide concentration is allowed
to attenuate through the circuit from 700 to 400 mg/L NaCN. The leached slurry is then passed through
a counter-current-decantation circuit (CCD) which serves to wash the pregnant leach solution (PLS)
from the leached solids. The leached solids are discharged from the last CCD thickener and then
pumped to the tailing storage facility. The PLS is processed in the Merrill-Crowe circuit to recover the
solubilized gold and silver values.

SRK Consulting (U.S.), Inc. NI 43-101 Technical Report – Marmato Project Page 227
MMS/KD Marmato_PEA_NI43-101_544400.020_Rev31_KD.docx November 2019
17.1.5 Merrill-Crowe Circuit and Smelter
The PLS is pumped to the Merrill-Crowe circuit where it is first clarified to remove any remaining
suspended solids and then deaerated to less than 1 mg/L dissolve oxygen in a vacuum tower. Zinc
dust is then added to the deaerated PLS in a controlled manner which results in the precipitation of
the gold and silver values, which are then recovered in a filter press. The resulting gold and silver
precipitate is removed from the filter press on a scheduled basis and then smelted using a flux with
the following composition:
• Borax: 40%
• Sodium nitrate: 30%
• Soda ash: 20%
• Silica: 10%
Approximately 600 kg of flux is blended with 600 kg of precipitate and smelted in a diesel-fired furnace
to produce a final dore’ product.
17.1.6 Process Plant Consumables
Process plant consumables are shown in Table 17-2 and includes grinding media, wear materials and
process reagents. Consumable costs during 2019 (Jan to July) averaged US$3.05/t processed.
Table 17-2: Marmato Process Plant Consumables
Item kg/t US$/Kg US$/t
Grinding Balls (1.5 inch) 0.165 1.13 0.19 Grinding Balls (2 inch) 0.312 1.15 0.36 Grinding Balls (3 inch) 0.392 1.15 0.45 Wear Liners 0.32 Sodium Cyanide 0.370 2.48 0.92 Zinc Dust 0.020 5.03 0.10 Lime 0.625 0.18 0.11 Copper Sulfate 0.015 2.35 0.04 Xanthate (Z-11) 0.011 3.58 0.04 Aerofroth (A65) 0.028 5.56 0.16 Collector MX 5160 0.005 11.12 0.06 Aero AR1404 0.003 11.22 0.03 Lead Acetate 0.002 6.49 0.01 Flocculant (EGA 1203) 0.015 5.09 0.08 Silica 0.095 1.17 0.11 Borax 0.015 0.74 0.01 Soda Ash 0.008 0.60 0.00 Potassium Carbonate 0.001 1.65 0.00 Soloun K 0.015 1.37 0.02 ACPM 0.017 2.47 0.04
Total Consumables 3.05
Source: GCM, 2019

SRK Consulting (U.S.), Inc. NI 43-101 Technical Report – Marmato Project Page 228
MMS/KD Marmato_PEA_NI43-101_544400.020_Rev31_KD.docx November 2019
17.1.7 Operating Performance
The current Marmato process plant performance is summarized in Table 17-3 for the period from 2013
to 2019 (January to July). During this period mineralized tonnes processed has increased from
274,191 to 338,902 tpy while grades have declined slightly from 2.90 g/t Au in 2013 to 2.45 g/t Au in
2019 and silver grades have ranged from 12.36 to 9.13 g/t Ag. Overall gold recovery has ranged from
89.0 to 83.7% and has averaged about 86.5% over the past three years. Silver recovery has ranged
from 41.1 to 31.5% and has averaged 33.2% over the past three years. Gold production has increased
from 22,566 ounces in 2013 to 24,909 ounces in 2018.
Table 17-3: Summary of Marmato Plant Operating Performance
Parameter 2013 2014 2015 2016 2017 2018 2019 (Jan to Jul)
Mineralized Tonnes 274,191 295,023 303,279 341,309 365,119 338,902 211,817
Mineralization Grade
Au (g/t) 2.90 2.85 2.79 2.56 2.48 2.67 2.45
Ag (g/t) 12.36 9.13 9.33 9.24 9.61 10.53 10.41
Metal Recovery
Au (%) 88.6 89.0 88.0 83.7 86.8 85.5 87.2
Ag (%) 36.6 41.1 37.9 35.8 34.9 33.2 31.5
Metal Produced
Au (Ounces) 22,566 24,113 23,954 23,449 25,163 24,909 14,538
Ag (Ounces) 39,916 34,753 34,490 36,318 39,524 37,522 22,878
Source: GCM, 2019
17.1.8 Operating Costs
Marmato process plant operating costs reported for 2019 (Jan to July) are summarized in Table 17-4.
During this period operating costs averaged US$13.08/t processed (exchange rate: 3,000 COP per
US$).

SRK Consulting (U.S.), Inc. NI 43-101 Technical Report – Marmato Project Page 229
MMS/KD Marmato_PEA_NI43-101_544400.020_Rev31_KD.docx November 2019
Table 17-4: Summary of Marmato 2019 Process Plant Operating Costs (January to July)
Cost Area COP
January February March April May June July Total
Crushing 240,724,049 261,324,792 252,355,448 223,144,847 228,189,512 231,127,744 245,642,011 1,682,508,403
Grinding 414,319,416 411,151,704 480,682,035 391,170,440 457,363,520 441,570,671 441,171,448 3,037,429,234
Flotation 178,736,120 199,589,193 191,049,133 189,186,472 192,761,316 175,173,963 220,898,954 1,347,395,151
Cyanidation and Merrill-Crowe
277,422,528 265,688,731 302,358,644 257,520,281 270,019,391 287,406,736 322,249,721 1,982,666,032
Smelting 43,974,090 45,764,157 41,608,733 42,517,945 37,338,644 47,447,376 43,405,216 302,056,161
Total 1,155,176,203 1,183,518,577 1,268,053,993 1,103,539,985 1,185,672,383 1,182,726,490 1,273,367,350 8,352,054,981
Cost Area US$/tonne
January February March April May June July Average
Crushing 2.64 3.19 2.49 2.33 2.44 2.72 2.73 2.64
Grinding 4.55 5.03 4.74 4.09 4.89 5.20 4.90 4.76
Flotation 1.96 2.44 1.89 1.98 2.06 2.06 2.45 2.11
Cyanidation and Merrill-Crowe
3.05 3.25 2.98 2.69 2.89 3.38 3.58 3.11
Smelting 0.48 0.56 0.41 0.44 0.40 0.56 0.48 0.47
Total 12.69 14.47 12.51 11.54 12.67 13.92 14.14 13.08
Mineralized Tonnes
30,346 27,267 33,776 31,889 31,195 28,327 30,017 212,817
Exchange Rate 3,000 3,000 3,000 3,000 3,000 3,000 3,000 3,000
Source: GCM, 2019

SRK Consulting (U.S.), Inc. NI 43-101 Technical Report – Marmato Project Page 230
MMS/KD Marmato_PEA_NI43-101_544400.020_Rev31_KD.docx November 2019
17.2 MDZ Process Plant
Metallurgical testwork was conducted to evaluate three different process flowsheet options including:
• Whole-ore cyanidation;
• Gravity concentration followed by cyanidation of the gravity tailing; and
• Gravity concentration followed by gold and silver flotation from the gravity tailing and
cyanidation of the flotation concentrate.
After conducting a trade-off study the process flowsheet that includes gravity concentration followed
by cyanidation of the gravity tailing was selected as this flowsheet option offers higher overall gold
recoveries along with lower estimated capital and operating costs than the flowsheet that includes
flotation followed by cyanidation of the flotation concentrate.
The process flowsheet will incorporate process unit operations that are standard to the industry,
including: primary crushing, SAG mill/ball mill grinding, agitated cyanide leaching, gold and silver
carbon-in-pulp (CIP) adsorption onto activated carbon, gold and silver desorption, electrowinning and
refining. A conceptual process flowsheet is shown in Figure 17-2. Preliminary process design criteria
are presented in Table 17-5 and a major equipment list is provided in Table 17-6.

DATE: 10/07/2019
REVIEWED: EODRAWN:
FILE:
SCALE: NOT TO SCALE
DESIGN:REVISION NO.
SRK JOB NO.:
ISSUED FOR:
REPORT TITLE:
A544400.020
FIGURE 17-2
GRAN COLOMBIA GOLD MARMATOMDZ CONCEPTUAL FLOWSHEET

SRK Consulting (U.S.), Inc. NI 43-101 Technical Report – Marmato Project Page 232
MMS/KD Marmato_PEA_NI43-101_544400.020_Rev31_KD.docx November 2019
Table 17-5: Preliminary Design Criteria for the MDZ Process Plant
Area Units Criteria
General
Mine production rate, tpy tpy 1,400,000
Operating days per year days 350
Mill design capacity tpd 4,000
Gold grade g/t 2.5
Silver grade g/t 3.4
Gold recovery % 95.0
Silver Recovery % 40.0
Crushing
Operating days per year days 350
Shifts per day 2
Hours per shift hours 12
Availability % 70
Operating hours per day hours 17
Crushing Rate tph 238
Feed F80 mm 1,200
Product P80 mm 150
Grinding
Operating days per year days 350
Hours per day hours 24
Shifts per day 2
Hours per shift hours 12
Availability % 92
Feed Rate tph 181
Ball Mill Work Index, Bond, BWi kWh/t 20
SMC, Axb 29
Abrasion Index , Ai 0.65
Ball Mill, F80 µm 9,500
Ball Mill, P80 µm 100
Pre-Leach Thickener
Slurry Feed Density w/w% 35
Underflow density w/w% 60
Specific Settling Area m2/tpd 0.09
Hydraulic Loading m3/m2.hr 5.1
Flocculant (Magnafloc 10) g/t 15
Flocculant (Magnafloc 1687) g/t 10
Cyanidation
Preaeration hr 4
Slurry Density w/w% 45
Retention Time hr 48
Cyanide Leach Concentration (NaCN) ppm 500
PH 10.5
Cyanidation Tailing Thickening
Slurry Feed Density w/w% 45
Underflow density w/w% 55
Specific Settling Area m2/tpd 0.09
Hydraulic Loading m3/m2.hr 5.10
Flocculant (Magnafloc 10) g/t 15
Flocculant (Magnafloc 1687) g/t 10
Cyanide Detoxification
Slurry density w/w% 55
retention time hours 1.5
Feed CNT ppm 150
Discharge CNT ppm 10
SO2 dosage g/g CNwad 8
CuSO4 g/g CNwad 0.20

SRK Consulting (U.S.), Inc. NI 43-101 Technical Report – Marmato Project Page 233
MMS/KD Marmato_PEA_NI43-101_544400.020_Rev31_KD.docx November 2019
Table 17-6: Preliminary Major Equipment List
Quantity Units Size KW Comment
Crushing Circuit
ROM Ore Bin 1 tonne 250
Stationary Grizzly 1 mm 600 x 600 spacing
Apron Feeder 1 mm 1,100 x TBD 20
Fines Vibrating Screen 1 m2 20 50
Primary Jaw Crusher 1 mm 700 x1060 110
Crushed Ore Stockpile 1 tonnes 2,000 One shift live capacity
Grinding Circuit
SAG Mill 1 meter 7.3 x 2.7 2,300
Ball Mill 1 meter 4.0 x 8.5 4,000
Cyclones 6 inch D-15
Pebble Crusher 1 HP100 90
Centrifugal Gravity Concentrator 2 KC-XD30 15 Knelson or equivalent
Grinding Control Thickener 1 meter 30 7.5
Cyanidation Circuit
Agitated Leach Tanks 9 meter 13 x13 100
Interstage Screen 6 TBD Vertical air swept
Carbon Recovery Screen 1 TBD
Carbon Safety Screen 1 meter 3 x 8 2 x 15
Tailings Thickener 1 meter 30 7.5
Detox Circuit
Agitated Detoxification Tanks 2 meter 6 x 6 50
Gold Room
Acid Wash Column 2 meter 1.2 x 9.5 4.5t carbon capacity
Elution Column 2 meter 1.2 x 9.5 4.5t carbon capacity
Carbon Activation Kiln 1 250 kg /hr Horizontal, diesel fired
Electrowinning Cells 4 Ampere 1,500 SS 304/polylined
Dore' Furnace 1 Diesel Fired
Source: SRK, 2019
17.2.1 Crushing Circuit
RoM material will be loaded into the RoM feed hopper by haul truck or front-end loader. A grizzly will
be fitted to the RoM hopper to protect the downstream equipment from oversize material. A rock
breaker will be provided to reduce oversize rock retained on the grizzly. RoM material will be drawn
from the hopper at a controlled rate by a variable speed apron feeder and discharged onto a vibrating
grizzly ahead of the jaw crusher. The grizzly oversize (+6 inches) will feed the jaw crusher. The crusher
product and vibrating grizzly undersize will discharge onto a conveyor belt and be transported to the
crushed material stockpile. Crushed material will be withdrawn from the stockpile at a controlled rate
by variable speed apron feeders and conveyed to the grinding circuit.
17.2.2 Grinding, Classification and Gravity Circuit
The grinding circuit will consist of a SAG mill discharging to a pebble screen with the screen oversize
conveyed to a pebble crusher and then returned to the SAG mill. The screen undersize will be
advanced to a ball which will be operated in closed circuit with hydrocyclones to produce a final grind
size of P80 100 µm. The cyclone underflow will flow to either the Knelson-type semi-continuous
centrifugal gravity concentrator or be recirculated back to the ball mill. The cyclone overflow will
gravitate to the pre-leach thickener where it will be thickened prior to being pumped to the cyanidation
circuit. The gravity concentrate produced from the Knelson concentrators will be subjected to batch
intensive cyanide leaching. The tails from the Knelson concentrators will flow back to the ball mill.

SRK Consulting (U.S.), Inc. NI 43-101 Technical Report – Marmato Project Page 234
MMS/KD Marmato_PEA_NI43-101_544400.020_Rev31_KD.docx November 2019
17.2.3 Grinding Control Thickener
Cyclone overflow will be screened to remove trash such as any coarse particles, wood fragments,
organic material, plastics and lime slurry grits that could otherwise blind the inter-tank screens. The
screen oversize (trash) will be collected in a bin, and the screen undersize (slurry) will flow to the
grinding control thickener where it will be dosed with flocculant in the feed well. Flocculant fed to the
thickener will be diluted with water in a static mixer to ensure good dispersion throughout the feed
stream. Thickener underflow will be pumped to the agitated cyanidation circuit, and thickener overflow
will report to the process water tank.
17.2.4 Leach and Carbon Adsorption Circuit
The thickener underflow will be pumped to the leach distributor feed box where it will be sampled by a
two-stage cross cut feed sampler. The sampler will be used to take representative samples of the
cyanide circuit feed head grade for metallurgical accounting purposes. It is anticipated that the
cyanidation circuit will consist of one stage of preaeration followed by standard agitated cyanidation
and CIP. The leach tanks will be interconnected with launders, and slurry will flow by gravity through
the tank train. Each tank will be fitted with a dual impeller mechanical agitator to ensure uniform mixing
and dispersion. Oxygen required for leaching will be provided by air sparging through the bottom of
the agitator shaft into the slurry. The CIP adsorption tanks will each be fitted with an air swept woven
wire inter-tank screen to retain the carbon. All tanks will be fitted with bypass facilities to allow any tank
to be removed from service for agitator or screen maintenance.
Sodium cyanide solution will be metered into the leach feed distribution box, as required, to achieve
the desired initial cyanide concentration (500 ppm NaCN), which will be allowed to attenuate to about
200 ppm NaCN at the discharge of the circuit. Compressed air will be distributed to the circuit and
sparged down the shafts of the agitators to allow a high dissolved oxygen profile to be maintained in
the circuit. Fresh and regenerated carbon will be returned to the circuit at the last CIP Tank, and will
be advanced counter-currently through the circuit. The inter-tank screen in each CIP tank will retain
the carbon and allow the slurry to gravity flow to the next CIP tank. This counter-current process will
be repeated until the carbon reaches CIP Tank 1 at which point an air lift will be used to transfer loaded
carbon to the loaded carbon recovery screen. The loaded carbon will be washed and dewatered on
the recovery screen prior to reporting to the acid wash/elution column. The recovery screen undersize
will return to the CIP circuit.
Slurry from the last CIP tank (leach tails) will flow to the vibrating carbon safety via the tails sampler
for metallurgical accounting. The safety screen will recover any carbon passing through worn inter-
tank screens or overflowing the tanks. Screen underflow will then flow to the cyanide destruction circuit.
Barren carbon returning to the adsorption circuit from the carbon regeneration kiln will be screened on
the sizing screen to remove fine carbon and prevent associated gold losses. The CIP tanks will be
located in a bunded area with a sloping concrete floor. Any spillage from the circuit will report to one
of two sumps and can be returned to the circuit or to the carbon safety screen ahead of the cyanide
destruction circuit.

SRK Consulting (U.S.), Inc. NI 43-101 Technical Report – Marmato Project Page 235
MMS/KD Marmato_PEA_NI43-101_544400.020_Rev31_KD.docx November 2019
17.2.5 Elution and Gold Room Operations
The following operations will be carried out in the elution and gold room areas:
• Acid washing of carbon;
• Stripping of gold from loaded carbon;
• Electrowinning of gold from pregnant solution;
• Smelting; and
• Carbon regeneration.
Acid Wash
Loaded carbon will be recovered on the loaded carbon recovery screen and directed to the acid wash
column. Acid washing of the carbon will commence after carbon transfer and drain down is complete.
The acid wash solution, 3% w/w HCl in fresh water, will be mixed in the dilute acid tank and transferred
to the acid wash column. The acid wash process removes contaminants, primarily calcium, from the
loaded carbon and prevents carbon fouling which reduces the effectiveness of the carbon. After the
prescribed acid soak period, the carbon will be rinsed with fresh water. Approximately three bed
volumes of fresh water will be pumped through the column to displace any residual acid from the
carbon. Dilute acid and rinse water will be neutralized and disposed of with the tailings. Acid-washed
carbon will be transferred to the elution column for stripping.
Pre-Soak and Elution
Strip solution will be pumped from the strip solution tank through in-line heat exchangers into the base
of the elution column. Sodium hydroxide and sodium cyanide solutions will be pumped from the
respective storage tanks into the strip solution tank. The loaded carbon will be pre-soaked in the 2%
cyanide / 2% caustic strip solution for 30 minutes to prepare the gold for elution. The carbon will then
be eluted with a hot strip solution (1200 C), which will then flow to the pregnant solution tank. Outgoing
strip solution will pass through the recovery heat exchanger to heat the incoming strip solution.
Electrowinning
Direct current will be passed through stainless steel anodes and stainless steel wool mesh cathodes
to deposit gold and silver sludge on the cathodes. Solution discharging from the electrowinning cells
will return by gravity to the pregnant solution tank. Electrowinning will continue until the solution exiting
the electrowinning cells is depleted of gold.
Gold Room
The electrowinning cells will be located within the security area of the gold room. Rectifiers, one per
cell, will be located in a non-secure area below the cells allowing maintenance access without
breaching gold room security. The electrowon gold and silver will be removed from the cathodes in-
situ by washing with high pressure water. The resulting sludge will be filtered in laboratory-style
pressure filters and dried in an oven. The sludge will then be smelted with fluxes in an HFO or diesel
fired furnace to produce doré bars. Slag from smelting operations will be returned to the milling circuit.
Fume extraction equipment will be provided to remove gases from the electrowinning cells, drying
oven and smelting furnace.

SRK Consulting (U.S.), Inc. NI 43-101 Technical Report – Marmato Project Page 236
MMS/KD Marmato_PEA_NI43-101_544400.020_Rev31_KD.docx November 2019
Carbon Regeneration
After completion of the elution process, the barren carbon will be transferred from the elution column
to the carbon dewatering screen to dewater the carbon prior to entering the feed hopper of the
horizontal carbon regeneration kiln. Any residual water will be drained from the carbon in the kiln feed
hopper before it enters the kiln. It is anticipated that only 75% of the carbon will be regenerated each
cycle. In the kiln, the carbon will be heated to 650°C to 750°C for 20 minutes to allow regeneration to
occur. Regenerated carbon from the kiln will be quenched and report to the carbon sizing screen. The
screen oversize (regenerated and sized carbon) will return to the cyanidation circuit.
17.2.6 Carbon Safety Screen
Tailings slurry from the final CIP tank will gravitate through the metallurgical sampler to the carbon
safety screen. Recovered carbon will be collected in the fine carbon bin for separate handling to
recover the contained precious metal values. The safety screen undersize will be advanced to the
cyanide destruction circuit.
17.2.7 Cyanide Destruction Circuit
The carbon safety screen undersize slurry will report to the SO2/air cyanide destruction circuit, which
utilizes SO2 and air in the presence of a soluble copper catalyst to oxidize cyanide to cyanate (OCN).
The SO2 source will be sodium metabisulfite (SMBS). Copper sulfate pentahydrate will be added to
supply the necessary copper in solution. Air will be sparged into the cyanide destruction tanks through
the agitator shaft. Slaked lime will be added to neutralize the sulfuric acid formed in the reaction and
maintain the slurry at about pH 9.
The cyanide destruction circuit will reduce the weak acid dissociable cyanide (CNwad) concentration
in the CIP discharge to less than 10 ppm, which is expected to self-attenuate to about 2.5 ppm in the
tailing storage facility (TSF). The cyanide destruction circuit will consist of two agitated tanks, which
will provide 90 minutes total retention time.
17.2.8 Tailings Disposal
Tailings from the cyanide detoxification circuit and other miscellaneous waste streams from the
process plant will be combined in the tailings collection sump and pumped to the TSF or mine backfill
plant where they will be filtered for dry stack disposal at the TSF or used as backfill underground.
17.3 Consumable Requirements
Process plant consumable requirements are shown in Table 17-7 and based on metallurgical studies
conducted to-date.

SRK Consulting (U.S.), Inc. NI 43-101 Technical Report – Marmato Project Page 237
MMS/KD Marmato_PEA_NI43-101_544400.020_Rev31_KD.docx November 2019
Table 17-7: MDZ Process Plant Consumables
Cost Area Usage (sets/year) kg/t
Wear Materials
Crusher Liners 6
SAG Mill Grinding Media 0.75
SAG Mill Liners 2
Ball Mill Grinding Media 0.75
Ball Mill Liners 2
Reagents
Lime (agitated leach) 1.0
Lime (CN-destruct) 0.30
Cyanide (agitated leach) 0.15
Cyanide (gravity conc. leach) 0.15
Flocculant 0.04
Sodium Metabisulfite 1.6
Copper Sulfate 0.03
Activated Carbon 0.05
Power kWh/t
Grinding Power (kWh/t) 27
Plant Power- Other (kWh/t) 16
Source: SGS and SRK, 2019
17.3.1 Lime
Quicklime will be delivered to the site in bulk by pneumatic tanker and stored in the lime silo. It is
anticipated that the quicklime will be slaked in a vendor supplied package accompanying the silo. The
slaked lime will be pumped to the grinding circuit and the cyanide destruction circuit in a ring main. A
dust collector will minimize dust emissions during silo filling.
17.3.2 Sodium Cyanide
Sodium cyanide will be delivered as briquettes in shipping containers containing approximately 1 t of
cyanide each. The containers will be emptied into the cyanide mixing tank and mixed with water to
dissolve the cyanide to a target strength of 20% NaCN. Sodium hydroxide will be added to the mixing
tank prior to cyanide addition in order to maintain a solution pH of 11 to prevent HCN generation. The
mixed cyanide solution will be transferred to the storage tank for dosing to the process. Empty cyanide
containers will be returned to the vendor.
17.3.3 Activated Carbon
Activated carbon will be delivered in 500 kg bulk bags. Carbon will be added to the carbon quench
vessel as required for carbon make-up to the CIP inventory. This addition point will allow removal of
carbon fines prior to entering the CIP tanks.
17.3.4 Flocculant
Flocculant for use in the grinding control and tailings thickeners will be delivered to site in 25 kg bags.
The vendor supplied flocculant mixing system will automatically mix batches of flocculant and transfer
the mixed flocculant to the aging tank after each mixing cycle is complete. Flocculant will be distributed
to the thickeners using positive displacement dosing pumps.

SRK Consulting (U.S.), Inc. NI 43-101 Technical Report – Marmato Project Page 238
MMS/KD Marmato_PEA_NI43-101_544400.020_Rev31_KD.docx November 2019
17.3.5 Copper Sulfate
Copper sulfate will be delivered in 1 t bulk bags and will be added to the mixing tank using an electric
hoist and bag breaker. Fresh water will be added to the mixing tank to dilute the copper sulfate. The
solution will be metered to the cyanide destruction and flotation circuits directly from the mixing tank.
17.3.6 Sodium Metabisulfite
Sodium metabisulfite will be delivered in 1 t bulk bags and will be added to the mixing tank using an
electric hoist and bag breaker. An air exhaust fan will draw dust and fumes away from this area as
SO2 gas is evolved and the dust can cause skin irritation. Fresh water will be used to mix the sodium
metabisulfite. The solution will be pumped from the mixing tank to the storage tank for metering to the
cyanide destruction circuit by dosing pump.
17.3.7 Grinding Media
Grinding balls will be delivered to site in bulk or 200 L steel drums.
17.4 Metallurgical Accounting
A weightometer on the primary crusher discharge conveyor will measure the primary crushed tonnage
and a weightometer on the SAG mill feed conveyor will determine mill feed tonnes.
Density and flow meters on the leach feed will allow the dry tonnage of solids to be determined as a
cross check on the mill feed tonnage determined from the mill feed weightometer. In conjunction with
the leach feed and tails samplers, the mass flow measurements will allow the gold recovered in the
CIP to be calculated.
Routine sampling of the leach feed stream and the final leach tailings will ensure reliable composite
shift samples for leach head grade and tails solution and residue grades. Regular in-circuit gold
surveys will allow reconciliation of precious metals in feed compared to doré production.
17.5 Operating Cost Estimate
Process operating costs are summarized in Table 17-8 and are estimated at US$13.34/t processed.
Operating costs have been estimated by major category (labor, power, consumables, etc.) and are
based on a throughput capacity of 4,000 tpd. The major contributors to operating cost are labor,
reagents, comminution consumables and power.
Table 17-8: Operating Cost Summary MDZ Process Plant
Cost Area Gravity-Cyanidation
(US$/t)
Labor 1.14
Comminution Consumables 2.76
Reagents 2.54
Power 4.30
Maintenance & Lubrication Supplies 0.60
Laboratory 0.50
Other 1.50
Total 13.34
Source: SRK, 2019

SRK Consulting (U.S.), Inc. NI 43-101 Technical Report – Marmato Project Page 239
MMS/KD Marmato_PEA_NI43-101_544400.020_Rev31_KD.docx November 2019
17.5.1 Labor
Labor costs are estimated US$1.14/t processed and are based on GCM’s actual labor rates and the
manpower schedule shown in Table 17-9. A total of 92 process plant employees (operations and
maintenance) has been identified. The labor cost estimate is based on the process plant operating two
12-hour shifts per day and includes a 60% burden rate. GCM’s labor rates have been converted to
US$ at an exchange rate of 3,000 COP per US$.
Table 17-9: MDZ Process Plant Manpower Schedule and Labor Cost Estimate
Position Number Annual (US$) Burden Burdened (US$) Total(US$)
Plant Manager 1 90,000 0.60 144,000 144,000
Administrative Assistant 1 8,000 0.60 12,800 12,800
Subtotal 2 98,000 156,800 156,800
Operating Crews Shift Supervisors 4 20,000 0.60 32,000 128,000
Crusher/Conveying Area Lead Operator 4 8,500 0.60 13,600 54,400
Assistant Crusher/Conveying Area Operator 4 4,500 0.60 7,200 28,800
Grinding/Gravity Area Lead Operator 4 8,500 0.60 13,600 54,400
CIP Operator 4 8,500 0.60 13,600 54,400
Gold Room Supervisor 2 20,000 0.60 32,000 64,000
Gold room Operator 4 8,500 0.60 13,600 54,400
Reagent Area Operator 2 4,500 0.60 7,200 14,400
General Laborer 8 4,500 0.60 7,200 57,600
Tailings Operator 4 4,500 0.60 7,200 28,800
Control Room Operator 4 6,000 0.60 9,600 38,400
Subtotal 44 98,000 156,800 577,600
Senior Metallurgist 1 36,000 0.60 57,600 57,600
Junior Metallurgist 1 10,000 0.60 16,000 16,000
Metallurgical Technician 2 7,000 0.60 11,200 22,400
Chemist 2 10,000 0.60 16,000 32,000
Sample Preparers 6 4,500 0.60 7,200 43,200
Analytical Technicians 6 6,000 0.60 9,600 57,600
Subtotal 18 73,500 117,600 228,800
Maintenance - Process plant Maintenance Foreman 4 44,000 0.60 70,400 281,600
Maintenance Planner / Foreman 2 9,000 0.60 14,400 28,800
Mechanics 8 9,000 0.60 14,400 115,200
Welders 2 9,000 0.60 14,400 28,800
Electrician 6 9,000 0.60 14,400 86,400
Instrument Technician 2 14,000 0.60 22,400 44,800
Trades Assistants 4 7,000 0.60 11,200 44,800
Subtotal 28 101,000 161,600 630,400
Total Processing Plant + Maintenance 92 370,500 592,800 1,593,600
Mineralized Tonnes Per Year 1,400,000 US$/t 1.14
Source: GCM, 2019
17.5.2 Consumables
Estimated consumable costs are shown in Table 17-10. Comminution consumables are estimated at
US$2.76/t and are based on wear liner and grinding media consumption rates that are typical for this
type of process facility. Reagent costs are estimated at US$2.54/t and are based on reagent
consumption rates established during metallurgical testing and current reagent pricing reported by
GCM. Other costs are estimated at US$0.20/t and are intended to cover costs for miscellaneous
consumables, such as sodium hydroxide, hydrochloric acid and fluxing agents.

SRK Consulting (U.S.), Inc. NI 43-101 Technical Report – Marmato Project Page 240
MMS/KD Marmato_PEA_NI43-101_544400.020_Rev31_KD.docx November 2019
Table 17-10: MDZ Process Plant Consumable Operating Cost Estimate
Cost Area Usage
kg/t US$/set or kg
US$/t Sets/year (FOB Site)
Wear Materials
Crusher Liners 6 25,000 0.11
SAG Mill Grinding Media 0.75 1.20 0.90
SAG Mill Liners 2 300,000 0.43
Ball Mill Grinding Media 0.75 1.20 0.90
Ball Mill Liners 2 300,000 0.43
Subtotal Wear Materials 2.76
Reagents
Lime (agitated leach) 1.0 0.25 0.25
Cyanide (agitated leach) 0.15 2.50 0.38
Cyanide (gravity conc. leach) 0.15 2.50 0.38
Flocculant 0.04 5.00 0.20
Na-Metabisulfite 1.6 0.50 0.82
Copper Sulfate 0.03 2.30 0.07
Lime ( CN-destruct) 0.3 0.25 0.08
Activated Carbon 0.05 3.50 0.18
Other 0.20
Subtotal Reagents 2.54
Power kWh/t US$/kWh US$/t
Grinding Power (kWh/t) 27 0.10 2.70
Plant Power- Other (kWh/t) 16 0.10 1.60
Subtotal Power 4.30
Mineralized Tonnes Per Year 1,400,000
Source: SGS and SRK, 2019
17.5.3 Power
The process plant power cost is estimated at US$4.30/t and is based on power supplied from the grid
at US$0.10/kWh and a total unit power consumption of 43 kWh/t. The estimated unit power
consumption includes an estimate of 27 kWh/t to grind feed material to the target grind of P80 100 µm
prior to cyanidation, which is based on SAG and ball mill comminution index (SMC and BWi)
determinations conducted during the metallurgical investigation. An allowance of 16 kWh/t for other
process unit operations is also included.
17.5.4 Maintenance Supplies
Maintenance supply costs are estimated at US$0.60/t and are based on 3% of estimated equipment
capital expenditure.
17.5.5 Laboratory Cost
Laboratory cost is estimated at US$0.50/t, which is similar to other operations of this size
17.6 Capital Cost Estimate
The capital cost for the 4,000 tpd process plant is summarized in Table 17-11 and is estimated at
US$65.6 million and is considered at a conceptual level with a +/-50% level of accuracy. The capital
cost estimate is based on Infomine’s CostMine Model for a CIP processing plant, and includes the
following adjustments:

SRK Consulting (U.S.), Inc. NI 43-101 Technical Report – Marmato Project Page 241
MMS/KD Marmato_PEA_NI43-101_544400.020_Rev31_KD.docx November 2019
• Capital cost has been adjusted to the 4,000 tpd design using the industry accepted Cost-
Capacity relationship; Costp2 = Costp1 X (Capacityp2/Capacityp1)0.65;
• TSF capital cost has been excluded (included as a separate cost area);
• Working capital excluded (included in the technical economic model);
• Contingency excluded (a global contingency factor is included in the technical economic
model); and
• Process plant capital cost has been increased by 30% based on SRK’s experience with the
CostMine models.
Table 17-11: Preliminary Process Capital Cost Estimate
Cost Area Tonnes Per Day
4,000
Equipment 19,069,499
Installation Labor 13,241,430
Concrete 1,600,360
Piping 5,946,814
Structural Steel 1,641,741
Instrumentation 1,276,735
Insulation 623,637
Electrical 2,046,104
Coatings & Sealants 259,755
Mill Building 2,027,888
Engineering and Design 10,022,380
Construction Management 7,795,122
Total CIP (US$) 65,551,466
Source: SRK, 2019 Capex Estimate Excludes:
• Initial TSF
• Working Capital
• Contingency
17.7 Significant Factors
GCM currently operates a 1,200 tpd process plant (rated capacity) to recover gold and silver values
from mineralization produced from current Marmato mining operations. The current Marmato process
plant includes gravity concentration followed by gold flotation from the gravity tailing and cyanidation
of the flotation concentrate.
• During the period from 2013 to 2019 overall gold recovery has ranged from 89.0 to 83.7% and
has averaged about 86.5% over the past three years. Silver recovery has ranged from 41.1 to
31.5% and has averaged 33.2% over the past three years.
• Marmato process plant operating costs reported for 2019 (Jan-July) averaged US$13.08/t
processed (exchange rate: 3,000 COP per US$).
MDZ material will be processed at the rate of 4,000 tpd using a flowsheet that includes gravity
concentration followed by cyanidation of the gravity tailing:
• The MDZ material is significantly harder than Marmato mineralization and will incur higher
comminution costs;
• Gold recovery is estimated at 95% and silver recovery is estimated at 40%;
• Process plant operating costs are estimated at US$13.34/t; and
• Process plant capital cost is estimated at US$65.6 million at an accuracy of +/-50%.

SRK Consulting (U.S.), Inc. NI 43-101 Technical Report – Marmato Project Page 242
MMS/KD Marmato_PEA_NI43-101_544400.020_Rev31_KD.docx November 2019
18 Project Infrastructure
18.1 General Site Access
The Project is in the Municipality of Marmato in Caldas. The concessions of the Marmato Project are
located on the eastern side of the Western Cordillera (Cordillera Occidental) of Colombia on the west
side of the Cauca River.
The Marmato Project is located approximately 125 km south of Medellín, the capital of the department
of Antioquia, Colombia. Medellín is the second largest city in Colombia with a population of
approximately 2.5 million. The Project is located in the department of Caldas near El Llano.
Figure 18-1 shows the location of the Project.
Source: GCM, 2017
Figure 18-1: Marmato Project Location
Primary access to the site is via the Pan American Highway, Colombia Highway 25. The road is a
paved two lane improved highway that is the winds through the mountainous area south of Medellín
and then follows the Cauca River to the turn off to the Project. The route from Medellín is via Itaguí
(7 km), Caldas (12 km), Alto de Minas (13 km), Santa Barbara (27 km), La Pintada (26 km), La
Guaracha del Rayo (32 km), and then a turn onto a secondary road to the community of El Llano that
is the community closest to the Project. From El Llano, the road is paved but partially single lane
another 2 km to the project security gate. An improved dirt road continues up the mountain another
4 km to the community of Marmato, where the artisinal miners are working the Zona Alta portion of the
Project. Approximately 40% of the 1,200 employees currently employed by the Project live in El Llano,
with the remainder traveling to work from various communities in the area.

SRK Consulting (U.S.), Inc. NI 43-101 Technical Report – Marmato Project Page 243
MMS/KD Marmato_PEA_NI43-101_544400.020_Rev31_KD.docx November 2019
The Pan American Highway continues south and east 90 km to another large regional city, Manizales,
and then on another 270 km to Bogotá, the capital of Colombia. Air access through international and
regional airports is available in Medellín, Manizales, and Bogatá.
Field personnel for the exploration program have been employed from the towns of Marmato and El
Llano and neighboring municipalities. In the long term, personnel currently working on the large
number of small scale mines and from the surrounding region would be able to supply the basic
workforce for any future mining construction and operation.
18.2 Marmato Existing Operations Infrastructure
18.2.1 Existing Project Access
The general project access is described in section 18.1. The secondary road to the existing operation
and general layout of the facilities is shown in Figure 18-2.
Source: SRK, 2019
Figure 18-2: Marmato General Access and Major Facilities

SRK Consulting (U.S.), Inc. NI 43-101 Technical Report – Marmato Project Page 244
MMS/KD Marmato_PEA_NI43-101_544400.020_Rev31_KD.docx November 2019
18.2.2 Existing Project Facilities
The Project has a fully developed infrastructure and facilities that include a security checkpoint that
provides access to the office and administrative office area. The facilities include employee motorcycle
parking, meeting area, multiple shops and warehouses, a camp with cafeteria, exercise and sports
field, equipment storage yards, compressor station, welding shop, a 500 kW backup generator,
processing plant, underground mine, explosives storage a short distance from the mine that is
managed by the military, main power substation and distribution powerlines with motor control centers
at key loads. The site has three portals that access the mine workings. A yard that has rail through it
near the portal allows servicing of the mine cars and locomotives. Figure 18-3 shows the overall plant
and camp area.

SRK Consulting (U.S.), Inc. NI 43-101 Technical Report – Marmato Project Page 245
MMS/KD Marmato_PEA_NI43-101_544400.020_Rev31_KD.docx November 2019
Source: GCM, Modified by SRK, 2019
Figure 18-3: Marmato Existing Project Site Map

SRK Consulting (U.S.), Inc. NI 43-101 Technical Report – Marmato Project Page 246
MMS/KD Marmato_PEA_NI43-101_544400.020_Rev31_KD.docx November 2019
18.2.3 Energy Supply and Distribution - Existing Marmato Project
Power to the project site is provided through the Colombian power company Central Hidroeléctrica
de Caldas (CHEC), a subisidiary of Empresas Públicas de Medellín (EPM) through existing local
substations. Substantial transmission capacity is available in the region around the Project, with energy
provided over the transmission system by the third largest electricity producer in Colombia, ISAGEN.
A 115 kV ISAGEN powerline feeds two main substations that transform the 115 kV to 33 kV. The main
substation feeding the Project has a capacity of 40 MVA and supplies the Project at 33 kV through the
El Dorado substation to the GCM principal substation. The 8.1 MVA main GCM substation has six
transformers that provide power to the mine, mill, and other facilities.
The loads supported by each transformer are provided as follows:
• Transformer 1 (2,000 KVA) steps the 33 kV power down to 13.2 kV and feeds the three mine
substations that in turn feed the compressors, pumps and offices/shops 440 VAC;
• Transformer 2 (2,000 KVA) feeds the mine at 13.2 kV through three separate mine
transformers that in turn feed the various mine levels, hoists, pumps, and mine equipment.
The equipment operates on 440 VAC;
• Transformer 3 (600 KVA) feeds the ball mill at the processing plant at 4,160 VAC;
• Transformer 4 (1,250 KVA) and 5 (630 KVA) feeds two compressors each at 440 VAC; and
• Transformer 6 (1,600 KVA) provides 440 VAC for the beneficiation plant.
The Project one-line electrical diagram is shown in Figure 18-4.

SRK Consulting (U.S.), Inc. NI 43-101 Technical Report – Marmato Project Page 247
MMS/KD Marmato_PEA_NI43-101_544400.020_Rev31_KD.docx November 2019
Source: GCM, 2019
Figure 18-4: Marmato Electrical System Schematic

SRK Consulting (U.S.), Inc. NI 43-101 Technical Report – Marmato Project Page 248
MMS/KD Marmato_PEA_NI43-101_544400.020_Rev31_KD.docx November 2019
18.2.4 Site Water Supply
Water supply for the existing Marmato mining activities is currently provided by a combination of
underground dewatering and reclaim from the existing TSF. The current Project has adequate water
supplies, but can be challenged during dry portions of the year. The Project has contingency plans to
draw water from either the Cascabel or Cauca River, with the Cauca River being the preference.
18.3 MDZ Project Infrastructure
The MDZ Project will require new infrastructure to support the development of the new mine and
processing facility. The new facilities will be located northeast of the existing Marmato Project and
approximately 2.7 km from the existing site by the existing road through El Llano. Figure 18-5 shows
the general location of the new processing facilities, camp, TSF, and MDZ mine portal.
Source: SRK, 2019
Figure 18-5: Marmato MDZ General Infrastructure Location

SRK Consulting (U.S.), Inc. NI 43-101 Technical Report – Marmato Project Page 249
MMS/KD Marmato_PEA_NI43-101_544400.020_Rev31_KD.docx November 2019
Additional detail is provided in the conceptual layout of the processing plant, mine portal, mine dump,
and access to the MDZ processing site (Figure 18-6).

SRK Consulting (U.S.), Inc. NI 43-101 Technical Report – Marmato Project Page 250
MMS/KD Marmato_PEA_NI43-101_544400.020_Rev31_KD.docx November 2019
Source: SRK/Ausenco, 2019
Figure 18-6: MDZ Processing and Mine Portal Site General Arrangement

SRK Consulting (U.S.), Inc. NI 43-101 Technical Report – Marmato Project Page 251
MMS/KD Marmato_PEA_NI43-101_544400.020_Rev31_KD.docx November 2019
18.3.1 MDZ Access
The new MDZ plant site will be accessed with a new access road off of the main paved road that
connects El Llano to the Pan American Highway. The new road will allow access to the plant facilities
and the new portal.
18.3.2 MDZ Project Surface Facilities
The MDZ Project will include a security access at the junction of the El Llano highway. The plant area
will have a parking area and an office facility. The plant site will have reagent storage, workshops,
laydown areas, warehousing, laboratory facilities, a new MDZ substation and power distribution to the
mine portal and the plant facility including the crusher and main stockpile. The portal site will be
adjacent to the plant with access to the mine, mine truck shop, tire pad, fuel storage and fueling facility,
parking, and mine RoM storage. The mine waste dump will also be located near the portal. The TSF
will be in several locations and is discussed in Section 18.4
The MDZ camp facility will be located near the existing camp with access to the existing camp facilities.
The new infrastructure will include all necessary communications systems required to operate the mine
and mill effectively.
18.3.3 MDZ Energy Supply and Distribution
The MDZ site will include a new 25 MVA substation that will be fed from the existing power system in
the area. The new substation will feed the processing facility and will also feed the mine through a
mine substation at the mine portal. The mine substation will feed power at 13.2 kV down the mine
decline to the main mineralized zone. Backup generation will be required for key systems at the plant
and ventilation systems and pumps at the mine.
18.3.4 Water Supply
The water for the MDZ plant and mine will be supplied by a combination of groundwater from the mine,
recycled water from the TSF and new dry stack tailings storage facility (DSTF), and fresh water from
the Cauca River.
Water Balance Modeling
The water balance was developed to produce a makeup demand for water at the MDZ processing
plant which could be sourced from the contact water produced by the DSTF, underground dewatering
as described in Section 16.3.2, or an external freshwater source, prioritized in that order. The model
also estimated if excess water would result from the DSTF contact water and/or the underground
dewatering exceeding the makeup demand. SRK assumed that discharges from the underground
could be discharged if monitored, and discharges from the DSTF can be discharged with monitoring
and control of suspended solids and cyanide. This is further addressed in Section 20, Environmental
Studies.
The water balance indicated that the water produced by the DSTF will occasionally exceed that
required by the process plant as makeup, with the most excess during the first few years of the Project
(25,000 m3/mon), as production (and thus demand) is still ramping up but the DSTF footprint is
relatively large. With limited storage available at site, excess water from the DSTF would need to be
discharged.

SRK Consulting (U.S.), Inc. NI 43-101 Technical Report – Marmato Project Page 252
MMS/KD Marmato_PEA_NI43-101_544400.020_Rev31_KD.docx November 2019
Similarly, projected underground dewatering flows exceed the demand for water from the underground
by a factor of 3 or more and excess underground dewatering is expected to be discharged at rates of
80,000 to 270,000 m3/mon. Makeup demand vs available water from the DSTF and MDZ dewatering
predicted by the model is shown in Figure 18-7.
Source: SRK, 2019
Figure 18-7: Makeup and Demand at the MDZ Process Plant
Overall, the water balance model of the Project indicates a net surplus of water for the Project due
largely to an overall increase in available water from the MDZ dewatering and a decrease in makeup
demand resulting from the lower moisture contents in the dewater tailings.
Although the water balance does not indicate there will be a need for additional water supply sources,
during dry periods the underground dewatering will be the only available source of water. A back-up
supply from the nearby Cauca river is recommended as a secondary supply source for time when
underground dewatering flows are unavailable, especially during milling ramp-up stage.
18.4 Tailings Management Facilities
The following sections summarize reasonably available information regarding existing tailings
generation and management and describe the conceptual design and operation of a new DSTF for
filtered (dewatered) tailings. The existing TSF is estimated to provide three to four years of additional
capacity, after which the new DSTF would need to accommodate tailings through the currently-
estimated 16-year LoM. Where appropriate, recommendations for additional investigation(s), or
expansion of existing baseline data collection programs, are provided.
On December 1, 2016, Mark Willow, a Qualified Person in accordance with Companion Policy 43-
101CP to NI 43-101, conducted a personal inspection of the Marmato site under Section 6.2 of the
Instrument. This inspection was intended to familiarize Mr. Willow with the conditions at the mine site

SRK Consulting (U.S.), Inc. NI 43-101 Technical Report – Marmato Project Page 253
MMS/KD Marmato_PEA_NI43-101_544400.020_Rev31_KD.docx November 2019
and any potentially available material information that could affect mine development/expansion in this
location. Information collected on site in 2016 was supplemented by GCM during 2019, as necessary.
Mark Willow shared his site knowledge with his SRK colleague Joshua Sames, who has directly
overseen the conceptual DSTF design described herein. In addition, SRK contracted with in-country
geotechnical consulting company Dynami to perform site reconnaissance and coordinate with site
personnel.
18.4.1 Existing Tailings Facilities
Currently, the processing plant sends tailings from the cyanide leach circuit to unlined settling ponds.
The underdrain water from these ponds is directed to small collection basins downgradient of the
tailings disposal piles. Flocculant is added to this water on an as-needed basis to remove residual
suspended solids. The solids from this process are pumped back to the tailings settling ponds, while
clarified overflow water is pumped back to the plant for use in the process. Excess water not needed
at the plant is discharged under permit to the adjacent stream, Quebrada (Qda.) Cascabel. Once
sufficiently dewatered to allow mechanical handling, the tailings are excavated from the ponds and
transported via truck to the existing DSTF.
18.4.2 Tailings Storage Facility Siting Study
A number of potential tailings storage sites were evaluated during the PEA. During the site selection
process, potential sites for both conventual slurry TSFs and DSTFs were evaluated.
The facilities were evaluated from technical, environmental, social, and cost perspectives. Other
criteria that influenced the site selection were: topography; extent of heavy vegetation; proximity of
communities; existing land use in and around the footprint; existing creeks, springs and streams; and,
distances between the proposed process plant location and the prospective tailings storage facilities.
The conventional slurry tailings storage facilities typically required very large embankments and
footprints/impacted areas and generally could not provide the required storage volume. Due to the
steep terrain within the available land holding and the anticipated high capital and operating costs
associated with a traditional slurry TSF, SRK concluded that a DSTF would be a more favorable tailings
management method for the Marmato site. Recent advances in tailings filtration technology and
performance favors tailings filtration and dry stacking for this project. Maximizing recycling and reuse
of process water and thereby minimizing makeup water requirements is considered an additional
benefit of the DSTF methodology.
To achieve the required storage for the LoM, two preferred locations were identified as the most
feasible locations for DSTF construction for consideration in the PEA. GCM is currently evaluating
additional siting options that may be evaluated as part of completion of a PFS.
18.4.3 Dry Stack Tailings Storage Facility
The preferred DSTF locations are shown in Figure 18-8 below. DSTF-1 would be constructed first and
receive dewatered tailings from both the upper and the MDZ for the first one to two years after
commissioning of the facility. After the filter plant is commissioned, tailings generated from mining in
the MDZ would be filtered, trucked and stacked at DSTF-1 until it reaches capacity at approximately
year 7, at which point filtered tailings would be hauled to DSTF-2, adjacent to the plant location.

SRK Consulting (U.S.), Inc. NI 43-101 Technical Report – Marmato Project Page 254
MMS/KD Marmato_PEA_NI43-101_544400.020_Rev31_KD.docx November 2019
Construction of DSTF-2 would commence one year prior to reaching capacity in DSTF-1 so no loss in
production would be observed.
Source: SRK, 2019
Figure 18-8: Preferred DSTF Locations
18.4.4 Design Criteria
Conceptual designs for both DSTF-1 and DSTF-2 are based on an assumed 16-year LoM with a total
mined tonnage of 26 Mt, and a maximum annual mining rate of 2 Mtpy for 16 years. Of the tailings
produced, approximately 11.7 Mt (approximately 45% of total future mill throughput) would be mixed
with cement and sent back to underground workings as paste backfill. The remaining 14.3 Mt (55% of
total mill throughput) of tailings would be dewatered using filter presses to a target moisture content of
about 15%, then trucked to the DSTFs, mixed with about 0.5% to 1% cement by weight, and placed
and compacted in controlled lifts to a specified minimum compacted density. The dry density of the
placed tailings was assumed to be 1.8 t/m3 for volumetric calculations. Key DSTF design criteria are
summarized in Table 18-1 below.
For the purposes of the PEA, the DSTF outer slope was designed at a 2H:1V (horizontal:vertical)
slope. Cement addition is assumed to be required at this stage to achieve global stability of the tailings

SRK Consulting (U.S.), Inc. NI 43-101 Technical Report – Marmato Project Page 255
MMS/KD Marmato_PEA_NI43-101_544400.020_Rev31_KD.docx November 2019
mass. The actual required amount of cement addition should be determined through laboratory testing,
overall slope angles may be revised for global stability in the next stage of the Project.
Due to the tailings being filtered and placed and compacted with cement amendment, it is not
anticipated that an appreciable amount of draindown from the tailings would contribute flows to the
underdrain. The DSTFs are therefore assumed to be unlined, but would have an underdrain system
for interception of any potential upwelling groundwater or flows from springs or seeps.
The rock starter embankments were designed with 2H:1V upstream and downstream slopes and
would be constructed from mined NAG waste rock from underground workings or a nearby approved
borrow source.
Table 18-1: DSTF Design Criteria
Criteria Units Description
General
Total Annual Mined Tonnes tpy 2,000,000
Total Mineralization Mined t 26,000,000
Life of Mine yr 13
Paste Backfill - percent of total tailings generated % 45
Required Capacity t 14,300,000
m3 7,840,000
100-year 24-hour Storm Event mm 143
Filtered Tailings
Placed Dry Density t/ m3 1.8
Moisture Content w/w 15%
Tailings Acid Generation Potential PAG/NAG NAG
Tailings Transport and Stacking System
Tailings Transport System from Filter to DSTF Truck
Tailings Spreading within DSTF - Dozer
Tailings Cement Amendment - Tractor with Discs
Compaction of Tailings - Dozer and Vibrating Smooth Drum Roller
Overall Slope Angle XH:1V 2:1
Rock Starter Embankment
Rock Source Waste Rock or Local Borrow
Downstream/Upstream Slopes XH:1V 2:1
Source: SRK, 2019
18.4.5 Rock Starter Embankments
It was assumed that there would be sufficient and suitable Net Acid Generation (NAG) waste rock
available to construct the rock starter embankments at the initial stages of the Project to ensure tailings
stability and containment. The rock embankments would be constructed between ridges that form the
primary valleys within which the DSTFs would be located. These ridges should consist of bedrock and
constitute solid foundations for embankments foundation, and unsuitable soils should be removed from
the embankment footprints. A geotechnical site investigation is recommended for completion during
the next stage of study to confirm suitable foundation conditions.
The rock embankment fill areas would require foundation preparation prior to placement of the waste
rock fill materials, to include clearing and grubbing and removal and stockpiling of salvaged topsoil
materials for later use in reclamation.

SRK Consulting (U.S.), Inc. NI 43-101 Technical Report – Marmato Project Page 256
MMS/KD Marmato_PEA_NI43-101_544400.020_Rev31_KD.docx November 2019
Drainage systems would be provided in the foundation of the DSTF and continue under the rock starter
embankment foundation. An allowance for the drainage systems is included in the cost estimate and
consists of a longitudinal underdrain system with a number of connecting transverse drains under each
DSTF footprint.
18.4.6 Tailings Stacking
Trucks would transport the filtered tailings from the filter plant to the DSTFs via dedicated haul roads,
as shown in Figure 18-9. The dewatered tailings would be end dumped, spread in approximately 30-
cm-thick loose lifts with a dozer, mixed with cement with discs, and compacted using a vibrating
smooth drum roller or sheepsfoot compactor, as appropriate. It is currently anticipated that the cement
amendment would be required to achieve global slope stability with 2H:1V slopes. Global slope stability
should be evaluated following completion of the geotechnical site investigation and tailings materials
characterization programs.
18.4.7 Underdrain and Surface Water Management
Seeps, springs or upwelling groundwater from within the DSTF footprint would be controlled by the
installation of an underdrain system consisting of central header pipes and connecting transverse
drains. Any seepage that is intercepted by the underdrain would be considered non-contact water and
routed to a sediment pond below each DSTF’s rock starter embankment and then released to the
natural drainage downstream.
For the purposes of PEA cost estimation, the underdrain was considered to consist of a network of 1m
diameter perforated and solid wall pipes surrounded by gravel drain and wrapped in a geotextile.
The upper operational deck surface would be graded so that contact runoff reports to a lined
operational pond to facilitate pumping back to the plant site process water pond for reuse.
Concrete-lined diversion channels would be constructed around the DSTFs before any dewatered
tailings are placed within the facility. These channels would direct non-contact stormwater runoff
around the DSTFs and back into natural drainages downstream. As part of the current conceptual
design, two set of channels would be constructed. The first at around the mid-height of the DSTF’s
planned valley fill to capture stormwater for the first half of the design life of the facility. The second
would be the ultimate closure channels that would capture surface runoff for the second half of the
DSSTF design life and serve as the final closure channel. Table 18-2 summarizes the currently-
assumed size of the trapezoidal channels used in preparing the PEA cost estimate.
DSTF reclamation activities would be carried out concurrently during active operations per Section
18.4.9 and therefore do not require management of contact water.
Table 18-2: Stormwater Diversion Channel Summary for 100-yr 24-hr Storm
Location Length (m) Bottom Width (m) Depth (m) Sideslope (m)
DSTF-1
Mid-Bench SW Diversion Channel 1,600 1 1 1H:1V
FNL SW Diversion Channel 1,700 1 1 1H:1V
DSTF-2
Mid-Bench SW Diversion Channel 1,400 1 2 1H:1V
FNL SW Diversion Channel 1,500 1 2 1H:1V
Source: SRK, 2019 Note: All channel are assumed to be concrete lined.

SRK Consulting (U.S.), Inc. NI 43-101 Technical Report – Marmato Project Page 257
MMS/KD Marmato_PEA_NI43-101_544400.020_Rev31_KD.docx November 2019
18.4.8 Access Road
The DSTFs would be accessed by dedicated haul roads (Figure 18-9) that include additional width to
support stormwater management and safety berms. For the purposes of PEA cost estimation, the
platform for both the road and drainage channels was assumed to be 20 m wide with a maximum
grade of 15%.
Source: SRK 2019
Figure 18-9: DSTF Haul Roads
18.4.9 Reclamation
Reclamation of the DSTFs would be being undertaken concurrent with DSTF construction. As
successive lifts of dewatered tailings are placed and compacted, the outer slope face would be covered
with topsoil, vegetated and armored with rock cladding. The final top surface of the DSTF would be
graded back to the natural slope and stormwater diversion channels at not less than 2%, covered with
topsoil and revegetated.
18.5 Off-Site Infrastructure and Logistics Requirements
The Project has no significant off-site infrastructure needs and this section is provided for reference
only.

SRK Consulting (U.S.), Inc. NI 43-101 Technical Report – Marmato Project Page 258
MMS/KD Marmato_PEA_NI43-101_544400.020_Rev31_KD.docx November 2019
18.5.1 Port
Marmato is 200 km west of the Pacific Ocean and 300 km south of the Caribbean Sea and Atlantic
Ocean. The nearest port is Buenaventura on the Pacific Ocean (320 km by the Pan American
Highway). The port will not be used for the Project other than as support for delivery of out of country
equipment.
18.5.2 Rail
There is an abandoned railway cutting along the east side of the Cauca River opposite Marmato, which
previously formed part of a railway network between the Pacific and Atlantic Oceans which ran
between Buenaventura and Puerto Berrio on the navigable Magdalena River. The middle section
between Medellín and La Felisa (Caldas, 10 km south of Marmato) was completed in 1942 and closed
in 1972. Ferrocarriles del Suroeste S. A. (Southwestern Railways) applied for a concession to rebuild
this 185 km line between La Felisa and Envigado, near Medellín, in November 2007, at a cost of
US$140 million. This would become integrated with the national railway network. Ferrocarriles del
Oeste S. A. (Western Railways) were awarded the contract to operate the 499 km Buenaventura to
La Felisa railway in November 2007. The concession is in two stages. In July 2009 the 388 km railway
between Buenaventura and Cartago and La Tebiada which has been rehabilitated was opened. In the
second stage the new concessionaire will take over operation of the 119 km section between Cartago
and La Felisa once this has been rebuilt by Tren de Occidente (Western Train). Currently the
concession contractor (Western Railway) is in liquidation, so another company would have to develop
the rail if needed for the Project. Currently there are no plans to use the rail.

SRK Consulting (U.S.), Inc. NI 43-101 Technical Report – Marmato Project Page 259
MMS/KD Marmato_PEA_NI43-101_544400.020_Rev31_KD.docx November 2019
19 Market Studies and Contracts
19.1 Commodity Price Projections
Gold and silver markets are mature, global markets with reputable smelters and refiners located
throughout the world. Demand is presently high with prices for gold showing an increase during the
past year. Markets for doré are readily available. Marmato possess a gold room for the production of
doré.
Assumed prices are based on the long-term outlook for gold and silver. This projection is below the
three-year trailing averages and current spot prices and are in-line with long term view of relevant
market analysts in the precious metal sector. Table 19-1 presents the prices used for the cash flow
modelling and resources estimation.
Table 19-1: Marmato Price Assumptions
Description Value Unit
Gold 1,300 US$/oz
Silver 17.00 US$/oz
Source: Gran Colombia Gold, 2019
19.2 Contracts and Status
Marmato currently has a long-term supply agreement for the sale of its products to an international
refinery who take delivery of dore from the mine at designated transfer points in Colombia. The refinery
is responsible for shipping the products abroad. The refining costs and discounts associated with the
sales of the products are based on this agreement. This study was prepared under the assumption
that the Project will sell doré containing gold and silver.
Treatment charges and net smelter return (NSR) terms are summarized in Table 19-2.
Table 19-2: Marmato Net Smelter Return Terms
Description Value Units
Doré
Payable Gold 100%
Doré Smelting & Refining Charges 6.38 US$/oz-Au
Source: Gran Colombia, 2019

SRK Consulting (U.S.), Inc. NI 43-101 Technical Report – Marmato Project Page 260
MMS/KD Marmato_PEA_NI43-101_544400.020_Rev31_KD.docx November 2019
20 Environmental Studies, Permitting and Social or Community Impact The following section discusses reasonably available information on environmental, permitting and
social or community factors related to the Marmato Project and the proposed expansion. Where
appropriate, recommendations for additional investigation(s), or expansion of existing baseline data
collection programs, are provided.
On December 1, 2016, Mark Willow, a Qualified Person in accordance with Companion Policy 43-
101CP to NI 43-101, conducted a personal inspection of the Marmato site under Section 6.2 of the
Instrument. This inspection was intended to familiarize Mr. Willow with the conditions on the properties,
and any potentially available material information that could affect mine development/expansion in this
location. Information collected on site in 2016 was supplemented by GCM during 2019, as necessary.
20.1 Environmental Studies and Management
The existing Marmato Project predates the regulatory requirements to prepare an environmental
impact assessment as part of the permitting process. Instead, the operations were authorized through
the approval of a PMA. The PMA for Marmato was approved by the regional environmental authority
(Corporación Autónoma Regional del Caldas or Corpocaldas) on October 29, 2001 under Resolution
0496, File No. 616. The site-specific PMA covers environmental studies and required management
procedures and practices associated with:
• Reclamation in the area of the production plant;
• Reclamation and closure of the tailings settling ponds;
• Management of unstable zones (including erosion control);
• Water management in the mines;
• Management of stormwater runoff;
• Management and protection of watersheds;
• Control planning and use of explosives;
• Reforestation and revegetation programs;
• Reclamation and closure planning;
• Management of tailings;
• Containment structures;
• Cyanide destruction (detoxification);
• Management of waste water (domestic);
• Water usage;
• Air resource management;
• Physical risk management measures (including toxic substances);
• Social management; and
• Biological Management (i.e., biodiversity).
In 2017, an audit of this PMA environmental management system was prepared from which most of
the following information was obtained.

SRK Consulting (U.S.), Inc. NI 43-101 Technical Report – Marmato Project Page 261
MMS/KD Marmato_PEA_NI43-101_544400.020_Rev31_KD.docx November 2019
20.1.1 Environmental Setting
The Marmato Project is located in the Municipality of Marmato, Department of Caldas, Republic of
Colombia, and is approximately 125 km due south of the city of Medellín, the capital of the Department
of Antioquia. The Town of Marmato was founded in 1540 and has a population of approximately 10,000
people. It is one of the historic gold-mining regions of the hemisphere. The Marmato Project has
excellent infrastructure, being located along the Pan American Highway with access to Medellín to the
north and Manizales (the capital of Caldas) to the south, and has access to the national electricity grid
which runs near the property.
The west-central Colombian Department of Caldas is situated in the Cordillera Central of the Andes
Mountains and is bounded by the Magdalena River on the east and the Cauca River on the west.
Marmato lies at an elevation of 1,050 masl, just west of Río Cauca, which joins the Magdalena River
near Magangué in Bolívar Department, before eventually flowing out into the Caribbean Sea.
The local topography is characterized by steep, incised valleys. The climate is tropical with an annual
average temperature of 21°C, that typically varies from 14°C to 24°C, and average annual rainfall of
approximately 2,162 mm/y, predominantly falling between April and November, with a negligible
difference of 153 mm of precipitation between the driest and wettest months. The drainage pattern
across Marmato is dendritic; the license area drains east into the Cauca River, which is heavily
influenced by artisanal mining operations. The vegetative cover across the landscape consists of
disturbed grassland (used mainly for mining and livestock rearing activities) interspersed with
fragmented forest patches, mainly along drainage lines within the incised valleys. Forest patches
provide important habitat for wildlife.
The operations are located within the town of Marmato, which has been a center for gold mining for
more than 500 years and the environmental and social setting is strongly influenced by this. Mining,
both formal and informal, is the main economic activity in Marmato and the neighboring towns of El
Llano and La Garrucha. Informal processing operations using basic technology has resulted in poor
health and safety conditions and widespread water contamination from discharge of tailings and waste
directly into the environment. This has led to a prevalence of mercury-related health problems in the
local populations. Health issues related to population influx are also common.
20.1.2 Water Quality and Monitoring
GCM has seven domestic wastewater discharges and three non-domestic wastewater discharges for
which monitoring is conducted. Table 20-1 lists each discharge point with its respective analytical
parameters to be measured. The results of the monitoring are provided to the regional environmental
authority (Corpocaldas).

SRK Consulting (U.S.), Inc. NI 43-101 Technical Report – Marmato Project Page 262
MMS/KD Marmato_PEA_NI43-101_544400.020_Rev31_KD.docx November 2019
Table 20-1: Water Discharges
ID Waste Water Discharge
Discharge Point
Parameters
1
Non-Domestic
Tailings dam Turbidity, pH, temperature, total solids, total suspended solids, DB05, DQ0, grease and oils, flow, conductivity, sedimentary solids (for treatment systems – bulk tails, if total cyanide and lead are taken into account).
2 Thickener
3 Sedimentation Ponds
4
Domestic
Camp 1
pH, temperature, total solids, total suspended solids, DB05, DQ0, grease and oils, flow, fecal coliform and total coliform.
5 Camp 2
6 Camp 3
7 Offices
8 Mines
9 Mine Dry
10 Contractor Lodging
Source: GCM S.A.S.
20.1.3 Air Quality and Monitoring
Air quality emissions from stationary sources at Marmato are regulated and monitored by the Air
Pollution Unit (Unidad de contaminación Atmosférica or UCA) according to Table 20-2.
Table 20-2: Stationary Emission Sources
Unit Parameter UCA Degree of Significance
Monitoring Frequency
Next Measurement
Date Observations
Metallurgical Laboratory
Particulate matter (PM)
0.01 Very low 3 years 03/07/2017
Sulphur dioxide (SO2)
0.00 Very low 3 years 03/07/2017
Nitrogen oxides (NOX)
0.04 Very low 3 years 18/02/2019
NOX measurement took place on 18/02/2016
Lead (Pb) 0.014 Very low 3 years 03/07/2017
Smelter / Foundry
Particulate matter (PM)
0.05 Very low 3 years 04/08/2017
Sulphur dioxide (SO2)
0.37 Low 2 years 04/08/2016 Measurement took place in 29/11/2016
Nitrogen oxides (NOX)
0.21 Very low 3 years 04/08/2017
Lead (Pb) 0.47 Low 2 years 04/08/2016 Measurement took place on 29/11/2016
Source: GCM S.A.S.
20.1.4 Environmental Procedures and Permissions
Environmental protection measures and procedures followed by GCM at the Marmato operations
include those shown in Table 20-3.

SRK Consulting (U.S.), Inc. NI 43-101 Technical Report – Marmato Project Page 263
MMS/KD Marmato_PEA_NI43-101_544400.020_Rev31_KD.docx November 2019
Table 20-3: Environmental Procedures
ID Resource Environmental Procedure
Location Approval
Current State of Process Competent Authority New Valid
Valid for (years)
Renewal or Modification
Filing Date
1 Air Atmospheric emission permit
Smelter
Resolution 270 of April 27, 2009
5 × February 21, 2014
Corpocaldas Laboratory furnace
Shedding filter bag
2 Water
Surface water concession
La Maruja portal
× 5
Corpocaldas
Aguas Claras
Resolution 0046 of March 09, 2004, amended by Resolution 127 of May 5, 2004
× February 07, 2014
Zaparillo
Guineo
Domestic water discharge permit
Camp 1
Resolution 270 of April 27, 2009 amended by resolution 254 of February 28, 2014
× February 21, 2014
Camp 2
Camp 3
Office
Mine
Contractor
Mine dry
Non-domestic water discharge permit (industrial)
Tailings
Thickener
Sediment ponds
Channel Occupation Charco Hondo
Resolution 0062 of February 15, 2006
Corpocaldas
Source: GCM, S.A.S.

SRK Consulting (U.S.), Inc. NI 43-101 Technical Report – Marmato Project Page 264
MMS/KD Marmato_PEA_NI43-101_544400.020_Rev31_KD.docx November 2019
20.1.5 Environmental Management
Environmental management programs for the current Marmato operations and associated costs, are
provided in Table 20-4.
Table 20-4: Environmental Management Budget
Item Description Annual Cost (Peso) Annual Cost (USD)
1 Tailings Management $26,909,709 $7,848
2 Forest Nursery Management $5,894,500 $1,719
3 Order and Cleanliness (Housekeeping) $12,237,000 $3,568
4 Potable Water Plant Operation $10,541,644 $3,074
5 Septic Tank Maintenance $37,951,500 $11,068
6 Environmental Monitoring Samples $33,506,200 $9,771
7 Environmental Education Program $33,506,200 $9,771
8 Reclamation of Dumps/Ponds 1 & 2 $16,124,000 $4,702
9 Reforestation $2,920,000 $851
10 Unstable areas $8,120,000 $2,368
11 Bulk Tailings Effluent Treatment $538,991,160 $157,193
12 Tailings Effluent Cyanide Treatment $94,981,814 $27,700
13 Water pumping and recirculation $190,228,000 $55,478
14 Tailings Dam Operation $251,780,000 $73,430
15 Labor $187,646,400 $54,726
16 Administration and Payment of Services $6,600,000 $1,924
ENVIRONMENTAL MANAGEMENT BUDGET* $1,457,938,128 $425,199
Based on exchange rate of 3,455 to 1 Source: GCM S.A.S., 2017
20.1.6 Geochemistry
The objective of this part of the program is to identify, at a preliminary level, aspects of environmental
geochemistry that might produce impacts that could negatively affect the project economics. At the
PEA stage of a project, and for a deposit of this type (i.e., precious or base metal), the evaluation
typically includes the following:
• Acid rock drainage and metal leaching (ARDML) potential of tailings;
• Chemical composition of tailings supernatant and the potential for seepage to the
environment. The assessment of tailings impacts is often preliminary because processing
methods and TSF construction plans might be modified as the Project advances;
• Acid rock drainage and metal leaching potential of waste rock;
• Chemical composition of inflowing underground mine water and the need for management of
the inflow based on the chemistry; and
• Background groundwater and surface water quality, and an assessment of potential impacts
to ambient groundwater and surface water quality due to mining activities; additionally, how
the ambient groundwater and surface water might affect mining operations.
At this stage of a project, SRK relies on existing data and information for the environmental
geochemistry evaluation rather than collect new data. The primary sources of information for this
assessment were the Updated Mineral Resource Estimate (SRK, 2017), the Hatch report (2012), and
the Mineral Processing and Metallurgical Testing section of this report. SRK was not provided copies
of the mining waste characterization reports, so we are unable to comment on that aspect of the
program.

SRK Consulting (U.S.), Inc. NI 43-101 Technical Report – Marmato Project Page 265
MMS/KD Marmato_PEA_NI43-101_544400.020_Rev31_KD.docx November 2019
Findings
Characteristics of the Marmato deposit that are significant with respect to environmental geochemistry
include the following:
• Acid-generating sulfide minerals identified in the deposit include pyrite, arsenopyrite, iron-
bearing sphalerite, pyrrhotite, and chalcopyrite (SRK, 2017). Sulfide concentrations are locally
elevated, as demonstrated by the Terra Mineralogical Services study (2019) conducted for the
SRK metallurgical program, which reported a pyrite concentration of 23.1% in mineralization,
along with lesser concentrations of sphalerite, pyrrhotite, chalcopyrite, and arsenopyrite.
• Samples of groundwater discharging in the underground, collected by Colombia Goldfields
Ltd for the baseline study, indicated that 13 of the 14 samples reported acidic pH. Four
samples reported pH less than 3, and another eight reported pH between 3 and 4.
• The underground water samples carried elevated metal(loid)s, many of which exceed World
Bank target guideline levels for mining discharges, including: Arsenic (2.64 mg/L against target
level of 1.0 mg/L), cadmium (2.12 mg/L against target level of 0.1 mg/L), copper (2.64 mg/L
against target level of 0.3 mg/L), iron (332 mg/L against target level of 2.0 mg/L), lead (7.06
mg/L against target level of 0.6 mg/L), mercury (4.88 μg/L against target level of 2.0 μg/L),
and zinc (663 mg/L against target level of 1.0 mg/L).
• Geochemical properties of current and future waste rock are unknown, as no test data have
been provided. Knight Piésold reportedly started a geochemistry characterization program of
waste rock and tailings, but the status of the program is unknown. Based on the characteristics
of recently tested mineralization, it is reasonable to assume that future waste rock will contain
mineralogical characteristics capable of generating ARDML.
• Field leach test cells were reportedly started but the type of rocks that were tested and the
status of the tests are unknown.
• Waste rock has been used to backfill underground or placed in unused headings. The program
is expected to continue. Non-acid generating waste rock has reportedly been used on the
surface for construction purposes.
• The tailings backfill is expected to continue, with approximately an estimated 50% of tailings
to be assigned to backfill.
• There is conflicting information in the Hatch report regarding the geochemical leaching
properties of the hydraulic backfilled tailings. Water samples collected underground, and
believed to be sourced from backfilled material, produced neutral pH. However, onsite
humidity cell tests conducted by Knight Piésold (2012), reportedly indicated that tailings from
the Mineros Nacionales mine generated acidic pH.
• Potential environmental liabilities reported by SRK (2017) include:
o Historical dumping of waste rock down mountain slopes and dumping of tailings into
watersheds represents a potential liability;
o Contamination of water by cyanide, acid drainage, heavy metals and solids;
o Contamination of water by untreated sewage from the Marmato and El Llano towns and
by agricultural chemicals and waste from cultivation of coffee, bananas etc.; and
o Potential contamination from the Mineros Nacionales operation which has:
- Unprotected waste rock dumps; and
- A reportedly unlined tailings facility that discharges overflow directly into Cascabel
creek and subsequently the Cauca River.

SRK Consulting (U.S.), Inc. NI 43-101 Technical Report – Marmato Project Page 266
MMS/KD Marmato_PEA_NI43-101_544400.020_Rev31_KD.docx November 2019
Risks and Uncertainties
SRK’s review identified the following risks and uncertainties related to environmental geochemistry of
the future mine.
• The abundance of sulfide minerals in the deposit combined with an apparent scarcity of acid-
neutralizing minerals (e.g., carbonate minerals such as calcite, dolomite) indicates a
potentially elevated threat of ARDML, both on a regional and local scale depending on the
concentration and distribution of acid-generating versus acid neutralizing minerals. The data
and reports provided to SRK contain insufficient information to make this determination, and
SRK recommends further investigation in the next phase of work.
• Based on metallurgical testwork completed for this report, all mineralization except for
recovered gold and silver will report to tailings, including acid-generating sulfide minerals. If
the reported pyrite concentration of 23.1% in Marmato material is representative of tailings in
general, then the ARDML potential of future tailings could be considerable.
• The acidic and metalliferous characteristic of groundwater discharging in the underground
workings may be evidence of a significant mass of reactive acid-generating sulfide minerals
with elevated trace metal content in both mineralized material and sub-mineralized grade rock.
Additional data collection is recommended in the next phase of work to determine the ARDML
properties of waste rock that could potentially be brought to surface for disposal.
• The ARDML characteristics and leaching potential of historical tailings, waste rock, and
artisanal tailings in the area is an unknown that could pose an environmental risk. Detailed
characterization is recommended in the next phase of work.
• As reported in SRK (2017), the Marmato Project holds the potential for significant adverse
environmental and social impacts which are diverse. Extensive assessment of the physical,
biophysical and socioeconomic features of the area are required and careful planning of
project infrastructure should occur.
20.2 Mine Waste Management
20.2.1 Waste Rock Management
Very little waste rock is generated by the underground operations at Marmato. What little waste rock
is generated is used as structural backfill in the underground workings or on the surface for small
construction projects, such as maintenance of roads. SRK is unaware of any geochemical or
geotechnical testing of the waste rock for use as construction material, so the potential impact
associated with ARDML cannot be assessed at this time. However, since so little, if any waste rock is
brought to the surface, a comprehensive geochemical characterization program is probably not
warranted on this surface located material, and only opportunistic sampling and testing of construction
materials is probably necessary. At the moment, Corpocaldas does not require the testing of mine
waste materials; only effluent discharges. This is likely to change in the future, as source control
becomes more of the norm in this jurisdiction.
20.2.2 Tailings Management
The Marmato gold processing plant is fed with mill feed which is milled and processed through a
cyanide (CN) leach circuit using underground dewatering water and make-up water from the surface.
Currently, approximately 70% of the tailings from the operations is returned to the underground

SRK Consulting (U.S.), Inc. NI 43-101 Technical Report – Marmato Project Page 267
MMS/KD Marmato_PEA_NI43-101_544400.020_Rev31_KD.docx November 2019
workings as structural backfill. The remaining approximately 30% (including fines) are slated for
surface disposal.
The CN leach circuit includes a hydrogen peroxide (H2O2) and copper sulfate (CuSO4) destruction unit
on the tail end to reduce CN concentrations to below the Colombian mine effluent discharge limit of
1.0 mg/L (Article 10 of Resolution 0631, dated March 17, 2015) before sending the residual tailings to
the unlined settling ponds (“Cascabel 1” and “Cascabel 2”). The underdrain water from these ponds is
directed to small collection basins downgradient of the tailings surface disposal piles. Flocculant is
added to this water on an as-needed basis to remove residual suspended solids; the underflow (solids)
from this process is directed back to the tailings settling ponds, while the clarified overflow water is
pumped back to the plant for use in the process. Excess water, not needed at the plant, is discharged
under permit to the adjacent stream, Quebrada (Qda.) Cascabel.
Once sufficiently dewatered to allow mechanical handling, the tailings are excavated from the ponds
and transported via truck to the final disposal location. Monitoring of the residual tailings to determine
whether or not they are classifiable as ‘hazardous’ is accomplished through Corrosive, Reactive,
Explosive, Toxic, Inflammable, Pathogen [biological] (CRETIP) analyses. Toxicity analyses were
carried out by the Universidad Pontificia Bolivariana on cyanides and metals (chromium, mercury and
lead). The results support the classification of the tailings as non-toxic for the metals based on
comparisons to the maximum concentration thresholds established by Decree 4741 of 2005. The
analyses also showed that Total CN was below the threshold allowed in Decree 1594 of 1984 for water
discharges. SRK did not perform a comprehensive audit of all testing data; however, given the vintage
of these results, SRK suggests that more frequent sampling and analysis be conducted by the
operation going forward, and especially for the expansion project.
Limited data and information are available pertaining to the geochemistry of tailings. However, general
conclusions can be drawn based on the geochemistry of the orebody and the process methodology.
Until detailed data are collected on the acid generating potential of the tailings (as recommended by
SRK), the conservative assumption will be to assume acid generating tailings with appropriate
management.
For the deep zone expansion of the Marmato Project, GCM intends to continue with a similar approach
to tailings and tailings water management. However, rather than using less efficient settling ponds, the
tailings will be filter pressed. The “dry stack” tailings will be transported to the new disposal facility,
mixed with cement, and stacked in a configuration that minimizes surface runoff. To the extent
practicable, contact water collected on the deck of the DSTF will be reused in the process; excess
water will be discharged under permit.
A critical driver of environmental impacts from tailings is whether contact water will be contained. The
current and predicted future quality of contact water needs to be determined. Two components of
potential chemical loading need to be estimated: 1) loading to surface water due to tailings runoff, and
loading to groundwater through seepage from the base of the tailings facilities.
Future metallurgical testing should include environmental geochemistry, to provide data that will assist
in forecasting tailings solids and potential runoff chemistry. Water re-use/recycling is recommended to
the extent feasible. A zero-discharge policy should be adopted so that water recycling is maximized,
and water treatment and discharge is minimized.

SRK Consulting (U.S.), Inc. NI 43-101 Technical Report – Marmato Project Page 268
MMS/KD Marmato_PEA_NI43-101_544400.020_Rev31_KD.docx November 2019
20.2.3 Site Monitoring
Various mitigation and monitoring programs are discussed in the approved PMA (per Section 20.1).
20.2.4 General Water Management
Operational water for the Marmato operation is provided through a combination of underground mine
dewatering water, and several surface freshwater sources. Even with the high precipitation
experienced by the site, only nominal effort appears to be directed toward stormwater management
and the prevention of contact with mine equipment and facilities. Some concrete channels and energy
dissipation structures for the management of run-off are already constructed, and some others are
being considered.
Surface water runoff is likely to represent a significant water management challenge to the Project
considering the difficulties in distinguishing between the impacts from the artisanal mining activities
and those of the Project.
Insufficient work has been undertaken on groundwater hydrogeology and surface water to establish
the true level of risk associated with potential groundwater contamination. A detailed evaluation,
including a groundwater model, would provide information that would assist in forecasts of post-closure
mine water discharge and possible treatment criteria.
The geochemical and hydrogeological/hydrological impacts should be evaluated at closure when
dewatering ceases and water levels rebound. Of critical importance is the possibility of mine water
discharging to surface water or groundwater and potentially impacting users. There are reports that
dewatering effluent carries elevated concentrations of metals. The water quality of dewatering effluent
must be well characterized in the event that treatment is needed before it is used or discharged. A
forecast of closure water quality is needed.
20.2.5 Off-Site Impacts
All mining wastes releasing uncontained runoff could be contributing to offsite impacts, and mitigation
measures should be implemented.
Informal processing operations in this location, using basic technology, has resulted in poor health and
safety conditions and widespread water contamination from discharge of tailings and waste directly
into the environment. This has led to a prevalence of mercury-related health problems in the local
populations.
The largest uncertainty regarding closure costs is associated with the potential need for long-term
treatment of water from the post-closure mine workings.
A comprehensive baseline surface and groundwater sampling program will be important to establish
the baseline condition and try to quantify the contributions from artisanal or pre-mining conditions,
especially with respect to mercury from artisanal mining.
20.3 Project Permitting
20.3.1 General Mining Authority
Since 1940, the Ministry of Mines and Energy (MME), formerly the Mines and Petroleum Ministry, has
been the main mining authority with the legal capacity to regulate mining activities in accordance with

SRK Consulting (U.S.), Inc. NI 43-101 Technical Report – Marmato Project Page 269
MMS/KD Marmato_PEA_NI43-101_544400.020_Rev31_KD.docx November 2019
the laws issued by the Colombian Congress. The MME can delegate its mining related powers to other
national and departmental authorities. Mining regulations in Colombia follow the principle that (except
for limited exceptions) all mineral deposits are the property of the state and, therefore, may only be
exploited with the permission of the relevant mining authority, which may include the MME, the
National Agency for Mining or the regional governments designated by law.
In 2001, the Congress issued Law 685 (the Mining Code). This law established that the rights to
explore and exploit mining reserves would only be granted through a single mining concession
agreement (the 2001 Concession Agreement). This new form of contracting did not affect the pre-
existing mining titles (licenses, aportes and concessions) which continue to be in force until their terms
lapse. The 2001 Concession Agreement includes the exploration, construction, exploitation and mine
closure phases and are granted for periods of up to 30 years. This term may be extended upon request
by the title holder for an additional 30-year term. According to the Mining Code, the initial term was
divided into three different phases:
• Exploration – During the first three years of the concession agreement, the title holder will
have to perform the technical exploration of the concession area. This term may be extended
for two additional years upon request;
• Construction – Once the exploration term lapses, the title holder may begin the construction
of the necessary infrastructure to perform exploitation and related activities. This phase has
an initial three-year term which may be extended for one additional year; and
• Exploitation – During the remainder of the initial term minus the two previous phases, the title
holder will be entitled to perform exploitation activities.
20.3.2 Environmental Authority
In 1993, Law 99 created the Environmental Ministry and then in 2011 the Decree 3570 modified its
objectives and structure and changed the name to Environment and Sustainable Development
Ministry. The Ministry is responsible for the management of the environment and renewable natural
resources, and regulates the environmental order of the territory. Also, the Ministry defines policies
and regulations related to rehabilitation, conservation, protection, order, management, use,
sustainable use of natural resources. Article 33 of the same Law created the regional environmental
authorities (including Corpocaldas) with the responsibility to manage the environment and renewable
natural resources.
In 2011, Decree 3533 created the National Authority of Environmental Licenses (Autoridad Nacional
de Licencias Ambientales, ANLA). ANLA is responsible that all project, works or activities subject to
licensing, permit or environmental procedures comply with the environmental regulations and
contribute to the sustainable development of the Country. ANLA will approve or reject licenses, permits
or environmental procedures according to the law and regulations, and will enforce compliance with
the licenses, permits and environmental procedures.
With regard to the licensing process of mining projects, the competence of either ANLA or Corpocaldas
is determined by the annual volume of material to be exploited. For projects exploiting more than 2
Mtpy the responsibility will be with ANLA. Both ANLA and Corpocaldas can enforce project compliance
with the terms of their licenses or permits. Up to now, based on the annual production and transport
of materials at Marmato, the environmental authority that controls operations is Corpocaldas.

SRK Consulting (U.S.), Inc. NI 43-101 Technical Report – Marmato Project Page 270
MMS/KD Marmato_PEA_NI43-101_544400.020_Rev31_KD.docx November 2019
20.3.3 Environmental Regulations and Impact Assessment
Colombian laws have distinguished between the environmental requirements for exploration activities,
and those that have to be fulfilled for construction and exploitation works. During the exploration phase,
the concession holder is not required to obtain an environmental license. However, the concession
holder requires environmental permits which will be obtained from the regional environmental
authority. The concession holder will have to comply with the mining and environmental guidelines
issued by the MME and the Environmental Ministry.
In order to begin and perform construction and exploitation operations, the concession holder must
obtain an environmental license or the approval of an existing Environmental Management Plan (EMP)
either from ANLA if the Project exploits more than 2 Mtpy or from the regional environmental authority
(Corpocaldas) if the mineral exploitation is less than 2 Mtpy.
The approval process begins with the request for Terms of Reference (ToR) to prepare an
Environmental Impact Statement (EIS) or update an existing PMA. The approval of the EIS and PMA
by the jurisdictional environmental authority includes all environmental permits, authorizations and
concessions for the use, exploitation or affectation, or all of the above, of natural resources necessary
for the development and operation of the Project, work or activity. Additionally, other permits and
requirements (non-environmental) are required in order to begin construction and operation of the
Project.
Non-Governmental Organizations (NGOs) and the local communities have the opportunity to
participate in the environmental administrative procedures leading up to the issuance of an
environmental license. The environmental process will include participation of, and information to, all
communities in the project area including indigenous communities and Afro-descendant communities.
20.3.4 Water Quality and Water Rights
The Colombian regulations that principally govern water quality, including discharge permitting and
requirements, are Decree 2811 of 1974, Decree 1541 of 1978, Decree 1594 of 1984, Decree 3930 of
2010 and Resolution 631 of 2015, that establish the maximum permissible limits for discharges to
surface water.
Currently, the Decree 1594 of 1984 is under review, which will modify the maximum concentrations,
allowed in industrial effluents. Resolution 631 of 2015 (new parameters and maximum limits on point
discharges) is being used as a guideline for this project. The regional environmental authority
(Corpocaldas) enforces compliance with these regulations.
Water rights for mining activities are granted by means of a water concession which is granted by
Corpocaldas and which is independent to the mining concession or to land ownership. The water rights
related to mining activities are included in the environmental licenses or in the approved PMA and are
normally granted for five years. The terms and conditions under which a water concession is granted
may depend, amongst others, on the amount of water available in the specific region, the possible
environmental impact of the concession, water demand, the ecological flow and the different users
that the water source services. The water concession is accompanied with a discharge permit.
Water concessions held by GCM for the Marmato Project include:

SRK Consulting (U.S.), Inc. NI 43-101 Technical Report – Marmato Project Page 271
MMS/KD Marmato_PEA_NI43-101_544400.020_Rev31_KD.docx November 2019
Table 20-5: Surface Water Concessions
Location Approval Term
(Years) Renewal of
Modification Filing Date
Competent Authority
Bocamina La Maruja
Resolution 345 of March 17, 2014
5 ×
January 29, 2019 (In process)
Corpocaldas Aguas Claras Resolution 0046 of March 9,
2004 (Amended by Resolution 127 of May 5, 2004)
10 ×
February 7, 2014 (In process)
Zaparillo
Guineo
Source: GCM S.A.S.’
20.3.5 Air Quality
Decree 948 of 1995, Resolution 650 of 2010 and Resolution 2154 of 2010 provide the main regulations
on protection and control of air quality. These regulations set forth the general principles and
regulations for the atmospheric protection, prevention mechanisms, control and attention of pollution
episodes from fixed, mobile or diffused sources. These regulations also provide emission levels or
standards. Among the emission sources regulated are: controlled open burnings, discharge of fumes,
gases, vapors, dust or particles through stacks or chimneys; fugitive emissions or dispersion of
contaminants by open pit mining exploitation activities; solid, liquid and gas waste incineration;
operation of boilers or incinerators by commercial or industrial establishments, etc.
Also, Resolution 627 of 2006 regulates noise emissions in terms of ambient noise. The parameters
regulated are: SO2, NO2, CO, TSP, PM10, O3, and noise. Corpocaldas enforces compliance with these
regulations at Marmato.
20.3.6 Fauna and Flora Protection
The main regulations for the protection of fauna and flora are contained in the Natural Resources Code
and the Agreement about Biological Diversity entered into in Rio de Janeiro on June 5, 1992, within
the framework of the Rio Convention. Also, forest management and use is regulated by Decree 1791
of 1996 and the compensation for biodiversity loss is regulated by Resolution 15717 of 2012. In
addition, there are other important regulations on the matter such as the Cartagena Protocol on
Biotechnology Security of the Agreement about Biological Diversity entered into in Montreal on
January 29, 2000, and the Convention on International Trade of Threatened Wild Fauna and Flora
Species (CITES). Endangered species are protected by environmental and criminal law.
In order to perform biodiversity studies, a permit for scientific investigation must first be obtained from
Corpocaldas.
20.3.7 Protection of Riparian Areas and Drainages
Resolution No. 077 of March 2, 2011, regarding riparian and water channel protection, strictly prohibits
the filling of perennial water courses except under very specific terms: road and pipeline crossings,
bank and slope protection measures, and installation of public service networks (Title III, Article 9).
The backfilling of intermitted or ephemeral channels can be authorized under permit by Corporcaldas,
provided that the design is appropriate for the conditions, and that surface water and groundwater are
properly managed. Application of this prohibition directly influenced the siting of the future tailings
disposal areas, in that it(they) cannot be located in perennial drainages.

SRK Consulting (U.S.), Inc. NI 43-101 Technical Report – Marmato Project Page 272
MMS/KD Marmato_PEA_NI43-101_544400.020_Rev31_KD.docx November 2019
20.3.8 Protection of Cultural Heritage or Archaeology
Cultural and natural heritage protection in Colombia is stated in the political constitution and developed
through several international treaties and laws of the state. There are strict legal provisions, such as
Law 397 of 1997 and Decree 763 of 2009, whereby the heritage is safeguarded and protected. For
example, if a citizen finds an archeological specimen, he or she must inform the Ministry of Culture of
the discovery within 24 hours; otherwise he or she could be sanctioned by the competent authority.
20.3.9 Marmato Permitting
The Marmato Project is authorized under a number of resolutions issued by the regional environmental
authority (Corpocaldas) in the name of GCM’s predecessor, Mineros Nacionales S.A.S. These are
identified in the Environmental Studies and Management section (above), and include, among others:
• Environmental Management Plan or PMA (Resolution No. 0496);
• Various water concessions; and
• Discharge permits (Resolutions 270 and 255).
According to GCM, all of the resolutions for operation of the existing Marmato Project are current and
valid, or in the process of being renewed. Most will need to be amended as part of the authorization
of the MDZ expansion of the Marmato Project to include the increases tonnage to be mined, new
process facilities, and tailings management area.
The current PMA authorizes the mining and processing of up to 1,500 tpd of ore. The current
processing plant has capacity of 1,200 tpd. The PMA will need to be modified to allow for the proposed
MDZ expansion project, which envisions a rate of an extra 4,000 tpd in a second processing plant to
be constructed. By regulation, the total of mined material (including waste and material) cannot exceed
2Mtpy in order for Corpocaldas (regional Environmental Authority) to remain as the permitting
authority. If more than 2Mtpy is mined, then the PMA will need to be submitted to and authorized by
the federal authority, ANLA (Environmental License National Authority). During construction, Channel
Occupancy Permits will most likely need to be obtained for the new tailings site, the tailings pipeline
corridor, the process plant site, and the site of the underground portal (bocamina). Likewise, a Forest
Exploitation Permit may be needed for areas of proposed surface disturbance with trees (DBH> 10
cm).
These new facilities and operation will be subject to the environmental licensing process described
above, which will require the submittal of comprehensive design reports, hydraulic and hydrogeological
investigation reports, geotechnical reports on stability, and an environmental impact assessment will
need to be prepared. This will require that adequate baseline data be collected from which the
significance of potential impacts can be assessed.
Operationally, the existing discharge, emissions (if applicable), and water concession permits may
also require modification to suit the new mining conditions. GCM estimates that a minimum of six to
12 months will be required for review of the complete application and issuance of the Environmental
License by Corpocaldas for the MDZ expansion of the Marmato Project.
Additional baseline data collection will need to be completed on the new areas proposed for the plant
site, portal, ancillary facilities, and tailings disposal area(s). GCM is currently in the process of bidding
out the baseline programs, and also the modifications to the PMA to an environmental consultant

SRK Consulting (U.S.), Inc. NI 43-101 Technical Report – Marmato Project Page 273
MMS/KD Marmato_PEA_NI43-101_544400.020_Rev31_KD.docx November 2019
(under a single contract). The plan is to award this contract in Q4 2019, with an anticipated completion
by end of Q1 2020 and submission to Corpocaldas.
20.3.10 Performance and Reclamation Bonding
The termination of a mining concession can happen for several reasons: resignation, mutual
agreement, and expiration of the term, the concession holder’s death, free revocation and reversion.
In all cases, the concession holder is obliged to comply or guarantee the environmental obligations
payable at the time the termination becomes effective.
The 2001 Mining Code requires the concession holder to obtain an Insurance Policy to guarantee
compliance with mining and environmental obligations which must be approved by the relevant
authority, annually renewed, and remain in effect during the life of the Project and for three years from
the date of termination of the concession contract. The value to be insured will be calculated as follows:
• During the exploration phase of the Project, the insured value under the policy must be 5% of
the value of the planned annual exploration expenditures;
• During the construction phase, the insured value under the policy must be 5% of the planned
investment for assembly and construction; and
• During the exploitation phase, the insured value under the policy must be 10% of the value
resulting from the estimated annual production multiplied by the pithead price established
annually by the government.
According to the Law, the concession holder is liable for environmental remediation and other liabilities
based on actions and or omissions occurring after the date of the concession contract, even if the
actions or omissions are by an authorized third-party operator on the concession. The owner is not
responsible for environmental liabilities which occurred before the concession contract, from historical
activities, or from those which result from non-regulated mining activity, as has occurred on and around
the Marmato Project site.
According to GCM, an Environmental Insurance Policy is in effect for the Marmato Project, though no
other information was provided at this time.
20.4 Social Management
The 2001 PMA for Marmato specifically requires the management of the social component of the
Project. GCM is required to maintain records on all community activities (including number of
participants, topics, duration, etc.), which is to be turned over to Corpocaldas as part of the ongoing
monitoring programs.
20.4.1 Stakeholder Engagement
As part of the social management and monitoring program, GCM has developed a social investment
model which seeks to promote the development of communities in the area of influence, with the
purpose of contributing to the consolidation of society and fostering economic development (Economic
Development), guaranteeing the care and respect for the environment (Environmental Development),
and supporting and participating in actions aimed at improving the quality of life and well-being of its
inhabitants (Social Development and Promotion of Solidarity Actions). Activities in 2017 included,
among others (for example):

SRK Consulting (U.S.), Inc. NI 43-101 Technical Report – Marmato Project Page 274
MMS/KD Marmato_PEA_NI43-101_544400.020_Rev31_KD.docx November 2019
• Direct economic compensation in excess of 3,850,000,000 pesos (US$1.123 million)
(including state royalties and a payment of 2,079,000,000 pesos [US$606,330] to the
municipality of Marmato);
• Support of education programs, such as Mining Training School with the SENA National
Center, Mine Rescue Training, Nutrition and Safety Training, etc.
• Support for traditional festivities of local municipalities like Ferias de El Oro and Fiesta of El
Barequero;
• Support for the Afro-Colombian meeting; and
• Health programs including vaccination days, sexual education workshops, drug addiction
prevention workshops, etc.
According to GCM, the company has a complaints and petitions handling procedure to record
grievances both at the company offices and community office in El Llano. The grievance recording and
response procedures follow international good practice.
20.4.2 Artisanal and Small-Scale Mining Operations
The Marmato district has been exploited since pre-Colonial times by the Quimbaya people. The
Spanish colonists assumed control of the Marmato mines in 1527 and the area has been in almost
continuous production ever since. This mining is informal/artisanal in nature (sometimes referred to as
“traditional”), which is the general characteristic of the mining sector in Colombia. A recent census
revealed that 72% of all mining operations in Colombia are classed as ‘artisanal and small-scale
mining’ (ASM), and 63% are ‘informal’, lacking a legal mining concession or title. Large-scale mining
(LSM) only accounts for 1% of operations. Over 340,000 Colombians depend directly on ASM and
medium-scale mining (MSM) for their income. This informality deprives the state of important financial
resources, while the current poor conditions (environmental, social, health and safety, labor, technical
and trading) prevent the sector from delivering on important social objectives, such as generating
formal employment and improving the quality of life in mining communities (Echavarria 2014).
In 2013, a decree (933) was enacted to address the legal void for almost 4,000 requests for
formalization from Law 1382 of 2010, which was promulgated, in part, with the objective of combating
illegal mining, while recognizing the traditional nature of informal ASM. This decree redefined
traditional mining as a form of informal mining. It set out formalization procedures for ASM in LSM
mining concessions and titles, notably including procedures for concession-owners to cede areas to
ASM, and included tax incentives. For the first time, it also provided options for areas returned to the
state to be reserved for ASM formalization. In addition, Mercury Law No. 1658 of 2013, introduced
incentives for the formalization of ASM such as: granting of soft credits and financing programs to
facilitate access to resources; and created a sub-contract intended to formalize illegal mining activities
with the registered license-holder. Under Article 11 of Law 1658, concession owners can sign
subcontracts with ASM operating in their concessions without the liability associated with normal
operating contracts. These subcontracts will legally allow these ASM to operate in an agreed upon
area with no oversight by the concession owner. Instead these ASM will be under the control of the
Colombian mining and environmental authorities.
GCM has since changed course with respect to the open pit concept, and has determined that it is
preferential to develop the concession as an underground operationwithout impacting the town.

SRK Consulting (U.S.), Inc. NI 43-101 Technical Report – Marmato Project Page 275
MMS/KD Marmato_PEA_NI43-101_544400.020_Rev31_KD.docx November 2019
20.5 Mine Closure and Reclamation
Article 209 of Law 685 of 2001 requires that the concession holder, upon termination of the agreement,
shall undertake the necessary environmental measures for the proper reclamation and closure of the
operation. To ensure that these activities are carried out, the Environmental Insurance Policy shall
remain in effect for three years from the date of termination of the contract. Little else regarding the
specifics of mine closure is provided in the Law. Decree 2820 Article 40 Paragraph 2 of 2010
specifically indicates that the concession holder must submit a plan for dismantling and abandonment
of the Project.
While a formal closure plan is not legally required at this stage of the operation, currently there is a
closure plan for Marmato (May 2019) which discusses basic reclamation and closure actions including
aspects of temporary, progressive, and final closure. More detailed, site-wide closure actions have not
yet been defined, as these will be developed through five-year updates to help identify potential closure
risks that GCM may need to manage and finalized closer to the end of operations. The below
discussion focuses on final closure and post-closure.
Some surface facilities (e.g., tailings disposal facility) will be progressively reclaimed over the duration
of the mine site operations, albeit on a limited basis, as there are relatively few surface facilities suitable
for concurrent reclamation and closure. In addition, progressive reclamation and closure can result in
the development of expertise on the most appropriate reclamation methods. Progressive reclamation
and closure will be undertaken, however, without posing impediments on day-to-day operations of the
site. Final closure of the mine site will be undertaken following completion of all mining operations.
Final closure of the facility will entail the following activities, if not undertaken during progressive
closure phases:
• Reclamation of tailings dam:
o The dam will be covered with growth media and revegetated.
o Concrete structures will be properly decommissioned.
o Metal fences will be removed.
• Underground workings:
o All equipment with resale value will be removed and salvaged.
o All portals, ventilation shafts, etc., will be sealed to exclude public access.
• Plant and other buildings:
o Plant equipment will be decommissioned and removed for transportation to, and storage
in, Medellín.
o Buildings will be demolished.
• Erosion control measures will be taken where there is evidence of erosion.
• Human resources: mine workers’ contracts will not be renewed (no extra costs to be included
in the reclamation and closure cost estimate) or the contracts will be terminated (which would
incur additional costs).
The May 2019 closure plan discusses post-closure activities which include monitoring for physical and
chemical stability. Physical stability monitoring will include monitoring for ground movements which
would indicate subsidence. The plan currently assumes monitoring of physical stability twice annually
for three years and then annually for three years if no movement is detected. Chemical stability will
include monitoring of water quality of mine effluent as well as tailings draindown. Monitoring of water

SRK Consulting (U.S.), Inc. NI 43-101 Technical Report – Marmato Project Page 276
MMS/KD Marmato_PEA_NI43-101_544400.020_Rev31_KD.docx November 2019
quality will continue twice a year for the first three years and then once annually for at least three years
afterwards until such time that permissible limits are met, or flows diminish (in the case of draindown
from tailings).
20.5.1 Reclamation and Closure Costs
Reclamation and closure costs for the current operation are provided in the May 2019 reclamation and
closure plan. These costs are based on percentages of costs to build the facilities. The plan does not
provide the basis for the percentages. The reclamation and closure cost estimate provided totals
20,128,000,000 pesos (US$5.8 million based on exchange rate of 3,455 to 1). A requirement for long-
term post-closure water treatment, if any, would significantly increase this estimate.
Given the conceptual design nature of the deep zone expansion of the Marmato Project, a detailed
closure cost assessment cannot be made at this time. However, it is not unreasonable to assume that
the closure cost would be 1.5 to 2.0 times the current estimate, given the increase in production
anticipated for the new operations and the construction of a new plant and tailings disposal area(s). A
cost of US$6.1 million was included in the technical economic model to account for a second tailings
disposal facility. These costs will need to be revisited more accurately during the PFS phase of project
development.

SRK Consulting (U.S.), Inc. NI 43-101 Technical Report – Marmato Project Page 277
MMS/KD Marmato_PEA_NI43-101_544400.020_Rev31_KD.docx November 2019
21 Capital and Operating Costs SRK visited Marmato’s mine site and office various times in 2019, during these visits SRK reviewed
budget estimates and site-specific cost data, this review included data regarding both capital and
operating costs. These reviewed budgets and site-specific cost data are the base support for the
capital and operating cost models prepared for this PEA.
The cost models prepared for Marmato Upper Zone operation are mostly based on the reviewed
budgets, as this will be a continuation of the current operation. MDZ cost estimates are based on cost
models prepared by SRK, which are based on SRK’s experience with similar operations and site-
specific data provided by Marmato’s staff.
The mine is currently owner operated and the projections prepared for this PEA assume that it will be
maintained. Common prices for consumables, labor, fuel, lubricants and explosives were used by all
engineering disciplines to derive capital and operating costs. Included in the labor costs are shift
differentials, vacation rotations, all taxes and the payroll burdens.
21.1 Capital Cost Estimates
21.1.1 Marmato Upper Zone
Marmato Upper Zone is a currently operating underground mine, the estimate of capital includes only
sustaining capital to maintain the equipment and all supporting infrastructure necessary to continue
operations until the end of the projected production schedule. The estimate of capital is divided into
the following main areas:
• Drilling;
• Development;
• Mine Equipment;
• Other Mine Infrastructure;
• Surface Facilities; and
• Plant.
The sustaining capital cost estimates developed for this mining area includes the costs associated with
the engineering, procurement, construction and commissioning. The cost estimate is based on
budgetary estimates prepared by Marmato and reviewed by SRK. The estimate indicates that the
Project requires a sustaining capital of US$40.5 million to support the projected production schedule
throughout the LoM. Table 21-1 summarizes the LoM sustaining capital estimate and Table 21-2 and
Table 21-3 present the same estimate by year.
Table 21-1: Marmato Upper Zone Sustaining Capital (LoM)
Description LoM ($000’s)
Drilling 1,450
Development 19,501
Mine Equipment 11,545
Other Mine 2,690
Surface 4,330
Plant 1,010
Total 40,526
Source: Gran Colombia/SRK, 2019

SRK Consulting (U.S.), Inc. NI 43-101 Technical Report – Marmato Project Page 278
MMS/KD Marmato_PEA_NI43-101_544400.020_Rev31_KD.docx November 2019
Table 21-2: Marmato Upper Zone Sustaining Capital (2019 to 2026)($000’s)
Description 2019 2020 2021 2022 2023 2024 2025 2026
Drilling 100 100 100 100 100 100 100 100
Development 1,186 2,014 1,374 1,545 1,395 1,268 1,873 1,623
Mine Equipment 920 2,155 1,640 725 580 515 450 645
Other Mine 280 550 720 250 330 300 80 -
Surface 220 480 300 330 250 250 350 250
Plant 50 50 50 50 50 50 50 260
Total 2,756 5,349 4,184 3,000 2,705 2,483 2,903 2,878
Source: Gran Colombia/SRK, 2019
Table 21-3: Marmato Upper Zone Sustaining Capital (2027 to 2034)($000’s)
Description 2027 2028 2029 2030 2031 2032 2033 2034
Drilling 100 100 100 100 100 100 50 -
Development 816 1,159 2,096 1,284 966 315 289 297
Mine Equipment 410 540 470 550 565 590 390 400
Other Mine 130 - - 50 - - - -
Surface 350 250 250 150 250 250 150 250
Plant 50 50 50 50 50 50 50 50
Total 1,856 2,099 2,966 2,184 1,931 1,305 929 997
Source: Gran Colombia/SRK, 2019
Most of this sustaining capital estimate is supported by a budget forecast prepared by Marmato and
reviewed by SRK, the following items are covered by this budget:
• A yearly infill drilling expenditure of US$100,000;
• Mine equipment maintenance and replacement schedule;
• Other mine sustaining capital includes improvements and maintenance of existing mine
infrastructure and stationary equipment;
• Surface sustaining capital includes improvements and maintenance of infrastructure located
at surface, such as the camp, laboratory, filter presses, detox system, etc.; and
• Plant sustaining capital is an estimate of a yearly maintenance cost.
Development costs are derived from the mining schedule prepared by SRK. The prepared mining
schedule includes meters of development in waste, this schedule of meters was combined with unit
costs, based on site specific data, to estimate the cost of this development operation. This cost was
then capitalized into the sustaining capital.
Table 21-4 presents the assumed unit costs for this development, while Table 21-5 and Table 21-6
present the yearly schedule of capital development meters.
Table 21-4: Marmato Upper Zone Capital Development Unit Costs
Description US$/m
Veins Dev in Waste (2.2 by 2.2) 1,050
Ramp (3.5 by 3.5) 1,200
Apique (Widening) 2,300
Source: Gran Colombia/SRK, 2019

SRK Consulting (U.S.), Inc. NI 43-101 Technical Report – Marmato Project Page 279
MMS/KD Marmato_PEA_NI43-101_544400.020_Rev31_KD.docx November 2019
Table 21-5: Marmato Upper Zone Capital Development Meters (2019 to 2026)($000’s)
Description 2019 2020 2021 2022 2023 2024 2025 2026
Veins Dev in Waste 418 1,139 1,309 1,472 1,329 1,207 1,784 1,546
Ramp Meters 459 367 - - - - - -
Apique 86 164 - - - - - -
Source: Gran Colombia/SRK, 2019
Table 21-6: Marmato Upper Zone Capital Development Meters (2027 to 2034)($000’s)
Description 2027 2028 2029 2030 2031 2032 2033 2034
Veins Dev in Waste 777 1,104 1,996 1,223 920 300 275 282
Ramp Meters - - - - - - - -
Apique - - - - - - - -
Source: Gran Colombia/SRK, 2019
21.1.2 Marmato Deeps Zone
The MDZ is a lower part of the deposit that is undeveloped. Before Marmato can exploit this part of
the deposit it will have to expand the existing operation. The expansion is planned to be executed
between the years of 2021 and 2022 and the following areas will require an investment of capital for
the following areas:
• Exploration Drilling;
• Mine Development;
• Mining Equipment;
• Surface Facilities and Equipment;
• Underground Facilities and Equipment;
• Power Supply;
• Access Road;
• Camp;
• Other Supporting Infrastructure;
• Mineral Processing Plant; and
• Tailings Storage Facility.
The capital cost estimates prepared for the expansion into this mining area also include estimates for
Engineering, Procurement and Construction Management (EPCM) and the owner’s cost to manage it.
The cost estimate is based on cost models prepared by SRK with site specific inputs from Marmato.
The estimate indicates that the expansion will require an investment of US$268.9 million, this includes
an estimated capital of US$215.1 million plus 25% contingency of US$53.8 million. Table 21-7
summarizes the expansion capital estimate.

SRK Consulting (U.S.), Inc. NI 43-101 Technical Report – Marmato Project Page 280
MMS/KD Marmato_PEA_NI43-101_544400.020_Rev31_KD.docx November 2019
Table 21-7: Marmato Deeps Zone Construction Capital ($000’s)
Description Total 2021 2022
Exploration Drilling 2,600 1,300 1,300
Development 52,021 14,790 37,232
Mining Equipment 26,956 923 26,033
Surface Facilities and Equipment 12,114 1,264 10,850
UG Facilities and Equipment 499 - 499
Power Supply 675 169 506
Access Road 225 169 56
Camp 750 188 563
Pump Station 200 - 200
Process Plant 65,551 26,221 39,331
Tailings Storage Facility 35,953 - 35,953
EPCM 7,562 268 7,294
Owners 10,000 5,000 5,000
Sub-Total 215,107 50,291 164,816
Contingency (25%) 53,777 12,573 41,204
Total 268,884 62,864 206,020
Source: Gran Colombia/SRK, 2019
The MDZ construction capital is supported by a mix of budgetary estimates and cost models developed
for the installation of the expansion. Budget estimates were prepared by Marmato and reviewed by
SRK and cost models were prepared by SRK. The following items are covered by this budget:
• Exploration drilling to improve resource estimate as a yearly expenditure of US$1.3 million;
• Schedule of mine equipment purchases prepared by SRK;
• Cost model estimate from SRK to install surface facilities like portal, ventilation system, power
generation and distribution, ancillary building, etc.;
• Cost model estimate from SRK to install underground facilities like shops, ventilation systems,
refuge chambers, pumping systems, paste distribution, fuel distribution, ancillary equipment,
etc.;
• Cost model from SRK to install other infrastructure including power supply, access road, camp
and pumping station;
• Cost model estimate from SRK to install mineral processing plant, which already includes
EPCM costs;
• A scoping study prepared by SRK build a tailings storage facility that estimated the initial cost
around US$36 million;
• Additional EPCM costs estimated as 15% of surface and underground facilities, power supply,
access road, camp, pumping station, tailings and tailings storage facility; and
• An estimate of US$10 million for owner’s team to supervise the expansion.
Development costs are derived from the mining schedule prepared by SRK. The prepared mining
schedule includes meters of development during pre-production, this schedule of meters was
combined with unit costs, based on site specific data, to estimate the cost of this development
operation. The pre-production development costs assume that this operation will be performed by a
contractor. Table 21-8 presents the assumed development unit costs and Table 21-9 presents the
scheduled meters for the pre-production period.

SRK Consulting (U.S.), Inc. NI 43-101 Technical Report – Marmato Project Page 281
MMS/KD Marmato_PEA_NI43-101_544400.020_Rev31_KD.docx November 2019
Table 21-8: Marmato Deeps Zone Pre-Production Development Unit Costs (Contractor)($000’s)
Description US$/m
Main Ramp (5.5 by 5.5 arched back) 5,500
Footwall Access (5 by 5) 5,000
Stope Drift in Ore(4.5 x 4.5) 5,000
Stope Drift in Waste (4.5 x 4.5) 5,000
Ventilation Drift (4.5 x 4.5) 5,000
Raisebore (5 m dia) 6,500
Source: Gran Colombia/SRK, 2019
Table 21-9: Marmato Deeps Zone Pre-Production Development Meters
Description 2021 2022
Main Ramp (5.5 by 5.5 arched back) 1,679 1,968
Footwall Access (5 by 5) - 1,271
Stope Drift in Ore (4.5 by 4.5) - 944
Stope Drift in Waste (4.5 by 4.5) - 335
Ventilation Drift (4.5 by 4.5) 1,111 1,594
Raisebore (5 m dia) - 875
Source: Gran Colombia/SRK, 2019
Additionally, the MDZ will require sustaining capital to maintain the equipment and all supporting
infrastructure necessary to continue operations until the end of its projected production schedule. The
estimate of sustaining capital is divided into the following main areas:
• Drilling;
• Development;
• Mine Equipment;
• UG Facilities and Equipment
• Surface Facilities;
• Plant;
• Tailings;
• Other Sustaining; and
• Project Closure.
The sustaining capital cost estimate developed for this mining area includes the costs associated with
the engineering, procurement, construction and commissioning. The cost estimate is based on cost
models prepared by SRK with site specific inputs from Marmato. The estimate indicate that the Project
requires a sustaining capital of US$140.7 million to support the projected production schedule through
the LoM. Table 21-10 summarizes the LoM sustaining capital estimate and Table 21-11 and
Table 21-12 present the same estimate by year.

SRK Consulting (U.S.), Inc. NI 43-101 Technical Report – Marmato Project Page 282
MMS/KD Marmato_PEA_NI43-101_544400.020_Rev31_KD.docx November 2019
Table 21-10: Marmato Deeps Zone Sustaining Capital (LoM)
Description LoM ($000’s)
Drilling 14,500
Development 55,848
Mine Equipment 22,245
UG Facilities and Equipment 8,150
Surface 280
Plant 7,000
Tailings 22,804
Other Sustaining 3,812
Project Closure 6,100
Total 140,739
Source: Gran Colombia/SRK, 2019
Table 21-11: Marmato Deeps Zone Sustaining Capital (2023 to 2030)($000’s)
Description 2023 2024 2025 2026 2027 2028 2029 2030
Drilling 1,000 1,000 1,000 1,000 1,000 1,000 1,000 1,000
Development 9,701 5,878 829 877 8,385 10,434 6,486 5,866
Mine Equipment 5,727 800 3,564 3,536 935 2,318 2,352 1,004
UG Facilities and Equipment 4,603 1,440 463 375 200 75 920 75
Surface 280 - - - - - - -
Plant - 500 500 500 500 500 500 500
Tailings 842 842 842 871 842 842 7,608 5,730
Other Sustaining 219 237 242 247 250 251 262 263
Project Closure - - - - - - - -
Total 22,371 10,696 7,440 7,406 12,112 15,419 19,128 14,438
Source: Gran Colombia/SRK, 2019
Table 21-12: Marmato Deeps Zone Sustaining Capital (2031 to 2038)($000’s)
Description 2031 2032 2033 2034 2035 2036 2037 2038
Drilling 1,000 1,000 1,000 1,000 1,000 1,000 500 -
Development 6,010 1,029 353 - - - - -
Mine Equipment 1,004 1,004 - - - - - -
UG Facilities and Equipment - - - - - - - -
Surface - - - - - - - -
Plant 500 500 500 500 500 500 500 -
Tailings 1,245 871 842 842 585 - - -
Other Sustaining 263 263 263 263 263 263 263 -
Project Closure - - - - - - - 6,100
Total 10,023 4,668 2,958 2,605 2,348 1,763 1,263 6,100
Source: Gran Colombia/SRK, 2019
The assumptions supporting this estimate of sustaining capital are mostly the same as described for
the MDZ construction capital, except for the development costs and closure costs.
In the case of development sustaining capital, these costs are derived from the mining schedule
prepared by SRK. The prepared mining schedule includes meters of development in waste, this
schedule of meters was combined with unit costs, based on site specific data, to estimate the cost of
this development operation. The development in waste costs assume that this operation will be
performed by mix of contractors and the owner. Table 21-13 presents the assumed development unit
costs and Table 21-14 and Table 21-15 present the scheduled meters for the sustaining period.

SRK Consulting (U.S.), Inc. NI 43-101 Technical Report – Marmato Project Page 283
MMS/KD Marmato_PEA_NI43-101_544400.020_Rev31_KD.docx November 2019
Table 21-13: Marmato Deeps Zone Development Sustaining Capital Unit Costs
Description US$/m
Raisebore (5 m dia) - Contractor 6,500
Ventilation Slot Raise (4x4) - Owner 3,500
Main Ramp (5.5 by 5.5 arched back) - Owner 3,800
Footwall Access (5 by 5) - Owner 3,300
Ventilation Drift (4.5 by 4.5) - Owner 2,250
Source: Gran Colombia/SRK, 2019
Table 21-14: Marmato Deeps Zone Development Sustaining Capital Meters (2023 to 2030)($000’s)
Description 2023 2024 2025 2026 2027 2028 2029 2030
Raisebore (5 m dia) - - - - 135 350 97 - Ventilation Slot Raise (4 by 4) - - - - - - - 77 Main Ramp (5.5 by 5.5 arched back) 948 280 - - 1,556 1,368 365 266 Footwall Access (5 by 5) 1,683 1,272 241 128 439 863 1,113 1,300 Ventilation Drift (4.5 by 4.5) 2,264 931 905 1,998 1,672 2,119 1,675 1,249
Source: Gran Colombia/SRK, 2019
Table 21-15: Marmato Deeps Zone Development Sustaining Capital Meters (2031 to 2037)($000’s)
Description 2031 2032 2033 2034 2035 2036 2037
Raisebore (5 m dia) - - - - - - -
Ventilation Slot Raise (4 by 4) - 25 - - - - -
Main Ramp (5.5 by 5.5 arched back) 241 - - - - - -
Footwall Access (5 by 5) 1,374 299 107 - - - -
Ventilation Drift (4.5 by 4.5) 960 1,181 1,542 1,413 1,012 1,387 40
Source: Gran Colombia/SRK, 2019
Project closure costs are based on a budget estimate prepared by Marmato and reviewed by SRK.
21.2 Operating Cost Estimates
SRK and Marmato prepared the estimate of operating costs for the PEA’s production schedule. These
costs were subdivided into the following categories:
• Mining Operating Expenditure;
• Processing Operating Expenditure; and
• Site G&A Operating Expenditure.
Marmato Upper Zone LoM cost estimate is presented in Table 21-16 and MDZ LoM cost estimate is
presented in Table 21-17
Table 21-16: Marmato Upper Zone Operating Costs Summary
Description LoM (US$/t-Ore) LoM (US$000’s)
Mining 46.71 258,918
Process 15.88 88,003
G&A 11.85 65,667
Total Operating 74.44 412,587
Source: Gran Colombia/SRK, 2019

SRK Consulting (U.S.), Inc. NI 43-101 Technical Report – Marmato Project Page 284
MMS/KD Marmato_PEA_NI43-101_544400.020_Rev31_KD.docx November 2019
Table 21-17: Marmato Deeps Zone Operating Costs Summary
Description LoM (US$/t-Ore) LoM (US$000’s)
Mining 32.43 675,150
Process 16.14 336,005
G&A 3.46 72,000
Total Operating 52.02 1,083,155
Source: Gran Colombia/SRK, 2019
21.2.1 Basis for Operating Cost Estimates
The prepared estimates that compose the operating costs consist of domestic and international
services, equipment, labor, etc. Where required, the following were included:
• Value added tax;
• Freight; and
• Duty.
It was assumed that the mill operates 350 days per year under a daily schedule of two shifts of 12
hours.
The operating cost estimates are based on the quantities associated with the production schedule,
including the following:
• Development meters;
• Stope ore tonnage; and
• Ore tonnage.
All operating costs include supervision staff, operations labor, maintenance labor, consumables,
electricity, fuels, lubricants, maintenance parts and any other operating expenditure identified by
contributing engineers.
Site-specific 2018 budget estimates were used to estimate the LoM operating costs of Marmato Upper
Zone. The following costs were used to estimate the operating cost of this mining area:
• Vein mining: US$46.25/t-stope, this includes backfill costs;
• Level 21 mining: US$42.00/t-stope, this includes backfill costs;
• Mineral Processing: US$13.08/t-ore;
• Tailings Deposition: US$2.80/t-ore; and
• G&A: US$4,000,000/year.
Additionally, development operating costs are derived from the mining schedule prepared by SRK.
The prepared mining schedule includes meters of development in ore, this schedule of meters was
combined with unit costs, based on site specific data, to estimate the cost of this development
operation. The development in ore costs assume that this operation will be performed by the owner.
Table 21-18 presents the assumed development unit cost, while Table 21-19 and Table 21-20 present
the scheduled meters for the operating years.
Table 21-18: Marmato Upper Zone Operating Development Unit Costs
Description US$/m
Veins Dev in Ore (2.2 by 2.2) 1,050
Dev Access (3.5 by 3.5) 1,200
Source: Gran Colombia/SRK, 2019

SRK Consulting (U.S.), Inc. NI 43-101 Technical Report – Marmato Project Page 285
MMS/KD Marmato_PEA_NI43-101_544400.020_Rev31_KD.docx November 2019
Table 21-19: Marmato Upper Zone Operating Development Meters (2019 to 2027)
Description 2019 2020 2021 2022 2023 2024 2025 2026 2027
Veins Dev in Ore 249 525 444 513 483 477 485 522 503
Dev Access 260 687 494 - - - - - -
Source: Gran Colombia/SRK, 2019
Table 21-20: Marmato Upper Zone Operating Development Meters (2028 – 2035)
Description 2028 2029 2030 2031 2032 2033 2034 2035
Veins Dev in Ore 685 675 506 511 360 343 238 28
Dev Access - - - - - - - -
Source: Gran Colombia/SRK, 2019
Cost models prepared by SRK based on site-specific inputs from Marmato were used to estimate the
LoM operating costs of MDZ. The following costs were used to estimate the operating cost of this
mining area:
• Stope mining: US$29.23/t-stope, this includes backfill costs;
• Mineral Processing: US$13.34/t-ore;
• Tailings Deposition: US$2.80/t-ore; and
• G&A: US$4,500,000/year.
Additionally, development operating costs are derived from the mining schedule prepared by SRK.
The prepared mining schedule includes meters of development in ore, this schedule of meters was
combined with unit costs, based on site specific data, to estimate the cost of this development
operation. The development in ore costs assume that this operation will be performed by the owner.
Table 21-21 presents the assumed development unit cost, while Table 21-22 and Table 21-23 and
present the scheduled meters for the operating years.
Table 21-21: Marmato Deeps Zone Operating Development Unit Costs
Description US$/m
Stope Drift in Ore (4.5 by 4.5) 2,250
Stope Drift in Waste (4.5 by 4.5) 2,250
Source: Gran Colombia/SRK, 2019
Table 21-22: Marmato Deeps Zone Operating Development Meters (2023 to 2030)
Description 2023 2024 2025 2026 2027 2028 2029 2030
Stope Drift in Ore (4.5 by 4.5) 4,828 1,582 1,112 2,161 2,101 2,393 2,711 2,775
Stope Drift in Waste (4.5 by 4.5) 2,264 931 905 1,998 1,672 2,119 1,675 1,249
Source: Gran Colombia/SRK, 2019
Table 21-23: Marmato Upper Zone Operating Development Meters (2031 to 2037)
Description 2031 2032 2033 2034 2035 2036 2037
Stope Drift in Ore (4.5 by 4.5) 2,970 2,258 2,222 2,118 2,248 2,703 82
Stope Drift in Waste (4.5 by 4.5) 960 1,181 1,542 1,413 1,012 1,387 40
Source: Gran Colombia/SRK, 2019

SRK Consulting (U.S.), Inc. NI 43-101 Technical Report – Marmato Project Page 286
MMS/KD Marmato_PEA_NI43-101_544400.020_Rev31_KD.docx November 2019
22 Economic Analysis The financial results presented here are based on monthly inputs from the production schedule
prepared by SRK. All financial data is first quarter 2019 and currency is in U.S. dollars (US$), unless
otherwise stated.
22.1 External Factors
Marmato currently has a long-term supply agreement for the sale of its products to an international
refinery who take delivery of dore from the mine at designated transfer points in Colombia. The refinery
is responsible for shipping the products abroad.. The refining costs and discounts associated with the
sales of the products are based on this agreement. This study was prepared under the assumption
that the Project will sell doré containing gold and silver.
Treatment charges and net smelter return (NSR) terms are summarized in Table 22-1.
Table 22-1: Marmato Net Smelter Return Terms
Description Value Units
Doré
Payable Gold 100%
Doré Smelting & Refining Charges 6.38 US$/oz-Au
Source: Gran Colombia, 2019
22.2 Production Assumptions
Marmato’s operation is supported by the production of doré bars containing gold and silver. The doré
bars result from the mineral processing of RoM containing gold and silver from an underground mining
operation. Table 22-2 presents this PEA’s production summary.
Table 22-2: Marmato Production Summary
Description Unit Value
Total Ore Mined tonnes 26,363,978
Total Waste Mined tonnes 303,387
Total Material Mined tonnes 26,667,365
Average Mined Grade g/t Au 2.78
Average Mined Grade g/t Ag 5.91
Contained Gold Mined ounces 2,355,994
Contained Silver Mined ounces 5,006,222
Gold Recovered ounces 2,180,395
Silver Recovered ounces 1,816,020
Source: SRK, 2019
The Marmato operation was broken down into two major mining areas, namely the Marmato Upper
Zone, which is represented by the current operation that is composed by a mining area at the upper
portion of the deposit and an existing mineral processing plant, and the MDZ. No pre-production period
has been considered for the Marmato Upper Zone mine schedule, as this part of the operation is
currently producing.

SRK Consulting (U.S.), Inc. NI 43-101 Technical Report – Marmato Project Page 287
MMS/KD Marmato_PEA_NI43-101_544400.020_Rev31_KD.docx November 2019
The MDZ is a lower portion of the deposit that will support an expansion of the Marmato operation.
This will require expansion of the mining operation and the installation of a new mineral processing
circuit to extract doré bars from this material. The mine schedule for MDZ assumes a pre-production
period of four years, considering 2019, which consists of a delay period of two years followed by a
construction period of another two years.
The Marmato Upper Zone mine production is based on a LoM assumed average mining rate of
1,020 tpd (350 days/year basis), including movement of both ore and waste. The MDZ mine production
is based on a LoM assumed average mining rate of 4,100 tpd (350 days/year basis), including
movement of both ore and waste. The combined total mine movement is limited to a maximum of 2
Mtpy.
The mine schedule does not include any major stockpiling, as most of the blending of RoM is done in
the mine. The schedule does include small quantities of stockpiling, the maximum size of this stock is
51,620 t. Table 22-3 to Table 22-5 present the yearly LoM mine production assumptions by area.

SRK Consulting (U.S.), Inc. NI 43-101 Technical Report – Marmato Project Page 288
MMS/KD Marmato_PEA_NI43-101_544400.020_Rev31_KD.docx November 2019
Table 22-3: Marmato Yearly (2019 to 2026) Mine Production Assumptions
2019 2020 2021 2022 2023 2024 2025 2026
Marmato Upper Zone
Ore Tonnes (t) 109,383 349,997 402,491 350,004 350,079 350,055 350,078 350,005
Au Head Grade (g/t) 3.95 3.77 3.53 3.64 3.63 3.64 3.75 3.92
Ag Head Grade (g/t) 14.32 12.16 10.95 14.41 15.28 15.06 14.81 15.29
Au Contained Gold (oz) 13,878 42,459 45,642 40,913 40,883 41,013 42,164 44,114
Ag Contained Gold (oz) 50,363 136,852 141,679 162,136 172,004 169,480 166,735 172,064
Waste (t) 28,231 42,600 29,587 21,012 18,972 17,240 25,470 22,074
Total (t) 137,614 392,597 432,078 371,016 369,051 367,295 375,548 372,079
Marmato Deeps Zone
Ore Tonnes (t) - - - - 830,693 1,400,364 1,400,872 1,400,216
Au Head Grade (g/t) - - - - 3.21 3.08 3.48 3.17
Ag Head Grade (g/t) - - - - 3.79 3.73 4.09 4.65
Au Contained Gold (oz) - - - - 85,828 138,498 156,950 142,538
Ag Contained Gold (oz) - - - - 101,291 167,975 184,183 209,262
Waste (t) - - - - 317,934 171,585 66,588 123,795
Total (t) - - - - 1,148,627 1,571,949 1,467,460 1,524,011
Total
Ore Tonnes (t) 109,383 349,997 402,491 350,004 1,180,772 1,750,419 1,750,950 1,750,221
Au Head Grade (g/t) 3.95 3.77 3.53 3.64 3.34 3.19 3.54 3.32
Ag Head Grade (g/t) 14.32 12.16 10.95 14.41 7.20 6.00 6.23 6.78
Au Contained Gold (oz) 13,878 42,459 45,642 40,913 126,711 179,511 199,114 186,652
Ag Contained Gold (oz) 50,363 136,852 141,679 162,136 273,295 337,455 350,919 381,325
Waste (t) 28,231 42,600 29,587 21,012 336,906 188,825 92,058 145,869
Total (t) 137,614 392,597 432,078 371,016 1,517,678 1,939,244 1,843,008 1,896,090
Source: SRK, 2019

SRK Consulting (U.S.), Inc. NI 43-101 Technical Report – Marmato Project Page 289
MMS/KD Marmato_PEA_NI43-101_544400.020_Rev31_KD.docx November 2019
Table 22-4: Marmato Yearly (2027 to 2034) Mine Production Assumptions
2027 2028 2029 2030 2031 2032 2033 2034
Marmato Upper Zone
Ore Tonnes (t) 350,065 350,080 350,031 350,048 350,030 350,049 350,061 350,046
Au Head Grade (g/t) 4.08 4.08 3.89 3.58 3.82 4.04 4.03 3.94
Ag Head Grade (g/t) 15.57 16.42 17.68 16.32 17.03 18.08 17.29 16.14
Au Contained Gold (oz) 45,928 45,955 43,750 40,324 43,006 45,413 45,364 44,396
Ag Contained Gold (oz) 175,209 184,807 198,972 183,703 191,698 203,469 194,565 181,683
Waste (t) 11,089 15,767 28,500 17,467 13,130 4,283 3,933 4,032
Total (t) 361,154 365,847 378,531 367,515 363,160 354,332 353,994 354,078
Marmato Deeps Zone
Ore Tonnes (t) 1,396,679 1,342,363 1,400,182 1,399,950 1,400,341 1,400,202 1,400,406 1,400,358
Au Head Grade (g/t) 2.59 2.29 2.26 2.16 2.04 2.09 2.18 2.18
Ag Head Grade (g/t) 3.57 4.20 5.19 4.67 2.49 1.64 1.79 2.03
Au Contained Gold (oz) 116,430 99,000 101,855 97,389 92,041 93,901 98,054 98,302
Ag Contained Gold (oz) 160,229 181,333 233,685 210,353 112,222 73,841 80,550 91,196
Waste (t) 241,877 291,664 213,666 188,674 174,910 85,794 91,527 77,264
Total (t) 1,638,556 1,634,027 1,613,848 1,588,624 1,575,251 1,485,996 1,491,933 1,477,622
Total
Ore Tonnes (t) 1,746,744 1,692,443 1,750,213 1,749,998 1,750,371 1,750,251 1,750,467 1,750,404
Au Head Grade (g/t) 2.89 2.66 2.59 2.45 2.40 2.48 2.55 2.54
Ag Head Grade (g/t) 5.97 6.73 7.69 7.00 5.40 4.93 4.89 4.85
Au Contained Gold (oz) 162,359 144,955 145,605 137,713 135,046 139,314 143,418 142,698
Ag Contained Gold (oz) 335,437 366,140 432,657 394,056 303,920 277,310 275,115 272,878
Waste (t) 252,966 307,431 242,166 206,141 188,040 90,077 95,460 81,296
Total (t) 1,999,710 1,999,874 1,992,379 1,956,139 1,938,411 1,840,328 1,845,927 1,831,700
Source: SRK, 2019
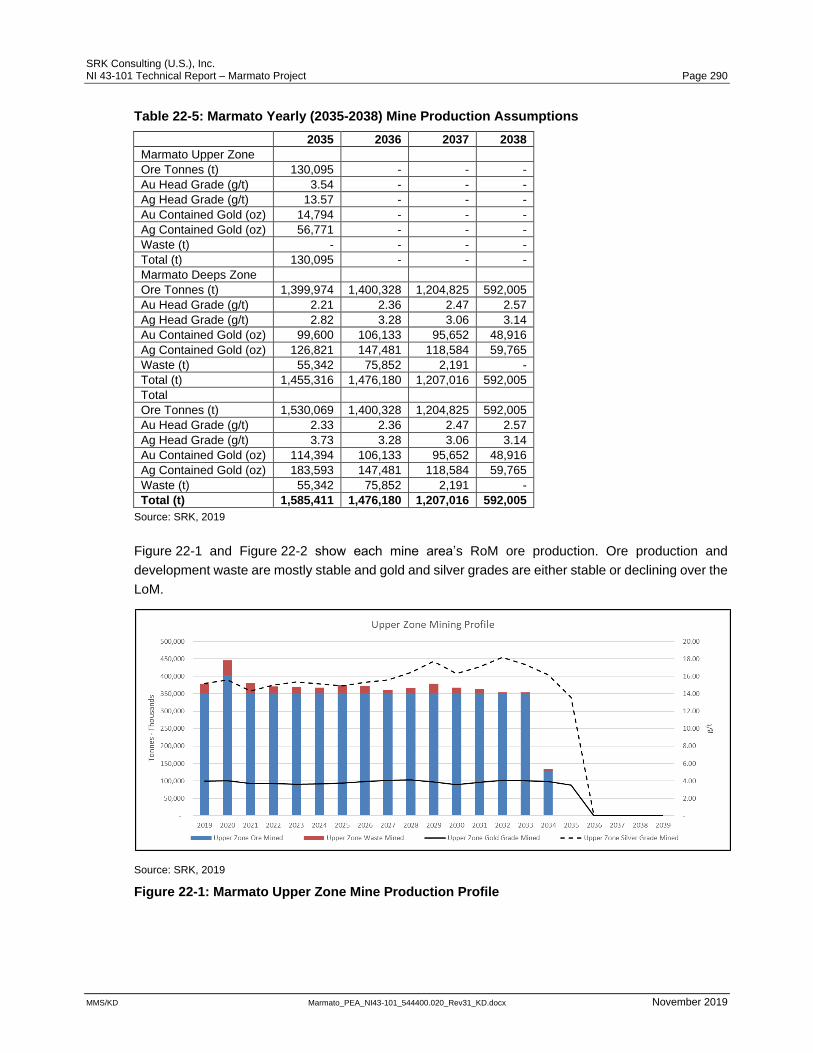
SRK Consulting (U.S.), Inc. NI 43-101 Technical Report – Marmato Project Page 290
MMS/KD Marmato_PEA_NI43-101_544400.020_Rev31_KD.docx November 2019
Table 22-5: Marmato Yearly (2035-2038) Mine Production Assumptions
2035 2036 2037 2038
Marmato Upper Zone
Ore Tonnes (t) 130,095 - - -
Au Head Grade (g/t) 3.54 - - -
Ag Head Grade (g/t) 13.57 - - -
Au Contained Gold (oz) 14,794 - - -
Ag Contained Gold (oz) 56,771 - - -
Waste (t) - - - -
Total (t) 130,095 - - -
Marmato Deeps Zone
Ore Tonnes (t) 1,399,974 1,400,328 1,204,825 592,005
Au Head Grade (g/t) 2.21 2.36 2.47 2.57
Ag Head Grade (g/t) 2.82 3.28 3.06 3.14
Au Contained Gold (oz) 99,600 106,133 95,652 48,916
Ag Contained Gold (oz) 126,821 147,481 118,584 59,765
Waste (t) 55,342 75,852 2,191 -
Total (t) 1,455,316 1,476,180 1,207,016 592,005
Total
Ore Tonnes (t) 1,530,069 1,400,328 1,204,825 592,005
Au Head Grade (g/t) 2.33 2.36 2.47 2.57
Ag Head Grade (g/t) 3.73 3.28 3.06 3.14
Au Contained Gold (oz) 114,394 106,133 95,652 48,916
Ag Contained Gold (oz) 183,593 147,481 118,584 59,765
Waste (t) 55,342 75,852 2,191 -
Total (t) 1,585,411 1,476,180 1,207,016 592,005
Source: SRK, 2019
Figure 22-1 and Figure 22-2 show each mine area’s RoM ore production. Ore production and
development waste are mostly stable and gold and silver grades are either stable or declining over the
LoM.
Source: SRK, 2019
Figure 22-1: Marmato Upper Zone Mine Production Profile

SRK Consulting (U.S.), Inc. NI 43-101 Technical Report – Marmato Project Page 291
MMS/KD Marmato_PEA_NI43-101_544400.020_Rev31_KD.docx November 2019
Source: SRK, 2019
Figure 22-2: Marmato Deeps Zone Mine Production Profile
Marmato’s Upper Zone operation is supported by an existing mineral processing facility, this plant has
a capacity of 525,000 tpy (based on 1,500 tpd and an availability of 350 days/year). Table 22-6
presents the projected LoM plant production for Marmato Upper Zone.
Table 22-6: Marmato Upper Zone LoM Mill Production Assumptions
Description Unit Value
Processing Capacity tpy 525,000
Ore Processed tonnes 5,542,597
Average Feed Grade g/t Au 3.82
Average Feed Grade g/t Ag 15.39
Gold Recovery % 87%
Silver Recovery % 33%
Gold Recovered ounces 588,196
Silver Recovered ounces 910,407
Average Gold Per year ounces/yr 34,600
Average Silver Per year ounces/yr 53,553
Source: SRK, 2019
The MDZ will require the installation of an additional mineral processing facility, this plant will have a
capacity of 1,400,000 tpy (based on 4,000 tpd and an availability of 350 days per year). Table 22-7
presents the projected LoM plant production for MDZ.

SRK Consulting (U.S.), Inc. NI 43-101 Technical Report – Marmato Project Page 292
MMS/KD Marmato_PEA_NI43-101_544400.020_Rev31_KD.docx November 2019
Table 22-7: Marmato Deeps Zone LoM Mill Production Assumptions
Description Unit Value
Processing Capacity tpy 1,400,000
Ore Processed tonnes 20,821,381
Average Feed Grade g/t Au 2.50
Average Feed Grade g/t Ag 3.38
Gold Recovery % 95%
Silver Recovery % 40%
Gold Recovered ounces 1,592,199
Silver Recovered ounces 905,613
Average Gold Per year ounces/yr 99,512
Average Silver Per year ounces/yr 56,601
Source: SRK, 2019
All figures presented above are based on the production derived from the resources disclosed in this
report.
22.3 Taxes, Royalties and Other Interests
The analysis of the Marmato Project includes an effective corporate income tax rate of 30%. A
depreciation schedule was calculated by SRK assuming a 10 year straight-line depreciation.
Royalties are also deducible from taxable income. The Project includes payment of a governmental
production royalties on both gold and silver sales as outlined in Section 4.3. The total royalty due,
excluding the inter-company royalty to Croesus, is calculated as 9.2% of gross metal sales deducted
by the costs of transportation and metal refining.
22.4 Results
The valuation results of the Marmato Project indicate that the Project has an after-tax Net Present
Value (NPV) of approximately US$206.8 million, based on a 5% discount rate and gold and silver
prices of US$1,300/oz and US$17.00/oz respectively. The operation is projected to have negative
cash flows during the years 2021 and 2022, when the MDZ is installed, with payback for the expansion
expected by 2026. The annual free cash flow profile of the Project is presented in Figure 22-3. The full
annual TEM is in Appendix D.

SRK Consulting (U.S.), Inc. NI 43-101 Technical Report – Marmato Project Page 293
MMS/KD Marmato_PEA_NI43-101_544400.020_Rev31_KD.docx November 2019
Source: SRK, 2019
Figure 22-3: Marmato After-Tax Free Cash Flow, Capital and Metal Production
Indicative economic results are presented in Table 22-8 . The Project is a gold operation with a sub-
product of silver, where gold represents 99% of the total projected revenue and silver the remaining
1%. The underground mining cost is the heaviest burden on the operation representing 63% of the
operating cost, as presented in Figure 22-4.

SRK Consulting (U.S.), Inc. NI 43-101 Technical Report – Marmato Project Page 294
MMS/KD Marmato_PEA_NI43-101_544400.020_Rev31_KD.docx November 2019
Source: SRK, 2019
Figure 22-4: Marmato Operating Cost Break-Down

SRK Consulting (U.S.), Inc. NI 43-101 Technical Report – Marmato Project Page 295
MMS/KD Marmato_PEA_NI43-101_544400.020_Rev31_KD.docx November 2019
Table 22-8: Marmato Indicative Economic Results
LoM Cash Flow
Gold Price USD/oz 1,300
Silver Price USD/oz 17.00
Total Revenue USD 2,851,475,063
Mining Cost USD (934,068,009)
Processing Cost USD (424,007,603)
G&A Cost USD (137,666,667)
Total Opex USD (1,495,742,278)
Operating Margin USD 1,355,732,785
Operating Margin Ratio % 48%
Taxes Paid USD (195,035,875)
Free Cashflow USD 717,096,368
LoM Capital
Expansion CAPEX USD (268,884,037)
Sustaining CAPEX USD (181,264,836)
Total LOM CAPEX USD (450,148,872)
Before Tax
Free Cash Flow USD 643,248,206
NPV @ 5% USD 322,995,835
NPV @ 8% USD 214,836,234
NPV @ 10% USD 163,296,934
IRR % 28%
After Tax
Free Cash Flow USD 448,212,331
NPV @ 5% USD 206,821,360
NPV @ 8% USD 126,595,938
NPV @ 10% USD 88,893,940
IRR % 20%
Payback Year 2026
Source: SRK, 2019
Table 22-9 shows annual production and revenue forecasts for the life of the Project. All production
forecasts, material grades, plant recoveries and other productivity measures were developed by SRK
and GCM.

SRK Consulting (U.S.), Inc. NI 43-101 Technical Report – Marmato Project Page 296
MMS/KD Marmato_PEA_NI43-101_544400.020_Rev31_KD.docx November 2019
Table 22-9: Marmato LoM Annual Production and Revenues
Year Ore Tonnes
(t) Au Head
Grade (g/t) Ag Head
Grade (g/t) Recovered
Gold (oz) Recovered Silver (oz)
Free Cash Flow (US$)
2019 109,383 3.95 14.32 12,004 16,721 2,280,989
2020 349,997 3.77 12.16 36,727 45,435 9,680,557
2021 402,491 3.53 10.95 39,480 47,037 8,747,239
2022 350,004 3.64 14.41 35,390 53,829 8,483,242
2023 1,190,079 3.33 7.15 117,433 97,682 28,640,806
2024 1,750,055 3.19 6.00 167,169 123,453 74,044,112
2025 1,750,078 3.53 6.23 184,969 128,793 89,142,295
2026 1,750,005 3.32 6.76 173,944 140,508 70,662,159
2027 1,750,065 2.90 5.99 151,357 122,995 47,078,629
2028 1,732,890 2.66 6.66 137,026 135,762 34,694,943
2029 1,750,031 2.59 7.69 134,593 159,521 30,519,081
2030 1,750,048 2.45 7.00 127,403 145,135 30,334,978
2031 1,750,030 2.40 5.40 124,618 108,525 34,163,408
2032 1,750,049 2.48 4.93 128,474 97,089 45,176,084
2033 1,750,061 2.55 4.89 132,362 96,805 49,971,149
2034 1,750,046 2.54 4.85 131,765 96,784 41,240,974
2035 1,530,095 2.33 3.73 107,417 69,563 29,297,203
2036 1,400,000 2.36 3.28 100,797 58,970 36,731,400
2037 1,206,566 2.47 3.06 90,995 47,507 35,767,475
2038 592,005 2.57 3.14 46,470 23,906 10,439,649
Total 26,363,978 2.78 5.91 2,180,395 1,816,020 717,096,368
Source: SRK, 2019
The estimated All-in Sustaining Costs (AISC), including sustaining capital, is US$882/Au-oz.
Table 22-10 presents the breakdown of the Marmato cash costs.
Table 22-10: LOM All-in Sustaining Cost Breakdown
Description Unit Value
Mining USD/Au 428
Processing USD/Au 194
G&A USD/Au 63
Refining USD/Au 6
Royalty USD/Au 120
Sustaining Capital USD/Au 83
Silver Credit USD/Au (14)
AISC USD/Au 882
SRK’s standard Cash Cost reporting methodology for NI 43-101 reports includes smelting/refining costs; whereas Gran Colombia’s basis of reporting treats these costs as a reduction of realized gold price (the refinery discounts the selling price by a factor to cover these charges) and excludes them from its reported “total cash cost per ounce”. Source: SRK, 2019
22.5 Sensitivity Analysis
A sensitivity analysis on variation of Project costs, both capital and operating, and metal prices
indicated that the cash generation is most sensitive to reduction in metal prices, or possibly loss on
metal recovery, and secondly to an increase in operating costs.

SRK Consulting (U.S.), Inc. NI 43-101 Technical Report – Marmato Project Page 297
MMS/KD Marmato_PEA_NI43-101_544400.020_Rev31_KD.docx November 2019
Source: SRK, 2019
Figure 22-5: Marmato NPV Sensitivity

SRK Consulting (U.S.), Inc. NI 43-101 Technical Report – Marmato Project Page 298
MMS/KD Marmato_PEA_NI43-101_544400.020_Rev31_KD.docx November 2019
23 Adjacent Properties
There are no properties or other operating mines with NI 43-101 compliant resources adjacent to
Marmato.

SRK Consulting (U.S.), Inc. NI 43-101 Technical Report – Marmato Project Page 299
MMS/KD Marmato_PEA_NI43-101_544400.020_Rev31_KD.docx November 2019
24 Other Relevant Data and Information There is no additional information or explanation necessary to make the technical report
understandable and not misleading.

SRK Consulting (U.S.), Inc. NI 43-101 Technical Report – Marmato Project Page 300
MMS/KD Marmato_PEA_NI43-101_544400.020_Rev31_KD.docx November 2019
25 Interpretation and Conclusions
25.1 Property Description and Ownership
The Company currently owns sufficient ground to operate and explore all the currently defined Mineral
Resources. In the Zona Alta area within the Company -owned licenses a number of small scale
operations exist..
SRK notes within the transfer of licenses from the previous owner, there is a gap between the existing
licenses for Zona Baja and Echandia. This ground is under application from the Company with the
Colombia government for formal approval to continue mining. SRK has reviewed the application within
the government website and notes that the status is defined as “in progress”, which has been in place
since September 30, 2009. The Company is taking steps to get the approval finalized.
Mining by GCM within this area has historically been conducted through the current operations and it
has been reported to SRK that this area is under application for adjustment of the status for inclusion
in the current mining operations of GCM. As the area represented by this gap contains approximately
8.7% of Measured & Indicated resources in Zona Baja and 1.9% of Inferred resources in Zona Baja,
SRK recommends that GCM accelerate its effort to obtain government resolution on this gap as it
could potentially result in loss of Mineral Resources (and future Reserves). Only approximately 2.3%
of the total LOM gold production included in the proposed mine plan for Zona Baja contained herein is
sourced from the area represented by this gap.
25.2 Exploration
SRK has been supplied with electronic databases covering the sampling at the Project, all of which
have been validated by the Company. The databases comprise of a combination of historical and
recent diamond core and underground channel samples. In total, there are some 1,317 diamond
drillholes for a combined length of 266,390 m; plus 24,824 individual underground channel samples,
inclusive of current mine sampling contained in the databases. Isolated historical channel samples in
the upper portion of the mines have a degree of uncertainty on spatial location and quality as they
have not been independently verified by SRK during site visits. SRK has excluded these samples from
estimation of the porphyry units but has used them to guide the geological interpretation of the veins
at higher elevations.
Historic underground channel samples are typically taken across the width of the vein, with limited
sampling into the hanging-wall and footwall where possible. GCM geologists have made great efforts
to position the sampling as accurately as possible, but SRK has noted some limitations still exist.
These samples have been allocated separate geological codes in the modelling process as to not
influence the geological model.
SRK is of the opinion that the exploration and assay data is sufficiently reliable to support evaluation
and classification of Mineral Resources in accordance with generally accepted CIM Estimation of
Mineral Resource and Mineral Reserve Best Practices Guidelines (2014).

SRK Consulting (U.S.), Inc. NI 43-101 Technical Report – Marmato Project Page 301
MMS/KD Marmato_PEA_NI43-101_544400.020_Rev31_KD.docx November 2019
25.3 Mineral Resource Estimate
The mineralization occurs in parallel, sheeted and anastomosing veins (vein domain), all of which
follow a regional structural control, with minor veins forming splays of the main structures (splays)
which often have limited strike or dip extent. The vein domain intersects broader zones of intense
veinlet mineralization (termed “porphyry domain” for the purpose of this report) and is hosted by a
lower grade mineralized porphyry. In addition, a discrete, relatively high-grade core, or feeder zone, to
the main mineralization (MDZ), has been identified at depth by GCM geologists. The upper portion of
the MDZ has been exposed in Level 21 of the existing mining operations, while deeper sections have
been observed in drillcore, both of which have been confirmed as a separate style of mineralization.
The main differences between the porphyry domain and the MDZ is that the veins and veinlets in the
upper mine pyrite has replaced pyrrhotite. The lowest levels of the mine have currently intersected a
combination of the porphyry domain which is where the gold is associated with veinlets with pyrite,
and the MDZ where gold (Au) is associated with pyrrhotite. There is a small transition between the two
domains, which is observed to some extent in the current mine workings but is not clearly defined from
the current drilling. Underground mining at the Company operated mine remains focused on the vein
structures located in the central portion (Zona Baja) of the Marmato deposit.
Stillitoe (2019) concluded the only geological parameter than can be used to constrain the grade model
is veinlet intensity, although the presence of visible native gold also acts as a useful grade indicator.
SRK has used this assumption as the basis for the mineralization model, by using a an indicator gold
(1.7 g/t) grade to act as a proxy to higher grades of vein density (which have been logged consistently
in older holes in the area).
SRK has produced block models using Datamine™ Studio RM Software (Datamine™). The procedure
involved import from Leapfrog™Geo of wireframe models for the fault networks, veins, definition of
resource domains (high-grade sub-domains), data conditioning (compositing and capping) for
statistical analysis, geostatistical analysis, variography, block modelling and grade interpolation
followed by validation. Grade estimation has for the veins has been based on block dimensions of 5 m
by 5 m by 5 m for the Porphyry and MDZ units. Sub-blocking to 0.5 m by 1 m by 1 m has been allowed
to reflect the narrow nature of the geological model. The block size reflects the relatively close-spaced
underground channel sampling and spacing within veins compared to the wider drilling spacing, with
the narrower block size used in the MDZ at depth to reflect the proposed geometry of the mineralization
(steeply dipping feeder zone).
SRK is of the opinion that the Mineral Resource Estimate has been conducted in a manner consistent
with industry best practices and that the data and information supporting the stated mineral resources
is sufficient for declaration of Measured, Indicated and Inferred classifications of resources. SRK
considers currently the veins (including splays) and the MDZ to be of sufficient confidence for use in a
mining study, but recommends further work on the short scale variability within the porphyry be
completed to confirm the current interpretation within areas of the existing mining infrastructure prior
to use in any mining studies.
The exclusive structural control of the Lower Zone orebody implies that additional examples could
exist elsewhere within the P1 stock and that they represent a priority exploration target, but further
exploration will be required to test this theory and there is no gaurentee of exploration success.

SRK Consulting (U.S.), Inc. NI 43-101 Technical Report – Marmato Project Page 302
MMS/KD Marmato_PEA_NI43-101_544400.020_Rev31_KD.docx November 2019
25.4 Mining and Mineral Reserve Estimate
No Mineral Reserves have been estimated for the Project. The available data indicate that
underground operations are viable for the Project. The upper zone is currently being mined using a
conventional cut and fill stope method. The MDZ zone is porphyry material below 1,025 m elevation,
and will be mined using a longhole stoping method. The MDZ zone is currently not developed.
Upper zone mining begins with a production of 700 tpd (245,000 tpy) from the vein stopes for the first
two years, and then increases to 1,000 tpd (350,000 tpy) for the remaining 15 years of the mine life.
The MDZ zone material will feed a new process facility with a capacity of 4,000 tpd (1.4 Mtpy). Higher
grade material from the MDZ area is targeted early in the mine life.
25.5 Metallurgy and Processing
GCM currently operates a 1,200 tpd process plant (rated capacity) to recover gold and silver values
from mineralization produced from current Marmato mining operations. The current Marmato process
plant includes gravity concentration followed by gold flotation from the gravity tailing and cyanidation
of the flotation concentrate.
• During the period from 2013 to 2019 overall gold recovery has ranged from 89.0 to 83.7% and
has averaged about 86.5% over the past three years. Silver recovery has ranged from 41.1 to
31.5% and has averaged 33.2% over the past three years.
• Marmato process plant operating costs reported for 2019 (Jan-July) averaged US$13.08/t
processed (exchange rate: 3,000 COP per US$).
MDZ material will be processed at the rate of 4,000 tpd in a new plant using a flowsheet that includes
gravity concentration followed by cyanidation of the gravity tailing:
• The MDZ material is significantly harder than Marmato mineralization and will incur higher
comminution costs;
• Gold recovery is estimated at 95% and silver recovery is estimated at 40%;
• Process plant operating costs are estimated at US$13.34/t; and
• Process plant capital cost is estimated at US$65.6 million at an accuracy of +/-50%.
25.6 Infrastructure
• Existing Project Facilities and Support Infrastructure: The existing infrastructure at the
existing project is fully developed and functioning. There are no significant additions to the
surface infrastructure other than potential pumping station to supplement the water supply to
the existing operation during dry seasons;
• Existing Project Tailings: The final and third phase of the existing TSF will follow the design
prepared by IRYS and includes the addition of a third settling pond at El Guacio and an
estimated two to three years of additional capacity at current production rates. Per GCM, the
method of dewatering the tailings will stay consistent with the current employed methods.
• MDZ Infrastructure: The new project will require a new access road, a connection to the
existing power system and the associated power infrastructure at the new site, new water
supply, and a new camp site. The new site infrastructure concepts and preliminary designs
are adequate to address the MDZ Project needs at a PEA level.

SRK Consulting (U.S.), Inc. NI 43-101 Technical Report – Marmato Project Page 303
MMS/KD Marmato_PEA_NI43-101_544400.020_Rev31_KD.docx November 2019
• MDZ Tailings: The MDZ Project will require the construction of at least two new DSTFs to
accommodate the estimated tailings volume required to be managed through the LoM. These
facilities will require new access roads, haul roads, pipeline corridors and culverts, perimeter
stormwater channels and associated settling ponds, a connection to the existing power system
for filter presses, and a building to house the filter presses and thickeners. Based on the
currently-available data, the conceptual new site infrastructure and DSTF designs would be
adequate to address the MDZ Project needs through the currently-envisioned mine life.
However, a significant effort is required to adequately characterize the proposed DSTF
foundations and the tailings material itself, in addition to identifying and testing a suitable
borrow source for rock starter embankment construction and outer slope cladding for erosion
protection. Based on the limited site and tailings characterization data currently available,
there is significant uncertainty with the DSTF design and construction costs presented herein.
25.7 Environmental Studies and Permitting
The following interpretations and conclusions have been drawn with respect to the currently available
information provided for the Marmato Project:
• Permitting: Operations are permitted through the posting of an Environmental Management
Plan (PMA) and secondary permits for use of water abstraction, forest use, air emissions,
discharges and river course (channel) construction. The PMA for the current operations was
approved in 2001.
• Environmental and Social Management: Environmental and social issues are currently
managed in accordance with the approved PMA, and may need to be updated and/or modified
for the proposed expansion project.
• Monitoring: GCM has seven domestic wastewater discharges and three non-domestic
(industrial) wastewater discharges for which monitoring is conducted. They also monitor air
quality emissions from the metallurgical laboratory and smelter for particulate matter (PM),
sulphur dioxide (SO2) nitrogen oxides (NOX) and lead (Pb). The tailings are infrequently
monitored for hazard classification purposes through a Corrosive, Reactive, Explosive, Toxic,
Inflammable, Pathogen [biological] (CRETIP) program. The results of the monitoring are
provided to Corpocaldas. This monitoring program will require significant modification to include
the facilities for the proposed expansion project, and to bring it up to international best practices.
• Geochemistry: Acid-generating sulfide minerals identified in the deposit include pyrite,
arsenopyrite, iron-bearing sphalerite, pyrrhotite, and chalcopyrite (SRK, 2017). Samples of
groundwater discharging into the underground are predominantly acidic. The underground
water samples contain elevated metal(loid) concentrations. Geochemical properties of current
and future waste rock and tailings are currently unknown.
• Health and Safety: The entire area around Marmato is heavily contaminated as a result of
‘artisanal and small-scale mining’ (ASM) alongside the formal GCM concession operation.
Significant health issues related to this contamination are occurring in the artisanal mines and
are expected to continue under current conditions. Whereas in many other parts of Colombia,
illegal armed groups (i.e., FARC, ELN, etc.), as well as armed criminal groups (i.e., BACRIM)
are tied to the ASM operations, the ASM operations at Marmato have become generational,
with only a few families controlling mines in the area that have been in existence for almost 500
years.

SRK Consulting (U.S.), Inc. NI 43-101 Technical Report – Marmato Project Page 304
MMS/KD Marmato_PEA_NI43-101_544400.020_Rev31_KD.docx November 2019
• Stakeholder Engagement: GCM has conducted stakeholder identification and analysis
programs and has set stakeholder engagement objectives and goals to develop
communications plans with government, community, media and small miners but the company
does not currently have a formal stakeholder engagement plan.
• Closure Costs: The reclamation and closure cost estimate provided for the current operations
is approximately US$5.8 million, though there is uncertainty surrounding the basis for this
estimate. A requirement for long-term post-closure water treatment, if any, could significantly
increase this estimate. A cost of US$6.1 million was included in the technical economic model
to account for a second tailings disposal facility.
Although additional studies are recommended to further develop the proposed mine expansion and
tailings management strategies, there do not appear to be any other known environmental issues that
could materially impact GCM’s ability to conduct mining and milling activities at the site. Preliminary
mitigation strategies have been developed to reduce environmental impacts to meet regulatory
requirements and the conditions of the PMA.
Geochemistry
A substantial effort is needed to bring the mine into conformity with international best practices of data
collection, management, and geochemical characterization. Implementation of a more comprehensive
data collection and management program will form the quantitative basis for understanding the current
status, forecasting future impacts, and designing concurrent and post-closure mitigation measures to
minimize environmental impacts.
25.8 Projected Economic Outcomes
The cash flow valuation of the Marmato Project indicate that the Project has an after-tax Net Present
Value (NPV) of approximately US$206.8 million, based on a 5% discount rate, gold price of
US$1,300/oz and silver price of US$17.00/oz. The operation is projected to have negative cash flows
during the years 2021 and 2022, when the MDZ is installed, with payback for the expansion expected
by 2026. Life of mine is projected to end in 2038 resulting in a total production of 2.18 million ouces of
gold and 1.82 million ounces of silver in the form of doré bars containing both precious metals.
Indicative economic results are presented in Table 25-1.

SRK Consulting (U.S.), Inc. NI 43-101 Technical Report – Marmato Project Page 305
MMS/KD Marmato_PEA_NI43-101_544400.020_Rev31_KD.docx November 2019
Table 25-1: Marmato Indicative Economic Results
LoM Cash Flow
Gold Price USD/oz 1,300
Silver Price USD/oz 17.00
Total Revenue USD 2,851,475,063
Mining Cost USD (934,068,009)
Processing Cost USD (424,007,603)
G&A Cost USD (137,666,667)
Total Opex USD (1,495,742,278)
Operating Margin USD 1,355,732,785
Operating Margin Ratio % 48%
Taxes Paid USD (195,035,875)
Free Cashflow USD 717,096,368
LoM Capital
Expansion CAPEX USD (268,884,037)
Sustaining CAPEX USD (181,264,836)
Total LOM CAPEX USD (450,148,872)
Before Tax
Free Cash Flow USD 643,248,206
NPV @ 5% USD 322,995,835
NPV @ 8% USD 214,836,234
NPV @ 10% USD 163,296,934
IRR % 28%
After Tax
Free Cash Flow USD 448,212,331
NPV @ 5% USD 206,821,360
NPV @ 8% USD 126,595,938
NPV @ 10% USD 88,893,940
IRR % 20%
Payback Year 2026
Source: SRK, 2019
The Project is a gold operation with a sub-product of silver, where gold represents 99% of the total
projected revenue and silver the remaining 1%. The underground mining cost is the heaviest burden
on the operation representing 63% of the operating cost, while processing costs represent 28% and
G&A costs the remaining 9%.
The estimated All-in Sustaining Costs (AISC), including sustaining capital, is US$882/Au-oz.
25.9 Foreseeable Impacts of Risks
25.9.1 Water Supply
The water balance indicates that adequate water supply is available from the underground dewatering
flows and additional water supply will be available from contact water runoff and seepage flows from
the DSTF. However, the contact water supply will be erratic and uncertain and should not considered
a reliable water supply. The underground dewatering flows represent a single source for a reliable
water supply and a backup supply is recommended. Either sufficient water storage to span a
foreseeable shut-down period of the underground dewatering system or a secondary water supply
from the nearby Cauca River is recommended to ensure adequate water supply for the Project.
The water balance of the Project indicated that both contact water from the DSTF and underground
dewatering flows are likely to exceed the makeup requirements at the processing plant at certain times

SRK Consulting (U.S.), Inc. NI 43-101 Technical Report – Marmato Project Page 306
MMS/KD Marmato_PEA_NI43-101_544400.020_Rev31_KD.docx November 2019
in the LoM. Discharges from both water sources are expected and should be addressed with
appropriate discharge structures as part of general infrastructure. Additionally, discharges of contact
water should be monitored to ensure environmental compliance is maintained.
25.9.2 Mining
Upper Area
The mine plan for the Veins area is based on economic areas above a CoG. This grade is higher than
the as-mined reported grade from Marmato due to factors such as Marmato mining outside of planned
areas, mining marginal areas below the CoG and uncontrolled dilution.
The Level 21 represents a new mining method for Marmato and carries risks and uncertainties.
Marmato will likely require a ramp up period to take full advantage of the bulk mining from this area.
25.9.3 Infrastructure
The infrastructure for the existing Project is mature and functioning. There are no significant additions
required for the existing Project to operate other than the potential to supplement the water supply.
The following risks are identified with respect to new DSTFs:
• Filter Plant – It is currently envisioned that a filter plant will be installed and will achieve a
tailings moisture content of around 15% by weight. If a filter plant is not installed, or if the target
moisture content is not achieved, management of the tailings and amendment with cement
may require more extensive and expensive handling than is currently envisioned.
• Seepage – Stormwater runon diversion, diligent stormwater runoff management, and
subdrains are required to minimize infiltration into the DSTF, minimize the potential for seeps
or springs to affect the DSTF foundation, and prevent the generation of an elevated phreatic
surface that could impact DSTF mass stability.
• Elevated Groundwater – Groundwater elevations beneath the conceptual DSTF footprints
have not been determined and may affect the design and extents of the subdrain system and
the shear strength of foundation soils.
• Slope Stability – The potential for seismic loading, saturated foundations, foundation brittle
failure, and unsatisfactory foundation conditions (weak soils) should be investigated and
analyzed in future design phases.
• Erosion – The conceptual outer slopes of the DSTF are necessarily relatively steep at 2H:1V
to maximize DSTF capacity in the steep natural terrain and will require rock cladding, cover
soil placement and revegetation to prevent erosion.
• Geochemical Stability - The geochemical characteristics of the tailings, waste rock and
potential borrow sources have not been established and may alter assumptions with respect
to the necessity of a base liner, the availability and cost of a suitable borrow source, and the
requirements to either treat or discharge contact stormwater and seepage.
• Land Position/Land Ownership – SRK completed an analysis of approximately eight potential
DSTF sites within the current project boundary. There are no suitable sites available for
development that do not cross ephemeral or perennial streams within the current landholding.
A determination as to the ability to permit DSTF facilities across one of these drainage
channels must be made and may require acquisition of additional landholdings in more
permittable terrain.

SRK Consulting (U.S.), Inc. NI 43-101 Technical Report – Marmato Project Page 307
MMS/KD Marmato_PEA_NI43-101_544400.020_Rev31_KD.docx November 2019
• Access and Haul Roads – To minimize potential impacts of hauling and facility access on
nearby communities, SRK prepared conceptual alignments and grading plans for haul and
access roads associated with new DSTF areas. The ability to permit and construct these roads
in the steep terrain at the site across existing perennial and ephemeral drainages, and the
ability to manage stormwater flows that may intersect the road alignments, has yet to be
determined and may significantly affect the estimated PEA costs associated with these
structures.
• Rate-of-Rise – The ability to amend, place and compact tailings in the narrow natural
drainages at the site will result in a relatively high initial rate-of-rise which may inhibit the
dissipation of porewater pressure and affect the overall stability of the DSTF during early
phases. Additional study is required to determine the potential impacts to DSTF operation, but
additional management and associated operating costs may be required.
• Climate (rainy season) – The ability to amend, place and compact tailings during the rainy
season may be curtailed. In addition, management of stormwater contacting exposed tailings
is assumed to require management and routing through the process with subsequent water
treatment prior to discharge. Additional characterization and discussions with permitting
agencies is required to determine the ultimate management requirements for contact water.
• Material balance – it is currently assumed that a sufficient quantity of suitable waste rock or
local borrow material is available for rock starter embankment construction and outer slope
cladding. If waste rock or local borrow cannot be supplied when required to meet demand,
additional more expensive and distant borrow sources may be required.
• Permitting – It is currently assumed that the DSTFs can be placed on prepared native
subgrade without a geomembrane or imported compacted clay liner, and that non-contact
stormwater captured upstream from the TSF or running off the closed outer faces of the DSTFs
can be discharged into natural drainages downstream from the DSTFs. It is also assumed that
subdrains could be utilized to adequately manage water from existing seeps, springs, or
groundwater within natural drainages under the DSTFs. The ability to permit new unlined
DSTFs in existing natural drainages with perennial surface expressions of water of any kind
has yet to be established and may affect the final location and cost of design, construction and
operation of the DSTFs in later design phases.

SRK Consulting (U.S.), Inc. NI 43-101 Technical Report – Marmato Project Page 308
MMS/KD Marmato_PEA_NI43-101_544400.020_Rev31_KD.docx November 2019
26 Recommendations
26.1 Recommended Work Programs and Costs
The Project requires a PFS level design effort to complete tradeoff studies and further evaluate the
feasibility and viability of the Project.
26.1.1 Mineral Resources
SRK is currently working with GCM’s geologists to optimize the remainder of the 2019 drilling program,
with a focus on increasing the confidence in the MDZ. The technical studies will aim to infill the drilling
spacing to a 50 by 50 m grid in the upper portions of the MDZ, and potentially increase the Inferred
Resources at the end. SRK is also working on a number of engineering studies to support the future
development of potential maiden Mineral Reserves for the Project. SRK anticipates the drilling to be
completed during Q4 2019 with an updated Mineral Resource produced during the same time period.
Additional on-going recommendations for the Mineral Resource studies on this project, to be done
prior to the PFS, should include:
• A detailed review of the vein model with GCM geologists to ensure continuity is suitably
modelled;
• Review of the capping sensitivity used in the veins to ensure grades match the current mine
plans on the lower levels of the mines, as GCM reported lower grades during recent months,
but this could also be a function of dilution, which will also need to be addressed;
• It is recommended that GCM develop a system to flag channel samples in the database taken
from the working stopes (vein channels), compared to more detailed exploration channel
samples taken from cross-cuts and exploration development where possible. Any updates in
the database will need to be completed prior to the PFS update, and SRK will work with the
geological team to ensure the best solution can be found in the time available. The aim will
be to identify areas for potential mining targets to provide additional feed to the current
operation and plant;
• Continual monitoring of the MDZ drilling program with regular updates on the Leapfrog Model;
• SRK also recommends a structural review of the controlling mineralization at depth to support
the PFS; and
• Comments by Richard H. Sillitoe: The conclusion that the 500 m long, west-northwest-striking
Lower Zone orebody is entirely controlled by a veinlet array developed during dextral
transpression raises the possibility that one or more look-alike deposits could be present
elsewhere within the 6 km by 5 km P1 stock. They could be exposed at lower elevations than
Marmato (say, less than 900 masl) as a result of greater degrees of erosion or, as in the case
of the Lower Zone itself, remain concealed beneath and partly overprinted by a swarm of
‘epithermal’ massive base-metal sulfide veins. Either possibility would represent an attractive
exploration opportunity, which it is considered worth pursuing. SRK considers this an important
consider for future exploration on completion of the current drilling program.
26.1.2 Geotechnical
The current geotechnical design parameters are based on characterization data from 35 diamond
drillholes, for which six were drilled deep in the orebody. The following recommendations are made

SRK Consulting (U.S.), Inc. NI 43-101 Technical Report – Marmato Project Page 309
MMS/KD Marmato_PEA_NI43-101_544400.020_Rev31_KD.docx November 2019
with respect geotechnical issues regarding the Marmato Project as the design advances to the next
level:
• Complete the geotechnical drilling program for the deep deposit (ongoing);
• Complete an hydrogeological investigation (ongoing);
• Prepare a numerical hydrogeological model;
• Prepare a major structural model;
• Integrate the exploration geotechnical investigation and the Operational geotechnical data
collection (consolidate a unique geotechnical model)
• Conduct mine induced strength measurements;
• Conduct a 3D numerical model to understand the long-term mine stability;
• Estimate the back filling strength specifications;
• Re- evaluate the stope dimensions;
• Estimate surface subsidence magnitude and effect of mining in upper levels and infrastructure;
• Complete a hydrogeologic study for estimating pore pressures and possible inflow to new
deeper levels; and
• Implement monitoring system (surface and micro seismic).
26.1.3 Tailings Management Facilities
During the next phase of study, the DSTF footprints need to be finalized and detailed characterization
of the proposed DSTF foundations and the tailings material itself needs to be completed, in addition
to identifying and testing a suitable borrow source for rock starter embankment construction and outer
slope cladding for erosion protection. GCM is currently contracting for a new aerial survey to facilitate
final DTSF siting and identification of borrow sources for construction. The ability to filter the tailings
and achieve a target moisture content of about 15% by weight must also be established. The depth to
groundwater and the source(s) of perennial water within each DSTF footprint must be determined, and
the ability to permit the DSTFs without a base liner in natural drainages at the site must be established.
26.1.4 Mining
SRK recommends that the following areas be reviewed during the next phase of work:
• Review drift sizes to optimize and minimize waste movement;
• Review and refine the development required during the pre-production period to minimize cost
and maximize faces available for development;
• Detailed sequencing of development and pre-production activities;
• Review the mine ventilation to optimize the system. This should include reviewing the impact of
utilizing more electric powered equipment to reduce ventilation needs;
• Review costs, productivities, and PEA assumptions to reduce cost, optimize sizing, and reduce
upfront time to production;
• Provide geotechnical and hydrogeological analysis of the decline and ventilation raise areas;
• Review the truck haulage system to see if there is a more cost effective method or options to
reduce cost;
• Refine the backfill quantities, material characteristics, and placement scheme to optimize the
system and confirm PEA assumptions. This should include testwork to determine paste makeup
and strength;

SRK Consulting (U.S.), Inc. NI 43-101 Technical Report – Marmato Project Page 310
MMS/KD Marmato_PEA_NI43-101_544400.020_Rev31_KD.docx November 2019
• Perform geotechnical analysis and numerical models confirm geotechnical assumptions; and
• Optimization of the production schedule by delaying development to an as-needed basis.
26.1.5 Metallurgy and Mineral Processing
Additional metallurgical studies will need to be conducted during the next phase of study. This work
has commenced and is being done at SGS Canada. This work is being conducted on master
composites and variability composites that are reprensentative of the MDZ. These studies are directed
at optimizing process parameters for the selected process flowsheet and establish the process design
criteria for the process plant. The next phase of metallurgical testing is estimated to cost about
US$250,000.
26.1.6 Recovery Methods
During the next phase of study, process plant engineering and design will need to be conducted by a
qualified engineering design based on process design criteria developed during the metallurgical
program. This work has commenced and is being conducted by Ausenco. Process engineering and
design will be conducted to a level of detail that will support capital and operating cost estimates at a
+/-25% level of accuracy. It is estimated that prefeasibility level process engineering and design will
cost US$250,00 to US$300,000.
26.1.7 Infrastructure
GCM is currently working on retaining a third party engineering firm for completion of PFS level
infrastructure engineering. GCM has estimated that a third party firm will be selected and contracted
by the end of 2019.
26.1.8 Hydrogeology
Based on the current understanding of hydrogeological conditions, the minimum data set will be
needed to meet a PFS-level hydrogeological analysis, SRK recommends the following work plan:
• Verify the field status of the 2012 piezometers presented in Table 16-7 and conduct a detailed
QA/QC of the hydraulic tests performed in 2012. Based on the verification findings, a detailed
work plan will be designed. The following preliminary tasks are strongly recommended:
o Conduct short-term hydraulic tests (airlift test, slug test constant head test, etc.) in the
available standpipe piezometers.
o Conduct shutdown tests in the piezometers located La Macha Tank (Level 17).
o Construct multiple VWP and/or standpipe piezometers upstream and low stream of
planned underground mine (proposed Hydro 001 and 002).
o Hydraulic testing of three NQ exploration/geotechnical holes from Level 21, (packer tests,
flow/shut-in testing if flowing conditions or slug testing if water level is below underground
developments) with a bottom target from 421 to 635 m amsl (boreholes SRK 3, SRK 13
and SRK 16).
o Install piezometers/monitoring wells in three geotechnical holes (SRK 13 and SRK 16) for
water level measurements (string of vibrating wire piezometers, VWPs, to define vertical
hydraulic gradient or install pressure transducers in standpipes).
o Install two deep-VWP targeting potential structures with connection to the Cauca river.
(Hydro 3 Hydro 4).

SRK Consulting (U.S.), Inc. NI 43-101 Technical Report – Marmato Project Page 311
MMS/KD Marmato_PEA_NI43-101_544400.020_Rev31_KD.docx November 2019
o Collecting groundwater samples in proposed piezometers.
• Continue monitor flow (total, from different levels). Surveying underground developments by
collecting groundwater seepage rates, seepage-water strike elevations and water quality data.
Figure 16-28 shows the location of the proposed piezometers.
26.1.9 Environmental Studies and Permitting
The following recommendations are made with respect to environmental, permitting and social issues
regarding the Marmato Project:
• Prepare a more detailed site-wide closure plan from which a more accurate final closure cost
estimate can be developed. This should include things like: equipment inventories; building
inventories (with limited design details), portal and vent plugging details and conceptual
designs, tec. This plan and cost estimate would require annual reviews and updates in order
to capture the latest configurations and conditions at the mine site(s) and processing facilities.
• Insufficient work has been undertaken on groundwater hydrogeology and surface water to
establish the true level of risk associated with potential groundwater contamination and
underground dewatering impacts. A detailed evaluation, including a groundwater model, could
provide information that would assist in forecasts of post-closure mine water discharge and
possible treatment requirements. Such an investigation could also provide vital information on
underground geotechnical stability, both during operations and post closure.
• There is an apparent shortage of geochemical characterization data. Without an
understanding of the scope of previous investigations (i.e., Knight Piésold investigations),
further work will be required for the PFS level, including ARDML characterization of future
waste rock, underground wall rock, and tailings designated for backfill or disposal to the TSF.
The water quality of dewatering effluent must be well characterized in the event that treatment
is needed before it is used or discharged. A forecast of closure water quality is needed.
• Detailed characterization of the future backfill tailings is needed to resolve the conflicting
information regarding their geochemical properties.
• Additional work is recommended to confirm groundwater and surface water quality in the mine
area and enhance the data collection network through installation of water quality monitoring
wells, and establishment of a periodic underground water quality monitoring program.
• The regulation prohibiting surface waste rock disposal should be further investigated. Although
the volume of waste rock brought to the surface is expected to be relatively small, the
regulation could represent a hindrance to operations unless a variance can be obtained.
• Co-disposal of acid-generating waste rock in the TSF should be evaluated in further detail.
• Characterization work should be completed on artisanal tailings and waste rock to understand
their ARDML potential and devise a management plan.
• A comprehensive baseline surface and groundwater sampling program will be important to
establish the baseline condition and try to quantify the contributions from artisanal or pre-
mining conditions, especially with respect to mercury from artisanal mining.
Substantial financial resources and technical specialist support will be required to implement the
environmental monitoring and mitigation measures likely to be presented in the updated PMA for the
expansion project.

SRK Consulting (U.S.), Inc. NI 43-101 Technical Report – Marmato Project Page 312
MMS/KD Marmato_PEA_NI43-101_544400.020_Rev31_KD.docx November 2019
26.1.10 Project Economics
The following recommendations are made with respect to capital and operating cost and economic
evaluation of the Marmato Project:
• Prepare first principles estimate of capital and operating costs with enough accuracy to
support a future PFS study of the project, including:
o Capital estimates and expenditure schedule based on basic engineering;
o Prepare cash flow model based on shorter periods of production;
o Further detail site-specific operating cost data and cost models to include fixed and
variable nature of costs and detail cost models to include breakdown by area and
function; and
o Improve cost models to include currencies used to estimate each cost and prepare
sensitivity to currencies variability.
• Preliminary economic valuations performed for the PEA indicate that the project could be
further optimized, SRK recommends that an optimization of the valuation is performed through
a series of trade-off studies during the PFS study.
26.1.11 Costs
The recommended work outlined here is targeted at the completion of a PFS for the project. The
estimated costs are outlined in Table 26-1 below.
Table 26-1: Summary of Costs for Recommended Work
Recommended Work Cost Estimate
(US$)
Complete infill drilling program to approximate 50x50 m spacing $1.7 million
Process PFS level design and metallurgical test programs. $0.6 million
Infrastructure PFs design program $0.1 million
NI 43-101 Compliant PFS report work program including geology, mining, hydrogeology, tailings and economics work programs
$1.8 million
Total $4.2 million

SRK Consulting (U.S.), Inc. NI 43-101 Technical Report – Marmato Project Page 313
MMS/KD Marmato_PEA_NI43-101_544400.020_Rev31_KD.docx November 2019
27 References Barton, N.R.; Lien, R. & Lunde, J. (1974). Engineering Classification of Rock Masses for the Design
of Tunnel Support, Rock Mech. 6(4) pp. 189-230.
CIM (2014). Canadian Institute of Mining, Metallurgy and Petroleum Standards on Mineral Resources
and Reserves: Definitions and Guidelines, May 10, 2014.
Colombia Goldfields Limited (CG, No Date. Estudio de Linea Base Ambiental Area de Interes del
Proyecto Minero Ambiental en el Municipio de Marmato, Departamento de Caldas.
Golder, (1990). Guidelines for use of the Scaled Span Method for Surface Crown Pillar Stability
Assessment, T.G. Carter, Golder Associates.
Hatch, (2012). Gran Colombia Gold Corp. - Marmato Gold Project - Option Studies Report, Section 21
- Environment Considerations and Overview (GCG) September 2012.
Hutchinson, J.D. & Diederichs, M.S. (1996). Cablebolting in Underground Mines, BiTech Publishers
Ltd, Richmond, Canada, 401 pp.
IDEAM, (2013). Aguas Subterraneas en Colombia: Una Vision General, Instituto de Hidrología,
Meteorología y Estudios Ambientales de Colombia, Bogota D.C., 2013.
Knight Piésold, (2012). Gran Colombia Gold Corp. Marmato Project Pre-Feasibility Study
Climatological Data Analysis Report. Jan 30, 2012.
Knight Piésold Consulting, (2012a). Marmato Mine, Pre-Feasibility Study Hydrogeology Report, April
12, 2012.
Lunder, P.J. & Pakalnis, R.C. (1997). Determination Of The Strength Of Hard-Rock Mine Pillars. Bull.
Can. bst. Min. Metall., 90(1013): 51-55.
Marmato Project, Department of Caldas, Republic of Colombia, March 5.
Mathews, K.E.; Hoek, E.; Wyllie, D.C. & Stewart, S.B.V. (1981).Prediction Of Stable Excavations For
Mining At Depth Below 1000 Meters In Hard Rock. CANMET Report DSS Serial No. OSQ80-
00081, DSS File No. 17SQ.23440-0-9020. Ottawa: Dept. Energy, Mines and Resources.
NRCS, (1986). U.S. Department of Agriculture, Natural Resources Conservation Service, Urban
Hydrology for Small Watersheds Technical Release 55, June 1986).
Paknalis, R. (2002). Empirical Design Methods – UBC Geomechanics an Update. NARMS-TAC Conf.
U of Toronto (ISBN 0 7727 6708 4).
Potvin, Y. (1988). Empirical Open Stope Design in Canada. PhD. Thesis, Dept. Mining and Mineral
Processing, University of British Columbia.
Reglamento de Suguridad en Las Labores Mineras Subterraneas, Decreto 1886 del 21 de Septembre
de 2015.
SGS Canada, (2019). The Recovery of Gold From Marmato Deposit Samples, Project 13387-01 Final
Report, April 16,2019.
Scott E. Wilson Consulting Inc. (Wilson) (2010). Technical Report, Modero Resources Ltd.

SRK Consulting (U.S.), Inc. NI 43-101 Technical Report – Marmato Project Page 314
MMS/KD Marmato_PEA_NI43-101_544400.020_Rev31_KD.docx November 2019
Sillitoe Richard H. (2019). Further Geological Observations On The Lower Zone Gold Deposit At
Marmato, Colombia, July 2019.

SRK Consulting (U.S.), Inc. NI 43-101 Technical Report – Marmato Project Page 315
MMS/KD Marmato_PEA_NI43-101_544400.020_Rev31_KD.docx November 2019
28 Glossary The Mineral Resources and Mineral Reserves have been classified according to CIM (CIM, 2014).
Accordingly, the Resources have been classified as Measured, Indicated or Inferred, the Reserves
have been classified as Proven, and Probable based on the Measured and Indicated Resources as
defined below.
28.1 Mineral Resources
A Mineral Resource is a concentration or occurrence of solid material of economic interest in or on
the Earth’s crust in such form, grade or quality and quantity that there are reasonable prospects for
eventual economic extraction. The location, quantity, grade or quality, continuity and other geological
characteristics of a Mineral Resource are known, estimated or interpreted from specific geological
evidence and knowledge, including sampling.
An Inferred Mineral Resource is that part of a Mineral Resource for which quantity and grade or
quality are estimated on the basis of limited geological evidence and sampling. Geological evidence
is sufficient to imply but not verify geological and grade or quality continuity. An Inferred Mineral
Resource has a lower level of confidence than that applying to an Indicated Mineral Resource and
must not be converted to a Mineral Reserve. It is reasonably expected that the majority of Inferred
Mineral Resources could be upgraded to Indicated Mineral Resources with continued exploration.
An Indicated Mineral Resource is that part of a Mineral Resource for which quantity, grade or quality,
densities, shape and physical characteristics are estimated with sufficient confidence to allow the
application of Modifying Factors in sufficient detail to support mine planning and evaluation of the
economic viability of the deposit. Geological evidence is derived from adequately detailed and reliable
exploration, sampling and testing and is sufficient to assume geological and grade or quality continuity
between points of observation. An Indicated Mineral Resource has a lower level of confidence than
that applying to a Measured Mineral Resource and may only be converted to a Probable Mineral
Reserve.
A Measured Mineral Resource is that part of a Mineral Resource for which quantity, grade or quality,
densities, shape, and physical characteristics are estimated with confidence sufficient to allow the
application of Modifying Factors to support detailed mine planning and final evaluation of the economic
viability of the deposit. Geological evidence is derived from detailed and reliable exploration, sampling
and testing and is sufficient to confirm geological and grade or quality continuity between points of
observation. A Measured Mineral Resource has a higher level of confidence than that applying to
either an Indicated Mineral Resource or an Inferred Mineral Resource. It may be converted to a Proven
Mineral Reserve or to a Probable Mineral Reserve.
28.2 Mineral Reserves
A Mineral Reserve is the economically mineable part of a Measured and/or Indicated Mineral
Resource. It includes diluting materials and allowances for losses, which may occur when the material
is mined or extracted and is defined by studies at Pre-Feasibility or Feasibility level as appropriate that
include application of Modifying Factors. Such studies demonstrate that, at the time of reporting,
extraction could reasonably be justified.

SRK Consulting (U.S.), Inc. NI 43-101 Technical Report – Marmato Project Page 316
MMS/KD Marmato_PEA_NI43-101_544400.020_Rev31_KD.docx November 2019
The reference point at which Mineral Reserves are defined, usually the point where the ore is delivered
to the processing plant, must be stated. It is important that, in all situations where the reference point
is different, such as for a saleable product, a clarifying statement is included to ensure that the reader
is fully informed as to what is being reported. The public disclosure of a Mineral Reserve must be
demonstrated by a Pre-Feasibility Study or Feasibility Study.
A Probable Mineral Reserve is the economically mineable part of an Indicated, and in some
circumstances, a Measured Mineral Resource. The confidence in the Modifying Factors applying to a
Probable Mineral Reserve is lower than that applying to a Proven Mineral Reserve.
A Proven Mineral Reserve is the economically mineable part of a Measured Mineral Resource. A
Proven Mineral Reserve implies a high degree of confidence in the Modifying Factors.
28.3 Definition of Terms
The following general mining terms may be used in this report.
Table 28-1: Definition of Terms
Term Definition
Assay The chemical analysis of mineral samples to determine the metal content.
Capital Expenditure All other expenditures not classified as operating costs.
Composite Combining more than one sample result to give an average result over a larger distance.
Concentrate A metal-rich product resulting from a mineral enrichment process such as gravity concentration or flotation, in which most of the desired mineral has been separated from the waste material in the ore.
Crushing Initial process of reducing ore particle size to render it more amenable for further processing.
Cut-off Grade (CoG) The grade of mineralized rock, which determines as to whether or not it is economic to recover its gold content by further concentration.
Dilution Waste, which is unavoidably mined with ore.
Dip Angle of inclination of a geological feature/rock from the horizontal.
Fault The surface of a fracture along which movement has occurred.
Footwall The underlying side of an orebody or stope.
Gangue Non-valuable components of the ore.
Grade The measure of concentration of gold within mineralized rock.
Hangingwall The overlying side of an orebody or slope.
Haulage A horizontal underground excavation which is used to transport mined ore.
Hydrocyclone A process whereby material is graded according to size by exploiting centrifugal forces of particulate materials.
Igneous Primary crystalline rock formed by the solidification of magma.
Kriging An interpolation method of assigning values from samples to blocks that minimizes the estimation error.
Level Horizontal tunnel the primary purpose is the transportation of personnel and materials.
Lithological Geological description pertaining to different rock types.
LoM Plans Life-of-Mine plans.
LRP Long Range Plan.
Material Properties Mine properties.
Milling A general term used to describe the process in which the ore is crushed and ground and subjected to physical or chemical treatment to extract the valuable metals to a concentrate or finished product.
Mineral/Mining Lease A lease area for which mineral rights are held.
Mining Assets The Material Properties and Significant Exploration Properties.
Ongoing Capital Capital estimates of a routine nature, which is necessary for sustaining operations.
Ore Reserve See Mineral Reserve.

SRK Consulting (U.S.), Inc. NI 43-101 Technical Report – Marmato Project Page 317
MMS/KD Marmato_PEA_NI43-101_544400.020_Rev31_KD.docx November 2019
Term Definition
Pillar Rock left behind to help support the excavations in an underground mine.
RoM Run-of-Mine.
Sedimentary Pertaining to rocks formed by the accumulation of sediments, formed by the erosion of other rocks.
Shaft An opening cut downwards from the surface for transporting personnel, equipment, supplies, ore and waste.
Sill A thin, tabular, horizontal to sub-horizontal body of igneous rock formed by the injection of magma into planar zones of weakness.
Smelting A high temperature pyrometallurgical operation conducted in a furnace, in which the valuable metal is collected to a molten matte or doré phase and separated from the gangue components that accumulate in a less dense molten slag phase.
Stope Underground void created by mining.
Stratigraphy The study of stratified rocks in terms of time and space.
Strike Direction of line formed by the intersection of strata surfaces with the horizontal plane, always perpendicular to the dip direction.
Sulfide A sulfur bearing mineral.
Tailings Finely ground waste rock from which valuable minerals or metals have been extracted.
Thickening The process of concentrating solid particles in suspension.
Total Expenditure All expenditures including those of an operating and capital nature.
Variogram A statistical representation of the characteristics (usually grade).
28.4 Abbreviations
The following abbreviations may be used in this report.
Table 28-2: Abbreviations
Abbreviation Unit or Term
A ampere
AA atomic absorption
A/m2 amperes per square meter
ANFO ammonium nitrate fuel oil
Ag silver
Au gold
AuEq gold equivalent grade
°C degrees Centigrade
CCD counter-current decantation
CIL carbon-in-leach
CoG cut-off grade
cm centimeter
cm2 square centimeter
cm3 cubic centimeter
cfm cubic feet per minute
ConfC confidence code
CRec core recovery
CSS closed-side setting
CTW calculated true width
° degree (degrees)
dia. diameter
EIS Environmental Impact Statement
EMP Environmental Management Plan
FA fire assay
ft foot (feet)
ft2 square foot (feet)
ft3 cubic foot (feet)
g gram

SRK Consulting (U.S.), Inc. NI 43-101 Technical Report – Marmato Project Page 318
MMS/KD Marmato_PEA_NI43-101_544400.020_Rev31_KD.docx November 2019
Abbreviation Unit or Term
gal gallon
g/L gram per liter
g-mol gram-mole
gpm gallons per minute
g/t grams per tonne
ha hectares
HDPE Height Density Polyethylene
hp horsepower
HTW horizontal true width
ICP induced couple plasma
ID2 inverse-distance squared
ID3 inverse-distance cubed
IFC International Finance Corporation
ILS Intermediate Leach Solution
kA kiloamperes
kg kilograms
km kilometer
km2 square kilometer
koz thousand troy ounce
kt thousand tonnes
kt/d thousand tonnes per day
kt/y thousand tonnes per year
kV kilovolt
kW kilowatt
kWh kilowatt-hour
kWh/t kilowatt-hour per metric tonne
L liter
L/sec liters per second
L/sec/m liters per second per meter
lb pound
LHD Long-Haul Dump truck
LLDDP Linear Low Density Polyethylene Plastic
LOI Loss On Ignition
LoM Life-of-Mine
m meter
m2 square meter
m3 cubic meter
masl meters above sea level
MARN Ministry of the Environment and Natural Resources
MDA Mine Development Associates
mg/L milligrams/liter
mm millimeter
mm2 square millimeter
mm3 cubic millimeter
MME Mine & Mill Engineering
Moz million troy ounces
Mt million tonnes
MTW measured true width
MW million watts
m.y. million years
NGO non-governmental organization
NI 43-101 Canadian National Instrument 43-101
OSC Ontario Securities Commission
oz troy ounce
% percent
PLC Programmable Logic Controller
PLS Pregnant Leach Solution
PMF probable maximum flood
ppb parts per billion

SRK Consulting (U.S.), Inc. NI 43-101 Technical Report – Marmato Project Page 319
MMS/KD Marmato_PEA_NI43-101_544400.020_Rev31_KD.docx November 2019
Abbreviation Unit or Term
ppm parts per million
QA/QC Quality Assurance/Quality Control
RC rotary circulation drilling
RoM Run-of-Mine
RQD Rock Quality Description
SEC U.S. Securities & Exchange Commission
sec second
SG specific gravity
SPT standard penetration testing
st short ton (2,000 pounds)
t tonne (metric ton) (2,204.6 pounds)
t/h tonnes per hour
tpd tonnes per day
t/y tonnes per year
TSF tailings storage facility
TSP total suspended particulates
µm micron or microns
V volts
VFD variable frequency drive
W watt
XRD x-ray diffraction
y year

SRK Consulting (U.S.), Inc. NI 43-101 Technical Report – Marmato Appendices
MMS/KD Marmato_PEA_NI43-101_544400.020_Rev31_KD.docx November 2019
Appendices

SRK Consulting (U.S.), Inc. NI 43-101 Technical Report – Marmato Appendices
MMS/KD Marmato_PEA_NI43-101_544400.020_Rev31_KD.docx November 2019
Appendix A: Certificates of Qualified Persons

SRK Consulting (U.S.), Inc.
Suite 600
1125 Seventeenth Street
Denver, CO 80202
T: 303.985.1333
F: 303.985.9947
www.srk.com
U.S. Offices:
Anchorage 907.677.3520
Clovis 559.452.0182
Denver 303.985.1333
Elko 775.753.4151
Fort Collins 970.407.8302
Reno 775.828.6800
Tucson 520.544.3688
Canadian Offices:
Saskatoon 306.955.4778
Sudbury 705.682.3270
Toronto 416.601.1445
Vancouver 604.681.4196
Yellowknife 867.873.8670
Group Offices:
Africa
Asia
Australia
Europe
North America
South America
CERTIFICATE OF QUALIFIED PERSON
I, David Bird, MSc., PG, RM-SME, do hereby certify that:
1. I am Associate Principal Consultant (Geochemistry) of SRK Consulting (U.S.), Inc., 1125 Seventeenth Street, Suite 600, Denver, CO, USA, 80202.
2. This certificate applies to the technical report titled “NI 43-101 Technical Report, Preliminary Economic Assessment, Marmato Project, Colombia” with an Effective Date of July 31, 2019 (the “Technical Report”).
3. I graduated with Bachelor’s Degrees in Geology and Business Administration Management from Oregon State University in 1983. In addition, I obtained a Master’s Degree in Geochemistry/Hydrogeology from the University of Nevada-Reno in 1993. I am a Registered Member of the Society for Mining, Metallurgy, and Exploration (SME). I am a certified Professional Geologist in the State of Oregon (G1438). I have worked full time as a Geologist and Geochemist for a total of 32 years. My relevant experience includes design, execution, and interpretation of mine waste geochemical characterization programs in support of open pit and underground mine planning and environmental impact assessments, design and supervision of water quality sampling and monitoring programs, geochemical modeling, and management of the geochemistry portion of numerous PEA, PFS and FS-level mine projects in the US and abroad.
4. I have read the definition of “qualified person” set out in National Instrument 43-101 (NI 43-101) and certify that by reason of my education, affiliation with a professional association (as defined in NI 43-101) and past relevant work experience, I fulfill the requirements to be a “qualified person” for the purposes of NI 43-101.
5. I have not visited the Marmato property.
6. I am responsible for Geochemistry Section 20.1.6. and portions of Sections 1, 24, 25 and 26.
7. I am independent of the issuer applying all of the tests in section 1.5 of NI 43-101.
8. I have not had prior involvement with the property that is the subject of the Technical Report.
9. I have read NI 43-101 and Form 43-101F1 and the sections of the Technical Report I am responsible for have been prepared in compliance with that instrument and form.
10. As of the aforementioned Effective Date, to the best of my knowledge, information and belief, the sections of the Technical Report I am responsible for contains all scientific and technical information that is required to be disclosed to make the Technical Report not misleading.
Dated this 27th Day of November, 2019.
“Signed”
________________________________ “Sealed”
David Bird, MSc, PG, RM-SME

SRK Consulting (U.S.), Inc.
Suite 600
1125 Seventeenth Street
Denver, CO 80202
T: 303.985.1333
F: 303.985.9947
www.srk.com
U.S. Offices:
Anchorage 907.677.3520
Clovis 559.452.0182
Denver 303.985.1333
Elko 775.753.4151
Fort Collins 970.407.8302
Reno 775.828.6800
Tucson 520.544.3688
Canadian Offices:
Saskatoon 306.955.4778
Sudbury 705.682.3270
Toronto 416.601.1445
Vancouver 604.681.4196
Yellowknife 867.873.8670
Group Offices:
Africa
Asia
Australia
Europe
North America
South America
CERTIFICATE OF QUALIFIED PERSON
I, David Hoekstra, BSc Civil Engineering, P.E, do hereby certify that:
1. I am Principal Consultant (Civil Engineer) of SRK Consulting (U.S.), Inc., 1125 Seventeenth Street, Suite 600, Denver, CO, USA, 80202.
2. This certificate applies to the technical report titled “NI 43-101 Technical Report, Preliminary Economic Assessment, Marmato Project, Colombia” with an Effective Date of July 31, 2019 (the “Technical Report”).
3. I graduated with a degree in Civil Engineering from Colorado State University in 1986. I am a Professional Engineer of the States of Alaska, Colorado, Montana, South Carolina, and Wyoming. I have worked as an Engineer for a total of 30 years since my graduation from university. My relevant experience includes the design and implementation of mine water management systems and storm water controls for numerous PEA, PFS, FS-level and operating mine projects in the US and abroad.
4. I have read the definition of “qualified person” set out in National Instrument 43-101 (NI 43-101) and certify that by reason of my education, affiliation with a professional association (as defined in NI 43-101) and past relevant work experience, I fulfill the requirements to be a “qualified person” for the purposes of NI 43-101.
5. I have not visited the Marmato property.
6. I am responsible for Hydrology Section 20.2.4 and portions of Sections 1, 24, 25 and 26.
7. I am independent of the issuer applying all of the tests in section 1.5 of NI 43-101.
8. I have not had prior involvement with the property that is the subject of the Technical Report.
9. I have read NI 43-101 and Form 43-101F1 and the sections of the Technical Report I am responsible for have been prepared in compliance with that instrument and form.
10. As of the aforementioned Effective Date, to the best of my knowledge, information and belief, the sections of the Technical Report I am responsible for contains all scientific and technical information that is required to be disclosed to make the Technical Report not misleading.
Dated this 27th Day of November, 2019.
“Signed”
________________________________ “Sealed”
David Hoekstra, BSc Civil Engineering, P.E.

SRK Consulting (U.S.), Inc.
Suite 600
1125 Seventeenth Street
Denver, CO 80202
T: 303.985.1333
F: 303.985.9947
www.srk.com
U.S. Offices:
Anchorage 907.677.3520
Clovis 559.452.0182
Denver 303.985.1333
Elko 775.753.4151
Fort Collins 970.407.8302
Reno 775.828.6800
Tucson 520.544.3688
Canadian Offices:
Saskatoon 306.955.4778
Sudbury 705.682.3270
Toronto 416.601.1445
Vancouver 604.681.4196
Yellowknife 867.873.8670
Group Offices:
Africa
Asia
Australia
Europe
North America
South America
CERTIFICATE OF QUALIFIED PERSON
I, Eric Olin, MSc, MBA, RM-SME do hereby certify that:
1. I am a Principal Process Metallurgist of SRK Consulting (U.S.), Inc., 1125 Seventeenth Street, Suite 600, Denver, CO, USA, 80202.
2. This certificate applies to the technical report titled “NI 43-101 Technical Report, Preliminary Economic Assessment, Marmato Project, Colombia, with an Effective Date of July 31, 2019 (the “Technical Report”).
3. I graduated with a Master of Science degree in Metallurgical Engineering from the Colorado School of Mines in 1976. I am a Registered Member of The Society for Mining, Metallurgy and Exploration, Inc. I have worked as a Metallurgist for a total of 40 years since my graduation from the Colorado School of Mines. My relevant experience includes extensive consulting, plant operations, process development, project management and research & development experience with base metals, precious metals, ferrous metals and industrial minerals. I have served as the plant superintendent for several gold and base metal mining operations. Additionally, I have been involved with numerous third-party due diligence audits, and preparation of project conceptual, pre-feasibility and full-feasibility studies.
4. I have read the definition of “qualified person” set out in National Instrument 43-101 (NI 43-101) and certify that by reason of my education, affiliation with a professional association (as defined in NI 43-101) and past relevant work experience, I fulfill the requirements to be a “qualified person” for the purposes of NI 43-101.
5. I have not visited the Marmato property.
6. I am responsible for the preparation of Metallurgy Sections 13 and 17 and portions of Sections 1, 24, 25 and 16 of the Technical Report.
7. I am independent of the issuer applying all of the tests in section 1.5 of NI 43-101.
8. I have not had prior involvement with the property that is the subject of the Technical Report.
9. I have read NI 43-101 and Form 43-101F1 and the sections of the Technical Report I am responsible for have been prepared in compliance with that instrument and form.
10. As of the aforementioned Effective Date, to the best of my knowledge, information and belief, the sections of the Technical Report I am responsible for contains all scientific and technical information that is required to be disclosed to make the Technical Report not misleading.
Dated this 27th Day of November, 2019.
“Signed” “Sealed”
________________________________
Eric Olin, MSc, MBA, RM-SME

SRK Consulting (U.S.), Inc.
Suite 600
1125 Seventeenth Street
Denver, CO 80202
T: 303.985.1333
F: 303.985.9947
www.srk.com
U.S. Offices:
Anchorage 907.677.3520
Clovis 559.452.0182
Denver 303.985.1333
Elko 775.753.4151
Fort Collins 970.407.8302
Reno 775.828.6800
Tucson 520.544.3688
Canadian Offices:
Saskatoon 306.955.4778
Sudbury 705.682.3270
Toronto 416.601.1445
Vancouver 604.681.4196
Yellowknife 867.873.8670
Group Offices:
Africa
Asia
Australia
Europe
North America
South America
CERTIFICATE OF QUALIFIED PERSON
I, Jeff Osborn, BEng Mining, MMSAQP do hereby certify that:
1. I am a Principal Consultant (Mining Engineer) of SRK Consulting (U.S.), Inc., 1125 Seventeenth, Suite 600, Denver, CO, USA, 80202.
2. This certificate applies to the technical report titled “NI 43-101 Technical Report, Preliminary Economic Assessment, Marmato Project, Colombia” with an Effective Date of July 31, 2019 (the “Technical Report”).
3. I graduated with a Bachelor of Science Mining Engineering degree from the Colorado School of Mines in 1986. I am a Qualified Professional (QP) Member of the Mining and Metallurgical Society of America. I have worked as a Mining Engineer for a total of 33 years since my graduation from university. My relevant experience includes responsibilities in operations, maintenance, engineering, management, mine costing, and construction activities.
4. I have read the definition of “qualified person” set out in National Instrument 43-101 (NI 43-101) and certify that by reason of my education, affiliation with a professional association (as defined in NI 43-101) and past relevant work experience, I fulfill the requirements to be a “qualified person” for the purposes of NI 43-101.
5. I visited the armato property on July 16 to July 18, 2019 for 3 days. I visited the Marmato property on August 22 and 23, 2017 for two days.
6. I am responsible for infrastructure and costing Sections 18.1, 18.2, 18.3, 18.5 and 21, and portions of Sections 1, 24, 25 and 26.
7. I am independent of the issuer applying all of the tests in section 1.5 of NI 43-101.
8. I have had prior involvement with the property that is the subject of the Technical Report. The nature of my prior involvement is contribution to the infrastructure section of the Ni 43-101 Technical Report Updated Mineral Resource Estimate Marmato Project Colombia report date November 20, 2017.
9. I have read NI 43-101 and Form 43-101F1 and the sections of the Technical Report I am responsible for have been prepared in compliance with that instrument and form.
10. As of the aforementioned Effective Date, to the best of my knowledge, information and belief, the sections of the Technical Report I am responsible for contains all scientific and technical information that is required to be disclosed to make the Technical Report not misleading.
Dated this 27th Day of November, 2019.
“Signed”
________________________________ “Sealed”
Jeff Osborn, BEng Mining, MMSAQP [01458QP] Principal Consultant (Mining Engineer)

SRK Consulting (U.S.), Inc.
Suite 600
1125 Seventeenth Street
Denver, CO 80202
T: 303.985.1333
F: 303.985.9947
www.srk.com
U.S. Offices:
Anchorage 907.677.3520
Clovis 559.452.0182
Denver 303.985.1333
Elko 775.753.4151
Fort Collins 970.407.8302
Reno 775.828.6800
Tucson 520.544.3688
Canadian Offices:
Saskatoon 306.955.4778
Sudbury 705.682.3270
Toronto 416.601.1445
Vancouver 604.681.4196
Yellowknife 867.873.8670
Group Offices:
Africa
Asia
Australia
Europe
North America
South America
CERTIFICATE OF QUALIFIED PERSON
I, Benjamin Parsons, MSc, MAusIMM (CP) do hereby certify that:
1. I am a Principal Consultant (Resource Geology) of SRK Consulting (U.S.), Inc., 1125 Seventeenth Street, Suite 600, Denver, CO, USA, 80202.
2. This certificate applies to the technical report titled “NI 43-101 Technical Report, Preliminary Economic Assessment, Marmato Project, Colombia” with an Effective Date of July 31, 2019 (the “Technical Report”).
3. I graduated with a degree in Exploration Geology from Cardiff University, UK in 1999. In addition, I have obtained a Masters degree (MSc) in Mineral Resources from Cardiff University, UK in 2000 and have worked as a geologist for a total of 16 years since my graduation from university. I am a member of the Australian Institution of Materials Mining and Metallurgy (Membership Number 222568) and I am a Chartered Professional.
4. I have read the definition of “qualified person” set out in National Instrument 43-101 (NI 43-101) and certify that by reason of my education, affiliation with a professional association (as defined in NI 43-101) and past relevant work experience, I fulfill the requirements to be a “qualified person” for the purposes of NI 43-101.
5. I visited the Marmato property on March 12, 2012 for two days, August 17, 2017 for one day and June 11, 2019 for two days.
6. I am responsible for data verification, preparation of the geologic model and mineral resource Sections 4 through 12, 14, 23 and portions of Sections 1, 24, 25 and 26
7. I am independent of the issuer applying all of the tests in section 1.5 of NI 43-101.
8. I have had prior involvement with the property that is the subject of the Technical Report. The nature of my prior involvement was in preparation of the NI43-101 Mineral Resource Estimates dated September 4, 2011, August 3, 2012, and the previous NI 43-101 Mineral Resource Estimate dated June 16, 2017 .
9. I have read NI 43-101 and Form 43-101F1 and the sections of the Technical Report I am responsible for have been prepared in compliance with that instrument and form.
10. As of the aforementioned Effective Date, to the best of my knowledge, information and belief, the sections of the Technical Report I am responsible for contains all scientific and technical information that is required to be disclosed to make the Technical Report not misleading.
Dated this 27th Day of November, 2019.
“Signed” “Sealed”
________________________________ Benjamin Parsons, MSc, MAusIMM Principal Consultant (Resource Geology)

SRK Consulting (U.S.), Inc.
Suite 600
1125 Seventeenth Street
Denver, CO 80202
T: 303.985.1333
F: 303.985.9947
www.srk.com
U.S. Offices:
Anchorage 907.677.3520
Clovis 559.452.0182
Denver 303.985.1333
Elko 775.753.4151
Fort Collins 970.407.8302
Reno 775.828.6800
Tucson 520.544.3688
Canadian Offices:
Saskatoon 306.955.4778
Sudbury 705.682.3270
Toronto 416.601.1445
Vancouver 604.681.4196
Yellowknife 867.873.8670
Group Offices:
Africa
Asia
Australia
Europe
North America
South America
CERTIFICATE OF QUALIFIED PERSON
I, Cristian A. Pereira Farias, SME-RM, do hereby certify that:
1. I am Senior Consultant (Hydrogeologist) of SRK Consulting (U.S.), Inc., 1125 Seventeenth Street, Suite 600, Denver, CO, USA, 80202.
2. This certificate applies to the technical report titled “NI 43-101 Technical Report, Preliminary Economic Assessment, Marmato Project, Colombia” with an Effective Date of July 31, 2019 (the “Technical Report”).
3. I graduated with a degree in Bachelors of Science in Geology from Universidad de Chile in 1999. I am a registered member of the Society for Mining, Metallurgy, and Exploration. I have worked as a hydrogeologist for a total of 19 years since my graduation from university. My relevant experience includes the developing conceptual and numerical hydrogeological models, the evaluation of groundwater resources, mine dewatering requirements, environmental impacts of mining, pit lake infilling, brine extraction, and pore pressure analyses.
4. I have read the definition of “qualified person” set out in National Instrument 43-101 (NI 43-101) and certify that by reason of my education, affiliation with a professional association (as defined in NI 43-101) and past relevant work experience, I fulfill the requirements to be a “qualified person” for the purposes of NI 43-101.
5. I visited the Marmato property on August 12, 2019 for two days.
6. I am responsible for Hydrogeology Sections 16.3.2 and 16.4.2. and portions of Sections 1, 24, 25 and 26.
7. I am independent of the issuer applying all of the tests in section 1.5 of NI 43-101.
8. I have not had prior involvement with the property that is the subject of the Technical Report.
9. I have read NI 43-101 and Form 43-101F1 and the sections of the Technical Report I am responsible for have been prepared in compliance with that instrument and form.
10. As of the aforementioned Effective Date, to the best of my knowledge, information and belief, the sections of the Technical Report I am responsible for contains all scientific and technical information that is required to be disclosed to make the Technical Report not misleading.
Dated this 27th Day of November, 2019.
“Signed”
________________________________ “Sealed”
Cristian A. Pereira Farias

SRK Consulting (U.S.), Inc.
Suite 600
1125 Seventeenth Street
Denver, CO 80202
T: 303.985.1333
F: 303.985.9947
www.srk.com
U.S. Offices:
Anchorage 907.677.3520
Clovis 559.452.0182
Denver 303.985.1333
Elko 775.753.4151
Fort Collins 970.407.8302
Reno 775.828.6800
Tucson 520.544.3688
Canadian Offices:
Saskatoon 306.955.4778
Sudbury 705.682.3270
Toronto 416.601.1445
Vancouver 604.681.4196
Yellowknife 867.873.8670
Group Offices:
Africa
Asia
Australia
Europe
North America
South America
CERTIFICATE OF QUALIFIED PERSON
I, Joanna Poeck, BEng Mining, SME-RM, MMSAQP, do hereby certify that:
1. I am a Principal Mining Engineer of SRK Consulting (U.S.), Inc., 1125 Seventeenth Street, Suite 600, Denver, CO, USA, 80202.
2. This certificate applies to the technical report titled “NI 43-101 Technical Report, Preliminary Economic Assessment, Marmato Project, Colombia” with an Effective Date of July 31, 2019 (the “Technical Report”).
3. I graduated with a degree in Mining Engineering from Colorado School of Mines in 2003. I am a Registered Member of the Society of Mining, Metallurgy & Exploration Geology. I am a QP member of the Mining & Metallurgical Society of America. I have worked as a Mining Engineer for a total of 16 years since my graduation from university. My relevant experience includes open pit and underground design, mine scheduling and mine optimization.
4. I have read the definition of “qualified person” set out in National Instrument 43-101 (NI 43-101) and certify that by reason of my education, affiliation with a professional association (as defined in NI 43-101) and past relevant work experience, I fulfill the requirements to be a “qualified person” for the purposes of NI 43-101.
5. I have not visited the Marmato property.
6. I am responsible for MDZ Mining related portions of sections 15, 16.4 (except for section 16.4.2) and portions of Sections 1, 24, 25 and 26.
7. I am independent of the issuer applying all of the tests in section 1.5 of NI 43-101.
8. I have not had prior involvement with the property that is the subject of the Technical Report.
9. I have read NI 43-101 and Form 43-101F1 and the sections of the Technical Report I am responsible for have been prepared in compliance with that instrument and form.
10. As of the aforementioned Effective Date, to the best of my knowledge, information and belief, the sections of the Technical Report I am responsible for contains all scientific and technical information that is required to be disclosed to make the Technical Report not misleading.
Dated this 27th Day of November, 2019.
“Signed”
________________________________ “Sealed”
Joanna Poeck, BEng Mining, SME-RM[4131289RM], MMSAQP[01387QP] Principal Consultant (Mining Engineer)

SRK Consulting (U.S.), Inc.
Suite 600
1125 Seventeenth Street
Denver, CO 80202
T: 303.985.1333
F: 303.985.9947
www.srk.com
U.S. Offices:
Anchorage 907.677.3520
Clovis 559.452.0182
Denver 303.985.1333
Elko 775.753.4151
Fort Collins 970.407.8302
Reno 775.828.6800
Tucson 520.544.3688
Canadian Offices:
Saskatoon 306.955.4778
Sudbury 705.682.3270
Toronto 416.601.1445
Vancouver 604.681.4196
Yellowknife 867.873.8670
Group Offices:
Africa
Asia
Australia
Europe
North America
South America
Marmato_544400.020_QPCert_Rodrigues_Rev02_KD.docx
CERTIFICATE OF QUALIFIED PERSON
I, Fernando Rodrigues, BS Mining, MBA, MMSAQP do hereby certify that:
1. I am Practice Leader and Principal Consultant (Mining Engineer) of SRK Consulting (U.S.), Inc., 1125 Seventeenth Street, Suite 600, Denver, CO, USA, 80202.
2. This certificate applies to the technical report titled “NI 43-101 Technical Report, Preliminary Economic Assessment, Marmato Project, Colombia” with an Effective Date of July 31, 2019 (the “Technical Report”).
3. I graduated with a Bachelors of Science degree in Mining Engineering from South Dakota School of Mines and Technology in 1999. I am a QP member of the MMSA. I have worked as a Mining Engineer for a total of 18 years since my graduation from South Dakota School of Mines and Technology in 1999. My relevant experience includes mine design and implementation, short term mine design, dump design, haulage studies, blast design, ore control, grade estimation, database management.
4. I have read the definition of “qualified person” set out in National Instrument 43-101 (NI 43-101) and certify that by reason of my education, affiliation with a professional association (as defined in NI 43-101) and past relevant work experience, I fulfill the requirements to be a “qualified person” for the purposes of NI 43-101.
5. I visited the Marmato property on August 22, 2019 for two days.
6. I am responsible for Upper Zone Mining and Economics related portions of Sections 16.1, 16.3 (except for section 16.3.2), 19 and 22, and portions of Sections 1, 25 and 26.
7. I am independent of the issuer applying all of the tests in section 1.5 of NI 43-101.
8. I have not had prior involvement with the property that is the subject of the Technical Report.
9. I have read NI 43-101 and Form 43-101F1 and the sections of the Technical Report I am responsible for have been prepared in compliance with that instrument and form.
10. As of the aforementioned Effective Date, to the best of my knowledge, information and belief, the sections of the Technical Report I am responsible for contains all scientific and technical information that is required to be disclosed to make the Technical Report not misleading.
Dated this 27th Day of November, 2019.
“Signed”
________________________________ “Sealed”
Fernando Rodrigues, BS Mining, MBA, MMSAQP [01405QP]

SRK Consulting (U.S.), Inc.
Suite 600
1125 Seventeenth Street
Denver, CO 80202
T: 303.985.1333
F: 303.985.9947
www.srk.com
U.S. Offices:
Anchorage 907.677.3520
Clovis 559.452.0182
Denver 303.985.1333
Elko 775.753.4151
Fort Collins 970.407.8302
Reno 775.828.6800
Tucson 520.544.3688
Canadian Offices:
Saskatoon 306.955.4778
Sudbury 705.682.3270
Toronto 416.601.1445
Vancouver 604.681.4196
Yellowknife 867.873.8670
Group Offices:
Africa
Asia
Australia
Europe
North America
South America
CERTIFICATE OF QUALIFIED PERSON
I, Joshua D. Sames, BSc Civil Engineering, PE do hereby certify that:
1. I am Senior Consultant at SRK Consulting (U.S.), Inc., 5250 Neil Road, Suite 300, Reno, NV, USA 89502.
2. This certificate applies to the technical report titled “NI 43-101 Technical Report, Preliminary Economic Assessment, Marmato Project, Colombia” with an Effective Date of July 31, 2019 (the “Technical Report”).
3. I graduated with a degree in Civil Engineering from University of Newcastle Australia in 2005. I am a registered Professional Engineer in the State of Nevada (PE No. 22346). I have worked as an engineer for a total of 13 years. My relevant experience includes site investigations, conceptual and detailed design of tailing storage facilities, construction supervision, management and operational assessments, mine reclamation permitting and closure design and permitting at mining properties in the western United States and South and Central America.
4. I have read the definition of “qualified person” set out in National Instrument 43-101 (NI 43-101) and certify that by reason of my education, affiliation with a professional association (as defined in NI 43-101) and past relevant work experience, I fulfill the requirements to be a “qualified person” for the purposes of NI 43-101.
5. I have not visited the Marmato Project property.
6. I am responsible for the preparation of tailings management facilities Section 18.4 and portions of Sections 1, 24, 25 and 26.
7. I am independent of the issuer.
8. I have not had prior involvement with the property that is the subject of the Technical Report.
9. I have read NI 43-101 and Form 43-101F1 and the sections of the Technical Report I am responsible for have been prepared in compliance with that instrument and form.
10. As of the aforementioned Effective Date, to the best of my knowledge, information and belief, the sections of the Technical Report I am responsible for contain all scientific and technical information that is required to be disclosed to make the Technical Report not misleading.
Signed and dated this 27th day of November, 2019
“Signed”
______________________________ “Sealed”
Joshua D. Sames P.E SRK Consulting (U.S.), Inc.
SRK Consulting (U.S.), Inc.
Suite 600
1125 Seventeenth Street
Denver, CO 80202
T: 303.985.1333
F: 303.985.9947
www.srk.com
U.S. Offices:
Anchorage 907.677.3520
Clovis 559.452.0182
Denver 303.985.1333
Elko 775.753.4151
Fort Collins 970.407.8302
Reno 775.828.6800
Tucson 520.544.3688
Canadian Offices:
Saskatoon 306.955.4778
Sudbury 705.682.3270
Toronto 416.601.1445
Vancouver 604.681.4196
Yellowknife 867.873.8670
Group Offices:
Africa
Asia
Australia
Europe
North America
South America
CERTIFICATE OF QUALIFIED PERSON
I, John Tinucci, PhD, PE, ISRM, do hereby certify that:
1. I am Practice Leader/Principal Consultant (Geotechnical Engineer) of SRK Consulting (U.S.), Inc., 1125 Seventeenth Street, Suite 600, Denver, CO, USA, 80202.
2. This certificate applies to the technical report titled “ NI 43-101 Technical Report, Preliminary Economic Assesment, Marmato Project, Colombia” with an effective Date of July 31, 2019 (the “Technical Report”).
3. I graduated with a degree in B.S. in Civil Engineering from Colorado State University, in 1980. In addition, I have obtained a M.S. in Geotechnical Engineering from University of California, Berkeley, in 1983 and I have obtained a Ph.D. in Geotechnical Engineering, Rock Mechanics from the University of California, Berkeley in 1985. I am member of the American Rock Mechanics Association, a member of the International Society of Rock Mechanics, and a Professional Member of the Society for Mining, Metallurgy & Exploration. I have worked as a Mining and Geotechnical Engineer for a total of 37 years since my graduation from university. My relevant experience includes 34 years of professional experience. I have 20 years managerial experience leading project teams, managing P&L operations for 120 staff, and directed own company of 8 staff for 8 years. I have technical experience in mine design, prefeasibility studies, feasibility studies, geomechanical assessments, rock mass characterization, project management, numerical analyses, underground mine stability, subsidence, tunneling, ground support, slope design and stabilization, excavation remediation, induced seismicity and dynamic ground motion. My industry commodities experience includes salt, potash, coal, platinum/palladium, iron, molybdenum, gold, silver, zinc, diamonds, and copper. My mine design experience includes open pit, room and pillar, (single and multi-level), conventional drill-and-blast and mechanized cutting, longwall, steep narrow vein, cut and fill, block caving, sublevel caving and cut and fill longhole stoping and paste backfilling.
4. I have read the definition of “qualified person” set out in National Instrument 43-101 (NI 43-101) and certify that by reason of my education, affiliation with a professional association (as defined in NI 43-101) and past relevant work experience, I fulfill the requirements to be a “qualified person” for the purposes of NI 43-101.
5. I visited the Marmato property on August 22, 2017 for two days.
6. I am responsible for Geotechnical Section 16.2 and portions of Sections 1, 24, 25 and 26.
7. I am independent of the issuer applying all of the tests in section 1.5 of NI 43-101.
8. I have not had prior involvement with the property that is the subject of the Technical Report..
9. I have read NI 43-101 and Form 43-101F1 and the sections of the Technical Report I am responsible for have been prepared in compliance with that instrument and form.
10. As of the aforementioned Effective Date, to the best of my knowledge, information and belief, the sections of the Technical Report I am responsible for contains all scientific and technical information that is required to be disclosed to make the Technical Report not misleading.
Dated this 27th Day of November, 2019.
“Signed”
________________________________ “Sealed”
John Tinucci, PhD, PE, ISRM

U.S. Offices:
Anchorage 907.677.3520
Clovis 559.452.0182
Denver 303.985.1333
Elko 775.753.4151
Reno 775.828.6800
Tucson 520.544.3688
Canadian Offices:
Saskatoon 306.955.4778
Sudbury 705.682.3270
Toronto 416.601.1445
Vancouver 604.681.4196
Yellowknife 867.873.8670
Group Offices:
Africa
Asia
Australia
Europe
North America
South America
SRK Consulting (U.S.), Inc.
5250 Neil Road, Suite 300
Reno, Nevada 89502
T: (775) 828-6800
F: (775) 828-6820
www.srk.com
CERTIFICATE OF QUALIFIED PERSON
I, Mark Allan Willow, MSc, CEM, SME-RM do hereby certify that:
1. I am Practice Leader/Principal Environmental Scientist of SRK Consulting (U.S.), Inc., 5250 Neil Road, Reno, Nevada 89502.
2. This certificate applies to the technical report titled “NI 43-101 Technical Report, Preliminary Economic Assessment, Marmato Project, Colombia” with an Effective Date of July 31, 2019 (the “Technical Report”).
3. I graduated with Bachelor's degree in Fisheries and Wildlife Management from the University of Missouri in 1987 and a Master's degree in Environmental Science and Engineering from the Colorado School of Mines in 1995. I have worked as Biologist/Environmental Scientist for over 25 years since my graduation from university. My relevant experience includes environmental due diligence/competent persons evaluations of developmental phase and operational phase mines through the world, including small gold mining projects in Panama, Senegal, Peru, Ecuador, Philippines, and Colombia; open pit and underground coal mines in Russia; large copper and iron mines and processing facilities in Mexico and Brazil; bauxite operations in Jamaica; and a coal mine/coking operation in the People's Republic of China. My Project Manager experience includes several site characterization and mine closure projects. I work closely with the U.S. Forest Service and U.S. Bureau of Land Management on permitting and mine closure projects to develop uniquely successful and cost-effective closure alternatives for the abandoned mining operations. Finally, I draw upon this diverse background for knowledge and experience as a human health and ecological risk assessor with respect to potential environmental impacts associated with operating and closing mining properties and have experience in the development of Preliminary Remediation Goals and hazard/risk calculations for site remedial action plans under Superfund activities according to current U.S. EPA risk assessment guidance.
4. I am a Certified Environmental Manager (CEM) in the State of Nevada (#1832) in accordance with Nevada Administrative Code 459.970 through 459.9729. Before any person consults for a fee in matters concerning: the management of hazardous waste; the investigation of a release or potential release of a hazardous substance; the sampling of any media to determine the release of a hazardous substance; the response to a release or cleanup of a hazardous substance; or the remediation soil or water contaminated with a hazardous substance, they must be certified by the Nevada Division of Environmental Protection, Bureau of Corrective Action;
5. I am a Registered Member (No. 4104492) of the Society for Mining, Metallurgy & Exploration Inc. (SME).
6. I have read the definition of “qualified person” set out in National Instrument 43-101 (NI 43-101) and certify that by reason of my education, affiliation with a professional association (as defined in NI 43-101) and past relevant work experience, I fulfill the requirements to be a “qualified person” for the purposes of NI 43-101.
7. I visited the Marmato property on December 1, 2016 for 1 day.
8. I am responsible for environmental studies, permitting and social or community impact, Sections 1.11, 4.4, 20 (except for section 20.1.6), portions of 24, 25.7, and 26.1.8.
9. I am independent of the issuer applying all of the tests in section 1.5 of NI 43-101.
10. I have not had prior involvement with the property that is the subject of the Technical Report.
11. I have read NI 43-101 and Form 43-101F1 and the sections of the Technical Report I am responsible for have been prepared in compliance with that instrument and form.

SRK Consulting Page 2
Marmato_544400.020_QPCert_Willow_Rev03_KD.docx
12. As of the aforementioned Effective Date, to the best of my knowledge, information and belief, the sections of the Technical Report I am responsible for contains all scientific and technical information that is required to be disclosed to make the Technical Report not misleading.
Dated this 27th Day of November, 2019.
“Signed” “Sealed”
SME-RM# 4104492
________________________________
Mark Allan Willow, MSc, CEM, SME-RM

SRK Consulting (U.S.), Inc.
Suite 600
1125 Seventeenth Street
Denver, CO 80202
T: 303.985.1333
F: 303.985.9947
www.srk.com
U.S. Offices:
Anchorage 907.677.3520
Clovis 559.452.0182
Denver 303.985.1333
Elko 775.753.4151
Fort Collins 970.407.8302
Reno 775.828.6800
Tucson 520.544.3688
Canadian Offices:
Saskatoon 306.955.4778
Sudbury 705.682.3270
Toronto 416.601.1445
Vancouver 604.681.4196
Yellowknife 867.873.8670
Group Offices:
Africa
Asia
Australia
Europe
North America
South America
CONSENT OF QUALIFIED PERSON
I, David Bird, MSc., PG, RM-SME, consent to the public filing of the technical report titled “NI 43-101 Technical Report, Preliminary Economic Assessment, Marmato Project, Colombia” with an Effective Date of July 31, 2019 (the “Technical Report”) by Gran Colombia Gold Marmato S.A.S. I also consent to any extracts from or a summary of the Technical Report in the press release titled “Gran Colombia Gold Announces Updated Mineral Resource Estimate and Preliminary Economic Assessment for it’s Marmato Project” and dated October 15, 2019 of Gran Colombia Gold Marmato, S.A.S.. I certify that I have read in the press release titled “Gran Colombia Gold Announces Updated Mineral Resource Estimate and Preliminary Economic Assessment for it’s Marmato Project” and dated October 15, 2019 being filed by Gran Colombia Gold Marmato, S.A.S. and that it fairly and accurately represents the information in the sections of the Technical Report for which I am responsible.
Dated this 27th Day of November, 2019.
“Signed”
________________________________ “Sealed”
David Bird, MSc, PG, RM-SME

SRK Consulting (U.S.), Inc.
Suite 600
1125 Seventeenth Street
Denver, CO 80202
T: 303.985.1333
F: 303.985.9947
www.srk.com
U.S. Offices:
Anchorage 907.677.3520
Clovis 559.452.0182
Denver 303.985.1333
Elko 775.753.4151
Fort Collins 970.407.8302
Reno 775.828.6800
Tucson 520.544.3688
Canadian Offices:
Saskatoon 306.955.4778
Sudbury 705.682.3270
Toronto 416.601.1445
Vancouver 604.681.4196
Yellowknife 867.873.8670
Group Offices:
Africa
Asia
Australia
Europe
North America
South America
CONSENT OF QUALIFIED PERSON
I, David Hoekstra, BSc Civil Engineering, P.E., consent to the public filing of the technical report titled “NI 43-101 Technical Report, Preliminary Economic Assessment, Marmato Project, Colombia” with an Effective Date of July 31, 2019 (the “Technical Report”) by Gran Colombia Gold Marmato S.A.S. I also consent to any extracts from or a summary of the Technical Report in the press release titled “Gran Colombia Gold Announces Updated Mineral Resource Estimate and Preliminary Economic Assessment for it’s Marmato Project” and dated October 15, 2019 of Gran Colombia Gold Marmato, S.A.S.. I certify that I have read in the press release titled “Gran Colombia Gold Announces Updated Mineral Resource Estimate and Preliminary Economic Assessment for it’s Marmato Project” and dated October 15, 2019 being filed by Gran Colombia Gold Marmato, S.A.S. and that it fairly and accurately represents the information in the sections of the Technical Report for which I am responsible.
Dated this 27th Day of November, 2019.
“Signed”
________________________________ “Sealed”
David Hoekstra, BSc, Civil Engineering, P.E.

SRK Consulting (U.S.), Inc.
Suite 600
1125 Seventeenth Street
Denver, CO 80202
T: 303.985.1333
F: 303.985.9947
www.srk.com
U.S. Offices:
Anchorage 907.677.3520
Clovis 559.452.0182
Denver 303.985.1333
Elko 775.753.4151
Fort Collins 970.407.8302
Reno 775.828.6800
Tucson 520.544.3688
Canadian Offices:
Saskatoon 306.955.4778
Sudbury 705.682.3270
Toronto 416.601.1445
Vancouver 604.681.4196
Yellowknife 867.873.8670
Group Offices:
Africa
Asia
Australia
Europe
North America
South America
CONSENT OF QUALIFIED PERSON
I, Eric Olin, MSc, MBA, RM-SME, consent to the public filing of the technical report titled “NI 43-101 Technical Report, Preliminary Economic Assessment, Marmato Project, Colombia” with an Effective Date of July 31, 2019 (the “Technical Report”) by Gran Colombia Gold Marmato S.A.S. I also consent to any extracts from or a summary of the Technical Report in the press release titled “Gran Colombia Gold Announces Updated Mineral Resource Estimate and Preliminary Economic Assessment for it’s Marmato Project” and dated October 15, 2019 of Gran Colombia Gold Marmato, S.A.S.. I certify that I have read in the press release titled “Gran Colombia Gold Announces Updated Mineral Resource Estimate and Preliminary Economic Assessment for it’s Marmato Project” and dated October 15, 2019 being filed by Gran Colombia Gold Marmato, S.A.S. and that it fairly and accurately represents the information in the sections of the Technical Report for which I am responsible.
Dated this 27th Day of November, 2019.
“Signed”
________________________________ “Sealed”
Eric Olin, MSc, MBA, RM-SME

SRK Consulting (U.S.), Inc.
Suite 600
1125 Seventeenth Street
Denver, CO 80202
T: 303.985.1333
F: 303.985.9947
www.srk.com
U.S. Offices:
Anchorage 907.677.3520
Clovis 559.452.0182
Denver 303.985.1333
Elko 775.753.4151
Fort Collins 970.407.8302
Reno 775.828.6800
Tucson 520.544.3688
Canadian Offices:
Saskatoon 306.955.4778
Sudbury 705.682.3270
Toronto 416.601.1445
Vancouver 604.681.4196
Yellowknife 867.873.8670
Group Offices:
Africa
Asia
Australia
Europe
North America
South America
CONSENT OF QUALIFIED PERSON
I, Jeff Osborn, BEng Mining, MMSAQP, consent to the public filing of the technical report titled “NI 43-101 Technical Report, Preliminary Economic Assessment, Marmato Project, Colombia” with an Effective Date of July 31, 2019 (the “Technical Report”) by Gran Colombia Gold Marmato S.A.S. I also consent to any extracts from or a summary of the Technical Report in the press release titled “Gran Colombia Gold Announces Updated Mineral Resource Estimate and Preliminary Economic Assessment for it’s Marmato Project” and dated October 15, 2019 of Gran Colombia Gold Marmato, S.A.S.. I certify that I have read in the press release titled “Gran Colombia Gold Announces Updated Mineral Resource Estimate and Preliminary Economic Assessment for it’s Marmato Project” and dated October 15, 2019 being filed by Gran Colombia Gold Marmato, S.A.S. and that it fairly and accurately represents the information in the sections of the Technical Report for which I am responsible.
Dated this 27th Day of November, 2019.
“Signed”
________________________________ “Sealed”
Jeff Osborn, BEng Mining, MMSAQP

SRK Consulting (U.S.), Inc.
Suite 600
1125 Seventeenth Street
Denver, CO 80202
T: 303.985.1333
F: 303.985.9947
www.srk.com
U.S. Offices:
Anchorage 907.677.3520
Clovis 559.452.0182
Denver 303.985.1333
Elko 775.753.4151
Fort Collins 970.407.8302
Reno 775.828.6800
Tucson 520.544.3688
Canadian Offices:
Saskatoon 306.955.4778
Sudbury 705.682.3270
Toronto 416.601.1445
Vancouver 604.681.4196
Yellowknife 867.873.8670
Group Offices:
Africa
Asia
Australia
Europe
North America
South America
CONSENT OF QUALIFIED PERSON
I, Benjamin Parsons, MSc, MAusIMM (CP), consent to the public filing of the technical report titled “NI 43-101 Technical Report, Preliminary Economic Assessment, Marmato Project, Colombia” with an Effective Date of July 31, 2019 (the “Technical Report”) by Gran Colombia Gold Marmato S.A.S. I also consent to any extracts from or a summary of the Technical Report in the press release titled “Gran Colombia Gold Announces Updated Mineral Resource Estimate and Preliminary Economic Assessment for it’s Marmato Project” and dated October 15, 2019 of Gran Colombia Gold Marmato, S.A.S.. I certify that I have read in the press release titled “Gran Colombia Gold Announces Updated Mineral Resource Estimate and Preliminary Economic Assessment for it’s Marmato Project” and dated October 15, 2019 being filed by Gran Colombia Gold Marmato, S.A.S. and that it fairly and accurately represents the information in the sections of the Technical Report for which I am responsible.
Dated this 27th Day of November, 2019.
“Signed”
________________________________ “Sealed”
Benjamin Parsons, MSc, MAusIMM (CP)

SRK Consulting (U.S.), Inc.
Suite 600
1125 Seventeenth Street
Denver, CO 80202
T: 303.985.1333
F: 303.985.9947
www.srk.com
U.S. Offices:
Anchorage 907.677.3520
Clovis 559.452.0182
Denver 303.985.1333
Elko 775.753.4151
Fort Collins 970.407.8302
Reno 775.828.6800
Tucson 520.544.3688
Canadian Offices:
Saskatoon 306.955.4778
Sudbury 705.682.3270
Toronto 416.601.1445
Vancouver 604.681.4196
Yellowknife 867.873.8670
Group Offices:
Africa
Asia
Australia
Europe
North America
South America
CONSENT OF QUALIFIED PERSON
I, Cristian A. Pereira Farias, SME-RM, consent to the public filing of the technical report titled “NI 43-101 Technical Report, Preliminary Economic Assessment, Marmato Project, Colombia” with an Effective Date of July 31, 2019 (the “Technical Report”) by Gran Colombia Gold Marmato S.A.S. I also consent to any extracts from or a summary of the Technical Report in the press release titled “Gran Colombia Gold Announces Updated Mineral Resource Estimate and Preliminary Economic Assessment for it’s Marmato Project” and dated October 15, 2019 of Gran Colombia Gold Marmato, S.A.S.. I certify that I have read in the press release titled “Gran Colombia Gold Announces Updated Mineral Resource Estimate and Preliminary Economic Assessment for it’s Marmato Project” and dated October 15, 2019 being filed by Gran Colombia Gold Marmato, S.A.S. and that it fairly and accurately represents the information in the sections of the Technical Report for which I am responsible.
Dated this 27th Day of November, 2019.
“Signed”
________________________________ “Sealed”
Cristian A. Pereira Farias, SME-RM

SRK Consulting (U.S.), Inc.
Suite 600
1125 Seventeenth Street
Denver, CO 80202
T: 303.985.1333
F: 303.985.9947
www.srk.com
U.S. Offices:
Anchorage 907.677.3520
Clovis 559.452.0182
Denver 303.985.1333
Elko 775.753.4151
Fort Collins 970.407.8302
Reno 775.828.6800
Tucson 520.544.3688
Canadian Offices:
Saskatoon 306.955.4778
Sudbury 705.682.3270
Toronto 416.601.1445
Vancouver 604.681.4196
Yellowknife 867.873.8670
Group Offices:
Africa
Asia
Australia
Europe
North America
South America
CONSENT OF QUALIFIED PERSON
I, Joanna Poeck, BEng Mining, SME-RM, MMSAQP, consent to the public filing of the technical report titled “NI 43-101 Technical Report, Preliminary Economic Assessment, Marmato Project, Colombia” with an Effective Date of July 31, 2019 (the “Technical Report”) by Gran Colombia Gold Marmato S.A.S. I also consent to any extracts from or a summary of the Technical Report in the press release titled “Gran Colombia Gold Announces Updated Mineral Resource Estimate and Preliminary Economic Assessment for it’s Marmato Project” and dated October 15, 2019 of Gran Colombia Gold Marmato, S.A.S.. I certify that I have read in the press release titled “Gran Colombia Gold Announces Updated Mineral Resource Estimate and Preliminary Economic Assessment for it’s Marmato Project” and dated October 15, 2019 being filed by Gran Colombia Gold Marmato, S.A.S. and that it fairly and accurately represents the information in the sections of the Technical Report for which I am responsible.
Dated this 27th Day of November, 2019.
“Signed”
________________________________ “Sealed”
Joanna Poeck, BEng Mining, SME-RM, MMSAQP

SRK Consulting (U.S.), Inc.
Suite 600
1125 Seventeenth Street
Denver, CO 80202
T: 303.985.1333
F: 303.985.9947
www.srk.com
U.S. Offices:
Anchorage 907.677.3520
Clovis 559.452.0182
Denver 303.985.1333
Elko 775.753.4151
Fort Collins 970.407.8302
Reno 775.828.6800
Tucson 520.544.3688
Canadian Offices:
Saskatoon 306.955.4778
Sudbury 705.682.3270
Toronto 416.601.1445
Vancouver 604.681.4196
Yellowknife 867.873.8670
Group Offices:
Africa
Asia
Australia
Europe
North America
South America
CONSENT OF QUALIFIED PERSON
I, Fernando Rodrigues, BS Mining, MBA, MMSAQP, consent to the public filing of the technical report titled “NI 43-101 Technical Report, Preliminary Economic Assessment, Marmato Project, Colombia” with an Effective Date of July 31, 2019 (the “Technical Report”) by Gran Colombia Gold Marmato S.A.S. I also consent to any extracts from or a summary of the Technical Report in the press release titled “Gran Colombia Gold Announces Updated Mineral Resource Estimate and Preliminary Economic Assessment for it’s Marmato Project” and dated October 15, 2019 of Gran Colombia Gold Marmato, S.A.S.. I certify that I have read in the press release titled “Gran Colombia Gold Announces Updated Mineral Resource Estimate and Preliminary Economic Assessment for it’s Marmato Project” and dated October 15, 2019 being filed by Gran Colombia Gold Marmato, S.A.S. and that it fairly and accurately represents the information in the sections of the Technical Report for which I am responsible.
Dated this 27th Day of November, 2019.
“Signed”
________________________________ “Sealed”
Fernando Rodrigues, BS Mining, MBA, MMSAQP

SRK Consulting (U.S.), Inc.
Suite 600
1125 Seventeenth Street
Denver, CO 80202
T: 303.985.1333
F: 303.985.9947
www.srk.com
U.S. Offices:
Anchorage 907.677.3520
Clovis 559.452.0182
Denver 303.985.1333
Elko 775.753.4151
Fort Collins 970.407.8302
Reno 775.828.6800
Tucson 520.544.3688
Canadian Offices:
Saskatoon 306.955.4778
Sudbury 705.682.3270
Toronto 416.601.1445
Vancouver 604.681.4196
Yellowknife 867.873.8670
Group Offices:
Africa
Asia
Australia
Europe
North America
South America
CONSENT OF QUALIFIED PERSON
I, Joshua D. Sames, BSc Civil Engineering, PE, consent to the public filing of the technical report titled “NI 43-101 Technical Report, Preliminary Economic Assessment, Marmato Project, Colombia” with an Effective Date of July 31, 2019 (the “Technical Report”) by Gran Colombia Gold Marmato S.A.S. I also consent to any extracts from or a summary of the Technical Report in the press release titled “Gran Colombia Gold Announces Updated Mineral Resource Estimate and Preliminary Economic Assessment for it’s Marmato Project” and dated October 15, 2019 of Gran Colombia Gold Marmato, S.A.S.. I certify that I have read in the press release titled “Gran Colombia Gold Announces Updated Mineral Resource Estimate and Preliminary Economic Assessment for it’s Marmato Project” and dated October 15, 2019 being filed by Gran Colombia Gold Marmato, S.A.S. and that it fairly and accurately represents the information in the sections of the Technical Report for which I am responsible.
Dated this 27th Day of November, 2019.
“Signed”
________________________________ “Sealed”
Joshua D. Sames, BSc Civil Engineering, PE

SRK Consulting (U.S.), Inc.
Suite 600
1125 Seventeenth Street
Denver, CO 80202
T: 303.985.1333
F: 303.985.9947
www.srk.com
U.S. Offices:
Anchorage 907.677.3520
Clovis 559.452.0182
Denver 303.985.1333
Elko 775.753.4151
Fort Collins 970.407.8302
Reno 775.828.6800
Tucson 520.544.3688
Canadian Offices:
Saskatoon 306.955.4778
Sudbury 705.682.3270
Toronto 416.601.1445
Vancouver 604.681.4196
Yellowknife 867.873.8670
Group Offices:
Africa
Asia
Australia
Europe
North America
South America
CONSENT OF QUALIFIED PERSON
I, John Tinucci, PhD, PE, ISRM consent to the public filing of the technical report titled “NI 43-101 Technical Report, Preliminary Economic Assessment, Marmato Project, Colombia” with an Effective Date of July 31, 2019 (the “Technical Report”) by Gran Colombia Gold Marmato S.A.S. I also consent to any extracts from or a summary of the Technical Report in the press release titled “Gran Colombia Gold Announces Updated Mineral Resource Estimate and Preliminary Economic Assessment for it’s Marmato Project” and dated October 15, 2019 of Gran Colombia Gold Marmato, S.A.S.. I certify that I have read in the press release titled “Gran Colombia Gold Announces Updated Mineral Resource Estimate and Preliminary Economic Assessment for it’s Marmato Project” and dated October 15, 2019 being filed by Gran Colombia Gold Marmato, S.A.S. and that it fairly and accurately represents the information in the sections of the Technical Report for which I am responsible.
Dated this 27th Day of November, 2019.
“Signed”
________________________________ “Sealed”
John Tinucci, PhD, PE, ISRM

SRK Consulting (U.S.), Inc.
Suite 600
1125 Seventeenth Street
Denver, CO 80202
T: 303.985.1333
F: 303.985.9947
www.srk.com
U.S. Offices:
Anchorage 907.677.3520
Clovis 559.452.0182
Denver 303.985.1333
Elko 775.753.4151
Fort Collins 970.407.8302
Reno 775.828.6800
Tucson 520.544.3688
Canadian Offices:
Saskatoon 306.955.4778
Sudbury 705.682.3270
Toronto 416.601.1445
Vancouver 604.681.4196
Yellowknife 867.873.8670
Group Offices:
Africa
Asia
Australia
Europe
North America
South America
CONSENT OF QUALIFIED PERSON
I, Mark Allan Willow, MSc, CEM, SME-RM consent to the public filing of the technical report titled “NI 43-101 Technical Report, Preliminary Economic Assessment, Marmato Project, Colombia” with an Effective Date of July 31, 2019 (the “Technical Report”) by Gran Colombia Gold Marmato S.A.S. I also consent to any extracts from or a summary of the Technical Report in the press release titled “Gran Colombia Gold Announces Updated Mineral Resource Estimate and Preliminary Economic Assessment for it’s Marmato Project” and dated October 15, 2019 of Gran Colombia Gold Marmato, S.A.S.. I certify that I have read in the press release titled “Gran Colombia Gold Announces Updated Mineral Resource Estimate and Preliminary Economic Assessment for it’s Marmato Project” and dated October 15, 2019 being filed by Gran Colombia Gold Marmato, S.A.S. and that it fairly and accurately represents the information in the sections of the Technical Report for which I am responsible.
Dated this 27th Day of November, 2019.
“Signed”
________________________________ “Sealed”
Mark Allan Willow, MSc, CEM, SME-RM

SRK Consulting (U.S.), Inc. NI 43-101 Technical Report – Marmato Appendices
MMS/KD Marmato_PEA_NI43-101_544400.020_Rev31_KD.docx November 2019
Appendix B: Capping

DATE: 11/26/2019
REVIEWED: BPDRAWN: BP
FILE: AppendixC_capping2019.xlsx
SCALE: NOT TO SCALE
DESIGN: REVISION NO.
SRK JOB NO.:
ISSUED FOR:
REPORT TITLE:
A544400.020
APPENDIX B-1
GRAN COLOMBIA GOLD MARMATO S.A.S
NI 43-101 TECHNICAL REPORT PRELIMINARY ECONOMIC ASSESSMENTMARMATO PROJECTCAPPING
CHARTS 1000Au
0.1 0.5 1 5 10 50 100 500
AU
0.01
0.10.20.512
510
20304050607080
9095
9899
99.599.899.9
99.99
Cum
ulat
ive %
Cap=50 Capped=595 CV=1.68 Total Lost=8.2%
Log Probability Plot AU
10.690% 1593.8% 2096% 3398.3% 4098.8% 5099.2% 6299.4% 7599.6% 10099.8% 20099.9%
Max
weighted byweights
countmin
maxmeanstdev
skewnesskurtosisvariance
CVgeom mean
25%median
75%
AULENGTH27905570990.00000891.031004.7272412.3898119.60839.2153.52.62
0.742001.760004.60000
Lost LostTotal% CV%
AU 57099 0 891 4.73 131912 153.5 2.62AU 200 36 99.90% 0.10% 1.30% 14% 57099 0 200 4.66 130149 110.2 2.25AU 100 174 99.80% 0.30% 3.60% 24% 57099 0 100 4.56 127172 81.82 1.98AU 75 293 99.60% 0.50% 5.20% 29% 57099 0 75 4.48 125033 69.28 1.86AU 62 413 99.40% 0.70% 6.50% 32% 57099 0 62 4.42 123343 61.56 1.78AU 50 595 99.20% 1.00% 8.20% 36% 57099 0 50 4.34 121080 53.25 1.68AU 40 881 98.80% 1.50% 10.00% 39% 57099 0 40 4.24 118354 45.36 1.59AU 33 1220 98.50% 2.10% 12.00% 42% 57099 0 33 4.14 115578 38.97 1.51AU 20 2813 96.00% 4.90% 19.00% 50% 57099 0 20 3.81 106228 24.52 1.3AU 15 4341 93.80% 7.60% 25.00% 55% 57099 0 15 3.56 99327 17.77 1.18AU 10.6 6853 90.00% 12.00% 32.00% 60% 57099 0 10.6 3.21 89634 11.36 1.05AU AU > 50 595 50.09 891 97.92 22134 5735 0.77AU AU <= 50 56504 0 50 3.97 109778 36.52 1.52
Variance CVCount Min Max Mean TotalColumn _Filter Cap Capped Percentile Capped%
Lost LostTotal% CV%
AU 53839 0 891 4.88 127206 160.2 2.6AU 200 36 99.90% 0.10% 1.40% 15% 53839 0 200 4.81 125443 113.9 2.22AU 100 169 99.80% 0.30% 3.70% 25% 53839 0 100 4.70 122517 84.02 1.95AU 75 284 99.60% 0.50% 5.30% 30% 53839 0 75 4.62 120481 71.28 1.83AU 62 402 99.40% 0.70% 6.60% 33% 53839 0 62 4.56 118864 63.4 1.75AU 50 579 99.20% 1.10% 8.30% 36% 53839 0 50 4.47 116683 54.87 1.66AU 40 861 98.70% 1.60% 10.00% 40% 53839 0 40 4.37 114039 46.71 1.56AU 40 861 98.70% 1.60% 10.00% 40% 53839 0 40 4.37 114039 46.71 1.56AU 33 1188 98.30% 2.20% 12.00% 43% 53839 0 33 4.27 111341 40.09 1.48AU 20 2739 95.90% 5.10% 20.00% 51% 53839 0 20 3.92 102249 25.14 1.28AU 15 4236 93.50% 7.90% 25.00% 55% 53839 0 15 3.66 95545 18.19 1.16AU AU > 50 579 50.09 891 98.13 21455 5907 0.78AU AU <= 50 53260 0 50 4.09 105751 37.67 1.5
Column _Filter Cap Capped Percentile Count Min Max MeanCapped% Total Variance CV
0.5 1 5 10 50 100
AU
0.01
0.10.20.512
510
20304050607080
9095
9899
99.599.899.9
99.99
Cum
ulat
ive %
Cap=6 Capped=313 CV=1.02 Total Lost=37%
Log Probability Plot AU
690.2%6.591.1%7.292.1%893% 1095.1% 12.596% 1596.8% 2097.8% 2898.9% 5099.6%
MaxCap
countmin
maxmeanstdev
skewnesskurtosisvariance
CVgeom mean
25%median
75%
AU32600.00000132.020002.928417.452539.09113.455.542.54
0.400001.165002.74100
Lost LostTotal% CV%
AU 3260 0 132 2.93 9547 55.54 2.54AU 50 16 99.60% 0.50% 5.60% 20% 3260 0 50 2.77 9015 31.49 2.03AU 28 36 98.90% 1.10% 11.00% 32% 3260 0 28 2.61 8498 20.51 1.74AU 20 74 97.80% 2.30% 16.00% 39% 3260 0 20 2.47 8062 14.90 1.56AU 15 105 96.80% 3.20% 20.00% 45% 3260 0 15 2.34 7622 10.87 1.41AU 12.5 130 96.00% 4.00% 23.00% 48% 3260 0 12.5 2.25 7334 8.85 1.32AU 10 159 95.10% 4.90% 27.00% 52% 3260 0 10 2.14 6971 6.84 1.22AU 8 229 93.00% 7.00% 31.00% 56% 3260 0 8 2.02 6589 5.23 1.13AU 7.2 256 92.10% 7.90% 33.00% 57% 3260 0 7.2 1.96 6396 4.57 1.09AU 6.5 288 91.10% 8.80% 35.00% 59% 3260 0 6.5 1.90 6204 3.99 1.05AU 6 313 90.20% 9.60% 37.00% 60% 3260 0 6 1.86 6054 3.59 1.02AU AU > 20 74 20.16 132 40.06 2965 702.70 0.66AU AU <= 20 3186 0 19.9 2.07 6582 7.94 1.36
Column _Filter Cap Capped Percentile Capped% Count Min Max Mean Total Variance CV

DATE: 11/26/2019
REVIEWED: BPDRAWN: BP
FILE: AppendixC_capping2019.xlsx
SCALE: NOT TO SCALE
DESIGN: REVISION NO.
SRK JOB NO.:
ISSUED FOR:
REPORT TITLE:
A544400.020
APPENDIX B-2
GRAN COLOMBIA GOLD MARMATO S.A.S
NI 43-101 TECHNICAL REPORT PRELIMINARY ECONOMIC ASSESSMENTMARMATO PROJECTCAPPING
CHARTS 1000Ag
10 100 1000
AG
0.01
0.10.20.512
510
20304050607080
9095
9899
99.599.899.9
99.99
Cum
ulat
ive %
Cap=150 Capped=603 CV=1.08 Total Lost=3.5%
Log Probability Plot AG
6089.9%63.591%6892.1%7593.5% 8595.1% 10097% 15098.9% 20099.5% 25099.7% 40099.9%
Max
countmin
maxmeanstdev
skewnesskurtosisvariance
CVgeom mean
25%median
75%
AG570990.0001995.00026.68536.84611.07377.713581.38
6.80016.56034.800
Lost LostTotal% CV%
AG 57099 0 1995 26.69 1523709 1358 1.38AG 400 36 99.90% 0.10% 0.70% 11% 57099 0 400 26.49 1512697 1065 1.23AG 250 151 99.70% 0.30% 1.40% 15% 57099 0 250 26.3 1501924 959.1 1.18AG 200 283 99.50% 0.50% 2.10% 17% 57099 0 200 26.12 1491513 887.6 1.14AG 150 603 98.90% 1.10% 3.50% 22% 57099 0 150 25.75 1470182 778.6 1.08AG 100 1713 97% 3% 6.80% 28% 57099 0 100 24.87 1419745 609.9 0.99AG 85 2789 95.10% 4.90% 9% 31% 57099 0 85 24.28 1386590 531.7 0.95AG 75 3696 93.50% 6.50% 11% 34% 57099 0 75 23.72 1354344 468.7 0.91AG 68 4498 92.10% 7.90% 13% 36% 57099 0 68 23.22 1325675 420.6 0.88AG 63.5 5128 91% 9% 14% 38% 57099 0 63.5 22.84 1304042 388.3 0.86AG 60 5737 89.90% 10% 16% 39% 57099 0 60 22.51 1285045 362.3 0.85AG AG > 150 603 150 1995 238.8 143977 25014 0.66AG AG <= 150 56496 0 150 24.42 1379732 620.3 1.02
Column _Filter Cap Capped Percentile Variance CVCapped% Count Min Max Mean Total
Lost LostTotal% CV%
AG 53839 0 1995 25.31 660349 1041 1.27AG 400 21 99.90% 0.04% 0.30% 6.40% 53839 0 400 25.22 658041 905.7 1.19AG 270 86 99.90% 0.20% 0.70% 8.50% 53839 0 270 25.14 656007 859.6 1.17AG 200 234 99.70% 0.40% 1.30% 11% 53839 0 200 24.98 651947 795.9 1.13AG 150 537 99.20% 1% 2.40% 15% 53839 0 150 24.7 644665 714.1 1.08AG 120 957 98.50% 1.80% 3.70% 19% 53839 0 120 24.37 635909 641 1.04AG 100 1607 97.40% 3% 5.20% 22% 53839 0 100 23.98 625819 575.3 1AG 85 2668 95.60% 5% 7.30% 25% 53839 0 84.96 23.47 612444 505.5 0.96AG 79 3174 94.70% 5.90% 8.40% 27% 53839 0 78.8 23.17 604630 470.5 0.94AG 70 4071 93.20% 7.60% 11% 29% 53839 0 70.08 22.65 590931 416.6 0.9AG 60 5482 91.40% 10.20% 14% 33% 53839 0 60 21.85 570204 349 0.85AG AG > 150 537 150 1995 223.1 47864 16159 0.57AG AG <= 150 53302 0 150 23.67 612485 588.8 1.03
Column _Filter Cap Capped Percentile Variance CVCount Min Max Mean TotalCapped%
Lost LostTotal% CV%
AG 3260 0 1160 23.08 75230 3610 2.6AG 300 24 99.30% 0.70% 8.50% 29% 3260 0 300 21.1 68799 1524 1.85AG 225 36 98.90% 1.10% 11% 35% 3260 0 225 20.45 66655 1209 1.7AG 180 53 98.40% 1.60% 14% 39% 3260 0 180 19.83 64646 986.5 1.58AG 150 66 98% 2% 16% 43% 3260 0 150 19.29 62895 830.8 1.49AG 105 102 96.80% 3.10% 21% 49% 3260 0 105 18.18 59273 592.9 1.34AG 85 129 96.10% 4% 24% 52% 3260 0 85 17.49 57006 486.1 1.26AG 75 152 95.40% 4.70% 26% 53% 3260 0 75 17.07 55631 433.3 1.22AG 68 190 94.10% 5.80% 28% 54% 3260 0 68 16.69 54422 392.9 1.19AG 62 226 93% 6.90% 29% 56% 3260 0 62 16.31 53179 355.9 1.16AG 50 351 89.20% 10.80% 34% 59% 3260 0 50 15.23 49645 269.6 1.08AG AG > 150 66 151 1160 336.9 22235 54969 0.7AG AG <= 150 3194 0 149.8 16.59 52995 487.6 1.33
Column _Filter Cap Capped Percentile Capped% Count Min Max Mean Total Variance CV

DATE: 11/26/2019
REVIEWED: BPDRAWN: BP
FILE: AppendixC_capping2019.xlsx
SCALE: NOT TO SCALE
DESIGN: REVISION NO.
SRK JOB NO.:
ISSUED FOR:
REPORT TITLE:
A544400.020
APPENDIX B-3
GRAN COLOMBIA GOLD MARMATO S.A.S
NI 43-101 TECHNICAL REPORT PRELIMINARY ECONOMIC ASSESSMENTMARMATO PROJECTCAPPING
CHARTS 3000Au
Lost LostTotal% CV%
AU 2683 0 405.6 5.46 14637 253.80 2.92AU 60 25 99.10% 0.90% 10% 36% 2683 0 60 4.89 13131 82.80 1.86AU 50 43 98.40% 1.60% 13% 40% 2683 0 50 4.77 12788 70.09 1.76AU 40 51 98.10% 1.90% 16% 44% 2683 0 40 4.60 12336 56.54 1.64AU 30 75 97.30% 2.80% 20% 49% 2683 0 30 4.37 11734 42.97 1.5AU 25 96 96.40% 3.60% 23% 52% 2683 0 25 4.21 11305 35.59 1.42AU 20 136 94.90% 5.10% 27% 55% 2683 0 20 4.00 10739 27.88 1.32AU 18 163 93.90% 6.10% 29% 56% 2683 0 18 3.89 10437 24.49 1.27AU 15 205 92.40% 7.60% 33% 59% 2683 0 15 3.68 9878 19.22 1.19AU 12.5 242 90.90% 9% 36% 62% 2683 0 12.5 3.48 9323 15.02 1.12AU 11.5 270 89.90% 10.10% 38% 63% 2683 0 11.5 3.38 9066 13.39 1.08AU AU > 40 51 40.09 405.6 85.13 4341 5286.00 0.85AU AU <= 40 2632 0 39.72 3.91 10296 32.87 1.47
Capped%Column _Filter Cap Capped Percentile CVCount Min Max Mean Total Variance

DATE: 11/26/2019
REVIEWED: BPDRAWN: BP
FILE: AppendixC_capping2019.xlsx
SCALE: NOT TO SCALE
DESIGN: REVISION NO.
SRK JOB NO.:
ISSUED FOR:
REPORT TITLE:
A544400.020
APPENDIX B-4
GRAN COLOMBIA GOLD MARMATO S.A.S
NI 43-101 TECHNICAL REPORT PRELIMINARY ECONOMIC ASSESSMENTMARMATO PROJECTCAPPING
CHARTS 3000Ag
Lost LostTotal% CV%
AG 2683 0 432 23.86 64028 990.9 1.32AG 150 24 99.10% 0.90% 2.90% 12% 2683 0 150 23.17 62160 717.7 1.16AG 120 51 98.10% 1.90% 4.60% 16% 2683 0 120 22.77 61093 629.8 1.1AG 100 84 96.90% 3.10% 6.70% 21% 2683 0 100 22.27 59739 542.3 1.05AG 90 103 96.20% 3.80% 8.20% 23% 2683 0 90 21.92 58801 491.4 1.01AG 80 130 95.20% 4.80% 10% 26% 2683 0 80 21.49 57650 437.3 0.97AG 75 144 94.60% 5.40% 11% 28% 2683 0 75 21.23 56961 408.4 0.95AG 70 164 93.90% 6.10% 12% 30% 2683 0 70 20.95 56201 379.3 0.93AG 65 196 92.70% 7.30% 14% 31% 2683 0 65 20.62 55309 348.3 0.91AG 60 217 91.90% 8.10% 15% 33% 2683 0 60 20.23 54285 316.2 0.88AG 50 292 89.10% 10.90% 19% 38% 2683 0 50 19.28 51729 249.5 0.82AG AG > 80 130 80.4 432 129.1 16778 3416 0.45AG AG <= 80 2553 0 80 18.51 47250 276.2 0.9
Capped%Column _Filter Cap Capped Percentile CVCount Min Max Mean Total Variance

DATE: 11/26/2019
REVIEWED: BPDRAWN: BP
FILE: AppendixC_capping2019.xlsx
SCALE: NOT TO SCALE
DESIGN: REVISION NO.
SRK JOB NO.:
ISSUED FOR:
REPORT TITLE:
A544400.020
APPENDIX B-5
GRAN COLOMBIA GOLD MARMATO S.A.S
NI 43-101 TECHNICAL REPORT PRELIMINARY ECONOMIC ASSESSMENTMARMATO PROJECTCAPPING
CHARTS 4000Au
Lost LostTotal% CV%
AU 11119 0.001 365.1 2.51 27851 77.75 3.52AU 90.0 11 99.90% 0.10% 4.80% 32% 11119 0.001 90.0 2.39 26518 32.82 2.40AU 60.0 21 99.80% 0.20% 6.30% 37% 11119 0.001 60.0 2.35 26102 27.45 2.23AU 45.0 43 99.60% 0.40% 8.00% 41% 11119 0.001 45.0 2.31 25628 23.26 2.09AU 30.0 100 99.10% 0.90% 12.00% 47% 11119 0.001 30.0 2.21 24576 16.77 1.85AU 20.1 167 98.50% 1.50% 16.00% 54% 11119 0.001 20.1 2.10 23289 11.57 1.62AU 14.7 256 97.70% 2.30% 20.00% 58% 11119 0.001 14.7 2.00 22191 8.57 1.47AU 11.5 367 96.70% 3.30% 24.00% 62% 11119 0.001 11.5 1.91 21204 6.61 1.35AU 7.6 639 94.20% 5.70% 31.00% 67% 11119 0.001 7.6 1.74 19320 4.05 1.16AU 6.0 865 92.20% 7.80% 35.00% 70% 11119 0.001 6.0 1.63 18118 2.96 1.06AU 5.0 1076 90.30% 9.70% 38.00% 72% 11119 0.001 5.0 1.54 17145 2.27 0.98AU AU > 30 100 30.08 365.1 62.74 6274 3937.00 1.00AU AU <= 30 11019 0.001 29.8 1.96 21576 9.85 1.60
CVCount Min Max Mean Total VarianceCapped%Column _Filter Cap Capped Percentile

DATE: 11/26/2019
REVIEWED: BPDRAWN: BP
FILE: AppendixC_capping2019.xlsx
SCALE: NOT TO SCALE
DESIGN: REVISION NO.
SRK JOB NO.:
ISSUED FOR:
REPORT TITLE:
A544400.020
APPENDIX B-6
GRAN COLOMBIA GOLD MARMATO S.A.S
NI 43-101 TECHNICAL REPORT PRELIMINARY ECONOMIC ASSESSMENTMARMATO PROJECTCAPPING
CHARTS 4000Ag
Lost LostTotal% CV%
AG KZONE = 401 430 0.2 173.2 9.17 3942 258.5 1.75AG KZONE = 401 66.5 5 99.00% 1.20% 6.20% 20% 430 0.2 66.5 8.59 3696 146 1.41AG KZONE = 401 60 8 98.20% 1.90% 7.20% 22% 430 0.2 60 8.50 3657 136.2 1.37AG KZONE = 401 56 9 98.00% 2.10% 8.10% 23% 430 0.2 56 8.42 3621 127.9 1.34AG KZONE = 401 43.5 13 97.00% 3.00% 12.00% 29% 430 0.2 43.5 8.11 3485 101.9 1.25AG KZONE = 401 36 17 96.00% 4.00% 14.00% 33% 430 0.2 36 7.85 3375 85.67 1.18AG KZONE = 401 31.5 22 94.90% 5.10% 17.00% 35% 430 0.2 31.5 7.64 3285 74.81 1.13AG KZONE = 401 29 25 94.10% 5.80% 18.00% 37% 430 0.2 29 7.50 3225 68.49 1.1AG KZONE = 401 27 31 92.90% 7.20% 20.00% 39% 430 0.2 27 7.37 3169 63.05 1.08AG KZONE = 401 23.5 35 91.90% 8.10% 23.00% 41% 430 0.2 23.5 7.10 3052 53.28 1.03AG KZONE = 401 22.5 41 90.50% 9.50% 24.00% 42% 430 0.2 22.5 7.01 3014 50.47 1.01AG KZONE = 401 22 44 89.80% 10.20% 24.00% 43% 430 0.2 22 6.96 2993 48.92 1.01AG KZONE = 401 - AG > 60 8 60.8 173.2 95.62 765 1880 0.45AG KZONE = 401 - AG <= 60 422 0.2 59.64 7.53 3177 87.41 1.24
CVCount Min Max Mean Total VarianceCapped%Column _Filter Cap Capped Percentile
Lost LostTotal% CV%
AG KZONE = 402 91 0.2 21.8 3.91 355.4 15.37 1AG KZONE = 402 19 1 99.20% 1.10% 0.80% 2.60% 91 0.2 19 3.88 352.6 14.34 0.98AG KZONE = 402 18 1 98.90% 1.10% 1.10% 3.50% 91 0.2 18 3.86 351.6 14.01 0.97AG KZONE = 402 16.5 3 97.80% 3.30% 1.90% 5.90% 91 0.2 16.5 3.83 348.5 13.09 0.94AG KZONE = 402 14 3 97.00% 3.30% 4.10% 11% 91 0.2 14 3.75 341 11.18 0.89AG KZONE = 402 12.5 4 96.30% 4.40% 5.50% 14% 91 0.2 12.5 3.69 336 10.13 0.86AG KZONE = 402 11.75 4 95.60% 4.40% 6.30% 16% 91 0.2 11.75 3.66 333 9.57 0.85AG KZONE = 402 11.25 6 93.50% 6.60% 7.10% 17% 91 0.2 11.25 3.63 330.2 9.08 0.83AG KZONE = 402 10.719 7 93.00% 7.70% 8.10% 19% 91 0.2 10.72 3.59 326.6 8.48 0.81AG KZONE = 402 9.872 8 92.00% 8.80% 9.80% 22% 91 0.2 9.872 3.52 320.6 7.59 0.78AG KZONE = 402 9.477 9 91.00% 9.90% 11.00% 24% 91 0.2 9.477 3.49 317.1 7.11 0.77AG KZONE = 402 8.09 10 90.00% 11.00% 14.00% 29% 91 0.2 8.09 3.35 304.6 5.62 0.71AG KZONE = 402 - AG > 18 1 21.8 21.8 21.80 21.8 0 0AG KZONE = 402 - AG <= 18 90 0.2 18 3.71 333.6 11.9 0.93
Mean Total Variance CVColumn _Filter Cap Capped Percentile Capped% Count Min Max
Lost LostTotal% CV%
AG KZONE = 403 2300 0 343 14.08 32374 453 1.51AG KZONE = 403 125 14 99.40% 0.60% 2.40% 12% 2300 0 125 13.74 31596 333.6 1.33AG KZONE = 403 95 24 98.90% 1.00% 4.10% 17% 2300 0 95 13.50 31040 287.6 1.26AG KZONE = 403 75 45 98.00% 2.00% 6.20% 21% 2300 0 75 13.20 30364 246 1.19AG KZONE = 403 62.5 68 97.00% 3.00% 8.40% 25% 2300 0 62.5 12.90 29664 212.3 1.13AG KZONE = 403 52.5 92 96.00% 4.00% 11.00% 29% 2300 0 52.5 12.55 28853 180.9 1.07AG KZONE = 403 47.7 115 95.00% 5.00% 12.00% 31% 2300 0 47.7 12.33 28361 164.8 1.04AG KZONE = 403 42.2 138 94.00% 6.00% 15.00% 34% 2300 0 42.2 12.03 27673 145.2 1AG KZONE = 403 40 160 93.00% 7.00% 16.00% 35% 2300 0 40 11.89 27344 136.9 0.98AG KZONE = 403 37.4 184 92.00% 8.00% 17.00% 36% 2300 0 37.4 11.69 26891 126.3 0.96AG KZONE = 403 34.6 207 91.00% 9.00% 19.00% 38% 2300 0 34.6 11.45 26334 114.5 0.93AG KZONE = 403 32.5 230 90.00% 10.00% 20.00% 40% 2300 0 32.5 11.25 25869 105.5 0.91AG KZONE = 403 - AG > 95 24 96 343 150.60 3614 3882 0.41AG KZONE = 403 - AG <= 95 2276 0 95 12.64 28760 219.8 1.17
MaxColumn _Filter Cap Capped Percentile Capped% CVMean Total VarianceCount Min

DATE: 11/26/2019
REVIEWED: BPDRAWN: BP
FILE: AppendixC_capping2019.xlsx
SCALE: NOT TO SCALE
DESIGN: REVISION NO.
SRK JOB NO.:
ISSUED FOR:
REPORT TITLE:
A544400.020
APPENDIX B-7
GRAN COLOMBIA GOLD MARMATO S.A.S
NI 43-101 TECHNICAL REPORT PRELIMINARY ECONOMIC ASSESSMENTMARMATO PROJECTCAPPING
CHARTS 4000Ag
Lost LostTotal% CV%
AG KZONE = 404 2095 0 914 14.91 31226 1074 2.2AG KZONE = 404 110 19 99.10% 0.90% 7.90% 38% 2095 0 110 13.73 28753 345.6 1.35AG KZONE = 404 95 36 98.40% 1.70% 9.20% 41% 2095 0 95 13.53 28345 311.4 1.3AG KZONE = 404 80 42 98.00% 2.00% 11.00% 44% 2095 0 80 13.25 27764 270.3 1.24AG KZONE = 404 66.5 62 97.10% 3.00% 13.00% 46% 2095 0 66.5 12.94 27113 233.2 1.18AG KZONE = 404 59 81 96.10% 3.90% 15.00% 48% 2095 0 59 12.69 26578 207.8 1.14AG KZONE = 404 54.42 105 95.00% 5.00% 16.00% 50% 2095 0 54.42 12.48 26146 189.6 1.1AG KZONE = 404 49.578 126 94.00% 6.00% 18.00% 52% 2095 0 49.58 12.21 25589 168.5 1.06AG KZONE = 404 42.948 147 93.00% 7.00% 21.00% 54% 2095 0 42.95 11.79 24697 139.4 1AG KZONE = 404 39.856 168 92.00% 8.00% 22.00% 56% 2095 0 39.86 11.56 24214 125.7 0.97AG KZONE = 404 36.835 189 91.00% 9.00% 24.00% 57% 2095 0 36.84 11.30 23678 111.9 0.94AG KZONE = 404 32.02 210 90.00% 10.00% 27.00% 60% 2095 0 32.02 10.85 22722 90.67 0.88AG KZONE = 404 - AG > 95 36 96 914 175.00 6301 25763 0.92AG KZONE = 404 - AG <= 95 2059 0 90 12.11 24925 198.7 1.16
Mean Total Variance CVCapped% Count Min MaxColumn _Filter Cap Capped Percentile
Lost LostTotal% CV%
AG KZONE = 405 5218 0 537.5 11.87 61941 387.8 1.66AG KZONE = 405 150 11 99.80% 0.20% 1.90% 14% 5218 0 150 11.65 60789 274.4 1.42AG KZONE = 405 115 26 99.50% 0.50% 2.90% 18% 5218 0 115 11.53 60140 244.9 1.36AG KZONE = 405 95 38 99.30% 0.70% 3.90% 21% 5218 0 95 11.40 59500 222.1 1.31AG KZONE = 405 75 71 98.60% 1.40% 5.60% 25% 5218 0 75 11.21 58497 194.2 1.24AG KZONE = 405 60 113 97.80% 2.20% 7.70% 29% 5218 0 60 10.96 57164 165.7 1.17AG KZONE = 405 47.5 196 96.30% 3.80% 11.00% 34% 5218 0 47.5 10.60 55302 135.4 1.1AG KZONE = 405 37.147 314 94.00% 6.00% 15.00% 39% 5218 0 37.15 10.11 52732 104.3 1.01AG KZONE = 405 34 362 93.00% 6.90% 17.00% 41% 5218 0 34 9.90 51670 93.95 0.98AG KZONE = 405 31.245 418 92.00% 8.00% 18.00% 43% 5218 0 31.25 9.69 50581 84.43 0.95AG KZONE = 405 28.975 470 91.00% 9.00% 20.00% 44% 5218 0 28.98 9.50 49574 76.52 0.92AG KZONE = 405 27 519 90.00% 9.90% 22.00% 46% 5218 0 27 9.31 48601 69.59 0.9AG KZONE = 405 - AG > 95 38 95.8 537.5 159.20 6051 8129 0.57AG KZONE = 405 - AG <= 95 5180 0 92.92 10.79 55890 172.1 1.22
CVMean Total VarianceCount Min MaxColumn _Filter Cap Capped Percentile Capped%
Lost LostTotal% CV%
AG KZONE = 406 985 0.005 5613 69.10 68059 74591 3.95AG KZONE = 406 800 11 99.00% 1.10% 18.00% 43% 985 0.005 800 56.55 55703 16315 2.26AG KZONE = 406 650 15 98.50% 1.50% 21.00% 46% 985 0.005 650 54.42 53605 13475 2.13AG KZONE = 406 550 24 97.60% 2.40% 24.00% 48% 985 0.005 550 52.62 51826 11510 2.04AG KZONE = 406 450 28 97.20% 2.80% 28.00% 52% 985 0.005 450 49.91 49163 9086 1.91AG KZONE = 406 350 40 96.00% 4.10% 33.00% 56% 985 0.005 350 46.39 45693 6627 1.75AG KZONE = 406 300 44 95.50% 4.50% 36.00% 58% 985 0.005 300 44.30 43636 5459 1.67AG KZONE = 406 246.6 60 94.00% 6.10% 40.00% 61% 985 0.005 246.6 41.57 40946 4206 1.56AG KZONE = 406 200.25 69 93.00% 7.00% 44.00% 63% 985 0.005 200.3 38.57 37994 3110 1.45AG KZONE = 406 169 78 92.00% 7.90% 48.00% 66% 985 0.005 169 36.23 35681 2419 1.36AG KZONE = 406 146.05 89 91.00% 9.00% 50.00% 68% 985 0.005 146.1 34.24 33722 1932 1.28AG KZONE = 406 132.5 99 90.00% 10.10% 52.00% 69% 985 0.005 132.5 32.95 32458 1661 1.24AG KZONE = 406 - AG > 550 24 554 5613 1226.00 29433 1530930 1.01AG KZONE = 406 - AG <= 550 961 0.005 545 40.19 38626 5459 1.84
Mean Total Variance CVColumn _Filter Cap Capped Percentile Capped% Count Min Max

DATE: 11/26/2019
REVIEWED: BPDRAWN: BP
FILE: AppendixC_capping2019.xlsx
SCALE: NOT TO SCALE
DESIGN: REVISION NO.
SRK JOB NO.:
ISSUED FOR:
REPORT TITLE:
A544400.020
APPENDIX B-8
GRAN COLOMBIA GOLD MARMATO S.A.S
NI 43-101 TECHNICAL REPORT PRELIMINARY ECONOMIC ASSESSMENTMARMATO PROJECTCAPPING
CHARTS 5000Au
Lost LostTotal% CV%
AU KZONE = 0 6828 0 262.9 0.598 4084 17.97 7.09AU KZONE = 0 15 18 99.70% 0.30% 18% 65% 6828 0 15 0.489 3340 1.47 2.48AU KZONE = 0 10 29 99.60% 0.40% 21% 69% 6828 0 10 0.474 3234 1.11 2.22AU KZONE = 0 9 34 99.50% 0.50% 22% 70% 6828 0 9 0.469 3203 1.02 2.16AU KZONE = 0 8 45 99.30% 0.70% 23% 71% 6828 0 8 0.463 3161 0.93 2.08AU KZONE = 0 7.5 52 99.30% 0.80% 23% 71% 6828 0 7.5 0.459 3137 0.87 2.04AU KZONE = 0 6.5 62 99.10% 0.90% 25% 73% 6828 0 6.5 0.451 3080 0.77 1.94AU KZONE = 0 5.5 82 98.70% 1.20% 26% 74% 6828 0 5.5 0.441 3010 0.65 1.83AU KZONE = 0 4 115 98.30% 1.70% 30% 77% 6828 0 4 0.419 2864 0.47 1.63AU KZONE = 0 3 159 97.70% 2.30% 33% 79% 6828 0 3 0.4 2732 0.35 1.48AU KZONE = 0 2 267 96.10% 3.90% 38% 82% 6828 0 2 0.371 2531 0.23 1.29AU KZONE = 0 - AU > 7.5 52 7.52 262.9 25.71 1337 1691 1.6AU KZONE = 0 - AU <= 7.5 6776 0 7.44 0.405 2747 0.5 1.74
CVVarianceColumn _Filter Cap Capped Percentile Capped% Count Min Max Mean Total
Lost LostTotal% CV%
AU KZONE = 1 5393 0.001 345.9 1.726 9307 42.33 3.77AU KZONE = 1 60 5 99.90% 0.10% 5.40% 42% 5393 0.001 60 1.633 8806 12.58 2.17AU KZONE = 1 30 17 99.70% 0.30% 8.70% 52% 5393 0.001 30 1.576 8499 7.99 1.79AU KZONE = 1 20 30 99.40% 0.60% 11% 57% 5393 0.001 20 1.534 8273 6.07 1.61AU KZONE = 1 12 74 98.70% 1.40% 15% 63% 5393 0.001 12 1.463 7887 4.07 1.38AU KZONE = 1 10 100 98.20% 1.90% 17% 65% 5393 0.001 10 1.431 7717 3.47 1.3AU KZONE = 1 8 138 97.40% 2.60% 20% 68% 5393 0.001 8 1.387 7478 2.8 1.21AU KZONE = 1 7 176 96.70% 3.30% 21% 69% 5393 0.001 7 1.358 7322 2.45 1.15AU KZONE = 1 6 216 96% 4% 23% 71% 5393 0.001 6 1.321 7125 2.07 1.09AU KZONE = 1 5 292 94.60% 5.40% 26% 73% 5393 0.001 5 1.275 6874 1.68 1.02AU KZONE = 1 4 398 92.60% 7.40% 30% 75% 5393 0.001 4 1.211 6529 1.27 0.93AU KZONE = 1 - AU > 3.5 474 3.508 345.9 9.821 4655 404.3 2.05AU KZONE = 1 - AU <= 3.5 4919 0.001 3.5 0.946 4652 0.59 0.81
Mean Total Variance CVColumn _Filter Cap Capped Percentile Capped% Count Min Max
Lost LostTotal% CV%
AU KZONE = 2 2073 0.001 246.5 4.083 8464 90.65 2.33AU KZONE = 2 62 5 99.80% 0.20% 5.20% 34% 2073 0.001 62 3.869 8021 35.45 1.54AU KZONE = 2 30 25 98.80% 1.20% 9.30% 45% 2073 0.001 30 3.701 7673 22.61 1.28AU KZONE = 2 25 28 98.70% 1.40% 11% 48% 2073 0.001 25 3.637 7540 19.57 1.22AU KZONE = 2 19 52 97.50% 2.50% 14% 52% 2073 0.001 19 3.526 7310 15.55 1.12AU KZONE = 2 15 76 96.30% 3.70% 17% 56% 2073 0.001 15 3.405 7059 12.3 1.03AU KZONE = 2 12 104 95% 5% 20% 59% 2073 0.001 12 3.274 6788 9.66 0.95AU KZONE = 2 11 126 93.90% 6.10% 21% 61% 2073 0.001 11 3.219 6674 8.75 0.92AU KZONE = 2 10 148 92.90% 7.10% 23% 62% 2073 0.001 10 3.153 6537 7.79 0.89AU KZONE = 2 9 174 91.60% 8.40% 25% 64% 2073 0.001 9 3.077 6379 6.82 0.85AU KZONE = 2 8 207 90% 10% 27% 65% 2073 0.001 8 2.986 6190 5.82 0.81AU KZONE = 2 - AU > 30 25 30.09 246.5 61.64 1541 3110 0.9AU KZONE = 2 - AU <= 30 2048 0.001 29.88 3.38 6923 14.33 1.12
Variance CVCapped% Count Min Max Mean TotalColumn _Filter Cap Capped Percentile

DATE: 11/26/2019
REVIEWED: BPDRAWN: BP
FILE: AppendixC_capping2019.xlsx
SCALE: NOT TO SCALE
DESIGN: REVISION NO.
SRK JOB NO.:
ISSUED FOR:
REPORT TITLE:
A544400.020
APPENDIX B-9
GRAN COLOMBIA GOLD MARMATO S.A.S
NI 43-101 TECHNICAL REPORT PRELIMINARY ECONOMIC ASSESSMENTMARMATO PROJECTCAPPING
CHARTS 5000Ag
Lost LostTotal% CV%
AG 14,294 0 316.1 4.14 59,121 104.2 2.47AG 125.0 13 99.9% 0.10% 1.70% 11% 14,294 0 125 4.07 58,128 79.33 2.19AG 80.0 28 99.8% 0.20% 3.20% 17% 14,294 0 80 4.01 57,243 67.42 2.05AG 70.0 43 99.7% 0.30% 3.80% 19% 14,294 0 70 3.98 56,902 64.04 2.01AG 60.0 59 99.6% 0.40% 4.60% 21% 14,294 0 60 3.95 56,402 59.79 1.96AG 50.0 103 99.3% 0.70% 5.90% 23% 14,294 0 50 3.89 55,622 54.26 1.89AG 40.0 192 98.7% 1.30% 8.30% 27% 14,294 0 40 3.79 54,190 46.12 1.79AG 30.0 337 97.6% 2.40% 13% 34% 14,294 0 30 3.61 51,534 34.64 1.63AG 22.5 497 96.0% 3.50% 18% 40% 14,294 0 22.5 3.39 48,465 24.98 1.47AG 15.7 785 94.5% 5.50% 25% 48% 14,294 0 15.65 3.09 44,142 15.56 1.28AG 10.0 1219 91.4% 8.50% 35% 57% 14,294 0 10 2.71 38,669 8.12 1.05AG AG > 30 337 30.1 316.1 52.51 17,697 1271 0.68AG AG <= 30 13,957 0 29.88 2.97 41,424 18.25 1.44
CVCount Min Max Mean Total VarianceCapped%Column _Filter Cap Capped Percentile

SRK Consulting (U.S.), Inc. NI 43-101 Technical Report – Marmato Appendices
MMS/KD Marmato_PEA_NI43-101_544400.020_Rev31_KD.docx November 2019
Appendix C: Swath Plots

DATE: 11/25/2019
REVIEWED: BPDRAWN: BP
FILE:
SCALE: NOT TO SCALE
DESIGN: REVISION NO.
SRK JOB NO.:
ISSUED FOR:
REPORT TITLE:
A544400.020
APPENDIX C-1
GRAN COLOMBIA GOLD MARMATO S.A.S
NI 43-101 TECHNICAL REPORT PRELIMINARY ECONOMIC ASSESSMENT MARMATO PROJECT
SWATH PLOTS1000Au
Appendix-B-validation_stats_swath.xlsx
600 800 1000 1200 1400 1600
Slice Centroid (mX)
0
1
2
3
4
5
6
7
0
200
400
600
800
1000
1200
1400
1600
AU [>
= 0
] Ave
rage
Gra
de
Num
ber o
f Sam
ples
10m X
Validation Trend Plot
Density: 1AU_NN [1000est_depLocal.dm]Estimate Mean
Density: 1AU_ID [1000est_depLocal.dm]Estimate Mean
Density: 1AU_K [1000est_depLocal.dm]Estimate Mean
Declustered Mean
600 800 1000 1200 1400 1600
Slice Centroid (mX)
0
1
2
3
4
5
6
7
0
500
1000
1500
2000
AU [>
= 0
] Ave
rage
Gra
de
Num
ber o
f Sam
ples
20m X
Validation Trend Plot
Density: 1AU_NN [1000est_depLocal.dm]Estimate Mean
Density: 1AU_ID [1000est_depLocal.dm]Estimate Mean
Density: 1AU_K [1000est_depLocal.dm]Estimate Mean
Declustered Mean
300 400 500 600 700 800 900 1000 1100 1200 1300
Slice Centroid (mY)
0
1
2
3
4
5
6
7
8
0
100
200
300
400
500
600
700
800
900
1000
AU [>
= 0
] Ave
rage
Gra
de
Num
ber o
f Sam
ples
10m Y
Validation Trend Plot
Density: 1AU_NN [1000est_depLocal.dm]Estimate Mean
Density: 1AU_ID [1000est_depLocal.dm]Estimate Mean
Density: 1AU_K [1000est_depLocal.dm]Estimate Mean
Declustered Mean
300 400 500 600 700 800 900 1000 1100 1200 1300
Slice Centroid (mY)
0
1
2
3
4
5
6
0
100
200
300
400
500
600
700
800
900
1000
AU [>
= 0
] Ave
rage
Gra
de
Num
ber o
f Sam
ples
20m Y
Validation Trend Plot
Density: 1AU_NN [1000est_depLocal.dm]Estimate Mean
Density: 1AU_ID [1000est_depLocal.dm]Estimate Mean
Density: 1AU_K [1000est_depLocal.dm]Estimate Mean
Declustered Mean
900 1000 1100 1200 1300 1400 1500 1600 1700
Slice Centroid (mZ)
0
1
2
3
4
5
6
7
8
0
500
1000
1500
2000
2500
3000
3500
4000
4500
AU [>
= 0
] Ave
rage
Gra
de
Num
ber o
f Sam
ples
15m Z
Validation Trend Plot
Density: 1AU_NN [1000est_depLocal.dm]Estimate Mean
Density: 1AU_ID [1000est_depLocal.dm]Estimate Mean
Density: 1AU_K [1000est_depLocal.dm]Estimate Mean
Declustered Mean

DATE: 11/25/2019
REVIEWED: BPDRAWN: BP
FILE:
SCALE: NOT TO SCALE
DESIGN: REVISION NO.
SRK JOB NO.:
ISSUED FOR:
REPORT TITLE:
A544400.020
APPENDIX C-2
GRAN COLOMBIA GOLD MARMATO S.A.S
NI 43-101 TECHNICAL REPORT PRELIMINARY ECONOMIC ASSESSMENT MARMATO PROJECT
SWATH PLOTS1000Ag
Appendix-B-validation_stats_swath.xlsx
600 800 1000 1200 1400 1600
Slice Centroid (mX)
0
10
20
30
40
50
60
70
80
0
100
200
300
400
500
600
700
AG [>
= 0
] Ave
rage
Gra
de
Num
ber o
f Sam
ples
10m X
Validation Trend Plot
Density: 1AG_NN [1000est_depLocal.dm]Estimate Mean
Density: 1AG_ID [1000est_depLocal.dm]Estimate Mean
Density: 1AG_K [1000est_depLocal.dm]Estimate Mean
Declustered Mean
300 400 500 600 700 800 900 1000 1100 1200 1300
Slice Centroid (mY)
0
10
20
30
40
50
60
70
0
500
1000
1500
2000
2500
3000
3500
4000
AG [>
= 0
] Ave
rage
Gra
de
Num
ber o
f Sam
ples
20m Y
Validation Trend Plot
Density: 1AG_NN [1000est_depLocal.dm]Estimate Mean
Density: 1AG_ID [1000est_depLocal.dm]Estimate Mean
Density: 1AG_K [1000est_depLocal.dm]Estimate Mean
Declustered Mean
900 1000 1100 1200 1300 1400 1500 1600 1700
Slice Centroid (mZ)
0
10
20
30
40
50
60
70
80
90
100
0
500
1000
1500
2000
2500
3000
3500
4000
4500
5000
5500
AG [>
= 0
] Ave
rage
Gra
de
Num
ber o
f Sam
ples
10m Z
Validation Trend Plot
Density: 1AG_NN [1000est_depLocal.dm]Estimate Mean
Density: 1AG_ID [1000est_depLocal.dm]Estimate Mean
Density: 1AG_K [1000est_depLocal.dm]Estimate Mean
Declustered Mean

DATE: 11/25/2019
REVIEWED: BPDRAWN: BP
FILE:
SCALE: NOT TO SCALE
DESIGN: REVISION NO.
SRK JOB NO.:
ISSUED FOR:
REPORT TITLE:
A544400.020
APPENDIX C-3
GRAN COLOMBIA GOLD MARMATO S.A.S
NI 43-101 TECHNICAL REPORT PRELIMINARY ECONOMIC ASSESSMENT MARMATO PROJECT
SWATH PLOTS3000Au
Appendix-B-validation_stats_swath.xlsx
800 900 1000 1100 1200 1300 1400 1500 1600
Slice Centroid (mX)
2
4
6
8
10
12
14
0
20
40
60
80
100
120
140
160
180
200
AU [>
= 0
] Ave
rage
Gra
de
Num
ber o
f Sam
ples
GROUP = 3000, 20m X
Validation Trend Plot
Density: DENSITYFilters: GROUP = 3000AU_NN [3000est_local.dm]Estimate Mean
Density: DENSITYFilters: GROUP = 3000AU_ID [3000est_local.dm]Estimate Mean
Density: DENSITYFilters: GROUP = 3000AU_OK [3000est_local.dm]Estimate Mean
Declustered Mean
800 900 1000 1100 1200 1300 1400 1500 1600
Slice Centroid (mX)
2
4
6
8
10
12
14
16
18
20
0
20
40
60
80
100
120
140
160
180
200
AU [>
= 0
] Ave
rage
Gra
de
Num
ber o
f Sam
ples
GROUP = 3000, 20m X
Validation Trend Plot
Density: DENSITYFilters: GROUP = 3000AU_NN [3000est_local.dm]Estimate Mean
Density: DENSITYFilters: GROUP = 3000AU_ID [3000est_local.dm]Estimate Mean
Density: DENSITYFilters: GROUP = 3000AU_OK [3000est_local.dm]Estimate Mean
Declustered Mean
500 600 700 800 900 1000 1100
Slice Centroid (mY)
0
5
10
15
20
25
0
10
20
30
40
50
60
AU [>
= 0
] Ave
rage
Gra
de
Num
ber o
f Sam
ples
GROUP = 3000, 10m Y
Validation Trend Plot
Density: DENSITYFilters: GROUP = 3000AU_NN [3000est_local.dm]Estimate Mean
Density: DENSITYFilters: GROUP = 3000AU_ID [3000est_local.dm]Estimate Mean
Density: DENSITYFilters: GROUP = 3000AU_OK [3000est_local.dm]Estimate Mean
Declustered Mean
500 600 700 800 900 1000 1100
Slice Centroid (mY)
0
5
10
15
20
0
10
20
30
40
50
60
AU [>
= 0
] Ave
rage
Gra
de
Num
ber o
f Sam
ples
GROUP = 3000, 10m Y
Validation Trend Plot
Density: DENSITYFilters: GROUP = 3000AU_NN [3000est_local.dm]Estimate Mean
Density: DENSITYFilters: GROUP = 3000AU_ID [3000est_local.dm]Estimate Mean
Density: DENSITYFilters: GROUP = 3000AU_OK [3000est_local.dm]Estimate Mean
Declustered Mean
1100 1150 1200 1250 1300 1350 1400 1450 1500 1550 1600
Slice Centroid (mZ)
0
1
2
3
4
5
6
7
8
9
0
20
40
60
80
100
120
AU [>
= 0
] Ave
rage
Gra
de
Num
ber o
f Sam
ples
GROUP = 3000, 10m Z
Validation Trend Plot
Density: DENSITYFilters: GROUP = 3000AU_NN [3000est_local.dm]Estimate Mean
Density: DENSITYFilters: GROUP = 3000AU_ID [3000est_local.dm]Estimate Mean
Density: DENSITYFilters: GROUP = 3000AU_OK [3000est_local.dm]Estimate Mean
Declustered Mean
1100 1150 1200 1250 1300 1350 1400 1450 1500 1550
Slice Centroid (mZ)
0
2
4
6
8
10
12
14
16
18
0
20
40
60
80
100
120
140
AU [>
= 0
] Ave
rage
Gra
de
Num
ber o
f Sam
ples
GROUP = 3000, 10m Z
Validation Trend Plot
Density: DENSITYFilters: GROUP = 3000AU_NN [3000est_local.dm]Estimate Mean
Density: DENSITYFilters: GROUP = 3000AU_ID [3000est_local.dm]Estimate Mean
Density: DENSITYFilters: GROUP = 3000AU_OK [3000est_local.dm]Estimate Mean
Declustered Mean

DATE: 11/25/2019
REVIEWED: BPDRAWN: BP
FILE:
SCALE: NOT TO SCALE
DESIGN: REVISION NO.
SRK JOB NO.:
ISSUED FOR:
REPORT TITLE:
A544400.020
APPENDIX C-4
GRAN COLOMBIA GOLD MARMATO S.A.S
NI 43-101 TECHNICAL REPORT PRELIMINARY ECONOMIC ASSESSMENT MARMATO PROJECT
SWATH PLOTS3000Ag
Appendix-B-validation_stats_swath.xlsx
800 900 1000 1100 1200 1300 1400 1500 1600
Slice Centroid (mX)
0
10
20
30
40
50
60
70
80
0
10
20
30
40
50
60
70
80
90
AG [>
= 0
] Ave
rage
Gra
de
Num
ber o
f Sam
ples
GROUP = 3000, 10m X
Validation Trend Plot
Density: DENSITYFilters: GROUP = 3000AG_NN [3000est_local.dm]Estimate Mean
Density: DENSITYFilters: GROUP = 3000AG_ID [3000est_local.dm]Estimate Mean
Density: DENSITYFilters: GROUP = 3000AG_OK [3000est_local.dm]Estimate Mean
Declustered Mean
500 600 700 800 900 1000 1100
Slice Centroid (mY)
0
10
20
30
40
50
60
70
0
5
10
15
20
25
30
35
40
45
AG [>
= 0
] Ave
rage
Gra
de
Num
ber o
f Sam
ples
GROUP = 3000, 10m Y
Validation Trend Plot
Density: DENSITYFilters: GROUP = 3000AG_NN [3000est_local.dm]Estimate Mean
Density: DENSITYFilters: GROUP = 3000AG_ID [3000est_local.dm]Estimate Mean
Density: DENSITYFilters: GROUP = 3000AG_OK [3000est_local.dm]Estimate Mean
Declustered Mean
1100 1150 1200 1250 1300 1350 1400 1450 1500 1550
Slice Centroid (mZ)
0
5
10
15
20
25
30
35
40
0
20
40
60
80
100
120
140
AG [>
= 0
] Ave
rage
Gra
de
Num
ber o
f Sam
ples
GROUP = 3000, 10m Z
Validation Trend Plot
Density: DENSITYFilters: GROUP = 3000AG_NN [3000est_local.dm]Estimate Mean
Density: DENSITYFilters: GROUP = 3000AG_ID [3000est_local.dm]Estimate Mean
Density: DENSITYFilters: GROUP = 3000AG_OK [3000est_local.dm]Estimate Mean
Declustered Mean

DATE: 11/25/2019
REVIEWED: BPDRAWN: BP
FILE:
SCALE: NOT TO SCALE
DESIGN: REVISION NO.
SRK JOB NO.:
ISSUED FOR:
REPORT TITLE:
A544400.020
APPENDIX C-5
GRAN COLOMBIA GOLD MARMATO S.A.S
NI 43-101 TECHNICAL REPORT PRELIMINARY ECONOMIC ASSESSMENT MARMATO PROJECT
SWATH PLOTS4000Au
Appendix-B-validation_stats_swath.xlsx
400 600 800 1000 1200 1400 1600 1800
Slice Centroid (mX)
0
2
4
6
8
10
12
0
100
200
300
400
500
600
AU [>
= 0
] Ave
rage
Gra
de
Num
ber o
f Sam
ples
20m X
Validation Trend Plot
Density: DENSITYAUNN [pymod072019d.dm]Estimate Mean
Density: DENSITYAUID [pymod072019d.dm]Estimate Mean
Density: DENSITYAUOK [pymod072019d.dm]Estimate Mean
Declustered Mean
300 400 500 600 700 800 900 1000 1100 1200 1300
Slice Centroid (mY)
0.0
0.5
1.0
1.5
2.0
2.5
3.0
3.5
4.0
4.5
5.0
0
100
200
300
400
500
600
700
AU [>
= 0
] Ave
rage
Gra
de
Num
ber o
f Sam
ples
20m Y
Validation Trend Plot
Density: DENSITYAUNN [pymod072019d.dm]Estimate Mean
Density: DENSITYAUID [pymod072019d.dm]Estimate Mean
Density: DENSITYAUOK [pymod072019d.dm]Estimate Mean
Declustered Mean
700 800 900 1000 1100 1200 1300 1400 1500 1600 1700
Slice Centroid (mZ)
0
1
2
3
4
5
6
7
8
9
0
50
100
150
200
250
300
350
400
450
AU [>
= 0
] Ave
rage
Gra
de
Num
ber o
f Sam
ples
5m Z
Validation Trend Plot
Density: DENSITYAUNN [pymod072019d.dm]Estimate Mean
Density: DENSITYAUID [pymod072019d.dm]Estimate Mean
Density: DENSITYAUOK [pymod072019d.dm]Estimate Mean
Declustered Mean

DATE: 11/25/2019
REVIEWED: BPDRAWN: BP
FILE:
SCALE: NOT TO SCALE
DESIGN: REVISION NO.
SRK JOB NO.:
ISSUED FOR:
REPORT TITLE:
A544400.020
APPENDIX C-6
GRAN COLOMBIA GOLD MARMATO S.A.S
NI 43-101 TECHNICAL REPORT PRELIMINARY ECONOMIC ASSESSMENT MARMATO PROJECT
SWATH PLOTS4000Ag
Appendix-B-validation_stats_swath.xlsx
400 600 800 1000 1200 1400 1600 1800
Slice Centroid (mX)
0
20
40
60
80
100
120
0
50
100
150
200
250
300
350
AG [>
= 0
] Ave
rage
Gra
de
Num
ber o
f Sam
ples
20m X
Validation Trend Plot
Density: DENSITYAGNN [pymod072019d.dm]Estimate Mean
Density: DENSITYAGID [pymod072019d.dm]Estimate Mean
Density: DENSITYAGOK [pymod072019d.dm]Estimate Mean
Declustered Mean
300 400 500 600 700 800 900 1000 1100 1200 1300
Slice Centroid (mY)
0
20
40
60
80
100
120
140
160
180
200
0
50
100
150
200
250
300
350
AG [>
= 0
] Ave
rage
Gra
de
Num
ber o
f Sam
ples
10m Y
Validation Trend Plot
Density: DENSITYAGNN [pymod072019d.dm]Estimate Mean
Density: DENSITYAGID [pymod072019d.dm]Estimate Mean
Density: DENSITYAGOK [pymod072019d.dm]Estimate Mean
Declustered Mean
700 800 900 1000 1100 1200 1300 1400 1500 1600 1700
Slice Centroid (mZ)
0
50
100
150
200
250
300
350
400
0
50
100
150
200
250
300
350
400
450
AG [>
= 0
] Ave
rage
Gra
de
Num
ber o
f Sam
ples
10m Z
Validation Trend Plot
Density: DENSITYAGNN [pymod072019d.dm]Estimate Mean
Density: DENSITYAGID [pymod072019d.dm]Estimate Mean
Density: DENSITYAGOK [pymod072019d.dm]Estimate Mean
Declustered Mean

DATE: 11/25/2019
REVIEWED: BPDRAWN: BP
FILE:
SCALE: NOT TO SCALE
DESIGN: REVISION NO.
SRK JOB NO.:
ISSUED FOR:
REPORT TITLE:
A544400.020
APPENDIX C-7
GRAN COLOMBIA GOLD MARMATO S.A.S
NI 43-101 TECHNICAL REPORT PRELIMINARY ECONOMIC ASSESSMENT MARMATO PROJECT
SWATH PLOTS5000Au
Appendix-B-validation_stats_swath.xlsx
850 900 950 1000 1050 1100 1150
Slice Centroid (mX)
0.2
0.4
0.6
0.8
1.0
1.2
1.4
1.6
1.8
2.0
50
100
150
200
250
300
350
400
450
500
550
AU [>
= 0
] Ave
rage
Gra
de
Num
ber o
f Sam
ples
KZONE = 0, 10m X
Validation Trend Plot
Density: DENSITYFilters: KZONE = 0AUNN [pomodz012.dm]Estimate Mean
Density: DENSITYFilters: KZONE = 0AUID [pomodz012.dm]Estimate Mean
Density: DENSITYFilters: KZONE = 0AUOK [pomodz012.dm]Estimate Mean
Filters: KZONE = 0Data: AU [>= 0 ] [local_5000c2mc.dm]Sample CountDeclustered MeanNaive Mean
900 950 1000 1050 1100 1150 1200
Slice Centroid (mX)
0.0
0.5
1.0
1.5
2.0
2.5
3.0
3.5
0
50
100
150
200
250
300
350
AU [>
= 0
] Ave
rage
Gra
de
Num
ber o
f Sam
ples
KZONE = 1, 10m X
Validation Trend Plot
Density: DENSITYFilters: KZONE = 1AUNN [pomodz012.dm]Estimate Mean
Density: DENSITYFilters: KZONE = 1AUID [pomodz012.dm]Estimate Mean
Density: DENSITYFilters: KZONE = 1AUOK [pomodz012.dm]Estimate Mean
Declustered Mean
960 980 1000 1020 1040 1060 1080 1100
Slice Centroid (mX)
0.0
0.5
1.0
1.5
2.0
2.5
3.0
3.5
4.0
4.5
5.0
5.5
0
20
40
60
80
100
120
140
160
180
200
220
AU [>
= 0
] Ave
rage
Gra
de
Num
ber o
f Sam
ples
KZONE = 2, 10m X
Validation Trend Plot
Density: DENSITYFilters: KZONE = 2AUNN [pomodz012.dm]Estimate Mean
Density: DENSITYFilters: KZONE = 2AUID [pomodz012.dm]Estimate Mean
Density: DENSITYFilters: KZONE = 2AUOK [pomodz012.dm]Estimate Mean
Declustered Mean
600 700 800 900 1000 1100 1200 1300
Slice Centroid (mY)
0.0
0.1
0.2
0.3
0.4
0.5
0.6
0.7
0.8
0
100
200
300
400
500
600
700
AU [>
= 0
] Ave
rage
Gra
de
Num
ber o
f Sam
ples
KZONE = 0, 10m Y
Validation Trend Plot
Density: DENSITYFilters: KZONE = 0AUNN [pomodz012.dm]Estimate Mean
Density: DENSITYFilters: KZONE = 0AUID [pomodz012.dm]Estimate Mean
Density: DENSITYFilters: KZONE = 0AUOK [pomodz012.dm]Estimate Mean
Declustered Mean
700 800 900 1000 1100 1200 1300
Slice Centroid (mY)
0.0
0.5
1.0
1.5
2.0
2.5
3.0
3.5
0
50
100
150
200
250
300
AU [>
= 0
] Ave
rage
Gra
de
Num
ber o
f Sam
ples
KZONE = 1, 10m Y
Validation Trend Plot
Density: DENSITYFilters: KZONE = 1AUNN [pomodz012.dm]Estimate Mean
Density: DENSITYFilters: KZONE = 1AUID [pomodz012.dm]Estimate Mean
Density: DENSITYFilters: KZONE = 1AUOK [pomodz012.dm]Estimate Mean
Declustered Mean
750 800 850 900 950 1000 1050 1100 1150
Slice Centroid (mY)
0
1
2
3
4
5
6
7
8
9
10
0
10
20
30
40
50
60
70
80
90
AU [>
= 0
] Ave
rage
Gra
de
Num
ber o
f Sam
ples
KZONE = 2, 10m Y
Validation Trend Plot
Density: DENSITYFilters: KZONE = 2AUNN [pomodz012.dm]Estimate Mean
Density: DENSITYFilters: KZONE = 2AUID [pomodz012.dm]Estimate Mean
Density: DENSITYFilters: KZONE = 2AUOK [pomodz012.dm]Estimate Mean
Declustered Mean
500 600 700 800 900 1000 1100
Slice Centroid (mZ)
0.0
0.5
1.0
1.5
2.0
2.5
0
100
200
300
400
500
600
700
800
900
AU [>
= 0
] Ave
rage
Gra
de
Num
ber o
f Sam
ples
KZONE = 0, 5m Z
Validation Trend Plot
Density: DENSITYFilters: KZONE = 0AUNN [pomodz012.dm]Estimate Mean
Density: DENSITYFilters: KZONE = 0AUID [pomodz012.dm]Estimate Mean
Density: DENSITYFilters: KZONE = 0AUOK [pomodz012.dm]Estimate Mean
Declustered Mean
500 600 700 800 900 1000 1100
Slice Centroid (mZ)
0.0
0.5
1.0
1.5
2.0
2.5
3.0
3.5
0
50
100
150
200
250
300
350
AU [>
= 0
] Ave
rage
Gra
de
Num
ber o
f Sam
ples
KZONE = 1, 10m Z
Validation Trend Plot
Density: DENSITYFilters: KZONE = 1AUNN [pomodz012.dm]Estimate Mean
Density: DENSITYFilters: KZONE = 1AUID [pomodz012.dm]Estimate Mean
Density: DENSITYFilters: KZONE = 1AUOK [pomodz012.dm]Estimate Mean
Declustered Mean
500 600 700 800 900 1000
Slice Centroid (mZ)
0
2
4
6
8
10
12
14
0
10
20
30
40
50
60
70
80
AU [>
= 0
] Ave
rage
Gra
de
Num
ber o
f Sam
ples
KZONE = 2, 10m Z
Validation Trend Plot
Density: DENSITYFilters: KZONE = 2AUNN [pomodz012.dm]Estimate Mean
Density: DENSITYFilters: KZONE = 2AUID [pomodz012.dm]Estimate Mean
Density: DENSITYFilters: KZONE = 2AUOK [pomodz012.dm]Estimate Mean
Declustered Mean

DATE: 11/25/2019
REVIEWED: BPDRAWN: BP
FILE:
SCALE: NOT TO SCALE
DESIGN: REVISION NO.
SRK JOB NO.:
ISSUED FOR:
REPORT TITLE:
A544400.020
APPENDIX C-8
GRAN COLOMBIA GOLD MARMATO S.A.S
NI 43-101 TECHNICAL REPORT PRELIMINARY ECONOMIC ASSESSMENT MARMATO PROJECT
SWATH PLOTS5000Ag
Appendix-B-validation_stats_swath.xlsx
850 900 950 1000 1050 1100 1150 1200
Slice Centroid (mX)
0.5
1.0
1.5
2.0
2.5
3.0
3.5
4.0
4.5
20
40
60
80
100
120
140
160
180
AG [>
= 0 ] A
vera
ge G
rade
Num
ber o
f Sam
ples
KZONE = 0, 5m X
Validation Trend Plot
Density: DENSITYFilters: KZONE = 0AGNN [pomodz012.dm]Estimate Mean
Density: DENSITYFilters: KZONE = 0AGID [pomodz012.dm]Estimate Mean
Density: DENSITYFilters: KZONE = 0AGOK [pomodz012.dm]Estimate Mean
Declustered Mean
900 950 1000 1050 1100 1150
Slice Centroid (mX)
0
1
2
3
4
5
6
7
8
9
10
11
0
50
100
150
200
250
300
350
AG [>
= 0 ] A
vera
ge G
rade
Num
ber o
f Sam
ples
KZONE = 1, 10m X
Validation Trend Plot
Density: DENSITYFilters: KZONE = 1AGNN [pomodz012.dm]Estimate Mean
Density: DENSITYFilters: KZONE = 1AGID [pomodz012.dm]Estimate Mean
Density: DENSITYFilters: KZONE = 1AGOK [pomodz012.dm]Estimate Mean
Declustered Mean
960 980 1000 1020 1040 1060 1080 1100
Slice Centroid (mX)
0
1
2
3
4
5
6
7
0
20
40
60
80
100
120
140
160
180
200
220
AG [>
= 0 ] A
vera
ge G
rade
Num
ber o
f Sam
ples
KZONE = 2, 10m X
Validation Trend Plot
Density: DENSITYFilters: KZONE = 2AGNN [pomodz012.dm]Estimate Mean
Density: DENSITYFilters: KZONE = 2AGID [pomodz012.dm]Estimate Mean
Density: DENSITYFilters: KZONE = 2AGOK [pomodz012.dm]Estimate Mean
Declustered Mean
600 700 800 900 1000 1100 1200 1300
Slice Centroid (mY)
0.0
0.5
1.0
1.5
2.0
2.5
3.0
3.5
4.0
4.5
5.0
0
50
100
150
200
250
300
350
AG [>
= 0 ] A
vera
ge G
rade
Num
ber o
f Sam
ples
KZONE = 0, 10m Y
Validation Trend Plot
Density: DENSITYFilters: KZONE = 0AGNN [pomodz012.dm]Estimate Mean
Density: DENSITYFilters: KZONE = 0AGID [pomodz012.dm]Estimate Mean
Density: DENSITYFilters: KZONE = 0AGOK [pomodz012.dm]Estimate Mean
Declustered Mean
700 800 900 1000 1100 1200 1300
Slice Centroid (mY)
0
1
2
3
4
5
6
7
0
20
40
60
80
100
120
140
160
180
200
AG [>
= 0 ] A
vera
ge G
rade
Num
ber o
f Sam
ples
KZONE = 1, 10m Y
Validation Trend Plot
Density: DENSITYFilters: KZONE = 1AGNN [pomodz012.dm]Estimate Mean
Density: DENSITYFilters: KZONE = 1AGID [pomodz012.dm]Estimate Mean
Density: DENSITYFilters: KZONE = 1AGOK [pomodz012.dm]Estimate Mean
Declustered Mean
750 800 850 900 950 1000 1050 1100 1150
Slice Centroid (mY)
0
2
4
6
8
10
12
14
16
18
20
22
0
10
20
30
40
50
60
70
80
90
AG [>
= 0 ] A
vera
ge G
rade
Num
ber o
f Sam
ples
KZONE = 2, 10m Y
Validation Trend Plot
Density: DENSITYFilters: KZONE = 2AGNN [pomodz012.dm]Estimate Mean
Density: DENSITYFilters: KZONE = 2AGID [pomodz012.dm]Estimate Mean
Density: DENSITYFilters: KZONE = 2AGOK [pomodz012.dm]Estimate Mean
Declustered Mean
500 600 700 800 900 1000 1100
Slice Centroid (mZ)
0.0
0.5
1.0
1.5
2.0
2.5
3.0
3.5
4.0
0
50
100
150
200
250
300
350
400
450
500
AG [>
= 0 ] A
vera
ge G
rade
Num
ber o
f Sam
ples
KZONE = 0, 10m Z
Validation Trend Plot
Density: DENSITYFilters: KZONE = 0AGNN [pomodz012.dm]Estimate Mean
Density: DENSITYFilters: KZONE = 0AGID [pomodz012.dm]Estimate Mean
Density: DENSITYFilters: KZONE = 0AGOK [pomodz012.dm]Estimate Mean
Declustered Mean
500 600 700 800 900 1000 1100
Slice Centroid (mZ)
0
2
4
6
8
10
12
0
20
40
60
80
100
120
AG [>
= 0 ] A
vera
ge G
rade
Num
ber o
f Sam
ples
KZONE = 1, 10m Z
Validation Trend Plot
Density: DENSITYFilters: KZONE = 1AGNN [pomodz012.dm]Estimate Mean
Density: DENSITYFilters: KZONE = 1AGID [pomodz012.dm]Estimate Mean
Density: DENSITYFilters: KZONE = 1AGOK [pomodz012.dm]Estimate Mean
Declustered Mean
500 600 700 800 900 1000
Slice Centroid (mZ)
0
5
10
15
20
25
30
0
10
20
30
40
50
60
70
80
AG [>
= 0 ] A
vera
ge G
rade
Num
ber o
f Sam
ples
KZONE = 2, 10m Z
Validation Trend Plot
Density: DENSITYFilters: KZONE = 2AGNN [pomodz012.dm]Estimate Mean
Density: DENSITYFilters: KZONE = 2AGID [pomodz012.dm]Estimate Mean
Density: DENSITYFilters: KZONE = 2AGOK [pomodz012.dm]Estimate Mean
Declustered Mean

SRK Consulting (U.S.), Inc. NI 43-101 Technical Report – Marmato Appendices
MMS/KD Marmato_PEA_NI43-101_544400.020_Rev31_KD.docx November 2019
Appendix D: Annual TEM

Total 2019 2020 2021 2022 2023 2024 2025 2026 2027 2028
Tonnes milled 11,135,047 109,383 349,997 402,491 350,004 1,190,079 1,750,055 1,750,078 1,750,005 1,750,065 1,732,890 Head grade (g/t Au) 3.20 3.95 3.77 3.53 3.64 3.33 3.19 3.53 3.32 2.90 2.66 Contained gold (ozs) 1,147,106 13,878 42,459 45,642 40,913 127,272 179,637 198,477 187,046 163,433 148,350 Recovery 92% 87% 87% 87% 87% 92% 93% 93% 93% 93% 92%Gold produced (ozs) 1,055,500 12,004 36,727 39,480 35,390 117,433 167,169 184,969 173,944 151,357 137,026 Silver produced (ozs) 912,215 16,721 45,435 47,037 53,829 97,682 123,453 128,793 140,508 122,995 135,762
Spot gold price ($/oz) 1,300 1,300 1,300 1,300 1,300 1,300 1,300 1,300 1,300 1,300 Spot silver price ($/oz) 17 17 17 17 17 17 17 17 17 17 Cash cost/oz 743 758 688 631 681 760 822 AISC/oz 843 971 767 687 740 853 950
Revenue (net of refining) 1,380,923,791 15,813,051 48,283,143 51,872,351 46,695,954 153,574,457 218,352,138 241,469,593 227,406,045 197,889,404 179,567,654 Opex (656,841,906) (8,739,562) (25,869,897) (28,801,035) (25,853,105) (76,512,666) (97,079,719) (96,735,577) (99,868,753) (98,989,206) (98,392,385) Royalties (127,044,989) (1,454,801) (4,442,049) (4,772,256) (4,296,028) (14,128,850) (20,088,397) (22,215,203) (20,921,356) (18,205,825) (16,520,224) Income taxes paid (111,269,598) ‐ (1,685,606) (5,308,670) (5,246,550) (4,595,358) (10,354,667) (21,077,710) (27,082,786) (22,001,626) (13,916,624) Working capital adjustments (6,653,711) (581,383) (1,255,769) (59,121) 183,162 (4,620,735) (3,606,516) (1,955,584) 1,413,429 2,353,734 1,475,073 Operating cash flow 485,767,299 5,037,306 15,029,822 12,931,269 11,483,433 53,716,848 87,222,839 99,485,520 80,946,579 61,046,481 52,213,493 Sustaining Capital (105,658,618) (2,756,317) (5,349,265) (4,184,030) (3,000,191) (25,076,042) (13,178,727) (10,343,224) (10,284,421) (13,967,852) (17,518,551) Free cash flow 380,108,681 2,280,989 9,680,557 8,747,239 8,483,242 28,640,806 74,044,112 89,142,295 70,662,159 47,078,629 34,694,943
Expansion capex (268,884,037) ‐ ‐ (62,863,892) (206,020,145) ‐ ‐ ‐ ‐ ‐ ‐
Project cash flow 111,224,644 2,280,989 9,680,557 (54,116,653) (197,536,903) 28,640,806 74,044,112 89,142,295 70,662,159 47,078,629 34,694,943
2029 2030 2031 2032 2033 2034 2035 2036 2037 2038 2039
Tonnes milled 1,750,031 1,750,048 1,750,030 1,750,049 1,750,061 1,750,046 1,530,095 1,400,000 1,206,566 592,005 ‐ Head grade (g/t Au) 2.59 2.45 2.40 2.48 2.55 2.54 2.33 2.36 2.47 2.57 ‐ Contained gold (ozs) 145,592 137,717 135,024 139,300 143,387 142,673 114,394 106,102 95,784 48,916 ‐ Recovery 92% 93% 92% 92% 92% 92% 94% 95% 95% 95% 0%Gold produced (ozs) 134,593 127,403 124,618 128,474 132,362 131,765 107,417 100,797 90,995 46,470 ‐ Silver produced (ozs) 159,521 145,135 108,525 97,089 96,805 96,784 69,563 58,970 47,507 23,906 ‐
Spot gold price ($/oz) 1,300 1,300 1,300 1,300 1,300 1,300 1,300 1,300 1,300 1,300 1,300 Spot silver price ($/oz) 17 17 17 17 17 17 17 17 17 17 17 Cash cost/oz 840 875 892 AISC/oz 1,005 1,006 988
Revenue (net of refining) 176,824,653 167,278,968 163,052,858 167,847,630 172,871,600 172,099,454 140,139,609 131,395,264 118,520,244 60,520,991 ‐ Opex (99,560,941) (98,572,560) (98,062,200) (98,033,478) (98,820,995) (98,420,706) (83,844,281) (72,902,504) (59,327,021) (31,355,686) ‐ Royalties (16,267,868) (15,389,665) (15,000,863) (15,441,982) (15,904,187) (15,833,150) (12,892,844) (12,088,364) (10,903,862) (5,567,931) ‐ Income taxes paid (8,685,790) (7,062,474) (4,178,605) (2,842,320) (3,923,958) (13,033,570) (13,578,982) (7,349,517) (11,188,139) (11,922,921) ‐ Working capital adjustments 303,268 703,340 305,404 (380,774) (363,880) 30,564 1,821,739 (560,440) (70,708) 4,865,196 ‐ Operating cash flow 52,613,322 46,957,609 46,116,594 51,149,077 53,858,581 44,842,592 31,645,241 38,494,438 37,030,513 16,539,649 ‐ Sustaining Capital (22,094,242) (16,622,632) (11,953,186) (5,972,993) (3,887,432) (3,601,619) (2,348,038) (1,763,038) (1,263,038) (6,100,000) ‐ Free cash flow 30,519,081 30,334,978 34,163,408 45,176,084 49,971,149 41,240,974 29,297,203 36,731,400 35,767,475 10,439,649 ‐
Expansion capex ‐ ‐ ‐ ‐ ‐ ‐ ‐ ‐ ‐ ‐ ‐
Project cash flow 30,519,081 30,334,978 34,163,408 45,176,084 49,971,149 41,240,974 29,297,203 36,731,400 35,767,475 10,439,649 ‐