
Prairie Creek NI 43-101 Technical Report on ... - Mining Data Online
330
Prairie Creek NI 43-101 Technical Report on Preliminary Economic Assessment Northwest Territories, Canada Effective Date: October 15, 2021 Prepared for: NorZinc Ltd. 650 West Georgia Street, Suite 1710 Vancouver, BC V6B 4N9 Prepared by: Ausenco Engineering Canada Inc. 855 Homer Street, Vancouver, British Columbia, V6B 2W2 List of Qualified Persons: Scott Elfen, P. Eng., Ausenco; Kevin Murray, P. Eng., Ausenco; Scott Weston, P. Eng., GC Hemmera; Maurice Mostert, P. Eng., Mining Plus; Greg Mosher, P. Geo., Global Mineral Resource Services; Frank Wright, P. Eng., F. Wright Consulting. Table
-
Upload
khangminh22 -
Category
Documents
-
view
0 -
download
0
Transcript of Prairie Creek NI 43-101 Technical Report on ... - Mining Data Online

Prairie Creek
NI 43-101 Technical Report on Preliminary Economic Assessment
Northwest Territories, Canada
Effective Date: October 15, 2021
Prepared for: NorZinc Ltd.
650 West Georgia Street, Suite 1710
Vancouver, BC V6B 4N9
Prepared by: Ausenco Engineering Canada Inc.
855 Homer Street,
Vancouver, British Columbia, V6B 2W2
List of Qualified Persons:
Scott Elfen, P. Eng., Ausenco; Kevin Murray, P. Eng., Ausenco; Scott Weston, P. Eng., GC Hemmera; Maurice Mostert, P. Eng., Mining Plus; Greg Mosher, P. Geo., Global Mineral Resource Services; Frank Wright, P. Eng., F. Wright Consulting.
Table

CERTIFICATE OF QUALIFIED PERSON
Scott C. Elfen, P.E. I, Scott C. Elfen, P.E., do hereby certify that:
1. I am the Global Lead Geotechnical and Civil Services of Ausenco Engineering Canada Inc., 855 Homer Street, Vancouver, BC V6B 2W2, Canada.
2. I graduated from the University of California, Davis with a Bachelor of Science degree in Civil Engineering (Geotechnical) in 1991.
3. I am a Registered Civil Engineer in the State of California (No. C56527) by exam since 1996 and I am also a member of the American Society of Civil Engineers (ASCE), Society for Mining, Metallurgy & Exploration (SME) that are all in good standing.
4. I have practiced my profession continuously for 24 years and have been involved in geotechnical, civil, hydrological, and environmental aspects for the development of mining projects; including feasibility studies on numerous underground and open pit base metal and precious metal deposits in North America, Central and South America, Africa and Australia.
5. I have read the definition of “qualified person” set out in National Instrument 43-101 Standards of Disclosure for Mineral Projects (“NI 43-101”) and certify that by reason of my education, affiliation with a professional association (as defined in NI 43-101) and past relevant work experience, I fulfill the requirements to be a “qualified person” for the purposes of NI 43-101.
6. I am responsible for the preparation of portions of Sections 18 and Subsection 1.15, 2.2, 25.10, and parts of 25.16, 26 and 27 of the technical report titled, “Prairie Creek NI 43-101 Technical Report on Preliminary Economic Assessment” that has an effective date of 15 October, 2021 (the “Technical Report”).
7. I have not visited Prairie Creek Site.
8. I am independent of NorZinc Ltd. applying all of the tests in Section 1.5 of NI 43-101.
9. I have had prior involvement with the property that is the subject of this Technical Report in co-authoring previous technical reports for Canadian Zinc Corporation, titled: Prairie Creek Property Feasibility Study NI43-101, with an effective date of 28th of September, 2017
10. I have read NI 43-101, Form 43-101F1 Technical Report (“Form 43-101F1”) and the Technical Report and confirm the Technical Report has been prepared in compliance with NI 43-101 and Form 43-101F1.
11. As of the Effective Date, to the best of my knowledge, information and belief, the sections of the Technical Report for which I am responsible contain all scientific and technical information that is required to be disclosed to make the Technical Report not misleading.
Dated this 10th day of November, 2021.
“Signed and Sealed”
Scott C. Elfen, P.E.

CERTIFICATE OF QUALIFIED PERSON Kevin Murray, P. Eng.
I, Kevin Murray, P.Eng., certify that:
1. I am employed as a Manager Process Engineering with Ausenco Engineering Canada Inc. (“Ausenco”), with an office address of 1050 West Pender Street, Suite 1200.
2. This certificate applies to the technical report titled Prairie Creek NI 43-101 Technical Report on Preliminary Economic Assessment, Northwest Territories, Canada that has an effective date of October 15, 2021 (the “Technical Report”).
3. I graduated from the University of New Brunswick, Fredericton NB, 1995 with a Bachelor of Science in Chemical Engineering. I am a member in good standing of Engineers and Geoscientists British Columbia, License# 32350.
4. I have practiced my profession for 21 years. I have been directly involved in all levels of engineering studies from preliminary economic analysis to feasibility studies. I have been directly involved with test work and flowsheet development from preliminary testing through to detailed design and construction.
5. I have read the definition of “Qualified Person” set out in the National Instrument 43-101 Standards of Disclosure for Mineral Projects (“NI 43-101”) and certify that by virtue of my education, affiliation to a professional association and past relevant work experience, I fulfill the requirements to be a “Qualified Person” for those sections of the Technical Report that I am responsible for preparing.
6. I have not visited the Prairie Creek Project.
7. I am responsible for sections 1.1; 1.2 ;1.3; 1.14 ; 1.17; 1.18; 1.19 ;1.20; 1.21; 1.22; 1.23; 2.1; 2.2 ;2.4;2.5;2.6;2.7;3.3;3.5; 4; 5; 6 ;17; 19; 21 (except 21.2.3 and 21.3.3);22 ;23; 25.2; 25.9; 25.12; 25.13; 25.14; 25.15; 25.16.1; 25.16.2; part of 26 and 27 of the Technical Report.
8. I am independent of NorZinc Ltd., as independence is defined in Section 1.5 of NI 43-101. I have had no previous involvement with Prairie Creek.
9. I have read NI 43-101 and the sections of the Technical Report for which I am responsible have been prepared in compliance with that Instrument.
10. As of the effective date of the Technical Report, to the best of my knowledge, information and belief, the sections of the Technical Report for which I am responsible contain all scientific and technical information that is required to be disclosed to make those sections of the Technical Report not misleading.
Dated this 10th, day of November, 2021.
“Signed and sealed”
Kevin Murray, P.Eng.

CERTIFICATE OF QUALIFIED PERSON Scott Weston, P. Geo.
I, Scott Weston, P. Geo., certify that:
1. I am employed as Vice President, Business Development with Hemmera Envirochem Inc, a wholly owned subsidiary of Ausenco Canada (“Ausenco”), with an office address of 4515 Central Boulevard, Burnaby, BC, Canada.
2. This certificate applies to the technical report titled, “Prairie Creek NI 43-101 Technical Report on Preliminary Economic Assessment Northwest Territories, Canada)” (the “Technical Report”), that has an effective date of October 15, 2021 (the “Effective Date”).
3. I graduated from University of British Columbia, Vancouver, BC, Canada, 1995 with a Bachelor of Science, Physical Geography, and Royal Roads University, Victoria, BC, Canada, 2003 with a Master of Science, Environment and Management
4. I am a Professional Geoscientist of Engineers and Geoscientists British Columbia; 124888.
5. I have practiced my profession for 25 years.
6. I have read the definition of “Qualified Person” set out in the National Instrument 43-101 Standards of Disclosure for Mineral Projects (“NI 43-101”) for those sections of the technical report that I am responsible for preparing.
7. I have not visited Prairie Creek site.
8. I am responsible for section 1.1; 1.16; 2.2 ;3.3; 20; ;22 ; 25.10 ; part of 27 of the technical report.
9. I am independent of NorZinc as independence is described by Section 1.5 of NI 43–101.
10. I have not previously been involved with Prairie Creek.
11. I have read the NI 43–101 and the sections of the technical report for which I am responsible have been prepared in compliance with that Instrument.
12. As of the Effective Date of the Technical Report, to the best of my knowledge, information and belief, the sections of the Technical Report for which I am responsible contain all scientific and technical information that is required to be disclosed to make the Technical Report not misleading.
Dated this 10th day of November, 2021.
“Signed and sealed”
Scott Weston, P. Geo.

CERTIFICATE OF QUALIFIED PERSON Maurice Mostert, P. Eng.
I, Maurice Mostert, P.Eng., FSAIMM, MSc., certify that I am employed as the Manager – Western Canada with Mining Plus Canada Consulting (“Mining Plus”), with an office address at Suite No. 504, 999 Canada Place, Vancouver, BC, V6C 3E1, Canada. This certificate applies to the technical report titled, “Prairie Creek Project NI 43-101 Technical Report on Preliminary Economic Assessment,” that has an effective date of October 15, 2021 (the “Technical Report”).
I graduated from University Witwatersrand, Johannesburg, South Africa in 2014 with a Master of Science in Engineering (Mining) degree. I am a Fellow of the Southern African Institute of Mining and Metallurgy (SAIMM), membership number 705275 as well as a member of the Canadian Institute of Mining and Metallurgy (CIM) Membership number 708681. I have practiced my profession for over 20 years. I have been directly involved in planning and managing of underground operations in deep and ultra deep metalliferous mines.
I have read the definition of “Qualified Person” set out in the National Instrument 43-101 Standards of Disclosure for Mineral Projects (“NI 43-101”) and certify that by virtue of my education, affiliation to a professional association and past relevant work experience, I fulfill the requirements to be a “Qualified Person” for those sections of the Technical Report that I am responsible for preparing.
I have not visited the Prairie Creek Project. I am responsible for the Sections 16, 21.2.3, 21.3.3 and 25.8, and I have contributed to Sections 1.1, 1.13, 2.2, 2.7, 24, 26 and 27 of the Technical Report.
I am independent of NorZinc as independence is defined in Section 1.5 of NI 43-101. I have had no previous involvement with Prairie Creek.
I have read NI 43-101 and the sections of the Technical Report for which I am responsible have been prepared in compliance with that Instrument. As of the effective date of the Technical Report, to the best of my knowledge, information and belief, the sections of the Technical Report for which I am responsible contain all scientific and technical information that is required to be disclosed to make those sections of the Technical Report not misleading.
Dated this 10th day of November, 2021.
“Signed and sealed”
Maurice Mostert P.Eng., FSAIMM, MSc

CERTIFICATE OF QUALIFIED PERSON Gregory Z. Mosher, P. Geo.
I, Gregory Z. Mosher, P. Geo., of North Vancouver, British Columbia, as an author of this Technical Report titled “Prairie Creek NI 43-101 Technical Report on the Preliminary Economic Assessment” with an effective Date of October 15, 2021, (the “Technical Report”), do hereby certify that:
• I am a Principal Geologist with Global Mineral Resource Services.
• I am a graduate of Dalhousie University (B.Sc. Hons., 1970) and McGill University (M.Sc. Applied, 1973). I am a member in good standing of the Association of Professional Engineers and Geoscientists of British Columbia, License #19267. My relevant experience with respect to lead-zinc deposits includes over 40 years of exploration for and evaluation of such deposits. In addition, I have been performing mineral resource estimates of base metal deposits since 2005. I am a “Qualified Person” for the purposes of National Instrument 43-101 (the “Instrument”).
• I am a member in good standing of the Association of Professional Engineers and Geoscientists of British Columbia, License #19267.
• I have been continuously practicing my profession as a geologist since 1973.
• I have read the NI 43-101 “Standards of Disclosure for Mineral Projects” and Form 43-101F1, and that this Technical Report has in part been prepared by me, in compliance with the foregoing Instrument and Form.
• I am independent of the issuer applying as defined in Section 1.5 of National Instrument 43-101. I have been involved with this Project as a contributing author of the 2017 Feasibility Study in which I was responsible for the mineral resource estimate.
• I conducted a site inspection of the Property on November 8, 2021 for a period of half a day.
• I am responsible for Sections 1.4, 1.6, 1.7, 1.8, 1.10, 1.11, 7,8,9,10,11, 12, 25.3, 25.4 and 25.6 and am partially responsible for Sections 1.1, 2.2, 2.3, 2.4, 2.7, 3.2 and 27 of this Technical Report.
• As of the effective date of this Technical Report, to the best of my knowledge, information and belief, this Technical Report contains all scientific and technical information that is required to be disclosed to make the Technical Report not misleading.
Dated this 10th day of November, 2021.
“Signed and sealed”
Gregory Z. Mosher, P. Geo.

CERTIFICATE OF QUALIFIED PERSON Frank R. Wright, P. Eng.
I, Frank R. Wright, P.Eng., of Delta, BC, do hereby certify that:
1. I am currently employed as Principal Metallurgical Engineer, with F. Wright Consulting Inc., Permit to Practice Number 1001106, with an office at #45-10605 Delsom Cr. Delta BC, Canada V4C 0A4;
2. This certificate applies to the technical report titled “Prairie Creek NI 43-101 Technical Report on Preliminary Economic Assessment, Northwest Territories, Canada”, with an effective date of 15 October, 2021 (the “Technical Report”) prepared for NorZinc Corporation (“the Issuer”);
3. I am a graduate of University of Alberta, in Edmonton, AB Canada with a Bachelor of Science in Metallurgical Engineering in 1979, and from Simon Fraser University in Burnaby, BC Canada with a Bachelor of Business Administration in 1983. I am a member in good standing with the Engineers and Geoscientists British Columbia with License #15747. I am a member of the Canadian Institute of Mining and Metallurgy. I have continuously practiced my profession in the areas of hydrometallurgy, environmental, and mineral process engineering since 1979, as an employee of various resource companies and consulting firms. Since 1998, I have been a self-employed consultant with F. Wright Consulting Inc., primarily providing process consulting services, including the co-authoring of technical reports for junior and mid-tier mineral exploration and mining firms.
I have read the definition of "Qualified Person" set out in National Instrument 43-101 (NI 43 101) and certify that by reason of my education, affiliation with a professional association (as defined in NI 43-101) and past relevant work experience, I fulfill the requirements to be a "Qualified Person" for the purposes of NI 43-101;
4. I have visited the Prairie Creek Property on May 1, 2017, in the capacity of a Qualified Person;
5. I am responsible for Section 13, along with sub-sections 1.1, 1.9, 2.2, 2.3, 2.7, 25.5, and portions of Section 26 and 27 of the Technical Report;
6. I am independent of the Issuer and related companies applying all of the tests in Section 1.5 of the NI 43-101;
7. I have had prior involvement with the property that is the subject of this Technical Report in co-authoring a previous technical report for Canadian Zinc Corporation, titled; Prairie Creek Property Feasibility Study NI43-101, with an effective date of 28 September, 2017.
8. I have read the NI 43-101 guidelines, and the Technical Report has been prepared in compliance with NI 43-101 and Form 43-101F1;
9. As of the effective date of the Technical Report and the date of this certificate, to the best of my knowledge, information and belief, this Technical Report contains all scientific and technical information that is required to be disclosed to make the sections of the Technical Report for which I am responsible not misleading.
Dated this 10th day of November, 2021
“Signed and sealed”
Frank Wright, P.Eng., Principal Metallurgical Engineer F. Wright Consulting Inc.

Important Notice
This report was prepared as National Instrument 43-101 Technical Report for NorZinc Ltd. (NorZinc) by Ausenco Engineering Canada Inc. (Ausenco).
The quality of information, conclusions, and estimates contained herein is consistent with the level of effort involved in Ausenco’s services, based on
i) information available at the time of preparation, ii) data supplied by outside sources, and iii) the assumptions, conditions, and qualifications set forth
in this report. This report is intended for use by NorZinc subject to terms and conditions of its contract with Ausenco. Except for the purposes legislated
under Canadian provincial and territorial securities law, any other uses of this report by any third party is at that party’s sole risk.

Prairie Creek Page i
NI 43-101 Technical Report on Preliminary Economic Assessment October 15, 2021
Table of Contents
1 SUMMARY .................................................................................................................................................................................... 1
1.1 Key Outcomes ........................................................................................................................................................... 1
1.2 Mineral Tenure, Surface Rights, Water Rights, Royalties and Agreements ................................................... 2
1.3 Project Setting ........................................................................................................................................................... 2
1.4 Geology and Mineralization ..................................................................................................................................... 3
1.5 History ......................................................................................................................................................................... 4
1.6 Exploration .................................................................................................................................................................. 5
1.7 Drilling and Sampling ................................................................................................................................................ 6
1.8 Data Verification ........................................................................................................................................................ 7
1.9 Metallurgical Testwork ............................................................................................................................................. 7
1.10 Mineral Resource Estimation .................................................................................................................................. 8
1.11 Mineral Resource Statement .................................................................................................................................. 8
1.12 Mineral Reserve Statement ..................................................................................................................................... 9
1.13 Mining Methods ......................................................................................................................................................... 9
1.14 Recovery Methods .................................................................................................................................................. 11
1.14.1 Main Process Design Criteria................................................................................................................................ 11
1.14.2 Process Plant Description ..................................................................................................................................... 12
1.15 Project Infrastructure ............................................................................................................................................. 14
1.16 Environmental, Permitting and Social Considerations ..................................................................................... 14
1.16.1 Environmental Considerations ............................................................................................................................. 14
1.16.2 Closure and Reclamation Considerations .......................................................................................................... 15
1.16.3 Permitting Considerations ..................................................................................................................................... 15
1.16.4 Social Considerations............................................................................................................................................. 15
1.17 Markets and Contracts .......................................................................................................................................... 15
1.17.1 Concentrate Market Outlook ................................................................................................................................. 15
1.17.2 Concentrate Quality ................................................................................................................................................ 15
1.17.3 Marketing Plan and Timing ................................................................................................................................... 16
1.18 Capital Cost Estimates ........................................................................................................................................... 16
1.19 Operating Cost Estimate ........................................................................................................................................ 17
1.19.1 Basis of Estimate .................................................................................................................................................... 17
1.20 Economic Analysis .................................................................................................................................................. 18
1.21 Sensitivity Analysis ................................................................................................................................................. 18
1.22 Risks and Opportunities ......................................................................................................................................... 19
1.22.1 Project Risks ............................................................................................................................................................ 19
1.22.2 Project Opportunities .............................................................................................................................................. 21
1.23 Recommendations ................................................................................................................................................. 22
1.23.1 Recovery Methods .................................................................................................................................................. 22

Prairie Creek Page i i
NI 43-101 Technical Report on Preliminary Economic Assessment October 15, 2021
2 INTRODUCTION ........................................................................................................................................................................ 23
2.1 Terms of Reference ................................................................................................................................................ 23
2.2 Qualified Persons .................................................................................................................................................... 23
2.3 Site Visits and Scope of Personal Inspection .................................................................................................... 25
2.4 Effective date ........................................................................................................................................................... 25
2.5 Information Sources and References ................................................................................................................. 25
2.6 Previous Technical Reports .................................................................................................................................. 25
2.7 Abbreviations ........................................................................................................................................................... 26
3 RELIANCE ON OTHER EXPERTS ........................................................................................................................................... 29
3.1 Introduction .............................................................................................................................................................. 29
3.2 Property Agreements, Mineral Tenure, Surface Rights and Royalties .......................................................... 29
3.3 Environmental, Permitting, Closure, and Social and Community Impacts................................................... 29
3.4 Taxation .................................................................................................................................................................... 30
3.5 Markets ..................................................................................................................................................................... 30
4 PROPERTY DESCRIPTION AND LOCATION ........................................................................................................................ 31
4.1 Property Location .................................................................................................................................................... 31
4.2 Project Description and Ownership ..................................................................................................................... 32
4.3 Property Agreements ............................................................................................................................................. 33
4.4 Land Tenure ............................................................................................................................................................. 34
4.5 Existing Environmental Liabilities ........................................................................................................................ 35
4.6 Nahanni National Park Reserve ............................................................................................................................ 35
5 ACCESSIBILITY, CLIMATE, LOCAL RESOURCES, INFRASTRUCTURE, AND PHYSIOGRAPHY.................................. 37
5.1 Accessibility ............................................................................................................................................................. 37
5.2 Climate ...................................................................................................................................................................... 37
5.3 Local Resources ...................................................................................................................................................... 37
5.4 Infrastructure ........................................................................................................................................................... 37
5.4.1 Utilities ....................................................................................................................................................................... 37
5.4.2 Formerly Intended Tailings Impoundment area ................................................................................................ 38
5.4.3 Communications ..................................................................................................................................................... 38
5.4.4 Mine buildings .......................................................................................................................................................... 38
5.4.5 Processing plant ...................................................................................................................................................... 38
5.5 Physiography ........................................................................................................................................................... 38
6 HISTORY ..................................................................................................................................................................................... 39
6.1 Activities and Ownership – 1928 to 1970 .......................................................................................................... 39
6.2 Activities and Ownership – 1971 to 1991 .......................................................................................................... 39
6.3 Ownership Post – 1991 ......................................................................................................................................... 40
6.4 Historical Mineral Resource Estimates ............................................................................................................... 40
6.5 Production ................................................................................................................................................................ 41
7 GEOLOGICAL SETTING AND MINERALIZATION ................................................................................................................ 42
7.1 Regional Geology .................................................................................................................................................... 42

Prairie Creek Page i i i
NI 43-101 Technical Report on Preliminary Economic Assessment October 15, 2021
7.2 Property Geology ..................................................................................................................................................... 44
7.2.1 Stratigraphy .............................................................................................................................................................. 44
7.2.2 Structure ................................................................................................................................................................... 46
7.3 Mineralization .......................................................................................................................................................... 49
7.3.1 MQV Mineralization ................................................................................................................................................ 49
7.3.2 STK Mineralization .................................................................................................................................................. 50
7.3.3 SMS Mineralization ................................................................................................................................................. 51
7.3.4 MVT Mineralization ................................................................................................................................................. 52
8 DEPOSIT TYPES ........................................................................................................................................................................ 54
8.1 Hydrothermal Quartz Veins (MQV and STK) ...................................................................................................... 54
8.2 SMS Mineralization ................................................................................................................................................. 55
8.3 MVT ........................................................................................................................................................................... 56
9 EXPLORATION ........................................................................................................................................................................... 59
9.1 Channel Sampling ................................................................................................................................................... 60
9.2 Gate mining leases ................................................................................................................................................. 60
10 DRILLING .................................................................................................................................................................................... 61
10.1 General ...................................................................................................................................................................... 61
10.2 2010 Drill Program .................................................................................................................................................. 62
10.3 2011 Drill Program .................................................................................................................................................. 62
10.4 2012 Drill Program .................................................................................................................................................. 62
10.5 2013 Drill Program .................................................................................................................................................. 63
10.6 2015 Drill Program .................................................................................................................................................. 64
10.7 2020 and 2021 Drill Programs .............................................................................................................................. 65
10.8 Drilling Procedures .................................................................................................................................................. 65
10.8.1 Drills ........................................................................................................................................................................... 65
10.8.2 Field Procedures...................................................................................................................................................... 66
10.8.3 Surveying .................................................................................................................................................................. 66
10.8.4 Core logging ............................................................................................................................................................. 67
10.8.5 Core Recovery .......................................................................................................................................................... 67
10.8.6 Bulk Density .............................................................................................................................................................. 67
10.8.7 Drilling Results ......................................................................................................................................................... 67
11 SAMPLE PREPARATION, ANALYSES, AND SECURITY ..................................................................................................... 68
11.1 Chain of custody ..................................................................................................................................................... 68
11.1.1 Underground channel samples ............................................................................................................................ 68
11.1.2 Drill core samples.................................................................................................................................................... 68
11.1.3 Sample sacks ........................................................................................................................................................... 68
11.1.4 Transport .................................................................................................................................................................. 68
11.1.5 Drill core storage ..................................................................................................................................................... 69
11.2 Assay method .......................................................................................................................................................... 70
11.2.1 Sample preparation ................................................................................................................................................ 70
11.2.2 Assay procedure...................................................................................................................................................... 71

Prairie Creek Page i v
NI 43-101 Technical Report on Preliminary Economic Assessment October 15, 2021
11.3 QA/QC procedures .................................................................................................................................................. 71
11.3.1 Blanks ........................................................................................................................................................................ 71
11.3.2 Duplicate samples .................................................................................................................................................. 71
11.3.3 Standard samples ................................................................................................................................................... 71
11.3.4 Check samples ........................................................................................................................................................ 71
11.4 Conclusion ................................................................................................................................................................ 72
12 DATA VERIFICATION................................................................................................................................................................ 73
13 MINERAL PROCESSING AND METALLURGICAL TESTING .............................................................................................. 74
13.1 Introduction .............................................................................................................................................................. 74
13.2 Historical Testwork (1960 -2016) ........................................................................................................................ 74
13.2.1 Mineralogy ................................................................................................................................................................ 76
13.2.2 Comminution ........................................................................................................................................................... 78
13.2.3 Dense Media Separation ........................................................................................................................................ 79
13.2.4 Preliminary Flotation Studies (1980 to 2000) .................................................................................................... 82
13.2.5 Flotation Testing (2001-2016) .............................................................................................................................. 88
13.2.6 Flotation Locked Cycle Testwork ......................................................................................................................... 94
13.2.7 Pilot Plant Testing ................................................................................................................................................. 100
13.2.8 Other Test Work .................................................................................................................................................... 103
13.2.9 Miscellaneous Testing Procedures ................................................................................................................... 105
13.2.10 Flotation Concentrate Characteristics ........................................................................................................ 107
13.3 2017 Test Program ............................................................................................................................................... 110
13.3.1 Origin of Metallurgical Composite Sample ...................................................................................................... 111
13.3.2 Composite Head Characterization..................................................................................................................... 118
13.3.3 Dense Media Separation ...................................................................................................................................... 123
13.3.4 Comminution ......................................................................................................................................................... 124
13.3.5 Flotation .................................................................................................................................................................. 126

Prairie Creek Page v
NI 43-101 Technical Report on Preliminary Economic Assessment October 15, 2021
13.3.6 Characterization of Flotation Products ............................................................................................................. 136
13.3.7 Settling and Filtration Studies ............................................................................................................................. 138
13.3.8 Projected Recovery ............................................................................................................................................... 140
13.4 Summary ................................................................................................................................................................ 142
14 MINERAL RESOURCE ESTIMATES...................................................................................................................................... 144
14.1 Introduction ............................................................................................................................................................ 144
14.2 Exploratory Data Analysis .................................................................................................................................... 144
14.3 Capping ................................................................................................................................................................... 148
14.4 Composites ............................................................................................................................................................ 148
14.5 Bulk Density ............................................................................................................................................................ 148
14.6 Spatial Analysis ..................................................................................................................................................... 149
14.7 Mineral Resource Block ....................................................................................................................................... 150
14.8 Interpolation Plan .................................................................................................................................................. 150
14.9 Zinc Equivalency Formula ................................................................................................................................... 150
14.10 Mineral Resource Classification ......................................................................................................................... 151
14.11 Mineral Resource Tabulation .............................................................................................................................. 155
14.12 Block Model Validation ......................................................................................................................................... 160
14.13 Comparison with September 2015 Mineral Resource Estimate .................................................................. 161
15 MINERAL RESERVE ESTIMATES ......................................................................................................................................... 163
16 MINING METHODS ................................................................................................................................................................. 164
16.1 Introduction ............................................................................................................................................................ 164
16.2 Mining methods .................................................................................................................................................... 165
16.2.1 Longhole Open Stoping (LHOS).......................................................................................................................... 165
16.3 Geotechnical Considerations .............................................................................................................................. 166
16.4 Mine design ............................................................................................................................................................ 169
16.5 Lateral and vertical development design .......................................................................................................... 169
16.6 Backfill ..................................................................................................................................................................... 170
16.6.1 Backfill system description ................................................................................................................................. 170
16.6.2 Paste fill production and delivery ....................................................................................................................... 171
16.7 Ventilation ............................................................................................................................................................... 173
16.7.1 Lead exposure considerations ........................................................................................................................... 174
16.7.2 Refuge Bays and Secondary Egress .................................................................................................................. 174
16.7.3 Mine air heating ..................................................................................................................................................... 174
16.8 Underground Infrastructure Facilities ............................................................................................................... 175
16.9 Production Schedule ............................................................................................................................................ 175
16.9.1 Development .......................................................................................................................................................... 180
16.9.2 Stoping .................................................................................................................................................................... 180
16.10 Mining Inventory .................................................................................................................................................... 181
16.11 Blasting and Explosives ....................................................................................................................................... 184
16.11.1 Explosives delivery and storage ................................................................................................................... 184

Prairie Creek Page v i
NI 43-101 Technical Report on Preliminary Economic Assessment October 15, 2021
16.12 Mining Equipment ................................................................................................................................................. 184
16.13 Dewatering ............................................................................................................................................................. 185
16.13.1 Contact water................................................................................................................................................... 185
16.13.2 Non-contact water .......................................................................................................................................... 186
16.13.3 Water Use System........................................................................................................................................... 187
16.14 Compressed air ..................................................................................................................................................... 187
16.15 Underground power distribution ........................................................................................................................ 187
16.15.1 Power requirements and electrical distribution ......................................................................................... 187
16.15.2 Underground power layout ............................................................................................................................ 188
16.16 Fuel supply ............................................................................................................................................................. 188
16.17 Underground communications .......................................................................................................................... 188
16.18 Underground mine personnel requirements .................................................................................................... 189
17 RECOVERY METHODS ........................................................................................................................................................... 190
17.1 Major Design Criteria ............................................................................................................................................ 192
17.2 Process Plant Description ................................................................................................................................... 192
17.2.1 Crushing .................................................................................................................................................................. 193
17.2.2 DMS Plant ............................................................................................................................................................... 193
17.2.3 Grinding And Classification ................................................................................................................................. 194
17.2.4 Flotation .................................................................................................................................................................. 194
17.2.5 Concentrate Dewatering And Load Out Systems ........................................................................................... 195
17.2.6 Tailings Handling ................................................................................................................................................... 197
17.2.7 Tailings Paste Plant .............................................................................................................................................. 197
17.2.8 Reagent Preparation and Delivery ...................................................................................................................... 197
17.2.9 Assay And Metallurgical Laboratory .................................................................................................................. 198
17.2.10 Mill Water Supply And Distribution .............................................................................................................. 200
17.2.11 Compressed Air Supply .................................................................................................................................. 200
17.3 Process Plant Instrumentation And Controls .................................................................................................. 200
17.3.1 Plant Control .......................................................................................................................................................... 200
17.3.2 Control Philosophy ................................................................................................................................................ 201
18 PROJECT INFRASTRUCTURE .............................................................................................................................................. 203
18.1 Camp ....................................................................................................................................................................... 206
18.2 Water ....................................................................................................................................................................... 207
18.2.1 Domestic water ..................................................................................................................................................... 207
18.2.2 Fire water ................................................................................................................................................................ 207
18.2.3 Site water management facilities ...................................................................................................................... 207
18.2.4 Flood protection .................................................................................................................................................... 207

Prairie Creek Page v i i
NI 43-101 Technical Report on Preliminary Economic Assessment October 15, 2021
18.3 Medical facilities .................................................................................................................................................... 208
18.4 Telecommunications ............................................................................................................................................ 208
18.5 Administration building ........................................................................................................................................ 208
18.6 Warehousing .......................................................................................................................................................... 209
18.7 Workshops ............................................................................................................................................................. 210
18.8 Air strip .................................................................................................................................................................... 210
18.9 Fuel storage ........................................................................................................................................................... 212
18.10 Sewage treatment ................................................................................................................................................. 213
18.11 Garbage incineration ............................................................................................................................................ 214
18.12 Electrical system ................................................................................................................................................... 214
18.13 LNG power generation ......................................................................................................................................... 217
18.14 Plant control ........................................................................................................................................................... 217
18.15 Fire detection and suppression systems.......................................................................................................... 217
18.16 Heating, Ventilation and Air Conditioning (HVAC) .......................................................................................... 218
18.17 Mine Water Treatment Plant ............................................................................................................................... 219
18.18 Explosives ............................................................................................................................................................... 220
18.19 Mine services – compressed air and communications ................................................................................ 220
18.20 Dewatering ............................................................................................................................................................. 220
18.21 Mine escape and rescue ...................................................................................................................................... 220
18.22 Surface mobile equipment .................................................................................................................................. 220
18.23 Water storage pond .............................................................................................................................................. 221
18.24 Waste rock pile ...................................................................................................................................................... 224
18.25 Laydown Areas ...................................................................................................................................................... 228
18.26 Transportation ....................................................................................................................................................... 228
18.26.1 Site roads .......................................................................................................................................................... 228
18.26.2 All-season road ................................................................................................................................................ 229
18.27 Logistics .................................................................................................................................................................. 230
18.27.1 Operations movement .................................................................................................................................... 230
18.27.2 Inbound freight ................................................................................................................................................ 230
18.27.3 Outbound Concentrate ................................................................................................................................... 231
19 MARKET STUDIES AND CONTRACTS ................................................................................................................................ 233
19.1 Concentrate Market Outlook ............................................................................................................................... 233
19.1.1 Zinc Concentrate Market Outlook ...................................................................................................................... 233
19.1.2 Lead Concentrate Market Outlook ..................................................................................................................... 235
19.2 Concentrate Quality .............................................................................................................................................. 236
19.2.1 Prairie Creek Zinc Concentrate Quality ............................................................................................................. 236
19.2.2 Prairie Creek Lead Concentrate Quality ............................................................................................................ 237
19.3 Marketing Plan and Timing ................................................................................................................................. 237
19.4 Current Status ........................................................................................................................................................ 238
20 ENVIRONMENTAL STUDIES, PERMITTING, AND SOCIAL OR COMMUNITY IMPACT .............................................. 239
20.1 Environmental Studies ......................................................................................................................................... 239

Prairie Creek Page v i i i
NI 43-101 Technical Report on Preliminary Economic Assessment October 15, 2021
20.1.1 Biophysical Setting ............................................................................................................................................... 239
20.1.2 Socioeconomic Setting ........................................................................................................................................ 241
20.1.3 Environmental Risks and Opportunities............................................................................................................ 241
20.2 Waste Management and Water Management ................................................................................................ 241
20.2.1 Waste Management ............................................................................................................................................. 241
20.2.2 Water Management .............................................................................................................................................. 243
20.3 Environmental Management .............................................................................................................................. 245
20.3.1 Management Plans ............................................................................................................................................... 245
20.4 Closure and Reclamation Planning ................................................................................................................... 247
20.4.1 Closure schedule and cost estimate ................................................................................................................. 247
20.4.2 Closure and Reclamation Plan ........................................................................................................................... 248
20.4.3 Temporary Closure Activities .............................................................................................................................. 249
20.4.4 Permanent Closure Activities.............................................................................................................................. 250
20.4.5 Post-Closure Monitoring, Maintenance, and Reporting Program ................................................................ 252
20.5 Permitting Considerations ................................................................................................................................... 253
20.5.1 Overview of the Regulatory Process.................................................................................................................. 253
20.5.2 Mine Permitting ..................................................................................................................................................... 253
20.5.3 All-Season Road Permitting ................................................................................................................................ 254
20.5.4 Renewal of Mine Permits ..................................................................................................................................... 254
20.5.5 Current Permits and Licences ............................................................................................................................ 255
20.6 Social Considerations........................................................................................................................................... 255
20.6.1 Naha Dehe Dene Band ......................................................................................................................................... 256
20.6.2 Liidlii Kue First Nation ........................................................................................................................................... 257

Prairie Creek Page i x
NI 43-101 Technical Report on Preliminary Economic Assessment October 15, 2021
20.6.3 Acho Dene Koe First Nation ................................................................................................................................ 257
20.7 Agreements And Programs With Government Agencies .............................................................................. 257
20.7.1 Nahanni National Park Reserve / Parks Canada Memorandum of Understanding ................................. 257
20.7.2 Government of the Northwest Territories Socio-Economic Agreement..................................................... 259
20.7.3 Government Of The Northwest Territories Department Of Infrastructure ................................................. 259
20.7.4 The Northwest Territories Power Corporation ................................................................................................ 259
21 CAPITAL AND OPERATING COSTS ..................................................................................................................................... 260
21.1 Introduction ............................................................................................................................................................ 260
21.2 Capital Cost Estimate ........................................................................................................................................... 261
21.2.1 Overview ................................................................................................................................................................. 261
21.2.2 Basis of Estimate .................................................................................................................................................. 261
21.2.3 Mine Capital Costs ................................................................................................................................................ 264
21.2.4 Process Plant Capital Costs ................................................................................................................................ 266
21.2.5 Site Infrastructure Pre-Production Capital Costs ............................................................................................ 267
21.2.6 Owner’s Capital Costs .......................................................................................................................................... 269
21.2.7 Sustaining Capital ................................................................................................................................................. 269
21.2.8 Capital Cost Estimate Summary ........................................................................................................................ 270
21.3 Operating Costs ..................................................................................................................................................... 270
21.3.1 Overview ................................................................................................................................................................. 270
21.3.2 Basis of Estimate .................................................................................................................................................. 270
21.3.3 Mining operating costs ........................................................................................................................................ 272
21.3.4 Processing, site surface and general and administrative operating costs ................................................ 273
21.3.5 Annual operating manpower costs.................................................................................................................... 275
21.3.6 Annual Supplies Costs ......................................................................................................................................... 275
21.3.7 Power cost and diesel fuel consumption ......................................................................................................... 276
21.3.8 Transportation cost .............................................................................................................................................. 276
21.4 Comments on Capital and Operating Costs .................................................................................................... 277
22 ECONOMIC ANALYSIS ........................................................................................................................................................... 278
22.1 Cautionary Statement .......................................................................................................................................... 278
22.2 Methodology Used ................................................................................................................................................ 279
22.3 Financial Model Parameters ............................................................................................................................... 279
22.3.1 Income Taxes ........................................................................................................................................................ 280
22.3.2 NWT Mineral Tax Royalty .................................................................................................................................... 280
22.3.3 Royalty ..................................................................................................................................................................... 280
22.3.4 Working Capital ..................................................................................................................................................... 280
22.3.5 Closure Costs......................................................................................................................................................... 280
22.4 Economic Analysis ................................................................................................................................................ 281

Prairie Creek Page x
NI 43-101 Technical Report on Preliminary Economic Assessment October 15, 2021
22.5 Sensitivity Analysis ............................................................................................................................................... 285
22.6 QP Comments on “Item 22: Economic Analysis” ........................................................................................... 287
23 ADJACENT PROPERTIES ...................................................................................................................................................... 288
24 OTHER RELEVANT DATA AND INFORMATION ................................................................................................................ 289
24.1 Mining Shapes ....................................................................................................................................................... 289
24.2 Dilution and Recovery Estimates ....................................................................................................................... 289
24.3 Geotechnical Considerations .............................................................................................................................. 289
24.3.1 Introduction ............................................................................................................................................................ 289
24.3.2 Geotechnical Comments ..................................................................................................................................... 290
24.3.3 Discussion .............................................................................................................................................................. 291
25 INTERPRETATION AND CONCLUSIONS ............................................................................................................................ 292
25.1 Introduction ............................................................................................................................................................ 292
25.2 Mineral Tenure, Surface Rights, Water Rights, Royalties and Agreements ............................................... 292
25.3 Geology and Mineralization ................................................................................................................................. 292
25.4 Exploration, Drilling and Analytical Data Collection ........................................................................................ 293
25.5 Metallurgical Testwork ......................................................................................................................................... 294
25.6 Mineral Resource Estimates ............................................................................................................................... 294
25.7 Mineral Reserve Estimate .................................................................................................................................... 295
25.8 Mine Plan ................................................................................................................................................................ 295
25.9 Recovery Plan ........................................................................................................................................................ 296
25.10 Infrastructure ......................................................................................................................................................... 298
25.10.1 Water Storage Pond........................................................................................................................................ 298
25.10.2 Waste Rock Pile ............................................................................................................................................... 298
25.11 Environmental, Permitting and Social Considerations ................................................................................... 298
25.12 Markets and Contracts ........................................................................................................................................ 299
25.13 Capital Cost Estimates ......................................................................................................................................... 299
25.14 Operating Cost Estimates ................................................................................................................................... 299
25.15 Economic Analysis ................................................................................................................................................ 300
25.16 Risks and Opportunities ....................................................................................................................................... 300
25.16.1 Risks .................................................................................................................................................................. 300
25.16.2 Opportunities .................................................................................................................................................... 302
26 RECOMMENDATIONS............................................................................................................................................................ 304
27 REFERENCES........................................................................................................................................................................... 306
List of Tables
Table 1-1: Summary of Exploration Work, 1992 to 2021 .............................................................................................................. 5
Table 1-2: Prairie Creek Mineral Resource Estimate at a Cutoff Grade of 8% Zinc Equivalent ............................................. 9

Prairie Creek Page x i
NI 43-101 Technical Report on Preliminary Economic Assessment October 15, 2021
Table 1-3: Prairie Creek Mining Inventory Estimate at a Cutoff Grade of 11% Zinc Equivalent .......................................... 10
Table 1-4: Main Processing Design Criteria .................................................................................................................................. 11
Table 1-5: Pre-production capital cost estimate – Prairie Creek Mine .................................................................................... 17
Table 1-6: Total Operating Cost Summary .................................................................................................................................... 18
Table 1-7: Project Risks ..................................................................................................................................................................... 20
Table 1-8: Project Opportunities ...................................................................................................................................................... 22
Table 2-1: Persons who prepared or contributed to this Technical Report............................................................................. 24
Table 2-2: Name Abbreviations ....................................................................................................................................................... 26
Table 2-3: Unit Abbreviations ........................................................................................................................................................... 27
Table 4-1-: Summary of NorZinc Land Holdings ........................................................................................................................... 34
Table 6-1: Historical Resource Estimates...................................................................................................................................... 40
Table 7-1: Summary of the Prairie Creek Stratigraphy ................................................................................................................ 45
Table 9-1: Summary of Exploration work, 1992 to 2021 ............................................................................................................ 59
Table 10-1: Summary of diamond drilling carried out at Prairie Creek ...................................................................................... 61
Table 10-2: Assay Results Of 2011 Drill Program .......................................................................................................................... 62
Table 10-3: Significant Assay Results Of 2012 Drill Program ...................................................................................................... 63
Table 10-4: Significant assay results from 2013 drill program .................................................................................................... 63
Table 10-5: Representative assay results from 2015 drill program ............................................................................................ 64
Table 10-6: Representative Assay Results from 2020/2021 Drill Programs Drillhole ............................................................. 65
Table 11-1: Prairie Creek QA/QC Control Samples by Type and Year ........................................................................................ 72
Table 12-1: Prairie Creek Check Sample Assay Results ............................................................................................................... 73
Table 13-1: Major Historical Metallurgical Test Programs ........................................................................................................... 75
Table 13-2: G&T: MQV Sulphide Mineral Liberation ....................................................................................................................... 76
Table 13-3: Hazen Sample – MQV Head Assay ............................................................................................................................. 77
Table 13-4: G&T: Mineral Composition of SMS .............................................................................................................................. 78
Table 13-5: SGS Lakefield – MQV Bond Ball Mill Work Index ...................................................................................................... 79
Table 13-6: Losses of Metals in DMS Tailings, Hazen (1997) ...................................................................................................... 79
Table 13-7: SGS – HLS Test Data for a 50 wt. ................................................................................................................................ 80
Table 13-8: SGS (2009)– DMS Testing @ SG2.8 on MQV (883m + 930 m level adits) ........................................................... 81
Table 13-9: SGS (2013) – DMS Testing @ SG2.8 on MQV (883m level adit) ............................................................................ 81
Table 13-10: Kamloops Lab 1980 MQV Flotation Data ................................................................................................................... 82
Table 13-11: SGS Composite Head Analyses (Phase 1 & 2 - 2005 test program) ..................................................................... 88
Table 13-12: SGS Composite Head Analyses (Phase 3 - 2005 test program) ............................................................................ 89
Table 13-13: SGS Composite Head Analyses (Phase 4 - 2007 test program) ............................................................................ 89
Table 13-14: SGS Composite Head Analyses (Phase 5 - 2009 test program) ............................................................................ 89
Table 13-15: SGS Composite Head Analyses (2013 test program) .............................................................................................. 90
Table 13-16: SGS Initial Reagent Scheme for Prairie Creek Mineralization ................................................................................. 91
Table 13-17: SGS Optimized 2009 Reagent Scheme ....................................................................................................................... 93
Table 13-18: MQV Locked Cycle Test Data (Kamloops Labs, Prior to 2001) .............................................................................. 94
Table 13-19: MQV Locked Cycle Test Data (SGS) ............................................................................................................................ 95
Table 13-20: SMS Locked Cycle Test Data ........................................................................................................................................ 99
Table 13-21: CSMRI Pilot plant test results ..................................................................................................................................... 102

Prairie Creek Page x i i
NI 43-101 Technical Report on Preliminary Economic Assessment October 15, 2021
Table 13-22: Outotec Settling Test Data – Flotation Tailing ......................................................................................................... 103
Table 13-23: SGS Settling Test Data – Flotation Tailing ............................................................................................................... 103
Table 13-24: CSMRI Settling Test Data - Flotation Tailing ............................................................................................................ 104
Table 13-25: SGS Settling Test Data – Flotation Concentrates ................................................................................................... 104
Table 13-26: CSMRI Settling Test Data – Flotation Concentrates .............................................................................................. 105
Table 13-27: SGS Settling Test Data – Flotation Concentrates ................................................................................................... 105
Table 13-28: MQV Analyses of Sulphide and Oxide Lead Flotation Concentrates ................................................................... 107
Table 13-29: SMS Analyses of Sulphide and Oxide Lead Flotation Concentrates ................................................................... 108
Table 13-30: MQV Analyses of Sulphide and Oxide Zinc Flotation Concentrates .................................................................... 109
Table 13-31: SMS Analyses of Sulphide and Oxide Zinc Flotation Concentrates .................................................................... 110
Table 13-32: Master Composite Origin - STK .................................................................................................................................. 112
Table 13-33: Master Composite Origin - STK .................................................................................................................................. 115
Table 13-34: Master Composite Origin, MQV-L ............................................................................................................................... 116
Table 13-35: Origin of Composite MQV-AR ...................................................................................................................................... 116
Table 13-36: Sample Origin – Composite MQV-Fe......................................................................................................................... 117
Table 13-37: Sample Origin – Composite MQV-Cu ........................................................................................................................ 117
Table 13-38: Sample Origin – Composite MQV-Pbox .................................................................................................................... 118
Table 13-39: Master Composite Head Analyses............................................................................................................................. 119
Table 13-40: Assay Reject and Variability Composites Head Analyses ..................................................................................... 119
Table 13-41: Mineral Distribution Float Feed MQV-H ..................................................................................................................... 120
Table 13-42: Mineral Distribution Float Feed STK .......................................................................................................................... 120
Table 13-43: DMS Balance on Composite MQV-H ......................................................................................................................... 124
Table 13-44: DMS Balance on Composite MQV-L .......................................................................................................................... 124
Table 13-45: DMS Balance on Composite STK ............................................................................................................................... 124
Table 13-46: Bond Ball Mill Grindability Test Summary ................................................................................................................ 125
Table 13-47: Primary Grind vs Float Response ............................................................................................................................... 127
Table 13-48: Primary Grind (with regrind) vs Flotation Response ............................................................................................... 129
Table 13-49: Comp MQV-HL Lead Rougher Float Kinetic Response .......................................................................................... 129
Table 13-50: STK – Lead Flotation Response to Graphite Depressant (A633) ......................................................................... 130
Table 13-51: Lead Flotation Variability Response on Higher Iron Composites ......................................................................... 131
Table 13-52: Zinc Flotation Variability Response on Higher Iron Composites .......................................................................... 131
Table 13-53: Lead Flotation Response – Phase 1 Variability Samples ...................................................................................... 131
Table 13-54: Oxide Composites Open Cycle Flotation Response ............................................................................................... 132
Table 13-55: Locked Cycle - Calculated Head / Tailing Assay ..................................................................................................... 135
Table 13-56: Locked Cycle – Mass Balance .................................................................................................................................... 135
Table 13-57: Locked Cycle – Lead Concentrate Assay and Recovery ....................................................................................... 135
Table 13-58: Locked Cycle – Zinc Concentrate Analyses and Recovery ................................................................................... 136
Table 13-59: Lead Concentrate Analyses ......................................................................................................................................... 136
Table 13-60: Zinc Concentrate Analyses .......................................................................................................................................... 137
Table 13-61: Float Product Physical Characteristics ..................................................................................................................... 137
Table 13-62: Static Thickening Data ................................................................................................................................................. 138
Table 13-63: Dynamic Settling Data .................................................................................................................................................. 138

Prairie Creek Page x i i i
NI 43-101 Technical Report on Preliminary Economic Assessment October 15, 2021
Table 13-64: Vacuum Filtration Data................................................................................................................................................. 139
Table 13-65: Pressure Filtration Data ................................................................................................................................................ 139
Table 13-66: Moisture Saturation and Porosity Calculation ......................................................................................................... 140
Table 13-67: DMS Plant Recovery Estimation ................................................................................................................................. 141
Table 13-68: Overall Recovery Estimation ....................................................................................................................................... 142
Table 13-69: Estimated Concentrate Grades including Deleterious Elements ......................................................................... 142
Table 14-1: Prairie Creek Assay Count by Channel and Drillhole Samples .............................................................................. 146
Table 14-2: Prairie Creek Assay and Composite Descriptive Statistics by Domain ............................................................... 147
Table 14-3: Prairie Creek Mineral Correlation Coefficients ......................................................................................................... 148
Table 14-4: Prairie Creek 2021 Variogram Parameters ............................................................................................................... 149
Table 14-5: Prairie Creek Search Ellipse Parameters................................................................................................................... 150
Table 14-6: Prairie Creek 2021 Block Model Parameters ........................................................................................................... 150
Table 14-7: Zinc-equivalency equation parameters ..................................................................................................................... 151
Table 14-8: Prairie Creek Resource Classification Search Ellipse Parameters ....................................................................... 152
Table 14-9: Prairie Creek Mineral Resource Summary at 8% ZnEq grade Cutoff .................................................................. 156
Table 14-10: Prairie Creek MQV Domain Mineral Resource Estimate at a Range of Cutoff Grades .................................... 157
Table 14-11: Prairie Creek SMS Domain Mineral Resource Estimate at a Range of Cutoff Grades ..................................... 158
Table 14-12: Prairie Creek STK Domain Mineral Resource Estimate at a Range of Cutoff Grades ...................................... 158
Table 14-13: Prairie Creek Comparison of Current and September 2015 Resource Estimates ............................................ 162
Table 16-1: Design Criteria ................................................................................................................................................................ 169
Table 16-2: Mining Inventory ............................................................................................................................................................ 183
Table 16-3: Mobile Equipment ......................................................................................................................................................... 185
Table 16-4: Manpower Requirement............................................................................................................................................... 189
Table 17-1: Main Processing Design Criteria ................................................................................................................................ 192
Table 18-1: LOM Major Area Power Demand ................................................................................................................................ 215
Table 18-2: Surface mobile equipment required .......................................................................................................................... 221
Table 18-3: Storage Capacity of WSP ............................................................................................................................................. 224
Table 19-1: Provisional Sales Plan .................................................................................................................................................. 237
Table 19-2: Marketing Plan Timing ................................................................................................................................................. 238
Table 20-1: Summary of MVRB Suggestions ................................................................................................................................ 254
Table 20-2: Summary of Current Permits and Licenses ............................................................................................................. 255
Table 21-1: Sources of Inputs to Capital and Operating Cost Estimates ................................................................................ 260
Table 21-2: Summary of Capital Costs ........................................................................................................................................... 261
Table 21-3: Reclamation and Closure Costs for the Prairie Creek Mine .................................................................................. 263
Table 21-4: Contingency – Prairie Creek Mine .............................................................................................................................. 264
Table 21-5: Capital Cost Estimate ................................................................................................................................................... 265
Table 21-6: Process Plant Pre-production capital cost estimate – Prairie Creek Mine ........................................................ 267
Table 21-7: Site Infrastructure - Pre-production capital cost estimate – Prairie Creek Mine .............................................. 269
Table 21-8: Sustaining cost estimate – Prairie Creek Mine ....................................................................................................... 269
Table 21-9: Pre-production capital cost estimate – Prairie Creek Mine .................................................................................. 270
Table 21-10: Total Operating Cost Summary .................................................................................................................................. 271
Table 21-11: Total Manpower Required ........................................................................................................................................... 275

Prairie Creek Page x i v
NI 43-101 Technical Report on Preliminary Economic Assessment October 15, 2021
Table 21-12: Power Consumption ..................................................................................................................................................... 276
Table 21-13: Annual Diesel Fuel Consumption ............................................................................................................................... 276
Table 22-1: Summary, Projected LOM Cashflow Assumptions and Results .......................................................................... 281
Table 22-2: Projected Cashflow on an Annualized Basis ............................................................................................................ 283
Table 22-3: Pre & Post-Tax Sensitivity ............................................................................................................................................ 286
Table 25-1: Prairie Creek Mineral Resource Estimate at a Cutoff Grade of 8% Zinc Equivalent ......................................... 295
Table 25-2: Projected Lead and Zinc Concentrate Production .................................................................................................. 297
Table 25-3: Project Risks ................................................................................................................................................................... 301
Table 25-4: Project Opportunities .................................................................................................................................................... 303
List of Figures
Figure 1-1: Location of the Prairie Creek Property .......................................................................................................................... 3
Figure 1-2: Longitudinal View of the Underground Mine Design ................................................................................................ 10
Figure 1-3: Process Flow Diagram ................................................................................................................................................... 13
Figure 1-4: NPV & IRR Sensitivity Results ....................................................................................................................................... 19
Figure 4-1: Location of the Prairie Creek Property ........................................................................................................................ 31
Figure 4-2: The Prairie Creek Mine Site ........................................................................................................................................... 32
Figure 4-3: Plan of leases and claims relative to Nahanni National Park Reserve Boundary ............................................... 33
Figure 4-4: Property in Relation to the Expanded Nahanni National Park Reserve ................................................................. 36
Figure 7-1: Prairie Creek Regional Geology ..................................................................................................................................... 43
Figure 7-2: Prairie Creek Property Geology ..................................................................................................................................... 47
Figure 7-3: Simplified Vertical Section Cross Section of Prairie Creek Main Zone ................................................................. 48
Figure 7-4: MQV Exposed Underground .......................................................................................................................................... 50
Figure 7-5: STK Mineralization Showing Separate Distinct high-grade sub-vertical veins in 883 mL ................................. 51
Figure 7-6: SMS Mineralization Showing Massive Sphalerite and Pyrite in Drill Core ............................................................ 52
Figure 7-7: MVT style mineralization showing colloform sphalerite rimming dolomite fragment from Zebra showing ............................................................................................................................................................................. 53
Figure 10-1: HTM-2500 skid-mounted diamond drill rig at Casket Creek ................................................................................... 66
Figure 11-1: Stored unmineralized drill core at Harrison Creek site ............................................................................................. 69
Figure 11-2: Stored mineralized drill core intersections at main site ........................................................................................... 70
Figure 13-1: G&T Lead Grade Recovery Curves for MQV Open Cycle Cleaning ......................................................................... 84
Figure 13-2: G&T Zinc Grade Recovery Curves for MQV Open Cycle Cleaning .......................................................................... 84
Figure 13-3: CSMRI Pilot Plant Flowsheet - base case run #101................................................................................................ 101
Figure 13-4: Sample Locations .......................................................................................................................................................... 112
Figure 13-5: Modal Distribution Float Feed MQV-H and STK ...................................................................................................... 121
Figure 13-6: Float Head STK Grain Size ........................................................................................................................................... 122
Figure 13-7: Float Head MQV-H Grain Size ..................................................................................................................................... 122
Figure 13-8: SGS Dense Media Pilot Plant ...................................................................................................................................... 123

Prairie Creek Page x v
NI 43-101 Technical Report on Preliminary Economic Assessment October 15, 2021
Figure 13-9: Abrasion Index ............................................................................................................................................................... 125
Figure 13-10: Grind vs MQV-H Recovery ........................................................................................................................................... 128
Figure 13-11: Grind vs MQV-L Recovery ............................................................................................................................................ 128
Figure 13-12: Locked Cycle Flotation Flowsheet ............................................................................................................................. 134
Figure 14-1: Prairie Creek Mineral Domains, Plan View ................................................................................................................ 145
Figure 14-2: Prairie Creek Mineral Domains Longitudinal View .................................................................................................. 146
Figure 14-3: Zinc-Equivalent block grade distribution MQV zone ............................................................................................... 152
Figure 14-4: Zinc-Equivalent block grade distribution SMS Zone ............................................................................................... 153
Figure 14-5: Zinc-Equivalent block grade distribution STK zone ................................................................................................ 154
Figure 14-6: Mineral Resource classification MQV domain ......................................................................................................... 155
Figure 14-7: Prairie Creek Grade Tonnage Curves......................................................................................................................... 160
Figure 14-8: Prairie Creek MQV Zone Swath Plots ........................................................................................................................ 161
Figure 16-1: Orthogonal View of Mine Design ................................................................................................................................ 165
Figure 16-2: LHOS Sequence ............................................................................................................................................................. 166
Figure 16-3: Stability graph results for stope walls (typical average dip 60–75 deg.) and stope backs ............................. 167
Figure 16-4: Support chart from the Q System .............................................................................................................................. 168
Figure 16-5: 4.0 m by 4.0 m drift for MT2000 truck ....................................................................................................................... 170
Figure 16-6: 4.5 m by 4.5 m drift for D40 truck ............................................................................................................................... 170
Figure 16-7: Paste Fill System ........................................................................................................................................................... 172
Figure 16-8: Stope filling showing strength requirements ........................................................................................................... 173
Figure 16-9: Annual Production Schedule ....................................................................................................................................... 175
Figure 16-10: Production Profile .......................................................................................................................................................... 176
Figure 16-11: Mine Plan – Year 1 (2024) ........................................................................................................................................... 177
Figure 16-12: Mine Plan – Year 2 (2025) ........................................................................................................................................... 177
Figure 16-13: Mine Plan – Year 3 (2026) ........................................................................................................................................... 178
Figure 16-14: Mine Plan – Year 5 (2028) ........................................................................................................................................... 178
Figure 16-15: Mine Plan – Year 10 (2033) ......................................................................................................................................... 179
Figure 16-16: Mine Plan – Year 15 (2038) ......................................................................................................................................... 179
Figure 16-17: Mine Plan – Year 21 (2044 / End of Mine) ............................................................................................................... 180
Figure 17-1: Process Flow Diagram ................................................................................................................................................. 191
Figure 18-1: The present-day Prairie Creek Mine site infrastructure .......................................................................................... 203
Figure 18-2: Proposed site layout of the Prairie Creek Mine infrastructure .............................................................................. 204
Figure 18-3: Proposed general arrangement of the modified Prairie Creek Mine site infrastructure .................................. 205
Figure 18-4: Prairie Creek present-day accommodations ............................................................................................................ 206
Figure 18-5: The two-storey steel clad Administration Building at the Prairie Creek site ...................................................... 209
Figure 18-6: Interior of the workshop at the Prairie Creek site .................................................................................................... 210
Figure 18-7: The 1,000 m gravel airstrip (CBH4) at Prairie Creek Site ....................................................................................... 211
Figure 18-8: Diesel tank farm at Prairie Creek within a clay-lined berm impoundment structure ........................................ 212
Figure 18-9: Sewage Treatment Plant ............................................................................................................................................. 213
Figure 18-10: Overall Single Line Electrical Drawing ........................................................................................................................ 216
Figure 18-11: Surface mobile equipment at the Prairie Creek site ............................................................................................... 220
Figure 18-12: Tailings impoundment facility - to be converted into a WSP ................................................................................ 222

Prairie Creek Page x v i
NI 43-101 Technical Report on Preliminary Economic Assessment October 15, 2021
Figure 18-13: Proposed WSP layout ................................................................................................................................................... 223
Figure 18-14: Proposed site of WRP Storage facility ...................................................................................................................... 226
Figure 18-15: Proposed Waste Rock Storage facility layout .......................................................................................................... 227
Figure 18-16: Proposed Waste Rock Haul Road Typical Cross Section ...................................................................................... 228
Figure 18-17: Proposed route of the all-season road into Prairie Creek Mine ............................................................................ 229
Figure 18-18: Total haulage route to Vancouver .............................................................................................................................. 232
Figure 19-1: Requirement for Zinc Mine Supply ............................................................................................................................. 234
Figure 19-2: Zinc Normal C1 Cast Cost Curve ............................................................................................................................... 235
Figure 19-3: Requirement for Lead Mine Supply ............................................................................................................................ 236
Figure 20-1: Process Flow Diagram Site Water Services ............................................................................................................. 244
Figure 21-1: LOM operating cost distribution ................................................................................................................................. 271
Figure 21-2: Annual cash operating cost by area – Process plant and site infrastructure .................................................... 272
Figure 21-3: Mine Operating Cost Breakdown ................................................................................................................................ 273
Figure 21-4: Process Plant Operating Cost Distribution ............................................................................................................... 274
Figure 21-5: Site Support Operating Cost Distribution .................................................................................................................. 274
Figure 21-6: G&A Cash Operating Cost Distribution ...................................................................................................................... 274
Figure 21-7: Transportation Operating Cost Distribution ............................................................................................................. 276
Figure 22-1: NPV & IRR Sensitivity Results ..................................................................................................................................... 285
Figure 23-1: Mine Area Map ............................................................................................................................................................... 288

Prairie Creek Page 1
NI 43-101 Technical Report on Preliminary Economic Assessment October 15, 2021
1 SUMMARY
Ausenco Engineering Canada Inc. (Ausenco) was engaged by NorZinc Ltd. (NorZinc) of Vancouver, Canada to prepare this technical report (the Report) on the Prairie Creek Property (the Property), located approximately 500 km west of Yellowknife in the Northwest Territories of Canada, with input from other experts as disclosed in Sections 2 and Section 3 in accordance with the requirements of National Instrument 43-101 (NI 43-101), “Standards of Disclosure for Mineral Projects”, of the Canadian Securities Administrators (CSA) for lodgment on CSA’s “System for Electronic Document Analysis and Retrieval” (SEDAR).
The report was prepared to support a Preliminary Economic Analysis (PEA) on the project as disclosed in the NorZinc news release entitled “NorZinc ltd. Announces positive PEA including after tax NPV8% of US$299M on extended 20-year mine life at higher 2,400 tpd throughput”, dated October 21st , 2021.
1.1 Key Outcomes
The key findings of the PEA are summarized below:
• Measured and Indicated Mineral Resources at a cutoff of 8% Zinc Equivalent (ZnEq) are 9,755,000 tonnes at an average grade of 139 grams/tonne silver; 9.7% zinc, for a zinc equivalent grade of 22.7% and 8.8% lead.
• Process plant is designed to process 2,400 tpd, using crushing, Dense Media Separation (DMS) followed by milling and conventional lead/zinc flotation.
• Average annual payable ZnEq production of 261 Mlbs, including 2.6 Moz of average annual silver production, over a 20-year life of mine.
• Initial pre-production capital cost of $368 M (All costs featured throughout the PEA document are expressed in US$).
• Operating cost of $167.50 per tonne of milled ore.
• Zinc, lead and silver price forecast for the economic model and mine actuals, was based on the average analyst consensus estimate resulting in $1.20/lb for zinc, $1.05/lb for lead and $24.00/troy ounce for silver respectively. The forecasts used are meant to reflect the average metal price expectation over the life of the Project.
• Net present value (base case at 8% discount rate) of $505 M (pre-tax) and $299 M (after tax).
• Internal rate of return (IRR) of 21.4% (pre-tax) and 17.7% IRR (post-tax) with a payback period of 4.8 years.
Readers are cautioned that the PEA is preliminary in nature. It includes Inferred Mineral Resources that are considered too speculative geologically to have the economic considerations applied to them that would enable them to be categorized as Mineral Reserves and there is no certainty that the PEA will be realized.

Prairie Creek Page 2
NI 43-101 Technical Report on Preliminary Economic Assessment October 15, 2021
1.2 Mineral Tenure, Surface Rights, Water Rights, Royalties and Agreements
The Property tenure consists of mining leases and surface leases which are held by NorZinc and were issued by the Government of the Northwest Territories, as further described in Section 4.3.
The total area of all land holdings, including mining leases and surface leases at Prairie Creek, is 7,485 hectares. All of the leases are currently in good standing.
The Mining Leases are renewable on a 21-year basis and currently have expiry dates ranging from September 2030 to August 2041.
The Surface Leases, containing the mine infrastructure, were originally granted by Aboriginal Affairs and Northern Development Canada (AANDC) on a renewable, ten-year basis and, since devolution of some Federal powers to the Northwest Territories on 1 April 2014, are now administered by the Government of the Northwest Territories (GNWT). Presently the surface leases are held in a recurring annual overholding tenancy which is renewed on March 31st of each year. These leases will remain until NorZinc negotiates new leases for operations.
There is a 1.2% Net Smelter Return (NSR) Royalty payable to Sandstorm Gold on the Property and a 1% NSR Royalty to RCF VI CAD LLC.
The Prairie Creek Mine is located on land claimed as their traditional territory by the Nahɂą Dehé Dene Band (NDDB). The Dehcho First Nations (DCFN) is engaged in ongoing land settlement negotiations with the Government of Canada and the Government of the Northwest Territories in what is referred to as the Dehcho Process. However, the NDDB has opted out of the DCFN, and is conducting their own negotiations regarding land claims.
1.3 Project Setting
The Property is located in the Northwest Territories (NWT), Canada, near the Yukon border, at latitude 61° 33’ North and longitude 124° 48’ West, in the Mackenzie Mountain Range that that varies in elevation from approximately 870 m to 1170 m above sea level, consisting of low mountains with moderate to steep sides and intervening narrow valleys.
The Mine site is located at an elevation of 870 m above mean sea level. Valleys are well-incised, and the area is located within the Alpine forest-tundra section of the Boreal Forest, characterized by stunted fir and limited undergrowth. The trees that grow at the lower elevations give way to mossy open Alpine-type country at higher elevations.
Historically and currently, seasonal access (from May to November) to the Mine site is provided by charter aircraft, generally from Fort Nelson, BC, or Fort Simpson, NWT, both of which are serviced by scheduled commercial airlines. A 1,000 m gravel airstrip is located on the flood plain of Prairie Creek, approximately 1 km northwest of the Mine site. Once the construction commences, access to the mine site will be year-round.
The Liard Highway, which connects Fort Nelson, BC to Fort Simpson, NWT, is the closest major transportation route to the Property.
The climate in the general Project area is sub-Arctic and is characterized by long cold winters with moderate snowfall, and short but pleasant summers.

Prairie Creek Page 3
NI 43-101 Technical Report on Preliminary Economic Assessment October 15, 2021
Figure 1-1: Location of the Prairie Creek Property
Note: Figure prepared by NZC, 2021.
1.4 Geology and Mineralization
The Property is located within a westward-thickening wedge of sedimentary carbonate rocks of mid-Proterozoic to mid-Jurassic age that was deposited along the paleo-continental margin of western North America (Mackenzie Platform). The Prairie Creek Embayment paleo-basin is interpreted to have developed as a half-graben controlled by a north-trending fault with down-drop to the west.
In the immediate area of the Property, north-south trending faulting and folding is apparent. The most significant fold structure is the fault-bounded, north-south doubly plunging Prairie Creek anticlinal structure, which is the host to the Prairie Creek mineralization.
Four styles of base metal mineralization have been identified on the Property: quartz vein, stratabound, stockwork and Mississippi Valley-type. Only the first three styles have been found in potentially economic quantities to date. Base metal mineral showings occur along the entire 16 km north to south length of the anticline, covered by the main group of mining leases.
The most significant style of mineralization is the quartz vein-type, on which the underground workings have been developed, containing the bulk of the currently defined Mineral Resource. The Main Quartz Vein (MQV) has been exposed

Prairie Creek Page 4
NI 43-101 Technical Report on Preliminary Economic Assessment October 15, 2021
in detail by underground development and diamond drilling over a horizonal strike length of 2.3 km (Main Zone). The MQV trends at an azimuth of approximately 20º and dips between vertical and 40º east, with an average dip of 65º. The MQV consists of massive to disseminated galena and sphalerite with lesser pyrite and tennantite-tetrahedrite in a quartz-carbonate-dolomite sheared matrix. The galena and tennantite-tetrahedrite also carry economically significant silver values. This vein style of mineralization has been identified throughout the entire 16 km length of the mining leases with surface trenches and diamond drilling.
Stockwork-style (STK) mineralization occurs as a series of narrow, massive sphalerite-galena-tennantite veins striking at about 40º azimuth that occupy tensional or dilatant-type fractures within a structural offset translation zone of the MQV. This mineralization has developed in sub-vertical tensional openings formed obliquely to, but also related to, the initial primary fault movement along the main vein structure. STK has been exposed in both diamond drilling and underground development.
Stratabound Massive Sulphide (SMS) mineralization occurs intermittently at the base of the trend of the Prairie Creek vein system over a strike length of more than 800 m. SMS mineralization occurs as semi-massive sphalerite-galena-pyrite replacement located close to both the vein system and the axis of the Prairie Creek antiform but has not yet been intersected by underground development. The MQV structure carries fragments of the SMS indicating the vein mineralization to be younger in age.
Mississippi Valley-type (MVT) lead-zinc mineralization is exposed on the Property within surface showings of rock formations marginal to the basin and consists of cavity-filling type breccias in dolostone with host fragments rimmed with colloform sphalerite-marcasite-galena healed with carbonate. This type of mineralization does not form part of the current resource.
1.5 History
An independent feasibility study was completed in 1980 for Cadillac by Kilborn Engineering Limited (Kilborn), the results of which prompted the decision to put the Mine (then called Cadillac Mine) into production. In December of 1980, Procan Exploration Company Limited (Procan), a company associated with Herbert and Bunker Hunt of Texas agreed to provide financing for construction, mine development and working capital necessary to attain the planned production of 1,000 stpd.
In 1991, Nanisivik Mines Limited (Nanisivik) acquired the Property from Procan. Pursuant to an option agreement dated 23 August 1991, NZC (then known as San Andreas Resources Corporation and later Canadian Zinc Corporation), acquired a 60% interest in the Property from Nanisivik.
Subsequently, pursuant to a 29 March 1993 Asset Purchase Agreement that superseded the 1991 Option Agreement, NZC acquired a 100% interest in the Mineral properties and a 60% interest in the plant and equipment, subject to a 2% net smelter royalty in favour of Procan. In January 2004, NZC acquired all of Procan’s (which had become Titan Pacific Resources Limited) interest in the plant and equipment, including the 2% net smelter royalty, thereby securing a 100% interest in the Property.
There has been no production from the Property, despite trial mining having been carried out in 1982. During the trial mining period, a mineralized material stockpile was created in the main yard near the mill and is estimated to include approximately 10,000 tonnes of material.

Prairie Creek Page 5
NI 43-101 Technical Report on Preliminary Economic Assessment October 15, 2021
1.6 Exploration
Table 1-1 summarizes work carried out by NZC since 1991. A full discussion with tables of results is contained in earlier reports that are referenced in Section 27. Drilling is further discussed in Section 10.
Table 1-1: Summary of Exploration Work, 1992 to 2021
Year No of holes
Meters Highlights
1992 22 6,322 Discovery of previously unknown SMS mineralization by diamond drilling.
Discovery hole (PC-92-008) ran 10.60% Zn, 5.29% Pb, 44.37 g/t Ag, over 28.40 m.
1993 31 8,432
Tested for further SMS Mineralization. UTEM survey.
Extended MQV by intersecting 18 m of vein 170 m below workings.
Trench samples from Rico showing, in north showed grades of 18% Zn, 35% Pb, 242 g/t Ag in a vertical mineralized. Geological mapping in north claims (Sam).
1994 31 11,113 Extension of Main Zone, more SMS lenses in Zone 5, regional mapping.
Rico Zone and Zebra showing (MVT) trenching, IP Ground Geophysics.
1995 36 10,082 Minor trenching and surface sampling.
1997 - - Channel sampling of previously un-sampled underground drift development.
1999 - -
Gate Claims 1 to 4 were staked and geological mapping, soil and rock sampling, was carried out for geochemical analysis based on a large surface grid.
Discovery of a mineralized vein in outcrop on Gate 1.
2001 5 1,711
Diamond drilling program designed both to increase confidence in 1998 resource estimate and to identify new high-grade areas.
Possibility of high-grade shoots recognized.
2004 27 5,944
MQV drilling which intersected significant mineralization.
Step out on the vein hit narrow but high-grade intersections.
SMS exploration outside Main Area.
2005 Rehabilitation of underground workings, chip sampling of MQV underground.
2006 19 2,393
Phase 1 driving of decline tunnel and U/G drilling commences on MQV.
Channel and round sampling.
Drilling of Zone 8 mineralization investigated.
2007 53 11,141 Phase 1 U/G program confirms vein grades. Decline extended, phase 2 drilling.
Gate claims drilling and Zone 8, 9 and 11 show poor results.
2010 4 2, 694 Deep drilling in Casket Creek (for MQV) and proximal to resource drilling.
2011 30 5, 926 Deep drilling in Casket Creek (wedging) and proximal to resource drilling.
2012 11 5,628 Deep drilling in Casket Creek and proximal to resource drilling, geophysical gravity & EM surveys, LIDAR survey of property.
2013 5 1,472 Deep drilling and proximal to resource drilling, silt sampling.
2015 21 5,548 Underground drilling - MQV and STK infill and extension, channel samples taken.
Well 1 183 Hydrology well.
2020 2 1,130 Exploration into Inferred Resources., MQV and STK zones.
2021 1 736 Exploration into Inferred Resources, MQV and STK zones.
In 1997, 231 channel samples were collected from 294 m of previously un-sampled MQV on the 883 mL and 930 mL. These samples gave a weighted average grade within vein limits of 17.2% Zn, 16.0% Pb, 330 g/t Ag, 0.8% Cu over a weighted average true width of 1.78 m.

Prairie Creek Page 6
NI 43-101 Technical Report on Preliminary Economic Assessment October 15, 2021
In 2006, access to the new decline ramp was provided by new Crosscut 883-07 that was driven as part of the 2006 underground exploration program. The MQV, with a true thickness of 6.5 m, was intersected about 12 m from the crosscut collar; the walls of a 10 m intersection were channel sampled.
In 2015, NZC collected 22 channel samples comprised of 50 individual samples (63.6 aggregate metres) on the 930 mL to assess STK mineralization. The weighted average grade of all 50 samples is 8.3% Pb, 18.9% Zn, and 178 g/t Ag. Half of these samples were collected along the strike of a mineralized STK vein exposed in the 930-Northwest Drift. The average grade of those samples is 9% Pb, 22.9% Zn and 223 g/t Ag. In 2020 and 2021, NZC completed additional drilling along the northern extent of the MQV. The MQV appears to be continuous with previously intercepted MQV material and remains open to additional exploration along strike to the north.
Gate Mining Leases 1 to 4 were originally staked as claims in 1999 and converted to mining leases in 2008. During 2001, a small exploration program comprising geological mapping and soil and rock sampling was carried out over areas underlain by Whittaker Formation strata. This work resulted in the discovery of a vein in outcrop from which select grab samples contained grades similar to those previously established for the MQV: 820 g/t Ag, 3.5% Cu, 16% Pb, and 10% Zn. A large, 1,000 parts per million (ppm) zinc-in-soil anomaly was also located over favourable geology on the Gate 3 Mining Lease.
During 2007, NZC carried out a helicopter-supported diamond drill program to test the soil anomalies within the Gate group and Zones 8, 9, and 11. This program returned very few significant mineral intersections.
1.7 Drilling and Sampling
NZC and its former entities have been involved with mineral exploration activity across the Prairie Creek Property since 1992. Limited exploration drilling had occurred and most of the underground development had been undertaken prior to NZC’s initial involvement. From 1992 through to 2021, NZC completed 299 surface and underground exploration diamond drillholes with an aggregate length of 80,453 m. In addition, 1,032 underground channel samples forming 365 composites from the three existing underground levels have been collected and analysed.
Exploration and underground development work have been focused on the Main Zone mineralization, where approximately 90% of the total drilling has been carried out.
Drill core was boxed at the drill by the drill crew then retrieved and removed to the core logging facility by NZC geologists. Core was checked for recovery, logged geologically and marked for sampling by a geologist. Core was split with a diamond saw for sampling; half was placed in a sample bag and the remainder returned to the core box. Unmineralized intervals were stored in square-piled stacks in the core storage area next to the boneyard near Harrison Creek. Mineralized intervals are stored in trailers adjacent to the core logging facility.
Bagged samples were placed in rice bags and flown either to Fort Nelson, BC, or Fort Simpson, NWT, for transshipment to the assay laboratory. The principal assay labs that have been used by NZC are Acme Analytical Labs Ltd, AGAT Laboratories, and ALS Geochemistry.
Acme Analytical Labs Ltd (ISO 9001-2000 accredited) (now Bureau Veritas) has carried out the majority of the sample assaying since NZC’s first involvement with the Property in 1992 and was used up until 2011. From 2011 to 2020, sample assaying has been conducted by AGAT Laboratories (ISO/IEC 17025:2005 accredited). For 2021 and onwards, assays were completed by ALS Geochemistry (ISO/IEC 17025:2017 and ISO 9001:2015 accredited).
Samples were sorted and inspected for quality of use (quantity and condition); wet or damp samples were dried at 60º Celsius. Samples were then crushed to 70% passing ten mesh (2 mm), homogenized, riffle split (250 g sub-sample) and pulverized to 95% passing 150 mesh (100 microns). The crusher and pulverizer were cleaned by brush and compressed air

Prairie Creek Page 7
NI 43-101 Technical Report on Preliminary Economic Assessment October 15, 2021
between routine samples. A granite wash was used to scour equipment after high-grade samples, between changes in rock colour and / or at end of each file. Granite was crushed and pulverized as the first sample in each sequence and each granite sample was carried through to analysis to monitor background assay grades.
The grades of silver, copper, lead, and zinc, and additional elements, were determined for all samples by aqua regia digestion followed by an ICP-ES finish. Prior to 2001, assays recorded an additional 3 to 15 elements depending on the lab and analytical method, whereas more recent assays record between 21 to 45 additional elements. Lead and zinc oxides were assayed by ammonium acetate leach and AAS finish. Silver is also analysed by fire assay fusion.
NZC submits Quality Assurance / Quality Control (QA/QC) blanks, duplicates and standards for analysis with the regular samples to ensure accuracy of the analysis. Blanks, duplicate samples, or standards are inserted on average after approximately 20 drill core samples and are randomly pre-designated to be inserted up to five samples ahead of or behind this mean value in order to reduce predictability of QA/QC sample occurrences in the sample stream.
1.8 Data Verification
G. Mosher, P.Geo., performed a random check of approximately 5% of the drillhole assays that have been generated since the 2012 verification program by comparing assay values in the database against the laboratory certificates. No discrepancies were found.
Data were also verified during construction of the resource estimation model. The verification procedure included checks for duplicate and overlapping sample intervals as well as any sample intervals extending beyond the end of the hole. Collars, down-hole surveys, assays, composite, and lithology tables were verified. No errors were found.
G. Mosher, P.Geo., conducted a site inspection visit on October 8, 2021. During that visit, the collar locations for the 2020/21 drillholes were inspected and photographed and GPS readings of the collar coordinates were collected. Mineralized intervals of drill core from hole PC-20-225 were examined and compared with written descriptions in the geology logs. Sample intervals recorded in the drill logs were also checked against the depth locations marked in the core boxes.
Ten (10) pulp samples from various drill programs between 2011 and 2020 were collected and submitted to ALS Geochemistry in North Vancouver, BC. Samples were assayed for 41 elements using the analytical package ME-ICP41. Overlimits for silver were re-run using GRA-21, mercury using HG-ICP42, and lead and zinc using ME-OG46h. All assay values for all elements compare closely to the re-assayed results.
1.9 Metallurgical Testwork
Historically, metallurgical test work was performed beginning in the 1960’s, although none of the earliest studies have information that can be sourced. Following this, and continuing sporadically into the 1980’s, and up to as recently as 2016 more testing was conducted. This testing developed a specialized flotation scheme for galena and sphalerite having an elevated oxidized mineral component in the feed. The most recent laboratory study was performed in 2017 on more representative samples sourced at depth, obtained from a 2015 drill program into various mineralized zones. The metallurgical test work conducted prior to 2017 is representative of a more highly oxidized feed obtained near surface, which does not correspond as well to the anticipated mine plan. The 2017 test program was conducted at SGS Mineral Services (SGS) facilities in both Burnaby, BC, and Lakefield, ON. In 2017 SGS undertook a variety of mineralogy, gravity, flotation, and liquid-solid separation studies. The optimization testing included investigating particle size distribution, reagent specifications, and evaluation of various flotation circuit procedures. Following optimization; variability testing was performed on samples primarily selected to better match the proposed mine schedule. In 2021 the Company initiated a variability study on previous MQV, STK and SMS intercepts, focusing on mercury in sphalerite and tetrahedrite-tennantite,

Prairie Creek Page 8
NI 43-101 Technical Report on Preliminary Economic Assessment October 15, 2021
via an electron microprobe analysis currently underway. Up to 50 mineral grains in each of 43 submitted samples will be analyzed, with relative abundances of mercury contributing to understanding overall trends and how these may affect concentrate quality throughout the mine life.
The 2017 study was successful in being able to establish a more conventional and simplified flotation flowsheet and reagent scheme than what had previously been proposed. This study used samples based principally on the representative content of the payable metals of lead, zinc, and silver. Other process factors included following detrimental elements, as well as accounting for changing content of graphite, iron, copper and particularly the percent of sulphide oxidation, which were evaluated using variability testing. The extent of sulphide oxidation in the samples was shown to be significant to process response. For the study, the extent of oxidation was principally correlated to the lead oxide content.
The flowsheet developed from metallurgical testing consists of forwarding pre-screened crushed product to dense media separation (DMS). The DMS sink product and screened fines go to grinding followed by differential froth flotation to produce separate lead and zinc concentrates. Primary grind requirements were modest with an expected 80% particle passing size of ~135 µm. Most of the silver was shown to report with the lead concentrate. Concentrate characterizations were evaluated with multi-element analyses.
1.10 Mineral Resource Estimation
The current Mineral Resource estimate is summarized in Table 1-2. A single block model was created to encompass the three mineral domains: MQV, STK, and SMS. Grades were interpolated into the blocks using ordinary kriging (OK).
The Mineral Resource was classified as Measured, Indicated and Inferred. For a block to be classified as Measured, it was necessary that a minimum of 24 composites be located within the volume of the search ellipse with a maximum of two composites per hole, equivalent to 12 drillholes or channel samples. The MQV and STK domains contain Measured resources; in both, the Measured blocks immediately surround the underground development in which channel sampling was carried out. For a block to be classified as Indicated, it was necessary that a minimum of 10 composites be located within the volume of the search ellipse, with a maximum of two composites per hole or the equivalent of five drillholes. For a block to be classified as Inferred, it was only necessary that a minimum of four composites be located within the volume of the search ellipse with a maximum of two composites per hole or the equivalent of two drillholes.
1.11 Mineral Resource Statement
Mineral resources are stated at a zinc equivalent cut-off grade of 8%. Readers are cautioned that Mineral Resources that are not Mineral Reserves have not demonstrated economic viability.

Prairie Creek Page 9
NI 43-101 Technical Report on Preliminary Economic Assessment October 15, 2021
Table 1-2: Prairie Creek Mineral Resource Estimate at a Cutoff Grade of 8% Zinc Equivalent
Domain Cutoff ZnEq % Classification Tonnes ZnEq % Ag ppm Pb % Zn %
MQV 8 Measured 903,000 30.3 206 11.2 12.9
MQV 8 Indicated 5,248,000 27.7 181 12.0 10.3
MQV 8 M & I 6,152,000 28.0 184 11.9 10.7
MQV 8 Inferred 3,849,000 31.4 207 8.4 16.7
STK 8 Measured 128,000 17.4 97 4.1 10.3
STK 8 Indicated 2,754,000 12.6 63 3.2 7.6
STK 8 M & I 2,883,000 12.8 65 3.2 7.7
STK 8 Inferred 2,187,000 12.7 67 4.0 6.7
SMS 8 Indicated 722,000 16.4 53 5.1 9.7
SMS 8 Inferred 367,000 15.4 47 4.4 9.6
TOTAL 8 Measured 1,031,000 28.7 193 10.3 12.6
TOTAL 8 Indicated 8,724,000 22.0 133 8.6 9.4
TOTAL 8 M & I 9,755,000 22.7 139 8.8 9.7
TOTAL 8 Inferred 6,403,000 24.1 150 6.7 12.9 CIM definitions were followed for classification of Mineral Resources. Stated at a cut-off grade of 8% ZnEq based on prices of $1.15/lb for zinc, $1.00/lb for lead, and $20/oz for silver. Average processing recovery factors of 81.5% for zinc, 84.3% for lead, and 95.1% for silver. Average payables of 85% for zinc, 95% for lead, and 85% for silver. ZnEq = (grade of Zn in %) + [(grade of lead in % * price of lead in $/lb * 22.046 * recovery of lead in % * payable lead in %) + (grade of silver in g/t* (price of silver in $/Troy oz/ 31.10348) * recovery of silver in % * payable silver in %)]/(price of zinc in $/lb*22.046 * recovery of zinc in % * payable zinc in %). Numbers may not compute exactly due to rounding. The Mineral Resource estimate is effective as of October 15, 2021.
1.12 Mineral Reserve Statement
There are no Mineral Reserves.
1.13 Mining Methods
The Prairie Creek project will be accessed via existing adits in the hillside and a main ramp twinned from surface following along the plunge of the MQV. The cross-sectional size of the existing adits is to be enlarged to make optimal use of existing infrastructure and allow for modern equipment to pass through.
The Prairie Creek orebody has three distinct zones, the MQV, SMS and the STK zones. Based on the geometry of the mining zones a Longitudinal Retreat Longhole Open Stoping (LHOS) method was selected for the MQV and the STK. In the SMS, however, Longitudinal Retreat Uppers Stoping (LRUS) was selected due to the zone’s geometry. Both mining methods lend themselves to comparatively low cost, bulk mining that suits the geometry and type of deposit. An updated geological block model for the Prairie Creek project was processed utilising Deswik© Mineable Shape Optimizer (MSO) software to identify the economically mineable shapes for the Project.
The Project will produce 2,400 tonnes per day (tpd) of diluted mill feed from the underground workings. A diesel-powered, mechanized mining fleet is currently planned. The operation is also planning to utilize 100% of flotation tailings for backfill

Prairie Creek Page 1 0
NI 43-101 Technical Report on Preliminary Economic Assessment October 15, 2021
purposes. Ventilation for the underground workings will be drawn into the portal adits, flow through the workings and exit the mine via dedicated ventilation shafts. Mine air will be heated as required at the adit portal due to the low temperatures in the region. Ventilation quantities are designed to adequately dilute, render harmless, and carry away diesel particulate. Secondary egress for workers will be via ladderways in dedicated escape shafts in the event that primary egress is obstructed.
Figure 1-2: Longitudinal View of the Underground Mine Design
Note: Figure prepared by NZC, 2021.
Table 1-3: Prairie Creek Mining Inventory Estimate at a Cutoff Grade of 11% Zinc Equivalent
Mining Inventory
Tonnes Zn Pb Ag As Cd Hg Sb PbO ZnO NSR
'000 t % % g/t ppm ppm ppm ppm % % U$/t
Me
as
ure
d MQV 1,207 8.9 7.6 139 241 343 172 709 2.7 2.4 202
SMS 0 0.0 0.0 0 0 0 0 0 0.0 0.0 0
STK 113 10.2 4.7 92 417 592 124 960 0.7 0.2 233
ALL 1,320 9.0 7.3 135 256 364 168 730 2.5 2.2 204
Ind
ica
ted
MQV 6,588 7.5 8.6 130 520 438 237 1,219 0.8 0.4 256
SMS 686 8.4 4.6 49 161 211 107 100 0.8 0.2 181
STK 1,955 8.0 3.5 66 295 430 100 701 0.5 0.2 177
ALL 9,289 7.6 7.2 109 443 417 197 1,020 0.8 0.4 232
Me
as
ure
d
an
d
Ind
ica
ted
MQV 7,795 7.7 8.5 131 477 423 227 1,141 1.1 0.7 248
SMS 686 8.4 4.6 49 161 211 107 100 0.8 0.2 181
STK 2,068 8.1 3.6 67 301 439 101 716 0.5 0.2 180
ALL 10,610 7.8 7.2 113 420 410 193 984 1.0 0.6 229
Infe
rre
d
MQV 5,179 11.9 6.0 146 939 691 464 1,988 0.5 0.1 296
SMS 270 8.4 3.6 41 157 154 92 52 0.5 0.2 169

Prairie Creek Page 1 1
NI 43-101 Technical Report on Preliminary Economic Assessment October 15, 2021
Mining Inventory
Tonnes Zn Pb Ag As Cd Hg Sb PbO ZnO NSR
'000 t % % g/t ppm ppm ppm ppm % % U$/t
STK 1,164 7.0 3.9 67 303 433 167 653 0.4 0.1 170
ALL 6,552 11.0 5.6 129 803 629 400 1,690 0.5 0.1 271
To
tal
MQV 12,974 9.4 7.5 137 662 530 322 1,479 0.9 0.5 267
SMS 956 8.4 4.3 47 160 195 103 87 0.7 0.2 178
STK 3,232 7.7 3.7 67 302 436 125 693 0.5 0.2 176
ALL 17,162 9.0 6.6 119 566 494 272 1,253 0.8 0.4 245
1.14 Recovery Methods
Ausenco has produced a process design for Prairie Creek which relies on information, data and analysis prepared by the Qualified Person for Section 13 of this Report. As referenced in Section 13, metallurgical tests indicate that the Prairie Creek mineralization is amenable to a combined process of pre-concentration by dense media separation (DMS) and sequential flotation to produce lead sulphide and zinc sulphide concentrates.
The process design is based mainly on the results from the 2017 metallurgical test programs, which included heavy liquid separation, flotation, mineralized material hardness, and dewatering tests. However, the mineralized material hardness expressed as Bond Ball Mill Work Index (BWI) has also considered the 75th percentile (100 micron) of the 1992 to 2017 BWI tests, which included a total of 12 tests with three (3) tests conducted in 2017.
The current process design incorporates some existing equipment, which was installed at Prairie Creek in 1981/1982. The increased throughput of 2,400 tpd, has resulted in modifications to the concentrator downstream from the crushing plant, as follows:
• the DMS pre-concentration plant is new and will be fed using a new conveyor from the existing fine mill feed bin;
• a new ball mill will be added into grinding circuit with the existing mill being refurbished;
• all of the flotation cells in the lead and zinc flotation circuits will be new to meet the required throughput with existing tanks being refurbished for conditioning purposes; and
• reagent preparation system will be completed to modern standards for lead and zinc concentrate production.
1.14.1 Main Process Design Criteria
The main processing design criteria, outlined in Table 1-4, which also summarizes grade and recovery data as presented in Sections 13 and 16 respectively.
Table 1-4: Main Processing Design Criteria
Criteria Unit Value
Annual Throughput (Nominal) tpa 876,000
Operating Days per Year d 365
Operating Availability – Crushing % 70.0
Operating Availability - DMS Plant % 91.7

Prairie Creek Page 1 2
NI 43-101 Technical Report on Preliminary Economic Assessment October 15, 2021
Criteria Unit Value
Operating Availability - Grinding and Flotation % 91.7
Operating Availability - Concentrate filtration % 75.0
Operating Availability - Paste Plant % 95.0
Nominal Rate - Crushing tph (dry) 143
Nominal Rate - DMS Plant tph (dry) 109
Nominal Rate - Milling and Flotation tph (dry) 82
Nominal Rate - Pb Concentrate Filtration tph (dry) 15.5
Nominal Rate - Zn Concentrate Filtration Rate tph (dry) 17.9
Nominal Rate - Paste Plant tph (dry) 53
Crushing Feed Size, 100% Passing mm 300
Crushing Product Size, 80% Passing mm 11.9
Ball Mill Product Size, 80% Passing μm 156
Ball Mill Circulating Load % 250
Bond Ball Mill Work Index kWh/t 13
Bond Abrasion Index g 0.205
ROM Head Grades Pb (LOM Average) % total / as sulphide 6.58 / 5.78
ROM Head Grades Zn (LOM Average) % total / as sulphide 9.00 / 8.58
ROM Head Grades Ag (Average) g/t 119
Metal Recovery Method DMS & polymetallic sequential flotation
DMS Plant – Mass recovery to sinks (flotation feed) % 75
Lead Concentrate - Lead Recovery % of total 86.5
Lead Concentrate - Lead Concentrate Grade Pb wt% 60.0
Lead Concentrate - Silver Recovery % 86.8
Zinc Concentrate – Zinc Recovery % of total 85.7
Zinc Concentrate - Zinc Grade Zn wt% 58.0
Zinc Concentrate – Silver Recovery %, Ag 7.8
1.14.2 Process Plant Description
Ahead of the process plant, the ROM area will include a stockpile used to even-out daily or short term mine production against mill capacity and operating time. The processing plant consists of:
• Crushing circuit;
• DMS pre-concentration;
• grinding;
• lead and zinc sequential flotation;
• concentrate dewatering and loadout; and
• tailings dewatering and disposal using paste back fill disposal method.
Overall process block flow diagram of the process plant is shown in Figure 1-3, whilst a detailed description of the process facilities could be found in the Section 17 of this report.

Prairie Creek Page 1 3
NI 43-101 Technical Report on Preliminary Economic Assessment October 15, 2021
Figure 1-3: Process Flow Diagram
Note: Figure prepared by Ausenco, 2021.

Prairie Creek Page 1 4
NI 43-101 Technical Report on Preliminary Economic Assessment October 15, 2021
1.15 Project Infrastructure
The Prairie Creek Mine is a remote, isolated site, with existing site infrastructure that requires upgrade, expansion or replacement where necessary.
In 1982, the mine was fully permitted and construction was almost complete, but production was not achieved. The existing site infrastructure includes the process plant, administration building, workshops, sewage treatment plant, diesel storage tank farm and warehouses. New facilities needed for operations will include the DMS plant, a paste backfill plant, tailings stockpiles, liquified natural gas (LNG) facility, Water Storage Pond (WSP), Waste Rock Pile (WRP), water treatment plant, accommodations and kitchen, additional warehouse and concentrate load-out facility.
New dual-fuel powered low-speed power generator units will provide power and heat for the site. These power generator units will be located within the existing mill powerhouse after removal of the obsolete units currently in place. The energy source for the power generation will be provided by a combination of LNG using an on-site LNG storage / vaporization facility and diesel fuel from the existing diesel storage tank farm adjacent to the mill. The new generators will be outfitted with glycol heat recovery systems in order to maximize energy efficiency. The heat from the generators will be used to heat some of the surface facilities.
An active stockpile of tailings will be stored in a building with heating capability next to the paste backfill plant to provide feed to the plant. An outdoor area will accommodate a secondary tailings stockpile. The WRP will be located in a draw of the Harrison Creek valley north of the mill and accessed by trucks on a reconstructed internal site road.
A 150-person camp and cookhouse exists on the site, but most of the buildings have deteriorated beyond economical repair. They will be demolished and replaced by a modular camp adjacent to the upgraded administration building complex to be used during construction and operations.
The site water management plan includes the reconfiguration of a large pond originally intended for tailings into a two-celled WSP connected to the mine and mill via piping and to a new water treatment plant. An exfiltration trench below the bed of Prairie Creek will discharge site effluent.
The site is serviced by a 1,000 m gravel airstrip located approximately 1 km from the camp beside Prairie Creek which can accommodate passenger aircraft up to DHC-7 in size.
The construction of the process plant and site infrastructure will be initially serviced via a winter road (WR). Site production operations will be supported via an all-season road (ASR) which will be completed prior to concentrate production.
1.16 Environmental, Permitting and Social Considerations
1.16.1 Environmental Considerations
The Mine site is located in a mountainous region adjacent to Prairie Creek, and in an area within the Nahanni National Park Reserve. As part of environmental oversight, the mine will focus on effluent discharge and water quality to meet discharge standards. Mine waste will be managed by placing all flotation tailings underground as paste backfill and placing waste rock from underground and from the Mill in an engineered pile in a draw of a tributary to Prairie Creek. An existing large pond on site will be converted into a two-celled WSP, one cell to receive Mill process water and other contaminated water streams for recycling to the Mill, and one to receive groundwater intercepted underground for subsequent controlled release

Prairie Creek Page 1 5
NI 43-101 Technical Report on Preliminary Economic Assessment October 15, 2021
to the environment with treatment as necessary. Effluent discharge will vary seasonally according to flows in Prairie Creek in order to meet water quality objectives downstream.
1.16.2 Closure and Reclamation Considerations
Mine site reclamation will consist of removing buildings, grading dykes and berms to restore pre-development runoff patterns, and placing a soil cover over the WRP. Following mine closure, it is expected that there will be no surface drainage from mine portals as the underground workings and access tunnels will be backfilled with paste tailings and sealed with bulkheads. Some groundwater seepage from the bedrock surrounding the underground workings may occur, with the water containing some metals. A small quantity of seepage from the covered WRP is also possible. This seepage may require treatment to ensure receiving water quality objectives are met in the early post-closure period. A short-term contingency pump and treat system is provided for in closure costs for this possibility. Following mine site reclamation, the all -season road would be reclaimed by pulling back fill slopes, grading and installing runoff control features.
1.16.3 Permitting Considerations
Mine operating permits were received in 2013 and renewed in 2020. However, the Company is presently engaged in a process to acquire longer-term mine operating permits with some changes to reflect the expanded project and a superior water management plan. All-season road permits were received in 2019.
1.16.4 Social Considerations
The Mine site and access road are in an area claimed as the traditional territory of the Nahɂą Dehé Dene Band. The Łı́ı́dlı̨ı̨ Kųę́ ́First Nation also claim part of the area as their traditional territory. The Company has benefit agreements with both groups for the Mine and access road, and both are strongly supportive of the Project. The Company is presently negotiating an arrangement with a third group, the Acho Dene Koe, who’s territory is crossed by a public highway which is likely to be used for transportation of concentrates to market.
1.17 Markets and Contracts
1.17.1 Concentrate Market Outlook
Wood Mackenzie, a reputable market research company forecasts the requirement for concentrate supply in the future. This is known and the “supply gap” and during the operating life of Prairie Creek this gap is substantial for zinc and lead concentrates. This gap in supply is normally filled with new mines coming into production or extension of existing mines.
According to the estimated C1 by-product costs of $0.19/lb Zn in this PEA, Prairie Creek would be in the lowest third of all projected mines operating in 2027 in the Normal (by-product) C1 Cash Cost Curve by Wood Mackenzie.
Prairie Creek is well positioned to contribute to the future required mine supply.
1.17.2 Concentrate Quality
The predicted Prairie Creek Zinc Concentrate contains a significant amount of Hg, but otherwise is an attractive concentrate for processing by smelters because of its high Zn grade, low Fe and minimal deleterious elements. Prairie Creek is not

Prairie Creek Page 1 6
NI 43-101 Technical Report on Preliminary Economic Assessment October 15, 2021
unique for producing a zinc concentrate containing significant levels of Hg. For this reason, the majority of the Western World zinc smelters have capability to remove Hg.
The Prairie Creek Lead Concentrate is an attractive concentrate for processing by smelters in China, which is the largest market. The Hg level is significant but has much less of an impact than in the Prairie Creek Zinc Concentrates.
1.17.3 Marketing Plan and Timing
Discussions have been ongoing with potential Buyers of the concentrate. A non-binding Memorandum of Understanding (“MOU”) has been signed with Boliden which extends the validity of the existing MOU and significantly increases the quantity of zinc concentrate to be delivered to the Boliden.
Negotiations have been proceeding with other potential Buyers of the concentrates. These negotiations are expected to proceed to formal agreements as the development of the mine progresses.
1.18 Capital Cost Estimates
The capital cost estimate for the project covers the costs to design, procure, construct and commission the facilities described in this report. The estimate is categorized as an Ausenco Class 5 Level Estimate, in Q3 2021 United States dollars, with an expected accuracy of -25%/+35%.
The total estimated Pre-Production cost to design, construct, and commission the 2,400 tpd concentrator facilities described for the project is $368 M.
The cost estimate is based on a combination of detail and semi-detail estimating for most of the components supported by budgetary vendor and contractor quotes and historical data for items not quoted and bulk factor estimating for others.
The estimated capital costs for surface facilities include the purchase of materials and equipment, construction and installation of all structures, utilities, materials, and equipment, and all associated indirect and management costs. They also include contractor and engineering support to commission the process plant to ensure all systems are operational.
The Pre-production (initial) capital costs are summarized in Table 1-5.

Prairie Creek Page 1 7
NI 43-101 Technical Report on Preliminary Economic Assessment October 15, 2021
Table 1-5: Pre-production capital cost estimate – Prairie Creek Mine
Description Total Pre-Production Cost
($ M)
Mining $51.3
Site Preparation $1.4
Process plant1 $41.0
Paste Tailings Plant $27.6
Surface Infrastructure2 $40.8
All-Season Road (ASR) $88.9
Total Direct Costs 251.1
Site Indirects3 including EPCM $39.0
Owner’s costs (Operational Readiness & fuel) $25.4
Owner’s costs (capitalized Opex) $17.4
Total Directs, Indirects and Owner’s costs $332.9
Contingency4 $35.2
Total Pre-Production (Initial) Capital $368.1
1. Includes dense media separator, mill building remediation, process plant upgrade. 2. Includes site utilities, process plant mobile equipment, ancillary buildings, water treatment plant, WSP, WRP, winter road maintenance and
management, underground infrastructure. 3. Includes construction indirects, spares and initial fills, freight and logistics, commissioning and start-up, EPCM, vendor assistance. 4. Includes contingencies for mining $4.1 M, plant and infrastructure $22.3 M, Owner $1.7 M, ASR $7.1 M.
1.19 Operating Cost Estimate
The operating cost estimate is categorized as an Ausenco Class 5 Level Estimate, in Q3 2021 United States dollars, with an expected accuracy of -25%/+35%, which aligns with the Association for the Advancement of Cost Engineering (AACE) guidelines for a Concept Screening estimate for which has an accuracy range of -30 to -15%/+20 to +50%.
1.19.1 Basis of Estimate
Process plant operating costs are based on power consumption, reagent and consumables usage, and an operating labour roster. Power costs are based on the loads specified in the equipment lists and data. Where required, operating cost estimate details were built from factoring, benchmarking and first principles.
Total operating costs (per tonne of mill feed) including transportation to the smelter, for the life of mine (17,162,000 tonnes) are summarised in Table 1-6 below. Mining and transportation of concentrate make up two thirds of the operating cost while processing, site services and G&A makes up the other third.

Prairie Creek Page 1 8
NI 43-101 Technical Report on Preliminary Economic Assessment October 15, 2021
Table 1-6: Total Operating Cost Summary
Total Operating Cost (average for the LOM) ($/t)
Mining 53.97
Processing 26.64
General and Administrative 12.12
Site Service 17.55
Sub-total 110.28
Transportation1 57.22
Total 167.50 1. Includes truck/rail/handling/shipping
1.20 Economic Analysis
The economic analysis was performed using 8% discount rate and metals prices of 1.20 $/lb Zn, 1.05 $/lb Pb and 24.00 $/oz Ag. The pre-tax NPV 8% is $505 M, the internal rate of return IRR is 21.4%. On an after-tax basis, the NPV 8% is $299 M, the internal rate of return IRR is 17.7% and the payback 4.8 years.
Readers are cautioned that the economic analysis is preliminary in nature. It includes inferred Mineral Resources that are considered too speculative geologically to have the economic considerations applied to them that would enable them to be categorized as Mineral Reserves and there is no certainty that the preliminary economic analysis will be realized. Mineral Resources that are not Mineral Reserves do not have demonstrated economic viability.
1.21 Sensitivity Analysis
A sensitivity analysis (range of -20% to +20%) was conducted on the base case pre-tax and after-tax NPV and IRR of the Project, using the following variables: commodity price, discount rate, exchange rate, initial capital costs, and operating costs. Figure 1-4 shows the sensitivity analysis findings. Analysis revealed that the Project is most sensitive to changes in commodity prices and head grade, then, to a lesser extent, to exchange rate, operating costs and initial capital costs.

Prairie Creek Page 1 9
NI 43-101 Technical Report on Preliminary Economic Assessment October 15, 2021
Figure 1-4: NPV & IRR Sensitivity Results
Note: Figure prepared by Ausenco, 2021.
1.22 Risks and Opportunities
NorZinc has commenced an assessment of risks and opportunities for the Project based on likelihood and consequence of outcomes. Many of the risks are associated with current uncertainties related to the limited testing and technical information about the Mineral Resource estimate, material properties, and metallurgical parameters of the feed and concentrates, as would be expected in a PEA. Actions have been recommended in relevant geological, geotechnical, mining, metallurgy, and environmental areas as appropriate to better quantify aspects of the Project during more detailed next phase of the project studies.
1.22.1 Project Risks
Some of the key risks that have currently been identified and are being investigated are outlined in Table 1-7.
–
$300
$600
$900
$1,200
(20.0%) (10.0%) -- 10.0% 20.0%
Pre-Tax NPV Sensitivity 8% ($M)
Operating Costs Initial Capex Commodity Price
Head Grade FX
--
5%
10%
15%
20%
25%
30%
35%
(20.0%) (10.0%) -- 10.0% 20.0%
Pre-Tax IRR Sensitivity (%)
Operating Costs Initial Capex Commodity Price
Head Grade FX
($200)
–
$200
$400
$600
$800
(20.0%) (10.0%) -- 10.0% 20.0%
Post-Tax NPV Sensitivity 8% ($M)
Operating Costs Initial Capex Commodity Price
Head Grade FX
--
5%
10%
15%
20%
25%
30%
(20.0%) (10.0%) -- 10.0% 20.0%
Post-Tax IRR Sensitivity (%)
Operating Costs Initial Capex Commodity Price
Head Grade FX

Prairie Creek Page 2 0
NI 43-101 Technical Report on Preliminary Economic Assessment October 15, 2021
Table 1-7: Project Risks
Preliminary Project Risks
Risk Explanation/Potential Impact Possible Risk Mitigation
Low commodity prices The Project is sensitive to low commodity prices negatively affecting economics
A focus on efficiency throughout the operation will minimize the economic impact of lower commodity prices.
High materials and labour prices
The Project is sensitive to materials and labour prices over which it has limited control. The Project economic model is based on a combination of pricing for metals, materials and labour. This combination may change to the Project’s advantage or disadvantage.
Further optimization of all operation processes to minimize cost of production would assist in reducing the economic impact of high materials and labour prices.
Condition of existing earthworks
The existing road out of site continues to be taken over by the various creeks/rivers, due to high rain events in the area. Slippage in the ground along the main access road form the airstrip to site. Impact is that environment is gradually reclaiming site.
Continuous repairs, preservation and protection of earthworks from further damage.
Metallurgical risk may develop from changes or variation in characteristics of the mill feed material
Potential detrimental effect on the project economics from impact to lead, zinc and silver recovery. This can include from mineral particle size and associations, or rock hardness, that could affect comminution response. Fluctuating extent of grade or mineral oxidation, or varying content of other elements including iron, graphite, mercury and other potentially detrimental elements that can impact product concentrate grade and quality.
These risks will be mitigated through more optimization and variability metallurgical testwork and by considering additional process design or altering the operating procedures.
Site completion
Unknown factors as to the details of the present equipment/buildings still exist including materials quality and specifications. As-built drawings of existing buildings are not available.
The buildings have stood without distortion or significant weather damage since they were built. As-built inspections, material stock takes, building surveys and materials testing will, however, be advisable.
Condition of existing process plant equipment
The major process plant components (mill, crushers, filters) may need more extensive and possibly offsite refurbishment.
Preliminary site investigations have been completed with specialist vendor input. Early works to further define the condition of the components is advisable.
Schedule delays due to weather and logistics related to cold weather construction
Seasonal restrictions for access are variable and could affect Project schedule and alter project economics.
Experienced management and sound operating plans will minimize the effect of this potential problem
Global supply chain & freight expediting delays due to the ongoing pandemic
Impact on project schedule Experienced management and sound operating
plans will minimize the impact
Insufficient Geotechnical analysis
The Geotechnical for the project is only significant for this phase of study. Safety,
construction delays,excess dilution
A dedicated core logging and Geotechnical
modelling program should be launched to
derive mining parameters such as unplanned
dilution and support requirements, etc.

Prairie Creek Page 2 1
NI 43-101 Technical Report on Preliminary Economic Assessment October 15, 2021
Preliminary Project Risks
Risk Explanation/Potential Impact Possible Risk Mitigation
Covid construction cost impacts
There is a potential exposure risk of COVID-19 to the workforce due to the remote location of the mine and the travel requirements of the workforce. With vaccines and the COVID-19 mitigations, a disruption to the workforce is possible, with the potential for a short term shut down of activities.
COVID-19 Exposure Control Plan developed in
line with Public Health advise from the NWT
Chief Public Health Office and WSCC that
includes symptoms monitoring, hygiene,
physical distancing, masks and PPE, cleaning
protocols and PCR testing.
Ability to attract a qualified workforce
High turnover rates and availability of appropriate experienced technical and management staff could result in difficulties meeting project goals. Skilled labour shortages could furthermore translate into the operating phase of the Project, increasing operating costs
Contracting, recruitment and retention
strategies will be developed to minimize these
risks.
Careful recruitment of experienced senior management will be essential. Continue with comprehensive training programs for local people and northern residents. Firm but fair management, incentive bonus systems and an understanding of the importance of morale will minimize the effects of this problem.
Geotechnical conditions are worse than used from the geotechnical investigations for the pond slump
Failure of the slope at the back of the WSP. Loss of operations of these ponds
Additional geotechnical investigations and
monitoring. Possibly a larger buttress, which
could reduce the storage capacity of the
ponds.
Storage ponds are too small for operations since there is some uncertainty in mine flows
Water treatment cannot keep up with mine flow and the discharge of untreated water to the environment
Update water management plan during next
design phase to reflex better understanding of
site wide waters.
Regulatory change or regulatory review
Change in regulatory requirements resulting in permitting change and updated environmental compliance requirements and/or increased costs to meet requirements.
Continued engagement with federal and
territorial governments on reviews and new
legislation.
Indigenous Government change
Change in Indigenous leadership resulting in lack of support for project which may impact and future project updates/permitting process schedule or costs.
Continued engagement with Indigenous
Governments on benefits from project.
Some of these risks could be mitigated through sensitivity analysis.
1.22.2 Project Opportunities
Some of the identified key opportunities are tabulated in Table 1-8.

Prairie Creek Page 2 2
NI 43-101 Technical Report on Preliminary Economic Assessment October 15, 2021
Table 1-8: Project Opportunities
Project Opportunities
Opportunity Explanation Possible Benefit
Use of ore sorting as an alternative method of preconcentration rate
Ore sorting may prove to be more cost-effective solution when compared to Dense Media Separation (DMS).
Improved economics - reduced downstream capital and operating cost expenditure;
Cancelled equipment orders; bundling up new equipment orders
Take advantage of OEM’s cancelled equipment orders; by identifying major equipment supplier for the process flow sheet orders should be combined to receive equipment discount pricing.
Lower capital cost expenditure resulting in economic benefit for the project.
Used equipment Obtain used equipment for surface. Numerous sites are downsizing or closing and have available equipment.
Lower capital cost expenditure.
1.23 Recommendations
1.23.1 Recovery Methods
Ausenco recommends that ore sorting should be considered as an alternative pre-concentration method which could replace Dense Media Separation. As a first step, evaluation of the ore sorting process option for the Prairie Creek project should be conducted.
Based on the ore sorting benchmarking on similar lead/zinc deposits ore sorting could potentially add value to the project by:
• reducing operating cost in the pre-concentration circuit (eliminates the need for the Ferro Silica (FeSi); and
• simpler circuit to operate and maintain when compared to a DMS circuit (lower operating cost).

Prairie Creek Page 2 3
NI 43-101 Technical Report on Preliminary Economic Assessment October 15, 2021
2 INTRODUCTION
Ausenco Engineering Canada Inc. (Ausenco) was approached by NorZinc of Vancouver, Canada to prepare this technical Report on the Prairie Creek Property (the Property), located approximately 500 km west of Yellowknife in the Northwest Territories, Canada, with input from other experts as disclosed in Section 3 in accordance with the requirements of National Instrument 43-101 (NI 43-101), “Standards of Disclosure for Mineral Projects”, of the Canadian Securities Administrators (CSA) for lodgment on CSA’s “System for Electronic Document Analysis and Retrieval” (SEDAR).
2.1 Terms of Reference
The Report was prepared to support a Preliminary Economic Analysis (PEA) on the Project as disclosed in the Nor Zinc news release entitled “NorZinc ltd. Announces positive PEA including after tax NPV8% of US$299M on extended 20-year mine life at higher 2,400 tpd throughput,” dated October 21st, 2021. All costs featured in the document are expressed in $US.
NorZinc is the 100% owner of the Property, which consists of two surface leases and twelve mining leases. The Property assets include the Prairie Creek Mine, a processing plant, various mine and plant-related surface infrastructures, various earth moving and mining equipment, and numerous mineralized occurrences that are at various stages of exploration and development.
NorZinc is a premium mine developer specializing in high-grade silver, zinc and lead. It is a publicly traded mining exploration company that is based in Vancouver, Canada and with offices in Fort Simpson, NWT. NorZinc is listed on the Toronto Stock Exchange under the trading symbol “NZC”, on the OTCQB Venture Marketplace in the United States under trading symbol “NORZF”, and in Germany under the symbol "SRS" on the Frankfurt Exchange. The prime asset controlled by NorZinc is the Prairie Creek Property.
2.2 Qualified Persons
The names and details of persons who prepared, or who assisted the Qualified Persons (QPs) in the preparation of this Technical Report are listed in Table 2-1.

Prairie Creek Page 2 4
NI 43-101 Technical Report on Preliminary Economic Assessment October 15, 2021
Table 2-1: Persons who prepared or contributed to this Technical Report
Competent Person
Position Employer Independent of NorZinc
Date of Last Site Visit
Professional Designation
Sections of Report
Mr. Scott Elfen Global Lead – Geotechnical
Services
Ausenco Engineering Inc.
Yes No site visit P.Eng.
Section 18 and Subsection 1.15, 2.2, 25.10, and parts of 25.16, 26 and 27
Mr. Kevin Murray
Manager - Process
Engineering
Ausenco Engineering Inc.
Yes No site visit P.Eng.
Section 1.1; 1.2 ;1.3; 1.14 ; 1.17; 1.18; 1.19 ;1.20; 1.21; 1.22; 1.23; 2.1; 2.2 ;2.4;2.5;2.6;2.7;3.3;3.5; 4; 5; 6 ;17; 19; 21 (except 21.2.3 and 21.3.3);22 ;23; 25.2; 25.9; 25.12; 25.13; 25.14; 25.15; 25.16.1; 25.16.2; part of 26 and 27
Mr. Scott Weston
Vice President - Business
Development
GC Hemmera Inc.
Yes No site visit P.Eng.
Section 1.1; 1.16; 2.2 ;3.3; 20; ;22 ; 25.10 ; part of 27
Mr. Maurice Mostert
Manager - Western Canada
Mining Plus Canada
Consulting Ltd Yes No site visit P.Eng.
Section 16, 21.2.3, 21.3.3 and 25.8, and I have contributed to Sections 1.1, 1.13, 2.2, 2.7, 24, 26 and 27
Mr. Greg Mosher
Principal Geologist
Global Mineral Resource Services
Yes October 2021 P.Geo
Sections 1.4, 1.6, 1.7, 1.8, 1.10, 1.11, 7,8,9,10,11, 12, 25.3, 25.4 and 25.6 and am partially responsible for Sections 1.1, 2.2, 2.3, 2.4, 2.7, 3.2 and 27 of this Technical Report
Mr. Frank Wright
Metallurgical Engineer
F. Wright Consulting Inc.
Yes May 2017 P.Eng.
Section 13, along with sub-sections 1.1, 1.9, 2.2, 2.3, 2.7, 25.5, and portions of Section 26 and 27
Note: Where QPs accept responsibility for parts of sections, that responsibility is limited to their areas of expertise.
Details of the QP’s recent visits are provided in Section 2.3.

Prairie Creek Page 2 5
NI 43-101 Technical Report on Preliminary Economic Assessment October 15, 2021
2.3 Site Visits and Scope of Personal Inspection
Greg Mosher P.Geo., visited the site on October 8, 2021 for a period of half a day. During that visit, the collar locations for the 2020/21 drillholes were inspected and photographed, and GPS readings of the collar coordinates were collected. Mineralized intervals of drill core from hole PC-20-225 were examined and compared with written descriptions in the geology logs. Sample intervals recorded in the drill logs were also checked against the depth locations marked in the core boxes.
Mr. Frank Wright, P.Eng., visited the site on May 1, 2017. During the visit the site infrastructure was inspected focusing on the mill building, reagent storage areas and processing equipment present on the property. Photographs were taken and equipment descriptions were compared to the company’s list. The condition of the buildings and equipment were discussed with other independent engineering and mechanical inspectors present during the site visit. A sample of a flotation reagent stored at site was collected for use in bench scale laboratory testing to determine the remaining effectiveness of the reagent.
2.4 Effective date
There are number of significant dates, as follows:
• Date of the last data in the database supporting Mineral Resource estimation: August 25, 2021.
• Date of the closeout of the database supporting Mineral Resource estimation: September 7, 2021.
• Date of the Mineral Resource Estimate: October 15, 2021.
• Date of the economic analysis used in the PEA: October 15, 2021.
The overall effective date of the Report is October 15, 2021, which is the date of the completion of the Mineral Resource Estimate, and the date of the economic analysis in the PEA.
2.5 Information Sources and References
Reports and documents listed in the Reliance on Other Experts (Section 3) and References (Section 27.0) of this Report were used to support the preparation of the Report.
2.6 Previous Technical Reports
Previously filed technical reports on the Property are as follows:
• Prairie Creek Property Feasibility Study NI 43-101 Technical Report for Canadian Zinc Corporation, prepared by AMC, with an effective date of 28 September 2017.
• Prairie Creek Property Prefeasibility Update NI 43-101 Technical Report (Amended and Restated) for Canadian Zinc Corporation, prepared by AMC, with an effective date of 31 March 2016.

Prairie Creek Page 2 6
NI 43-101 Technical Report on Preliminary Economic Assessment October 15, 2021
• Prairie Creek Property NWT, Canada Technical Report for Canadian Zinc Corporation, prepared by AMC Mining Consultants, with an effective date of 15 June 2012.
2.7 Abbreviations
Table 2-2: Name Abbreviations
Abbreviation Description
ABA Acid-base accounting
ADK Acho Dene Koe First Nation
ARD/ML acid rock drainage and metal leaching
BBMWi Bond Ball Mill Work Index
CaO Calcium oxide
CA(OH)2 Calcium hydroxide
CPD Consolidated Project Description
CRP Closure and Reclamation Plan
CuSO4 Copper sulphate
DAR Developers Assessment Report
DCFN Dehcho First Nations
DMS Dense Media Separation
EIR Environmental Impact Review
ELOS Equivalent Linear Overbreak Slough
HLS Heavy Liquid Separation
ICP Induced Coupled Plasma spectrophotometry
K80 the theoretical mesh size through which 80% of the weight of particles pass through
LC, LCT Locked Cycle, Locked Cycle Test
LKFN Łı́ı́dlı̨ı ̨ Kų́ę ́ First Nation
LNG Liquefied Natural Gas
LOM Life of Mine
LUP Land use Permits
MIBC Methyl Isobutyl Carbinol
mL Millilitre
MOA Memorandum of Agreement
MOU Memorandum of Understanding
MQV Main Quartz Vein
MSO Mineable Shape Optimizer
MVRB Mackenzie Valley Environmental Impact Review Board
NDDB Nahɂą Dehé Dene Band
NNPR Nahanni National Park Reserve
NTPC Northwest Territories Power Corporation
NWT Northwest Territories
NZC Trading symbol for NorZinc
P80 Particle size for 80% of ground product passing at given sieve opening
PSA Particle Size Analyses
PSD Particle Size Distribution
QEMSCAN Quantitative Evaluation of Materials by Scanning Electron Microscopy
REA Report of Environmental Assessment
RLE Roast-Leach-Electrowin
SGS SGS Mineral Services Canada Ltd. Testing Laboratory
SIBX Sodium Isobutyl Xanthate

Prairie Creek Page 2 7
NI 43-101 Technical Report on Preliminary Economic Assessment October 15, 2021
SMS Stratabound Massive Sulphides
STK Stockwork
TOC Total organic carbon
Wi Work Index
WRP Waste Rock Pile
WSP Water Storage Pond
WTP Water Treatment Plant
XRF X-ray Fluorescence
ZnEq Zinc Equivalent
ZnSO4 Zinc Sulphate
Table 2-3: Unit Abbreviations
Abbreviation Description
AMSL above mean sea level
US$ United States dollar
C$ Canadian dollar
°C degree Celsius
°F degree Fahrenheit
% percent
μ micro
μm micrometre
cm centimetre
ft feet
ft2 square feet
g gram
g/t grams per tonne
ha hectare
hr hour
HP horsepower
km Kilometre (Canada) Kilometer (US)
koz thousand ounces
kV kilovolt
kW kilowatt
kWh kilowatt-hour
kWh/t Kilowatt per tonne
kN/m3 kilonewton per cubic metre
MW megawatt
kPa kilopascal
kcmil thousand circular mills
kN kilonewton
masl metres above sea level
mamsl metres above mean sea level
lbs pounds
L/s litre per second
M million
m metre
m/a metres per annum
m2 square metre
m3 cubic metre
mm millimetres

Prairie Creek Page 2 8
NI 43-101 Technical Report on Preliminary Economic Assessment October 15, 2021
t metric tonne
M million
Mt million tonnes
oz ounce
Moz million ounces
Mt mega tonne
ppb parts per billion
ppm parts per million
Stpd Short tons per day
ton short ton
tph tonnes per hour
t/d tonnes per day
tpd tonnes per day
tpa tonnes per annum
w/w/ w/s gravimetric moisture content (weight of water/weight of soil)
wt weight

Prairie Creek Page 2 9
NI 43-101 Technical Report on Preliminary Economic Assessment October 15, 2021
3 RELIANCE ON OTHER EXPERTS
3.1 Introduction
The QPs have relied upon the following other expert reports, which provided information regarding mineral rights, surface rights, property agreements, royalties, environmental, permitting, social licence, closure, taxation, and marketing for sections of this Report.
3.2 Property Agreements, Mineral Tenure, Surface Rights and Royalties
The Qualified Persons have relied, in respect of legal aspects, upon the work of the Expert listed below. To the extent permitted under NI 43-101, the Qualified Persons disclaim responsibility for the relevant section of the Report.
• Expert: Mr K. Cupit, Exploration and Project Manager, NZC.
• Report, opinion or statement relied upon: information on mineral tenure and status, title issues, royalty obligations, etc.
• Extent of reliance: full reliance following a review by the Qualified Persons.
• Portion of Technical Report to which disclaimer applies: Section 4.
3.3 Environmental, Permitting, Closure, and Social and Community Impacts
The QPs have fully relied upon, and disclaim responsibility for, information supplied by NorZinc and experts retained by NorZinc for information related to environmental (including groundwater predictions and water management plans) permitting, permitting, closure planning and related cost estimation, and social and community impacts as follows:
• Robertson Geoconsultants, Sep. 2019, “Mine Dewatering Simulations”, 170 pp.
• Robertson Geoconsultants, Sep. 2012, “Prediction of Post-Closure Contingency Pumping”, 15 pp.
• Robertson Geoconsultants, Mar. 2021, “Updated Pre-Mining and Post-Closure Water Quality Predictions”, 151 pp.
• O’Kane Consultants, Feb. 2010, “Results of Preliminary Numerical Modelling Program of WRP Cover System Alternatives”, 15 pp.
• Water management and effluent discharge plans and information provided by NZC.
• Advice on impact-benefit agreements and socio-economic agreements provided by NZC.
This information is used in Section 20 of the Report. The information is also used in support of the dewatering plan in Section 16, infrastructure descriptions in Section 18, and cost data in Section 21.

Prairie Creek Page 3 0
NI 43-101 Technical Report on Preliminary Economic Assessment October 15, 2021
3.4 Taxation
The Project has been evaluated on an after-tax basis to provide an approximate value of the potential economics. The tax model was compiled by NorZinc with assistance from third-party taxation professionals.
3.5 Markets
The QPs have not independently reviewed the marketing information. The QPs have fully relied upon, and disclaim responsibility for, information derived from Howard Okumura of H OKUMURA CONSULTING LTD a sales marketing Expert for this information as follows:
• Wood Mackenzie, Zinc_TCs_and_Balances.xls, Sep 2021.
• Wood Mackenzie, Lead_TCs_and_Balances.xls, Sep 2021.
• Wood Mackenzie, Zinc mine cost league curves_2027.xls, Sep 2021.
• The knowledge of the Expert acquired through decades’ experience working for a mining company.
• The knowledge of the Expert acquired through discussions, presentations, news releases by mining and smelting companies, and industry experts such as Wood Mackenzie, CRU, Refinitiv, Reuters, etc.
This information is used in Section 19 of the Report. The information is also used in support of the Report.
The sales and marketing of base metals concentrates is a very specialized business. It is common for external experts to be utilized to provide this information. The information is often of a qualitative nature as such judgement is required by external experts. More over the view established by the expert is based on information at the time and anticipates future events. Since it is not possible to have certainty regarding the future there is an inherent risk in the actual results that may occur.

Prairie Creek Page 3 1
NI 43-101 Technical Report on Preliminary Economic Assessment October 15, 2021
4 PROPERTY DESCRIPTION AND LOCATION
4.1 Property Location
The Property is located in the Northwest Territories, NWT, Canada, near the Yukon border, at latitude 61° 33’ North and longitude 124° 48’ West. The nearest communities include Nahanni Butte approximately 90 km to the southeast, Fort Liard approximately 170 km to the south, and Fort Simpson approximately 185 km to the east. Yellowknife, the capital and administrative centre of the NWT, is approximately 500 km to the east. The town of Fort Nelson, British Columbia, which is located approximately 340 km to the south of the Mine, is the primary charter point for incoming cargo and out-of-territory workers. Figure 4-1 shows the location of the Property within the Northwest Territories and relative to various population centres and mining operations.
Figure 4-1: Location of the Prairie Creek Property
Note: Figure prepared by NZC, 2021.

Prairie Creek Page 3 2
NI 43-101 Technical Report on Preliminary Economic Assessment October 15, 2021
The Mine site, which is highlighted in Figure 4-1, is located within the watershed of the South Nahanni River, approximately 48 km upstream of the point where Prairie Creek joins the South Nahanni River. The current boundary of the expanded Nahanni National Park Reserve (NNPR) is approximately 7 km downstream and 18 km upstream of the mine site. Since the expansion of the NNPR, the Property is located within an approximate 300 km2 area of territorial land that is now surrounded by, but not included in, the expanded NNPR. Figure 4-2 shows an overview of the mine site as of March 2017.
Figure 4-2: The Prairie Creek Mine Site
Note: Figure prepared by NZC 2021.
4.2 Project Description and Ownership
The Property tenure consists of mining leases and surface leases which are held by NorZinc and were issued by the Government of the Northwest Territories, as further described in Section 4.3.
The total area of all land holdings, including mining leases and surface leases at Prairie Creek, is 7,485 hectares. All of the leases, as listed in Table 4-1, are currently in good standing. The mining leases are located as shown in Figure 4-3.

Prairie Creek Page 3 3
NI 43-101 Technical Report on Preliminary Economic Assessment October 15, 2021
4.3 Property Agreements
Figure 4-3: Plan of leases and claims relative to Nahanni National Park Reserve Boundary
Note: Figure prepared by NZC, 2016.

Prairie Creek Page 3 4
NI 43-101 Technical Report on Preliminary Economic Assessment October 15, 2021
4.4 Land Tenure
The Mining Leases are renewable on a 21-year basis and currently have expiry dates ranging from September 2030 to August 2041.
The Surface Leases, containing the mine infrastructure, were originally granted by Aboriginal Affairs and Northern Development Canada (AANDC) on a renewable, ten-year basis and, since devolution of some Federal powers to the Northwest Territories on 1 April 2014, are now administered by the Government of the Northwest Territories (GNWT). Presently the surface leases are held in a recurring annual overholding tenancy which is renewed on March 31st of each year. These leases will remain until NorZinc negotiates new leases for operations. A minimum six months’ notice as to initiation of construction activities related to future mine operations has to be given to GNWT to allow time to prepare and negotiate the new leases.
The Gate 1 to 4 Mineral Claims were staked in 1999. In August 2010 a perimeter land survey of these claims was completed resulting in an adjusted total surface area of 2,776 hectares. New mining leases for the Gate Claims were received on 16 February 2011, are dated 9 September 2009, and have a term of 21 years, until 9 September 2030.
There is a 1.2% Net Smelter Return Royalty payable to Sandstorm Gold on the Property and 1% NSR Royalty payable to RCF VI CAD LLC.
The Prairie Creek Mine is located on land claimed as their traditional territory by the Nahɂą Dehé Dene Band (NDDB). The DCFN is engaged in ongoing land settlement negotiations with the Government of Canada and the Government of the Northwest Territories in what is referred to as the Dehcho Process. However, the NDDB has opted out of the DCFN, and is conducting their own negotiations regarding land claims.
Table 4-1-: Summary of NorZinc Land Holdings
Property Type File Number Name Expiry date Area (ha)
Surface leases 95F/10-5-5
95F/10-7-4
Mine site
Airstrip
31 March 2022
31 March 2022
113.6
18.2
Total surface lease area - - 131.8
Mining leases
ML 2854
ML 2931
ML 2932
ML 2933
ML 3313
ML 3314
ML 3315
Zone 8-12
Zone 4-7
Zone 3 / Main Zone
Rico West
Samantha
West Joe
Miterk
21 August 2040
4 August 2041
4 August 2041
4 August 2041
12 July 2031
12 July 2031
12 July 2031
743.0
909.0
871.0
172.0
420.0
196.0
43.5
ML 3338 Rico 16 July 2032 186.0
ML 5113 Gate 1 8 September 2030 794.0
ML 5114 Gate 2 8 September 2030 1,039.0
ML 5115 Gate 3 8 September 2030 944.0
ML 5116 Gate 4 8 September 2030 1,036.0
Total mining lease area - - 7,353.5
Grand Total - - 7,485.3

Prairie Creek Page 3 5
NI 43-101 Technical Report on Preliminary Economic Assessment October 15, 2021
4.5 Existing Environmental Liabilities
NorZinc’s exposure to the existing environmental liabilities at the Property are limited by the terms of the two surface leases. An “Abandonment Plan” is attached to the main site lease which specifies the activities to be undertaken with respect to existing infrastructure. The plan does not include full site reclamation, in fact buildings in a good state of repair are to be left, and there are no requirements for on-going water management and/or treatment. NorZinc’s exposure is the subject of security deposits associated with the surface leases and permits.
On 22 May 2015 the Mackenzie Valley Land and Water Board (MVLWB) approved amendments to security payments, relating to the issued Land Use Permit and Water Licence for operations at Prairie Creek, as proposed by NorZinc. The amended payments to be made during construction and the early years of operations reflected NorZinc’s limited existing liability at the site based on the Abandonment Plan associated with the Surface Leases. NorZinc made a payment to increase the total security to cover the existing liability. On 19 August 2015 the Government of the Northwest Territories confirmed that NorZinc had posted an additional security of $1,550,000 (additional to the previously posted $250,000 security) consistent with the MVLWB ruling.
The existing surface leases provide for site care and maintenance and exploration. A new closure and reclamation plan associated with the operations Water Licence will form the basis for future security payments tied to construction and operations.
Existing exploration land use permits and water licences issued by the Mackenzie Valley Land and Water Board also have separate security deposits associated with them to ensure reclamation of items covered by those permits is carried out.
4.6 Nahanni National Park Reserve
The NNPR was created in 1972 specifically for the purpose of setting aside the South Nahanni River for wilderness recreational purposes. Exploration activity at Prairie Creek Mine had been ongoing for many years prior to 1972 and underground development was well advanced at that time.
In June 2009, new legislation was enacted by the Canadian Parliament entitled “An Act to amend the Canada National Parks Act to enlarge Nahanni National Park Reserve of Canada” to provide for the expansion of the NNPR. The NNPR was expanded to 30,000 km2, making it the third largest National Park in Canada. The enlarged park covers most of the South Nahanni River watershed and completely encircles the Prairie Creek Mine. However, the Mine itself and a large surrounding area of approximately 300 km2 are specifically excluded from the expanded NNPR, as depicted in Figure 4-4, and the Parks Act was amended in parliament to allow the right of access into the Prairie Creek Mine. The Nááts’ihch’oh National Park Reserve was proclaimed in 2014 and adjoins NNPR to the northwest to further protect the South Nahanni watershed.

Prairie Creek Page 3 6
NI 43-101 Technical Report on Preliminary Economic Assessment October 15, 2021
Figure 4-4: Property in Relation to the Expanded Nahanni National Park Reserve
Note: Figure prepared by NZC, 2021.
The exclusion of the Prairie Creek Mine from the NNPR expansion area has brought clarity to the land use policy objectives for the region and facilitated various aspects of the environmental assessment process. In July 2008, Parks Canada Agency (Parks Canada) and NorZinc entered into a Memorandum of Understanding (MOU), valid for three years, with regard to the expansion of the NNPR and the development of the Prairie Creek Mine. In March 2012, the MOU was renewed for a further period of three years wherein Parks Canada and NorZinc agreed to work collaboratively to achieve their respective goals of managing the NNPR and an operating Prairie Creek Mine.
Subsequently the MOU was renewed in November 2015 for a period of five years, and again in September 2021 for another five years.

Prairie Creek Page 3 7
NI 43-101 Technical Report on Preliminary Economic Assessment October 15, 2021
5 ACCESSIBILITY, CLIMATE, LOCAL RESOURCES, INFRASTRUCTURE, AND PHYSIOGRAPHY
5.1 Accessibility
Year-round access to the Mine site is provided by charter aircraft, generally from Fort Nelson, BC or Fort Simpson, NWT, both of which are serviced by scheduled commercial airlines. A 1,000 m gravel airstrip is located on the flood plain of Prairie Creek, approximately 1 km north of the Mine site.
The Liard highway, which connects Fort Nelson, BC to Fort Simpson, NWT, is the closest major transportation route to the Property. A 170 km long winter road from the Blackstone crossing on the Liard highway was constructed in 1980. During the winters of 1981 and 1982 the road was used to transport the bulk of the building materials, supplies and equipment into the Mine site, which enabled the construction of the extensive infrastructure that is currently in place. About 700 loads per season of material, plant, machinery, equipment, and supplies were transported during this period. A proposed new all-season road will use much of the old winter road route with some key re-alignments, such as changing the eastern terminus to join with the Nahanni Butte access road which connects to the Liard Highway.
5.2 Climate
The climate in the general project area is sub-Arctic and is characterized by long, cold winters with moderate snowfall, and short but pleasant summers. A climate station is established immediately to the south of the mine site, which measures precipitation, temperature, wind speed and wind direction. A mean annual temperature of minus 4.1º Celsius was recorded during 2018-2019 with annual rainfall of 479 mm.
5.3 Local Resources
The hamlet of Nahanni Butte is the closest settlement to the Property (90 km by air). It has an airstrip, but it is remote and can offer only a limited labour force. Fort Simpson and Fort Liard are the next closest NWT communities and have businesses that may be a part of the procurement process to provide services such as labour, some heavy equipment, and supplies. Fort Nelson, BC (340 km south of Mine site) is located adjacent to both a railhead and the Alaska Highway and it can provide additional support.
5.4 Infrastructure
5.4.1 Utilities
Electrical power on-site is currently provided by diesel-powered generators. There are several generators available to bring on-line, depending on demand, and include a CAT 3412 750 kW, Isuzu 150 kW and a John Deere 75 kW. A diesel storage tank farm is located on site and capable of storing up to 6.8 million litres of diesel fuel. Potable water is extracted from an on-site well. A sewage treatment plant exists on-site but is not commissioned at this time.

Prairie Creek Page 3 8
NI 43-101 Technical Report on Preliminary Economic Assessment October 15, 2021
5.4.2 Formerly Intended Tailings Impoundment area
The (unused) tailings impoundment was designed by Golder Associates and was constructed in 1982 in conjunction with the surface construction and mine development activities.
The tailings impoundment was designed originally to store the fine fraction after tailings hydrocycloning, for size separation whilst coarse fraction was pumped back to the mine as a backfill
Current plans are that the existing large pond, originally intended for tailings disposal, will be reconfigured, relined, and recertified to form a two-celled WSP.
5.4.3 Communications
All outside communications from the site are via satellite. On site, radios are used to link surface work crews; a Femco telephone system has been installed underground.
5.4.4 Mine buildings
Most of the Mine site surface facilities were constructed in 1982, including a prefabricated administration building that contains office, mine dry, first aid and warehouse facilities, as well as a maintenance building and storage building. These buildings are in good condition. Trailer accommodations and kitchen facilities were built to support a 200-man construction crew, but these are in disrepair and will be replaced.
5.4.5 Processing plant
A processing plant, also constructed in 1982, consists of a crusher at that time rated to handle 1,500 short tons per day (stpd) of material, and a grinding and flotation circuit to produce separate lead and zinc concentrates that is rated at 1,000 short tons per day. The flotation circuit is partially constructed with some pieces of equipment not yet installed. Two Larox filters were installed for concentrate filtration and two conventional thickener tanks were constructed for dewatering the tailings slurry in preparation for the tailings backfill circuit that was never completed. Upon mine closure in 1982, the processing plant was incomplete.
A powerhouse, which contains four Cooper Bessemer 1.1 MW generators and switching facilities, was constructed but never operated.
5.5 Physiography
The Property is located in the Mackenzie Mountain Range with topography that varies in elevation from approximately 870 m to 1170 m above sea level, consisting of low mountains with moderate to steep sides and intervening narrow valleys. The Mine site is located at an elevation of 870 m above mean sea level. Valleys are well-incised, and the area is located within the Alpine forest-tundra section of the boreal forest, characterized by stunted fir and limited undergrowth. The trees that grow at the lower elevations give way to mossy open Alpine-type country at higher elevations.

Prairie Creek Page 3 9
NI 43-101 Technical Report on Preliminary Economic Assessment October 15, 2021
6 HISTORY
6.1 Activities and Ownership – 1928 to 1970
The original discovery of mineralization on the Property was made by a local trapper in 1928, at what is now known as the Zone 5 showing, a mineralized vein exposed in the south bank of Prairie Creek. Mr. Poole Field staked the first Mineral claims, and in 1958 a limited mapping program was undertaken by Fort Reliance Minerals Limited. The claims lapsed in 1965 and were re-staked and subsequently conveyed to Cadillac Explorations Limited in 1966. Cadillac also acquired a 182,590 acre regional Prospecting Permit.
Between 1966 and 1969, trenching was carried out on a number of mineralized zones and underground exploration was commenced in the Main Zone and Zones 7 and 8 as follow-up to trench results. Underground workings in Zone 7 consisted of a 280 m drive northward, collared approximately 325 vertical metres below the surface trenches. Similarly, in Zone 8 a 240 m long underground drive was collared in 1969 and driven south, opposite the Zone 7 portal, in an attempt to undercut the surface vein showings exposed in the trench 300 m vertically above the tunnels. Mineralization was intercepted in both drives but was lower in grade relative to the more positive results obtained in the Main Zone. A historical (not 43-101 compliant) Mineral Resource was at one time held for zones 7 and 8, containing 326,000 tonnes grading 12.3% Zn, 12.4% Pb and 182 g/t Ag. Additional drilling would be required for restating a modern resource estimate in these zones, which are peripheral to the larger and more accessible Main Zone. Both Zone 7 and 8 portals have been blocked by sloughed debris and the drives are inaccessible.
Cadillac’s Prospecting Permit expired in 1969 and 6,659 acres (210 claims) were selected by Cadillac and brought to lease. The Property was optioned to Penarroya Canada Limited (Penarroya) in 1970 and the then-existing underground development in the Main Zone was extended. Approximately 5,800 m of surface drilling and preliminary metallurgical testing were also carried out. Penarroya discontinued its work late in 1970, at which time Cadillac resumed full operation of the project.
6.2 Activities and Ownership – 1971 to 1991
In 1975, Noranda Exploration Company Limited optioned the southern portion of the Property, drilled eight holes and subsequently dropped its option in the same year. Cadillac, however, continued to develop the Main Zone underground workings and in 1979 re-sampled the crosscuts. A winter road from Camsell Bend to the site was used in the mid-1970s to transport equipment and supplies.
An independent feasibility study was completed in 1980 for Cadillac by Kilborn Engineering Limited (Kilborn), the results of which prompted the decision to put the Mine (then called Cadillac Mine) into production. In December of 1980, Procan Exploration Company Limited (Procan), a company associated with Herbert and Bunker Hunt of Texas agreed to provide financing for construction, mine development and working capital necessary to attain the planned production of 1,000 stpd.
Between 1980 and 1982, extensive mine development took place. Cadillac acquired a 1,000 stpd mill and concentrator from Churchill Copper, which was dismantled and transported to the site. The mill and concentrator were erected and a new camp was established. The winter road connecting the Mine to the newly established Liard highway was also constructed and over 700 loads of supplies were transported to site. Two more underground levels and extensive underground workings were subsequently developed. In 1982, the mine received a Class A Water Licence and, with a Land Use Permit also, was

Prairie Creek Page 4 0
NI 43-101 Technical Report on Preliminary Economic Assessment October 15, 2021
fully permitted for production. In early 1982 the price of silver collapsed. Construction activities continued until May 1982 when they were suspended due to lack of financing, which forced Cadillac into bankruptcy in May 1983, after a total of approximately C$64 M (1982 value) had been expended on the Property. Thereafter, site maintenance was taken over by Procan, which acquired Cadillac’s interest in the Property through bankruptcy proceedings in 1984.
6.3 Ownership Post – 1991
In 1991, Nanisivik Mines Limited (Nanisivik) acquired the Property from Procan. Pursuant to an option agreement dated 23 August 1991, NZC (then known as San Andreas Resources Corporation and later Canadian Zinc Corporation), acquired a 60% interest in the Property from Nanisivik.
Subsequently, pursuant to a 29 March 1993 Asset Purchase Agreement that superseded the 1991 Option Agreement, NorZinc acquired a 100% interest in the Mineral properties and a 60% interest in the plant and equipment, subject to a 2% net smelter royalty in favour of Procan. In January 2004, NorZinc acquired all of Procan’s (which had become Titan Pacific Resources Limited) interest in the plant and equipment, including the 2% net smelter royalty, thereby securing a 100% interest in the Property.
6.4 Historical Mineral Resource Estimates
Numerous historical estimates have been reported for the Main Zone deposits. The Main Zone in this report refers to Zones 1, 2, and 3. Initially these estimates were for the MQV only, but later incorporated the SMS and STK mineralization, as they were discovered. The chronology of historical resource estimates is shown in Table 6-1.
Table 6-1: Historical Resource Estimates
Year Company Zone estimated
Vein Stratabound Stockwork
1970 Behre Dolbear & Company for Pennarroya Canada Yes - -
1972 James & Buffam Yes - -
1980 Kilborn Yes - -
1983 Procan Exploration Yes - -
1993 Cominco Engineering Yes Yes
1995 Simons Mining Group Yes Yes Yes
1998 MRDI Canada Yes Yes Yes
2007 MineFill Service Inc. Yes Yes Yes
2012 AMC Mining Consultants (Canada) Ltd. Yes Yes Yes
2015 March AMC Mining Consultants (Canada) Ltd. Yes Yes Yes
2015 September AMC Mining Consultants (Canada) Ltd. Yes Yes Yes
None of the estimates completed prior to 2007 are NI 43-101 compliant. The 2007 estimate prepared by MineFill was used in a PEA prepared by SNC Lavalin in 2011, and originally reported in Stone DMR and Godden SJ 2007, Technical Report on the Prairie Creek Mine, Northwest Territories 12 October 2007, prepared by MineFill Service Inc.
The most recent Mineral Resource estimate, completed by GMRS in October 2021, is discussed in Section 14.

Prairie Creek Page 4 1
NI 43-101 Technical Report on Preliminary Economic Assessment October 15, 2021
6.5 Production
There has been no production from the Property, despite trial mining having been carried out in 1982. During the trial mining period, mineralized material stockpile was created in the main yard near the mill and is estimated to include approximately 10,000 tonnes of material. While historical reports indicate this stockpile was mostly from shrinkage stope development, it has not been evaluated and, since it has been weathering for 40 years, has been given no value as a Mineral Resource at this time.

Prairie Creek Page 4 2
NI 43-101 Technical Report on Preliminary Economic Assessment October 15, 2021
7 GEOLOGICAL SETTING AND MINERALIZATION
7.1 Regional Geology
The Property is located within a westward-thickening wedge of sedimentary rocks of mid-Proterozoic to mid-Jurassic age that was deposited along the paleo-continental margin of western North America.
The Property is underlain by lower Paleozoic-age clastic sedimentary strata that were deposited in the Prairie Creek Embayment, an eastward incursion of the Selwyn Basin into the western edge of the Mackenzie Platform.

Prairie Creek Page 4 3
NI 43-101 Technical Report on Preliminary Economic Assessment October 15, 2021
Figure 7-1: Prairie Creek Regional Geology
Note: Figure prepared by Paradis, 2007.

Prairie Creek Page 4 4
NI 43-101 Technical Report on Preliminary Economic Assessment October 15, 2021
During the period from Ordovician to Devonian time, the western edge of the platform represented the western margin of the North American continent, and during this time, shallow-water carbonates were deposited on the Mackenzie Platform while deep-water clastic sediments were contemporaneously deposited in the basin to the west. The Prairie Creek Embayment is interpreted (Morrow and Cook 1987) to have developed as a half-graben controlled by a north-trending fault with down-drop to the west.
Sedimentation into the Prairie Creek embayment ended in mid-Jurassic time when eastward collision of an island-arc terrane led to imbrication and folding of the sedimentary succession and to the intrusion of widespread post-tectonic plutons of Cretaceous-age.
The structural style of deformation varies with lithology; thick, predominantly carbonate units form large structures whereas thin-bedded clastic units form repeated small folds and fault panels. These variations are evident in the Prairie Creek Embayment where three phases of deformation have occurred. The earliest phase corresponds to regional north-south folding.
These folds are cut by steep-dipping wrench faults that were subsequently reactivated as high-angle reverse faults. The reverse faults are post-dated by shallow north-trending thrust faults that predominantly occur within the carbonate platform.
The present margins of the Prairie Creek Embayment are defined by the Tundra Thrust to the east and the Manetoe Thrust 20 km to the west. These thrusts juxtapose shallow-water shelf carbonates against deeper-water basinal sedimentary rocks of the Embayment.
7.2 Property Geology
7.2.1 Stratigraphy
The lower Paleozoic strata exposed in the area of the Property are divisible into four major subdivisions that reflect abrupt changes in patterns of sedimentation related to the inception, growth and filling of the Prairie Creek Embayment. In ascending stratigraphic order these subdivisions are: 1) Sunblood Platform, 2) Mount Kindle-Root River assemblage, 3) Prairie Creek assemblage, and 4) Funeral-Headless assemblage.
The Sunblood Platform consists of shallow-water, argillaceous limestone and dolomite of the Sunblood Formation of middle Ordovician age. In the Prairie Creek area the Sunblood Formation is unconformably overlain by dolostones of the Whittaker Formation and, west of Prairie Creek, the Sunblood Formation is conformably overlain by basinal shales of the Road River Formation.
The Mount Kindle-Root River assemblage is comprised of the Whittaker, Road River and Root River Formations of Late Ordovician to Devonian age. The Mount Kindle Formation, the shallow-water equivalent of the Whittaker, is not present in the Prairie Creek area. The Whittaker Formation is divided into three members: 1) lower dark-grey silty to sandy limestone of middle to upper Ordovician age (muOw1), 2) fine-grained quartzite of middle to upper Ordovician age (muOw2), and 3) laminated, dark-grey fine-crystalline dolostone of upper Ordovician to Silurian age (OSW3) that is the host rock of the stratabound mineralization at Prairie Creek. The Silurian-Devonian age Road River Formation conformably overlies the Whittaker Formation and is comprised of graptolite-bearing shale and argillaceous dolostone. The Silurian-age Root River Formation is comprised of light-grey, vuggy, micritic dolostone, and is interpreted to be the shallow-water equivalent of the Cadillac Formation.

Prairie Creek Page 4 5
NI 43-101 Technical Report on Preliminary Economic Assessment October 15, 2021
The Upper Whittaker has been divided into seven lithological sub-units on the basis of detailed information obtained from diamond drilling (Table 7-1). From stratigraphic top to bottom these sub-units are the Interbedded Chert-Dolomite (OSW3-7), Upper Spar (OSW3-6), Upper Chert Nodular Dolomite (OSW3-5), Lower Spar (OSW3-4), Lower Chert Nodular Dolomite (OSW3-3), Mottled Dolomite (OSW3-2), and Massive Dolomite (OSW3-1). The thickness of individual units varies broadly because contacts are generally gradational.
The Prairie Creek assemblage of Silurian to Devonian age is variable in both lithology and thickness, which reflects the inception and growth of the Prairie Creek Embayment.
The assemblage is comprised of lower and upper Cadillac Formation phases. The lower phase marks the onset of the Embayment during Early Devonian time and is comprised of orange-weathering siltstone and carbonate debris flows. The upper Cadillac phase encompasses strata deposited in the Embayment throughout early Devonian time and comprises the Sombre and Arnica Formations as well as the pink shale member of the Cadillac Formation.
The Funeral-Headless assemblage of middle Devonian age records the disappearance of the Embayment and is comprised of shale, dolostone and limestone.
Table 7-1 summarizes the Prairie Creek stratigraphy. Figure 7-2 is a simplified geological map of the Property area and Figure 7-3 is a representative cross-section through the main mine area showing both stratigraphy and mineralization.
Table 7-1: Summary of the Prairie Creek Stratigraphy
Formation Code Thickness (m) Description
Arnica ImDAb 200 to 250 Finely crystalline black nodular and banded cherty dolostone and
limestone with white quartz-carbonate crackle veining.
Cadillac SDC 300 to 350 Grey, thinly banded siltstone / shale with minor debris flow.
Road River SDR 230 to 280 Mid-dark grey graphitic argillaceous bioclastic dolostone (graptolites common, occasional crinoids and brachiopods). Marker horizon near
base – possible debris flow.
Upper Whittaker
OSW3-7 50 to 55 Interbedded chert-dolostone unit. Well-bedded, black to mid-grey cherts interbedded with dolostone. Chert content decreases with depth. Algal mat-type structures and possible dolomitized anhydrite towards base.
OSW3-6 11 to 25 Upper Spar unit. Massive bioclastic, mid-grey, fine grained dolostone with white spar-filled cavities. Bioclastic material is fine grained and
comminuted (crinoids, brachiopods).
OSW3-5 55 to 100 Upper chert nodule-dolostone unit. Massive to poorly bedded weakly
bioclastic, fine- to medium- grained dolostone. Mid-grey to black chert nodules.
OSW3-4 9 to 24 Lower Spar unit (similar to the Upper Spar unit).
OSW3-3 40 to 60 Lower Chert Nodule-dolostone unit (similar to Upper chert-nodule
dolostone unit).
OSW3-2 20 to 30 Mottled dolostone unit. Fine grained dolostone with spheroidal mottled texture and chert. Unit is host to Stratabound Massive Sulphide (SMS)
deposits. Disseminated fine-grained pyrite common.

Prairie Creek Page 4 6
NI 43-101 Technical Report on Preliminary Economic Assessment October 15, 2021
Formation Code Thickness (m) Description
OSW3-1 20 to 30 Grey massive dolostone with minor chert nodules.
Middle Whittaker muOW2 40 to 50 Grey gritty dolostone with some sand size grit units with greenish,
shaley partings.
Lower Whittaker muOW1 +50 Chert Nodule dolomite.
7.2.2 Structure
In the immediate area of the Property, fault and fold axes trend north-south; the most significant fold is the gently, doubly-plunging Prairie Creek Anticline (PCA), which is the locus of all of the immediate Prairie Creek mineralization. Windows of Upper Whittaker and Road River Formation strata are exposed through the overlying Cadillac Formation along the axis of the PCA.
The PCA is bounded to the east by the Prairie Creek Fault and to the west by the Gate Fault. Both are west-dipping thrusts. The Prairie Creek Fault is up to 40 m thick and has a dextral displacement of approximately 1,500 m.

Prairie Creek Page 4 7
NI 43-101 Technical Report on Preliminary Economic Assessment October 15, 2021
Figure 7-2: Prairie Creek Property Geology
Note: Figure prepared by Paradis, 2007.

Prairie Creek Page 4 8
NI 43-101 Technical Report on Preliminary Economic Assessment October 15, 2021
Figure 7-3: Simplified Vertical Section Cross Section of Prairie Creek Main Zone
Note: Figure prepared by NZC, 2015.
Leases in the northern part of the Property straddle the Tundra Thrust, which separates strata of the PCA to the west from platformal strata to the east (Figure 7-2). The platformal sediments are relatively undeformed and comprise a stratigraphic

Prairie Creek Page 4 9
NI 43-101 Technical Report on Preliminary Economic Assessment October 15, 2021
sequence starting with the Road River Formation that is overlain, from oldest to youngest, by the Root River, Camsell and Sombre Formations. MVT mineralization is hosted in biohermal reefs of the Root River Formation, or facies equivalent.
In the Mine area, the continuation of the Tundra Thrust separates the Prairie Creek Anticline from the marginal platform, approximately 2 km east of the mine site. The platformal sequence in this area is dominated by a thick assemblage of Sombre Formation dolomites.
To the west of the Mine area, four contiguous Gate mining leases overlie lithological assemblages similar to those found in the Prairie Creek Assemblage (Figure 7-2). Grassroots exploration was carried out in this area for the presence of mineralization similar to that found in the Mine area. The Whittaker and Road River Formations occur within the Gate Leases as relatively flat-lying to gently dipping units and, compared to the PCA, the prospective Whittaker Formation is more extensively exposed.
7.3 Mineralization
Exploration has located numerous base metal occurrences on the Property that can be grouped into four styles of mineralization:
• Quartz veins containing base metal mineralization occur in a north-trending, 16-km-long corridor in the southern portion of the Property where the occurrences are exposed at surface. Vein showings were referred to historically as Zones 1 through 12, as shown on Figure 7-2. The Main Zone, which includes the Main Quartz Vein (MQV) and other styles of mineralization, is found in historical Zones 1, 2, and 3. Vein Zones 4 to 12 extend discontinuously for about 10 km to the south of the Main Zone. The Rico showing is located approximately 4 km north of the Main Zone.
• Stockwork-style (STK) mineralization is associated with the MQV and does not represent a true stockwork but rather a series of tensional splays from the MQV. STK mineralization is exposed underground in the 883 mL and has been intersected in drillholes.
• Stratabound Massive Sulphide (SMS) mineralization is associated with several of the vein zones and occurs near the currently known lower limits of vein mineralization. Vein mineralization contains fragments of SMS indicating that the deposition of SMS pre-dated vein formation. SMS mineralization is not exposed on surface or underground and is known only from drillholes.
• Mississippi Valley type (MVT) showings in the northern section of the Property are developed over a distance of approximately 10 km and from north to south are referred to as the Samantha, Joe, Horse, Zulu, Zebra, and Road showings (Figure 7-2).
7.3.1 MQV Mineralization
Vein-type mineralization developed within the cherty dolomites of the Ordovician-Silurian age Upper Whittaker Formation and shaly dolomites of the lower Road River Formation, along the axial plane of the PCA.
MQV type mineralization comprises massive to disseminated galena and sphalerite with lesser pyrite and tetrahedrite-tennantite in a quartz-carbonate-dolomite matrix. Secondary oxidation is variably developed, yielding mainly cerussite (lead oxide) and smithsonite (zinc oxide); tetrahedrite-tennantite has undergone only minor oxidation. Silver is present in solid solution with tetrahedrite-tennantite and to a lesser extent with galena. Veins dip steeply to the east; widths generally vary between less than 0.1 m up to 5 m, with an average horizontal thickness of approximately 2.7 m.

Prairie Creek Page 5 0
NI 43-101 Technical Report on Preliminary Economic Assessment October 15, 2021
The MQV is the most extensively developed of the known mineral zones. Underground development and diamond drilling have demonstrated the continuity of the MQV over a horizontal strike length of 2.3 km. The MQV trends approximately north-south and dips between vertical and 40º east (average dip is 65º east). It remains open to the north and may continue for a further 4 km to the Rico showing. Diamond drilling has indicated continuity to a depth of at least 450 masl.
Mineralization is best developed in the more competent (brittle) units of the Lower Road River and Whittaker Formations; graphitic shale in the mid and upper parts of the Road River Formation is less competent and contained veins are poorly developed. For example, at the end of 930 mL the MQV can be seen to dissipate into the middle-Road River shales. As well, the vein does not appear to be well developed in the shales of the Cadillac Formation lying stratigraphically above the Road River Formation.
Figure 7-4: MQV Exposed Underground
Note: Figure provided by NZC, 2021
Preliminary structural evidence suggests that the various mineralized vein showings may be structurally linked as a series of en échelon segments comprising a single, but structurally complex, mineralized vein structure. An en échelon vein structure could offer a simple explanation for apparent off-sets between the various vein showings.
7.3.2 STK Mineralization
Towards the end of 930 mL at Crosscut 30, a series of narrow (average 0.3 m wide), massive sphalerite-galena-tennantite veins are developed at about 40º to the average trend of the MQV. These sub-vertical veins range in thickness from 0.1 to

Prairie Creek Page 5 1
NI 43-101 Technical Report on Preliminary Economic Assessment October 15, 2021
0.5 m, have no apparent alteration halo, and are separated from each other by unmineralized dolomite. The veins are locally offset and cut off by fault planes and are difficult to correlate at the present level of information. This style of mineralization is referred to as STK, although it does not represent a true stockwork but rather a series of splays off the MQV. To date, STK-style mineralization has only been located in the immediate area surrounding the exposure in the 930 mL workings and through diamond drilling. There is also evidence that the STK may be exposed on surface towards the northern end of the main zone but is partially obscured by alluvium.
Figure 7-5: STK Mineralization Showing Separate Distinct high-grade sub-vertical veins in 883 mL
Note: Figure provided by NZC, 2021.
7.3.3 SMS Mineralization
SMS mineralization was discovered by NZC in 1992 while testing the depth extent of the MQV. To date, intermittent occurrences of SMS mineralization have been intersected in drillholes over a strike length of more than 800 m in the Main Zone, as well as in Zones 4, 5, and 6 (Figure 7-6).
Mineralization is generally fine-grained, banded to semi-massive, and comprises massive fine-grained sphalerite, coarse-grained galena and disseminated to massive pyrite. Silver is contained in solid solution within both galena and sphalerite

Prairie Creek Page 5 2
NI 43-101 Technical Report on Preliminary Economic Assessment October 15, 2021
and the SMS mineralization contains no tennantite-tetrahedrite, very little copper, half as much galena, but substantially more iron sulphide / pyrite than typical vein mineralization. Fragments of SMS mineralization occur in vein mineralization indicating that the SMS predates the veins.
The majority of SMS mineralization occurs within the Mottled Dolomite unit of the Whittaker Formation (OSW3-2, see Table 7-1), which the mineralization totally replaces without any significant alteration. SMS sulphides are developed close to both the vein system and the axis of the PCA and are presumably older than the vein mineralization (Figure 7-3). An apparent thickness of up to 28 m of SMS mineralization has been intersected in MQV drillholes, approximately 200 m below 883 mL.
Figure 7-6: SMS Mineralization Showing Massive Sphalerite and Pyrite in Drill Core
Note: Figure provided by NZC, 2021.
7.3.4 MVT Mineralization
MVT mineralization found on the Property is comprised of colloform rims of sphalerite, brassy pyrite-marcasite and minor galena, with or without later dolomite infilling. The mineralization appears to occur discontinuously within coarse biohermal reefs of the Root River Formation, and always at approximately the same stratigraphic horizon. It appears to be classic MVT mineralization insofar as it occurs in open cavity-type settings.
An example of MVT style of mineralization showing the colloform nature of sulphide rimming fragments of local dolomite in chip and drill core from the Zebra showing is shown in Figure 7-7.

Prairie Creek Page 5 3
NI 43-101 Technical Report on Preliminary Economic Assessment October 15, 2021
Figure 7-7: MVT style mineralization showing colloform sphalerite rimming dolomite fragment from Zebra showing
Note: Figure provided by NZC, 2021.

Prairie Creek Page 5 4
NI 43-101 Technical Report on Preliminary Economic Assessment October 15, 2021
8 DEPOSIT TYPES
Four main styles of base metal mineralization have been identified on the Property:
• Hydrothermal Quartz Veins (MQV);
• Stockwork (STK);
• Stratabound (SMS); and
• Mississippi Valley type (MVT).
In the following generic descriptions, the STK style is discussed with the MQV because, as represented on the Property, it is directly related to and a subset of the MQV.
8.1 Hydrothermal Quartz Veins (MQV and STK)
The hydrothermal quartz veins of the MQV (and STK), are characteristic of polymetallic base metal veins, the salient characteristics of which follow (modified after Lefebure and Church 1996):
Tectonic settings: These veins occur in virtually all tectonic settings except oceanic, including continental margins, island arcs, continental volcanic and cratonic sequences.
Depositional environment / geological setting: In sedimentary host rocks veins are emplaced along faults and fractures in sedimentary basins dominated by clastic rocks that have been deformed, metamorphosed and intruded by igneous rocks. Veins postdate deformation and metamorphism.
Age of Mineralization: Proterozoic or younger.
Host / associated rock types: These veins can occur in virtually any host. Most commonly the veins are hosted by thick sequences of clastic sedimentary or intermediate to felsic volcanic rocks.
Deposit form: Typically, steeply dipping, narrow, tabular or splayed veins. Commonly occur as sets of parallel and offset veins. Individual veins vary from centimetres up to more than 3 m wide and can be followed from a few hundred to more than 1,000 m in length and depth.
Texture / structure: Compound veins with a complex paragenetic sequence are common. A wide variety of textures exist, including cockade texture, colloform banding and crustiform textures, and are locally druzy. Veins may grade into broad zones of STK or breccia. Coarse-grained sulphides as patches and pods, and fine-grained disseminations are confined to veins.
Ore Mineralogy: (Principal and subordinate): Galena, sphalerite, tetrahedrite-tennantite, other sulphosalts including pyrargyrite, stephanite, bournonite and acanthite, native silver, chalcopyrite, pyrite, arsenopyrite, and stibnite. Silver minerals often occur as inclusions in galena. Native gold and electrum are in some deposits. Rhythmic compositional banding is

Prairie Creek Page 5 5
NI 43-101 Technical Report on Preliminary Economic Assessment October 15, 2021
sometimes present in sphalerite. Some veins contain more chalcopyrite and gold at depth and gold grades are normally low for the amount of sulphides present.
Gangue Mineralogy: (Principal and subordinate): In sedimentary host rocks: Carbonates (most commonly siderite with minor dolomite, ankerite and calcite), quartz, barite, fluorite, magnetite, and bitumen.
Alteration Mineralogy: Macroscopic wall rock alteration is typically limited in extent (measured in metres or less). The metasediments typically display sericitization, silicification, and pyritization. Thin veining of siderite or ankerite may be locally developed adjacent to veins.
Weathering: Galena and sphalerite weather to secondary lead and zinc carbonates and lead sulphate. In some deposits supergene enrichment has produced native and horn silver.
Mineralization controls: Regional faults, fault sets, and fractures are an important mineralization control. However, veins are typically associated with second order structures. In igneous rocks the faults may relate to volcanic centres. Significant deposits restricted to competent lithologies. Dikes are often emplaced along the same faults and in some camps are believed to be roughly contemporaneous with mineralization. Some polymetallic veins are found surrounding intrusions with porphyry deposits or prospects.
Genetic models: Historically these veins have been considered to result from differentiation of magma with the development of a volatile fluid phase that escaped along faults to form the veins. More recently researchers have preferred to invoke mixing of cooler, upper crustal hydrothermal or meteoric waters with rising fluids that could be metamorphic, groundwater heated by an intrusion or expelled directly from a differentiating magma.
8.2 SMS Mineralization
The Irish carbonate-hosted, lead-zinc deposits (e.g. Lisheen, Galmoy, and Silvermines) may be the most appropriate analogy for the SMS. A brief description of this class of deposit follows (modified after Hoy 1996).
Tectonic setting: Platformal sequences on continental margins which commonly overlie deformed and metamorphosed continental crustal rocks.
Depositional environment / geological setting: Adjacent to normal growth faults in transgressive, shallow marine platformal carbonates. Also, commonly localized near basin margins.
Age of Mineralization: Known deposits are believed to be Paleozoic in age and younger than their host rocks. Irish deposits are hosted by Lower Carboniferous rocks.
Host/associated rock types: Hosted by thick, non-argillaceous carbonate rocks. These are commonly the lowest pure carbonates in the stratigraphic succession. They comprise micritic and oolitic beds, and fine-grained calcarenites in calcareous shale, sandstone, and calcarenite succession. Underlying rocks include sandstones or argillaceous calcarenites and shales. Iron formations, comprising interlayered hematite, chert and limestone, may occur as distal facies to some deposits.
Deposit form: Deposits are typically wedge shaped, ranging from over 30 m thick adjacent to, or along growth faults, to 1-2 cm bands of massive sulphides at the periphery of lenses. Economic mineralization rarely extends more than 200 m from the faults. Large deposits comprise individual or stacked sulphide lenses that are roughly concordant with bedding. In detail ,

Prairie Creek Page 5 6
NI 43-101 Technical Report on Preliminary Economic Assessment October 15, 2021
however, most lenses cut host stratigraphy at low angles. Contacts are sharp to gradational. Deformed deposits are typically elongate within and parallel to the hinges of tight folds.
Texture / structure: Sulphide lenses are massive to occasionally well-layered. Typically, massive sulphides adjacent to faults grade outward into veinlet-controlled or disseminated sulphides. Colloform sphalerite and pyrite textures occur locally. Breccias are common with sulphides forming the matrix to carbonate (or as clasts). Sphalerite-galena veins, locally brecciated, commonly cut massive sulphides. Rarely, thin laminated, graded and cross-bedded sulphides, with framboidal pyrite, occur above more massive sulphide lenses.
Ore Mineralogy: (Principal and subordinate): Sphalerite, galena; barite, chalcopyrite, pyrrhotite, tennantite, sulfosalts, tetrahedrite, and chalcopyrite.
Gangue Mineralogy: (Principal and subordinate): Dolomite, calcite, quartz, pyrite, marcasite; siderite, barite, hematite, magnetite; at higher metamorphic grades, olivine, diopside, tremolite, wollastonite, and garnet.
Alteration Mineralogy: Extensive early dolomitization forms an envelope around most deposits which extends tens of metres beyond the sulphides. Dolomitization associated with mineralization is generally fine grained, commonly iron-rich, and locally brecciated and less well banded than limestone. Manganese halos occur around some deposits; silicification is local and uncommon. Iron occurs in more distal formations.
Weathering: Gossan Minerals include limonite, cerussite, anglesite, smithsonite, hemimorphite, and pyromorphite.
Mineralization controls: Deposits are restricted to relatively pure, shallow-marine carbonates. Regional basement structures and, locally, growth faults are important. Orebodies may be more common at fault intersections. Proximity to carbonate bank margins may be a regional control in some districts.
Genetic model: Two models are commonly proposed:
• Syngenetic seafloor deposition: Evidence includes stratiform geometry of some deposits, occurrence together of bedded and clastic sulphides, sedimentary textures in sulphides, and, where determined, similar ages for mineralization and host rocks.
• Diagenetic to epigenetic replacement: Replacement and open-space filling textures, lack of laminated sulphides in most deposits, alteration and mineralization above sulphide lenses, and lack of seafloor oxidation.
8.3 MVT
Salient characteristics of MVT mineral deposits are presented below (modified after Alldrick and Sangster 2005).
Tectonic settings: Most commonly stable interior cratonic platform or continental shelf. Some deposits are incorporated in foreland thrust belts.
Depositional environment / geological setting: Host rocks form in shallow water, particularly tidal and subtidal marine environments. Reef complexes may be developed on or near paleo-topographic basement highs. The majority of deposits are found around the margins of deep-water shale basins. Some are located within or near rifts (Nanisivik, Alpine district).

Prairie Creek Page 5 7
NI 43-101 Technical Report on Preliminary Economic Assessment October 15, 2021
Age of Mineralization: Proterozoic to Tertiary, with two peaks in Devonian to Permian and Cretaceous to Eocene time. Dating mineralization has confirmed the epigenetic character of these deposits. The difference between host rock age and mineralization age varies from district to district.
Host / associated rock types: Host rocks are most commonly dolostone, limestone, or dolomitized limestone. Locally hosted in sandstone, conglomerate or calcareous shale.
Deposit form: Highly irregular. May be concordant as planar, braided or linear replacement bodies. May be discordant in roughly cylindrical collapse breccias. Individual ore bodies range from a few tens to a few hundreds of metres in the two dimensions parallel with bedding. Perpendicular to bedding, dimensions are usually a few tens of metres. Deposits tend to be interconnected thereby blurring deposit boundaries.
Texture / structure: Most commonly as sulphide cement to chaotic collapse breccia. Sulphide minerals may be disseminated between breccia fragments, deposited as layers atop fragments (snow-on-roof), or completely filling the intra-fragment space. Sphalerite commonly displays banding, either as colloform cement or as detrital layers (internal sediments) between host-rock fragments. Sulphide stalactites are abundant in some deposits. Both extremely fine-grained and extremely coarse-grained textured sulphide minerals may be found in the same deposit. Precipitation is usually in the order pyrite (marcasite) → sphalerite → galena.
Ore Mineralogy: (Principal and subordinate): Galena, sphalerite, barite, and fluorite. Some mineralization contains up to 30 ppm Ag. Although some MVT districts display metal zoning, this is not a common feature. The Southeast Missouri district and small portions of the Upper Mississippi Valley district are unusual in containing significant amounts of Ni-, Co-, and Cu-sulphides.
Gangue Mineralogy: (Principal and subordinate): Dolomite (can be pinkish), pyrite, marcasite, quartz, calcite, gypsum.
Alteration Mineralogy: Extensive finely crystalline dolostone may occur regionally, whereas coarse crystalline dolomite is more common close to mineralization. Extensive carbonate dissolution results in deposition of insoluble residual components as internal sediments. Silicification (jasperoid) is closely associated with ore bodies in the Tri-State and northern Arkansas districts. Authigenic clays composed of illite, chlorite, muscovite, dickite, and or kaolinite accumulate in vugs; minor authigenic feldspar (adularia).
Weathering: Extensive development of smithsonite, hydrozincite, willemite, and hemimorphite, especially in non-glaciated regions (including upstanding hills or monadnocks). Large accumulations of secondary zinc minerals can be mined. Galena is usually much more resistant to weathering than sphalerite. Iron-rich gossans are not normally well-developed, even over pyrite-rich deposits.
Mineralization controls: Any porous unit may host mineralization. Porosity may be primary (rare) or secondary. Dissolution collapse breccias are the most common host although fault breccias, permeable reefs, and slump breccias may also be mineralized. Dissolution collapse breccias may form through action of meteoric waters or hydrothermal fluids. Underlying aquifers may be porous sandstone or limestone aquifers; the limestones may show thinning due to solution by ore-bearing fluids.
Genetic models: Deposits are obviously epigenetic, having been emplaced after host rock lithification. mineralization-hosting breccias are considered to have resulted from dissolution of more soluble sedimentary units, followed by collapse of overlying beds. The major mineralizing processes appear to have been open-space filling between breccia fragments, and replacement of fragments or wall rock. The relative importance of these two processes varies widely among, and within, deposits. Fluid inclusion data show that these deposits formed from warm (75°- 200°C), saline, aqueous solutions are

Prairie Creek Page 5 8
NI 43-101 Technical Report on Preliminary Economic Assessment October 15, 2021
similar in composition to oil-field brines. Brine movement out of sedimentary basins, through aquifers or faults, to the hosting structures is the most widely accepted mode of formation.
Two main processes have been proposed to move mineralizing solutions out of basin clastics and into carbonates:
• compaction-driven fluid flow is generated by over-pressuring of subsurface aquifers by rapid sedimentation, followed by rapid release of basinal fluids; and
• gravity-driven fluid flow flushes subsurface brines by artesian groundwater flow from recharge areas in elevated regions of a foreland basin, to discharge areas in regions of lower elevation.
In addition to fluid transport, three geochemical mechanisms have been proposed to account for chemical transport and deposition of mineralization constituents:
• Mixing: Base metals are transported by fluids of low sulphur content. Precipitation is affected by mixing with fluids containing hydrogen sulphide; replacement of diagenetic iron sulphides; and / or reaction with sulphur released by thermal degradation of organic compounds.
• Sulphate reduction: Base metals are transported together with sulphate in the same solution. Precipitation is the result of reduction of sulphate by reaction with organic matter or methane.
• Reduced sulphur: Base metals are transported together with reduced sulphur. Precipitation is brought about by change in pH, dilution, and / or cooling.

Prairie Creek Page 5 9
NI 43-101 Technical Report on Preliminary Economic Assessment October 15, 2021
9 EXPLORATION
Table 9-1 summarizes work completed by NZC since 1991. A full discussion with tables of results is contained in earlier reports that are referenced in Section 27. Drilling is further discussed in Section 10.
Table 9-1: Summary of Exploration work, 1992 to 2021
Year No of holes
Metres Highlights
1992 22 6,322 Discovery of previously unknown SMS mineralization by diamond drilling.
Discovery hole (PC-92-008) ran 10.60% Zn, 5.29% Pb, 44.37 g/t Ag, over 28.40 m.
1993 31 8,432
Tested for further SMS Mineralization. UTEM survey.
Extended MQV by intersecting 18 m of vein 170 m below workings.
Trench samples from Rico showing, in north showed grades of 18% Zn, 35% Pb, 242 g/t Ag in a vertical mineralized. Geological mapping in north claims (Sam).
1994 31 11,113 Extension of Main Zone, more SMS lenses in Zone 5, regional mapping.
Rico Zone and Zebra showing (MVT) trenching, IP Ground Geophysics.
1995 36 10,082 Minor trenching and surface sampling.
1997 - - Channel sampling of previously un-sampled underground drift development.
1999 - -
Gate Claims 1 to 4 were staked and geological mapping, soil and rock sampling, was carried out for geochemical analysis based on a large surface grid.
Discovery of a mineralized vein in outcrop on Gate 1.
2001 5 1,711
Diamond drilling program designed both to increase confidence in 1998 resource estimate and to identify new high-grade areas.
Possibility of high-grade shoots recognized.
2004 27 5,944
MQV drilling which intersected significant mineralization.
Step out on the vein hit narrow but high-grade intersections.
SMS exploration outside Main Area.
2005 Rehabilitation of underground workings, chip sampling of MQV underground.
2006 19 2,393
Phase 1 driving of decline tunnel and U/G drilling commences on MQV.
Channel and round sampling.
Drilling of Zone 8 mineralization investigated.
2007 53 11,141 Phase 1 U/G program confirms vein grades. Decline extended, phase 2 drilling.
Gate claims drilling and Zone 8, 9 and 11 show poor results.
2010 4 2,694 Deep drilling in Casket Creek (for MQV) and proximal to resource drilling.
2011 30 5,926 Deep drilling in Casket Creek (wedging) and proximal to resource drilling.
2012 11 5,628 Deep drilling in Casket Creek and proximal to resource drilling, Geophysical Gravity & EM surveys, LIDAR survey of property.
2013 5 1,472 Deep drilling and proximal to resource drilling, silt sampling.
2015 21 5,548 Underground drilling - MQV and STK infill and extension, channel samples taken.
Well 1 183 Hydrology well.

Prairie Creek Page 6 0
NI 43-101 Technical Report on Preliminary Economic Assessment October 15, 2021
Year No of holes
Metres Highlights
2020 2 1,130 Exploration into Inferred Resources, MQV and STK intercepts.
2021 1 736 Exploration into Inferred Resources, MQV and STK intercepts.
Total 299 80,453
9.1 Channel Sampling
In 1997, 231 channel samples were collected from 294 m of previously un-sampled MQV on the 883 mL and 930 mL. These samples gave a weighted average grade within vein limits of 17.2% Zn, 16.0% Pb, 330 g/t Ag, 0.8% Cu over a weighted average true width of 1.78 m.
This program brought the total of verifiable channel samples from Main Zone workings to 1,072, inclusive of channel samples collected by Cadillac Mines prior to 1982. The channel samples together form 393 composites, comprising 14 channel samples from 970 mL, 273 channel samples from 930 mL, and 106 channel samples from 883 mL.
In 2006, access to the new decline ramp was provided by the new Crosscut 883-07 that was driven as part of the 2006 underground exploration program. The MQV, with a true thickness of 6.5 m, was intersected about 12 m from the crosscut collar; the walls of a 10 m intersection were channel sampled.
To obtain an overall grade comparison and dilution test, samples were also taken from each of the rounds excavated through the MQV intersection, including footwall and hanging wall material. After remixing the material twice, an estimated 20 kg of representative material was collected from each round, which was subsequently crushed on site to less than 1 cm in size, split into 2 kg samples and forwarded to the assay laboratory for analysis.
The weighted average grades (by estimated tonnes) of the rounds excavated in MQV compare reasonably well with weighted average for the channel samples: Rounds: 19.0% Zn, 16.4% Pb, 250 g/t Ag, 0.5% Cu; Channels: 21.3% Zn, 17.0% Pb, 413 g/t Ag, 1.2% Cu, (all samples); Channels: 20.6% Zn, 15.4% Pb, 302 g/t Ag, 0.7% Cu (excluding one outlier). No documentation was seen by GMRS describing the sampling, which in some reports is referred to as ‘chip sampling’.
In 2015, NZC collected 22 channel samples comprised of 50 individual samples (63.6 aggregate metres) on the 930 mL to assess STK mineralization. The weighted average grade of all 50 samples is 8.3% Pb, 18.9% Zn, and 178 g/t Ag. Half of these samples were collected along the strike of a mineralized STK vein exposed in the 930-Northwest Drift. The average grade of those samples is 9% Pb, 22.9% Zn and 223 g/t Ag.
9.2 Gate mining leases
Gate Mining Leases 1 to 4 were originally staked as claims in 1999 and converted to mining leases in 2008. During 2001, a small exploration program comprising geological mapping and soil and rock sampling was carried out over areas underlain by Whittaker Formation strata. This work resulted in the discovery of a vein in outcrop from which select grab samples contained grades similar to those previously established for the MQV: 820 g/t Ag, 3.5% Cu, 16% Pb, and 10% Zn. A large, 1,000 parts per million (ppm) zinc-in-soil anomaly was also located over favourable geology on the Gate 3 Mining Lease.
During 2007, NZC carried out a helicopter-supported diamond drill program to test the soil anomalies within the Gate group and Zones 8, 9, and 11. This program returned very few significant mineral intersections.

Prairie Creek Page 6 1
NI 43-101 Technical Report on Preliminary Economic Assessment October 15, 2021
10 DRILLING
10.1 General
The metres drilled during the drill programs completed since 1992 are summarized in Table 10-1.
Table 10-1: Summary of diamond drilling carried out at Prairie Creek
Year DDHs Length (m)
1992 22 6,322
1993 31 8,432
1994 31 11,113
1995 36 10,082
2001 5 1,711
2004 27 5,944
2006 19 2,393
2007 53 11,141
2010 4 2,694
2011 30 5,926
2012 11 5,628
2013 5 1,472
2015 21 5,548
2020 2 1,130
2021 1 736
Well 1 183
Total 299 80,453
Approximately 19,244 m of drilling was carried out on the Property prior to 1992. None of those drill results has been used in the current Mineral Resource estimate.
It should be noted that over 87% of the drilling tabulated in Table 10-1 was carried out in the Main Zone and Zone 4 area (Zones 1, 2, and 3 are now collectively referred to as the Main Zone, which is comprised of the MQV, SMS and STK zones that are referenced in this report).
Drill programs during 2010, 2011, and 2012 were primarily designed to test for extensions of mineralization to the north of the mine area. The 2013 drill program was principally designed to test for continuity of mineralization to the south of the Main Zone and to test an electromagnetic geophysical anomaly. The 2015 underground drill program was designed to assess the STK and adjacent MQV. The recent work, in 2020 and 2021, was exploring the continuity of the MQV and STK to the north of the previously-defined Measured and Indicated mineral resources.

Prairie Creek Page 6 2
NI 43-101 Technical Report on Preliminary Economic Assessment October 15, 2021
10.2 2010 Drill Program
During 2010 three holes with an aggregate length of 2,694 m were drilled in the Casket Creek area approximately 1.7 km north of the mine site. Hole PC-10-186 was drilled to a target depth of 1,557 m. This hole intersected the target Whittaker Formation, the principal host of mineralization, at a down-hole depth of 1,500 m. The stratigraphic information provided by this hole enabled the determination of a more precise location of the potential vein-hosting structure.
A second, wedged drillhole, PC-10-186W1, was directed from the upper part of PC-10-186 to the west toward the revised target location. This hole had to be abandoned after about 150 m into the wedged hole, at an estimated depth of about 536 m, because of technical difficulties.
A third hole, PC-10-187, with a revised orientation, was collared at surface from the same drill pad and had reached a down hole depth of 652 m when weather conditions forced suspension of drilling for the year.
10.3 2011 Drill Program
The 2011 program had two objectives: continuation of the 2010 deep drilling program and testing for additional high-grade vein structures and for other, wider, SMS deposits adjacent to known mineralization within the mine area.
The Casket Creek program comprised four holes, including wedges, with an aggregate length of 2,513 m, and commenced with the completion of drillhole PC-10-187. This hole intersected significant vein-type lead-zinc mineralization that demonstrated the probable northward continuation of MQV-type mineralization from the mine area.
A wedge hole, PC-11-187W2, was drilled as an undercut to PC-10-187. This hole intersected mineralization 50 m below the PC-10-187 intercept. Intersected grades in PC-11-187 and PC-11-187W2 are shown in Table 10-2.
Table 10-2: Assay Results Of 2011 Drill Program
Drillhole From (m) To (m) Interval (m) Pb (%) Zn (%) Ag (g/t) Cu (%)
PC-10-187 1,348.36 1,348.88 0.52 4.92 5.90 34 0.034
PC-11-187W2 1,384.00 1,387.50 3.50 5.26 11.47 84 0.176
The drill intercepts are approximately 100 m west of the PCA fold axis in a structural setting identical to that of the MQV in the Main Zone. It was concluded that a mineralized structure similar to the MQV in the main zone occurs under Casket Creek and may represent the northern continuation of the MQV.
A subsequent drillhole, PC-11-206, was designed to cut target stratigraphy 250 m below intersected depths at the Main Zone. The drilling of this hole was suspended at the end of October 2011 due to weather conditions and was completed in 2012.
10.4 2012 Drill Program
Eleven holes with an aggregate length of 5,628 m were drilled in 2012. Eight of these tested the Main Zone and one (PC-12-213) was drilled to the north of the Main Zone in Casket Creek.
Examples of significant intercepts from the 2012 program are listed in Table 10-3.

Prairie Creek Page 6 3
NI 43-101 Technical Report on Preliminary Economic Assessment October 15, 2021
Table 10-3: Significant Assay Results Of 2012 Drill Program
Drillhole From (m) To (m) Interval (m) Pb (%) Zn (%) Ag (g/t) Cu (%)
PC-12-211 215.62 216.39 0.77 3.87 4.66 47.00 0.13
PC-12-212 211.44 212.75 1.31 4.60 5.91 27.70 0.01
PC-12-212 212.75 213.46 0.71 3.48 15.30 27.10 0.03
PC-12-212 213.46 214.26 0.80 8.20 21.10 50.00 0.04
PC-12-214 152.84 153.74 0.90 9.07 19.50 162.00 0.45
PC-12-214 305.00 306.00 1.00 31.90 3.25 393.00 0.37
PC-12-214 306.00 306.80 0.80 2.13 6.31 36.30 0.03
PC-12-215 575.59 576.34 0.75 14.00 0.15 103.00 0.02
PC-12-215 576.34 577.19 0.85 0.08 0.05 0.00 0.00
PC-12-215 578.51 579.35 0.84 36.90 6.30 268.00 0.04
PC-12-215 579.35 580.27 0.92 0.08 0.02 0.70 0.00
PC-12-216 417.17 418.28 1.11 0.12 0.11 1.00 0.00
PC-12-216 418.28 419.59 1.31 4.02 10.30 2059.00 9.37
PC-12-216 419.59 420.60 1.01 0.18 0.84 5.90 0.02
PC-12-217 463.6 464.60 1.00 18.10 3.96 157.00 0.01
10.5 2013 Drill Program
Five holes, with an aggregate length of 1,472 m, were drilled in 2013. Three were drilled to test Zone 4 approximately 200 m south of the currently defined southern end of the MQV, and two were collared about 320 m apart to test a 900 m wide multi-channel electromagnetic anomaly identified in 2012. At the same time, hole PC-13-220 was also designed to intercept projections of previously defined vein and STK mineralization within the upper parts of the hole.
Both holes are projected to have tested the main part of the geophysical anomaly at depth. Interpretations based on current data suggest that the EM anomaly is likely due to inherent natural variations in graphite content within the upper half of the Road River Formation. Table 10-4 lists intercepts with greater than 8% combined lead-zinc.
Table 10-4: Significant assay results from 2013 drill program
Drillhole From (m) To (m) Interval (m) Pb (%) Zn (%) Ag (g/t) Cu (%)
PC-13-220 206.08 207.08 1.00 3.22 5.92 62.00 0.11
PC-13-220 207.93 209.00 1.07 5.00 8.76 84.00 0.09
PC-13-220 209.00 210.00 1.00 5.35 8.74 104.00 0.25
PC-13-220 210.00 211.00 1.00 14.40 21.50 191.00 0.32
PC-13-220 212.00 213.00 1.00 13.80 25.30 331.00 0.86
PC-13-222 373.60 374.60 1.00 16.60 1.59 125.00 0.05
PC-13-223 83.56 84.56 1.00 6.17 19.70 66.00 0.03
PC-13-224 28.85 29.60 0.75 23.00 20.70 268.00 0.02
PC-13-224 34.80 36.10 1.30 1.40 15.80 30.80 0.05
PC-13-224 47.24 48.24 1.00 5.61 8.84 97.00 0.03

Prairie Creek Page 6 4
NI 43-101 Technical Report on Preliminary Economic Assessment October 15, 2021
Drillhole From (m) To (m) Interval (m) Pb (%) Zn (%) Ag (g/t) Cu (%)
PC-13-224 87.00 88.00 1.00 2.55 5.44 18.20 0.01
PC-13-224 105.22 106.22 1.00 1.92 6.16 15.80 0.00
10.6 2015 Drill Program
During 2015 NZC drilled 21 holes from the 883 mL decline as a series of vertically-oriented fans. These holes were designed to test the MQV Zone but also the STK and provided additional information regarding the spatial relationship between the two. The resulting assays indicate that the style and grades of the MQV Zone that have been encountered in the southern portion of the Zone continue to the north beyond and below the existing workings. As well, the drill program indicates that the STK occupies an offset in the MQV and is largely bounded to the east and west by the MQV, suggesting that the STK formed as a result of deformation prior to the emplacement of the MQV. Representative assay results from the 2015 drill program are shown in Table 10-5.
Table 10-5: Representative assay results from 2015 drill program
Drillhole From (m) To (m) Interval (m) Pb (%) Zn (%) Ag (g/t) Cu (%)
PCU-15-52 128.24 129.24 1.00 0.03 0.04 1 0.00
PCU-15-52 129.24 130.24 1.00 12.90 31.10 159 0.30
PCU-15-52 132.63 133.60 0.97 25.70 29.80 321 0.59
PCU-15-52 133.60 134.60 1.00 0.62 3.96 8 0.01
PCU-15-52 134.60 135.70 1.10 0.38 0.35 4 0.00
PCU-15-52 135.70 136.64 0.94 5.97 20.90 43 0.00
PCU-15-52 136.64 137.70 1.06 5.70 13.20 58 0.10
PCU-15-52 137.70 138.70 1.00 0.21 0.26 2 0.00
PCU-15-53 101.80 103.33 1.53 0.33 1.96 8 0.01
PCU-15-53 103.33 104.85 1.52 20.90 31.20 173 0.04
PCU-15-53 104.85 106.38 1.53 34.00 29.70 405 0.10
PCU-15-53 106.38 107.90 1.52 1.06 1.15 23 0.06
PCU-15-53 124.66 126.19 1.53 0.40 4.66 8 0.02
PCU-15-54 181.20 181.90 0.70 0.06 0.08 1 0.00
PCU-15-54 181.90 182.57 0.67 3.94 7.69 84 0.21
PCU-15-60 138.38 139.35 0.97 0.08 0.84 2 0.00
PCU-15-60 139.35 140.35 1.00 0.15 4.18 2 0.00
PCU-15-60 144.40 145.40 1.00 7.87 9.47 118 0.24
PCU-15-60 145.40 146.40 1.00 0.19 0.42 59 0.22
PCU-15-60 158.48 159.48 1.00 1.55 14.10 21 0.02
PCU-15-60 164.57 165.70 1.13 4.67 8.11 55 0.08
PCU-15-60 165.70 166.70 1.00 5.01 15.80 78 0.17
PCU-15-68 142.00 142.95 0.95 2.58 3.42 44 0.12
PCU-15-68 142.95 144.48 1.53 0.07 0.05 2 0.00
PCU-15-68 144.48 146.40 1.92 0.08 0.06 1 0.00
PCU-15-68 146.40 147.35 0.95 1.39 12.10 44 0.13

Prairie Creek Page 6 5
NI 43-101 Technical Report on Preliminary Economic Assessment October 15, 2021
Drillhole From (m) To (m) Interval (m) Pb (%) Zn (%) Ag (g/t) Cu (%)
PCU-15-72 282.72 283.73 1.01 11.50 0.38 121 0.12
PCU-15-72 285.16 286.20 1.04 3.02 10.20 51 0.13
PCU-15-72 286.20 287.53 1.33 0.28 5.60 11 0.03
PCU-15-72 292.98 293.83 0.85 0.56 8.37 25 0.08
PCU-15-72 296.15 296.88 0.73 1.36 1.01 18 0.03
PCU-15-72 299.92 300.98 1.06 1.84 0.97 14 0.00
PCU-15-72 302.28 303.26 0.98 0.08 0.02 1 0.00
PCU-15-72 309.52 310.59 1.07 1.16 1.13 10 0.01
10.7 2020 and 2021 Drill Programs
In 2020, the Company undertook an exploration drill program to test the continuity of the MQV and STK mineralization styles adjacent to the Main Zone, and to upgrade Inferred Resources to the Indicated Mineral Resource category for future Mineral Resource estimates. Nearby existing holes suggested that the target area could host above-average silver grades and is proximal to the strong intercepts observed in hole PCU-15-72. All three holes from these years were from the same drill pad, with results summarized in Table 10-6.
Table 10-6: Representative Assay Results from 2020/2021 Drill Programs Drillhole
From (m) To (m) Interval (m) Pb (%) Zn (%) Ag (g/t) Cu (%)
PC-20-225 502.55 506.81 4.26 16.89 27.18 204 0.47
PC-20-225 506.81 508.79 1.98 8.44 5.58 88 0.16
PC-20-225 549.89 611.12 61.23 2.47 3.79 29 0.06
PC-20-226 593.8 594.8 1.00 10.1 21.3 391 1.6
PC-21-227 Hole is at 553m and did not reach target depth
10.8 Drilling Procedures
10.8.1 Drills
Since 1992, surface diamond drilling has been carried out using skid-mounted Longyear Super 38 drills, owned by NZC, to recover NQ diameter (47.6 mm) core. Core size was reduced to BQ size (36.5 mm) where difficult downhole conditions are encountered. In 2010 a new, higher-capacity HTM-2500 diamond drill rig was airlifted to the property for use in the deep drilling program. Figure 10.1 shows this drill set up at Casket Creek during the deep drilling program.
Various drilling contractors have been engaged to run the NZC drills. In 2007 Titan Drilling Limited of Yellowknife, NWT was contracted to carry out a surface drilling program using a Boyles helicopter-portable drill to recover NQ diameter (47.6 mm) core. Procon Mining and Tunnelling (Procon), who were contracted to continue the decline development work in 2005, sub-contracted Advanced Drilling Limited of Surrey BC, a subsidiary of Cabo Drilling Corporation of North Vancouver BC, to undertake the underground drilling programs. During smaller drill programs, NZC has hired individuals to staff the drills as needed, as was the case in 2011 and 2013. In 2012, Cabo Drilling Corporation of North Vancouver was contracted to staff and supply the NZC drills. More recently in 2014-2015, Procon was contracted to manage the underground program and subcontracted DMAC Drilling Ltd of Aldergrove, BC to carry out the diamond drilling. In 2020, Paycore Drilling of Valemount,

Prairie Creek Page 6 6
NI 43-101 Technical Report on Preliminary Economic Assessment October 15, 2021
BC was contracted to run the NZC-owned HTM-2500 drill rig, with DMAC Drilling Ltd returning in 2021 to continue drilling from the same drill pad as the previous year.
Figure 10-1: HTM-2500 skid-mounted diamond drill rig at Casket Creek
Note: Figure provided by NZC, 2021.
10.8.2 Field Procedures
Surface drillhole collars are initially located by handheld GPS and alignment is completed by Brunton compass sighting along pickets. Once aligned, the dip of the hole is set using an inclinometer placed on the rods. Underground drillhole collar locations are marked up using a total station instrument. The surveyor uses spads in the development back for a reference line and marks the foresight and backsight on the walls of the drift with spray paint. The drill mast is aligned parallel to the foresight and backsight. A supervising geologist attends the drill site several times per day, as needed.
Drilled core is placed in wooden boxes with depth markers placed in the boxes at the beginning and end of each drilling run. The markers are labelled by the drillers in feet or metres, to correspond with units used for the drill rods. Full drill core boxes are individually sealed with wooden lids that are securely nailed in place to prevent any spilling or shuffling of core during transit.
10.8.3 Surveying
The collars of completed surface drillholes are surveyed by qualified surveyors using a transit. Both UTM coordinates and local mine grid co-ordinates are calculated. The collars of underground holes are surveyed using mine grid coordinates that are then converted to UTM coordinates.
For the 2006 and 2007 drill programs, downhole surveys of both surface and underground holes were completed using a FLEXIT SmartTool instrument. Earlier surveys used an Icefield MI-3 tool and prior to 1995, a Pajari instrument was used. From 2010 to the present, downhole survey measurements have been completed using a Reflex EZ-Shot and are taken every 15 m instead of every 60 m as was previously the case. The completion of individual surveys is dependent on downhole conditions.

Prairie Creek Page 6 7
NI 43-101 Technical Report on Preliminary Economic Assessment October 15, 2021
Raw survey data is processed by software that accompanies the survey tools. Output such as Depth in Feet, Depth in M, Azimuth, Dip, Magnetic Field Strength and Magnetic Dip are captured from the processed data and copied to a master spreadsheet of all drillhole surveys. The spreadsheet is then used to prepare traces of the drillholes in three-dimensions, using Geovia GEMS software. Paper and electronic data files are stored at NZC’s head office in Vancouver, BC.
10.8.4 Core logging
All drillcore logging is carried out at the Mine site in a secure facility. Received core is laid out and a quick assessment is done to verify that all the boxes are intact, confirm the drillhole identification data and that the dril lers’ depth markers are in good order (i.e. drill core mixing or displacement has not occurred during transport). If disruption is identified, the core is “fitted” together, and the depth markers are placed at the appropriate points by means of direct measurement and identification of the start / end points of successive drilling runs. The depth markers are then converted, if necessary, to metre measurements and aluminium tags are stapled to each box-end noting drillhole number and the box-start and end depths. Drill core recovery is calculated by comparing the drilled length with the actual core length between depth markers. Rock Quality Description (RQD) is calculated from the sum of the length of full-diameter drill core pieces over 10 cm, divided by the total length of the run. Rock mass ratings are then calculated for 10 m envelopes around individual mineralized intersections, using industry standard methods.
All drill core is geologically logged using the standard lithologies identified in the stratigraphic sequence presented as Table 7-1. Geology logs, complete with written and coded descriptions of lithology, alteration, oxide / sulphide mineralization and structure, are compiled and recorded. Prior to core photography, which is done for two or three boxes at a time, sample intervals are marked on the core by the geologist responsible for that hole. Core photographs are archived in NZC’s electronic files.
Prior to 2011, core logs were transposed into Excel spreadsheet format for copying into a central database. Starting in 2011, NZC switched to direct inputting into an MS Access database by way of a software package named GeoticLog. This core logging software allows for immediate error checking and reduces transcription errors. Data integrity checks (overlapping intervals, missing intervals and duplicate samples) are performed via automated software checks nearer to the end of the season, and problems are resolved as they are identified, referring to the core as needed.
10.8.5 Core Recovery
Core recoveries have been consistently recorded since 2006. Average recoveries are approximately 80% for the MQV and 97% for the SMS mineralization. No recovery information was provided for the STK mineralization. Intervals of poor recovery in the MQV are associated with shearing and faulting. Rates of recovery were based on drill run lengths.
10.8.6 Bulk Density
No bulk density measurements have been collected from the drill core recently. Bulk density values were estimated on the basis of regression equations that were used for the 2007 and 2012 estimates. These equations were based on 231 measurements of drill core from the MQV made in 1998 and 54 measurements from sample pulps of SMS mineralization made in 2007. No measurements were made on samples from the STK. This is discussed further in Section 14.
10.8.7 Drilling Results
Underground drillholes have an intersection angle which is generally near normal to the planar vein. As the SMS is sub-horizontal, the surface holes have an intersection angle which is near true width.

Prairie Creek Page 6 8
NI 43-101 Technical Report on Preliminary Economic Assessment October 15, 2021
11 SAMPLE PREPARATION, ANALYSES, AND SECURITY
11.1 Chain of custody
11.1.1 Underground channel samples
Rice sacks containing channel sample bags are transported to surface by either the responsible geologist or an assistant under his or her supervision. The rice sacks are then transported in pick-up trucks driven by a NZC geologist to the secure, on-site drill core logging and sampling facility.
11.1.2 Drill core samples
Drill core is boxed at the drill rig by the drillers’ helpers who securely nail a wooden lid onto each filled core box. Underground core is transported by the drillers to the portal. Both underground and surface drill core boxes are picked up by a Company geologist and then transported in pick-up trucks, driven by a NZC geologist, to the secure, on-site drill core logging and sampling facility.
The sealed drill core boxes are laid out in order, from top to bottom of the hole, on large tables or racks outside the core shack from where they are brought inside for logging and sampling. A geologist marks appropriate sample intervals on the drill core of approximately 1 m length. After logging, core boxes are photographed three at a time and then cross-piled outside or set aside for sample processing within the core shack. A geotechnician will then cut the marked sample intervals of drillcore in half with a diamond saw, placing half of the material into a sample bag and the other half back into the core box. A tag is placed into the sample bag listing an ID number, and another tag with the same ID number is stapled into the core box at the start of the sampled interval for later reference if needed.
11.1.3 Sample sacks
All drill core logging and sampling is supervised by a senior geologist. Only authorized personnel or those accompanied by an authorized person are allowed into the core shack. The shed is locked at all times when geologists or their assistants are not present.
Individual sample bags are sealed with plastic ties and placed in rice sacks (50 pounds per bag). Requisition sheets are inserted into each rice bag and each rice bag is labelled with the assay lab shipping address. The sacks are securely fastened and then stored in the secure, on-site drill core and sampling facility, prior to their transport off-site.
11.1.4 Transport
Samples are air-freighted in charter aircraft from the mine site to Fort Nelson, BC, or Fort Simpson, NWT. Prior to 2011, samples were transported by Greyhound bus to the Acme Labs assay laboratory in Vancouver, BC. From 2011 to 2020, samples were delivered to AGAT Laboratories either at their sample drop-off location in Fort Nelson, or shipped to their lab in Mississauga, ON. For 2021 and onwards, samples are either couriered or delivered by Company staff direct to ALS Geochemistry in Yellowknife, NT.

Prairie Creek Page 6 9
NI 43-101 Technical Report on Preliminary Economic Assessment October 15, 2021
11.1.5 Drill core storage
Boxes containing the main mineralized drill core intersections are stored in trailers adjacent to the core shack facility (Figure 11-2) to ensure their security, to facilitate their ready access, and to protect the core from weathering. Boxes containing unmineralized drill core are square-piled in stacks (Figure 11-1) in the core storage area next to the boneyard near Harrison Creek.
Figure 11-1: Stored unmineralized drill core at Harrison Creek site
Note: Figure provided by NZC, 2021.

Prairie Creek Page 7 0
NI 43-101 Technical Report on Preliminary Economic Assessment October 15, 2021
Figure 11-2: Stored mineralized drill core intersections at main site
Note: Figure provided by NZC, 2021.
11.2 Assay method
Acme Labs (ISO 9001-2000 accredited) has carried out the majority of the sample assaying since NZC’s first involvement with the Property in 1992 and was used up until 2011. From 2011 to 2020, sample assaying has been conducted by AGAT Laboratories (ISO/IEC 17025:2005 accredited). For 2021 and onwards, assays were completed by ALS Geochemistry (ISO/IEC 17025:2017 and ISO 9001:2015 accredited).
11.2.1 Sample preparation
Samples are sorted and inspected for quality of use (quantity and condition); wet or damp samples are dried at 60º Celsius. Samples are then crushed to 70% passing ten mesh (2 mm), homogenized, riffle split (250 g sub-sample) and pulverized to 95% passing 150 mesh (100 microns). The crusher and pulverizer are cleaned by brush and compressed air between routine samples. A granite wash is used to scour equipment after high-grade samples, between changes in rock colour and / or at the end of each file. Granite is crushed and pulverized as the first sample in each sequence and each granite sample is carried through to analysis to monitor background assay grades.

Prairie Creek Page 7 1
NI 43-101 Technical Report on Preliminary Economic Assessment October 15, 2021
11.2.2 Assay procedure
The grades of silver, copper, lead, and zinc, as well as 30 additional elements, are determined for all samples by aqua regia digestion followed by an ICP-ES finish. Lead and zinc oxides are assayed by ammonium acetate leach and AAS finish. Silver is also analysed by fire assay fusion.
11.3 QA/QC procedures
NZC submits Quality Assurance / Quality Control (QA/QC) blanks, duplicates and standards for analysis with the regular samples to ensure accuracy of the analysis. Blanks, duplicate samples, or standards are inserted on average after approximately 20 drill core samples and are randomly pre-designated to be inserted up to five samples ahead of or behind this mean value in order to reduce predictability of QA/QC sample occurrences in the sample stream.
11.3.1 Blanks
The blank material used is common landscaping gravel.
11.3.2 Duplicate samples
Duplicate samples comprise half of the core halves remaining after normal splitting and sampling: the half core is split longitudinally using a diamond saw; the remaining quarter core is returned to its core box for storage and reference and the quarter core sample is placed in a sample bag for transport and assaying. The same procedures as those outlined for half drill core samples are followed as regards labelling, storage and transport of duplicate samples.
11.3.3 Standard samples
NZC has generated its own assay standard samples, in conjunction with Smee & Associates Consulting Limited of North Vancouver, BC (Smee). Standards were compiled from a shipment of mineralized samples sent by NZC to CDN Resource Laboratories Limited in Delta, BC (CDN). CDN prepared three homogeneous pulps suitable for use as standard reference materials. The samples were dried, and the material was mechanically ground in a rod mill and then screened through a 200 mesh sieve, the plus 200 mesh fraction being discarded. The minus 200 fraction was mechanically mixed for 48 hours in a twin-shell V Blender rotating at approximately 20 revolutions per minute. The derived standards were bagged in lots of approximately 110 grams in tin-top kraft bags that were then individually vacuum packed and heat-sealed in plastic bags. Ten samples of each bagged and sealed standard were sent for round-robin analysis to Acme Labs (ISO 9001-2000 accredited), Chemex (ISO 9001-2000 accredited), Actlabs Limited in Ancaster, Ontario (ISO/IEC 17025 [Standards Council of Canada], which includes ISO 9001 and ISO 9002 accreditations), Assayers Canada in Vancouver BC (ISO/IEC 17025 [Standards Council of Canada]) and SGS Lakefield (ISO 9001-2000 accredited).
The remainder of the packaged standards was returned to NZC for insertion into the sample stream, as earlier outl ined. Certificates for each of NZC’s three standards (as compiled by Smee) are available.
11.3.4 Check samples
As an additional quality control measure, a number of check samples were selected from the 2015 drill program and forwarded to Met-Solve Laboratories Inc. 27 sample pulps were chosen using a random number generator on a list of samples that excluded duplicates, standards and blanks. Using the same analytical techniques as AGAT Laboratories, Met-

Prairie Creek Page 7 2
NI 43-101 Technical Report on Preliminary Economic Assessment October 15, 2021
Solve Laboratories returned values that were within acceptable ranges for Pb, Zn, Ag, and Cu from those obtained by AGAT Laboratories.
11.4 Conclusion
QA/QC data was reviewed for five sampling campaigns: 2006 – 2007 underground drilling, 2007 surface drilling, 2011 – 2013 surface drilling and 2015 underground drilling, and the 2020-2021 surface drilling. Collectively these programs included 25 duplicate pairs, 86 blank samples, and 124 standards comprising 36 CZN Standard-1, 45 CZN Standard-2 and 43 CZN Standard-3 for a total of 235 control samples equal to approximately 6% of the samples collected for analysis. The temporal distribution of these control samples is set out in Table 11-1.
Table 11-1: Prairie Creek QA/QC Control Samples by Type and Year
Year Blank Duplicate STD CZN-1 STD CZN-2 STD CZN-3
2006-2007 47 10 19 15
2007 6 6 4 1
2011-2013 18 6 7 8 4
2015 11 9 15 15 22
2020 3 3 0 1 2
2021 1 1 0 1 0
Total 86 25 36 45 43
The following observations were made of the various control samples.
Four blanks exceeded the background values of lead and zinc. All were from the 2006-2007 underground program and all were immediately preceded by samples containing high values of lead or zinc or both. Analytical data for the samples following the contaminated blanks is available for only two of the four; one is of sufficiently high-grade that the contribution from the level of contamination in the blank would have been trivial and the other sample is of very low grade and not obviously contaminated.
The duplicate samples are in general, although not always close, agreement. However, given the coarse nature of much of the mineralization, close agreement between split samples should not necessarily be expected.
Most lead, zinc and silver assays of standard samples fell within two standard deviations of the expected mean; four lead assays (5%) exceeded three standard deviations and all of the zinc and silver assays were within three standard deviations.
The QP believes that the data collection and handling followed normal industry practice and the data is fit for purpose of Mineral Resource estimation. However, although QA/QC samples were inserted during pre-2010, drill programs and the results have been observed in the assay certificates, it is not clear if any analysis of the data was carried out or whether any remedial action was taken for out-of-bounds results, if any. This deficiency has been remedied in the programs that have taken place since 2010.

Prairie Creek Page 7 3
NI 43-101 Technical Report on Preliminary Economic Assessment October 15, 2021
12 DATA VERIFICATION
Greg Mosher, P.Geo., performed a random check of approximately 5% of the drillhole assays that have been generated since the 2012 verification program by comparing assay values in the database against the laboratory certificates. No discrepancies were found.
Data was also verified during construction of the resource estimation model. The verification procedure included checks for duplicate and overlapping sample intervals as well as any sample intervals extending beyond the end of the hole. Collars, down-hole surveys, assays, composite, and lithology tables were verified. No errors were found.
NZC indicated to GMRS that the assay database in its entirety was rebuilt in early 2021 from original assay certificates as part of a comprehensive effort to re-import all certificate values to their certified levels of precision and re-assay pulps for overlimits in penalty elements, and in doing so corrected identified errors in mercury grades primarily from the 2006-2007 drill programs.
Greg Mosher, P.Geo., conducted a site inspection visit on October 8, 2021. During that visit, the collar locations for the 2020/21 drillholes were inspected and photographed and GPS readings of the collar coordinates were collected. Mineralized intervals of drill core from hole PC-20-225 were examined and compared with written descriptions in the geology logs. Sample intervals recorded in the drill logs were also checked against the depth locations marked in the core boxes.
Ten (10) pulp samples from various drill programs between 2011 and 2020 were collected and submitted to ALS in North Vancouver, BC. Samples were assayed for 41 elements using the analytical package ME-ICP41. Overlimits for silver were re-run using GRA-21, overlimits for mercury using HG-ICP42, and lead and zinc using ME-OG46h. All assay values for all elements compare closely; results for silver, lead, and zinc are shown in comparison with the original assay results in Table 12-1.
Table 12-1: Prairie Creek Check Sample Assay Results
Original Samples Check Samples (ALS 2021)
Sample Ag ppm Pb % Zn % Lab Ag ppm Pb % Zn %
25016 2 0.15 0.26 AGAT 3 0.17 0.36
25044 162 9.07 19.50 AGAT 173 10.50 24.30
25184 181 4.64 12.90 AGAT 175 4.84 11.20
25212 59 6.33 1.31 AGAT 53 5.87 1.29
25775 0 0.01 0.01 AGAT 1 0.01 0.01
25795 11 1.02 2.05 AGAT 10 1.02 2.12
398567 46 2.64 4.21 ALS 41 2.70 4.03
1157285 124 2.21 0.65 ACME 117 2.37 0.69
1157496 17 0.62 0.03 ACME 16 0.69 0.04
D732517 433 10.05 21.30 ALS 441 10.30 21.60
The QP (Mosher) considers that the data is fit for the purpose of estimating a Mineral Resource.

Prairie Creek Page 7 4
NI 43-101 Technical Report on Preliminary Economic Assessment October 15, 2021
13 MINERAL PROCESSING AND METALLURGICAL TESTING
13.1 Introduction
The existing site process infrastructure includes a crushing plant, ball mill, flotation, and concentrate handling circuits, that were constructed in the 1980’s. Construction was never fully completed, nor was the plant ever operated. The existing circuits would require major refurbishing and consists of comminution and differential flotation of lead and zinc concentrates. It is estimated the circuits would be capable of treating approximately 1,200 tpd of feed. The current processing plan is to replace most of the treatment circuits with new, larger, equipment and include Dense Media Separation (DMS) to treat 2,400 tpd. The metallurgical testing that has been conducted is analyzed for providing preliminary design criteria on this processing approach.
Historically metallurgical test work was performed on Prairie Creek beginning in the 1960’s, although none of the earliest studies including information relating to the existing circuit design is available. Following this and continuing sporadical ly into the 1980’s, and up to as recently as 2016 more testing using a modified flotation scheme for high oxide feed was conducted. There are three major principal types of mineralization that represent the resource from the Prairie Creek Project. These consist of the MQV, STK, and SMS. The MQV is described as the principal resource zone for the project. The pre-2017 test work was performed on MQV and SMS mineralization by several different laboratories. For MQV the historic testing had been limited to samples readily available from the bulk sampling areas in mine adits, closer to surface. This material contained more highly oxidized mineralization. MQV was then described as primarily massive to semi-massive galena and sphalerite, with varying degrees of cerussite (lead oxide) and smithsonite (zinc oxide) in a quartz-carbonate-dolomite matrix. The SMS samples, which were obtained from drilling, were described as more finely grained and with lower sulphide oxidation content. The samples used for testing prior to 2017 are not considered representative, as the oxide content was elevated well above that indicated in the most recent mine schedule. In 2017 less oxidized material for metallurgical testing was sourced from deeper zones in the resource that originated from a 2015 exploration drilling program.
A summary of the pre-2017 metallurgical test programs is discussed below in Section 13.2, while the 2017 test program is outlined in Section 13.3.
13.2 Historical Testwork (1960 -2016)
The metallurgical testwork conducted prior to 2017 test was performed principally on MQV and SMS mineralization. This work was limited to samples that could be obtained from the existing surface stockpiles and near surface underground mine workings. These contained more highly oxidized material often averaging from 4% to 8% lead oxide, and 3% to 7% zinc oxide. Based on the current mine plan, this average extent of oxidation would be more than double that of the highest oxide content of the corresponding base metals content expected for mill feed, and well above those expected for LOM. Consequently, most of the historic testwork as related to flotation response is of limited value.
Historic test work was summarized during previous technical reporting and is outlined in Table 13-1.

Prairie Creek Page 7 5
NI 43-101 Technical Report on Preliminary Economic Assessment October 15, 2021
Table 13-1: Major Historical Metallurgical Test Programs
Year Program ID Laboratory Flotation Grindability Mineralogy Others
1960-1980 Unknown Unknown Unknown
1980-1990
KM019, KM034, KM040, KM048, KM077, KM081, KM370, KM424, KM440, KM454, KM462, KM469, KM474, KM488, KM497
Kamloops/G&T ✓ ✓ - ✓
1980 L.R.2252 Lakefield ✓ - - -
1982-1983 N20481/ NP831003 CSMRI ✓ - ✓ ✓
1993-1994 X93-112/X94-006 Cominco - - ✓ -
1997 9197-01 Hazen - ✓ - -
1997 97-099 PRA - - - ✓
1992 MT-9303 De Randt Corp - - ✓ -
2000 00-90 Harris Exploration
Services - - ✓ -
2000 - UBC ✓ - - -
2006 MS-06 Jun-001/ MS-06Aug-001
Terra - - ✓ -
2004-2009 10916/11098/12018 SGS-Lakefield ✓ ✓ ✓ ✓
2011 SE-1389-TR Outotec - - - ✓
2013 50242-001 SGS-Lakefield ✓ - - ✓
2014 – 2016 14002 GMR ✓ - - ✓
a) Kamloops = Metallurgical Services Ltd/Kamloops Research & Assay Laboratory Ltd./G&T Metallurgical Services Ltd. b) De Randt Corp = De Randt Corp Mineral Technologies Group, Division of De Randt Corp Enterprises c) Terra = Terra Mineralogical Services d) Harris = Harris Exploration Services e) Hazen = Hazen Research Inc. f) Cominco = Cominco Exploration Research Laboratory g) Lakefield = Lakefield Research of Canada Limited h) SGS Lakefield = Lakefield Research Limited i) CSMRI = The Colorado School of Mines Research Institute j) UBC = University of British Columbia k) Outotec = Outotec (Canada) Ltd
Early studies were not well documented or are not available, but beginning in 1980, a variety of test programs were performed to investigate metallurgical responses and have been reported. Among the principal programs were various studies including pilot plant testing of a sulphide flotation circuit conducted by Colorado School of Mines Research Institute (CSMRI) in the early 1980’s. Following this, the majority of the work was conducted at G&T and its predecessor laboratory

Prairie Creek Page 7 6
NI 43-101 Technical Report on Preliminary Economic Assessment October 15, 2021
Kamloops Metallurgy (KM), located in Kamloops, BC, which focused on flotation from 2004 through to 2009. During this time and more recently SGS (including a predecessor company Lakefield Research) performed considerable testing, primarily at their facilities in Lakefield, Ontario. The SGS testing included considerable bench testing as well as bulk sample evaluation using dense media separation (DMS), followed by flotation. Other laboratories performed additional programs as described in the following sub-sections.
13.2.1 Mineralogy
13.2.1.1 MQV Mineralization
A number of different laboratories included mineralogical studies of the head samples, as well as some of the concentrates from MQV. An examination by Terra in 2006 was done on material collected from the 930 m and 883 m level adits, showing the principal lead mineral was galena accounting for about 60% of the lead, followed by cerussite (lead carbonate) at 30%, and remainder being anglesite (lead sulphate), along with trace lead sulphosalts. Most of the mineral textures were described as coarse-grained and simple, implying that lead-bearing minerals would liberate well at a coarse primary grind. A minor amount of galena-sphalerite, galena-quartz and cerussite-dolomite was present locally at finer more complex textures, which could require a finer grind size to liberate the target minerals.
For MQV, sphalerite was found to be the main zinc carrier accounting for 77% of the zinc mineralization, and occurring mostly as liberated grains, or forming simple coarse-grained intergrowths, predominately with galena and quartz. The balance is principally accounted for by smithsonite, which is commonly intergrown with sphalerite, but is also noted with finer mineral intergrowths with the dolomite.
The main copper carrier is a combination of tetrahedrite and azurite/malachite; minor to trace amounts of covellite and enargite were also identified. Non-opaque gangue is mainly comprised of quartz and dolomite. Dolomite can be intergrown with smithsonite and/or cerussite, as well as quartz.
Follow-up mineralogy by G&T laboratories undertook mineral composition for MQV by weight with the identifying ~25% sphalerite, ~18% galena, 1.6% each of tetrahedrite and pyrite, with 54% gangue minerals. The corresponding liberation is provided in Table 13-2.
Table 13-2: G&T: MQV Sulphide Mineral Liberation
Mineral Class
Mineral Distribution (%)
Tetrahedrite Galena Sphalerite Pyrite Gangue
Liberated 77 83 82 65 95
Binary with Tetrahedrite - 1 1 <1 <1
Binary with Galena 4 - 3 <1 1
Binary with Sphalerite 3 7 - 7 2
Binary with Pyrite 1 <1 1 - 1
Binary with Gangue 5 3 10 22 -
Multiphase 10 6 3 6 1
An examination at de Randt Laboratories consisted of mineralogical analysis of fourteen MQV rock samples. The study showed that most of the metals occur as sulphide minerals, although some carbonates of zinc, lead, and copper were also found. The metals in the carbonates only accounted for a small portion of the total metals. Most of the value minerals occurred in either coarse liberated sulphide grains or sulphide middling particles, it was suggested that a fine grind size may be required to effectively separate the metal bearing minerals from each other. No native silver was observed nor was it detected by scanning electron microscopy.

Prairie Creek Page 7 7
NI 43-101 Technical Report on Preliminary Economic Assessment October 15, 2021
Hazen’s 1997 study was on a MQV bulk head sample, as well as corresponding flotation concentrates. The assay of the head samples is provided in Table 13-3 indicating a high portion of oxidized lead and zinc.
Table 13-3: Hazen Sample – MQV Head Assay
Element Total Oxide
Pb 9.70% 6.70%
Zn 6.10% 3.90%
Cu 0.30% -
Hg 0.04% -
Ag 1.76 g/t -
Au <0.07 g/t -
The Hazen results indicated that main value minerals are galena, sphalerite, cerussite, and smithsonite, with lesser amounts of tetrahedrite-tennantite, minor amounts of pyrite, and traces of chalcopyrite and covellite. Gangue minerals were quartz and dolomite. Oxide minerals showed great diversity in occurrence and texture, varying from independent, liberated single crystals and crystal aggregates, through various stages of sulphide replacement, and also complex intergrowths with quartz and dolomite.
Examination of gravity separation products, at a grind size < 10 mesh, showed the target minerals to be generally coarse and mostly liberated from the quartz, although finer sub-hedral to euhedral quartz inclusions (typical size 20 to 80 µm) are fairly common, particularly in galena. Most of the sulphides were liberated from each other. However, mutual intergrowths typically ranging from about 50 to 150 µm were relatively frequent.
Occurrence of mercury in flotation concentrates found that for:
• Zinc flotation concentrate: mercury occurs sub-microscopically in sphalerite. Mercury concentrations vary from 1,500 to 3,300 ppm in individual particles.
• Lead flotation concentrate: mercury occurs in tetrahedrite-tennantite, ranging from 800 to 4,200 ppm in individual particles.
• Copper flotation concentrate (low copper grade): mercury occurs in sphalerite and tetrahedrite-tennantite (typically 1,600 to 2,400 ppm Hg, and 1.0 to 1.3% Ag).
A study by Cominco on MQV sulphide flotation tailings concluded that high losses of lead and zinc to tailings were primarily as carbonates, such as cerussite and smithsonite. Further study by Cominco on lead and zinc concentrates showed that about 75% of the galena in the lead concentrate occurred as liberated grains, while 50% of the pyrite and 25% of the sphalerite were liberated. The zinc concentrate contained 95% sphalerite, 4% pyrite, and 1% galena. Approximately 80 to 85% of the sphalerite occurred as liberated grains, while 50% of the pyrite was in a liberated form; most galena was associated with other minerals. It was indicated that mercury and cadmium may occur in the sphalerite lattice, and arsenic and antimony are associated with tennantite.
CSMRI mineralogical work found the liberation at approximately 80% for cerussite and smithsonite in the 100 to 150 mesh particle size fraction. As a part of 1982 pilot plant test work, CSMRI conducted mineralogical examinations on various

Prairie Creek Page 7 8
NI 43-101 Technical Report on Preliminary Economic Assessment October 15, 2021
products. The results indicated that all samples contained both galena and sphalerite, with most having detectable cerussite and smithsonite. Tetrahedrite was in all samples and with silver concentrations at greater than 850 g/tonne.
13.2.1.2 SMS Mineralization
The SMS sample studied by G&T outlined pyrite as the dominant sulphide and accounted for most of the iron sulphides present. Some marcasite was also observed, but no appreciable pyrrhotite was detected. Galena was present as well-formed crystals and accounted for virtually all of the lead. Sphalerite was dominant for zinc. Trace quantities of chalcopyrite and tetrahedrite were seen in intimate association with the galena, and to a lesser extent with sphalerite. The interstitial iron content of the sphalerite was estimated at approximately 4%, indicating that the maximum zinc concentrate grade that could be produced from the sphalerite would be about 63%. No lead or zinc oxides were observed, although very small amounts of oxides were detected by chemical assay techniques.
The non-sulphides in the sample consisted of quartz and apparently colloform silica, together with some calcite and dolomites. The mineral composition of the sample generated by two sets of modal data is shown in Table 13-4.
Table 13-4: G&T: Mineral Composition of SMS
Sample Mineral Composition
Galena Sphalerite Pyrite* Tetrahedrite Non-sulphide Gangue
Flotation Feed – 80% 79 µm 7.4 17.8 40.2 <0.1 34.6
Flotation Feed – 80% 44 µm 7.5 17.0 41.7 <0.1 33.8
* Marcasite and pyrite are shown as pyrite
Mineral liberation data indicated that a fine association between galena and sphalerite, with binary assemblages between galena and sphalerite, pyrite and gangue observed even in the sub-sieve fractions. Approximately 20% of sphalerite was as binary composites with pyrite, displaying complex structures with multiple, small pyrite inclusions and adhesions on larger sphalerite particles. Typically, these composites had equal pyrite and sphalerite weights, assaying about 30% Zn and 25% Fe. Multiphase particles containing near equal amounts of sphalerite and pyrite with smaller and highly variable galena and gangue contents, accounted for approximately 5% of the lead and 5% of the zinc in the flotation feed stream.
G&T showed the stratiform sample as a mixture of sulphides in a dolomite host rock. In relative abundance order, dominant sulphides were pyrite, sphalerite, and galena. Trace tetrahedrite group minerals and minor amounts of arsenopyrite were also detected. At a grind level of 80% passing 50 µm, more than 80% of the galena, pyrite, and non-sulphide gangue, and about 65% of sphalerite were liberated. At least one third of the sphalerite in the feed stream was locked, mostly in binary and multiphase composites rich in non-sulphides. Only 3% of the sphalerite was locked with galena in structurally simple binary assemblages, containing about 50% galena by weight.
13.2.2 Comminution
Six Bond ball mill work index (BBMWi) tests were performed on MQV in 2007 by SGS Lakefield. The results showed a moderately soft work index of 8.5 to 11.1 kWh/tonne, averaging 9.7 kWh/t. The hardest material was for a composite with higher oxidation than the others. The results are shown in Table 13-5 with asterisks indicating if the sample was performed on material produced from sink product obtained from heavy liquid separation.

Prairie Creek Page 7 9
NI 43-101 Technical Report on Preliminary Economic Assessment October 15, 2021
Table 13-5: SGS Lakefield – MQV Bond Ball Mill Work Index
Sample Screen
Aperture (mesh)
Bond Work
Index (kWh/t)
Master Composite – w/HLS* 150 8.5
Master Composite + Dilution 100 10.2
Low Oxidation Composite – w/HLS* 150 8.8
Low Oxidation Composite + Dilution 150 8.7
High Oxidation Comp – w/HLS* 150 11.1
High Oxidation Composite + Dilution 150 10.0
* 2.8 SG Sink + Fines; HLS: heavy liquid separation
The findings were supported by G&T testing a MQV sample providing for 9.7 kWh/tonne at a closing sieve size 105 µm (150 mesh). A SMS sample that was tested gave a measurement of 9.2 kWh/tonne.
13.2.3 Dense Media Separation
Initial dense media separation (DMS) testing was performed by Hazen in 1997 for MQV material, that contained a relatively high proportion of oxide lead and zinc minerals. The material was crushed to different particle sizes, resulting in 55% - 60% of the material being rejected. The resulting metals losses with corresponding weight rejected are provided in Table 13-6.
Table 13-6: Losses of Metals in DMS Tailings, Hazen (1997)
Particle Size
(Finer Than)
Weight
(%)
Distribution (%)
Pb Zn Cu Ag
1/2 Inch 59.5 6.8 11.8 16 15
1/4 Inch 57.7 5.3 7.2 7.9 11
6 Mesh 56.9 4.8 6.7 9.5 11.3
10 Mesh 55.6 3.7 6 7.2 8.5
Analyses of the minus 10 mesh DMS rejects showed that the majority of the lead and zinc losses occurred as oxide mineralization and amounted to 86.5% of the total lead and 70% of the total zinc present in the reject. Microscopic examination showed that the oxides occurred primarily as intergrowths with dolomite and quartz. The lead, zinc, silver and copper reporting to the < 200 mesh fraction recovered screened fines that ranged between 21.2 and 35.5% of these metals.
In 2005, SGS Lakefield did DMS tests simulated by using heavy liquid separation (HLS). A composite of 50% MQV and 50% SMS, was crushed to two product sizes of nominal 12.7 mm (1/2") and 6.4 mm (¼”) to be used for the testing. Both of the sized materials were pre-screened to remove minus 3.36 mm (6 mesh) particles, which were analyzed separately. The results are presented for both fractions in Table 13-7 at three varying heavy liquid densities of SG 2.6, 2.8 and 3.0 g/cm3.

Prairie Creek Page 8 0
NI 43-101 Technical Report on Preliminary Economic Assessment October 15, 2021
Table 13-7: SGS – HLS Test Data for a 50 wt.
Product
Weight Assays Distribution (%)
(%) Pb Zn Cu Ag Pb Oxide Zn Oxide Pb Zn Cu Ag Pb Oxide Zn Oxide
(%) (%) (%) (g/t) (%) (%)
Heavy Liquid Separation ¼"
Minus 6 mesh 57.3 10.2 9.5 0.24 137 3.51 2.05 65.4 59.8 65.2 67.9 71.5 67.9
¼" Sample 3.0 SG Sink 15.3 19.4 22.6 0.48 226 4.78 3.38 33.2 38 34.8 29.9 26 29.9
¼" Sample 2.8 SG Sink 15.6 0.52 0.92 - 9.3 0.27 0.48 0.9 1.6 0 1.3 1.5 1.3
¼" Sample 2.6 SG Sink 11.4 0.38 0.47 - 9.3 0.24 0.26 0.5 0.6 0 0.9 1 0.9
¼" Sample 2.6 SG Float 0.4 0.71 0.54 - 22.5 0.41 0 0.03 0.03 0 0.08 0.1 0.1
Head (calculated) 100 8.93 9.09 0.21 115.6 2.81 1.8 100 100 100 100 100 100
Heavy Liquid Separation ½"
Minus 6 mesh 30.8 12.1 19 0.41 201 6.29 3.46 39.5 52.8 47.2 45.6 49.5 52.1
½" Sample 3.0 SG Sink 26.6 19.8 18.2 0.53 253 6.26 2.85 55.8 43.7 52.8 49.6 42.6 37.1
½" Sample 2.8 SG Sink 22.7 1.41 1.33 20.4 1.03 0.78 3.4 2.7 0 3.4 6 8.7
½" Sample 2.6 SG Sink 19.7 0.63 0.39 8.7 0.38 0.22 1.3 0.7 0 1.3 1.9 2.1
½" Sample 2.6 SG Float 0.2 0.52 0.62 59.8 0.32 0 0 0 0 0.1 0 0
Head (calculated) 100 9.44 11.1 0.27 135.7 3.91 2.04 100 100 100 100 100 100
Follow-up work in 2005 by Confidential Metallurgical Services (CMS) and by SGS Lakefield undertook HLS testing on 13 MQV samples from the 883 m and 930 m level adits. The samples were crushed to minus 12.7 mm ( ½") particle size and screened to remove the minus 1.4 mm (12 Tyler mesh) fraction. The -12.7 +1.4 mm fraction was tested at heavy liquid specific densities of 2.8 and 3.0 g/cm3. For 883 m samples, weight percentages of the HLS rejects (floats) ranged from 14% to 53% at specific density of 2.8 g/cm3, averaging 34.3%. Average metal losses were 2.6% Pb and 4.6% Zn. HLS rejects for 930 m samples accounted for 8% to 34% of the feed weight, averaging 21.6%. Average metal losses were 1.5% Pb and 2.1% Zn. The higher specific density media (3.0 g/cm3) produced 17% more rejects for 930 m samples, and 23% more rejects for 883 m samples, than the 2.8 g/cm3 density media. However, more metal losses were seen at the higher specific density.
In 2007, SGS Lakefield did four sets of HLS tests on four different composite samples at media specific densities of 2.6 and 2.8. At specific density 2.8, between 19.0% and 26.5% of the total feed weight was rejected. The loss of lead, zinc and silver to the HLS rejects was similar among these samples, ranging from 0.9% to 2.1% Pb, 1.4% to 2.6% Zn, and 1.3% to 3.2% for Ag. Samples with higher sulphide oxidation averaged slightly higher metal losses to the rejects.
In 2009, SGS did large-scale DMS testing on a composite generated from level 883 m and 930 m adits. A 530 kg sample was processed through media with a specific density of 2.8. Results are provided in Table 13-8.

Prairie Creek Page 8 1
NI 43-101 Technical Report on Preliminary Economic Assessment October 15, 2021
Table 13-8: SGS (2009)– DMS Testing @ SG2.8 on MQV (883m + 930 m level adits)
Prod.
Wt. Assays Distribution (%)
(%) Pb
(%)
Pb Oxide
(%)
Zn
(%)
Zn Oxide
(%)
Cu
(%)
Ag
(g/t) Pb
Pb Oxide Zn
Zn Oxide Cu
Ag
Sink 31.9 28.3 6.44 26.9 4.48 1.1 453 73.3 50 57.1 42 66.4 59.5
-14 Mesh 27.1 11 6.81 21.3 5.64 0.6 339 24.2 45 38.5 45 30.8 37.9
Sink plus -14 Mesh 59 20.4 6.61 24.3 5.01 0.9 401 97.5 94.9 95.6 94.9 97.2 97.4
Float 41 0.75 0.51 1.6 1.07 0.04 15.2 2.5 5.1 4.4 5.1 2.8 2.6
Head (Calc.) 100 12.3 4.11 15 3.4 0.5 242 100 100 100 100 100 100
The test work showed 41% of the feed weight was rejected as waste with a corresponding loss of economic metals at 2.5% Pb, 4.4% Zn, and 2.6% Ag.
Later work performed in 2013 by SGS Lakefield did DMS on a composite sample also obtained from 883 m level adit. The sample was stage-crushed to < 6.35 mm and screened to remove the minus 20 mesh fraction. The coarse fraction underwent DMS upgrading at a media specific density of 2.8, with results as provided for in Table 13-9.
Table 13-9: SGS (2013) – DMS Testing @ SG2.8 on MQV (883m level adit)
Product
Weight Assays Distribution (%)
(%) Pb
(%)
Zn
(%)
Cu
(%)
Ag
(g/t) Pb Zn Cu Ag
Sink 29.2 23.1 29.6 0.87 341 40 38 35.3 35
Sink plus -14 Mesh 79.3 21.0 28.2 0.88 350 98.8 98.1 97.3 97.6
Intermediate 2.2 0.96 2.01 0.07 24.6 0.1 0.2 0.2 0.2
Float 18.5 1.00 2.05 0.10 33.8 1.1 1.7 2.5 2.2
Head (Calc.) 100 16.9 22.8 0.72 284 100 100 100 100
The results showed a recovery of 99% of the lead, 98% of the zinc and 98% of the silver, which includes the sink recombined with the screened fine fractions. Approximately 21% of the feed weight was rejected as waste.
Following up in 2014, GMR laboratories conducted HLS tests at a media specific density of 2.8 on various samples, including a master composite sample and 17 variability test samples. Results gave ~20.2% of the feed weight from the master composite as rejected into the float fraction with losses of the lead, zinc and silver respectively at 1.7%, 1.7% and 1.6%. The floats rejected from the 17 variability samples ranged from 9.0% to 44.6% and averaging 22.7% of the feed weight.

Prairie Creek Page 8 2
NI 43-101 Technical Report on Preliminary Economic Assessment October 15, 2021
13.2.4 Preliminary Flotation Studies (1980 to 2000)
13.2.4.1 MQV Mineralization
13.2.4.1.1 Lead and Zinc Response
Among the earliest test with good documentation available were from Lakefield Research in 1980. Preliminary flotation studies were performed on a sulphide composite and an oxide composite, both obtained from MQV zone with a near surface bulk sampling program. The test results were described by Lakefield as providing a poor separation between lead and zinc. Lakefield indicated that the slime gangue minerals (dolomite and graphitic materials) complicated the flotation and used a combination of gangue depressants and zinc mineral depressants in an effort to suppress zinc minerals and slime at the lead flotation stage. The test work also investigated the effect of primary grind size on lead and zinc flotation performance, indicating that lead recovery at both the rougher and cleaner flotation stages reduced slightly at a fine primary grind size. However, the selectivity between lead and zinc improved at a fine primary grind size. The test conducted on the oxide composite showed that sufficiently high-grade lead and zinc concentrates could be produced. However, metal recoveries decreased significantly in the sulphide flotation stages, although it appeared that lead oxide minerals were able to recover after the zinc sulphide flotation tailings were conditioned by sodium sulphide.
In 1980, Kamloops Research & Assay Laboratory Ltd (Kamloops, KM 019) did further tests on the samples tested by Lakefield. Soda ash was used to adjust slurry pH and sodium cyanide and sodium sulphite were used for suppressing zinc minerals (some tests used zinc sulphate to replace sodium cyanide). The work also evaluated effects of primary grind sizes on lead and zinc differential flotation. The better results were attained at a primary grind size between 70% and 80% passing 74 µ (200 mesh). The tests also indicated that degree of regrinding of lead rougher concentrate would be a key factor to achieve satisfactory metallurgical performance, and that substantial addition of sodium cyanide to the primary grinding circuit would permit acceptable zinc suppression at the lead flotation stages. Zinc flotation responded well to the conventional reagent scheme. Lead and zinc concentrates produced good grades but contained significant deleterious elements. Projected metallurgical performance is shown in Table 13-10.
Table 13-10: Kamloops Lab 1980 MQV Flotation Data
Product Grades (%) Distribution (%)
Pb Zn Mass Pb Zn Ag
Feed 12.5 15.5 100.0 100.0 100.0 100.0
Lead Concentrate 55.0 10.0 15.5 68.0 10.0 59.0
Zinc Concentrate 5.0 55.0 21.1 8.0 75.0 16.0
In 1980, Kamloops carried out separate test work using a sample identified from the lower audit to compare metallurgical performance with that achieved with the upper adit sample in the previous studies. A composite sample was generated from three cross-cut samples. In general, the metallurgical responses of both samples tested were similar, with high-grade lead and zinc concentrates being produced. Both samples showed zinc minerals active in the lead flotation circuits. It was concluded that use of strong zinc depressants may be necessary.
Two years later potential alternatives to the cyanide-based reagent scheme were examined. Kamloops indicated that complete exclusion of cyanide from the reagent scheme for the mineralization would produce unsatisfactory results. Optimum primary grind size continued to appear to be about 75% passing 74 µ (200 mesh). Regrinding benefits on lead rougher concentrate were described as being of marginal value to lead metallurgical performance. However, zinc rougher concentrate regrinding was seen to be potentially beneficial. Subsequent testing by Kamloops laboratory showed regrinding zinc rougher concentrates would not significantly impact the zinc response.

Prairie Creek Page 8 3
NI 43-101 Technical Report on Preliminary Economic Assessment October 15, 2021
In 1982, Kamloops (KM081) conducted two tests on a sample that was being used for a pilot test program at CSMRI. Reagents used for zinc suppression were 1,000 g/t soda ash and 200 g/t sodium cyanide in the primary grinding. Collector dosage and flotation retention time varied. To better reject zinc minerals from lead concentrates, a lower collector dosage (30 g/t vs. 60 g/t Z-11) and shortest possible flotation retention time (4 minutes vs. 7 minutes) was deemed to be required. The resulting lead concentrate assayed 63.1% lead and 11.9% zinc. The zinc concentrate assayed 55.8% zinc and 5.0% lead. Again, results confirmed cyanide is warranted for rejecting zinc from lead concentrate for the MQV mineral samples.
In 1982, CSMRI did pre-pilot plant flotation testing to determine effects of various conditions on metallurgical performances. Results used a primary varied from 50% to 94% passing 74 µ (200 mesh). Metal recoveries to lead and zinc rougher concentrates were not significantly affected, although lead rougher recovery was reduced slightly at the coarsest grind investigated, regrinding was not incorporated. A primary grind size of ~ 75% passing 74µ was used for the remainder of the laboratory flotation tests.
Testing of cyanide dosage on lead rougher flotation showed that with the addition of 1000 g/t (2.0 lb/ton) of soda ash in the primary grind, with 500 g/t (1.0 lb/ton) sodium cyanide produced the highest-grade lead rougher concentrate (49.0% lead) with the lowest zinc content (16.1% zinc). Using a lower dosage of cyanide, or partially replacing with sodium sulphite resulted in decreased response. Addition of sodium cyanide in lead cleaner flotation stages did not improve final lead concentrate grade. The effect of regrinding of rougher lead concentrate on lead cleaner flotation was not conclusive, with two sets of tests generating different results. Also, the test program showed that an extended conditioning with sodium cyanide for 60 minutes did not improve zinc depression in lead cleaner flotation. When sodium sulphide dosages were increased above 1.5 kg/t (3.0 lb/ton), lead grade of the lead rougher concentrate improved with more efficient rejection of zinc. The lead recovery to the concentrate also improved by approximately 2%. CSMRI also tested ammoniacal zinc cyanide as replacement for sodium cyanide without effective rejection of the zinc minerals to improve lead recovery. Lime was used in place of soda ash to modify slurry pH. At similar pH level as soda ash, the lime produced inferior results; lead metallurgical performance also deteriorated at pH 12.0 as compared to pH 9.5.
Earlier investigation into the zinc flotation looked at altering retention time, pH and related modifiers, along with various depressants, with minor apparent effect as zinc grade and recovery appeared challenging, with significant quantities of zinc reporting to the lead circuit. In 1994, G&T did further testing to evaluate a cyanide-free processing scheme to minimize potential environmental impact and avoid silver dissolution. Flotation response of the sample remained relatively consistent, despite relatively large changes in reagents and treatment conditions. In addition to sodium cyanide as zinc mineral suppressants, sodium metabisulphite (SMBS) additions of up to 5,000 g/t resulted in very similar concentrate grades and recoveries during differential flotation. Regrinding of cleaner feed streams did not appear to enhance lead circuit performance but regrinding of zinc cleaner feed stream was considered potentially beneficial.
Figure 13-1 and Figure 13-2 show the G&T test results in terms of recovery and grade relationships for lead and zinc cleaner open circuits.

Prairie Creek Page 8 4
NI 43-101 Technical Report on Preliminary Economic Assessment October 15, 2021
Figure 13-1: G&T Lead Grade Recovery Curves for MQV Open Cycle Cleaning
Note: Figure prepared by G&T, 1980.
Figure 13-2: G&T Zinc Grade Recovery Curves for MQV Open Cycle Cleaning
Note: Figure prepared by G&T, 1980.

Prairie Creek Page 8 5
NI 43-101 Technical Report on Preliminary Economic Assessment October 15, 2021
The results indicated that acceptable lead concentrate grades resulted in approximately 70% Pb recovery, while for zinc a recovery of 65% might be expected.
13.2.4.1.2 Copper Separation
G&T investigated a batch differential flotation procedures to produce separate copper, lead and zinc concentrates for smelting studies. SMBS was used as a lead and zinc depressant in copper and lead flotation circuits, with M2030 as copper collector and ethyl xanthate as lead collector. Lime, copper sulphate, and potassium amyl xanthate (PAX) were used for zinc flotation. Although reasonably good-grade concentrates could be achieved, lead and zinc recoveries were apparently low; and lead flotation circuits used complex reverse flotation.
A high-grade head sample, containing approximately 0.77% copper, 20.8% lead and 26.6% zinc was used for further evaluation. The open circuit tests produced 28.2% copper concentrate at 47% copper recovery, 75.5% lead concentrate at 71.7% lead recovery, and 56.6% zinc concentrate at 61.6% zinc recovery. The response is considered modest and the high feed grades did not well represent the MQV mineralization.
Further studies investigated copper metallurgical response with sequential copper and lead flotation, as well as testing copper separation from copper-lead bulk concentrates. Lakefield did three tests on a sulphide composite in 1980 in an effort to produce a silver-rich copper concentrate. The tests included one sequential flotation using sulphur dioxide to suppress lead minerals. Best results were obtained using soda ash and a mixture of oxide zinc and cyanide in the copper-lead bulk flotation circuit and dichromate for lead depression in the copper separation circuit. The test produced a copper concentrate grading 24% copper, 24% lead, 8.4% zinc, 5,964 g/t silver, and 4.5% arsenic.
Due to high lead losses to copper-lead bulk flotation tailings and high lead content (24% lead) in copper concentrate, concentrates and tailings from the test were mineralogical examined. The majority of galena (~66%) in copper concentrate and about 50% of sphalerite particles in copper and lead concentrates were seen in liberated forms. Separation conditions were seen as not optimum. Further work was recommended to reduce lead content of the copper concentrate and to improve cleaning efficiency for copper-lead bulk concentrate. A copper separation test was also done using sequential flotation with sulphur dioxide to suppress lead minerals. The resulting copper concentrate assayed 8.5% copper and 57.3% lead.
In 1980 Kamloops Laboratories investigated potential methods to produce a silver-rich copper concentrate from the composite sample tested by Lakefield. Copper and lead separation was performed on bulk copper-lead concentrates that were produced by a soda ash/cyanide procedure. The rougher copper-lead concentrate was reground, cleaned, and subjected to two copper and lead separation techniques. The first procedure used potassium dichromate with sodium silicate and sulphur dioxide to depress galena, and the other procedure conditioned with sulphur dioxide, then pH was increased with lime and using a selective collector. Both procedures apparently gave similar results with a moderate response. The procedures were deemed complex and seen as unlikely to be able to be controlled in a commercial environment and applicable for the typical feed grades expected.
Follow-up testing performed on copper and lead separation were conducted on samples from the lower and upper adits. Both sequential flotation and copper-lead bulk flotation followed by copper-lead separation were tested. A maximum of 30% copper recovery at a grade of 10.6% copper was obtained using a combination of sulphur dioxide/lime/dichromate/silicate to suppress lead and gangue minerals. A concentrate with 19% copper was obtained at a copper recovery of 18% using sulphur dioxide/lime as lead depressants. These results were not consistent as compared to those obtained by Lakefield. Kamloops concluded that producing a silver-rich copper concentrate from either adit samples was not technically feasible. This may be due to high lead to copper ratios, which are 64:1 for the lower adit sample and 22:1 for the upper adit sample.

Prairie Creek Page 8 6
NI 43-101 Technical Report on Preliminary Economic Assessment October 15, 2021
In 1981 Kamloops conducted further testing to evaluate copper and lead separation by using SMBS to suppress the galena in the copper-lead bulk concentrate. The work appeared to show that a copper-rich concentrate could be produced from the sample tested, although conditioning time and reagent dosages were not optimized. The copper concentrates produced contained 20 to 30% copper. Silver reporting to copper concentrate ranged from 20% to 30% for the upper adit sample and 13% to 28% for the lower adit sample. However, the copper concentrates produced contained about 10 to 40% lead. This program also investigated effect of recycled water on the selectivity of copper-lead separation. It appeared that separation selectivity decreased with using recycled water.
In a later program a locked cycle test was done using the SMBS method to separate copper and lead. Copper and lead separation efficiency was relatively good until the final cycle of the test. This instability was attributed to an increased load into the copper and lead separation stage. Lead metallurgy was quite stable after the initial cycle, but zinc contents of the final lead concentrates were high. A 25.3% copper concentrate with a copper recovery of 43.7% was produced from the locked cycle test. A further batch copper and lead separation test was conducted using starch and sulphur dioxide as lead mineral depressants at an enhanced pulp temperature (60 to 65°C). Little difference from the SMBS method resulted. A subsequent study investigated the effect of adding various dosages of SMBS in primary grinding on copper metallurgical performance. It was found that copper grade and recovery did not suffer using 2,000 g/t SMBS compared to 5,000 g/t MBS. The results from the test work using 3,500 g/t SMBS were anomalous in that copper grade and recovery were significantly lower than when adding 2,000 or 5,000 g/t SMBS. In 2000, MQV samples tested at the University of British Columbia (UBC) showed metallurgical performance sensitive to grind size, with a fine primary grind possibly required. This was contrary to some previous results. Further evaluation was performed in 1981 by Kamloops lab with mine water obtained from the upper adit that indicated a negative impact particularly for the copper and lead were experienced unless some dilution with fresh water was incorporated.
In 1994, G&T did further sequential flotation studies on a MQV sample in an effort to produce a separate copper concentrate. Three collectors were tested, with Minerec 2030 giving the better metallurgical performance. The open circuit test results showed that 47% to 61% of the copper was recovered to the copper concentrates, grading about 20 to 28% copper. A locked cycle test was conducted on the sample using the SMBS and Minerec 2030 reagent regime in the copper flotation. The test results showed that 58.7% of the copper was recovered to a 20.6% copper concentrate. Using the differential flotation method tested by the earlier program, a large-scale, open-circuit flotation was carried out to produce copper, lead, and zinc concentrates for smelting testing from a MQV bulk sample. The copper concentrate produced assayed 28.2% copper, 9.8% lead, and 13.1% zinc. The lead concentrate assayed 75.5% lead, 5.3% zinc. The zinc rougher concentrate assayed 56.8% zinc.
13.2.4.1.3 Cerussite and Smithsonite Recovery
In 1980, Lakefield Research did preliminary oxide mineral flotation tests on a sulphide composite and an oxide composite. About 20% of lead and zinc minerals in the sulphide composite and about 50% of lead and zinc minerals in the oxide composite were in oxide forms. The oxide mineral flotation was conducted separately on the two samples.
The sulphide composite in reality was still highly oxidized. The sulphide flotation tailings produced after flotation of galena and sphalerite was filtered, re-pulped, and then conditioned with sodium sulphide, and cerussite was floated with potassium amyl xanthate collector (Z6). The results gave 9.4% of the lead reporting to an oxide concentrate with 18.5% lead and 4.2% zinc. The oxide lead flotation tailings were then conditioned with 500 g/t copper sulphate and then floated for smithsonite. The flotation failed to recover oxide zinc minerals and insignificant zinc was recovered. For the more highly oxidized composite the treatment was similar except that no oxide zinc flotation was conducted. The results gave an oxide lead concentrate averaging 11.5% lead and 7.8% zinc. The previous additional lead flotation recovered about 22% of the lead.
In 1982, CSMRI did flotation tests on a gravity concentrate sample containing cerussite and smithsonite. Sodium sulphide was added to sulphidize zinc tailings. Smithsonite was depressed with copper sulphite and sodium cyanide. Selective flotation was not achieved, possibly due to excess sodium cyanide depressed both lead and zinc minerals. Similar tests

Prairie Creek Page 8 7
NI 43-101 Technical Report on Preliminary Economic Assessment October 15, 2021
were done on zinc tailings with the tailings sulphidized by sodium sulphide. Essentially all of the lead carbonate was lost to the zinc concentrate and final tailings.
In 1983, CSMRI did a series of open-circuit tests to determine if cerussite and smithsonite could be recovered by a variety of procedures including flotation, leaching, or gravity concentration. Soda ash was used for conditioning and galena was concentrated by flotation; the tailings were subjected to non-sulphide flotation. The feed sample did not contain significant sphalerite. The oxide lead and zinc minerals flotation response to various flotation reagent regimes was investigated. For cerussite, sodium sulphide, sodium hexametaphosphate, and copper sulphate were examined. For smithsonite, a tallow amine collector and potassium dichromate were tested. Sodium hexametaphosphate had a depressing effect on both cerussite and smithsonite flotation; copper sulphate reduced effectiveness of sodium sulphide, and dichromate depressed smithsonite flotation. Potassium dichromate depressed smithsonite flotation to a lesser extent with the use of a stronger primary amine. For the cerussite flotation collector suites that incorporated xanthate, fatty acid, or petroleum sulphonate, only xanthate produced a selective float.
Among the best results from the 1983 CSMRI test work was Test #15 that gave a cerussite third cleaner concentrate of 57.7% lead and 8.1% zinc using sodium silicate/sodium sulphide for flotation conditioning and Aero 350 as the cerussite collector. From the head sample, 36.2% of lead and 22.8% of silver was recovered. The effect of sphalerite flotation reagents on subsequent cerussite flotation should be studied. Using primary coco amine as a zinc collector, (Test #12) produced an oxide zinc concentrate that assayed 19.1% zinc and 0.96% lead and 1.52 oz/ton silver. The zinc and silver recoveries reporting to the concentrate were 62.8% and 10.4%, respectively. Further testing showed that napthenic acid as a collector for smithsonite was not effective, and silica flotation prior to smithsonite flotation was not successful.
A process patented by New Jersey Zinc Company to concentrate smithsonite was also tried. This involved dispersion of silica, selective flocculation of carbonate materials, and smithsonite flotation with an organic ester of carboxylic acid. A smithsonite concentrate of 39.6% zinc was produced, but only 1.1% of the zinc in the sample was recovered. Using a similar procedure, (Test #18) produced a concentrate of 32.9% zinc with a zinc recovery of 13%.
In 1994, Kamloops Laboratory initiated testing for oxide lead and zinc recovery. However, the sample which had a non-sulphide content that was lower than expected and few conclusions resulted from the test program.
13.2.4.2 SMS Mineralization
SMS mineralization had less copper, and silver with a lower extent of sulphide oxidation than MQV. A principal mineralogical difference is that about half the sulphides occur as 50% pyrite (including marcasite). Lead and zinc minerals mainly occur as galena and sphalerite.
Kamloops undertook a test program in 1992 to establish a preliminary flowsheet and to select an appropriate reagent regime. Two primary grind sizes of 80% passing 80 µ and 50 µ were tested. Lead circuit performance was seen to be insensitive to change in grind size. However, the zinc circuit was influenced by the grind size variation. Tests of two sphalerite/pyrite/marcasite suppression reagent schemes, lime-cyanide, and lime alone, showed similar response of the lead and zinc. No test work to optimize reagent addition levels was conducted. Locked cycle tests, at a primary grind size of 80% passing 80 µ, produced a lead concentrate with 57.8% Pb grade and 80.6% recovery, and a zinc concentrate with 52.0% Zn grade at 87.4% recovery. With the same reagent conditions at 80% passing 50 µ, lower metal recoveries resulted. Mineralogical analysis of concentrates produced from the finer grind showed that 70% to 75% of the lead concentrate was galena, with pyrite comprising 15% to 20%, of which 50% was liberated. The zinc concentrate consisted of 95% sphalerite, with the remainder pyrite, galena, and traces of tennantite. In follow-up testing, three samples were tested, using 250 g/t calcium oxide and 500 g/t sodium cyanide as sphalerite/pyrite/marcasite suppression reagents. The three samples produced similar metallurgical performance as previous results.

Prairie Creek Page 8 8
NI 43-101 Technical Report on Preliminary Economic Assessment October 15, 2021
Further testing at Kamloops used a simple two-product process at a primary grind of 80% passing 50 µm. However, it was noted that a coarser primary grind of 80% 100 µ may suffice for mineral separation in lead and zinc rougher flotation stages. Sulphoxy (SMBS or sulphur dioxide), lime-cyanide, and lime alone were tested for sphalerite / pyrite / marcasite suppression. The sulphoxy scheme developed for MQV mineralization did not produce an acceptable metallurgical response for the SMS mineralization. Process selectivity was poor due to uncontrolled pyrite flotation. Metallurgical response improved slightly, using lime-cyanide. For lead rougher concentrate, a combination of 500 g/t lime and 250 g/t sodium cyanide gave the highest lead grade (41.5% lead) and lowest zinc grade (7.7% zinc). Lime-cyanide and lime-alone reagent regimes were tested in locked cycle tests. Similar results for sphalerite/pyrite/marcasite suppression were achieved.
In 2000, a University of British Columbia study showed a SMS sample to be sensitive to overgrinding. This resulted in elevated losses for both lead and zinc, especially in the less than 44 µ (325 mesh) fraction of the flotation tailings. It was recommended to evaluate more grind sizes, including staged grinding with flash flotation.
13.2.5 Flotation Testing (2001-2016)
13.2.5.1 Sample Origin and Characterization
A more comprehensive testing program was performed by SGS Lakefield beginning in 2004 and was performed in several phases. The work was performed on composites generated from samples collected from several underground adit crosscuts. In the Phase 1 and 2 of the program, three samples were generated from material from the MQV upper (930 m level) and lower (883 m level) adits, as well as from the SMS zone. Composites were labelled as Lower Zone and Upper Zone composites and Stratabound composite. From the zone composite samples, two master composite samples were generated:
• Master Composite 1 - 50% Upper Zone composite and 50% Lower Zone composite.
• Master Composite 2 - 50% Master Composite 1 and 50% Stratabound Composite.
The head analyses for major elements of interest are provided for the composites in Table 13-11.
Table 13-11: SGS Composite Head Analyses (Phase 1 & 2 - 2005 test program)
Sample Assays
Pb (%) Pb Oxide (%) Zn (%) Zn Oxide (%) Ag (g/t) Cu (%)
Upper Zone Composite 21.3 7.63 20.3 5.57 242 0.76
Upper Zone Composite w Dilutions 11 - 11.4 - 193 -
Lower Zone Composite 16 6.48 15.9 4.01 350 0.46
Lower Zone Composite w Dilutions 11.5 - 11.5 - 137 -
Master Composite 1 18.2 6.9 17.9 5.5 320 0.58
Master Composite 1 w Dilutions* 10.8 - 11.7 - 180 -
Master Composite 2 15.5 5.63 16.5 3.34 255 0.44
Master Composite 2 w Dilutions* 11.2 - 12.2 - 175 -
Stratabound Composite 5.16 0.33 10.5 0.11 52.4 0.025
* Back-calculated head assay from locked cycle tests

Prairie Creek Page 8 9
NI 43-101 Technical Report on Preliminary Economic Assessment October 15, 2021
For Phase 3, flotation test samples were diluted Lower Zone (870 m) and Upper Zone (930 m) composites from Phases 1 and 2. The samples were upgraded by heavy liquid separation (HLS) procedure. Flotation head, which consists of HLS sink and pre-screened fines, have the assay results shown in Table 13-12.
Table 13-12: SGS Composite Head Analyses (Phase 3 - 2005 test program)
Sample Assays
Pb (%) Pb Oxide (%) Zn (%) Zn Oxide (%) Ag (g/t) Cu (%)
Upper Zone Composite HLS* 19.6 6.92 21.5 6.47 263 13.4
Lower Zone Composite HLS* 15 5.55 12.5 4.3 174 11.8
* 2.8 SG Sink + Fines
In Phase 4, three additional composite samples were tested, including a master composite made from 11 individual samples containing dilution material, and two sub-composites identified as low-oxide composite and high-oxidation composite. The main test work was carried out on the Master Composite sample after HLS upgrading. Additional tests were done on the non-pre-concentrated Master Composite and the two sub-composites treated by the HLS pre-concentration. Head assay data are summarized in Table 13-13.
Table 13-13: SGS Composite Head Analyses (Phase 4 - 2007 test program)
Sample Assays
Pb (%) Pb Oxide (%) Zn (%) Zn Oxide (%) Ag (g/t) Cu (%)
Master Composite 18 8.59 16.4 4.12 258 8.01
Master Composite HLS* 21.9 7.58 21.9 5.5 304 -
Low Oxidation Composite** 21.5 4.84 19.1 2.86 350 -
Low Oxidation Composite HLS* 24.6 5.37 23 3.37 407 12.9
High Oxidation Composite** 12.4 4.48 12.8 4.15 194 -
High Oxidation Composite HLS* 15.5 5.82 15.9 4.76 237 6.38
Phase 5 testing was done on a 503 kg composite sample made from nine individual samples. The key objective was to produce a quantity of process water for environmental testing purposes. Head assay data for the composite sample are shown in Table 13-14.
Table 13-14: SGS Composite Head Analyses (Phase 5 - 2009 test program)
Sample Assays
Pb (%) Pb Oxide (%) Zn (%) Zn Oxide (%) Ag (g/t) Cu (%) S (%)
ROM Composite 12 6.81 15.3 5.64 219 0.51 8.33
In 2013, SGS did tests for environmental and other aspects using water collected from the mine adits. The waster was used along with composite material collected from the 883 m adit to generate flotation concentrates, flotation tailings, and supernatants for evaluation. Head analyses of the composite are provided in Table 13-15.

Prairie Creek Page 9 0
NI 43-101 Technical Report on Preliminary Economic Assessment October 15, 2021
Table 13-15: SGS Composite Head Analyses (2013 test program)
Sample Assays
Pb (%) Zn (%) Ag (g/t) Cu (%)
Composite 16.9 22.8 284 0.72
Between 2014 and 2016, GMR laboratories in Burnaby conducted a test program to generate concentrate samples for a bio-leaching program (due to Hg smelter penalty concerns) and an attempt to simplify the flotation reagent regime. One master composite sample and 17 variability test samples from the mine adits were collected for the study. The head grades for the samples ranged from 8.0% to 43.5% for total lead, and 4.3% to 28.9% for total zinc. However, the average oxidation rate was high at approximately 47% for lead, and 24% for zinc, indicating the samples are not representative of the more global MQV mineralization.
13.2.5.2 DMS and Open Cycle Flotation Testing
Between 2004 and 2013 SGS Lakefield did flotation test work that used DMS to pre-concentrate flotation feed. The test work objectives included optimization studies for flowsheet development and developing a cyanide free flotation reagent scheme. This would provide a mass balance for the metals of interest, including oxide portions of the feed material, and in determining the process response if MQV and SMS materials are blended when mining.
13.2.5.2.1 Phase 1&2 – SGS Lakefield (2004 – 2005)
The results of the first two phases of test work showed that the sulphide and oxide minerals can be recovered using a sequential flotation process, consisting of sulphide lead flotation, sulphide zinc flotation, oxide lead flotation and oxide zinc flotation. The process flowsheet development tests investigated various reagent schemes, especially types and dosages of depressants and dispersants. Reagent scheme findings for the Lower Zone composite are as follows:
Cyanide-free reagent schemes were tested, including several depressant combinations: sodium sulphide/zinc sulphate, sodium sulphide/zinc sulphate/ferric sulphate, sodium sulphide /MQ1 (sodium metabisulphite (Na2S2O5)/zinc sulphate) and sodium sulphide /MQ2 (sodium metabisulphite/sodium thiosulfate (Na2S2O3)/zinc sulphate). Results showed that zinc minerals and pyrite can be successfully suppressed by cyanide-free reagent schemes, such as sodium sulphide/MQ1 or sodium sulphide/MQ2. The programs also tested the effect of slime dispersants on lead flotation. MKF (60% sodium silicate, 20% Acumer 9000, 20% thiourea) gave best results among sodium silicate and polyacrylamide dispersants and was used for remaining tests. Collector testing for sulphide and oxide lead flotation included using sodium isobutyl xanthate (SIBX) as primary collector and several other collectors as secondary collectors. A combination of SIBX and DF067 collectors was selected. For oxide lead flotation, selected reagents were sodium sulphide for sulphidization SIBX and DF067 as collectors, and MKF as slime dispersant.
The pH levels used ranged from 7.5 to 8.5 for sulphide zinc rougher flotation and 10 to 10.5 for sulphide zinc cleaner flotation. PZ1 (40% Dextrin W9524, 40% disodium hydrogen phosphate (Na2HPO4) and 10% Tamol 819), were used as gangue minerals and pyrite suppressors in sulphide zinc flotation. SIBX and Cytec 3894 were used as collectors for sulphide zinc flotation. The oxide zinc flotation used an emulsified mixture of PAX and Armeen C as a collector. The typical reagent scheme developed is summarized in Table 13-16.

Prairie Creek Page 9 1
NI 43-101 Technical Report on Preliminary Economic Assessment October 15, 2021
Table 13-16: SGS Initial Reagent Scheme for Prairie Creek Mineralization
Reagent
Reagent Dosage (g/t)
Sulphide Lead Flotation
Oxide Lead Flotation Sulphide Zinc
Flotation Oxide Zinc Flotation
Modifier and Depressant
Na2S · 9H20 500 800 - 600
MQ2 475 - - -
MKF 175 175 - -
PZ I - - 400 -
CaO - - ~1300 -
CuSO4 · 5H20 - - 900 -
Na2SiO3 - - - 400
Collector and Frother
Dinafloat DF067 22 12 - -
SIBX 30 65 50 -
Cytec 3894 - - 6 -
PAX/Armeen C (50:50) - - - 50
MIBC 4 - - 24
MQ2: 60% ZnSO4, 30% Na2S2O5 and 10% Na2S2O3 MKF: 60% Na2SiO3, 20% Acumer 9000 and 20% Thiourea PZ1: 40% Dextrin W9524, 40% Na2HPO4 and 10% Tamol 819 PAX/Armeen C: 44% PAX/44% Armeen C/12% Ethofat 242/12 (emulsifying agent)
Grind size used for the Lower Zone composite was 80% passing about 80 µm, although there is limited information to show how this was selected. Overall the samples selected responded reasonably well to the process flowsheet developed, and it was reported that the different types could be co-mingled in processing.
13.2.5.2.2 Phase 3 – 2006 SGS Lakefield
The test objective was to optimize flotation on HLS pre-concentrated samples using the general flowsheet and reagent scheme developed in the Phase I and II test program. Effects of process variables tested on the pre-concentrated samples indicated a number of findings. Among these was that use of soda ash as a pH modifier for sulphide lead flotation circuit gave improved lead recovery, as well as better selectivity between lead and zinc. Sodium hydroxide to adjust pulp pH for sulphide zinc flotation gave much poorer results.
Sulphide lead collector testing showed that alternative collectors, such as modified dithiophosphates, did not give improved sulphide lead metallurgical performance compared to the collectors selected in the previous test programs. A combination of N-type sodium silicate and DV177 (short chain polyacrylamide) gave better results in suppressing gangues in the oxide lead and zinc circuits.
Primary grind size testing showed the Lower Zone composite to be harder than the Upper Zone composite. Change in primary grind size did not significantly affect the overall metallurgical responses.
For Upper Zone testing, results were better with pre-concentration than without. The principal open cycle metal flotation recoveries were given as 91% lead, 87% zinc, and 98% silver into the lead and zinc concentrates. For the Lower Zone, lead

Prairie Creek Page 9 2
NI 43-101 Technical Report on Preliminary Economic Assessment October 15, 2021
metallurgical performance was also improved with HLS pre-concentration than without. Metal recoveries achieved were 94% lead, 82% zinc, and 98% silver in lead and zinc concentrates. Zinc grade for the combined sulphide and oxide zinc concentrate was 46.4% Zn, lower than that obtained from the as-received sample.
13.2.5.2.3 Phase 4 – 2007, SGS Lakefield
Principal objectives were to improve selectivity between lead and zinc mineral flotation in the lead flotation circuit, and improve oxide zinc concentrate grade.
Sulphide lead/zinc and oxide lead flotation
SGS Lakefield further examined the effect of primary grind size on the metallurgical performance of target minerals, using the conditions developed in the Phase 3 test program. Results indicated better lead sulphide metallurgical performance through increasing primary grinding fineness from 80% passing 60 µm to 80% passing 117 µ. However, this did not result in a significant change in the oxide lead and zinc sulphide metallurgical results.
The effect of lime on sulphide lead flotation rather than soda ash as a pH modifier was studied. Lime gave a significant loss in selectivity between lead and zinc differential flotation. The soda ash dosage did not significantly affect sulphide lead metallurgical performance. Several zinc depressants were tested on the Master Composite sample for sulphide lead flotation. The previously developed MQ3 was not as effective as a modified version, P82 (50% zinc sulphate, 25% sodium thiosulfate and 25% sodium metabisulphite).
The Master Composite sample was seen to contain high levels of clay-type slimes, with this having a negative effect on lead and zinc flotation selectivity. To reduce this effect, a new slime dispersant/depressant, AQ4 (33% Accumer 9000, 34% sodium silicate and 33% trisodium phosphate (Na3PO4), was developed and tested; it reportedly showed better metallurgical performance than MKF. Consequently, reagents P82 and AQ4 were selected for suppressing zinc minerals and dispersing slimes for the rest of the test program.
For sulphide lead flotation, instead of recycling the first cleaner scavenger concentrate to primary grinding, a modified flowsheet eliminated this stage and sent the first cleaner flotation tailings to the lead rougher scavenger flotation. The rougher scavenger flotation concentrate was cleaned and the tailings were floated again, the concentrate produced being sent to primary grinding and the tailings to the zinc flotation circuit. It was stated that the modified flowsheet appeared to give improved lead selectivity in the locked cycle tests.
13.2.5.2.4 Oxide zinc sulphide and oxide lead flotation
Various collector and gangue dispersant/depressant combinations were tested. A SIPX and Normac S (amine acetate) combination gave better metallurgical performance in oxide zinc flotation and was retained for the rest of the test program. Secondary gangue depressant testing in the oxide zinc circuit included starch, a Calgon/Dispersogen mixture, and polyacrylamide. Highest zinc concentrate grade obtained was 34.7% Zn.
Both starch and the Calgon/Dispersogen mixture produced good concentrate grade in batch tests. The Calgon/Dispersogen mixture performed better in locked cycle tests. Regrinding oxide zinc rougher concentrate prior to cleaning flotation had a negative effect on zinc concentrate grade, which was reduced from 32% to 20% zinc. Also indicated from the batch testing when using process recycle water was a negative effect on flotation showing a deteriorated selectivity between lead and zinc minerals when LCT test flotation water was used.

Prairie Creek Page 9 3
NI 43-101 Technical Report on Preliminary Economic Assessment October 15, 2021
13.2.5.2.5 Phase 5 – 2009, SGS Lakefield
SGS tested a bulk composite sample to generate flotation products for environmental and concentrate marketing review. It was noted that secondary copper minerals in the ROM sample resulted in zinc minerals activation, which caused a sulphide lead flotation selectivity problem. In using the Phase 4 reagent regime, some further selectivity problems were seen because of a larger proportion of fine slimes. For satisfactory slime depression and flotation selectivity, the reagent scheme was modified, including increasing sodium sulphide dosages and changing slime depressant from AQ4 to SQ4 (40% Aqumer 9400, 45% sodium silicate), with 15% EDTA (ethylene diamine tetra acetic acid).
Mine water was not shown to affect sulphide lead and zinc flotation, but oxide lead flotation deteriorated. By adjusting reagent dosages and modifying depressant AQ4, oxide lead floatability was restored. The final reagent scheme that was developed including those eventually used for the locked cycle testing as shown in Table 13-17.
Table 13-17: SGS Optimized 2009 Reagent Scheme
Reagent Reagent Dosage (g/t)
Lead Sulphide Flotation Oxide Lead Flotation Zinc Sulphide Flotation
Modifier and Depressant
Na2CO3 4,800 - 1,900
Na2S · 9H2O 500 1,000 -
SQ4 550 - 400
P82 1,200 - -
Sodium Silicate ‘N’ - 900 -
CuSO4 · 5H2O - - 1,800
Collector/Frother
DF067 20 12 -
SIBX 36 65 75
3894 - - 18
MIBC 4 - -
SQ4: 40% Aqumer 9400, 45% Na2SiO3, 15% EDTA (Ethylene Diamine Tetra Acetic Acid)
13.2.5.2.6 2013 Testwork, SGS Lakefield
SGS did flotation test work on pre-concentrated DMS sample, including two batch flotation tests and two locked cycle tests. The first batch flotation test used potable tap water; the remaining tests used water from the 883 m level adit decline.
The test work objective was to generate supernatants for environmental tests and concentrates for marketing assessments. The reagent regime was similar to that of the Phase 5 testing, done in 2009. Concentrate grades and metal recoveries of the sulphide lead and zinc concentrates produced were inferior to these generated in previous testing. Locked cycle testing results are described below.

Prairie Creek Page 9 4
NI 43-101 Technical Report on Preliminary Economic Assessment October 15, 2021
13.2.5.2.7 2014 – 2016 Testwork, GMR
The GMR laboratory located in Burnaby, BC conducted a series of flotation test program to generate concentrate samples for a bio-leaching program and simplify flotation reagent regime. The open bench test results appear to show similar metallurgical performance results using a modified reagent regime, compared to the previous test results.
13.2.6 Flotation Locked Cycle Testwork
13.2.6.1 MQV Oxidized Material
The historical locked cycle work was performed on samples collected from bulk sample areas of the resource located closer to surface. Locked cycle tests (LCT) done prior to 2001 did not use DMS pre-concentration and focused on flotation of galena and sphalerite with little attention paid to the oxide minerals. Some tests included copper and lead separation. During 2004 and 2013 SGS did extensive LCT testing, including sulphide, as well as investigating recovery of oxide lead and zinc flotation.
Specific locked cycle testing done on MQV prior to 2001, with corresponding tabulated results are shown below. This includes by Kamloops Labs (KM) along with the related project number, which are provided in Table 13-18. Those LCT performed later by SGS are summarized in Table 13-19.
Table 13-18: MQV Locked Cycle Test Data (Kamloops Labs, Prior to 2001)
Product Weight Grade Distribution
(%) Pb (%) Zn (%) Ag (g/t) Cu (%) Pb (%) Zn (%) Ag (%) Cu (%)
KM019 – 1980 Lakefield Sample
Feed 100 12.5 15.5 226 - 100 100 100 -
Lead Concentrate 15.5 55 10 857 - 68 10 59 -
Zinc Concentrate 20.1 5 55 171 - 8 75 16 -
Tailings 64.4 4.7 3.7 89 - 24 15 25 -
KM048 - Upper Adit Sample
Feed 100 11.6 15.4 203 0.58 100 100 100 100
Copper Concentrate 1 22.8 6.6 5,281 25.3 2 0.4 26.7 43.7
Lead Concentrate 15 49.9 21 538 1.2 64.7 20.5 42.4 31.1
Copper + Lead Concentrate 16 48.2 20.1 834 2.7 66.7 20.9 69.1 74.8
Zinc Concentrate 19.8 5.7 51.3 178 0.4 9.8 66.1 17.9 13
Tailings 64.2 4.3 3.1 40 0.11 23.5 13 13 12.2
KM440 - Composite
Feed 100 15.4 15.8 - 0.56 100 100 - 100
Lead Concentrate 15.8 68.3 7.03 - 2.77 70.1 7.1 - 78.9
Zinc Concentrate 19.9 4.17 59.1 - 0.17 5.4 74.5 - 6.1
Zinc Retreat Tail 13 13.1 11 - 0.39 11 9 - 9
Tailings 51.3 4.07 2.89 - 0.07 13.5 9.4 - 6

Prairie Creek Page 9 5
NI 43-101 Technical Report on Preliminary Economic Assessment October 15, 2021
Product Weight Grade Distribution
(%) Pb (%) Zn (%) Ag (g/t) Cu (%) Pb (%) Zn (%) Ag (%) Cu (%)
KM454 – Vein Ore Sample
Feed 100 15.8 16.1 - 0.6 100 100 - 100
Copper Concentrate 1.8 17.9 16 - 20.6 2 1.8 - 58.9
Reverse Tailings 13.4 69.4 12.4 - 0.3 58.7 10.3 - 6.4
Reverse Concentrate 7 19.4 35 - 0.9 8.6 15.3 - 10
Copper + Lead Concentrate 22.2 49.5 19.8 - 2.1 69.3 27.4 - 75.3
Zinc Concentrate 18.5 6.5 52.7 - 0.3 7.6 60.7 - 8.8
Zinc Retreat Tailings 13.5 10.9 5.4 - 0.4 9.3 4.5 - 8.6
Tailings 45.7 4.8 2.6 - 0.1 13.8 7.4 - 7.3
The pre-2001 processing flowsheet did not include recovery of oxide lead and zinc minerals, which lowered recovery. Some testing investigated separate copper recovery. Although tests for copper were performed on samples with above average Cu grades and not considered representative of the resource as a whole. There was also significant loss of other payable metal distribution into the copper concentrate, as well as a high level of detrimental elements such as arsenic and antimony. While most of the silver reported with the copper concentrate, the low copper grades achieved may inhibit being able to achieve an easily saleable product.
The recovery and grade ranges varied depending on composite and the procedure. Many of the target metals were distributed into other concentrates or lost to tailings. The optimized lead concentrate appeared to be test KM440, which recovered approximately 70% of the lead, with a grade of ~68% Pb, with the zinc concentrate recovering about 75% with a concentrate grade of ~ 60% Zn.
Subsequent locked cycle tests performed by SGS used procedures to recover oxide minerals, with most tests using HLS for pre-concentration. The flotation flowsheet used a similar procedure to the earlier work, followed by oxide flotation. However, as outlined previously in the open cycle procedures the reagent scheme was much more complex. The SGS locked cycle results are highlighted in Table 13-19.
Table 13-19: MQV Locked Cycle Test Data (SGS)
Product Weight Grade Distribution
(%) Pb (%) Zn (%) Ag (g/t) Cu (%) Pb (%) Zn (%) Ag (%) Cu (%)
LR10916-001/Test 56/Master Composite 2*
Feed 100 9.6 11.5 152 0.4 100 100 100 100
PbS Concentrate 7.6 63.5 7.6 1,145 2.64 50.2 5 56.9 56.5
PbO Concentrate 4.5 55.1 4.8 385 0.6 25.6 1.9 11.3 7.7
PbS + PbO Concentrate 12 60.4 6.6 864 1.9 75.8 6.9 68.2 64.2
ZnS Concentrate 15 2.1 58.3 89.7 0.2 3.3 75.5 8.8 7.1
ZnO Concentrate 2.5 2.4 33.7 155 0.5 0.6 7.4 2.6 3.9
ZnS+ZnO Concentrate 17.5 2.1 54.7 99.1 0.2 3.9 82.8 11.4 11
Total Tailings 70.5 2.8 1.7 44.2 0.1 20.3 10.3 20.4 24.8
LR10916-001/Test 57/Upper Zone Composite
Feed 100 9 10.8 162 0.4 100 100 100 100
PbS Concentrate 7.5 60.9 4.5 1,258 3.5 50.7 3.1 58.6 64.8
PbO Concentrate 6.3 49 5.9 394 0.6 34.1 3.4 15.3 8.6
PbS+PbO Concentrate 13.8 55.5 5.1 864 2.1 84.8 6.5 73.9 73.4
ZnS Concentrate 13.4 4 59.5 132 0.2 6 73.8 10.9 7.8
ZnO Concentrate 2 4.8 37.6 307 1.2 1.1 6.9 3.8 5.7

Prairie Creek Page 9 6
NI 43-101 Technical Report on Preliminary Economic Assessment October 15, 2021
Product Weight Grade Distribution
(%) Pb (%) Zn (%) Ag (g/t) Cu (%) Pb (%) Zn (%) Ag (%) Cu (%)
ZnS + ZnO Concentrate 15.4 4.1 56.6 155 0.4 7 80.7 14.7 13.6
Total Tailings 70.8 1 2 26 0.1 8.2 12.8 11.4 13
LR10916-001/Test 58/Lower Zone Composite
Feed 100 14 10.7 152 0.3 100 100 100 100
PbS Concentrate 11.5 84.7 8.6 847 1.5 69.1 9.2 63.9 54.9
PbO Concentrate 5.8 46.2 5.9 383 0.6 19 3.2 14.6 10.4
PbS + PbO Concentrate 17.3 71.7 7.7 691 1.2 88.2 12.4 78.5 65.3
ZnS Concentrate 11.9 4.2 60.2 109 0.3 3.6 66.7 8.6 9.6
ZnO Concentrate 4.6 10 27 139 0.5 3.3 11.6 4.2 7
ZnS + ZnO Concentrate 16.5 5.9 50.9 118 0.3 6.9 78.3 12.8 16.5
Total Tailings 66.2 1 1.5 20 0.1 4.9 9.3 8.7 18.2
LR10916-001/Test 59/Master Composite 1
Feed 100 9.5 10.9 160 0.4 100 100 100 100
PbS Concentrate 7.6 64.4 8.8 1,261 3.3 51.1 6.1 59.8 60.3
PbO Concentrate 5.8 44.8 6 377 0.7 27.2 3.2 13.6 9.7
PbS + PbO Concentrate 13.4 55.9 7.6 879 2.1 78.3 9.3 73.5 70
ZnS Concentrate 13.2 3.9 60.9 112 0.2 5.5 73.8 9.3 7.3
ZnO Concentrate 2.4 26.5 20.6 297 0.7 6.7 4.5 4.5 4.3
ZnS + ZnO Concentrate 15.6 7.4 54.7 141 0.3 12.1 78.3 13.7 11.5
Total Tailings 71 1.3 1.9 28.8 0.1 9.6 12.4 12.8 18.5
LR11098-001/Test 25/HLS Upper Zone Composite
Feed 100 18.2 21.2 259 - 100 100 100 -
PbS Concentrate 16.4 71.2 5.3 1,010 - 64 4.1 63.9 -
PbO Concentrate 10.3 46.4 8.7 311 - 26.2 4.2 12.4 -
PbS + PbO Concentrate 26.7 61.6 6.6 740 - 90.2 8.3 76.3 -
ZnS Concentrate 23.5 3.8 60.3 148 - 4.9 67.1 13.4 -
ZnO Concentrate 12.8 3.6 31.5 144 - 2.6 19 7.1 -
ZnS + ZnO Concentrate 36.3 3.7 50.2 146 - 7.5 86.1 20.6 -
Total Tailings 37 1.1 3.2 21.9 - 2.3 5.6 3.1 -
LR11098-001/Test 26/HLS Lower Zone Composite
Feed 100 15.4 11.7 175 - 100 100 100 -
PbS Concentrate 16 66.9 8.5 784 - 69.7 11.6 71.8 -
PbO Concentrate 7.9 47.8 8.8 298 - 24.7 6 13.5 -
PbS + PbO Concentrate 23.9 60.6 8.6 623 - 94.3 17.6 85.3 -
ZnS Concentrate 12.4 5.4 55.5 149 - 4.3 59.1 10.6 -
ZnO Concentrate 8.1 1.3 29.8 43.8 - 0.7 20.7 2 -
ZnS + ZnO Concentrate 20.6 3.8 45.3 108 - 5 79.8 12.6 -
Total Tailings 55.5 0.2 0.6 7.9 - 0.7 2.6 2.5 -
LR11098-002/Test 24/HLS Master Composite
Feed 100 20.9 23.5 332 0.7 100 100 100 100
PbS Concentrate 20.2 67.7 7.2 1,078 2.4 65.4 6.2 65.5 70.5
PbO Concentrate 8.2 38.5 10.3 413 0.4 15.2 3.6 10.2 5.4
PbS + PbO Concentrate 28.4 59.2 8.1 885 1.8 80.6 9.8 75.7 75.9
ZnS Concentrate 28.3 5.5 60.4 182 0.3 7.5 72.7 15.5 10.9
ZnO Concentrate 10.1 12.2 23 133 0.4 5.9 9.9 4 6.2
ZnS + ZnO Concentrate 38.4 7.3 50.6 169 0.3 13.3 82.6 19.5 17.1
Total Tailings 33.2 3.83 5.4 47.5 0.14 6.1 7.6 4.8 7
LR11098-002/Test 27/HLS Master Composite
Feed 100 17.8 22.7 277 - 100 100 100 -
PbS Concentrate 20.4 56.2 16 871 - 64.4 14.4 64.1 -
PbO Concentrate 8.3 47.9 8.1 413 - 22.3 3 12.4 -

Prairie Creek Page 9 7
NI 43-101 Technical Report on Preliminary Economic Assessment October 15, 2021
Product Weight Grade Distribution
(%) Pb (%) Zn (%) Ag (g/t) Cu (%) Pb (%) Zn (%) Ag (%) Cu (%)
PbS + PbO Concentrate 28.7 53.8 13.7 739 - 86.7 17.4 76.5 -
ZnS Concentrate 23.9 4.4 60.2 161 - 6 63.5 13.9 -
ZnO Concentrate 7.7 4.8 31.1 137 - 2 10.5 3.8 -
ZnS + ZnO Concentrate 31.6 4.5 53.1 155 - 8 74 17.6 -
Total Tailings 39.7 2.39 4.95 41.2 - 5.3 8.6 5.9 -
LR11098-002/Test 30/HLS Master Composite
PbS Concentrate 17.2 75 4 1,032 - 62.8 3.1 58.7 -
PbO Concentrate 9.3 57 6.1 440 - 25.7 2.6 13.5 -
PbS + PbO Concentrate 26.5 68.7 4.7 825 - 88.5 5.7 72.2 -
ZnS Concentrate 27.3 4.4 59.8 202 - 5.8 73.8 18.2 -
ZnO Concentrate 8.1 1.9 33.3 116 - 0.7 12.2 3.1 -
ZnS + ZnO Concentrate 35.4 3.8 53.8 182 - 6.5 86 21.3 -
Total Tailings 38.1 2.69 4.85 51.5 - 5 8.3 6.5 -
LR11098-002/Test 31/Master Composite w/o HLS
Feed 100 16 16.8 221 - 100 100 100 -
PbS Concentrate 14.4 69.1 6.2 982 - 62.1 5.3 63.7 -
PbO Concentrate 7.6 44.6 7 388 - 21.2 3.2 13.3 -
PbS + PbO Concentrate 22 60.6 6.5 777 - 83.3 8.5 77 -
ZnS Concentrate 20.5 5.9 59 130 - 7.6 72 12.1 -
ZnO Concentrate 7.1 8.7 30 137 - 3.9 12.7 4.4 -
ZnS + ZnO Concentrate 27.6 6.65 51.5 132 - 11.5 84.7 16.5 -
Total Tailings 50.4 1.63 2.27 28.7 - 5.2 6.8 6.5 -
LR11098-002/Test 37/HLS High Oxide Composite
Feed 100 13.6 16 223 - 100 100 100 -
PbS Concentrate 11.3 59 12.7 1,069 - 49 9 54.2 -
ZnS Concentrate 15.8 5.2 57.9 208 - 6 57.1 14.6 -
Total Tailings 72.9 8.4 7.44 95.4 - 45 33.9 31.2 -
LR11098-002/Test 38/HLS Low Oxide Composite
Feed 100 20.7 23.7 397 - 100 100 100 -
PbS Concentrate 20.3 64.9 7.8 1,423 - 64 6.7 72.9 -
ZnS Concentrate 28.5 3.4 62 114 - 4.6 74.4 8.2 -
Total Tailings 51.2 12.7 8.7 147 - 31.4 18.9 18.9 -
LR11098-002/Test 40/HLS Master Composite
Feed 100 20 22 306 - 100 100 100 -
PbS Concentrate 15.5 73.6 4.8 1,193 - 57.1 3.4 60.5 -
ZnS Concentrate 25.1 4 62.2 186 - 5 71.1 15.3 -
Total Tailings 59.4 12.8 9.5 125 - 37.9 25.5 24.2 -
LR12018-001/Test 9/HLS ROM Composite
Feed 100 19.7 24.7 331 - 100 100 100 -
PbS Concentrate 17.4 71.8 4.9 1,158 - 63.3 3.5 60.7 -
PbO Concentrate 6.8 53.9 8.3 321 - 18.7 2.3 6.6 -
PbS + PbO Concentrate 24.1 66.8 5.9 922 - 82 5.8 67.3 -
ZnS Concentrate 32.2 5.1 58 261 - 8.3 75.6 25.3 -
Total Tailings 43.7 4.4 10.5 56.3 - 9.7 18.6 7.4 -
LR12018-001/Test 10/HLS ROM Composite
Feed 100 18.8 24.8 318 - 100 100 100 -
PbS Concentrate 16.3 75.1 4.5 1,172 - 65 3 60 -
PbO Concentrate 5.9 52.5 8.9 382 - 16.6 2.1 7.1 -
PbS + PbO Concentrate 22.2 69.1 5.6 961 - 81.6 5.1 67.1 -
ZnS Concentrate 32.4 4.6 57.6 251 - 7.9 75.4 25.6 -
Total Tailings 45.4 4.3 10.6 51.5 - 10.5 19.5 7.3 -

Prairie Creek Page 9 8
NI 43-101 Technical Report on Preliminary Economic Assessment October 15, 2021
Product Weight Grade Distribution
(%) Pb (%) Zn (%) Ag (g/t) Cu (%) Pb (%) Zn (%) Ag (%) Cu (%)
LR12018-001/Test 11/HLS ROM Composite
Feed 100 19.8 24.4 337 - 100 100 100 -
PbS Concentrate 18.8 71.4 6.5 1,091 - 67.5 5 60.8 -
PbO Concentrate 6.7 49 9.1 343 - 16.6 2.5 6.8 -
PbS + PbO Concentrate 25.5 65.5 7.1 895 - 84.1 7.5 67.6 -
ZnS Concentrate 31.7 5.3 57.4 267 - 8.4 74.7 25.2 -
Total Tailings 42.8 3.5 10.1 56.8 - 7.5 17.8 7.2 -
LR50242-001/Test 2/DMS Composite
Feed 100 19.5 31.6 320 0.84 100 100 100 100
PbS Concentrate 19.8 50.7 24 999 2.7 51.3 15 61.7 63.2
PbO Concentrate 1.78 44.6 11.5 662 1.95 4.1 0.6 3.7 4.1
PbS + PbO Concentrate 21.58 50.2 23 971 2.6 55.4 15.6 65.4 67.3
ZnS Concentrate 34.7 8.1 62.3 159 0.24 14.5 68.5 17.3 9.8
Total Tailings 43.7 13.4 11.5 127 0.44 30.1 15.9 17.3 22.8
LR50242-001/Test 3/DMS Composite
Feed 100 20.4 27.7 351 0.85 100 100 100 100
PbS Concentrate 19.8 53.6 19.4 1,036 2.47 52 13.9 58.6 57.8
PbO Concentrate 4.1 52.2 7.02 598 1.45 10.4 1 6.9 6.9
PbS + PbO Concentrate 23.9 53.4 17.3 961 2.3 62.4 14.9 65.5 64.7
ZnS Concentrate 33.3 7.62 57.3 191 0.36 12.4 68.8 18.1 14.2
Total Tailings 42.8 12 10.5 134 0.42 25.2 16.2 16.4 21
Generally, the results for recovery of sulphide lead and zinc minerals were similar to the pre-2001 testing. Flotation of oxide lead and zinc minerals improved overall lead and zinc recoveries, but with lower combined resulting concentrate grades. The tests showed better slime suppression control was required for oxide flotation circuits, especially for oxide zinc.
The sulphide lead concentrate recovered about 50% to 70% of the lead and 57 to 72% of the silver. Concentrate lead grades (mainly between 60% and 75%), were higher than pre-2001. Oxide lead flotation further recovered about 15% to 34% of the lead to a concentrate containing about 48% lead (range from 38 to 57%). Silver recovery to oxide lead concentrate ranged from 7% to 15% and averaged about 11%, if removing anomalous test results.
Concentrate produced from sulphide zinc flotation recovered between 57% and 76% of the zinc and between 8% and 25% of the silver. Zinc concentrate grades ranged from 55% to 62% Zn. Oxide zinc flotation was performed after oxide lead flotation, recovering an additional 5% to 20% of the zinc (averaging 12%). Average oxide zinc concentrate grade was 30% zinc, with a range 23% to 38% and contained about 4% of the silver.
In 2015 GMR conducted a multi-cycle LCT test. It appeared that the lead and zinc performances were stable in the initial cycles and that more zinc reported to the lead concentrate. This implies that suppression of zinc minerals in the lead flotation circuit should be further optimized.
13.2.6.2 SMS Mineralization
The 2005 testing by SGS had included a locked cycle test using a sample of 50% MQV and 50% SMS. The work appeared to confirm additional open cycle testing that co-processing of the two types of mineralization would not cause a significant impact on metallurgical performance.
The locked cycle procedures for SMS did not include an attempt to recovery an oxide mineral portion due to the low content present. Otherwise, the testing looked at recycling the streams following earlier developed procedures, although grind was reported to be coarser. The results are presented in Table 13-20.

Prairie Creek Page 9 9
NI 43-101 Technical Report on Preliminary Economic Assessment October 15, 2021
Table 13-20: SMS Locked Cycle Test Data
Product Weight Grade Distribution
(%) Pb (%) Zn (%) Ag (g/t) Pb (%) Zn (%) Ag (%)
KM370/Test 8
Feed 100 6.3 11.4 53 100 100 100
Lead Concentrate 8.3 57.2 8.9 361 75.6 6.5 57.2
Zinc Concentrate 15.3 1.6 57.7 60 4 77.3 17.4
Tailings 76.4 1.7 2.4 17 20.4 16.2 25.4
KM370/Test 9
Feed 100 6.3 11.5 55 100 100 100
Lead Concentrate 8.8 57.8 7.5 372 80.6 5.8 59.7
Zinc Concentrate 19.2 1.9 52 62 5.7 87.4 21.7
Tailings 72 1.2 1.1 14.1 13.7 6.8 18.6
KM462/Test 13
Feed 100 9.2 15.4 - 100 100 -
Lead Concentrate 13.6 53.1 6.4 - 79 5.6 -
Zinc Concentrate 22.5 3.3 59 - 8 85.9 -
Tailings 64 1.9 2.1 - 13 8.5 -
KM462/Test 14
Feed 100 9.6 16 130 100 100 100
Lead Concentrate 13.8 53.3 4.3 349 76.7 3.7 37.1
Zinc Concentrate 24.8 4.3 59.2 265 11.2 91.7 50.7
Tailings 61.4 1.9 1.2 25.4 12.1 4.6 12.2
KM462/Test 15
Feed 100 9.1 16.2 115 100 100 100
Lead Concentrate 11 60.4 3.7 422 73.3 2.5 40.6
Zinc Concentrate 23.8 2.9 62 199 7.6 91 41.4
Tailings 65.2 2.7 1.6 32.1 19.2 6.5 18
LR10916-001/Test 60
Feed 100 4.9 9 46.8 100 100 100
Lead Concentrate 7.3 59.8 5.4 404 89.5 4.4 63.1
Zinc Concentrate 14.9 0.8 53.9 82.8 2.5 89.3 26.4
Tailings 77.7 0.5 0.7 6.3 8 6.3 10.5
While the data is difficult to evaluate due to the feed containing 50 wt% oxidized MQV, the SMS appeared to provide for a modestly improved performance as compared to MQV alone. This is likely due to lower extent of sulphide oxidation for SMS. The lead concentrate recovered about 73% to 89% of the lead at grades ranging from ~53% to 60% Pb. Corresponding silver recovery ranged from 17% to 50%, with grade of 350 g/t to 422 g/t Ag. The silver recovery to the lead concentrate is noted to be low with significant losses reporting with the zinc or lost to final tailing, probably because a lead oxide concentrate was not included. Approximately 77% to 92% of the zinc reported to the concentrate, which graded from 53% to 61% Zn.

Prairie Creek Page 1 00
NI 43-101 Technical Report on Preliminary Economic Assessment October 15, 2021
13.2.7 Pilot Plant Testing
In 1982, CSMRI undertook flotation pilot plant testing to simulate the then proposed mill process. Test objectives were to provide operating and metallurgical data from the continuous operation of three flow schemes (Runs # 101, 102, 103) and produce lead and zinc concentrates representative of the full-scale mill operation. The flowsheets tested were similar, with the final two runs including a regrind step prior to lead cleaners flotation. A flowsheet, not showing the regrind step, is provided in Figure 13-3.

Prairie Creek Page 1 01
NI 43-101 Technical Report on Preliminary Economic Assessment October 15, 2021
Figure 13-3: CSMRI Pilot Plant Flowsheet - base case run #101
Note: Figure prepared by CMSRI, 1982.

Prairie Creek Page 1 02
NI 43-101 Technical Report on Preliminary Economic Assessment October 15, 2021
Run 101 is shown as in the preceding figure, while Runs 102 and 103 had minor modifications to the flowsheet. Modifications for Run 102 were that it undertook regrinding of the first lead cleaner tailing and lead rougher scavenger concentrate. Run #103 reground all rougher and scavenger concentrates and lead cleaner flotation with three stages of flotation instead of the two used in the previous two runs. The pilot plant feed rate was approximately 227 kg/h (500 lb/h), with sampling every 45 minutes for a minimum of three hours to produce composite samples for chemical and particle size analyses. Primary grind size was approximately 70% passing 74 µ (200 mesh). Soda ash/ sodium cyanide was used in the lead circuit and lime/copper sulphate in the zinc circuit. A summary of the results is provided in Table 13-21 below.
Table 13-21: CSMRI Pilot plant test results
Run Process Stream
Feed Rate
Weight Grade Distribution
(lb/h) (%) Cu (%)
Pb (%)
Zn (%)
Ag (oz/t)
Cu (%)
Pb (%)
Zn (%)
Ag (%)
101
Flotation Feed 492 100 0.37 10.1 11.9 5.61 100 100 100 100
Lead 2nd Cleaner Concentrate
52.4 10.6 2.8 63.6 10.7 36.9 79.9 67.1 9.6 70
Zinc 3rd Cleaner Concentrate
73.1 14.9 0.23 4.23 59.2 5.87 9.1 6.2 73.8 15.6
Zinc Rougher Flotation Tailings
366.5 74.5 0.06 3.62 2.67 1.09 11 26.7 16.7 14.5
102
Flotation Feed 463 100 0.37 9.58 11.6 5.49 100 100 100 100
Lead 2nd Cleaner Concentrate
43.3 9.4 2.97 64.5 9.44 40.4 74.8 62.9 7.6 68.7
Zinc 3rd Cleaner Concentrate
65 14 0.26 2.96 61 5.76 9.7 4.3 74.2 14.7
Zinc Rougher Flotation Tailings
354.7 76.6 0.08 4.09 2.75 1.19 15.5 32.7 18.2 16.6
103
Flotation Feed 442 100 0.35 9.5 12.8 5.27 100 100 100 100
Lead 2nd Cleaner Concentrate
46.6 10.5 2.79 66.3 9.03 37.7 85 73.5 7.4 75.4
Lead 3rd Cleaner Concentrate
34.9 7.9 2.57 69.1 7.74 35.5 58.8 57.4 4.8 53.2
Zinc 3rd Cleaner Concentrate
79.8 18.1 0.42 5.4 56.8 7.9 22.2 10.3 79.9 27.1
Zinc Rougher Flotation Tailings
327.3 74 0.09 4.15 2.66 1.4 19.1 32.3 15.3 19.7
Pilot plant runs produced lead concentrates containing 64% to 69% lead, with 8% to 11% zinc, with incorporation of regrind showing a slight improvement to grade. Lead recovery based on the second cleaner concentrate was 63% to 73% into about 10% of the feed weight.
The zinc concentrates graded from 57% to 61% zinc, with 3% to 6% lead. Less lead was present if regrinding had been incorporated during prior lead cleaning. Zinc recovery was 74% up to 79% in Run 103.

Prairie Creek Page 1 03
NI 43-101 Technical Report on Preliminary Economic Assessment October 15, 2021
13.2.8 Other Test Work
13.2.8.1 Settling Tests
13.2.8.1.1 Flotation Tailing
In 2011 Outotec performed a thickening test on two flotation tailings samples. No significant difference was observed. Particle size was 80% passing 91 µ. MF10 as flocculant at 30 g/t dosage gave a thickener underflow solid density of 69 to 71% at loading rates of 0.54 and 0.84 t/m2/h respectively. Results are summarized in Table 13-22 below, with no significant differences noted.
Table 13-22: Outotec Settling Test Data – Flotation Tailing
Flocculant Solid Loading Rate Rise Rate Underflow Overflow Vane Yield Stress
Type Dosage (g/t) (t/m2/h) (m/h) (w/w%) (ppm) (Pa)
MF10 30 0.54 2.4 71 36 67
0.84 3.8 69 56 47
The phase 3 work performed in 2006 by SGS included dewatering tests on tailings and subsequently the concentrates. Tailings from both Upper Zone and Lower Zone MQV composites contained appreciable clay-like slimes, thus settling rates were relatively low. The thickener overflow also contained appreciable suspended solids. To achieve reasonably good settling rates, tailings pH was reduced to about 7.0 and with a significant amount of the flocculent, Magnafloc (MF) 351 added, as outlined in Table 13-23.
Table 13-23: SGS Settling Test Data – Flotation Tailing
Test No. pH Flocculant
Initial Settling Rate
Thickener U/F Unit Area
Thickener Hydraulic Unit Area *
Type g/t m3/m2/d m2/mt/d m2/mt/d
Upper Zone Composite
S-3 7 Mag 351 34.4 27.59 0.154 0.089
S-4 6.8 Mag 351 50 412.5 0.057 0.006
Lower Zone Composite
S-1 7 Mag 351 8.5 49.44 0.085 0.048
S-2 7 Mag 351 17.3 63.52 0.073 0.039
* Overflow capacity
In the 1982 CSMRI piloting settling tests were conducted on Run 103 flotation tailings. The results showed a clear supernatant was produced. The tailing settled rapidly and rate improved with the addition of lime or flocculant (Superfloc 1202, non-ionic), as shown in Table 13-24.

Prairie Creek Page 1 04
NI 43-101 Technical Report on Preliminary Economic Assessment October 15, 2021
Table 13-24: CSMRI Settling Test Data - Flotation Tailing
Flocculant Critical Time* Unit Rate
Type Dosage (lb/ton) (min) (ft2/st/d)
- - 32 3.03
Ca(OH)2 2.02 27 3.05
Ca(OH)2 5.08 25 2.36
Superfloc 1202 0.035 17 1.76
Superfloc 1202 0.1 13 1.23
* Time to reach a solid density of 55% w/w
13.2.8.1.2 Flotation Concentrates
SGS undertook settling tests on oxide and sulphide concentrates from the first two phases of their work performed in 2006. The concentrates had been frozen and were thawed and re-cleaned prior to the settling tests, which were performed at natural pH, with and without flocculant added. Table 13-25 shows the results. Good settling rates were achieved for all concentrates. Addition of Magnafloc 351, improved settling rate and supernatant clarity.
Table 13-25: SGS Settling Test Data – Flotation Concentrates
Test No. pH Flocculant
Initial Settling Rate
Thickener U/F Unit Area
Thickener Hydraulic Unit Area *
Type g/t m3/m2/d m2/mt/d m2/mt/d
Lead Sulphide Concentrate, Particle Size: 80% 46 µm
S-5 8.3 - - 47.64 0.022 0.035
S-6 8.3 Mag 351 6.4 494.4 0.008 0.004
Oxide Lead Concentrate, Particle Size: 80% 84 µm
S-9 10.2 None 0 20.46 0.112 0.092
S-10 10.2 Mag 351 2.7 49.44 0.06 0.038
S-11 10.2 Mag 351 6.8 79.4 0.035 0.024
Zinc Sulphide Concentrate, Particle Size: 80% 90 µm
S-7 9.6 - - 28.94 0.034 0.059
S-8 10 Mag 351 6.6 300.9 0.009 0.006
Oxide Zinc Concentrate, Particle Size: 80% 74 µm
S-12 10 - - 57.17 0.029 0.037
S-13 10 Mag 351 7.8 349 0.007 0.006
* Overflow capacity
The CSMRI 1982 pilot plant study included settlings tests by the modified Kynch method on flotation concentrates produced from Run 103. The addition of Superfloc 1202 was seen to improve concentrate settling rates. The addition of lime did not improve settling rates. Without flocculant, the conventional unit settling rate requirements were estimated to be 0.086 m2/mt/d (0.84 ft2/st/d) for the lead concentrate and 0.128 m2/mt/d (1.25 ft2/st/d) for the zinc concentrate, indicating good settling of both the concentrates.

Prairie Creek Page 1 05
NI 43-101 Technical Report on Preliminary Economic Assessment October 15, 2021
Table 13-26: CSMRI Settling Test Data – Flotation Concentrates
Test No. Flocculant Critical Time* Unit Rate
Type Dosage (lb/st) (min) (ft2/st/d)
Zinc Concentrate
1 - - 32 1.25
2 Ca(OH)2 0.61 35 1.37
4 Ca(OH)2 1.25 38 1.49
5 Superfloc 1202 0.034 22 0.85
Lead Concentrate
8 - - 20 0.84
10 Ca(OH)2 0.11 21 0.88
11 Ca(OH)2 1.09 20 0.87
12 Superfloc 1202 0.01 15 0.55
14 Superfloc 1202 0.04 11 0.48
*Time to reach a solid density of 65% w/w
13.2.8.2 Filtration Testing on Flotation Concentrates
SGS performed filtration tests on the oxide and sulphide concentrates generated from the first two phases of study in 2006. The procedure used a vacuum pour-on method. Good cake production rates were achieved on each concentrate, as shown on Table 13-27. Filter cake moisture ranged from 9.5% to 10.9%.
Table 13-27: SGS Settling Test Data – Flotation Concentrates
Sample
Slurry Total Filtration
Cycle Time Filter Cake
Percentage pH
Mag 351 (min) Thickness Moisture Filtration
Rate
Solids (%) (g/t) (mm) (%) kg/m2/h
Oxide Lead Concentrate 59.6 10.2 10 4.5 10 9.5 365.9
Sulphide Zinc Concentrate 61.0 10.0 10 1.76 12 10.3 666.7
Sulphide Lead Concentrate 61.4 8.3 10 1.4 10 9.8 909.1
Oxide Zinc Concentrate 56.4 10.0 13 1.58 13 10.9 5882
Dry kg/ m2/h; filter cloth: Neatex 3670/13 Total Filtration Cycle Time
13.2.9 Miscellaneous Testing Procedures
Historically a number of miscellaneous testing procedures were attempted on a scoping level basis to address potential problems with the treating the various products that were generated. However, none of these processes were developed to advanced consideration for the flowsheet. The work included:

Prairie Creek Page 1 06
NI 43-101 Technical Report on Preliminary Economic Assessment October 15, 2021
• CSMRI in 1983 undertook leaching of sulphide flotation tailings using ammonium hydroxide, sodium hydroxide, and sulphuric acid as lixiviates for lead and zinc extraction. Both ammonia and sulphuric acid extracted over 97% of zinc, but less than 1% of lead. Caustic leaching of cerussite flotation tailings extracted over 90% of lead and over 95% of zinc, but no silver. Caustic leaching of galena flotation tailings extracted about 95% of lead and zinc.
• In a related CSMRI study whole ore caustic leaching extracted about 50% of lead and 80% of zinc. A precipitate with 52% lead, 14% zinc, and 25 oz/ton silver resulted from the caustic leach liquor. Subsequent precipitation of zinc hydroxide with carbon dioxide (CO2) gave a concentrate of 64% zinc, 0.03% lead. Caustic soda regeneration was only partially successful reportedly due to the method complexity.
• Gravity concentration studies were performed by CSMRI in 1983 on both head sample and sulphide flotation tailings. The head sample procedures used shaking tables, that recovered 75.8% of lead and 63.8% of zinc into a concentrate grading 24.4% lead and 20.1% zinc originating from feed with 11.8% lead and 10.6% zinc. A cerussite flotation tailings table test produced three products: concentrate, middling, and tailings. 56.9% of zinc was recovered into a table concentrate with 34.6% zinc. A related earlier test undertaken by O’Kane was also performed using hydrocyclone principals to recover non-sulphide values from sulphide zinc flotation tailings but was shown to be unsuccessful.
• Pyrite flotation following zinc flotation was performed on several SMS samples, due to its higher iron content. The product was obtained from zinc flotation tailings which followed upstream treatment of lime and cyanide addition in the lead flotation circuit, as well as copper sulphate in the zinc flotation circuit. The sulphide zinc flotation tailings were then conditioned with sulphur dioxide and floated using butyl xanthate collector. Pyrite rougher concentrates from three different SMS samples graded 37.5 to 40.4% Fe. Similar procedures used on MQV sample produced a pyrite concentrate of 9.3% Fe and 26.1% Zn.
• A few procedures to reduce mercury content in the flotation concentrates were evaluated, although limited documentation remains. One procedure evaluated a polysulphide leach procedure on both the lead and zinc concentrates, using a 4% sodium sulphide/2% sodium hydroxide (NaOH) solution. The results reduced mercury levels in the concentrates by ~16%. A second procedure used sodium cyanide (NaCN) resulting in reducing mercury content by 23%, to 5 g/l, in the lead concentrate. Residue from the zinc concentrate showed no reduction in mercury levels using NaCN. A later scoping study heated the zinc concentrate to 750°C to volatilize mercury. Results showed the mercury content was significantly reduced from 1,988 to 155 ppm on MQV zinc concentrate, and from 477 to 157 ppm Hg for SMS concentrate. A more thorough review of the options was reported by Thibault and Associates Inc. in a report issued to NorZinc on February 5, 2015.
• Hydrometallurgical procedures have been performed on the zinc concentrate in large part due to the elevated mercury content that results in potentially significant smelter penalty charges. This has included pressure oxidation procedures which are used commercially in other operations worldwide. A report by Dynatec Corp. dated October 2002 indicated that ~98% zinc dissolution could be expected with the mercury remaining in the residue. The pregnant zinc solution would then be recovered by solvent extraction – electrowinning (SX-EW). However, due to significant capital costs, as well as some processing complications including loss of silver credit the program has not been followed up. Preliminary bioleaching was performed on the zinc concentrate by GMR in 2015 with some success. However, there are no comparable commercial plants and operating costs are deemed to be excessive due to the high power requirements for extended periods to achieve dissolution of sphalerite.

Prairie Creek Page 1 07
NI 43-101 Technical Report on Preliminary Economic Assessment October 15, 2021
13.2.10 Flotation Concentrate Characteristics
13.2.10.1 Lead Concentrates
The grade achieved in most of MQV sulphide lead concentrate produced is considered good, generally ranging from 55% to 70% Pb. The concentrates also contained, from 800 to 1200 g/t silver. Oxide lead concentrates from MQV gave significantly lower grade ranging from 38% to 57% Pb, with 300 to 430 g/t Ag. Impurity levels are significant, and of special concern are arsenic and antimony, which are potential penalty elements from the smelters. Mineralogical studies showed that arsenic and antimony are intimately associated with the copper minerals, which typically report into the lead concentrate. The analyses of the MQV lead concentrate generated from the bulk sampling zone are provided in Table 13-28 as follows.
Table 13-28: MQV Analyses of Sulphide and Oxide Lead Flotation Concentrates
Concentrate Sulphide Lead Concentrate Oxide Lead Concentrate
Test Program LR10916-001
LR11098-001 LR110
98 -002
KM
440 CSMR LR2252
LR10916-001
LR11098-001 LR110
98-002
Head Sample Comp 1 HLS 930
Comp
HLS 883
Comp
HLS M Comp
Comp * - Comp Comp Comp 1 HLS 930
Comp
HLS 883
Comp
HLS M Comp
Lead (Pb) % 63.3 70.9 69 71.5 70 67.5 54.3 54.3 44.2 50.5 50.8 56.5
Zinc (Zn) % 8.55 6 8.22 3.93 7.5 8.56 19.2 15.4 5.8 8.58 7.97 6.09
Copper (Cu) % 3.11 1.75 1.41 1.96 2.8 2.97 1.8 1.9 0.17 0.31 0.69 0.42
Iron (Fe) % 0.48 0.71 0.76 0.14 1 0.33 0.56 0.87 2.03 0.91 2.87 1.06
Cobalt (Co) % <0.02 <0.02 <0.02 <0.02 - <0.001 - - <0.02 <0.02 <0.02 <0.02
Arsenic (As) % 0.53 0.29 0.24 0.35 0.5 0.54 0.29 0.34 0.096 0.028 0.054 0.27
Antimony (Sb) % 1.43 0.94 0.67 1.09 1.2 1.4 - - 0.16 0.075 0.14 0.67
Tin (Sn) % <0.002 <0.002 <0.002 <0.002 - <0.01 - - <0.002 <0.002 <0.002 <0.002
Sulphur (S) % 14.3 13.1 14.1 12.9 - 16.6 - - 2.19 1.61 3.22 1.27
Carbon (total) % 0.43 0.34 0.53 0.17 - 0.39 - - 4.3 4.81 4.37 4.09
Germanium (Ge) g/t <4 <4.0 <4.0 <4.0 - - - <4 <4.0 <4.0 <4.0
Selenium (Se) g/t <10 <20 <20 <10 - <30 - - <15 <20 <20 23
Fluorine (F) % <0.005 <0.01 0.01 <0.01 - 0.024 - - 0.014 0.02 0.01 <0.01
Chlorine (Cl) g/t 303 210 105 90 - 1100 - - 47 450 30.3 52
Titanium (Ti) g/t 69 58 90 <40 - - - 220 308 150 90
Calcium (Ca) % 0.25 0.28 0.07 <0.04 - 0.082 - - 2.4 1.69 1.19 0.43
Magnesium (Mg) % 0.1 0.11 0.1 0.024 - - - 1.2 0.929 0.64 0.21
Manganese (Mn) g/t 31 30 60 <20 - 20 - - 130 170 160 70
Aluminum (A1203) % 0.1 0.18 0.4 <0.08 - 0.051 - - 0.42 0.73 <0.4 0.24
Silica (Si02) % 1.2 1.07 0.92 0.48 - 0.52 - - 12 8.41 9.49 6.07
Bismuth (Bi) g/t <400 20 <20 <20 - 100 - - <400 30 <20 <20
Cadmium (Cd) % 0.08 0.044 0.06 0.034 0.045 0.069 0.17 0.15 0.036 0.073 <0.09 0.047
Mercury (Hg) g/t 1120 550 810 562 550 830 360 360 660 40 310 936
Gold (Au) g/t 0.11 0.04 0.12 0.03 - 0.062 - - 0.06 0.13 0.06 0.05
Silver (Ag) g/t 1,246 791 815 1,034 1,100 1,126 737 813 374 309 297 438

Prairie Creek Page 1 08
NI 43-101 Technical Report on Preliminary Economic Assessment October 15, 2021
The grades of the lead concentrate from SMS were lower than those from MQV at about 55% Pb, with the levels of impurities also generally reduced. The grade range for metal payables and the principal impurity elements occurring in a SMS lead concentrate blend are shown in Table 13-29, with Comp. 2 actually being a 50:50 blend of SMS and MQV.
Table 13-29: SMS Analyses of Sulphide and Oxide Lead Flotation Concentrates
Concentrate Sulphide Lead Concentrate Oxide Lead Concentrate
Test Program KM462 LR10916-001 LR10916-001
Head Sample Comp* Comp 2** Comp 2 **
Lead (Pb) % 55 67 49.2
Zinc (Zn) % 5 7.32 4.82
Copper (Cu) % <0.1 2.64 0.6
Iron (Fe) % 15 1.89 1.5
Cobalt (Co) % <0.02 <0.02
Arsenic (As) % <0.01 0.42 0.091
Antimony (Sb) % 0.045 1.28 0.17
Tin (Sn) % <0.002 <0.002
Sulphur (S) % 15.9 0.79
Carbon (total) % 0.42 4.92
Germanium (Ge) g/t <7 <4
Selenium (Se) g/t <15 <15
Fluorine (F) % 0.005 0.009
Chlorine (Cl) g/t 449 592
Titanium (Ti) g/t 53 140
Calcium (Ca) % 0.42 3.2
Magnesium (Mg) % 0.18 1.6
Manganese (Mn) g/t 43 220
Aluminum (A1203) % 0.11 <0.075
Silica (Si02) % 1.1 9.2
Bismuth (Bi) g/t <400 <400
Cadmium (Cd) % 0.07 0.047
Mercury (Hg) g/t 40 676 56
Gold (Au) g/t 0.04 0.12
Silver (Ag) g/t 450 1,102 341
* Estimated concentrations by laboratory ** Blended sample (50% MQV and 50% SMS)
13.2.10.2 Zinc Concentrates
For both the MQV and SMS material the zinc sulphide concentrates ranged from 55% to 62% Zn, although much lower grades were evident for subsequent zinc oxide concentrates (when produced). There is also less iron, copper and some impurities such as mercury, arsenic and antimony should be closely followed with respect to concentrate marketability.

Prairie Creek Page 1 09
NI 43-101 Technical Report on Preliminary Economic Assessment October 15, 2021
Mineralogical investigation showed the mercury to be intermittently associated with zinc minerals. Concentrate from SMS showed lower mercury content, as did that in oxide zinc concentrates. Cadmium present in the MQV mineralization was also concentrated into the zinc sulphide concentrates. Average cadmium concentration would be expected to be in the range of 0.2% to 0.5% Cd. The analyses of the zinc concentrates are outlined in Table 13-30 and Table 13-31.
Table 13-30: MQV Analyses of Sulphide and Oxide Zinc Flotation Concentrates
Concentrate Sulphide Zinc Concentrate Oxide Zinc Concentrate
Test Program LR10916-001
LR11098-001 LR11098 -
002 KM440 CSMR LR2252
LR10916 -001
LR11098-001 LR11098 -002
Head Sample Comp
1
HLS 930
Comp
HLS 883
Comp
HLS M Comp
Comp *
- Comp Comp Comp
1
HLS 930
Comp
HLS 883
Comp
HLS M Comp
Lead (Pb) % 3.29 3.58 5.52 4.02 2.5 4.52 3.6 6.5 2.76 1.52 2.53
Zinc (Zn) % 61.3 61.7 57.8 60.1 58 - 60 58.1 55.5 31.4 30.4 31.1 32
Copper (Cu) % 0.17 0.25 0.26 0.31 0.4 0.36 0.4 0.71 0.41 0.26 0.54
Iron (Fe) % 0.36 0.56 0.81 0.36 1.2 0.77 1.12 1.49 0.73 1.26 1.08
Cobalt (Co) % <0.02 <0.02 <0.02 <0.02 0.001 <0.00
1 <0.02 <0.02 <0.02 <0.02
Arsenic (As) % 0.05 0.064 0.082 0.079 0.15 0.05 0.44 0.01 0.045 0.049 0.073
Antimony (Sb) % 0.04 0.065 0.07 0.12 0.14 0.105 - 0.16 0.075 0.067 0.11
Tin (Sn) % <0.00
2 <0.002 <0.002 <0.002 <0.01 <0.00
2 <0.002 <0.002 <0.002
Sulphur (S) % 29.4 29.9 27.8 30 29.8 0.42 0.31 0.39 0.28
Carbon (total) % 0.36 0.38 0.85 0.43 0.51 7.74 6.94 7.5 6.5
Germanium (Ge) g/t <4 <4 <4 6 2 <4 <4 <4 <4
Selenium (Se) g/t 14 <20 <20 <10 <30 14 28 <20 17
Fluorine (F) % <0.00
5 <0.01 0.01 <0.01 0.007 0.028 <0.00
5 0.02 0.03 0.02
Chlorine (Cl) g/t 144 63 80 57 400 171 101 69 58
Titanium (Ti) g/t 15 48 30 <40 50 260 270 270 300
Calcium (Ca) % <0.04 0.21 0.11 0.11 0.21 0.23 2.9 2.21 3.69 1.68
Magnesium (Mg) % 0.04 0.066 0.06 0.061 0.02 1.8 1.26 2.19 0.98
Manganese (Mn) g/t 47 60 110 70 60 440 430 530 400
Aluminum (A1203) % 0.07 0.13 <0.4 0.1 0.098 0.57 0.74 0.8 0.79
Silica (Si02) % 1.2 1.2 2.53 1.36 1 1.84 8.7 20.6 17.5 23.1
Bismuth (Bi) g/t <400 <20 <20 <20 <10 <400 <20 <20 <20
Cadmium (Cd) % 0.34 0.24 0.31 0.36 0.5 0.359 0.44 0.15 0.24 0.091 0.22
Mercury (Hg) g/t 2,330 1,520 2,200 2,730 3,500 2,200 1,270 373 20 220 477
Gold (Au) g/t 0.14 0.12 0.37 0.08 0.25 0.07 0.09 0.06 0.03
Silver (Ag) g/t 100 128 143 190 218 168 220 138 19 117
* Estimated concentrations by laboratory

Prairie Creek Page 1 10
NI 43-101 Technical Report on Preliminary Economic Assessment October 15, 2021
Table 13-31: SMS Analyses of Sulphide and Oxide Zinc Flotation Concentrates
Concentrate Sulphide Zinc Concentrate Oxide Zinc Concentrate
Test Program KM462 LR10916-001 LR10916-001
Head Sample Comp* Comp 2** Comp 2 **
Lead (Pb) % 1.0 2.02 2.71
Zinc (Zn) % 60 -63 59.3 34.1
Copper (Cu) % 0.15 0.14 0.54
Iron (Fe) % 2.0 3.02 1.51
Cobalt (Co) % < 0.001 <0.02 <0.02
Arsenic (As) % 0.02 0.04 0.06
Antimony (Sb) % 0.10 0.04 0.13
Tin (Sn) % - - <0.002
Sulphur (S) % - 31.6 0.38
Carbon (total) % - 0.27 8.20
Germanium (Ge) g/t 40 58 <4
Selenium (Se) g/t - <15 <15
Fluorine (F) % 0.009 <0.002 0.02
Chlorine (Cl) g/t - 118 109
Titanium (Ti) g/t 40 13.0 220
Calcium (Ca) % 0.11 1.9 3.9
Magnesium (Mg) % 0.02 0.07 2.4
Manganese (Mn) g/t - 56 640
Aluminium (A1203) % - <0.07 0.62
Silica (Si02) % 0.60 0.90 7.1
Bismuth (Bi) g/t - <400 <400
Cadmium (Cd) % 0.20 0.34 0.17
Mercury (Hg) g/t 900 1,740 56
Gold (Au) g/t - 0.12 0.12
Silver (Ag) g/t 78 83.2 145
* Estimated concentrations by laboratory ** Blended sample (50% MQV and 50% SMS)
13.3 2017 Test Program
The 2017 test program was performed through SGS Canada Inc., Mineral Services (SGS) at their Canadian facilities in both Burnaby, BC, and Lakefield, Ontario. The program was conducted in two phases for Canadian Zinc Corporation, now NorZinc. Phase 1 evaluated low oxide material, from deeper within the resource on samples obtained from a drill program conducted in 2015. The Phase 1 final report was issued by SGS in July, 2017. SGS Project 16016-001 Final Report: - Dense Media Separation, Comminution, Flotation and Solid-Liquid Separation on Samples for the Prairie Creek Project, Prepared for Canadian Zinc., July 28, 2017.

Prairie Creek Page 1 11
NI 43-101 Technical Report on Preliminary Economic Assessment October 15, 2021
This was followed by a second phase of testing, which consisted of blended material to note the flotation response that would better represent oxide content in the initial years of production. The Phase 2 SGS report was issued on December 4, 2017 SGS Project 16016-001 Final Report II: - Flotation of Oxidized Samples for the Prairie Creek Zinc Lead and Silver Project., December 4, 2017.
The primary objectives of the 2017 test program were to determine the mineral processing response of a more representative sample than what had been conducted from the 1980’s up until 2016. An additional objective at that time was to attempt to make use of the existing site infrastructure and equipment, along with the addition of Dense Media Separation (DMS) to the flowsheet.
Mineral processing testing was performed by SGS, primarily at their laboratory in Burnaby, BC. This included quantitative evaluation of minerals by scanning electron microscopy (QEMSCAN), grinding, flotation, and related studies. Procedures including DMS piloting, and liquid – solid separation, as well as some of the required analytical procedures were conducted at the SGS facility in Lakefield, Ontario.
The pre-concentration conditions were based on historical test work and were incorporated into the 2017 program. This consisted of crushing to 12.7 mm (1/2”) and screening fines at 1.4 mm (12 Tyler mesh). The -12.7 mm +1.4 mm material was subjected to DMS using a ferrosilicon media adjusted to SG 2.75. DMS sinks and the screened -1.4 mm fines were combined and forwarded to evaluation using various differential flotation procedures. Based on the grades of the 2017 lab samples there was insufficient oxide lead/zinc minerals or copper present to justify evaluating separate circuits for recovering these minerals. Consequently, the differential flotation procedures focussed on optimizing concentrating the galena and sphalerite. Follow-up settling and pressure filtration testing was performed on the final lead and zinc concentrates, as well as on the flotation tailing.
In January 2017, the Phase 1 program was initiated on samples representing previously untested zones of the resource. These consisted of deeper zones in the MQV and for STK material. The test work focussed on simplifying the historic lab flotation procedure, reagent scheme, and better optimizing the grind. At the conclusion of Phase 1 a modified flotation procedure had been developed.
Later in 2017 a second phase test program was conducted at SGS to evaluate a higher oxide feed content. This feed was considered more typical of what would be expected in the initial years of production. Representation for oxide content was based on the most recent available mine plan, which was correlated to lead oxide. Zinc oxide mineralization generally trended below that of lead. The mine plan that was referenced called for between 2% to 2.5% lead oxide during start-up and commissioning, which is expected to last 4-6 months. Following this, the first year of mill feed is anticipated to average on a monthly basis between 1.5% to 2% lead oxide, before dropping below 1.5% near the middle of year two. With some minor fluctuation, the oxide content of both lead and zinc after the initial period then generally decreases for the life of mine. The Phase 2 test work initially tested the earlier developed flowsheet, as well as additional modified oxide treatment procedures. As the Phase 2 program developed, it followed the similar flotation procedures developed during Phase 1.
13.3.1 Origin of Metallurgical Composite Sample
Three master composites originating from 2015 split drill core were primarily used for testing flotation procedures and flowsheet development in Phase 1. These composite identifications consisted of the STK, and two areas of greater depth in the MQV, broken out initially as upper MQV zone (MQV-H), and lower MQV (MQV-L) zone. The zones from which the samples were obtained are shown in Figure 13-4 below, and also show the bulk sampling areas of MQV and SMS that were used in historical test work.

Prairie Creek Page 1 12
NI 43-101 Technical Report on Preliminary Economic Assessment October 15, 2021
Figure 13-4: Sample Locations
Note: Figure prepared by NZC, 2021.
The drillhole number and corresponding weights of the intervals used to make up the master composites for Phase 1 are provided in Table 13-32 to Table 13-34.
Table 13-32: Master Composite Origin - STK
Drillhole ID From (m) To (m) Wt (kg)
PCU-15-52 114.5 115.5 2.67
PCU-15-52 115.5 116.5 2.43
PCU-15-52 117.2 118.3 1.95
PCU-15-52 120.3 121.3 2.71
PCU-15-52 121.3 122.3 2.32
PCU-15-52 129.2 130.2 3.29
PCU-15-52 132.6 133.6 2.56
PCU-15-52 133.6 134.6 2.57
PCU-15-52 135.7 136.6 2.24
PCU-15-52 136.6 137.7 3.14
PCU-15-52 137.7 138.7 2.52
PCU-15-52 149.1 150.6 2.62
PCU-15-52 150.6 152.1 1.82
PCU-15-52 152.1 153.5 1.75

Prairie Creek Page 1 13
NI 43-101 Technical Report on Preliminary Economic Assessment October 15, 2021
Drillhole ID From (m) To (m) Wt (kg)
PCU-15-52 173.0 174.0 2.93
PCU-15-52 176.8 177.9 3.06
PCU-15-52 193.8 194.6 2.58
PCU-15-52 194.6 196.0 3.73
PCU-15-52 196.0 197.0 2.71
PCU-15-52 210.0 211.0 2.11
PCU-15-52 214.5 215.5 2.83
PCU-15-53 124.7 126.2 3.49
PCU-15-53 126.2 126.6 1.11
PCU-15-53 130.8 132.3 3.56
PCU-15-53 132.3 133.8 4.25
PCU-15-53 149.2 150.2 2.96
PCU-15-53 150.2 151.5 3.69
PCU-15-53 151.5 152.5 2.36
PCU-15-53 152.5 153.6 2.39
PCU-15-53 153.6 154.7 2.49
PCU-15-53 160.9 161.3 2.33
PCU-15-53 161.3 162.9 2.76
PCU-15-53 162.9 164.3 2.86
PCU-15-53 173.4 174.4 2.09
PCU-15-53 174.4 175.4 3.08
PCU-15-53 175.4 176.4 2.67
PCU-15-53 176.4 178.0 3.96
PCU-15-53 189.0 190.0 2.68
PCU-15-53 190.0 191.5 3.55
PCU-15-53 191.5 193.0 3.72
PCU-15-53 193.0 194.0 2.67
PCU-15-55 126.2 127.9 2.36
PCU-15-55 131.6 132.3 1.47
PCU-15-55 139.9 141.0 2.60
PCU-15-55 141.0 142.0 2.43
PCU-15-55 142.0 143.0 2.88
PCU-15-55 144.0 144.8 2.75
PCU-15-55 144.8 146.0 2.50
PCU-15-55 146.0 146.7 0.88
PCU-15-55 146.7 148.0 3.26
PCU-15-55 148.0 149.1 3.09
PCU-15-55 149.1 149.9 2.00
PCU-15-55 149.9 151.1 3.20
PCU-15-55 151.1 152.0 2.47
PCU-15-55 152.0 152.9 2.03
PCU-15-55 152.9 154.1 2.96
PCU-15-55 154.1 155.0 2.36
PCU-15-55 155.0 156.0 2.51
PCU-15-60 138.4 139.4 2.54
PCU-15-60 139.4 140.4 2.88
PCU-15-60 144.4 145.4 3.80

Prairie Creek Page 1 14
NI 43-101 Technical Report on Preliminary Economic Assessment October 15, 2021
Drillhole ID From (m) To (m) Wt (kg)
PCU-15-60 145.4 146.4 2.76
PCU-15-60 158.5 159.5 3.10
PCU-15-60 164.6 165.7 3.08
PCU-15-60 165.7 166.7 3.04
PCU-15-60 166.7 167.7 2.80
PCU-15-60 167.7 168.7 2.72
PCU-15-60 168.7 169.7 2.92
PCU-15-60 169.7 170.7 2.78
PCU-15-60 170.7 171.7 2.62
PCU-15-60 171.7 172.7 2.36
PCU-15-60 172.7 173.7 2.46
PCU-15-60 173.7 175.0 3.16
PCU-15-60 176.5 177.5 2.96
PCU-15-61 182.9 183.9 2.56
PCU-15-61 184.6 185.6 2.10
PCU-15-61 185.6 186.5 2.26
PCU-15-61 186.5 187.3 1.92
PCU-15-61 187.3 188.4 2.70
PCU-15-61 188.4 189.2 1.84
PCU-15-61 189.2 189.9 1.60
PCU-15-61 190.6 191.2 1.42
PCU-15-62 146.1 147.1 2.38
PCU-15-62 151.5 152.2 2.20
PCU-15-62 154.1 155.1 2.16
PCU-15-62 157.0 158.0 2.56
PCU-15-62 159.7 160.6 2.38
PCU-15-62 176.0 176.7 1.50
PCU-15-62 176.7 177.5 2.02
PCU-15-62 203.9 205.1 3.28
PCU-15-62 205.1 206.2 2.62
PCU-15-62 206.2 207.2 2.68
PCU-15-62 207.2 208.2 2.94
PCU-15-63 143.5 144.5 2.44
PCU-15-63 147.4 148.4 2.54
PCU-15-65 133.3 133.9 1.62
PCU-15-65 133.9 135.0 3.90
PCU-15-65 187.4 188.4 3.00
PCU-15-68 153.6 154.6 2.84
PCU-15-68 154.6 155.6 2.10
PCU-15-68 155.6 156.7 3.10
PCU-15-68 158.0 158.8 2.22
PCU-15-68 159.9 161.1 3.54
PCU-15-68 161.1 162.2 4.12
PCU-15-68 163.3 164.1 2.26
PCU-15-68 164.7 165.8 3.42
PCU-15-68 165.8 166.8 3.12
PCU-15-68 173.4 173.9 1.32

Prairie Creek Page 1 15
NI 43-101 Technical Report on Preliminary Economic Assessment October 15, 2021
Drillhole ID From (m) To (m) Wt (kg)
PCU-15-68 173.9 174.9 2.34
PCU-15-69 139.1 140.1 2.58
PCU-15-69 140.1 140.9 2.28
PCU-15-69 140.9 141.7 1.48
PCU-15-69 141.7 143.0 3.18
PCU-15-69 159.0 160.0 2.70
PCU-15-69 160.0 161.0 2.78
PCU-15-69 162.8 163.8 2.96
PCU-15-69 163.8 164.7 2.16
PCU-15-69 166.3 167.3 3.06
PCU-15-69 170.9 171.9 3.10
PCU-15-69 173.5 174.5 2.38
PCU-15-69 182.6 184.1 4.16
PCU-15-69 186.0 187.0 3.00
Total = 323.8
Table 13-33: Master Composite Origin - STK
Drillhole ID From (m) To (m) Wt (kg)
PCU-15-52 104.50 107.50 7.36
PCU-15-53 101.80 106.38 9.84
PCU-15-55 120.61 123.25 6.68
PCU-15-60 96.23 100.28 4.04
PCU-15-61 117.04 118.57 2.02
PCU-15-62 98.50 99.80 2.52
PCU-15-62 179.70 185.65 12.06
PCU-15-63 114.94 117.55 5.44
PCU-15-63 159.85 162.35 5.18
PCU-15-65 114.00 117.04 7.46
PCU-15-65 211.80 214.88 6.26
PCU-15-66 127.41 131.98 8.18
PCU-15-68 144.48 149.05 9.24
PCU-15-69 122.38 133.55 27.98
PCU-15-69 190.00 203.06 38.94
PCU-15-71 160.57 169.04 21.64
PCU-15-72 191.40 200.74 31.40
PCU-15-72 263.69 268.68 8.58
Total = 214.8

Prairie Creek Page 1 16
NI 43-101 Technical Report on Preliminary Economic Assessment October 15, 2021
Table 13-34: Master Composite Origin, MQV-L
Drillhole ID From (m) To (m) Wt (kg)
PCU-15-54 166.04 176.70 11.57
PCU-15-56 326.27 332.71 15.12
PCU-15-58 213.58 214.58 3.21
PCU-15-58 301.45 307.54 15.05
PCU-15-59 367.00 371.60 15.30
PCU-15-64 275.54 284.68 15.04
PCU-15-66 191.00 196.44 10.42
PCU-15-67 349.82 357.53 15.40
PCU-15-70 150.90 155.33 11.08
PCU-15-70 266.09 271.50 10.40
PCU-15-71 248.65 252.02 8.04
Total = 130.6
Prior to testing the master composites an initial composite of assay rejects originating from both upper and lower zones of the MQV (MQV-AR) was generated in order to begin flotation scoping studies. Work was undertaken on assay rejects to preserve the limited master composite weight and to expedite the testing schedule while the master composites were subjected to DMS. The origin of the MQV-AR composite sub-samples is provided in Table 13-35.
Table 13-35: Origin of Composite MQV-AR
Drillhole Id From To Length (M) Source Zone Mqv- Weight (Kg)
PCU-15-53 101.80 106.38 4.58 H 9.84
PCU-15-55 120.61 123.25 2.64 H 6.68
PCU-15-58 213.58 214.58 1.00 L 3.21
PCU-15-60 96.23 100.28 4.05 H 4.04
PCU-15-61 117.04 118.57 1.53 H 2.02
PCU-15-63 114.94 117.55 2.61 H 5.44
PCU-15-63 159.85 162.35 2.50 H 5.18
PCU-15-66 191.00 196.44 5.44 L 10.4
PCU-15-68 144.48 149.05 4.57 H 9.24
PCU-15-69 122.38 133.55 11.17 H 28.0
PCU-15-69 190.00 203.06 13.06 H 19.5
PCU-15-70 150.90 155.33 4.43 L 11.1
PCU-15-70 266.09 271.50 5.41 L 10.4
PCU-15-72 263.69 268.68 4.99 H 8.58
Total = 133.6
Once flotation conditions on the master composites were set, further study included the response of three variability composites that were available from archived assay rejects. The variability samples all originated from the MQV zone. These consisted of composites with higher iron content (MQV-Fe), higher copper content (MQV-Cu), and variable lead oxide content (MQV-Pbox), as compared to the MQV master composites. As with MQV-AR, the three variability composites originated from assay rejects. As a result of the finer particle size of minus 3.6 mm this did not allow the assay rejects to be subjected to DMS. The origin of the sub-samples used to make up the variability composites is provided in Table 13-36 to Table 13-38.

Prairie Creek Page 1 17
NI 43-101 Technical Report on Preliminary Economic Assessment October 15, 2021
Table 13-36: Sample Origin – Composite MQV-Fe
CZN Sample ID AGAT Lab Sample ID Length (m) Weight (kg)
A512678 6734433 0.90 2.60
25428 6460962 1.00 3.21
25375 6412567 1.05 3.09
25371 6412563 1.22 2.50
25368 6412560 1.07 2.88
25437 6460971 0.75 2.17
25335 6412527 1.00 2.67
25334 6412526 1.00 3.08
25331 6412523 1.60 2.76
25408 6460942 0.98 2.88
25402 6460936 1.22 3.16
25387 6412579 0.96 2.96
25565 6581914 1.25 3.78
25564 6581912 1.08 3.32
25465 6461000 0.85 2.38
Total = 43.44
Table 13-37: Sample Origin – Composite MQV-Cu
CZN Sample ID AGAT Lab Sample ID Length (m) Weight (kg)
25424 6460958 1.51 4.46
25425 6460959 1.20 3.15
25423 6460957 0.78 2.39
25422 6460956 1.05 2.48
25421 6460955 0.55 1.95
25434 6460968 1.00 2.82
25467 6461002 1.00 2.95
25608 6461003 0.71 2.14
25464 6460998 0.75 2.70
25463 6460997 1.00 3.59
25461 6460995 0.99 3.12
Total = 31.75

Prairie Creek Page 1 18
NI 43-101 Technical Report on Preliminary Economic Assessment October 15, 2021
Table 13-38: Sample Origin – Composite MQV-Pbox
CZN Sample ID AGAT Lab Sample ID Length (m) Weight (kg)
25369 6412561 0.95 2.87
25283 6388823 1.40 1.75
25272 6388812 0.94 2.24
25273 6388813 1.06 3.14
25377 6412569 1.15 3.20
25554 6581902 0.86 2.38
25269 6388809 0.97 2.56
25268 6388808 1.00 3.29
25272 6388812 0.94 2.24
25264 6388804 1.00 2.32
25262 6388802 1.00 2.91
25460 6460994 1.00 3.34
Total = 32.24
For the Phase 2 test program the objective was to evaluate samples with a higher oxide content than Phase 1. It was composited to better represent material scheduled for the initial 3-5 years of production. This was blended from the pre-existing composites from Phase 1 shown above, with additional elevated sulphide oxidation. The higher oxide material was primarily obtained from the existing underground mine workings at the 930 level of crosscut 11. This material was obtained in May 2017 and assayed 286 g/t Ag, 16% Pb and 33.6% Zn. The oxide content was 3.68% Pb oxide and 2.37% Zn oxide. Further re-blending of this material with other assay rejects that were archived was also performed. Ultimately there were three master composite samples used in the Phase 2 test program. These were labeled as Comp. PB1, PB2, and PB3, to target a composite oxide lead content of 1%, 2%, and 3%, respectively.
13.3.2 Composite Head Characterization
The six master composites from both the Phase 1 and Phase 2 study originated from specific spatial zones and corresponding variations in head grade, oxide content and mineralogy from material both obtained near surface and at greater depth in the resource than those tested prior to that time.
The head assays to the crushing circuit for metal values, and other elements of interest including those potentially deleterious to the process or smelter terms are provided in the table below. These consist of the three master composites used in Phase 1, and three master composites in Phase 2 testing.

Prairie Creek Page 1 19
NI 43-101 Technical Report on Preliminary Economic Assessment October 15, 2021
Table 13-39: Master Composite Head Analyses
Sample ID
Phase Pb % Zn % Pb Oxide as Pb %
Zn Oxide as Zn %
Ag g/t Cu % Fe % S % S= % Hg g/t Sb g/t As g/t
STK 1 3.86 7.46 0.43 0.029 58.6 0.18 0.956 5.19 4.85 117 680 558
MQV-H 1 14.7 16 0.39 0.051 222 0.40 0.316 10.1 9.82 436 2050 949
MQV-L 1 5.9 4.74 0.39 0.017 84 0.18 2.33 5.66 5.42 162 917 552
PB1 2 10.6 11.5 1.01 0.51 160 0.26 0.85 7.46 7.20 287 1290 105
PB2 2 11.9 12.0 2.04 1.21 170 0.27 0.77 7.05 7.00 378 1220 121
PB3 2 12.3 12.1 3.11 1.86 170 0.29 0.72 6.87 6.58 471 1180 125
Composite grade variation included following the principal metals of value consisting of lead, zinc, and silver grades. Potential penalty elements reporting to the flotation concentrate, such as mercury, arsenic and antimony were analyzed. The variation in grade for potential detrimental minerals that can impact flotation response was also monitored. This includes iron (Fe) in relation to pyrite, and graphite as quantified by total organic carbon analyses (TOC). For the master composites these parameters were also re-analyzed following DMS treatment.
Similarly head assays for composites generated from assay rejects were analyzed and are provided in Table 13-40.
Table 13-40: Assay Reject and Variability Composites Head Analyses
Sample ID Pb % Zn % Pb Oxide as Pb %
Zn Oxide as Zn %
Ag g/t Cu % Fe% S % TOC
leco % Hg g/t Sb g/t As g/t
MQV-AR 10.8 11.6 n/a n/a 149 0.25 0.32 n/a n/a 246 1400 <1000
MQV-Fe 6.11 2.10 0.38 0.008 137 0.37 5.28 7.95 0.15 106 1660 159
MQV-Cu2 11.3 14.6 0.32 0.022 236 0.65 1.08 9.8 0.21 273 3070 145
MQV-PbOx 11.9 11.2 0.40 0.017 133 0.17 0.47 7.3 0.40 158 847 < 70
*n/a = not available
Mineralogical evaluation representing float feed for two of the master composites (MQV-H and STK) were performed by QEMSCAN. Note that this represents the material following rejection of majority of gangue minerals to the DMS float. The related information was issued by SGS on March 6, 2017. A synopsis of the results is provided below in Table 13-41 and Table 13-42 respectively for MQV-H and STK.

Prairie Creek Page 1 20
NI 43-101 Technical Report on Preliminary Economic Assessment October 15, 2021
Table 13-41: Mineral Distribution Float Feed MQV-H
Fraction Combined +75um -75um
Mass Size Distribution (%) 33.7 66.3
Calc. ESD Particle Size (µm) 21 85 16 Sample Sample Fraction Sample Fraction
Mineral Mass (%)
Sphalerite 30.6 12.9 38.2 17.7 26.7
Galena 16.3 3.40 10.1 12.9 19.5
Tetrahedrite 1.25 0.37 1.09 0.88 1.33
Pyrite 0.39 0.05 0.16 0.34 0.51
Other Sulphides 0.05 0.01 0.04 0.04 0.06
Quartz 12.6 5.08 15.1 7.47 11.3
Feldspars 0.17 0.04 0.12 0.13 0.19
Micas 2.77 0.58 1.73 2.19 3.30
Other Silicates 0.45 0.10 0.30 0.34 0.52
Dolomite 34.7 11.0 32.7 23.7 35.8
Calcite 0.39 0.12 0.37 0.26 0.40
Oxides 0.16 0.01 0.04 0.14 0.22
Other 0.18 0.02 0.05 0.16 0.24
Total 100.0 33.7 100.0 66.3 100.0
Table 13-42: Mineral Distribution Float Feed STK
Fraction Combined +75um -75um
Mass Size Distribution (%) 30.8 69.2
Calc. ESD Particle Size (µm) 20 86 15
Sample Sample Fraction Sample Fraction
Mineral Mass (%)
Sphalerite 15.0 6.00 19.5 9.03 13.0
Galena 5.51 1.37 4.44 4.14 5.98
Tetrahedrite 0.81 0.25 0.82 0.56 0.81
Pyrite 0.17 0.03 0.11 0.13 0.19
Other Sulphides 0.01 0.00 0.00 0.01 0.02
Quartz 10.5 3.96 12.9 6.54 9.45
Feldspars 0.49 0.15 0.48 0.34 0.50
Micas 5.44 0.98 3.18 4.47 6.45
Other Silicates 0.81 0.20 0.66 0.60 0.87
Dolomite 58.7 17.1 55.5 41.6 60.1
Calcite 1.99 0.68 2.21 1.32 1.90
Oxides 0.27 0.03 0.09 0.24 0.35
Other 0.30 0.04 0.13 0.26 0.38
Total 100.0 30.8 100.0 69.2 100.0
The results confirm MQV-H has significantly higher content of sphalerite and galena as compared to STK. The other main sulphide minerals present consist of tetrahedrite, followed by pyrite. The major gangue mineral remaining is dolomite. This is further represented in Figure 13-5, below.

Prairie Creek Page 1 21
NI 43-101 Technical Report on Preliminary Economic Assessment October 15, 2021
Figure 13-5: Modal Distribution Float Feed MQV-H and STK
Note: Figure prepared by SGS, 2017.
Size distribution of the major minerals is provided in Figure 13-6 and Figure 13-7, respectively for MQV-H and STK.

Prairie Creek Page 1 22
NI 43-101 Technical Report on Preliminary Economic Assessment October 15, 2021
Figure 13-6: Float Head STK Grain Size
Note: Figure prepared by SGS, 2017.
Figure 13-7: Float Head MQV-H Grain Size
Note: Figure prepared by SGS, 2017.

Prairie Creek Page 1 23
NI 43-101 Technical Report on Preliminary Economic Assessment October 15, 2021
Examination indicated that for both these master composites the galena and sphalerite particles showed good liberation, and the samples should respond well to standard flotation procedures at moderate grinds.
Further evaluation of physical characteristics of potential mill feed material was sent to Jenike and Johanson Laboratory in Mississauga, Ontario (Jenike). The material selected was described as a MQV blend of -6 mesh assay rejects, primarily consisting of sulphides in quartz veining and dolomite. The sample was observed to be free flowing (not appearing to be sticky) or have a high clay content or generate anomalous dust. Jenike advanced the material for basic physical testing including compressibility, flow function and wall friction.
Among the findings of the Jenike study was the tested material provided a 50% particle size distribution of 0.83 mm, and a moisture saturation of 10.6%. Further studies related to developing flow properties, including minimum chute outlet sizes, and mass flow wall angles at various moisture content, bulk densities, and materials of construction. The findings are presented in Jenike and Johanson Ltd.: - Report 70809-1 Rev. 1, Canadian Zinc Prairie Creek, NWT, Flow Property Test Results for Zinc Lead Silver Ore, July 28, 2017.
13.3.3 Dense Media Separation
DMS was performed on each of the Phase 1 master composites MQV-H, MQV-L and STK, using procedures that had been developed with previous metallurgical laboratory test work. DMS work was not performed on the Phase 2 samples which was limited by sample weight and focussed on the flotation circuit response to a higher oxide feed representing the initial years of the projected mine schedule. The Phase 2 samples were blended to represent projected grade of flotation feed, following DMS.
Sample preparation and DMS pilot testing was performed at the SGS facilities in Lakefield, Ontario. After crushing the split drill core to a nominal 12.7 mm (1/2”) crush, the fines were removed by screening at 1.4 mm. The minus 12.7 mm, plus 1.4 mm was pumped to the 200 mm Multotec cyclone at feed rates ranging from 185 kg/h to 223 kg/h. The DMS media incorporated ferrosilicon adjusted to SG 2.75. Ferrosilicon was subsequently recovered for reuse by magnetic separation. The DMS floats were removed as reject. The DMS sinks, were combined with the screened fines, and forwarded to further mineral testing procedures. A flowsheet of the DMS pilot plant circuit is provided, courtesy of SGS in Figure 13-8.
Figure 13-8: SGS Dense Media Pilot Plant
Note: Figure prepared by SGS, 2017.
Feed
preparation
Dense media
separationDrain Rinse
Medium
storageDensification
Medium
recovery
Floats
Snks
Floats
Sinks
Water sprays Water sprays
FeedFloats
Sinks
Feed
preparation
effluent
Medium
recovery
effluent
Density
measurement
Density
control
Water
addition
Media recovery circuit

Prairie Creek Page 1 24
NI 43-101 Technical Report on Preliminary Economic Assessment October 15, 2021
The DMS sink and pre-screened fines were then blended and the resulting product ground in a laboratory mill in 2 kg batches to be used for flotation feed. The separate DMS products consisting of the sink, and rejects (float), as well as the fines removed prior to DMS are provided for each of the master composites in Table 13-43.
Table 13-43: DMS Balance on Composite MQV-H
Product Wt (kg) Wt% Assay % Distribution
%Pb %Zn g/t, Ag %S %TOC Pb Zn Ag S TOC
DMS Sink 118.10 62.62 21.1 21.4 250.00 13.1 0.20 88.9 78.1 78.6 79.2 39.2
DMS Float 43.20 22.91 0.36 0.49 10.0 0.47 0.43 0.55 0.65 1.15 1.04 30.8
DMS Fines 27.30 14.48 10.8 25.2 279 14.1 0.66 10.5 21.3 20.3 19.7 29.9
DMS Sink+Fines 145.40 77.09 19.2 22.1 255 13.3 0.29 99.4 99.3 98.9 99.0 69.2
Head (Calc.) 188.60 100.00 14.9 17.2 199 10.4 0.32 100 100 100 100 100
Table 13-44: DMS Balance on Composite MQV-L
Product Wt (kg) Wt% Assay, %, g/t Distribution, %
%Pb %Zn g/t, Ag % S %TOC Pb Zn Ag S TOC
DMS Sink 67.0 53.3 8.49 6.20 139 7.58 0.11 56.0 59.5 59.1 64.3 34.0
DMS Float 31.7 25.2 0.27 0.30 10.0 0.63 0.22 0.84 1.36 2.01 2.53 32.2
DMS Fines 27.1 21.5 16.2 10.1 226 9.67 0.27 43.2 39.2 38.9 33.2 33.8
DMS Sink+Fines 94.1 74.8 10.7 7.32 164 8.18 0.16 99.2 98.6 98.0 97.5 67.8
Head (Calc.) 125.8 100.0 8.08 5.55 125 6.28 0.17 100 100 100 100 100
Table 13-45: DMS Balance on Composite STK
Product Wt (kg) Wt% Assay % Distribution
%Pb %Zn g/t, Ag %S %TOC Pb Zn Ag S TOC
DMS Sink 177.0 56.5 4.35 9.3 95.4 5.37 0.33 64.4 66.3 63.0 66.4 49.8
DMS Float 74.4 23.7 0.16 0.24 5.1 0.22 0.40 1.0 0.7 1.4 1.1 25.4
DMS Fines 61.9 19.8 6.67 13.30 154 7.50 0.47 34.6 33.0 35.6 32.4 24.8
DMS Sink+Fines 238.9 76.3 4.95 10.36 111 5.92 0.37 99.0 99.3 98.6 98.9 74.6
Head (Calc.) 313.3 100.0 3.81 7.96 85.5 4.57 0.37 100 100 100 100 100
The results show an excellent response of the three master composites to DMS. The combined fines with the DMS sinks averaged a recovery approaching 99% of the metal values, while rejecting close to a quarter of the feed mass prior to grinding.
13.3.4 Comminution
Abrasion (Ai) testing used for calculating grinding media consumption and liner wear rates were performed on the Phase 1 master composite sinks. The sinks were produced by heavy media separation with a media SG 2.75, on nominal 19 mm (¾”) material required for Ai testing. The two MQV composites were combined in a 50:50 weight ratio into a single Ai test head labelled as MQV-HL. STK was tested separately. The results gave an Ai of 0.205 g for the sinks produced from MQV-

Prairie Creek Page 1 25
NI 43-101 Technical Report on Preliminary Economic Assessment October 15, 2021
HL, and 0.108 g for STK. This would be considered relatively soft when compared to the SGS database as plotted in Figure 13-9 below.
Figure 13-9: Abrasion Index
Note: Figure prepared by SGS, 2017.
Comminution testing was limited by the particle size of the sample available. Each of the three Phase 1 master composite DMS sinks had a Bond Ball Mill Work Index (BBMWi) undertaken using a closing mesh size of 106 microns (150 Tyler mesh). Results are provided in Table 13-46.
Table 13-46: Bond Ball Mill Grindability Test Summary
Sample ID Mesh of
Grind F80
(µm) P80
(µm) Gram per
Revolution Work Index
(kWh/t) Hardness Percentile
Category
MQV-H (DMS sink) 150 2,485 81 1.41 13.9 45 Medium
MQV-L (DMS sink) 150 2,294 82 1.45 13.8 44 Medium
STK (DMS sink) 150 2,355 77 1.49 13.0 35 Moderately Soft
The work index range of 13 to 14 kWh/tonne for the three master composites is noted to be significantly higher than the historical work index test results. This is hypothesized to be due to potential differences in mineralogy, including a higher quartzite content from deeper areas of the resource and to a lower extent of sulphide oxidation and weathering.
The DMS sinks and -1.4 mm screened fines were combined to make up the flotation feed for each of the Phase 1 master composites. Each master composite float feed material, as well as the four assay reject composite blends had separate laboratory mill test grinds performed for estimating the various targeted primary grind sizes used in flotation, which is discussed in the following section.
0
10
20
30
40
50
60
70
80
90
100
0
50
100
150
200
250
300
350
400
450
500
550
600
0.0
5
0.1
5
0.2
5
0.3
5
0.4
5
0.5
5
0.6
5
0.7
5
0.8
5
0.9
5
1.0
5
1.1
5
1.2
5
1.3
5
>1.4
0
Cum
ula
tive F
req
uen
cy (%
)
Fre
quen
cy
Abrasion Index
Database
Prairie Creek

Prairie Creek Page 1 26
NI 43-101 Technical Report on Preliminary Economic Assessment October 15, 2021
13.3.5 Flotation
A series of flotation studies was performed to determine the response of composited mineral samples representing previously untested zones of the resource. In the case of the Phase 1 composites these had been pre-concentrated by the DMS procedures as discussed previously. The Phase 2 composites did not have DMS treatment as these were limited by the particle size distribution and weights of the sample. The Phase 2 composites were blended to more directly represent the targeted float feed blends (DMS sinks + fines).
The flotation studies consisted of:
• Open cycle Testing: With an initial objective to simplify the pre-2017 flotation flowsheet, including for reducing the reagent requirements, as well as using a coarser grind. Optimization was followed by final confirmation open cycle testing.
• Variability Testing: Composites were generated containing variable head characteristics which included increased iron content, increased copper content and a variable oxide content to note their response to the optimized float procedure.
• 10kg Batch Studies: Larger scale 10 kg batch tests were undertaken on a global mix of primarily the Phase 1 master composite DMS sinks and fines. The testing was performed to generate concentrate for smelter terms and tailing paste backfill testing undertaken by other parties. Minor variation in reagent addition was investigated when undertaking these procedures to better optimize a recommended dosage.
• Locked Cycle Testing: Three tests were initially performed to better confirm the optimized open cycle response on the DMS product (sink + fines) of the Phase 1 master composites. To best represent the average grade of silver, lead and zinc in the resource the MQV-H and MQV-L were combined in a 50:50 weight ratio, labelled as MQV-HL. STK was tested as a separate resource zone. An additional fourth locked cycle test was performed on Comp. PB2 to represent the higher oxide feed expected during initial production.
Bench scale work including variability and locked cycle testing used 2 kg batch samples in a Denver D12 float machine at typically 33 wt.% slurry feed. Standard procedures consisted of depressing sphalerite and floating galena, followed by reactivating the sphalerite to produce a separate zinc sulphide concentrate. Flotation cleaning was accomplished in typically three stages. Following evaluation of regrinding, it was employed for the rougher lead concentrate prior to cleaning. No regrinding was used prior to cleaning zinc. A more detailed summary of the procedure and corresponding results of each set of tests are provided below.
13.3.5.1 Open Cycle Flotation Optimization
The Phase 1 portion was used to establish the optimized procedures. The initial scoping flotation procedures were performed on the MQV-AR composite to first repeat historic methods and to determine response. This moved to modifications including testing of new reagents and a more simplified cleaning circuit with less recycle streams. Test conditions initially used the historic 80% passing particle size (K80) primary grind of ~80 microns. Based on the initial eight tests a procedure was then undertaken to test on the master composite DMS products that better represented flotation feed.
The initial tests performed on the master composites suggested using a reduced reagent scheme consisting of zinc sulphate (ZnSO4) as a depressant, with the majority added in primary grinding. This was followed with a combination of two selective collectors produced by Solvay Corp. (A3418, A2410) that were used in the lead circuit. Sphalerite was reactivated with copper sulphate (CuSO4) in the zinc circuit conditioning step, with sodium isopropyl xanthate (SIPX) used

Prairie Creek Page 1 27
NI 43-101 Technical Report on Preliminary Economic Assessment October 15, 2021
as the collector. Lime was typically used to modify pH generally evaluated at a range of 8 to 9.5 in the lead roughers, and at up to pH 10.5 in the lead cleaners. The pH in the zinc circuit was maintained at approximately 11, increasing up to 11.5 during cleaning. The pH was adjusted later in the study to correspond with iron control and depended on pyrite content of the feed. Use of soda ash as a modifier was also investigated and might be preferential for feeds with higher oxide content.
Initial optimization of the master composites continued with primary grinding evaluation. Primary grind product particle size included starting with a targeted K80 of 85 microns, based on historical work. This grind would have required major modifications and/or addition to the existing site grinding circuit, especially with the increasing hardness of the ball mill work index that was indicated as mining depth increased. Consequently, the test work proceeded at evaluating coarser grind sizes that could more easily be accommodated with modifications to the existing circuit, continuing up to K80~156 microns. The K80 156 micron was selected based on modeling in 2017 by Ausenco which indicated the existing refurbished mill could accommodate this grind at 1200 tonnes / day throughput, assuming a BBMWi of 13.9 kWh/tonne. Since then a higher throughput is envisioned, which would require the need of a redesigned grinding circuit.
The results of the primary grind testing are provided in Table 13-47.
Table 13-47: Primary Grind vs Float Response
Comp. Prim Grind Pb Bulk 2nd Pb Conc. 2nd Zn Conc. Final Tail Grade
ID K80 u Rec. (%) % Rec % Pb % Rec % Zn %Pb %Zn
MQV-H 83 97.2 91.3 61.0 67.9 64.7 0.78 2.0
MQV-H 103 95.8 92.1 57.5 69.7 63.7 0.37 1.23
MQV-H 139 97.8 91.0 54.3 67 62.3 0.57 1.24
MQV-L 77 98.3 90.9 55.3 68.9 47.4 0.14 0.12
MQV-L 100 97.6 91.3 52.6 71.7 42.0 0.17 0.14
MQV-L 130 97.2 91.3 45.4 67.3 43.5 0.37 0.19
STK 85 91.4 70.5 51.4 85.2 67.2 0.28 0.15
STK 107 94.2 59.8 45.6 86.1 66.4 0.18 0.11
STK 135 95.5 82.6 42.6 87.1 63.3 0.13 0.17
The grind data indicates that a significantly coarser primary grind from that used in most of the historical test work could be applied. The bulk lead concentrate prior to cleaning showed consistent grades as did the final tailing. A lower zinc concentrate grade for MQV-L is attributed to the higher iron content (pyrite) in the feed. This was subsequently partially offset with increased lime addition. More detailed examination of the data showed the mass pull was not significantly affected within the range of the particle size distributions of the float feed that were studied. Silver recovery tended to follow that of lead. The trend while variable showed the final concentrate lead and zinc grades to be relatively static. There was some degradation of zinc recovery, and final lead concentrate grade at the coarsest primary grind, as indicated below in Figure 13-10 and Figure 13-11, respectively for composites MQV-H and MQV-L. This was attributed to minor liberation issues between galena and sphalerite prior to the first lead cleaner that should be assisted by regrinding the bulk lead concentrate if the coarser primary grind is employed.

Prairie Creek Page 1 28
NI 43-101 Technical Report on Preliminary Economic Assessment October 15, 2021
Figure 13-10: Grind vs MQV-H Recovery
Note: Figure prepared by SGS, 2017.
Figure 13-11: Grind vs MQV-L Recovery
Note: Figure prepared by SGS, 2017.

Prairie Creek Page 1 29
NI 43-101 Technical Report on Preliminary Economic Assessment October 15, 2021
The data suggested that a coarser grind than historically used can be accommodated with minimal effect on flotation response, if regrinding of the lead rougher concentrate is used to assist in improving the final lead concentrate grade. A follow-up examination on a coarser grind of K80 ~156 µ, along with a brief polish regrind was performed on combined MQV material labelled as MQV-HL. This material consisted of a 50% ratio of MQV-H, blended with an equal weight of MQV-L (50:50 ratio). A similar test was performed on STK, and the results provided in Table 13-48.
Table 13-48: Primary Grind (with regrind) vs Flotation Response
Comp. Prim Grind Pb Bulk 3rd Pb Conc. 2nd Zn Conc. Zn Ro. Tail Grade
ID K80 u Rec. (%) % Rec % Pb % Rec % Zn %Pb %Zn
MQV-H+L 109 97.7 88.5 67.3 74.0 64.8 0.36 0.34
MQV-H+L 156 96.1 90.2 63.3 74.4 63.2 0.64 0.63
STK 107 93.8 64.8 58.6 84.9 64.0 0.22 0.12
STK 156 91.6 65.0 60.1 83.3 63.8 0.27 0.21
If a brief regrind is incorporated with the coarser primary grind of K80 ~156 µ, then the results as compared to the K80 ~110µ grind, still show some degradation to float response. Further study showed why this might be expected, as shown in Table 13-49.
Table 13-49: Comp MQV-HL Lead Rougher Float Kinetic Response
Stream Retention Size Grade of Concentrate Distribution (%)
Minutes K80 u Pb Zn Fe mass Pb Zn Fe
Float Feed - 156 12.1 12.9 1.73 100 100 100 100
Pb Ro #1 Con 6 74 54.8 5.2 1.91 19.9 89.7 8.0 21.9
Pb Ro #2+3 Con 6+6 54 9.18 12.1 3.63 7.7 5.8 7.2 16.2
Pb Ro. Tail - 202 0.74 15.1 1.48 72.4 4.4 84.8 61.9
The lead rougher concentrate was shown to be considerably finer than the corresponding ball mill product likely owing to a softer work index of the galena, as compared to the gangue minerals. Consequently, this resulted in the tailing having a coarser particle size distribution as shown from the K80 when compared to the primary grind. The initial lead rougher (Pb. Ro1) concentrate also had a coarser K80 as compared to the later portion (Pb Ro. 2+3), indicating the flotation kinetics could be hindered by overgrinding. Most of the lead was shown to report to the bulk float concentrate in the first 6 minutes. A coarser grind is also supported by the galena / sphalerite liberation particle size as outlined in the QEMSCAN data, previously presented.
Further effect on the primary grind on MQV is provided in the locked cycle testing discussed below.
13.3.5.2 Variability Flotation Testing
Variations to the optimized open cycle float procedure were undertaken to address specific characteristics of each of the major composites in both the Phase 1 and Phase 2 studies. Among the observations was that Comp. MQV-H having the higher grade required slightly extended retention times, although retention time was generally kept consistent for all open cycle tests. MQV-H also appeared to require additional collector suggesting further reagent optimization might be available to lower grade flotation feed material. Other factors showed that feed material with higher pyrite (MQV-L) as quantified by iron content, or higher graphite content (STK) as measured by total organic carbon (TOC) analyses required a more specialized approach. As the extent of oxidation increased the response to the optimized Phase 1 flowsheet was more

Prairie Creek Page 1 30
NI 43-101 Technical Report on Preliminary Economic Assessment October 15, 2021
challenged. Attempts to improve overall lead recovery by addition of oxide lead flotation following sphalerite flotation produced low concentrate grade within the 1% to 3% lead oxide content of flotation feed.
The presence of graphite can cause excessive froth in the lead circuit. This can result in excessive reagent consumption and challenges in forwarding a heavy stiff concentrate with each cleaning stage. In addition, extra stages for reagent application can be necessary and ultimately a lower final lead concentrate grade results due to dilution from the graphite content. This was especially true if the graphite to lead ratio increased as evident in the STK master composite. A carbon pre-float was tested but resulted in unacceptable losses of metal values. The use of a graphite depressant A633, distributed by Solvay Corp. was then evaluated and worked well. The results on STK with A633 are compared to a similar test without using the depressant in Table 13-50.
Table 13-50: STK – Lead Flotation Response to Graphite Depressant (A633)
A633 3rd Cl. Pb Conc Grade Pb 3rd Cl Conc Rec. 2nd Cl Zn Conc
g/t %Mass %Pb Ag, g/t %Zn %TOC %Pb %Ag % Zn %Zn Rec.
None 5.2 60.1 1452 2.1 2.1 65.0 83.0 63.8 83.3
250 5.2 70.5 1554 2.5 0.39 78.7 85.4 65.3 82.8
Although the reagent addition was not optimized the results show both recovery and grade of the lead concentrate improved by the addition of A633. The zinc concentrate grade improved slightly with a stable recovery.
The open cycle results also showed that higher pH using lime as the modifier assisted with pyrite depression to improve the grades of both the lead and zinc concentrates. This is well documented in mineral processing literature and was shown to be particularly evident for MQV-L, which had the highest iron content of the three master composites.
Further variability testing included replacing lime with soda ash, as a pH modifier. This was evaluated as lime (calcium ions) may inhibit flotation of lead oxide. Based on historical test work oxide lead flotation is anticipated to be incorporated for feeds earlier in the mine life that have a higher oxide content. While high oxide feed was not available for the 2017 Phase 1 test program the use of soda ash was evaluated as an alternate pH modifier, with results shown in the following table. Also included in the following table is the response from three separate variability composites that were evaluated to compare variation in their feed characteristics to the master composites. These variability composites were blended from assay rejects that were made available and outlined in composite origins discussed previously. Since the material was not subjected to DMS the feed had a higher ratio of gangue minerals. The variability samples included MQV-Fe, and MQV-Cu, which respectively contained a higher iron and copper content than any of the master composites. In addition, a test was performed on composite MQV-Pbox, which had a slightly elevated oxide lead content as compared to the other two variability samples.
The results of open cycle test work evaluating pH with respect to pyrite depression included varying the iron head grade, pH modification with lime, along with a single test using soda ash. This data is presented in Table 13-51 and Table 13-52, respectively for the response on the lead and zinc concentrates.

Prairie Creek Page 1 31
NI 43-101 Technical Report on Preliminary Economic Assessment October 15, 2021
Table 13-51: Lead Flotation Variability Response on Higher Iron Composites
Comp. Modifier pH range Calc Head Grade / Wt. Ratio Final Pb Conc % Rec. Final Pb Conc Grade %
ID Used Ro. Float Cleaners %Pb %Fe Fe:Pb Mass Pb Fe %Pb %Zn %Fe
MQV-HL Lime 9.0 10-10.5 12.4 1.7 0.14 17.6 90.2 17.2 63.3 4.76 1.7
MQV-HL Soda Ash 8.0 9-10 12.2 1.8 0.14 16.9 85.5 32.1 61.6 4.40 3.3
MQV-L* None 7.3 7.3 10.1 3.1 0.31 19.4 92.3 40.2 48.3 4.68 6.4
MQV-L Lime 10-10.2 10.1-11 10.0 3.1 0.31 15.1 89.7 18.6 59.2 5.65 3.9
MQV-Fe Lime 9.0 10.1-10.5 5.9 5.4 0.91 13.6 89.7 35.8 39.2 2.71 14.2
MQV-Fe** Lime ~10.3 10.4-10.8 5.6 5.0 0.90 11.9 88.9 27.9 41.6 2.85 11.4
*finer primary grind used; **collector & CuSO4 dosage decreased
Table 13-52: Zinc Flotation Variability Response on Higher Iron Composites
Comp. Modifier pH range Calc Head Grade / Wt. Ratio Final Zn Conc % Rec. Final Zn Conc Grade %
ID Used Ro.
Float Cleaners %Zn %Fe Fe:Zn Mass Zn Fe %Zn %Pb %Fe
MQV-HL Lime 11 11.2- 11.4 12.7 1.7 0.14 15.0 74.4 7.0 63.2 0.22 0.80
MQV-HL Soda Ash 10 10.5 12.8 1.8 0.14 14.9 74.5 5.4 64.1 0.33 0.64
MQV-L* None 11.2 11.6 5.9 3.1 0.53 9.2 67.5 27.0 42.8 0.51 9.1
MQV-L Lime 11 11.4 6.2 3.1 0.50 5.9 57.4 7.6 60.1 0.32 4.0
MQV-Fe Lime 11 11 - 11.1 2.2 5.4 2.4 5.8 57.6 27.3 21.8 0.72 25.3
MQV-Fe** Lime 11.1 11.6-11.9 2.0 5.0 2.5 4.6 68.0 14.0 30.3 1.82 15.3
*finer primary grind used; **collector & CuSO4 dosage decreased
The results suggest that higher pyrite (Fe) concentration can negatively impact concentrate grade, particularly as the ratio of Fe:Pb, or Fe:Zn increases. This can be countered to some extent with the use of lime to increase pH. Soda ash can be substituted for lime as a pH modifier prior to flotation of oxide lead providing iron content is moderate. Lime as the modifier should be used as pyrite content increases, but the effectiveness has upper limits and alternate procedures may need to be investigated. Further evaluation into checking into additional iron depressants and/or decreasing collector dosage and CuSO4 addition can be applied when galena or sphalerite content decrease in the feed with respect to the iron ratio.
The response of the variability composites MQV-Cu and MQV-Pbox are shown in Table 13-53.
Table 13-53: Lead Flotation Response – Phase 1 Variability Samples
Comp. ID Final (3rd Cl) Conc Recovery Final (3rd Cl) Conc Grade
Lead Conc. Lead Zinc Mass % Pb % Zn %Fe Hg, ppm
MQV-Pbox 79.3 1.2 12.2 76.3 1.1 0.15 104
MQV-Cu 88.4 4.6 15.6 62.8 4.4 1.25 306
Zinc Conc. Zinc Lead Mass % Zn % Pb %Fe Hg, ppm
MQV-Pbox 80.9 0.5 13.8 66.6 0.43 0.27 924
MQV-Cu 80.8 0.3 18.5 64.6 0.18 1.05 1030
Both MQV-Cu and MQV-Pbox responded well, and with a good comparison to the baseline testing done on the master composite DMS products. The MQV-Pbox composite was shown to still have too low an oxide content to sufficiently justify incorporating a separate oxide flotation circuit. Further variability evaluation of oxidized sample was conducted in Phase 2 on Comps. PB1, PB2, and PB3.

Prairie Creek Page 1 32
NI 43-101 Technical Report on Preliminary Economic Assessment October 15, 2021
The response to the optimized float procedure developed in Phase 1 was evaluated in Phase 2 using the higher oxide samples. The use of speciality reagents and sulphidization was evaluated during flotation of galena. Ultimately, other than a modest increase in collector dose depending on extent of oxidation and a slightly increased pH in the lead rougher float to pH 9.2 there were no significant changes to the sulphide portion of the flotation procedures. The response of the final open cycle testing incorporated for Comp. PB1, PB2 and PB3 is provided in Table 13-54.
Table 13-54: Oxide Composites Open Cycle Flotation Response
Comp Grind P80 (u) Calc. Head Rougher Rec.
(%) 3rd Cl Pb Conc. 3rd Cl Zn Conc. Final Tail Grade
ID Prim. Regrind %Pb %Zn Pb Zn % Rec %Pb % Zn % Rec %Zn % Pb %Pb %Zn
PB1 127 40 11.0 11.7 92.8 83.7 84.8 62.8 4.4 80.1 57.3 0.69 0.97 0.76
PB2 136 50 10.9 11.8 86.8 74.9 81.8 55.3 8.1 71.9 59.3 4.80 n/a n/a
PB3 126 47 11.4 11.7 79.1 71.9 73.3 61.4 7.3 68.1 57.3 1.39 n/a n/a
*n/a= not available as final tail (Zn Ro. Tail) used for lead oxide float testing
The data shows that for the less oxidized composite of up to 2% lead oxide the recovery losses of lead and zinc are manageable, although the final zinc concentrate grade does suffer slightly compared to the Phase 1 materials. For Comp. PB3 with 3.1% oxide lead the sulphide flotation response becomes more challenging. While the lead and zinc concentrate grades remain acceptable, the recovery losses increase by up to 10%.
As a means of improving total lead recovery, several oxide lead flotation schemes were evaluated including the previously optimized historical procedure, and modified methods that followed the sulphide zinc flotation. The modified procedures often use sodium isobutyl xanthate as collector in various combination with speciality collectors including from the supplier Solvay Ltd. These collectors included OX-100, as well as SQ4, typically with DF067 as frother. In most cases sodium sulphide (Na2S) was used for as a sulphidizing agent, and soda ash incorporated as a pH modifier.
The best results using the speciality reagents were, not surprisingly, were on the highest grade oxide composite sample PB3, which had a head grade of 12.3% total lead, of which 3.1% reported as oxide lead. This oxide content is above the highest one month mill head grade indicated in the mine plan. The current mine plan indicates the highest oxide content in mill feed occurs during commissioning and is provided approximately 2.5% Pbox. Using the separate lead oxide float circuit, the highest open cycle recovery to the oxide concentrate resulted in an additional 14% lead produced from Comp. PB3. This was providing that the froth was pulled hard by the technician. However, the corresponding lead oxide concentrate grade was only 20% with a 1:2 mass pull as related to the sulphide concentrate. When the two lead concentrates are recombined into a final lead concentrate, the grade would be such as it would be expensive to ship and difficult to market. The highest grade lead oxide concentrate for Comp. PB3 was 33% Pb, resulting in an additional 8.7% in improved lead recovery. Lower grade oxide feed samples showed decreasing grade and recovery relationships.
13.3.5.3 10 kg Batch Flotation
A final set of open cycle tests was undertaken during the Phase 1 program to produce enough product to provide concentrate samples to better establish smelter terms and to provide slurried tailing for paste backfill testing (not part of the metallurgical test program). The resulting products were also used for settling and pressure filtration studies performed at SGS Lakefield, Ontario (discussed below). As the products were needed to be kept wet final the mass balance (including middling analyses) was not performed, although assay splits were taken for each of the two final concentrates, and two tailing (Zn 1st Cl scavenger tailing; and Zn rougher tailing) produced for each test. The blend for the main feed consisted of master composite DMS sink, plus fines in a weighted percent of 49% MQV-H, 36% MQV-L and 15% STK which

Prairie Creek Page 1 33
NI 43-101 Technical Report on Preliminary Economic Assessment October 15, 2021
corresponds to a calculated float feed grade of 9.5% Pb, 10.6% Zn, 147 g/t Ag, 1.2% Fe, and 288 ppm Hg. Later additional float feed was generated to make up additional material for further concentrate and tailing characterization.
The 10 kg testing used a primary grind K80~135 µ. Lime was used as the pH modifier. Reagent addition initially followed those used in bench scale work (including for locked cycle), but dosage reductions were undertaken as the testing proceeded. The results indicated that the various collector dosages when compared to the 2 kg open cycle tests could be reduced by about 30% for average expected feed grades. Addition of the zinc sulfate depressant, and copper sulfate activator were also modestly reduced without apparent negative consequences to the float response. The required float retention time particularly during lead roughing were also observed to be less based on froth characteristics (i.e., color, mass pull). This is likely a result of changes in cell aeration with the larger 10 kg cells. Overall, the final concentrate grades appeared relatively consistent in the range of 55% to 65% Pb for the lead concentrate, and 60% to 65% Zn for the zinc concentrate.
13.3.5.4 Locked Cycle Flotation
The locked cycle testing was based on the flowsheet developed during the 2017 open cycle test program. Three locked cycle tests were performed in Phase 1 (LCT1, LCT2, LCT3) on the master composite DMS sinks plus screen fines, representing flotation feed. Two of the tests (LCT1, LCT3) were performed on MQV-HL, which was a 50:50 weighted blend of MQV-H and MQV-L. The blend was used to better represent average expected mill head grades for the MQV resource zone, representing the majority of mill feed for the LOM. The variation between the two tests was the primary grind. Another locked cycle test (LCT2) was performed on STK mineralization. A final locked cycle LCT 4, was performed in Phase 2 on Comp. PB2. This material represented the average feed expected during the initial three years of operation consisting of a higher oxide content, represented by 2% oxide lead, and the corresponding zinc and sulfur oxidation. Due to the lower oxidation content of the material, as compared to historic test work neither a lead nor zinc oxide float circuit was incorporated.
The locked cycle procedure was also simplified as compared to the historic flotation flowsheet, with less scavenging and middling recycling incorporated, as well as reduced reagent requirements. The float circuit consisted of separately cleaning a bulk lead and bulk zinc rougher concentrate. There is no lead or zinc rougher scavenger requiring recycle. The lead rougher concentrate is sent to a brief regrind prior to cleaning in three stages. Both the first cleaner lead and zinc scavenger concentrate are respectively combined with their second cleaner tailing back to the first cleaner. Six cycles for each test were incorporated for each LCT. The flowsheet used for locked cycle testing is provided in Figure 13-12, courtesy of SGS.

Prairie Creek Page 1 34
NI 43-101 Technical Report on Preliminary Economic Assessment October 15, 2021
Figure 13-12: Locked Cycle Flotation Flowsheet
Note: Figure prepared by SGS, 2017.
Both the STK and PB2 composites used an average K80 of ~135 µ. The remaining two locked cycle tests on MQV-HL were performed under similar conditions, with exception being the grind and cleaner float retention time used. Based open cycle studies the feed particle size of the locked cycle flotation feed was varied between LCT1 verses LCT3 on sample Comp. MQV-HL to note the variation in response. The lower and upper grind range (K80 ~110 to 156 µ) were used to represent potential differences in particle size due to changes in the ball mill work index at depth, and to assist with design evaluation.
The reagents scheme was developed during the open cycle study. However, dosages can be further optimized to suite head grade and mineralogical characteristics. Zinc sulphate (ZnSO4) was added as a sphalerite depressant, with the majority added in primary grinding. A graphite depressant A633 was added during lead rougher conditioning for STK, but not for MQV-HL. Any mill feed with an elevated Pb to total organic carbon (TOC) ratio would likely benefit from A633 addition. A3418, and A241 were used as collectors in the lead circuit. This was followed by reactivating the sphalerite with CuSO4 and using SIPX as collector in the zinc circuit. The pH modifier used was lime. For the locked cycle tests the targeted pH 9 was used in the lead roughers, increasing up to pH 10 during cleaning. The pH used in the zinc rougher circuit was approximately 11 increasing up to 11.5 in cleaning. STK had a lower iron content than MQV-HL and consequently did not increase the pH in cleaning. The pH is primarily used to depress pyrite and can be adjusted depending on iron content of the float feed.
Table 13-55 includes the calculated heads generated from the four tests, which compared reasonably well to the assayed head for the master composites. Also shown in the following table are the tailing analyses.

Prairie Creek Page 1 35
NI 43-101 Technical Report on Preliminary Economic Assessment October 15, 2021
Table 13-55: Locked Cycle - Calculated Head / Tailing Assay
Comp Test Calc. Head Grade Zn 1st Cl Tail Grade Zn Ro. Tail Grade
ID No. Pb, % Zn, % Fe, % Ag, g/t % Pb % Zn Ag, g/t % Pb % Zn Ag, g/t
MQV-HL LCT 1 12.2 13.3 2.4 176 1.38 1.21 17.2 0.81 0.80 12.0
STK LCT 2 4.73 9.64 0.38 90 1.07 0.76 14.0 0.20 0.17 2.1
MQV-HL LCT 3 12.4 12.9 1.7 185 1.08 0.98 15.3 0.58 0.46 5.7
PB2 LCT 4 11.0 11.4 0.51 152 3.49 2.64 33.0 2.16 1.59 20.1
The grind and regrind 80% passing particle size as represented by the K80, as well as the mass distribution from the final product streams are provided in Table 13-56.
Table 13-56: Locked Cycle – Mass Balance
Comp Test Grind Regrind Mass Distribution (%)
ID No. ~K80 µ ~K80 µ Pb Con Zn Con Zn 1st Tail Zn Ro. Tail
MQV-HL LCT 1 156 47 22.0 18.7 9.8 49.4
STK LCT 2 135 48 6.8 15.1 10.2 67.9
MQV-HL LCT 3 109 48 19.1 19.0 13.9 48.0
PB2 LCT 4 135 41 16.1 15.9 7.8 60.3
Based on the locked cycle results the material was shown to have responded well to produce stable concentrates at acceptable grades and recovery. The average of the final three cycles for the principal elements of interest reporting to the lead concentrate is summarized in the following Table 13-57.
Table 13-57: Locked Cycle – Lead Concentrate Assay and Recovery
Comp Test Pb Conc. Grade % Recovery
ID No. Pb, % Ag, g/t Zn, % Fe, % Pb Ag
MQV-HL LCT 1 52.5 762 6.3 2.42 94.5 91.7
STK LCT 2 61.7 1281 3.0 0.42 88.9 99.1
MQV-HL LCT 3 61.9 941 4.7 2.41 95.6 93.5
PB2 LCT 4 57.3 855 6.6 1.10 83.8 85.6
The first locked cycle performed on MQV-HL was conducted at the coarser grind. The results provided for a lower lead concentrate grade of ~53% Pb. For LCT3, which was done at a finer grind the grade to the final lead concentrate increased to ~62% Pb. However, this was thought to be at least partly due from too long a residence time during final cleaning in the initial test. This is supported by a corresponding high lead recovery of 95% in LCT1. Consequently, for LCT 3 while done at a finer primary grind the final lead cleaning retention time was also reduced, from 3 minutes to 2 minutes per cycle. This resulted in a concentrate grade recovery relationship more in line with the expected optimized open cycle data. Silver grade and recovery responded similarly with modestly improved grade and recovery for the LCT3 procedures, providing a silver recovery in the lower ninety percent range.
For STK (see LCT2) despite a lower head grade the lead concentrate grade and recovery relationship was roughly maintained. The findings based on the composite tested would indicate that the expected grade for the lead concentrate would be in the lower sixty percent range, with recovery in the upper eighty percent range. The STK silver grade achieved was 1280 g/t, with excellent recovery of 99%.

Prairie Creek Page 1 36
NI 43-101 Technical Report on Preliminary Economic Assessment October 15, 2021
Test LCT4 was performed on Composite PB2, which has a higher oxide content and better represents material during initial production. There is a corresponding drop in recovery in lead and silver recovery to the lead concentrate by 5-10% as compared to LCF 1 and 3. There is also higher zinc reporting to the lead concentrate, although the concentrate grade remains just above 57% Pb. The results show that sulphide oxidation can have a notable effect on lead float response.
Zinc concentrate grade and recovery from the locked cycle procedures is summarized in Table 13-58.
Table 13-58: Locked Cycle – Zinc Concentrate Analyses and Recovery
Comp Test Zn Conc. Grade % Recovery
ID No. Zn, % Ag, g/t Pb, % Fe, % Zn Ag
MQV-HL LCT 1 60.8 40 0.74 1.30 85.6 4.1
STK LCT 2 61.1 30 1.85 0.38 95.8 0.57
MQV-HL LCT 3 61.4 40 0.62 1.27 90.2 3.9
PB2 LCT4 58.0 53 1.31 0.65 80.6 5.3
Zinc concentrate could be expected to grade approximately 60% Zn, with about 30-40 g/t Ag, in samples with a lower extent of oxidation. Recovery for MQV-HL is slightly more variable depending on the primary grind in the 85% to 90% range depending on the process conditions used. STK achieved zinc recoveries approximately 5% higher than MQV-HL. As with the lead oxidation of the MQV sample with Comp. PB2, showed a drop in zinc recovery of up to 10% Zn.
13.3.6 Characterization of Flotation Products
In addition to the metals of value (Pb, Zn, Ag), there are other elements that are present which can impact smelter terms resulting in potential penalty charges, or that could affect acceptability of the concentrate. Most notably the deportment and concentration of mercury, antimony, arsenic, and other detrimental elements are relevant.
The lead and zinc concentrates produced from the locked cycle testing were subjected to detailed chemical characterization. Also included are the blended concentrates produced from the 10 kg batch floats on feed originating from the mixed MQV/STK feed, as outlined previously.
Table 13-59: Lead Concentrate Analyses
Element Comp. ID= MQV-HL STK MQV-HL PB2 10 kg Blends Test ID= LCT 1 LCT 2 LCT 3 LCT4 F10-1 to 20
Ag g/t 761 1288 889 927 939
As % 0.33 0.67 0.38 0.33 0.1
Bi ppm <20 <30 <20 <10 <20
C (total) % 2.31 2.38 1.35 2.07 1.01
Cd ppm 380 271 346 417 299
Cl % <0.005 <0.005 0.005 0.007 0.008
Cu % 1.5 3.7 1.9 1.7 2.0
F % 0.012 0.013 0.007 0.014 0.014
Fe % 2.37 0.43 2.37 0.84 1.00
Hg ppm 289 239 284 662 258
Pb % 54.3 61.7 62.9 61.1 63.6
S (total) % 13.6 11.4 14.0 13.4 12.8

Prairie Creek Page 1 37
NI 43-101 Technical Report on Preliminary Economic Assessment October 15, 2021
Sb % 0.76 1.27 0.70 0.61 1.01
TOC % 0.51 0.65 0.54 1.02 0.69
Zn % 5.98 3.05 5.25 5.64 4.09
Table 13-60: Zinc Concentrate Analyses
Element Comp. ID= MQV-HL STK MQV-HL PB2 10 kg Blends Test ID= LCT 1 LCT 2 LCT 3 LCT4 F10-1 to 20
Ag g/t 41 29 39 50 28
As ppm <200 <80 <100 119 <30
Bi ppm <20 <30 <20 <20 <20
C (total) % 0.38 0.69 0.33 0.97 0.48
Cd ppm 3390 3514 3557 221 3390
Cl % 0.008 0.012 0.008 0.027 -
Cu ppm 722 681 699 1270 545
F % 0.003 0.006 0.003 0.012 <0.005
Fe % 1.30 0.38 1.27 0.57 0.63
Hg ppm 1520 988 1530 1390 1400
Pb % 0.74 1.85 0.62 1.38 0.55
S (total) % 31.7 30.6 32.7 29.4 31.3
Sb ppm 170 <80 99 177 123
TOC % n/a 0.34 <0.05 0.22 0.12
Zn % 60.8 61.4 61.4 58.6 63.4
For the Phase 1 work, acid base accounting based on the Sobek method was performed on the zinc rougher tailing and provided a net modified neutralization potential of 634 tonnes equivalent CaCO3 per thousand tonnes of material. The corresponding total sulfur content was 2.7%S, 2.2% as sulphide S, with a 9.0 paste pH. Chemical analyses on the combined final tailing from the final cycle of LCT3, provided for 2.3% total S, 1.6% Fe, 479 ppm Cu, 59 ppm As, 80 ppm Sb, and 34 ppm Hg.
Various physical characterizations including particle size analyses (PSA), angle of repose, as well as solid and bulk specific gravity were determined for final blended tailing, and for each of the two final concentrates. The combined (final) tailing was produced by blending the Zn 1st Cl scavenger tailing; and Zn rougher tailing. The bulk SG moisture content were selected based on expected filter cake moisture content, with vacuum filter option assumed for the tailing and pressure filtration for the two concentrates. The products used for the characterization studies were produced from twenty 10 kg flotation tests discussed previously that were performed to generate the necessary material. The detailed data is presented in the May 2017 SGS report5. titled “Solid – Liquid Separation and Geotechnical Results”. The physical characteristics of the various products are summarized in Table 13-61.
Table 13-61: Float Product Physical Characteristics
Material Particle Size Analy. SG Bulk SG Moisture
wt.% Bulk SG (Kg/L) Angle Repose
K80, u <20 u (% vol) Dry Dry (assumed) @ % moisture Avg @ % moisture
Combined Tailing 148 12.3 2.83 2.83 13.0 1.627 46 degrees
Zn Concentrate 135 18.9 4.03 4.03 5.2 2.083 46 degrees
Lead Concentrate 46 62.5 5.75 5.75 6.6 2.887 39 degrees

Prairie Creek Page 1 38
NI 43-101 Technical Report on Preliminary Economic Assessment October 15, 2021
The lead concentrate had the finest particle size, due to the relative softness of galena, as well as the fact it was reground prior to flotation cleaning. This likely contributed to this product having the lowest angle of repose at 39 degrees and a higher pressure filter cake moisture content as compared to the zinc concentrate.
13.3.7 Settling and Filtration Studies
The lead concentrate, the zinc concentrate, and final tailing produced from the 10 kg flotation tests, and characterized as described previously above, were used for solid / liquid separation studies. The related work was conducted at SGS Lakefield and outlined in a report titled Liquid Separation and Geotechnical Results, dated May 24, 2017. The combined (final) tailing was produced by blending the Zn 1st Cl scavenger tailing; and Zn rougher tailing. The work included static and dynamic settling tests, as well as pressure filtration testing on all three materials. Vacuum filtration testing was also performed on the flotation tailing.
Initial scoping studies indicated the flocculant, Magnafloc 10, distributed by BASF worked well, improving settling characteristics. Depending on the material and conditions used improvements were observed at Magnafloc 10 dosage rates of 4 g/t to 15 g/t. The static settling results are provided in Table 13.3.31, with abbreviated data of the dynamic thickening provided in Table 13-62.
Table 13-62: Static Thickening Data
Sample I.D. Dosage
flocc’t g/t Feed1 %w/w
U/F2 %w/w Unit Area
m2/(t/day) ISR3
m3/m2/day Supernatant4
Visual TSS5 mg/L
Comb Zn Tailings 5 20 73 0.05 502 Clear <10
Zn Conc 4 25 81 0.05 657 Clear 11
Pb Conc 6 30 80 0.05 337 Clear 18 All values were calculated without a safety factor. Common conditions:Raked, ambient temperature. Magnafloc : BASF Magnafloc 10 flocculants. 1Diluted Thickener Feed. 2Final Underflow Density. 3Initial Settling Rate. 4Supernatant Visual Clarity after 30 minutes of elapsed settling time. 5Supernatant Total Suspended Solids (TSS) after 30 minutes of elapsed settling time.
Table 13-63: Dynamic Settling Data
Product Unit Area Solids Loading Net Rise Rate Underflow O/F - TSS Residence
Conditions m2/(t/d) t/m2/h m3/m2/d wt.% solids mg/L Time (h)
Combined Tailing 0.05 0.83 78.0 70.2 28 0.51
(10 g/t Magnafloc 10) 0.07 0.60 55.7 70.8 18 0.69
Feed @ 20 wt.% solids 0.09 0.46 43.3 71.0 13 0.89
Zinc Concentrate 0.04 1.04 72.5 79.7 74 0.58
(10 g/t Magnafloc 10) 0.05 0.83 58.0 79.3 47 0.73
Feed @ 25 wt.% solids 0.06 0.69 48.3 79.0 14 0.81
Lead Concentrate 0.05 0.83 57.0 80.8 17 1.04
(15 g/t Magnafloc 10) 0.07 0.60 40.7 81.4 18 1.45
Feed @ 25 wt.% solids 0.10 0.42 28.5 80.8 9 2.07

Prairie Creek Page 1 39
NI 43-101 Technical Report on Preliminary Economic Assessment October 15, 2021
The higher SG lead concentrate had the densest underflow at 80 wt.% solids, but with the longest residence time required. The data shows good settling characteristics for all three materials with high bed compaction and thickener unit areas calculated at 0.04 to 0.1 m2/(t/d) depending on the conditions used.
Testori P 6583 TC polypropylene cloth was selected for use in the various filtration studies, after conducting scoping tests using various filter cloths. The thickened tailing was subjected to vacuum filtration testing with the summarized data presented in Table 13-64.
Table 13-64: Vacuum Filtration Data
Sample I.D.
Filter Cloth
Operating Conditions Filter Outputs
Feed Solids %w/w
Vacuum Level,
inch Hg
Form Time, s
Dry Time, s
Form/Dry Ratio
Cake Thickness,
mm
2Throughout, dry kg/m2 h
Cake Moisture,
% w/w
Filtrate TSS
Cake Texture
Combined Zn Tails
Testori P6583
TC 70.0 20
14 1 11.50 53 21581 19.2 50 Wet
8 2 4.67 37 22446 18.6 68 Wet
8 5 1.75 37 17307 18.4 59 Wet
8 13 0.64 37 10545 16.2 57 Wet
8 40 0.21 38 4685 13.8 51 Wet
5 120 0.04 22 1031 9.7 49 1DTT
17 170 0.10 55 1739 12.4 30 DTT 1Dry to touch 2Examples of general filter throughout predictions versus test conditions using raw test data. Throughputs are calculated based on cycle time of form and dry only. Results are not for sizing of any specific type of filter. Refer to individual test results for additional sizing information.
The results provided for a cake moisture content varying from 9.7 wt.% to 19.7 wt.%. Depending on the vacuum filtration equipment used, a one minute dry time would be expected to give a cake moisture content of ~12 wt.%. Cake surface cracking, or cake-wall separation were not observed, and the cakes were reported to have a clean release from the cloth.
Pressure filtration was performed on each of the three materials with a synopsis of the results provided in Table 13-65.
Table 13-65: Pressure Filtration Data
Material Feed Pressure Form Dry Cake Troughput Filtrate Cake
wt.% solid bar Time (s) Time (s) Thick (mm) kg/m2 h (dry) TSS (mg/L) wt.% moist.
Tailing 70 4.1 3 43 30 3358 197 6.1
70 6.9 3 47 30 3684 85 6.1
Zinc 79 4.1 2 42 28 5488 164 4.3
79 6.9 1 48 30.5 5221 180 3.8
Lead 81 4.1 15 44 20 4322 95 6.7
81 6.9 15 81 25 3252 72 6.1
Overall, the results show good filter response with the lead concentrate having the finest particle size distribution (see Table 13.3.30, above) providing for a lower throughput, and with the highest cake moisture content. Generally, the throughput and residual moisture were reported to be relatively insensitive to pressure levels. Cake surface cracking or cake-wall separation was not observed, but typically the filter cakes left a thin layer of solids on the cloth.

Prairie Creek Page 1 40
NI 43-101 Technical Report on Preliminary Economic Assessment October 15, 2021
The water saturation level and porosity calculations were based on the moisture content levels that were targeted in the bulk density tests. The results are summarized in Table 13-66.
Table 13-66: Moisture Saturation and Porosity Calculation
Sample I.D.
Solids Content
(%)
Water Content
(%)
Wet Bulk Density (t/m3)
Dry Bulk Density (t/m3)
Density of Water at
20°C
(t/m3)
Solids Specific
Gravity, Gs
Porosity
N
Void ratio
e
Saturation Sr
Combined Zn Tailing
87.00 0.130 1.63 N/D 0.998 2.83 0.50 1.00 0.42
93.00 0.070 1.40 N/D 0.998 2.83 0.54 1.16 0.18
100.00 0.000 N/D 1.83 0.998 2.83 0.35 0.55 0.00
Zn Conc
94.80 0.052 2.08 N/D 0.998 4.03 0.51 1.04 0.21
100.00 0.000 N/D 2.64 0.998 4.03 0.34 0.52 0.00
Pb Conc
93.39 0.066 2.89 N/D 0.998 5.75 0.53 1.13 0.36
100.00 0.000 N/D 2.56 0.998 5.75 0.38 0.61 0.00
Where, Porosity, n = (void space, liquid & gas)/(total volume including solid) Void, e = (void space, liquid & gas)/(Volume of solid)
13.3.8 Projected Recovery
The DMS and flotation recovery projections made by Tetratech in 2016 were updated by Ausenco in 2019 incorporating more recent test data. Following an update to the mercury grades in the block model and using microprobe data of mercury content in sphalerite and tennantite/tetrahedrite minerals the mercury deportment models were again updated in 2021. The current recovery equations, include all of the aforementioned updates and are shown in the Table 13-67 and are described in Reference 6 (104367-RPT-RX-0001, Prairie Creek Project, Recovery Estimation Model Derivation and Update, Rev G, September 2021).
The following definitions are used in the equations to differentiate lead and zinc present as sulphide or oxide minerals. Al l other elements have only a ‘total’ assay.
• PbOx: lead in oxide form
• PbS: lead in sulphide form, not the compound lead sulphide
• PbT: total lead - i.e. lead in both sulphide and non-sulphide forms
• ZnOx: zinc in oxide form
• ZnS: zinc in sulphide form, not the compound zinc sulphide
• ZnT: total zinc - i.e. zinc in both sulphide and non-sulphide forms

Prairie Creek Page 1 41
NI 43-101 Technical Report on Preliminary Economic Assessment October 15, 2021
Table 13-67: DMS Plant Recovery Estimation
DMS Bypass in Fines
Fraction feed mass below 1.4 mm 20% of total feed tonnage
Pb Total Concentration Ratio =-0.0296*(Pb Feed grade, % + Zn Feed grade, %) + 1.9647
Pb Oxide Grade = 1.4302*(Pb Oxide Feed grade, %)
Zn Total Grade = 1.3262*(Zn Feed Grade, %)
Zn Oxide Grade = 1.2331*(ZnOx fraction in DMS feed, %)
DMS sink
PbS recovery in Sink =0.9173*LN(PbS Feed grade, %) + 97.052
PbOx recovery in Sink =0.1939*(total Pb feed, % + total Zn feed, %) + 88.781
ZnS recovery in Sink =1.539*LN(total Zn feed, %) + 94.923
ZnOx recovery in Sink =6.686*LN(ZnOx feed, %) + 79.139
Total Zn grade in Sink =1.3677*1.05(Zn grade with no fines)
NOTE: 1.05 factor added for PEA due to higher mine dilution
DMS Sinks Mass Pull calculated based on zinc assay & recovery
Combined DMS sink & fines fractions
Ag recovery in Combined DMS product =(PbT recovery, %) - 0.5
As recovery in Combined DMS product =100% from whole ore
Cd recovery in Combined DMS product =100% from whole ore
Cu recovery in Combined DMS product =100% from whole ore
Hg recovery in Combined DMS product =100% from whole ore
Sb recovery in Combined DMS product =100% from whole ore
Mercury Deportment in Flotation Feed
Mercury associated with Cu and Zn =Hg grade/(ZnT grade + 3.26*Cu grade)
Pb Flotation
Pb recovery to lead concentrate =99.31*(PbS/PbT); PbS and PbT are sulphide lead assay and total lead assay
Ag recovery to lead concentrate =1.0086*(Pb recovery to Pb concentrate, %)
As recovery to lead concentrate =Cu recovery to lead concentrate
Cu recovery to lead concentrate =-0.8315*(Pb rec to Pb con, %) + 1.713; cap at 95%

Prairie Creek Page 1 42
NI 43-101 Technical Report on Preliminary Economic Assessment October 15, 2021
DMS Bypass in Fines
Hg grade in lead concentrate =calculated from Cu and Zn grades and associated Hg
Sb recovery to lead concentrate =0.5301*(Cu rec to Pb con, % )+ 26.37
Lead concentrate grade =60% Pb, 7% Zn (to a maximum of 10% of the zinc)
NOTE: 60% used for PEA (typically target > 58%)
Zn Flotation
Zn recovery to zinc concentrate =MIN(91.31*(ZnS/ZnT),98 - (Zn rec to Pb con, %)); ZnS is the assay of zinc in sulphide form, while ZnT is the total Zn assay.
Ag recovery to zinc concentrate =MIN((Pb rec to Pb con + Pb rec to Zn con)*1.0771,98) -(Ag rec to Pb con, %); combined silver recovery between the cons is capped at 98%.
Cd recovery to zinc concentrate =(Zn rec to Zn con, %)
Hg grade in zinc concentrate =calculated from Cu and Zn grades and associated Hg
Zinc concentrate grade =58% Zn, 3% Pb
Using these equations the recoveries and grades of the value and deleterious elements into the lead and zinc concentrates has been calculated. These values, calculated using a mine plan dated August 16th 2021, are reported in Table 13-68 and Table 13-69.
Table 13-68: Overall Recovery Estimation
Mine Life Period Final Pb
Concentrate Final Zn
Concentrate
Mass Pull
(%) Pb Rec
(%) Ag Rec
(%) Mass Pull
(%) Zn Rec
(%)
First 5 years of mine life average 10.8 82.4 82.2 11.2 79.6
LOM average 9.5 86.5 86.8 13.3 85.7
Table 13-69: Estimated Concentrate Grades including Deleterious Elements
Mine Life Period Final Pb Concentrate Final Zn Concentrate
Pb (%)
Zn (%)
Ag (g/t)
As (%)
Cu (%)
Hg (g/t)
Sb (%)
Zn (%)
Pb (%)
Cd (%)
Hg (g/t)
First 5 years of mine life average
60 6.69 935 0.39 2.16 365 0.70 58 3.0 0.30 1529
LOM average 60 6.79 1090 0.57 2.68 437 1.01 58 3.0 0.33 1632
13.4 Summary
The 2017 metallurgical test program updated the preceding flotation studies to include additional mineral zones that had not previously been tested. This improved representation of the samples to better reflect the most recent mine plan. The 2017 study was successful in being able to establish a more conventional and simplified flotation flowsheet and reagent

Prairie Creek Page 1 43
NI 43-101 Technical Report on Preliminary Economic Assessment October 15, 2021
scheme than what had previously been proposed. The use of DMS was further supported by this most recent testwork. The revised flotation flowsheet eliminated some of the scavenging and recycle streams during differential flotation of galena and sphalerite and was able to justify increasing the particle size of flotation feed. An improved reagent scheme resulted in reducing the number of flotation reagents, as well as identifying readily available chemical products that are currently marketed by known suppliers. The metallurgical response of the 2017 work, as compared to earlier results, showed an improvement by having lower lead and silver values in the zinc concentrate, with most of the silver reporting to the lead concentrate. Mercury content remained elevated in the zinc concentrate and requires further verification to the mine plan. Alternate methods were also developed for variation in changing mill feed characteristics, particularly with respect to sulphide oxidation, as well as pyrite and graphite content.
In conjunction with the developing mine plan a more representative range of oxide minerals was tested in 2017. The oxide content of the plant feed was shown to be significantly lower than previously anticipated. Due to this lower extent of sulphide oxidation in the 2017 metallurgical samples being tested, there was no anticipated need shown for separate oxide flotation circuits. This was subsequently supported by an internal engineering trade-off evaluation relating to separate lead oxide flotation and reported by Ausenco in November 2017.
The overall process response of the Prairie Creek material shows good separation and yields of payable metals using conventional mineral processing applications. The data allows for recovery projections for lead and silver reporting into a lead sulphide flotation concentrate, and separately zinc reporting into a zinc sulphide flotation concentrate. The recovery model was developed by Ausenco in order to estimate payables, as well as potential detrimental elements, as related to the latest mine plan. Assuming a 60% lead concentrate grade, the average lead recovery is predicted at 82.4% during first five years of operation, increasing to 86.5% lead recovery for LOM. Correspondingly, most silver reports to the lead concentrate at a projected recovery of 82.2% during the first five years of operation at an average grade of 935 g/t Ag. For LOM the silver recovery increases to 86.8% into the lead concentrate, at a grade of 1090 g/t Ag. Assuming a 58% zinc concentrate grade, the average zinc recovery is provided at 79.6% during the first five years of operation, increasing to 85.7% zinc recovery for LOM. The lower recoveries in the first 5 years for Pb, Ag and Zn are attributable to higher oxide content on the ore.”

Prairie Creek Page 1 44
NI 43-101 Technical Report on Preliminary Economic Assessment October 15, 2021
14 MINERAL RESOURCE ESTIMATES
14.1 Introduction
The current Mineral Resource estimate is an update of the estimate in a Feasibility Study Technical Report dated 20 September 2017 and includes assay data from 47 samples and lithological data collected from three drillholes, PC-20-225, 226, and PC-21-227 that have been acquired since the previous estimate. As well, the historical database was audited and a number of corrections and additions were made, particularly with respect to mercury assays.
NorZinc provided wireframes of three mineral domains, surface topography and underground development, all in dxf format, together with drillhole locations, downhole surveys, assays and geology, all in csv format. Greg Mosher, P.Geo. of Global Mineral Resource Services completed the Mineral Resource estimate using Genesis software from SGS.
As received, minor overlaps existed between the STK and MQV and SMS and MQV wireframes. To avoid duplication of estimated resources in those overlapping volumes, the STK and SMS wireframes were clipped against the MQV wireframe so that the volume is attributed only to the MQV wireframe.
14.2 Exploratory Data Analysis
The Mineral Resource estimate is based on assays from all underground channel samples, surface and underground drill core collected by NorZinc since 1992.
The dataset contains data for 302 surface and underground drillholes of which 220, with an aggregate length of 60,849 m, constrain the three mineral zone domains (MQV = Main Quartz Vein, SMS = Stratabound, and STK = Stockwork), and 370 channel samples (1,283 aggregate metres) from the MQV and STK Zones. The 220 drillholes contain 3,280 assays of which 875 are contained within the MQV, 897 within the STK and 391 within the SMS domain. The channel samples contain 918 assays, of which 678 are within the MQV domain and 66 within the STK. Channel samples are from the MQV and STK Zones and were taken from the three underground levels: 970 mL, 930 mL, and 883 mL.
Plan and longitudinal views of the MQV, SMS and STK mineral domains are shown in Figure 14-1 and Figure 14-2. The underground channel samples are indicated on Figure 14-1.

Prairie Creek Page 1 45
NI 43-101 Technical Report on Preliminary Economic Assessment October 15, 2021
Figure 14-1: Prairie Creek Mineral Domains, Plan View
Note: Figure prepared by G. Mosher, 2021.

Prairie Creek Page 1 46
NI 43-101 Technical Report on Preliminary Economic Assessment October 15, 2021
Figure 14-2: Prairie Creek Mineral Domains Longitudinal View
Note: Figure prepared by G. Mosher, 2021.
Table 14-1 shows the number of assays or analyses available for each element of interest from channel and drillhole samples.
Table 14-1: Prairie Creek Assay Count by Channel and Drillhole Samples
Element Channel # DDH #
Ag ppm 894 3,279
As ppm 304 3,280
Cd ppm 918 3,166
Cu ppm 753 3,187
Fe % 287 3,195
Hg ppm 918 3,161
PbO % 681 2,422
Pb % 916 3,214
Sb ppm 290 3,280
ZnO % 751 2,454
Zn % 918 3,238

Prairie Creek Page 1 47
NI 43-101 Technical Report on Preliminary Economic Assessment October 15, 2021
A significant number of channel samples were not analyzed for mercury and cadmium, both of which are of metallurgical significance. To ensure that there were sufficient values for those elements in the area of the channel samples, missing analyses were replaced with regression values using the regressions Hg ppm = Zn ppm * 45.038 and Cd ppm = Zn ppm * 71.39.
Descriptive statistics for silver, lead and zinc from drillhole and channel sample assays and corresponding composites are presented in Table 14-2. Compositing is described in Section 14.4.
Table 14-2: Prairie Creek Assay and Composite Descriptive Statistics by Domain
MQV Assays Non-Zero Ag_ppm Pb_pct Zn_pct MQV Comps Non-Zero Ag_ppm Pb_pct Zn_pct
Mean 190 11.23 10.97 Mean 184 10.94 10.66
Median 132 8.61 7.2 Median 149 8.98 8.33
Mode 3 0.02 0.02 Mode 69 0.08 10.35
Standard Deviation 208 11.37 11.57 Standard Deviation 158 8.82 9.23
Range 1848 69.87 64.11 Range 968 49.02 47.9
Minimum 0 0.01 0.01 Minimum 0 0.01 0.02
Maximum 1848 69.88 64.12 Maximum 968 49.03 47.92
Count 1540 1548 1554 Count 762 764 763
STK Assays Non-Zero Ag_ppm Pb_pct Zn_pct STK Comps Non-Zero Ag_ppm Pb_pct Zn_pct
Mean 79 4.37 7.69 Mean 50 2.91 4.94
Median 21 1.13 2.53 Median 21 1.17 2.55
Mode 2 0.02 0.02 Mode 9 0.01 0.02
Standard Deviation 139 7.08 11.13 Standard Deviation 69 4.17 6.37
Range 1741 47.1 54.39 Range 658 31.95 36.94
Minimum 0 0.01 0.01 Minimum 0 0.01 0.01
Maximum 1741 47.11 54.4 Maximum 658 31.96 36.95
Count 962 945 951 Count 599 592 595
SMS Assays Non-Zero Ag_ppm Pb_pct Zn_pct SMS Comps Non-Zero Ag_ppm Pb_pct Zn_pct
Mean 56 5.59 10.08 Mean 51 4.95 9.96
Median 32 3.23 8.18 Median 37 3.9 8.91
Mode 3 0.07 0.04 Mode 13 4.85 6.55
Standard Deviation 79 7.11 9.44 Standard Deviation 47 4.37 6.81
Range 707 63.2 50.97 Range 238 22.6 29.91
Minimum 0 0.01 0.01 Minimum 0 0.02 0.03
Maximum 707 63.21 50.98 Maximum 238 22.62 29.94
Count 391 389 391 Count 185 185 185
Table 14-3 shows the correlation coefficients of silver, lead and zinc relative to a number of other elements for each of the three Mineral domains MQV, STK and SMS, as well as the underground channel samples.

Prairie Creek Page 1 48
NI 43-101 Technical Report on Preliminary Economic Assessment October 15, 2021
Table 14-3: Prairie Creek Mineral Correlation Coefficients
Element Ag Pb Zn
Ag MQV STK SMS MQV STK SMS MQV STK SMS
Ag 0.77 0.68 0.90 0.42 0.64 0.48
As 0.78 0.88 0.19 0.39 0.30 0.20 0.40 0.51 0.28
Cd 0.51 0.66 0.44 0.39 0.57 0.46 0.95 0.98 0.93
Cu 0.83 0.89 0.69 0.43 0.32 0.68 0.40 0.52 0.36
Fe -0.06 -0.02 0.10 -0.03 -0.02 0.12 -0.18 -0.09 0.37
Hg 0.56 0.59 0.29 0.42 0.48 0.33 0.80 0.81 0.75
PbO 0.45 0.45 0.60 0.39 0.57 0.69 0.12 0.42 0.57
Pb 0.77 0.68 0.90 0.33 0.55 0.49
Sb 0.87 0.89 0.63 0.47 0.33 0.61 0.40 0.52 0.08
ZnO 0.05 0.07 0.22 -0.03 0.03 0.24 0.16 0.13 0.63
Zn 0.42 0.64 0.48 0.33 0.55 0.49
The Mineral Resource estimate in the upper levels of the MQV and a small portion of the upper STK is supported by both channel and drill core samples; the estimation of grades in the balance of the MQV and STK zones is supported by drill core data only. The SMS Mineral Resource estimate is based on diamond drill core only.
14.3 Capping
Capping is the process of artificially reducing high values within a sample population that are regarded as statistically anomalous with respect to the population as a whole (outliers), to avoid the distorting influence these values would have on the statistical characteristics of the population if left at their full value. The risk in including atypically high values in a Mineral Resource estimate is that their contribution to the estimated grade will be disproportionate to their contribution to the tonnage, and therefore the grade of the Mineral Resource as a whole will be overstated.
The appropriateness of capping of high assay values was investigated by the construction of cumulative frequency plots of silver, lead and zinc assay values. None of the distributions displayed any discernible breaks in the plots suggestive of separate populations of high values and, therefore, no capping of assay values was considered warranted.
14.4 Composites
Compositing of samples is done to overcome the influence of sample length on the contribution of sample grade (sample support). Both drill core and channel samples were composited to a length of 2.5 m. Approximately 97% of the drill core samples and 98% of the channel samples are 2.5 m in length or shorter. Descriptive statistics of composites are presented in Table 14-2. Composites were constrained by domain boundaries (MQV, STK and SMS) and the last composite within a domain was discarded if it was less than 20% of the nominal composite length.
14.5 Bulk Density
For the current estimate, bulk density values were estimated on the basis of regression equations that were used for the 2007 and 2012 estimates. These equations were based on 231 measurements of drill core from the MQV made in 1998, and 54 measurements from sample pulps of SMS mineralization made in 2007; no measurements were made on samples from the STK and the regression equation used for the STK domain is the same as for the MQV. The equation for the MQV and STK domains is: (2.6466 + (Pb%*0.0339) + (Zn%*0.02) – (Fe%*0.02)). For the SMS domain, the equation is: (2.777 + ((Pb% + Fe%)*0.0413)).

Prairie Creek Page 1 49
NI 43-101 Technical Report on Preliminary Economic Assessment October 15, 2021
15.5.1 Geological Interpretation
NZC generated wireframe models for the three mineralized domains MQV, STK and SMS. These solids were reviewed for conformity to the lithological boundaries established by drilling and were observed to adhere to the lithological boundaries. The wireframe models were used as provided. The mineral domains are illustrated in plan and longitudinal vertical views in Figure 14-1 and Figure 14-2.
14.6 Spatial Analysis
Variography of composited values was carried out using Sage 2001 software. A range of lag distances was tested and 50 m was determined to be optimal with respect to maximizing the number of sample pairs used in the construction of the variogram. Consequently, all variograms and search ellipses were established on the basis of 50 m lag spacings. Separate variographic and search ellipse parameters were determined for each of the mineral domains MQV, STK, and SMS, and for each of the elements/compounds: silver, arsenic, cadmium, copper, iron, mercury, lead, lead oxide, antimony, zinc and zinc oxide. All models were one-structure spherical. Because of the paucity of data, variograms and search ellipses for the SMS domain were constructed using orientations and dimensions obtained from zinc variography. Table 14-4 contains the variography parameters and Table 14-6 contains the search ellipse parameters that were used in the estimate. The search ellipse dimensions were standardized to provide similar coverage for all elements. Note that the plunge is in the strike direction.
Table 14-4: Prairie Creek 2021 Variogram Parameters
Domain Element Nugget C₁ Strike (m) Cross-Strike (m) Dip (m) Azimuth (°) Dip (°) Plunge (°)
MQV Ag 0.684 0.316 200 35 28 13 84 -3
MQV As 0.61 0.39 200 74 57 18 61 7
MQV Cd 0.685 0.315 200 44 6 15 61 2
MQV Cu 0.769 0.231 147 98 77 4 82 -8
MQV Fe 0.357 0.643 200 77 29 338 82 3
MQV Hg 0.698 0.302 200 100 93 342 78 -10
MQV PbO 0.193 0.807 95 41 22 181 -23 67
MQV Pb 0.712 0.288 200 100 50 40 -53 34
MQV Sb 0.436 0.564 200 90 7 21 76 14
MQV ZnO 0.339 0.661 158 100 10 45 56 28
MQV Zn 0.564 0.436 185 75 7 24 -56 28
Domain Element Nugget C₁ Strike (m) Cross-Strike (m) Dip (m) Azimuth (°) Dip (°) Plunge (°)
STK Ag 0.755 0.245 200 77 41 341 45 24
STK As 0.751 0.249 200 100 5 356 90 0
STK Cd 0.658 225 200 100 6 325 90 0
STK Cu 0.775 0.231 200 53 14 304 78 10
STK Fe 0.283 0.717 69 35 11 310 -66 22
STK Hg 0.687 0.313 200 100 5 155 89 -1
STK PbO 0.53 0.47 197 79 17 7 -64 2
STK Pb 0.648 0.352 115 25 13 313 69 18
STK Sb 0.722 0.278 200 100 4 330 90 0
STK ZnO 0.427 0.573 200 13 12 2 90 0
STK Zn 0.177 0.823 130 76 6 319 -62 27
Domain Element Nugget C₁ Strike (m) Cross-Strike (m) Dip (m) Azimuth (°) Dip (°) Plunge (°)
SMS All 0.231 0.769 15 14 12 10 -5 2

Prairie Creek Page 1 50
NI 43-101 Technical Report on Preliminary Economic Assessment October 15, 2021
Table 14-5: Prairie Creek Search Ellipse Parameters
Domain Max Range Mid Range Min Range Azimuth (°) Dip (°) Plunge (°)
MQV 400 200 300 15 0 -15
STK 100 50 100 5 -10 -15
SMS 100 50 50 15 0 -15
14.7 Mineral Resource Block
Block model parameters are summarized in Table 14-6. A block size of width 2.5 m across strike, length 15 m along strike, and height of 10 m reasonably captures the mineralization distribution all three mineral domains.
Table 14-6: Prairie Creek 2021 Block Model Parameters
Dimension Number Size (m) Coordinates * Minimum Maximum
Columns 241 2.5 X 404 400 405 5000
Rows 169 15 Y 6 826 000 6 828 520
Levels 111 10 Z 0 1100
Rotation 15 Degrees Clockwise
Coordinates of Block Centroids * UTM NAD 83 Zone 10V
14.8 Interpolation Plan
Grades were estimated for silver, lead, zinc, arsenic, cadmium, copper, iron, mercury lead oxide, antimony and zinc oxide and were interpolated into the block model using ordinary kriging (OK).
For the MQV and STK domains, grades were interpolated into the block model in two passes. The first pass required a minimum of 24 composites within the volume of the search ellipse. The only area of the two domains that could meet this requirement is within the underground development in which channel samples were collected at nominal five-meter intervals, therefore this pass captured only composites from the channels. This approach was taken because the channels preferentially sampled mineralization and therefore are of higher average grade than composites from drillholes and if they were not constrained, they would potentially inflate the interpolated grades of blocks outside the areas that were preferentially sampled. For the second pass, a minimum of four composites within the volume of the search ellipse was required for a grade to be interpolated into a block, with a maximum of two composites coming from a single drillhole. Therefore, a minimum of two drillholes was required to interpolate a grade which ensured that continuity of mineralization was demonstrated. The maximum number of composites was set at 24 (12 drillholes). For the SMS domain, grades were interpolated in a single pass with the same parameters as the second pass for the MQV and STK domains.
14.9 Zinc Equivalency Formula
The Mineral Resource is stated using a zinc equivalent grade (ZnEq) as a cut-off that takes into account the economic contribution of silver, lead and zinc. The equivalency calculation, which expresses the combined value of silver, lead and zinc in terms of percent zinc, was calculated as follows:

Prairie Creek Page 1 51
NI 43-101 Technical Report on Preliminary Economic Assessment October 15, 2021
ZnEq% = (Grade of Zn in %) + [(Grade of lead in % * Price of lead in $/lb * 22.046 * Recovery of lead in % * Payable lead in %) + (Grade of silver in g/t* (Price of silver in $/Troy oz/ 31.10348) * Recovery of silver in % * Payable silver in %)]/(Price of zinc in $/lb*22.046 * Recovery of zinc in % * Payable zinc in %)
Metal prices were based on an assessment of three-year trailing averages and market forecasts and considering reasonable prospects for eventual economic extraction. Recoveries and payables were provided by NorZinc from internal studies. Parameters are summarized below in Table 14-7.
Table 14-7: Zinc-equivalency equation parameters
Item Units Value
Zn price $/Lb 1.15
Pb price $/Lb 1.00
Ag price $/Oz 20.00
Ag price $/g 0.64
Zn recovery % 0.815
Pb recovery % 0.843
Ag recovery % 0.951
Zn payable % 0.850
Pb payable % 0.948
Ag payable % 0.850
Metal prices in US$ 22.046 = pounds/metric tonne/% 31.10348 = grams/Troy ounce
14.10 Mineral Resource Classification
The Mineral Resource was classified as Measured, Indicated and Inferred. For a block to be classified as Measured, it was necessary that a minimum of 24 composites be located within the volume of the search ellipse. The MQV and STK domains contain Measured resources; in both, the Measured blocks immediately surround the underground development in which channel sampling was carried out.
For a block to be classified as Indicated, it was necessary that a minimum of 10 composites be located within the volume of the search ellipse.
For a block to be classified as Inferred, it was only necessary that a minimum of four composites be located within the volume of the search ellipse.
Table 14-8 shows the search ellipse orientations and dimensions used for resource classification.

Prairie Creek Page 1 52
NI 43-101 Technical Report on Preliminary Economic Assessment October 15, 2021
Table 14-8: Prairie Creek Resource Classification Search Ellipse Parameters
Domain Category Strike Cross-Strike Dip Azimuth (°) Dip (°) Plunge (°) Minimum Comps Maximum Comps
MQV Measured 85 35 50 15 0 -15 24 24
MQV Indicated 325 50 150 15 0 -15 10 24
MQV Inferred 400 200 300 15 0 -15 4 24
STK Measured 30 30 30 15 0 -15 24 24
STK Indicated 70 70 70 15 0 -15 10 24
STK Inferred 400 200 300 15 0 -15 4 24
SMS Indicated 60 60 60 15 0 -15 10 24
SMS Inferred 400 200 300 5 -10 -15 4 24 Ellipse Dimensions in Meters.
Figure 14-3 shows a longitudinal vertical view of the zinc-equivalent block grade distribution in the MQV domain; Figure 14-4, and Figure 14-5 show similar views for the SMS and STK Zones. Figure 14-6 shows the classification for the MQV Zone.
Figure 14-3: Zinc-Equivalent block grade distribution MQV zone
Note: Figure prepared by G. Mosher, 2021.

Prairie Creek Page 1 53
NI 43-101 Technical Report on Preliminary Economic Assessment October 15, 2021
Figure 14-4: Zinc-Equivalent block grade distribution SMS Zone
Note: Figure prepared by G. Mosher, 2021.

Prairie Creek Page 1 54
NI 43-101 Technical Report on Preliminary Economic Assessment October 15, 2021
Figure 14-5: Zinc-Equivalent block grade distribution STK zone
Note: Figure prepared by G. Mosher, 2021.

Prairie Creek Page 1 55
NI 43-101 Technical Report on Preliminary Economic Assessment October 15, 2021
Figure 14-6: Mineral Resource classification MQV domain
Note: Figure prepared by G. Mosher, 2021.
14.11 Mineral Resource Tabulation
Table 14-9 presents the Mineral Resource estimate for the three mineral zones MQV, STK and SMS, at a ZnEq cut-off of 8%. The upper portion of the table presents the mineral resources in each of the zones; the lower portion of the table shows the sum of those same mineral resources according to resource classification. Tonnes have been rounded to the nearest 1,000, Ag to the nearest g/t, and Pb and Zn to the nearest 0.1%.

Prairie Creek Page 1 56
NI 43-101 Technical Report on Preliminary Economic Assessment October 15, 2021
Table 14-9: Prairie Creek Mineral Resource Summary at 8% ZnEq grade Cutoff
Domain CutOff ZnEq % Classification Tonnes ZnEq % Ag ppm Pb % Zn %
MQV 8 Measured 903,000 30.3 206 11.2 12.9
MQV 8 Indicated 5,248,000 27.7 181 12.0 10.3
MQV 8 M & I 6,152,000 28.0 184 11.9 10.7
MQV 8 Inferred 3,849,000 31.4 207 8.4 16.7
STK 8 Measured 128,000 17.4 97 4.1 10.3
STK 8 Indicated 2,754,000 12.6 63 3.2 7.6
STK 8 M & I 2,883,000 12.8 65 3.2 7.7
STK 8 Inferred 2,187,000 12.7 67 4.0 6.7
SMS 8 Indicated 722,000 16.4 53 5.1 9.7
SMS 8 Inferred 367,000 15.4 47 4.4 9.6
TOTAL 8 Measured 1,031,000 28.7 193 10.3 12.6
TOTAL 8 Indicated 8,724,000 22.0 133 8.6 9.4
TOTAL 8 M & I 9,755,000 22.7 139 8.8 9.7
TOTAL 8 Inferred 6,403,000 24.1 150 6.7 12.9
Mineral Resources are stated as of 15 October 2021. Mineral Resources include those Resources converted to Mineral Reserves. Stated at a cut-off grade of 8% ZnEq based on prices of $1.15/lb for zinc, $1.00/lb for lead, and $20/oz for silver. Average processing recovery factors of 81.5% for zinc, 84.3% for lead, and 95.1% for silver. Average payables of 85% for zinc, 95% for lead, and 85% for silver. ZnEq = (grade of Zn in %) + [(grade of lead in % * price of lead in $/lb * 22.046 * recovery of lead in % * payable lead in %) + (grade of silver in g/t* (price of silver in $/Troy oz/ 31.10348) * recovery of silver in % * payable silver in %)]/(price of zinc in $/lb*22.046 * recovery of zinc in % * payable zinc in %). Numbers may not compute exactly due to rounding.
Table 14-10, Table 14-11 and Table 14-12 show the Mineral Resource estimates for the MQV, SMS and STK zones respectively for a range of ZnEq cut-offs and with the same rounding of tonnes and grades as for Table 14-9. It should be noted that the ZnEq average grade is relatively insensitive to the cut-off grade, with the exception of the STK Indicated and Inferred. At all cut-offs the ZnEq grade is significantly higher than 8% and therefore the use of a threshold grade has little impact on the total Mineral Resource. Note there are no Measured mineral resources reported for SMS. Base Case is highlighted.
Readers are cautioned that Mineral Resources that are not Mineral Reserves do not have demonstrated economic viability.

Prairie Creek Page 1 57
NI 43-101 Technical Report on Preliminary Economic Assessment October 15, 2021
Table 14-10: Prairie Creek MQV Domain Mineral Resource Estimate at a Range of Cutoff Grades
Domain CutOff ZnEq %
Classification
Tonnes ZnEq % Ag ppm Pb % Zn %
MQV 25 Measured 643,000 33.7 231 12.2 14.6
MQV 25 Indicated 3,349,000 32.3 206 13.7 12.5
MQV 25 M & I 3,992,000 32.5 210 13.4 12.9
MQV 25 Inferred 2,721,000 35.8 239 9.5 19.1
MQV 20 Measured 850,000 31.0 212 11.5 13.2
MQV 20 Indicated 4,408,000 30.0 195 12.9 11.2
MQV 20 M & I 5,258,000 30.1 197 12.7 11.6
MQV 20 Inferred 3,319,000 33.6 224 9.1 17.9
MQV 15 Measured 903,000 30.3 206 11.2 12.9
MQV 15 Indicated 4,940,000 28.7 187 12.4 10.7
MQV 15 M & I 5,843,000 28.9 190 12.2 11.1
MQV 15 Inferred 3,816,000 31.5 208 8.5 16.8
MQV 10 Measured 903,000 30.3 206 11.2 12.9
MQV 10 Indicated 5,153,000 28.0 183 12.1 10.4
MQV 10 M & I 6,056,000 28.3 186 12.0 10.8
MQV 10 Inferred 3,845,000 31.4 208 8.5 16.7
MQV 8 Measured 903,000 30.3 206 11.2 12.9
MQV 8 Indicated 5,248,000 27.7 181 12.0 10.3
MQV 8 M & I 6,152,000 28.0 184 11.9 10.7
MQV 8 Inferred 3,849,000 31.4 207 8.4 16.7
MQV 5 Measured 903,000 30.3 206 11.2 12.9
MQV 5 Indicated 5,279,000 27.5 180 11.9 10.2
MQV 5 M & I 6,182,000 27.9 184 11.8 10.6
MQV 5 Inferred 3,849,000 31.4 207 8.4 16.7

Prairie Creek Page 1 58
NI 43-101 Technical Report on Preliminary Economic Assessment October 15, 2021
Table 14-11: Prairie Creek SMS Domain Mineral Resource Estimate at a Range of Cutoff Grades
Domain CutOff ZnEq % Classification Tonnes ZnEq % Ag ppm Pb % Zn %
SMS 25 Indicated 20,000 26.8 89 9.4 14.7
SMS 25 Inferred 6,000 27.2 91 7.8 16.7
SMS 20 Indicated 126,000 22.7 75 7.4 13.0
SMS 20 Inferred 46,000 22.7 75 6.6 13.9
SMS 15 Indicated 459,000 18.8 62 6.0 11.0
SMS 15 Inferred 187,000 18.4 58 5.2 11.5
SMS 10 Indicated 683,000 16.8 55 5.3 9.9
SMS 10 Inferred 348,000 15.8 49 4.5 9.8
SMS 8 Indicated 722,000 16.4 53 5.1 9.7
SMS 8 Inferred 367,000 15.4 47 4.4 9.6
SMS 5 Indicated 734,000 16.3 53 5.1 9.6
SMS 5 Inferred 374,000 15.2 47 4.3 9.5
Table 14-12: Prairie Creek STK Domain Mineral Resource Estimate at a Range of Cutoff Grades
Domain CutOff ZnEq
% Classificati
on Tonnes ZnEq % Ag ppm Pb % Zn %
STK 25 Measured 1,000 27.0 132 6.7 16.4
STK 25 Indicated 1,000 26.1 118 8.1 14.6
STK 25 M & I 2,000 26.4 123 7.6 15.2
STK 25 Inferred 60,000 29.9 130 9.1 17.0
STK 20 Measured 36,000 22.0 115 5.3 13.3
STK 20 Indicated 71,000 21.2 96 4.7 13.6
STK 20 M & I 107,000 21.4 102 4.9 13.5
STK 20 Inferred 184,000 25.1 118 7.6 14.0
STK 15 Measured 92,000 19.4 103 4.5 11.8

Prairie Creek Page 1 59
NI 43-101 Technical Report on Preliminary Economic Assessment October 15, 2021
Domain CutOff ZnEq
% Classificati
on Tonnes ZnEq % Ag ppm Pb % Zn %
STK 15 Indicated 658,000 17.3 83 3.9 11.0
STK 15 M & I 750,000 17.6 86 4.0 11.1
STK 15 Inferred 452,000 20.4 100 6.2 11.2
STK 10 Measured 122,000 17.8 98 4.2 10.6
STK 10 Indicated 2,001,000 14.0 70 3.4 8.5
STK 10 M & I 2,123,000 14.2 72 3.4 8.7
STK 10 Inferred 1,433,000 14.6 76 4.5 7.8
STK 8 Measured 128,000 17.4 97 4.1 10.3
STK 8 Indicated 2,754,000 12.6 63 3.2 7.6
STK 8 M & I 2,883,000 12.8 65 3.2 7.7
STK 8 Inferred 2,187,000 12.7 67 4.0 6.7
STK 5 Measured 128,000 17.4 97 4.1 10.3
STK 5 Indicated 5,023,000 9.8 49 2.6 5.7
STK 5 M & I 5,152,000 9.9 50 2.6 5.8
STK 5 Inferred 3,795,000 10.1 53 3.2 5.3
Figure 14-7 demonstrates the relationship between grade and tonnage for all three zones.

Prairie Creek Page 1 60
NI 43-101 Technical Report on Preliminary Economic Assessment October 15, 2021
Figure 14-7: Prairie Creek Grade Tonnage Curves
Note: Figure prepared by G. Mosher, 2021.
Other than the normal uncertainties that pertain to mineral properties, the author is not aware of any known environmental, permitting, legal, title, taxation, socio-economic, marketing, political, or other similar factors that could materially affect the stated Mineral Resource estimates.
14.12 Block Model Validation
The block model was validated by visual comparison of drillhole assay grades relative to block grades, and numerically by comparison of composite average grades with corresponding block model average grades in the form of swath plots.
Visual inspection shows that the block model honours the boundaries of the wireframes and that the block grades correspond well with the relevant assay grades. Figure 14-8 shows the graphic comparison of composite and block grades on east-west, north-south and vertical bands through the MQV Zone and demonstrates the reasonable correspondence between the original and interpolated grades. These plots also demonstrate that interpolation smooths short-scale variability in composite grades.

Prairie Creek Page 1 61
NI 43-101 Technical Report on Preliminary Economic Assessment October 15, 2021
Figure 14-8: Prairie Creek MQV Zone Swath Plots
Note: Figure prepared by G. Mosher, 2021.
14.13 Comparison with September 2015 Mineral Resource Estimate
Table 14-13 shows a comparison of the current (October 2021) Mineral Resource estimate with the estimate reported in September 2015. The current estimate contains approximately one million more tonnes, but the overall metal content is relatively unchanged because grades in the current estimate are marginally lower. Changes in tonnage are largely attributable to modifications and enlargement of the STK wireframe model since the last resource estimate. The changes in distribution of resources among resource classifications – a decrease of Measured resources in both the MQV and STK Zones – are attributable to the use of more conservative search ellipses in the current estimate compared to the 2015 estimate.

Prairie Creek Page 1 62
NI 43-101 Technical Report on Preliminary Economic Assessment October 15, 2021
Table 14-13: Prairie Creek Comparison of Current and September 2015 Resource Estimates
Current (October 2021) Estimate (8% ZnEq Cutoff) September 2015 Estimate (8% ZnEq Cutoff)
MQV Tonnes Ag (g/t) Pb (%) Zn (%) Tonnes Ag (g/t) Pb (%) Zn (%)
Measured 903,000 206 11.2 12.9 1,313,000 211 11.5 13.2
Indicated 5,248,000 181 12.0 10.3 4,227,000 168 11.6 9.2
M & I 6,152,000 184 11.9 10.7 5,540,000 178 11.6 10.1
Inferred 3,849,000 207 8.4 16.7 5,269,000 199 8.7 12.9
SMS
Measured - - - - - - - -
Indicated 722,000 53 5.1 9.7 1,042,000 54 5.2 10.8
Inferred 367,000 47 4.4 9.6 170,000 60 6.3 11.2
STK
Measured 128,000 97 4.1 10.3 169,000 116 5.3 12.6
Indicated 2,754,000 63 3.2 7.6 1,953,000 61 3.5 6.6
M & I 2,882,000 65 3.2 7.7 2,122,000 66 3.6 7.1
Inferred 2,187,000 67 4.0 6.7 1,610,000 70 4.6 6.2
TOTAL
Measured 1,031,000 193 10.3 12.6 1,482,000 200 10.8 13.2
Indicated 8,724,000 133 8.6 9.4 7,222,000 123 8.5 8.7
M & I 9,755,000 139 8.8 9.7 8,704,000 136 8.9 9.5
Inferred 6,403,000 150 6.7 12.9 7,050,000 166 7.7 11.3

Prairie Creek Page 1 63
NI 43-101 Technical Report on Preliminary Economic Assessment October 15, 2021
15 MINERAL RESERVE ESTIMATES
This section is not relevant to this report.

Prairie Creek Page 1 64
NI 43-101 Technical Report on Preliminary Economic Assessment October 15, 2021
16 MINING METHODS
16.1 Introduction
Prairie Creek will be an underground mine extracting the majority of mineralized material from the steeply-dipping, narrow MQV. Smaller mineralized material quantities will be mined from the STK and SMS zones, generally later in the mine life. Three levels of adits (970 L, 930 L, 883 L) were established previously. Five shrinkage stopes were partly mined above the 930 and 883 levels, giving a stockpile of about 10,000 tonnes of mixed mill feed and waste that is currently located adjacent to the mill.
The MQV zone area covers a strike distance of about 2,100 m and a vertical distance of about 400 m. Below 883 L, mining levels will be established at generally 60 m intervals with 20 m sublevels. Initial stoping will start from the 883 L. As mining on the MQV progresses to depth, mineralized material mined will be supplemented by the STK and SMS zones. Lower levels will be developed to depth through ramp access over the first approximately five years of operation.
Mining will be by Longhole Open Stoping Longitudinal Retreat (LHOS) in the MQV vein and in the STK area. Longhole Upper Retreat Stoping (LUR) will be employed in the SMS area. An average mining rate of 2,400 tonnes per day of mineralized material is projected.
At steady-state, approximately 864,000 tonnes of mineralized material per year will be mined. Mine life is projected to be 20.1 years from start-up of the processing plant.
MQV material will be the majority of mill feed production and will be extracted throughout the life of the mine. The vein structure is currently exposed in over 800 m of backs in the existing underground development.
The SMS mineralization occurs approximately 200 m below 883 L and will require significant underground development for access from mill feed development driven in the MQV.
LHOS will use electric-hydraulic drill jumbos and diesel-powered scoops for waste development. Mill feed development will use the same equipment in early years of production but with battery-powered scoops planned to be used in later years. Production drilling will be by conventional longhole drills. The SMS zone will use electric-hydraulic drill jumbos and diesel-powered scoops. Bolting will generally be accomplished by mechanized bolters; mineralized material and waste movement to surface will be via conventional truck haulage.
Main access to the mine will be through the existing 870 portal, via the existing adit, and a new twin portal that will drive a new ramp down from surface along the plunge of the MQV. This 883L adit will be slashed out to 5.0 m high by 5.0 m wide after removal of the existing track. Underground development currently in place reduces the amount of full-face development needed for mine operation. Access to the mineralized material below the 883 L will be via twin ramps as shown in Figure 16-1. A single ramp will provide access to the mineralized material above 883 L.
Ground conditions in existing development underground are generally good. Current workings have stood unsupported for about 39 years with minimal bolting. Figure 16-1 is an orthogonal view of the underground workings.

Prairie Creek Page 1 65
NI 43-101 Technical Report on Preliminary Economic Assessment October 15, 2021
Figure 16-1: Orthogonal View of Mine Design
Note: Figure prepared by Mining Plus, 2021.
16.2 Mining methods
16.2.1 Longhole Open Stoping (LHOS)
Mining of the MQV will be by LHOS. The mining level in the mineralized material at the 883 m elevation has previously been established along a significant part of its length but will be slashed to 4.5 m W x 4.5 m H to serve as a mucking horizon. The average vein width is less than 4.5 m. Mining below the 883 level will require similar main levels, driven 4.5 m W x 4.5 m H, to be established every 60 m vertically; within this 60 m height there will be a sub-level driven every 20 m at 4.0 m x 4.0 m dimensions. Access to the sublevels will be gained by ramp and cross-cuts. Mill feed development in the vein will be for a distance of up to 250 m north and south (each side) of the access point. Slots will then be developed between sub-levels followed by retreat LHOS towards the access in approximately 30 m panels. The lowest elevation sub-level will lead the mining front, as shown in Figure 16-2, with all mineralized material being mucked from the main (mucking) level. Broken mineralized material will be drawn down in a controlled fashion so as to provide interim wall support and assist in minimizing wall dilution. Fill fences will be constructed on all levels other than the uppermost, after the extraction of each panel. The mining cycle will thus involve mill feed development, followed by drilling, blasting, mucking, and filling.

Prairie Creek Page 1 66
NI 43-101 Technical Report on Preliminary Economic Assessment October 15, 2021
Figure 16-2: LHOS Sequence
Note: Figure prepared by AMC, 2017.
16.3 Geotechnical Considerations
Based on analysis of the available data, shear zones may occur within the HW sequence at varying distances from the HW contact. In general, the shear zone can be seen from at the HW contact to approximately 30 m from the HW contact. In some areas the HW shear zone has been noted to be absent. The HW shear zone consists of varying degrees of fragmented and sheared dolomite. It is commonly a single zone varying in width from 0.1 m to 2 m. In some areas, however, it occurs as two or more zones of poor-quality rock separated by narrow zones of intact rock.
The stability number (N’) for rock mass conditions of each lithological sub-unit is plotted on the stability graphs shown in Figure 16-3. These graphs are representative of the stope walls and stope back, respectively. They illustrate the correlation between N’ and the excavation surface hydraulic radius (HR). Some dilution should be expected as the final muck from a stope is drawn down; it is, however, difficult to quantify this aspect without additional structural information and prior to actual stope excavation experience. Timely removal of final stope mill feed and prompt placement of paste fill in stopes will impact stope wall stability.

Prairie Creek Page 1 67
NI 43-101 Technical Report on Preliminary Economic Assessment October 15, 2021
Figure 16-3: Stability graph results for stope walls (typical average dip 60–75 deg.) and stope backs
Note: Figure prepared by AMC, 2017.
Preliminary empirical support requirements are presented in Figure 16-4. The results indicate that typical (Fair) to upper bound (Good) ground conditions plot within the ‘unsupported’ category. For safety and stability, however, systematic bolting and mesh placement would be required for rock catchment in areas where personnel may be exposed. Excavations within the lower bound (Very Poor to Poor) ground conditions plot within support categories 4 to 5. These ground conditions would require systematic bolting as well as shotcrete support for stability.

Prairie Creek Page 1 68
NI 43-101 Technical Report on Preliminary Economic Assessment October 15, 2021
Figure 16-4: Support chart from the Q System
Note: Figure prepared by AMC, 2017.

Prairie Creek Page 1 69
NI 43-101 Technical Report on Preliminary Economic Assessment October 15, 2021
16.4 Mine design
The existing access via the 883L adit will be enlarged to 5.0 m H x 5.0 m W to provide appropriate main access from surface for personnel, equipment, fresh air and materials handling. The new ramp, following the plunge of the MQV, from the twinned portal will serve as the main access to the mine and internal ramp systems to access the ore. The ramps have been designed at a maximum +/-15% gradient with a minimum 30 m turning radius and remucks at 150 m intervals. Mineralized material remucks and truck loading areas will be sited at every level access to the MQV. Within the vein, the maximum distance between remucks is approximately 200 m.
Design criteria are listed in Table 16-1.
Table 16-1: Design Criteria
Item Quantum
Access Drive Cross-section 5 m x 5 m
Crosscut
Adit (Final size) 5 m x 5 m
Ramp Cross-section 5 m x 5 m
Ramp turning radius 30 m
Ramp gradient 15%
Remuck spacing 150 m
Ore remuck and loading centres Max 200 m
Ventilation Raise diameter 4 m
16.5 Lateral and vertical development design
Sublevels will be accessed from the ramps on a 20 m vertical interval defined by the planned stoping heights. Ramp development will be set back typically 40 m (minimum 25 m) from the mill feed contact. This arrangement recognizes long-term geotechnical stability and provides adequate space for the placement of a return air raise and other services such as sumps, remucks, transformer bays and portable refuge locations.
The mine design includes raises for return air. Generally, raises from level to level (nominally 60 m) will be excavated by raisebore and will be outfitted to provide a means of second egress. The twinned main ramp access drives will serve as the main and secondary egress to and from the mine. The 930L will be an additional exhaust airway.
Mineralized material drives in the MQV zone will typically be for a distance of up to 250 m each side of the access cross-cut from the ramp. In the STK zone, mineralized material drives on a level will be driven in accordance with the geometry and mining sequence. The SMS zone will be accessed by a secondary ramp driven up from the south ramp at a gradient of 15%, with entry to the zone by a series of cross-cuts.

Prairie Creek Page 1 70
NI 43-101 Technical Report on Preliminary Economic Assessment October 15, 2021
In the development of drives to support stoping, low-grade mineralized material will be determined as that with a marginal cut-off grade. Any development material below the marginal cut-off grade will be considered waste and will generally be placed on the surface waste stockpile; small amounts of waste may be placed in stopes as fill.
Development heading design considers equipment needs, mine services and regulatory requirements. Mineralized material drives at the base of a mining block will be used for mucking access and will be driven at 4.5 m x 4.5 m; sub-level mineralized material drives will be driven at 4.0 m x 4.0 m. Figure 16-5 and Figure 16-6 show typical mineralized material drift cross-sections, considering the dimensions of mobile equipment and ventilation ducting.
Figure 16-5: 4.0 m by 4.0 m drift for MT2000 truck
Note: Figure prepared by AMC, 2017.
Figure 16-6: 4.5 m by 4.5 m drift for D40 truck
Note: Figure prepared by AMC, 2017.
16.6 Backfill
16.6.1 Backfill system description
Paste fill will generally be the material used as backfill within the mine. A newly installed paste backfill plant will return 100% of the flotation tailings to underground. The planned Dense Media Separation (DMS) plant at the front end of the mill will remove a significant amount of waste rock from the mill feed, reducing the production of tailings. As the resource is a high-grade base metal deposit, the high concentrate mass pull will further reduce the amount of tailings produced. All the

Prairie Creek Page 1 71
NI 43-101 Technical Report on Preliminary Economic Assessment October 15, 2021
aforementioned factors contribute to allowing full disposal underground of the tailings produced at the mine as paste backfill, thus negating the need for a permanent surface tailings facility.
Paste will be produced from dewatered tailings mixed with cement binder and make-up water to the target density. The ratio of binders will be varied to produce various strengths of fill. Binder addition rates will typically average 3.5%, varying between 2% (where only low-strength fill is required) and 6% (sills only), dependent upon the required strength and slump (the paste density is typically measured by its slump, a term commonly used in the cement industry - the higher the slump of the paste, the lower its density).
16.6.2 Paste fill production and delivery
The paste fill system has been designed to produce approximately 315,000 m3 of paste fill per year, which will be predominantly placed in stope voids, but with some placed in waste voids as required by the backfill schedule.
The paste fill system will be designed to produce enough paste fill per year to match the steady state yearly underground production void. Development waste rock will be predominantly transported to surface for disposal. If required for short-term filling purposes, development waste rock and, continuously available DMS reject material are additional sources of backfill.
At the completion of production in each longhole stope, structural shotcrete barricades will be built at the draw-point stope access and at each of the sub-level accesses above to retain the paste fill. Reticulation pipes will be extended into the highest-level opening for the placement of fill.
The pressure filters will operate in batch mode, dewatering the thickened tailings slurry to form a moist cake with moisture content between 10% and 15% at a rate of 54 tph. When backfill is not required, this cake will be conveyed to the active tailings stockpile. This conveyor will be reversible, and any out-of-specification cake will be returned to the tailings filter stock tank. A front-end loader will manage the stockpile. The active filter cake stockpile will be in a building that can be heated in winter. Excess filter cake will be stored out-doors between the plant and the WSP; details of the storage arrangement will be finalized in the next project phase.
When backfill is required underground, the tailings cake from the pressure filters will be routed directly to the mixer feed hopper. At the same time, the loader will deliver tails from the active stockpile into the adjacent mixer feed hopper at a rate of 54 tph. This will result in a feed rate of 108tph of tailings solids to the mixer.
The paste plant operator will select the required fill recipe, specifying density, cement dosing and delivery rate, and will start up the paste mixing plant. The tailings cake, cement and process water will be mixed in the continuous mixer to produce a cemented paste fill. At an average dosing rate of 3.5%, cement will be added at 3.8 tph with make-up water to produce 80 m3/hr of cemented paste fill for delivery underground by a high-pressure positive displacement pump. Figure 16- depicts the pastefill system.

Prairie Creek Page 1 72
NI 43-101 Technical Report on Preliminary Economic Assessment October 15, 2021
Figure 16-7: Paste Fill System
Note: Figure prepared by AMC, 2020.
The paste fill will be pumped underground along the 883L using 150 mm nominal bore high-pressure pipelines to a pair of near-vertical boreholes, approximately 900 m from the paste plant. From the top of the boreholes the paste will then be delivered through internal boreholes and pipelines to the stopes to be filled.
At each sub-level where paste is required, steel pipes will be installed from the borehole to close to the point of discharge. Because of lower paste pressure at the discharge end of the pipe, the final 50 to 100 m of pipeline can be HDPE to simplify handling and installation.
Stopes in the northern area will be supplied with fill by an additional borehole; this will enable quick sequential filling of both northern and southern stopes. A number of stopes above the 883L will require uphill pumping of paste through a single vertical borehole and / or combination of pipes up the decline. Filling the highest stopes will add 60 m of static head to the pump duty and will require a separate scuttling and flushing arrangement at the base of the piping servicing those stopes.
Filling will continue in each stope until the paste reaches the required elevation. Typically for LHOS, filling will stop about 0.5 m below the floor elevation of the top drive. The line will be flushed clear of paste and the paste plant will be prepared for the next fill run. Waste rock will then be pushed on to the top surface of the paste to complete filling and to provide a traction surface for mucking and access as required for the next stage of production.
Figure 16-8 illustrates filling activities for longhole stopes including barricade construction and fill pipe installation (sill pour shown at base of stope assumes stope to be mined immediately beneath at future date).

Prairie Creek Page 1 73
NI 43-101 Technical Report on Preliminary Economic Assessment October 15, 2021
Figure 16-8: Stope filling showing strength requirements
Note: Figure prepared by AMC, 2017.
16.7 Ventilation
The function of the ventilation system is to dilute/remove airborne dust, diesel emissions, blasting smoke and other contaminants and to maintain temperatures at levels appropriate for safe production throughout the life of the mine. The ventilation system for Prairie Creek was designed in accordance with the “NWT and Nunavut Mine Health and Safety Regulations - 2016.”

Prairie Creek Page 1 74
NI 43-101 Technical Report on Preliminary Economic Assessment October 15, 2021
The mine will be ventilated by a “pull” or exhausting type ventilation system. That is, the primary mine ventilation fans (with Variable Frequency Drives) will be located in the primary exhaust airways of the mine and will develop sufficient negative pressure to ensure that all work places are supplied with the required fresh air from the intake
Utilising a factor of 0.06 m3/kW/hr for the equipment and correcting for reduced utilisation and availability of diesel equipment, it is estimated that approximately 420 m3/s of ventilation is required for the mine.
16.7.1 Lead exposure considerations
Regulations and current practices with respect to lead contamination and worker exposure were reviewed and mitigation options for both underground and on surface were investigated. Exposure of underground workers to lead and the impact upon the health of the underground workers has been identified at other mine operations. Monitoring and establishment of worker exposure limits to lead is regulated at a provincial level. The Northwest Territories and Nunavut do not outline removal or action levels. However, the Occupational Health and Safety Regulations outline the requirement for employers to develop work procedures and processes to protect workers from chemical and biological substances, of which lead is identified as a ‘Designated Chemical and Biological Substance’ requiring an employer to:
• Provide adequate engineering controls to prevent, to the extent that is reasonably possible, the release of the substance into the work site; and
• Take other measures and provide personal protective equipment that meets the requirements of Part 7 [Personal Protective Equipment] to prevent, to the extent that is reasonably possible, exposure of workers to the substance.
16.7.2 Refuge Bays and Secondary Egress
Refuge bays will be of the self contained type and will not require compressed air. They will be of adequate size to harbour personnel working in their vicinity in the event of an emergency. Refuge bays will be placed throughout the mine so as to comply with NWT mine regulations in that they will be placed within the closer of:
• 1 km, or
• 15 minutes of travel from an active working place.
A secondary means of egress will be established via the exhaust raises by equipping them with ladders to surface via the 930L.
16.7.3 Mine air heating
The source of fresh air is exclusively the 883 L portal. Owing to the below-freezing air temperature during the winter months, this air must be heated before being introduced into the side of the portal through a fan / heater arrangement. A direct-fired propane or LNG heating system will be sited at the 883 L portal to heat the ambient air to a temperature of 1° C to ensure that access ways do not ice up in winter conditions, and to prevent service water pipes from freezing. Considering that the portal will be the sole access point for truck haulage and all other mobile equipment, the intent is for the portal fans to deliver slightly more air than the exhaust fan capacity. The objective is to ensure that the portal structure outcasts this excess of air to the atmosphere, therefore avoiding the need for an airlock ventilation door arrangement. It is planned that an extra 10 m³/s should be introduced for a total of 152 m³/s being delivered by the portal fans.

Prairie Creek Page 1 75
NI 43-101 Technical Report on Preliminary Economic Assessment October 15, 2021
16.8 Underground Infrastructure Facilities
An underground workshop is planned for the operation. Workshop facilities will be situated on surface for the initiation and capital development phase of the mine. Once production mining has started and the need for mechanical maintenance of stoping equipment starts, an underground workshop will be established in the area where the centre of gravity of the orebody is situated.
16.9 Production Schedule
Figure 16-9: Annual Production Schedule
Note: Figure prepared by Mining Plus, 2021.
Figure 16-10 shows the planned production profile for the operation.

Prairie Creek Page 1 76
NI 43-101 Technical Report on Preliminary Economic Assessment October 15, 2021
Figure 16-10: Production Profile
Note: Figure prepared by Mining Plus, 2021.

Prairie Creek Page 1 77
NI 43-101 Technical Report on Preliminary Economic Assessment October 15, 2021
Figure 16-1 through Figure 16-17 show longitudinal views of the progression of the mine development and production over time.
Figure 16-11: Mine Plan – Year 1 (2024)
Note: Figure prepared by Mining Plus, 2021.
Figure 16-12: Mine Plan – Year 2 (2025)
Note: Figure prepared by Mining Plus, 2021.

Prairie Creek Page 1 78
NI 43-101 Technical Report on Preliminary Economic Assessment October 15, 2021
Figure 16-13: Mine Plan – Year 3 (2026)
Note: Figure prepared by Mining Plus, 2021.
Figure 16-14: Mine Plan – Year 5 (2028)
Note: Figure prepared by Mining Plus, 2021.

Prairie Creek Page 1 79
NI 43-101 Technical Report on Preliminary Economic Assessment October 15, 2021
Figure 16-15: Mine Plan – Year 10 (2033)
Note: Figure prepared by Mining Plus, 2021.
Figure 16-16: Mine Plan – Year 15 (2038)
Note: Figure prepared by Mining Plus, 2021.

Prairie Creek Page 1 80
NI 43-101 Technical Report on Preliminary Economic Assessment October 15, 2021
Figure 16-17: Mine Plan – Year 21 (2044 / End of Mine)
Note: Figure prepared by Mining Plus, 2021.
16.9.1 Development
Development to the orebody will be initiated from existing adits. The adits will be enlarged to accommodate modern mining equipment by slashing the side and footwalls. Slashing will done at a rate of 180 linear metres per month.
Development of the ramps is expected to progress at a rate of 180 m per month in a single development heading. The ramps are planned to have a “ramp-up” period at the start to allow for the learning curve of the development crews. The ramp-up period shown below:
• Month 1 at 40 m/month
• Month 2 at 80 m/month
• Month 3 at 120 m/month
• Month 4 at 160 m/month
• Month 5 at 180 m/month (steady state)
When the ramps bifurcate to establish a twin drive system, the mining rate changes to a nominal 200 m/month over both ramps, i.e., the system advance is approximately 100 m/month in the direction of mining.
16.9.2 Stoping
Stoping is planned to produce an average of 2,400 tpd of material. This will be achieved by ensuring a minimum of 3 stopes are actively mined at any one time.

Prairie Creek Page 1 81
NI 43-101 Technical Report on Preliminary Economic Assessment October 15, 2021
16.10 Mining Inventory
As per NI 43-101 Guidelines, there are no Mineral Reserves for this report, however, the information provided here describes the Mining Inventory to be considered for this report. Please use the information in this section as required for the subsequent sections, as appropriate.

Prairie Creek Page 1 82
NI 43-101 Technical Report on Preliminary Economic Assessment October 15, 2021
Table 16-2: Mining Inventory
depicts the estimated Mining Inventory.

Table 16-2: Mining Inventory
Mining Inventory Tonnes Zn Pb Ag As Cd Hg Sb PbO ZnO NSR
'000 t % % g/t ppm ppm ppm ppm % % U$/t
Me
as
ure
d MQV 1,207 8.9 7.6 139 241 343 172 709 2.7 2.4 202
SMS 0 0.0 0.0 0 0 0 0 0 0.0 0.0 0
STK 113 10.2 4.7 92 417 592 124 960 0.7 0.2 233
ALL 1,320 9.0 7.3 135 256 364 168 730 2.5 2.2 204
Ind
ica
ted
MQV 6,588 7.5 8.6 130 520 438 237 1,219 0.8 0.4 256
SMS 686 8.4 4.6 49 161 211 107 100 0.8 0.2 181
STK 1,955 8.0 3.5 66 295 430 100 701 0.5 0.2 177
ALL 9,289 7.6 7.2 109 443 417 197 1,020 0.8 0.4 232
Me
as
ure
d
an
d
Ind
ica
ted
MQV 7,795 7.7 8.5 131 477 423 227 1,141 1.1 0.7 248
SMS 686 8.4 4.6 49 161 211 107 100 0.8 0.2 181
STK 2,068 8.1 3.6 67 301 439 101 716 0.5 0.2 180
ALL 10,610 7.8 7.2 113 420 410 193 984 1.0 0.6 229
Infe
rre
d MQV 5,179 11.9 6.0 146 939 691 464 1,988 0.5 0.1 296
SMS 270 8.4 3.6 41 157 154 92 52 0.5 0.2 169
STK 1,164 7.0 3.9 67 303 433 167 653 0.4 0.1 170
ALL 6,552 11.0 5.6 129 803 629 400 1,690 0.5 0.1 271
To
tal
MQV 12,974 9.4 7.5 137 662 530 322 1,479 0.9 0.5 267
SMS 956 8.4 4.3 47 160 195 103 87 0.7 0.2 178
STK 3,232 7.7 3.7 67 302 436 125 693 0.5 0.2 176
ALL 17,162 9.0 6.6 119 566 494 272 1,253 0.8 0.4 245 Note:
• The Mining Inventory is preliminary in nature.
• It includes mineral resources that are considered too speculative geologically to have the economic considerations applied to them that would allow them to be categorized as Mineral Reserves.
• There is no certainty that the preliminary economic assessment will be realized, and mineral resources that are not mineral reserves do not have demonstrated economic viability.
• The Mining Inventory is based on a cut-off of NSR C$163/t, inclusive of metallurgical recoveries, concentrate payables and penalties and concentrate transportation.
• NSR values were based on Metal prices of Zinc U$1. 20/lb, Lead U$1.05/lb and Silver U$24.00/toz, an exchange rate of C$1.25 per U$.

Prairie Creek Page 1 84
NI 43-101 Technical Report on Preliminary Economic Assessment October 15, 2021
16.11 Blasting and Explosives
The primary options for explosives in production and development blasting are: Emulsions (bulk and packaged) and Blasting Agents (bulk and packaged).
Bulk emulsion can be used in development and production blasting. It is very safe to handle, can be used in both up- and down-holes, is highly water resistant and produces low nitrate levels in mine water. In bulk form it is less costly and can be left in blastholes for up to four weeks before detonation. Emulsions typically have a shelf life of one year and the explosive must be warmed to > 0º C before use or the product may misfire due to reduced sensitivity. Extremely cold temperatures are expected at the Prairie Creek mine and therefore any emulsion product brought to site must be transferred underground and allowed to warm up to > 0º C before use.
In early mine development using a contractor, implementation of bulk emulsion infrastructure and bulk emulsion loading equipment may not be cost effective or practical. Therefore, packaged emulsion explosives should be considered for both early development and stoping.
Planned Prairie Creek dewatering offers the potential for ANFO use in production blasting. It is generally the cheapest explosive option, but should only be used in dry ground, avoiding possible high nitrate levels in mine water. Also, use in areas with very high concentrations of sulphide ore should be done in close consultation with the explosives supplier as it can react exothermically with sulphides, which, potentially, can lead to spontaneous detonation.
The production blast design used in this study assumed that ANFO would be purchased in standard 25 kg poly bags and pneumatically loaded. If required for wall control purposes, blastholes could be gravity loaded to achieve a reduction in energy (gravity-loaded ANFO has 19% less energy, on a volume basis, than pneumatically-loaded ANFO). Future consideration may be given to using ANFO in the larger tote bags as ANFO explosive is less expensive when ordered in bulk.
16.11.1 Explosives delivery and storage
Packaged emulsion explosives and bulk emulsion will be delivered to the mine portal by the explosives supplier. Explosives will be received by mine personnel and promptly transported to the underground explosives magazine.
Blasting accessories (e.g., detonators, boosters, detonating cord) will also be delivered to the portal by the explosives supplier, usually in shipments that are separate from the delivery of packaged explosives. Blasting accessories will be received by mine personnel and promptly transported to the underground detonator storage.
16.12 Mining Equipment
For the period through to achievement of steady state production and for approximately two years thereafter, a contractor will supply the personnel and mobile equipment to execute the mine plan, inclusive of all capital and development activities. At the completion of the contract, the ownership of the contractor-supplied mobile equipment is planned to be transferred to the Owner. To continue to meet the steady state development and production schedule over the LOM, procurement of additional equipment will be required at particular intervals. Table 16-3 shows the total steady state mobile equipment numbers and types that are projected to be required to meet the development and production schedule for the LOM plan after the mine switches to Owner operation.
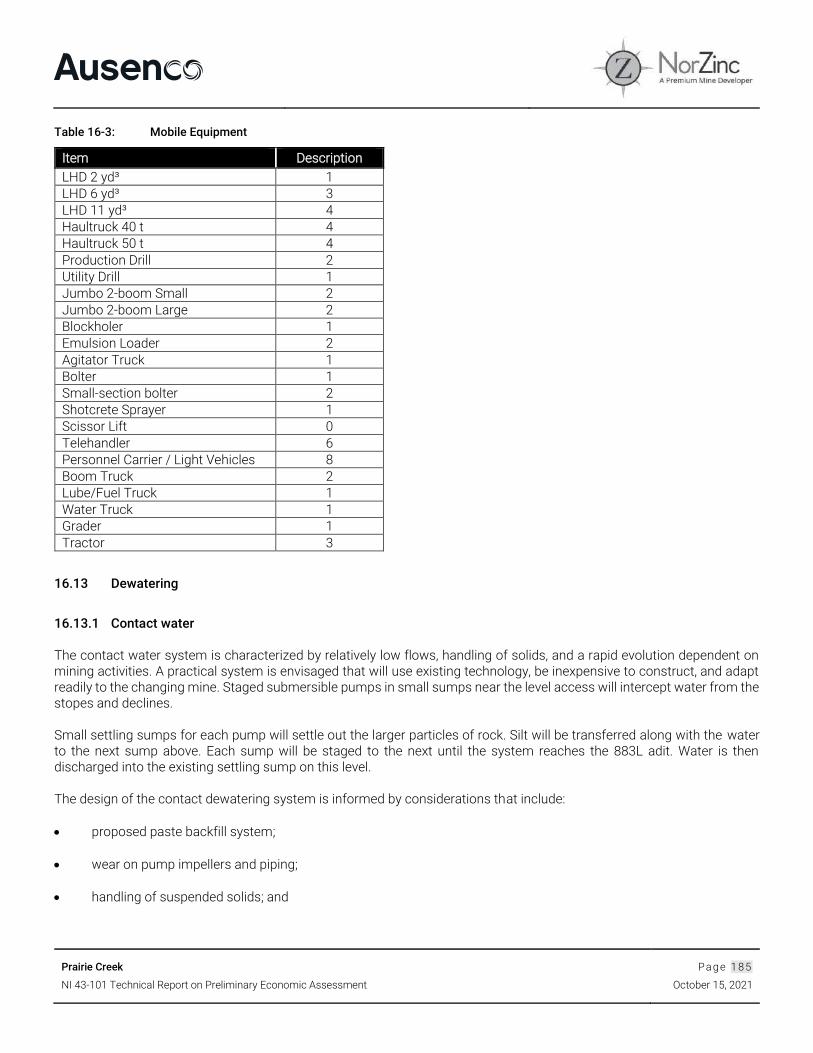
Prairie Creek Page 1 85
NI 43-101 Technical Report on Preliminary Economic Assessment October 15, 2021
Table 16-3: Mobile Equipment
Item Description
LHD 2 yd³ 1
LHD 6 yd³ 3
LHD 11 yd³ 4
Haultruck 40 t 4
Haultruck 50 t 4
Production Drill 2
Utility Drill 1
Jumbo 2-boom Small 2
Jumbo 2-boom Large 2
Blockholer 1
Emulsion Loader 2
Agitator Truck 1
Bolter 1
Small-section bolter 2
Shotcrete Sprayer 1
Scissor Lift 0
Telehandler 6
Personnel Carrier / Light Vehicles 8
Boom Truck 2
Lube/Fuel Truck 1
Water Truck 1
Grader 1
Tractor 3
16.13 Dewatering
16.13.1 Contact water
The contact water system is characterized by relatively low flows, handling of solids, and a rapid evolution dependent on mining activities. A practical system is envisaged that will use existing technology, be inexpensive to construct, and adapt readily to the changing mine. Staged submersible pumps in small sumps near the level access will intercept water from the stopes and declines.
Small settling sumps for each pump will settle out the larger particles of rock. Silt will be transferred along with the water to the next sump above. Each sump will be staged to the next until the system reaches the 883L adit. Water is then discharged into the existing settling sump on this level.
The design of the contact dewatering system is informed by considerations that include:
• proposed paste backfill system;
• wear on pump impellers and piping;
• handling of suspended solids; and

Prairie Creek Page 1 86
NI 43-101 Technical Report on Preliminary Economic Assessment October 15, 2021
• water source for use underground.
Paste backfill systems typically release little water or fine solids. A key aspect of the system is to trap solids and water in backfill permanently. An allowance for discharge from the paste backfill system was included in the design criteria.
Water for use underground (for drilling and dust suppression) will be provided by recycled contact mine water. Information from vendors and past practice have indicated that the use of recycled water is not harmful to drills, provided excess solids are removed and no contaminants that promote corrosion are present. Contact water will be collected in individual sumps before being pumped to a settling sump on the 883 L; here remaining solids will be removed to a level suitable for the water to be used underground.
16.13.2 Non-contact water
The non-contact water system is intended to intercept groundwater upgradient of the orebody before it enters the mine workings. This minimizes contamination and facilitates discharge to the environment after surface storage, with treatment as necessary. Non-contact dewatering sumps will be in place and operating before mining begins on the levels above.
The dewatering sumps will be established below (nominally one sub-level down), and prior to, active mining levels, and drainage holes will be drilled into the vein so that they span the length of the area to be mined. The intent is to lower the water table in the MQV zone so that mining can proceed in relatively dry conditions.
Design considerations for the non-contact water system include:
• control of ground water captured via drillholes;
• high volumes of water in upset conditions and during initial dewatering;
• high pressures due to a single stage to surface strategy;
• flexibility of pumps during the development of the mine; and
• storage for water inflows to allow for motor cycling times.
A number of drillholes will be required for intercepting water at each dewatering level. The longest drillholes may need to be over 240 m long and must be drilled with appropriate care and accuracy. Each hole will be drilled through a casing and blow-out preventer so that once the MQV zone is intersected the drill steel and bit can be withdrawn while controlling the water. The pressure rating of the casing, valves, and intermediate piping will need to be able to withstand the hydrostatic pressure of the current water table.
Each of the drillholes will be fitted with a case, piping, and an accessible valve that allows discharge of water into the sump. During initial dewatering the inflow of water must be controlled so that the pumps are not overloaded. As the water table is drawn down the flow rate will decrease and more drillhole valves will be opened to maintain flow rates. During the steady state phase the valves will all be open and the pumps will remove as much water as is required to maintain the water table a nominal distance above the drillholes.
Water will be conveyed up the ramps to surface in 200-mm steel pipes.

Prairie Creek Page 1 87
NI 43-101 Technical Report on Preliminary Economic Assessment October 15, 2021
16.13.3 Water Use System
The water use system recycles contact water from the settling sump on the 883 L. Water is decanted from the sump at the clear end and distributed back into the mine via a small pumping system, with excess water being pumped to surface. Pressure is provided by the pumps to service levels above 883 L, and pressure reducing valves staged through small head tanks will provide water to the levels below.
16.14 Compressed air
In the first three years of operations the contractor will provide a stationary diesel-powered compressor for all the underground requirements. For owner operations, mobile / portable compressors have been specified and costed.
During owner operation and considering cost and efficiency issues with mine-wide compressed air systems, compressed air will be supplied by local portable electric compressors, which will use the same jumbo plugs and jumbo boxes as other mobile equipment. Portable compressors will be required for the following demands:
• elevated pressure requirements for ITH drill activities;
• powering mechanized raise climbers; and
• miscellaneous activities such as spot bolting with jacklegs, powering air tools, etc.
All mobile drilling equipment, including jumbos, long-hole drills and bolters will be equipped with on-board compressors. Typical compressors that could provide air for production drilling are 470 L/s electrically driven rotary screw compressors. These would be rubber-tire mounted and moved within the production levels to follow the drills.
16.15 Underground power distribution
16.15.1 Power requirements and electrical distribution
Infrastructure and equipment that will be serviced by the mine electrical distribution system include:
• main mine ventilation fans and mine air heaters;.
• underground dewatering systems;
• paste distribution pump for the stopes above 883 L;
• underground mining mobile equipment; and
• other loads such as lighting, fuel transfer, and refuge stations.
The electrical distribution system for the mine will consist of two main feeders brought down the 883 portal and access.
An overhead powerline will be constructed to feed the portal substation. The incoming line voltage will be 4160 V. A tap in the overhead line will be made prior to the portal substation to supply power to the portal supply fans substation. The portal

Prairie Creek Page 1 88
NI 43-101 Technical Report on Preliminary Economic Assessment October 15, 2021
supply fans substation will step the voltage down from 4160 V to 600 V to feed two 100 HP supply fans and a 600 V-120/240 V 30 kVA transformer to supply auxiliary loads for the substation.
The portal substation will have an incoming breaker protecting the 5 MVA step-up transformer, which will raise the voltage to 13.8 kV to feed the underground distribution. A 15 kV switchgear line-up will contain two breakers that will feed one cable each to underground, thus providing a redundant feed system.
Two feeder cables from the substation will enter the portal at the 883 level and connect to a dual gang load break switch 883-1. A third switch bussed to the dual gang switch will feed a cable up a ventilation raise to the 930 L to feed the 200 hp portal exhaust fan. Initial slashing of the 883 level access will be supported by diesel generators brought in by the contractor.
16.15.2 Underground power layout
Eight mine power centres (MPC) will provide local electrical power to levels 930, 792, 728, 613, and 448.
From the dual gang load break switch 883-1, the two 15 kV feeder cables will connect to a second intermediately located dual gang load break switch 883-2. From this switch the two cables will take alternate routes to create a redundant feed in the mine.
The first cable leaving 883-2 will be routed down a ventilation raise and a ramp to the 792 L to connect to a dual gang load break switch 792-1. From the 792-1 switch, one switch will feed down a ventilation raise and ramp to the 728 L to connect to the 728-1 load break switch. The other fused switch will feed mine power centres on the 792 L. Additional MPCs can be added via the ability of MPCs to daisy chain together as the development of the level expands.
The second cable will continue along the development at the 883 L to the third dual gang load break switch 883-3. From the 883-3 switch, one fused switch will feed a cable up a ventilation raise to supply power to the exhaust raise fan located at the 930 L. The second load break switch feeds a cable further along the 883 L to a ventilation raise down to the 792 L to a dual gang load break switch 792-2.
Levels 728, 613, and 448 (bottom pump station level) will be supplied in similar fashion. If required, additional MPCs can be added via the ability of MPCs to daisy chain together as the development of any particular level expands.
16.16 Fuel supply
The estimated underground peak fuel consumption is 3.2 M litres per year, with mobile equipment being the biggest user. The elevated contractor fuel consumption profile includes diesel fuel required for temporary electrical generators until the main mine power generation facility is operable in August 2020.
Vehicles that come to surface regularly will also re-fuel there. For underground diesel storage and dispensing, a 5,000 L portable ‘SatStat’ fuel tank will be located off the main ramp near active working horizons to re-fuel vehicles. The fuel tank will be self-bunded and fitted with a fire suppression system and self-closing fire doors. These units incorporate safety valves, dry disconnect fittings, door lock release latch and an emergency lever. The tank will be refilled as required from a fuel supply truck that will source fuel from the main surface fuel facility.
16.17 Underground communications
Radio communications will be established underground by means of Leaky Feeder and handheld VHF radios. The Leaky Feeder system head-end unit will be installed at a suitable location near the 883 portal. The Leaky Feeder cables will run the

Prairie Creek Page 1 89
NI 43-101 Technical Report on Preliminary Economic Assessment October 15, 2021
length of the declines and also to a surface antenna. In the mine, VHF amplifiers will be spaced between Leaky Feeder VHF coax cable segments at no more than 500 m intervals. Leaky feeder cables will also branch out to all active mining levels with “end-of-line” termination antennas, as required.
16.18 Underground mine personnel requirements
In the first 39 months the mine will be operated by a contractor with oversight by the owner. Personnel will be scheduled on a regular, fly-in-fly-out rotation of two-weeks-in and two-weeks-out during operations. Most positions in operations will require a day and night shift, while technical positions typically only require a day shift. Table 16-4 lists the steady state underground personnel requirements of mine operations. At steady state 139 people (total on payroll) will be employed within the mining technical, and production departments. Some redundancy has been built into the personnel requirements to account for training, sickness and absenteeism.
Table 16-4: Manpower Requirement
Position Total
Chief Engineer 1
Senior Engineer 1
Mine Planning / Ventilation / Ground Control 6
Mine Technologist / Surveyor 2
Chief Geologist 1
Senior Geologist 1
Grade Control / Beat 3
Mine Superintendent 1
General Foreman 1
UG Supervisors 6
Safety / Training Co-Ordinator 2
Sub-total, mining supervision, and technical 25
Miners 48
Longhole drillers 7
Longhole blasters 12
Services crew 12
LHD - production 16
Haul truck 16
Backfill - surface paste plant (costed with surface crew) 12
Construction / Fill Barricades / Pumping 12
Labour 6
Sub-total, mining 141
Maintenance Superintendent 1
Chief Mechanic 1
Chief Electrician 2
Maintenance Planner 2
Welder 6
Electricians 9
Diesel Mechanics 12
Plumber / Pipefitter 6
Sub-total, underground maintenance* 39
Total 205

Prairie Creek Page 1 90
NI 43-101 Technical Report on Preliminary Economic Assessment October 15, 2021
17 RECOVERY METHODS
Ausenco has produced a process design for Prairie Creek which relies on information, data and analysis prepared by the Qualified Person for Section 13 of this report. As referenced in Section 13, metallurgical tests indicate that the Prairie Creek mineralization is amenable to a combined process of pre-concentration by dense media separation (DMS) and sequential flotation to produce lead sulphide and zinc sulphide concentrates.
The process design is based mainly on the results from the 2017 metallurgical test programs, including heavy liquid separation, flotation, mineralized material hardness, and dewatering tests. However the mineralized material hardness or Bond Ball Mill Work Index (BBMWi) has also considered the 75th percentile (100 micron) of the 1992 to 2017 BWI tests, which included a total of 12 tests with three (3) tests conducted in 2017.
The current process design incorporates some existing equipment, which was moved from another mine and installed at Prairie Creek in 1981/1982. With the increase in throughput to 2400 tonnes per day (tpd), the crushing plant is the only area to be retained without modification. The DMS pre-concentration plant is new and will be fed using a new conveyor from the existing fine mill feed bin. A new ball mill will be added into the grinding circuit with the existing mill being refurbished. All of the flotation cells in the lead and zinc flotation circuits will be new to meet the required throughput with existing tanks refurbished for conditioning purposes. Reagent preparation system will be completed to modern standards for lead and zinc concentrate production.
The proposed process flow diagram for the Prairie Creek Mine processing facility is shown in Figure 17-1, below.

Prairie Creek Page 1 91
NI 43-101 Technical Report on Preliminary Economic Assessment October 15, 2021
Figure 17-1: Process Flow Diagram
Note: Figure prepared by Ausenco, 2021

Prairie Creek Page 1 92
NI 43-101 Technical Report on Preliminary Economic Assessment October 15, 2021
17.1 Major Design Criteria
The main processing design criteria are outlined in Table 17-1, which also summarizes grade and recovery data as presented in Sections 13 and 16.
Table 17-1: Main Processing Design Criteria
Criteria Unit Value
Annual Throughput (Nominal) tpa 876,000
Operating Days per Year d 365
Operating Availability – Crushing % 70.0
Operating Availability - DMS Plant % 91.7
Operating Availability - Grinding and Flotation % 91.7
Operating Availability - Concentrate filtration % 75.0
Operating Availability - Paste Plant % 95.0
Nominal Rate - Crushing tph (dry) 143
Nominal Rate - DMS Plant tph (dry) 109
Nominal Rate - Milling and Flotation tph (dry) 82
Nominal Rate - Pb Concentrate Filtration tph (dry) 15.5
Nominal Rate - Zn Concentrate Filtration Rate tph (dry) 17.9
Nominal Rate - Paste Plant tph (dry) 53
Crushing Feed Size, 100% Passing mm 300
Crushing Product Size, 80% Passing mm 11.912 Ball Mill Product Size, 80% Passing μm 156
Ball Mill Circulating Load % 250
Bond Ball Mill Work Index kWh/t 13
Bond Abrasion Index g 0.205
ROM Head Grades Pb (LOM Average) % total / as sulphide 6.58 / 5.78
ROM Head Grades Zn (LOM Average) % total / as sulphide 9.00 / 8.58
ROM Head Grades Ag (Average) g/t 119
Metal Recovery Method DMS & polymetallic sequential
flotation
DMS Plant – Mass recovery to sinks (flotation feed) % 75
Lead Concentrate - Lead Recovery % of total 86.5
Lead Concentrate - Lead Concentrate Grade Pb wt% 60.0
Lead Concentrate - Silver Recovery % 86.8
Zinc Concentrate – Zinc Recovery % of total 85.7
Zinc Concentrate - Zinc Grade Zn wt% 58.0
Zinc Concentrate – Silver Recovery %, Ag 7.8
17.2 Process Plant Description
Ahead of the process plant, the ROM area will include a stockpile used to even-out mine production against mill capacity. The processing plant consists of crushing, DMS pre-concentration, grinding, lead and zinc sequential flotation, concentrate dewatering, and tailings dewatering/paste preparation units.

Prairie Creek Page 1 93
NI 43-101 Technical Report on Preliminary Economic Assessment October 15, 2021
17.2.1 Crushing
The existing refurbished crushing circuits, consisting of a primary crushing unit and a secondary crushing unit in closed circuit with a vibrating screen, will reduce ROM mill feed to a particle size of 80% passing 12 mm.
The major equipment and facilities in this area include:
• ROM mill feed dump pocket, (40 tonnes live capacity) with a fixed grizzly and a vibrating feeder;
• coarse mill feed surge bin (136 tonnes) with an apron feeder fitted with grizzly bars;
• Kue-Ken 36'' x 24'' (914mm by 610mm) jaw crusher;
• secondary crushing feed surge bin (45 tonnes) with a belt feeder;
• double deck screen with apertures of 25 mm and 15 mm;
• Symons Nordberg 5.5' (1.7m) shorthead cone crusher;
• conveyors including a metal detector and a magnetic separator;
• fine mill feed bin (1,800 tonnes) with a reversible belt feeder; and
• dust collection systems.
17.2.2 DMS Plant
The DMS plant (new equipment) is designed to reject gangue material to reduce effective feed tonnage and increase feed grades to the downstream grinding and flotation circuits. Fines are removed from the crushed ore, with material passing a 1.4 mm screen bypassed to grinding. Screen oversize is fed to dense media (ferrosilicon) cyclone separation at a proposed separation SG of 2.8. DMS rejects (the light, float fraction) will be conveyed to a temporary 200 tonnes stockpile (uncovered) and will be loaded onto haul trucks by a front-end loader for transport to the waste rock storage facility. The coarse DMS sink fraction, will be conveyed to the ball mills in the grinding circuit.
The DMS feed tonnage will be controlled by adjusting the speed of the fine oremill feed bin discharge conveyor belt. Operators will have the ability to set an optimal feed rate based on DMS plant on-stream analyser information. The DMS circuit is designed to be by-passed, whereby feed will be directed to the grinding circuit via the feeder under the fine mill feed bin during times when the DMS circuit is off-line for maintenance.
The major equipment and facilities in this area will be located within a new heated building connected to the mill building and will include:
• desliming screen with apertures of 1.4 mm;
• heavy media cyclone;
• sieve bends;

Prairie Creek Page 1 94
NI 43-101 Technical Report on Preliminary Economic Assessment October 15, 2021
• drain and rinse screens;
• heavy media preparation system;
• circulating heavy media handling system;
• dilute heavy medium handling system including a wet magnetic separator; and
• tanks, pumps, and conveyors.
17.2.3 Grinding And Classification
The grinding circuit will consist of two ball mills (one existing, one new) in closed circuit with classifying hydrocyclones located within the existing mill building.
Major equipment and facilities in this area include:
• Existing refurbished 10' (3.05m) diameter x 14' (4.27m) longball mill with a 700 horsepower (522 kW) motor;
• New 10' (3.05m) diameter x 14' (4.27m) , or similar ball mill with a 700 horsepower (522 kW) motor;
• New classifying hydrocyclone pack;
• Existing refurbished ball mill discharge pump box;
• New hydrocyclone feed pumps;
• Existing and new ball mill feed conveyors; and
• Ancillary equipment including a steel ball storage bin and a ball bucket.
17.2.4 Flotation
Polymetallic, sequential flotation will be employed to separate lead and zinc sulphide minerals into concentrates. All flotation cells in both circuits will be new and, a new ball mill will be installed to regrind lead rougher concentrate to maximize grade of the final lead concentrate.
17.2.4.1 Lead flotation
The lead flotation circuit consists of rougher, regrind and three stages of cleaner flotation; the major equipment for lead flotation circuit includes:
• one (1) new rougher conditioning tank, equipped with a mechanical agitator;
• six (6) new rougher flotation cells (14.2 m3);

Prairie Creek Page 1 95
NI 43-101 Technical Report on Preliminary Economic Assessment October 15, 2021
• one (1) new regrind ball mill, 6.5’ (2 m) diameter x 10’ (3.05 m) long mill, or similar with 200 HP (150kW) motor and cyclones;
• two (2) existing refurbished cleaner conditioning tanks, equipped with mechanical agitators;
• five (5) new primary cleaner flotation cells (5.1 m3);
• two (2) new scavenger flotation cells (5.1 m3);
• five (5) new secondary cleaner flotation cells (2.8 m3);
• four (4) new tertiary cleaner flotation cells (2.8 m3); and
• ancillary equipment including pumps, pump boxes and sump pumps.
17.2.4.2 Zinc flotation
The zinc flotation circuit consists of rougher flotation followed by three stages of cleaner flotation; major equipment includes:
• two (2) existing rougher conditioning tanks, each equipped with mechanical agitators;
• five (5) new rougher flotation cells (14.2 m3);
• one (1) new cleaner conditioning tank, equipped with mechanical agitator;
• four (4) new primary cleaner flotation cells (5.1 m3);
• two (2) new scavenger flotation cells (5.1 m3);
• four (4) new secondary cleaner flotation cells (2.8 m3);
• four (4) new tertiary cleaner flotation cells (2.8 m3); and
• ancillary equipment including pumps, pump boxes and sump pumps.
17.2.5 Concentrate Dewatering And Load Out Systems
The final concentrates will be dewatered by thickening and pressure filtration. The filtered lead and zinc concentrates will be stored separately on a temporary stockpile before being loaded into 20 t concentrate containers. Lead concentrate will be thickened in a new thickener and will be filtered using the existing (refurbished) lead and zinc Larox pressure filters. Both the thickener and filter used to process zinc concentrate will be new.
17.2.5.1 Lead Concentrate Dewatering and Load-Out System
Lead concentrate will be thickened in a new 8.9 m diameter high-capacity thickener. Underflow will be pumped using a new pump to the existing lead concentrate surge tank (equipped with a mechanical agitator) at approximately 65% solids. The

Prairie Creek Page 1 96
NI 43-101 Technical Report on Preliminary Economic Assessment October 15, 2021
flocculant addition rate will be adjusted, based on the lead concentrate thickener overflow clarity and underflow density. The lead concentrate surge tank will be capable of holding the thickened concentrate for approximately four (4) hours to offset any minor maintenance required for the filter and load-out system. Any additional storage capacity required for filter maintenance will be achieved by holding concentrate in the thickener. The lead concentrate thickener overflow will be pumped back to required circuits as process water.
The thickened concentrate will be further dewatered to a moisture level of 8% using the existing refurbished Larox pressure filters. Filtrate will be returned to the lead concentrate thickener and concentrate filter cake conveyed to the lead concentrate stockpile with one (1) day of storage capacity. From the stockpile it will be loaded into purpose built 20 t concentrate containers complete with removable lids. The containers will be loaded using a front end loader and a weigh scale with a digital readout to assist the operators in achieving the desired payload. Reach stacker container handlers will be used to manoeuvre the containers in and out of the building and to relocate containers to/from the container storage area.
Additional on-site storage, to account for closure of the transport route (up to one (1) week), will be provided using additional bulk containers stored in a newly constructed storage area near the air strip.
The concentrate storage building will provide temporary storage of the lead and zinc concentrate products in their own dedicated stockpiles. The new building will include concrete foundations, concrete slab, HVAC, dust control system and a vacuum system to clean up any concentrate spills from the container before removal from the building.
The major equipment used in the lead concentrate dewatering circuit includes:
• new 8.9 m diameter high-capacity lead concentrate thickener;
• existing refurbished lead concentrate surge tank equipped with a mechanical agitator;
• existing refurbished Larox pressure filter;
• existing refurbished concentrate filter discharge conveyors; and
• ancillary equipment including pump boxes and pumps.
The following equipment will be shared between the lead and zinc concentrate systems:
• concentrate containers;
• container weigh scale;
• reach stacker container handler;
• vacuum clean-up system;
• new storage building; and
• dust collection system.
Zinc concentrate dewatering and load-out system

Prairie Creek Page 1 97
NI 43-101 Technical Report on Preliminary Economic Assessment October 15, 2021
Zinc concentrate will be thickened in a new 6.8 m diameter high-capacity thickener. Underflow will be pumped using a new pump to the existing zinc concentrate surge tank (equipped with a mechanical agitator) at approximately 65% solids. The flocculant addition rate will be adjusted, based on the thickener overflow clarity and underflow density. The zinc concentrate surge tank will be capable of holding the thickened concentrate for approximately three (3) hours to offset any minor maintenance required for the filter and load-out system. Similar to the lead concentrate system, additional zinc concentrate can be stored in the thickener to conduct major zinc filter and load-out system maintenance activity. The thickened concentrate will be further dewatered to a moisture level of 8% using a new Larox (or similar) pressure filter. Filtrate will return to the zinc concentrate thickener, while concentrate filter cake is conveyed to a dedicated zinc concentrate stockpile (adjacent to the lead concentrate stockpile) with a temporary storage capacity of one (1) day’s production. The zinc concentrate is loaded into 20 t containers prior to shipping, as noted above.
The major equipment used in the zinc concentrate dewatering circuit includes:
• new 6.8 m diameter high-capacity zinc concentrate thickener;
• existing refurbished zinc concentrate surge tank equipped with a mechanical agitator;
• new Larox (or similar) pressure filter;
• existing refurbished concentrate filter discharge conveyors; and
• ancillary equipment including pump boxes and pumps.
17.2.6 Tailings Handling
The final tailings from the zinc flotation circuit will be pumped to the tailings thickener and then to the backfill plant to produce paste for backfilling underground slopes. In the thickener, a solids underflow concentration of approximately 60 wt% will be achieved. Flocculant will be added to the thickener to facilitate the thickening process. The thickened tailings will be pumped to the paste filter feed tank (equipped with an agitator) for feed to the paste plant discussed in Section 16.6.2. The overflow from the tailings thickener will be pumped to Cell A of the WSP, which is the process water storage compartment as discussed in Section 18.23.
The major equipment in the tailings handling area includes:
• existing 40’ diameter tailings thickener; and
• new ancillary equipment including pump boxes and pumps.
17.2.7 Tailings Paste Plant
There will be a new paste plant and paste delivery system as discussed in Section 16.6.2.
17.2.8 Reagent Preparation and Delivery
Various chemical reagents will be added to the flotation circuits to facilitate lead, zinc, and silver recovery. Specific reagent requirements for the Prairie Creek processes have been identified, along with packaging and estimated dosages.

Prairie Creek Page 1 98
NI 43-101 Technical Report on Preliminary Economic Assessment October 15, 2021
A typical preparation unit of a solid reagent will include:
• bulk handling system;
• mixing tank, for mixing reagent with fresh water to required strength;
• holding tank; and
• reagent pumps.
Liquid reagents will be diluted prior to delivery to the flotation circuits or pumped directly to the f lotation circuits without dilution. The existing reagent preparation area will be refurbished and utilized. Storage tanks will be equipped with level indicators and instrumentation to minimize spills. Appropriate ventilation, fire and safety protection, and Material Safety Data Sheet (MSDS) stations will be provided at the facility. Each reagent line and addition point will be labelled in accordance with Workplace Hazardous Materials Information Systems (WHMIS) standards. All operation personnel will receive WHMIS training, along with additional training for the safe handling and use of reagents.
Storage of bulk reagents will be located inside the mill building.
17.2.9 Assay And Metallurgical Laboratory
The metallurgical laboratory will be located in the existing refurbished office rooms in the mill building complete with HVAC and safety station. This laboratory will undertake test work to monitor metallurgical performance and facilitate improvement of process unit operations and efficiencies. The metallurgical lab will be equipped with equipment that is relatively insensitive to vibration and dust to perform tests such as flotation tests, size analysis, grinding tests and prepare shift samples for assays.
The metallurgical laboratory equipment will include:
• laboratory crusher;
• laboratory ball mills;
• sample pulveriser;
• splitter;
• Ro-tap sieve size analyser;
• laboratory flotation test cells;
• laboratory vacuum filters;
• pH meters;
• weighing scale;
• hot plate;

Prairie Creek Page 1 99
NI 43-101 Technical Report on Preliminary Economic Assessment October 15, 2021
• work bench; and
• drying oven.
A new stand-alone assay and water treatment laboratory with HVAC and safety stations will be housed in a free-standing pre-engineered building remote from vibration and dust caused by operating machinery. It will be equipped to conduct all routine assays for the mine, concentrator and environmental department.
The assay and water treatment laboratory equipment will include:
• laboratory crusher;
• sample pulveriser;
• splitter;
• microwave plasma-atomic emission spectrometer (MP-AES);
• graphite atomic absorption spectrophotometers (AAS);
• X-ray fluorescence spectrometer (XRF);
• UV/VIS spectrophotometer;
• drying oven;
• pressed pellet;
• chloride ISE kit;
• laboratory pressure filter;
• fusion furnace;
• cupelling furnace;
• hot plate;
• weighing scale;
• work bench; and
• pH meters.

Prairie Creek Page 2 00
NI 43-101 Technical Report on Preliminary Economic Assessment October 15, 2021
17.2.10 Mill Water Supply And Distribution
17.2.10.1 Fresh water
Fresh water will be supplied from Cell B of the WSP, which is supplied with mine dewatering non-contact water.
Fresh water will be used primarily for:
• fire water for emergency use, and
• gland services for the slurry pumps (only in rare exceptions when contact water can’t be used)
Fire water and potable water are discussed further in Section 18.2.
17.2.10.2 Process water
The concentrate thickener overflows will be pumped back to the respective flotation circuits and re-used. The tailings thickener overflow and excess water from the paste plant will be pumped to Cell A of the WSP to be re-used after the flotation reagents are allowed to degrade for approximately two (2) months. No treatment of the process water is required. Cell A water will also be used for gland services and reagent make-up.
Process water is supplied throughout the plant via a ring main process water pipe arrangement.
17.2.11 Compressed Air Supply
The two (2) existing plant air compressors (duty/standby) will be refurbished to provide high-pressure air for general plant use, pressure filters and instrumentation. The instrumentation air stream will be dried and the dry compressed air will be stored separately in a new dedicated air receiver.
The Paste Plant will have its own dedicated air system.
The two (2) existing blowers will be refurbished and supply air for all flotation cells.
17.3 Process Plant Instrumentation And Controls
17.3.1 Plant Control
The refurbished process equipment will be manually controlled with aids of a programmable logic controller (PLC)-based process monitoring. The system will generate production reports and provide data and malfunction analyses, as well as a log of all process upsets. All process alarms and events will be also logged into the historian database.
Secondary local interface (or control panels) will be provided for the following areas:
• DMS plant;
• backfill paste plant;

Prairie Creek Page 2 01
NI 43-101 Technical Report on Preliminary Economic Assessment October 15, 2021
• water treatment plant;
• concentrate filters; and
• power generation plant.
New intelligent-type motor control centres (MCCs) will be located in electrical rooms throughout the plant. A digital interface to the control system will facilitate MCC remote operation and monitoring.
For site-wide infrastructure (i.e. telephone, internet, security, fire alarm, and control systems), a fiber optic backbone will be installed.
17.3.2 Control Philosophy
To control and monitor all mill building processes, three (3) PC work stations will be installed in the refurbished central control room located within the mill building. The following will be controlled and monitored:
• underground production, primary crushing and secondary screening;
• dense media separation circuit;
• grinding feed conveyors (zero speed switches, side travel switches, emergency pull cords, and plugged chute detection);
• ball mill (mill speed, bearing temperatures, lubrication systems, clutch, motor, and feed rates);
• pump boxes, tanks, and bin levels;
• variable speed pumps;
• hydrocyclone feed density controls;
• thickeners (drives, slurry interface levels, underflow density, and flocculant addition);
• flotation cells (level controls, reagent addition, and airflow rates);
• samplers (for flotation optimization);
• concentrate filters, and load out;
• reagent handling and distribution systems;
• tailings disposal to paste backfill or tailings storage;
• water treatment, storage, reclamation, and distribution, including tank level automatic control;
• air compressors; and

Prairie Creek Page 2 02
NI 43-101 Technical Report on Preliminary Economic Assessment October 15, 2021
• fuel storage.
An automatic sampling system will collect samples for daily metallurgical balance accounting.

Prairie Creek Page 2 03
NI 43-101 Technical Report on Preliminary Economic Assessment October 15, 2021
18 PROJECT INFRASTRUCTURE
The Prairie Creek Mine is a remote, isolated site, with infrastructure that requires upgrade, expansion or replacement where necessary. Figure 18-1 shows a photograph of the site from 2015.
Figure 18-1: The present-day Prairie Creek Mine site infrastructure
Note: Figure prepared by NZC, 2021.
The mine site lies on the flood plain of Prairie Creek and an engineered dykes and berms were built in 1980-82 adjacent to Prairie Creek to prevent flooding of the site. The dykes next to the impoundment pond have a clay core and the exterior base, Prairie Creek Side, are lined with coarse rip-rap armouring to protect the dykes from erosion due to flow from Prairie Creek. Since this infrastructure was built the site has not flooded, in spite of a number of significant flood events during that time. The dyke/berm system can be seen at the base of the above photograph with the coarse rip-rap armour showing as a light colour.
Figure 18-2 is a plan view of the proposed site layout. Figure 18-3 shows the proposed general arrangement for modified infrastructure at the site.

Prairie Creek Page 2 04
NI 43-101 Technical Report on Preliminary Economic Assessment October 15, 2021
Figure 18-2: Proposed site layout of the Prairie Creek Mine infrastructure
Note: Figure provided by Ausenco, 2021.

Prairie Creek Page 2 05
NI 43-101 Technical Report on Preliminary Economic Assessment October 15, 2021
Figure 18-3: Proposed general arrangement of the modified Prairie Creek Mine site infrastructure
Note: Figure provided by Ausenco, 2021.

Prairie Creek Page 2 06
NI 43-101 Technical Report on Preliminary Economic Assessment October 15, 2021
18.1 Camp
The 15 modules of the current camp accommodation (with orange and yellow stripe in the background of Figure 18-4) are in various stages of deterioration and will be demolished.
A self-contained, modular camp (second-hand) with accommodation for an additional 300 people will be constructed to support the construction and operations activities throughout the mine life. The new kitchen will be sized for 250 people.
Figure 18-4: Prairie Creek present-day accommodations
Note: Figure provided by NZC, 2021.

Prairie Creek Page 2 07
NI 43-101 Technical Report on Preliminary Economic Assessment October 15, 2021
18.2 Water
18.2.1 Domestic water
Domestic water will be pumped from an existing well, the water quality of which has been tested multiple times and is acceptable for drinking apart from the high hardness. In terms of flow rate, the water level in the well showed no draw-down after four hours at a pumping rate of 46 litres per minute. This is sufficient to supply 300 litres per person per day to 200 people. A new potable water treatment plant will be provided for treatment of the well water for domestic use.
18.2.2 Fire water
There will be a minimum of two (2) hours of dedicated fire water supply stored in an above ground fresh/fire water tank (minimum 680,000 L), and a fire water pump will deliver fire water through a distribution network to each of the protected areas. One (1) of the existing diesel fuel tanks will be refurbished and repurposed for use as the fresh/fire water tank.
Fire water will be supplied from Cell B of the WSP and distributed using electric pumps (main pump with jockey pump) and a diesel fired fire water pump will be provided for automatic start in the event of a failure of the prime electric fire pump.
18.2.3 Site water management facilities
An existing exploration-level water treatment plant treats the mine water that flows from the underground workings during the open water season. This plant consists of a primary mixing tank where the main reagent (sodium sulphide) is added to the mine water followed by addition of some flocculants before the mine water flows into the polishing pond. The polishing pond is where most of the zinc particles precipitate out of the water before the water flows into the catchment pond and thence into Harrison Creek through a controlled culvert. This water treatment plant will be dismantled and replaced by a new plant; the polishing pond will be removed, and the location used as a temporary waste rock stockpile.
The WSP is described in Section 18.23. The WRP is described in Section 18.24. The water management plan is described in Section 20.2. A new culvert will be installed in the catchment pond to discharge to an exfiltration trench. The culvert inlet will include a recycle option in the event that the discharge does not meet effluent quality criteria, in which case the water will be pumped back to the WSP. The exfiltration trench will contain two perforated pipes for alternate use.
Having two pipes also provides redundancy in the event that one pipe is unusable for any reason.
18.2.4 Flood protection
The site is protected from flooding associated with Prairie Creek by a berm creating one side of the WSP and a flood protection berm that protects the mine, which is connected to the pond berm. Both structures are armoured with rip-rap to prevent erosion during large flood events. These structures are inspected annually by a geotechnical engineer and were re-assessed recently by a hydraulic engineer and were confirmed to be of suitable design to withstand the probable maximum flood.

Prairie Creek Page 2 08
NI 43-101 Technical Report on Preliminary Economic Assessment October 15, 2021
18.3 Medical facilities
The location of the Prairie Creek site and the possibility of air access being interrupted by adverse weather will require that more enhanced medical facilities be provided and staffed on site than would be the case at a less remote site. Minimum standards are set by regulations, but NZC will access the experience of similarly-situated mines.
Medically-trained staffs are listed in the organization chart and will comprise a Health, Safety and Training Superintendent on rotation with a Health, Safety and Training Supervisor, and one full-time paramedic with no other duties; the warehouse persons will be first aid trained. These employees will also be responsible for emergency response.
NZC will seek to enter into mine rescue mutual aid agreements with such other mines as may be operating in the area.
18.4 Telecommunications
In order to support the number of personnel expected to be accommodated at Prairie Creek, upgrades to the existing telecommunications infrastructure will be needed to allow for effective and reliable emergency, recreational, and administrative use.
Two technologies are commonly used for providing internet and phone service to remote sites: satellite and microwave. Microwave technology relies on repeater installations that may be problematic to install due to steep terrain and permitting and environmental considerations in the surrounding area. Satellite technology is therefore preferred as it relies only on line-of-sight to an orbiting geostationary satellite; NZC has had satisfactory experience with this technology.
An alternative technology that may be available in coming years is satellite internet via low-Earth-orbit satellite constellations. While commercial availability is pending, this technology is rapidly developing and may become a realistic option for providing telecommunications at Prairie Creek in the very near future. Low-Earth-orbit is loosely defined as less than 1,000 km above the surface of the Earth, which when compared with geostationary satellite orbits of 35,000+ km above the Earth, allow for much lower latency and higher throughput connections, for lower cost.
Additional phone and internet equipment will supplement the equipment installed at Prairie Creek for a managed network, including modems, routers, phone equipment and satellite dish, to accommodate office and off-hours recreational uses.
The targeted monthly service availability is rated at 99.97%; handheld satellite phones will be available as back-up. An additional satellite link may also be set up for redundant fail-over communications.
18.5 Administration building
The Administration Building is an existing two storey steel clad building that includes the Mine dry, a warehouse, offices and training rooms as shown in Figure 18-5. This building has been maintained as the site operations base and will retain this function. The building will need some basic maintenance and refurbishing to bring it up to current standards including roof repairs, window replacement and repairs to plumbing fixtures.

Prairie Creek Page 2 09
NI 43-101 Technical Report on Preliminary Economic Assessment October 15, 2021
Figure 18-5: The two-storey steel clad Administration Building at the Prairie Creek site
Note: Figure provided by NZC, 2021.
18.6 Warehousing
Supplies and spare parts are currently stored in several different small buildings around the site and are in generally poor condition. A new fabric-structure warehouse will be erected to elongate the existing cold storage building. The existing cold storage building will undergo basic maintenance and refurbishment and will continue to be used.

Prairie Creek Page 2 10
NI 43-101 Technical Report on Preliminary Economic Assessment October 15, 2021
18.7 Workshops
The existing heavy-equipment workshop will undergo basic maintenance & refurbishment and will be used for the maintenance of both surface and underground mobile equipment (see Figure 18-6) and to refurbish and maintain process plant components.
Figure 18-6: Interior of the workshop at the Prairie Creek site
Note: Figure provided by NZC, 2021.
18.8 Air strip
The site is serviced by a 1,000 m gravel airstrip approximately 1 km from the camp and is registered with Navigation Canada as CBH4. The airstrip is beside Prairie Creek at the bottom of a narrow, sinuous canyon with obstructed approaches. Passenger aircraft up to DHC-7 size can use the strip; this does not limit crew movements for the forecast employee numbers. The current maximum size of freight aircraft capable of using the strip, however, is a DHC-5 Buffalo; the site does

Prairie Creek Page 2 11
NI 43-101 Technical Report on Preliminary Economic Assessment October 15, 2021
not permit a sufficient runway extension to accommodate a bigger and more economical freight aircraft, such as a Hercules.
Presently a visual approach is mandatory and the tops of the surrounding mountains must be clear of cloud to permit safe operations. Access may be interrupted in poor weather conditions. Beacons and additional navigation aids may be added to further facilitate safety and more extended operation.
Figure 18-7 is a photograph showing the Prairie Creek air strip.
Figure 18-7: The 1,000 m gravel airstrip (CBH4) at Prairie Creek Site
Note: Figure provided by NZC, 2021.

Prairie Creek Page 2 12
NI 43-101 Technical Report on Preliminary Economic Assessment October 15, 2021
18.9 Fuel storage
Four 1.7 million litre diesel fuel tanks exist on the site, as shown below, complete with dispensing equipment, with a combined capacity of 6.8 million litres, all within an engineered clay-lined berm containment system. The nearest (white) tank in Figure 18-8 is presently in service.
Figure 18-8: Diesel tank farm at Prairie Creek within a clay-lined berm impoundment structure
Note: Figure provided by NZC, 2021.
An inspection by Roosdahl Engineering Enterprises in 2011 showed that minor repairs are needed to restore all four fuel tanks to serviceable condition and the fuel farm containment system meets the required Environment Canada regulations. Based on the API 653 tank inspections conducted on September 20, 2008, the structural integrity of the diesel fuel bulk storage and dispensing facilities was considered to be good and suitable for continued operation, with routine inspection and maintenance for the next 19 to 20 years with the approval of the Authority Having Jurisdiction (AHJ).
As the current NZC operating plan is for access by all-season road, one tank will suffice for ongoing site fuel storage needs and another will be re-purposed for the fire water tank as mentioned in section 18.2. During construction, it is expected that an additional two tanks will be utilised.

Prairie Creek Page 2 13
NI 43-101 Technical Report on Preliminary Economic Assessment October 15, 2021
18.10 Sewage treatment
The existing Sewage Treatment Plant (STP) is a secondary-level, extended aeration treatment plant as shown in Figure 18-9; the plant will be reactivated.
Figure 18-9: Sewage Treatment Plant
Note: Figure provided by NZC, 2021.
Sewage treatment in the plant is based on aerobic biological digestion of the sewage with the addition of air. The sewage is kept in an aerated tank for 24 hours during which oxidization of the solids takes place. After the solids settle, the effluent is pumped out and irradiated with a UV system. Alum will also be added to control phosphate concentrations. The effluent will be pumped to the WSP Cell A. Settled solids will be returned to the aeration tank if needed.
Sewage will be piped within each building and pumped to the STP from strategically located lift stations through force mains in the utilidors. Any sewage generated in outlying areas will be collected in local holding tanks and removed by means of a tanker truck for treatment in the STP.
The treatment of the raw sewage is based on a biological oxygen demand (BOD5) of 220 to 300 mg/L. The flow rate per person per day of 300 litres is estimated to have a loading of 220 to 300 mg/L of total suspended solids (TSS). The design parameters for treated effluent quality are BOD5 : <20 mg/L, and TSS: <20 mg/L.

Prairie Creek Page 2 14
NI 43-101 Technical Report on Preliminary Economic Assessment October 15, 2021
18.11 Garbage incineration
Suitably trained members of the site work force will collect garbage from bins at the work sites and deal with it as follows:
• Food waste Incinerate, ash to WRP
• Combustible scrap Incinerate, ash to WRP
• Non-combustible scrap Bundle and back haul to Fort Nelson for recycling or sale as scrap
• Hazardous waste Stored in designated containers, back haul to Fort Nelson for disposal
The incinerator will be located near the kitchen to facilitate the transfer of the main source of waste for incineration. Combustible wastes from other locations will be transported by truck.
The incinerator will also generate energy which will be used to supplement the camp heating system.
18.12 Electrical system
The original owner intended to provide 2,400 volt site power by means of four Bessemer-Cooper diesel generators, which are currently installed in part of the mill building. These have been deemed inefficient and beyond reasonable repair and will be replaced with five 1.8 Megawatt diesel / LNG blend generators with a sixth generator on standby to provide the required 10.8 MW (at 4,160 volts) of installed power. The new generators will be located where existing diesel generators are installed to allow for reuse of the building, cabling and trays where possible. The existing operating power generation capability on site, totalling 1.075 MW, will be used to supply essential power to process and to supplement the power system at camp and administration area.
The new plant will maximize heat recovery from the coolant circuits and from the generator exhaust by means of glycol loops. This heat will be used to heat the process plant buildings as discussed in Section 18.16.
Some of the existing electrical cabling and switchgear does not conform to current standards or has deteriorated due to weathering and will be replaced.
The electrical system design includes the following:
• New electrical equipment. Where possible, some existing electrical equipment (such as MCC, transformers, motors, local start/stop stations) may be reused after testing and evaluation. The electrical equipment will be located where existing equipment is to maximize the reuse of cable & tray.
• Existing electrical rooms will be reused.
• Existing cabling and trays will be reused where possible and supplemented with new materials. Some additional existing electrical materials will be reused after testing to confirm the condition.
A portion of the existing overhead line from the mill building to the administration and camp will be demolished and re-routed to make room for the ROM pad. A new line will be installed to supply the camp and new water treatment plant to account for the higher electrical load and an extension of the line will be installed to feed the water pond reclaim pumps.

Prairie Creek Page 2 15
NI 43-101 Technical Report on Preliminary Economic Assessment October 15, 2021
The existing overhead line to the tank farm will be extended to the catchment pond to supply power to the exfiltration equipment.
Temporary construction power for the mine, process plant and surface infrastructure will be provided by diesel generators, on surface near the 883L portal. Permanent power during operations will be provided by the new generators when they become available.
Electric power will be used for underground fans, pumps, electric-hydraulic jumbos, longhole drills, skid-mounted mobile air compressors and local permanent lighting. NZC will review the use of electric power for battery-powered scooptrams to muck the majority of oremineralized material and waste but envisages starting operations with contractor-supplied diesel equipment.
The camp will be installed with auto-start emergency power supply.
Load-sharing and load-shedding protocols will be a part of powerhouse operating procedures.
Table 18-1 shows the estimated life-of-mine average demand loads.
Figure 18-10 is single-line electrical drawing for the site.
Table 18-1: LOM Major Area Power Demand
Area Demand Load, (kW)
UG Mine 1,978
Crushing, Grinding, Flotation, Concentrate Regrind and Concentrate Handling 1,369
DMS Plant 287
Paste/Backfill Plant 658
Pumps 698
Conveyors 186
Camp
Other 1,975
Total Site 7,6506,541
“Demand Load” is the long-term average power draw.

Prairie Creek Page 2 16
NI 43-101 Technical Report on Preliminary Economic Assessment October 15, 2021
Figure 18-10: Overall Single Line Electrical Drawing
Note: Figure prepared by Ausenco, 2021.

Prairie Creek Page 2 17
NI 43-101 Technical Report on Preliminary Economic Assessment October 15, 2021
18.13 LNG power generation
Generators used to supply the site operating power needs will be capable of using a mixture of liquefied natural gas (LNG) and diesel as the fuel source.
The LNG fuel storage system will be constructed and will include LNG storage tanks, LNG vaporizer, LNG unloading pump and LNG transfer pump located within a bunded area.
18.14 Plant control
Instrumentation and control technology has made major advances since the Mine was originally built, offering significant improvements in economy and efficiency. An entirely new instrumentation and control system will be designed and installed.
18.15 Fire detection and suppression systems
The fire protection system will be based upon the National Building Code of Canada Codes, as well as specific National Fire Prevention Association (NFPA) standards.
The fire protection system will consist of new equipment and materials and will make use of existing hardware where possible upon further testing and inspection.
The distribution network will be maintained under a constant pressure with a jockey pump and will be looped and sectionalized to minimize loss of fire protection during maintenance. Where run outside buildings, fire water piping will run above ground and be heat traced and insulated.
Yard hydrants will be limited to the fuel storage tank area. Wall hydrants will be used in lieu of yard hydrants, and these will be located on the outside walls of the buildings in heated cabinets.
Fire protection within buildings will include standpipe systems, sprinkler systems and portable fire extinguishers. Standpipe systems will be provided in structures that exceed 14 metres in height and additionally where required by Code, local authorities or the Insurance Underwriter.
Sprinklers will be provided in the following locations (or to protect the following items):
• Truck shops;
• Assay laboratory;
• Over hydraulic or lube packs that contain more than 454 Litres of fluid;
• Lube storage rooms;
• Any conveyor belts that are within tunnels or other enclosed spaces which would be hazardous to fight manually;
• Transformers;
• Heated warehouse; and
• Cold Storage.

Prairie Creek Page 2 18
NI 43-101 Technical Report on Preliminary Economic Assessment October 15, 2021
Camp modules will be purchased with fire detection; fire rated walls and will utilize separation as a means of fire protection. Handheld extinguishers will be located throughout the buildings.
Fire protection of the generators will be provided by a water mist system. Gas detection will be provided to detect high levels of LNG gas within the generator room.
18.16 Heating, Ventilation and Air Conditioning (HVAC)
The heating system at Prairie Creek will involve several sources of heat, including:
• Heat recovered from the on-site generators – using circulated hot glycol as the heat transfer medium;
• Latent heat from drive motors in the concentrator, such as air compressors and mills; and
• Propane gas from on-site storage tanks.
Utilization of LNG (liquefied natural gas) for heating has been identified as an opportunity for further investigation.
The primary source for heating the following areas will be high grade heat recovery from the power generators:
• Mill Building;
• Lead Oxide Building;
• DMS Plant;
• Tailings Paste Plant Building;
• Active Tailing Stockpile Building; and
• Concentrate Storage Building.
The primary source for heating the following areas will be propane gas:
• Administration Building;
• Camp;
• Workshop;
• Assay Lab;
• Heated Warehouse; and
• Mine Water Treatment Plant.

Prairie Creek Page 2 19
NI 43-101 Technical Report on Preliminary Economic Assessment October 15, 2021
The generators will include a heat recovery module on each generator skid which will transfer heat from the jacket water and the exhaust boiler through a plate and frame heat exchanger. The generators will also include a liquid to air radiator, which will be capable of removing all of the heat that is generated by the generators when there is no requirement for any heat recovery.
A hydraulically separated glycol system will be connected to the heat exchangers and be pumped around the plant as a high grade primary loop. The hydraulic separation ensures that any issues with either circuit will not impact the other circuit. This loop will include an expansion tank, a waste glycol tank, a clean glycol fill tank, a make-up glycol pump, and primary glycol pumps.
The glycol will be a factory mixture comprising 60% ethylene glycol and 40% demineralized water, and the distribution piping located outside buildings will be insulated to minimize heat loss.
Secondary high-grade heating loops will be connected to the primary loop to serve the buildings that are outside the Mill Building.
“Process” type buildings will be heated in winter to achieve a minimum indoor air temperature of +5° Celsius at the design outdoor air temperature of -47° Celsius. Glycol unit heaters will provide heating to the perimeter of buildings and air handling units with glycol coils will provide either make-up air or ventilation air.
“Occupied” buildings will be heated in winter to achieve an indoor air temperature of no less than +18° Celsius at the design outdoor air temperature.
The propane system will comprise a storage tank with a minimum capacity of 7 days, a vaporizer and a primary pressure reduction valve (PRV) to distribute the propane gas to the end users at 10 psig. Secondary PRVs will be located at each building.
The heating of mine air and the ventilation systems for the underground mine are discussed in Section 16.
18.17 Mine Water Treatment Plant
The Mine Water Treatment Plant (WTP) will treat excess water in Cell B of the WSP prior to discharge to the environment.
The design of the treatment plant was based upon test work by SGS-CEMI; the primary conclusions of the test work indicated that mine water treated with hydrated lime to a pH>9 will be sufficient to meet effluent quality requirements.
The treated water will then be pumped to a reactor clarifier for the addition of flocculant to aid solids settling. (Space has been reserved in the layout for additional treatment trains if the mine water treatment rate needs to increase and additional equipment is required).
The capacity of the mine water treatment plant will be 75 litres per second initially based on the best estimate of probable inflows underground and with addition of a contingency. However, the plant will be modular and can be expanded to increase this capacity, if necessary, which would be sufficient to manage the projected upper-bound of possible inflows. Inflows will be monitored during the early years of mine development, allowing the model to be calibrated and any necessary treatment circuit changes to be anticipated.
NZC’s current mine plan envisages pre-drainage of mining areas so as to bring ground water to surface as non-contact water, avoiding contamination with metals, sludge, oil and ammonia residues. This will minimize demand on the WTP.

Prairie Creek Page 2 20
NI 43-101 Technical Report on Preliminary Economic Assessment October 15, 2021
18.18 Explosives
Refer to 16.11.1.
18.19 Mine services – compressed air and communications
Refer to 16.14.
18.20 Dewatering
Refer to 16.13.
18.21 Mine escape and rescue
Refer to 16.7.2.
18.22 Surface mobile equipment
NZC has a fleet of mobile equipment onsite (refer to Figure 18-11), a portion of which, upon refurbishing, would be capable of supporting operating requirements.
Figure 18-11: Surface mobile equipment at the Prairie Creek site
Note: Figure provided by NZC, 2021.

Prairie Creek Page 2 21
NI 43-101 Technical Report on Preliminary Economic Assessment October 15, 2021
The mobile equipment fleet required for the operation and maintenance of all the surface facility areas (including the roadways and airstrip) is listed in Table 18-2.
Table 18-2: Surface mobile equipment required
Equipment Specifications Qty
D6T Dozer Refurbished Equipment 1
Forklift for Maintenance New Equipment
DP50N1 - 5t capacity 1
Skid Steer Loader (Bobcat) New Equipment 1
Mobile Rock Breaker for ROM
New Equipment
CAT 304.5E2 XTC - Rock breaker (hammer) mounted on CAT excavator
1
Front End Loader for ROM Refurbished Equipment
CAT 950/960 1
Front End Loader for Waste Rock Refurbished Equipment
CAT 950/960 1
Front End Loader for Concentrate New Equipment
CAT 950/960 1
Front End Loader for Paste Plant / DMS Plant New Equipment
CAT 950/960 1
Ambulance 4x4 New Equipment 1
Fire Truck New Equipment 1
Reach Stacker for Concentrate Containers @ site New Equipment
Konecranes SMV 2115 TB3 2
Fuel Tanker / Lube Day Truck New Equipment 1
Waste Rock dump truck Refurbished Equipment
20 t 2
Grader Refurbished Equipment 2
Pick-up Trucks Refurbished Equipment 2
Mini-bus Refurbished Equipment 1
Mobile Crane - Pick and carry New Equipment
AT20-3 Terex model, 20t capacity 1
Telescopic Handler (Telehandler) Refurbished Equipment
3t, 11m lift 1
Mechanics Truck New Equipment 1
18.23 Water storage pond
The water storage structure will be the key facility of NZC’s water management plan.
The large pond located northwest of the plant and offices (see Figure 18-12) was originally intended for the disposal of tailings, although none were placed as the mill was not commissioned. Soon after construction, a section of the pond’s back-slope slumped, due to a combination of permafrost thaw and slope movement along a weak zone in the underlying in-situ clay layer. Recently slope inclinometers showed that the slope is creeping at a rate of several millimeters per year. In

Prairie Creek Page 2 22
NI 43-101 Technical Report on Preliminary Economic Assessment October 15, 2021
addition, there have been a number of small failures along the inside of the pond berm due to improper compaction, materials being placed while frozen, poor design and construction of the interior slope and subsequent freeze thaw cycles. Although the failures have affected the engineered interior slopes of the pond, the impoundment can be remediated to provide a stable water impoundment facility. Figure 18-13 shows the proposed layout for the WSP.
Figure 18-12: Tailings impoundment facility - to be converted into a WSP
Note: Figure provided by NZC, 2021.

Prairie Creek Page 2 23
NI 43-101 Technical Report on Preliminary Economic Assessment October 15, 2021
Figure 18-13: Proposed WSP layout
Note: Figure prepared by Golder, 2014.

Prairie Creek Page 2 24
NI 43-101 Technical Report on Preliminary Economic Assessment October 15, 2021
There is some uncertainty regarding the magnitude of mine flows that will occur and which will require temporary storage in the WSP. For this reason, NZC has endeavoured to maximize storage capacity in the WSP. The WSP has been optimized to increase the storage capacity along with the remediation program. Total storage capacity will be increased from 590,000 m3 (original design) to 666,000 m3 and live storage from 410,000 m3 (original design) to 458,000 m3 (refer to Table 18-3).
Table 18-3: Storage Capacity of WSP
Cell Live Storage Volume
(m3)
Total Storage Volume
(m3)
Cell A 158,000 264,000
Cell B 300,000 402,000
Total 458,000 666,000
The proposed remediation program to convert the pond into the storage water pond is as follows:
• Preparation of the base of the pond to an elevation of 870 m (AMSL), which will be the foundation for the separation berm and stabilization apron.
• Construction of the separation berm with 2:1 (H:V) slopes to elevation 882 m and stabilization apron of variable thickness to stabilize the back-slope movement.
• Construction of an upstream containment berm raise with 2.5:1 (H:V) slopes to stabilize the interior of the old berm to an elevation of 882 m.
• Excavation of the north slope east of the separation berm removing any significant overburden load acting on the in-situ clay.
• Installation of a reinforced polypropylene liner in both cells of the pond.
• Construction of a diversion channel along the back of the WSP lined with geomembrane to prevent further saturation of the northern slope along with an energy dissipation structure at the outlet.
Stability analyses of the pond remediation program of the back-slope and the containment berm were performed in accordance with dam safety guidelines. The configuration of the storage water pond utilized limit 2D equilibrium analysis using SLOPE/W from Geostudio 2007. Material properties for the pond are based on a geotechnical field investigation (including test pits, boreholes, and dynamic cone penetrometer programs) and laboratory testing program. The results of the stability analyses for the remediation program for the WSP showed factors of safety that exceeded the prescribed requirements (1.5 static and 1.1 pseudo-static) and therefore the feasibility design is determined to be stable. However, the north slope will be monitored to confirm that the remediation measurements above completely arrest the creep.
18.24 Waste rock pile
A new WRP will be constructed to store approximately 5 Mt of combined development waste rock and dense media separation (DMS) rock along with 35,000 m3 of solid waste. The solid waste is expected to consist of non-hazardous wood, metal, paper, etc. The site of the WRP is located in a ravine approximately 1 km north of the plant site (refer to Figure 18-14). The capacity of the WRP is open-ended since the volume can migrate upslope within the ravine as more waste is added.

Prairie Creek Page 2 25
NI 43-101 Technical Report on Preliminary Economic Assessment October 15, 2021
A geotechnical program was performed to determine subsurface conditions for the development of the WRP, which included 4 boreholes and 8 test pits. Toward the bottom of the WRP and collection pond area, the overburden consists of sand and gravel and the upper area (above 975 m) consists of thin overburden overlying shale bedrock. There was no evidence of permafrost in this area. The overburden between 925 and 975 m (AMSL) will be removed down to bedrock for the installation of both the seepage collection pond and the toe section of the WRP. Above 990 m, within the WRP footprint, only the organic and deleterious materials need to be removed along with any permafrost, if found. This will provide suitable foundations for both the WRP and the seepage collection pond.
The toe of the WRP will be at an elevation of 937 m and proceed up the valley with an overall external slope of either 2:1 (H:V) to an elevation of 1,105 m or 2.5:1 to an elevation of 1,160 m, with the slope angle adopted to be based on detailed design results. The exterior slope will have benches to capture contact surface runoff and divert this to the collection pond. The rock portion of the WRP will be developed from the bottom up to provide a stable platform (refer to Figure 18-15 for the WRP preliminary design with an overall slope angles of 2:1).
The WRP has been designed with a water management system. A seepage collection pond will be constructed below the WRP. The pond will be constructed by placing a berm (2H:1V slopes) across the small valley and the pond will be lined with geomembrane along the upstream side. The collection pond was designed for the 100-year return runoff flow, based on the ultimate WRP footprint. Contact water collected in this pond will report to the WSP via a pipeline along the haul road to a collection sump adjacent to the ROM stockpile. The seepage collection includes an emergency spillway located on the southwest abutment. At the toe of the WRP, a shallow interception structure will be installed into the bedrock to intercept shallow groundwater. Water collected in this structure will also report to the seepage collection pond. Runoff will be diverted around the WRP by, diversion channels around the east and west sides connecting to Harrison Creek. The diversion channels will be designed for a 100-year storm event.
Slope stability analyses were performed for both the WRP and the seepage collection pond berm. Limit 2-D equilibrium analyses were performed using SLOPE/W from Geostudio 2007. The results of the analyses showed factors of safety that exceeded the prescribed requirements (1.5 static and 1.1 pseudo-static) and therefore the feasibility design is determined to be stable.

Prairie Creek Page 2 26
NI 43-101 Technical Report on Preliminary Economic Assessment October 15, 2021
Figure 18-14: Proposed site of WRP Storage facility
Note: Figure provided by NZC, 2021.

Prairie Creek Page 2 27
NI 43-101 Technical Report on Preliminary Economic Assessment October 15, 2021
Figure 18-15: Proposed Waste Rock Storage facility layout
Note: Figure provided by Golder, 2020.

Prairie Creek Page 2 28
NI 43-101 Technical Report on Preliminary Economic Assessment October 15, 2021
18.25 Laydown Areas
The Prairie Creek Mine occupies a constricted site in the bottom of the Prairie Creek valley. The available space will have to be carefully managed for use as a laydown area for inbound freight and outbound material.
A portion of land at the North-West corner of the site will be used for this purpose. A container storage area on compacted gravel will also be provided on the northern side of the air strip to provide short-term storage of concentrate and consumables containers as they are readied for transport to and from site.
18.26 Transportation
18.26.1 Site roads
The existing site contains a number of roads connecting the various facilities, the longest being a 1 km length to the airstrip. These roads are in good shape and will require on-going maintenance for use throughout the year. A road to the new WRP will be constructed to accommodate the waste rock haul trucks as shown in Figure 18-16.
The newly designed haul road from the mill to the WRP consists of a 4 m wide gravel road with a maximum sustained grade of less than 11%. The vehicular traffic load is expected in the order of 40 to 50 tonne Gross vehicle weight (GVW).
Figure 18-16: Proposed Waste Rock Haul Road Typical Cross Section
Note: Figure prepared by Ausenco, 2021.

Prairie Creek Page 2 29
NI 43-101 Technical Report on Preliminary Economic Assessment October 15, 2021
18.26.2 All-season road
The existing mine plant was hauled in over a winter road and the mine was fully permitted to operate on a winter road basis in 1982. When NZC obtained new operating permits in 2013, this included a winter road permit. Access limited to winter roads, however, would cause some constraining issues, namely:
• large working capital needed to support concentrate sales once a year;
• need to forecast materials and equipment 18-24 months in advance;
• risk of late freeze / early thaw, compromising both inbound and outbound freight campaigns. This is especially significant in view of the airstrip being too short for large freight aircraft; and
• competition with other winter road users for crews and equipment.
Accordingly, NZC applied for permits to construct an all-season road, substantially following the winter road alignment as shown in Figure 18-17.
Figure 18-17: Proposed route of the all-season road into Prairie Creek Mine
Note: Figure prepared by NZC, 2021.

Prairie Creek Page 2 30
NI 43-101 Technical Report on Preliminary Economic Assessment October 15, 2021
The all-season road will be purpose built to support the transportation needs of the mine to transport consumables in and salable product out of the site.
The total length of the road is 169.5 km commencing from Highway 7 (approximately 131 km north from BC border) through to the mine site. The road has been designed to accommodate conventional commercial transport traffic, based on the low traffic volumes of up to 25 trucks per day. The design of the road incorporates localized cut and fill construction and the use of local borrow.
The road traverses mixed low valley bottom terrain, higher elevation plateaus, and rugged mountainous valleys and passes. The route includes a total of 19 major watercourse crossings which will include nine bridge structures, nine large / multi large culverts, and a combination ice bridge / barge crossing over the Liard River. The crossings have been designed to meet the life cycle of the mine with the consideration of the total number of loads and the ability to plan preventative maintenance operations.
Construction is projected to start in 2021 and to continue through to Q4 2024. The construction program has been developed to have an operational road for the winter of 2021/2022 with the final all-season road operational for Q4 2024.
18.27 Logistics
The Prairie Creek Mine location will require significant logistics management for the efficient movement of people to and from the site, supplies inbound, and concentrates outbound.
18.27.1 Operations movement
The site workforce will work on a regular fly-in-fly-out rotation (two weeks on and two weeks off). Fort Nelson and Yellowknife are the nearest communities served by scheduled air services with large aircraft. Additional movements per year may be anticipated for visitors and senior management.
NZC will charter flights from one or both of Fort Nelson and Yellowknife, depending on the availability and reliability of scheduled services. Yellowknife is farther from the site than Fort Nelson but is more easily accessible for a workforce that may be recruited from all parts of Canada and offers a wider range of charter aircraft.
The Prairie Creek airstrip is usable by DHC-7 aircraft, which will suffice for all foreseeable passenger movement needs. Flights will be restricted to day visual flight rules conditions; some weather delays may be anticipated.
18.27.2 Inbound freight
Construction of the project will be serviced by winter roads for initially moving construction freight to the site and to mobilize equipment for the construction of the all-season road. The all-season road will be used to move freight over the life of the mine during operations. With the assistance of a barge to facilitate movements across the Liard River and the removal of seasonal load limitations on any existing roadways through negotiations with the North West Territories Department of Infrastructure , the maximum interruption anticipated is a few weeks per year.
The bulk of the inbound freight will consist of food, diesel fuel, equipment, spare parts, mining consumables, mill reagents and general supplies to support the operation.

Prairie Creek Page 2 31
NI 43-101 Technical Report on Preliminary Economic Assessment October 15, 2021
18.27.3 Outbound Concentrate
The current logistics system envisages moving concentrate over an all-season road to market in bulk containers comprising the following general operating areas and transport route segments:
• bulk handling and buffer storage of lead and zinc concentrate at the mine site;
• loading of open top bulk containers (with lids) and temporary storage at the mine site for both loaded and empty containers;
• transfer of loaded containers to B-train container haul trucks (incl. removal of empties);
• trucking from the mine site to Liard Highway #7 (NWT) on an all-season road, which includes crossing the Liard River using either a barge, ice bridge or a bridge structure as potential future development;
• trucking from Liard Highway #7 (NWT) to Fort St. John, British Columbia (BC) where containers will be staged at an intermodal storage yard facility;
• transfer of containers onto flat deck rail cars for movement to Vancouver, BC;
• concentrate will be subsequently loaded from the container onto bulk carrier vessels for overseas export; and
• empty containers will be returned to site along the same route.
A transportation plan was developed, which investigated alternative transport routes and ports of export. It was determined that the most viable route was to truck to Fort St. John and rail to Vancouver.
The concentrate is transported by containers to the Port of Vancouver over the proposed route shown in Figure 18-18 and empty containers will follow the similar route back to the mine site. There are some synergies that can be exploited in the use of these empty concentrate containers for movement of consumables for the mine, such as grinding media and reagents. When in use, LNG will be moved using LNG tank containers with an ISO footprint to the mine using the same container truck fleet. The proposed truck fleet for hauling concentrate will provide sufficient space for up to a 5,000 litre fuel tank behind the cab or on the bridge of the trailer. With this configuration the mine can be re-supplied with fuel up to a capacity of 65,000 litres/day during hauling operations.

Prairie Creek Page 2 32
NI 43-101 Technical Report on Preliminary Economic Assessment October 15, 2021
Figure 18-18: Total haulage route to Vancouver
Note: Figure prepared by NZC, 2021.
NZC engaged Vancouver-based shipping brokers, logistics consultants and port operators to produce plans and cost estimates for receiving and shipping concentrate onward from the CN Rail terminus in Vancouver to prospective ports and overseas destinations, and alternatively to smelters in Canada. NZC has estimated transportation costs accordingly.

Prairie Creek Page 2 33
NI 43-101 Technical Report on Preliminary Economic Assessment October 15, 2021
19 MARKET STUDIES AND CONTRACTS
19.1 Concentrate Market Outlook
19.1.1 Zinc Concentrate Market Outlook
The Prairie Creek mine is expected to commence production in 2024, and the requirement for zinc and lead concentrates is substantial over the time period which the mine will operate. Mines are a finite resource, thus when forecasting into the future it is normal to see the total production of the current operating mines decreasing. This gap in supply is normally filled with new mines coming into production or extensions of existing mines.
For purposes of the Prairie Creek mine project the relevant time frame is from 2024 onward when the project is scheduled to commence production. There is possible attrition and closures of some significant mines in this time period. The world’s largest zinc mine, Red Dog in Alaska current mine life is until early next decade. Mount Isa in Australia, also one of the largest mines is forecast to significantly decrease in production around 2025 as the Lady Loretta pit comes to its end of life. Antamina in Peru, which recently has been in the top 3 largest zinc mines will enter a lower zinc phase later this decade. The Empire State mine in the United States current mine life is also near term which is relevant as it also contains a significant level of Hg. Other significant possible mine closures come from San Cristobal, Cannington, Kidd Creek, Perkoa, Zyryanovsk and Bisha.
Committed new mine projects during this time frame are less numerous. Ozernoye in Russia is the only significant sized mine project currently known to be under construction. Mehdiabad in Iran is thought to be commencing with small scale mining of oxide ores. There are no other known significant zinc mine projects that have been committed.
There are numerous projects in the development stage, which usually means they have not completed bankable feasibility studies, permitting or secured financing. Some of the significant ones are Dairi in Indonesia, Howard’s Pass in the Yukon, Hermosa/Taylor in Arizona, Huoshaoyun in China and the Gamsberg expansion in South Africa.
In China, domestic mine production has been flat in the last decade. Therefore, China has moved from being a net exporter of zinc concentrate to a significant importer. This is a result of the efforts in China to consolidate the industry and application of more stringent environmental requirements on mining.
On the demand side zinc consumption is expected to be stronger than historical as a result of the decarbonization trend worldwide as zinc consumption is correlated with infrastructure growth. Over the last decade zinc consumption growth has been strong in Asia, especially China. This is expected to continue as the Chinese economic growth continues to be strong.
Zinc smelter growth has come mainly from China as the economy continues to expand. This has been from new smelters as well as expansion of existing smelters. Growth in the rest of the world has been primarily incremental brownfield expansion. Recently Boliden has announced the expansion of the Odda smelter in Norway from 200,000 mt of refined zinc to 350,000 mt per year. The expansion is forecast to be complete at the end of 2024 and in itself will require an additional 300,000 tonnes of zinc concentrate feed. This is particularly significant to the Prairie Creek Project because the Odda smelter has capability for processing concentrates containing mercury.
Subsequently the requirement for additional mine production in the period of the Prairie Creek mine is significant. The Figure below shows the zinc concentrate supply requirement as forecasted by Wood Mackenzie. The current base case mine production estimates, which includes committed projects, falls significantly short of filling the gap. In order to meet

Prairie Creek Page 2 34
NI 43-101 Technical Report on Preliminary Economic Assessment October 15, 2021
the requirement for more mine production a combination of mine life extensions and probable mine projects will be required. Prairie Creek is a probable project in the forecast.
If a large number of the probable projects came into production on time, potentially, there is an oversupply of concentrate in the near term. In reality this unlikely to happen as the challenges of resource development, permitting and financing defer many of these projects.
Figure 19-1: Requirement for Zinc Mine Supply
Note: Figure prepared by Wood Mackenzie, 2021.
The relative economic attractiveness of a project is an important aspect. Those mine projects which have the lower cost structure should be the first projects to fill the supply gap. This is best illustrated by the Normal C1 Cash Cost Curve from Wood Mackenzie shown below. This evaluation considers the cash operating costs and accounts for the by-product credits. This includes all mines which are forecast to be operating in 2027 when Prairie Creek will have been operating for several years. According to the estimated C1 by-product costs of $0.19/lb Zn in this PEA, this would place Prairie Creek in the lowest third of all projected mine operating costs in that year.
Thus, with its low operating cost structure and advanced project status, Prairie Creek is well positioned to fill the requirement for zinc mine supply.
4000
6000
8000
10000
12000
14000
16000
18000
2012 2016 2020 2024 2028 2032 2036 2040
kt Z
n
Probable (bankable feasibility) Projects
Probable (financing) Projects
Possible Mine Life Extensions
Base Case Production Capability
Requirement for Zinc Mine Production
Source: Wood Mackenzie

Prairie Creek Page 2 35
NI 43-101 Technical Report on Preliminary Economic Assessment October 15, 2021
Figure 19-2: Zinc Normal C1 Cast Cost Curve
Note: Figure prepared by Wood Mackenzie, 2021.
19.1.2 Lead Concentrate Market Outlook
The majority of lead metal is supplied through the recycling of batteries. Growth in demand must be met through additional primary mined lead supply. However, lead is a by-product metal usually from zinc, silver and copper mining. Similar to zinc, there is a general trend of more attrition in lead concentrate production as opposed to expansion as several zinc-lead mines come to the end of their mine life. The possible closure of Cannington later in the decade would be a significant loss of lead production as Cannington is the mine which typically sets the benchmark for high silver lead concentrates. On the supply side, one significant new lead mine project is the Hermosa/Taylor project which is forecast to be a significant lead concentrate producer.
The Wood Mackenzie lead mine supply gap below shows the same trend as the zinc supply gap. In order to meet the requirement for future mine supply a combination of mine life extensions and probable mine projects will be required to come into production. However, as previously discussed, the decision on lead projects is strongly influenced by the economics of other commodities, especially zinc and silver. This aspect of the lead market makes it more challenging to forecast future supply.

Prairie Creek Page 2 36
NI 43-101 Technical Report on Preliminary Economic Assessment October 15, 2021
Figure 19-3: Requirement for Lead Mine Supply
Note: Figure prepared by Wood Mackenzie, 2021.
19.2 Concentrate Quality
19.2.1 Prairie Creek Zinc Concentrate Quality
The Prairie Creek Zinc Concentrate quality is characterized by its high Zn grade, low Fe, Cd which is above the import limit to China and high Hg. The Zn and Fe grades are attractive from a smelting perspective. The Cd level will require a portion of the concentrate to be blended prior to delivery to China. Finally, the Hg is a negative aspect because it creates waste by product and requires more attention in the smelters.
However, the low Fe content is of great benefit in the zinc smelting process. In a typical Roast-Leach-Electrowin (RLE) zinc smelter, the iron in the concentrate becomes an iron residue waste. A typical zinc smelter produces between 0.5 – 0.9 tonnes of iron residue for every tonne of zinc. That is to say a medium size zinc smelter producing 300,000 tonnes of zinc metal annually will also produce between 150,000 and 270,000 tonnes of iron residue. These residues are considered hazardous wastes and are typically dealt with by disposal as a hazardous waste, pyrometallurgical treatment or indefinite storage.
The benefit to a zinc smelter in terms of reduced hazardous waste quantity is large. The forecast Fe content of Prairie Creek is 2%, where a typical zinc concentrate contains 8% Fe. Conversely the Hg content is estimated to be on average 0.16%. Thus, Prairie Creek adds 0.16 % Hg but 6% less Fe.
2000
3000
4000
5000
6000
2012 2016 2020 2024 2028 2032 2036 2040
kt P
b
Probable Projects
Possible mine life extensions
Base Case Production Capability
Requirement for concentrate
Source: Wood Mackenzie

Prairie Creek Page 2 37
NI 43-101 Technical Report on Preliminary Economic Assessment October 15, 2021
Zinc concentrates typically contain some level of Hg. Notably Red Dog, Rampura Agucha and Mt Isa which are 3 of the top 5 zinc mines in the world all contribute significant amounts of Hg. In addition, Gamsberg, San Cristobal, McArthur River, Neves Corvo, Aljustrel and Aquas Tenidas are major zinc concentrate smelter feeds which contain significant Hg. For this reason the majority of the Western World zinc smelters have the capability to remove Hg.
Prairie Creek is not unique as a zinc concentrate containing significant levels of Hg. It is expected to rank third in terms of total Hg produced behind the Aljustrel and Neves Corvo mines.
19.2.2 Prairie Creek Lead Concentrate Quality
The Prairie Creek Lead Concentrate is characterized by its high Pb grade, medium Ag level, Hg content and material levels of Zn, Cu and Sb by-products. The Hg level is significant but much less of an impact than in the Prairie Creek Zinc Concentrates. The Ag, Zn, Cu and Sb by-products are attractive to most Chinese lead smelters. A portion of the concentrate will likely exceed the Hg import restriction level for China, this material would need to be blended prior to delivery.
19.3 Marketing Plan and Timing
The primary market for Prairie Creek Zinc Concentrates will be Canada and Europe, the estimated total smelting capacity in these two regions totals 2,570,000 tonnes of refined zinc production annually. This results in a zinc concentrate feed requirement of 5.1 million dry metric tonnes. Prairie Creek would therefore be just over 1% of the feed in these markets. Therefore, it is very reasonable to assume that the concentrate can be sold into this market.
The marketing plan for the zinc concentrate is to reach sales agreements for the majority of the production for a duration of 5-10 years or more for delivery to smelters that have capability for treating concentrates with mercury.
For the lead concentrate the plan is to reach sales agreements for a significant portion of the concentrate for a duration of up to 5 years or more.
The provisional sales plan is as follows.
Table 19-1: Provisional Sales Plan
Location Smelters Zn Concentrate (dmt/yr) Pb Concentrate (dmt/yr)
Canada Trail, Valleyfield 10,000-40,000 0-20,000
Europe Auby, Aviles, Balen, Budel, Kokkola,
Nordenham, Odda, Porto Vesme, Stolberg 60,000-100,000 0-20,000
China 90,000
Mexico Torreon 0-20,000
Australia Port Pire 0-40,000
The process for establishing a sales agreement for concentrates typically takes several years and Prairie Creek continues to make progress in its concentrate marketing strategy. The marketing plan is to finalize sales agreements once the major commitments of permitting and financing have been reached. It is at this time that the receiving smelter is in a position to make a contractual commitment to begin processing the concentrate at a specific time in the future.
The interim stages that can be established in the marketing process are:

Prairie Creek Page 2 38
NI 43-101 Technical Report on Preliminary Economic Assessment October 15, 2021
Memorandum of Understanding (MOU) / Letter of Intent (LOI) – These are non-binding formal expressions of interest between the Seller and Buyer in further discussion toward an agreement. These are not a requirement but are a formal documentation of expression of interest. The timing to establish these documents based on the current project schedule is from H2-2021 through 2022.
Memorandum of Agreement (MOA) – This is a binding agreement on the major terms and conditions between the Seller and Buyer. This typically occurs when permitting and financing for the mine is in place.
Sales Agreement – This is the full contractual language for the agreement between the Seller and Buyer. The Sales Agreement wording would be expected to be reached within several months after signing a MOA, but prior to the start of the mine operation.
Table 19-2: Marketing Plan Timing
Type Explanation Timing
MOU / LOI Memorandum of Understanding / Letter of Intent H2-2021, H1-2022
MOA Memorandum of Agreement (Terms Sheet) Upon financing and permitting
Sales Agreement Detailed contractual agreement based on MOA Prior to start of the mine
19.4 Current Status
Discussions have been ongoing with potential Buyers of the concentrate and the Prairie Creek Mine project is well known in the market place. A non-binding Memorandum of Understanding (“MOU”) has been signed with Boliden which extends the validity of the existing MOU to June 30, 2023 from its original expiry date of June 30, 2022 and significantly increases zinc sulphide concentrates to be delivered to Boliden, with exact annual quantities to be mutually agreed.
Boliden has two zinc smelter operations, one in Norway and one in Finland. Boliden is a metals company with a focus on sustainable development. Boliden’s roots are Nordic, and its market global. Boliden’s core competence lies within the fields of exploration, mining, smelting and metal recycling.
Along with the formal MOU process. Negotiations have been proceeding with several other Buyers of the concentrates. As such, formal offers have been received by NorZinc which exceed the total forecast production of the mine. These negotiations will continue and are expected to proceed to formal agreements as the development of the mine progresses.

Prairie Creek Page 2 39
NI 43-101 Technical Report on Preliminary Economic Assessment October 15, 2021
20 ENVIRONMENTAL STUDIES, PERMITTING, AND SOCIAL OR COMMUNITY IMPACT
Operating permits were received for the Mine site in 2013, and at that time the operation was to be supported by winter road access. The Project now envisaged, with a production capacity of approximately 2,400 t/day, will be supported by all-season road access. In terms of Mine site facilities, most will remain the same for the expanded project. The main differences are a much larger WRP, larger stockpiles for oremineralized material and tailings, and a larger accommodation complex.
20.1 Environmental Studies
20.1.1 Biophysical Setting
The Project is located in the southern Mackenzie Mountains in south-west Northwest Territories. The Mine site facilities are situated on the eastern side of and adjacent to Prairie Creek, about 43 km upstream from its confluence with the South Nahanni River, and approximately 7 km upstream of the point where Prairie Creek crosses the boundary of the expanded Nahanni National Park Reserve (NNPR). The South Nahanni River flows into the Liard River near Nahanni Butte, 100 km downstream from Prairie Creek. The Liard River merges with the Mackenzie River at Fort Simpson, a further 175 km downstream.
The Mine site is at an elevation of 870 m above mean sea level (AMSL) and is situated in topography characterized by low mountains and narrow valleys that vary in elevation from approximately 870 m to 1170 m above sea level. The Mine site is located within the Alpine Forest-Tundra section of the Boreal Forest, characterized by stunted fir with limited undergrowth and open areas dominated by lichen.
The 170 km all-season road connecting the Mine to the Liard Highway leaves the Mine site (Km 0) heading north along the Prairie Creek valley for about 7 km before turning east to cross the Mackenzie Mountains. As the road climbs out of the Prairie Creek valley it enters Sub-Alpine Shrub and Alpine Tundra from an elevation of approximately 1000 m AMSL at Km 10. The road continues to climb through the Alpine to a summit of 1530 m at Km 17, then dropping down and leaving the Sub-Alpine again at the 1000 m elevation around Km 25. As the road drops from the 1000 m elevation to the 900 m elevation, it passes through a spruce-lichen Alpine forest zone similar to that found at the Mine site and then into Riparian Alluvial habitat in the Sundog tributary valley bottom.
From Km 40 to Km 55, the road crosses forest developed on glacial depositional deposits, and crosses Polje Creek which drains the Poljes (karst lakes) before ascending the Ram Plateau. As the road crosses the Ram Plateau, it passes through an open forest Black Spruce/Pine Parkland setting between the 830 to 930 m elevations, before dropping down into the Tetcela River valley. The valley consists of a mixed coniferous/deciduous closed forest. The road then passes through a short distance of muskeg open shrub/sedge wetland at the headwaters of Fishtrap Creek, and climbs up and over the Silent Hills, again a closed mixed coniferous/deciduous forest. The road alignment then runs along the eastern slopes of the Silent Hills, an area of black spruce, before passing through mixed coniferous-deciduous-pine parkland prior to entering the Grainger River headwaters at Grainger Gap (Second Gap), staying north of, and never crossing into, the Bluefish Creek basin.

Prairie Creek Page 2 40
NI 43-101 Technical Report on Preliminary Economic Assessment October 15, 2021
Once through the Grainger Gap, the road alignment turns south along the foothills of the Front Range through mixed deciduous coniferous forest towards Nahanni Butte, avoiding the Grainger Tillplain. The road crosses the Liard River near the community and continues through forest to the Nahanni Butte access road which after 10 km connects with the Liard Highway.
Both the Mine and ASR have been the subject of extensive baseline studies to support separate environmental assessments and to provide data for project plans (refer to the Developer’s Assessment Reports submitted during EA dated 2010 (Mine) and 2015 (ASR). Studies relating to the Mine environment include operation of a hydrometric station on Prairie Creek, collection of data on water quality, sediment, fish and other aquatic biota, as well as climate and wildlife studies. Baseline studies for the ASR included hydrometric stations, water sampling, extensive wildlife studies, terrain assessment and permafrost investigation.
There is extensive background information available on the Mackenzie Valley Land and Water Board’s (MVLWB’s) public registries (www.mvlwb.com), which includes environmental baseline studies; regulatory reports/documents; and socio-economic data. Much of this information has been compiled by NZC or has been collected as part of baseline and environmental assessment activities by consultants. Some of the baseline information collected at the site dates back to the 1970’s.
20.1.1.1 Terrestrial flora and fauna
Prevalent wildlife within the Project area include: Dall’s sheep; mountain woodland caribou; wood bison; wolverine; and grizzly bear. While potential impacts to mammalian mega fauna from mine operations are expected to be limited and largely avoidable, there is potential for effects associated with road use, such as mortality (primarily caribou and bison), and noise disturbance due to air traffic (primarily Dall’s sheep). The possibility exists for potential bear-human encounters at the site; however, programs to limit any attraction of bears will be implemented.
To help avoid potential interactions of wildlife with humans and project-related activities, a wildlife sighting and notification system will be adopted as part of a broader mitigation plan. Other mitigation measures include posted and enforced speed limits and the management of flight paths for air traffic.
No significant impacts to vegetation communities are expected due to the relatively small area of disturbance that will result from Project construction and operations.
20.1.1.2 Terrain and stability
No large-scale landslide features are evident near the mine and access road. The Mine site is protected by an armoured flood protection berm designed to withstand the 1:100 year return period flood. The main engineered structure associated with the Project will be the WSP. Stability analyses for the dyke structures of the pond have confirmed they are stable assuming a peak ground acceleration of 0.246g, corresponding to a 2,475 year return period seismic event.
Sections of the access road were re-aligned to firmer ground for ASR construction and to avoid permafrost and potential terrain issues as much as possible. Changes were also made to avoid wetlands and key wildlife habitat, and proximity to karst features.

Prairie Creek Page 2 41
NI 43-101 Technical Report on Preliminary Economic Assessment October 15, 2021
20.1.1.3 Aquatic environment
Bull trout and mountain whitefish have been documented in Prairie Creek near the Mine in multiple surveys (Ker Priestman (July, 1980), Beak Consultants (March, April, May, September 1981), Rescan (May-June, September 1994), and Mochnacz, DFO (August 2001). No evidence of spawning has been found adjacent to or downstream of the Mine site; however, bull trout were found to spawn in Funeral Creek (DFO, 2005), an upstream tributary of Prairie Creek, the valley of which is used for part of the road route.
Based on the site water management plan and water quality predictions (NZC, 2012), effluent discharge via an exfiltration trench will not impact the aquatic environment and will meet downstream water quality objectives. An exfiltration trench for effluent discharge will be installed below the bed of Prairie Creek and only part-way across the channel (Northwest Hydraulics, 2011). These plans and predictions formed the basis of the effluent regulation contained in the Water Licence issued by the MVLWB in 2013.
20.1.2 Socioeconomic Setting
The Project is within the claimed traditional territories of the Nahɂą Dehé Dene Band (NDDB) and the Łı́ı́dlı̨ı̨ Kųę́́ First Nation (LKFN). The nearest community is Nahanni Butte, home of the NDDB, located approximately 90 km to the southeast of the Project site. Other communities within 200 km of the site include Fort Simpson, Fort Liard, Trout Lake and Jean-Marie River.
Resource development and other industrial projects are next to non-existent in the region. The major employer is government. Limited education, high unemployment, low income levels, sub-standard housing and social issues are typical of local communities. Although the region has low employment, the Dene of the region have a rich cultural history and strong community that can see benefits from an economic project. With Mine development, there would be a period of adjustment as people and communities integrate into the wage economy.
20.1.3 Environmental Risks and Opportunities
Permitting of the Prairie Creek Mine and ASR have been challenging given that the Mine site is on land surrounded by a national park and world heritage site, and the access road has to cross the park to connect to transportation links. Expectations for environmental protection are high and translate into extensive monitoring and management plans and oversight. Prairie Creek is an essentially pristine mountain stream, and as a result downstream water quality objective must be met for the protection of aquatic life.
Approximately 5 km of underground workings were previously developed at the Mine site and include an adit that discharges mine water by gravity, requiring treatment for discharge. Mine development will include backfill and sealing of the mine openings such that mine water discharge will not exist after mine closure.
20.2 Waste Management and Water Management
20.2.1 Waste Management
NZC evaluated the potential for acid rock drainage and metal leaching (ARD/ML) from mine wastes. Mesh Environmental Inc. (Mesh) undertook a broad geochemical study in 2005 and 2006, which analyzed mineralized rock samples, tailings and waste rock. Laboratory work conducted as part of this study to assess acid rock drainage included: acid-base accounting (ABA); total inorganic carbon and multi-element Inductively Coupled Plasma (ICP) analyses on all samples; mineralogy;

Prairie Creek Page 2 42
NI 43-101 Technical Report on Preliminary Economic Assessment October 15, 2021
expanded ABA (pyritic sulphur, siderite correction, acid-buffering characterization curves); and grain size analyses on a sub-set of samples. Mesh made the following conclusions regarding the study:
• all tested host rock units are non-acid generating due to low quantities of sulphur and the substantial effective buffering capacity provided by reactive Mg containing carbonates (dolomite);
• dolomite presence in some waste materials represents a low risk of elevated salinity associated with neutral mine drainage; however, environmental factors (higher rainfall, lower year-round temperatures) are likely to reduce incidence;
• vein and stratabound mineralization classify as potentially acid generating due to an abundance of sulphide mineralization (although Mesh’s kinetic test data collected up to December 2006 suggests that it may take a substantial amount of time for acidity to be generated, due to the significant amount of buffering capacity available from the carbonate host rocks);
• dense media separation (DMS) rock is non-PAG and contains relatively low sulphur values; and
• flotation tailings are classified as non-PAG and contain sufficient buffering capacity to maintain neutral conditions under laboratory conditions.
Mesh also evaluated potential metal leaching as part of their study program. Samples were collected from underground seeps and portal discharge. Short-term leach extraction tests were completed on rock, tailings and concentrate samples. In addition, kinetic testwork was carried out on two mine wall-wash stations (one host rock and one mineralized sample) and on seven humidity cells. The following conclusions were made:
• waste/host rock have the potential to release soluble metals such as cadmium, copper, mercury, lead, strontium, and zinc at neutral pH conditions, mainly as a result of metal carbonate dissolution and, to a lesser extent, sulphide oxidation (note predicted rates of soluble metal release were considered to reflect a worst case scenario);
• under neutral pH conditions, DMS rock could potentially release elevated concentrations of a number of metals of environmental concern such as arsenic, strontium, cadmium, copper, lead, mercury, selenium, gold, and zinc;
• under neutral pH conditions, tailings have the potential to release metals such as arsenic, cadmium, copper, lead, mercury, selenium and zinc at levels of potential environmental concern (release rates similar to those for DMS rock material); and
• dissolved metals are typical for flotation supernatant.
The current Project plan includes the placement of the flotation tailings from the mill underground into the mined out voids as a paste backfill mix. DMS reject rock, together with waste rock from mine development, will be placed in an engineered WRP located in a draw of Harrison Creek. This approach has two clear advantages:
• Following mine closure, there will be no mine waste on the Prairie Creek floodplain; and
• The underground workings will be backfilled and sealed, reducing pathways for mine drainage egress.
During operations, seepage from the WRP will be collected at the toe of the pile in a lined seepage collection pond. The pond will be connected to the site water management system by pipeline.

Prairie Creek Page 2 43
NI 43-101 Technical Report on Preliminary Economic Assessment October 15, 2021
Testing has confirmed that mine and mill wastes have the potential to leach metals at neutral pH. For this reason, a closure and reclamation strategy has been selected specifically to minimize metal leaching, primarily by placing tailings underground and placing an engineered cover over the WRP.
20.2.2 Water Management
In 2010, NorZinc commissioned the Saskatchewan Research Council to complete a study of background metal concentrations in Prairie Creek to assist with the development of site specific water quality guidelines for the Project. Hatfield Consultants continued this work in 2012. Based on the findings of these studies and site specific water balances, it was predicted that the planned discharges from the Mine during operations would result in metal concentrations in Prairie Creek that would not exceed the proposed objectives, which were adopted by the MVLWB when the Water Licence was issued. NorZinc has developed a discharge strategy based on monitoring flows in the creek and determining the effluent volume that can be safely discharged without causing exceedance of objectives, with water being stored temporarily in the on-site WSP.
There are three main sources of water that will need to be managed during mine operations, other than diverted runoff. These are:
• waste rock dump and stockpile seepage water;
• groundwater intercepted underground and pumped to surface as ‘non-contact mine water; and,
• process water from the mill.
The groundwater may contain elevated metals. Seepage water may contain for elevated metal concentrations. The process water is expected to contain high concentrations of a number of metals plus residues from flotation chemicals.
A large, ponded facility was originally built on site with dykes and a clay lining and intended for tailings disposal. This pond will be re-engineered (including the installation of a new synthetic liner) as a WSP for the Project. The WSP will consist of two cells, one for mainly the groundwater from underground, and the other for mainly mill process effluent. Up to 50,000 tonnes of flotation tailings may also be placed in the process effluent cell as a contingency if surface storage capacity is unavailable. The tailings will be reclaimed from the pond at a later date, likely at mine closure, and placed underground.
During operations, the WSP will supply feed water to the mill from Cell A. Mine drainage coming into contact with the mine workings will be recycled to stope drills, and the remainder sent to Cell A. Cell A will also receive seepage and runoff from the Waste Rick Pile and stockpiles. A water balance will be maintained due to water losses to concentrates and tailings backfill. Cell A will provide the main source of water to the Mill, with no discharge to the environment.
The groundwater drawn from the vein structure up-gradient of the mine workings will be sent to Cell B for temporary storage. Cell B water will be treated in a new treatment plant to reduce metal concentrations, as necessary, and then released to Prairie Creek. A detailed schematic of the water management system and narrative can be found in Figure 20-1 below.

Prairie Creek Page 2 44
NI 43-101 Technical Report on Preliminary Economic Assessment October 15, 2021
Figure 20-1: Process Flow Diagram Site Water Services

Prairie Creek Page 2 45
NI 43-101 Technical Report on Preliminary Economic Assessment October 15, 2021
Note: Figure provided by Ausenco, 2021.
The water level in Cell B of the WSP will fluctuate seasonally, increasing in the winter as water is accumulated in storage, and decreasing in the summer when water is discharged at a higher rate.
The treatment and release rate of water will vary depending on flows in Prairie Creek at the time of discharge in order to meet in-stream water quality objectives. Effluent discharge in the NWT is typically regulated by a Water Licence that specifies end-of-pipe concentrations, and in some cases, volume restrictions. This will be the case for the Prairie Creek project, with volume restrictions in the form of an established creek to effluent flow ratio.
NZC will establish a permanent, automated flow monitoring station on Prairie Creek. Flows would be monitored continuously, with data relayed to the Water Treatment Plant (WTP) in real time. A flow monitoring protocol has been developed to convert creek water levels to reliable flow rates, no matter the circumstance. This accounts for seasonal effects, high water events, and ice cover. This ensures the effluent flow calculation will always be based on creek flows that are known to exist with a high degree of certainty. Monitoring of discharge flows will be automated, with data relayed continuously.
The discharge of the final combined effluent from the site will be achieved via an exfiltration trench located below the bed of Prairie Creek. This exfiltration system will promote mixing of the effluent with the receiving waters.
20.3 Environmental Management
The majority of mine activities, and those associated with chemicals, fuel and hazardous material, will take place within a dyke-protected area, isolated from Prairie Creek. Any spills or contamination can be contained on site, and discharge of site water to the environment can be stopped temporarily. Spilled liquid could infiltrate, but the shallow water table would carry the liquid to the final site collection pond where it could be collected and managed. Specific chemicals and fuels, such as diesel, will have their own dedicated containments. Most other chemicals will be non-liquid in nature and will be stored in warehouses.
The potential for spills or leaks along the access road will be minimized by controlling road use in terms of vehicle numbers and speeds and using industry-standard containers for transport and storage. Response equipment will be carried by every vehicle and will also be stored on the road at specific locations to facilitate a rapid response. Response efforts and spill collection will be focused at control points in the event of a spill. Six control points have been defined.
Mine concentrates will be transported in sealed containers, and thus concentrate dust should be minimal. Any spills would be completely recovered. To confirm the absence of impacts, road bed soil and vegetation samples will be collected along the route annually and compared to a baseline to confirm material is not being dispersed.
Given the remote location of the Project, there is currently no nearby development, and it is expected that there will be very little additional activity in the future which could contribute to cumulative effects.
20.3.1 Management Plans
Permits for project development include requirements to submit a number of detailed plans and conduct programs that are expected to mitigate such effects. For mine operations, documents that will need to be submitted and activities to be undertaken are:

Prairie Creek Page 2 46
NI 43-101 Technical Report on Preliminary Economic Assessment October 15, 2021
• Engagement Plan
• Final design, Construction drawings WRP
• Final design, Construction drawings OreMill Feed Stockpile
• Final design, Construction drawings WSP
• Final design, Construction drawings Exfiltration Trench
• Exfiltration Trench construction as-built report
• Final design, Construction drawings Engineered Structures
• Engineered Structures construction as-built reports
• Waste Management Plan
• Waste Rock and OreMill Feed Storage Monitoring Plan
• Contaminant Loading Management Plan
• Tailings and Backfill Management Plan
• Explosives Management Plan
• Water Management Plan
• Report on water treatment effluent quality optimization
• Update the Protocol for Real-Time Estimation of Prairie Creek Flows
• Terms of Reference for Plume Delineation Study
• Results of Plume Delineation Study
• AEMP Design Plan
• Spill Contingency Plan
• Failure Modes and Effects Analysis (FMEA)
• Mine Site Contingency Plan
• Closure and Reclamation Plan
• QA/QC Plan for SNP Water Sampling

Prairie Creek Page 2 47
NI 43-101 Technical Report on Preliminary Economic Assessment October 15, 2021
For the winter road and subsequent ASR, the following documents will need to be submitted:
• Spill Contingency Plan
• Engagement Plan
• Sediment and Erosion Control Plan
• Permafrost Management Plan
• Rare Plant Management Plan
• Invasive Species Management Plan
• Geochemical Verification Plan
• Traffic Control Mitigation, Operation and Maintenance Plan
• Explosives Management Plan
• Water Management Plan
• Interim Closure and Reclamation Plan
• Waste Management Plan
• Wildlife Management and Monitoring Plan
• Avalanche Hazard Management Plan
• Design and Construction Plan
• Cultural Heritage Protection Plan
20.4 Closure and Reclamation Planning
20.4.1 Closure schedule and cost estimate
Upon cessation of operations, closure activities at the Prairie Creek Mine site are envisaged to occur in three phases, as follows:
Phase I – On-site and off-site reclamation of all facilities not required for long-term monitoring and water treatment:
• Backfill underground workings;
• Mine and mill equipment removal to WRP;

Prairie Creek Page 2 48
NI 43-101 Technical Report on Preliminary Economic Assessment October 15, 2021
• Building and on-site infrastructure demolition;
• WSP – Tailings and Sediment removal and disposal;
• WSP – Liner removal and dyke breaching; and
• Substantial reclamation of the WRP, leaving a portion available for the disposal of final site items.
Phase II – Post-closure monitoring and water treatment:
• Monitoring over a period of 13 years, as described above; and,
• Treatment of mine water for six years, if required.
Phase III – Reclamation of post-closure facilities:
• Demolition of the post-closure facilities;
• Disposal of final demolition waste in the WRP;
• Final reclamation of the WRP; and,
Following Phase III at the Mine site, reclamation of the access road will occur.
The total amount of security deposits are as described in the issued permits associated with future operations and summarized in Table 21-3.
20.4.2 Closure and Reclamation Plan
Following mine closure, it is expected that there will be no surface drainage from mine portals as the underground workings and access tunnels will be backfilled with a paste tailings mix and sealed with bulkheads. Some groundwater seepage from the bedrock surrounding the underground workings may occur, with the water containing some metals, and to a lesser extent from the backfilled waste mixture. A small quantity of seepage from the covered WRP is also possible.
Predictions for Prairie Creek water quality after mine closure were made by Robertson Geoconsultants, with geochemical source terms provided by phase Geochemistry. The predictions indicate that all metal concentrations will remain within the water quality objectives for average creek flows year-round, although if creek flows are lower than normal in winter, zinc concentrations may exceed objectives but will be similar to those predicted to have occurred before any mine development. Post-mine predictions also indicate higher cadmium concentrations in Prairie Creek during the winter if creek flows are unusually low.
An interim Closure and Reclamation Plan (CRP) for the Prairie Creek Mine was prepared during the 2012-2013 permitting process and was updated in 2021 for the mine permit renewal applications. The principal difference is the assumption of a much larger WRP. The plan adheres to the 2017 MVLWB “Guidelines for the Closure and Reclamation of Advanced Mineral Exploration and Mine Sites in the Northwest Territories”.
A CRP is prepared at the permitting stage to demonstrate how the mine site can be reclaimed to protect the environment, and as a basis for estimating reclamation costs which allow a decision regarding a reclamation bond to be made.

Prairie Creek Page 2 49
NI 43-101 Technical Report on Preliminary Economic Assessment October 15, 2021
The following sections briefly describe temporary and permanent activities to close and reclaim the site.
20.4.3 Temporary Closure Activities
According to MVLWB, temporary closure is defined as a mine ceasing operations with the intent to resume mining activities in the future. Temporary closures can last for periods of weeks, or for several years based on economic, environmental, political or social factors.
20.4.3.1 Waste Rock Pile
Activities planned for the WRP during temporary mine closures include continued collection and management of seepage, maintenance of diversion ditches, and monitoring of physical stability and water quality.
20.4.3.2 Underground
The focus of activities underground would be on maintaining stability, safety and water management systems. Specific activities would include the following:
• Inspect open faces and access ways, and fence-off or install temporary support for any unstable areas;
• Ensure that mine drainage flows to sumps and that water pumping stations are active and maintained;
• Continue to monitor the operation of underground pumps and their flow rates;
• Ensure all explosives and detonators are removed from temporary storage areas and placed in secure magazines on surface;
• Remove all mobile electrical and other equipment not required during the shutdown to surface; and,
• Review ventilation requirements to assess if, and what, reductions can be implemented.
20.4.3.3 Process Plant
All process equipment, tanks and piping will be emptied to prevent problems on restart. Process water will be sent to the WSP. All concentrates within the processing circuit will be filtered and containerized. For extended temporary closures, the ball mill will be jacked up off its bearings to prevent wear.
20.4.3.4 Water Storage Pond
The WSP will continue to receive water from underground and the WRP. The latter would be directed to Cell B for later treatment and discharge, as necessary, to avoid accumulation in Cell A.
The Process Plant will not be producing process water.
Cell B of the WSP will be kept in balance by sending water to the WTP.

Prairie Creek Page 2 50
NI 43-101 Technical Report on Preliminary Economic Assessment October 15, 2021
20.4.3.5 Water Treatment Plant
The WTP will remain at full operational status and will be operated as required to maintain an annual balance in Cell B of the WSP.
20.4.3.6 On-Site Infrastructure
Any infrastructure facilities on-site that are not required during temporary closure will be taken off-line, such as some of the generator sets. Most facilities will need to stay in operation but at a lower utilization rate, such as the Sewage Treatment Plant, incinerator and power plant. All infrastructure will be maintained.
20.4.3.7 Off-Site Infrastructure
Off-site infrastructure is limited to the access road where.
no temporary closure activities are planned over and above the normal seasonal closures each year.
20.4.4 Permanent Closure Activities
The MVLWB defines permanent closure as when a mine exhausts ore reserves that can be economically extracted and ceases operations without the intent to resume mining activities in the future.
20.4.4.1 Salvage
Due to the remote location of the mine, only a portion of the mine assets are expected to have sufficient salvage value at mine closure to warrant transport off-site to a suitable market. The majority of the assets are expected to be buried either underground or in the WRP.
20.4.4.2 Waste Rock Pile
The WRP will store up to 5 Mt of waste rock and an additional 35,000 m3 of inert solid waste to provide landfill disposal. The following solid waste components will be landfilled following removal of all contaminants:
• all mobile equipment;
• all stationery equipment;
• all building structural materials;
• all construction materials; and
• all other solid materials.
At the completion of the mine reclamation landfilling, the landfill within the WRP will be covered with a minimum one-metre thick layer of waste rock. A cover will be placed over the WRP during mine reclamation to promote runoff and minimize

Prairie Creek Page 2 51
NI 43-101 Technical Report on Preliminary Economic Assessment October 15, 2021
infiltration and the generation of leachate. An initial cover design study recommended a 1 to 2 m thick ‘till’ (clayey soil) layer be applied. The cover is part of the current closure plan, but the design will be reviewed during operations.
The selected cover design will be based on data from seepage monitoring during the mine life, and predictions of cover behaviour, long-term waste rock seepage, and the resulting groundwater and surface water quality.
At mine closure, the seepage from the WRP may need to be temporarily directed to water treatment (see ‘Underground’ below re receiving water quality predictions).
20.4.4.3 Water Storage Pond
At the point that the WSP is no longer required for mine operations or reclamation activities, it will be reclaimed as follows:
• water in both cells will be processed through the WTP and discharged;
• sediment and any remaining tailings in the WSP will be removed and sent to the Paste Backfill Plant to be subsequently deposited underground;
• when the WSP is free of contaminated solids and water, the liner will be removed and placed in the WRP; and
• the WSP embankment will be breached in two places to prevent the structure from impounding water, and the locations of discharge to Prairie Creek will be stabilized as necessary to limit erosion and sedimentation.
20.4.4.4 Underground
The intent is to backfill and seal the underground workings and all access tunnels. The workings will be sealed all the way out to the portals. Hydraulic bulkheads have been included in closure plans to ensure the tunnels do not provide seepage pathways.
After mine closure and underground backfill, groundwater levels will slowly rebound in the mine area, flooding any remnants of the workings. Some groundwater movement may occur along the edges of the backfilled area where the wall rocks are fractured, and within the workings where gaps remain between the backfill mix and the roof that could not be filled, or where the mix has settled. Predictions have been made regarding the quality and movement of this groundwater to surface, and the resulting impact to the quality of surface water (see above). These predictions indicate that surface water quality objectives will be met without a need for further actions. While the predictions will be refined during operations and at mine closure, as a contingency, a short-term groundwater pumping and water treatment scheme has been devised and provided for in security estimates.
The pumping system will consist of a well installed from surface into the core of the backfilled workings. Pumping would occur during open water months to depress groundwater levels, and pumping would stop in winter allowing water levels to rebound. In this way, the Mine void would be used as a sump. Pumped water would be sent to a scaled-down mine water treatment circuit in the WTP, followed by discharge to the environment. The WTP would also receive seepage from the WRP if deemed necessary. Over time, the quality of groundwater underground and WRP seepage is expected to improve as leachable metals diminish. Therefore, the contingency pumping scheme, if required, would be expected to operate for four to eight years. Six years was assumed for security estimates.

Prairie Creek Page 2 52
NI 43-101 Technical Report on Preliminary Economic Assessment October 15, 2021
20.4.4.5 Mine Equipment
Mine equipment containing hydrocarbons will be removed from underground before mine closure. Inert equipment will be left.
Equipment and material that is salvageable will also be removed. Equipment and material that has no salvage value will be decontaminated and either moved back underground or placed in the WRP.
20.4.4.6 Process plant and on-site infrastructure
All surface facilities including the Process Plant, Paste Plant, Administration, Camp, Sewage Treatment Plant and Tank Farm will be reclaimed as follows:
• evaluate and store for removal all wastes that do not qualify for disposal in the WRP; and
• dismantle all equipment and building structures, reduce the material to manageable pieces, and place them in the WRP.
For the post-closure monitoring phase, a scaled-down mine water treatment circuit may remain, along with reduced accommodations, fuel storage and warehouse facilities.
20.4.4.7 Off-Site Infrastructure
The road will be reclaimed by removing stream-crossing structures and culverts, grading/pulling back fill slopes, and scarifying surfaces to promote revegetation by the natural invasion of native species. Cross ditches/water bars will be installed as necessary to limit erosion and sedimentation.
20.4.5 Post-Closure Monitoring, Maintenance, and Reporting Program
Post-closure monitoring at the Mine site will include inspection of mine access barricades, the WRP cover and runoff controls, and reclaimed surfaces for erosion, and the collection of water samples. Water samples will be collected from Harrison Creek and Prairie Creek, and a limited number of groundwater wells. Three locations on Harrison Creek (one upstream and two downstream), three locations on Prairie Creek (one upstream and two downstream) are envisaged. The number and location of groundwater wells to be included will be determined during operations.
For the first three years after closure and reclamation, monitoring and inspections will occur monthly over the period March to November. In the following five years, monitoring and inspections will occur bi-monthly from May to September. In the final five years, monitoring and inspections will occur once a year in July (post-freshet). The intent of monitoring is to track the revegetation and stabilization of surfaces and confirm that water quality is as expected. An annual monitoring report will be provided to regulators.
Provision has also been made to operate the previously described mine water pumping and treatment system for six years after the groundwater level has rebounded to elevation 865 m.
Post-closure monitoring of the access road over 2-3 years will focus on surface stabilization and sediment controls, with water quality sampling primarily for turbidity/TSS to confirm the absence of issues.

Prairie Creek Page 2 53
NI 43-101 Technical Report on Preliminary Economic Assessment October 15, 2021
20.5 Permitting Considerations
20.5.1 Overview of the Regulatory Process
As the Mine Site is located within the Mackenzie Valley, all activity relating to land and water use at the site is subject to the Mackenzie Valley Resource Management Act (MVRMA). The Mackenzie Valley Land and Water Board (MVLWB) is responsible for regulating the use of land and waters and the deposit of waste on Crown Land used by the mine and its infrastructure. The MVLWB issues land use permits (LUP) and Water Licences for projects outside settled land claim areas in the Mackenzie Valley.
Applications for a LUP or a Water Licence are made to the MVLWB. Each application requires the inclusion of certain baseline and technical information, in the form of a Project Description Report (PDR). The information in a PDR is used to undertake preliminary screenings of applications to determine whether an application should be referred to the Mackenzie Valley Environmental Impact Review Board (MVRB) for EA or can proceed directly to regulatory review for the issuance of a LUP and / or Water Licence.
If an application is referred to an EA, the MVRB develops a work plan and terms of reference for the EA, including the preparation of a Developers Assessment Report (DAR). On completion of an EA, the MVRB, in their Report of Environmental Assessment (REA), can either reject the project, approve it with or without measures to enforce environmental mitigation actions, or refer the project to Environmental Impact Review (EIR) by an appointed panel. The REA is forwarded to the Minister of Crown-Indigenous Relations and Northern Affairs Canada (CIRNAC) for consideration. The Minister may do nothing, in which case the MVRB’s decision stands, or the Minister may seek to modify the decision in a consult -to-modify process. If the project is approved, the file reverts to the MVLWB for the processing of permits.
NZC made operating permit applications in 2008 prior to the expansion of the NNPR. During scoping of the EA, operation of the winter road access was included in the scope of development, although NZC already held a winter road permit. Since the road crosses through the jurisdictions of both the MVLWB and Parks Canada it was then necessary to apply for separate permits within the different jurisdictions in particular reference to the LUPs and Type B water licences associated with the access road.
20.5.2 Mine Permitting
20.5.2.1 EA Decision
After environmental assessment (EA) of the Mine, the Mackenzie Valley Review Board (MVRB) recommended approval of the Project proposal for operations on 8 December 2011. The MVRB concluded, pursuant to paragraph 128(1)(a) of the MVRMA, that the proposed development as described in the EA (including the list of commitments made by NZC) is “not likely to have any significant impacts on the environment or to be a cause for significant public concern”. As part of their decision, the MVRB provided a series of suggestions that, in their opinion, would improve the monitoring and management of potential impacts from the project.

Prairie Creek Page 2 54
NI 43-101 Technical Report on Preliminary Economic Assessment October 15, 2021
Table 20-1: Summary of MVRB Suggestions
Suggestion Description
#1 Either option proposed by NZC to increase water storage on site will improve water quality in Prairie Creek; however
construction of a second pond may address a broader range of risks and result in better water management on site.
#2 A Tailings Management Plan should be prepared for both the permanent storage of tailings underground and the
temporary storage of tailings on surface at the Mine Site.
#3 There are better ways to contain concentrate during transport along the winter road than the bag method proposed.
Secondary containment of concentrate during transport was recommended.
20.5.2.2 Permit Issue Process
Following the December 2011 positive EA decision, the MVLWB proceeded with the processing of permits required to operate the mine (a Type ‘A’ Water Licence and a Land Use Permit for the mine site).
To initiate the process to acquire mine operating permits, a Consolidated Project Description (CPD) was submitted to MVLWB on 15 February 2012. A final LUP for the mine site was issued in June 2013 and a final Water Licence was issued on 5 July with a term of seven years, with Reasons for Decision issued on 30 July. Ministerial approval was given on 24 September 2013.
20.5.3 All-Season Road Permitting
On 16 April 2014 NZC made applications to the MVLWB and Parks Canada for permits to construct, maintain and operate an all-season road from the mine to the Nahanni Butte access road, which connects to the Liard Highway. An all-season road will enable the haul of concentrates from the mine site to rail year-round, with temporary closures relating to freeze-up and break-up on the Liard River. The all-season road would use a similar alignment to the permitted winter road with some re-alignments to cross ground more suitable for ASR construction.
The MVLWB referred the applications to the MVRB on 22 May 2014 for EA1415-001.
The MVRB issued its Report of Environmental Assessment and Reasons for Decision (the EA Report) on 12 September 2017 and submitted the Report to the federal Minister of CIRNAC. The MVRB recommended approval of the ASR subject to implementation of measures described in the Report, which it considers are necessary to prevent significant adverse impacts on the environment and local people. The federal Minister approved the MVRB’s decision on October 9, 2018. The MVLWB issued a Type A Land Use Permit and a Type B Water Licence on November 13, 2019. Parks Canada issued comparable permits on November 22, 2019.
20.5.4 Renewal of Mine Permits
On March 11, 2021 NZC submitted applications to renew the operating permits. A decision on a new LUP is expected in Q1 2022, and for a new Water Licence in Q2 2022. NZC has requested a 25-year licence term for both. The new permits will also consolidate the existing exploration permits into the new authorizations.
The new applications included some changes to project components to allow for an expanded project. The MVLWB confirmed on August 27, 2021 that those changes do not require EA.

Prairie Creek Page 2 55
NI 43-101 Technical Report on Preliminary Economic Assessment October 15, 2021
20.5.5 Current Permits and Licences
NZC currently has a number of permits and licences for both exploration and mine operations (refer to Table 20-2 for a summary) issued by the MVLWB under the Mackenzie Valley Resource Management Act. In addition, NZC also has a LUP and Water Licence from Parks Canada for the portion of the ASR that crosses the NNPR.
Table 20-2: Summary of Current Permits and Licenses
Permit Date of issuance (duration) Description
Water Licence (Class B)
MV2019L2-0006 09 September 2019 (for 7 years)
Allows NZC to pursue surface exploration and
underground exploration (decline) LUP MV2020C0008 02 September 2020 (for 5 years)
LUP MV2014F0013 13 November 2019 (for 5 years) Allows NZC to construct and operate an all-season
road to the Mine on territorial land
Water Licence (Class B)
MV2014L8-0006 13 November 2019 (valid for 20 years)
Water Licence for the ASR permanent crossings and
extraction of water from authorized sources for road
construction and maintenance.
LUP Parks PC2014L8-0006 22 November 2019 (for 10 years) Allows NZC to construct and operate an all-season
road within the NNPR.
Water Licence
Parks PC2014F0013 22 November 2019 (for 5 years)
Water Licence for the ASR permanent crossings and
extraction of water from authorized sources for road
construction and maintenance.
Water Licence MV2019L8-
0002 13 November 2019 (for 20 years)
Water Licence for the ASR on Indian Affairs Branch
lands
LUP MV2020D0007 29 December 2020 (for 5 years) Allows NZC to construct and operate the Prairie
Creek Mine.
Water Licence (Class A)
MV2020L2-0003 12 February 2021 (for 5 years)
Allows NZC to use water and deposit waste to
operate the Prairie Creek Mine.
20.6 Social Considerations
The Prairie Creek Mine and access road is located in an area that includes the claimed traditional territory of the Nahɂą Dehé Dene Band and the Łı́ı́dlı̨ı̨ Kųę́ ́First Nation, historically both part of the Dehcho First Nations (Dehcho or DCFN).
The Dehcho Region hosts a distinct group of Aboriginal peoples, whose ancestors were among the South Slavey people of the Dene Nation of what is now the Northwest Territories, as well as Metis people. Many Dehcho people continue to rely heavily on the land, water and resources within DCFN territory for sustenance, social and ceremonial purposes.
The DCFN is an organization representing Dene and Metis peoples in the Dehcho territory of the Northwest Territories. The DCFN have incorporated a society under the laws of the Northwest Territories in order to provide leadership, governance, administration and program delivery to their member communities. The DCFN is a governing body of the Dehcho peoples’ lands and administers and oversees a number of programs and services for its member communities, including those relating to health, employment, education, and land and resource management.

Prairie Creek Page 2 56
NI 43-101 Technical Report on Preliminary Economic Assessment October 15, 2021
The outcome of land claims negotiations between the Federal Government, GNWT and the DCFN, referred to as the Dehcho Process, is expected to be a Final Agreement that will provide, amongst other things, for the implementation of a Dehcho government within the Dehcho territory. The negotiations have taken many years; however, the timing of completion is uncertain.
20.6.1 Naha Dehe Dene Band
The community of Nahanni Butte is located at the confluence of the South Nahanni and Liard Rivers, 146 km downstream of the mine site and the home of the Nahɂą Dehé Dene Band (NDDB). The population of Nahanni Butte is approximately 90 people.
There is no other existing land occupation, nor commercial land or water based activities, in the vicinity of the Mine. No traditional use or trapping activity has occurred in the mine site area in recent history.
In October 2008, Canadian Zinc and the NDDB entered into a MOU, to establish a mutually beneficial, co-operative and productive relationship. In the MOU, the Band agreed to maintain close communication links with Canadian Zinc, participate in good faith in current and pending environmental assessment and regulatory processes, and not to oppose, “in principle,” mining operations at Prairie Creek. Canadian Zinc has agreed to apply best efforts to employ Band members and to assist the Band and its community to benefit from business opportunities associated with the exploration and development of the Prairie Creek Project. The MOU also provided for the subsequent negotiation of an Impact Benefits Agreement regarding mining operations.
The Company continued discussions and engagement with the Band throughout 2009 and 2010, specifically regarding their Traditional Knowledge and alternate routes for the access road to Prairie Creek, taking into consideration the expressed preferences of the community of Nahanni Butte. The Band outlined their concerns with the project and the Company’s responses to date include investigation of road realignment options and surveys of specific locations along the access road for heritage resources.
In January 2011, the Company signed the Naha Dehe Dene Prairie Creek Agreement (the Nahanni Agreement), which provides for an ongoing working relationship between Canadian Zinc Corporation and the NDDB that respects the goals and aspirations of each party and will enable the Nahanni community members to participate in the opportunities and benefits offered by the Prairie Creek Project and confirms their support for the Prairie Creek Mine.
The Nahanni Agreement provides a framework such that training, employment and business contracts are made available to NDDB members to ensure maximization of benefits from opportunities arising from the Prairie Creek Project in a manner that will be to the mutual benefit of both parties.
The Naha Dehe Dene Prairie Creek Agreement provides for a positive and cooperative working relationship between the Company and Nahanni Butte in respect of developing and operating an environmentally sound mining undertaking at Prairie Creek, which will not have significant adverse environmental effects on the ecological integrity of the South Nahanni River or the NNPR.
NZC engaged with the NDDB during the course of the EA for the all-season road. The parties completed a Traditional Land Use Agreement (TLUA) related to the ASR which covers road activities and will provide additional benefits to the Band. The agreement was signed on January 15, 2019.
On 3 May 2017 the NDDB announced the Band’s withdrawal from the DCFN. This development has not negatively affected relations between the Band and NZC.

Prairie Creek Page 2 57
NI 43-101 Technical Report on Preliminary Economic Assessment October 15, 2021
20.6.2 Liidlii Kue First Nation
In June 2011, the Company signed an Impact Benefits Agreement (LKFN Agreement) with the Łı́ı́dlı̨ı̨ Kų́ę ́First Nation (LKFN) of Fort Simpson. The LKFN Agreement is similar in many respects to the Nahanni Agreement entered into with the Nahanni Butte Dene Band. The LKFN agreed to support NZC in obtaining all necessary permits and other regulatory approvals required for the Prairie Creek Mine Project. The Agreement is intended to ensure that NZC undertakes operations in an environmentally sound manner.
The Agreement provides a framework such that training, employment and business contracts, and some financial provisions are made available to the LKFN to ensure maximization of benefits from opportunities arising from the Prairie Creek Project in a manner that will be to the mutual benefit of all parties. The LKFN is the largest member of the DCFN.
Similar to the TLUA signed with the NDDB, on August 11, 2021 NZC signed a Road Benefit Agreement with the LKFN ensuring economic and social benefits from the construction and use of the ASR.
20.6.3 Acho Dene Koe First Nation
The Company has been in discussions with the Acho Dene Koe First Nation (ADK) on potential benefit programs associated with the Project and has met five times between 2019 and 2021 to date. No agreement has been completed but discussions are on-going.
20.7 Agreements And Programs With Government Agencies
20.7.1 Nahanni National Park Reserve / Parks Canada Memorandum of Understanding
In June 2009, new legislation was enacted by the Canadian Parliament entitled “An Act to amend the Canada National Parks Act to enlarge Nahanni National Park Reserve of Canada” to provide for the expansion of Nahanni National Park Reserve. Nahanni National Park Reserve was expanded by 30,000 km2, making it the third largest National Park in Canada. The enlarged Park covers most of the South Nahanni River watershed and completely encircles the Prairie Creek Mine. However, the Mine itself and a large surrounding area of approximately 300 km2 are specifically excluded from the Park and are not part of the expanded Park.
The exclusion of the Prairie Creek Mine from the NNPR expansion area brought clarity to the land use policy objectives for the region and will facilitate various aspects of the environmental assessment process. The Government’s decision on the expansion of NNPR reflects a balanced approach to development and to conservation which allows for Mineral Resource and energy development in the Northwest Territories and, at the same time, protects the environment.
Section 7(1) of the new Act amended the Canada National Parks Act to enable the Minister of the Environment to enter into leases or licences of occupation of, and easements over, public lands situated in the expansion area for the purposes of a mining access road leading to the Prairie Creek Area, including the sites of storage and other facilities connected with that road. Heretofore, an access road to a mine through a National Park was not permitted under the Canada National Parks Act, and the Act was amended solely for NNPR and specifically for the purpose of providing access to the Prairie Creek Area.
On 29 July 2008, Parks Canada Agency (Parks Canada) and Canadian Zinc entered into a MOU with regard to the expansion of the NNPR and the development of the Prairie Creek Mine, whereby:

Prairie Creek Page 2 58
NI 43-101 Technical Report on Preliminary Economic Assessment October 15, 2021
• Parks Canada and NZC agreed to work collaboratively, within their respective areas of responsibility, authority and jurisdiction, to achieve their respective goals of an expanded NNPR and an operating Prairie Creek Mine. • Parks Canada recognized and respects the right of Canadian Zinc to develop the Prairie Creek Mine and was to manage the expansion of NNPR so that the expansion did not in its own right negatively affect development of, or reasonable access to and from, the Prairie Creek Mine.
• Canadian Zinc accepted and supported the proposed expansion of the NNPR and will manage the development of the Prairie Creek Mine so the mine does not, in its own right, negatively affect the expansion of the NNPR.
The 2008 MOU was intended to cover the period up to the development of the Prairie Creek Mine (Phase I). In February 2012, and subsequently in November 2015, Canadian Zinc and Parks Canada signed a renewed Memorandum of Understanding regarding the operation and development of the Prairie Creek Mine and the management of NNPR.
The Phase III MOU, signed November 2015 was valid for five years, replaced the previous MOU signed between the Parties in 2008. In the renewed MOU:
• Parks Canada and Canadian Zinc agree to work collaboratively, within their respective areas of responsibility, authority and jurisdiction, to achieve their respective goals of managing Nahanni National Park Reserve and an operating Prairie Creek Mine.
• Parks Canada recognizes and respects the right of Canadian Zinc to develop the Prairie Creek Mine and has granted Land Use Permit Parks 2012 – L001 and Water Licence Parks 2012_W001 to provide road access through the Park to the Mine area.
• Canadian Zinc acknowledges the cooperative management relationship Parks Canada shares with the Dehcho First Nations in the management of Nahanni National Park Reserve. This includes recognition of the 2003 Parks Canada - Dehcho First Nation Interim Park Management Arrangement and the role of the cooperative management mechanism – Naha Dehé Consensus Team.
In the MOU Parks Canada and Canadian Zinc agreed to make every reasonable effort to address issues of common interest and build a strong working relationship, including convening a Technical Team, including representatives of the DCFN, which will better identify, define and consider issues of common interest, including, among other things, development of the access to and from the Prairie Creek Mine through NNPR and operation of the Prairie Creek Mine.
The Parties also agreed to share with one another and the Technical Team any existing technical and scientific information relevant to a discussion and analysis of issues of common interest to the Parties. The parties have agreed to make reasonable efforts to be timely in regard to permit requests being submitted, with ample time for review and consultation; such review and consultation will occur without unreasonable delay. The Parties operated under the 2015 MOU until its expiry in 2020. The MOU was renewed in September 2021 for 5 years.
To the extent that the Prairie Creek Mine is subject to regulatory or government processes, including hearings, Parks Canada reserves the right, while recognizing the intent of the MOU, to participate in any such process and take such positions as it sees fit and the MOU does not, and is not intended to constrain Parks Canada from doing so, subject only to the understanding that in doing so Parks Canada will not object to or oppose, in principle, the development of the Prairie Creek Mine.

Prairie Creek Page 2 59
NI 43-101 Technical Report on Preliminary Economic Assessment October 15, 2021
20.7.2 Government of the Northwest Territories Socio-Economic Agreement
In August 2011, the Company signed a Socio-Economic Agreement with the Government of the Northwest Territories related to the planned development of the Prairie Creek Mine. The Socio-Economic Agreement establishes the methods and procedures by which the Company and the GNWT have agreed to work together to maximize the beneficial opportunities and minimize the negative socio–economic impacts arising from an operating Prairie Creek Mine. The Socio-Economic Agreement defines hiring priorities and employment commitments and practices during the construction, operation and closure of the Prairie Creek Mine and across the entire spectrum of project-based employment. The Company has targeted employment levels of at least 25% being aboriginal, and at least 60% being NWT residents. The Company has agreed to implement policies to maximize business and value-added opportunities for businesses in the Northwest Territories. Canadian Zinc will use its best efforts to ensure that purchases of goods and services through or from Northwest Territories businesses will be at least 30% during construction and at least 60% during operations.
On 1 April 2014 The Northwest Territories Devolution Act, which provides for the devolution of lands and resource management from the Government of Canada to the Government of the Northwest Territories (GNWT), came into force. Devolution in the Northwest Territories means the transfer of decision-making and administration for land and resource management from the Government of Canada to the Government of the Northwest Territories.
20.7.3 Government Of The Northwest Territories Department Of Infrastructure
In August 2012, Canadian Zinc and the GNWT Department of Transportation (now Infrastructure) signed a Collaboration Agreement to ensure effective co-operation related to the public transportation infrastructure that will support the Prairie Creek Mine project and will help ensure that both public needs and mine activities are supported.
Canadian Zinc plans to use the existing Northwest Territories public transportation system to bring goods, fuel and equipment by road to the mine and to transport its mineral products from the mine to world markets. As part of this Collaborative Agreement, to assist in priority setting, NZC will provide reports to the Department of Infrastructure on its anticipated road transportation requirements for the construction and operation of the Prairie Creek Mine, which will help the Department of Transport to plan future work on these roads and to maintain and enhance these roads effectively; also the Department agreed to work closely with Canadian Zinc to ensure public safety by identifying areas of Highway 7 and the Nahanni Butte access road that require enhancement or upgrading.
20.7.4 The Northwest Territories Power Corporation
On 14 February 2017 a Memorandum of Understanding (“MOU”) was signed with Northwest Territories Power Corporation (“NTPC”) to examine the supply of electrical power for the development and operation of the Prairie Creek Mine in the Northwest Territories, Canada. In the MOU, NTPC has agreed to work with Canadian Zinc to assess (a) how NTPC could supply the primary electrical energy source to the mine and (b) how NTPC could install generating and connection facilities or other infrastructure assets to provide such electricity supply. NZC and NTPC have also agreed to evaluate the integration of other energy alternatives, and specifically Liquefied Natural Gas (“LNG”), as part of the energy supply for the mine.

Prairie Creek Page 2 60
NI 43-101 Technical Report on Preliminary Economic Assessment October 15, 2021
21 CAPITAL AND OPERATING COSTS
21.1 Introduction
The total estimated Pre-Production cost to design, construct, and commission the 2,400 t/d lead-zinc-silver facilities described for the project is $368 M.
The capital cost estimate for the project covers the costs to design, procure, construct and commission the facilities described in this report. The estimate is categorized as an Ausenco Class 5 Level Estimate, in Q3 2021 United States dollars, with an expected accuracy of -25%/+35%.
The estimate reflects the combined current and historical efforts of NorZinc Limited, Ausenco Engineering Limited, Allnorth Consultants Limited (from 2017-2020) and Mining Plus (AMC & Procon from 2017 to 2020).
The following table lists the contributors to this study:
Table 21-1: Sources of Inputs to Capital and Operating Cost Estimates
Component of input to the Capital and Operating Cost Estimates Contributors
Mine Development Capital Cost Estimate (AMC/Procon, 2017-2020) Mining Plus, 2021 forward
Mill Capital Cost Estimate Ausenco
Surface Facilities Capital Cost Estimate Ausenco
Mine Workforce Cost Estimate (AMC/Procon, 2017-2020), Mining Plus, 2021 forward
Mill Workforce Cost Estimate Ausenco
Surface & G&A Workforce Cost Estimate Ausenco, NorZinc
Mine Operating Cost Estimate (AMC/Procon,,2017-2020), Mining Plus, 2021 forward), NorZinc
Mill Operating Cost Estimate Ausenco
Surface Facilities & G&A Operating Cost Estimate Ausenco, NorZinc
Power Requirements Ausenco
Power Cost Estimate Ausenco
All-Season Road Installation & Maintenance Cost Estimate NorZinc, (2021 forward) ; Allnorth (2017 - 2020)
Owner’s Costs NorZinc
Reclamation Security Estimate NorZinc
AMC = AMC Mining, Mining Plus = Mining Plus Consultants, NorZinc = NorZinc Ltd., Ausenco = Ausenco Engineering, Allnorth = Allnorth Engineering

Prairie Creek Page 2 61
NI 43-101 Technical Report on Preliminary Economic Assessment October 15, 2021
21.2 Capital Cost Estimate
21.2.1 Overview
The capital cost estimate is categorized as an Ausenco Class 5 Level Estimate, in Q3 2021 United States dollars, with an expected accuracy of -25%/+35%, which aligns with the Association for the Advancement of Cost Engineering (AACE) guidelines for a Concept Screening estimate for which has an accuracy range of -30 to -15%/+20 to +50%.
The capital Cost estimate is broken down into pre-production capital and sustaining capital and is presented as a summary outlined in Table 21-2 below. The sustaining capital is carried over operating years 1 through 20.
Pre-Production capital cost refers to capital costs incurred until the first processing of mined ore and has been estimated to a total of $ 332.9 M excluding contingency, and $ 368.1 M including a contingency of $ 35.2 M. Pre-Production capital includes mine development, process plant, onsite/offsite infrastructure, associated project indirects and contingency. The sustaining capital is $ 316 M. Salvage has been estimated at $ 4.4 M.
The overall contingency was calculated at 11% on direct and indirect costs.
Table 21-2: Summary of Capital Costs
Description Total ($ M)
Pre-Production Capital (incl. contingency of $36.6 M) $368.1
Sustaining Capital $315.7
Salvage -$4.4
Total Capital Cost (Life of Mine) $ 679.4
21.2.2 Basis of Estimate
The capital cost estimate for the project covers the costs to design, procure, construct and commission the facilities described in this report. The estimate is categorized as an Ausenco Class 5 Level Estimate, in Q3 2021 United States dollars, with an expected accuracy of -25%/+35%.
Capital cost for surface facilities include the purchase of materials and equipment, construction and installation of all structures, utilities, materials, and equipment, and all associated indirect and management costs. The estimate also includes costs for contractor and engineering support to commission the process plant to ensure all systems are operational.
The cost estimate has been based on a combination of detail and semi-detail estimating for which the 2017 Prairie Creek feasibility study has been carried and escalated to Q3 2021. The 2017 feasibility study had a 30% project definition level and was supported by engineered Material Take Offs (MTOs), budgetary vendor priced equipment lists and contractor quotes for rates of material and labour. Historical data was used for items not quoted. A subsequent 2020 update was based on a revised priced equipment list for the 2,400 tpd throughput with associated bulk materials being factored. In 2021, a Value Engineering cost reduction workshop took place to identify areas of scope deferral, scope removals and price reductions based on revised concept level vendor pricing on some major equipment. Bulk materials were factored on the equipment pricing.

Prairie Creek Page 2 62
NI 43-101 Technical Report on Preliminary Economic Assessment October 15, 2021
21.2.2.1 Direct costs
Approximately 89% of the mechanical equipment supply costs were received from vendors via non-binding budgetary quotes for the process plant and site infrastructure.
Civil, concrete, structural steel, piping, electrical and instrumentation quantities were developed by Ausenco’s engineering team and the unit supply and installation rates are based on the contractor’s rates.
Refurbishment costs for the major process equipment including the ball mill, crushers and filters are based on site inspection reports and were developed with input from specialist contractors.
All materials, plant and equipment items within the direct costs are based on delivered to store on-site. Freight costs include inland transportation, export packing, all forwarder costs, ocean freight and air freight where required, insurance, receiving port custom agent fees, local inland freight to the project site.
21.2.2.2 Indirect costs
Indirect costs have been based on first-principles methods developed for the 2017 Prairie Creek feasibility cost estimate for which the same percentages have been prorated across the 2020 and 2021 cost updates.
• Engineering, Procurement & Construction Management (EPCM).
o The cost of EPCM services includes all related work and activities required for the complete engineering package necessary to construct the intended facilities, procurement, contract administration, office services and construction management activities.
• Construction indirects.
o Project facilities and services required to support during the construction period, EPCM offices, maintenance services, provision of temporary roads, scaffold, power, water and effluent disposal are included in as construction indirects in the estimate.
o Flight costs for the construction workforce are included and are based on commercial flights within Alberta and British Columbia to Yellowknife and charter flights between Yellowknife and site.
o Catering costs are estimated at $75 per person per day and are based NorZinc’s actual camp costs and the manpower curves for direct and indirect labour.
o Marshalling yard, spare parts, vendor representatives.
o Access to the site during construction will be via an ice road from Fort Nelson and the estimate allows for a marshalling yard at Fort Nelson inclusive of yard rental, security, onsite management / dispatch office, mobile equipment, and manpower.
• Ausenco estimate the cost of spare parts, first fill lubricants and vendor assistance.
• Pre-Commissioning, Commissioning.
o Commissioning assistance from mechanical completion to hand over has been included in the estimate.

Prairie Creek Page 2 63
NI 43-101 Technical Report on Preliminary Economic Assessment October 15, 2021
21.2.2.3 Reclamation & Closure Costs
Reclamation and Closure costs have been established by the Mackenzie Valley Land and Water Board and are associated with issued Land Use Permits and Water Licences, as shown in Table 21-3. A process is underway for NZC to acquire modified operating permits. This will include a review of closure costs and will include a modest increase to reflect the new mine plan.
Table 21-3: Reclamation and Closure Costs for the Prairie Creek Mine
Mine site “A" WL 1,620,000 Security posted per 22 May 2015 amendment on existing leases
(MV2020L2-0003) 2,550,000 Prior to extracting waste rock from underground
2,100,000 Within 12 months of extracting waste rock from underground
2,100,000 Within 24 months of extracting waste rock from underground
5,160,000 Prior to commencing milling
13,530,000
Mine site LUP 250,000 Previously posted security on existing leases
(MV2020D0007) 1,850,000 Prior to commencement of construction upgrades
1,075,000 Within 12 months of commencement of construction upgrades
1,075,000 Within 24 months of commencement of construction upgrades
4,200,000
Access road (NWT) LUP 1,115,309 Phase 1 winter road
(MV2014F0013) 219,908 Phase 2 ASR
1,335,217
Access road (NWT) "B" WL 336,341 Phase 1 winter road
(MV2014L8-0006) 1,372,324 Phase 2 ASR
1,708,665
Access road (NNPR) LUP 1,344,345 Phase 1 winter road
(PC2014F0013) 521,070 Phase 2 ASR
1,865,415
Access road (NNPR) "B" WL 482,067 Phase 1 winter road
(PC2014L8-0006) 2,574,407 Phase 2 ASR
3,056,474
Grand total 25,695,771
Previously remitted 1,870,000
Ongoing requirements 23,825,771
Reclamation costs of $12.9 M incurred prior to mine start-up are included in pre-production capital costs with the balance of $5.0 M included within sustaining capital.
21.2.2.4 Contingency
Contingency has been included in the estimate as a percentage of direct and indirect costs. Separate contingency amounts are included for mining, access road works and Owner’s costs, as there are different levels of certainty and estimation applicable to the different contributors cost estimates and scope.

Prairie Creek Page 2 64
NI 43-101 Technical Report on Preliminary Economic Assessment October 15, 2021
For the contingency on Ausenco’s scope of work (process plant and site infrastructure), a Monte Carlo simulation model was used for the 2017 feasibility study. For subsequent 2020 and 2021 cost updates on Ausenco’s scope of work, a deterministic approach has been used. The total contingency value for Ausenco’s scope is $22.3 M which equates to 14.9% of directs and indirect costs.
Table 21-4 summarizes the contingency amounts per each contributor:
Table 21-4: Contingency – Prairie Creek Mine
Description
Directs & Indirects costs
($ M)
Contingency value
($ M)
% Contingency
Of scope value
(%)
Mining Plus (Mining) $51.3 $4.1 8.0%
Ausenco (Process plant and infrastructure) 149.9 $22.3 14.9%
Allnorth (2017 -2020) (Main access road) $88.9 $7.1 8.0%
Owner’s costs (Operational Readiness) $16.4 $1.6 10.0%
Owner’s costs (capitalized opex) 17.4 $0.0 0.0%
Owner’s costs (diesel fuel) $8.9 $0.0 0.0%
Total $332.9 $35.1 10.5%
The following cost items have not been included in the Pre-Production Capital Cost Estimate:
• Project sunk costs and any additional studies;
• Project financing costs;
• Any bonding costs (performance bonds or completion bonds);
• Inflation or escalation during construction;
• Foreign exchange variations; and
• Operating costs.
21.2.3 Mine Capital Costs
The Capital Cost estimate for the Project was derived from the preliminary mine design. These costs are summarized in the followingTable 21-5.

Prairie Creek Page 2 65
NI 43-101 Technical Report on Preliminary Economic Assessment October 15, 2021
Table 21-5: Capital Cost Estimate
Area Unit Price Unit Updated CAPEX
Mobilization Year 1 (2022) $ 788,840 ea. $ 788,840
Mobilization Year 2 (2023) $ 783,936 ea. $ -
Set Up Year 1 (2022) 930 Portal & 883 Portal $ 549,656 ea. $ 549,656
Load-out & Set Up Year 2 (2023) $ 73,287 ea. $ 73,287
883 Adit Strip Services $ 299 m $ 299
Main Access Slashing (2.9x2.9 to 5x5) $ 5,410 m $ 3,549,261
Slash Powder Magazine from (2.7m x 7m to 4m x 7m) $ 8,626 m $ 405,434
Slash #1 X-Cut on 883 (2.9x2.9 to 4.5x4.5) $ 5,149 m $ 51,486
Reconfigure 883 Adit Ventilation, Dewatering & Electrical System To Start Decline Work
$ 61,702 ea. $ 61,702
Construct Powder & Detonator Magazine 883 Level $ 191,444 ea. $ 191,444
Rehab Raise 930 Level to Surface $ 1,790 m $ 1,790
Ramp Development Year 1 (4.6mx4.6m) $ 6,693 m $ 11,241,499
Ramp & Stope Remucks Year 1 (4.5m x 4.5m) 15m long $ 5,398 m $ 1,515,089
Stope Access Year 1 (4.5mx4.5m) $ 6,693 m $ 5,188,528
Stope Return Air Drive Year 1 (4.5m x 4.5m) $ 5,900 m $ 1,823,781
Stope & Dewatering Sumps Year 1 (4.5m x 4.5m) $ 5,800 m $ -
Stope Electrical Sub Cut Out Year 1 (4.5m x 4.5m) $ 5,398 m $ 172,756
Stope Paste Fill Drive Year 1 (4.5m x 4.5m) $ 5,900 m $ 224,202
Excavate and Support Alimak Raise Year 1 (3mx3m) $ 6,766 m $ 2,145,593
Excavate and Support Alimak Raise Year 2 (3m x 3m) $ 6,464 m $ -
Stope Mineralized Material Drives Large Year 2 (4.5m x 4.5m) $ 5,900 m $ 2,745,756
Stope Mineralized Material Drives Small Year 2 (4.0m x 4.0m) $ 5,129 m $ 15,001,330
Materials Handling Drives (5.0m x 5.0m) $ 6,693 m $ 133,850
Fresh Air Drive Metres (4.0m x 4.0m) $ 5,900 m $ 132,271
Miscellaneous Drive Metres (5.0m x 5.0m) $ 6,693 m $ 53,540
Diamond Drill Bay Metres (4.0m x 4.0m) $ 5,900 m $ 495,600
Ore Crosscut Slashing Large Metres (2.9m x 2.9 m to 4.5m x 4.5m) $ 6,693 m $ 7,891,089
Waste Rock Haulage Year 1 from 883 Portal to Dump Site $ 12 tonnes $ 2,414,704
Waste Rock Haulage Year 2 from 883 Portal to Dump Site $ 13 tonnes $ -
Contingency @ 7.5% $ 4,263,959
Escalation/Inflation @ 15% $ 9,167,512
Total $ 70,284,259
Capex Less Development $ 17,970,114
Pre-production, or “early works” mining capital is estimated to be approximately $5.5 million for the Project.

Prairie Creek Page 2 66
NI 43-101 Technical Report on Preliminary Economic Assessment October 15, 2021
21.2.4 Process Plant Capital Costs
The process plant pre-production capital costs include the purchase of materials and equipment, construction and installation of all structures, utilities, materials, and equipment associate with the process plant and represent direct costs only.
The scope for the process plant includes facilities for the concentrate circuit, dense media separation circuit, concentrate handling and storage, plant auxiliary services (fresh/fire water, process water, plant and instrument air systems) and general process plant (Process Control System, process piping refurbishment, building refurbishment).
Ausenco completed the initial design, developed budgetary quotation packages and completed technical and cost evaluations in the 2017 Feasibility Study, for the following capital items within the process plant:
Process Plant:
• Flotation Cells
• DMS Plant
• Thickeners
• Mine Water Treatment Plant
• Fire Water Pumps
• Slurry Pumps
• Water and Solution Pumps
• Reagent Pumps
• Cyclones
• Air compressors
• Blowers
• Agitators
• Flocculent System
• Vibratory Feeders
• Bag Breaker
• Conveyors and Feeders.
These costs are summarized in Figure 21-7.

Prairie Creek Page 2 67
NI 43-101 Technical Report on Preliminary Economic Assessment October 15, 2021
Table 21-6: Process Plant Pre-production capital cost estimate – Prairie Creek Mine
Description
Project Year –2
(2022)
($ M)
Project Year -1
(2023)
($M)
Project Year 1
(2024)
($M)
Total Cost
($ M)
Concentrate Building process1 $0.0 $9.1 $13.6 $22.7
Dense Media Separation (DMS) $0.0 $3.6 $5.4 $9.0
Concentrate Handling and Storage $0.0 $1.3 $1.9 $3.2
Auxiliary Services2 $0.0 $1.5 $2.3 $3.8
Process Plant General 3 $0.0 $0.9 $1.4 $2.3
Total Direct Costs - Pre-Production (Initial) Capital $0.0 $16.4 $24.6 $41.0
1. Includes crushing, grinding, flotation, concentrate thickening, reagents, building refurbishment 2. Includes plant fresh/fire water, process water, incinerator, plant and instrument air systems 3. Includes plant control system, piping replacement, building refurbishment
21.2.5 Site Infrastructure Pre-Production Capital Costs
The site infrastructure pre-production capital costs include the purchase of materials and equipment, construction and installation of all structures, utilities, materials, and equipment associate with the onsite infrastructure and represent direct costs only.
The scope for the site infrastructure includes the following:
• Site Development
o Site Preparation
o Site utilities
o Power supply and distribution
o Diesel storage
o Propane storage
o Mobile equipment (for process plant)
o Ancillary buildings
o Site general
• Mine facilities
o Mine facilities general
o U/G infrastructure
o Waste rock, ore, and DMS pad

Prairie Creek Page 2 68
NI 43-101 Technical Report on Preliminary Economic Assessment October 15, 2021
• Power Generation
o Power Plant
o On-Site Power transmission
o LNG
• Water Management
o Water Treatment facilities
o Water Treatment facilities
o Sewage Treatment facilities
o WSP
o Catchment pond
• Tailings
o Tailings Thickening
o Tailings thickening
o Tailing filtration
o Tailing pipeline
• Transport and roads
o Main access road
o Off-site facilities
o Fort Nelson Facilities
o All-Season Road
These costs are summarized in Table 21-7 below.

Prairie Creek Page 2 69
NI 43-101 Technical Report on Preliminary Economic Assessment October 15, 2021
Table 21-7: Site Infrastructure - Pre-production capital cost estimate – Prairie Creek Mine
Description
Project Year –2
(2022)
($ M)
Project Year -1
(2023)
($ M)
Project Year 1
(2024)
($ M)
Total Cost
($ M)
Site Development1 $1.6 $2.3 $13.8 $17.7
Mine Facilities2 $4.8 $2.1 $3.2 $10.1
Power Generation3 $0.4 $0. $0.5 $1.3
Water Management $1.6 $2.9 $4.4 $8.9
Tailings4 $0.0 $11.0 $16.6 $27.6
Transport and roads5 $1.9 $0.9 $1.4 $4.2
All-Season Road $14.8 $29.7 $44.4 $88.9
Total Direct Costs - Pre-Production (Initial) Capital $25.1 $49.3 $84.3 $158.7
1. Includes – Site preparation, utilities, mobile equip’t for process plant, diesel & propane storage, ancilliary building refurbishments 2. Includes – waste rock/ore/DMS pad TF, electrical services to mining portals 3. Includes – existing gensets removal and building repairs, OHPL to camp 4. Includes - tailings thickening, paste plant, tailings pipeline and reclaim 5 Includes – onsite roads and Fort Nelson warehouse facilities
21.2.6 Owner’s Capital Costs
The Owner’s capital costs include on site operations such as camp services and off site operations such as personnel costs. The Owner’s capital costs also include environmental work that the Owner needs to complete during construction as well as the purchase of a barge for transportation of trucks and goods across the Liard River.
21.2.7 Sustaining Capital
Sustaining capital costs have been estimated at $315.8 M includes mining fleet replacement costs, mine development, general sustaining of process plant, deferred capital for a Waste Heat Recovery system and general sustaining of Tailings Filtration and include leasing costs for leased camp facilities. Salvage is estimated at $4.4 M.
Sustaining costs are summarized in Table 21-8:
Table 21-8: Sustaining cost estimate – Prairie Creek Mine
Description Total Cost
($ M)
Fleet Replacement costs $97.6
Mine Development $211.6
Process Plant $6.6
Total Sustaining Costs (excluding Salvage) $315.8
Salvage - $4.4
Total with Salvage $311.4

Prairie Creek Page 2 70
NI 43-101 Technical Report on Preliminary Economic Assessment October 15, 2021
21.2.8 Capital Cost Estimate Summary
The total estimated Pre-production cost to design, construct, and commission the 2,400 t/d lead-zinc-silver facilities described for the project is $368.1 M. Total sustaining costs are $311.4.1 M (including salvage of $4.4 M). The total project cost (less closure costs) is $680.1 M. Table 21-9 summarizes these costs.
Table 21-9: Pre-production capital cost estimate – Prairie Creek Mine
Description Total Pre-Production Cost
($ M)
Sustaining costs
($ M)
Total costs (LOM)
($ M)
Mining $51.3 $309.2 $ 360.5
Site Preparation $1.4 $1.4
Process plant1 $41.0 6.6 $47.6
Paste Tailings Plant $27.6 $27.6
Surface Infrastructure2 $40.9 $40.0
All-Season Road $88.9 $88.9
Total Direct Costs 251.1 $315.8 $ 566.9
Site Indirects3 including EPCM $39.0 $39.0
Owner’s costs4 including Fuel $25.4 $25.4
Owner’s costs (capitalized Opex) $17.4 $17.4
Total Directs, Indirects and Owner’s costs $332.9 $315.8 $648.7
Contingency $35.2 $35.2
Salvage costs -$4.4 -$4.4
Total Capital $368.1 $311.4 $679.5
1. Includes dense media separator, mill building remediation, process plant upgrade. 2. Includes site utilities, process plant mobile equipment, ancillary buildings, water treatment plant, WSP, WRP, winter road maintenance and management, underground infrastructure, 3. Includes construction indirects, spares and initial fills, freight and logistics, commissioning, and startup, EPCM, vendor assistance 4. Includes camp refurbishments and additional camp facilities
Closure costs are estimated at $16 M and are excluded from the above table.
21.3 Operating Costs
21.3.1 Overview
The operating cost estimate is categorized as an Ausenco Class 5 Level Estimate, in Q3 2021 United States dollars, with an expected accuracy of -25%/+35%, which aligns with the Association for the Advancement of Cost Engineering (AACE) guidelines for a Concept Screening estimate for which has an accuracy range of -30 to -15%/+20 to +50%.
21.3.2 Basis of Estimate
Process plant operating costs are based on power consumption, reagent and consumables usage, and an operating labour roster. Power costs are based on the loads specified in the equipment lists and data. Where required operating cost estimate was build from factoring, benchmarking and first principles.

Prairie Creek Page 2 71
NI 43-101 Technical Report on Preliminary Economic Assessment October 15, 2021
Total operating costs (per tonne of mill feed) including transportation to the smelter, for the life of mine (17,162,000 tonnes) are summarised in Table 21-10. Mining and concentrate transportation makes up two thirds of the operating cost while processing, site services and G&A makes up the other third, as broken down in Figure 21-1, below.
Table 21-10: Total Operating Cost Summary
Total Operating Cost (average for the LOM) ($/t)
Mining 53.97
Processing 26.64
General and Administrative 12.12
Site Service 17.55
Sub-total 110.28
Transportation1 57.22
Total 167.50 1. Includes truck/rail/handling/shipping
Figure 21-1: LOM operating cost distribution
Note: Figure prepared by Ausenco, 2021.
Figure 21-2 below shows the split of cash operating costs based on (diesel fuel power generation).
7%
32%
10%16%
34%
G&A
Mining
Site Surface
Process
Transportation

Prairie Creek Page 2 72
NI 43-101 Technical Report on Preliminary Economic Assessment October 15, 2021
Figure 21-2: Annual cash operating cost by area – Process plant and site infrastructure
Note: Figure prepared by Ausenco, 2021.
21.3.3 Mining operating costs
Mining operating costs have been estimated based on staffing levels and labour rates agreed between NorZinc and Mining Plus. The actual cost, year by year, vary in accordance with the tonnage feeding the processing plant as shown in Figure 21-. The total mining operating cost average for the LOM is $53.97/t.
The mining operating costs includes the following:
• Labour (mine administrative and technical, and mine maintenance)
• Power (power, fuel and propane)
• Mining (stoping, development and backfill barricades).
Figure 21-3 shows the respective split of mining operating costs.

Prairie Creek Page 2 73
NI 43-101 Technical Report on Preliminary Economic Assessment October 15, 2021
Figure 21-3: Mine Operating Cost Breakdown
Note: Figure prepared by Mining Plus, 2021.
21.3.4 Processing, site surface and general and administrative operating costs
Processing, site support service and G&A operating costs have been estimated based on staffing levels and labor rates agreed between NorZinc and Ausenco, and materials costs provided by Ausenco. The actual cost, year by year, vary in accordance with the tonnage feeding the processing plant as shown in Figure 22-1.
The operational cost includes the following:
• Process plant operating costs – mill staff, plant operators, process plant maintenance, laboratory staff, process plant consumables, grinding media, reagents, power generation (process plant and site infrastructure);
• G&A operational costs – administrative staff site office expenses, consultants, personnel transport, camp accommodation, insurance, contract services, mobile equipment fuel and maintenance;
• Site support operating costs – maintenance labour and fuel; and
• Mine water treatment operating costs – power, consumables, reagents and labour (estimated by specialist vendor).
Figure 21-4; Figure 21-5 and Figure 21-6, show the respective split of costs in the processing, site surface support and G&A areas.
The total costs for these areas are:
• $26.64/t for processing;
• $17.55/t for site surface; and
• $12.12/t for G&A

Prairie Creek Page 2 74
NI 43-101 Technical Report on Preliminary Economic Assessment October 15, 2021
Figure 21-4: Process Plant Operating Cost Distribution
Note: Figure prepared by Ausenco, 2021.
Figure 21-5: Site Support Operating Cost Distribution
Note: Figure prepared by Ausenco, 2021.
Figure 21-6: G&A Cash Operating Cost Distribution
Note: Figure prepared by Ausenco, 2021.
23%
35%
18%
17%7%
Mill & Lab Labour
Process Supplies
Power
Maintenance
Water Treatment
23%
20%57%
Support Labour
Support Supplies
Paste Plant Supplies
22%
9%
36%
21%
8%
4%
G&A Labour
Power
Personel Transportation
Camp
Insurance
G&A Other

Prairie Creek Page 2 75
NI 43-101 Technical Report on Preliminary Economic Assessment October 15, 2021
21.3.5 Annual operating manpower costs
The process plant manpower includes plant staff, plant operators, plant maintenance crew and laboratory technicians.
The manpower for site services includes all site maintenance labor including maintenance superintendent, maintenance planner, foreman, electricians, mechanics, pipefitters, carpenters, welders, labourers, mobile equipment operators.
The manpower for G&A includes all positions required for general and administrative support at the site including general manager, accounting, purchasing/warehouse personnel, human resources, health and safety and technical services.
Catering manpower costs are included in the camp-person day rate. The mine water treatment plant manpower cost is included in the WTP operating cost.
The concentrate transport manpower costs are included in the transportation cost.
Labour costs have been escalated from the 2017 feasibility study values which were compiled by NorZinc and are based on Canadian Mine Salaries, Wages, and Benefits Survey, published by InfoMine USA Inc.
The total manpower required (on payroll) to operate the Prairie Creek site (process plant and site infrastructure) are shown in Table 21-11 below.
Table 21-11: Total Manpower Required
Position Number of Employees
General and Administration 20
Mill Staff 11
Mill Operators 28
Met Lab & Quality Control 12
Plant Maintenance 22
Service Services - Mill 32
Service Services - Mine 10
Paste Plant & Water Treatment
8
Camp Staff 28
Concentrate Haulage 45
Mining 113
TOTAL 329
21.3.6 Annual Supplies Costs
Processing supplies costs are based on all consumables and supplies for the process plant, including equipment wearing parts, grinding balls, reagent chemicals and power.
G&A supplies costs include costs of office and general, professional fees, camp and air flights.
Site support costs include the day-to-day operation and maintenance of the surface facilities and fuel used for heating of site infrastructure buildings such as the camp and the warehouse.

Prairie Creek Page 2 76
NI 43-101 Technical Report on Preliminary Economic Assessment October 15, 2021
21.3.7 Power cost and diesel fuel consumption
The steady-state, site-wide average power demand is estimated at 6.8 MW. The cost of co-generating this power with diesel and natural gas is estimated to be $0.2/kWh.
Table 21-12 shows the estimated average power consumption by main area of use.
Table 21-12: Power Consumption
Area Average MW
Process Plant 2.69
Mining 2.99
Water treatment 0.55
Site Infrastructure (camp and offices) 0.61
The estimated annual diesel fuel consumption (based on diesel only) is as indicated in Table 21-13.
Table 21-13: Annual Diesel Fuel Consumption
Area million litres
Power generation (diesel only) 8.98
Mobile Equipment 0.72
21.3.8 Transportation cost
The total transportation cost is estimated as $57.22/t of process plant feed (ore). The breakdown of this cost is shown in Figure 21-7.
Figure 21-7: Transportation Operating Cost Distribution
Note: Figure prepared by Ausenco, 2021.
Concentrate will be hauled from Prairie Creek Mine site to Fort St. John by truck and the operating cost includes:
47%
25%
24%
4%
Trucking to Fort St John
Rail Freight
Ocean Freight
Container Lease

Prairie Creek Page 2 77
NI 43-101 Technical Report on Preliminary Economic Assessment October 15, 2021
• Trucks and trailers;
• Labour including drivers, mechanics, supervision and logistics;
• Maintenance of equipment;
• Fuel; and
• Accommodation of drivers at site.
Transportation costs are estimated based on a study “Logistics Framework Overview Rev.2” prepared by Jenny Hawes and dated 17 Aug 2020.
21.4 Comments on Capital and Operating Costs
In the opinion of the QPs, the following conclusions and comments are made:
• Capital and operating costs were prepared according to each individual consultant’s area of expertise.
• Total Capital costs are estimated at $679.5 M (including $4.4 M salvage) excluding closure costs of $16 M. The estimate has been based on a combination of detail, semi-detailed estimating for most elements of the project, with capacity factoring or equipment factoring estimating for others.
• There is a potential exposure risk of COVID-19 to the workforce due to the remote location of the mine and the travel requirements of the workforce. With vaccines and the COVID-19 mitigations, a disruption to the workforce is possible, with the potential for a short term shut down of activities. This should be carried in the risk register.
• Total operating costs (per tonne of milled ore) including transportation to the smelter, on average over the LOM is $167.50.

Prairie Creek Page 2 78
NI 43-101 Technical Report on Preliminary Economic Assessment October 15, 2021
22 ECONOMIC ANALYSIS
22.1 Cautionary Statement
The results of the economic analyses discussed in this section represent forward- looking information as defined under Canadian securities law. The results depend on inputs that are subject to a number of known and unknown risks, uncertainties and other factors that may cause actual results to differ materially from those presented here. Information that is forward-looking includes:
• Mineral Resource estimates;
• assumed commodity prices and exchange rates;
• the proposed mine production plan;
• projected mining and process recovery rates;
• sustaining costs and proposed operating costs;
• interpretations and assumptions as to joint venture and agreement terms;
• assumptions as to closure costs and closure requirements;
• assumptions as to environmental, permitting and social risks.
Additional risks to the forward-looking information include:
• changes to costs of production from what are estimated;
• unrecognized environmental risks;
• unanticipated reclamation expenses;
• unexpected variations in quantity of mineralized material, grade or recovery rates;
• geotechnical or hydrogeological considerations during mining being different from what was assumed;
• failure of mining methods to operate as anticipated;
• failure of plant, equipment or processes to operate as anticipated;
• changes to assumptions as to the availability of electrical power, and the power rates used in the operating cost estimates and financial analysis;
• ability to maintain the social licence to operate;

Prairie Creek Page 2 79
NI 43-101 Technical Report on Preliminary Economic Assessment October 15, 2021
• Accidents, labour disputes and other risks of the mining industry;
• changes to interest rates;
• changes to tax rates.
This PEA assumes that permits have to be obtained in support of operations, and approval for development to be provided by NorZinc’s Board.
Furthermore, readers are cautioned that the PEA is preliminary in nature. It includes Inferred Mineral Resources that are considered too speculative geologically to have the economic considerations applied to them that would enable them to be categorized as Mineral Reserves and there is no certainty that the PEA will be realized. Mineral Resources that are not Mineral Reserves do not have demonstrated economic viability.
22.2 Methodology Used
An economic model was developed to estimate annual pre-tax and post-tax cash flows and sensitivities of the Project based on an 8% discount rate. Sensitivity analysis was performed to assess impact of variations in metal prices, head grades, operating costs and capital costs. The capital and operating cost estimates are summarized in Section 21 of this Report (presented in 2021 US dollars). The economic analysis has been run with no inflation (constant dollar basis).
22.3 Financial Model Parameters
The economic analysis was performed using the following assumptions:
• construction period of 2.4 years;
• mine life of 20.3 years;
• zinc, lead and silver price forecast based on the average analyst consensus estimate resulting in $1.20/lb of zinc, $1.05/lb of lead and $24.00/troy ounce of silver. The forecasts used are meant to reflect the average metal price expectation over the life of the Project. No price inflation or escalation factors were taken into account. Commodity prices can be volatile, and there is the potential for deviation from the forecast;
• Canadian dollar to United States Dollar exchange rate assumption of 1.25 (C$/US$)
• cost estimates in constant Q4 2021 US$ with no inflation or escalation factors considered;
• results are based on 100% ownership with 2.2% NSR;
• capital costs funded with 100% equity (i.e., no financing costs assumed);
• all cash flows discounted to start of construction;
• all metal products are assumed to be sold in the same year they are produced;
• project revenue is derived from the sale of zinc and lead concentrate into the international marketplace; and
• no contractual arrangements for smelting or refining currently exist.

Prairie Creek Page 2 80
NI 43-101 Technical Report on Preliminary Economic Assessment October 15, 2021
22.3.1 Income Taxes
The project has been evaluated on an after-tax basis to provide an approximate value of the potential economics. The calculations are based on the tax regime as of the date of the effective date.
Project was assumed to be subject to the Federal Income Tax of 15% and NWT Tax of 11.5% resulting in total income tax payments of $381 M over the life of mine.
22.3.2 NWT Mineral Tax Royalty
The Northwest Territories Mining Regulations impose a mining royalty on an operator or owner of a mine located in the Northwest Territories. The royalty is a percentage of the mine's annual profit. The profit is calculated as the total mine revenue less the cost of mining and processing and other deductions and allowances. The royalty rate applied to the annual mine profit is the lesser of 13% of the total profit and the sum of escalating tiered marginal royalty rates ranging from zero percent to the maximum of 13%. NWT royalty payments total $237 M over the life of mine.
22.3.3 Royalty
Following net smelter return royalties (NSR) are incorporated into the cash flow resulting in total royalty payments of $93 M over the life of mine.
• Sandstorm Gold of 1.2%
• Resource Capital Funds (RCF) 1%
22.3.4 Working Capital
A high-level estimation of working capital has been incorporated into the cash flow based on the following assumptions:
• Realization Costs (1.2 months)
• Mine site Operating Costs (1 months)
• Processing Costs (1 months)
• Surface Support Costs (1 months)
• G&A Costs (1 months)
• Transport Costs (1 months)
22.3.5 Closure Costs
Total closure cost is estimated to be $16 M which is partially offset by salvage value of $4 M.

Prairie Creek Page 2 81
NI 43-101 Technical Report on Preliminary Economic Assessment October 15, 2021
22.4 Economic Analysis
The economic analysis was performed using 8% discount rate. The pre-tax NPV 8% is $505 M, the internal rate of return IRR is 21.4%. On an after-tax basis, the NPV 8% is $299 M, the internal rate of return IRR is 17.7% and the payback 4.8 years.
A summary of the Project economics is included in Table 22-1. The cashflow on an annualized basis is provided in Table 22-2.
Table 22-1: Summary, Projected LOM Cashflow Assumptions and Results
Economic Assumptions Units LOM
Zinc Price US$/lb $1.20
Lead Price US$/lb $1.05
Silver Price US$/oz $24.00
Exchange Rate C$:US$ $1.25
Discount Rate % 8.0%
Production
Mine Life yr 20.3 years
Total Mill Feed kt 17,162
Average Annual Mill Feed kt 844
Zinc
Average Mill Head Grade Zn % 8.58%
Total Payable Zn Mlbs 2,481
Average Annual Payable Zn Mlbs 122
Lead
Average Mill Head Grade Pb % 5.78%
Total Payable Pb Mlbs 2,043
Average Annual Payable Pb Mlbs 101
Silver
Average Mill Head Grade Ag g/t 119.01 g/t
Total Payable Ounces Ag Koz 51,866
Average Annual Payable Ag Koz 2,551
Zinc Eq
Total Payable Zn Eq Mlbs 5,306
Average Annual Payable Zn Eq Mlbs 261
Operating Cost
Mining US$/t milled $53.97
Processing US$/t milled $26.64
Surface Support US$/t milled $17.55
Transport US$/t milled $57.22
G&A US$/t milled $12.12
Total US$/t milled $167.50
Other
Total Revenue US$M $6,368
Average Annual Revenue US$M $313

Prairie Creek Page 2 82
NI 43-101 Technical Report on Preliminary Economic Assessment October 15, 2021
Economic Assumptions Units LOM
EBITDA US$M $2,497
Average Annual EBITDA US$M $123
Total Undiscounted Free Cashflow (Pre-tax) US$M $1,738
Average Undiscounted Free Cashflow (Pre-tax) US$M $85
Total Undiscounted Free Cashflow (Post-tax) US$M $1,121
Average Undiscounted Free Cashflow (Post-tax) US$M $55
Cash Costs per Pound
LOM C1 Cost By-Product Basis US$/lb Zn $0.19
LOM C3 Cost By-Product Basis US$/lb Zn $0.60
LOM C1 Cost Co-Product Basis US$/lb Zn Eq $0.73
LOM C3 Cost Co-Product Basis US$/lb Zn Eq $0.92
Initial Capital Cost
Mining US$M $51
Site Preparation US$M $1
Process plant US$M $41
Paste Tailings Plant US$M $28
Surface Infrastructure US$M $41
All-Season Road US$M $89
Total Direct Costs US$M $251
Site Indirects (including EPCM) US$M $39
Owner’s costs - Operational Readiness & Fuel US$M $25
Owner’s costs - Capitalized Pre-production US$M $18
Total Directs, Indirects and Owner’s costs US$M $333
Contingency US$M $35
Total Pre-Production (Initial) Capital US$M $368
Other Capital Cost
Sustaining Capex US$M $316
Closure Cost US$M $16
Salvage Value US$M $4
Pre-Tax Economics
NPV (8%) US$M $505
IRR % 21.4%
Payback yr 4.7
Post-Tax Economics Units
NPV (8%) US$M $299
IRR % 17.7%
Payback yr 4.8
Note: C1 Cost (By-Product) is the net direct cash cost incurred from mining through to refined metal, plus royalties and net of by-product credits C3 Cost (By-Product) is C1 Cost, plus depreciation, sustaining capex and closure.

Prairie Creek Page 2 83
NI 43-101 Technical Report on Preliminary Economic Assessment October 15, 2021
Table 22-2: Projected Cashflow on an Annualized Basis
Avg/Total 2022 2023 2024 2025 2026 2027 2028 2029 2030 2031 2032 2033 2034 2035 2036 2037 2038 2039 2040 2041 2042 2043 2044 2045
FX Rate CADUSD 1.25 1.25 1.25 1.25 1.25 1.25 1.25 1.25 1.25 1.25 1.25 1.25 1.25 1.25 1.25 1.25 1.25 1.25 1.25 1.25 1.25 1.25 1.25 1.25 1.25
Zinc Price US$/lb 1.20 1.20 1.20 1.20 1.20 1.20 1.20 1.20 1.20 1.20 1.20 1.20 1.20 1.20 1.20 1.20 1.20 1.20 1.20 1.20 1.20 1.20 1.20 1.20 1.20
Lead Price US$/lb 1.05 1.05 1.05 1.05 1.05 1.05 1.05 1.05 1.05 1.05 1.05 1.05 1.05 1.05 1.05 1.05 1.05 1.05 1.05 1.05 1.05 1.05 1.05 1.05 1.05
Silver Price US$/oz 24.00 24.00 24.00 24.00 24.00 24.00 24.00 24.00 24.00 24.00 24.00 24.00 24.00 24.00 24.00 24.00 24.00 24.00 24.00 24.00 24.00 24.00 24.00 24.00 24.00
Revenue-Zinc US$M $2,978 -- -- $14 $110 $131 $125 $142 $138 $152 $135 $117 $143 $145 $140 $129 $127 $159 $150 $187 $201 $205 $210 $119 --
Revenue-Lead US$M $2,145 -- -- $13 $104 $123 $134 $133 $137 $131 $136 $130 $109 $120 $112 $104 $91 $98 $78 $81 $83 $83 $91 $54 --
Revenue-Silver US$M $1,245 -- -- $7 $58 $62 $63 $63 $66 $61 $66 $65 $57 $60 $61 $60 $53 $67 $58 $62 $65 $68 $73 $49 --
Total Revenue US$M $6,368 -- -- $34 $272 $316 $322 $338 $341 $345 $337 $311 $309 $324 $313 $293 $272 $324 $286 $330 $349 $356 $374 $221 --
Total Realization US$M ($903) -- -- ($4) ($36) ($41) ($43) ($45) ($46) ($47) ($44) ($40) ($41) ($44) ($44) ($41) ($39) ($49) ($44) ($51) ($53) ($54) ($58) ($38) --
Total Minesite Operating Costs US$M ($2,875) -- -- ($19) ($144) ($164) ($149) ($152) ($149) ($152) ($152) ($143) ($144) ($148) ($145) ($145) ($138) ($145) ($139) ($140) ($140) ($141) ($136) ($89) ($1)
Royalty US$M ($93) -- -- ($1) ($4) ($5) ($5) ($5) ($5) ($5) ($5) ($5) ($5) ($5) ($5) ($4) ($4) ($5) ($4) ($5) ($5) ($5) ($5) ($3) $0
Net Profits Interest ("NPI") Agreements US$M ($63) -- -- ($0) ($3) ($3) ($4) ($4) ($4) ($4) ($3) ($3) ($3) ($3) ($3) ($2) ($2) ($2) ($2) ($2) ($2) ($5) ($6) ($3) --
Initial Capex US$M ($295) ($36) ($114) ($218) -- -- -- -- -- -- -- -- -- -- -- -- -- -- -- -- -- -- -- -- --
Sustaining Capex US$M ($316) -- -- ($3) ($34) ($56) ($23) ($14) ($11) ($14) ($9) ($12) ($17) ($15) ($12) ($11) ($17) ($12) ($14) ($18) ($6) ($8) ($3) ($4) --
Salvage Value US$M $4 -- -- -- -- -- -- -- -- -- -- -- -- -- -- -- -- -- -- -- -- -- -- $4 --
Closure US$M ($16) -- -- -- -- -- -- -- -- -- -- -- -- -- -- -- -- -- -- -- -- -- -- ($16) --
Pre-Tax Project Cash Flows US$M $1,738 ($36) ($114) ($212) $40 $44 $96 $116 $126 $122 $125 $110 $100 $109 $105 $91 $73 $107 $86 $110 $140 $142 $165 $83 $10
Cumulative Pre-Tax Project Cash Flows US$M ($36) ($150) ($362) ($322) ($278) ($181) ($65) $60 $183 $307 $417 $517 $626 $732 $822 $895 $1,002 $1,088 $1,198 $1,339 $1,481 $1,645 $1,728 $1,738
Income & Mining Taxes US$M $618 -- -- -- -- -- -- $0 $17 $41 $45 $39 $36 $39 $37 $32 $25 $40 $29 $41 $51 $52 $61 $32 --
Post-Tax Project Cash Flows US$M $1,121 ($36) ($114) ($212) $40 $44 $96 $116 $109 $81 $80 $71 $65 $69 $68 $59 $48 $67 $56 $69 $89 $90 $104 $51 $10
Cumulative Post-Tax Project Cash Flows US$M ($36) ($150) ($362) ($322) ($278) ($181) ($65) $44 $125 $204 $275 $340 $409 $477 $536 $584 $651 $707 $777 $866 $956 $1,060 $1,111 $1,121
MINING
Resource Mined kt 17,162 -- 10 306 697 896 902 906 902 906 901 901 901 901 903 901 777 883 891 902 906 901 744 228 --
Mined Resource Grades
Lead (Sulphide) wt% 5.78 -- 4.52 5.04 5.65 6.46 7.05 7.00 7.23 6.92 7.18 6.84 5.77 6.32 5.91 5.46 4.59 5.17 4.07 4.29 4.40 4.37 4.61 6.94 --
Silver g/t 119.01 -- 78.24 119.75 141.00 118.25 119.14 118.78 123.02 112.81 123.73 122.63 104.98 108.43 110.93 110.45 95.17 121.58 106.94 113.94 118.80 125.74 137.07 248.64 --
Zinc (Sulphide) wt% 8.58 -- 0.74 5.60 6.45 7.41 7.04 7.97 7.76 8.61 7.65 6.59 8.05 8.26 7.98 7.35 7.13 8.96 8.44 10.46 11.29 11.52 12.40 19.47 --
MILLING AND CONCENTRATE PRODUCTION
Resource Milled kt 17,162 -- -- 121 876 876 876 878 876 876 876 878 876 876 876 878 876 876 876 878 876 876 876 388 --
Flotation Feed kt 12,713 -- -- 87 635 643 644 649 647 649 647 644 649 652 652 653 650 653 652 655 654 654 654 290 --
Lead Concentrate kt 1,626 -- -- 10 79 93 101 101 104 99 103 99 83 91 85 79 69 74 59 62 63 63 69 41 --
Zinc Concentrate kt 2,283 -- -- 10 84 101 96 109 106 117 104 90 109 111 107 99 97 122 115 143 154 157 161 91 --
TOTAL CONTAINED METALS IN CONCENTRATE
Lead Mlbs 2,151 -- -- 13 104 123 134 133 138 132 137 130 110 120 112 104 92 98 78 82 83 83 91 54 --
Silver koz 62,127 -- -- 371 2,962 3,172 3,218 3,217 3,331 3,055 3,312 3,242 2,844 2,938 3,006 2,997 2,641 3,289 2,893 3,083 3,203 3,397 3,622 2,334 --
Zinc Mlbs 2,919 -- -- 13 107 129 122 139 135 149 132 115 140 142 137 126 124 156 147 183 197 201 206 117 --
CONCENTRATE PRODUCTION
Lead Concentrate
Payable Lead kt 927 -- -- 6 45 53 58 58 59 57 59 56 47 52 48 45 40 42 33 35 36 36 39 23 --
Payable Silver koz 51,691 -- -- 298 2,381 2,552 2,626 2,626 2,721 2,543 2,723 2,664 2,387 2,493 2,528 2,506 2,213 2,806 2,426 2,593 2,695 2,849 3,035 2,025 --
Zinc Concentrate
Payable Zinc kt 1,126 -- -- 5 41 50 47 54 52 58 51 44 54 55 53 49 48 60 57 71 76 78 79 45 --
Payable Silver koz 176 -- -- 7 54 28 17 9 15 -- 19 27 -- -- -- -- -- -- -- -- -- -- -- -- --
TOTAL PAYABLE METALS
Lead Mlbs 2,043 -- -- 13 99 117 128 127 131 125 130 124 104 114 107 99 87 93 74 77 79 79 86 51 --
Silver koz 51,866 -- -- 305 2,435 2,580 2,643 2,635 2,736 2,543 2,742 2,691 2,387 2,493 2,528 2,506 2,213 2,806 2,426 2,593 2,695 2,849 3,035 2,025 --
Zinc Mlbs 2,481 -- -- 11 91 110 104 118 115 127 113 97 119 121 117 107 106 132 125 155 167 171 175 99 --

Prairie Creek Page 2 84
NI 43-101 Technical Report on Preliminary Economic Assessment October 15, 2021
Zinc Eq. Mlbs 5,306 -- -- 28 227 263 268 282 284 287 281 260 258 270 261 244 226 270 238 275 291 297 312 185 --
CONCENTRATE REALIZATION COSTS
Lead Concentrate
Treatment Charge US$M $228 -- -- $1 $11 $13 $14 $14 $15 $14 $14 $14 $12 $13 $12 $11 $10 $10 $8 $9 $9 $9 $10 $6 --
Silver Refining US$M $78 -- -- $0 $4 $4 $4 $4 $4 $4 $4 $4 $4 $4 $4 $4 $3 $4 $4 $4 $4 $4 $5 $3 --
Penalties
Zinc US$M -- -- -- -- -- -- -- -- -- -- -- -- -- -- -- -- -- -- -- -- -- -- -- -- --
Arsenic US$M $3 -- -- -- $0 -- -- -- $0 -- -- $0 $0 $0 $0 $0 $0 $0 $0 $0 $0 $0 $0 $0 --
Antimony US$M $13 -- -- $0 $0 $0 $0 $0 $0 $0 $0 $0 $0 $1 $1 $1 $1 $1 $1 $1 $1 $1 $1 $1 --
Mercury US$M $12 -- -- $0 $1 $0 $1 $0 $1 $0 $0 $0 $0 $0 $1 $1 $1 $1 $1 $1 $1 $1 $1 $1 --
Transport Insurance US$M $15 -- -- $0 $1 $1 $1 $1 $1 $1 $1 $1 $1 $1 $1 $1 $1 $1 $1 $1 $1 $1 $1 $0 --
Zinc Concentrate
Treatment Charge US$M $400 -- -- $2 $15 $18 $17 $19 $18 $20 $18 $16 $19 $19 $19 $17 $17 $21 $20 $25 $27 $28 $28 $16 --
Silver Refining US$M $0 -- -- $0 $0 $0 $0 $0 $0 -- $0 $0 -- -- -- -- -- -- -- -- -- -- -- -- --
Penalties
Cadmium US$M $2 -- -- -- $0 $0 $0 $0 $0 $0 $0 $0 $0 $0 $0 $0 $0 $0 $0 $0 $0 $0 $0 $0 --
Mercury US$M $141 -- -- $0 $5 $5 $6 $5 $6 $6 $5 $4 $4 $6 $6 $6 $7 $10 $9 $9 $10 $10 $11 $10 --
Transport Insurance US$M $12 -- -- $0 $0 $1 $1 $1 $1 $1 $1 $0 $1 $1 $1 $1 $1 $1 $1 $1 $1 $1 $1 $0 --
Total Realization US$M $903 -- -- $4 $36 $41 $43 $45 $46 $47 $44 $40 $41 $44 $44 $41 $39 $49 $44 $51 $53 $54 $58 $38 --
MINESITE OPERATING COSTS
Mining - Variable US$M $926 -- -- $9 $58 $65 $52 $52 $49 $50 $50 $47 $47 $49 $48 $50 $47 $48 $47 $41 $38 $37 $31 $11 --
Processing US$M $457 -- -- $4 $23 $23 $23 $23 $23 $23 $23 $23 $23 $23 $23 $23 $23 $23 $23 $23 $23 $23 $23 $19 --
Surface Support US$M $301 -- -- $2 $14 $16 $16 $16 $16 $16 $16 $16 $16 $16 $16 $16 $14 $15 $15 $16 $16 $16 $14 $9 --
Transport US$M $982 -- -- $3 $39 $50 $48 $52 $51 $54 $53 $48 $48 $50 $48 $46 $43 $49 $44 $50 $54 $55 $57 $40 $1
G&A US$M $208 -- -- $2 $10 $10 $10 $10 $10 $10 $10 $10 $10 $10 $10 $10 $10 $10 $10 $10 $10 $10 $10 $10 --
Total Minesite Operating Costs US$M $2,875 -- -- $19 $144 $164 $149 $152 $149 $152 $152 $143 $144 $148 $145 $145 $138 $145 $139 $140 $140 $141 $136 $89 $1
Sandstorm NSR Royalty US$M $51 -- -- $0 $2 $3 $3 $3 $3 $3 $3 $3 $2 $3 $2 $2 $2 $3 $2 $3 $3 $3 $3 $2 ($0)
RCF NSR Royalty US$M $42 -- -- $0 $2 $2 $2 $2 $2 $2 $2 $2 $2 $2 $2 $2 $2 $2 $2 $2 $2 $2 $2 $1 ($0)
Total Production Costs US$M $3,871 -- -- $23 $184 $211 $197 $202 $200 $204 $201 $188 $189 $197 $193 $190 $181 $199 $187 $195 $199 $200 $199 $130 $1
By-Product Basis
C1 Cash Cost US$/lb Zn $0.19 -- -- $0.25 $0.24 $0.24 ($0.00) $0.05 ($0.03) $0.10 ($0.01) ($0.07) $0.19 $0.14 $0.18 $0.25 $0.34 $0.26 $0.41 $0.33 $0.30 $0.29 $0.20 $0.27 --
C3 Cash Cost US$/lb Zn $0.60 -- -- $0.73 $0.83 $0.99 $0.50 $0.44 $0.36 $0.48 $0.38 $0.40 $0.63 $0.59 $0.62 $0.71 $0.87 $0.72 $0.90 $0.86 $0.77 $0.36 $0.23 $0.49 --
Co-Product Basis
C1 Cash Cost US$/lb Zn eq $0.73 -- -- $0.82 $0.81 $0.80 $0.73 $0.72 $0.70 $0.71 $0.71 $0.72 $0.73 $0.73 $0.74 $0.78 $0.80 $0.74 $0.79 $0.71 $0.68 $0.67 $0.64 $0.70 --
C3 Cash Cost US$/lb Zn eq $0.92 -- -- $1.01 $1.05 $1.11 $0.93 $0.88 $0.86 $0.88 $0.87 $0.90 $0.94 $0.93 $0.94 $0.98 $1.05 $0.96 $1.04 $1.01 $0.96 $0.72 $0.65 $0.82 --
CAPITAL EXPENDITURES
Initial Capex US$M $368 $36 $114 $218 -- -- -- -- -- -- -- -- -- -- -- -- -- -- -- -- -- -- -- -- --
Sustaining Capex US$M $316 -- -- $3 $34 $56 $23 $14 $11 $14 $9 $12 $17 $15 $12 $11 $17 $12 $14 $18 $6 $8 $3 $4 --
Salvage Value US$M $4 -- -- -- -- -- -- -- -- -- -- -- -- -- -- -- -- -- -- -- -- -- -- $4 --
Closure US$M $16 -- -- -- -- -- -- -- -- -- -- -- -- -- -- -- -- -- -- -- -- -- -- $16 --
NORTHWEST TERRITORIES ROYALTY
NWT Royalty Payable US$M $237 -- -- -- -- -- -- $0 $17 $16 $16 $14 $13 $14 $14 $11 $9 $14 $10 $15 $19 $19 $23 $11 --
CORPORATE INCOME TAX
Federal Income Tax Payable US$M $216 -- -- -- -- -- -- -- -- $14 $16 $14 $13 $14 $14 $12 $9 $14 $11 $15 $18 $18 $21 $12 --
NWT Tax Payable US$M $165 -- -- -- -- -- -- -- -- $11 $12 $11 $10 $11 $10 $9 $7 $11 $8 $11 $14 $14 $16 $9 --
Total Taxes Payable US$M $381 -- -- -- -- -- -- -- -- $25 $28 $25 $23 $25 $24 $20 $17 $25 $19 $26 $32 $33 $38 $20 --

Prairie Creek Page 2 85
NI 43-101 Technical Report on Preliminary Economic Assessment October 15, 2021
22.5 Sensitivity Analysis
A sensitivity analysis (range of -20% to +20%) was conducted on the base case pre-tax and after-tax NPV and IRR of the Project, using the following variables: commodity price, discount rate, exchange rate, initial capital costs, and operating costs. Figure 22-1 shows the pre-tax sensitivity analysis findings, and Table 22-3. shows the results post-tax. Analysis revealed that the Project is most sensitive to changes in commodity prices and head grade, then, to a lesser extent, to exchange rate, operating costs and initial capital costs.
Figure 22-1: NPV & IRR Sensitivity Results
Note: Figure prepared by Ausenco, 2021
–
$300
$600
$900
$1,200
(20.0%) (10.0%) -- 10.0% 20.0%
Pre-Tax NPV Sensitivity 8% ($M)
Operating Costs Initial Capex Commodity Price
Head Grade FX
--
5%
10%
15%
20%
25%
30%
35%
(20.0%) (10.0%) -- 10.0% 20.0%
Pre-Tax IRR Sensitivity (%)
Operating Costs Initial Capex Commodity Price
Head Grade FX
($200)
–
$200
$400
$600
$800
(20.0%) (10.0%) -- 10.0% 20.0%
Post-Tax NPV Sensitivity 8% ($M)
Operating Costs Initial Capex Commodity Price
Head Grade FX
--
5%
10%
15%
20%
25%
30%
(20.0%) (10.0%) -- 10.0% 20.0%
Post-Tax IRR Sensitivity (%)
Operating Costs Initial Capex Commodity Price
Head Grade FX

Prairie Creek Page 2 86
NI 43-101 Technical Report on Preliminary Economic Assessment October 15, 2021
Table 22-3: Pre & Post-Tax Sensitivity
Pre-Tax NPV (US$M) Sensitivity To Discount Rate Pre-Tax IRR % Sensitivity To Discount Rate Post-Tax NPV (US$M) Sensitivity To Discount Rate
Commodity Price Commodity Price Commodity Price
$505 -20% -10% 0% 10% 20% 21.4% -20% -10% 0% 10% 20%
3.0% $251 $671 $1,092 $1,512 $1,932 3.0% 8.1% 15.1% 21.4% 27.2% 32.7%
5.0% $127 $465 $804 $1,142 $1,481 5.0% 8.1% 15.1% 21.4% 27.2% 32.7%
8.0% $2 $254 $505 $757 $1,009 8.0% 8.1% 15.1% 21.4% 27.2% 32.7%
10.0% ($54) $156 $366 $577 $787 10.0% 8.1% 15.1% 21.4% 27.2% 32.7%
12.0% ($95) $83 $260 $438 $616 12.0% 8.1% 15.1% 21.4% 27.2% 32.7%
Pre-Tax NPV (US$M) Sensitivity To Operating Costs Pre-Tax IRR Sensitivity To Operating Costs Post-Tax NPV (US$M) Sensitivity To Operating Costs
Commodity Price Commodity Price Commodity Price
$505 -20% -10% 0% 10% 20% 21.4% -20% -10% 0% 10% 20%
(20%) $240 $491 $743 $995 $1,247 (20%) 14.9% 21.3% 27.1% 32.7% 38.0%
(10%) $121 $372 $624 $876 $1,128 (10%) 11.6% 18.3% 24.3% 30.0% 35.4%
-- $2 $254 $505 $757 $1,009 -- 8.1% 15.1% 21.4% 27.2% 32.7%
10% ($117) $135 $386 $638 $890 10% 4.2% 11.9% 18.4% 24.4% 30.0%
20% ($238) $16 $267 $519 $771 20% 0.0% 8.5% 15.4% 21.6% 27.3%
Pre-Tax NPV (US$M) Sensitivity To Initial Capex Pre-Tax IRR Sensitivity To Initial Capex Post-Tax NPV (US$M) Sensitivity To Initial Capex
Commodity Price Commodity Price Commodity Price
$505 -20% -10% 0% 10% 20% 21.4% -20% -10% 0% 10% 20%
(20%) $66 $318 $570 $822 $1,074 (20%) 10.4% 18.4% 25.7% 32.4% 38.9%
(10%) $34 $286 $538 $790 $1,042 (10%) 9.1% 16.7% 23.4% 29.6% 35.5%
-- $2 $254 $505 $757 $1,009 -- 8.1% 15.1% 21.4% 27.2% 32.7%
10% ($30) $221 $473 $725 $977 10% 7.1% 13.8% 19.7% 25.2% 30.3%
20% ($63) $189 $441 $693 $944 20% 6.3% 12.7% 18.3% 23.4% 28.3%
Pre-Tax NPV (US$M) Sensitivity To Sustaining Capex Pre-Tax IRR Sensitivity To Sustaining Capex Post-Tax NPV (US$M) Sensitivity To Sustaining Capex
Commodity Price Commodity Price Commodity Price
$505 -20% -10% 0% 10% 20% 21.4% -20% -10% 0% 10% 20%
(20%) $34 $286 $537 $789 $1,041 (20%) 9.1% 16.1% 22.4% 28.2% 33.7%
(10%) $18 $270 $521 $773 $1,025 (10%) 8.6% 15.6% 21.9% 27.7% 33.2%
-- $2 $254 $505 $757 $1,009 -- 8.1% 15.1% 21.4% 27.2% 32.7%
10% ($14) $238 $489 $741 $993 10% 7.6% 14.7% 20.9% 26.7% 32.2%
20% ($30) $222 $473 $725 $977 20% 7.1% 14.2% 20.4% 26.2% 31.7%
Pre-Tax NPV (US$M) Sensitivity To Head Grade Pre-Tax IRR Sensitivity To Head Grade Post-Tax NPV (US$M) Sensitivity To Head Grade
Commodity Price Commodity Price Commodity Price
$505 -20% -10% 0% 10% 20% 21.4% -20% -10% 0% 10% 20%
(20%) ($270) ($67) $134 $335 $536 (20%) 0.0% 5.9% 11.9% 17.2% 22.1%
(10%) ($134) $93 $320 $546 $773 (10%) 3.6% 10.8% 16.8% 22.3% 27.5%
-- $2 $254 $505 $757 $1,009 -- 8.1% 15.1% 21.4% 27.2% 32.7%
10% $137 $414 $691 $968 $1,246 10% 12.0% 19.2% 25.8% 31.9% 37.7%
20% $272 $574 $877 $1,180 $1,483 20% 15.7% 23.1% 29.9% 36.4% 42.5%
Pre-Tax NPV (US$M) Sensitivity To FX Pre-Tax IRR Sensitivity To FX Post-Tax NPV (US$M) Sensitivity To FX
Commodity Price Commodity Price Commodity Price
$505 -20% -10% 0% 10% 20% 21.4% -20% -10% 0% 10% 20%
(20%) ($399) ($144) $108 $360 $612 (20%) 0.0% 4.2% 10.6% 16.0% 21.0%
(10%) ($175) $77 $329 $581 $833 (10%) 2.7% 10.1% 16.2% 21.8% 27.0%
-- $2 $254 $505 $757 $1,009 -- 8.1% 15.1% 21.4% 27.2% 32.7%
10% $146 $398 $650 $902 $1,154 10% 12.7% 19.8% 26.3% 32.4% 38.2%
20% $266 $518 $770 $1,022 $1,274 20% 16.9% 24.2% 30.9% 37.3% 43.4%
Head
Gra
de
Head
Gra
de
FX
FX
Init
ial
Cap
ex
Init
ial
Cap
ex
Su
sta
inin
g C
ap
ex
Su
sta
inin
g C
ap
ex
Dis
co
un
t R
ate
Dis
co
un
t R
ate
Op
era
tin
g C
osts
Op
era
tin
g C
osts

Prairie Creek Page 2 87
NI 43-101 Technical Report on Preliminary Economic Assessment October 15, 2021
22.6 QP Comments on “Item 22: Economic Analysis”
Based on the assumptions and parameters presented in this Report, the PEA shows positive economics with the greatest sensitivity to commodity pricing and mine head grade.
Post-Tax NPV (US$M) Sensitivity To Discount Rate Post-Tax IRR % Sensitivity To Discount Rate Pre-Tax NPV (US$M)
Commodity Price Commodity Price
$299 -20% -10% 0% 10% 20% 17.7% -20% -10% 0% 10% 20%
3.0% $149 $423 $692 $958 $1,225 3.0% 6.5% 12.5% 17.7% 22.5% 27.1%
5.0% $55 $281 $500 $716 $931 5.0% 6.5% 12.5% 17.7% 22.5% 27.1%
8.0% ($42) $132 $299 $461 $623 8.0% 6.5% 12.5% 17.7% 22.5% 27.1%
10.0% ($86) $63 $204 $341 $478 10.0% 6.5% 12.5% 17.7% 22.5% 27.1%
12.0% ($118) $11 $132 $249 $365 12.0% 6.5% 12.5% 17.7% 22.5% 27.1%
Post-Tax NPV (US$M) Sensitivity To Operating Costs Post-Tax IRR Sensitivity To Operating Costs
Commodity Price Commodity Price
$299 -20% -10% 0% 10% 20% 17.7% -20% -10% 0% 10% 20%
(20%) $124 $291 $453 $615 $776 (20%) 12.3% 17.6% 22.5% 27.1% 31.4%
(10%) $43 $212 $376 $539 $700 (10%) 9.5% 15.1% 20.1% 24.8% 29.3%
-- ($42) $132 $299 $461 $623 -- 6.5% 12.5% 17.7% 22.5% 27.1%
10% ($134) $51 $220 $384 $547 10% 3.3% 9.8% 15.2% 20.2% 24.9%
20% ($240) ($33) $141 $307 $469 20% 0.0% 6.9% 12.7% 17.8% 22.6%
Post-Tax NPV (US$M) Sensitivity To Initial Capex Post-Tax IRR Sensitivity To Initial Capex
Commodity Price Commodity Price
$299 -20% -10% 0% 10% 20% 17.7% -20% -10% 0% 10% 20%
(20%) $13 $184 $348 $510 $671 (20%) 8.6% 15.3% 21.3% 27.0% 32.3%
(10%) ($14) $159 $324 $486 $647 (10%) 7.5% 13.8% 19.4% 24.6% 29.4%
-- ($42) $132 $299 $461 $623 -- 6.5% 12.5% 17.7% 22.5% 27.1%
10% ($70) $107 $273 $437 $599 10% 5.7% 11.4% 16.3% 20.8% 25.1%
20% ($98) $80 $248 $413 $575 20% 5.0% 10.4% 15.1% 19.3% 23.4%
Post-Tax NPV (US$M) Sensitivity To Sustaining Capex Post-Tax IRR Sensitivity To Sustaining Capex
Commodity Price Commodity Price
$299 -20% -10% 0% 10% 20% 17.7% -20% -10% 0% 10% 20%
(20%) ($17) $155 $321 $483 $644 (20%) 7.4% 13.3% 18.6% 23.4% 27.9%
(10%) ($29) $144 $310 $472 $634 (10%) 7.0% 12.9% 18.2% 23.0% 27.5%
-- ($42) $132 $299 $461 $623 -- 6.5% 12.5% 17.7% 22.5% 27.1%
10% ($54) $121 $287 $451 $613 10% 6.1% 12.1% 17.3% 22.1% 26.7%
20% ($67) $110 $276 $440 $602 20% 5.7% 11.7% 16.9% 21.7% 26.3%
Post-Tax NPV (US$M) Sensitivity To Head Grade Post-Tax IRR Sensitivity To Head Grade
Commodity Price Commodity Price
$299 -20% -10% 0% 10% 20% 17.7% -20% -10% 0% 10% 20%
(20%) ($270) ($94) $51 $187 $319 (20%) 0.0% 4.7% 9.8% 14.2% 18.3%
(10%) ($147) $23 $177 $325 $471 (10%) 2.8% 8.8% 13.9% 18.5% 22.8%
-- ($42) $132 $299 $461 $623 -- 6.5% 12.5% 17.7% 22.5% 27.1%
10% $53 $239 $419 $597 $774 10% 9.8% 15.9% 21.3% 26.4% 31.2%
20% $145 $344 $539 $732 $926 20% 12.9% 19.1% 24.8% 30.1% 35.2%
Post-Tax NPV (US$M) Sensitivity To FX Post-Tax IRR Sensitivity To FX Post-Tax IRR %
Commodity Price Commodity Price
$299 -20% -10% 0% 10% 20% 17.7% -20% -10% 0% 10% 20%
(20%) ($399) ($166) $22 $192 $358 (20%) 0.0% 3.3% 8.6% 13.2% 17.3%
(10%) ($186) $7 $178 $344 $506 (10%) 2.1% 8.2% 13.4% 18.0% 22.4%
-- ($42) $132 $299 $461 $623 -- 6.5% 12.5% 17.7% 22.5% 27.1%
10% $64 $232 $395 $557 $718 10% 10.4% 16.4% 21.8% 26.8% 31.6%
20% $149 $313 $475 $636 $797 20% 14.0% 20.1% 25.7% 30.9% 35.9%
Head
Gra
de
Head
Gra
de
FX
FX
Init
ial
Cap
ex
Init
ial
Cap
ex
Su
sta
inin
g C
ap
ex
Su
sta
inin
g C
ap
ex
Dis
co
un
t R
ate
Dis
co
un
t R
ate
Op
era
tin
g C
osts
Op
era
tin
g C
osts

Prairie Creek Page 2 88
NI 43-101 Technical Report on Preliminary Economic Assessment October 15, 2021
23 ADJACENT PROPERTIES
There are no mineral properties immediately adjacent to the Prairie Creek Project since the site is somewhat uniquely located in relation to the Nahanni National Park Reserve. The NNPR was expanded in 2009 and, as part of the expansion agreement, the Prairie Creek Mine itself, and a large surrounding area of approximately 300 square kilometres, was specifically excluded from the Park. This excluded area remains under the jurisdiction of the GNWT and is surrounded by the NNPR as shown in Figure 23-1. In addition, road access into the Prairie Creek Mine area through the expanded Park area was also provided through an amendment to the Canada National Parks Act, solely for the NNPR.
Figure 23-1: Mine Area Map
Note: Figure prepared by NZC, 2021.

Prairie Creek Page 2 89
NI 43-101 Technical Report on Preliminary Economic Assessment October 15, 2021
24 OTHER RELEVANT DATA AND INFORMATION
24.1 Mining Shapes
Mining Shapes were estimated using Deswik.SO, with the back-end Mineable Shape Optimizer (MSO).
For the MQV and STK, Mineable Shapes from the optimizer were grouped together into stopes nominally 30 m long, and three sublevels that are each 20 m height.
For the SMS, Mineable Shapes are nominally grouped into lengths of 30 m long in a single sublevel.
24.2 Dilution and Recovery Estimates
The LHOS shapes generated in MSO and then manually edited are inclusive of any planned dilution required to extract the mineralized material. Average unplanned waste dilution thickness along the hangingwall and footwall was estimated to be 0.2 m and 0.1 m, respectively. Average pastefill dilution from the floor was estimated to be 0.1 m and average endwall dilution from an adjacent filled stope was estimated to be 0.25 m. The resultant planned and unplanned dilution values of 16% and 12% respectively were evaluated from the stope shapes. The mining recovery utilized for all LHOS was 95%.
24.3 Geotechnical Considerations
24.3.1 Introduction
Dr. Paul Hughes provides comments regarding the geotechnical findings for the completed Technical Report for NorZinc’s Prairie Creek Mine and accompanying reports:
In general, the methodologies and analysis of the report are consistent for a Preliminary Economic Analysis (PEA) based on the geotechnical information data collected. It is the opinion that the findings of the report are considered aggressive for the level of geotechnical information gathered but are consistent with comparable mining studies.
The PEA was performed with limited geotechnical data gathering and relied on historic underground exposures and assessment of rock mass from core photos and geology logs. The data analysed was not directly associated with the proposed new mining areas – variation in rock mass is to be expected. The presence of shears and competency of the hangingwall needs further study.
The performed empirical analysis of the stope sizes may result in underestimating the dilution given the presence of shears within the proximal and distal hangingwall. However, this method of analysis is consistent with PEA level studies and typically provides an order of magnitude estimate for stope sizing. Ground support recommended is inline with standard drift support. The paste backfill testing to date has not achieved the adequate strengths required for vertical and horizontal exposures. If the strengths can not be achieved, higher binder content or additional support may be required for the backfill to perform as designed when exposed. The inadequate strength of backfill poses a risk to ability to recover ore, worker safety, and operating costs.

Prairie Creek Page 2 90
NI 43-101 Technical Report on Preliminary Economic Assessment October 15, 2021
24.3.2 Geotechnical Comments
Geotechnical studies indicate that the rock mass in historic development is competent in general. Poor rock mass, with occasional observed shears and very poor ground, along the hangingwall contact were observed. Logging from core photographs indicate that mean RQD is between “50-75%” with a wide dispersion of data around this mean. The study does not quantitatively investigate the conditions of the discrete contact between mineralized material and the hangingwall, rather mention of shears at contact is continued throughout the reporting. There is a risk of discrete zones of weaker rock mass than reported based on observations in the report and the wide disbursement of RQD values around the mean.
Mapping of the headings was performed to determine the rock mass ratings, structures, and assist in the design of ground support. It is understood that the future of the mine will be located a distance from the historic workings. The designing of mine infrastructure with extrapolated data presents a risk as the rock mass and structure may change with depth/location. The analysis to date does not capture the actual rock mass conditions in the proposed mining areas. A study of the variation of the rock mass domains over the mining area is required for subsequent studies.
Ground support for development is consistent with a PEA report and recommendations are suitable based on the reported rock mass values. The use the NGI Q’ index support provides a useful estimate tool in PEA assessment but tends to overprescribe rock mass for temporary headings. Opportunity exists in refining development ground control to better suit the rock mass once a quantitative geotechnical study of the mining areas is performed.
A review of the photos provided on development drifts show adequately scaled rock walls and reasonable ground control for the development widths. As the heading widths increase to fit equipment, additional ground support will be required. There appears a dominant near-flat lying discontinuity sets that may provide an opportunity to develop a shanty back. The ground conditions present at the mine can be considered to be in a ‘static’ state as it understood that min ing has not occurred within the past 14 years. Blasting, active mining and heating of the underground area may result in loosening of blocks and ground fall – the current conditions of the ground are not to be relied on during mining activities. It is recommended that a ground control inspection be performed prior to the resumption of underground mining activities.
The geotechnical study of the stope dimensions relied on the Potvin Modified Stope Stability (N’) methodology. This method provides a maximum stable hydraulic radius for a given rock mass, stope geometry, ground stress, and orientation of stope with respect to rock structure. This method is suitable for a PEA but does pose a risk to a study as it provides results based on observations at other operations that may not be empirically suitable. It is the opinion that the sheared nature of the hangingwall is not accounted for in the study when assessing the maximum stope spans that may impact stope stability.
The geotechnical study provides, without justification, an adjustment factor of 120% to the reported rock mass values. Further, the study reported the results based on ‘high confidence’ in the input parameters. Although it is considered practice in mining studies to use aggressive inputs some degree of caution should be applied when applying a positive adjustment factor in input parameters. The result of the aggressive design presents a risk of higher than anticipated dilution, and/or a requirement to reduce stope sizes during subsequent studies or during operations.
From the mining study, initial stope sizes are 60 m high, 30 m along strike, and 4.5 m wide. Dilution (external) from the spalling/deterioration of the stope walls will occur. AMC estimated the dilution to be 13% on a 4.5 m wide design: 0.2 m Equivalent Linear Overbreak Slough (ELOS) on the footwall; 0.3 m ELOS on the hangingwall; and 1.0 m on the stope end as fill dilution. The dilution levels are considered low - equivalent to minimal overbreak - for long hole blasting unless proper pre-support and/or specialized blasting techniques are employed. External dilution is sensitive to the ore body widths – an increase of 20 cm ELOS on the hangingwall increase external dilution by 5%. AMC note that the rock mass quality is variable – this is a project risk as applying generic, and low, dilution estimates to varying rock mass found within mineralized material will not properly characterize the dilution.

Prairie Creek Page 2 91
NI 43-101 Technical Report on Preliminary Economic Assessment October 15, 2021
Of note is that the 1.0 m of backfill (paste) within the mill feed may impact overall mineralized material recovery (through external dilution and issues with flotation) and is a project risk. Dilution can be expected to increase as the stope dips decrease. An opportunity to reduce dilution is present with a better understanding of the geotechnical domains and spatial locations. A thorough geotechnical 3D model will provide mine designers with opportunity to create larger stopes (improving production) and reduce stope sizes where adverse ground conditions are present (minimize dilution).
Ground support design for stoping is rock bolts, shotcrete, and cable bolts. This is a large amount of support and there is opportunity to reduce the need of shotcrete/cable bolts with further geotechnical study.
Recent testing of paste backfill testing indicates that comparatively low strengths are achieved for the applied binder content in comparison to industry standards. The 2015 study substantiates the findings of previous backfill test studies that found low paste strengths This poses an operational cost risk as the binder content required for stable vertical wall and horizontal exposures will require higher binder costs than likely assumed. Risk reduction on this item will require additional testing of tailings from any mill studies. Additives, additional or a/spec binder may be required to achieve required strength gains in backfill for the scheduled time. At present, the backfill testing has not provided a batch of samples of suitable strengths for horizontal (undercut exposures). Consideration of mining underneath paste will require additional costs than industry standard due to additional support, and/or binder contents.
Operational risks from low paste fill will be dilution from paste entering the mill feed, long rest times within stope for adequate strength gain in paste, and potential stope failure. Consideration of cemented waste rock for backfill should be considered if sufficient high strength paste back fill is not achievable.
24.3.3 Discussion
The PEA study was based on geotechnical mapping of footwall and hangingwall structures of historical developments in the upper part of the mine with core photo observations were made in assessing the rock mass for stope design and ground support. This is considered preliminary as it reviews data on hand or easily available and does not constitute a full geotechnical investigation.
For the PEA level study, AMC performed appropriate analysis for the given geotechnical recommendations. The dilution estimates and stope sizes are aggressive given the quality and quantity and spatial relation of the data to the proposed new mining areas. Consideration of smaller stope sizes and/or higher dilution should be considered in subsequent studies.
Ground support appears within typical ranges with an expectation that mining will not be in high stress conditions.
The PEA study has not succeeded in developing adequate strengths of fills. With a lack of a proper mill and low sample volumes, there is difficulty in performing a thorough backfill study. The inability to achieve paste strengths remains a project risk as backfill is required to maximize the orebody recovery.
The recommendations provided in the geotechnical report are suitable and provide adequate direction for subsequent geotechnical studies. In addition, it is recommended that televiewer scans be completed for geotechnical studies to provide additional insight into the hangingwall and provide structural information around the proposed new mining areas.

Prairie Creek Page 2 92
NI 43-101 Technical Report on Preliminary Economic Assessment October 15, 2021
25 INTERPRETATION AND CONCLUSIONS
25.1 Introduction
The QPs note the following interpretations and conclusions in their respective areas of expertise, based on the review of data available for this Report.
25.2 Mineral Tenure, Surface Rights, Water Rights, Royalties and Agreements
The mineral tenure is secure and covers the proposed Project and potential extensions via mining leases. Surface rights to the Mine site are currently in the form of Surface Leases, which will be replaced by new Surface Leases for the operations phase. Water rights are provided within Water Licences which allow use of water for potable consumption (Mine) and road construction and maintenance.
NorZinc has signed following agreements:
• Impact Benefit Agreement (IBA) 2011 with NDDB;
• Traditional Land Use Agreement (TLUA) 2019 with NDDB;
• Letter of Agreement (LOA) 2019 with NDDB linking the IBA and TLUA;
• Impact Benefit Agreement 2011 with LKFN;
• Road Benefit Agreement 2021 with LKFN;
• Letter of Agreement 2021 with LKFN linking the IBA and the TLUA;
• MOU with Parks Canada; and
• Socio-Economic Agreement with the Government of the Northwest Territories.
The Northwest Territories Mining Regulations impose a mining royalty on an operator or owner of a mine which is a percentage of the mine's annual profit. The profit is calculated as the mine's total revenue less the cost of mining and processing and other deductions and allowances. The royalty rate applied to the annual mine profit is the lesser of 13% of the total profit and the sum of escalating tiered marginal royalty rates ranging from zero percent to the maximum of 13%. NWT royalty payments total $237 M over the life of mine.
25.3 Geology and Mineralization
Exploration has located numerous base metal occurrences on the Property that can be grouped into four styles of mineralization: 1) Quartz veins containing base metal mineralization that occur in a north-trending, 16-km-long corridor.

Prairie Creek Page 2 93
NI 43-101 Technical Report on Preliminary Economic Assessment October 15, 2021
This style of mineralization includes the MQV. 2) STK type mineralization is associated with the MQV and does not appear to represent a true STK but rather a series of tensional splays from the MQV. STK mineralization is exposed underground in the 880 mL and has been intersected in drillholes. 3) SMS mineralization occurs near the currently-known lower limits of vein mineralization. Vein mineralization contains fragments of SMS indicating that the deposition of SMS pre-dated vein formation. SMS mineralization is not exposed on surface or underground and is known only from drillholes. 4) MVT showings in the northern section of the Property are developed over a distance of approximately 10 km and from north to south are referred to as the Samantha, Joe, Horse, Zulu, Zebra, and Road showings.
NZC generated explicitly-modelled wireframes for the three mineralized domains MQV, STK and SMS as inputs to the Mineral Resource Estimate. These solids were reviewed for conformity to the lithological boundaries established by drilling and were observed to adhere to the lithological boundaries. Some portions of the wireframe models are based on wide-spaced drilling and therefore the risk exists that the interpretation based on them may change at such time as more drilling is done to refine the understanding of the distribution of mineralization in those areas. Any changes to the wireframe models would affect the mineral resource based on them but the areas most likely to be affected all represent long-term mining targets. Regardless of that risk, the QP (Mosher) considers the geological interpretation and the assay data both suitable for the purpose of supporting the resource estimate described in Section 14 of this report.
25.4 Exploration, Drilling and Analytical Data Collection
The original discovery of mineralization on the Property was made by a local trapper in 1928, at what is now known as the Zone 5 showing, a mineralized vein exposed in the bank of Prairie Creek. In 1958, mapping was undertaken by Fort Reliance Minerals Limited. The claims lapsed in 1965 and were re-staked and subsequently conveyed to Cadillac Explorations Limited in 1966.
Between 1966 and 1969, Cadillac carried out trenching on a number of mineralized zones and underground exploration was commenced in the Main Zone as follow-up to trench results. Underground workings from this phase of exploration are currently inaccessible.
Penarroya Canada Limited (Penarroya) explored the Property in 1970 and in 1975, Noranda Exploration Company Limited carried out a small drill program.
Between 1980 and 1982 commenced development of the mine, mill and ancillary facilities but were forced into bankruptcy in May 1983, after a total of approximately C$64M (1982 value) had been expended on the Property. Thereafter, site maintenance and operations were taken over by Procan, which acquired Cadillac’s interest in the Property through bankruptcy proceedings in 1984.
In 1991, Nanisivik Mines Limited (Nanisivik) acquired the Property from Procan. Canadian Zinc Corp. (then known as San Andreas Resources Corporation), acquired a 60% interest in the Property from Nanisivik and in 1993 acquired a 100% interest in the mineral properties and a 60% interest in the plant and equipment, subject to a 2% net smelter royalty in favour of Procan. In January 2004, Canadian Zinc Corp. acquired all of Procan’s interest in the plant and equipment, including the 2% net smelter royalty, thereby securing a 100% interest in the Property.
In 2018, Canadian Zinc became a subsidiary of the newly-created NorZinc Limited.
There has been no production from the Property.
NZC and its former entities have been involved with mineral exploration activity across the Prairie Creek Property since 1992. Somewhat limited exploration drilling had occurred and most of the underground development had been undertaken

Prairie Creek Page 2 94
NI 43-101 Technical Report on Preliminary Economic Assessment October 15, 2021
prior to NZC’s initial involvement. From 1992 to 2021, NZC completed 299 surface and underground exploration diamond drillholes with an aggregate length of 80,453 m. In addition, 1,032 underground channel samples forming 365 composites from the three existing underground levels have been collected and analysed.
The main objective of exploration and underground development work has been focused on the Main Zone mineralization, where approximately 90% of the total drilling has been carried out.
Drill core was boxed at the drill by the drill crew then retrieved and removed to the core logging facility by NZC geologists. Core was checked for recovery, logged geologically and marked for sampling by a geologist. Core was split with a diamond saw for sampling; half was placed in a sample bag and the remainder returned to the core box. Unmineralized intervals were stored in square-piled stacks in the core storage area next to the boneyard near Harrison Creek. Mineralized intervals are stored in trailers adjacent to the core logging facility.
Bagged samples were placed in rice bags and flown to Fort Nelson, BC or Fort Simpson, NWT for transshipment to the assay laboratory.
25.5 Metallurgical Testwork
Past laboratory testing programs have been able to provide a conceptual mineral processing flowsheet and metallurgical response of the Prairie Creek material. However, most of this data relies on the most recent test work performed during 2017, which secured more representative samples. The 2017 optimization testing was performed on master composites to investigate the effect of particle size fractions on DMS and flotation. In addition, a comprehensive PEA level study was applied to flotation schemes and reagents. Variability testing investigated the optimized procedures, to provide the response of composite samples from diverse resource zones and potential mine blends. The PEA flowsheet that was developed incorporates a conventional process, consisting of DMS, followed by a moderate grind of DMS sinks (flotation feed) to a differential sulphide flotation circuit. This circuit shows good separation and recovery of lead and silver into a lead concentrate. This requires regrinding of the lead rougher concentrate, which is then cleaned in three stages. Following this the zinc is cleaned into a final concentrate in three stages, without the need for regrind.
The corresponding recovery model developed by the laboratory data allowed for estimation of metal payables, as well as potential detrimental elements, as related to the latest mine plan. The process response of the mined material reacts appreciably to the extent of sulphide oxidation present. This is accounted for in the recovery model. Based on the current mine schedule and assuming a 60% lead concentrate grade is produced, then the average lead recovery is projected at 82.5% during first five years of operation. This is predicted to increase to 86.5% lead recovery for LOM, due to a lower extent of sulphide oxidation in the mill feed later in the mine life. Correspondingly, most silver reports to the lead concentrate at a projected recovery of 82.2% during the first five years of operation, at an average grade of 935 g/t Ag to the concentrate. For LOM the silver recovery increases to 86.8% into the lead concentrate, at a grade predicted to average 1090 g/t Ag. Assuming 58% zinc concentrate grade, the average zinc recovery is provided at 79.6% during the first five years of operation, increasing to 85.7% zinc recovery for LOM.
25.6 Mineral Resource Estimates
The current Mineral Resource estimate is summarized in Table 25-1. A single block model was created to encompass the three mineral domains: MQV, STK, and SMS. The summary results are stated at a cut-off grade of 8% Zn equivalent (ZnEq).
The Mineral Resource was classified as Measured, Indicated and Inferred. For a block to be classified as Measured, it was necessary that a minimum of 24 composites be located within the volume of the search ellipse. The MQV and STK domains

Prairie Creek Page 2 95
NI 43-101 Technical Report on Preliminary Economic Assessment October 15, 2021
contain Measured resources; in both, the Measured blocks immediately surround the underground development in which channel sampling was carried out. For a block to be classified as Indicated, it was necessary that a minimum of 10 composites be located within the volume of the search ellipse. For a block to be classified as Inferred, it was only necessary that a minimum of four composites be located within the volume of the search ellipse.
Readers are cautioned that Mineral Resources that are not Mineral Reserves have not demonstrated economic viability.
Table 25-1: Prairie Creek Mineral Resource Estimate at a Cutoff Grade of 8% Zinc Equivalent
Domain CutOff ZnEq % Classification Tonnes ZnEq % Ag ppm Pb % Zn %
MQV 8 Measured 903,000 30.3 206 11.2 12.9
MQV 8 Indicated 5,248,000 27.7 181 12.0 10.3
MQV 8 M & I 6,152,000 28.0 184 11.9 10.7
MQV 8 Inferred 3,849,000 31.4 207 8.4 16.7
STK 8 Measured 128,000 17.4 97 4.1 10.3
STK 8 Indicated 2,754,000 12.6 63 3.2 7.6
STK 8 M & I 2,883,000 12.8 65 3.2 7.7
STK 8 Inferred 2,187,000 12.7 67 4.0 6.7
SMS 8 Indicated 722,000 16.4 53 5.1 9.7
SMS 8 Inferred 367,000 15.4 47 4.4 9.6
TOTAL 8 Measured 1,031,000 28.7 193 10.3 12.6
TOTAL 8 Indicated 8,724,000 22.0 133 8.6 9.4
TOTAL 8 M & I 9,755,000 22.7 139 8.8 9.7
TOTAL 8 Inferred 6,403,000 24.1 150 6.7 12.9 CIM definitions were followed for classification of Mineral Resources. Stated at a cut-off grade of 8% ZnEq based on prices of $1.15/lb for zinc, $1.00/lb for lead, and $20/oz for silver. Average processing recovery factors of 81.5% for zinc, 84.3% for lead, and 95.1% for silver. Average payables of 85% for zinc, 95% for lead, and 85% for silver. ZnEq = (grade of Zn in %) + [(grade of lead in % * price of lead in $/lb * 22.046 * recovery of lead in % * payable lead in %) + (grade of silver in g/t* (price of silver in $/Troy oz/ 31.10348) * recovery of silver in % * payable silver in %)]/(price of zinc in $/lb*22.046 * recovery of zinc in % * payable zinc in %). Numbers may not compute exactly due to rounding. The Mineral Resource estimate is effective as of October 15, 2021.
25.7 Mineral Reserve Estimate
There are no mineral reserves.
25.8 Mine Plan
The latest geological block model was analysed using state of the art software to identify mineable shapes. A more detailed study into mining costs and schedules is required before Mineral Reserves can be estimated.
The mining sequence and design is adequately robust and detailed for this level of study. Some optimisation of the development sequence and timing is warranted in further studies.

Prairie Creek Page 2 96
NI 43-101 Technical Report on Preliminary Economic Assessment October 15, 2021
The required production rate of 2,400 tpd is estimated to be achievable with ample opportunity to increase production by mining more stopes concurrently than what is currently called for. The stoping method is well known and suited to the type of deposit and the orebody. This de-risks the project to an extent. All of the equipment and technology in this study is proven and has been, or is currently being, successfully applied in similar projects. The development rates are considered achievable by a dedicated contract miner with experience of the ground conditions and the area.
25.9 Recovery Plan
The Prairie Creek concentrator consists of industrially proven unit operations: crushing, dense media separation, grinding and sequential flotation, and will be able to achieve the following estimated metal recoveries.
Annual metal production estimates shown in Table 25-2 were developed using the mine production schedule shown in Section 16 and the metallurgical performance projection outlined in Section 13. Based on this for the LOM the process plant is estimated to produce approximately 1,626kt of lead concentrate with a grade of 60% lead and 2,283 kt of zinc concentrate with a grade of 58% zinc. Average silver grade in lead concentrate is projected to be 1,090 g/t for lead concentrate.
Arsenic, mercury and antimony contents in lead concentrate and mercury contents in zinc concentrate may be higher than the penalty thresholds given by most smelters. For lead concentrate, the main impurity concentrations are projected to be 0.57% arsenic, 1.0% antimony and 0.04% mercury. For zinc concentrate, the average mercury content is estimated at 0.16% with cadmium at 0.343%.

Prairie Creek Page 2 97
NI 43-101 Technical Report on Preliminary Economic Assessment October 15, 2021
Table 25-2: Projected Lead and Zinc Concentrate Production
Year 1 2 3 4 5 6 7 8 9 10 11 12 13 14 15 16 17 18 19 20 21 Total/LOM
Average
Mill Feed Tonnage/Grade
Tonnage, kt 120.8 876.0 876.0 876.0 878.4 876.0 876.0 876.0 878.4 876.0 876.0 876.0 878.4 876.0 876.0 876.0 878.4 876.0 876.0 876.0 387.6 17,162
Grade
Ag, g/t 125 135 118 119 119 123 113 124 123 105 108 111 110 98 122 107 114 119 126 134 195 119
Pb total, % 7.38 7.77 7.51 8.00 7.92 8.21 7.65 8.14 7.87 6.37 6.87 6.52 6.08 5.37 5.68 4.60 4.80 4.93 4.93 5.40 7.00 6.58
Pb as sulphide, % 5.07 5.48 6.46 7.06 7.00 7.24 6.91 7.18 6.83 5.78 6.32 5.91 5.46 4.83 5.17 4.10 4.29 4.40 4.37 4.79 6.41 5.78
Zn total % 7.28 8.17 8.27 7.69 8.45 8.27 9.00 8.19 7.31 8.36 8.36 8.09 7.45 7.32 9.07 8.57 10.66 11.47 11.78 12.00 15.31 9.00
Zn as sulphide, % 5.55 6.20 7.42 7.04 7.97 7.76 8.60 7.66 6.59 8.06 8.27 7.99 7.34 7.18 8.96 8.45 10.46 11.28 11.53 11.80 15.06 8.58
Lead Concentrate Tonnage/Grade/Recovery
Tonnage, kt 10.0 78.8 92.9 101.5 100.9 04.2 99.4 103.3 98.5 83.0 90.8 84.9 78.7 69.3 74.3 58.8 61.7 63.0 62.6 68.7 40.7 1,626
Tons / day 165 216 254 278 276 285 272 283 269 227 249 233 215 190 203 161 168 173 172 188 111 221
Grade
Pb, % 60.0 60.0 60.0 60.0 60.0 60.0 60.0 60.0 60.0 60.0 60.0 60.0 60.0 60.0 60.0 60.0 60.0 60.0 60.0 60.0 60.0 60.0
Ag, g/t 1,023 1,040 950 897 902 905 888 913 935 992 949 1,024 1,093 1,095 1,287 1,402 1,427 1,450 1,539 1,496 1,678 1,091
Hg, g/t 346 434 361 364 327 374 354 332 307 330 364 413 444 460 577 607 588 582 597 626 892 437
Recovery
Pb, total % 67.6 69.4 84.7 86.9 87.0 86.9 89.1 86.9 85.5 89.2 90.4 89.2 88.3 88.4 89.5 87.5 87.7 87.6 87.1 87.2 90.0 86.5
Ag, % 67.9 69.2 85.0 87.2 87.3 87.3 89.4 87.0 85.6 89.4 90.7 89.5 88.6 88.7 89.8 87.8 88.0 88.0 87.5 87.6 90.6 86.8
Zinc Concentrate Tonnage/Grade/Recovery
Tonnage, kt 10.4 84.0 100.8 95.7 108.7 105.5 116.9 103.6 89.6 109.4 110.9 107.5 98.8 97.3 121.7 115.0 143.1 154.0 157.5 161.2 91.3 2,283
Tons / day 170 230 276 262 297 289 320 284 245 300 304 294 270 267 334 315 391 422 431 442 250 310
Grade
Zn, % 58.0 58.0 58.0 58.0 58.0 58.0 58.0 58.0 58.0 58.0 58.0 58.0 58.0 58.0 58.0 58.0 58.0 58.0 58.0 58.0 58.0 58.0
Ag, g/t 122 122 104 94 83 88 58 84 97 56 47 60 73 64 55 66 55 54 59 61 47 70
Hg, g/t 1,258 1,556 1,431 1,652 1,478 1,629 1,545 1,466 1,435 1,349 1,510 1,602 1,667 1,720 1,846 1,816 1,690 1,644 1,618 1,725 2,260 1,632
Recovery
Zn, total % 68.3 68.1 80.7 82.3 85.0 84.5 86.0 83.8 80.9 86.7 87.8 87.9 87.6 88.0 88.8 88.8 88.6 88.9 88.5 89.0 89.3 85.7
Ag % .3 8.7 10.1 8.7 8.7 8.6 6.9 8.0 8.1 6.7 5.5 6.7 7.4 7.3 6.3 8.1 7.9 7.9 8.4 8.4 5.6 7.8
Revenue M$ 37.3 294.5 343.3 348.7 366.8 368.4 372.1 366.4 339.6 335.7 350.0 336.6 314.6 290.4 343.9 302.2 349.5 369.3 377.8 395.0 229.5 6,832
Revenue $/t 308.8 336.2 391.9 398.0 417.6 420.5 424.8 418.2 386.7 383.2 399.5 384.2 358.2 331.5 392.5 345.0 397.9 421.6 431.3 450.9 592.1 398.1

Prairie Creek Page 2 98
NI 43-101 Technical Report on Preliminary Economic Assessment October 15, 2021
25.10 Infrastructure
25.10.1 Water Storage Pond
The WSP for this project was designed for tailings storage but is to be converted to a WSP. Just after construction, the pond’s back-slope slumped due to a combination of permafrost thaw and slope movement along a weak zone in the underlying in-situ clay layer.
The plan is to convert the pond into two cells, Cell A and Cell B, by the construction of a divider berm. The back-slope will be stabilized by the placement of an apron in the base of the pond and removing overburden material from the back-slope.
Cell A will receive water from the mill, and Cell B will receive groundwater intercepted underground.
Stability analyses of the pond remediation program of the back-slope and the containment berm were performed in accordance with dam safety guidelines for the Northwest Territories. The configuration of the storage water pond utilized limit 2D equilibrium analysis using SLOPE/W from Geostudio (2007). The results of the stability analyses for the remediation program for the WSP showed factors of safety that exceeded the prescribed requirements (1.5 static and 1.1 pseudo-static) and therefore the feasibility design is determined to be stable.
25.10.2 Waste Rock Pile
The new WRP constructed to store approximately 5 Mt of combined development waste rock and dense media separation float rock, along with 35,000 m3 of solid waste, will be located in a ravine approximately 1 km north of the plant site.
The toe of the WRP will be at an elevation of 937 m and proceed up the valley with an overall external slope of either 2:1 (H:V) to an elevation of 1,105 m to an elevation of 1,160 m, with the slope angle adopted to be based on detailed design results. The exterior slope will have benches to direct surface runoff to the collection pond. The rock portion of the WRP will be developed from the bottom up to provide a stable platform.
Diversion channels will direct runoff around the east and west sides of the WRP to Harrison Creek. The diversion channels will be designed for a 100-year storm event.
Slope stability analyses were performed for both the WRP and the seepage collection pond berm. Limit 2-D equilibrium analyses were performed using SLOPE/W from Geostudio (2007). The results of the analyses showed factors of safety that exceeded the prescribed requirements (1.5 static and 1.1 pseudo-static) and therefore the feasibility design is determined to be stable.
25.11 Environmental, Permitting and Social Considerations
The location of the Project poses environmental challenges due to being surrounded by a national park and having to cross that park by road to transport concentrates to market. However, the Company has obtained mine and road construction and operating permits and has extensive plans for effluent management and environmental protection. A process is underway to acquire modified mine permits to reflect the expanded Project development. The MVLWB has confirmed that the proposed development will not require another environmental assessment. The Company expects the modified permits to be issued in Q1-Q2 2022.

Prairie Creek Page 2 99
NI 43-101 Technical Report on Preliminary Economic Assessment October 15, 2021
The Company has negotiated and signed impact benefit agreements for development of the mine and access road with the two main Indigenous groups in the area, the NDDB and LKFN. Negotiations are underway with a 3rd group, ADKFN, regarding a business arrangement since ADKFN territory is proximal to the mine area and mine transport vehicles will utilize the Liard Highway which crosses ADKFN territory. The Company also has a Socioeconomic Agreement with the Government of the NWT.
25.12 Markets and Contracts
The Prairie Creek mine life corresponds with a period where the market requires significant additional supply of zinc and lead concentrates. There is near term risk that if a large number of mine projects came into operation around the scheduled start up of Prairie Creek, there could be a temporarily over supplied market. The impact of this scenario is limited as many mine projects often delay. Prairie Creek is also well positioned on the zinc mine cost curve in an over supplied market.
The high level of mercury is the most distinguishing feature of the Prairie Creek Zinc Concentrate. It materially influences the marketing of the concentrate in terms of customers and commercial terms. Mercury in zinc concentrates is common and the majority of zinc smelters control mercury and most smelters outside of China have the capability to remove mercury. The technology to remove mercury in zinc smelters is well established in the industry. Prairie Creek is not unique in the total quantity of mercury it will produce but will be one of several high mercury mines. The other characteristics of the Prairie Creek Zinc Concentrates are attractive for processing by most zinc smelters.
Through discussions with potential customers for the Prairie Creek Concentrates there is sufficient interest to purchase the production of the mine. The mercury in the concentrate has also been discussed with the potential customers. The risk of having long term reliable customers for the Prairie Creek Concentrates is not viewed as a significant risk.
The marketing strategy is based on anticipation of the results of future markets and sales agreement negotiations. It is not possible to have certainty regarding the future so there is an inherent risk on the actual outcomes.
25.13 Capital Cost Estimates
In the opinion of the QPs, the following conclusions and comments are made:
• Capital and costs were prepared according to each individual consultant’s area of expertise.
• Total Capital costs are estimated at US$679.5 M excluding closure costs of US$16 M. The estimate has been based on a combination of detail, semi-detailed estimating for most elements of the project, with capacity factoring or equipment factoring estimating for others.
• The capital cost estimate is categorized as an Ausenco Class 5 Level Estimate, in Q3 2021 United States dollars, with an expected accuracy of -25%/+35%, which aligns with the Association for the Advancement of Cost Engineering (AACE) guidelines for a Concept Screening estimate for which has an accuracy range of -30 to -15%/+20 to +50%.
25.14 Operating Cost Estimates
In the opinion of the QPs, the following conclusions and comments are made:
• Operating costs were prepared according to each individual consultant’s area of expertise.

Prairie Creek Page 3 00
NI 43-101 Technical Report on Preliminary Economic Assessment October 15, 2021
• Total operating costs (per tonne of milled ore) including transportation to the smelter, on average over the LOM are US$167.50.
• Process plant operating costs are based on power consumption, reagent and consumables usage, and an operating labour roster. Power costs are based on the loads specified in the equipment lists and data. Where required operating cost estimate was built from factoring, benchmarking and first principles.
• The operating cost estimate is categorized as an Ausenco Class 5 Level Estimate, in Q3 2021 United States dollars, with an expected accuracy of -25%/+35%, which aligns with the Association for the Advancement of Cost Engineering (AACE) guidelines for a Concept Screening estimate for which has an accuracy range of -30 to -15%/+20 to +50%.
25.15 Economic Analysis
• The economic analysis was performed using 8% discount rate and metals prices of 1.20 US$/lb Zn, 1.05 $/lb Pb and 24.00 $/oz Ag.
• The pre-tax NPV 8% is $505 M, the internal rate of return IRR is 21.4%. On an after-tax basis, the NPV 8% is US$299 M, the internal rate of return IRR is 17.7% and the payback 4.8 years.
Readers are cautioned that the economic analysis is preliminary in nature. It includes inferred Mineral Resources that are considered too speculative geologically to have the economic considerations applied to them that would enable them to be categorized as Mineral Reserves and there is no certainty that the preliminary economic analysis will be realized.
25.16 Risks and Opportunities
25.16.1 Risks
NorZinc has commenced an assessment of risks and opportunities for the Project based on likelihood and consequence of outcomes. Many of the risks are associated with current uncertainties related to the limited testing and technical information about the Mineral Resource estimate, material properties, and metallurgical parameters of the feed and concentrates, as would be expected in a PEA. Plans have been recommended in relevant geological, geotechnical, mining, metallurgy, and environmental areas as appropriate to better quantify aspects of the Project during more detailed next phase of the project studies.
Some of the key risks that have currently been identified and are being investigated are outlined in Table 25-3.

Prairie Creek Page 3 01
NI 43-101 Technical Report on Preliminary Economic Assessment October 15, 2021
Table 25-3: Project Risks
Preliminary Project Risks
Risk Explanation/Potential Impact Possible Risk Mitigation
Low commodity prices The Project is sensitive to low commodity prices negatively affecting economics
A focus on efficiency throughout the operation will minimize the economic impact of lower commodity prices.
High materials and labour prices
The Project is sensitive to materials and labour prices over which it has limited control. The Project economic model is based on a combination of pricing for metals, materials and labour. This combination may change to the Project’s advantage or disadvantage.
Further optimization of all operation processes to minimize cost of production would assist in reducing the economic impact of high materials and labour prices.
Condition of existing earthworks
The existing road out of site continues to be taken over by the various creeks/rivers, due to high rain events in the area. Slippage in the ground along the main access road form the airstrip to site. Impact is that environment is gradually reclaiming site.
Continuous repairs, preservation and protection of earthworks from further damage.
Metallurgical risk may develop from changes or variation in characteristics of the mill feed material
Potential detrimental effect on the project economics from impact to lead, zinc and silver recovery. This can include from mineral particle size and associations, or rock hardness, that could affect comminution response. Fluctuating extent of grade or mineral oxidation, or varying content of other elements including iron, graphite, mercury and other potentially detrimental elements that can impact product concentrate grade and quality.
These risks will be mitigated through more optimization and variability metallurgical testwork and by considering additional process design or altering the operating procedures.
Site completion
Unknown factors as to the details of the present equipment/buildings still exist including materials quality and specifications. As-built drawings of existing buildings are not available.
The buildings have stood without distortion or significant weather damage since they were built. As-built inspections, material stock takes, building surveys and materials testing will, however, be advisable.
Condition of existing process plant equipment
The major process plant components (mill, crushers, filters) may need more extensive and possibly offsite refurbishment.
Preliminary site investigations have been completed with specialist vendor input. Early works to further define the condition of the components is advisable.
Schedule delays due to weather and logistics related to cold weather construction
Seasonal restrictions for access are variable and could affect Project schedule and alter project economics.
Experienced management and sound operating plans will minimize the effect of this potential problem
Global supply chain & freight expediting delays due to the ongoing pandemic
Impact on project schedule Experienced management and sound operating
plans will minimize the impact
Insufficient Geotechnical analysis
The Geotechnical for the project is only significant for this phase of study. Safety, construction delays, excess dilution
A dedicated core logging and Geotechnical
modelling program should be launched to
derive mining parameters such as unplanned
dilution and support requirements, etc.
Covid construction cost impacts
There is a potential exposure risk of COVID-19 to the workforce due to the remote location of
COVID-19 Exposure Control Plan developed in
line with Public Health advise from the NWT

Prairie Creek Page 3 02
NI 43-101 Technical Report on Preliminary Economic Assessment October 15, 2021
Preliminary Project Risks
Risk Explanation/Potential Impact Possible Risk Mitigation
the mine and the travel requirements of the workforce. With vaccines and the COVID-19 mitigations, a disruption to the workforce is possible, with the potential for a short term shut down of activities.
Chief Public Health Office and WSCC that
includes symptoms monitoring, hygiene,
physical distancing, masks and PPE, cleaning
protocols and PCR testing.
Ability to attract a qualified workforce
High turnover rates and availability of appropriate experienced technical and management staff could result in difficulties meeting project goals. Skilled labour shortages could furthermore translate into the operating phase of the Project, increasing operating costs
Contracting, recruitment and retention
strategies will be developed to minimize these
risks.
Careful recruitment of experienced senior management will be essential. Continue with comprehensive training programs for local people and northern residents. Firm but fair management, incentive bonus systems and an understanding of the importance of morale will minimize the effects of this problem.
Geotechnical conditions are worse than used from the geotechnical investigations for the pond slump
Failure of the slope at the back of the WSP. Loss of operations of these ponds
Additional geotechnical investigations and
monitoring. Possibly a larger buttress, which
could reduce the storage capacity of the
ponds.
Storage ponds are too small for operations since there is some uncertainty in mine flows
Water treatment cannot keep up with mine flow and the discharge of untreated water to the environment
Update water management plan during next
design phase to reflex better understanding of
site wide waters.
Regulatory change or regulatory review
Change in regulatory requirements resulting in permitting change and updated environmental compliance requirements and/or increased costs to meet requirements.
Continued engagement with federal and
territorial governments on reviews and new
legislation.
Indigenous Government change
Change in Indigenous leadership resulting in lack of support for project which may impact and future project updates/permitting process schedule or costs.
Continued engagement with Indigenous
Governments on benefits from project.
Some of these risks could be mitigated through sensitivity analysis
25.16.2 Opportunities
Some of the identified key opportunities are tabulated below.

Prairie Creek Page 3 03
NI 43-101 Technical Report on Preliminary Economic Assessment October 15, 2021
Table 25-4: Project Opportunities
Project Opportunities
Opportunity Explanation Possible Benefit
Use of ore sorting as an alternative method of preconcentration rate
Ore sorting may prove to be more cost-effective solution when compared to Dense Media Separation (DMS)
Improved economics - reduced downstream capital and operating cost expenditure;
Cancelled equipment orders; bundling up new equipment orders
Take advantage of OEM’s cancelled equipment orders; by identifying major equipment supplier for the process flow sheet orders should be combined to receive equipment discount pricing
Lower capital cost expenditure resulting in economic benefit for the project
Used equipment Obtain used equipment for surface. Numerous sites are downsizing or closing and have available equipment.
Lower capital cost expenditure

Prairie Creek Page 3 04
NI 43-101 Technical Report on Preliminary Economic Assessment October 15, 2021
26 RECOMMENDATIONS
Following are recommendations for the execution phase of the project.
Mining Plus recommends the following for the next phase of study:
• Supplemental site wide geotechnical program to support next phase of work. Estimated cost of $70,000.
• Improve Geotechnical knowledge through a dedicated core logging and Geotechnical modelling program to confirm mining parameters. Estimated cost of $75,000.
• Improve confidence in the mining capital and operating expense estimates by updating equipment, labour and consumables etc. Costs. Estimated cost of $5,000.
• Utilize updated costing information to re-run MSO and confirm stope shapes. Estimated cost of $3,000.
• Identify the most valuable development philosophy, e.g. develop to highest grade mineralized material first vs develop to the closest part of the orebody. Estimated cost of $3,000.
• Evaluate various mining technologies, e.g. Battery Electric Vehicles, Automation of equipment. Estimated cost of $3,000.
• Analyse ventilation and heating requirements . Estimated cost of $2,000.
• Apply appropriate modifying factors into the orebody to estimate Reserves. Estimated cost of $100,000.
Metallurgical Testwork and Mineral Processing
If increasing the throughput and re-design of the existing Prairie Creek treatment circuit to a feasibility level, it is recommended that further laboratory testing be performed. This data would be used to better define the mineral processing design criteria. Objectives of future test work would be to further improve representation of mill feed with the developing mine schedule. This includes providing a higher level of confidence in modeling of the payables recovery and concentrate grade. This should also include better definition of the concentrate characteristics, including deportment of potential penalty elements, most notably mercury, arsenic, and antimony. Potential mill feed that contains elevated iron, copper or graphite should be identified as this can impact flotation response. The use of site water (including groundwater if relevant) should be tested in final verification testing of the updated flowsheet response.
The mineral samples tested in any future metallurgical study should be provided from fresh drill core, to represent feed characteristics with respect to lead, silver, and zinc grade, oxide content, as well as deleterious elements and relevant lithology. Extent of sulphide oxidation in mill feed is a significant process parameter that can negatively impact flotation response. Mercury content in zinc concentrates has recently become more restrictive and must be followed closely in any future test program. Optionally, the use of hydrometallurgy may be better adapted to treat zinc concentrates with low silver and elevated mercury content than pyro-metallurgy options. Consequently, the use of pressure oxidation treatment might be investigated for the zinc concentrate, as there are regional refiners in Western Canada that may be willing to provide terms to compare against overseas smelters. A sufficient mine life may also justify evaluating on-site hydrometallurgical treatment of Prairie Creek zinc concentrate as a future opportunity.

Prairie Creek Page 3 05
NI 43-101 Technical Report on Preliminary Economic Assessment October 15, 2021
For future mineral process testing to a feasibility level, the cost estimate is US$360,000. This program would relate to DMS testing, followed by variability testing including ball mill work indices, both open and locked cycle flotation work, liquid-solid separation studies, as well as better provision of the concentrate characteristics, including material handling. A reduction in the testing program objectives would result in lower confidence to developing accurate criteria for process design. This cost estimate does not include (if desired depending on engineering design philosophy) further optimization testing to any significant extent. It would also not include comminution test work if wanted for crushing or semi-autogenous grinding work indices, or hydrometallurgical investigations for zinc concentrate treatment. Further testing relating to tailing storage and design, underground paste backfill, and environmental requirements would also be additional if it is deemed to be required.
Recovery Methods
Ausenco recommends that ore sorting should be considered as an alternative pre-concentration method which could replace Dense Media Separation. Ore sorting evaluation should be conducted to assess amenability of the ore sorting process option for the Prairie Creek project. Ausenco estimates that evaluation works will be in the US$10,000 range.
Based on the benchmarking done ore sorting application to similar ore bodies, ore sorting can potentially add value to the project by:
• reducing operating cost in the pre-concentration circuit (eliminates the need for the reagents).
• decreasing capital and operating expenditure in the milling circuit by rejecting more waste material.

Prairie Creek Page 3 06
NI 43-101 Technical Report on Preliminary Economic Assessment October 15, 2021
27 REFERENCES
There is an extensive list of references in the 2012 PEA Technical Report. References listed below are those cited in this report.
Ausenco 104367-RPT-RX-001: Canadian Zinc, Prairie Creek Recovery Estimate Model Derivation ., October 7, 2021
Ausenco 103014-TOS-001 Rev.C: Canadian Zinc, Prairie Creek Derisking and Basic Engineering Trade Off Study, Lead Oxide Flotation Circuit., November 28, 2018
Golder Associates (2010). Preliminary Design: Waster Rock Pile at Prairie Creek Mine NWT. Golder Associates, February 2010.
Golder Associates (2010). Preliminary Design: Water Storage Pond at Prairie Creek Mine NWT. Golder Associates, March 2010.
Golder Associates (2012). Feasibility Design: Water Storage Pond at Prairie Creek Mine NWT. Golder Associates, 11 September 2012.
Jenike and Johanson Ltd.: - Report 70809-1 Rev. 1, Canadian Zinc Prairie Creek, NWT, Flow Property Test Results for Zinc Lead Silver Ore, July 28, 2017
JDS Energy & Mining Inc., (2013). Prairie Creek Mine Site Condition Inspection Report. 13 December 2013.
Northwest Hydraulics (2010), Conceptual Design for Mine Site Outfall to Prairie Creek, Northwest Hydraulics (EBA), 9 September 2010.
Paradis, S., (2007). Isotope Geochemistry of the Prairie Creek Carbonate-hosted Zinc-lead-silver Deposit, southern Mackenzie Mountains, Northwest Territories, in Mineral and Energy Re source source Assessment of the Greater Nahanni Ecosystem Under Consideration for the Expansion of the Nahanni National Park Reserve, Northwest Territories; Geological Survey of Canada, Open File 5344, p. 131-176.
SGS Project 16016-001 Final Report: - Dense Media Separation, Comminution, Flotation and Solid-Liquid Separation on Samples for the Prairie Creek Project, Prepared for Canadian Zinc., July 28, 2017
SGS Project 16016-001 Final Report II: - Flotation of Oxidized Samples for the Prairie Creek Zinc Lead and Silver Project., December 4, 2017
SGS Test Results Summary CAVM 16016-001, Solid – Liquid Separation and Geotechnical Test results for Three Flotation Samples for Canadian Zinc Corporation., May 24, 2017.
White Paper (Internal to NorZinc): - Prairie Creek Mine Optimization., March 5, 2020.