selected model assessment reports - Prairie State College
65
SELECTED MODEL ASSESSMENT REPORTS 2007-2008
-
Upload
khangminh22 -
Category
Documents
-
view
1 -
download
0
Transcript of selected model assessment reports - Prairie State College
SELECTED MODEL ASSESSMENT REPORTS
2007-2008
CONTENTS
MODEL ASSESSMENTS IN GENERAL EDUCATION . . . . . . . . . . . . . . . . . . . . . . . . . . . . . . . . . . . . . . 1
Communication . . . . . . . . . . . . . . . . . . . . . . . . . . . . . . . . . . . . . . . . . . . . . . . . . . . . . . . . . . . . . 2
Scientific Reasoning . . . . . . . . . . . . . . . . . . . . . . . . . . . . . . . . . . . . . . . . . . . . . . . . . . . . . . . . . . 6
MODEL ASSESSMENTS IN TRANSFER DISCIPLINES (ARTS & SCIENCES) . . . . . . . . . . . . . . . . . . 17
Chemistry . . . . . . . . . . . . . . . . . . . . . . . . . . . . . . . . . . . . . . . . . . . . . . . . . . . . . . . . . . . . . . . . . . 18
Education (transfer) . . . . . . . . . . . . . . . . . . . . . . . . . . . . . . . . . . . . . . . . . . . . . . . . . . . . . . . . . 25
Humanities . . . . . . . . . . . . . . . . . . . . . . . . . . . . . . . . . . . . . . . . . . . . . . . . . . . . . . . . . . . . . . . . . 30
MODEL ASSESSMENTS IN BUSINESS & TECHNOLOGY . . . . . . . . . . . . . . . . . . . . . . . . . . . . . . . . . 35
Computer Aided Design (CAD) . . . . . . . . . . . . . . . . . . . . . . . . . . . . . . . . . . . . . . . . . . . . . . . . 36
IT: Web and Networking . . . . . . . . . . . . . . . . . . . . . . . . . . . . . . . . . . . . . . . . . . . . . . . . . . . . . . 39
MODEL ASSESSMENTS IN HEALTH PROFESSIONS . . . . . . . . . . . . . . . . . . . . . . . . . . . . . . . . . . . . . 47
Fitness & Exercise . . . . . . . . . . . . . . . . . . . . . . . . . . . . . . . . . . . . . . . . . . . . . . . . . . . . . . . . . . 48
Nursing . . . . . . . . . . . . . . . . . . . . . . . . . . . . . . . . . . . . . . . . . . . . . . . . . . . . . . . . . . . . . . . . . . . . 50
MODEL ASSESSMENT IN DEVELOPMENTAL STUDIES . . . . . . . . . . . . . . . . . . . . . . . . . . . . . . . . . . 56
Reading . . . . . . . . . . . . . . . . . . . . . . . . . . . . . . . . . . . . . . . . . . . . . . . . . . . . . . . . . . . . . . . . . . . 57
MODEL ASSESSMENTS INGENERAL EDUCATION
Communication
Scientific Reasoning
2
What makes the Communication Report a model for assessment of student learning in generaleducation?
The opening paragraph is exceptionally thoughtful and reviews the kinds of thinking and research thatunderlies a meaningful assessment project and guides its development. • Reviews the IAI learning objectives for Comm 101, the College's gen ed learning objectives, and
the master syllabus for 101. That helps ensure the centrality of what is being assessed to whatwe most want students to learn.
• Reviews assessment projects from other schools to see what can be learned.• Defines what is meant by "oral communication competency" and develops a clear set of learning
outcomes plus a rubric that can be used to assess them.
The Communication Department has chosen to assess the learning objective they care most about ("oralcommunication competency"), one that is central to both disciplinary and general education learningoutcomes. In addition, they have defined five specific categories of performance that define thatcompetency and created a rubric that reflects those competencies. The assessment is admirably holisticand looks at the most important outcome for a course required for all graduates.
The full-time faculty members have thought carefully about the mechanism for assessing this outcome andhave come up with plan that allows them to evaluate students taught by both adjunct and full-time faculty. They have also selected sections meeting at different times of day, thus providing a better cross-departmental overview.
They have reviewed and re-evaluated their plans to reflect what can realistically be accomplished giventhe difficulty of securing adequate adjunct participation. They asked Lee to make a random selection ofclasses meeting at different times.
They developed a workable system of "grading," separating students into three categories which arecarefully delineated by the percentage of mastery that defines them.
The fall 07 assessment project provided usable data that suggested that students were performing lesswell than expected on Learning outcome 2 - "construct and deliver a well organized, logical presentation…that demonstrates critical thinking skills," and the faculty adjusted their instruction to spend more time onthose skills.
In spring 08 the assessment was repeated with minor changes in both procedure and sampling. Insteadof having all the evaluation done by full-timers, one adjunct was added to the team observing thespeeches. Again, some very concrete and useful information emerged about students' difficulty in meetingtime limits. This information will now be shared across the department. Finally, the department will meetthis week to develop an action and integration plan based on recent results. It seems to me that this kindof recursive process is typical of excellent assessment, as are the ongoing discussions about how to doeffective assessment. The usefulness and specificity of the results are due in part to the careful process ofplanning, analysis, and fine tuning.
3
COMMUNICATION REPORT ON ASSESSMENT OF STUDENT LEARNING 2007-2008
PLANNING - Making ProgressDuring fall semester 2006, we spent time exploring ways to assess oral communication competency in theCOMM 101 course. To assist us in this task, we reviewed the IAI learning goals for the basiccommunication course, the College's general education learning objectives, the course goals/objectivesoutlined in the master syllabus for COMM 101, and communication assessment projects from othercolleges/universities. Our review of these documents led us to the following: a definition of oralcommunication competency, the identification of common learning goals for COMM 101, a clear set oflearning outcomes for oral communication assessment, and an adaptable rubric for assessing oralcommunication.
A Pilot assessment project was conducted in Spring 2007. Six sections of COMM 101 were selected forparticipation in the pilot project. The results of this assessment (see Spring 2006-2007 assessmentreport) were informative and provided enough constructive feedback for us to forge ahead with this newassessment project for the 2007-2008 academic year. The details of this assessment project is describedin the following pages.
Definition of Competency: Oral communication competency is defined as the ability to use oralcommunication as a way of thinking as well as sharing ideas with others. The general educationcurriculum identifies several learning objectives in oral communication that are addressed specifically inCOMM 101. PSC students are required to take COMM 101 to meet the general education requirement.
Based upon our review of the course goals/objectives of the master syllabus for COMM 101, the College'sgeneral education objectives, and IAI's list of competencies for the basic communication course, weidentified six common learning goals.
Learning Goals:1. Students will understand and practice effective elements of verbal and nonverbal communication.2. Students will demonstrate understanding of and proficiency in constructing multiple message
types.3. Students will develop critical thinking and listening skills.4. Students will learn and practice principles of ethical communication.5. Students will understand the influence of culture in communication and will know how to cope with
cultural differences when presenting information to an audience.6. Students will demonstrate ability to use technology to facilitate learning.
From these learning goals, five specific learning outcomes have been identified for oral communicationassessment. Upon completion of COMM 101, students will be able to:
1. Analyze audience and adapt an oral presentation to audience.2. Construct and deliver a well-organized, logical, and informative oral presentation that
demonstrates critical thinking skills.3. Use clear, concise, colorful, creative and culturally sensitive language in an oral presentation.4. Use appropriate delivery techniques (e.g. maintain adequate eye contact, being vocally
expressive, avoid distracting or nervous mannerisms, etc.) in an oral presentation.5. Use appropriate presentational technology to enhance messages and convey greater depths of
information, knowledge and feeling in an oral presentation.
DATA COLLECTION - Making ProgressFor COMM 101, faculty agreed that an in-class oral presentation during weeks 14-16 was the bestopportunity to assess student oral communication competence. Students are required to give a 7-9 minutepersuasive presentation on a question of fact, value or policy. This presentation is generally the finalindividual presentation in COMM 101.
4
Faculty in the department have developed, tested, and been using rubrics to assess student presentationsfor years. A rubric was used to assess the 7-9 minute persuasive presentation during Fall 2007 and Spring2008. The rubric reflects the specified learning outcomes for students upon the completion of COMM 101. The rubric (see attached) uses a 3-point scale and includes 20 items in 7 major areas: audience analysis,introduction, content/organization, language, conclusion, delivery, and presentation aids.
In Fall 2007, with the help of Lee Helbert-Gordon, a stratified sample based on the time of day COMM 101courses meet was originally planned for assessment. Our original goal was to assess persuasivepresentations in five (5) day courses, one (1) afternoon class, and three (3) evening classes(approximately 200 students or 43% of the total population in 22 sections of COMM 101. Unfortunately,due to our inability to secure enough adjunct participation in the assessment project, we ended up doingthe assessment in five randomly selected courses chosen by Lee Helbert-Gordon.
Three adjunct faculty sections were chosen and two full time faculty sections were chosen for assessment.Two of the sections met in the morning, two met in the afternoon, and one section met in the evening. Thethree full time faculty members served as the raters. The raters went into classes, and rated a totalnumber of 65 presentations - an average of 13 presentations per section.
The results were aggregated across all five sections. The three faculty members participating in theassessment established standards for oral communication competency. The faculty decided upon thefollowing standards: • Highly competent level: a student "meets expectations" on 90% or more of 20 items.• Competent level: a student "meets expectations" on 75%-89% of the 20 items.• Less than competent: a student "meets expectations" on less than 75% of the total items.
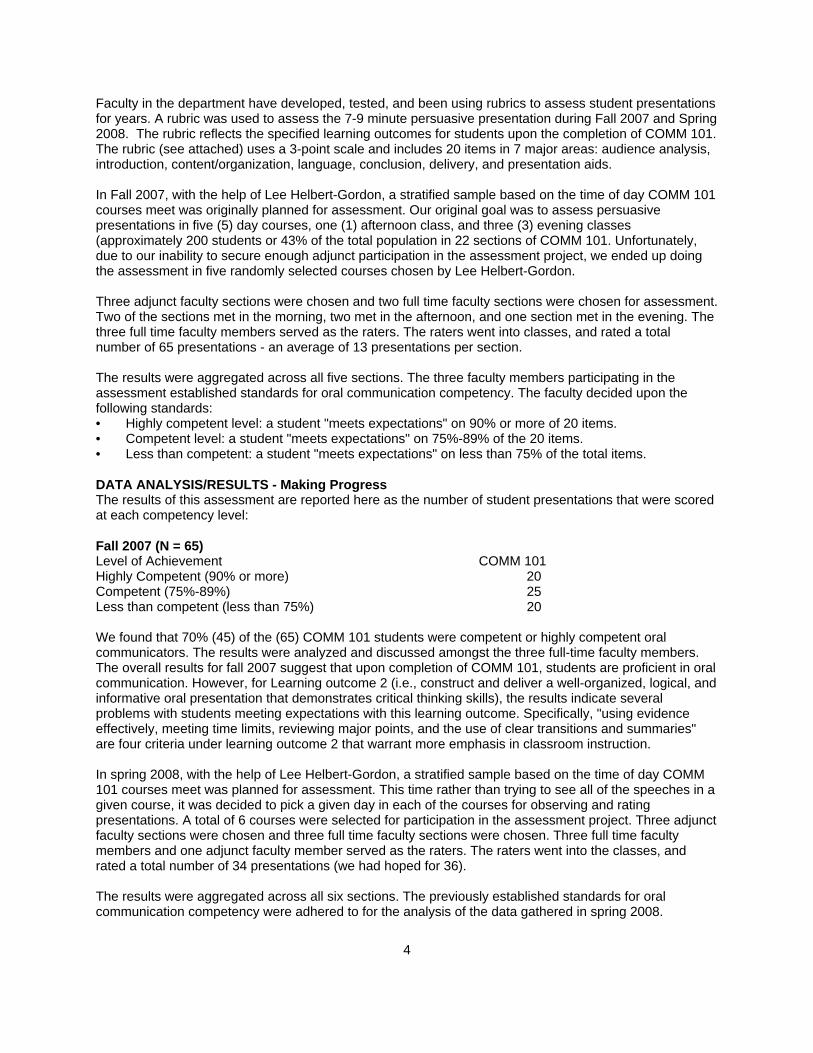
DATA ANALYSIS/RESULTS - Making ProgressThe results of this assessment are reported here as the number of student presentations that were scoredat each competency level:
Fall 2007 (N = 65)Level of Achievement COMM 101Highly Competent (90% or more) 20Competent (75%-89%) 25Less than competent (less than 75%) 20
We found that 70% (45) of the (65) COMM 101 students were competent or highly competent oralcommunicators. The results were analyzed and discussed amongst the three full-time faculty members.The overall results for fall 2007 suggest that upon completion of COMM 101, students are proficient in oralcommunication. However, for Learning outcome 2 (i.e., construct and deliver a well-organized, logical, andinformative oral presentation that demonstrates critical thinking skills), the results indicate severalproblems with students meeting expectations with this learning outcome. Specifically, "using evidenceeffectively, meeting time limits, reviewing major points, and the use of clear transitions and summaries"are four criteria under learning outcome 2 that warrant more emphasis in classroom instruction.
In spring 2008, with the help of Lee Helbert-Gordon, a stratified sample based on the time of day COMM101 courses meet was planned for assessment. This time rather than trying to see all of the speeches in agiven course, it was decided to pick a given day in each of the courses for observing and ratingpresentations. A total of 6 courses were selected for participation in the assessment project. Three adjunctfaculty sections were chosen and three full time faculty sections were chosen. Three full time facultymembers and one adjunct faculty member served as the raters. The raters went into the classes, andrated a total number of 34 presentations (we had hoped for 36).
The results were aggregated across all six sections. The previously established standards for oralcommunication competency were adhered to for the analysis of the data gathered in spring 2008.
5
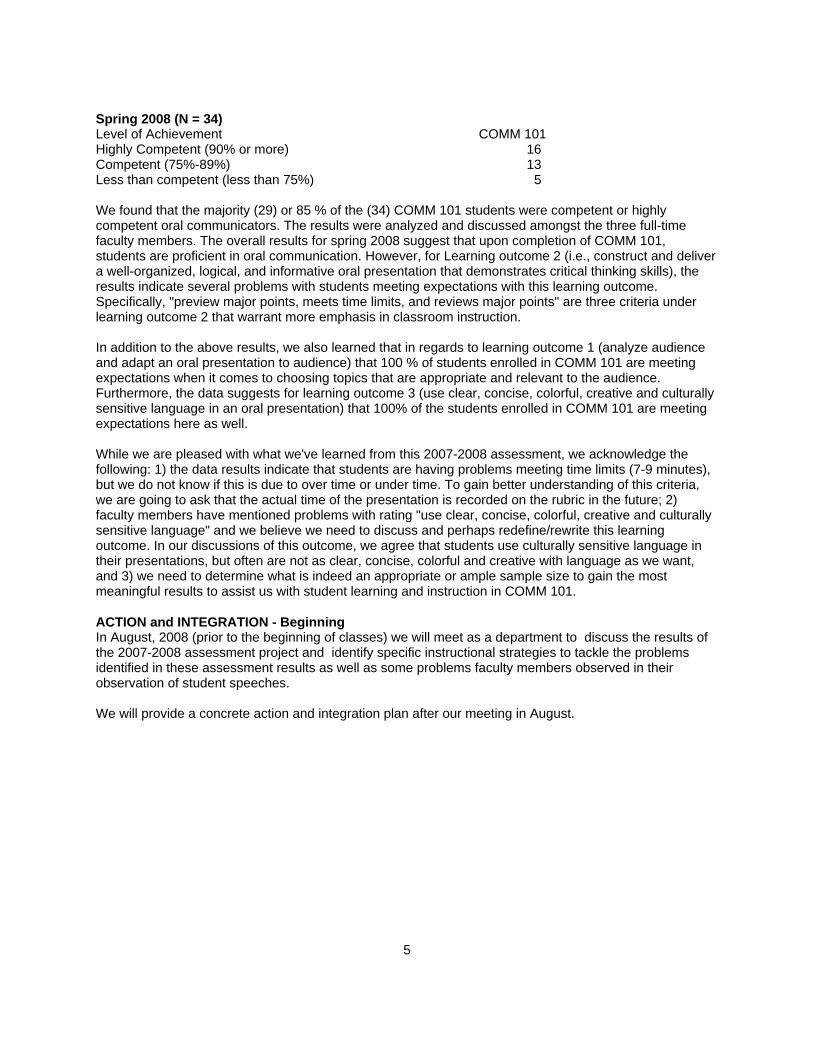
Spring 2008 (N = 34)Level of Achievement COMM 101Highly Competent (90% or more) 16Competent (75%-89%) 13Less than competent (less than 75%) 5
We found that the majority (29) or 85 % of the (34) COMM 101 students were competent or highlycompetent oral communicators. The results were analyzed and discussed amongst the three full-timefaculty members. The overall results for spring 2008 suggest that upon completion of COMM 101,students are proficient in oral communication. However, for Learning outcome 2 (i.e., construct and delivera well-organized, logical, and informative oral presentation that demonstrates critical thinking skills), theresults indicate several problems with students meeting expectations with this learning outcome.Specifically, "preview major points, meets time limits, and reviews major points" are three criteria underlearning outcome 2 that warrant more emphasis in classroom instruction.
In addition to the above results, we also learned that in regards to learning outcome 1 (analyze audienceand adapt an oral presentation to audience) that 100 % of students enrolled in COMM 101 are meetingexpectations when it comes to choosing topics that are appropriate and relevant to the audience.Furthermore, the data suggests for learning outcome 3 (use clear, concise, colorful, creative and culturallysensitive language in an oral presentation) that 100% of the students enrolled in COMM 101 are meetingexpectations here as well.
While we are pleased with what we've learned from this 2007-2008 assessment, we acknowledge thefollowing: 1) the data results indicate that students are having problems meeting time limits (7-9 minutes),but we do not know if this is due to over time or under time. To gain better understanding of this criteria,we are going to ask that the actual time of the presentation is recorded on the rubric in the future; 2)faculty members have mentioned problems with rating "use clear, concise, colorful, creative and culturallysensitive language" and we believe we need to discuss and perhaps redefine/rewrite this learningoutcome. In our discussions of this outcome, we agree that students use culturally sensitive language intheir presentations, but often are not as clear, concise, colorful and creative with language as we want,and 3) we need to determine what is indeed an appropriate or ample sample size to gain the mostmeaningful results to assist us with student learning and instruction in COMM 101.
ACTION and INTEGRATION - BeginningIn August, 2008 (prior to the beginning of classes) we will meet as a department to discuss the results ofthe 2007-2008 assessment project and identify specific instructional strategies to tackle the problemsidentified in these assessment results as well as some problems faculty members observed in theirobservation of student speeches.
We will provide a concrete action and integration plan after our meeting in August.
6
What makes the Scientific Reasoning Report a model for assessment of student learning ingeneral education?
This report is based on a cross disciplinary assessment of scientific reasoning. In addition to identifyingproblems that students have across the sciences, it is useful in evaluating our college-wide learningoutcomes in problem solving. The test is designed to assess students’ ability to “think like a scientist.” AsLee Anne explains, “The test is not content related: all the information needed to answer a question ispresent in the test.” Students are asked to read and analyze information from a variety of scientificdisciplines, much as they are in the reading portion of the SAT. What the test reveals is something wehear anecdotally from faculty in the sciences and health professions. Our students are learning lots offactual information in their science classes. Where they falter is applying what they have learned in aslightly different context. This may be a college-wide problem, and what this assessment demonstrates isthat this is another way in which we are a “developmental college.” Most of our students come to usneeding developmental work in reading, math, and English, and they get instruction that brings them along way towards making up for prior deficiencies, but some developmental problems remain, and onethat needs special thought and attention is how to develop teaching strategies that will help our studentslearn how to apply what they already know to solve problems in a new context.
7
SCIENTIFIC REASONING REPORT ON ASSESSMENT OF STUDENT LEARNING 2007-2008
Natural Science Department: Impact and Implications of Scientific Reasoning Test
INTRODUCTIONThe Natural Science Department continued administering the Science Reasoning Test during the2007-2008 academic year. This test is designed to assess students' ability to think like a scientist: toprocess information, interpret it and reason like scientists (as well as other professionals.) The test is notcontent related: all the information needed to answer a question is present in the test. Questions aremodeled after ACT and PLAN test questions and are at the high school sophomore and junior level.
Students are required to read and analyze information from a variety of science disciplines. Data arepresented in the form of paragraphs, tables, charts and graphs which the student must read and interpret . Questions require the student to "look up" information, draw conclusions, extrapolate, interpolate, andcompare and contrast data as well as conclusions of others. The test consists of twenty questions: six orseven questions about information provided in each of three passages. A final question asks how manycollege science courses the student has taken.
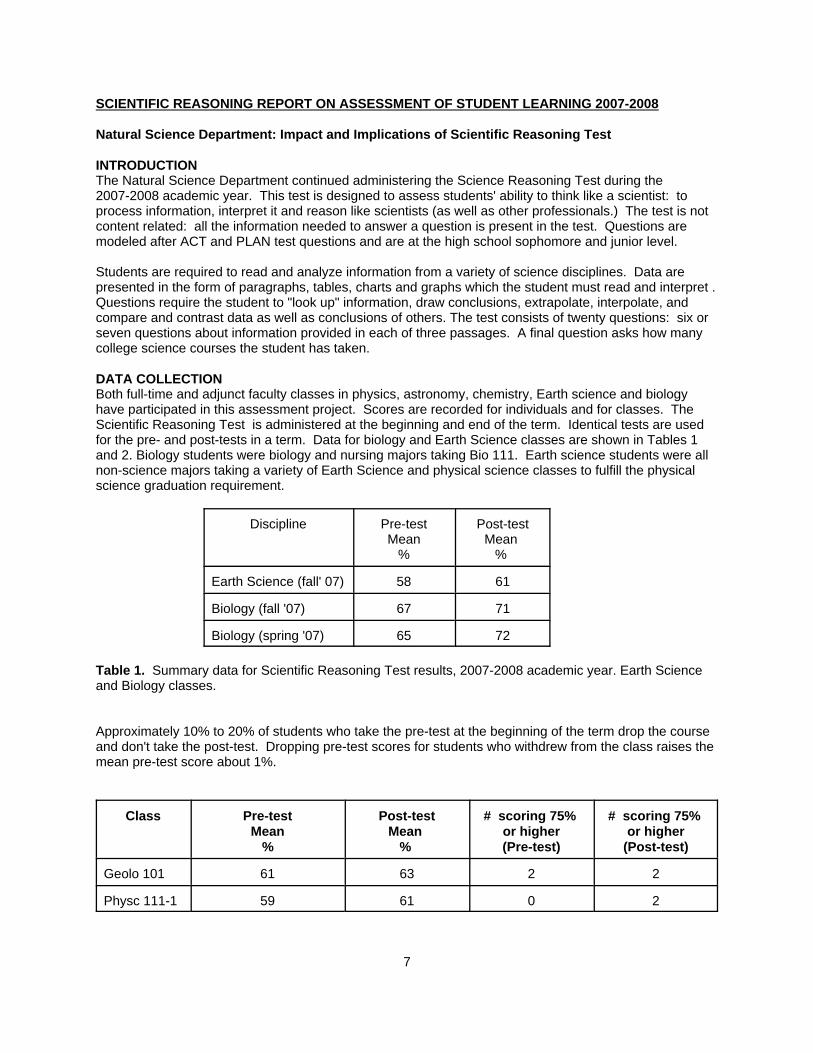
DATA COLLECTIONBoth full-time and adjunct faculty classes in physics, astronomy, chemistry, Earth science and biologyhave participated in this assessment project. Scores are recorded for individuals and for classes. TheScientific Reasoning Test is administered at the beginning and end of the term. Identical tests are usedfor the pre- and post-tests in a term. Data for biology and Earth Science classes are shown in Tables 1and 2. Biology students were biology and nursing majors taking Bio 111. Earth science students were allnon-science majors taking a variety of Earth Science and physical science classes to fulfill the physicalscience graduation requirement.
Discipline Pre-testMean
%
Post-testMean
%
Earth Science (fall' 07) 58 61
Biology (fall '07) 67 71
Biology (spring '07) 65 72
Table 1. Summary data for Scientific Reasoning Test results, 2007-2008 academic year. Earth Scienceand Biology classes.
Approximately 10% to 20% of students who take the pre-test at the beginning of the term drop the courseand don't take the post-test. Dropping pre-test scores for students who withdrew from the class raises themean pre-test score about 1%.
Class Pre-testMean
%
Post-testMean
%
# scoring 75% or higher(Pre-test)
# scoring 75% or higher
(Post-test)
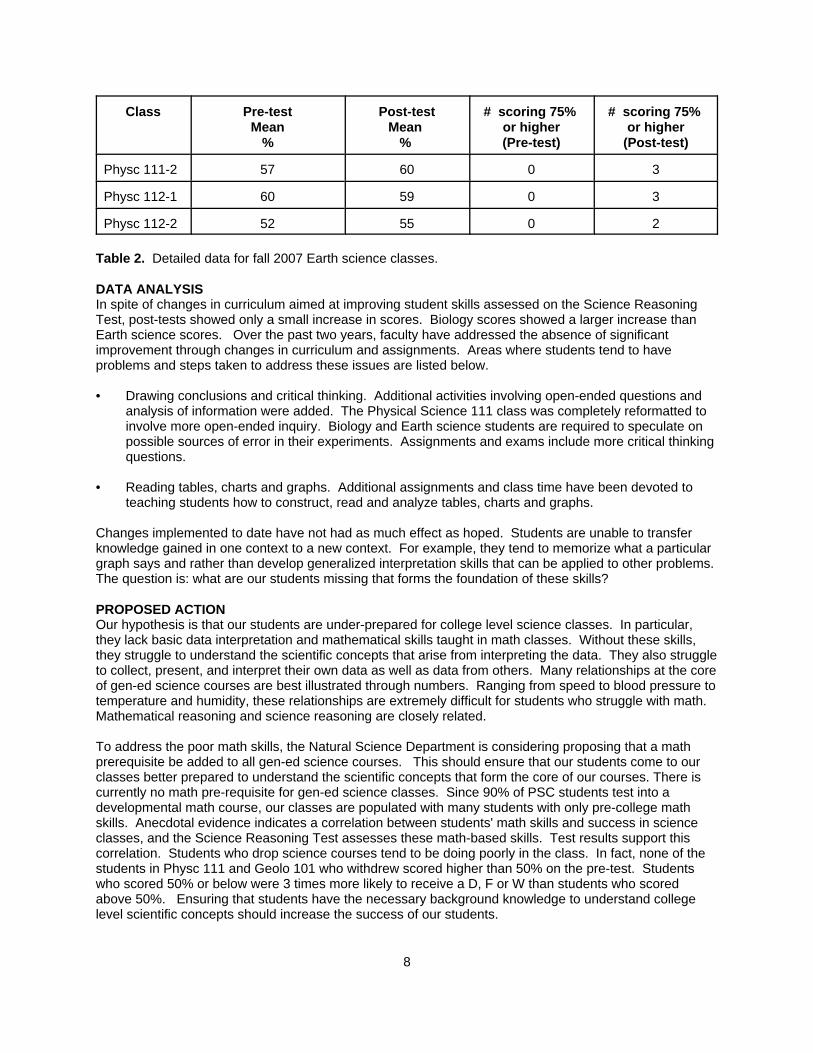
Geolo 101 61 63 2 2
Physc 111-1 59 61 0 2
Class Pre-testMean
%
Post-testMean
%
# scoring 75% or higher(Pre-test)
# scoring 75% or higher
(Post-test)
8
Physc 111-2 57 60 0 3
Physc 112-1 60 59 0 3
Physc 112-2 52 55 0 2
Table 2. Detailed data for fall 2007 Earth science classes.
DATA ANALYSISIn spite of changes in curriculum aimed at improving student skills assessed on the Science ReasoningTest, post-tests showed only a small increase in scores. Biology scores showed a larger increase thanEarth science scores. Over the past two years, faculty have addressed the absence of significantimprovement through changes in curriculum and assignments. Areas where students tend to haveproblems and steps taken to address these issues are listed below.
• Drawing conclusions and critical thinking. Additional activities involving open-ended questions andanalysis of information were added. The Physical Science 111 class was completely reformatted toinvolve more open-ended inquiry. Biology and Earth science students are required to speculate onpossible sources of error in their experiments. Assignments and exams include more critical thinkingquestions.
• Reading tables, charts and graphs. Additional assignments and class time have been devoted toteaching students how to construct, read and analyze tables, charts and graphs.
Changes implemented to date have not had as much effect as hoped. Students are unable to transferknowledge gained in one context to a new context. For example, they tend to memorize what a particulargraph says and rather than develop generalized interpretation skills that can be applied to other problems. The question is: what are our students missing that forms the foundation of these skills?
PROPOSED ACTIONOur hypothesis is that our students are under-prepared for college level science classes. In particular,they lack basic data interpretation and mathematical skills taught in math classes. Without these skills,they struggle to understand the scientific concepts that arise from interpreting the data. They also struggleto collect, present, and interpret their own data as well as data from others. Many relationships at the coreof gen-ed science courses are best illustrated through numbers. Ranging from speed to blood pressure totemperature and humidity, these relationships are extremely difficult for students who struggle with math. Mathematical reasoning and science reasoning are closely related.
To address the poor math skills, the Natural Science Department is considering proposing that a math prerequisite be added to all gen-ed science courses. This should ensure that our students come to ourclasses better prepared to understand the scientific concepts that form the core of our courses. There iscurrently no math pre-requisite for gen-ed science classes. Since 90% of PSC students test into adevelopmental math course, our classes are populated with many students with only pre-college mathskills. Anecdotal evidence indicates a correlation between students' math skills and success in scienceclasses, and the Science Reasoning Test assesses these math-based skills. Test results support thiscorrelation. Students who drop science courses tend to be doing poorly in the class. In fact, none of thestudents in Physc 111 and Geolo 101 who withdrew scored higher than 50% on the pre-test. Studentswho scored 50% or below were 3 times more likely to receive a D, F or W than students who scoredabove 50%. Ensuring that students have the necessary background knowledge to understand collegelevel scientific concepts should increase the success of our students.
9
The science department also believes that our students lack science reasoning skills normally acquired inhigh school science courses. This seems to be especially true of returning adult students who have nothad a science class in several years. To address this issue, the natural science department is consideringoffering a developmental science course. This course would probably cover basic concepts in both lifeand physical sciences as well as the scientific method, measurement, data collection and analysis.
Before implementing either of these major changes, the Natural Science Department will develop abroader database in the 2008-2009 academic year by administering the Science Reasoning Test in moreclasses. In fall 2008, all natural science classes will be tested. This will provide a data set that includesscience and health profession majors as well as gen ed students. It will also provide an opportunity to seeif there is a correlation between test scores and other factors such as Compass scores, major, and adjunctv. full time faculty. A larger database will enable the department to better identify possible contributors tothe low scores and design a effective remediation plan.
10
Scientific Reasoning December 2007
Directions: Write your name, class and date on the scantron sheet. There are three passages in this test. Each passage is followed by several questions. After reading a passage, choose the best answer to each question and fill in the corresponding oval on your scantron sheet. You may refer to the passages as often as necessary.
11
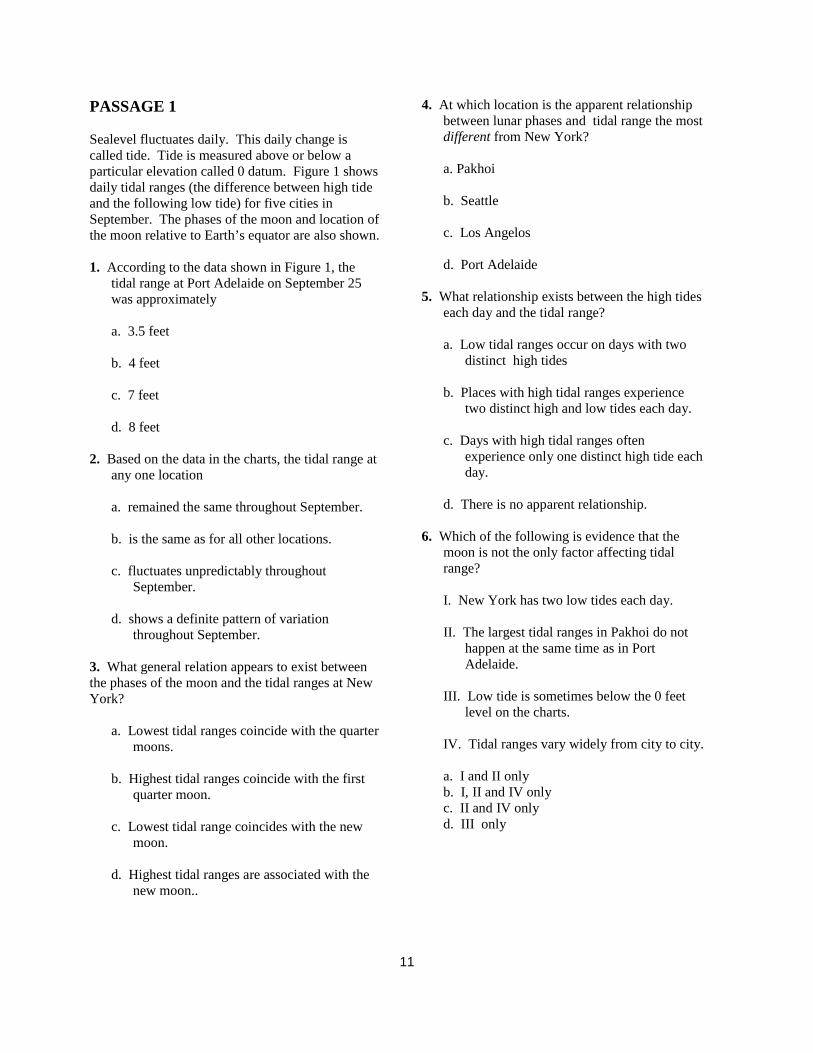
PASSAGE 1 Sealevel fluctuates daily. This daily change is called tide. Tide is measured above or below a particular elevation called 0 datum. Figure 1 shows daily tidal ranges (the difference between high tide and the following low tide) for five cities in September. The phases of the moon and location of the moon relative to Earth’s equator are also shown. 1. According to the data shown in Figure 1, the
tidal range at Port Adelaide on September 25 was approximately
a. 3.5 feet b. 4 feet c. 7 feet d. 8 feet 2. Based on the data in the charts, the tidal range at
any one location
a. remained the same throughout September. b. is the same as for all other locations. c. fluctuates unpredictably throughout
September. d. shows a definite pattern of variation
throughout September. 3. What general relation appears to exist between the phases of the moon and the tidal ranges at New York?
a. Lowest tidal ranges coincide with the quarter moons.
b. Highest tidal ranges coincide with the first
quarter moon. c. Lowest tidal range coincides with the new
moon. d. Highest tidal ranges are associated with the
new moon..
4. At which location is the apparent relationship between lunar phases and tidal range the most different from New York? a. Pakhoi b. Seattle c. Los Angelos d. Port Adelaide
5. What relationship exists between the high tides
each day and the tidal range? a. Low tidal ranges occur on days with two
distinct high tides b. Places with high tidal ranges experience
two distinct high and low tides each day. c. Days with high tidal ranges often
experience only one distinct high tide each day.
d. There is no apparent relationship.
6. Which of the following is evidence that the moon is not the only factor affecting tidal range? I. New York has two low tides each day. II. The largest tidal ranges in Pakhoi do not
happen at the same time as in Port Adelaide.
III. Low tide is sometimes below the 0 feet
level on the charts. IV. Tidal ranges vary widely from city to city.
a. I and II only b. I, II and IV only c. II and IV only d. III only
12
7. According to Figure 1, what phase of the moon was seen on September 1? a. New moon b. First quarter c. Full moon d. Last quarter
13
PASSAGE 2
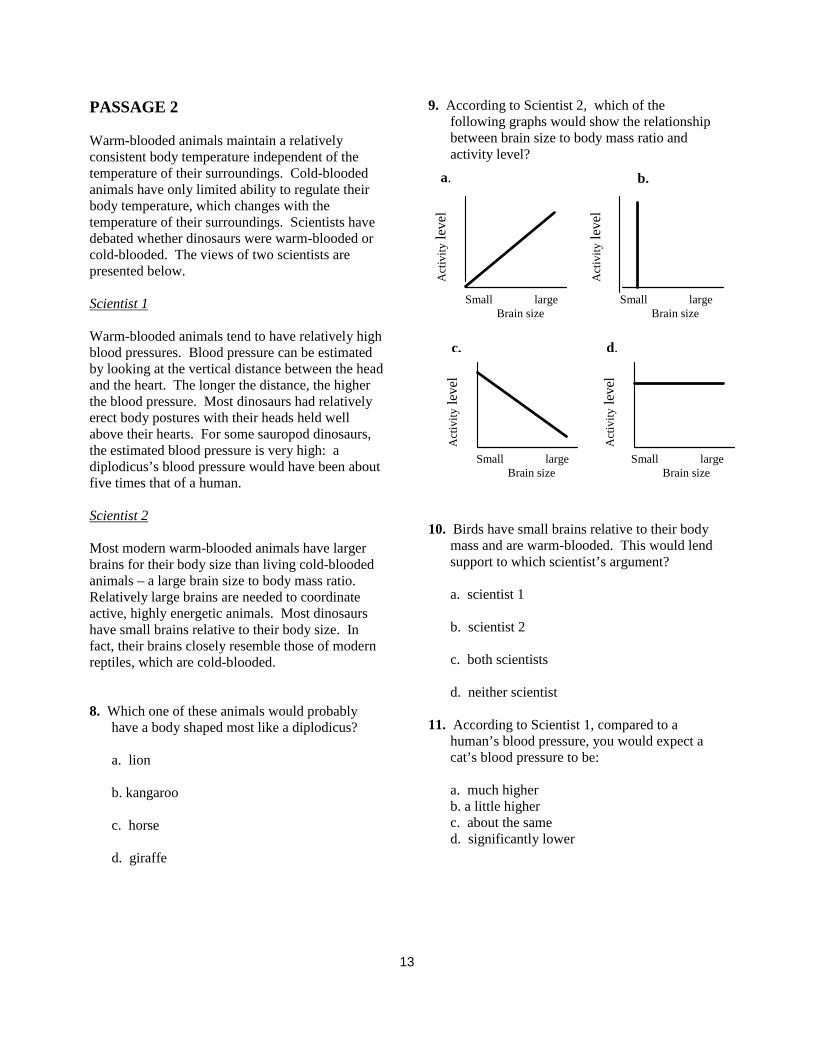
Warm-blooded animals maintain a relatively consistent body temperature independent of the temperature of their surroundings. Cold-blooded animals have only limited ability to regulate their body temperature, which changes with the temperature of their surroundings. Scientists have debated whether dinosaurs were warm-blooded or cold-blooded. The views of two scientists are presented below. Scientist 1 Warm-blooded animals tend to have relatively high blood pressures. Blood pressure can be estimated by looking at the vertical distance between the head and the heart. The longer the distance, the higher the blood pressure. Most dinosaurs had relatively erect body postures with their heads held well above their hearts. For some sauropod dinosaurs, the estimated blood pressure is very high: a diplodicus’s blood pressure would have been about five times that of a human. Scientist 2 Most modern warm-blooded animals have larger brains for their body size than living cold-blooded animals – a large brain size to body mass ratio. Relatively large brains are needed to coordinate active, highly energetic animals. Most dinosaurs have small brains relative to their body size. In fact, their brains closely resemble those of modern reptiles, which are cold-blooded. 8. Which one of these animals would probably
have a body shaped most like a diplodicus? a. lion b. kangaroo c. horse d. giraffe
9. According to Scientist 2, which of the following graphs would show the relationship between brain size to body mass ratio and activity level?
10. Birds have small brains relative to their body
mass and are warm-blooded. This would lend support to which scientist’s argument?
a. scientist 1 b. scientist 2 c. both scientists d. neither scientist
11. According to Scientist 1, compared to a human’s blood pressure, you would expect a cat’s blood pressure to be:
a. much higher b. a little higher c. about the same d. significantly lower
Small large Brain size
Act
ivity
leve
l
Act
ivity
leve
l
Act
ivity
leve
l
Act
ivity
leve
l
c. d.
a. b.
Small large Brain size
Small large Brain size
Small large Brain size
14
12. Which lifestyle for dinosaurs would be most consistent with Scientist 2’s theory?
I. slow moving, largely sedentary II. long migrations involving complex
navigation III. Active predator which must run fast to
capture prey IV. predator eating readily available slow-
moving prey
a. I and IV only b. II and IV only c. III only d. II and III only
13. Both scientists’ reasoning is based on which of
the following principles?
a. Warm-blooded animals all lead energetic, highly active lives.
b. Evolution of life forms resulted in new
relationships between structure and function of body parts.
c. All warm-blooded animals share some
characteristics. d. Scientists will not be able to determine if
dinosaurs were warm-blooded or cold-blooded because no evidence is preserved when dinosaurs die.
15
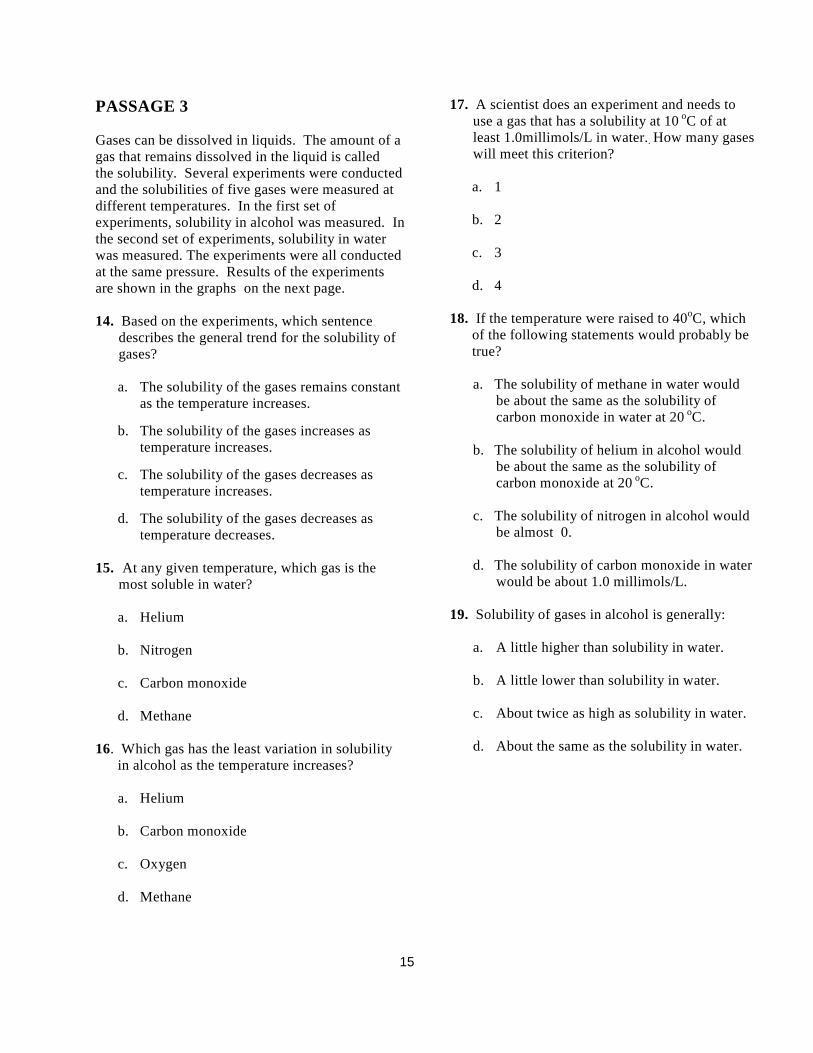
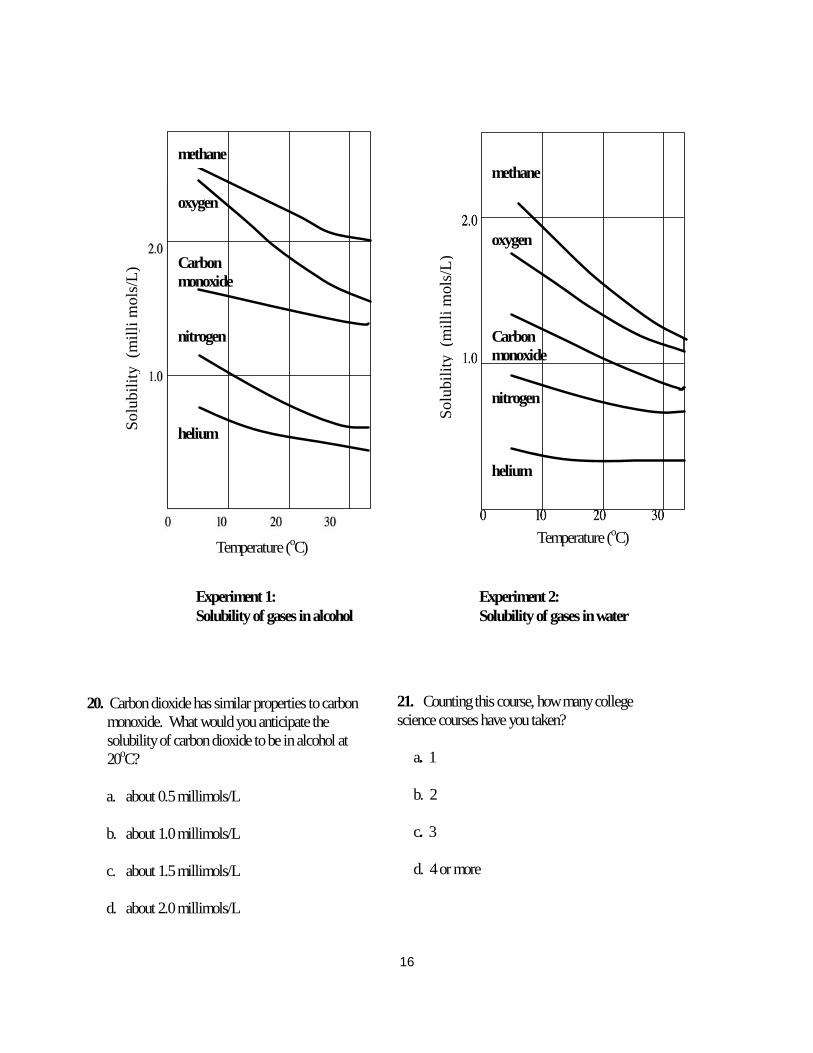
PASSAGE 3 Gases can be dissolved in liquids. The amount of a gas that remains dissolved in the liquid is called the solubility. Several experiments were conducted and the solubilities of five gases were measured at different temperatures. In the first set of experiments, solubility in alcohol was measured. In the second set of experiments, solubility in water was measured. The experiments were all conducted at the same pressure. Results of the experiments are shown in the graphs on the next page. 14. Based on the experiments, which sentence
describes the general trend for the solubility of gases?
a. The solubility of the gases remains constant
as the temperature increases. b. The solubility of the gases increases as
temperature increases.
c. The solubility of the gases decreases as temperature increases.
d. The solubility of the gases decreases as
temperature decreases. 15. At any given temperature, which gas is the
most soluble in water? a. Helium b. Nitrogen
c. Carbon monoxide
d. Methane
16. Which gas has the least variation in solubility
in alcohol as the temperature increases? a. Helium
b. Carbon monoxide
c. Oxygen
d. Methane
17. A scientist does an experiment and needs to use a gas that has a solubility at 10 oC of at least 1.0millimols/L in water.. How many gases will meet this criterion?
a. 1 b. 2
c. 3
d. 4
18. If the temperature were raised to 40oC, which
of the following statements would probably be true?
a. The solubility of methane in water would
be about the same as the solubility of carbon monoxide in water at 20 oC.
b. The solubility of helium in alcohol would
be about the same as the solubility of carbon monoxide at 20 oC.
c. The solubility of nitrogen in alcohol would
be almost 0.
d. The solubility of carbon monoxide in water would be about 1.0 millimols/L.
19. Solubility of gases in alcohol is generally:
a. A little higher than solubility in water. b. A little lower than solubility in water.
c. About twice as high as solubility in water.
d. About the same as the solubility in water.
16
20. Carbon dioxide has similar properties to carbon monoxide. What would you anticipate the solubility of carbon dioxide to be in alcohol at 20oC?
a. about 0.5 millimols/L
b. about 1.0 millimols/L
c. about 1.5 millimols/L
d. about 2.0 millimols/L
21. Counting this course, how many college science courses have you taken? a. 1 b. 2 c. 3 d. 4 or more
methane
oxygen
Carbon monoxide
nitrogen
helium
Temperature (oC)
Solu
bilit
y (m
illi m
ols/
L)
Experiment 2: Solubility of gases in water
methane
oxygen
Carbon monoxide
nitrogen
helium
Temperature (oC)
Solu
bilit
y (m
illi m
ols/
L)
3
Experiment 1: Solubility of gases in alcohol
MODEL ASSESSMENTS FORTRANSFER DISCIPLINES
(ARTS & SCIENCES)
Chemistry
Education
Humanities
18
What makes the Chemistry Report a model for assessment of student learning in the transferdisciplines?
In 2007-08, Christine Brooms did two assessment projects. The first was a simple pre- and post test todetermine whether students "were actually learning what we thought we were teaching them." The initialtest was given during the first week of Chemistry 130 and the same 14 questions were embedded in thefinal. The following information emerged from this assessment:
1. The pre-test revealed that too many students were missing material covered in Chemistry 110,suggesting they were inadequately prepared for 130.
2. An alternative explanation might be that too long a time had elapsed between completing 110 andbeginning 130. Thus the instructor will ask advisers to stress the importance of taking 130immediately after completing 110.
3. The questions missed on the post-test identify concepts that need more emphasis.4. The results showed that students were less successful answering questions that required the
application of higher level thinking skills, suggesting that more class time needed to be spentdeveloping those skills.
Pre- and post tests are a simple and useful way for a new faculty member to get a feel for the students inher program and a sense of what might be done to help them succeed.
The second assessment (for Chemistry 110) focused on how well students could apply previously learnedlaboratory skills in a new context. The professor commented that the current lab manual for 110 focusedon developing good lab techniques but did not foster much creativity or experimentation or rigorousanalysis of the results. Thus, the instructor decided to pilot two inquiry based labs to develop these skills.In this model, students construct their own knowledge and apply it to a new situation, responding toprompts that guide them through the process.
Students were given a scenario in which "they had to design, conduct and analyze an experiment todetermine the empirical formula of an unknown." The assignment was made more inviting by beingintroduced by a mock business letter suggesting that "a demonstration of initiative and capable scientificreasoning" would make the award of a contract more likely. In the first lab, students collected the data butwere not sure what to do with it. They were also frustrated by the lack of guidance from the teacher andby lack of support from group members. (The lab was designed to elicit such feelings.) Even thoughstudents weren't successful in identifying the unknowns, they did learn to work together with other groupmembers, to think through problems, and to "become more patient with the 'process' of learning science,"important outcomes.
The next time students were given a loosely defined problem (the second pilot lab), they were moreupbeat and eager to work together, and the instructor created a more comfortable learning situation byproviding more prompts. This time students made more progress moving through the assignment eventhough they still had difficulties analyzing the data and synthesizing the results. (Everyone filled out asurvey - attached -- on group participation that looks adaptable for use in other disciplines.) Studentsimproved their ability to work together in a mutually supportive way.
These two very different kinds of assessments provide a nice balance between mastery of course contentand the ability to apply that knowledge to solve problems. By giving students experience experimenting,persevering through frustration, applying higher level reasoning skills, and collaborating with otherstudents, the instructor gives science students a sense of what it feels like to do science in the real world,thus allowing them to test their vocation for that kind of career. The report concludes with an interesting listof outcomes as well as next steps.
19
CHEMISTRY REPORT ON ASSESSMENT OF STUDENT LEARNING 2007-2008
AbstractDuring this period, the Chemistry Department conducted two assessment projects:1. Assessed how well students learn information in the current semester using post tests. (Chem 130)2. Assessed how students are able to apply previously learned laboratory concepts in a different context
(Chem 110)
In the first project, post-tests included questions about polarity, kinetics, and intermolecular forces forChem 130. Prior course preparation and poor higher level thinking seemed to be a contributing factor tothe poor grades earned in Chem 130. The second project piloted new laboratory experiments in Chem110 to determine if students could apply what they had learned in an earlier lab to a different situation.Results show that students were able to apply basic concepts such as designing a lab procedure, but hadtrouble interpreting the results.
Changes Implemented as a Result of the Last Assessment PeriodAs this is an entirely new assessment, the only change is that the program is now being assessed.
Focus of Assessment and ResultsIn this section, each assessment project will be discussed. In some cases, more data needs to becollected and analyzed.
Project #1: How well students learn information in a single semester using post-tests. This project focused on determining how well students learn information using post-tests. The purpose ofthis assessment is to ensure the students are actually learning what we think we are teaching them.
Students were administered a 14 question pre-test during the first week of class.The same questions werethen embedded on the final exam. Data is only included if the students completed both the pre- andpost-tests. Data from students who did not take the pre-test or dropped the course and therefore did nottake the post-test was excluded from the data set. The total number of correct responses for eachquestion was analyzed to identify the concepts should be emphasized more.
More data needs to be collected. Specifically, pre-test data is needed for each of the sections forcomparison to the post-test data. All sections should be included in the assessment project.
Chem 130 (Fall 07 and Sp08)Analysis of individual questions showed that only 6 of 14 questions were answered correctly by 50% ormore of the students. The sample size is small since many students drop Chem 130. The eight questionsthat were answered incorrectly can be placed into 4 categories:• concept not covered (and therefore should have been excluded)-one question• concept is directly related to Chem 110 skills (students remarked that they had poor 110 skills)-2/3
questions• concept was presented in one way in lecture, but students had to apply it in a different context-2
questions• concept was straight forward and it was not expected to be missed-2 questions.
In Fall 2007, the overall scores on the final exam were disappointing at best, though the semester gradeswere better. On the final exam, only one student scored 92% and the next highest grade was 63%. (Thesemester grades for this course were 1-A, 2-B, 6-C, 2-D, and 1-F.) In Spring 2008, one student scored100% and the next highest scores were in the 60th percentile (3 students). (The semester grades for thiscourse were 2-A, 1-B, 1-C, 5-D, and 6-F.) This is a difficult course for students to grasp and the gradeshave historically been low with a small class size.
20
The issues plaguing Chem 130 are:• Students are un(der)prepared for Chem 130
Anecdotal evidence suggest that many students do not have a firm grasp on the first semesterchemistry though they may have earned the requisite C or higher. This issue stems from a variety ofreasons. Some students don't take the two semester sequence in consecutive semesters. In fact,some students wait several semesters after completing the first semester to enroll in the secondsemester. As a result, they don't retain much of the necessary information from the first semester.Alternatively, several students indicate that they just didn't understand the first semester course due topoor study habits or a poor instructor.
• Students have a hard time understanding and applying the concepts. Chem 130 is conceptuallydifferent from the first semester course. Therefore, students who may have done very well in the firstsemester often have to work harder to maintain the same grades. Chem 130 requires higher levelthinking and it is unclear if Chem 110 adequately prepares the students to think on this level.
Students' perceptions of how well they were prepared for the second semester chemistry course seemedto have an effect on how they approached the course and whether they thought they could be successfulin the course. Results showed that student's perceptions were dependent on how much time had elapsedbetween the continuing courses, the instructor's teaching style, and the college where the first course wascompleted.
Project #2: How well students can apply previously learned laboratory skills in a different context.Assessment efforts associated with Chem 110 involved the pilot of two new laboratory experiments. Thisproject involved two sections of Chem 110. Thirty-three students completed the course. The current Chem110 lab manual (adopted from previous semesters) focuses on developing good lab technique. However,it does not foster much creativity or allow for the design of experimental procedure or rigorous analysis ofresults. Since these skills are important to chemists, two new Inquiry Based Learning experiments thatemphasize these skills were piloted. In this method, prompting questions guide students through thelearning process. Students construct their own knowledge and then apply it to a new situation.
In the first pilot experiment, students would use skills learned in a previously performed technique focusedlab to complete the new experiment. (Both labs are included in the appendix.) In the technique lab,"Determining the Empirical Formula of Magnesium Oxide", students learned how to burn a compound todrive of the water in order to determine the mass of the dehydrated compound. Using that information,students were able to determine the empirical formula (the elements and their representative proportionsin the compound). Grades on this lab report were quite high. All students earned an overall grade of B orhigher. Students learned lab techniques such as using a Bunsen burner, how to accurately weighcompounds on an analytical balance, and how to use those results to determine the empirical formula.Anecdotally, students were often reminded to use good lab technique to accurately measure compoundsand properly record the data.
In the piloted lab, students were given a scenario where they had to design, conduct, and analyze anexperiment to determine the empirical formula of an unknown. The preliminary information the studentswere provided was purposely vague and scant. This mimics a real world situation that many entry-levelchemists face. Lab report grades reveal that students were not able to analyze the data very well. Theywere able to develop an experimental procedure (essentially the same as the one they had previouslydone) and were able to conduct the experiment with few problems. However, after they collected the data,they were unsure of what to do with it. Some hints were provided, but only one group out of 8 determinedthe correct answer. (Each group was comprised of either 3 or 4 students.)
According to the surveys, students expressed frustration with not having enough guidance, groupmembers not providing support, and "extreme" frustration that the instructor never revealed how theanswer could be derived. These frustrations and results were expected. The experiment is designed insuch a way that students will be frustrated at not being provided more information. However, the studentswere comforted by the fact that all the other students are just as frustrated as they were.
21
Though not many students correctly identified the unknowns, they learned to work effectively as a group,to encourage other group members, think through problems, and become more patient with the "process"of learning science. These skills are especially important for young scientist to learn.
In fact, when students were faced with another loosely defined problem (the second pilot lab), they weremuch more upbeat and eager to work through it. This lab was designed much like the first one. However,more prompting questions were included to reduce the level of frustration and to guide the students inthinking through the problem. The students conducted a "Calorimetry Lab" in which they were given ascenario and had to collect data to discover trends in certain reactions. They designed and tested theeffectiveness of a coffee cup calorimeter and then determined the amount of heat absorbed or evolvedfrom a variety of reactions.
Lab report grades and a survey about group dynamics were analyzed collected. The lab reports showedthat most students were able to design the calorimeter, discuss the characteristics of a good design, andconduct the experiments. However, again, they had a hard time analyzing the data they collected andsynthesizing the results. Most students had no trouble collecting the data. They did not do a good jobidentifying trends in the data. They did not understand what the data showed and how that informationcould be useful. (The lab grades were as follows: 15-A, 9-B, 0-C, 1-D, 8-F.)
Next StepsThe following outlines our plans for future assessment as well as strategies for improving our courses.
In Chem 130, strategies for improving this course and assessment project are listed.• Developing a relationship with the Counseling and Advising Office to ensure that students are advised
to take the courses in consecutive semesters if at all possible. • Institute a more intensive first semester review in the first week of the course to bring the students up
to the appropriate level even if they are un(der)prepared. (This is already done at a less aggressivelevel and the review of introductory concepts are embedded in the course.)
• Better prepare future Chem 130 students in Chem 110 by focusing on higher level thinking. Thepiloted labs in Chem 110 may be one way to address this issue by requiring the students to devisetheir own procedures, collect data, and rigorously analyze the data.
In Chem 110, strategies for improving the course and assessment project are listed.• Introduce more labs to allow students more independence in designing and collecting data. More of
the labs should also emphasize rigorous analysis of the data. Since many students demonstrated poorlab techniques, these skills should be emphasized and assessed early in the semester. We are in theprocess of revising the current lab manual to ensure a balance of technique focused experiments andinquired based experiments.
• The pre and post-tests will be expanded to all sections and courses. This was the original plan exceptsome instructors did not submit the data needed or in some cases administer the tests properly.
• For all courses, we plan to expand the pre- and post-testing for the following reasons.• By comparing the results from various course sections, we can ensure academic rigor across the
department. The total number of questions answered correctly can be tallied to determine an averagefor each section. We want to identify sections that deviate from the mean. If a particular section didexceptionally well, we want to identify and share good teaching strategies. If a section did particularlypoor, we want to address that issue as well.
• We can identify questions that are commonly missed to highlight concepts we should emphasize andspend more time covering. At times, instructors may think they are adequately explaining a topic, butthe assessment will help to objectively determine if this is the case.
22
Appendix-Supporting DataSupporting data for each assessment project can be found in these appendices.
A. Post-Test assessment of concepts learned in a single semester1. Chem 130 Post Test scores for Fall 2007 and Spring 20082. Copy of the Chem 130 assessment questions
B. Laboratory Pilots--The three labs and a copy of the Group Dynamics survey are included.1. Empirical Formula (technique lab)2. Analysis of Hydrated Sulfate Salts (Inquiry Based Lab)3. Calorimetry (Inquiry Based Lab)4. Group Dynamics survey
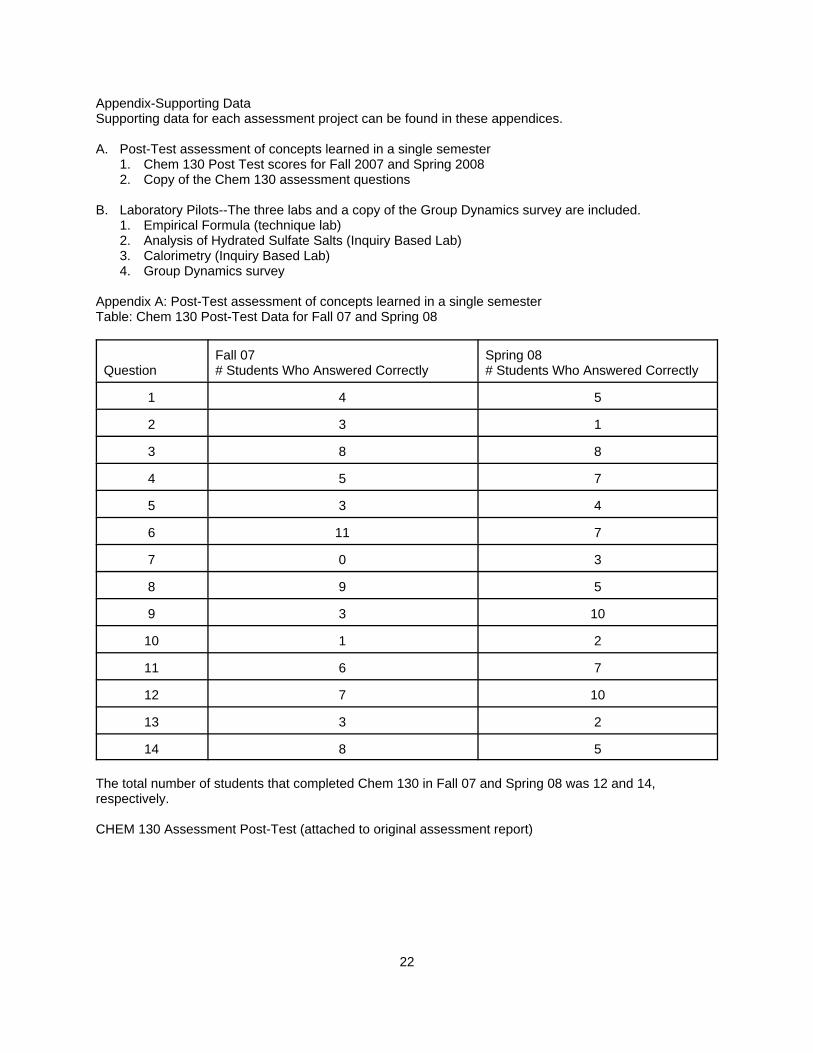
Appendix A: Post-Test assessment of concepts learned in a single semesterTable: Chem 130 Post-Test Data for Fall 07 and Spring 08
QuestionFall 07# Students Who Answered Correctly
Spring 08# Students Who Answered Correctly
1 4 5
2 3 1
3 8 8
4 5 7
5 3 4
6 11 7
7 0 3
8 9 5
9 3 10
10 1 2
11 6 7
12 7 10
13 3 2
14 8 5
The total number of students that completed Chem 130 in Fall 07 and Spring 08 was 12 and 14,respectively.
CHEM 130 Assessment Post-Test (attached to original assessment report)
23
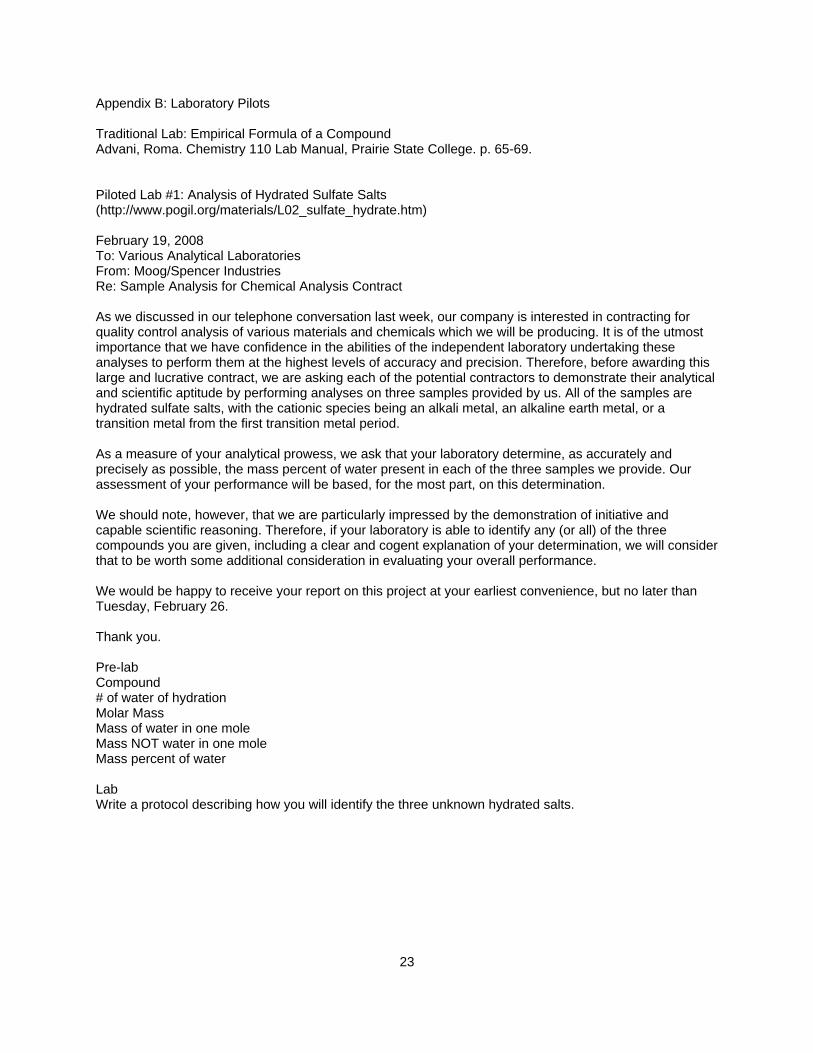
Appendix B: Laboratory Pilots
Traditional Lab: Empirical Formula of a Compound Advani, Roma. Chemistry 110 Lab Manual, Prairie State College. p. 65-69.
Piloted Lab #1: Analysis of Hydrated Sulfate Salts(http://www.pogil.org/materials/L02_sulfate_hydrate.htm)
February 19, 2008To: Various Analytical LaboratoriesFrom: Moog/Spencer IndustriesRe: Sample Analysis for Chemical Analysis Contract
As we discussed in our telephone conversation last week, our company is interested in contracting forquality control analysis of various materials and chemicals which we will be producing. It is of the utmostimportance that we have confidence in the abilities of the independent laboratory undertaking theseanalyses to perform them at the highest levels of accuracy and precision. Therefore, before awarding thislarge and lucrative contract, we are asking each of the potential contractors to demonstrate their analyticaland scientific aptitude by performing analyses on three samples provided by us. All of the samples arehydrated sulfate salts, with the cationic species being an alkali metal, an alkaline earth metal, or atransition metal from the first transition metal period.
As a measure of your analytical prowess, we ask that your laboratory determine, as accurately andprecisely as possible, the mass percent of water present in each of the three samples we provide. Ourassessment of your performance will be based, for the most part, on this determination.
We should note, however, that we are particularly impressed by the demonstration of initiative andcapable scientific reasoning. Therefore, if your laboratory is able to identify any (or all) of the threecompounds you are given, including a clear and cogent explanation of your determination, we will considerthat to be worth some additional consideration in evaluating your overall performance.
We would be happy to receive your report on this project at your earliest convenience, but no later thanTuesday, February 26.
Thank you.
Pre-labCompound# of water of hydrationMolar MassMass of water in one moleMass NOT water in one moleMass percent of water
LabWrite a protocol describing how you will identify the three unknown hydrated salts.
24
Piloted Lab #2: Calorimetry LabCooper, Melanie. Cooperative Chemistry Laboratory Manual, 4th edition, McGraw Hill, p. 121.
Calorimetry Lab: Data SheetAcid-Base ReactionsAcid:Base:MolarityTypeAmountTemperature: InitialTemperature: Final
Acid:Base:MolarityTypeAmountTemperature: InitialTemperature: Final
Redox RxnAcid:Metal:MolarityTypeAmountTemperature: InitialTemperature: Final
Acid:Metal:MolarityTypeAmountTemperature: InitialTemperature: Final
Solution of SaltsSalt #1:Salt #2:Amount of waterTypeAmount saltTemperature: InitialTemperature: Final
Data and ResultsGroup Name: __________________Unknown (# and letter)Identity of UnknownShow any calculations that support the identity ofeach unknown.
4. Group Dynamics SurveyExperiment: Your name:
Group members:Please complete the following questions regarding your group for this particular lab. Be candid ANDconstructive. Answer all questions. Use the back for more space if needed. Your responses areconfidential.
Group Process1. Did everyone in your group contribute to the activity today? If so, explain how; if not, identify whatindividuals need to do to assure participation by all.2. Did everyone in your group understand the material covered in the activity today? If so, explain howyour group assured that everyone understood; if not, identify what your group needs to do to assure thateveryone in the group understands the material.3. Identify three things your group could do to work more effectively and efficiently.4. Identify one contribution made by each group member to today's activity.5. What constructive feedback can you give another group member on the application of a skill?6. Develop a short term plan to strengthen your team's performance.
Individual Performance7. Identify 3 ways you and the other group members have modified or could modify study habits andstrategies in order to improve performance on exams, team activities, etc.8. Cite two examples of how you carried out your team responsibility or role.
25
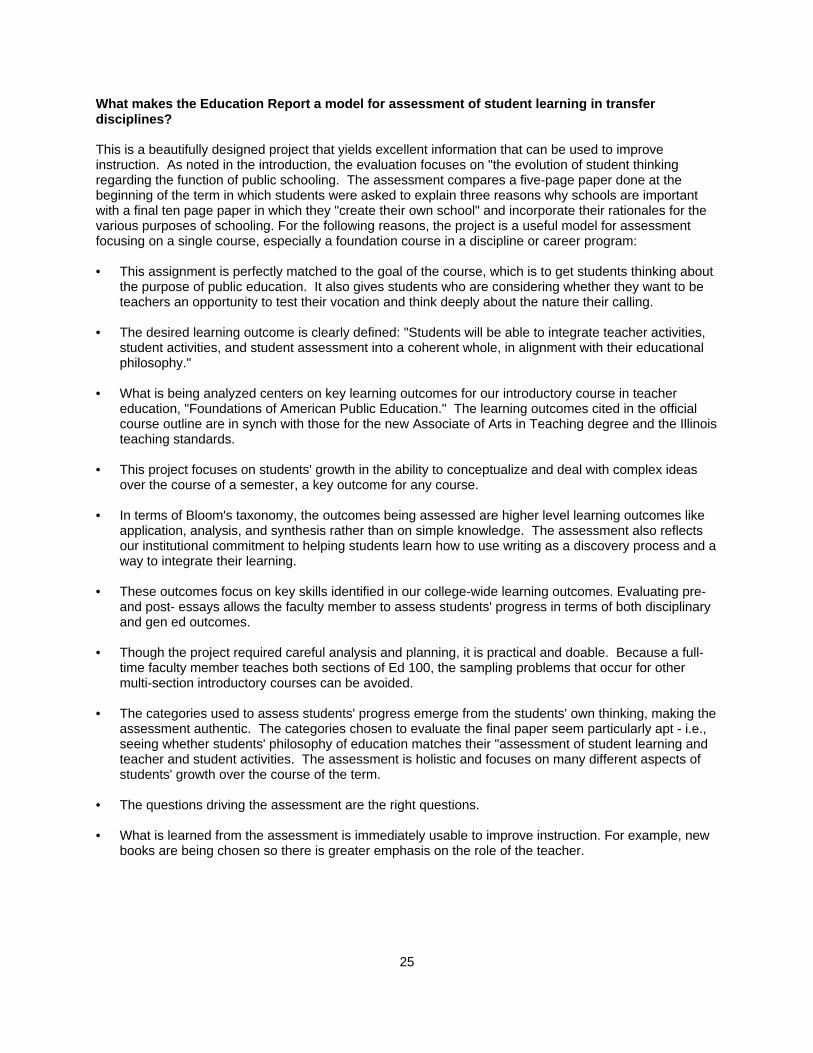
What makes the Education Report a model for assessment of student learning in transferdisciplines?
This is a beautifully designed project that yields excellent information that can be used to improveinstruction. As noted in the introduction, the evaluation focuses on "the evolution of student thinkingregarding the function of public schooling. The assessment compares a five-page paper done at thebeginning of the term in which students were asked to explain three reasons why schools are importantwith a final ten page paper in which they "create their own school" and incorporate their rationales for thevarious purposes of schooling. For the following reasons, the project is a useful model for assessmentfocusing on a single course, especially a foundation course in a discipline or career program:
• This assignment is perfectly matched to the goal of the course, which is to get students thinking about
the purpose of public education. It also gives students who are considering whether they want to beteachers an opportunity to test their vocation and think deeply about the nature their calling.
• The desired learning outcome is clearly defined: "Students will be able to integrate teacher activities,student activities, and student assessment into a coherent whole, in alignment with their educationalphilosophy."
• What is being analyzed centers on key learning outcomes for our introductory course in teachereducation, "Foundations of American Public Education." The learning outcomes cited in the officialcourse outline are in synch with those for the new Associate of Arts in Teaching degree and the Illinoisteaching standards.
• This project focuses on students' growth in the ability to conceptualize and deal with complex ideasover the course of a semester, a key outcome for any course.
• In terms of Bloom's taxonomy, the outcomes being assessed are higher level learning outcomes likeapplication, analysis, and synthesis rather than on simple knowledge. The assessment also reflectsour institutional commitment to helping students learn how to use writing as a discovery process and away to integrate their learning.
• These outcomes focus on key skills identified in our college-wide learning outcomes. Evaluating pre-and post- essays allows the faculty member to assess students' progress in terms of both disciplinaryand gen ed outcomes.
• Though the project required careful analysis and planning, it is practical and doable. Because a full-time faculty member teaches both sections of Ed 100, the sampling problems that occur for othermulti-section introductory courses can be avoided.
• The categories used to assess students' progress emerge from the students' own thinking, making theassessment authentic. The categories chosen to evaluate the final paper seem particularly apt - i.e.,seeing whether students' philosophy of education matches their "assessment of student learning andteacher and student activities. The assessment is holistic and focuses on many different aspects ofstudents' growth over the course of the term.
• The questions driving the assessment are the right questions.
• What is learned from the assessment is immediately usable to improve instruction. For example, newbooks are being chosen so there is greater emphasis on the role of the teacher.
26
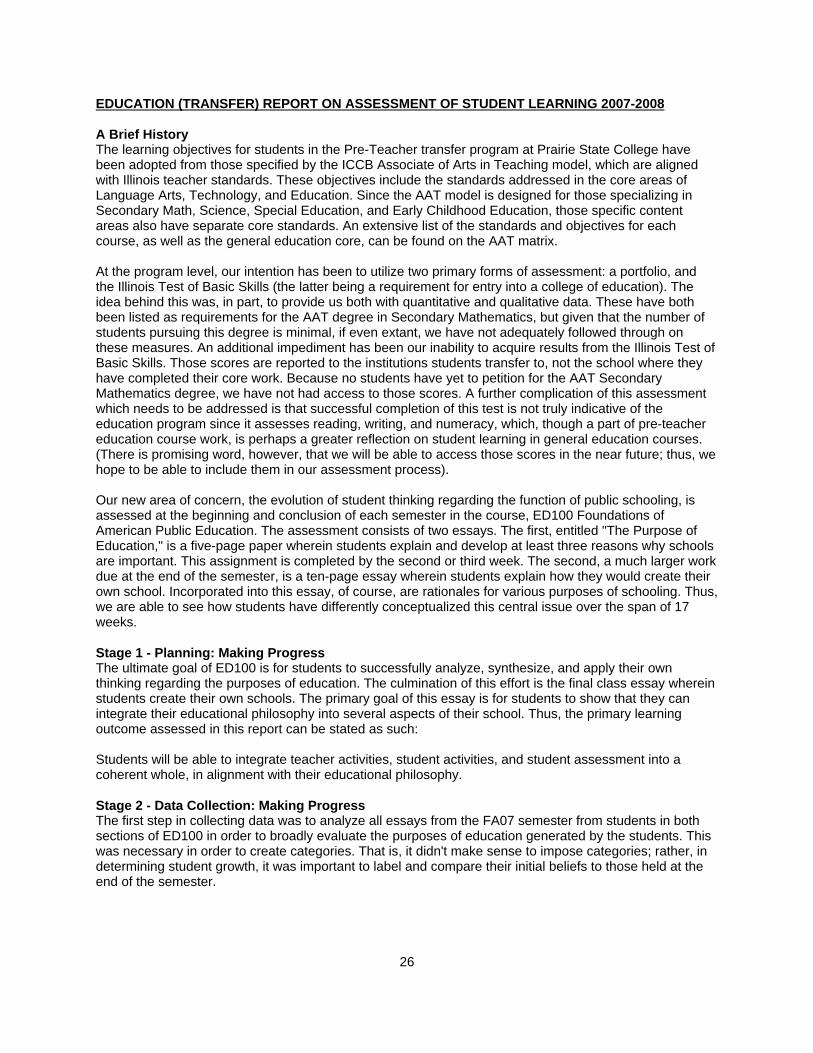
EDUCATION (TRANSFER) REPORT ON ASSESSMENT OF STUDENT LEARNING 2007-2008
A Brief HistoryThe learning objectives for students in the Pre-Teacher transfer program at Prairie State College havebeen adopted from those specified by the ICCB Associate of Arts in Teaching model, which are alignedwith Illinois teacher standards. These objectives include the standards addressed in the core areas ofLanguage Arts, Technology, and Education. Since the AAT model is designed for those specializing inSecondary Math, Science, Special Education, and Early Childhood Education, those specific contentareas also have separate core standards. An extensive list of the standards and objectives for eachcourse, as well as the general education core, can be found on the AAT matrix.
At the program level, our intention has been to utilize two primary forms of assessment: a portfolio, andthe Illinois Test of Basic Skills (the latter being a requirement for entry into a college of education). Theidea behind this was, in part, to provide us both with quantitative and qualitative data. These have bothbeen listed as requirements for the AAT degree in Secondary Mathematics, but given that the number ofstudents pursuing this degree is minimal, if even extant, we have not adequately followed through onthese measures. An additional impediment has been our inability to acquire results from the Illinois Test ofBasic Skills. Those scores are reported to the institutions students transfer to, not the school where theyhave completed their core work. Because no students have yet to petition for the AAT SecondaryMathematics degree, we have not had access to those scores. A further complication of this assessmentwhich needs to be addressed is that successful completion of this test is not truly indicative of theeducation program since it assesses reading, writing, and numeracy, which, though a part of pre-teachereducation course work, is perhaps a greater reflection on student learning in general education courses.(There is promising word, however, that we will be able to access those scores in the near future; thus, wehope to be able to include them in our assessment process).
Our new area of concern, the evolution of student thinking regarding the function of public schooling, isassessed at the beginning and conclusion of each semester in the course, ED100 Foundations ofAmerican Public Education. The assessment consists of two essays. The first, entitled "The Purpose ofEducation," is a five-page paper wherein students explain and develop at least three reasons why schoolsare important. This assignment is completed by the second or third week. The second, a much larger workdue at the end of the semester, is a ten-page essay wherein students explain how they would create theirown school. Incorporated into this essay, of course, are rationales for various purposes of schooling. Thus,we are able to see how students have differently conceptualized this central issue over the span of 17weeks.
Stage 1 - Planning: Making ProgressThe ultimate goal of ED100 is for students to successfully analyze, synthesize, and apply their ownthinking regarding the purposes of education. The culmination of this effort is the final class essay whereinstudents create their own schools. The primary goal of this essay is for students to show that they canintegrate their educational philosophy into several aspects of their school. Thus, the primary learningoutcome assessed in this report can be stated as such:
Students will be able to integrate teacher activities, student activities, and student assessment into acoherent whole, in alignment with their educational philosophy.
Stage 2 - Data Collection: Making ProgressThe first step in collecting data was to analyze all essays from the FA07 semester from students in bothsections of ED100 in order to broadly evaluate the purposes of education generated by the students. Thiswas necessary in order to create categories. That is, it didn't make sense to impose categories; rather, indetermining student growth, it was important to label and compare their initial beliefs to those held at theend of the semester.
27
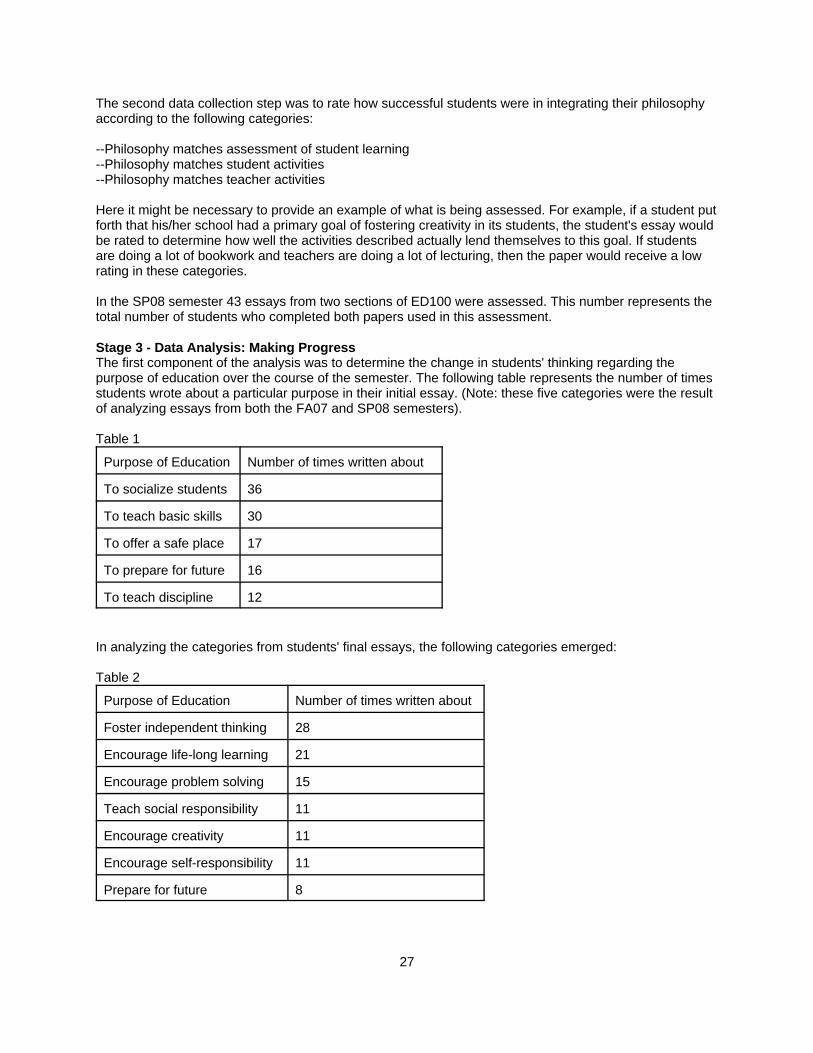
The second data collection step was to rate how successful students were in integrating their philosophyaccording to the following categories:
--Philosophy matches assessment of student learning--Philosophy matches student activities--Philosophy matches teacher activities
Here it might be necessary to provide an example of what is being assessed. For example, if a student putforth that his/her school had a primary goal of fostering creativity in its students, the student's essay wouldbe rated to determine how well the activities described actually lend themselves to this goal. If studentsare doing a lot of bookwork and teachers are doing a lot of lecturing, then the paper would receive a lowrating in these categories.
In the SP08 semester 43 essays from two sections of ED100 were assessed. This number represents thetotal number of students who completed both papers used in this assessment.
Stage 3 - Data Analysis: Making ProgressThe first component of the analysis was to determine the change in students' thinking regarding thepurpose of education over the course of the semester. The following table represents the number of timesstudents wrote about a particular purpose in their initial essay. (Note: these five categories were the resultof analyzing essays from both the FA07 and SP08 semesters).
Table 1
Purpose of Education Number of times written about
To socialize students 36
To teach basic skills 30
To offer a safe place 17
To prepare for future 16
To teach discipline 12
In analyzing the categories from students' final essays, the following categories emerged:
Table 2
Purpose of Education Number of times written about
Foster independent thinking 28
Encourage life-long learning 21
Encourage problem solving 15
Teach social responsibility 11
Encourage creativity 11
Encourage self-responsibility 11
Prepare for future 8
28
At this time, the data collected reveal one important change about the growth of student thinking over thecourse of the semester. Students are clearly formulating more complex purposes for education. What canbe inferred from the data is the following 3 points:
1 -Students do not view the teaching of basic skills as a primary function of education; rather, basic skillsbecome integrated into larger purposes such as teaching problem solving, creativity, and independentthinking.
2 - Students do not view warehousing as a primary function of education; that is, they have moved awayfrom viewing schools as safe places for children to be until they are adults.
3 - Students have integrated individual needs (life-long learning, self-responsibility, independent thinking)into the primarily social purpose of education they addressed in their first essays.
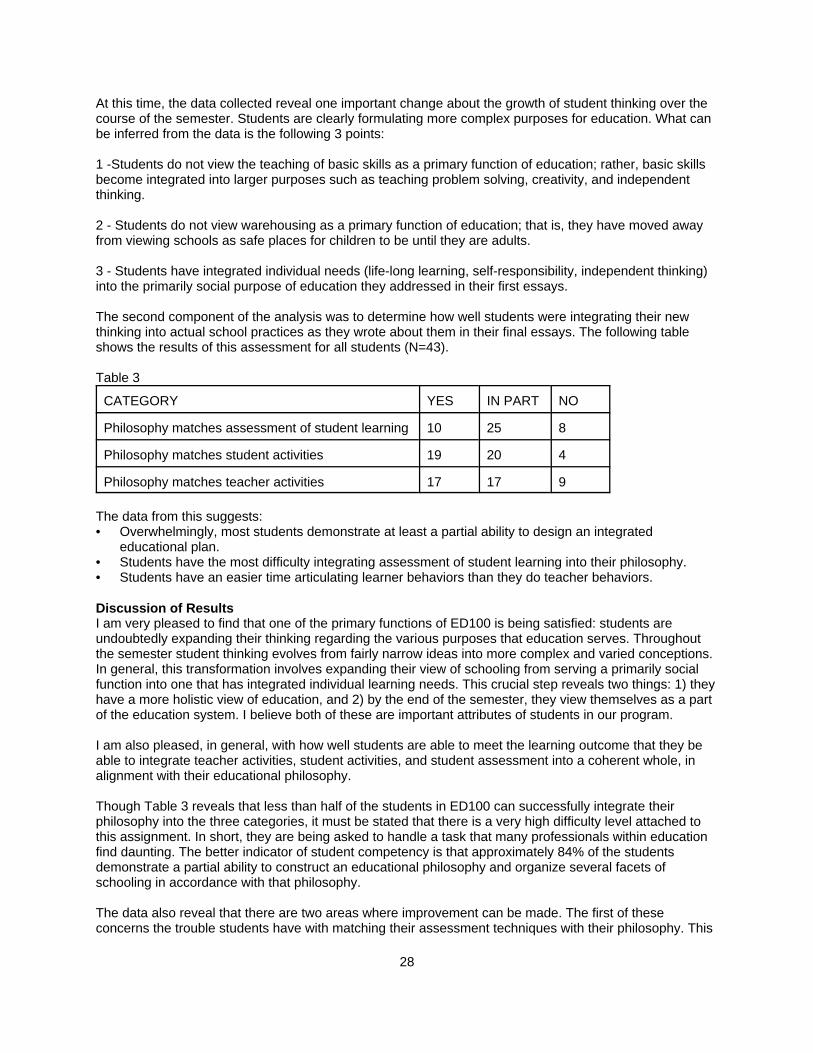
The second component of the analysis was to determine how well students were integrating their newthinking into actual school practices as they wrote about them in their final essays. The following tableshows the results of this assessment for all students (N=43).
Table 3
CATEGORY YES IN PART NO
Philosophy matches assessment of student learning 10 25 8
Philosophy matches student activities 19 20 4
Philosophy matches teacher activities 17 17 9
The data from this suggests:• Overwhelmingly, most students demonstrate at least a partial ability to design an integrated
educational plan.• Students have the most difficulty integrating assessment of student learning into their philosophy.• Students have an easier time articulating learner behaviors than they do teacher behaviors.
Discussion of ResultsI am very pleased to find that one of the primary functions of ED100 is being satisfied: students areundoubtedly expanding their thinking regarding the various purposes that education serves. Throughoutthe semester student thinking evolves from fairly narrow ideas into more complex and varied conceptions.In general, this transformation involves expanding their view of schooling from serving a primarily socialfunction into one that has integrated individual learning needs. This crucial step reveals two things: 1) theyhave a more holistic view of education, and 2) by the end of the semester, they view themselves as a partof the education system. I believe both of these are important attributes of students in our program.
I am also pleased, in general, with how well students are able to meet the learning outcome that they beable to integrate teacher activities, student activities, and student assessment into a coherent whole, inalignment with their educational philosophy.
Though Table 3 reveals that less than half of the students in ED100 can successfully integrate theirphilosophy into the three categories, it must be stated that there is a very high difficulty level attached tothis assignment. In short, they are being asked to handle a task that many professionals within educationfind daunting. The better indicator of student competency is that approximately 84% of the studentsdemonstrate a partial ability to construct an educational philosophy and organize several facets ofschooling in accordance with that philosophy.
The data also reveal that there are two areas where improvement can be made. The first of theseconcerns the trouble students have with matching their assessment techniques with their philosophy. This
29
is not surprising given that students in ED100 often struggle with the idea that labeling (grading) is only asmall, and perhaps the least significant, aspect of assessment. Nonetheless, the results of this studyindicate that more needs to be done in the course to help students understand how to integrate learninggoals with appropriate assessment measures.
The second concern raised by the results is that there might not be significant emphasis in the courseconcerning the role of the teacher in educational systems. Informal observation seems to support thisshortcoming as well. There is perhaps too much class tome given to analyzing student behavior, and toolittle with regard to teacher behavior. It is important that these issues be addressed in the future if studentsare to fully integrate their experiences in the course with their developing educational philosophy.
Stage 4 - Action and Integration: Making ProgressIn the summer of 2008, an effort will be made to add a new book (or new reading materials) to thecurriculum to address the needs made evident through this report. As well, a new component to the classwill be developed that more pointedly investigates what it means to be a teacher from both a personal andprofessional point of view. Hopefully, this will allow students to more clearly understand the connectionbetween who they are as people and who they will be as teachers.
In addition, further work needs to be done with the assessment used in this report. In particular, the ratingsystem (Yes, In Part, No) will have to be analyzed in order to ascertain how well these indicatorsaccurately reflect students' work.
30
What makes the Humanities Report a model for assessment of student learning in transferdisciplines?
Planning: Last fall the Humanities Department put together its own Community of Practice focused onassessment, allowing them to have bi-monthly conversations focused on teaching and learning. One ofthe things that made their work interesting was the way they defined the ability-based learning outcomesthey believed were common across all Humanities and Philosophy courses. Faculty wanted their studentsto develop four skills:
• Evaluating issues• Interrogating concepts• Analyzing ideas and• Understanding points of view
These seem like excellent learning objectives, which reinforce general education learning outcomes forcritical thinking, close reading, and thoughtful writing, allowing students to build on skills developed inearlier courses like speech and English.
In Humanities, the conversations about how to do assessment were driven by the faculty's interest indiscovering which teaching strategies had been most effective in helping their students become "betterwriters and more careful thinkers." Faculty eventually identified two kinds of writing exercises thatproduced useful results: asking students to respond to a specific question on an assigned text, or askingthem to identify and respond to particular elements in a text (problems in reasoning, elements of style,etc.). Such exercises were then adapted as necessary to fit the content of each course.
In addition to these formal assessments, each faculty member used informal assessment measures(CATS) tailored to the content of each course, allowing for a quicker implementation of a feedback loop.These efforts were discussed in bi-monthly meetings, and faculty visited each other's classes andcompared observations and teaching strategies. This informal process generated thoughtfulconversations, suggested new teaching strategies, encouraged experimentation, and clarified how to helpstudents more fully understand and use the skills being assessed.
Data Collection and Analysis: The department collected qualitative and quantitative data, the firstthrough on-going conversations and the second through systematic evaluation of essays for the full rangeof Humanities and Philosophy courses. Final essays were collected from a variety of classes andevaluated using a rubric keyed to the outcomes listed above. The results were encouraging and raisedadditional questions (see p.4) to be considered.
Integration: The results will be discussed further at the beginning of the fall term, but current plans are toconstruct course syllabi around the skills to be assessed and to explain those skills much more explicitlyso students become more self-aware about what they are expected to learn. The department's intent is touse assessment strategies to structure both class discussions and assignments. Additional time will bespent defining the desired outcomes and explaining how these skills can be developed and why they areimportant. The model and process described above seems similar to the one advocated by AlvernoCollege where students are immersed in a culture of ability-based outcomes, and every course stressesseveral of the skills on Alverno's list of institutional learning objectives.
31
HUMANITIES REPORT ON ASSESSMENT OF STUDENT LEARNING 2007-2008
Planning: Making ProgressThis assessment report will detail our efforts to implement substantive assessment measures in theHumanities. Specifically, this will reflect our work in assessing student learning in the following courses: • Humanities 101: Comparative Religions; • Humanities 201: Form and Structure in the Arts; • Humanities 202: Myth, Reason, and God; • Philosophy 201: Introduction to Philosophy; • Philosophy 202: Ethics; • Philosophy 203: Logic.
The broad range of the material covered in these courses should not be seen as a weakness when itcomes to implementing assessment measures across the discipline. Rather, despite the substantivedifferences in the subject matter of each course, they are unified by a common concern for basic skills. Our assessment measures are aimed at assessing the success of our efforts to help students in four basicareas:1. Evaluating Issues2. Interrogating Concepts3. Analyzing Ideas4. Understanding Points of View
We assess these measures throughout the semester in two basic ways:1. Writing Exercises2. Informal Measures tailored to the demands of each course.
I'll briefly describe each. Last year we discovered that our students were becoming better writers and morecareful thinkers. However, we expressed ambivalence as to how this was happening. We knew we didmany worthwhile things in class, but we had not yet discovered which of the things we were doing wereresponsible.
Writing ExercisesThis year we have identified some of our most effective strategies: writing exercises of two particular kindshave yielded positive, verifiable results: short writing assignments responding to a specific question on anassigned text; and assignments asking students to identify particular elements found in a given text (i.e.problems in reasoning, elements of style, etc.).
This Spring we implemented these activities in each of the classes taught by full-time faculty. At the endof every semester our students respond to a prompt requiring them to write a two-page essay on aquestion referring to one of three possible texts (depending on the course-see attached). We haveanalyzed the results, and found them exciting (to be discussed momentarily). In response to thesefindings, we will implement a more general assessment strategy, incorporating all of the courses taught inthe Humanities, engaging a larger number of our instructors in the process from planning, to closing thefeedback loop.
Informal MeasuresWe define "informal assessment" as the multiple ways an instructor solicits feedback from studentsregarding how well they are dealing with course requirements and materials. Sometimes these measurestake the form of a conversation, sometimes they are more formal requests for written feedback (i.e. "Whathas been the most difficult sentence to make sense out of in this chapter?").
Rather than leave these informal assessment measures up to chance, we have begun systematicallyapproaching their use in our classrooms. For instance, in our bi-monthly discussions, we have eachplanned to use one or another kind of assessment measure in a coming class, and to bring the results tothe next meeting-thereby providing us with an opportunity to collect data, analyze the results, and close
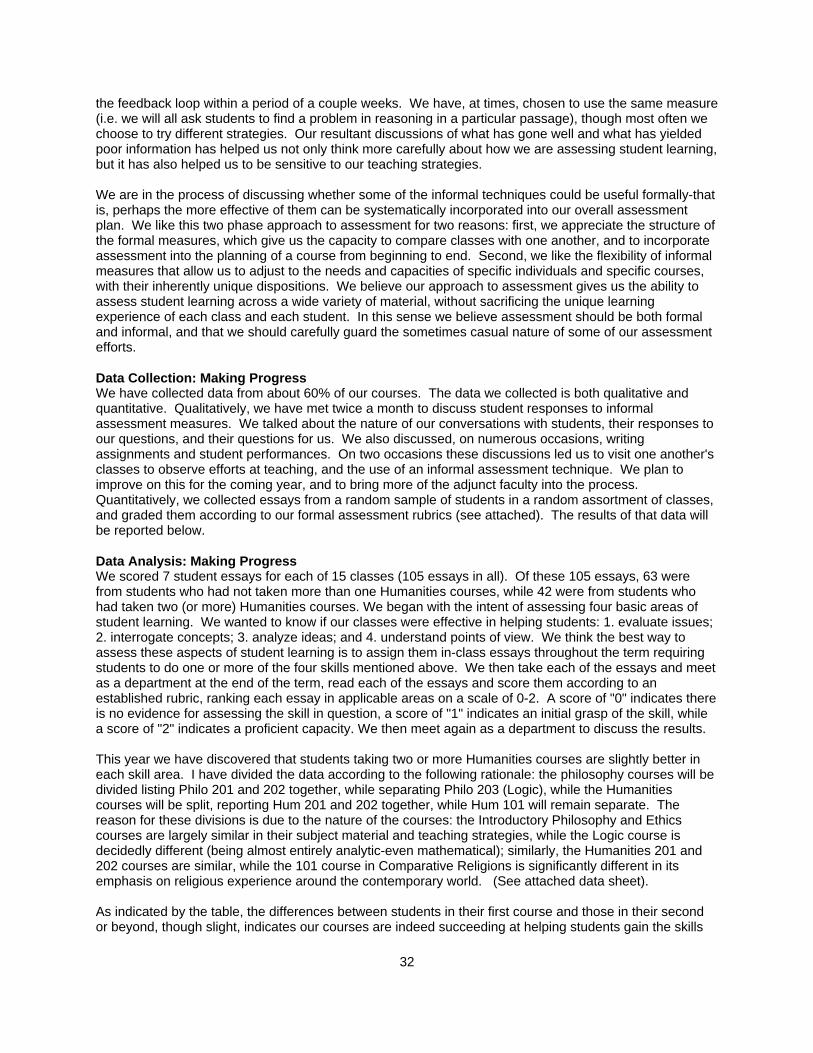
32
the feedback loop within a period of a couple weeks. We have, at times, chosen to use the same measure(i.e. we will all ask students to find a problem in reasoning in a particular passage), though most often wechoose to try different strategies. Our resultant discussions of what has gone well and what has yieldedpoor information has helped us not only think more carefully about how we are assessing student learning,but it has also helped us to be sensitive to our teaching strategies.
We are in the process of discussing whether some of the informal techniques could be useful formally-thatis, perhaps the more effective of them can be systematically incorporated into our overall assessmentplan. We like this two phase approach to assessment for two reasons: first, we appreciate the structure ofthe formal measures, which give us the capacity to compare classes with one another, and to incorporateassessment into the planning of a course from beginning to end. Second, we like the flexibility of informalmeasures that allow us to adjust to the needs and capacities of specific individuals and specific courses,with their inherently unique dispositions. We believe our approach to assessment gives us the ability toassess student learning across a wide variety of material, without sacrificing the unique learningexperience of each class and each student. In this sense we believe assessment should be both formaland informal, and that we should carefully guard the sometimes casual nature of some of our assessmentefforts. Data Collection: Making ProgressWe have collected data from about 60% of our courses. The data we collected is both qualitative andquantitative. Qualitatively, we have met twice a month to discuss student responses to informalassessment measures. We talked about the nature of our conversations with students, their responses toour questions, and their questions for us. We also discussed, on numerous occasions, writingassignments and student performances. On two occasions these discussions led us to visit one another'sclasses to observe efforts at teaching, and the use of an informal assessment technique. We plan toimprove on this for the coming year, and to bring more of the adjunct faculty into the process. Quantitatively, we collected essays from a random sample of students in a random assortment of classes,and graded them according to our formal assessment rubrics (see attached). The results of that data willbe reported below.
Data Analysis: Making ProgressWe scored 7 student essays for each of 15 classes (105 essays in all). Of these 105 essays, 63 werefrom students who had not taken more than one Humanities courses, while 42 were from students whohad taken two (or more) Humanities courses. We began with the intent of assessing four basic areas ofstudent learning. We wanted to know if our classes were effective in helping students: 1. evaluate issues;2. interrogate concepts; 3. analyze ideas; and 4. understand points of view. We think the best way toassess these aspects of student learning is to assign them in-class essays throughout the term requiringstudents to do one or more of the four skills mentioned above. We then take each of the essays and meetas a department at the end of the term, read each of the essays and score them according to anestablished rubric, ranking each essay in applicable areas on a scale of 0-2. A score of "0" indicates thereis no evidence for assessing the skill in question, a score of "1" indicates an initial grasp of the skill, whilea score of "2" indicates a proficient capacity. We then meet again as a department to discuss the results.
This year we have discovered that students taking two or more Humanities courses are slightly better ineach skill area. I have divided the data according to the following rationale: the philosophy courses will bedivided listing Philo 201 and 202 together, while separating Philo 203 (Logic), while the Humanitiescourses will be split, reporting Hum 201 and 202 together, while Hum 101 will remain separate. Thereason for these divisions is due to the nature of the courses: the Introductory Philosophy and Ethicscourses are largely similar in their subject material and teaching strategies, while the Logic course isdecidedly different (being almost entirely analytic-even mathematical); similarly, the Humanities 201 and202 courses are similar, while the 101 course in Comparative Religions is significantly different in itsemphasis on religious experience around the contemporary world. (See attached data sheet).
As indicated by the table, the differences between students in their first course and those in their secondor beyond, though slight, indicates our courses are indeed succeeding at helping students gain the skills
33
we have identified as important to our discipline. Not surprisingly, students in our Hum 101 coursesscored lowest in two of the three categories, but scored highest in Social and Cultural Awareness. It isalso important to note that the largest number of students in these classes are taking their first Humanitiescourse, and have likely not been attending college as long as those taking other Humanities courses. That their writing and analytic skills are less developed than those in other courses is thus encouraging,and points to the conclusion that our efforts to teach these skills is indeed working.
At the point of writing this report we have yet to fully determine what the data means. We are happy tosee that students emerge with greater proficiencies in these core areas upon completion of two or morehumanities courses, but we are still in the process of determining how to read these results. For instance,some interesting trends emerge, leaving us with questions like the following:
1. Why do our students seem to score uniformly higher on the "Understands Points of View" measurethan on the others?
2. Why do those students in the Logic course, whether in their first or second Humanities course, scorelower in the "Understands Points of View" measure than those in other courses?
3. There isn't a single instance in which a skill was rated lower for students taking a second Humanitiescourse than for students in their first Humanities course. Can we reasonably conclude that it does notmatter which two courses our students take, they are uniformly going to improve in these four skills?
4. Which courses are better at teaching which of these skills, and could we determine this based on ourpresent process?
Implementation of the Feedback Loop: Making ProgressWe are making some changes in the way we approach assessment as a department directly related tohow well we close the feedback loop. These changes fall into two basic areas: 1. integrating assessment;and 2. teaching strategies. (At this point our efforts to close the feedback loop are generic. This isbecause we will be meeting in August to discuss in greater detail this data and make specific decisions onhow to implement the information it provides. We anticipate making specific changes in our approach toour classes as a result of that conversation. These changes will occur to the assignments we givestudents, the syllabi we use for classes, and the examinations we give. We cannot, however, at the timeof this writing, provide those details because we haven't yet determined them).
Integrating AssessmentAs a department we are allowing assessment to generate our course assignments on a local level. Ineach course, we will construct our syllabi and grading policies around the same skills we have determinedto assess. Each assignment will therefore have a connection to assessment, and our students will have aclear idea of how each assignment is coordinated with the overall goals of the course.
Each of our courses will thus integrate assessment activities in a way that drives the courses assignments. The ultimate goal would be to have a total correlation between those students who receive the highestgrades and those students scoring highest on assessment measures. This is possible to the extent thatwe integrate assessment into each assignment, and have each assignment building skills we haveidentified for assessment. This kind of correlation is ultimately unlikely to obtain, for there are certainly amyriad of factors that intervene: native capacities of students, faulty teaching, poor study habits, etc. Nonetheless we hope to use our assessment strategies to help us structure the day-to-day operation ofthe classroom and its assignments.
Teaching StrategiesAs a department we have committed to improve our own abilities to teach these skills. We will thusexplore ways to help students gain these four basic skills, thereby teaching to the measures. We knowthat those things we practice with our students will be the same things our students will gain proficiency indoing. If we want to see out students improve in the skills we are assessing, we need to regularly practice
34
those skills explicitly in the classroom. This does not mean, however, that we will turn every class periodinto routine assessment practices. Rather, we will allow the way we assess students to help us focus ourteaching on those elements of our discipline that are likely to motivate proficiencies in the skills we assess. In some ways this can be as simple as using the terms "Analyze Issues," "Interrogate Concepts,""Analyze Ideas," and "Understand Points of View" more regularly in our discussions with students. Inother ways we will spend more time discussing what these terms mean, how they can be identified anddeveloped, and why they are important.
We believe it is important for each instructor to incorporate strategies to implement these assessmentmeasures to their own teaching style. In light of this commitment we meet regularly (twice a month) todiscuss our efforts to teach theses skills. We have become supportive of one another, and innovative inour efforts. In the end we believe it is not an overstatement to say that we have become a department thatis genuinely interested in the process of assessment, and have begun to make significant progress inintegrating it both in the way we plan for our courses, and the way we teach them.
Assessment Data Humanities 2008Evaluates IssuesHumanities 101 (42 essays)First Course: 1Second Course: 1.2
Humanities 201/202 (14 essays)First Course: 1.2Second Course: 1.3
Philosophy 201/202 (42 essays)First Course: 1.2Second Course: 1.4
Philosophy 203 (7 essays)First Course: 1.2Second Course: 1.3
Interrogates ConceptsHumanities 101 (42 essays)First Course: .9Second Course: 1
Humanities 201/202 (14 essays)First Course: 1.1Second Course: 1.1
Philosophy 201/202 (42 essays)First Course: 1Second Course: 1
Philosophy 203 (7 essays)First Course: .9Second Course: 1.2
Analyze IdeasHumanities 101 (42 essays)First Course: 1.2Second Course: 1.2
Humanities 201/202 (14 essays)First Course: 1.3Second Course: 1.4
Philosophy 201/202 (42 essays)First Course: 1.1Second Course: 1.2
Philosophy 203 (7 essays)First Course: 1.2Second Course: 1.4
Understand Points of ViewHumanities 101 (42 essays)First Course: 1.3Second Course: 1.6
Humanities 201/202 (14 essays)First Course: 1.3Second Course: 1.4
Philosophy 201/202 (42 essays)First Course: 1.1Second Course: 1.3
Philosophy 203 (7 essays)First Course: 1Second Course: 1.2
MODEL ASSESSMENTS FORBUSINESS & TECHNOLOGY
Computer Aided Design (CAD)
IT: Web and Networking
36
What makes the Computer Aided Design (CAD) Report a model for assessment of student learningin business and technology?
The Industrial Technology CAD Assessment reflects the needs of local business and industry. This is agood example of data collected from several sources. Input was received from Advisory Committeemembers. A comparison of programs at other colleges and companies was used to assess themethodology and class teaching style.
This assessment resulted in a change to the course assignments. While assessments have beencompleted throughout the College and have shown good examples of data collection, this was anexample of an assessment that resulted in a direct change as a result of data collection. Thechange was to include more timed course assignments that will demonstrate productivity in constructingand revising drawings.
37
COMPUTER AIDED DESIGN (CAD) REPORT ON ASSESSMENT OF STUDENT LEARNING 2007-2008
Summary of student learning outcomes assessment for 2007-2008:The student learning outcomes that were assessed for the 2007-2008 were as follows:1. Is the present method of class teaching style effective in meeting the course objectives?2. Are the concepts and subject matter presented in the CAD classes relevant to the needs of local
industry and prospective employers of our students.
In summary, we found through interviews and conversations with other community college programs andtheir instructors, as well as CAD consultants, our methodology and class teaching style is consistent withother programs in the area. Our present software supplied by Autodesk in the form of AutoCAD 2008, isstill being used in a majority of manufacturing and engineering firms.
With regard to student learning outcome objective two, we determined that our program needs toemphasize productivity tools for constructing and revising drawings. For example, there are manycommands and paths you can take in using AutoCAD to construct or revise a drawing. An understandingof the basic and most used commands will produce an accurate drawing as we demonstrate in class. However, our advisory committee members are looking for experienced CAD operators that havemastered proficiency in the application of the software and can rapidly produce or revise a document in ashort order of time versus the inexperienced operator. Depending upon the commands you execute, thesame drawing may take as little of time as fifteen minutes and as long as an hour in the least productiveselection of commands.
Our emphasis for the upcoming school year will have us incorporate productivity exercises that will bebased upon proficiency and time. In addition to the present teaching methodology, we will provideexercises that emphasize certain commands that will allow for greater productivity. Some of theexercises will be timed. The exercises can be assessed for productivity by reviewing the command logthat is saved with every drawing assignment.
Based on these results, changes will be implemented in 2008-2009, and these changes will beassessed to determine their effectiveness. The course assignments will be revised to include timed assignments. Additional assignments will involvemaking revisions to existing drawings that will emphasize the use of certain productivity commands. Atthe completion of the course, a timed assignment will be part of the course completion requirements. Anassignment that was developed by an industry consultant will be incorporated in the assignments whichwill be given in May of 2009. This is a productivity assignment that was developed for employers todetermine if a Cad operator candidate can meet productivity requirements for entry level employment.
Planned productivity assessment project for 2008-2009:New student learning outcomes will be related to productivity:
1. demonstrate mastery of productivity commands2. demonstrate executable commands effectively to revise drawings in an efficient manner.
Productivity assignments will be incorporated in CADMD 243, 244, and 245. The industry productivityassessment will be given at the completion of CADMD 245.
Integration of 2007-2008 assessment findings.The assessment for the previous calendar year assessed the effectiveness of teaching methodology toour course objectives and relevance of class content to the needs of industry. These questions wereanswered through surveys, interviews, advisory committee meeting and conversations with professionalsin the field. However, we determined that our students are versed in the subject matter upon completionof the program, but are they employable?
How many sections of the course(s) will be assessed? How many students?Six sections of classes will be assessed and approximately 40 students will be involved.
38
What data will you collect?To be determined
How will your adjunct faculty be involved in these assessments?The adjunct will be required to be involved since our classes are presently being instructed only byadjunct.
Do you have a need for any specialized data that is not provided as part of the annual programreview process? If so, identify your needs.At this point in time we do not need any additional specialized data.
How will this data be analyzed? Do you have any specialized tools for analysis?We will be working closely with the adjunct to determine the data analysis part of this assessment.
Do you need any support of assistance to complete this project?Not at this time.
39
What makes the IT: Web and Networking Report a model for assessment in business andtechnology?
The ITWEB Assessment is a good example of planning, data collection, data analysis, action andintegration. The plan and data are clearly presented. The data collected reflects several semesters. TheOutcome Objectives are specific and supported with measurable data.
The Action and Integration portion of the report provides a concise summary of the report and a plan forfuture courses. Many assessments at the College show data collection, data analysis, and the changes tocourses or methods. This assessment, with its statement on taking the project to the next level, goes onestep further and shows additional forward planning.
40
IT: WEB AND NETWORKING REPORT ON ASSESSMENT OF STUDENT LEARNING 2007-2008
Assessment of Student Learning – Overview Report
Discipline/Program: ITNET – 2008-2009Summarize in three or four sentences the result of your outcomes assessment for 2007-2008.After redesigning this assessment project, this is the first set of data available for analysis.More data will be required in future semesters to get a solid understanding of how wellstudents are learning the foundational concepts of networking, but I do believe that thecurrent method of assessment will do well to shed light on the issue.
Given these results, what changes are you implementing in 2008-2009? How will you assess theeffectiveness of these changes?After reviewing the first set of student responses to the exit essay exam and survey, I willreword a few questions that may have come across ambiguously to students.
If you are launching a new assessment project in 2008-2009, describe the student learningoutcome(s) you plan to assess. Identify the course(s) in which the outcome(s) will be assessed.a. I will continue the same assessment project, including all ITNET courses in the summer and fall of 2008and spring 2009.
b. Outcome Objective: To complete the exit exam with a grade of C (70%) or better.
How is this assessment related to your findings in 2007-2008?It is the same assessment.
How many sections of the course(s) will be assessed? How many students?a. Summer 2008 - 2 sections, 8 students currently enrolledb. Fall 2008 – 3 sections, 24 max students per sectionc. Spring 2009 – To be determined
What data will you collect?a. Exit essay exam resultsb. Exit survey results
How will your adjunct faculty be involved in this assessment?a. My ITNET adjunct (Josh Kunkes) was involved in developing the questions that are used to assess theoutcome objective.
b. My ITNET adjunct (Josh Kunkes) will be responsible for distributing, collecting, and assessing studentresponses in the ITNET courses that he teaches.
Do you have a need for any specialized data that is not provided as a part of the annual programreview process? If so, identify your needs.If possible, I would like a list of students in each ITNET course and an indication ofwhether they completed the recommended prerequisite for the course. If such data cannotbe assembled, I will ask students to self-report that data via an exit survey.
How will this data be analyzed? Do you have any specialized tools for analysis (e.g. rubrics,standards)?Answers to the essay exam are evaluated for basic foundational understanding ofnetworking concepts. Exams are then categorized into 2 groups: C or better (indicating anacceptable level of understanding), and D or F (unacceptable level of understanding). Do you need any support or assistance to complete this project?
41
Timely feedback on the quality of this assessment project would be greatly appreciated.
Assessment of Student Learning – ITNET 2008-2009
Stage 1 – Planning – Status: Beginning (Level 1)Students must be able to apply foundational networking knowledge to be effective in troubleshootingcomputer problems in order to be successful in completing 200-level ITNET courses, in completing PSCnetworking certificates, and in securing employment in the information technology industry. Students mustbe able to troubleshoot a problem using a process very similar to the Scientific Method (observe aproblem, identify potential solutions, test those solutions, observe a result, and document the process).Beyond assessing that students can effectively apply networking concepts to the troubleshooting process,I will continue to investigate whether completion of recommended prerequisites affects the level ofsuccess of students.
I will also analyze the results of the multiple choice portions of each course’s final exams to see if thereare any areas in which students en masse appear deficient in comprehension. These results may lead tofuture action items.
Outcome Objective: To demonstrate effective troubleshooting skills through the application offoundational networking knowledge.
Stage 2 – Data Collection – Status: Beginning (Level 1)I have completed one round of data collection for this assessment project. At least one more year of datawill be required to get a good understanding of whether or not students are learning the objectivesnecessary to be successful in the field of networking.
An exit exam component is now required of all ITNET students in all sections. This exit exam can be givenfor credit at the professor’s discretion. The exam is to be given in addition to any final exam requirementsthe professor has. It includes one essay question testing comprehension and foundational knowledge, oneessay question testing comprehension of the troubleshooting process, and a survey of previous coursestaken. A copy of the updated exam is included with this report.
Stage 3 – Data Analysis – Status: Beginning (Level 1)One round of data has been collected. 20 ITNET160 students were tested and surveyed. Of the 20students, 14 demonstrated acceptable understanding of both foundational networking concepts andtroubleshooting skills (70%). Of those 14 students, 9 (64%) completed the recommended prerequisite forthe course (ITPRG140). Of the remaining 6 students, all 6 scored unacceptably in both the concepts andtroubleshooting portions of the exam. Of the 6, 5 completed the recommended prerequisite (83%). Overall,14 of the 20 students took the prerequisite course (70%). It does not appear from this small sample thattaking the prerequisite course (or not) affected students’ levels of success. In fact, 5 of the 6 students whofailed the exit exam did complete the prerequisite course.
The networking portion of the exam contains information that is not covered in the prerequisite course.The troubleshooting portion, however, encourages students to draw upon skills learned in the prerequisitecourse and apply those skills to their newly acquired networking knowledge. It is alarming that none of thestudents who failed the exit exam were able to use methodical thinking to approach the troubleshootingportion of the exam. I believe that a more technical approach to covering the prerequisite operatingsystems objectives might benefit students that aren’t naturally methodical in their approach to solvingproblems.
Stage 4 – Action and Integration – Status: Beginning (Level 1)There is not as strong of a correlation between successful completion of the prerequisite course andsuccessful completion of the exit exam. In fact, successful completion of the prerequisite does NOTappear to help students in developing foundational troubleshooting skills required for success in the field
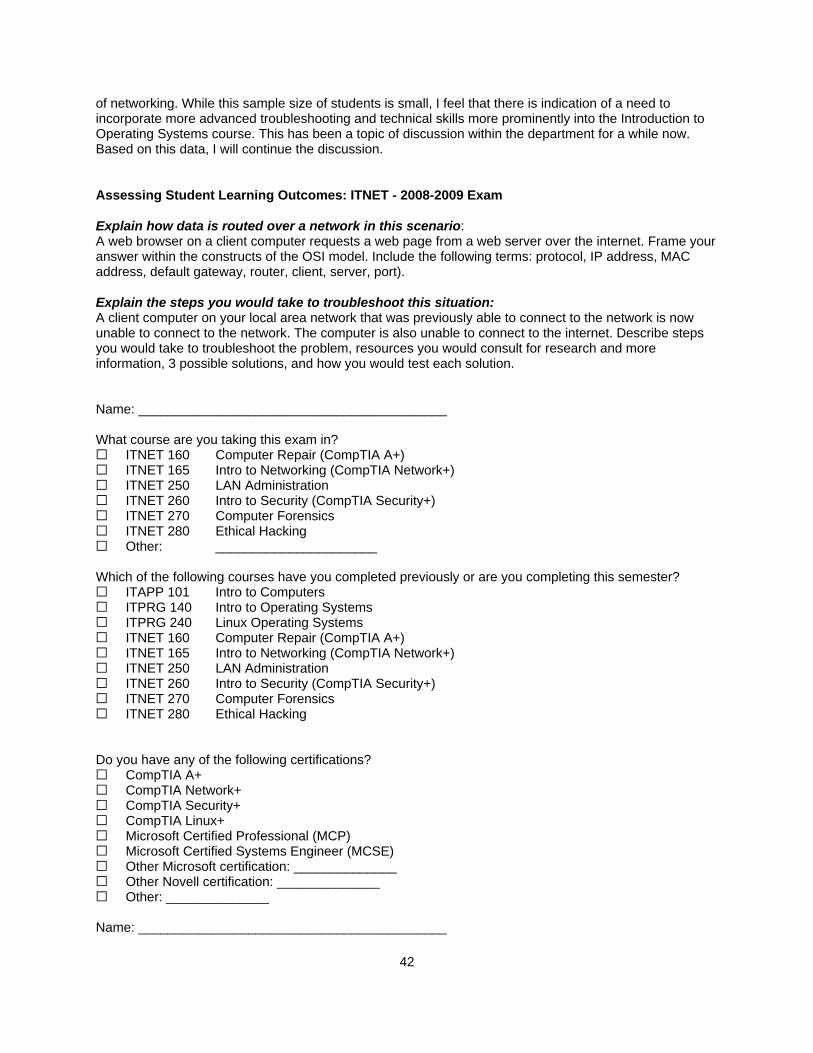
42
of networking. While this sample size of students is small, I feel that there is indication of a need toincorporate more advanced troubleshooting and technical skills more prominently into the Introduction toOperating Systems course. This has been a topic of discussion within the department for a while now.Based on this data, I will continue the discussion.
Assessing Student Learning Outcomes: ITNET - 2008-2009 Exam
Explain how data is routed over a network in this scenario: A web browser on a client computer requests a web page from a web server over the internet. Frame youranswer within the constructs of the OSI model. Include the following terms: protocol, IP address, MACaddress, default gateway, router, client, server, port).
Explain the steps you would take to troubleshoot this situation: A client computer on your local area network that was previously able to connect to the network is nowunable to connect to the network. The computer is also unable to connect to the internet. Describe stepsyou would take to troubleshoot the problem, resources you would consult for research and moreinformation, 3 possible solutions, and how you would test each solution.
Name: __________________________________________
What course are you taking this exam in?G ITNET 160 Computer Repair (CompTIA A+)G ITNET 165 Intro to Networking (CompTIA Network+)G ITNET 250 LAN AdministrationG ITNET 260 Intro to Security (CompTIA Security+)G ITNET 270 Computer ForensicsG ITNET 280 Ethical HackingG Other: ______________________
Which of the following courses have you completed previously or are you completing this semester?G ITAPP 101 Intro to ComputersG ITPRG 140 Intro to Operating SystemsG ITPRG 240 Linux Operating SystemsG ITNET 160 Computer Repair (CompTIA A+)G ITNET 165 Intro to Networking (CompTIA Network+)G ITNET 250 LAN AdministrationG ITNET 260 Intro to Security (CompTIA Security+)G ITNET 270 Computer ForensicsG ITNET 280 Ethical Hacking
Do you have any of the following certifications?G CompTIA A+G CompTIA Network+G CompTIA Security+G CompTIA Linux+G Microsoft Certified Professional (MCP)G Microsoft Certified Systems Engineer (MCSE)G Other Microsoft certification: ______________G Other Novell certification: ______________G Other: ______________
Name: __________________________________________
43
Discipline/Program: ITWEB 2008-2009Summarize in three or four sentences the result of your outcomes assessment for 2007-2008.Results in 2007-2008 were encouraging. 2 of the 3 goals set last year were met, and the third did not missby much. I am confident that I have demonstrated successful student learning with the particular set ofoutcome objectives I was measuring against.
Given these results, what changes are you implementing in 2008-2009? How will you assess theeffectiveness of these changes?I plan to move this project forward and assess a more finely grained outcome objective starting in the Fall2008 semester. Results of the new assessment should compare favorably and in line with the resultsachieved in the previous assessments.
If you are launching a new assessment project in 2008-2009, describe the student learningoutcome(s) you plan to assess. Identify the course(s) in which the outcome(s) will be assessed.a. To demonstrate the ability to create a unique web design layout using current software, given a specificset of criteria.
b. This objective will be measured via a practicum exam near the end of the semester. It will be gradedbased on both the integration of web layout concepts and the successful execution of those conceptsusing a tool such as Adobe Photoshop. I feel that a practicum is a more accurate reflection of the student’strue abilities (versus a multiple choice exam). I would like to explore this objective for at least 2 years.
c. All ITWEB103 and GC162 students will be assessed.
How is this assessment related to your findings in 2007-2008?Because I am confident that students are demonstrating learning of the objectives set forth in the2007-2008 and previous assessments, I feel it is appropriate to move forward and try to get an accuratereflection of students’ true ability to integrate concepts and hands-on manipulation of software.
How many sections of the course(s) will be assessed? How many students?a. Fall 2008 – 2 sections, 48 max studentsb. Spring 2009 – To be determined
What data will you collect?Results of a practicum exam delivered near the end of the semester
How will your adjunct faculty be involved in this assessment?Adjunct will not be involved in this assessment, as I am the only person teaching thisclass.
Do you have a need for any specialized data that is not provided as a part of the annual programreview process? If so, identify your needs.No.
How will this data be analyzed? Do you have any specialized tools for analysis (e.g. rubrics,standards)?Practicum will be graded based on a rubric to be developed in the Fall 2008 semester.
Do you need any support or assistance to complete this project?Timely feedback on the quality of this assessment project would be greatly appreciated.
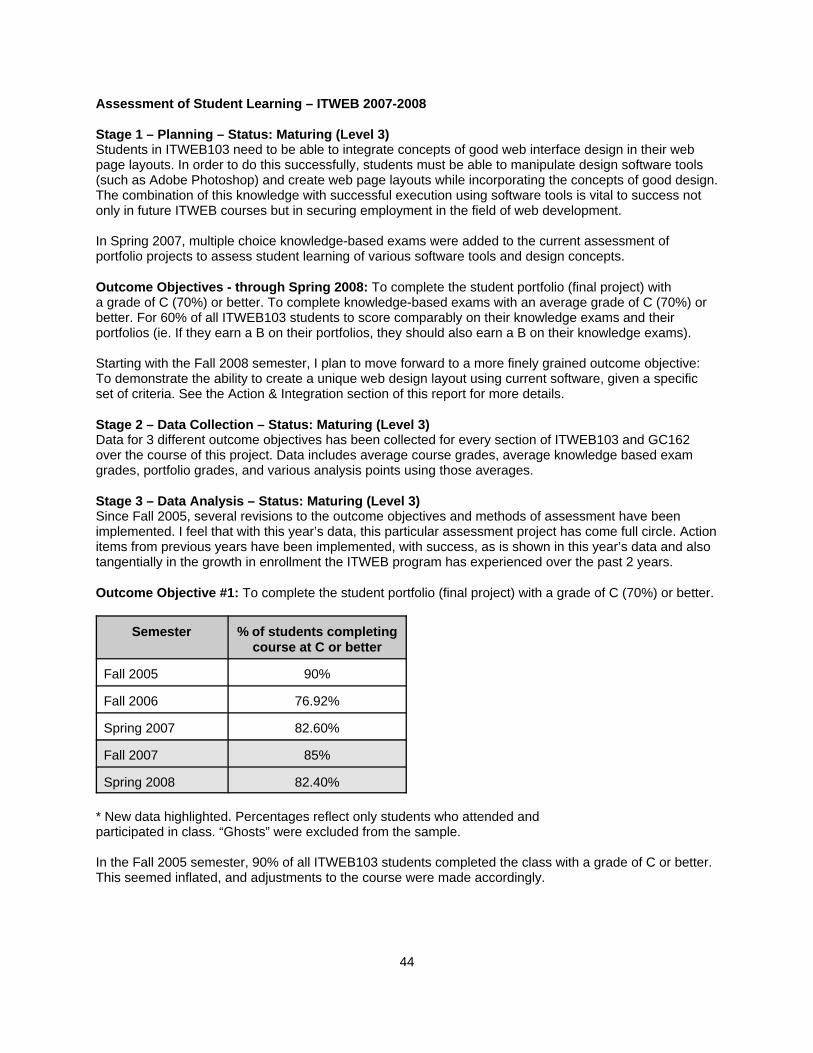
44
Assessment of Student Learning – ITWEB 2007-2008
Stage 1 – Planning – Status: Maturing (Level 3)Students in ITWEB103 need to be able to integrate concepts of good web interface design in their webpage layouts. In order to do this successfully, students must be able to manipulate design software tools(such as Adobe Photoshop) and create web page layouts while incorporating the concepts of good design.The combination of this knowledge with successful execution using software tools is vital to success notonly in future ITWEB courses but in securing employment in the field of web development.
In Spring 2007, multiple choice knowledge-based exams were added to the current assessment ofportfolio projects to assess student learning of various software tools and design concepts.
Outcome Objectives - through Spring 2008: To complete the student portfolio (final project) witha grade of C (70%) or better. To complete knowledge-based exams with an average grade of C (70%) orbetter. For 60% of all ITWEB103 students to score comparably on their knowledge exams and theirportfolios (ie. If they earn a B on their portfolios, they should also earn a B on their knowledge exams).
Starting with the Fall 2008 semester, I plan to move forward to a more finely grained outcome objective:To demonstrate the ability to create a unique web design layout using current software, given a specificset of criteria. See the Action & Integration section of this report for more details.
Stage 2 – Data Collection – Status: Maturing (Level 3)Data for 3 different outcome objectives has been collected for every section of ITWEB103 and GC162over the course of this project. Data includes average course grades, average knowledge based examgrades, portfolio grades, and various analysis points using those averages.
Stage 3 – Data Analysis – Status: Maturing (Level 3)Since Fall 2005, several revisions to the outcome objectives and methods of assessment have beenimplemented. I feel that with this year’s data, this particular assessment project has come full circle. Actionitems from previous years have been implemented, with success, as is shown in this year’s data and alsotangentially in the growth in enrollment the ITWEB program has experienced over the past 2 years.
Outcome Objective #1: To complete the student portfolio (final project) with a grade of C (70%) or better.
Semester % of students completingcourse at C or better
Fall 2005 90%
Fall 2006 76.92%
Spring 2007 82.60%
Fall 2007 85%
Spring 2008 82.40%
* New data highlighted. Percentages reflect only students who attended andparticipated in class. “Ghosts” were excluded from the sample.
In the Fall 2005 semester, 90% of all ITWEB103 students completed the class with a grade of C or better.This seemed inflated, and adjustments to the course were made accordingly.
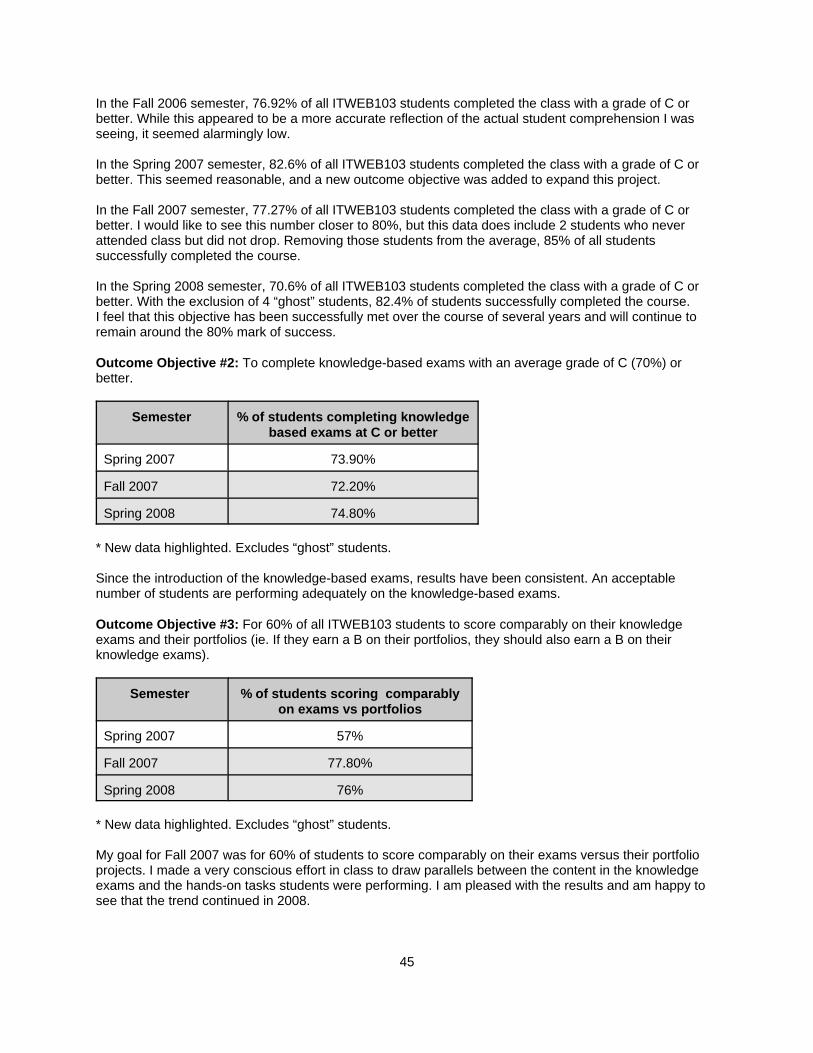
45
In the Fall 2006 semester, 76.92% of all ITWEB103 students completed the class with a grade of C orbetter. While this appeared to be a more accurate reflection of the actual student comprehension I wasseeing, it seemed alarmingly low.
In the Spring 2007 semester, 82.6% of all ITWEB103 students completed the class with a grade of C orbetter. This seemed reasonable, and a new outcome objective was added to expand this project.
In the Fall 2007 semester, 77.27% of all ITWEB103 students completed the class with a grade of C orbetter. I would like to see this number closer to 80%, but this data does include 2 students who neverattended class but did not drop. Removing those students from the average, 85% of all studentssuccessfully completed the course.
In the Spring 2008 semester, 70.6% of all ITWEB103 students completed the class with a grade of C orbetter. With the exclusion of 4 “ghost” students, 82.4% of students successfully completed the course.I feel that this objective has been successfully met over the course of several years and will continue toremain around the 80% mark of success.
Outcome Objective #2: To complete knowledge-based exams with an average grade of C (70%) orbetter.
Semester % of students completing knowledgebased exams at C or better
Spring 2007 73.90%
Fall 2007 72.20%
Spring 2008 74.80%
* New data highlighted. Excludes “ghost” students.
Since the introduction of the knowledge-based exams, results have been consistent. An acceptablenumber of students are performing adequately on the knowledge-based exams.
Outcome Objective #3: For 60% of all ITWEB103 students to score comparably on their knowledgeexams and their portfolios (ie. If they earn a B on their portfolios, they should also earn a B on theirknowledge exams).
Semester % of students scoring comparablyon exams vs portfolios
Spring 2007 57%
Fall 2007 77.80%
Spring 2008 76%
* New data highlighted. Excludes “ghost” students.
My goal for Fall 2007 was for 60% of students to score comparably on their exams versus their portfolioprojects. I made a very conscious effort in class to draw parallels between the content in the knowledgeexams and the hands-on tasks students were performing. I am pleased with the results and am happy tosee that the trend continued in 2008.
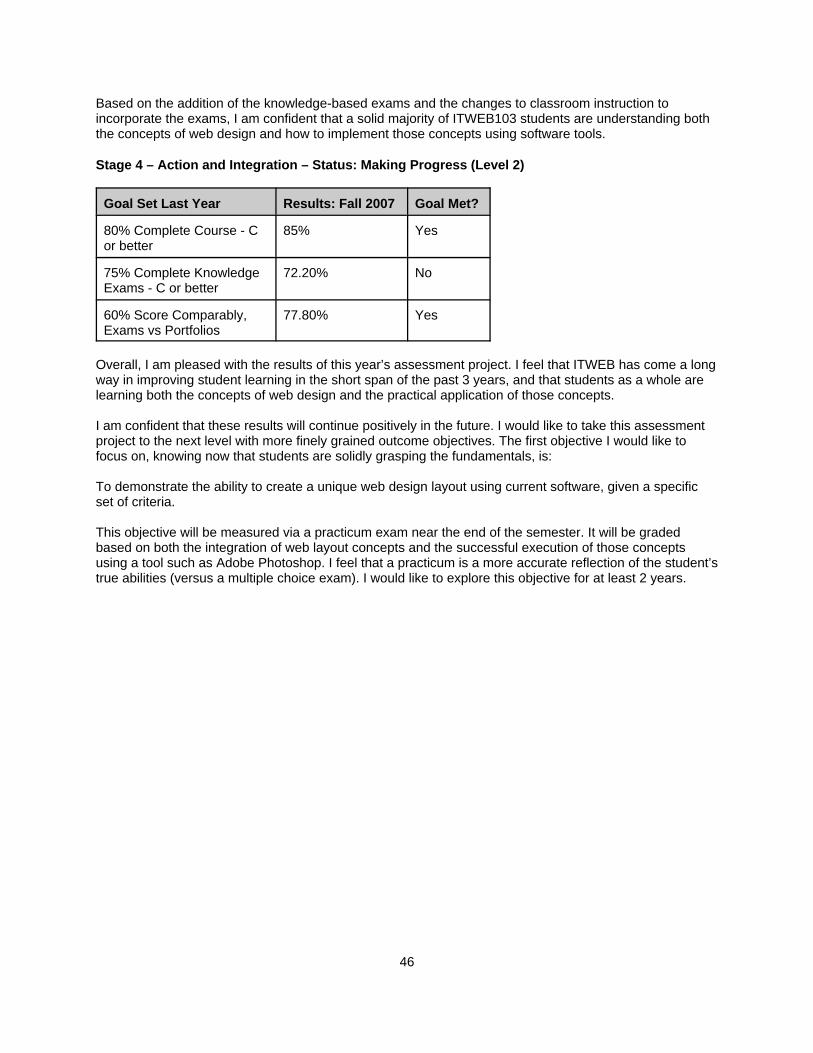
46
Based on the addition of the knowledge-based exams and the changes to classroom instruction toincorporate the exams, I am confident that a solid majority of ITWEB103 students are understanding boththe concepts of web design and how to implement those concepts using software tools.
Stage 4 – Action and Integration – Status: Making Progress (Level 2)
Goal Set Last Year Results: Fall 2007 Goal Met?
80% Complete Course - Cor better
85% Yes
75% Complete KnowledgeExams - C or better
72.20% No
60% Score Comparably,Exams vs Portfolios
77.80% Yes
Overall, I am pleased with the results of this year’s assessment project. I feel that ITWEB has come a longway in improving student learning in the short span of the past 3 years, and that students as a whole arelearning both the concepts of web design and the practical application of those concepts.
I am confident that these results will continue positively in the future. I would like to take this assessmentproject to the next level with more finely grained outcome objectives. The first objective I would like tofocus on, knowing now that students are solidly grasping the fundamentals, is:
To demonstrate the ability to create a unique web design layout using current software, given a specificset of criteria.
This objective will be measured via a practicum exam near the end of the semester. It will be gradedbased on both the integration of web layout concepts and the successful execution of those conceptsusing a tool such as Adobe Photoshop. I feel that a practicum is a more accurate reflection of the student’strue abilities (versus a multiple choice exam). I would like to explore this objective for at least 2 years.
MODEL ASSESSMENTS FORHEALTH PROFESSIONS
Fitness & Exercise
Nursing
48
What makes the Fitness & Exercise Report of model of assessment for the health professions?
The fitness and exercise programs demonstrate in their assessment project an effort to validate the scopeof knowledge the students have acquired at the conclusion of the program. The exit exam has beendeveloped through the collaboration of all teaching faculty in the program. Student feedback is obtainedfrom focus groups and clinical performance evaluations. All of the adjunct faculty and the advisory boardhave reviewed the results and have made recommendations which have been implemented. This is anexcellent example of completing the feedback loop.
49
FITNESS & EXERCISE REPORT ON ASSESSMENT OF STUDENT LEARNING 2007-2008
Summarize in three or four sentences the result of your outcomes assessment for 2007-2008The exit exam was administered the last week of the Fall 2007 semester and Spring 2008 semester. Theexam is a 100 multiple choice, comprehensive exam. The Advisory Committee was involved with rankingthe importance of each course, thereby deciding the number of questions for each particular course. Forthe first time, the students were required to have a pass rate of 70% to receive their Personal TrainerCertificate. There were 7 students in Fall 2007 and one student in Spring 2008 that completed the requiredexam. Three of the eight passed the exam the first time. The remaining six students passed the exam thesecond time. I would like to see a 70% of students passing the exam the first time.
Given these results, what changes are you implementing in 2008-2009? How will you assess theeffectiveness of these changes?Since the students are allowed to take the exam a second time, a second exam is needed. There will alsobe a few questions that need to be clarified or changed.
If you are launching a new assessment project for 2008-2009, describe the student learningoutcome(s) you plan to assess. Identify the course(s) in which the outcomes(s) will be assessed.We will not be launching a new assessment project for 2008-2009, but will be looking at improving thecurrent project. We would like to improve the performance of the students passing the exam and pass itwith a higher percentage. Since many of the courses are taken by the students almost one to two yearsprior, I will schedule a review session before the exit exam and involve the adjunct faculty withdevelopment.
How is this assessment related to your findings for 2007-2008?Last year was the benchmark for the new assessment. We will make improvements to the exit exam toincrease the percentage of students passing the first time it is taken. In order to produce the desiredoutcome, we will take an in-depth look at each individual question.
How many sections of the courses(s) will be assessed? How many students?Currently there are 12 students on target to complete their internship Fall 2007. One section, PE 299-Internship.
What data will you collect?I will collect the test score percentages and the individual questions will then be analyzed to make sure thecorrespond with course content.
How will you adjunct faculty be involved in this assessment?They will have input on the test question content from the courses they instruct.
Do you have a need for any specialized data that is not provided as part of the annual programreview process? If so, identify you needs.No
How will this data be analyzed? Do you have any specialized tools for analysis (e.g. rubrics,standards)?The exam pass rate will be evaluated through the MIS department for scoring and each question will beanalyzed for validity and reliability after receiving the information. Adjunct instructors will be given the testresults to evaluate the effectiveness of their questions.
Do you need any support or assistance to complete this project?No, I will schedule an adjunct faculty meeting during the Fall 2008 semester to review test questions.
50
What makes the Nursing Report a model for assessment of student learning in the healthprofessions?
The nursing program's assessment project looked for links between student readiness, enrichmentprograms, and student success and retention in the nursing program. The project sought to determinewhether students who obtained low pre-HESI scores, yet had enough points from course grades to beoffered a seat in the nursing program, would be able to successfully complete the first semester of theprogram if they participated in a required enrichment program during the summer before their firstsemester of nursing studies. The enrichment program received excellent evaluations from the studentswho participated, and all students that were expected to attend did so. However, the end result was onlytwo of the sixteen students who participated successfully completed the first course of the nursingprogram. This is an excellent example of a project that was well developed, received a positive evaluationfrom the students but failed in achieving the expected outcome. This demonstrates that it isn't necessaryto have a positive outcome to learn something from the project.
51
NURSING REPORT ON ASSESSMENT OF STUDENT LEARNING 2007-2008
PLAN BASED ON FINDINGS OF PREVIOUS YEAR.Summarize in three or four sentences the results of your outcomes assessment for 2006-2007.
The tests results of the specialty HESI exams and the HESI exit exams were analyzed to see if there wasa pattern in the scores of the students who received a score below 825 on the exit HESI and also failedNCLEX-RN exam. All students who achieved a score of 825 on the HESI-RN exit exam passedNCLEX-RN. There is not data available whether these students also took a review course before takingthe NCLEX-RN and, if so, what type of review course was taken.
There does not seem to be a clear delineation of scores from the HESI composite, average or exit examthat would indicate assurance of passing the NCLEX-RN. There were student who scored lower is theseareas than the ones that failed NCLEX-RN, yet they were still successful in receiving their RN licensure onthe first attempt.
Given these results, what changes are you implementing in 2007-2008? How will you assess theeffectiveness of these changes?
We will continue to monitor those students who achieve a score lower than 825 on the exit HESI.
If you are launching a new assessment project in 2007-2008, describe the student learningoutcome(s) you plan to assess. Identify the course(s) in which the outcome(s) will be assessed.
A new project will be done in the freshman nursing courses NURS 101 & NURS 102 tracking the studentwho scored low on the Admission Assessment HESI examination and were provided with a week longcourse including topics such as self-directed learning, class preparation, critical thinking skills, timemanagement, stress management, test-taking skills and classroom etiquette. The student success rate inthe program will be analyzed.
How is this assessment related to your findings for 2006-2007? We are trying to evaluate whether the results of standardized testing can predict success in the nursingprogram either in the selection process or on NCLEX-RN readiness.
How many sections of the course(s) will be assessed? How many students? All the students who scored lower that 70% on the Admission Assessment HESI, regardless of section,will be assessed. There were 18 students in this category.
What data will be collected? The exam score of these 18 students will be monitored and follow-up with faculty and counseling will bedone as needed.
How will your adjunct faculty be involved in this assessment? There will be no adjunct faculty involved.
Do you have a need for any specialized data that is not provided as part of the annual programreview process? If so, identify your needs. N/A
How will this data be analyzed? Do you have any specialized tools for analysis (e.g. rubrics,standards)? The analysis will consist of tracking the success of these students in the nursing program to determine ifthe extra pre-program sessions were beneficial to student success.
52
REPORTReadiness Success Retention – Outcomes Assessment – Department of Nursing 2007-2008
Problem Statement:It has become evident that over the next decade that Illinois as well as the Nation faces an acute shortageof professional registered nurses. This shortage continues to grow within the South Suburbs which PrairieState College serves. Projected studies have shown by the year 2020 the nursing shortage nationwidecould be as high as 40%. This does not account for what the impact of that shortage will have on thePrairie State College Community. With an aging workforce at both the practice and educational level thisshortage will become even more critical.
Prairie State College is an accredited 2 year nursing program which offers an Associate of AppliedScience in Nursing. The Program has provides qualified registered professional nurses for the diversecommunity which the College serves. Prairie State College attracts many applicants for their nursingprogram yearly. Many times there are 4:1 applicants for the potential 95 slots available. As with mostprograms not all 95 applicants are successful and do not matriculate from the Nursing program.
The biggest challenge to these students is at the first level of the Nursing program. In many instancesstudents have difficulty adjusting to the rapid pace and demands of a 2 year nursing program. Frequentlythe new nursing student's approach to studying tries to mimic previous study habits they practiced inEnglish, math or psychology. Students in many of these courses are required to memorize facts and arenot required to conceptually or critically think. Thus presents the problem. As an applied science Nursingrequires is students to pull from elements of anatomy and physiology, biology, English, math etc. Theability to conceptualize information is vitally important in the process of critically thinking. It is this majorelement that can prove success or failure in the Nursing program. Faculty have frequently documentedthat the inability to conceptualize data and critically think is one of the major elements that have lead tofailure during the first year of the Nursing program.
Proposed solution:As of 2006, the Nursing Program at Prairie State College required students to take the HESI examinationas a diagnostic to for incoming freshman students. For the class of 2008 the HESI examination wasrequired by the faculty as part of the admission process to ensure not only qualified candidates butcandidates that faculty felt would be successful in the program. It must be noted that the HESI scores arenot to be the only admission criteria for entrance, since students accumulate admission points from othervehicles through courses taken and points from grades accrued. It was noted with the class of 2007 thereappeared to be a direct correlation between composite HESI scores and student success. It was notedthat students with composite scores 80% or above showed the most opportunity to succeed in theprogram. This of course did not include variables which might have varied the results such as studentsworking full time, ESL and personal problems.
Program Goals: To1. provide a program to increase first semester student retention2. enhance mentorship between students and faculty3. provide a vehicle to monitor success during the first semester
What we would like to propose is a program in an attempt to ensure the success and retention of ournursing students at Prairie State College. Readiness, Success, Retention is the proposed name. We knowthat the educational material presented to the students is of high quality but what the faculty fails toevaluate is the way students are integrated into the program at the beginning and throughout their firstsemester. We must identify our high risk students early before the program officially begins, thus we areproposing the following:
1. students who do not achieve 70% on the composite HESI must qualify for the RSR program2. the program will begin the week prior to the official orientation to the Nursing program in August
53
3. students will be required to participate in the program as a contingency for admission4. students participate in a one hour session each week prior to midterm to monitor student success
and mentoring activities 5. each student meet weekly with assigned academic advisor to ensure mentoring activities
Pre-Freshman Nursing Orientation: Summer Program Development1. Learning styles inventory , critical thinking assessment test2. What is critical thinking and how do I begin3. Math, Math, Math4. How to take that nursing test5. Time Management6. Stress without distress7. How to use the library and online resources8. Where do I go to for help9. Dealing with those personal battles
Readiness program summer orientation program will begin on August 6-10th from 8:00-12:00
Personnel/Resources1. Nursing Faculty2. Counseling Services3. Student Success Services4. Student Testing Services5. Computer/Blackboard/Online services
Outcome ObjectivesSixteen have been identified as meeting the criteria for the RSR program from the fall class of 2007.These students scored below 70% on the composite HESI test. The objective is to promote a success rateof 70% of the freshman students participating in this program by the end of Nursing 101. Studentassistance and follow-up will to be monitored during the semester with their participation in the continuingenrichment program.
Continuation of Readiness Success Retention ProgramIn order to ensure continued success in the nursing program, it is vital to provide programs and activitiesfor freshman students. The fall class of 2006 reported an attrition rate of 31%, which represented 1/3 ofthe class (n=94). A supplemental instructional program, which flows from the RSR, proposes to assistfreshman students for the fall of 2007 by providing weekly activities to promote assimilation into thisrigorous nursing curriculum.
Objectives for this program: To1. provide supplementary programs to support the Nursing 101 curriculum on a weekly basis2. create a supplemental instructional nursing facilitator to conduct/monitor programs for Nursing 101students 3. decrease the Nursing 101 attrition rate by 15 % 4. provide academic advising and counseling 5. guide, assist and motivate students6. make available the necessary technological tools for student success7. mentor beginning freshman students ( faculty& students, students and upperclassman)
The Program1. workshop on previous week's skills 3 hours weekly2. tutoring of content ( appointments necessary) 3hours weekly3. Sim Man ( this program will occur every 2 weeks ) two 2 hour sessions4. Question and answer sessions ( scheduled or per e-mail) 1-2 hours weekly
54
Supplemental Nursing Facilitator Role: To1. guide , assist and motivate students2. server as a liaison between students and faculty3. provide referrals to support services4. coordinate tutoring and workshop activities for freshman students5. prepare monthly reports on student participation in program activities Outcomes Assessment EvaluationThere continues to be a growing concern pertaining to the high attrition rate of nursing students duringNursing 101 &102. The Readiness, Success and Retention program was designed to address theseconcerns. The program was originally targeted for students who scored 70% and below on the Pre-HESIentrance examination. 15 students met this criterion. The one week enrichment program as describeabove was intended to provide a head start for this group of students which HESI considered as a highrisk for failure.
Analysis of Nursing 101 RSR program• N=15• 73% of the intensive enrichment students failed nursing 101 ( 11 out of 15)
Analysis of Nursing 102 RSR Program• N=4• 75% or 3 of 4 of the intensive program failed Nursing 102• 93% failure rate of all students enrolled in intensive enrichment program
These statistics show a direct correlation between HESI composite scores and course failures. HESIcontinues to state through reliability and validity studies that students scoring 70% or below in specifictesting areas and on the composite score will require remediation and have a high potential of failing. Ourstatistics have shown this to be true.
Analysis of Nursing 101 • N= 94 ( enrolled fall 2007)• 26 course failures• Failure rate 28%• 11 of 15 or 73% were RSR students• 20% of students not identified as high risk failed Nursing 101
Analysis of Nursing 102• N= 86• 32 course failures• Failure rate 37%• 3of 4 or 75 % failure rate of RSR students
Conclusion & Recommendations1. All students will continue to take the HESI A2 ( pre HESI) including learning profile for admission intothe nursing program
2. Students must score 70% in all areas including the composite score
3. Students will be allowed no more than 3 attempts within the same calendar year if they do not meetthe 70% criteria in all tested areas on the HESI A2
4. The Nursing department will continue to work with counseling services to advise and support allincoming and continuing nursing students
55
5. That the RSR program be incorporated with the Illinois Education Foundation to continue enrichmentprograms and provide statistical data to monitor success of Nursing students for the academic year of2008-2009
6. A task force be created to work with the Biology department , specifically anatomy and physiology, toaddress correlation of A& P scores to the Pre-HESI and provide remediation programs for students whodo not meet the 70% HESI criteria
In conclusion the RSR programs components were correctly identified to assist nursing 101 students.What was obvious that a one week program cannot erase years of deficits that these students presented.Due to lack of personnel the continuation of the RSR program throughout the semester was notaccomplished. It is unknown whether or not this was pivotal in the success or failure of these students.What is conclusive data is that students who score 70% or above on the pre-HESI admission examinationhave a higher rate of success than those who scored below the required 70%.
MODEL ASSESSMENT FORDEVELOPMENTAL STUDIES
Reading
57
What makes the Reading Report a model for assessment for developmental studies?
Reading 098 is an important gateway developmental course, and Patty has thought carefully about how toorient her students to college in a welcoming way. See, for example, the attached forms that leadstudents through things like using e-mail to communicate with their professors and signing up for a tutor inthe SSC in a welcoming way. The beauty of this first form is that students don’t have to know the rightquestions to ask in order to get the information they need. The second form helps them learn about whatthe College offers as well as how to use technology like WebAdvisor to enhance their academic success –see especially the “nuts and bolts” section. Patty also suggests a new approach to evaluating studentsuccess in English, making a distinction between students who disappear midway through the course andthose who persist to the end of the semester. This method provides a clearer picture of the outcomes ofour academic instruction. Finally and most important, Patty has created a visual syllabus. This innovationcould be used for a number of courses and is especially good for visual learners. Communicating clearlywhat we expect our students to be learning is a hallmark of effective instruction and the visual syllabushelps to do this. (Recall the classic comment: “If I’d been told what I was supposed to learn, I would havepassed the course.”)
58
READING REPORT ON ASSESSMENT OF STUDENT LEARNING 2007-2008
SummaryRDG 098 assists students in developing and refining the reading skills necessary to be successful in ENG099 and higher level courses. It is often the entry point to the College for these students, and this levelcontinues to grow in importance as a gateway course and a challenge to rise to our mission as an opendoor institution. Specific skills addressed in RDG-098 include, but are not limited to: interpretation ofcontext clues, expansion and application of vocabulary, and using applying various metacognitivetechniques to guide comprehension.
PlanningThe initial plan launched in the fall of 2007 for the assessment of the RDG program at the 098 levelincluded COMPASS testing plus grade correlation. In order to distinguish this year's project from previousyears, two growth elements were added to the project:1. A larger cohort of students will be analyzed. Last year, 4 sections in total Ire analyzed. This year, 8
sections will be analyzed.2. All students who are COMPASSed for Post-testing will also have their final grade in RDG-098 given
to the Coordinator of Reading as part of the data analysis process.
The two new elements provided two details to this year's assessment. First, a larger cohort of studentsprovides an opportunity to check reliability across sections. The smaller cohort of '06-'07 revealed thatRDG-098 was statistically significant in the remediation of reading abilities, but this larger sample sizewould answer the question of whether or not this was something that was really at the program-level, orsimply something that was teacher-dependent. Second, adding a final grade correlate would enable us togage whether or not grade distribution could function as a reliable post-test instrument. While we are ableto COMPASS post-test students, it often places an undue stress that we may not need to inflict if we areable to verify that grades received closely reflect reading achievement measured by the COMPASSinstrument.
Data CollectionWhile I did analyze a larger cohort of students this academic year, I was able to analyze data sets from 6sections rather than the 8 sections as projected, due to course cancellations and faculty emergencies. Additionally, universal data holes existed among pretests across the sections, and this changed the focusof the data to include Post-tests and final grades only (rather than Pre & Post tests along with finalgrades). This speaks to one of the ongoing challenges of data collection for projects that are not entirelycourse-embedded.
While the Post-test is course-embedded, the Pre-test is not, and the gathering of this data is challengingand often spotty. Instructors have access to the academic history of students at the start of the course, butas course rosters shift, faculty rarely have time to keep up with the shifting histories in their sections.Additionally, without easy/ready access to data, the Pre-test component becomes rather burdensome inthis project. To have the largest sample possible, complete data sets were reorganized to include thecourse-embedded elements only: Post-test and final grade.
Six sections of RDG-098 were used for this study. Four sections in the fall and 2 sections in the springmade up this cohort. The fall sections included 3 daytime sections and one evening section. The springsections included one daytime section and one evening late-start section. A total of 62 studentsparticipated in this study: 47 in the fall of 2007, and 15 in the spring of 2008. Two full-time faculty and twopart-time faculty participated in the study. This maintained the ft/pt faculty ratio from last year's projectwhile increasing the number of students for the sample. This sample also included representation fromvarious RDG-098 consumers: daytime, evening, regular start, and late-start students.
Ultimately, the sample size for this year's project was almost double that of last year:: 62 students in 07-08compared to 34 students in 06-07. Data sets for each student in the sample included a Post-testCOMPASS score taken in the 16th week of the semester, and a final grade for the RDG-098 course.
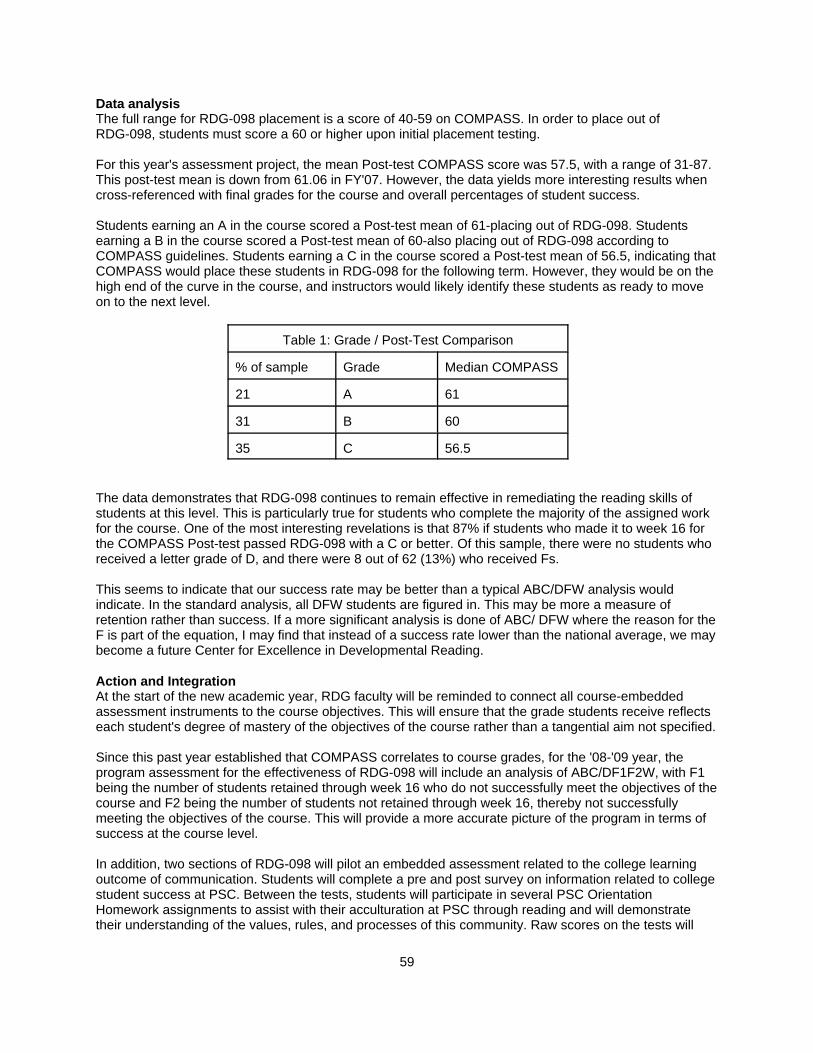
59
Data analysisThe full range for RDG-098 placement is a score of 40-59 on COMPASS. In order to place out ofRDG-098, students must score a 60 or higher upon initial placement testing.
For this year's assessment project, the mean Post-test COMPASS score was 57.5, with a range of 31-87. This post-test mean is down from 61.06 in FY'07. However, the data yields more interesting results whencross-referenced with final grades for the course and overall percentages of student success.
Students earning an A in the course scored a Post-test mean of 61-placing out of RDG-098. Studentsearning a B in the course scored a Post-test mean of 60-also placing out of RDG-098 according toCOMPASS guidelines. Students earning a C in the course scored a Post-test mean of 56.5, indicating thatCOMPASS would place these students in RDG-098 for the following term. However, they would be on thehigh end of the curve in the course, and instructors would likely identify these students as ready to moveon to the next level.
Table 1: Grade / Post-Test Comparison
% of sample Grade Median COMPASS
21 A 61
31 B 60
35 C 56.5
The data demonstrates that RDG-098 continues to remain effective in remediating the reading skills ofstudents at this level. This is particularly true for students who complete the majority of the assigned workfor the course. One of the most interesting revelations is that 87% if students who made it to week 16 forthe COMPASS Post-test passed RDG-098 with a C or better. Of this sample, there were no students whoreceived a letter grade of D, and there were 8 out of 62 (13%) who received Fs.
This seems to indicate that our success rate may be better than a typical ABC/DFW analysis wouldindicate. In the standard analysis, all DFW students are figured in. This may be more a measure ofretention rather than success. If a more significant analysis is done of ABC/ DFW where the reason for theF is part of the equation, I may find that instead of a success rate lower than the national average, we maybecome a future Center for Excellence in Developmental Reading.
Action and IntegrationAt the start of the new academic year, RDG faculty will be reminded to connect all course-embeddedassessment instruments to the course objectives. This will ensure that the grade students receive reflectseach student's degree of mastery of the objectives of the course rather than a tangential aim not specified.
Since this past year established that COMPASS correlates to course grades, for the '08-'09 year, theprogram assessment for the effectiveness of RDG-098 will include an analysis of ABC/DF1F2W, with F1being the number of students retained through week 16 who do not successfully meet the objectives of thecourse and F2 being the number of students not retained through week 16, thereby not successfullymeeting the objectives of the course. This will provide a more accurate picture of the program in terms ofsuccess at the course level.
In addition, two sections of RDG-098 will pilot an embedded assessment related to the college learningoutcome of communication. Students will complete a pre and post survey on information related to collegestudent success at PSC. Between the tests, students will participate in several PSC OrientationHomework assignments to assist with their acculturation at PSC through reading and will demonstratetheir understanding of the values, rules, and processes of this community. Raw scores on the tests will
60
then be analyzed to indicate whether the intervention was successful in reaching the communicationoutcome. While the College learning outcome of professionalism is not an explicit outcome for this course,it is fair to say that this particular means of communication assessment will also address theprofessionalism outcome in terms of the PSC standards and expectations.
Attached (p. 4 of this report) are the pre/post survey instrument (highlighted questions are testitems), the PSC Orientation Homework assignments (p.5), and the course syllabus (p.6).
Respectfully submitted,
Patty Valenziano
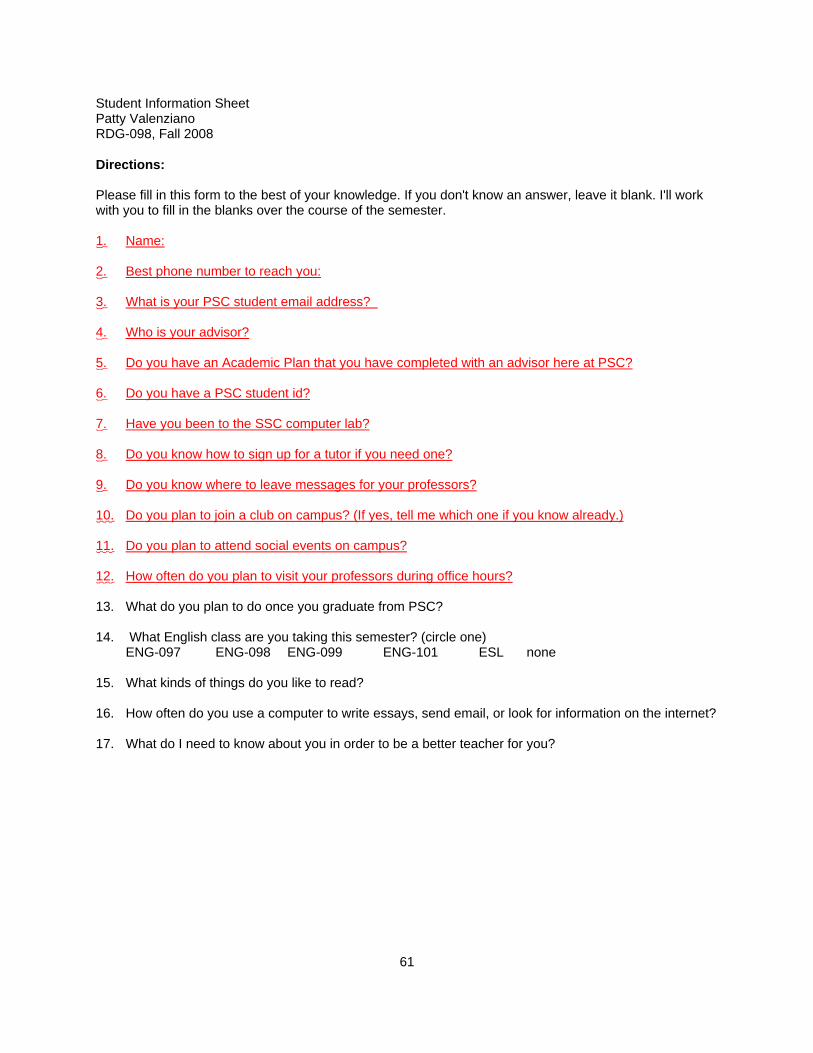
61
Student Information SheetPatty ValenzianoRDG-098, Fall 2008
Directions:
Please fill in this form to the best of your knowledge. If you don't know an answer, leave it blank. I'll workwith you to fill in the blanks over the course of the semester.
1. Name:
2. Best phone number to reach you:
3. What is your PSC student email address?
4. Who is your advisor?
5. Do you have an Academic Plan that you have completed with an advisor here at PSC?
6. Do you have a PSC student id?
7. Have you been to the SSC computer lab?
8. Do you know how to sign up for a tutor if you need one?
9. Do you know where to leave messages for your professors?
10. Do you plan to join a club on campus? (If yes, tell me which one if you know already.)
11. Do you plan to attend social events on campus?
12. How often do you plan to visit your professors during office hours?
13. What do you plan to do once you graduate from PSC?
14. What English class are you taking this semester? (circle one)ENG-097 ENG-098 ENG-099 ENG-101 ESL none
15. What kinds of things do you like to read?
16. How often do you use a computer to write essays, send email, or look for information on the internet?
17. What do I need to know about you in order to be a better teacher for you?
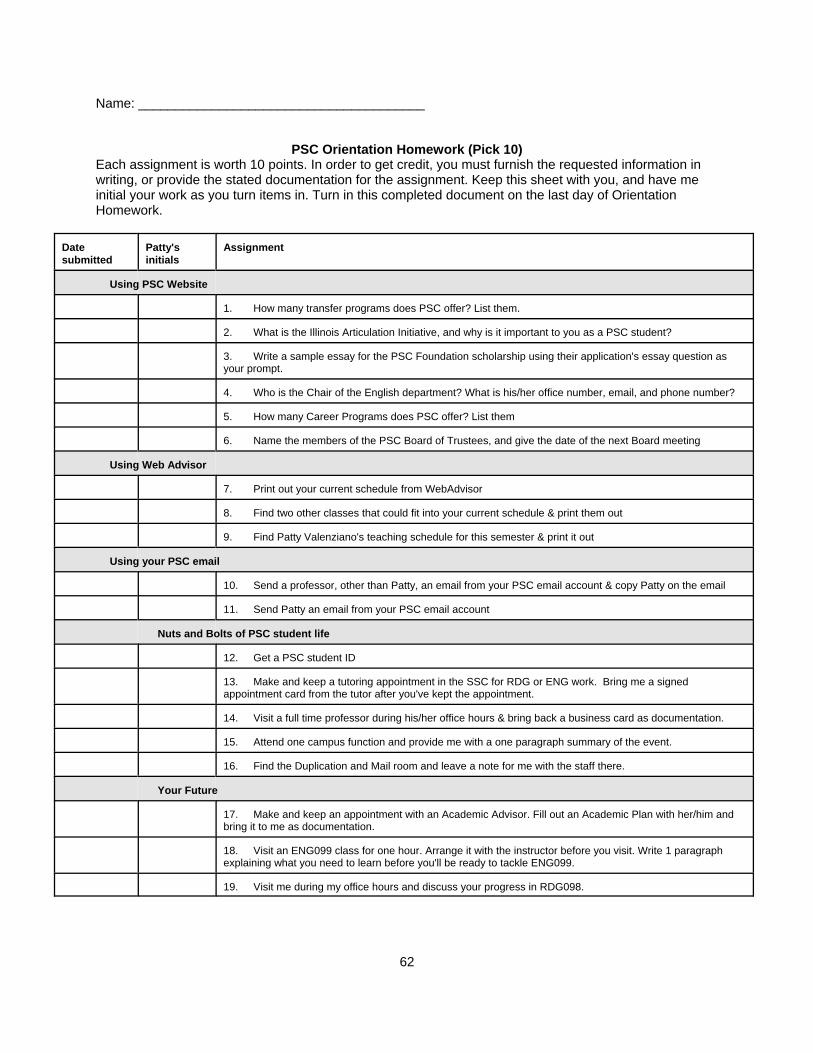
62
Name: _______________________________________
PSC Orientation Homework (Pick 10)Each assignment is worth 10 points. In order to get credit, you must furnish the requested information inwriting, or provide the stated documentation for the assignment. Keep this sheet with you, and have meinitial your work as you turn items in. Turn in this completed document on the last day of OrientationHomework.
Datesubmitted
Patty'sinitials
Assignment
Using PSC Website
1. How many transfer programs does PSC offer? List them.
2. What is the Illinois Articulation Initiative, and why is it important to you as a PSC student?
3. Write a sample essay for the PSC Foundation scholarship using their application's essay question asyour prompt.
4. Who is the Chair of the English department? What is his/her office number, email, and phone number?
5. How many Career Programs does PSC offer? List them
6. Name the members of the PSC Board of Trustees, and give the date of the next Board meeting
Using Web Advisor
7. Print out your current schedule from WebAdvisor
8. Find two other classes that could fit into your current schedule & print them out
9. Find Patty Valenziano's teaching schedule for this semester & print it out
Using your PSC email
10. Send a professor, other than Patty, an email from your PSC email account & copy Patty on the email
11. Send Patty an email from your PSC email account
Nuts and Bolts of PSC student life
12. Get a PSC student ID
13. Make and keep a tutoring appointment in the SSC for RDG or ENG work. Bring me a signedappointment card from the tutor after you've kept the appointment.
14. Visit a full time professor during his/her office hours & bring back a business card as documentation.
15. Attend one campus function and provide me with a one paragraph summary of the event.
16. Find the Duplication and Mail room and leave a note for me with the staff there.
Your Future
17. Make and keep an appointment with an Academic Advisor. Fill out an Academic Plan with her/him andbring it to me as documentation.
18. Visit an ENG099 class for one hour. Arrange it with the instructor before you visit. Write 1 paragraphexplaining what you need to learn before you'll be ready to tackle ENG099.
19. Visit me during my office hours and discuss your progress in RDG098.