ni 43-101 technical report - jiama phase 2 expansion project ...
250
FINAL REPORT NI 43-101 TECHNICAL REPORT - JIAMA PHASE 2 EXPANSION PROJECT MINERAL RESOURCES & RESERVES For CHINA GOLD INTERNATIONAL THIS DOCUMENT IS NOT BE USED FOR ANY PURPOSE OTHER THAN TO ASSESS THE CURRENT STATUS OF WORK ON THE PROJECT REPORT BY MINING ONE Job No. 1870_G Mining One Pty Ltd Level 9, 50 Market Street Melbourne VIC 3000 Ph: 03 9600 3588 Fax: 03 9600 3944 Doc No. 3725 Date: January 2014 Prepared for: Anthony R Cameron & Bin Guo
-
Upload
khangminh22 -
Category
Documents
-
view
0 -
download
0
Transcript of ni 43-101 technical report - jiama phase 2 expansion project ...
FINAL REPORT
NI 43-101 TECHNICAL REPORT - JIAMA
PHASE 2 EXPANSION PROJECT
MINERAL RESOURCES & RESERVES
For
CHINA GOLD INTERNATIONAL
THIS DOCUMENT IS NOT BE USED FOR ANY PURPOSE OTHER THAN TO ASSESS THE
CURRENT STATUS OF WORK ON THE PROJECT REPORT BY MINING ONE
Job No. 1870_G Mining One Pty Ltd Level 9, 50 Market Street
Melbourne VIC 3000 Ph: 03 9600 3588
Fax: 03 9600 3944
Doc No. 3725 Date: January 2014 Prepared for: Anthony R Cameron & Bin Guo
P:\1870_G\3725_Final_Signed_20140130
JIAMA PHASE 2 EXPANSION PROJECT
CHINA GOLD INTERNATIONAL
IMPORTANT NOTICE
This report has been prepared as a National Instrument 43-101 Technical Report, as prescribed
in Canadian Securities Administrators’ National Instrument 43-101, Standards of Disclosure for
Mineral Projects (“NI 43-101”) for China Gold International (“China Gold”): The data,
information, estimates, conclusions and recommendations contained herein, as prepared and
presented by the Authors, are consistent with i) information available at the time of preparation;
ii) data supplied by outside sources; and, iii) the assumptions, conditions and qualifications set
forth in this report.
This report is intended to be used by China Gold, subject to the terms and conditions of
professional services contracts, written or verbal, and other terms of engagement between
China Gold and the Authors who hereby give their consents to China Gold to file this report as a
Technical Report with Canadian Securities Regulatory Authorities pursuant to provincial
securities legislation and any Canadian stock exchange requirements. Except for the purposes
legislated under provincial securities law, any other use of this report by a third party is at that
party’s sole risk.
P:\1870_G\3725_Final_Signed_20140130
JIAMA PHASE 2 EXPANSION PROJECT
CHINA GOLD INTERNATIONAL
TABLE OF CONTENTS
1 EXECUTIVE SUMMARY.................................................................................................... i
1.1 Property Description and Location ........................................................................... i
1.2 Geology and Mineralisation ...................................................................................... i
1.3 Mineral Processing and Metallurgical Testing ......................................................... ii
1.4 Mineral Resources .................................................................................................. ii
1.5 Mineral Reserve Estimate ....................................................................................... v
1.6 Pit Optimisation ...................................................................................................... vi
1.7 Underground Mine Shape Optimisation .................................................................. vii
1.8 Geotechnical Review ............................................................................................ viii
1.9 Pit Design .............................................................................................................. ix
1.10 Underground Design ............................................................................................... x
1.11 Capital Costs ........................................................................................................ xiii
1.12 Financial Modelling and Economic Analysis .......................................................... xiv
1.13 Recommendations ................................................................................................ xiv
2 INTRODUCTION ............................................................................................................... 1
2.1 Terms of Reference ................................................................................................ 1
2.2 Author’s Qualifications & Responsibilities ................................................................ 3
2.3 Limitations and Exclusions ...................................................................................... 4
3 RELIANCE ON OTHER EXPERTS ................................................................................... 5
3.1 Agreements, Land Tenure, Surface Rights, Access and Permits ............................ 5
3.2 Historical Information .............................................................................................. 5
3.3 Risks Associated with the Valuation or Pricing ........................................................ 5
4 PROPERTY DESCRIPTION AND LOCATION ................................................................. 7
5 ACCESSIBILITY, CLIMATE, LOCAL RESOURCES, INFRASTRUCTURE AND
PHYSIOGRAPHY .................................................................................................................... 12
5.1 Topography ........................................................................................................... 12
5.2 Climate and Vegetation ......................................................................................... 12
5.3 Project Access ...................................................................................................... 12
5.4 Power .................................................................................................................... 13
5.5 Water .................................................................................................................... 13
5.6 Local Resources and Infrastructure ....................................................................... 13
5.7 Personnel .............................................................................................................. 13
5.8 Accommodation .................................................................................................... 13
6 HISTORY ........................................................................................................................ 14
6.1 Pre 2008 ............................................................................................................... 14
6.2 2008-2012 ............................................................................................................. 14
7 GEOLOGICAL SETTING AND MINERALISATION ........................................................ 16
P:\1870_G\3725_Final_Signed_20140130
JIAMA PHASE 2 EXPANSION PROJECT
CHINA GOLD INTERNATIONAL
7.1 Regional Geological Setting .................................................................................. 16
7.2 Project Geology .................................................................................................... 16
7.3 Mineralisation ........................................................................................................ 18
7.4 Skarn-Type Copper-Polymetallic Mineralisation .................................................... 18
7.5 Hornfels Hosted Copper-Polymetallic Mineralisation ............................................. 19
7.6 Porphyry-Type Molybdenum-Copper Polymetallic Mineralisation .......................... 19
8 DEPOSIT TYPES ............................................................................................................ 20
9 EXPLORATION .............................................................................................................. 21
9.1 Pre 1990 ............................................................................................................... 21
9.2 Years 1990–2000 .................................................................................................. 21
9.3 Years 2008-2012................................................................................................... 21
10 DRILLING ....................................................................................................................... 23
11 SAMPLE PREPARATION, ANALYSIS AND SECURITY ............................................... 24
11.1 Sampling Methodology ......................................................................................... 24
11.1.1 Brigade 6 Sampling (1990’s) .............................................................................. 24
11.1.2 Huatailong Sampling (2008–2011) ..................................................................... 24
11.1.3 Huatailong Sampling (2012) ............................................................................... 24
11.2 Sample Preparation and Analysis ......................................................................... 24
11.2.1 Bridge Brigade 6 (1990’s) .................................................................................. 24
11.2.2 Huatailong (2008–2011)..................................................................................... 25
11.2.3 Huatailong (2012) .............................................................................................. 25
12 DATA VERIFICATION .................................................................................................... 26
12.1 Quality Control Data for Pre-2011 Drilling ............................................................. 26
12.2 Quality Control Data for 2012 Drilling .................................................................... 26
12.2.1 Duplicates .......................................................................................................... 27
12.2.2 Analytical Blanks ................................................................................................ 27
12.2.3 Conclusions ....................................................................................................... 27
13 MINERAL PROCESSING AND METALLURGICAL TESTING ....................................... 32
13.1 Introduction ........................................................................................................... 32
13.2 Metallurgical Testing and Process Plant Considerations ....................................... 33
13.3 Copper-Lead-Zinc Ore Metallurgical Testing ......................................................... 34
13.4 Commentary ......................................................................................................... 35
14 MINERAL RESOURCE ESTIMATE ................................................................................ 36
14.1 Source Data .......................................................................................................... 36
14.2 Bulk Density Data ................................................................................................. 36
14.3 Geological Interpretation ....................................................................................... 38
14.4 Weathering Surfaces ............................................................................................ 39
14.5 Three Dimensional Modelling ................................................................................ 39
14.6 Drill Sample Statistics ........................................................................................... 39
P:\1870_G\3725_Final_Signed_20140130
JIAMA PHASE 2 EXPANSION PROJECT
CHINA GOLD INTERNATIONAL
14.6.1 Overview ............................................................................................................ 39
14.7 Sample Support .................................................................................................... 39
14.8 Drill Hole Compositing .......................................................................................... 40
14.9 High Grade Capping ............................................................................................. 44
14.10 Resource Block Model ........................................................................................ 47
14.10.1 Block Size ........................................................................................................ 47
14.10.2 Variography and Estimation ............................................................................. 47
14.10.3 Resource Classification .................................................................................... 50
14.11 Mineral Resource Statement ............................................................................... 51
15 MINERAL RESERVE ESTIMATE ................................................................................... 53
15.1 Introduction ........................................................................................................... 53
15.2 Project Strategy .................................................................................................... 53
15.3 Mine Planning and Scheduling Process ................................................................ 55
15.4 Underground Phase II Expansion ......................................................................... 57
15.5 Mine Design Underground .................................................................................... 60
15.5.1 Mining Method Description ................................................................................. 60
15.5.2 Underground Mining - Initial Ten Years .............................................................. 60
15.5.3 Underground Mining beyond Ten Years ............................................................. 72
15.5.4 Sub-Level Open Stoping with Fill (Primary/Secondary/Tertiary) ......................... 74
15.5.5 Sub-Level Caving............................................................................................... 75
15.5.6 Open Stoping with Pillars ................................................................................... 76
15.5.7 Open Stoping with Fill (Transverse) ................................................................... 77
15.5.8 Room and Pillar ................................................................................................. 78
15.5.9 Cut-off Grade ..................................................................................................... 78
15.5.10 Material Handling ............................................................................................. 79
15.6 Phase II Underground Schedule ........................................................................... 80
15.6.1 Initial Design Schedule ...................................................................................... 80
15.6.2 Underground Life of Mine Design (Completed by China Gold) ........................... 83
15.6.3 Underground Life of Mine Schedule ................................................................... 84
15.7 Pit Optimisation ..................................................................................................... 88
15.7.1 Pit Optimisation Methodology............................................................................. 88
15.7.2 Block Model ....................................................................................................... 89
15.7.3 Whittle Re-blocked Model .................................................................................. 91
15.7.4 Whittle Geotechnical Input Parameters .............................................................. 91
15.7.5 Whittle Mining Input Parameters ........................................................................ 91
15.7.6 Whittle Selling Input Parameters ........................................................................ 92
15.7.7 Whittle Processing Capacity .............................................................................. 92
15.7.8 Discount Rate .................................................................................................... 92
15.7.9 Mine Extent Limitations ...................................................................................... 92
15.7.10 Whittle Optimisation Parameter Summary ........................................................ 93
15.7.11 Whittle General Conversion Process ................................................................ 94
15.7.12 Input Parameters Validation Process ............................................................... 94
15.7.13 Pit Optimisation Comparison ............................................................................ 95
P:\1870_G\3725_Final_Signed_20140130
JIAMA PHASE 2 EXPANSION PROJECT
CHINA GOLD INTERNATIONAL
15.7.14 Pit Optimisation Result ..................................................................................... 96
15.8 Mine Design Guidelines Open Pit ....................................................................... 101
15.8.1 Pit Design Criteria ............................................................................................ 101
15.8.2 Pit Design Open Pit .......................................................................................... 103
15.9 Mining Schedule Overview .................................................................................. 111
15.10 Stage Plans ...................................................................................................... 117
15.11 Interaction between the Underground and Open Pit Operations ....................... 120
15.12 Open Pit Mineral Reserve Statement ................................................................ 122
15.13 Mineral Reserve Statement ............................................................................... 123
16 MINING METHODS ...................................................................................................... 125
16.1 Introduction ......................................................................................................... 125
16.2 Open Cut Mining Methods .................................................................................. 126
16.2.1 Introduction ...................................................................................................... 126
16.2.2 Operating Hours .............................................................................................. 127
16.2.3 Drill and Blast ................................................................................................... 128
16.2.4 Load and Haul ................................................................................................. 130
16.2.5 Loss and Dilution ............................................................................................. 131
16.2.6 Ore Haulage, Crushing, Stockpiling ................................................................. 131
16.2.7 Waste Dumps .................................................................................................. 132
16.2.8 Open Cut Dewatering ...................................................................................... 134
16.2.9 Open Pit Mining Fleet ...................................................................................... 134
16.3 Labour, Open Pit and Underground .................................................................... 135
16.4 Geotechnical ....................................................................................................... 136
16.4.1 Rock Mechanics .............................................................................................. 137
16.5.1 Hydrogeology / Mine Dewatering Concept ....................................................... 141
16.5.2 Waste Dump Design ........................................................................................ 141
16.5.3 Civil Geotechnical ............................................................................................ 142
16.5.4 Recommendations ........................................................................................... 142
17 RECOVERY METHODS ............................................................................................... 143
17.1 Existing Site Plants ............................................................................................. 143
17.1.1 Huatailong No. 1 Plant ..................................................................................... 143
17.1.2 Pilot Plant ........................................................................................................ 145
17.1.3 Huatailong No.2 New Mineral Processing Plant ............................................... 147
17.2 CAPEX and OPEX .............................................................................................. 148
17.1.4 OPEX Process Plant ........................................................................................ 149
17.1.5 Capital Cost – Process Plant ........................................................................... 150
18 PROJECT INFRASTRUCTURE .................................................................................... 152
18.1 Introduction ......................................................................................................... 152
18.2 Mining Facilities .................................................................................................. 152
18.2.1 Mining Equipment Workshop ........................................................................... 154
18.2.2 Building area .................................................................................................... 154
P:\1870_G\3725_Final_Signed_20140130
JIAMA PHASE 2 EXPANSION PROJECT
CHINA GOLD INTERNATIONAL
18.3 Access Roads and Transportation ...................................................................... 155
18.3.1 Road Access .................................................................................................... 155
18.3.2 Transportation .................................................................................................. 156
18.4 Waste Dumps ..................................................................................................... 156
18.5 Water Supply and Drainage ................................................................................ 157
18.5.1 Water Consumption ......................................................................................... 157
18.6 Power ................................................................................................................. 159
18.6.1 Power Supply ................................................................................................... 159
18.7 Heating, Ventilation ............................................................................................. 160
18.7.1 Heating ............................................................................................................ 160
18.7.2 Ventilation and Dust ......................................................................................... 161
18.7.3 Processing Plant .............................................................................................. 161
18.7.4 Mining Workshop ............................................................................................. 162
18.8 Tailing Storage Facility ........................................................................................ 163
18.9 Site Selection ...................................................................................................... 163
18.10 Dam Design ...................................................................................................... 164
18.11 Dam Stability Analysis ...................................................................................... 165
19 MARKET STUDIES AND CONTRACTS ....................................................................... 166
19.1 Introduction ......................................................................................................... 166
19.2 Copper ................................................................................................................ 166
19.2.1 Forecast of Copper Supply and Demand ......................................................... 166
19.2.2 Copper Price .................................................................................................... 168
19.3 Molybdenum ....................................................................................................... 170
19.3.1 Usage of Molybdenum ..................................................................................... 170
19.3.2 Supply-Demand Situation in Molybdenum Market ............................................ 170
19.4 Analysis on the Prices of Gold, Silver, Lead and Zinc ......................................... 174
19.4.1 Gold Price ........................................................................................................ 174
19.4.2 Silver Price....................................................................................................... 174
19.4.3 Lead Price........................................................................................................ 175
19.4.4 Zinc Price ......................................................................................................... 176
20 ENVIRONMENTAL STUDIES, PERMITTING, AND SOCIAL OR COMMUNITY IMPACT ..
...................................................................................................................................... 177
20.1 Environmental Approvals .................................................................................... 178
20.2 Corporate Policy ................................................................................................. 179
20.3 Corporate Guidance ............................................................................................ 180
20.4 Corporate Environmental Activities ..................................................................... 182
20.5 Environmental Protection .................................................................................... 183
20.6 Community and Social ........................................................................................ 184
20.6.1 Policies and Agreements ................................................................................. 184
21 CAPITAL AND OPERATING COSTS ........................................................................... 187
21.1 Introduction ......................................................................................................... 187
P:\1870_G\3725_Final_Signed_20140130
JIAMA PHASE 2 EXPANSION PROJECT
CHINA GOLD INTERNATIONAL
21.2 Scope of Estimate ............................................................................................... 187
21.3 Estimate Accuracy .............................................................................................. 187
21.4 Capital Cost Estimate ......................................................................................... 187
21.5 Operating Cost Estimate ..................................................................................... 189
21.5.1 Open Pit Mining ............................................................................................... 189
21.5.2 Underground Mining ........................................................................................ 191
21.5.3 Cost of Mining Ore ........................................................................................... 193
21.5.4 Labour ............................................................................................................. 194
21.6 Processing Plant Operating Costs ...................................................................... 194
21.7 Overheads and Fixed Costs ................................................................................ 195
21.8 Summary of Operating Costs .............................................................................. 195
21.9 Conclusion of Capital and Operating Costs ......................................................... 196
22 ECONOMIC ANALYSIS................................................................................................ 197
22.1 Introduction ......................................................................................................... 197
22.2 Parameters ......................................................................................................... 197
22.2.1 Discount Rate .................................................................................................. 197
22.2.2 Metal Price ....................................................................................................... 198
21.2.3 Taxes and Royalties ........................................................................................ 198
22.3 Metal Production and Revenues ......................................................................... 198
22.4 Taxes & Royalties ............................................................................................... 200
22.5 Cashflows ........................................................................................................... 201
22.6 Summary ............................................................................................................ 206
22.7 Sensitivities ......................................................................................................... 207
23 ADJACENT PROPERTIES ........................................................................................... 210
24 OTHER RELEVANT DATA AND INFORMATION ........................................................ 211
25 INTERPRETATION AND CONCLUSIONS ................................................................... 212
26 RECOMMENDATIONS ................................................................................................. 214
27 REFERENCES .............................................................................................................. 215
28 SIGNATURE PAGE ...................................................................................................... 217
P:\1870_G\3725_Final_Signed_20140130
JIAMA PHASE 2 EXPANSION PROJECT
CHINA GOLD INTERNATIONAL
TABLE INDEX
Table 1-1: Composite Files – Domain Statistics ....................................................................... iii
Table 1-2: Mineral Resource Statement .................................................................................. iv
Table 1-3: Mineral Reserve Estimate ....................................................................................... v
Table 1-4: Optimisation Parameters Study .............................................................................. vi
Table 1-5: Copper Equivalent Mill and Smelter Recoveries ................................................... viii
Table 1-6: Copper Equivalent Cut-off by Underground Mining Method .................................. viii
Table 1-7: Pit Design Criteria .................................................................................................. ix
Table 1-8: Estimated Capital Costs ........................................................................................ xiii
Table 1-9: Summary of Operating Costs ................................................................................ xiii
Table 1-10: Summary Economic Analysis .............................................................................. xiv
Table 2-1: Abbreviations .......................................................................................................... 2
Table 2-2: Technical Reporting Responsibilities....................................................................... 3
Table 4-1: Jiama Copper Polymetallic Project Mining Licence C5400002010073210070276. 10
Table 4-2: Jiama Copper Polymetallic Project – Mining Licence C5400002011113220119758 ..
............................................................................................................................. 10
Table 4-3: Jiama Copper – Polymetallic Project – Exploration Licence T54520080702010972 ..
............................................................................................................................. 11
Table 4-4: Jiama Copper – Polymetallic Project – Exploration Licence T54520080702010976 ..
............................................................................................................................. 11
Table 12-1: Summary of the Analytical Standards used in 2012 (highlighted in green) .......... 26
Table 13-1: Assay Concentrates ............................................................................................ 34
Table 14-1: Bulk Density Measurement Summary ................................................................. 36
Table 14-2: Drilling Statistics .................................................................................................. 39
Table 14-3: Composite Files – Domain Statistics ................................................................... 44
Table 14-4: High Grade Top Cuts Applied – Skarn Domain ................................................... 44
Table 14-5: Block Model Summary ........................................................................................ 47
Table 14-6: Block Model Attributes ........................................................................................ 47
Table 14-7: Interpreted Skarn Variography Parameters ......................................................... 49
Table 14-8: Block Model Search Parameters ......................................................................... 50
Table 14-9: Mineral Resource Statement ............................................................................... 52
P:\1870_G\3725_Final_Signed_20140130
JIAMA PHASE 2 EXPANSION PROJECT
CHINA GOLD INTERNATIONAL
Table 15-1: Underground Mineral Reserve Estimate.............................................................. 57
Table 15-2: Commodity Price Assumptions ........................................................................... 57
Table 15-3: Total Underground Mine Reserve ....................................................................... 59
Table 15-4: Equipment Selection for Train System in Level 4450m and 4400m ..................... 66
Table 15-5: Ventsim Results showing Air Flow and Resistance ............................................. 69
Table 15-6: Underground Mining Methods ............................................................................. 73
Table 15-7: Copper Equivalent Mill and Smelter Recoveries .................................................. 79
Table 15-8: Copper Equivalent Cut-off by Underground Mining Method................................. 79
Table 15-9: Underground Start of Mine Schedule .................................................................. 86
Table 15-10: Underground Life of Mine Schedule .................................................................. 87
Table 15-11: Whittle Optimisation Process ............................................................................ 89
Table 15-12: Processing Costs by Ore Type .......................................................................... 90
Table 15-13: Smelter Returns by Commodity ........................................................................ 90
Table 15-14: Optimisation Parameters Summary ................................................................... 93
Table 15-15: Jiaoyan Pit Optimisation Result Comparison ..................................................... 95
Table 15-16: South Pit Optimisation Result Comparison ........................................................ 95
Table 15-17: Jiaoyan Pit Shell Quantities ............................................................................... 98
Table 15-18: Pit Shell Quantities .......................................................................................... 100
Table 15-19: Pit Design Criteria ........................................................................................... 101
Table 15-20: Jiaoyan Pit – Whittle Evaluation Results ......................................................... 103
Table 15-21: South Pit – Whittle Evaluation Results ............................................................ 104
Table 15-22: Jiaoyan Pit Whittle Evaluation vs Copper Equivalent Comparison ................... 110
Table 15-23: South Pit Whittle Evaluation vs Copper Equivalent Comparison ..................... 110
Table 15-24: Jiaoyan Pit Mining Schedule ........................................................................... 114
Table 15-25: South Pit Life of Mine Schedule, Part 1 ........................................................... 115
Table 15-26: South Pit Life of Mine Schedule, Part 2 ........................................................... 116
Table 15-27: Mineral Reserve Statement ............................................................................. 123
Table 16-1: Timeline of Mining Areas ................................................................................... 125
Table 16-2: Open Pit Mining Quantities ............................................................................... 127
P:\1870_G\3725_Final_Signed_20140130
JIAMA PHASE 2 EXPANSION PROJECT
CHINA GOLD INTERNATIONAL
Table 16-3: Drill Calculations for Stripping ........................................................................... 129
Table 16-4: 165 mm diameter Drill Calculations ................................................................... 130
Table 16-5: Open Pit – Ore Haulage, Crushing and Stockpiling Summary ........................... 132
Table 16-6: Waste Dump Capacities .................................................................................... 134
Table 16-7: Estimated Open Pit Mining Fleet ....................................................................... 135
Table 17-1: Skarn Copper Lead-Zinc Ore Performance Design Criteria ............................... 145
Table 17-2: SKARN Performance Design Criteria ................................................................ 147
Table 17-3: Hornfels Performance Design Criteria ............................................................... 147
Table 18-1: Gravel Roads .................................................................................................... 155
Table 18-2: Roads in Processing Plant Area ........................................................................ 156
Table 18-3: Water Consumption .......................................................................................... 157
Table 18-4: Breakdown of Waste Consumption in Processing ............................................. 157
Table 18-5: Total Electricity Load – Stage II Additional Load Summary ............................... 160
Table 18-6: Electricity Load – Total in Mining Areas after Expansion ................................... 160
Table 18-7: Dust Collection System ..................................................................................... 162
Table 18-8: Results of Taillings Dam Assessment ............................................................... 165
Table 21-1: Mining Capital Costs ......................................................................................... 188
Table 21-2: Sustaining Capital ............................................................................................. 188
Table 21-3: Open Cut Contractors and Mining Rates ........................................................... 189
Table 21-4: Total Mining Cost per Cubic Metre .................................................................... 189
Table 21-5: Variable Open Pit Mining Costs Including Incremental Mining Factors .............. 190
Table 21-6: Open Pit Mining Cost Summary ........................................................................ 190
Table 21-7: Underground Mining and Development unit rates ............................................. 192
Table 21-8: Underground Backfill Cost Estimate .................................................................. 192
Table 21-9: Underground Unit Cost per Tonne of Ore .......................................................... 193
Table 21-10: Processing Physicals and Unit Cost ................................................................ 194
Table 21-11: Processing Unit Costs ..................................................................................... 195
Table 21-12: Overheads ...................................................................................................... 195
Table 21-13: Fixed Costs ..................................................................................................... 195
P:\1870_G\3725_Final_Signed_20140130
JIAMA PHASE 2 EXPANSION PROJECT
CHINA GOLD INTERNATIONAL
Table 21-14: Summary of Operating Costs .......................................................................... 195
Table 22-1: Summary of Economic Analysis ........................................................................ 197
Table 22-2: General Parameters .......................................................................................... 197
Table 22-3: Metal Prices ...................................................................................................... 198
Table 22-4: Metallurgical Recoveries by Pit and Ore Type ................................................... 199
Table 22-5: Metal Production and Revenues ....................................................................... 200
Table 22-6: Jiama Phase II Royalties ................................................................................... 200
Table 22-7: Cashflow Summary 2014 - 2023 ....................................................................... 202
Table 22-8: Cashflow Summary 2024 - 2033 ....................................................................... 203
Table 22-9: Cashflow Summary 2034 – 2033 ...................................................................... 204
Table 22-10: Cashflow Summary 2044 - 2049 - End of Mine ............................................... 205
Table 22-11: Economic Analysis Results ............................................................................. 206
Table 22-12: NPV Sensitivity ............................................................................................... 209
Table 25-1: Jiama Project Resource Estimate ..................................................................... 212
Table 25-2: Jiama Project Reserve Estimate ....................................................................... 213
FIGURE INDEX
Figure 1-1: Jiaoyan Pit Optimisation Results
Figure 1-2: South Pit Optimisation Results
Figure 1-3: Jiaoyan Pit Final Design
Figure 1-4: South Pit Final Design
Figure 1-5: CGDI Stopes in Relation to As-built Development
Figure 1-6: Reserve Estimate as at November 2013
Figure 4-1: Location Map of Jiama Project
Figure 4-2: Jiama Phase I Pictures
Figure 4-3: Jiama Mining and Mineral Exploration Licences (projected using the 1954 Beijing
Coordinate System)
Figure 7-1: Simplified Tectonic Map of Tibet (after Burchfiel & Zhilang, 2012)
Figure 7-2: Geology of the Jiama Copper – Polymetallic (projected using the 1954 Beijing
Coordinate System)
P:\1870_G\3725_Final_Signed_20140130
JIAMA PHASE 2 EXPANSION PROJECT
CHINA GOLD INTERNATIONAL
Figure 7-3: Geological Cross-Section along Exploration Line 24
Figure 8-1: Jiama – Modelled Geological Domains
Figure 12-1: Variation of Reported Values for Analytical Standards, 2012
Figure 12-2: Variation of Reported Values for Analytical Standards, 2012 continued
Figure 12-3: Correlation Plots of Analytical Results for 2012 Duplicate Samples
Figure 12-4: Blank Analysis with Detection Limits Marked in Red. Au and Ag Detection Limit
0.01 g/t. Cu, Mo, Zn and Pb Detection Limit 0.0001%
Figure 14-1: Hornfels Density Histogram
Figure 14-2: Skarn (Cu/Mo) Density Histogram
Figure 14-3: Skarn (Pb/Zn) Density Histogram
Figure 14-4: Porphyry Density Histogram
Figure 14-5: Raw Sample Lengths Histogram
Figure 14-6: Skarn Cu Composite Date - Histogram
Figure 14-7: Hornfels Cu Composite Data – Histogram
Figure 14-8: Porphyry Cu Composite Data - Histogram
Figure 14-9: Skarn Mo Composite Data – Histogram
Figure 14-10: Hornfels Mo Composite Data - Histogram
Figure 14-11: Porphyry Mo Composite Data - Histogram
Figure 14-12: Cu% Histogram (All Domains)
Figure 14-13: Cu% Log Histogram (All Domains)
Figure 14-14: Mo% Histogram (All Domains)
Figure 14-15: Mo% Log Histogram (All Domains)
Figure 14-16: Variogram – Copper (MMC Report)
Figure 14-17: Variogram – Molybdenum (MMC Report)
Figure 14-18: Skarn Variogram – Copper Validation Variogram
Figure 14-19: Jiama Resource Block Model – Plan View
Figure 15-1: Site General Layout
Figure 15-2: Processing Plant in relation to Mining
Figure 15-3: CGDI Designed Stopes in Relation to As-built Development
Figure 15-4: Development Codes for the CGDI Underground Design (Mine 24D)
P:\1870_G\3725_Final_Signed_20140130
JIAMA PHASE 2 EXPANSION PROJECT
CHINA GOLD INTERNATIONAL
Figure 15-5: GDI Development Design showing Ventilation and Backfill Drives
Figure 15-6: CGDI Stope Design Dimensions
Figure 15-7: CGDI Stope Design Dimensions with Pillar Location
Figure 15-8: CGDI Stoping Cross-section with Mining Sequence
Figure 15-9: CGDI Stoping Cross-section with Mining Sequence for Smaller Western Stopes
Figure 15-10: CGDI Development Design showing Bogging Levels and Rail System (dark
blue)
Figure 15-11: CGDI Development Design within Stoping Areas showing Draw Point and
Orepass Layouts - Eastern Zone
Figure 15-12: CGDI Development Design within Stoping Areas showing Draw Point and
Orepass Layout - Western Zone
Figure 15-13: Simplified Plan of Current CGDI Ventilation Design
Figure 15-14: Ventilation 4,450 mRL
Figure 15-15: Ventilation 4,400 mRL
Figure 15-16: Plan View of Current CGDI Backfill Drives (orange)
Figure 15-17: Underground Mining Methods in Relation to the South Pit – Plan View
Figure 15-18: Underground Mining Methods in Relation to the South Pit - Oblique View
Figure 15-19: Longhole Stoping showing Primary and Secondary Stopes
Figure 15-20: Sub-Level Caving Zone below South Pit
Figure 15-21: Open Stoping with Pillars to the West of South Pit
Figure 15-22: Transverse Open Stoping with Fill to the North of the Long Hole Stoping Area
Figure 15-23: Room and Pillar Zone to the North of the Long Hole Stoping Area
Figure 15-24: CGDI Year 1 Development and Stoping
Figure 15-25: CGDI Year 3 Development and Stoping
Figure 15-26: CGDI Year 5 Development and Stoping
Figure 15-27: CGDI Year 7 Development and Stoping
Figure 15-28: China Gold Life of Mine Design for Jiama Phase II Underground
Figure 15-29: Life of Mine Design for the Jiama Underground showing Schedule Zones
Figure 15-30: Whittle General Conversion Process
Figure 15-31: Jiaoyan Pit Optimisation Results
P:\1870_G\3725_Final_Signed_20140130
JIAMA PHASE 2 EXPANSION PROJECT
CHINA GOLD INTERNATIONAL
Figure 15-32: Jiaoyan Optimal Shell
Figure 15-33: Jiaoyan Optimal Shell
Figure 15-34: South Pit Optimisation Results
Figure 15-35: South Pit Optimal Shell
Figure 15-36: South Pit Optimal Shell
Figure 15-37: Pit Section
Figure 15-38: Jiaoyan Pit Stage 1
Figure 15-39: Jiaoyan Pit Final Design
Figure 15-40: Jiaoyan Pit - All Stages
Figure 15-41: South Pit Stage 1 Design
Figure 15-42: South Pit Stage 2 Design
Figure 15-43: South Pit Stage 3 Design
Figure 15-44: South Pit Final Design
Figure 15-45: South Pit - All Stages
Figure 15-46: Life of Mine Waste Dumps and Pit Designs
Figure 15-47: Open Pit Schedule - Annual Mining Totals
Figure 15-48: Open Cut Mining Schedule – Ore and Waste Totals
Figure 15-49: Open Cut 2015 (Year 2) Stage Plan
Figure 15-50: Open Cut 2017 (Year 4) Stage Plan
Figure 15-51: Open Cut 2023 (Year 10) Stage Plan
Figure 15-52: Life of Mine Stage Plan
Figure 15-53: Final Design Extents for Phase I and Phase II Mining
Figure 15-54: Final Design Extents including Dump Designs and Topography
Figure 15-55: Section of Underground and Open Pit showing Small Pillar between Open Pit
and Underground Designs
Figure 16-1: Picture of Truck and Excavator Operation - Jiama Phase I
Figure 16-2: Pit and Dump Locations
Figure 16-3: Image of Local Terrain and Existing Operation
Figure 16-4: Organisational Template
Figure 16-5: Photos of Existing Niumatang and Tongquinshan Pits

P:\1870_G\3725_Final_Signed_20140130
JIAMA PHASE 2 EXPANSION PROJECT
CHINA GOLD INTERNATIONAL
Figure 17-1: Huatailong 6,500 TPD Plant – Process Flow
Figure 17-2: TPD Pilot Plant – Simplified Process Flow Diagram
Figure 17-3: 43,500 TPD – Simplified Process Flow Diagram
Figure 17-4: Plant Construction Photos
Figure 18-1: Stage 1 Dam Design
Figure 18-2: Tailings Dam Design Overview
Figure 19-1: World Copper Production/Usage for 2007-2012
Figure 19-2: Historical Copper Price 1995-2002
Figure 19-3: Historical Copper Price 2003-2008
Figure 19-4: Historical Copper Price Since 2008
Figure 19-5: Molybdenum Production by Region (International Molybdenum Association,
2013)
Figure 19-6: Molybdenum Demand of Major Consuming Countries/Regions (International
Molybdenum Association, 2013)
Figure 19-7: China's Molybdenum Output, Consumption and Demand Gap (kt) 2005-2011
(Research in China, 2012)
Figure 19-8: Historical Molybdenum Price Since 1997
Figure 19-9: Historical and Predicted Molybdenum Output and Consumption 2010-2015
(Research in China, 2013)
Figure 19-10: Historical Gold Price Since 2003
Figure 19-11: Historical Silver Price
Figure 19-12: Historical Lead Price Since 2003
Figure 19-13: Historical Zinc Price Since 2003
Figure 21-1: Open-Pit Material Movement and Unit Cost
Figure 21-2: Open Pit and Underground Unit Cost of Mining Ore
Figure 22-1: Pre-Tax Cash Flow and Cumulative Cash Flow
Figure 22-2: Post-Tax Cash Flow and Cumulative Cash Flow
Figure 22-3: Post-Tax NPV Sensitivity
P:\1870_G\3725_Final_Signed_20140130 i
JIAMA PHASE 2 EXPANSION PROJECT
CHINA GOLD INTERNATIONAL
1 EXECUTIVE SUMMARY
The Jiama Project is a large polymetallic deposit containing Copper, Molybdenum, Gold, Silver,
Lead and Zinc. Phase I of the Jiama Project commenced commercial production in September
2010 and included the development of the Tongqianshan and Niumatang open cut pits. These
pits currently produce 1.8 Mtpa of ROM feed. The ore from these mines is processed via two
processing plants with current processing capacity of 6,600 tonnes of ore per day.
This technical report incorporates all Resources for the Jiama Project. The Reserve Estimate
considers the Phase II expansion areas which incorporates the Jiaoyan and South Pit open pit
mines as well as the Phase II underground mine. Conventional mining methods have been
proposed for the open pit and underground operations.
This report has been prepared based on the “Feasibility Study for the Phase II Expansion
Project” (The Study), prepared by the Changchun Gold Design Institute (CGDI) in conjunction
with China Gold International (China Gold).
1.1 Property Description and Location
The Jiama Copper-Polymetallic Project (Jiama) is located in Metrokongka County, Tibet
Autonomous Region, the Peoples’ Republic of China. The mine lies approximately 68 km east-
northeast of Lhasa, the capital city of Tibet Autonomous Region.
Huatailong hold two mining licences and two larger adjacent exploration licences in the area.
The Niumatang (73.5 ha) and Jiama (216 ha) mining licences are set in the centre of the Jiama
exploration licence while the Bayi Ranch licence located southwest of the current mining
activities.
Phase II of the Jiama Expansion Project is expected to commence in 2014 and rump up to full
production by the end of 2016 at which time it will be producing 16.5Mtpa of ore. This is an
increase of 250% on current production levels. The expansion will include the development of
two additional open pits (Jiaoyan and South pits) as well as a large underground development.
The Mineral Resource estimate as of April, 2013 is 1,486 million tonnes of metal at > 0.40% Cu.
1.2 Geology and Mineralisation
The Jiama project is located within the Gangdese Yanshanian epi-continental arc on the central
southern portion of the Gangdese-Nianqing Tanggula Terrain. At the tenement scale, rock types
are typically passive epi-continental clastics and carbonates. The stratigraphy is dominated by
marbles and limestones of the Upper Jurassic Duodigou Formation and sandstones, slates and
hornfels belonging to the Lower Cretaceous Linbuzong Formation. Although some mafic and
intermediate to felsic dykes have been mapped in outcrop and drill core, the intrusive granitic
body responsible for the wide spread contact metamorphism and copper-polymetallic
mineralisation is yet to be identified. A number of thrust faults and shears concentrated between
major geological contacts and a large detachment fault (Gliding Nappe Fault) have also been
observed. Locally bedrock units are overlain by unconsolidated Quaternary colluvium and
alluvium.
Three types of Copper-polymetallic mineralisation are recognised in the project area, these
include skarn, hornfels and porphyry hosted deposits.
P:\1870_G\3725_Final_Signed_20140130 ii
JIAMA PHASE 2 EXPANSION PROJECT
CHINA GOLD INTERNATIONAL
The Jiama deposit is a structurally controlled stratiform skarn-type copper-polymetallic system.
The majority of high grade mineralisation is associated with shear zone contacts between the
Duodigou and Linbuzong formations and shear related folding. The zone of mineralisation within
fault hosted skarn alteration measures kilometres in both strike and dip and remains open at
depth to the northeast.
Mineralisation is also associated with granite porphyry dykes intruding the ‘Duodigou Marble’
and observed within the overlying hornfels of the Linbuzong formation. Although both deposit
types are of lower grade than that of the skarn, the hornfels mineralisation may potentially be of
further economic value in the future.
1.3 Mineral Processing and Metallurgical Testing
Sufficient testing has been carried out for plant design and construction to proceed. In the
meantime, process optimization could continue as research and development (R&D), and as
part of a Continuous Improvement Program. This is normal in any plant after commissioning
and could include items described below.
Further metallurgical testing should be carried out on both skarn and hornfels ores to improve
the molybdenum and precious metal recoveries, especially in lower grade ore. Take Skarn
samples from the deeper parts of the orebody underground to confirm recoveries. Test Hornfels
ore from the Jiaoyan pit, to improve copper-molybdenum separation efficiency. Studies should
be made into the molybdenum grade variability in the various ores to optimise the grade and
recovery of molybdenum. Carry out more Copper-Molybdenum selective flotation tests to
optimise the reagent regime, determine molybdenum cut-off grades to help decide whether to
process lower grade molybdenum ores. Set up routine metallurgical testing to optimise process
performance, provide information circuit changes and additions.
1.4 Mineral Resources
The Mineral Resource estimate was independently completed by Runge Pincock Minarco
(RPM) Global dated 12th November 2012. Mining One Pty Ltd (Mining One) was provided with
the block model and all files related to construction of the model. The information contained
within this report is based on information provided to Mining One, which has been verified and
in some instances refined by Mining One. The Resource estimate is based on three
dimensional geological and mineralisation models that were informed by the drill hole data set.
The Resource is based on three main geological domains that represent Skarn, Hornfels and
Porphyry lithologies; mineralisation is hosted within each of these domains. Domain boundaries
were constructed using a combination of the geology domains and a 0.1% Cu equivalent cut –
off for the mineralisation. Standard wireframing procedures were used in relation to
extrapolation of polygons half the drill spacing distance past known data points and tapering of
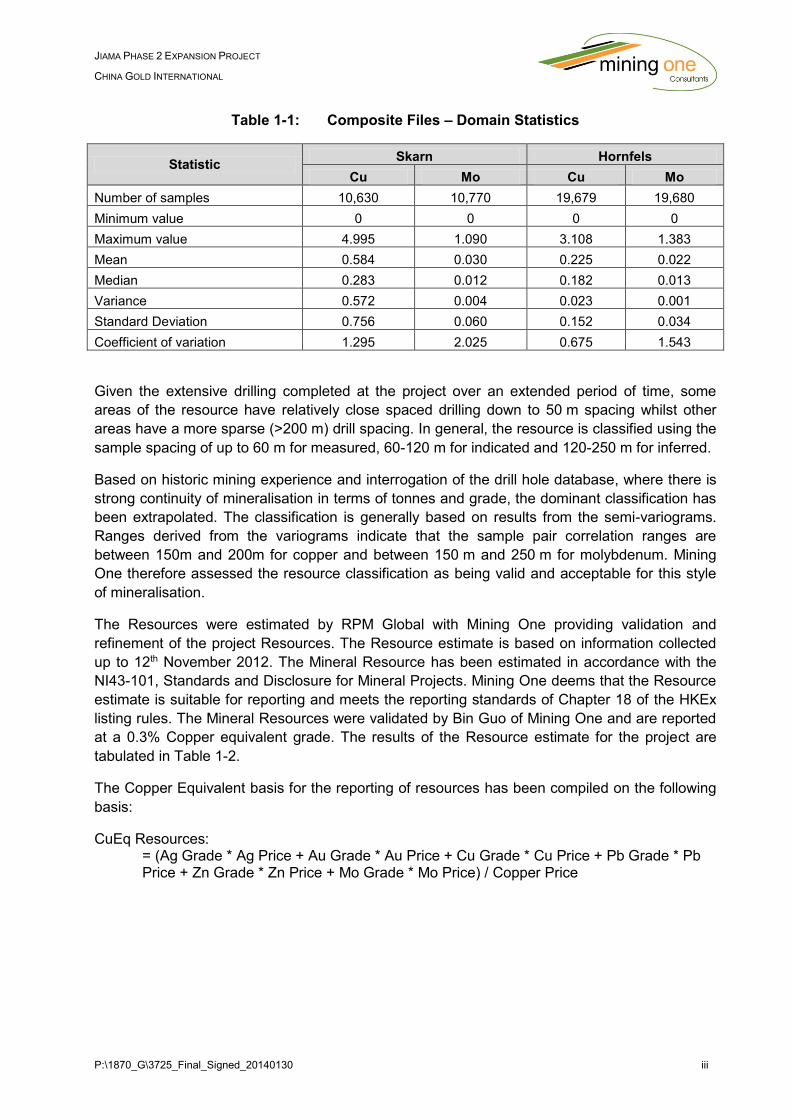
zone thickness on the periphery of the domains. Table 1-1 shows the domain statistics.
P:\1870_G\3725_Final_Signed_20140130 iii
JIAMA PHASE 2 EXPANSION PROJECT
CHINA GOLD INTERNATIONAL
Table 1-1: Composite Files – Domain Statistics
Statistic Skarn Hornfels
Cu Mo Cu Mo
Number of samples 10,630 10,770 19,679 19,680
Minimum value 0 0 0 0
Maximum value 4.995 1.090 3.108 1.383
Mean 0.584 0.030 0.225 0.022
Median 0.283 0.012 0.182 0.013
Variance 0.572 0.004 0.023 0.001
Standard Deviation 0.756 0.060 0.152 0.034
Coefficient of variation 1.295 2.025 0.675 1.543
Given the extensive drilling completed at the project over an extended period of time, some
areas of the resource have relatively close spaced drilling down to 50 m spacing whilst other
areas have a more sparse (>200 m) drill spacing. In general, the resource is classified using the
sample spacing of up to 60 m for measured, 60-120 m for indicated and 120-250 m for inferred.
Based on historic mining experience and interrogation of the drill hole database, where there is
strong continuity of mineralisation in terms of tonnes and grade, the dominant classification has
been extrapolated. The classification is generally based on results from the semi-variograms.
Ranges derived from the variograms indicate that the sample pair correlation ranges are
between 150m and 200m for copper and between 150 m and 250 m for molybdenum. Mining
One therefore assessed the resource classification as being valid and acceptable for this style
of mineralisation.
The Resources were estimated by RPM Global with Mining One providing validation and
refinement of the project Resources. The Resource estimate is based on information collected
up to 12th November 2012. The Mineral Resource has been estimated in accordance with the
NI43-101, Standards and Disclosure for Mineral Projects. Mining One deems that the Resource
estimate is suitable for reporting and meets the reporting standards of Chapter 18 of the HKEx
listing rules. The Mineral Resources were validated by Bin Guo of Mining One and are reported
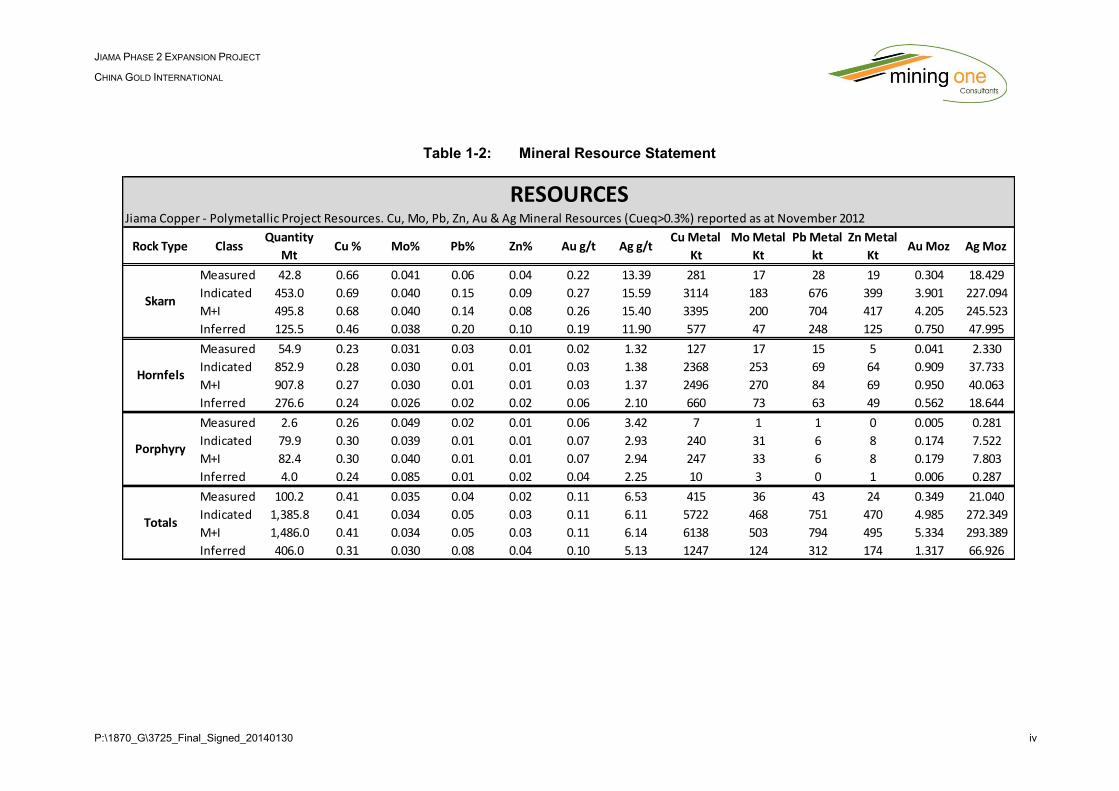
at a 0.3% Copper equivalent grade. The results of the Resource estimate for the project are
tabulated in Table 1-2.
The Copper Equivalent basis for the reporting of resources has been compiled on the following
basis:
CuEq Resources: = (Ag Grade * Ag Price + Au Grade * Au Price + Cu Grade * Cu Price + Pb Grade * Pb Price + Zn Grade * Zn Price + Mo Grade * Mo Price) / Copper Price
P:\1870_G\3725_Final_Signed_20140130 iv
JIAMA PHASE 2 EXPANSION PROJECT
CHINA GOLD INTERNATIONAL
Table 1-2: Mineral Resource Statement
Jiama Copper - Polymetallic Project Resources. Cu, Mo, Pb, Zn, Au & Ag Mineral Resources (Cueq>0.3%) reported as at November 2012
Measured 42.8 0.66 0.041 0.06 0.04 0.22 13.39 281 17 28 19 0.304 18.429
Indicated 453.0 0.69 0.040 0.15 0.09 0.27 15.59 3114 183 676 399 3.901 227.094
M+I 495.8 0.68 0.040 0.14 0.08 0.26 15.40 3395 200 704 417 4.205 245.523
Inferred 125.5 0.46 0.038 0.20 0.10 0.19 11.90 577 47 248 125 0.750 47.995
Measured 54.9 0.23 0.031 0.03 0.01 0.02 1.32 127 17 15 5 0.041 2.330
Indicated 852.9 0.28 0.030 0.01 0.01 0.03 1.38 2368 253 69 64 0.909 37.733
M+I 907.8 0.27 0.030 0.01 0.01 0.03 1.37 2496 270 84 69 0.950 40.063
Inferred 276.6 0.24 0.026 0.02 0.02 0.06 2.10 660 73 63 49 0.562 18.644
Measured 2.6 0.26 0.049 0.02 0.01 0.06 3.42 7 1 1 0 0.005 0.281
Indicated 79.9 0.30 0.039 0.01 0.01 0.07 2.93 240 31 6 8 0.174 7.522
M+I 82.4 0.30 0.040 0.01 0.01 0.07 2.94 247 33 6 8 0.179 7.803
Inferred 4.0 0.24 0.085 0.01 0.02 0.04 2.25 10 3 0 1 0.006 0.287
Measured 100.2 0.41 0.035 0.04 0.02 0.11 6.53 415 36 43 24 0.349 21.040
Indicated 1,385.8 0.41 0.034 0.05 0.03 0.11 6.11 5722 468 751 470 4.985 272.349
M+I 1,486.0 0.41 0.034 0.05 0.03 0.11 6.14 6138 503 794 495 5.334 293.389
Inferred 406.0 0.31 0.030 0.08 0.04 0.10 5.13 1247 124 312 174 1.317 66.926
Skarn
Hornfels
Porphyry
Totals
Cu Metal
Kt
RESOURCES
Rock Type ClassQuantity
MtCu % Mo% Pb% Zn% Au g/t Ag g/t
Mo Metal
Kt
Pb Metal
kt
Zn Metal
KtAu Moz Ag Moz
P:\1870_G\3725_Final_Signed_20140130 v
JIAMA PHASE 2 EXPANSION PROJECT
CHINA GOLD INTERNATIONAL
1.5 Mineral Reserve Estimate
The selected mining strategies developed by CGRI (Changchun Gold Design Institute) in
conjunction with China Gold considers conventional truck shovel mining for the Jiaoyan and
South open pits. Various mining methods have been proposed for the Phase II Expansion
Underground Mine with the primary method being Sub Level Stoping with fill
(Primary/Secondary/(Tertiary)).
The reserve estimate for the Jiama underground mine is based on a combination of Sub Level
Open Stoping with Paste fill, Room and Pillar and Cut and Fill. These mining methods are
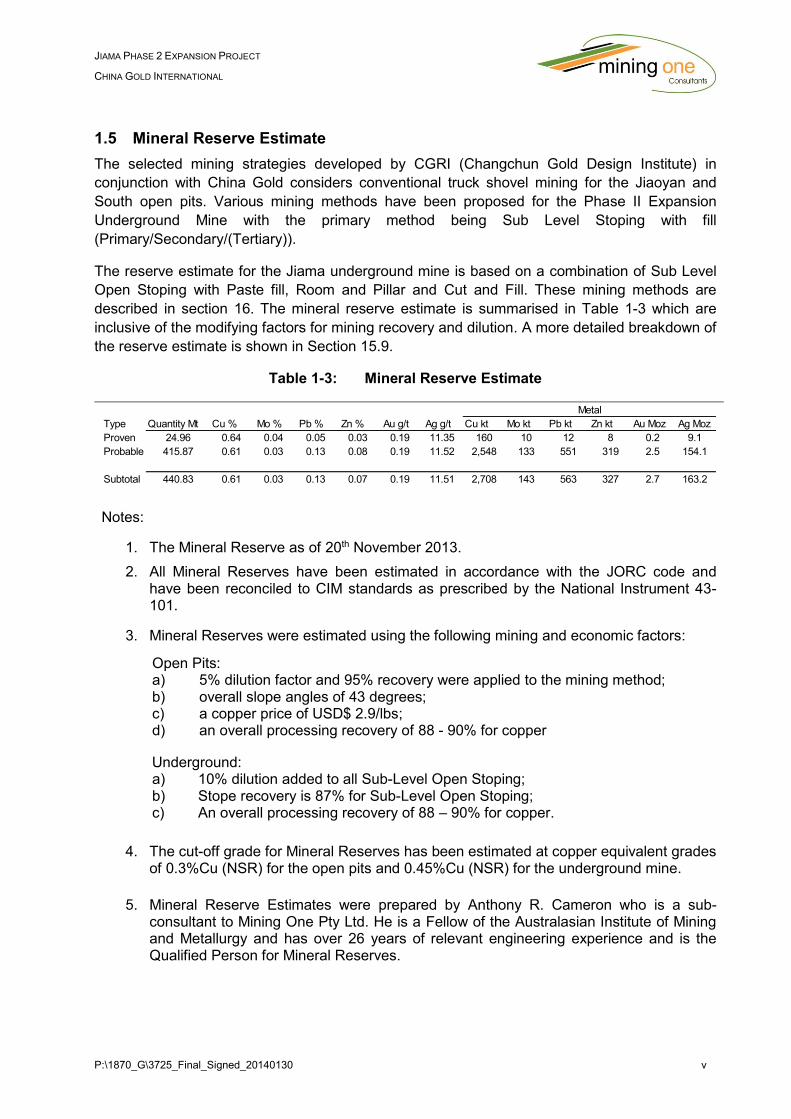
described in section 16. The mineral reserve estimate is summarised in Table 1-3 which are
inclusive of the modifying factors for mining recovery and dilution. A more detailed breakdown of
the reserve estimate is shown in Section 15.9.
Table 1-3: Mineral Reserve Estimate
Notes:
1. The Mineral Reserve as of 20th November 2013.
2. All Mineral Reserves have been estimated in accordance with the JORC code and have been reconciled to CIM standards as prescribed by the National Instrument 43-101.
3. Mineral Reserves were estimated using the following mining and economic factors:
Open Pits: a) 5% dilution factor and 95% recovery were applied to the mining method; b) overall slope angles of 43 degrees; c) a copper price of USD$ 2.9/lbs; d) an overall processing recovery of 88 - 90% for copper
Underground: a) 10% dilution added to all Sub-Level Open Stoping; b) Stope recovery is 87% for Sub-Level Open Stoping; c) An overall processing recovery of 88 – 90% for copper.
4. The cut-off grade for Mineral Reserves has been estimated at copper equivalent grades of 0.3%Cu (NSR) for the open pits and 0.45%Cu (NSR) for the underground mine.
5. Mineral Reserve Estimates were prepared by Anthony R. Cameron who is a sub-consultant to Mining One Pty Ltd. He is a Fellow of the Australasian Institute of Mining and Metallurgy and has over 26 years of relevant engineering experience and is the Qualified Person for Mineral Reserves.
Type Quantity Mt Cu % Mo % Pb % Zn % Au g/t Ag g/t Cu kt Mo kt Pb kt Zn kt Au Moz Ag Moz
Proven 24.96 0.64 0.04 0.05 0.03 0.19 11.35 160 10 12 8 0.2 9.1
Probable 415.87 0.61 0.03 0.13 0.08 0.19 11.52 2,548 133 551 319 2.5 154.1
Subtotal 440.83 0.61 0.03 0.13 0.07 0.19 11.51 2,708 143 563 327 2.7 163.2
Metal
P:\1870_G\3725_Final_Signed_20140130 vi
JIAMA PHASE 2 EXPANSION PROJECT
CHINA GOLD INTERNATIONAL
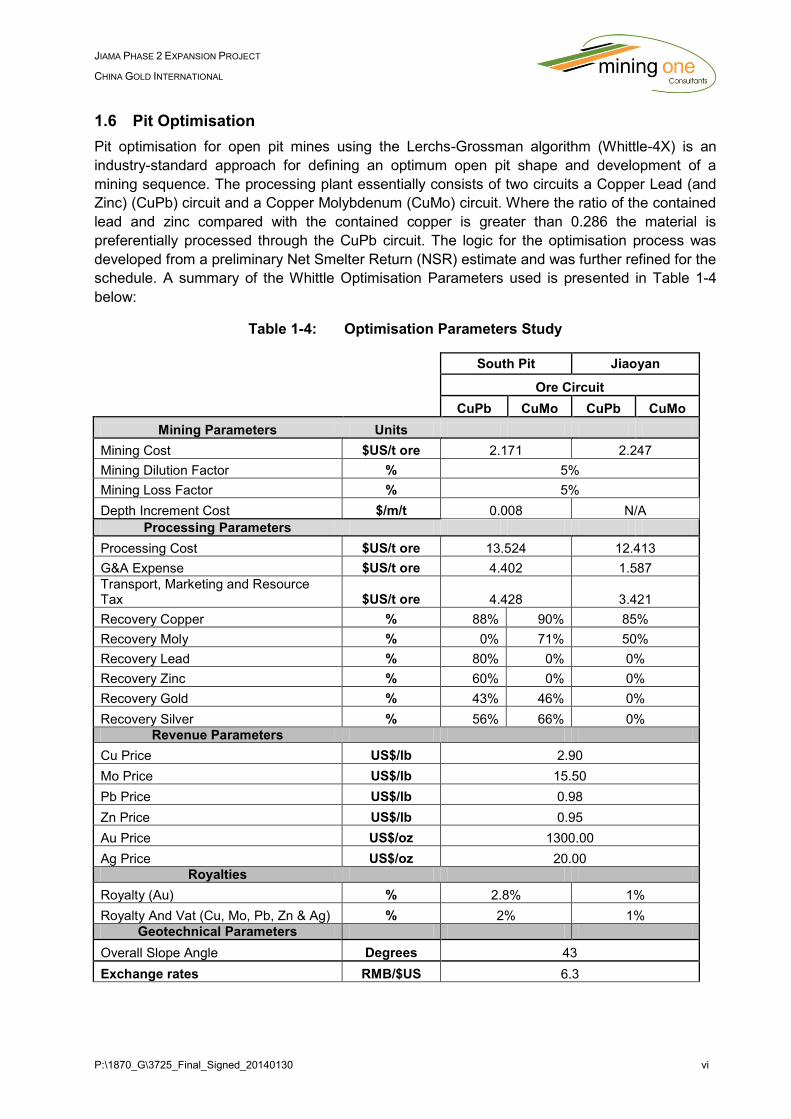
1.6 Pit Optimisation
Pit optimisation for open pit mines using the Lerchs-Grossman algorithm (Whittle-4X) is an
industry-standard approach for defining an optimum open pit shape and development of a
mining sequence. The processing plant essentially consists of two circuits a Copper Lead (and
Zinc) (CuPb) circuit and a Copper Molybdenum (CuMo) circuit. Where the ratio of the contained
lead and zinc compared with the contained copper is greater than 0.286 the material is
preferentially processed through the CuPb circuit. The logic for the optimisation process was
developed from a preliminary Net Smelter Return (NSR) estimate and was further refined for the
schedule. A summary of the Whittle Optimisation Parameters used is presented in Table 1-4
below:
Table 1-4: Optimisation Parameters Study
South Pit Jiaoyan
Ore Circuit
CuPb CuMo CuPb CuMo
Mining Parameters Units
Mining Cost $US/t ore 2.171 2.247
Mining Dilution Factor % 5%
Mining Loss Factor % 5%
Depth Increment Cost $/m/t 0.008 N/A
Processing Parameters
Processing Cost $US/t ore 13.524 12.413
G&A Expense $US/t ore 4.402 1.587
Transport, Marketing and Resource Tax $US/t ore 4.428 3.421
Recovery Copper % 88% 90% 85%
Recovery Moly % 0% 71% 50%
Recovery Lead % 80% 0% 0%
Recovery Zinc % 60% 0% 0%
Recovery Gold % 43% 46% 0%
Recovery Silver % 56% 66% 0%
Revenue Parameters
Cu Price US$/lb 2.90
Mo Price US$/lb 15.50
Pb Price US$/lb 0.98
Zn Price US$/lb 0.95
Au Price US$/oz 1300.00
Ag Price US$/oz 20.00
Royalties
Royalty (Au) % 2.8% 1%
Royalty And Vat (Cu, Mo, Pb, Zn & Ag) % 2% 1%
Geotechnical Parameters
Overall Slope Angle Degrees 43
Exchange rates RMB/$US 6.3

P:\1870_G\3725_Final_Signed_20140130 vii
JIAMA PHASE 2 EXPANSION PROJECT
CHINA GOLD INTERNATIONAL
Figure 1-1: Jiaoyan Pit Optimisation Results
Figure 1-2: South Pit Optimisation Results
Pit designs were prepared using the optimised pit shells as templates. Design software package
Vulcan was used to prepare practical pits incorporating haul roads, ramps and geotechnical
parameters as outlined in The Study. Optimisation results for the Jiaoyan and South Pits are
summarised in Figure 1-1 and Figure 1-2 respectively.
1.7 Underground Mine Shape Optimisation
Datamine’s Mine Shape Optimiser (MSO) was used to provide guidance for the underground
mine design. Generally, MSO generates multiple potentially mineable underground shapes
considering input parameters for stope shapes and a cut-off grade based on the Net Smelter
Return (NSR).
A Copper Equivalent (CuEqUg) field based on a NSR estimate specific to underground mining
and rock-type was added to the block model. Table 1-5 summarises the copper equivalent mill
and smelter recoveries.

P:\1870_G\3725_Final_Signed_20140130 viii
JIAMA PHASE 2 EXPANSION PROJECT
CHINA GOLD INTERNATIONAL
Table 1-5: Copper Equivalent Mill and Smelter Recoveries
Element
Price Mill Recovery % Smelter
Recovery
% Unit USD CuMo
Skarn
CuPbZn
Skarn*
CuMo
Hornfels /
Porphyry
Copper lbs $ 2.90 90% 90% 84% 83.8%
Molybdenum lbs $ 15.50 71% 48% 68.1%
Gold ozs $ 1,300 65% 43% 84.0%
Silver ozs $ 20 70% 56% 77.5%
Lead Tonne $ 2,150 75% 80.0%
Zinc Tonne $ 2,150 65% 65.0%
* Jiaoyan Pit
Skarn:
CuEqUg = (Au Grade * Au Price *Au Mill Recovery * Au Smelter Recovery + Ag Grade * Ag Price * Ag Mill Recovery * Ag Smelter Recovery + Mo Grade * Mo Price * Mo Mill Recovery * Mo Smelter Recovery + Cu Grade * Cu Price * Cu Mill Recovery * Cu Smelter Recovery) / Cu Price
Hornfels / Porphyry:
CuEqUg = (Mo Grade * Mo Price * Mo Mill Recovery * Mo Smelter Recovery + Cu Grade * Cu Price * Cu Mill Recovery * Cu Smelter Recovery) / Cu Price
Table 1-6: Copper Equivalent Cut-off by Underground Mining Method
Cost Parameter Cemented Tailings
Paste Backfill Unit
Cost
Tailings Paste backfill
Unit Cost
No backfill Unit Cost
Currency RMB USD RMB USD RMB USD
Mining ¥ 115.98 $ 18.41 ¥ 95.98 $ 15.23 ¥ 80.86 $ 12.83
Processing ¥ 60.17 $ 9.55 ¥ 60.17 $ 9.55 ¥ 60.17 $ 9.55
G & A ¥ 5.18 $ 0.82 ¥ 5.18 $ 0.82 ¥ 5.18 $ 0.82
Sales/Transport ¥ - $ - ¥ - $ - ¥ - $ -
Total ¥ 181.33 $ 28.78 ¥ 161.33 $ 25.61 ¥ 146.21 $ 23.21
CuEqUg Cut –off* 0.45% 0.40% 0.36%
* Copper Price = $2.9/lb
1.8 Geotechnical Review
Mining One conducted a geotechnical review of the The Study covering the proposed open pits
and underground expansion for the Jiama Polymetallic Mine in Tibet.
An initial review of the geotechnical studies and analyses were completed by Mining One in
June 2013 and subsequently in November 2013. As part of the review, Mining One has
considered the provided technical data and documentation and compared it to the Mining One
requirements and standards for geotechnical open pit and underground studies.
Several methods of stability analysis were carried out including structural analysis, limited
equilibrium and finite element.
P:\1870_G\3725_Final_Signed_20140130 ix
JIAMA PHASE 2 EXPANSION PROJECT
CHINA GOLD INTERNATIONAL
Mining of Phase II will commence in two open pits and an extensive underground mine
including; Jiaoyan Pit, South Pit and the underground mine respectively. The open pits and
underground expansion will be developed simultaneously. The open pits will be separated from
the underground operation by a crown pillar that will be maintained between the base of South
Pit and the upper underground mine. Stope voids will be progressively backfilled beneath the
base of the pit floor to reduce the potential for open pit and underground mine interaction. The
two underground mining methods considered in this area are cut & fill mining and sub-level
caving. The area under the pit is not planned to be mined in the initial 10 years of operation.
The pit should be finished by this time which would make sub-level caving a possible option
here.
The underground and open pit mine designs were developed by the Changchun Gold Design
Institute (CGDI). The geotechnical studies were undertaken by the Changsha Institute of Mining
Research Co Ltd (CIMR) for all mining areas and the waste dumps were designed by CGDI with
contribution from the CIMR. The CIMR Feasibility Study reporting for the geotechnical studies
are referenced in Section 27, which forms part of The Study.
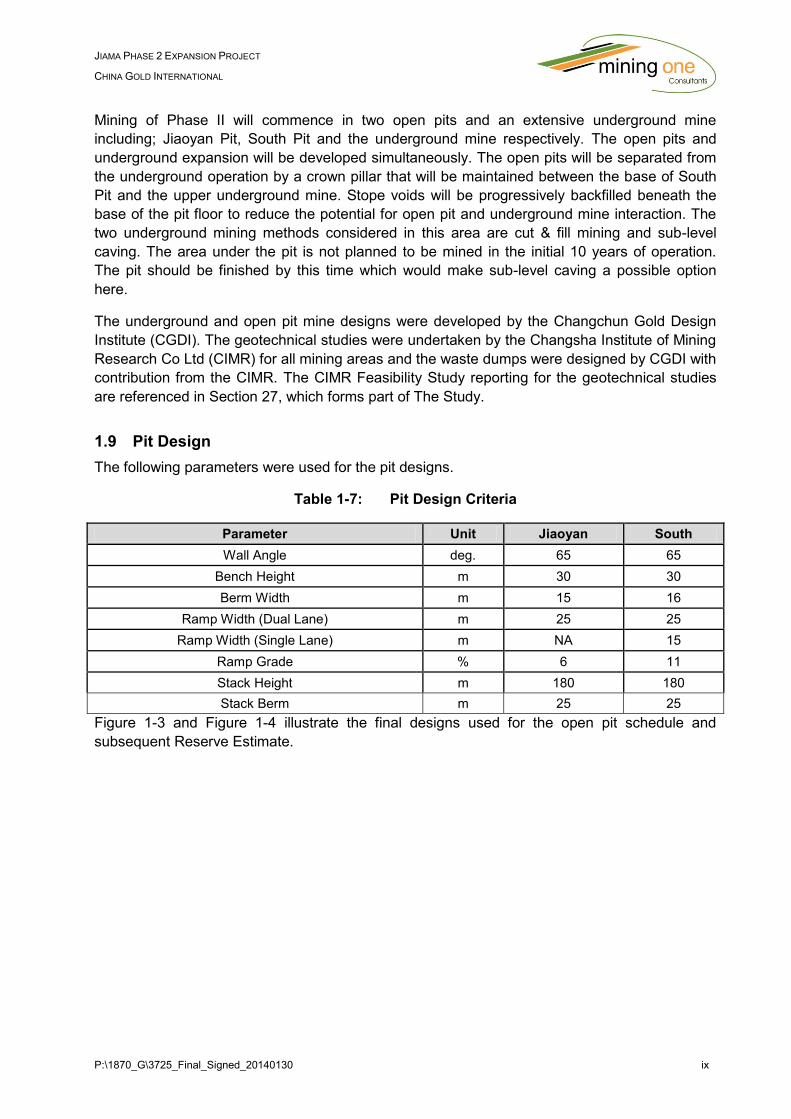
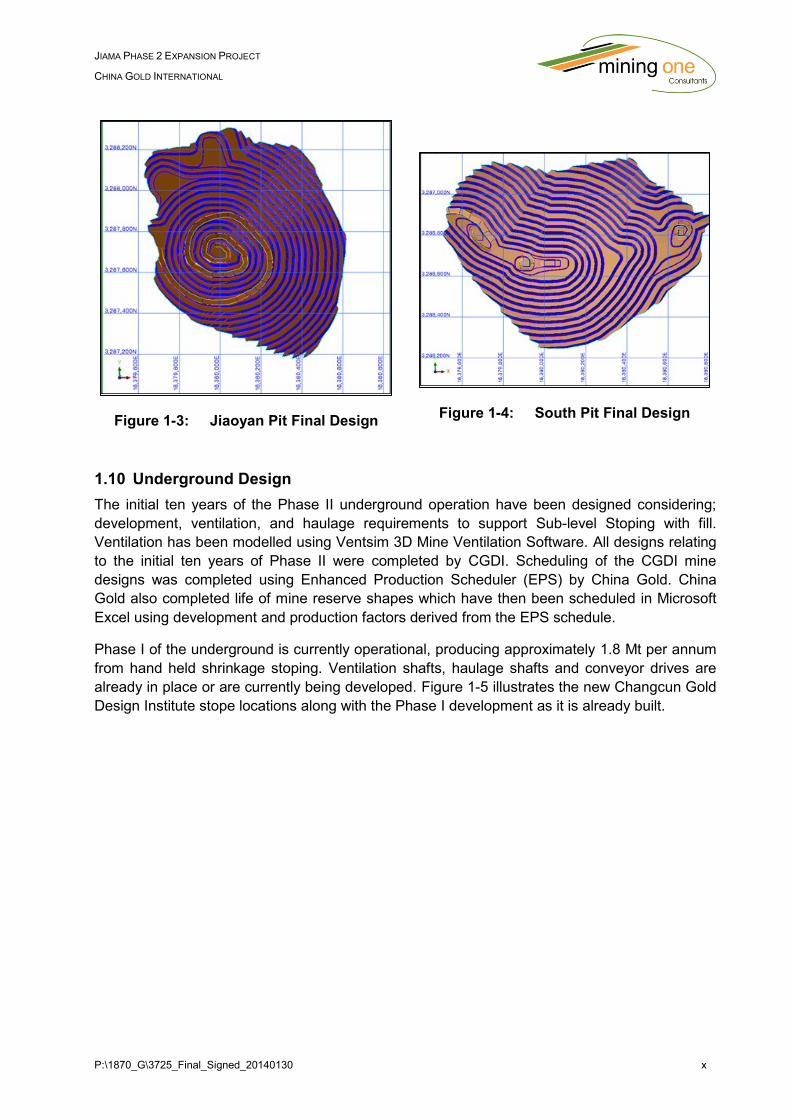
1.9 Pit Design
The following parameters were used for the pit designs.
Table 1-7: Pit Design Criteria
Parameter Unit Jiaoyan South
Wall Angle deg. 65 65
Bench Height m 30 30
Berm Width m 15 16
Ramp Width (Dual Lane) m 25 25
Ramp Width (Single Lane) m NA 15
Ramp Grade % 6 11
Stack Height m 180 180
Stack Berm m 25 25
Figure 1-3 and Figure 1-4 illustrate the final designs used for the open pit schedule and
subsequent Reserve Estimate.
P:\1870_G\3725_Final_Signed_20140130 x
JIAMA PHASE 2 EXPANSION PROJECT
CHINA GOLD INTERNATIONAL
Figure 1-3: Jiaoyan Pit Final Design
Figure 1-4: South Pit Final Design
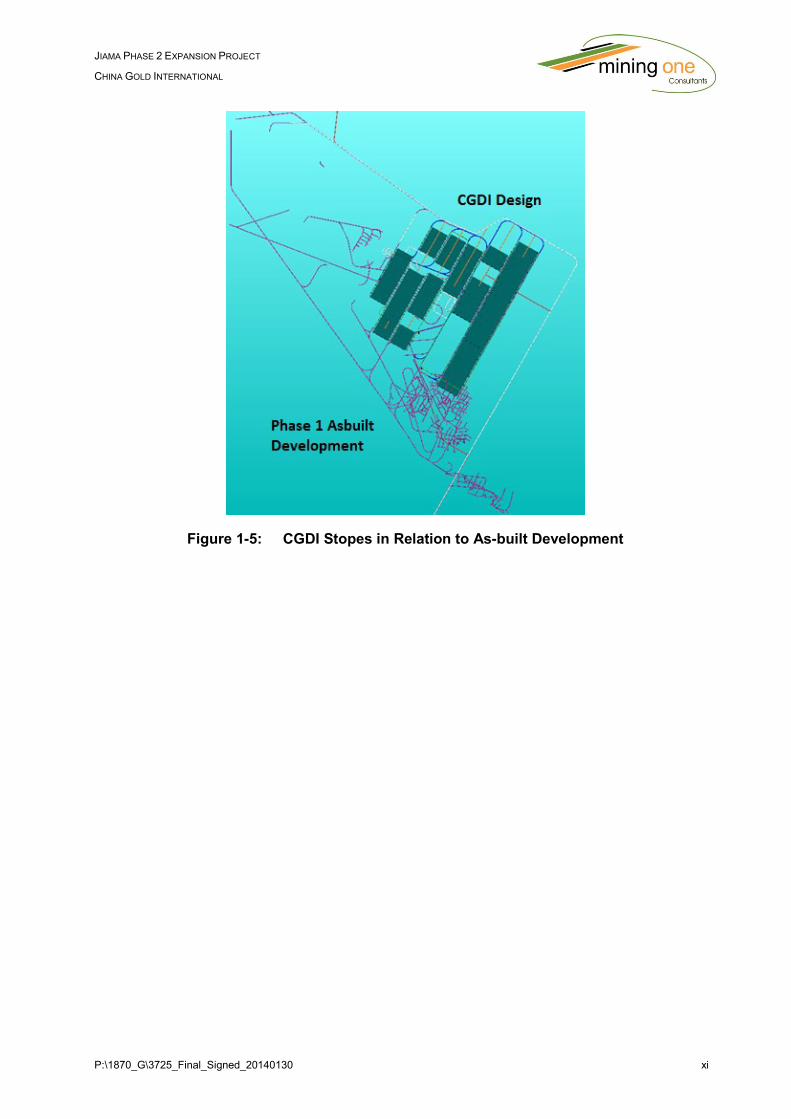
1.10 Underground Design
The initial ten years of the Phase II underground operation have been designed considering;
development, ventilation, and haulage requirements to support Sub-level Stoping with fill.
Ventilation has been modelled using Ventsim 3D Mine Ventilation Software. All designs relating
to the initial ten years of Phase II were completed by CGDI. Scheduling of the CGDI mine
designs was completed using Enhanced Production Scheduler (EPS) by China Gold. China
Gold also completed life of mine reserve shapes which have then been scheduled in Microsoft
Excel using development and production factors derived from the EPS schedule.
Phase I of the underground is currently operational, producing approximately 1.8 Mt per annum
from hand held shrinkage stoping. Ventilation shafts, haulage shafts and conveyor drives are
already in place or are currently being developed. Figure 1-5 illustrates the new Changcun Gold
Design Institute stope locations along with the Phase I development as it is already built.
P:\1870_G\3725_Final_Signed_20140130 xi
JIAMA PHASE 2 EXPANSION PROJECT
CHINA GOLD INTERNATIONAL
Figure 1-5: CGDI Stopes in Relation to As-built Development
P:\1870_G\3725_Final_Signed_20140130 xii
JIAMA PHASE 2 EXPANSION PROJECT
CHINA GOLD INTERNATIONAL
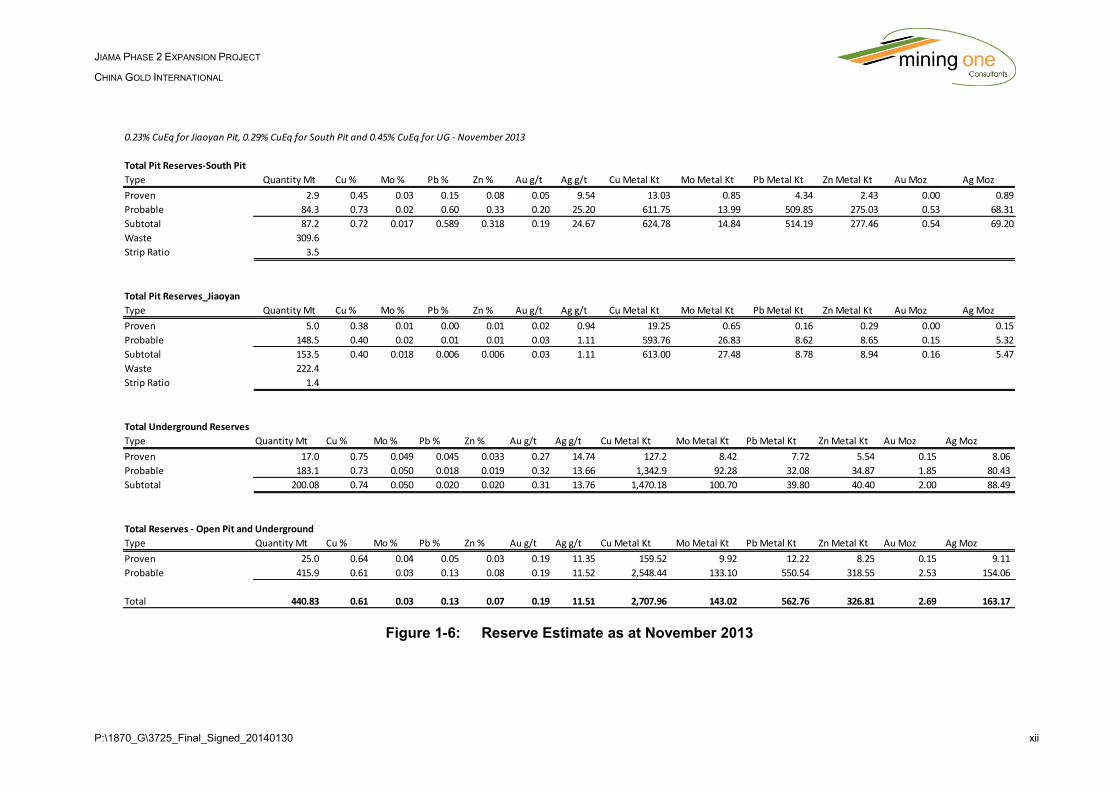
Figure 1-6: Reserve Estimate as at November 2013
0.23% CuEq for Jiaoyan Pit, 0.29% CuEq for South Pit and 0.45% CuEq for UG - November 2013
Total Pit Reserves-South Pit
Type Quantity Mt Cu % Mo % Pb % Zn % Au g/t Ag g/t Cu Metal Kt Mo Metal Kt Pb Metal Kt Zn Metal Kt Au Moz Ag Moz
Proven 2.9 0.45 0.03 0.15 0.08 0.05 9.54 13.03 0.85 4.34 2.43 0.00 0.89
Probable 84.3 0.73 0.02 0.60 0.33 0.20 25.20 611.75 13.99 509.85 275.03 0.53 68.31
Subtotal 87.2 0.72 0.017 0.589 0.318 0.19 24.67 624.78 14.84 514.19 277.46 0.54 69.20
Waste 309.6
Strip Ratio 3.5
Total Pit Reserves_Jiaoyan
Type Quantity Mt Cu % Mo % Pb % Zn % Au g/t Ag g/t Cu Metal Kt Mo Metal Kt Pb Metal Kt Zn Metal Kt Au Moz Ag Moz
Proven 5.0 0.38 0.01 0.00 0.01 0.02 0.94 19.25 0.65 0.16 0.29 0.00 0.15
Probable 148.5 0.40 0.02 0.01 0.01 0.03 1.11 593.76 26.83 8.62 8.65 0.15 5.32
Subtotal 153.5 0.40 0.018 0.006 0.006 0.03 1.11 613.00 27.48 8.78 8.94 0.16 5.47
Waste 222.4
Strip Ratio 1.4
Total Underground Reserves
Type Quantity Mt Cu % Mo % Pb % Zn % Au g/t Ag g/t Cu Metal Kt Mo Metal Kt Pb Metal Kt Zn Metal Kt Au Moz Ag Moz
Proven 17.0 0.75 0.049 0.045 0.033 0.27 14.74 127.2 8.42 7.72 5.54 0.15 8.06
Probable 183.1 0.73 0.050 0.018 0.019 0.32 13.66 1,342.9 92.28 32.08 34.87 1.85 80.43
Subtotal 200.08 0.74 0.050 0.020 0.020 0.31 13.76 1,470.18 100.70 39.80 40.40 2.00 88.49
Total Reserves - Open Pit and Underground
Type Quantity Mt Cu % Mo % Pb % Zn % Au g/t Ag g/t Cu Metal Kt Mo Metal Kt Pb Metal Kt Zn Metal Kt Au Moz Ag Moz
Proven 25.0 0.64 0.04 0.05 0.03 0.19 11.35 159.52 9.92 12.22 8.25 0.15 9.11
Probable 415.9 0.61 0.03 0.13 0.08 0.19 11.52 2,548.44 133.10 550.54 318.55 2.53 154.06
Total 440.83 0.61 0.03 0.13 0.07 0.19 11.51 2,707.96 143.02 562.76 326.81 2.69 163.17
P:\1870_G\3725_Final_Signed_20140130 xiii
JIAMA PHASE 2 EXPANSION PROJECT
CHINA GOLD INTERNATIONAL
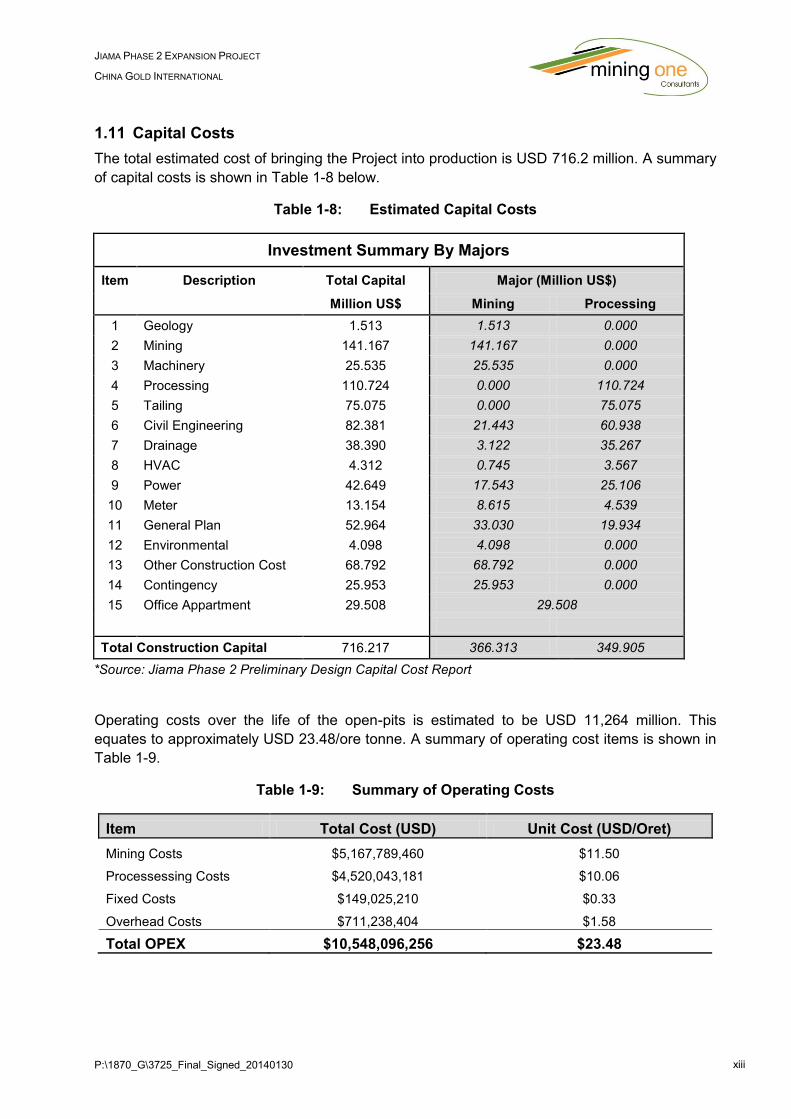
1.11 Capital Costs
The total estimated cost of bringing the Project into production is USD 716.2 million. A summary
of capital costs is shown in Table 1-8 below.
Table 1-8: Estimated Capital Costs
Investment Summary By Majors
Item Description Total Capital Major (Million US$)
Million US$ Mining Processing
1 Geology 1.513 1.513 0.000
2 Mining 141.167 141.167 0.000
3 Machinery 25.535 25.535 0.000
4 Processing 110.724 0.000 110.724
5 Tailing 75.075 0.000 75.075
6 Civil Engineering 82.381 21.443 60.938
7 Drainage 38.390 3.122 35.267
8 HVAC 4.312 0.745 3.567
9 Power 42.649 17.543 25.106
10 Meter 13.154 8.615 4.539
11 General Plan 52.964 33.030 19.934
12 Environmental 4.098 4.098 0.000
13 Other Construction Cost 68.792 68.792 0.000
14 Contingency 25.953 25.953 0.000
15 Office Appartment 29.508 29.508
Total Construction Capital 716.217 366.313 349.905
*Source: Jiama Phase 2 Preliminary Design Capital Cost Report
Operating costs over the life of the open-pits is estimated to be USD 11,264 million. This
equates to approximately USD 23.48/ore tonne. A summary of operating cost items is shown in
Table 1-9.
Table 1-9: Summary of Operating Costs
Item Total Cost (USD) Unit Cost (USD/Oret)
Mining Costs $5,167,789,460 $11.50
Processessing Costs $4,520,043,181 $10.06
Fixed Costs $149,025,210 $0.33
Overhead Costs $711,238,404 $1.58
Total OPEX $10,548,096,256 $23.48
P:\1870_G\3725_Final_Signed_20140130 xiv
JIAMA PHASE 2 EXPANSION PROJECT
CHINA GOLD INTERNATIONAL
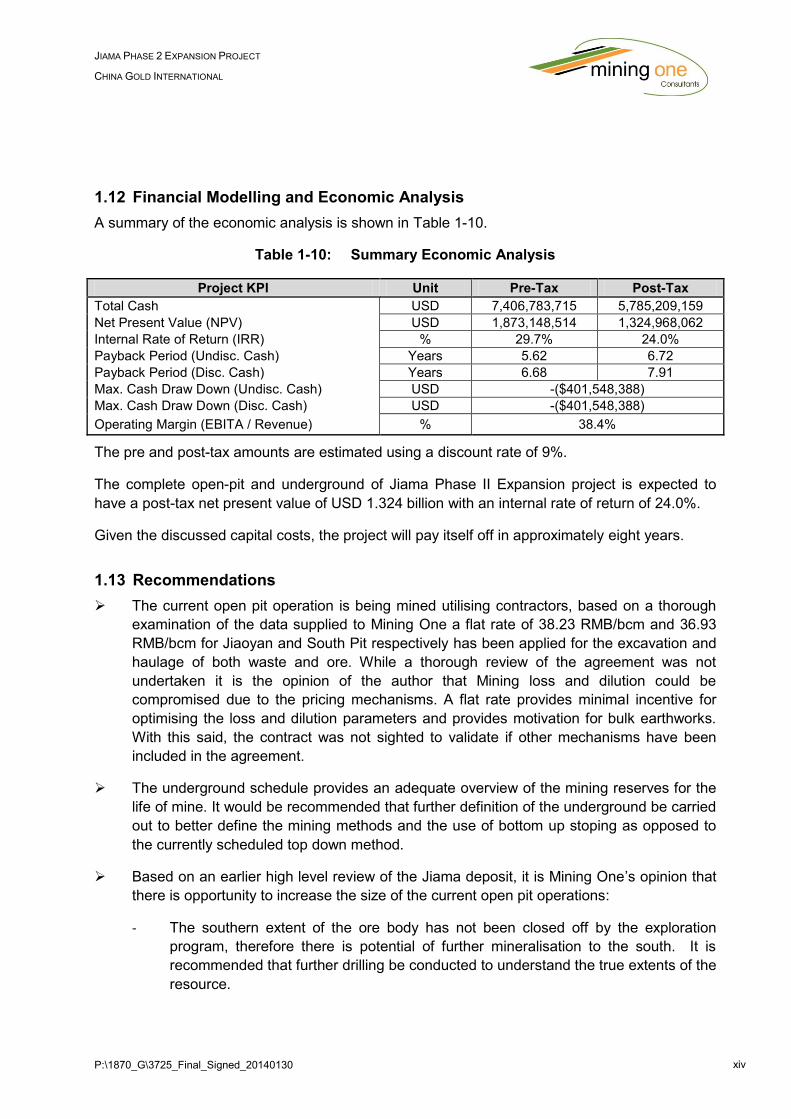
1.12 Financial Modelling and Economic Analysis
A summary of the economic analysis is shown in Table 1-10.
Table 1-10: Summary Economic Analysis
Project KPI Unit Pre-Tax Post-Tax
Total Cash USD 7,406,783,715 5,785,209,159
Net Present Value (NPV) USD 1,873,148,514 1,324,968,062
Internal Rate of Return (IRR) % 29.7% 24.0%
Payback Period (Undisc. Cash) Years 5.62 6.72
Payback Period (Disc. Cash) Years 6.68 7.91
Max. Cash Draw Down (Undisc. Cash) USD -($401,548,388)
Max. Cash Draw Down (Disc. Cash) USD -($401,548,388)
Operating Margin (EBITA / Revenue) % 38.4%
The pre and post-tax amounts are estimated using a discount rate of 9%.
The complete open-pit and underground of Jiama Phase II Expansion project is expected to
have a post-tax net present value of USD 1.324 billion with an internal rate of return of 24.0%.
Given the discussed capital costs, the project will pay itself off in approximately eight years.
1.13 Recommendations
The current open pit operation is being mined utilising contractors, based on a thorough
examination of the data supplied to Mining One a flat rate of 38.23 RMB/bcm and 36.93
RMB/bcm for Jiaoyan and South Pit respectively has been applied for the excavation and
haulage of both waste and ore. While a thorough review of the agreement was not
undertaken it is the opinion of the author that Mining loss and dilution could be
compromised due to the pricing mechanisms. A flat rate provides minimal incentive for
optimising the loss and dilution parameters and provides motivation for bulk earthworks.
With this said, the contract was not sighted to validate if other mechanisms have been
included in the agreement.
The underground schedule provides an adequate overview of the mining reserves for the
life of mine. It would be recommended that further definition of the underground be carried
out to better define the mining methods and the use of bottom up stoping as opposed to
the currently scheduled top down method.
Based on an earlier high level review of the Jiama deposit, it is Mining One’s opinion that
there is opportunity to increase the size of the current open pit operations:
- The southern extent of the ore body has not been closed off by the exploration
program, therefore there is potential of further mineralisation to the south. It is
recommended that further drilling be conducted to understand the true extents of the
resource.
P:\1870_G\3725_Final_Signed_20140130 xv
JIAMA PHASE 2 EXPANSION PROJECT
CHINA GOLD INTERNATIONAL
- Current market prices have been applied to the financial modelling. A number of the
commodities are believed to be reflective of a soft market and therefore there is
opportunity for improvements in the sales revenue if a shift in pricing occurred.
- The current waste management (waste dumps) present a risk to further extension of
the ore body to the south as waste dump #4 is located directly to the south of the
South pit. It is recommended that sterilisation drilling be conducted prior to the
commencement of this and other waste dumps.
Mining and exploration licences are current however the rates of mining that have been
nominated on these licences is below the production rates anticipated from the Phase II
development. It is advisable that these licences be reviewed in line with or above the
current production expectations. This has been noted previously and it is Mining One’s
understanding that new titles will not be issued by the Chinese authorities until the expiry
of the current titles.
P:\1870_G\3725_Final_Signed_20140130 1
JIAMA PHASE 2 EXPANSION PROJECT
CHINA GOLD INTERNATIONAL
2 INTRODUCTION
Mining One Consultants (M1), at the request of China Gold International Resources Corp Ltd
(China Gold), were commissioned to review data as presented in the “Feasibility Study for the
Phase II Expansion Project” (The Study), prepared by the Changchun Gold Design Institute
(CGDI) in conjunction with China Gold International Resource Corp Ltd.
The Study is a focus of the Jiama Polymetallic resource located in Metrorkonga Country of
Tibet. The scope of this study included the preparation of a Mineral Resource and Reserve
Estimate for the Jiama project, specifically related to the Phase II Expansion Project. This
document has been prepared in accordance with the Canadian Securities Administrators’
National Instrument 43-101 (NI 43-101) in accordance with Form 43-101F1 - Guidelines for the
Preparation of Technical Reports.
Mineral Resource and Mineral Reserve estimations have been prepared in accordance with the
Canadian Institute of Mining, Metallurgy and Petroleum (CIM) Definition Standards – On Mineral
Resources and Mineral Reserves (2011) as incorporated by reference NI 43-101.
This report has been prepared by Mining One for use by China Gold management to provide
technical and economic information on the Jiama Phase II Expansion Project. Phase II of the
expansion incorporates two open pits and an underground operation. This report considers both
the proposed open pit and underground operations. This report is submitted on the
understanding that the technical data contained herein has been provided by China Gold and
reviewed by technical professionals who have validated the technical data and assumptions
contained in the respective bodies of work.
2.1 Terms of Reference
China Gold International Resources Corporation Ltd, is a Canadian based gold and copper
producer with two producing mines in China. These mines include the CSH Gold Mine in Inner
Mongolia, and the Jiama Copper-Polymetallic Mine in the Tibet Region. China Gold
International Resources Corporation Ltd, is the only overseas listing vehicle of the largest gold
producer in China and 39% shareholder, China National Gold.
The Jiama project is a large polymetallic deposit containing copper, molybdenum, gold, silver,
lead and zinc. Phase 1 of the Jiama Project commenced commercial production in September
2010 and included the development of the Tongqianshan and Niumatang open cut pits. These
pits currently produce 1.8 Mtpa of ROM feed. The ore from these mines is processed via two
processing plants with a current processing capacity of 6,500 tonnes of ore per day.
This technical report is specific to the Phase II Expansion of the Jiama Project. Phase II
includes the addition of two more open pits namely the Jiaoyan and South complimented by an
underground operation. Conventional mining methods will be adopted for both the open cut pits
which include drill, blast, excavate and haul. Various underground mining methods have been
proposed for the Phase II expansion with the primary mining method proposed being Sub-Level
Open Stoping with Fill (Primary / Secondary/Tertiary).
The reserve estimate for the Jiama underground mine is based on a combination of Sub-Level
Open Stoping with fill, Long Hole Stoping (LHS) with paste fill, Room and Pillar and Cut and Fill.
These mining methods are described in section 16.
P:\1870_G\3725_Final_Signed_20140130 2
JIAMA PHASE 2 EXPANSION PROJECT
CHINA GOLD INTERNATIONAL
The purpose of this report is to provide an estimate of the Mineral Resource and Reserve for
the Phase II expansion project and provide an estimate of the economic value of the operation
considering mining modifying factors, geotechnical constraints, mining methods and
metallurgical characteristics of the deposit.
This technical report is a summary of the Phase II Expansion as prepared by Mining One in
conjunction with China Gold. The Authors of the report were engaged by China Gold to prepare
a technical report in compliance with NI43-101.
Unless otherwise stated, monetary values are in US dollars (USD).
Table 2-1: Abbreviations
Abbreviations Unit or Term
AAS Atomic Absorption Spectrometry.
AES Atomic Emission Spectrometry.
Ag Silver.
Au Gold.
bcm Bank cubic metre
BRIMM Beijing General Research Institute of Mining and Metallurgy.
CAPEX Capital Expenditure
CGDI Changchun Gold Design Institute
China Gold China Gold International Resources Corp Ltd.
CNAL Chinese National Accreditation Board for laboratories.
Cu Copper.
g Grams.
g/t Grams per tonne.
HKEx Hong Kong Stock Exchange.
Huatailong Tibet Huatailong Mining Development Company Ltd (indirectly wholly owned by China Gold International Resources Corporation).
ICSG International Copper Study Group.
lb pound
M1 Mining One Consultants Pty Ltd.
MMC Minarco Mine Consult (Runge) Consultants who prepared the 2011 pre-feasibililty report.
Mo Molybdenum.
MSO Mineable Solid Object.
NI43-101 Canadian Securities Administrators’ National Instrument 43-101.
NPV Net Present Value.
OPEX Operational Expenditure
oz ounce
Pb Lead.
P:\1870_G\3725_Final_Signed_20140130 3
JIAMA PHASE 2 EXPANSION PROJECT
CHINA GOLD INTERNATIONAL
Abbreviations Unit or Term
RPM Runge Pincock Minarco (Global).
RMB Yuan – (¥)
SLC Sub Level Caving.
Southwest Centre Southwestern Metallurgic Geology Analytical Centre.
t tonne
The Study Feasibility Study for the Phase II Expansion Project
QA Quality Assurance.
QC Quality Control.
US United States.
USD United States Dollars ($)
Zn Zinc.
2.2 Author’s Qualifications & Responsibilities
The Jiama Phase I project has been operational since September 2010, operations from both
the Tongqianshan and Niumatang open cut pits provide a substantial level of confidence in the
operational assumptions made in the evaluation of the two new open pit mines as is the case
with the existing underground operations. As a result of this confidence, a single site visit was
conducted to validate the assumptions made for the development of the Jiaoyan and South pits.
Responsibilities for the preparation of certain sections of this Technical Report have been
assigned to individual authors as shown in Table 2-2 of this report and such individual authors
are not responsible for sections of this report other than those indicated in this table.
Table 2-2: Technical Reporting Responsibilities
Report Section Qualified Person Company
1-14 Bin Guo, BSc Geology, MSc Structural
Geology, Ph.D. Exploration Geophysics, AIG,
ASEG, MAusIMM
GL Resources
13, 17 Ron Goodman, Principal Metallurgist, HNC
(Metallurgy), United Kingdom
Mining One Pty
Ltd
1-3, 15-27 Anthony R. Cameron, BE (Mining),
GradDipBus, M Comm Law, FAusIMM
CMC Ltd
Bin Guo is a sub-consultant to Mining One Pty Ltd, he has 13 years’ of industry and academic
experience, with specific expertise in exploration management, 3D integrated geological and
geophysical modelling / targeting and fulfils the requirements to be a QP for the purpose of NI
43-101.
Ron Goodman has more than 40 years in the mining and mineral processing industry, his
positions have included process research and development, equipment development, project
engineering and operations management at senior and executive levels. Ron has extensive
experience in feasibility, due diligence and valuation studies.
P:\1870_G\3725_Final_Signed_20140130 4
JIAMA PHASE 2 EXPANSION PROJECT
CHINA GOLD INTERNATIONAL
Anthony R Cameron is a sub-consultant to Mining One Pty Ltd and is classified as an
independent author. He is a Fellow of the Australasian Institute of Mining and Metallurgy and
has over 26 years of relevant engineering experience and is the Qualified Person for Mineral
Reserves.
Bin Guo visited site on the 14th and 15th of July 2013 and Tony Cameron visited the site on the
29th of April 2012. Jeff Zhang a mining engineer employed by Micromine Consulting Services
was deputised by Tony Cameron and visited site between the 14th and 17th of July 2013.
2.3 Limitations and Exclusions
This technical report has been prepared by the Authors for China Gold and is based, on a
review of The Study prepared by CGRI in conjunction with China Gold for the “Jiama Phase II
Expansion Project”.
The independent Authors have not performed any sampling or assaying, performed any
detailed geological mapping, excavated any trenches, drilled any holes or carried out any
independent exploration work.
P:\1870_G\3725_Final_Signed_20140130 5
JIAMA PHASE 2 EXPANSION PROJECT
CHINA GOLD INTERNATIONAL
3 RELIANCE ON OTHER EXPERTS
This report has been prepared by the Authors for China Gold International Resources Corp Ltd
and is based on the review, analysis, interpretation and conclusions derived from information
that has been made available by China Gold. Additional validation of the data has been
augmented through consultation with current employees of China Gold and consultants who
have been involved with the Jiama Phase II Project.
The independent authors have not performed any sampling or assaying, performed any detailed
geological mapping, excavated any trenches, drilled any holes or carried out any independent
exploration or testing of the proposed mining area.
This technical report has been prepared with assistance of a number of China Gold employees
who have provided local insight to many sections of this report. Their contribution has been
invaluable in defining and validating operational and physical data used for the purpose of this
technical study.
3.1 Agreements, Land Tenure, Surface Rights, Access and Permits
In reference to Sections 4.0 and 20.0, the Authors have not researched property ownership
information such as tenement ownership or status, joint venture agreements, surface access or
mineral rights and, have not independently verified the legal status or ownership of the Property.
In relation to all tenement information, the author has relied on the information as provided by
China Gold.
3.2 Historical Information
Historical information contained within this document has been provided by China Gold.
3.3 Risks Associated with the Valuation or Pricing
The financial model was constructed by Mining One to ascertain the Net Present Value of the
operation. Within this analysis numerous economic and cost assumptions were required in
order that a reasonable pricing estimate was used in valuing the project. While the model is built
on sound financial principles, the quality and accuracy of the model outputs is a function of the
input data. Input cost parameters were provided by China Gold and based on contractual
agreements that are already in place at the operation. The following represents a summary of
the pricing associated with the valuation contained within this report:-
At the time of preparing the report the US dollar to RMB exchange rate was 6.1. This has
been maintained throughout the analysis however is subject to change, based on global
economic conditions.
Contract mining rates for the open cut operations has been set by an agreed contract rate
for each of the mining areas. The Jiaoyan pit has an agreed rate of 38.23 RMB per bcm of
material movement including ore while the South pit has a rate of 36.93 per bcm. This
equates to a cost of US$6.07 and US$5.86 per bcm respectively. The contract rate is a
flat rate for ore and waste.
P:\1870_G\3725_Final_Signed_20140130 6
JIAMA PHASE 2 EXPANSION PROJECT
CHINA GOLD INTERNATIONAL
Current contracts are based on an agreed rate for the initial 10 years of the project, it is
anticipated that mining costs will escalate for the later part of the open pit mining process
so an escalation cost of 0.15 RMB per 5m bench has been included into the cost of
mining the open pit mines. This cost will only take effect below the 5,120 mRL and 5,000
mRL benches for Jiaoyan and South Pits respectively.
The mining rates provided appears reasonable based on experience from other
operations within the Chinese demographic;
Contract tables were provided by China Gold and contained a comprehensive list of
capital items. Validation of these capital items was not conducted by Mining One;
however, the total cost of capital for a project of this size seemed reasonable based on
previous studies.
China Gold supplied a document titled “Jiama Phase II preliminary design capital cost
estimate report” and released in November 2013. This document provided a detailed
breakdown of the capital estimates required for the construction and commissioning of the
Phase II project. This information was referenced for the capital estimate in the NPV
analysis, capital spend was scheduled over the first three years based on estimated
construction time. Plant processing rates have been scheduled to reflect this ramp up in
production.
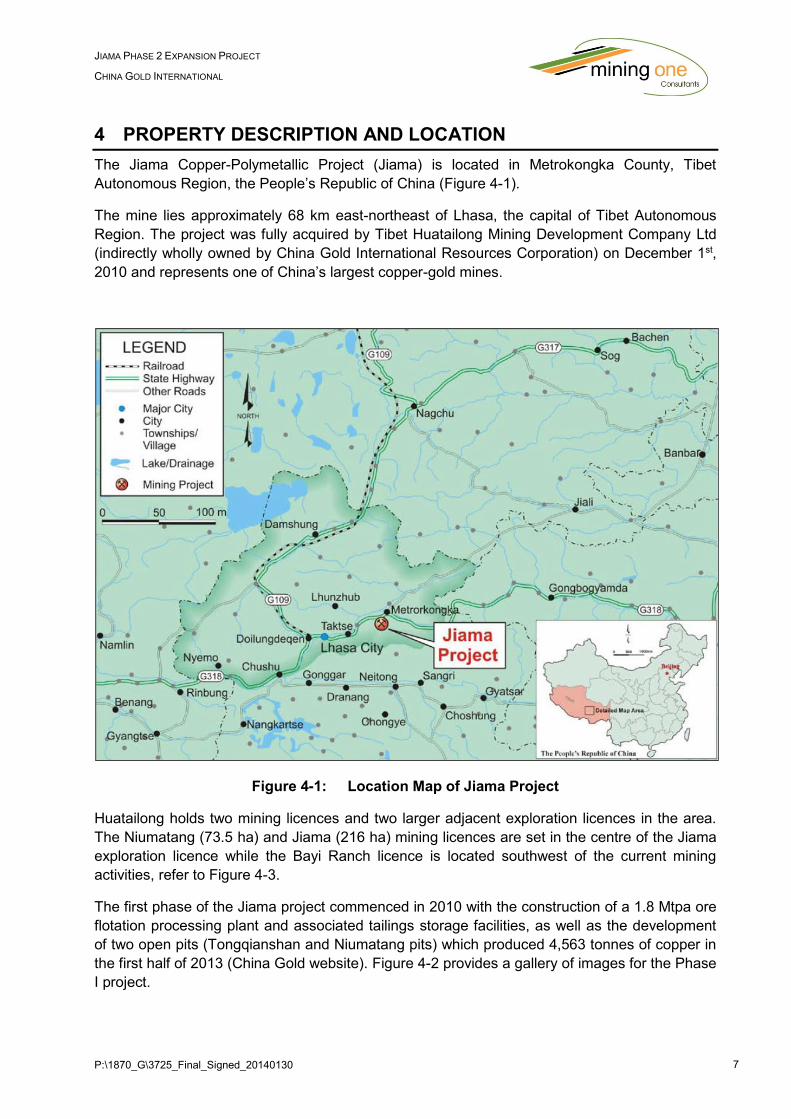
P:\1870_G\3725_Final_Signed_20140130 7
JIAMA PHASE 2 EXPANSION PROJECT
CHINA GOLD INTERNATIONAL
4 PROPERTY DESCRIPTION AND LOCATION
The Jiama Copper-Polymetallic Project (Jiama) is located in Metrokongka County, Tibet
Autonomous Region, the People’s Republic of China (Figure 4-1).
The mine lies approximately 68 km east-northeast of Lhasa, the capital of Tibet Autonomous
Region. The project was fully acquired by Tibet Huatailong Mining Development Company Ltd
(indirectly wholly owned by China Gold International Resources Corporation) on December 1st,
2010 and represents one of China’s largest copper-gold mines.
Figure 4-1: Location Map of Jiama Project
Huatailong holds two mining licences and two larger adjacent exploration licences in the area.
The Niumatang (73.5 ha) and Jiama (216 ha) mining licences are set in the centre of the Jiama
exploration licence while the Bayi Ranch licence is located southwest of the current mining
activities, refer to Figure 4-3.
The first phase of the Jiama project commenced in 2010 with the construction of a 1.8 Mtpa ore
flotation processing plant and associated tailings storage facilities, as well as the development
of two open pits (Tongqianshan and Niumatang pits) which produced 4,563 tonnes of copper in
the first half of 2013 (China Gold website). Figure 4-2 provides a gallery of images for the Phase
I project.
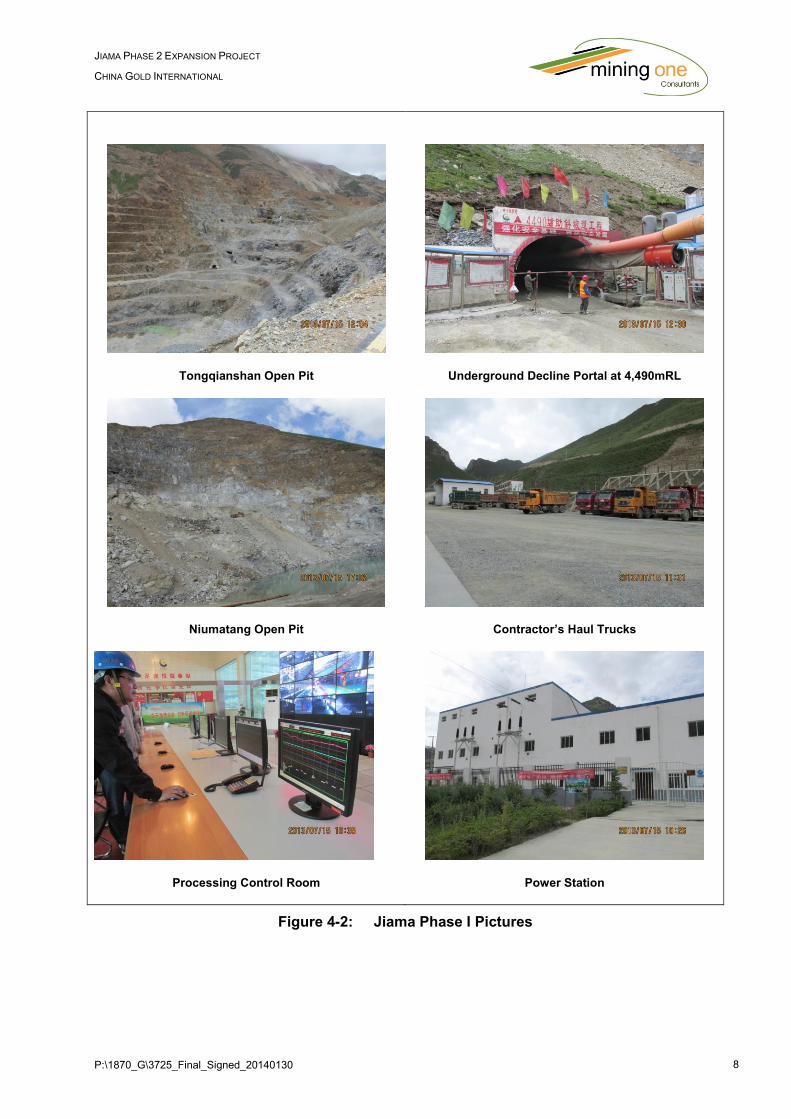
P:\1870_G\3725_Final_Signed_20140130 8
JIAMA PHASE 2 EXPANSION PROJECT
CHINA GOLD INTERNATIONAL
Tongqianshan Open Pit
Underground Decline Portal at 4,490mRL
Niumatang Open Pit
Contractor’s Haul Trucks
Processing Control Room
Power Station
Figure 4-2: Jiama Phase I Pictures
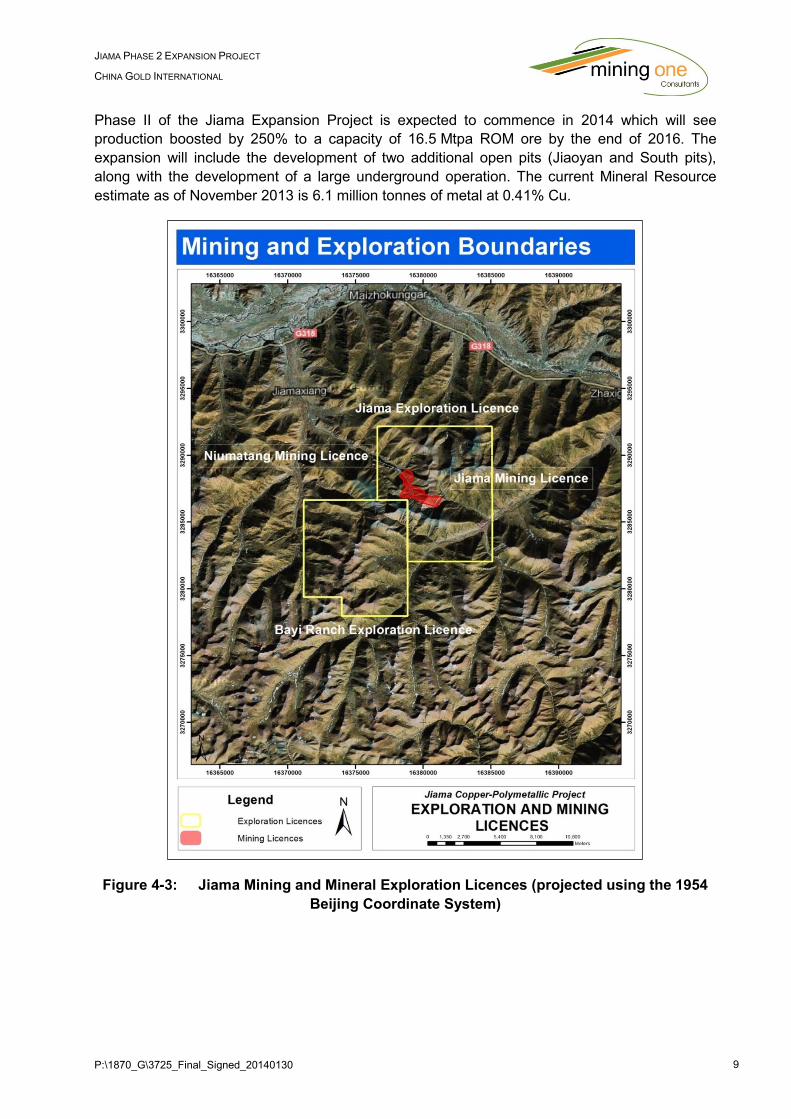
P:\1870_G\3725_Final_Signed_20140130 9
JIAMA PHASE 2 EXPANSION PROJECT
CHINA GOLD INTERNATIONAL
Phase II of the Jiama Expansion Project is expected to commence in 2014 which will see
production boosted by 250% to a capacity of 16.5 Mtpa ROM ore by the end of 2016. The
expansion will include the development of two additional open pits (Jiaoyan and South pits),
along with the development of a large underground operation. The current Mineral Resource
estimate as of November 2013 is 6.1 million tonnes of metal at 0.41% Cu.
Figure 4-3: Jiama Mining and Mineral Exploration Licences (projected using the 1954
Beijing Coordinate System)
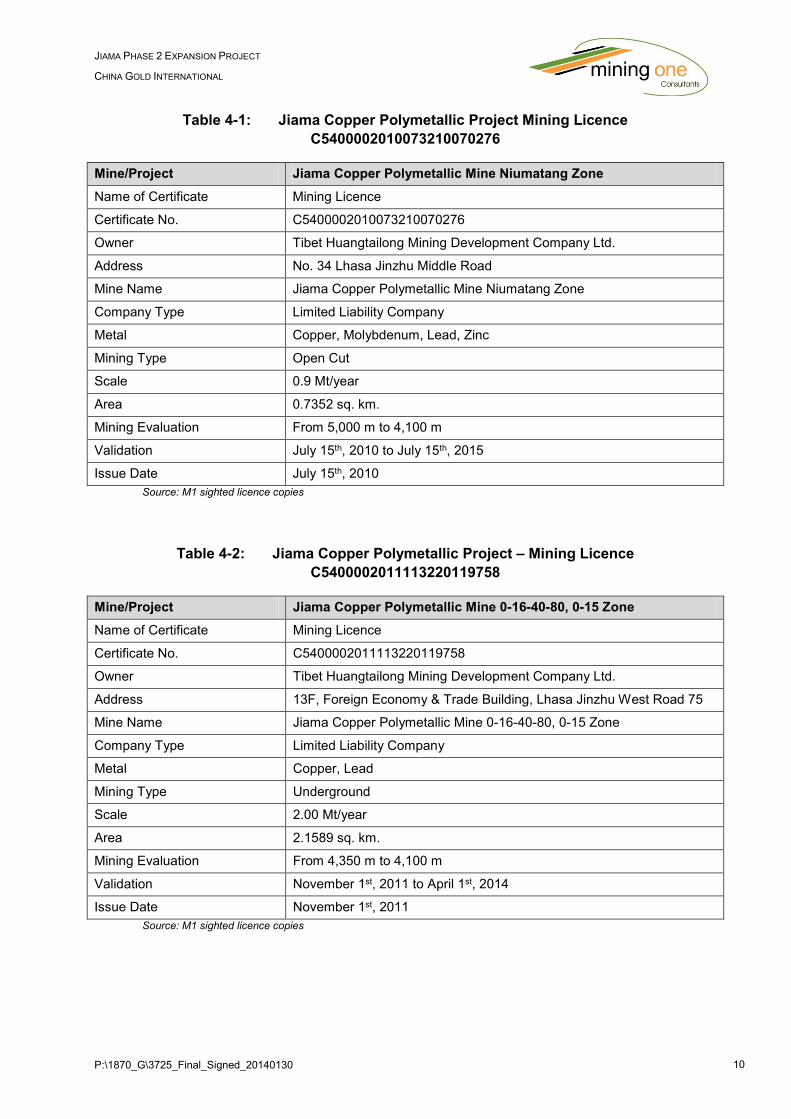
P:\1870_G\3725_Final_Signed_20140130 10
JIAMA PHASE 2 EXPANSION PROJECT
CHINA GOLD INTERNATIONAL
Table 4-1: Jiama Copper Polymetallic Project Mining Licence
C5400002010073210070276
Mine/Project Jiama Copper Polymetallic Mine Niumatang Zone
Name of Certificate Mining Licence
Certificate No. C5400002010073210070276
Owner Tibet Huangtailong Mining Development Company Ltd.
Address No. 34 Lhasa Jinzhu Middle Road
Mine Name Jiama Copper Polymetallic Mine Niumatang Zone
Company Type Limited Liability Company
Metal Copper, Molybdenum, Lead, Zinc
Mining Type Open Cut
Scale 0.9 Mt/year
Area 0.7352 sq. km.
Mining Evaluation From 5,000 m to 4,100 m
Validation July 15th, 2010 to July 15th, 2015
Issue Date July 15th, 2010
Source: M1 sighted licence copies
Table 4-2: Jiama Copper Polymetallic Project – Mining Licence
C5400002011113220119758
Mine/Project Jiama Copper Polymetallic Mine 0-16-40-80, 0-15 Zone
Name of Certificate Mining Licence
Certificate No. C5400002011113220119758
Owner Tibet Huangtailong Mining Development Company Ltd.
Address 13F, Foreign Economy & Trade Building, Lhasa Jinzhu West Road 75
Mine Name Jiama Copper Polymetallic Mine 0-16-40-80, 0-15 Zone
Company Type Limited Liability Company
Metal Copper, Lead
Mining Type Underground
Scale 2.00 Mt/year
Area 2.1589 sq. km.
Mining Evaluation From 4,350 m to 4,100 m
Validation November 1st, 2011 to April 1st, 2014
Issue Date November 1st, 2011
Source: M1 sighted licence copies
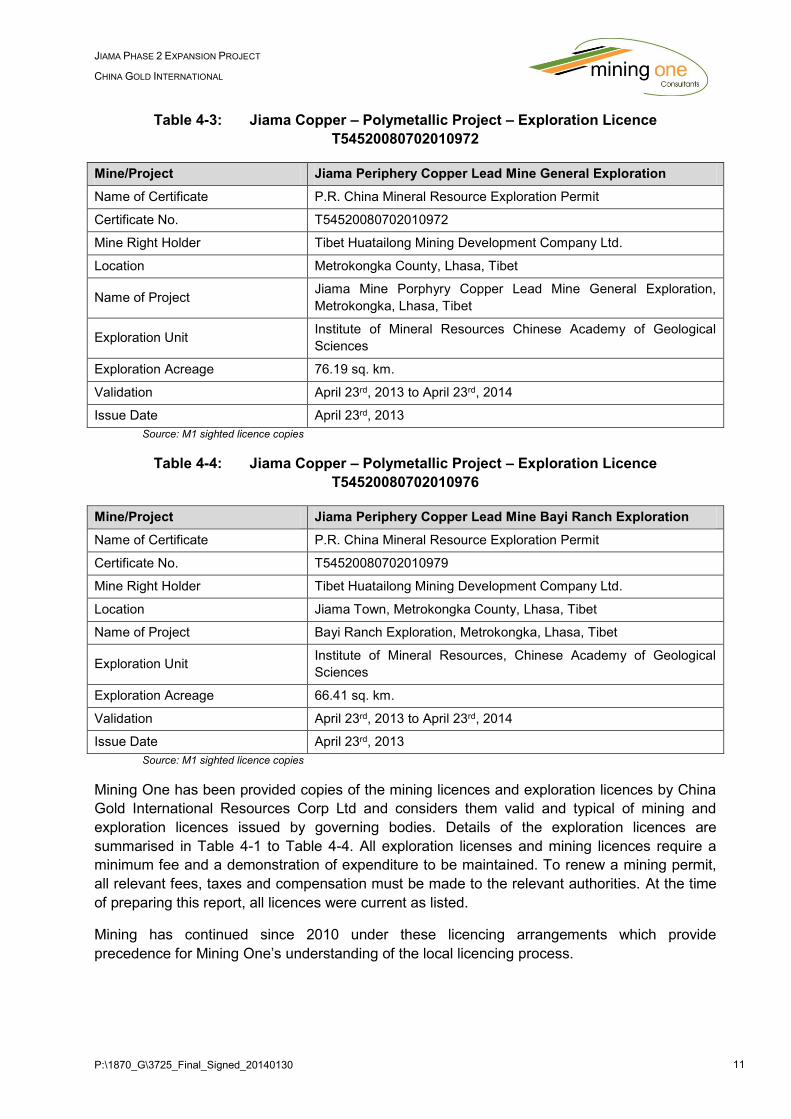
P:\1870_G\3725_Final_Signed_20140130 11
JIAMA PHASE 2 EXPANSION PROJECT
CHINA GOLD INTERNATIONAL
Table 4-3: Jiama Copper – Polymetallic Project – Exploration Licence
T54520080702010972
Mine/Project Jiama Periphery Copper Lead Mine General Exploration
Name of Certificate P.R. China Mineral Resource Exploration Permit
Certificate No. T54520080702010972
Mine Right Holder Tibet Huatailong Mining Development Company Ltd.
Location Metrokongka County, Lhasa, Tibet
Name of Project Jiama Mine Porphyry Copper Lead Mine General Exploration,
Metrokongka, Lhasa, Tibet
Exploration Unit Institute of Mineral Resources Chinese Academy of Geological
Sciences
Exploration Acreage 76.19 sq. km.
Validation April 23rd, 2013 to April 23rd, 2014
Issue Date April 23rd, 2013
Source: M1 sighted licence copies
Table 4-4: Jiama Copper – Polymetallic Project – Exploration Licence
T54520080702010976
Mine/Project Jiama Periphery Copper Lead Mine Bayi Ranch Exploration
Name of Certificate P.R. China Mineral Resource Exploration Permit
Certificate No. T54520080702010979
Mine Right Holder Tibet Huatailong Mining Development Company Ltd.
Location Jiama Town, Metrokongka County, Lhasa, Tibet
Name of Project Bayi Ranch Exploration, Metrokongka, Lhasa, Tibet
Exploration Unit Institute of Mineral Resources, Chinese Academy of Geological
Sciences
Exploration Acreage 66.41 sq. km.
Validation April 23rd, 2013 to April 23rd, 2014
Issue Date April 23rd, 2013
Source: M1 sighted licence copies
Mining One has been provided copies of the mining licences and exploration licences by China
Gold International Resources Corp Ltd and considers them valid and typical of mining and
exploration licences issued by governing bodies. Details of the exploration licences are
summarised in Table 4-1 to Table 4-4. All exploration licenses and mining licences require a
minimum fee and a demonstration of expenditure to be maintained. To renew a mining permit,
all relevant fees, taxes and compensation must be made to the relevant authorities. At the time
of preparing this report, all licences were current as listed.
Mining has continued since 2010 under these licencing arrangements which provide
precedence for Mining One’s understanding of the local licencing process.
P:\1870_G\3725_Final_Signed_20140130 12
JIAMA PHASE 2 EXPANSION PROJECT
CHINA GOLD INTERNATIONAL
5 ACCESSIBILITY, CLIMATE, LOCAL RESOURCES,
INFRASTRUCTURE AND PHYSIOGRAPHY
Tibet has an average of only 2 people per square kilometre. The Tibet Autonomous Region has
the lowest population density among any of the Chinese province-level administrative regions,
mostly due to its harsh and rugged terrain. Lhasa, the capital of Tibet Autonomous Region, is
located within the Himalayan Mountains and has an elevation of 3,600 m above sea level and a
population approximating 250,000. The Jiama mine lies approximately 68 km east-northeast of
Lhasa and has an elevation approximating 4,700 m above sea level. Due to its high elevation
the climate is a cool semi-arid climate with frosty winters and mild summers.
5.1 Topography
The topography of the Jiama project is mountainous with elevations up to 5,410 m above sea
level. The local terrain consists of steep slopes and large changes in relief, making the area
technically challenging for the development of the mining assets.
5.2 Climate and Vegetation
The climate in Lhasa consists of cold dry winters with an average temperature of -1.6 degrees
Celsius. Summer periods are characterised by a humid but cool climate with an average
temperature of 16 degrees Celsius. Climatic conditions at the Jiama project will be slightly
cooler due to the additional elevation. The high elevation also impacts on the air quality with thin
air likely to affect personnel who have not acclimatised to the local region
The average annual precipitation is 500 mm with rain commonly falling in July, August and
September. Nearby Lhasa receives almost 3000 sunlight hours per annum, prompting many
locals to name it the ‘sunlit city’.
5.3 Project Access
Access to the project site is via the Sichuan–Tibet Highway (National Road G318)
approximately 60 km east of Lhasa. An 8 km paved road connects the mine and camp to the
highway. Lhasa is connected to other locations via road, rail (Qingzang Railway) and has daily
national and international flights from the Lhasa–Gonggar Airport. The project is considered well
located due to its proximity to the Tibetan capital.
The topography within the exploration licences is mountainous with large elevation differences
between valleys (4,435 mRL) and the surrounding precipitous slopes and peaks (5,390 mRL).
The mine itself sits in the headwaters of one of the many tributaries feeding into the Lhasa
River. The landscape is without trees and dominated by skeletal, rocky soils covered with
patches of dry perennial grasses and shrubbery. The project area (including exploration
licences) contains a small local population, of which most are yak and sheep graziers.
Regional resources regarding labour, supplies and equipment are adequate to support
increased mining operations. Skilled personnel have traditionally been sourced from other
China Gold operations and from other mining operations in China. Huatailong however has
formed a logistics company comprised entirely of local staff and in the past have trained local
Tibetans elsewhere in China.

P:\1870_G\3725_Final_Signed_20140130 13
JIAMA PHASE 2 EXPANSION PROJECT
CHINA GOLD INTERNATIONAL
5.4 Power
The mine site has direct access to the Central Tibetan Power Grid. Electricity for Phase I of the
Jiama Expansion project is supplied by a recently constructed 110 kV electricity transmission
line that runs from the Metrorkongka substation located approximately 20 km to the north of the
Jiama Project Area. This facility is adequate to supply power to the Phase I and Phase II mining
development. Electricity supply in the central Tibet region has been, in the past, insufficient for
mining operations. The Tibet government and Central Government of China are progressing a
power-supply development plan whereby the Central Tibet power grid will be connected to the
national power grid in China. This work was understood to be ongoing at the time of writing.
5.5 Water
Water is a scarce commodity in the general area of the Jiama project. Fresh water rights have
been secured from the Chikang River, for the purpose of human consumption and for the
processing operations. The Phase I processing plant currently recycles water through the plant
and from the tailings facilities with makeup water being sourced from the Chikang River. For the
Phase II installation, a new high-level intake water pool shall be constructed for the water supply
system. This will be located on the ore dressing industrial site. The construct of this additional
facility is not perceived to be an issue. Water is not therefore considered a risk to the Phase II
expansion.
5.6 Local Resources and Infrastructure
The Phase II expansion will require substantial construction to be carried out. Previous studies
have indicated that Tibet has a weak industrial base and therefore the supply of construction
materials such as sand, stone, cement and steel as required by the mine construction has been
a concern for the development. For Phase II of the expansion, many of these obstacles have
been overcome during Phase I and therefore Mining One considers there to be minimal risk in
the development and construction of the site infrastructure and do not believe construction
constraints represent a significant risk to the project.
5.7 Personnel
With the Phase I open cut mines currently operating and scheduled for closure during the early
stages of Phase II, a component of the required workforce is already employed at site. The
availability of personnel has been achieved with a number of contract agreements being signed
for the the supply and accommodation of operational personnel. Both open pit and underground
mining operations have been provided for within the contracts. Procession personnel and
management staff will be accommodated in the existing facilities which will be expanded to
facilitate the needs of the Phase II expansion.
5.8 Accommodation
Accommodation for the workforce will be contained on site as part of the site facility. With Phase
I accommodation facilities in place, the expansion to a Phase II facility is not seen as a
significant technical challenge. All mining contractors will provide accommodation for their
respective workforces. At the time of writing construction of the Phase II camp had commenced
for the housing of China Gold personnel.
P:\1870_G\3725_Final_Signed_20140130 14
JIAMA PHASE 2 EXPANSION PROJECT
CHINA GOLD INTERNATIONAL
6 HISTORY
6.1 Pre 2008
Surface trenching exploration and geological works undertaken between 1951 and 1990
identified and delineated a 3.6 km long zone of copper-lead zinc mineralisation, although
artisanal mining of lead occurred prior to this. In 1990, following a review of these early results,
the Tibetan Geology and Minerals Resource Bureau implemented a much larger field program.
Between 1990 and 1999,the No. 6 Geological Brigade (Brigade 6) from the Bureau completed
31 diamond drill holes for a total of 10,091 m on 16 exploration traverses. 407.5 m of
underground development and 16,474 m3 of surface trenching was completed during this time.
As a result of this work,four mining licences within the current Jiama Project mining licence
boundary were issued and mining operations commenced shortly after:
1. The Jiama Township Fupin Development Company Limited constructed a 300 tpd
concentrating plant and commenced mining in 2004. A total of 14 adits were developed
for mining with an estimated 49,000 tonnes of ore being mined to the end of June 2006.
2. Open pit and underground mining practices were carried out on the mining licence by the
Lhasa Mining Company. Open pit mining commenced above the MSL elevation of
4,780 m in 1995. Prior to 2006, a total of ten adits were developed between MSL 4,606 m
and 4,780 m with total production from the open pit and underground workings
approximating 130,000 tonnes.
3. A joint venture between the Tibet Jiama Mining Development Company Limited, and
Henan Rongye Trading Company Limited was established. Mining commenced in 2003,
with a total of 109,000 tonnes of ore being mined through until the end of June 2006.
4. The Original Tibet Huatailong Mining Development Company Limited commenced mining
in 2005. The estimated mine production from three mining adits was 80,000 tonnes to
June 20, 2006.
In the period prior to 2006, it is estimated that the total mining production for the four operations
at Jiama was 368,000 tonnes. In the absence of any reliable total historical mine production
figures, the Resource Institute conducted a systematic survey of the existing underground
workings using mined stope volume as a proxy for consumed mineral resources. The Tibetan
government stopped all 4 operators from mining in April 2007, and in an agreement with the
China National Gold Group Corporation consolidated the mining/exploration licences and
awarded it to the newly reorganised Tibet Huatailong Mining Development Company.
6.2 2008-2012
Exploration work has been completed in a number of distinct phases following the consolidation
of the licences. 2008 marked the beginning of an extensive exploration program with 105
diamond holes drilled, the development of survey control points and the completion of a 1:200
topographic survey. In 2009, exploration consisted of an in-fill drill programme in the Niumatang
Open Pit area and step-out drilling along the northwest margin of the known zone of
mineralisation.

P:\1870_G\3725_Final_Signed_20140130 15
JIAMA PHASE 2 EXPANSION PROJECT
CHINA GOLD INTERNATIONAL
Further exploration drilling during 2010 greatly expanded the mineral resource and was followed
by in-fill drilling in the area of the proposed Jiama Open Pit throughout 2011. Huatailong
commissioned a pre-feasibility study in 2012 and continued in-fill and step-out drilling in the
region of the proposed South Pit.
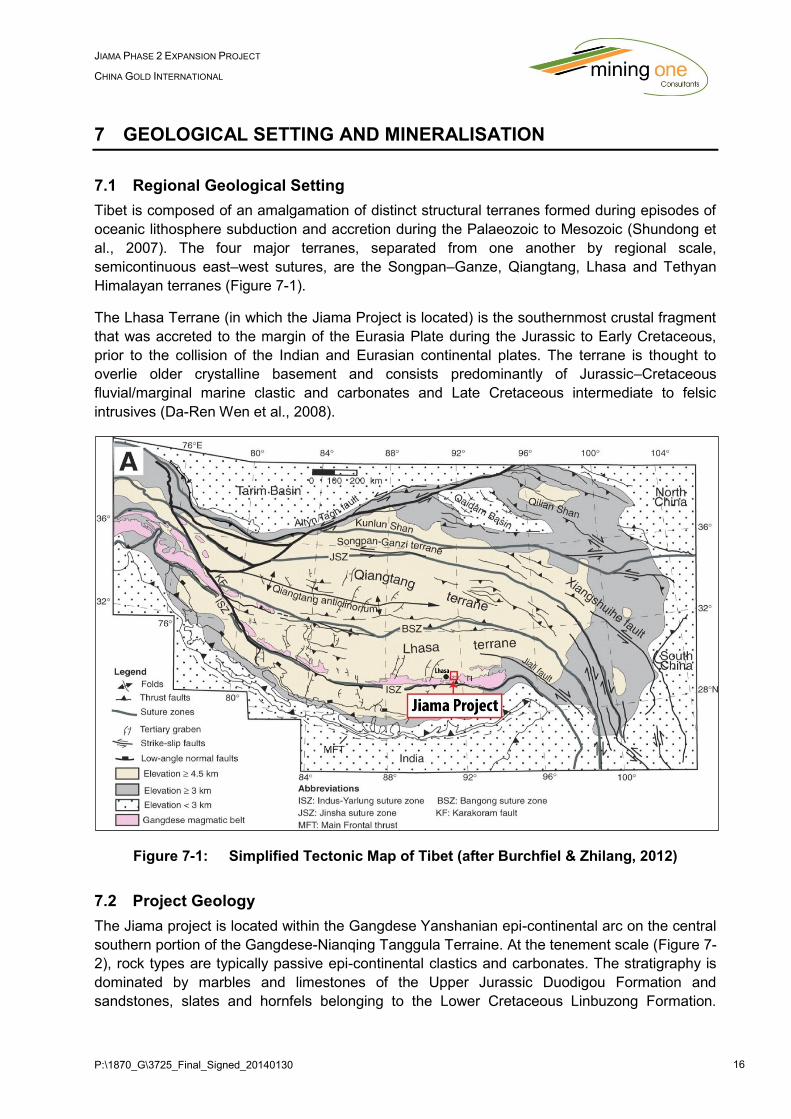
P:\1870_G\3725_Final_Signed_20140130 16
JIAMA PHASE 2 EXPANSION PROJECT
CHINA GOLD INTERNATIONAL
7 GEOLOGICAL SETTING AND MINERALISATION
7.1 Regional Geological Setting
Tibet is composed of an amalgamation of distinct structural terranes formed during episodes of
oceanic lithosphere subduction and accretion during the Palaeozoic to Mesozoic (Shundong et
al., 2007). The four major terranes, separated from one another by regional scale,
semicontinuous east–west sutures, are the Songpan–Ganze, Qiangtang, Lhasa and Tethyan
Himalayan terranes (Figure 7-1).
The Lhasa Terrane (in which the Jiama Project is located) is the southernmost crustal fragment
that was accreted to the margin of the Eurasia Plate during the Jurassic to Early Cretaceous,
prior to the collision of the Indian and Eurasian continental plates. The terrane is thought to
overlie older crystalline basement and consists predominantly of Jurassic–Cretaceous
fluvial/marginal marine clastic and carbonates and Late Cretaceous intermediate to felsic
intrusives (Da-Ren Wen et al., 2008).
Figure 7-1: Simplified Tectonic Map of Tibet (after Burchfiel & Zhilang, 2012)
7.2 Project Geology
The Jiama project is located within the Gangdese Yanshanian epi-continental arc on the central
southern portion of the Gangdese-Nianqing Tanggula Terraine. At the tenement scale (Figure 7-
2), rock types are typically passive epi-continental clastics and carbonates. The stratigraphy is
dominated by marbles and limestones of the Upper Jurassic Duodigou Formation and
sandstones, slates and hornfels belonging to the Lower Cretaceous Linbuzong Formation.
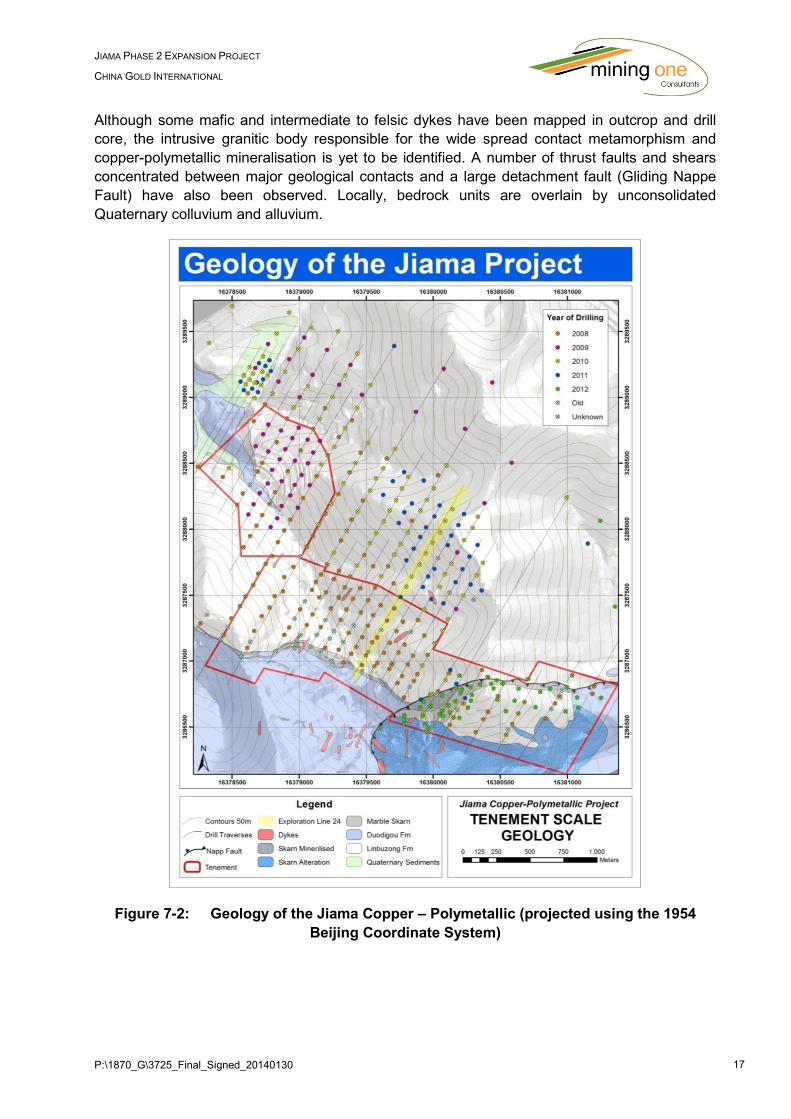
P:\1870_G\3725_Final_Signed_20140130 17
JIAMA PHASE 2 EXPANSION PROJECT
CHINA GOLD INTERNATIONAL
Although some mafic and intermediate to felsic dykes have been mapped in outcrop and drill
core, the intrusive granitic body responsible for the wide spread contact metamorphism and
copper-polymetallic mineralisation is yet to be identified. A number of thrust faults and shears
concentrated between major geological contacts and a large detachment fault (Gliding Nappe
Fault) have also been observed. Locally, bedrock units are overlain by unconsolidated
Quaternary colluvium and alluvium.
Figure 7-2: Geology of the Jiama Copper – Polymetallic (projected using the 1954
Beijing Coordinate System)
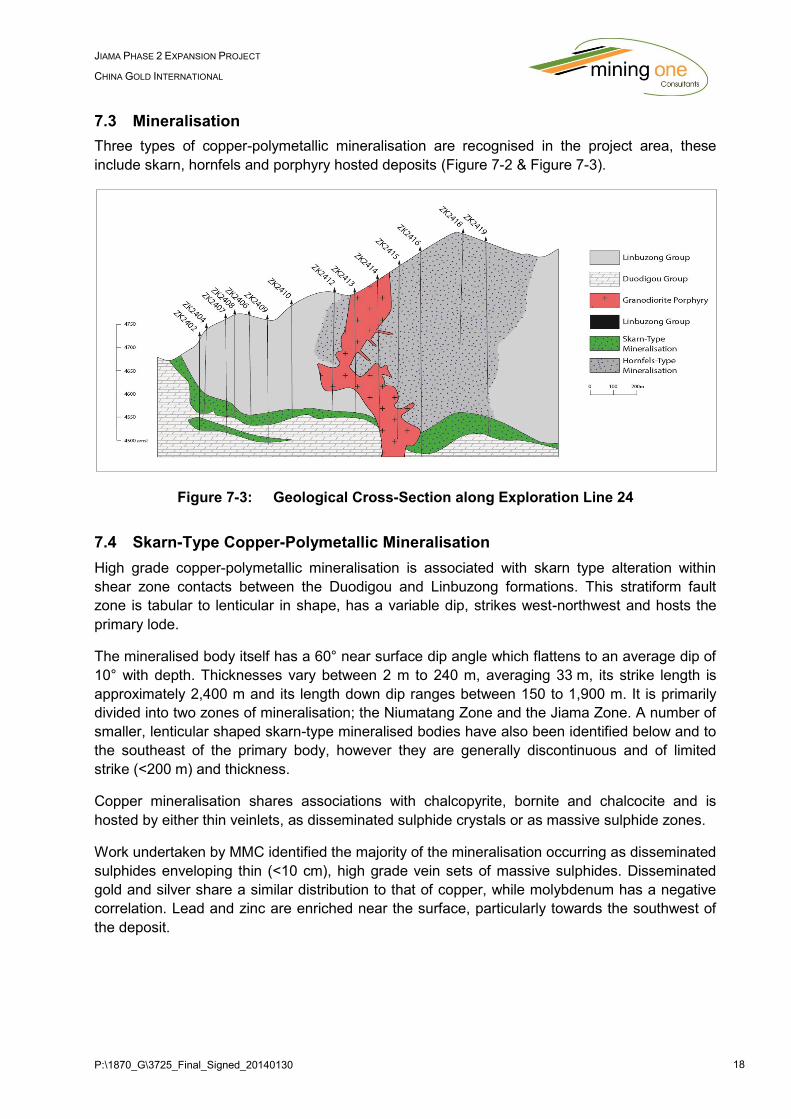
P:\1870_G\3725_Final_Signed_20140130 18
JIAMA PHASE 2 EXPANSION PROJECT
CHINA GOLD INTERNATIONAL
7.3 Mineralisation
Three types of copper-polymetallic mineralisation are recognised in the project area, these
include skarn, hornfels and porphyry hosted deposits (Figure 7-2 & Figure 7-3).
Figure 7-3: Geological Cross-Section along Exploration Line 24
7.4 Skarn-Type Copper-Polymetallic Mineralisation
High grade copper-polymetallic mineralisation is associated with skarn type alteration within
shear zone contacts between the Duodigou and Linbuzong formations. This stratiform fault
zone is tabular to lenticular in shape, has a variable dip, strikes west-northwest and hosts the
primary lode.
The mineralised body itself has a 60° near surface dip angle which flattens to an average dip of
10° with depth. Thicknesses vary between 2 m to 240 m, averaging 33 m, its strike length is
approximately 2,400 m and its length down dip ranges between 150 to 1,900 m. It is primarily
divided into two zones of mineralisation; the Niumatang Zone and the Jiama Zone. A number of
smaller, lenticular shaped skarn-type mineralised bodies have also been identified below and to
the southeast of the primary body, however they are generally discontinuous and of limited
strike (<200 m) and thickness.
Copper mineralisation shares associations with chalcopyrite, bornite and chalcocite and is
hosted by either thin veinlets, as disseminated sulphide crystals or as massive sulphide zones.
Work undertaken by MMC identified the majority of the mineralisation occurring as disseminated
sulphides enveloping thin (<10 cm), high grade vein sets of massive sulphides. Disseminated
gold and silver share a similar distribution to that of copper, while molybdenum has a negative
correlation. Lead and zinc are enriched near the surface, particularly towards the southwest of
the deposit.

P:\1870_G\3725_Final_Signed_20140130 19
JIAMA PHASE 2 EXPANSION PROJECT
CHINA GOLD INTERNATIONAL
7.5 Hornfels Hosted Copper-Polymetallic Mineralisation
Hornfels hosted mineralisation is of lower grade than that of the skarn type deposits and occurs
predominantly as disseminated sulphides. Mineralisation is fine grained and consists of copper
in association with chalcopyrite, bornite and molybdenum. No massive sulphide zones or
veining has been recognised within the texturally massive and highly fractures rock mass.
Earlier observations of copper associated with pyrite and pyrrhotite coating fracture planes has
been attributed to secondary enrichment.
The mineralised body shows no preferential orientation, it is shallow, tabular shaped and
approximately 1,200 m in length, 1,000 m wide and generally 10 to 50 m thick, although a
maximum thickness of 826 m was intercepted in drillhole ZK3216. It pinches out in the west-
southwest and in general is thinner towards both the west-northwest and east-southeast.
7.6 Porphyry-Type Molybdenum-Copper Polymetallic Mineralisation
Mineralisation in porphyritic granodiorite and monzogranite is characterised by molybdenum
with lesser amounts of chalcopyrite and bornite. Sulphides are medium to coarse grained and
confined to a thin horizontal pipe shaped body with a maximum known thickness of 476 m. The
porphyritic host lies beneath the Duodigou Formation and appears intruded into the sheared
contact between the two basement units.
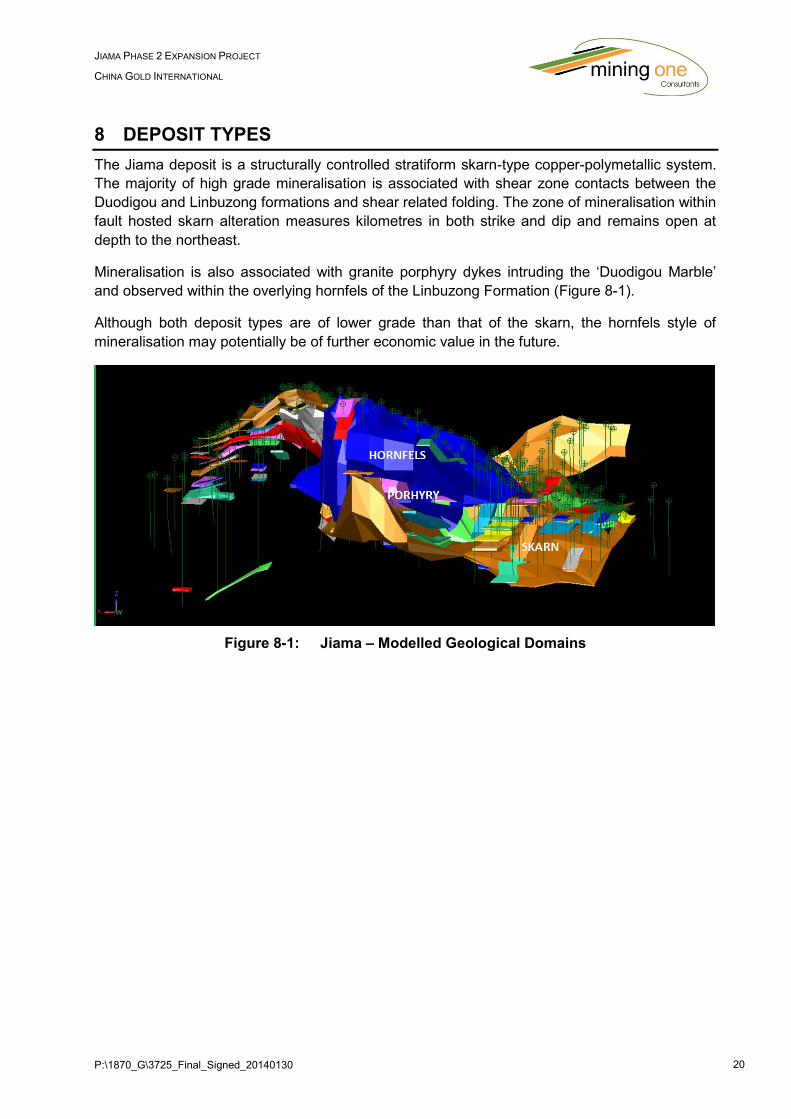
P:\1870_G\3725_Final_Signed_20140130 20
JIAMA PHASE 2 EXPANSION PROJECT
CHINA GOLD INTERNATIONAL
8 DEPOSIT TYPES
The Jiama deposit is a structurally controlled stratiform skarn-type copper-polymetallic system.
The majority of high grade mineralisation is associated with shear zone contacts between the
Duodigou and Linbuzong formations and shear related folding. The zone of mineralisation within
fault hosted skarn alteration measures kilometres in both strike and dip and remains open at
depth to the northeast.
Mineralisation is also associated with granite porphyry dykes intruding the ‘Duodigou Marble’
and observed within the overlying hornfels of the Linbuzong Formation (Figure 8-1).
Although both deposit types are of lower grade than that of the skarn, the hornfels style of
mineralisation may potentially be of further economic value in the future.
Figure 8-1: Jiama – Modelled Geological Domains
P:\1870_G\3725_Final_Signed_20140130 21
JIAMA PHASE 2 EXPANSION PROJECT
CHINA GOLD INTERNATIONAL
9 EXPLORATION
Exploration drilling has been carried out over the Jiama Resource for a number of years, the
history of the exploration works are outlined below. This data has been obtained from various
geological data bases that are maintained by China Gold. Unfortunately unless stated otherwise
the sampling methodology adopted for the exploration work was not available.
9.1 Pre 1990
Minimal exploration was undertaken prior to the 1990’s with only small scale mining occurring
prior to the 1950’s. Exploration between the 1950’s and 1990 consisted predominantly of
surface trenching to target the out cropping, no drilling was conducted during this period.
9.2 Years 1990–2000
Exploration work undertaken by Brigade 6 in the 1990’s included 1:2,000 and 1:25,000 scale
topographic surveys, geological mapping, surface trenching, adit development and diamond
drilling. A total of 31 diamond drill holes with a total drilled length of 10,091 m were completed,
along with the development of 407.5 m of adits and 16,474 m3 of surface trenches. Exploration
concentrated on the near surface portion of the mineralised zone and was conducted in
accordance with Chinese Industry requirements at the time.
9.3 Years 2008-2012
Exploration work has been completed in four distinct phases following the consolidation of the
licences.
In 2008 the exploration program included:
105 diamond drill holes with a total drill length of 50,616.65 m.
Establishment of survey control points using differential GPS and based on the 1954
Beijing Coordinate System/1956 Yellow Sea Elevation System.
A 1:2,000 topographic survey at two metre contour intervals.
In 2009 the exploration program included:
47 in-fill and step-out diamond drill holes in the Niumatang area with a total drill length of
18,745 m.
In 2010, the exploration program included:
99 Diamond drill holes with a total drill length of 49,613 m
Jiama Resource Estimate was undertaken using 2008–2009 drilling results and limited
historical data as part of a Behre Dolbear independent technical report.
P:\1870_G\3725_Final_Signed_20140130 22
JIAMA PHASE 2 EXPANSION PROJECT
CHINA GOLD INTERNATIONAL
In 2011, the exploration program included:
22 in-fill diamond drill holes totalling 10,720 m
Updated Jiama Resource Estimate undertaken using 2008–2010 drilling results and
limited historical data as part of a Behre Dolbear independent technical report.
In 2012 the exploration included:
58 certified in-fill diamond drill holes with a total drill length of 26,379 m in the area of the
proposed South Pit
Updated Jiama Resource Estimate undertaken using 2008–2010 drilling results and
limited historical data as part of a Behre Dolbear resource update report
Pre-Feasibility Study undertaken by Minarco-MineConsult (MMC).
P:\1870_G\3725_Final_Signed_20140130 23
JIAMA PHASE 2 EXPANSION PROJECT
CHINA GOLD INTERNATIONAL
10 DRILLING
Huatailong’s 2012 drilling program consisted of 58 certified diamond drill holes with a total of
26,379 m drilled. In-fill drilling targeted the mineralised skarn of the Duodigou Formation in the
area of the proposed South Pit, increasing drill density to approximately 100 m. All drill holes
were drilled at either -90° or -70°.
Drilling and surveying of the 2012 drill holes was conducted in a similar manner as that for the
2011 drill program. Collar locations were surveyed using differential GPS after drilling and
down-hole deviation measured using down hole-survey equipment generally at a 100 m interval.
Completed drill holes were plugged using cement and marked with a cement post in the centre
of the collar. Details of the drilling programs completed prior to 2012 are summarised in section
16 of this report.
Labelled and boxed drill core were transported from the drill pad to core warehouse, where core
was logged, photographed and sampled. All remaining non-sampled core was labelled and
stored to protect from the region’s weather.
P:\1870_G\3725_Final_Signed_20140130 24
JIAMA PHASE 2 EXPANSION PROJECT
CHINA GOLD INTERNATIONAL
11 SAMPLE PREPARATION, ANALYSIS AND SECURITY
Little information regarding sample preparation, analysis and security was provided to Mining
One directly other than the drilling database. Therefore the following has been summarised from
the Behre Dolbear Asia Incorporated report ‘Resource Update Report for the Jiama Copper-
Polymetallic Project in Metrorkongka County, Tibet Autonomous Region, Peoples Republic of
China’, dated March 2012 and the pre-feasibility report undertaken by Minarco-MineConsult
(MMC), November 12th, 2012.
11.1 Sampling Methodology
11.1.1 Brigade 6 Sampling (1990’s)
The Tibet Central Laboratory of the Ministry of Geology and Mineral Resources of China
conducted sample preparation and analysis for the Brigade 6 samples during the 1990’s. Core
samples were taken by mechanical splitter, with half the core sent for sample preparation and
the remaining half retained for records. Sample intervals were generally 1.0 to 2.0 meters.
Surface trenches were sampled with the trenches being 5 cm wide and 3 cm deep, orientated
as perpendicular as possible to the trend of mineralisation/alteration.
11.1.2 Huatailong Sampling (2008–2011)
Cores were collected and following logging and photography of the core samples, a Geologist
selected the zones of interest within the core length. The Geologist would determine the sample
intervals for the purpose of assaying. The core was halved using a diamond rock saw with one
half sent for sample preparation and the remaining half retained for records. Occasionally,
sample lengths varied in relation to the geological characteristics of the core, however, the
interval was commonly determined by the type of mineralisation, with intervals of 1.0 m for
skarn-type mineralisation and 2.0 m for hornfels hosted mineralisation. The entire zone of
mineralisation was sampled continuously and host rock either side of the mineralisation
sampled every 2.0 m.
11.1.3 Huatailong Sampling (2012)
The 2012 sampling methodology was conducted in a similar manner as that for 2011, with
standard interval sizes at the discretion of the geologist, but more commonly dependant on the
style of mineralisation. The entire zone of mineralisation was sampled continuously and host
rock either side of the mineralisation sampled every 2.0 m.
11.2 Sample Preparation and Analysis
11.2.1 Bridge Brigade 6 (1990’s)
Sample preparation and analysis was conducted by the Tibet Central Laboratory of the Ministry
of Geology and Mineral Resources of China, in accordance with regulations of the time.
Although no detailed information was available concerning preparation and analysis, Behre
Dolbear and MMC believe the assay results to be acceptable based on similar results in
samples from subsequent drilling programmes.
P:\1870_G\3725_Final_Signed_20140130 25
JIAMA PHASE 2 EXPANSION PROJECT
CHINA GOLD INTERNATIONAL
11.2.2 Huatailong (2008–2011)
Between 2008 and 2011, sample preparation and analysis for the Huatailong core samples
were undertaken by the Southwestern Metallurgic Geology Analytical Center (Southwest
Center) in Chengdu, Sichuan Province, which is accredited by the Chinese National
Accreditation Board for Laboratories. A two-stage crushing and grinding procedure to achieve a
particle size to minus 200 mesh (0.074 mm). Sample splitting was not performed until the
particle size was reduced to approximately 1 mm. A ground sample of approximately 400 grams
was sent for analysis; a duplicate ground sample of approximately 500 grams as well as the
coarse rejects was kept in the core storage warehouse.
Gold grades were determined using an aqua-regia/fluoride digestion, reactivated carbon
concentrating and atomic absorption spectrometry procedure (AAS). Copper, lead, zinc
molybdenum, and silver grades were determined using an aqua regia/hydrofluoric acid
perchloric acid digestion and Inductively Coupled Plasma Atomic Emission Spectrometry (ICP-
AES) or Ass procedure. Standard analytical methods adhere to the former Ministry of Geology
and Mineral Resources of China’s official publication ‘The Quality Administration Standards for
Analysis in Geological and Mineral Resource Laboratories’ (DZ0130-94).
No Huatailong employees, offices, directors or associates were involved in the sample
preparation.
11.2.3 Huatailong (2012)
The 2012 sample preparation and analysis was conducted in a similar manner as that for 2011
and again undertaken by the Southwest Metallurgical Geology Analytical Centre (Southwest
Centre) in Chengdu, Sichuan Province. The laboratory is accredited by the Chinese National
Accreditation Board for laboratories (CNAL).
Gold grades were determined using an aqua-regia/fluoride digestion, reactivated carbon
concentrating and atomic absorption spectrometry procedure (AAS). Copper, lead, zinc
molybdenum, and silver grades were determined using an aqua regia/hydrofluoric acid
perchloric acid digestion and Inductively Coupled Plasma Atomic Emission Spectrometry (ICP-
AES) or Ass procedure. Standard analytical methods adhere to the former Ministry of Geology
and Mineral Resources of China’s official publication ‘The Quality Administration Standards for
Analysis in Geological and Mineral Resource Laboratories’ (DZ0130-94).
No Huatailong employees, offices, directors or associates were involved in the sample
preparation. During the June site visit Mining One was able to confirm that appropriate sample
and quality control procedures were in place to minimise sample bias.
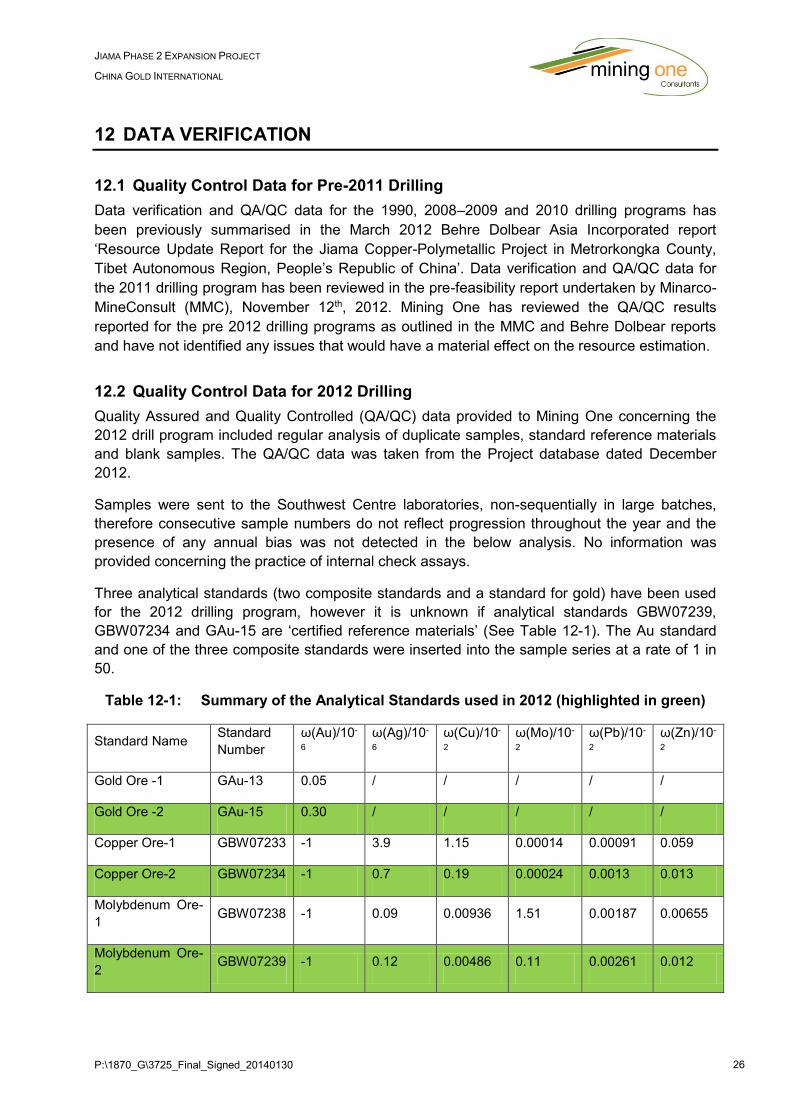
P:\1870_G\3725_Final_Signed_20140130 26
JIAMA PHASE 2 EXPANSION PROJECT
CHINA GOLD INTERNATIONAL
12 DATA VERIFICATION
12.1 Quality Control Data for Pre-2011 Drilling
Data verification and QA/QC data for the 1990, 2008–2009 and 2010 drilling programs has
been previously summarised in the March 2012 Behre Dolbear Asia Incorporated report
‘Resource Update Report for the Jiama Copper-Polymetallic Project in Metrorkongka County,
Tibet Autonomous Region, People’s Republic of China’. Data verification and QA/QC data for
the 2011 drilling program has been reviewed in the pre-feasibility report undertaken by Minarco-
MineConsult (MMC), November 12th, 2012. Mining One has reviewed the QA/QC results
reported for the pre 2012 drilling programs as outlined in the MMC and Behre Dolbear reports
and have not identified any issues that would have a material effect on the resource estimation.
12.2 Quality Control Data for 2012 Drilling
Quality Assured and Quality Controlled (QA/QC) data provided to Mining One concerning the
2012 drill program included regular analysis of duplicate samples, standard reference materials
and blank samples. The QA/QC data was taken from the Project database dated December
2012.
Samples were sent to the Southwest Centre laboratories, non-sequentially in large batches,
therefore consecutive sample numbers do not reflect progression throughout the year and the
presence of any annual bias was not detected in the below analysis. No information was
provided concerning the practice of internal check assays.
Three analytical standards (two composite standards and a standard for gold) have been used
for the 2012 drilling program, however it is unknown if analytical standards GBW07239,
GBW07234 and GAu-15 are ‘certified reference materials’ (See Table 12-1). The Au standard
and one of the three composite standards were inserted into the sample series at a rate of 1 in
50.
Table 12-1: Summary of the Analytical Standards used in 2012 (highlighted in green)
Standard Name Standard
Number
ω(Au)/10-
6
ω(Ag)/10-
6
ω(Cu)/10-
2
ω(Mo)/10-
2
ω(Pb)/10-
2
ω(Zn)/10-
2
Gold Ore -1 GAu-13 0.05 / / / / /
Gold Ore -2 GAu-15 0.30 / / / / /
Copper Ore-1 GBW07233 -1 3.9 1.15 0.00014 0.00091 0.059
Copper Ore-2 GBW07234 -1 0.7 0.19 0.00024 0.0013 0.013
Molybdenum Ore-
1 GBW07238 -1 0.09 0.00936 1.51 0.00187 0.00655
Molybdenum Ore-
2 GBW07239 -1 0.12 0.00486 0.11 0.00261 0.012
P:\1870_G\3725_Final_Signed_20140130 27
JIAMA PHASE 2 EXPANSION PROJECT
CHINA GOLD INTERNATIONAL
The reported analytical results for each of the three standards used in 2012 are presented in
Figure 12-1 and Figure 12-2. In these figures, the expected set value (green), ±2 standard
deviation QC warning limit (red) and ±3 standard deviation QC failure limit (red) are also shown.
Standard material analysis generally produced acceptable results, but with room for
improvement, particularly the silver component of standard GBW07294 where average results
were significantly higher than expected and 26% of all samples were beyond the limits of failure.
12.2.1 Duplicates
A total of 299 duplicates were sampled in 2012 and were inserted into the sample series at an
average rate of 1 per every 50 samples. A review of the scatter plots (Figure 12-3) of the data
provided to Mining One demonstrates strong correlations between the original and duplicate
samples for all elements tested. Minor variations in the data were observed, although a review
of this data, considers this variability natural rather than bias related to sample preparation or
analytical technique.
12.2.2 Analytical Blanks
319 blanks were analysed in 2012. When compared with the set standard values, Mining One
considers the reported assay values returned for the blank material (Figure 12-4) within
acceptable limits.
12.2.3 Conclusions
Based on the review of the drilling, sampling, sampling preparation, analysis and QA/QC data,
Mining One is of the opinion that the 2012 samples for the Jiama Phase II Project meets
industry standards and are suitable for mineral resource estimation.
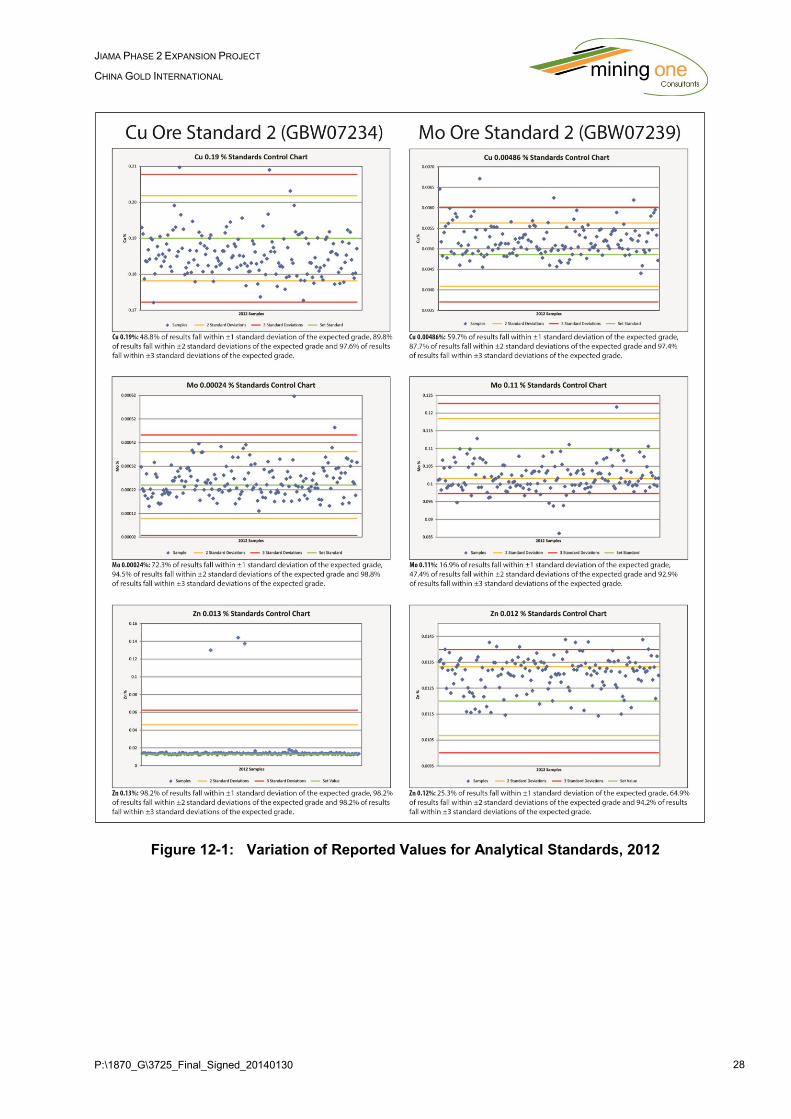
P:\1870_G\3725_Final_Signed_20140130 28
JIAMA PHASE 2 EXPANSION PROJECT
CHINA GOLD INTERNATIONAL
Figure 12-1: Variation of Reported Values for Analytical Standards, 2012
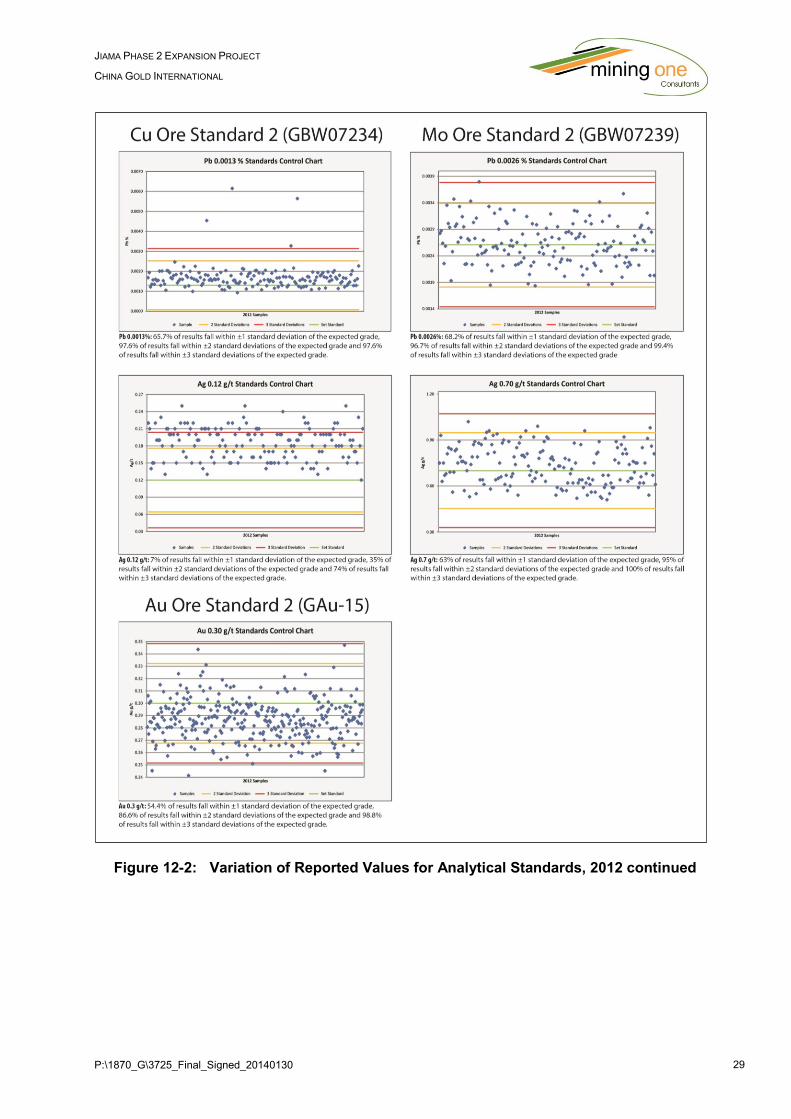
P:\1870_G\3725_Final_Signed_20140130 29
JIAMA PHASE 2 EXPANSION PROJECT
CHINA GOLD INTERNATIONAL
Figure 12-2: Variation of Reported Values for Analytical Standards, 2012 continued
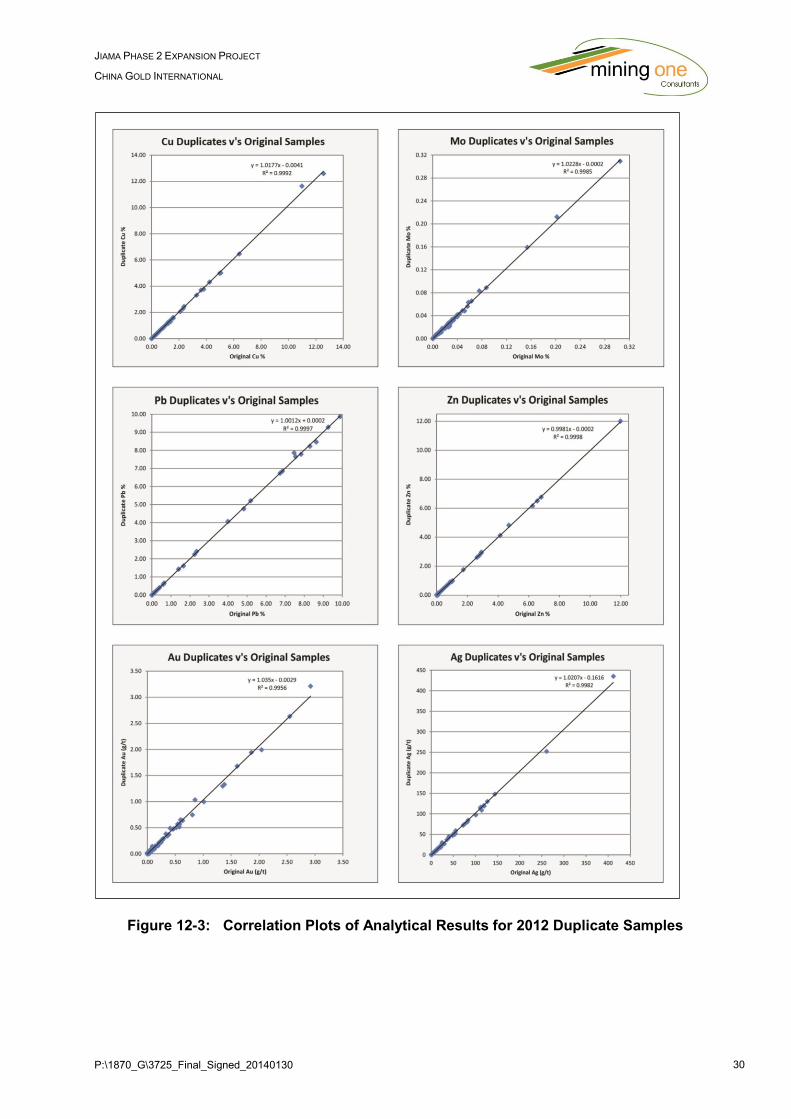
P:\1870_G\3725_Final_Signed_20140130 30
JIAMA PHASE 2 EXPANSION PROJECT
CHINA GOLD INTERNATIONAL
Figure 12-3: Correlation Plots of Analytical Results for 2012 Duplicate Samples

P:\1870_G\3725_Final_Signed_20140130 31
JIAMA PHASE 2 EXPANSION PROJECT
CHINA GOLD INTERNATIONAL
Figure 12-4: Blank Analysis with Detection Limits Marked in Red. Au and Ag Detection
Limit 0.01 g/t. Cu, Mo, Zn and Pb Detection Limit 0.0001%
P:\1870_G\3725_Final_Signed_20140130 32
JIAMA PHASE 2 EXPANSION PROJECT
CHINA GOLD INTERNATIONAL
13 MINERAL PROCESSING AND METALLURGICAL TESTING
13.1 Introduction
There are three types of mineralisation found within the Jiama deposit; large scale skarn-type,
dominated porphyry copper polymetallic, and developed hornfels. copper, molybdenum, gold,
silver, lead and zinc occur in varying quantities in the ore types.
In skarn ore, copper mineralisation is mainly associated with the sulphide minerals chalcopyrite,
bornite and chalcocite hosted in sulphide veins, or as disseminated sulphide crystals or massive
sulphide zones. The hornfels copper-polymetallic mineralisation is generally lower in grade than
the Skarn and, unlike the Skarn mineralisation the majority of the Cu and associated
mineralisation occurs as disseminated crystals hosted by the Hornfels with no veining or
massive sulphide being observed. Generally, mineralisation occurs in the form of chalcopyrite,
bornite, and molybdenite with a fine grain size. The porphyry type mineralisation is dominated
by molybdenite with only minor chalcopyrite and bornite observed. The sulphide minerals occur
in the main as medium to coarse grains in the host rock.
Molybdenum occurs as medium to coarse grained disseminated molybdenite (MoS2)
predominantly within the porphyry and hornfels.
Copper-lead zinc ore is only 3% of the total Jiama mineralisation and consists of primary
sulphides, galena, sphalerite and chalcopyrite. Galena is associated with sphalerite,
chalcopyrite, and bornite as well as occurring in the gangue. Sphalerite is mainly associated
with galena and is distributed within the gangue as granular and irregular-shaped aggregates
with galena, chalcopyrite and pyrite. In skarn blocks, it mainly occurs between mineral particles
or in garnet cracks, sometimes micro pyroxene crystals are enclosed. Some chalcopyrite is
present as emulsion droplets within the sphalerite.
The main product from the Jiama project will be copper concentrate containing gold and silver
which are credited.
Phase I development was completed in 2010 comprising two open pits, a processing plant and
an underground ore transportation system, to treat 6,500 tpd (2.15Mtpa) of ore per day. Current
activities are focused on the Phase II expansion in which it is planned to increase ore treatment
capacity by 43,500 tpd (14.35Mtpa). The new plant will consist of two circuits capable of 21,750
tpd, this design enables the capacity to maintain plant through put when one of the circuits is
offline.
The program is scheduled to deliver production of some 80,000 tonnes of copper in concentrate
by 2016 - forecast life of mine is 35 years with the last 10 years of operation being underground
only. The southern extent of the ore body remains open so there is opportunity to consider an
increase in the size of the South Pit so there is opportunity for improved open pit mine life.
In addition to the Phase I Huatailong processing plant (6,500tpd) a second smaller plant with a
capacity of 600 tpd (200,000 tpa) exists at Jiama. This smaller plant was built a number of years
ago using equipment from an earlier concentrator to treat copper-lead-zinc ores, and has more
recently been modified and used for pilot plant testing. The Huatailong plant was designed to
recover concentrates of copper, molybdenum, lead, and zinc, with gold and silver credits by
P:\1870_G\3725_Final_Signed_20140130 33
JIAMA PHASE 2 EXPANSION PROJECT
CHINA GOLD INTERNATIONAL
bulk flotation, followed by selective flotation. This plant will be maintained on site for the duration
of the Phase II project and primarily used for research and development work. This plant could
be adapted to provide contingency if required however has not been factored into the evaluation
of the project.
The Phase I (6,500tpd) plant may be upgraded to produce separate Pb and Zn concentrates
which will also include credits for gold and silver.
13.2 Metallurgical Testing and Process Plant Considerations
Extensive metallurgical testing has been carried out to develop and optimise a process
flowsheet on which to base the plant design. The work was carried out in China Gold’s own
laboratories and in commercial testing organisations.
Test results from work carried out at the General Research Institute, Beijing was used as the
main basis for design of the Huatailong No 2 Processing Plant, which included detailed
mineralogical investigations, physical tests, comminution, liberation, beneficiation, settling and
filtration assessment to provide the technical parameters.
Feed for the processing plant will consist of skarn and hornfels hosted copper-molybdenum ore
types. Ore characterisation test work show marked differences; the skarn hosted ore varies
greatly in terms of hardness and grade, while the hornfels hosted ore is disseminated with
consistently lower copper and molybdenum grades. Beneficiation tests showed differences in
amenability between the two types of ores.
Liberation tests showed that grinding to P70=74 microns ahead of copper–molybdenum bulk
flotation, roughing, scavenging and cleaning, then regrinding to P90=74 microns, for separation
of the molybdenum from the copper through further roughing, scavenging and multi-stage
cleaning in column flotation cells.
A range of flotation collectors, activators, dispersants, depressants, pH adjustment, and
frothers, were tested at different addition rates and combinations. Conditioning and flotation
residence time and kinetics were investigated under a number of flotation conditions and pH.
Following establishment of the reagent regime, open cycle flotation tests at the selected primary
and re-grind sizes were carried out to determine the best performance. Locked cycle tests were
then carried out to establish the effect of circulating loads and reagent build-up on flotation
performance.
The locked cycle testing showed that 94 % copper recovery and 73% molybdenum recovery
was achievable at a grind size of P70=74 microns, with concentrate grades of 32 % Cu and 47
% Mo.
The major source of revenue for the Jiama Project is the copper, with gold and silver credits.
Molybdenum is not credited and must be sold as a molybdenum concentrate and it is important
to keep the arsenic content low < 0.25 %. Table 13-1 shows assays of saleable copper and
molybdenum concentrates produced in testwork.
The arsenic content of the molybdenum is a little high and reduction of this should be addressed
in any future R&D testwork or continuous improvement program as is normally practiced in any
operating mineral process plant.
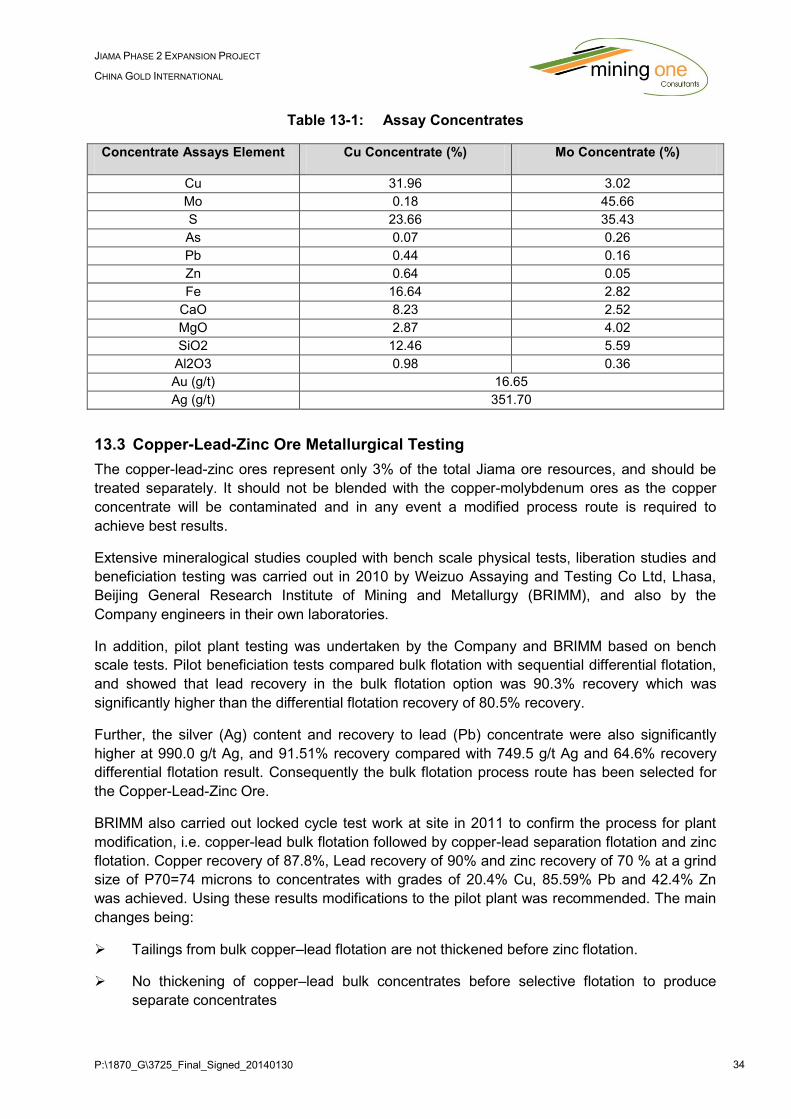
P:\1870_G\3725_Final_Signed_20140130 34
JIAMA PHASE 2 EXPANSION PROJECT
CHINA GOLD INTERNATIONAL
Table 13-1: Assay Concentrates
Concentrate Assays Element Cu Concentrate (%) Mo Concentrate (%)
Cu 31.96 3.02
Mo 0.18 45.66
S 23.66 35.43
As 0.07 0.26
Pb 0.44 0.16
Zn 0.64 0.05
Fe 16.64 2.82
CaO 8.23 2.52
MgO 2.87 4.02
SiO2 12.46 5.59
Al2O3 0.98 0.36
Au (g/t) 16.65
Ag (g/t) 351.70
13.3 Copper-Lead-Zinc Ore Metallurgical Testing
The copper-lead-zinc ores represent only 3% of the total Jiama ore resources, and should be
treated separately. It should not be blended with the copper-molybdenum ores as the copper
concentrate will be contaminated and in any event a modified process route is required to
achieve best results.
Extensive mineralogical studies coupled with bench scale physical tests, liberation studies and
beneficiation testing was carried out in 2010 by Weizuo Assaying and Testing Co Ltd, Lhasa,
Beijing General Research Institute of Mining and Metallurgy (BRIMM), and also by the
Company engineers in their own laboratories.
In addition, pilot plant testing was undertaken by the Company and BRIMM based on bench
scale tests. Pilot beneficiation tests compared bulk flotation with sequential differential flotation,
and showed that lead recovery in the bulk flotation option was 90.3% recovery which was
significantly higher than the differential flotation recovery of 80.5% recovery.
Further, the silver (Ag) content and recovery to lead (Pb) concentrate were also significantly
higher at 990.0 g/t Ag, and 91.51% recovery compared with 749.5 g/t Ag and 64.6% recovery
differential flotation result. Consequently the bulk flotation process route has been selected for
the Copper-Lead-Zinc Ore.
BRIMM also carried out locked cycle test work at site in 2011 to confirm the process for plant
modification, i.e. copper-lead bulk flotation followed by copper-lead separation flotation and zinc
flotation. Copper recovery of 87.8%, Lead recovery of 90% and zinc recovery of 70 % at a grind
size of P70=74 microns to concentrates with grades of 20.4% Cu, 85.59% Pb and 42.4% Zn
was achieved. Using these results modifications to the pilot plant was recommended. The main
changes being:
Tailings from bulk copper–lead flotation are not thickened before zinc flotation.
No thickening of copper–lead bulk concentrates before selective flotation to produce
separate concentrates
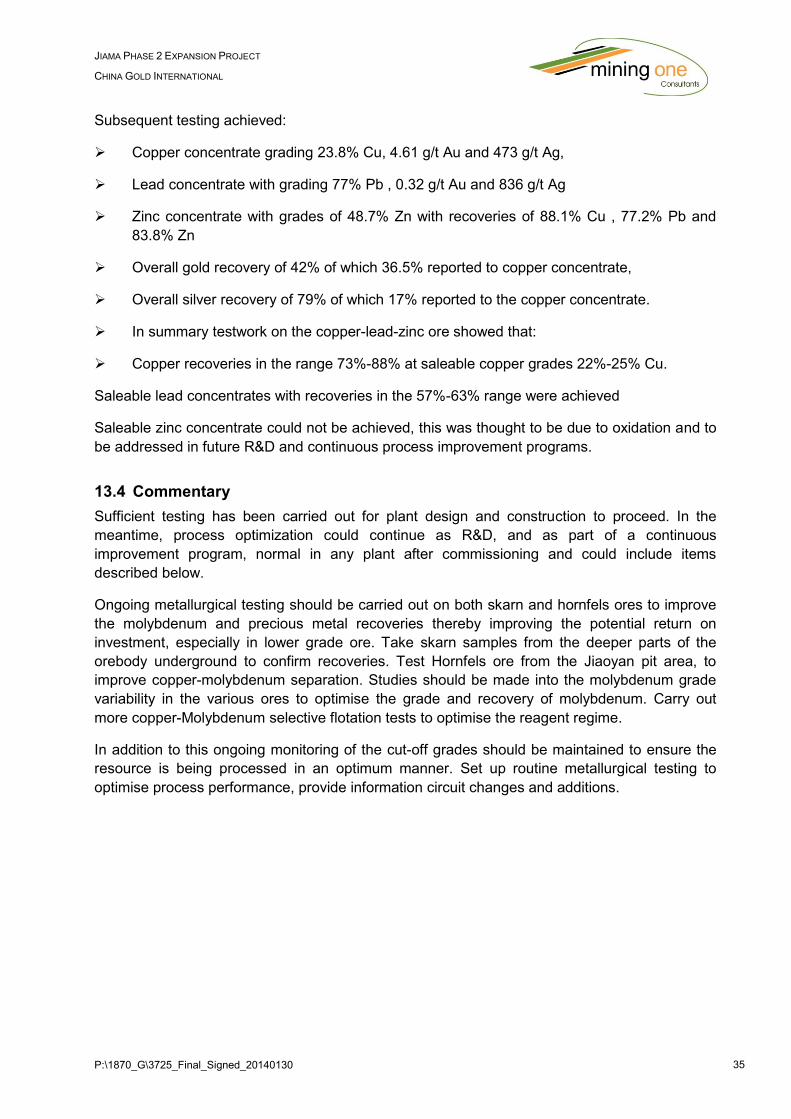
P:\1870_G\3725_Final_Signed_20140130 35
JIAMA PHASE 2 EXPANSION PROJECT
CHINA GOLD INTERNATIONAL
Subsequent testing achieved:
Copper concentrate grading 23.8% Cu, 4.61 g/t Au and 473 g/t Ag,
Lead concentrate with grading 77% Pb , 0.32 g/t Au and 836 g/t Ag
Zinc concentrate with grades of 48.7% Zn with recoveries of 88.1% Cu , 77.2% Pb and
83.8% Zn
Overall gold recovery of 42% of which 36.5% reported to copper concentrate,
Overall silver recovery of 79% of which 17% reported to the copper concentrate.
In summary testwork on the copper-lead-zinc ore showed that:
Copper recoveries in the range 73%-88% at saleable copper grades 22%-25% Cu.
Saleable lead concentrates with recoveries in the 57%-63% range were achieved
Saleable zinc concentrate could not be achieved, this was thought to be due to oxidation and to
be addressed in future R&D and continuous process improvement programs.
13.4 Commentary
Sufficient testing has been carried out for plant design and construction to proceed. In the
meantime, process optimization could continue as R&D, and as part of a continuous
improvement program, normal in any plant after commissioning and could include items
described below.
Ongoing metallurgical testing should be carried out on both skarn and hornfels ores to improve
the molybdenum and precious metal recoveries thereby improving the potential return on
investment, especially in lower grade ore. Take skarn samples from the deeper parts of the
orebody underground to confirm recoveries. Test Hornfels ore from the Jiaoyan pit area, to
improve copper-molybdenum separation. Studies should be made into the molybdenum grade
variability in the various ores to optimise the grade and recovery of molybdenum. Carry out
more copper-Molybdenum selective flotation tests to optimise the reagent regime.
In addition to this ongoing monitoring of the cut-off grades should be maintained to ensure the
resource is being processed in an optimum manner. Set up routine metallurgical testing to
optimise process performance, provide information circuit changes and additions.
P:\1870_G\3725_Final_Signed_20140130 36
JIAMA PHASE 2 EXPANSION PROJECT
CHINA GOLD INTERNATIONAL
14 MINERAL RESOURCE ESTIMATE
The Mineral Resource estimate was independently completed by Runge on November 12th,
2012. Mining One was provided with the block model and all files related to construction of the
model. The information contained within this report is based on information provided to Mining
One and verified by Mining One. The Resource estimate is based on a three dimensional
geological and mineralisation models that were informed by the drill hole data set.
14.1 Source Data
Drillhole information was supplied to Mining One by China Gold International Resource Corp in
excel spread sheet format. The drillhole information provided was used to validate the Resource
model. The historical data up to November 2012 was received on the 28th April 2013. The 12th
of November 2012 was used as a cut-off date for resource validation. Mining One imported the
excel spread sheets into a Microsoft Access database to use within Surpac software.
The Access database contains a total of 421 diamond holes for 171,201.92 m of drilling
14.2 Bulk Density Data
A total of 539 bulk density measurements have been recorded in the resource area. These
samples were taken from the Skarn, Hornfels and Porphyry domains. Rock types selected
ranged from waste domains through to strongly mineralised copper-molybdenum and lead-zinc
skarns. Mining One determined that these measurements are representative of the rock types
within the Resource area and are sufficient for estimation of in situ tonnages within the model. A
summary of the bulk density measurements is shown in Table 14-1 below.
Table 14-1: Bulk Density Measurement Summary
Rock Type Samples Average g/cm3
Skarn – Cu/Mo 304 2.97
Skarn – Pb/Zn 42 3.33
Hornfels 138 2.59
Porphyry 55 2.35
Distributions of these results are contained in Figure 14-1 to Figure 14-4.
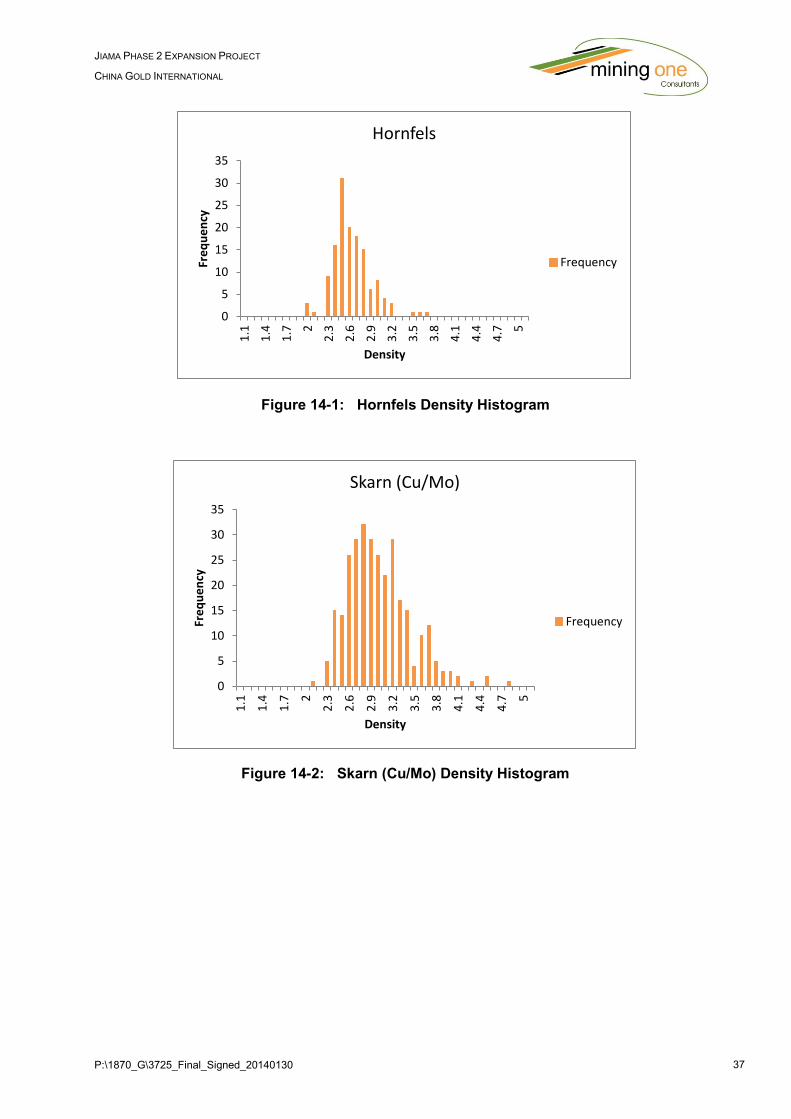
P:\1870_G\3725_Final_Signed_20140130 37
JIAMA PHASE 2 EXPANSION PROJECT
CHINA GOLD INTERNATIONAL
Figure 14-1: Hornfels Density Histogram
Figure 14-2: Skarn (Cu/Mo) Density Histogram
0
5
10
15
20
25
30
35
1.1
1.4
1.7 2
2.3
2.6
2.9
3.2
3.5
3.8
4.1
4.4
4.7 5
Fre
qu
en
cy
Density
Hornfels
Frequency
0
5
10
15
20
25
30
35
1.1
1.4
1.7 2
2.3
2.6
2.9
3.2
3.5
3.8
4.1
4.4
4.7 5
Fre
qu
en
cy
Density
Skarn (Cu/Mo)
Frequency
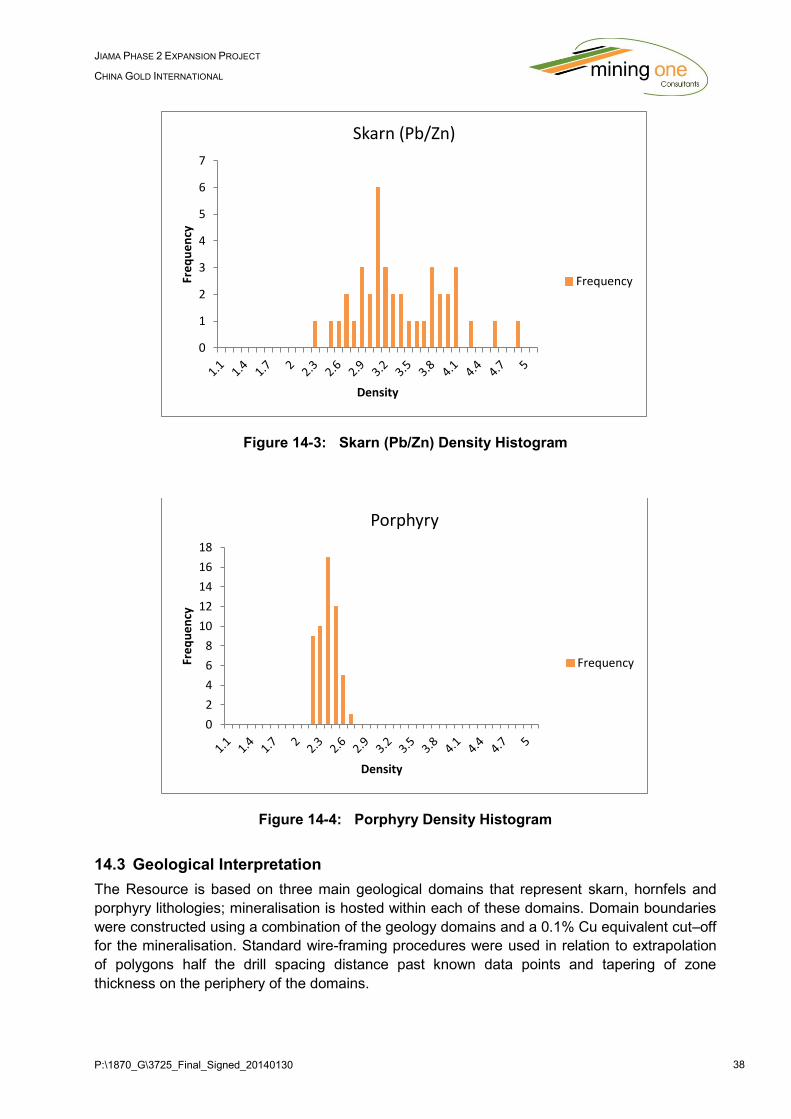
P:\1870_G\3725_Final_Signed_20140130 38
JIAMA PHASE 2 EXPANSION PROJECT
CHINA GOLD INTERNATIONAL
Figure 14-3: Skarn (Pb/Zn) Density Histogram
Figure 14-4: Porphyry Density Histogram
14.3 Geological Interpretation
The Resource is based on three main geological domains that represent skarn, hornfels and
porphyry lithologies; mineralisation is hosted within each of these domains. Domain boundaries
were constructed using a combination of the geology domains and a 0.1% Cu equivalent cut–off
for the mineralisation. Standard wire-framing procedures were used in relation to extrapolation
of polygons half the drill spacing distance past known data points and tapering of zone
thickness on the periphery of the domains.
0
1
2
3
4
5
6
7
Fre
qu
en
cy
Density
Skarn (Pb/Zn)
Frequency
0
2
4
6
8
10
12
14
16
18
Fre
qu
en
cy
Density
Porphyry
Frequency
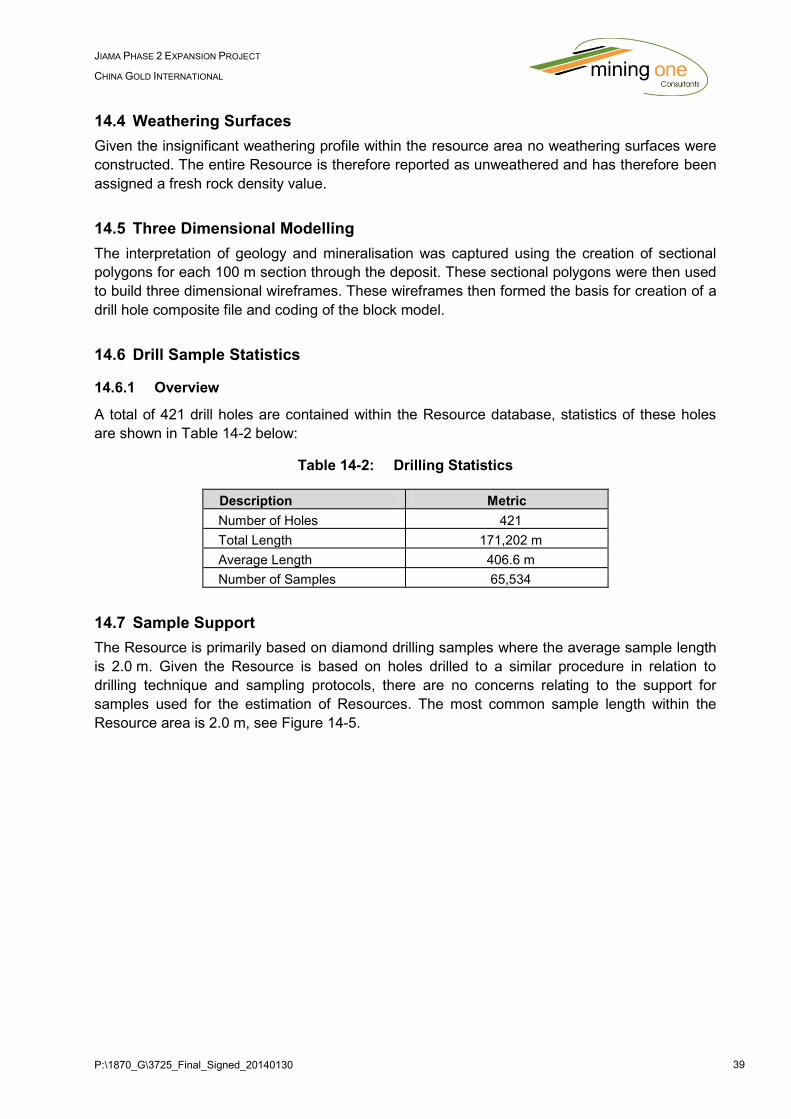
P:\1870_G\3725_Final_Signed_20140130 39
JIAMA PHASE 2 EXPANSION PROJECT
CHINA GOLD INTERNATIONAL
14.4 Weathering Surfaces
Given the insignificant weathering profile within the resource area no weathering surfaces were
constructed. The entire Resource is therefore reported as unweathered and has therefore been
assigned a fresh rock density value.
14.5 Three Dimensional Modelling
The interpretation of geology and mineralisation was captured using the creation of sectional
polygons for each 100 m section through the deposit. These sectional polygons were then used
to build three dimensional wireframes. These wireframes then formed the basis for creation of a
drill hole composite file and coding of the block model.
14.6 Drill Sample Statistics
14.6.1 Overview
A total of 421 drill holes are contained within the Resource database, statistics of these holes
are shown in Table 14-2 below:
Table 14-2: Drilling Statistics
Description Metric
Number of Holes 421
Total Length 171,202 m
Average Length 406.6 m
Number of Samples 65,534
14.7 Sample Support
The Resource is primarily based on diamond drilling samples where the average sample length
is 2.0 m. Given the Resource is based on holes drilled to a similar procedure in relation to
drilling technique and sampling protocols, there are no concerns relating to the support for
samples used for the estimation of Resources. The most common sample length within the
Resource area is 2.0 m, see Figure 14-5.
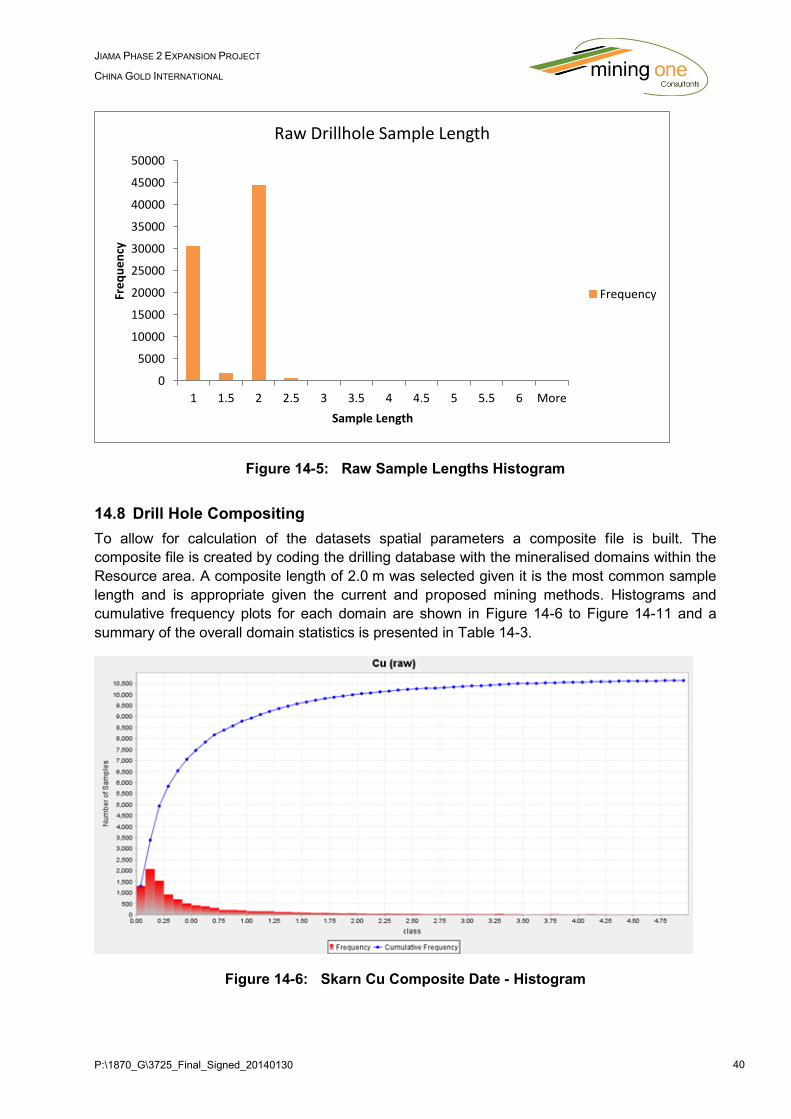
P:\1870_G\3725_Final_Signed_20140130 40
JIAMA PHASE 2 EXPANSION PROJECT
CHINA GOLD INTERNATIONAL
Figure 14-5: Raw Sample Lengths Histogram
14.8 Drill Hole Compositing
To allow for calculation of the datasets spatial parameters a composite file is built. The
composite file is created by coding the drilling database with the mineralised domains within the
Resource area. A composite length of 2.0 m was selected given it is the most common sample
length and is appropriate given the current and proposed mining methods. Histograms and
cumulative frequency plots for each domain are shown in Figure 14-6 to Figure 14-11 and a
summary of the overall domain statistics is presented in Table 14-3.
Figure 14-6: Skarn Cu Composite Date - Histogram
0
5000
10000
15000
20000
25000
30000
35000
40000
45000
50000
1 1.5 2 2.5 3 3.5 4 4.5 5 5.5 6 More
Fre
qu
en
cy
Sample Length
Raw Drillhole Sample Length
Frequency
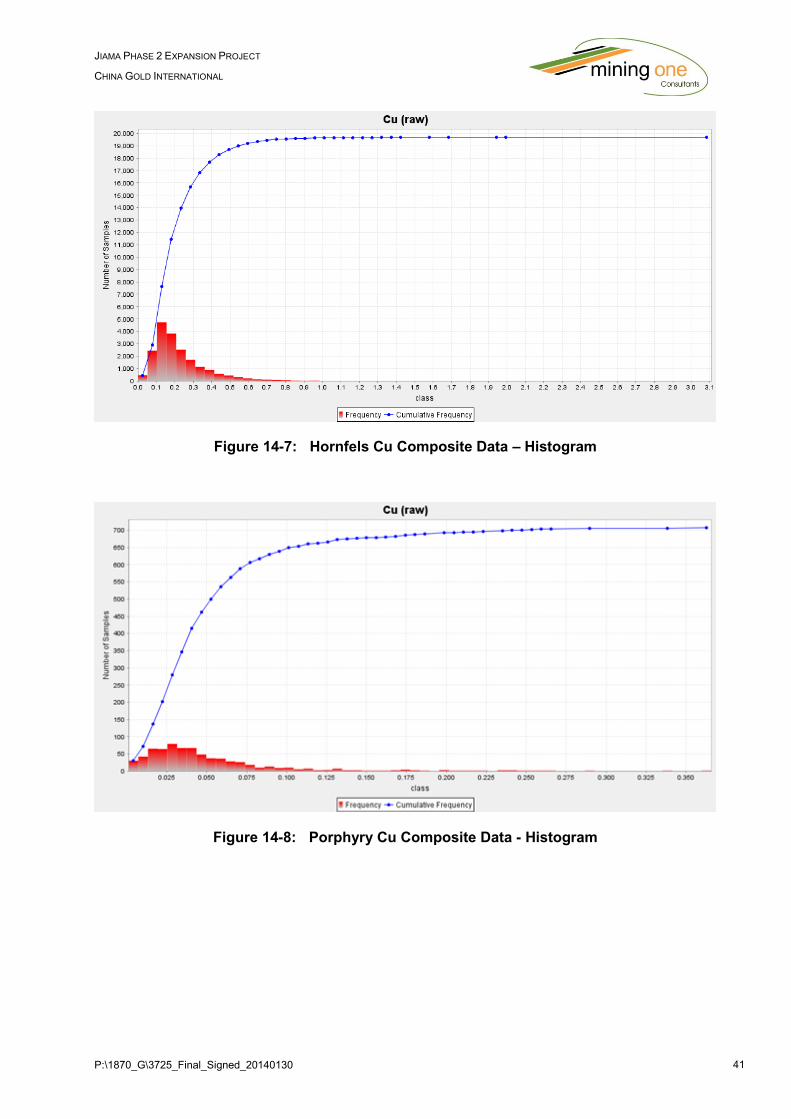
P:\1870_G\3725_Final_Signed_20140130 41
JIAMA PHASE 2 EXPANSION PROJECT
CHINA GOLD INTERNATIONAL
Figure 14-7: Hornfels Cu Composite Data – Histogram
Figure 14-8: Porphyry Cu Composite Data - Histogram
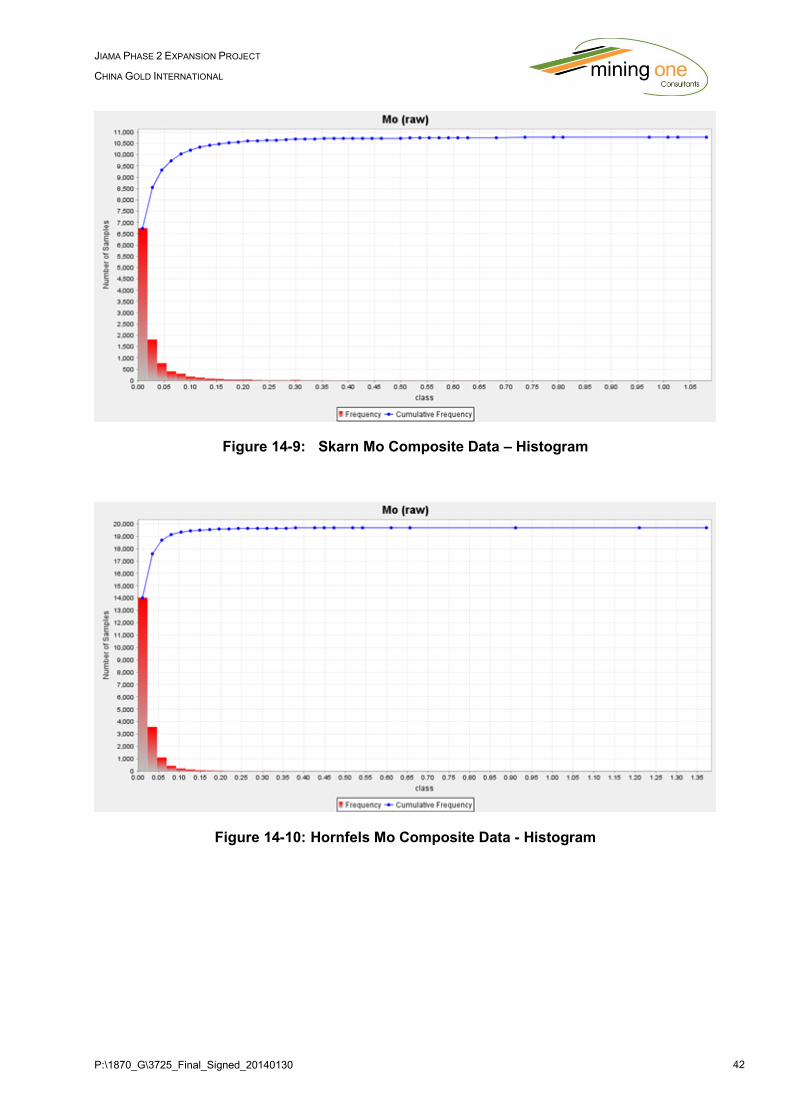
P:\1870_G\3725_Final_Signed_20140130 42
JIAMA PHASE 2 EXPANSION PROJECT
CHINA GOLD INTERNATIONAL
Figure 14-9: Skarn Mo Composite Data – Histogram
Figure 14-10: Hornfels Mo Composite Data - Histogram
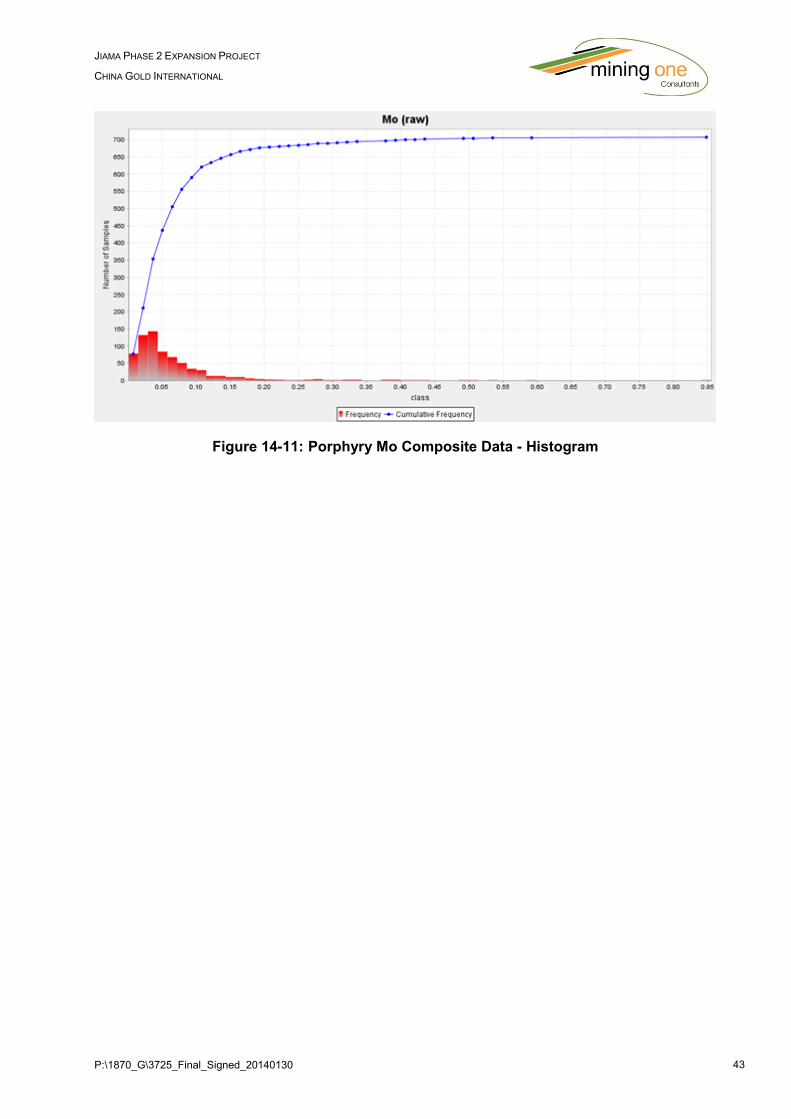
P:\1870_G\3725_Final_Signed_20140130 43
JIAMA PHASE 2 EXPANSION PROJECT
CHINA GOLD INTERNATIONAL
Figure 14-11: Porphyry Mo Composite Data - Histogram
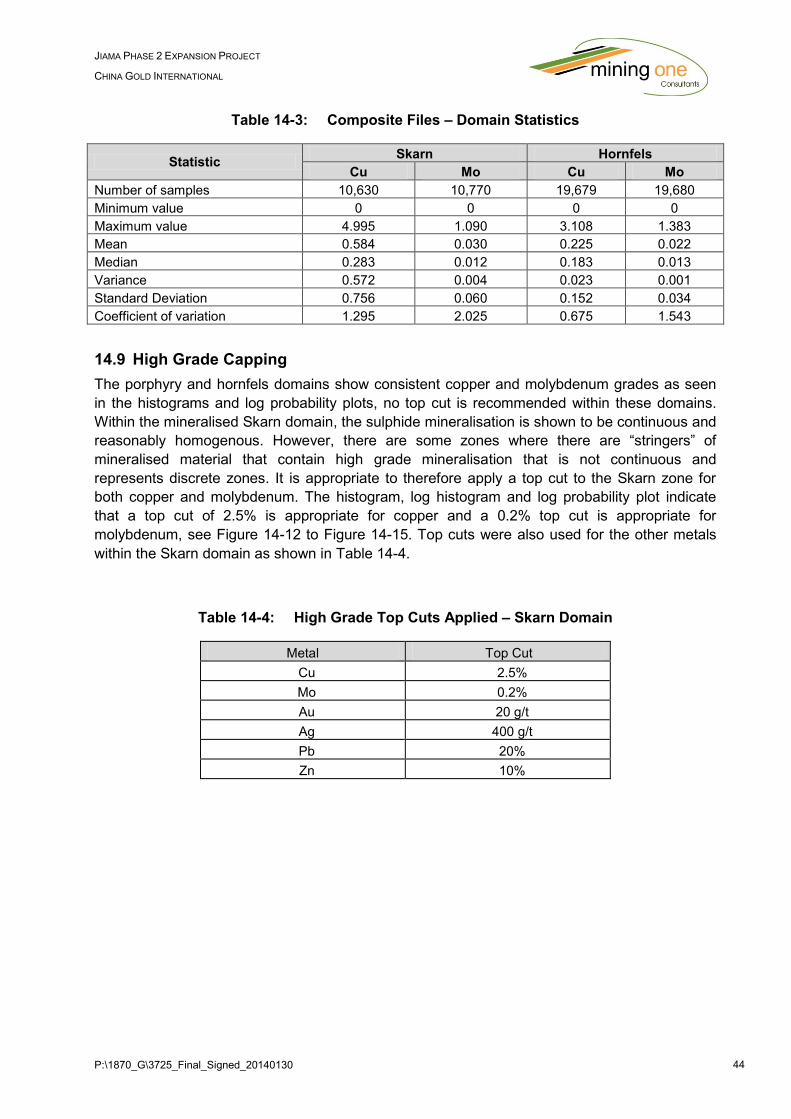
P:\1870_G\3725_Final_Signed_20140130 44
JIAMA PHASE 2 EXPANSION PROJECT
CHINA GOLD INTERNATIONAL
Table 14-3: Composite Files – Domain Statistics
Statistic Skarn Hornfels
Cu Mo Cu Mo
Number of samples 10,630 10,770 19,679 19,680
Minimum value 0 0 0 0
Maximum value 4.995 1.090 3.108 1.383
Mean 0.584 0.030 0.225 0.022
Median 0.283 0.012 0.183 0.013
Variance 0.572 0.004 0.023 0.001
Standard Deviation 0.756 0.060 0.152 0.034
Coefficient of variation 1.295 2.025 0.675 1.543
14.9 High Grade Capping
The porphyry and hornfels domains show consistent copper and molybdenum grades as seen
in the histograms and log probability plots, no top cut is recommended within these domains.
Within the mineralised Skarn domain, the sulphide mineralisation is shown to be continuous and
reasonably homogenous. However, there are some zones where there are “stringers” of
mineralised material that contain high grade mineralisation that is not continuous and
represents discrete zones. It is appropriate to therefore apply a top cut to the Skarn zone for
both copper and molybdenum. The histogram, log histogram and log probability plot indicate
that a top cut of 2.5% is appropriate for copper and a 0.2% top cut is appropriate for
molybdenum, see Figure 14-12 to Figure 14-15. Top cuts were also used for the other metals
within the Skarn domain as shown in Table 14-4.
Table 14-4: High Grade Top Cuts Applied – Skarn Domain
Metal Top Cut
Cu 2.5%
Mo 0.2%
Au 20 g/t
Ag 400 g/t
Pb 20%
Zn 10%
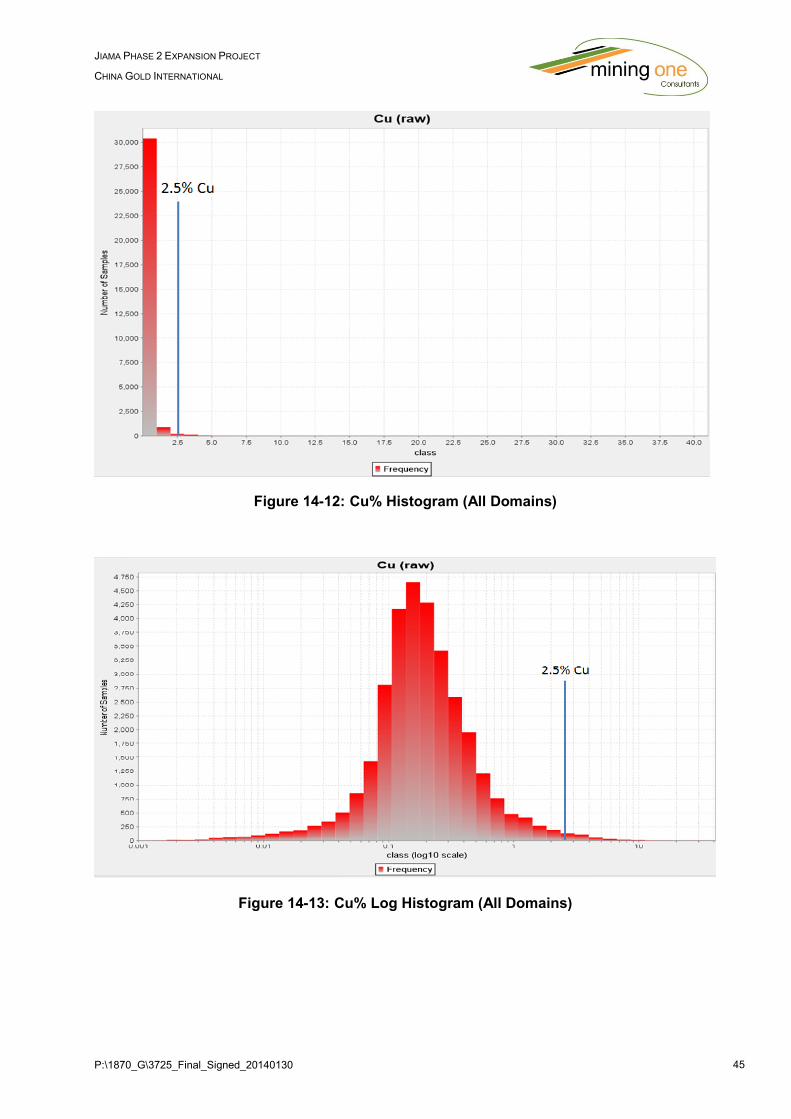
P:\1870_G\3725_Final_Signed_20140130 45
JIAMA PHASE 2 EXPANSION PROJECT
CHINA GOLD INTERNATIONAL
Figure 14-12: Cu% Histogram (All Domains)
Figure 14-13: Cu% Log Histogram (All Domains)
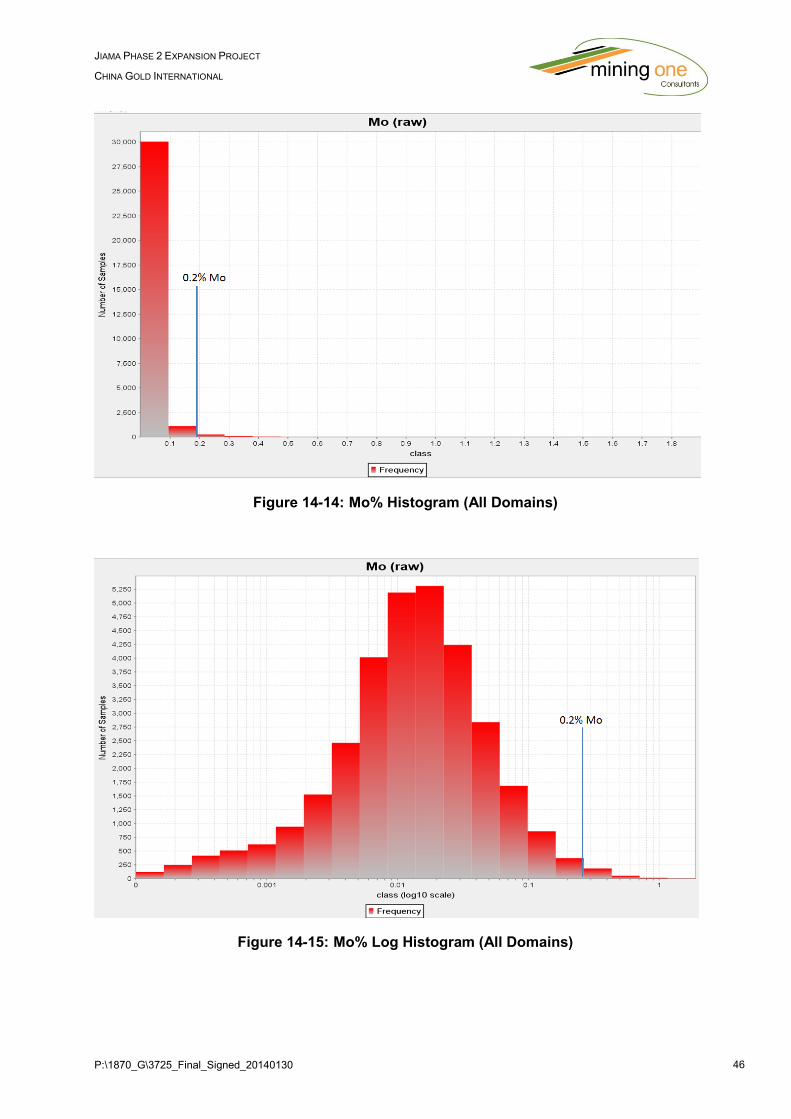
P:\1870_G\3725_Final_Signed_20140130 46
JIAMA PHASE 2 EXPANSION PROJECT
CHINA GOLD INTERNATIONAL
Figure 14-14: Mo% Histogram (All Domains)
Figure 14-15: Mo% Log Histogram (All Domains)
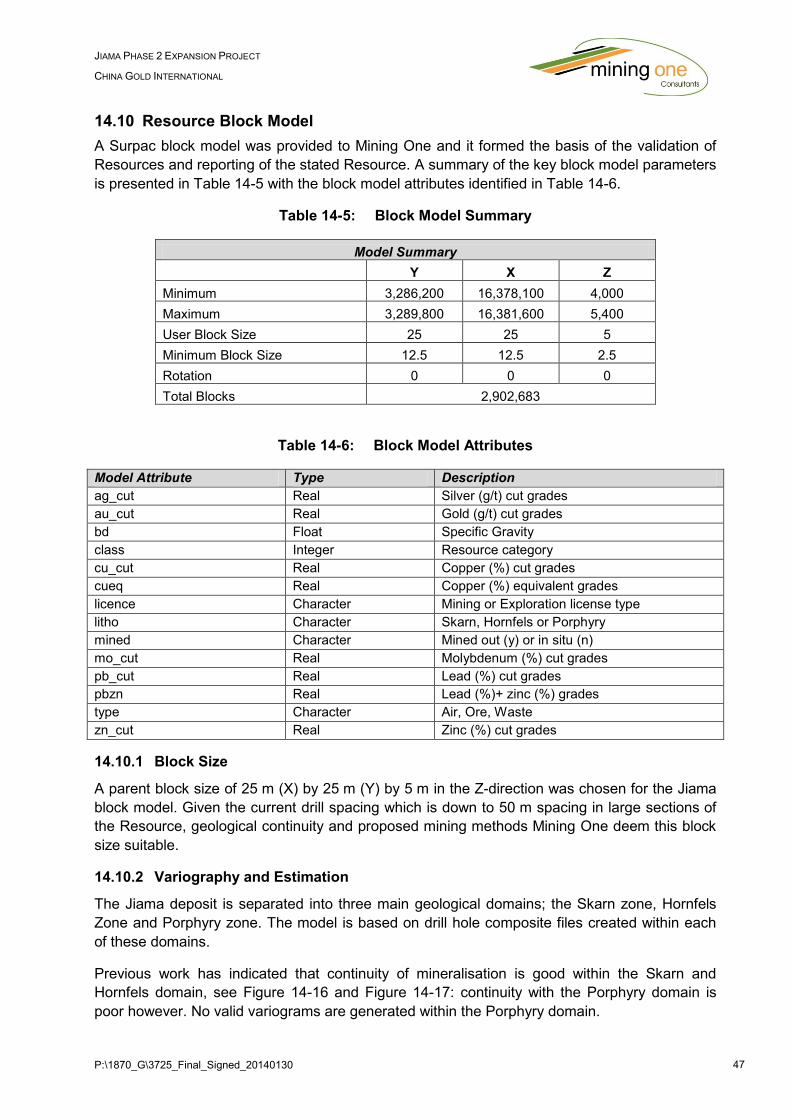
P:\1870_G\3725_Final_Signed_20140130 47
JIAMA PHASE 2 EXPANSION PROJECT
CHINA GOLD INTERNATIONAL
14.10 Resource Block Model
A Surpac block model was provided to Mining One and it formed the basis of the validation of
Resources and reporting of the stated Resource. A summary of the key block model parameters
is presented in Table 14-5 with the block model attributes identified in Table 14-6.
Table 14-5: Block Model Summary
Model Summary
Y X Z
Minimum 3,286,200 16,378,100 4,000
Maximum 3,289,800 16,381,600 5,400
User Block Size 25 25 5
Minimum Block Size 12.5 12.5 2.5
Rotation 0 0 0
Total Blocks 2,902,683
Table 14-6: Block Model Attributes
Model Attribute Type Description
ag_cut Real Silver (g/t) cut grades
au_cut Real Gold (g/t) cut grades
bd Float Specific Gravity
class Integer Resource category
cu_cut Real Copper (%) cut grades
cueq Real Copper (%) equivalent grades
licence Character Mining or Exploration license type
litho Character Skarn, Hornfels or Porphyry
mined Character Mined out (y) or in situ (n)
mo_cut Real Molybdenum (%) cut grades
pb_cut Real Lead (%) cut grades
pbzn Real Lead (%)+ zinc (%) grades
type Character Air, Ore, Waste
zn_cut Real Zinc (%) cut grades
14.10.1 Block Size
A parent block size of 25 m (X) by 25 m (Y) by 5 m in the Z-direction was chosen for the Jiama
block model. Given the current drill spacing which is down to 50 m spacing in large sections of
the Resource, geological continuity and proposed mining methods Mining One deem this block
size suitable.
14.10.2 Variography and Estimation
The Jiama deposit is separated into three main geological domains; the Skarn zone, Hornfels
Zone and Porphyry zone. The model is based on drill hole composite files created within each
of these domains.
Previous work has indicated that continuity of mineralisation is good within the Skarn and
Hornfels domain, see Figure 14-16 and Figure 14-17: continuity with the Porphyry domain is
poor however. No valid variograms are generated within the Porphyry domain.
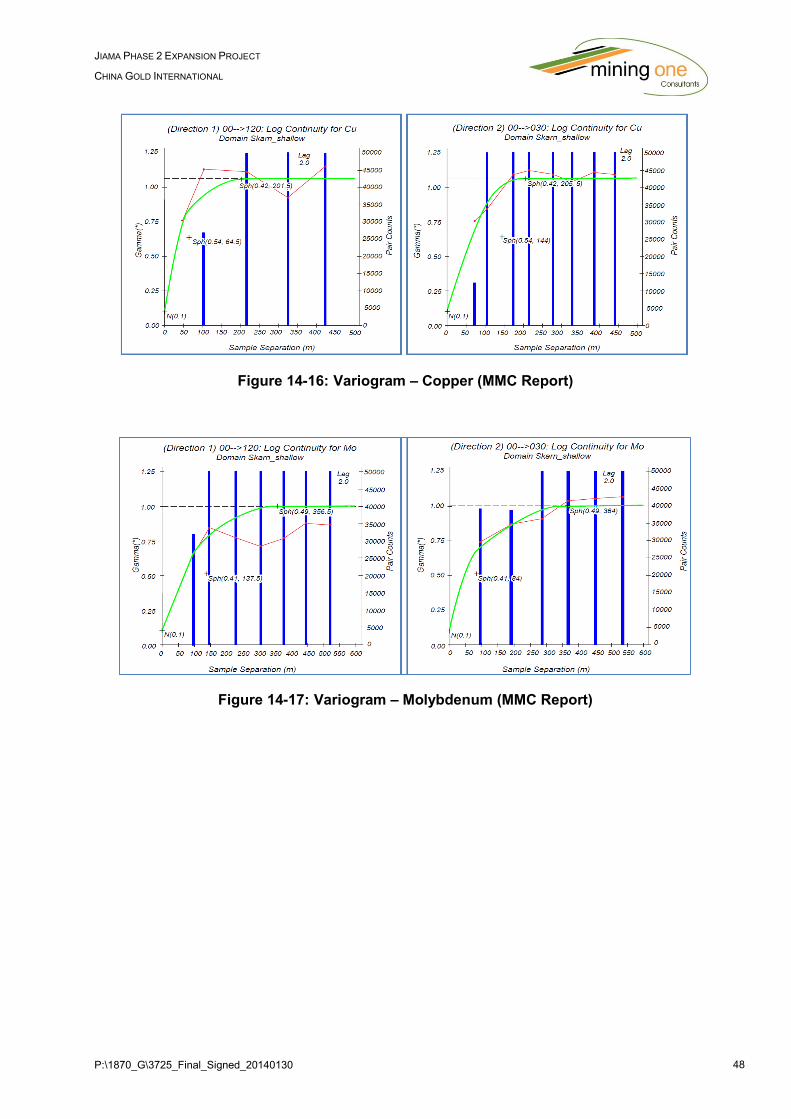
P:\1870_G\3725_Final_Signed_20140130 48
JIAMA PHASE 2 EXPANSION PROJECT
CHINA GOLD INTERNATIONAL
Figure 14-16: Variogram – Copper (MMC Report)
Figure 14-17: Variogram – Molybdenum (MMC Report)
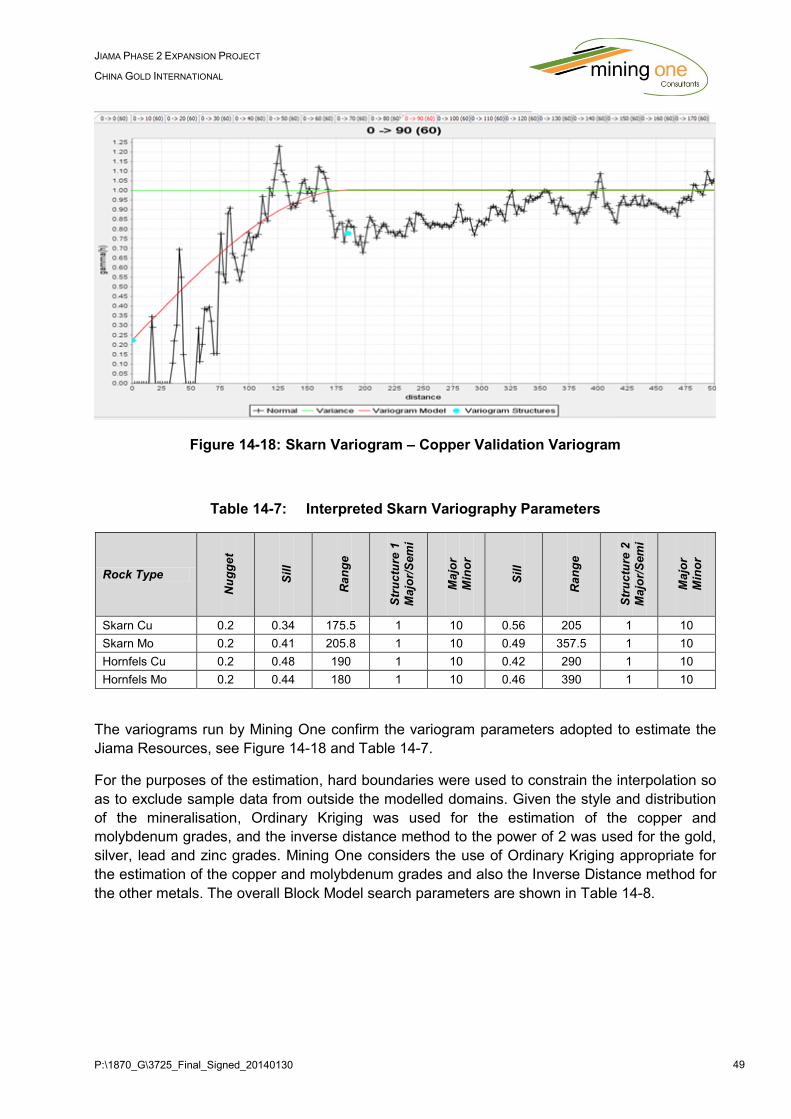
P:\1870_G\3725_Final_Signed_20140130 49
JIAMA PHASE 2 EXPANSION PROJECT
CHINA GOLD INTERNATIONAL
Figure 14-18: Skarn Variogram – Copper Validation Variogram
Table 14-7: Interpreted Skarn Variography Parameters
Rock Type
Nu
gg
et
Sil
l
Ran
ge
Str
uc
ture
1
Ma
jor/
Sem
i
Ma
jor
Min
or
Sil
l
Ran
ge
Str
uc
ture
2
Ma
jor/
Sem
i
Ma
jor
Min
or
Skarn Cu 0.2 0.34 175.5 1 10 0.56 205 1 10
Skarn Mo 0.2 0.41 205.8 1 10 0.49 357.5 1 10
Hornfels Cu 0.2 0.48 190 1 10 0.42 290 1 10
Hornfels Mo 0.2 0.44 180 1 10 0.46 390 1 10
The variograms run by Mining One confirm the variogram parameters adopted to estimate the
Jiama Resources, see Figure 14-18 and Table 14-7.
For the purposes of the estimation, hard boundaries were used to constrain the interpolation so
as to exclude sample data from outside the modelled domains. Given the style and distribution
of the mineralisation, Ordinary Kriging was used for the estimation of the copper and
molybdenum grades, and the inverse distance method to the power of 2 was used for the gold,
silver, lead and zinc grades. Mining One considers the use of Ordinary Kriging appropriate for
the estimation of the copper and molybdenum grades and also the Inverse Distance method for
the other metals. The overall Block Model search parameters are shown in Table 14-8.
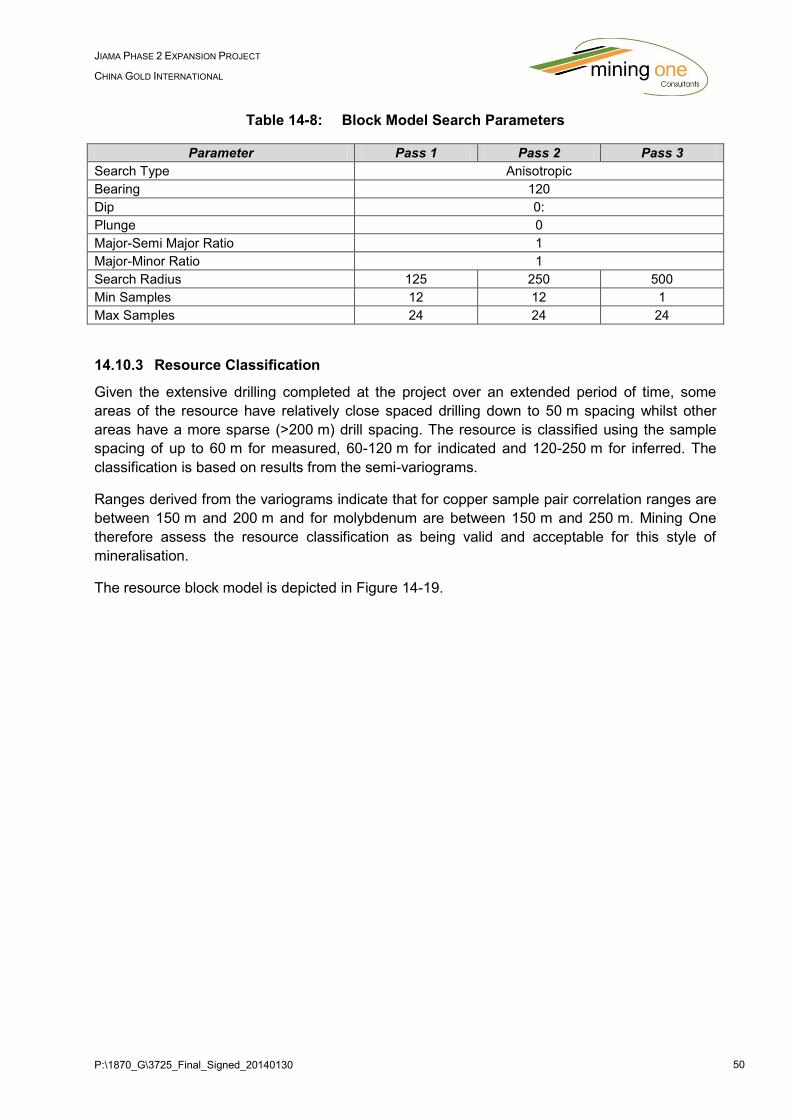
P:\1870_G\3725_Final_Signed_20140130 50
JIAMA PHASE 2 EXPANSION PROJECT
CHINA GOLD INTERNATIONAL
Table 14-8: Block Model Search Parameters
Parameter Pass 1 Pass 2 Pass 3
Search Type Anisotropic
Bearing 120
Dip 0:
Plunge 0
Major-Semi Major Ratio 1
Major-Minor Ratio 1
Search Radius 125 250 500
Min Samples 12 12 1
Max Samples 24 24 24
14.10.3 Resource Classification
Given the extensive drilling completed at the project over an extended period of time, some
areas of the resource have relatively close spaced drilling down to 50 m spacing whilst other
areas have a more sparse (>200 m) drill spacing. The resource is classified using the sample
spacing of up to 60 m for measured, 60-120 m for indicated and 120-250 m for inferred. The
classification is based on results from the semi-variograms.
Ranges derived from the variograms indicate that for copper sample pair correlation ranges are
between 150 m and 200 m and for molybdenum are between 150 m and 250 m. Mining One
therefore assess the resource classification as being valid and acceptable for this style of
mineralisation.
The resource block model is depicted in Figure 14-19.
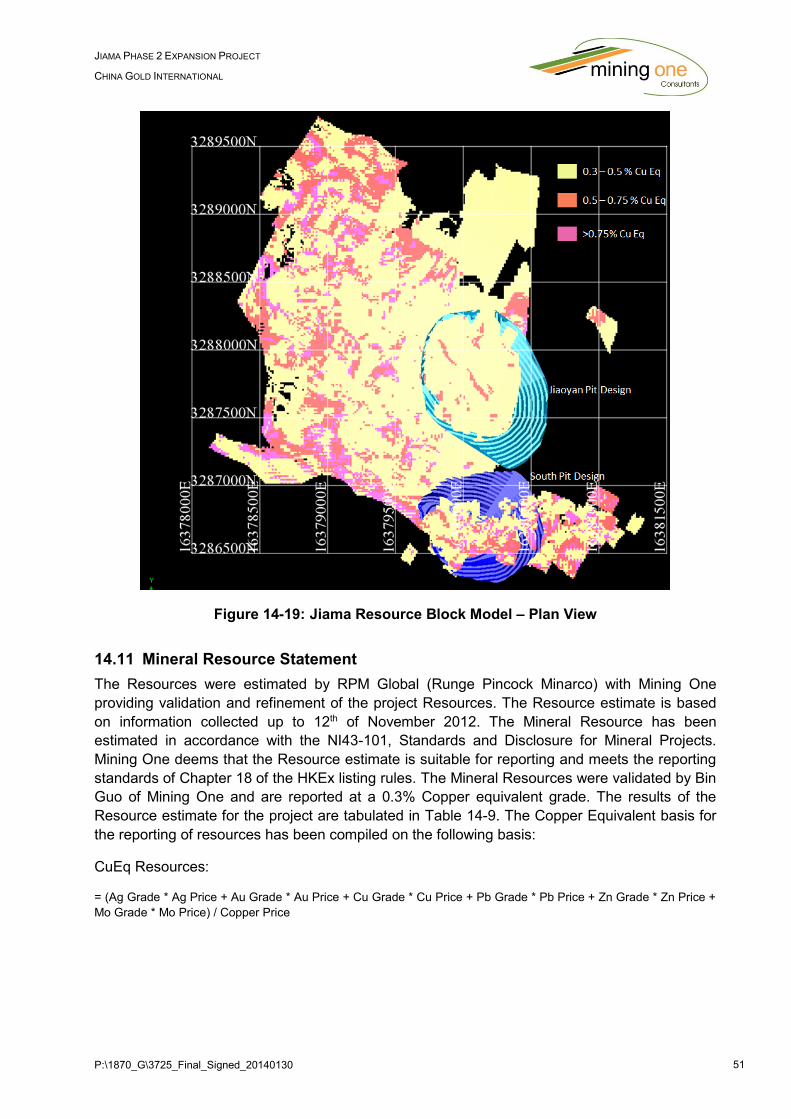
P:\1870_G\3725_Final_Signed_20140130 51
JIAMA PHASE 2 EXPANSION PROJECT
CHINA GOLD INTERNATIONAL
Figure 14-19: Jiama Resource Block Model – Plan View
14.11 Mineral Resource Statement
The Resources were estimated by RPM Global (Runge Pincock Minarco) with Mining One
providing validation and refinement of the project Resources. The Resource estimate is based
on information collected up to 12th of November 2012. The Mineral Resource has been
estimated in accordance with the NI43-101, Standards and Disclosure for Mineral Projects.
Mining One deems that the Resource estimate is suitable for reporting and meets the reporting
standards of Chapter 18 of the HKEx listing rules. The Mineral Resources were validated by Bin
Guo of Mining One and are reported at a 0.3% Copper equivalent grade. The results of the
Resource estimate for the project are tabulated in Table 14-9. The Copper Equivalent basis for
the reporting of resources has been compiled on the following basis:
CuEq Resources:
= (Ag Grade * Ag Price + Au Grade * Au Price + Cu Grade * Cu Price + Pb Grade * Pb Price + Zn Grade * Zn Price +
Mo Grade * Mo Price) / Copper Price

P:\1870_G\3725_Final_Signed_20140130 52
JIAMA PHASE 2 EXPANSION PROJECT
CHINA GOLD INTERNATIONAL
Table 14-9: Mineral Resource Statement
Jiama Copper - Polymetallic Project Resources. Cu, Mo, Pb, Zn, Au & Ag Mineral Resources (Cueq>0.3%) reported as at November 2012
Measured 42.8 0.66 0.041 0.06 0.04 0.22 13.39 281 17 28 19 0.304 18.429
Indicated 453.0 0.69 0.040 0.15 0.09 0.27 15.59 3114 183 676 399 3.901 227.094
M+I 495.8 0.68 0.040 0.14 0.08 0.26 15.40 3395 200 704 417 4.205 245.523
Inferred 125.5 0.46 0.038 0.20 0.10 0.19 11.90 577 47 248 125 0.750 47.995
Measured 54.9 0.23 0.031 0.03 0.01 0.02 1.32 127 17 15 5 0.041 2.330
Indicated 852.9 0.28 0.030 0.01 0.01 0.03 1.38 2368 253 69 64 0.909 37.733
M+I 907.8 0.27 0.030 0.01 0.01 0.03 1.37 2496 270 84 69 0.950 40.063
Inferred 276.6 0.24 0.026 0.02 0.02 0.06 2.10 660 73 63 49 0.562 18.644
Measured 2.6 0.26 0.049 0.02 0.01 0.06 3.42 7 1 1 0 0.005 0.281
Indicated 79.9 0.30 0.039 0.01 0.01 0.07 2.93 240 31 6 8 0.174 7.522
M+I 82.4 0.30 0.040 0.01 0.01 0.07 2.94 247 33 6 8 0.179 7.803
Inferred 4.0 0.24 0.085 0.01 0.02 0.04 2.25 10 3 0 1 0.006 0.287
Measured 100.2 0.41 0.035 0.04 0.02 0.11 6.53 415 36 43 24 0.349 21.040
Indicated 1,385.8 0.41 0.034 0.05 0.03 0.11 6.11 5722 468 751 470 4.985 272.349
M+I 1,486.0 0.41 0.034 0.05 0.03 0.11 6.14 6138 503 794 495 5.334 293.389
Inferred 406.0 0.31 0.030 0.08 0.04 0.10 5.13 1247 124 312 174 1.317 66.926
Skarn
Hornfels
Porphyry
Totals
Cu Metal
Kt
RESOURCES
Rock Type ClassQuantity
MtCu % Mo% Pb% Zn% Au g/t Ag g/t
Mo Metal
Kt
Pb Metal
kt
Zn Metal
KtAu Moz Ag Moz
P:\1870_G\3725_Final_Signed_20140130 53
JIAMA PHASE 2 EXPANSION PROJECT
CHINA GOLD INTERNATIONAL
15 MINERAL RESERVE ESTIMATE
15.1 Introduction
Section 15 of this report is a review of the Feasibility Study prepared by CGDI in conjunction with
China Gold International Resources Corp (China Gold). Mining One Pty Ltd (Mining One) have
endeavoured to substantiate assumptions made in the estimation of the mineral reserves for the
proposed open pit and underground mining operations at Jiama. This estimate specifically relates
to the life of mine (LoM) Reserves estimated as part of The Study and includes the Jiaoyan and
South pits and the proposed underground phase II mine expansion.
15.2 Project Strategy
There is an economic case for the development of the Jiama Phase II project; specifically the
development of the Jiaoyan and South Pits. The project is the second phase of a growth strategy at
Jiama with Phase I already complete and operational including two open pit operations, namely
Tonggianshan and Niumatang pits. This existing operation provides a reference for a number of the
assumptions made in the estimation of the reserves.
Phase II development will see an increase in the onsite processing capacity with the construction of
a new Huatailong processing plant to treat the copper-molybdenum sulphide ores for the Project. It
is forecast that an overall rate of 14.35 Mtpa will be achieved from this plant and will complement
the existing Phase I capacity of 2.15 Mtpa.
The selected mining strategy has been developed by the CGDI in conjunction with China Gold and
is based on conventional truck shovel haulage for the open pit design and Sub-level Open Stoping
with fill for the initial underground design.
The following areas were considered by China Gold in the development of the Phase II strategy:
Open pit and underground mining methodology;
Mine geology;
Mine hydrology and hydrogeology;
Mine geotechnical engineering;
Material characteristics, geotechnical, and hydrological considerations;
Selection of a suitable mining and material handling concept;
Selection of suitable mining method and equipment concept;
Mining cost;
Metallurgical recovery and engineering studies;

P:\1870_G\3725_Final_Signed_20140130 54
JIAMA PHASE 2 EXPANSION PROJECT
CHINA GOLD INTERNATIONAL
Mine design of the selected concept; and
High level economic analysis of the selected concept.
Meanwhile, factors considered in formulating the strategy include:
Deposit characteristics;
Material characteristics;
Topographic profile;
Results of previous studies;
Commodity prices (copper, molybdenum, gold, silver, lead, zinc);
Pastefill and Waste placement strategy;
Contract mining scenario;
Geological interpretation; and
Potential mine life.
Excavation for the open pit will be carried out by contract workforce with contracts already
established for a bulk of the work. Agreements are in place for the open pit mining with
underground agreements in final signoff at the time of writing. The scope of all mining contracts is
inclusive of all consumables including drilling, blasting, loading hauling, excavation and services.
Contract rates incorporate the establishment of accommodation and maintenance facilities for the
respective contracts as well as all service equipment associated with the upkeep and maintenance
of the contract equipment. China Gold has included provision for technical services to provide
design and scheduling services along with all survey and contract management requirements.
Rates quoted by the respective contractors have been adopted as the foundation for the mining
costs in this evaluation. Mining One have sighted copies of the contractual rates upon which all
costing has been based. It should be noted that the rates are comparable with mining costs at other
open pit mines in China. Contingency has been factored in to allow for the upkeep and
management of the mining areas by China Gold.
Two separate contractors have been selected to carry out mining in the initial mining areas for the
underground mine:
The 14th Metallurgical Construction Corporation Ltd, Yunnan
The 14th Metallurgical Construction Corporation Ltd, China
The first seven years of the underground schedule has been designed and scheduled using CAE’s
Studio 5D Planner. The initial 2 years of operation has been aligned with the site operational plan.
Beyond the initial seven year plan, stopes based on MSO shapes have been used to define
mineable stopes for subsequent scheduling.
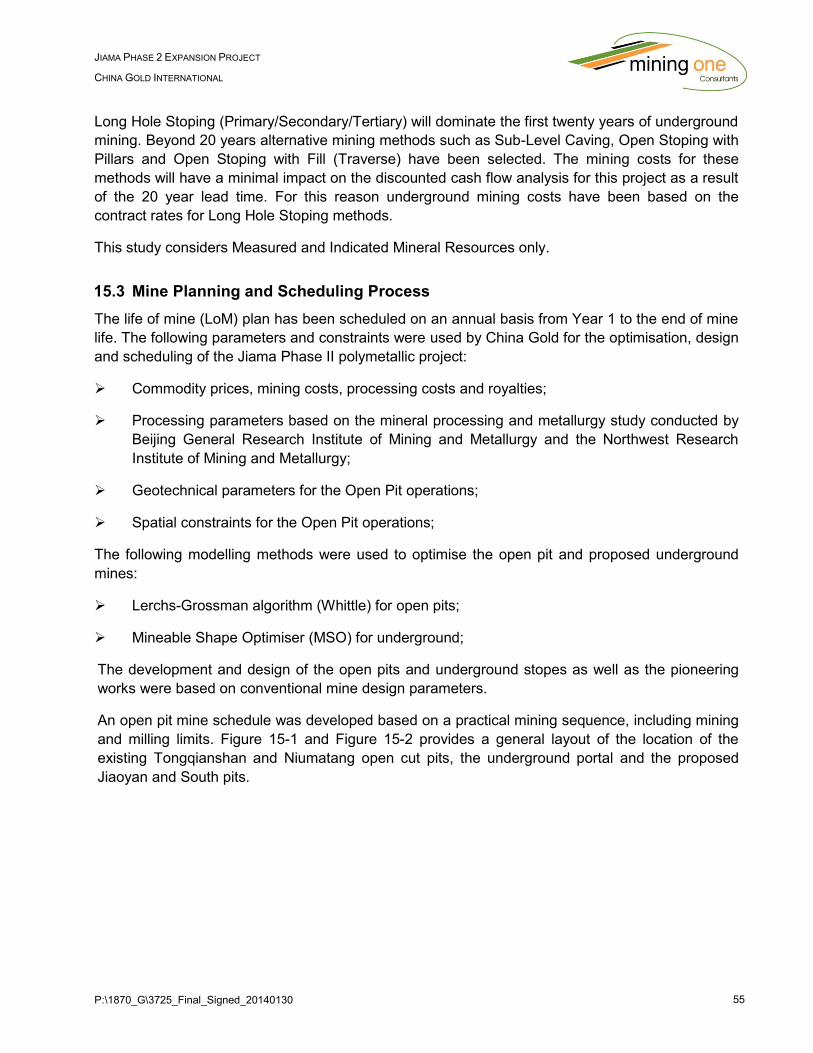
P:\1870_G\3725_Final_Signed_20140130 55
JIAMA PHASE 2 EXPANSION PROJECT
CHINA GOLD INTERNATIONAL
Long Hole Stoping (Primary/Secondary/Tertiary) will dominate the first twenty years of underground
mining. Beyond 20 years alternative mining methods such as Sub-Level Caving, Open Stoping with
Pillars and Open Stoping with Fill (Traverse) have been selected. The mining costs for these
methods will have a minimal impact on the discounted cash flow analysis for this project as a result
of the 20 year lead time. For this reason underground mining costs have been based on the
contract rates for Long Hole Stoping methods.
This study considers Measured and Indicated Mineral Resources only.
15.3 Mine Planning and Scheduling Process
The life of mine (LoM) plan has been scheduled on an annual basis from Year 1 to the end of mine
life. The following parameters and constraints were used by China Gold for the optimisation, design
and scheduling of the Jiama Phase II polymetallic project:
Commodity prices, mining costs, processing costs and royalties;
Processing parameters based on the mineral processing and metallurgy study conducted by
Beijing General Research Institute of Mining and Metallurgy and the Northwest Research
Institute of Mining and Metallurgy;
Geotechnical parameters for the Open Pit operations;
Spatial constraints for the Open Pit operations;
The following modelling methods were used to optimise the open pit and proposed underground
mines:
Lerchs-Grossman algorithm (Whittle) for open pits;
Mineable Shape Optimiser (MSO) for underground;
The development and design of the open pits and underground stopes as well as the pioneering
works were based on conventional mine design parameters.
An open pit mine schedule was developed based on a practical mining sequence, including mining
and milling limits. Figure 15-1 and Figure 15-2 provides a general layout of the location of the
existing Tongqianshan and Niumatang open cut pits, the underground portal and the proposed
Jiaoyan and South pits.
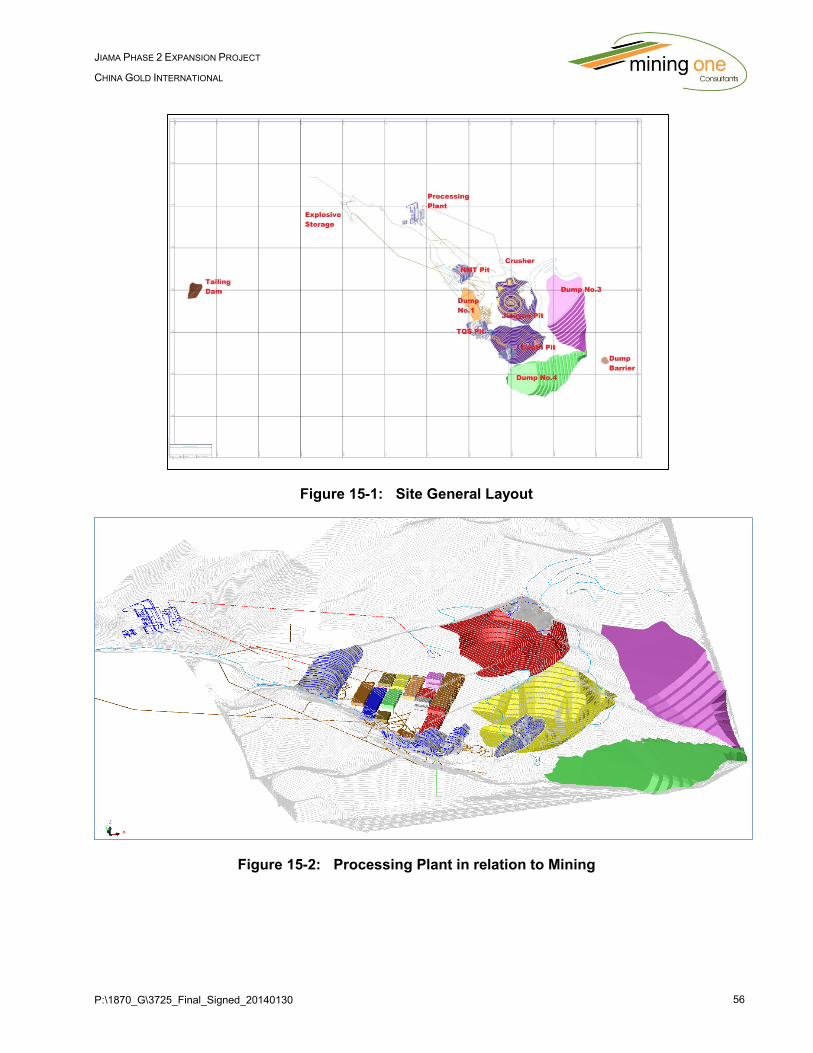
P:\1870_G\3725_Final_Signed_20140130 56
JIAMA PHASE 2 EXPANSION PROJECT
CHINA GOLD INTERNATIONAL
Figure 15-1: Site General Layout
Figure 15-2: Processing Plant in relation to Mining
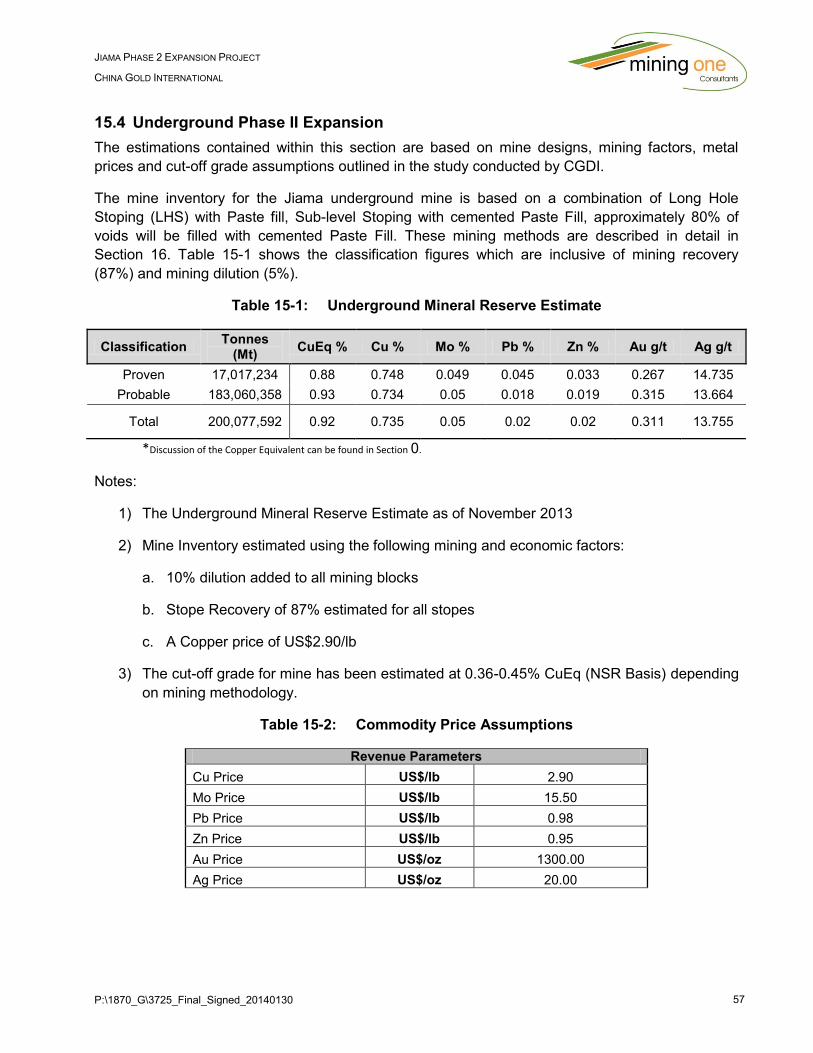
P:\1870_G\3725_Final_Signed_20140130 57
JIAMA PHASE 2 EXPANSION PROJECT
CHINA GOLD INTERNATIONAL
15.4 Underground Phase II Expansion
The estimations contained within this section are based on mine designs, mining factors, metal
prices and cut-off grade assumptions outlined in the study conducted by CGDI.
The mine inventory for the Jiama underground mine is based on a combination of Long Hole
Stoping (LHS) with Paste fill, Sub-level Stoping with cemented Paste Fill, approximately 80% of
voids will be filled with cemented Paste Fill. These mining methods are described in detail in
Section 16. Table 15-1 shows the classification figures which are inclusive of mining recovery
(87%) and mining dilution (5%).
Table 15-1: Underground Mineral Reserve Estimate
Classification Tonnes
(Mt) CuEq % Cu % Mo % Pb % Zn % Au g/t Ag g/t
Proven 17,017,234 0.88 0.748 0.049 0.045 0.033 0.267 14.735
Probable 183,060,358 0.93 0.734 0.05 0.018 0.019 0.315 13.664
Total 200,077,592 0.92 0.735 0.05 0.02 0.02 0.311 13.755
*Discussion of the Copper Equivalent can be found in Section 0.
Notes:
1) The Underground Mineral Reserve Estimate as of November 2013
2) Mine Inventory estimated using the following mining and economic factors:
a. 10% dilution added to all mining blocks
b. Stope Recovery of 87% estimated for all stopes
c. A Copper price of US$2.90/lb
3) The cut-off grade for mine has been estimated at 0.36-0.45% CuEq (NSR Basis) depending
on mining methodology.
Table 15-2: Commodity Price Assumptions
Revenue Parameters
Cu Price US$/lb 2.90
Mo Price US$/lb 15.50
Pb Price US$/lb 0.98
Zn Price US$/lb 0.95
Au Price US$/oz 1300.00
Ag Price US$/oz 20.00
P:\1870_G\3725_Final_Signed_20140130 58
JIAMA PHASE 2 EXPANSION PROJECT
CHINA GOLD INTERNATIONAL
The mining sequence includes the use of a consolidated fill (Paste) in the Sub-level Open Stoping
areas to allow high proportion of pillars to be extracted in an attempt to maximise the Reserve
Estimate. Paste fill will constitute 80% of the work conducted at Jiama.
The use of Sub-level Caving (SLC) as a stoping option is considered for the upper levels of Jiama
mine, underneath the proposed open pits and is applied due to the vertical nature of this section of
the ore body. The use of this method would not require backfill and is amenable to relatively higher
rates of production. Room and Pillar mining is also considered for some of the thinner flatter lying
areas of the ore body. This has been considered only for the Life of Mine designs produced by
China Gold, Sub-level stoping is the only method considered by the CGDI for the initial 10 to 20
years of mining.
A total underground mine reserve can be found in Table 15-3.
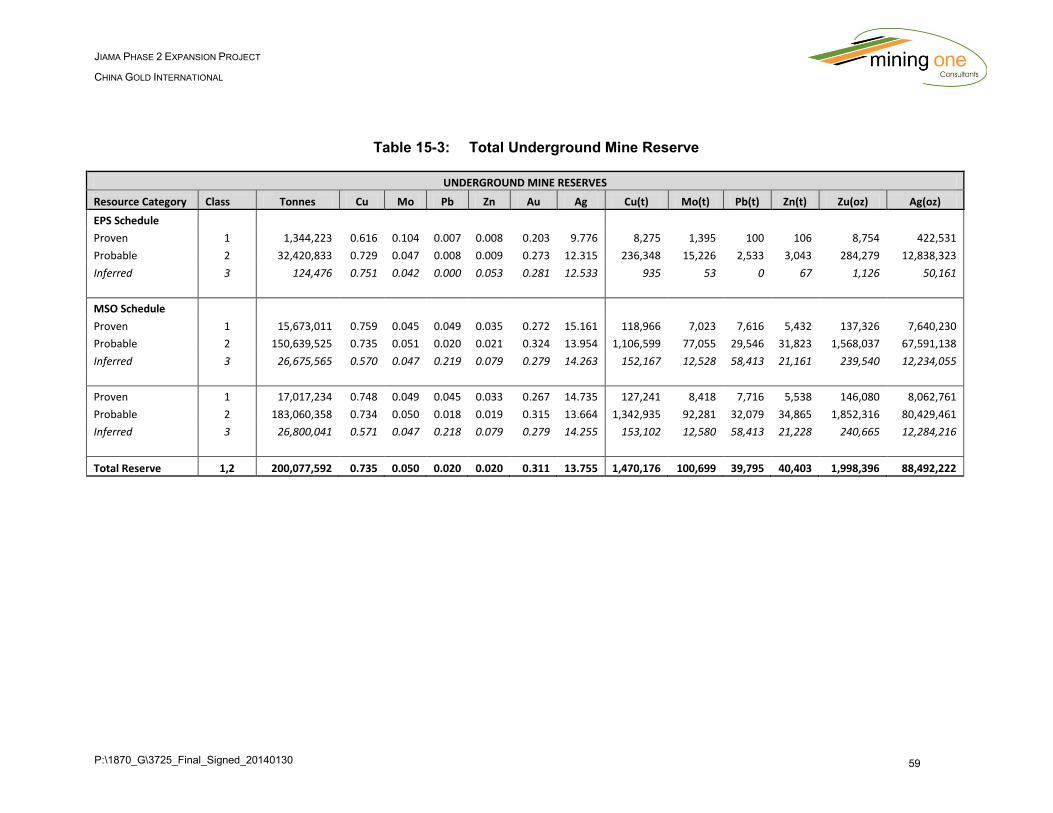
P:\1870_G\3725_Final_Signed_20140130 59
JIAMA PHASE 2 EXPANSION PROJECT
CHINA GOLD INTERNATIONAL
Table 15-3: Total Underground Mine Reserve
UNDERGROUND MINE RESERVES
Resource Category Class Tonnes Cu Mo Pb Zn Au Ag Cu(t) Mo(t) Pb(t) Zn(t) Zu(oz) Ag(oz)
EPS Schedule
Proven 1 1,344,223 0.616 0.104 0.007 0.008 0.203 9.776 8,275 1,395 100 106 8,754 422,531
Probable 2 32,420,833 0.729 0.047 0.008 0.009 0.273 12.315 236,348 15,226 2,533 3,043 284,279 12,838,323
Inferred 3 124,476 0.751 0.042 0.000 0.053 0.281 12.533 935 53 0 67 1,126 50,161
MSO Schedule
Proven 1 15,673,011 0.759 0.045 0.049 0.035 0.272 15.161 118,966 7,023 7,616 5,432 137,326 7,640,230
Probable 2 150,639,525 0.735 0.051 0.020 0.021 0.324 13.954 1,106,599 77,055 29,546 31,823 1,568,037 67,591,138
Inferred 3 26,675,565 0.570 0.047 0.219 0.079 0.279 14.263 152,167 12,528 58,413 21,161 239,540 12,234,055
Proven 1 17,017,234 0.748 0.049 0.045 0.033 0.267 14.735 127,241 8,418 7,716 5,538 146,080 8,062,761
Probable 2 183,060,358 0.734 0.050 0.018 0.019 0.315 13.664 1,342,935 92,281 32,079 34,865 1,852,316 80,429,461
Inferred 3 26,800,041 0.571 0.047 0.218 0.079 0.279 14.255 153,102 12,580 58,413 21,228 240,665 12,284,216
Total Reserve 1,2 200,077,592 0.735 0.050 0.020 0.020 0.311 13.755 1,470,176 100,699 39,795 40,403 1,998,396 88,492,222

P:\1870_G\3725_Final_Signed_20140130 60
JIAMA PHASE 2 EXPANSION PROJECT
CHINA GOLD INTERNATIONAL
15.5 Mine Design Underground
15.5.1 Mining Method Description
The initial ten years of the Phase II underground operation have been designed considering;
development, ventilation, and haulage requirements to support Sub-level Stoping with fill.
Ventilation has been modelled using Ventsim 3D Mine Ventilation Software. All designs relating
to the initial ten years of Phase II were completed by CGDI. Scheduling of the CGDI mine
designs was completed using Enhanced Production Scheduler (EPS) by China Gold. China
Gold also completed life of mine reserve shapes which have then been scheduled in Microsoft
Excel using development and production factors derived from the EPS schedule.
Phase 1 of the underground is currently operational, producing approximately 2.1Mt per annum
from hand held shrinkage stoping and room and pillar mining in thin orebody areas. Ventilation
shafts, haulage shafts and conveyor drives are already in place or are currently being
developed. Figure 15-3 illustrates the new CGDI stope locations for the first 10 years of mining,
along with the Phase 1 development as it is already built.
Figure 15-3: CGDI Designed Stopes in Relation to As-built Development
15.5.2 Underground Mining - Initial Ten Years
Specific Sub-level Open Stoping designs were produced by the CGDI and transferred into
Mine24D and Enhanced Production Scheduler (EPS) by China Gold. The first 6 - 9 years of the
operation is fully designed and scheduled demonstrating the production capacity is achievable.
Mining and development factors derived from the EPS schedule were applied to the complete
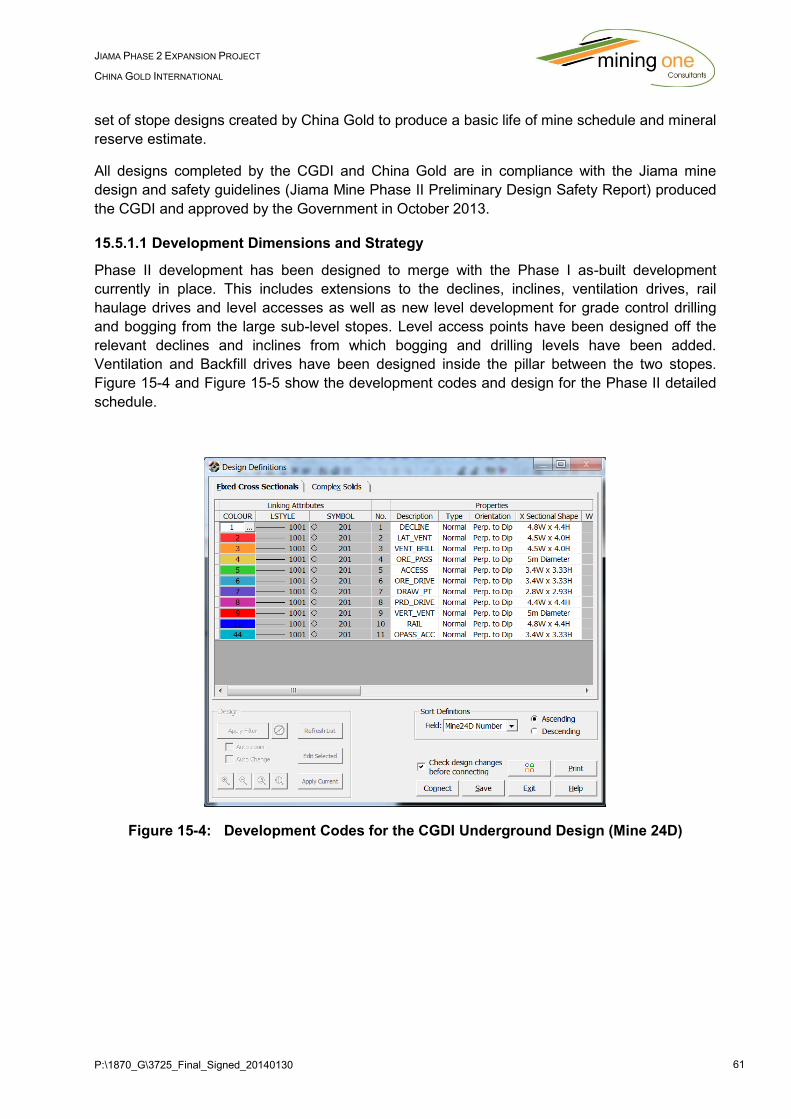
P:\1870_G\3725_Final_Signed_20140130 61
JIAMA PHASE 2 EXPANSION PROJECT
CHINA GOLD INTERNATIONAL
set of stope designs created by China Gold to produce a basic life of mine schedule and mineral
reserve estimate.
All designs completed by the CGDI and China Gold are in compliance with the Jiama mine
design and safety guidelines (Jiama Mine Phase II Preliminary Design Safety Report) produced
the CGDI and approved by the Government in October 2013.
15.5.1.1 Development Dimensions and Strategy
Phase II development has been designed to merge with the Phase I as-built development
currently in place. This includes extensions to the declines, inclines, ventilation drives, rail
haulage drives and level accesses as well as new level development for grade control drilling
and bogging from the large sub-level stopes. Level access points have been designed off the
relevant declines and inclines from which bogging and drilling levels have been added.
Ventilation and Backfill drives have been designed inside the pillar between the two stopes.
Figure 15-4 and Figure 15-5 show the development codes and design for the Phase II detailed
schedule.
Figure 15-4: Development Codes for the CGDI Underground Design (Mine 24D)
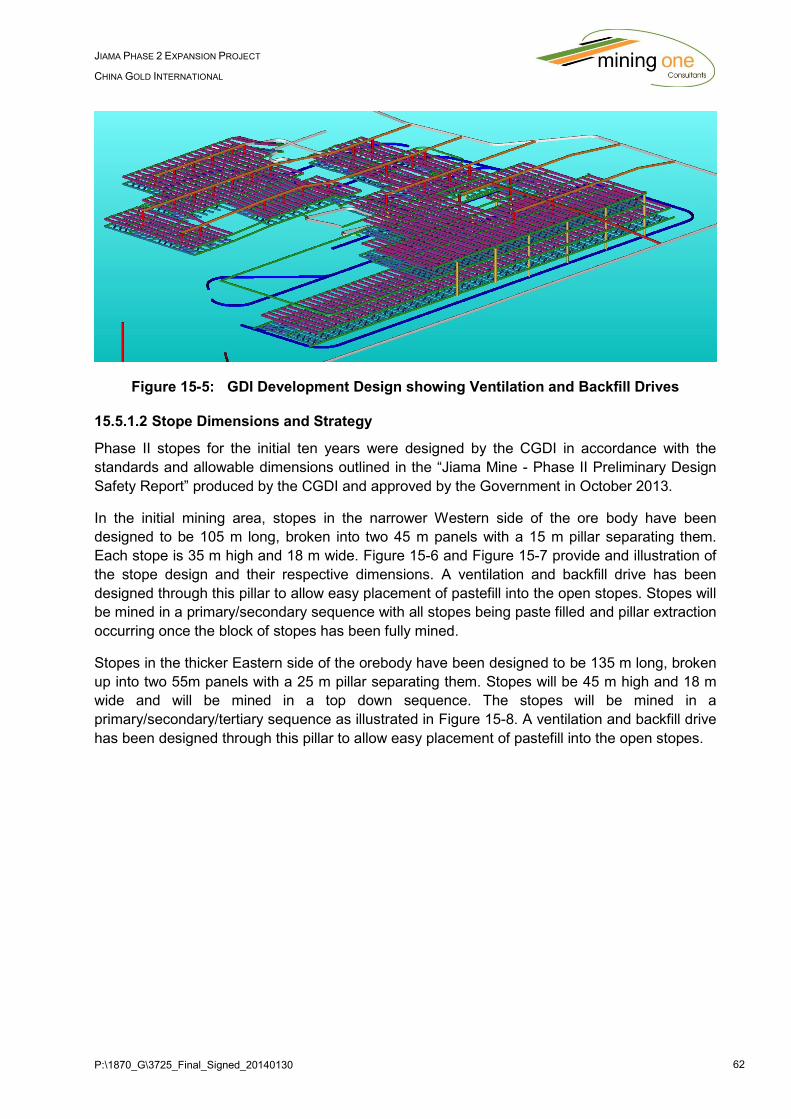
P:\1870_G\3725_Final_Signed_20140130 62
JIAMA PHASE 2 EXPANSION PROJECT
CHINA GOLD INTERNATIONAL
Figure 15-5: GDI Development Design showing Ventilation and Backfill Drives
15.5.1.2 Stope Dimensions and Strategy
Phase II stopes for the initial ten years were designed by the CGDI in accordance with the
standards and allowable dimensions outlined in the “Jiama Mine - Phase II Preliminary Design
Safety Report” produced by the CGDI and approved by the Government in October 2013.
In the initial mining area, stopes in the narrower Western side of the ore body have been
designed to be 105 m long, broken into two 45 m panels with a 15 m pillar separating them.
Each stope is 35 m high and 18 m wide. Figure 15-6 and Figure 15-7 provide and illustration of
the stope design and their respective dimensions. A ventilation and backfill drive has been
designed through this pillar to allow easy placement of pastefill into the open stopes. Stopes will
be mined in a primary/secondary sequence with all stopes being paste filled and pillar extraction
occurring once the block of stopes has been fully mined.
Stopes in the thicker Eastern side of the orebody have been designed to be 135 m long, broken
up into two 55m panels with a 25 m pillar separating them. Stopes will be 45 m high and 18 m
wide and will be mined in a top down sequence. The stopes will be mined in a
primary/secondary/tertiary sequence as illustrated in Figure 15-8. A ventilation and backfill drive
has been designed through this pillar to allow easy placement of pastefill into the open stopes.
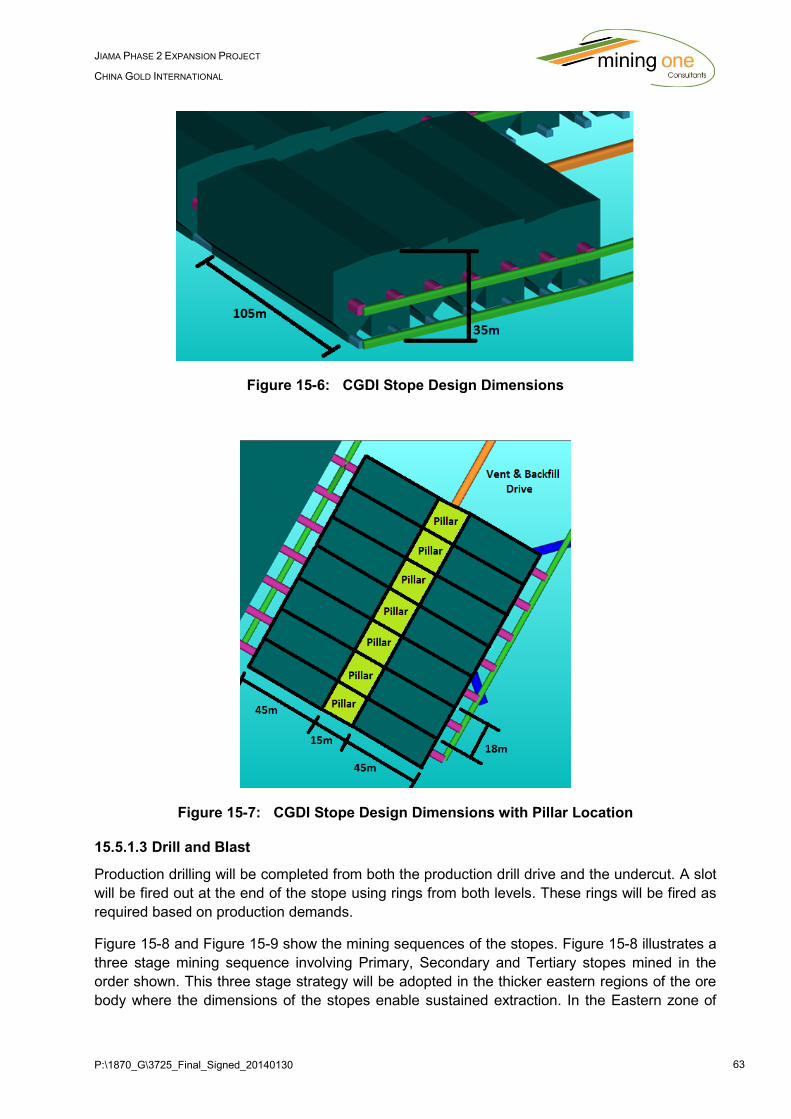
P:\1870_G\3725_Final_Signed_20140130 63
JIAMA PHASE 2 EXPANSION PROJECT
CHINA GOLD INTERNATIONAL
Figure 15-6: CGDI Stope Design Dimensions
Figure 15-7: CGDI Stope Design Dimensions with Pillar Location
15.5.1.3 Drill and Blast
Production drilling will be completed from both the production drill drive and the undercut. A slot
will be fired out at the end of the stope using rings from both levels. These rings will be fired as
required based on production demands.
Figure 15-8 and Figure 15-9 show the mining sequences of the stopes. Figure 15-8 illustrates a
three stage mining sequence involving Primary, Secondary and Tertiary stopes mined in the
order shown. This three stage strategy will be adopted in the thicker eastern regions of the ore
body where the dimensions of the stopes enable sustained extraction. In the Eastern zone of
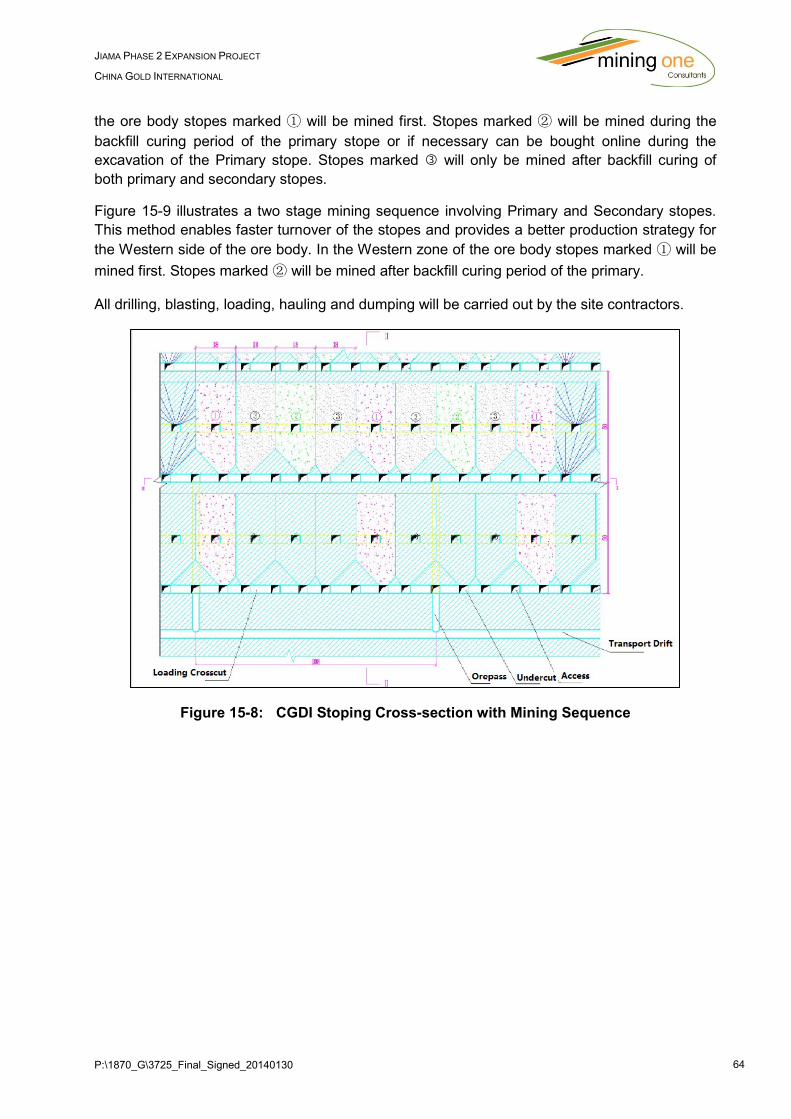
P:\1870_G\3725_Final_Signed_20140130 64
JIAMA PHASE 2 EXPANSION PROJECT
CHINA GOLD INTERNATIONAL
the ore body stopes marked ① will be mined first. Stopes marked ② will be mined during the
backfill curing period of the primary stope or if necessary can be bought online during the
excavation of the Primary stope. Stopes marked will only be mined after backfill curing of
both primary and secondary stopes.
Figure 15-9 illustrates a two stage mining sequence involving Primary and Secondary stopes.
This method enables faster turnover of the stopes and provides a better production strategy for
the Western side of the ore body. In the Western zone of the ore body stopes marked ① will be
mined first. Stopes marked ② will be mined after backfill curing period of the primary.
All drilling, blasting, loading, hauling and dumping will be carried out by the site contractors.
Figure 15-8: CGDI Stoping Cross-section with Mining Sequence

P:\1870_G\3725_Final_Signed_20140130 65
JIAMA PHASE 2 EXPANSION PROJECT
CHINA GOLD INTERNATIONAL
Figure 15-9: CGDI Stoping Cross-section with Mining Sequence for Smaller Western
Stopes
15.5.1.4 Haulage
Requirements of the ore haulage system include:
(1)Large production rate to meet 6.6Mt/annum (20000t/day);
(2)Long distance of greater than 2100m;
(3)Long life mine of greater than 30 years.
The primary ore haulage system will be bogging or remote bogging from stopes to ore passes
or stockpiles. All ore will be bogged using Toro 1400E (6m3 bucket) or equivalent based on
contractor selection. Stockpiled ore will be trucked (small capacity trucks only) to ore passes
where it will be loaded onto the rail system. The rail system will operate on the 4,450 mRL and
4,400 mRL levels which will deliver ore to the underground crusher. Once crushed, ore will be
hauled via a conveyor system to the surface then transferred to a surface conveyor and hauled
to the processing plant. The specifications for the #1 and #2 conveyors is provided below.
All haulage designs are compliant with the “Metal and nonmetal mines safety regulations”
(GB16423-2006), items 6.3.1.5- 6.3.1.10.
#1 Conveyor
Tonnage per hour: 1,685 t/h
Length: 1,986.5 m
Hoist Height: 354 m
Dip Angle: 9.84 degrees
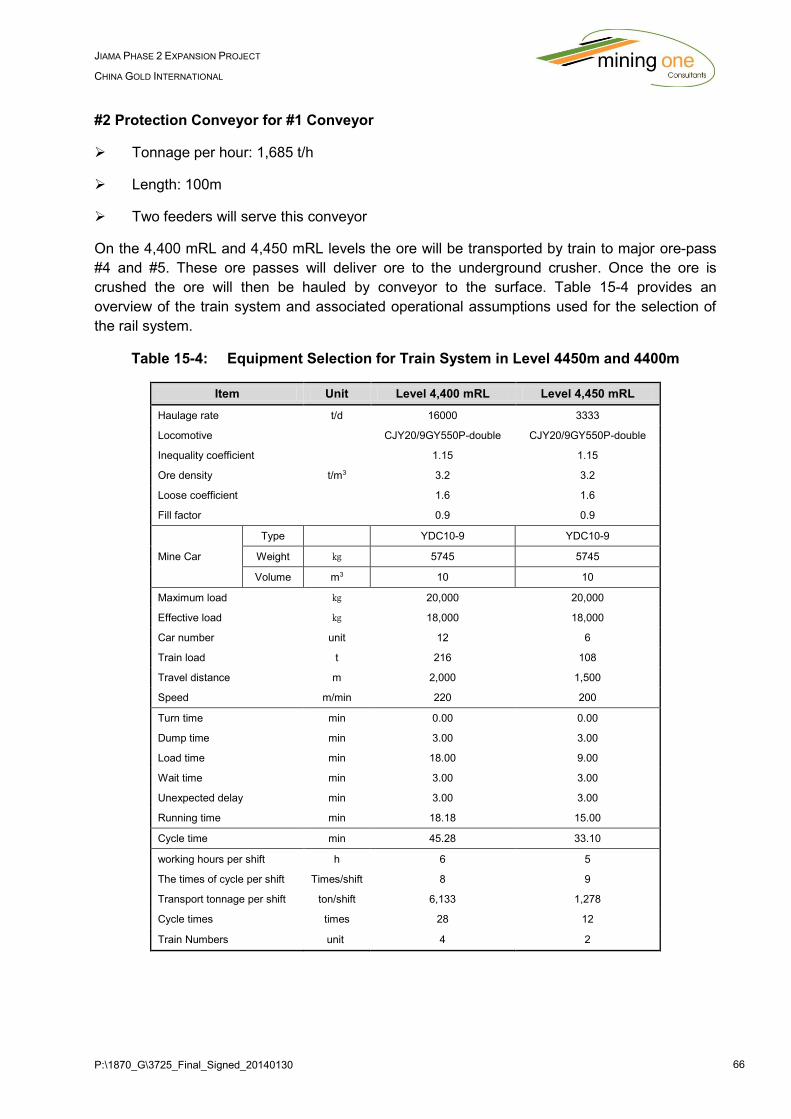
P:\1870_G\3725_Final_Signed_20140130 66
JIAMA PHASE 2 EXPANSION PROJECT
CHINA GOLD INTERNATIONAL
#2 Protection Conveyor for #1 Conveyor
Tonnage per hour: 1,685 t/h
Length: 100m
Two feeders will serve this conveyor
On the 4,400 mRL and 4,450 mRL levels the ore will be transported by train to major ore-pass
#4 and #5. These ore passes will deliver ore to the underground crusher. Once the ore is
crushed the ore will then be hauled by conveyor to the surface. Table 15-4 provides an
overview of the train system and associated operational assumptions used for the selection of
the rail system.
Table 15-4: Equipment Selection for Train System in Level 4450m and 4400m
Item Unit Level 4,400 mRL Level 4,450 mRL
Haulage rate t/d 16000 3333
Locomotive
CJY20/9GY550P-double CJY20/9GY550P-double
Inequality coefficient
1.15 1.15
Ore density t/m3 3.2 3.2
Loose coefficient
1.6 1.6
Fill factor
0.9 0.9
Mine Car
Type YDC10-9 YDC10-9
Weight ㎏ 5745 5745
Volume m3 10 10
Maximum load ㎏ 20,000 20,000
Effective load ㎏ 18,000 18,000
Car number unit 12 6
Train load t 216 108
Travel distance m 2,000 1,500
Speed m/min 220 200
Turn time min 0.00 0.00
Dump time min 3.00 3.00
Load time min 18.00 9.00
Wait time min 3.00 3.00
Unexpected delay min 3.00 3.00
Running time min 18.18 15.00
Cycle time min 45.28 33.10
working hours per shift h 6 5
The times of cycle per shift Times/shift 8 9
Transport tonnage per shift ton/shift 6,133 1,278
Cycle times times 28 12
Train Numbers unit 4 2
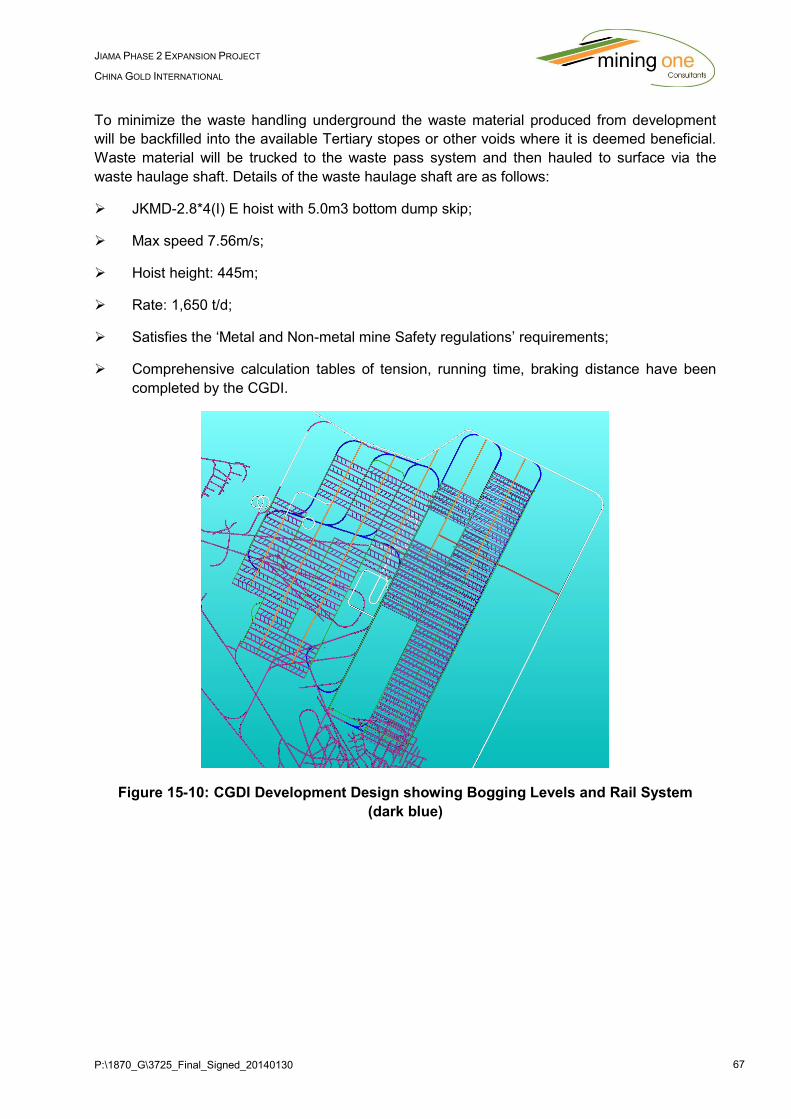
P:\1870_G\3725_Final_Signed_20140130 67
JIAMA PHASE 2 EXPANSION PROJECT
CHINA GOLD INTERNATIONAL
To minimize the waste handling underground the waste material produced from development
will be backfilled into the available Tertiary stopes or other voids where it is deemed beneficial.
Waste material will be trucked to the waste pass system and then hauled to surface via the
waste haulage shaft. Details of the waste haulage shaft are as follows:
JKMD-2.8*4(I) E hoist with 5.0m3 bottom dump skip;
Max speed 7.56m/s;
Hoist height: 445m;
Rate: 1,650 t/d;
Satisfies the ‘Metal and Non-metal mine Safety regulations’ requirements;
Comprehensive calculation tables of tension, running time, braking distance have been
completed by the CGDI.
Figure 15-10: CGDI Development Design showing Bogging Levels and Rail System
(dark blue)
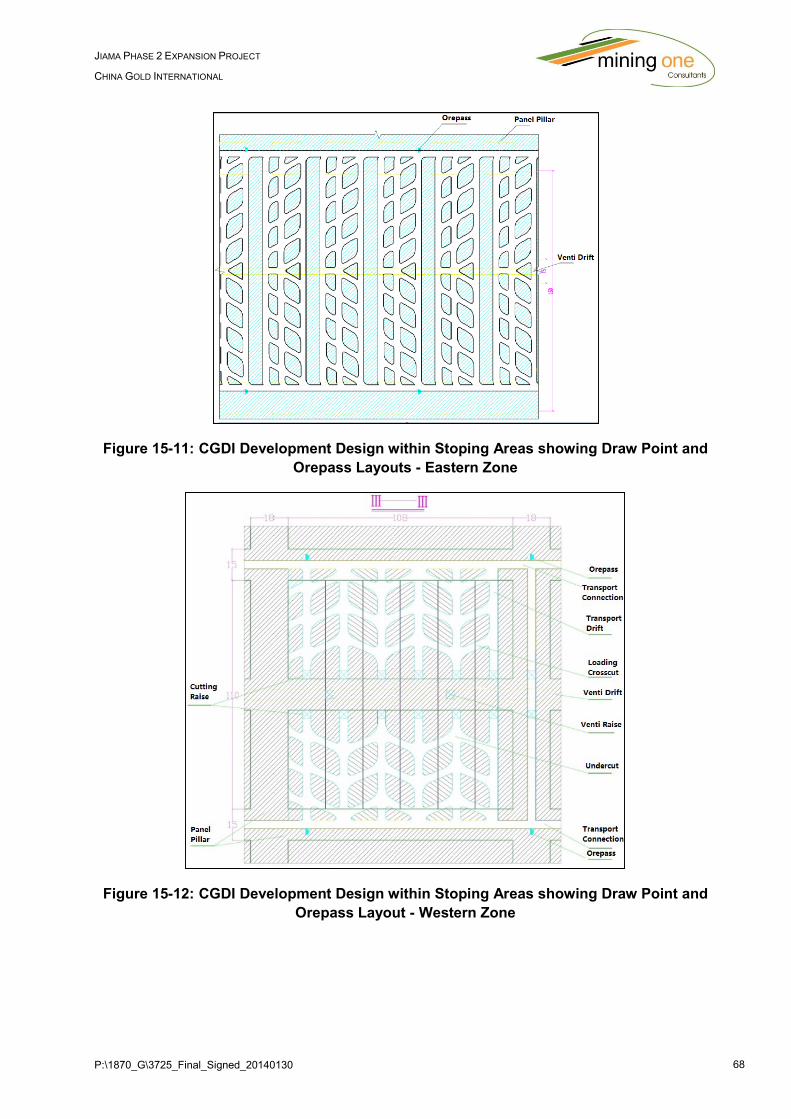
P:\1870_G\3725_Final_Signed_20140130 68
JIAMA PHASE 2 EXPANSION PROJECT
CHINA GOLD INTERNATIONAL
Figure 15-11: CGDI Development Design within Stoping Areas showing Draw Point and
Orepass Layouts - Eastern Zone
Figure 15-12: CGDI Development Design within Stoping Areas showing Draw Point and
Orepass Layout - Western Zone
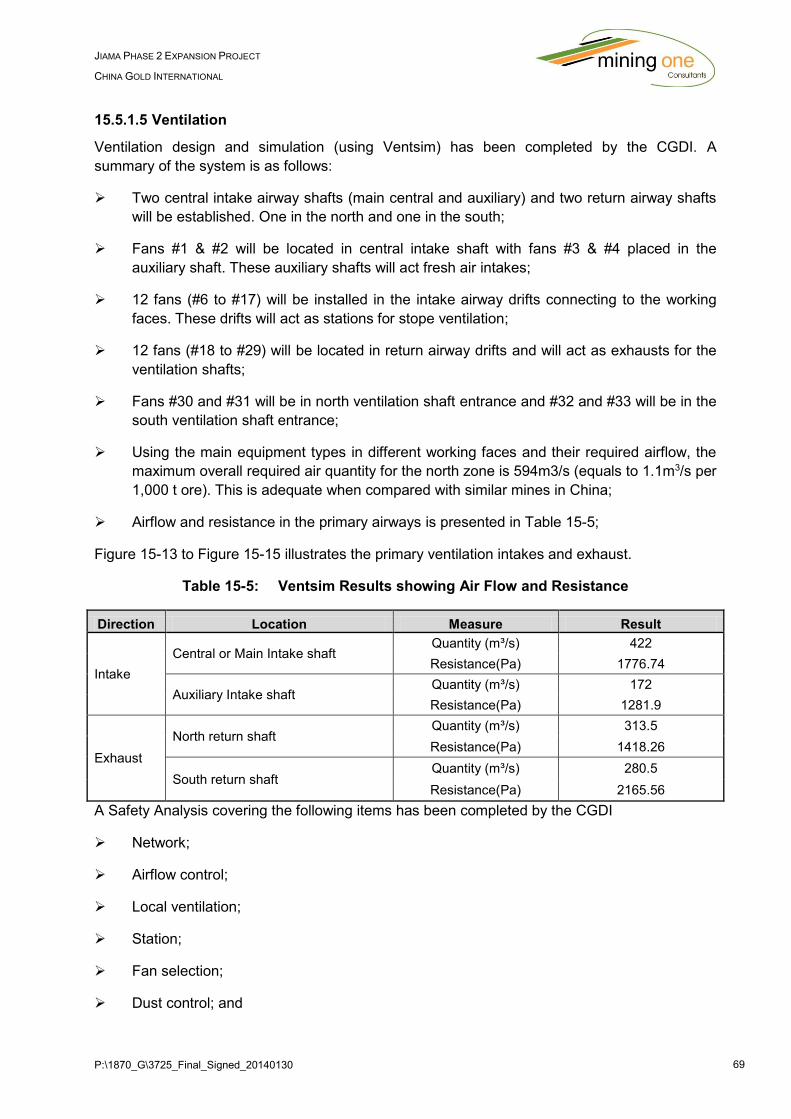
P:\1870_G\3725_Final_Signed_20140130 69
JIAMA PHASE 2 EXPANSION PROJECT
CHINA GOLD INTERNATIONAL
15.5.1.5 Ventilation
Ventilation design and simulation (using Ventsim) has been completed by the CGDI. A
summary of the system is as follows:
Two central intake airway shafts (main central and auxiliary) and two return airway shafts
will be established. One in the north and one in the south;
Fans #1 & #2 will be located in central intake shaft with fans #3 & #4 placed in the
auxiliary shaft. These auxiliary shafts will act fresh air intakes;
12 fans (#6 to #17) will be installed in the intake airway drifts connecting to the working
faces. These drifts will act as stations for stope ventilation;
12 fans (#18 to #29) will be located in return airway drifts and will act as exhausts for the
ventilation shafts;
Fans #30 and #31 will be in north ventilation shaft entrance and #32 and #33 will be in the
south ventilation shaft entrance;
Using the main equipment types in different working faces and their required airflow, the
maximum overall required air quantity for the north zone is 594m3/s (equals to 1.1m3/s per
1,000 t ore). This is adequate when compared with similar mines in China;
Airflow and resistance in the primary airways is presented in Table 15-5;
Figure 15-13 to Figure 15-15 illustrates the primary ventilation intakes and exhaust.
Table 15-5: Ventsim Results showing Air Flow and Resistance
Direction Location Measure Result
Intake
Central or Main Intake shaft Quantity (m³/s) 422
Resistance(Pa) 1776.74
Auxiliary Intake shaft Quantity (m³/s) 172
Resistance(Pa) 1281.9
Exhaust
North return shaft Quantity (m³/s) 313.5
Resistance(Pa) 1418.26
South return shaft Quantity (m³/s) 280.5
Resistance(Pa) 2165.56
A Safety Analysis covering the following items has been completed by the CGDI
Network;
Airflow control;
Local ventilation;
Station;
Fan selection;
Dust control; and
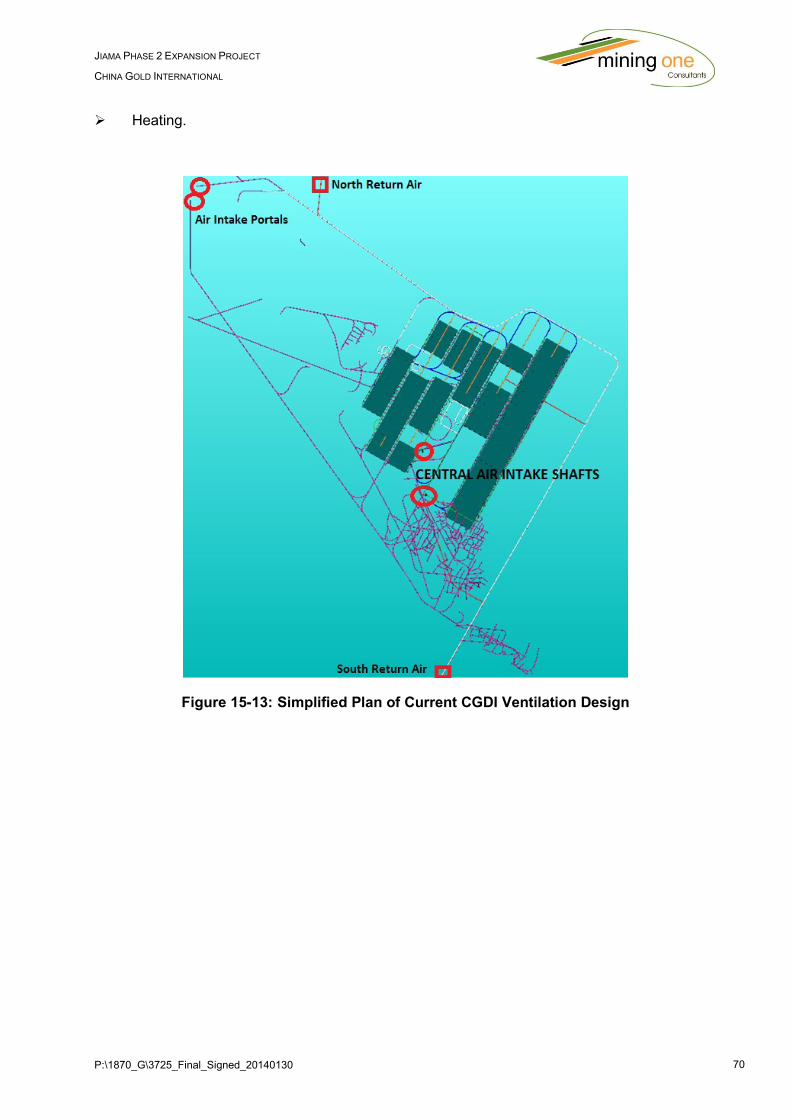
P:\1870_G\3725_Final_Signed_20140130 70
JIAMA PHASE 2 EXPANSION PROJECT
CHINA GOLD INTERNATIONAL
Heating.
Figure 15-13: Simplified Plan of Current CGDI Ventilation Design
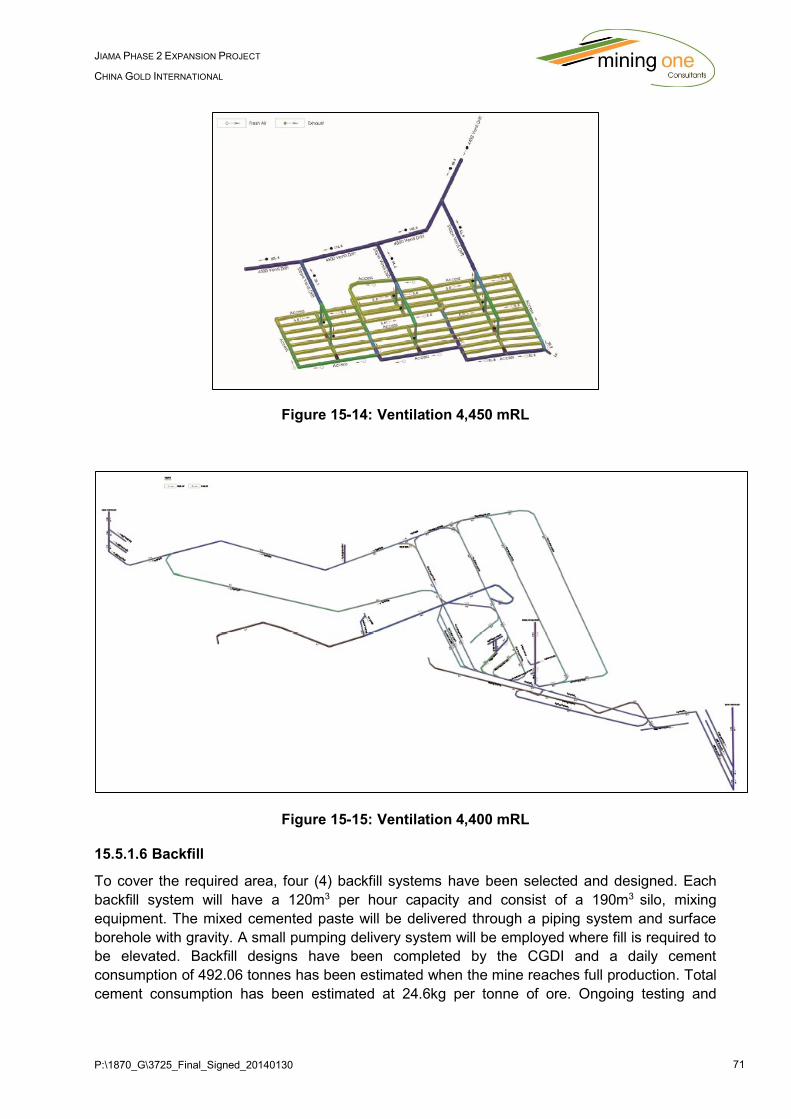
P:\1870_G\3725_Final_Signed_20140130 71
JIAMA PHASE 2 EXPANSION PROJECT
CHINA GOLD INTERNATIONAL
Figure 15-14: Ventilation 4,450 mRL
Figure 15-15: Ventilation 4,400 mRL
15.5.1.6 Backfill
To cover the required area, four (4) backfill systems have been selected and designed. Each
backfill system will have a 120m3 per hour capacity and consist of a 190m3 silo, mixing
equipment. The mixed cemented paste will be delivered through a piping system and surface
borehole with gravity. A small pumping delivery system will be employed where fill is required to
be elevated. Backfill designs have been completed by the CGDI and a daily cement
consumption of 492.06 tonnes has been estimated when the mine reaches full production. Total
cement consumption has been estimated at 24.6kg per tonne of ore. Ongoing testing and

P:\1870_G\3725_Final_Signed_20140130 72
JIAMA PHASE 2 EXPANSION PROJECT
CHINA GOLD INTERNATIONAL
analysis of the backfill will occur once the mine is operational to ensure it provides adequate
support for the top down mining strategy that has been planned.
It is envisaged that paste will be transferred via surface drill holes and transported to the
required stopes through a series of pipes and drill holes as required. The ventilation drives
located within the pillars will serve as backfill drives and will host dual pipes for the purpose of
transporting the backfill paste. Figure 15-16 illustrates the location of the pipe network for the
backfill system. Once a stope has been mined, a paste hole will be drilled from the ventilation
drive into the top of the stope and paste reticulation pipes connected as required to enable the
backfill process to occur.
Figure 15-16: Plan View of Current CGDI Backfill Drives (orange)
15.5.3 Underground Mining beyond Ten Years
Minarco Mineconsult conducted a “Prefeasibility Study Technical Report” in November 2012 in
which a number of potential mining methods were considered. Methods are appropriate for the
criteria specified and the following is a summary of the areas and the mining methods
considered. These methods are considered for underground mining beyond the initial 10 years
of operation and will be further developed as mining continues and further operational
knowledge is gained.
The ore body orientation and thickness are the main determining factors in mining method
selection. Table 15-6 provides a summary of the different mining method and the operational
dimensions for their selection.
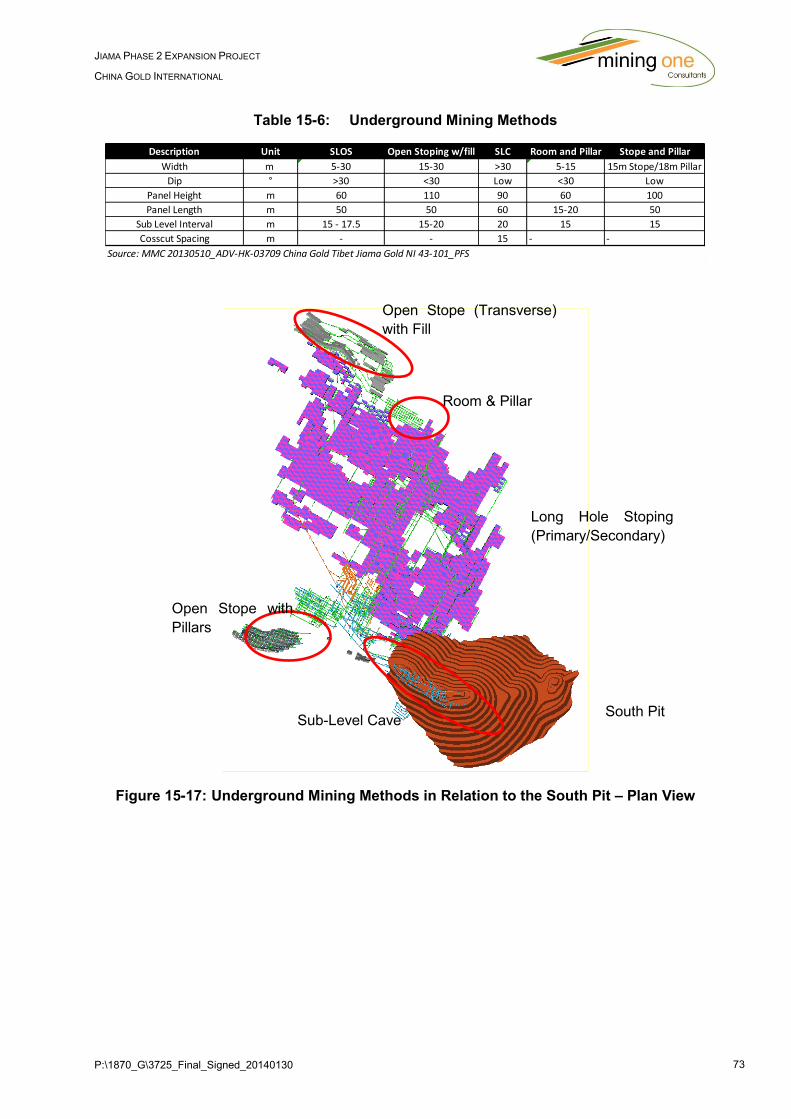
P:\1870_G\3725_Final_Signed_20140130 73
JIAMA PHASE 2 EXPANSION PROJECT
CHINA GOLD INTERNATIONAL
Table 15-6: Underground Mining Methods
Figure 15-17: Underground Mining Methods in Relation to the South Pit – Plan View
Description Unit SLOS Open Stoping w/fill SLC Room and Pillar Stope and Pillar
Width m 5-30 15-30 >30 5-15 15m Stope/18m Pillar
Dip ° >30 <30 Low <30 Low
Panel Height m 60 110 90 60 100
Panel Length m 50 50 60 15-20 50
Sub Level Interval m 15 - 17.5 15-20 20 15 15
Cosscut Spacing m - - 15 - -
Source: MMC 20130510_ADV-HK-03709 China Gold Tibet Jiama Gold NI 43-101_PFS
Sub-Level Cave
Open Stope with
Pillars
Open Stope (Transverse)
with Fill
Room & Pillar
Long Hole Stoping
(Primary/Secondary)
South Pit

P:\1870_G\3725_Final_Signed_20140130 74
JIAMA PHASE 2 EXPANSION PROJECT
CHINA GOLD INTERNATIONAL
Figure 15-18: Underground Mining Methods in Relation to the South Pit - Oblique View
15.5.4 Sub-Level Open Stoping with Fill (Primary/Secondary/Tertiary)
This method is considered for the extraction of ore from shallow dipping ore bodies with
thicknesses greater than 30 m;
Mining panels 120 m wide and 100 m long will be established. The length of the mining
panel will be divided into 15 m wide primary and 18 m wide secondary stope panels;
The primary stopes will be backfilled with paste fill using 75% tailings and an average
cement to solid ratio of 1:8. The secondary stopes will be filled with 75% tailings and 1.5%
cement;
Pillar recovery will be undertaken by cut and fill mining for any pillars remaining;
Production using this method is scheduled at 1,000 tpd per stope;
The estimated dilution will be 10% and the recovery of 87%;
This method is forecast to be used for the first 10 years of operation, with the post-mining
backfill providing additional ground stabilisation of the rock mass, while open pit
operations continue.
Sub-Level Cave
Open Stope with
Pillars
Room & Pillar Open Stope (Transverse)
with Fill
Long Hole Stoping
(Primary/Secondary)

P:\1870_G\3725_Final_Signed_20140130 75
JIAMA PHASE 2 EXPANSION PROJECT
CHINA GOLD INTERNATIONAL
Figure 15-19: Longhole Stoping showing Primary and Secondary Stopes
15.5.5 Sub-Level Caving
This method is considered where the ore is inclined and greater than 30 m thick;
The sublevel cave crosscut interval is assumed to be 20m with a sublevel spacing of 25
m;
Dilution is estimated at 13% and the recovery 80%;
Production using this method is forecast at approximately 1,500 tpd per stope;
This method will be used to break through to the bottom of the open pit and will not
commence until open pit mining has been completed.
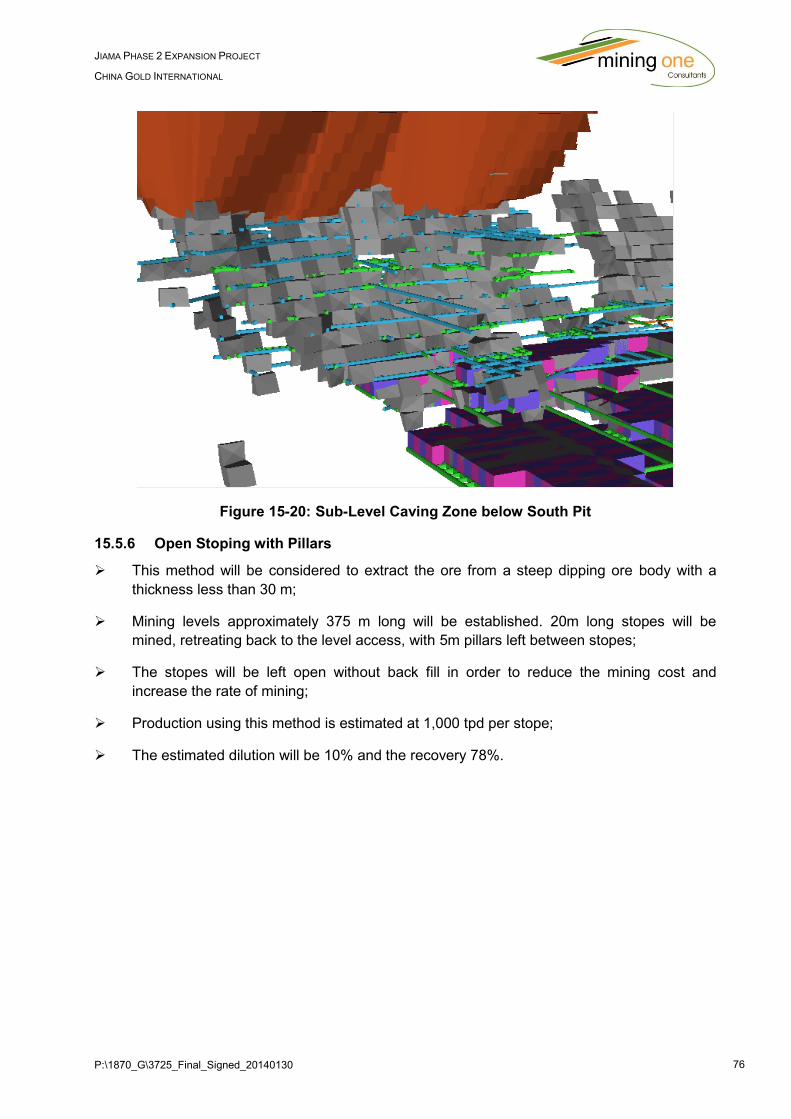
P:\1870_G\3725_Final_Signed_20140130 76
JIAMA PHASE 2 EXPANSION PROJECT
CHINA GOLD INTERNATIONAL
Figure 15-20: Sub-Level Caving Zone below South Pit
15.5.6 Open Stoping with Pillars
This method will be considered to extract the ore from a steep dipping ore body with a
thickness less than 30 m;
Mining levels approximately 375 m long will be established. 20m long stopes will be
mined, retreating back to the level access, with 5m pillars left between stopes;
The stopes will be left open without back fill in order to reduce the mining cost and
increase the rate of mining;
Production using this method is estimated at 1,000 tpd per stope;
The estimated dilution will be 10% and the recovery 78%.
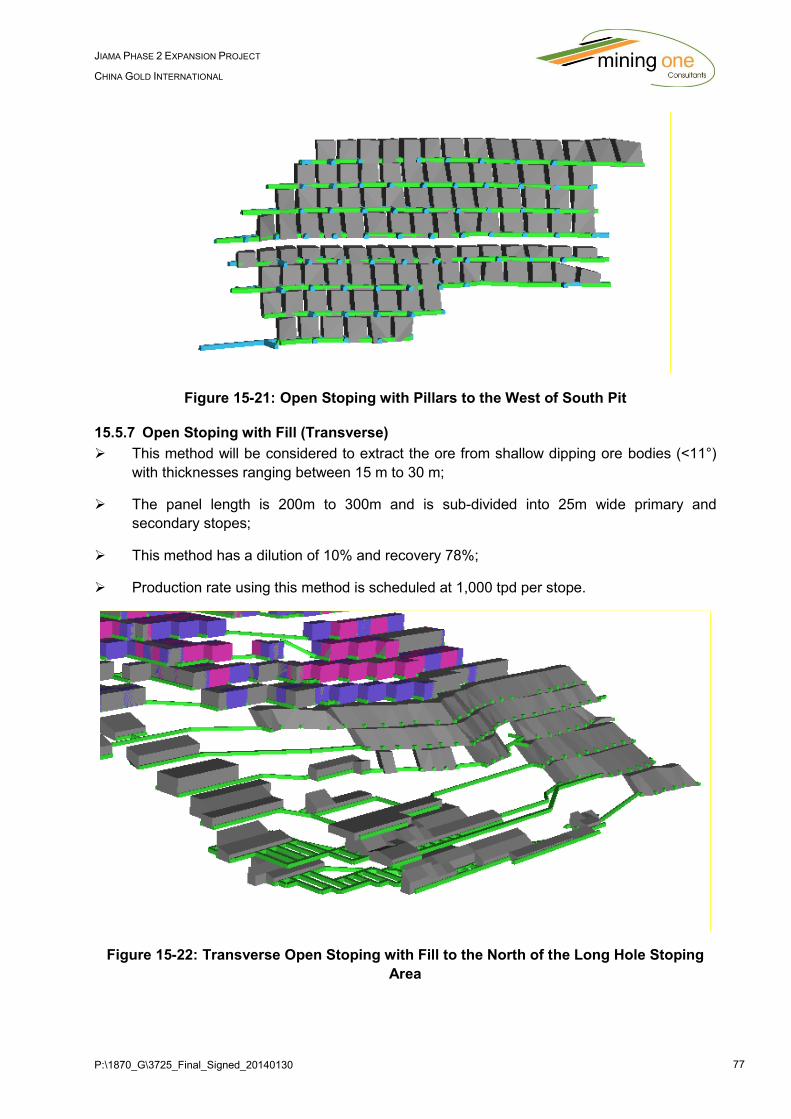
P:\1870_G\3725_Final_Signed_20140130 77
JIAMA PHASE 2 EXPANSION PROJECT
CHINA GOLD INTERNATIONAL
Figure 15-21: Open Stoping with Pillars to the West of South Pit
15.5.7 Open Stoping with Fill (Transverse)
This method will be considered to extract the ore from shallow dipping ore bodies (<11°)
with thicknesses ranging between 15 m to 30 m;
The panel length is 200m to 300m and is sub-divided into 25m wide primary and
secondary stopes;
This method has a dilution of 10% and recovery 78%;
Production rate using this method is scheduled at 1,000 tpd per stope.
Figure 15-22: Transverse Open Stoping with Fill to the North of the Long Hole Stoping
Area

P:\1870_G\3725_Final_Signed_20140130 78
JIAMA PHASE 2 EXPANSION PROJECT
CHINA GOLD INTERNATIONAL
15.5.8 Room and Pillar
This method will be considered to extract shallow dipping ore bodies (<30°) with
thicknesses between 5m and 15m;
Pillars will be approximately 6 m by 6m to 8m, while the mined rooms will be
approximately 12m by 8m;
The dilution is estimated to be 10% and recovery is estimated to be 78%;
The production rate using this method is 400 tpd per stope.
Figure 15-23: Room and Pillar Zone to the North of the Long Hole Stoping Area
15.5.9 Cut-off Grade
The estimations contained within this section are based on information contained within The
Study.
A cut-off grade of 0.45% CuEq (NSR) for Sub-level Open Stoping and 0.36% for mining
methods not requiring backfill has been estimated in the Study.
An estimation of the Copper Equivalent (CuEq) cut-off grade has been estimated on a Net
Smelter Return basis considering operating costs, mill commodity recoveries and prices (Table
15-7). Details of the CuEq cut-off calculations are outlined below with the estimations shown in
Table 15-8.
A Copper Equivalent (CuEqUg) field based on a NSR estimate specific to underground mining
and rock-type was added to the block model. This cut-off is considered the stope only cut-off
and does not consider the development capital required to realise the stope.
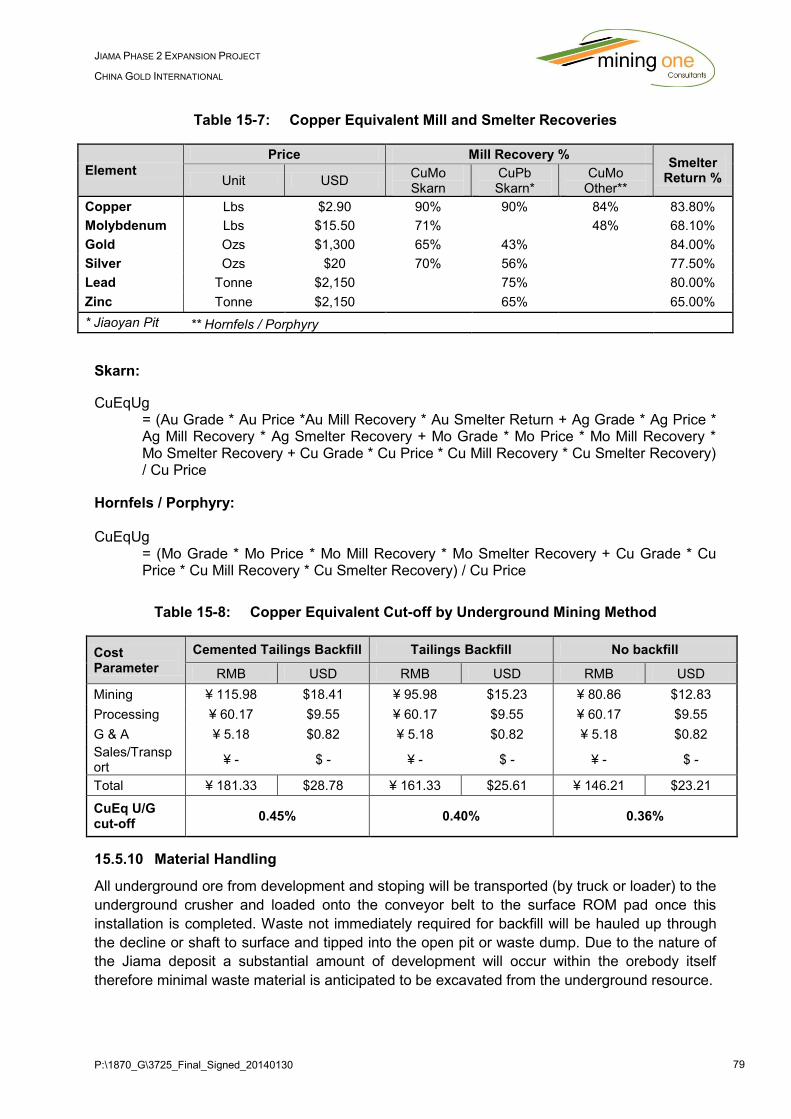
P:\1870_G\3725_Final_Signed_20140130 79
JIAMA PHASE 2 EXPANSION PROJECT
CHINA GOLD INTERNATIONAL
Table 15-7: Copper Equivalent Mill and Smelter Recoveries
Element
Price Mill Recovery % Smelter
Return % Unit USD CuMo Skarn
CuPb Skarn*
CuMo Other**
Copper Lbs $2.90 90% 90% 84% 83.80%
Molybdenum Lbs $15.50 71%
48% 68.10%
Gold Ozs $1,300 65% 43%
84.00%
Silver Ozs $20 70% 56%
77.50%
Lead Tonne $2,150
75%
80.00%
Zinc Tonne $2,150 65% 65.00%
* Jiaoyan Pit ** Hornfels / Porphyry
Skarn:
CuEqUg = (Au Grade * Au Price *Au Mill Recovery * Au Smelter Return + Ag Grade * Ag Price * Ag Mill Recovery * Ag Smelter Recovery + Mo Grade * Mo Price * Mo Mill Recovery * Mo Smelter Recovery + Cu Grade * Cu Price * Cu Mill Recovery * Cu Smelter Recovery) / Cu Price
Hornfels / Porphyry: CuEqUg
= (Mo Grade * Mo Price * Mo Mill Recovery * Mo Smelter Recovery + Cu Grade * Cu Price * Cu Mill Recovery * Cu Smelter Recovery) / Cu Price
Table 15-8: Copper Equivalent Cut-off by Underground Mining Method
Cost Parameter
Cemented Tailings Backfill Tailings Backfill No backfill
RMB USD RMB USD RMB USD
Mining ¥ 115.98 $18.41 ¥ 95.98 $15.23 ¥ 80.86 $12.83
Processing ¥ 60.17 $9.55 ¥ 60.17 $9.55 ¥ 60.17 $9.55
G & A ¥ 5.18 $0.82 ¥ 5.18 $0.82 ¥ 5.18 $0.82
Sales/Transport
¥ - $ - ¥ - $ - ¥ - $ -
Total ¥ 181.33 $28.78 ¥ 161.33 $25.61 ¥ 146.21 $23.21
CuEq U/G cut-off
0.45% 0.40% 0.36%
15.5.10 Material Handling
All underground ore from development and stoping will be transported (by truck or loader) to the
underground crusher and loaded onto the conveyor belt to the surface ROM pad once this
installation is completed. Waste not immediately required for backfill will be hauled up through
the decline or shaft to surface and tipped into the open pit or waste dump. Due to the nature of
the Jiama deposit a substantial amount of development will occur within the orebody itself
therefore minimal waste material is anticipated to be excavated from the underground resource.
P:\1870_G\3725_Final_Signed_20140130 80
JIAMA PHASE 2 EXPANSION PROJECT
CHINA GOLD INTERNATIONAL
15.6 Phase II Underground Schedule
A Life of mine schedule for the Jiama Phase II underground was developed to provide an
estimate on the life of the mine and to enable financial modelling to be conducted on the mining
operation. The targeted production from the Phase II underground is 6.6Mtpa of ore. This ore
will be complimented by 9.9Mtpa from the Phase II open pits to provide a combined production
total of 16.5Mtpa. The schedule was constructed primarily to establish if the underground
operation could sustain the targeted production rates and to establish a development strategy
for the underground.
The initial seven years of the operation were scheduled using detailed stope and development
designs and then scheduled in the EPS scheduler. This detailed schedule was then used to
derive operational assumptions to enable the remaining life of mine to be scheduled. This
involved utilising MSO designs to schedule the remaining resource based on a number of
mining zones. The resultant life of mine for the Jiama underground is approximately 30 years.
15.6.1 Initial Design Schedule
China Gold used the following assumptions and rates when scheduling the CGDI mine design
in EPS:
Stope Dilution: 10%;
Stope Recovery: 87%;
Total Development rate: 60 m/day (1,800 m/month maximum);
Total Production rate: 547,000 t/month (6.57 Mt/year maximum);
CuEq Cut-off grade: 0.45%;
The Phase I underground is currently achieving an average development rate of 30 m/day and
a production rate of 2.15 Mt/year. These rates are being achieved utilising hand held equipment
and therefore the production targets for the Phase II development were considered reasonable
as the size and number of headings will increase significantly.
The schedule produced by China Gold has a ramp up period for Phase II of 3 to 4 years to
establish capital infrastructure development and to bring enough stopes online to produce the
desired output of 6.6Mt per year. This initial ramp up period will be complemented with ore that
is currently being mined as part of Phase I and any additional ore development that may come
available during this time.
The figures below show screen captures of the schedule in Year 1, 3, 5 and 7.
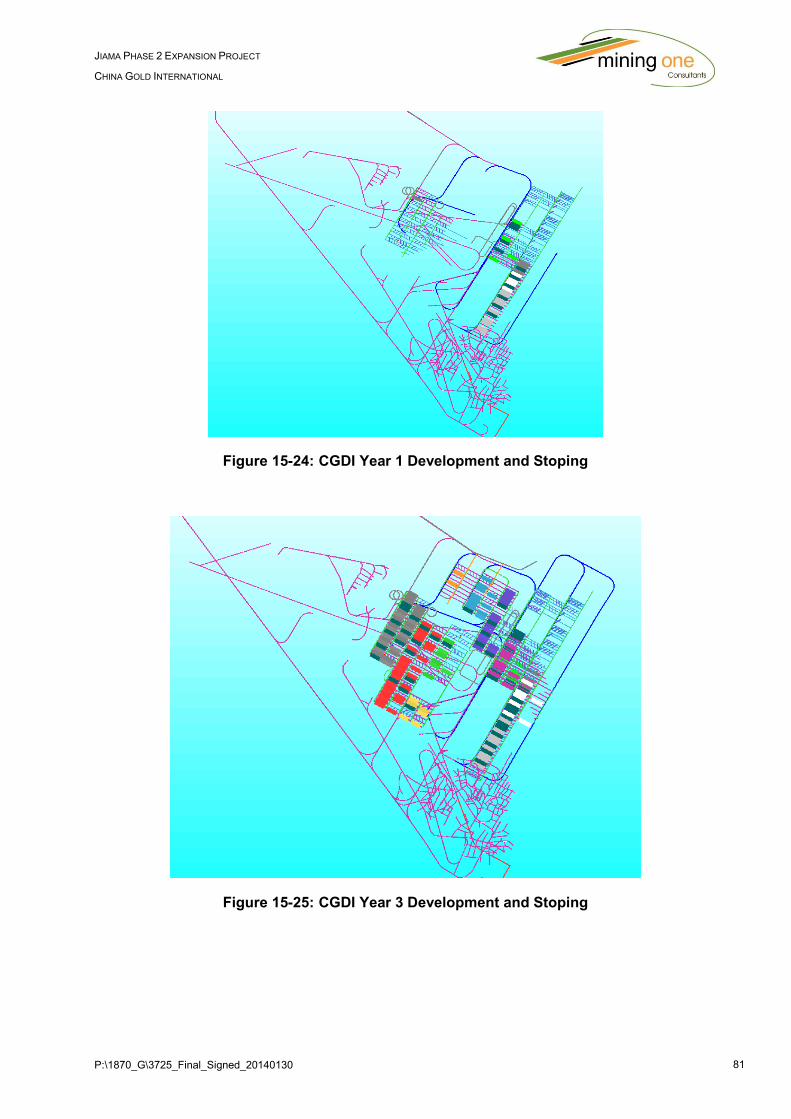
P:\1870_G\3725_Final_Signed_20140130 81
JIAMA PHASE 2 EXPANSION PROJECT
CHINA GOLD INTERNATIONAL
Figure 15-24: CGDI Year 1 Development and Stoping
Figure 15-25: CGDI Year 3 Development and Stoping
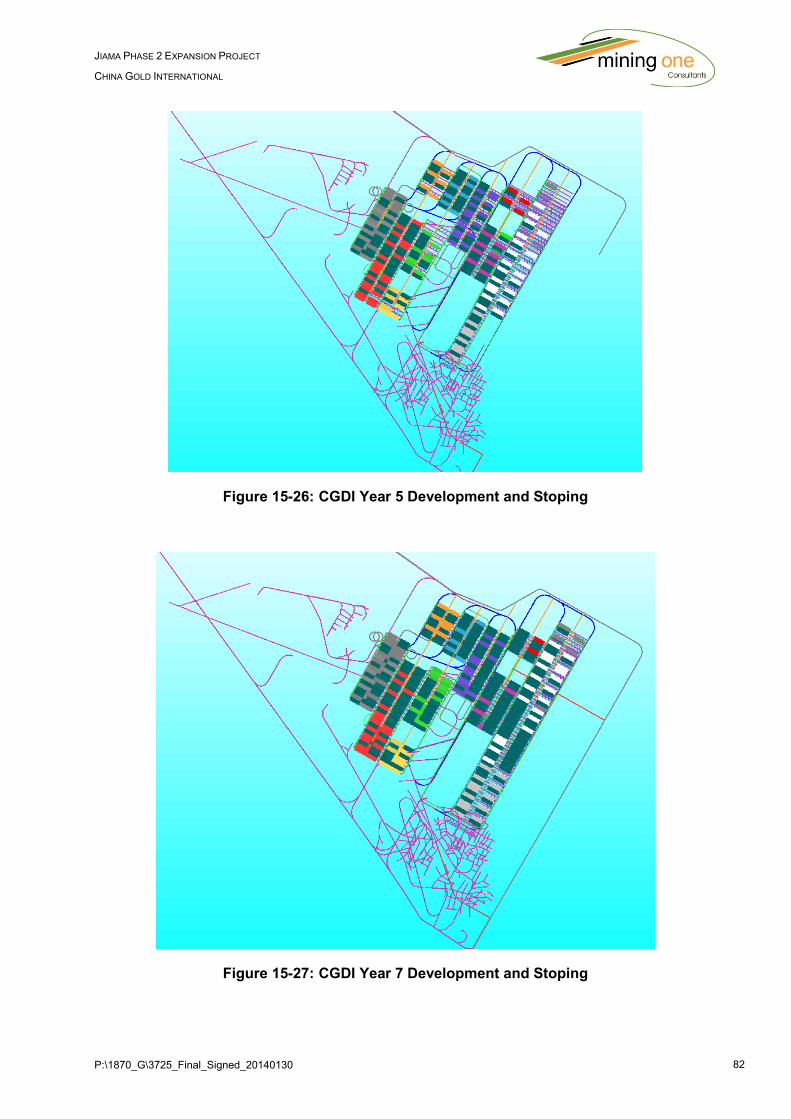
P:\1870_G\3725_Final_Signed_20140130 82
JIAMA PHASE 2 EXPANSION PROJECT
CHINA GOLD INTERNATIONAL
Figure 15-26: CGDI Year 5 Development and Stoping
Figure 15-27: CGDI Year 7 Development and Stoping

P:\1870_G\3725_Final_Signed_20140130 83
JIAMA PHASE 2 EXPANSION PROJECT
CHINA GOLD INTERNATIONAL
15.6.2 Underground Life of Mine Design (Completed by China Gold)
The life of mine reserve shapes produced by China Gold were designed based on a Sub-level
Stoping (primary/secondary/(tertiary)) mining method with stope dimensions similar to those
created by the CGDI and approved by the government. Figure 15-28 provides an overview of
the targeted mining areas that are contained in the life of mine schedule. These design were
evaluated using Surpac to produce the mine reserves.
A dilution of 10% and recovery of 87% was applied to all shapes.
Inferred material was not included in the mineral reserve or life of mine schedule but is noted in
the mine reserve. All stoping material below a copper equivalent cut-off grade of 0.45% was
excluded from the mineral reserve, mine inventory and the life of mine schedule.
Figure 15-28: China Gold Life of Mine Design for Jiama Phase II Underground
Inferred Material (Not included
in Life of Mine schedule)
South Pit
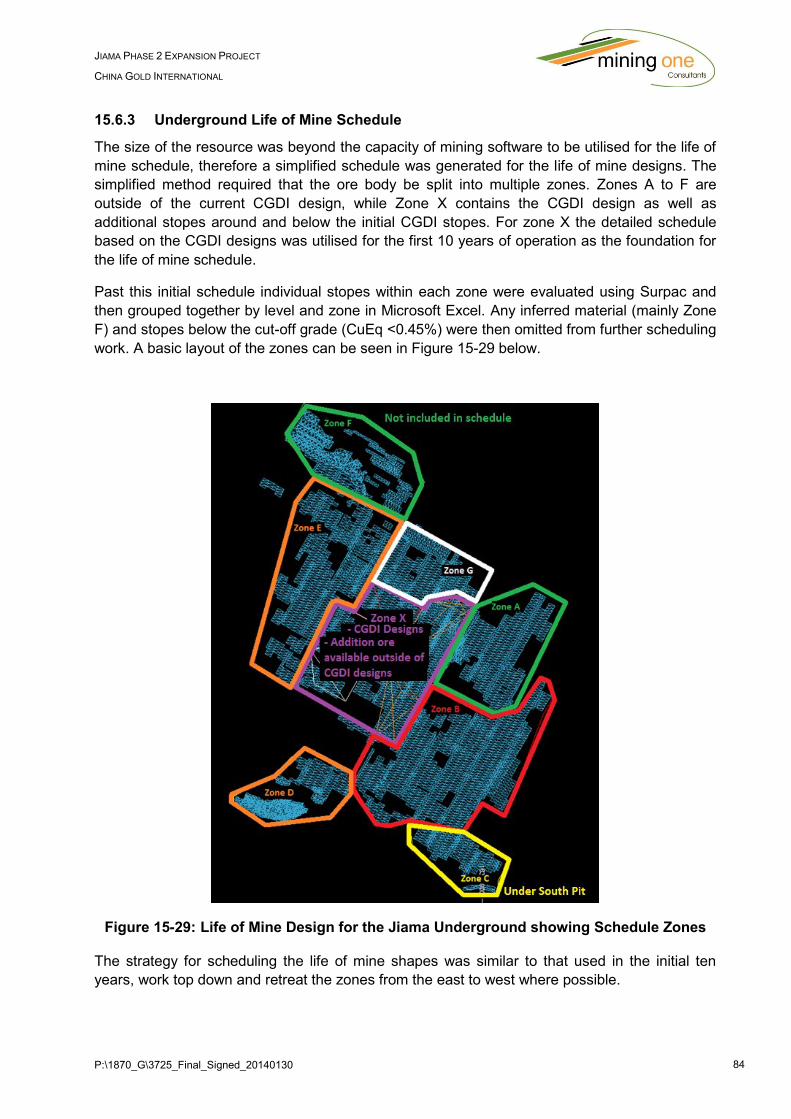
P:\1870_G\3725_Final_Signed_20140130 84
JIAMA PHASE 2 EXPANSION PROJECT
CHINA GOLD INTERNATIONAL
15.6.3 Underground Life of Mine Schedule
The size of the resource was beyond the capacity of mining software to be utilised for the life of
mine schedule, therefore a simplified schedule was generated for the life of mine designs. The
simplified method required that the ore body be split into multiple zones. Zones A to F are
outside of the current CGDI design, while Zone X contains the CGDI design as well as
additional stopes around and below the initial CGDI stopes. For zone X the detailed schedule
based on the CGDI designs was utilised for the first 10 years of operation as the foundation for
the life of mine schedule.
Past this initial schedule individual stopes within each zone were evaluated using Surpac and
then grouped together by level and zone in Microsoft Excel. Any inferred material (mainly Zone
F) and stopes below the cut-off grade (CuEq <0.45%) were then omitted from further scheduling
work. A basic layout of the zones can be seen in Figure 15-29 below.
Figure 15-29: Life of Mine Design for the Jiama Underground showing Schedule Zones
The strategy for scheduling the life of mine shapes was similar to that used in the initial ten
years, work top down and retreat the zones from the east to west where possible.
P:\1870_G\3725_Final_Signed_20140130 85
JIAMA PHASE 2 EXPANSION PROJECT
CHINA GOLD INTERNATIONAL
As complete development designs for the life of mines have not yet been completed and a
number of assumptions were made when scheduling outside the initial 10 years:
Development metres were based on the ore tonnage to development metre ratio from the
initial ten years of schedule;
After ten years the total development was also reduced as the capital infrastructure was
completed. This capital infrastructure would service the Phase II underground for the life
of the operation;
As all development is completed by contractors at a fixed and relatively low cost and the
majority of development is within the ore body, if more development is required than is
scheduled, it will not affect the overall cost of the operation by a substantial amount.
Contingency has been included in the cost model to cater for additional unforeseen
development;
Development tonnages are based on 41t per metre due to the various sizes of
development required;
Top down mining has been maintained for the life of the operation. This is in line with the
mining strategy developed by the CGDI;
Maximum development rate of 21,000 m/year has been adopted;
Maximum production rate of 6.6 Mt/year (total ore), and;
Backfill quantities are based on stope volume.
Table 15-9 and Table 15-10 shows the life of mine schedule for the Jiama Phase II
underground.
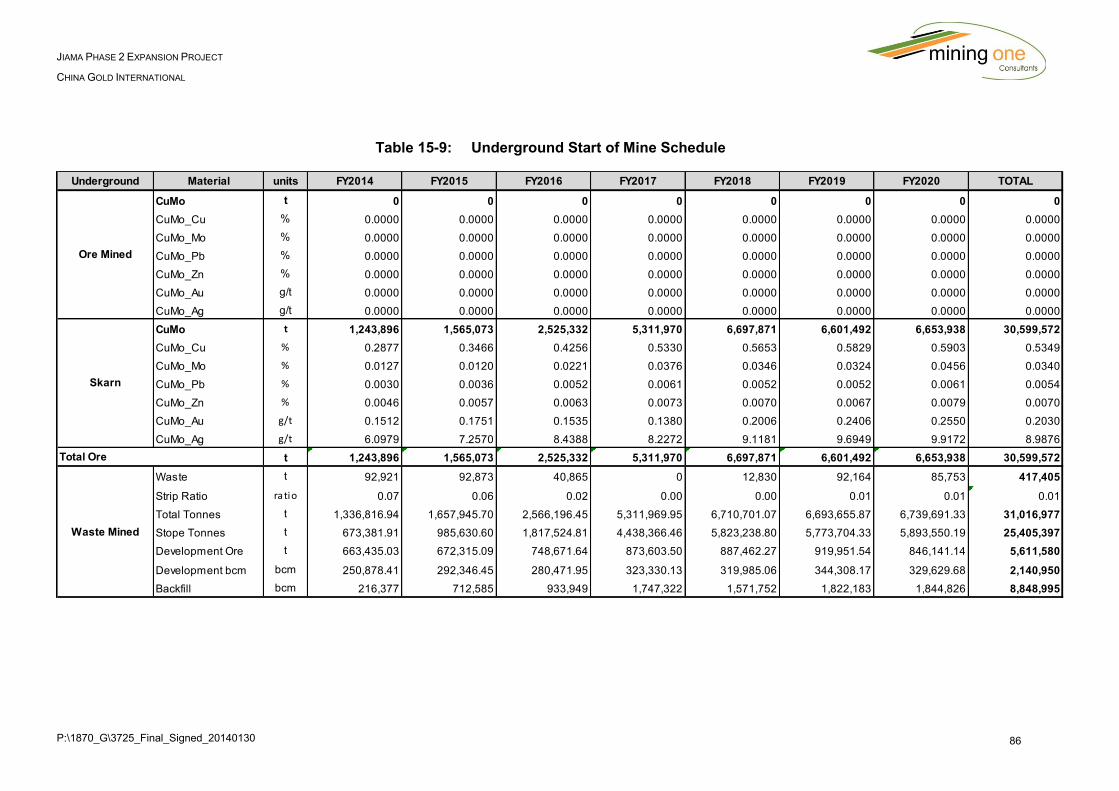
P:\1870_G\3725_Final_Signed_20140130 86
JIAMA PHASE 2 EXPANSION PROJECT
CHINA GOLD INTERNATIONAL
Table 15-9: Underground Start of Mine Schedule
Underground Material units FY2014 FY2015 FY2016 FY2017 FY2018 FY2019 FY2020 TOTAL
CuMo t 0 0 0 0 0 0 0 0
CuMo_Cu % 0.0000 0.0000 0.0000 0.0000 0.0000 0.0000 0.0000 0.0000
CuMo_Mo % 0.0000 0.0000 0.0000 0.0000 0.0000 0.0000 0.0000 0.0000
CuMo_Pb % 0.0000 0.0000 0.0000 0.0000 0.0000 0.0000 0.0000 0.0000
CuMo_Zn % 0.0000 0.0000 0.0000 0.0000 0.0000 0.0000 0.0000 0.0000
CuMo_Au g/t 0.0000 0.0000 0.0000 0.0000 0.0000 0.0000 0.0000 0.0000
CuMo_Ag g/t 0.0000 0.0000 0.0000 0.0000 0.0000 0.0000 0.0000 0.0000
CuMo t 1,243,896 1,565,073 2,525,332 5,311,970 6,697,871 6,601,492 6,653,938 30,599,572
CuMo_Cu % 0.2877 0.3466 0.4256 0.5330 0.5653 0.5829 0.5903 0.5349
CuMo_Mo % 0.0127 0.0120 0.0221 0.0376 0.0346 0.0324 0.0456 0.0340
CuMo_Pb % 0.0030 0.0036 0.0052 0.0061 0.0052 0.0052 0.0061 0.0054
CuMo_Zn % 0.0046 0.0057 0.0063 0.0073 0.0070 0.0067 0.0079 0.0070
CuMo_Au g/t 0.1512 0.1751 0.1535 0.1380 0.2006 0.2406 0.2550 0.2030
CuMo_Ag g/t 6.0979 7.2570 8.4388 8.2272 9.1181 9.6949 9.9172 8.9876
t 1,243,896 1,565,073 2,525,332 5,311,970 6,697,871 6,601,492 6,653,938 30,599,572
Waste t 92,921 92,873 40,865 0 12,830 92,164 85,753 417,405
Strip Ratio ratio 0.07 0.06 0.02 0.00 0.00 0.01 0.01 0.01
Total Tonnes t 1,336,816.94 1,657,945.70 2,566,196.45 5,311,969.95 6,710,701.07 6,693,655.87 6,739,691.33 31,016,977
Stope Tonnes t 673,381.91 985,630.60 1,817,524.81 4,438,366.46 5,823,238.80 5,773,704.33 5,893,550.19 25,405,397
Development Ore t 663,435.03 672,315.09 748,671.64 873,603.50 887,462.27 919,951.54 846,141.14 5,611,580
Development bcm bcm 250,878.41 292,346.45 280,471.95 323,330.13 319,985.06 344,308.17 329,629.68 2,140,950
Backfill bcm 216,377 712,585 933,949 1,747,322 1,571,752 1,822,183 1,844,826 8,848,995
Ore Mined
Skarn
Total Ore
Waste Mined
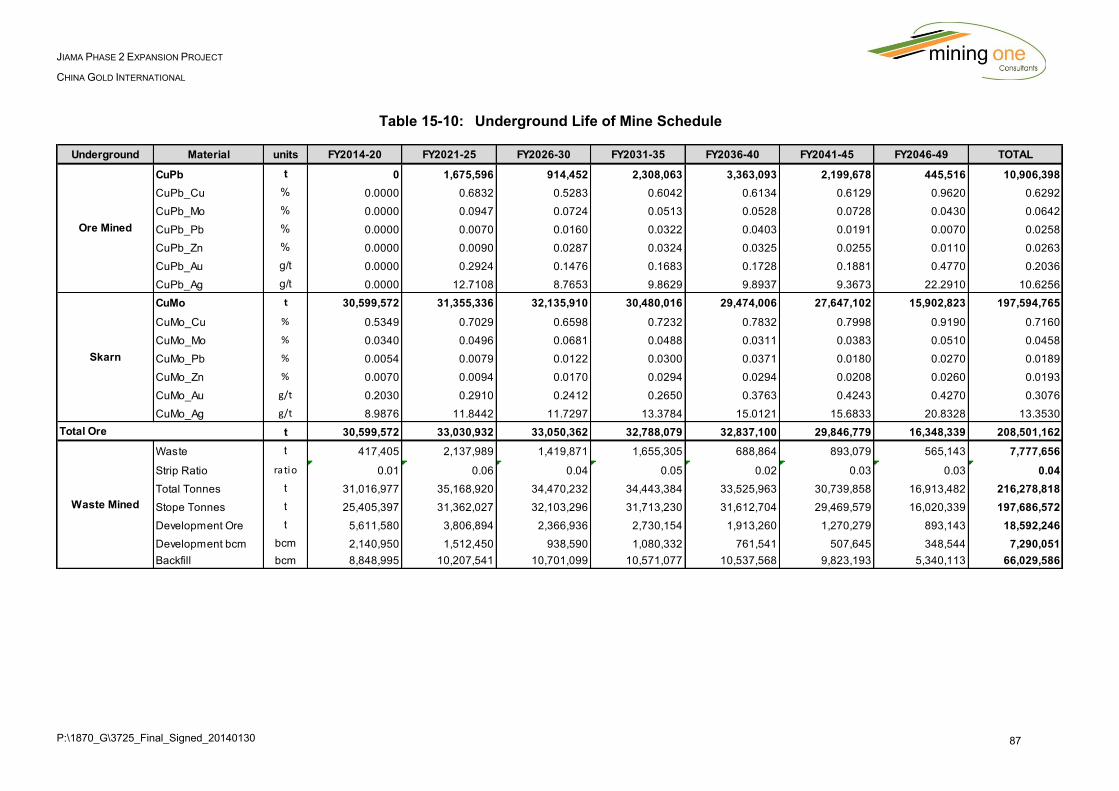
P:\1870_G\3725_Final_Signed_20140130 87
JIAMA PHASE 2 EXPANSION PROJECT
CHINA GOLD INTERNATIONAL
Table 15-10: Underground Life of Mine Schedule
Underground Material units FY2014-20 FY2021-25 FY2026-30 FY2031-35 FY2036-40 FY2041-45 FY2046-49 TOTAL
CuPb t 0 1,675,596 914,452 2,308,063 3,363,093 2,199,678 445,516 10,906,398
CuPb_Cu % 0.0000 0.6832 0.5283 0.6042 0.6134 0.6129 0.9620 0.6292
CuPb_Mo % 0.0000 0.0947 0.0724 0.0513 0.0528 0.0728 0.0430 0.0642
CuPb_Pb % 0.0000 0.0070 0.0160 0.0322 0.0403 0.0191 0.0070 0.0258
CuPb_Zn % 0.0000 0.0090 0.0287 0.0324 0.0325 0.0255 0.0110 0.0263
CuPb_Au g/t 0.0000 0.2924 0.1476 0.1683 0.1728 0.1881 0.4770 0.2036
CuPb_Ag g/t 0.0000 12.7108 8.7653 9.8629 9.8937 9.3673 22.2910 10.6256
CuMo t 30,599,572 31,355,336 32,135,910 30,480,016 29,474,006 27,647,102 15,902,823 197,594,765
CuMo_Cu % 0.5349 0.7029 0.6598 0.7232 0.7832 0.7998 0.9190 0.7160
CuMo_Mo % 0.0340 0.0496 0.0681 0.0488 0.0311 0.0383 0.0510 0.0458
CuMo_Pb % 0.0054 0.0079 0.0122 0.0300 0.0371 0.0180 0.0270 0.0189
CuMo_Zn % 0.0070 0.0094 0.0170 0.0294 0.0294 0.0208 0.0260 0.0193
CuMo_Au g/t 0.2030 0.2910 0.2412 0.2650 0.3763 0.4243 0.4270 0.3076
CuMo_Ag g/t 8.9876 11.8442 11.7297 13.3784 15.0121 15.6833 20.8328 13.3530
t 30,599,572 33,030,932 33,050,362 32,788,079 32,837,100 29,846,779 16,348,339 208,501,162
Waste t 417,405 2,137,989 1,419,871 1,655,305 688,864 893,079 565,143 7,777,656
Strip Ratio ratio 0.01 0.06 0.04 0.05 0.02 0.03 0.03 0.04
Total Tonnes t 31,016,977 35,168,920 34,470,232 34,443,384 33,525,963 30,739,858 16,913,482 216,278,818
Stope Tonnes t 25,405,397 31,362,027 32,103,296 31,713,230 31,612,704 29,469,579 16,020,339 197,686,572
Development Ore t 5,611,580 3,806,894 2,366,936 2,730,154 1,913,260 1,270,279 893,143 18,592,246
Development bcm bcm 2,140,950 1,512,450 938,590 1,080,332 761,541 507,645 348,544 7,290,051
Backfill bcm 8,848,995 10,207,541 10,701,099 10,571,077 10,537,568 9,823,193 5,340,113 66,029,586
Total Ore
Skarn
Waste Mined
Ore Mined
P:\1870_G\3725_Final_Signed_20140130 88
JIAMA PHASE 2 EXPANSION PROJECT
CHINA GOLD INTERNATIONAL
15.7 Pit Optimisation
15.7.1 Pit Optimisation Methodology
The optimisation methodology adopted for the Jiama project used the geological block model
provided by China Gold (JM_BM_1301_Undepl.bmf). The block model contained mineable
resource codes which were used to generate Whittle specific fields in preparation for the
optimisation in Gemcom’s Whittle-4X software. Whittle-4X utilises a Lerchs-Grossman algorithm
to provide the optimum mining pit shell for a given set of mining, metallurgy and economic
parameters.
Pit optimisation for open pit mines using the Lerchs-Grossman algorithm is an industry-standard
approach for defining an optimum open pit shape and development of a mining sequence. The
methodology relies on the preparation of a 3D block model to represent all parts of the
mineralisation and host rock that can reasonably influence the pit shape. A single cash surplus
for each block is estimated as the difference between the revenues derived from each block, at
a nominated product price, and the costs required to realise the revenue from that block. For
mineralised blocks with a grade above the economic cut-off grade, the net cash flow is positive
reflecting the profit that can be made by mining and treating the block to recover the product.
For all the other blocks, the net cash flow is negative, reflecting the cost of mining the block to
access blocks of positive cash flow.
Whittle-4X structure arcs were used to define the precedence of block removal, such that a
block cannot be considered for mining unless certain overlying blocks are also mined. This
effectively defined the slope geometry for an open pit operation.
The optimisation then consisted of finding the combination of positive and negative cash flow
blocks, consistent with the slope precedent rules, which accumulated to a maximum positive
cash flow.
Whittle then generated a series of pit optimisation shells which present as concentric pits, each
generating the maximum undiscounted cash surplus for the set of economic parameters used to
develop the optimised shell. The shells were developed by varying the product price, but once
defined are presented as a series of shells analysed against the input price.
These nested shells were used to develop indicative production schedules and hence estimate
discounted cash flows. For this purpose, two schedules were developed, a best case and a
worst case schedule. The best case schedule assumed the pits mined optimally with each
optimisation shell completed before mining of the next shell commenced. The worst case
schedule assumed that no staging of pits was possible and that the entire pit area was mined
out on each bench before proceeding to the next. In reality, a practical mining schedule would
lie between these two schedules, this has been approximated by selecting specific cutbacks
within any given mining area and a strategic scheduling that sequences all mining areas and
their respective cutbacks.
Only blocks with resource categories of 1 (Measured) and 2 (Indicated) were considered as
potential ore blocks in the generation of the optimum pit shell. A process flow of the optimisation
logic and reserves estimates is summarised in Table 15-11.
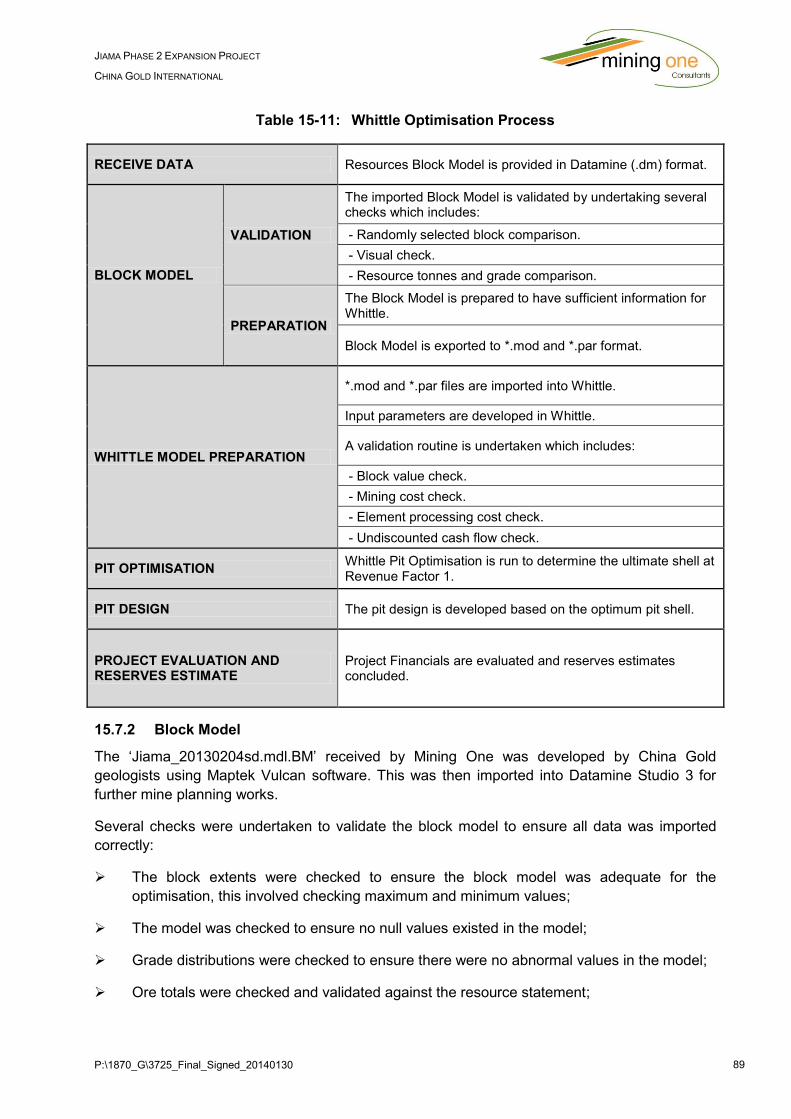
P:\1870_G\3725_Final_Signed_20140130 89
JIAMA PHASE 2 EXPANSION PROJECT
CHINA GOLD INTERNATIONAL
Table 15-11: Whittle Optimisation Process
RECEIVE DATA Resources Block Model is provided in Datamine (.dm) format.
BLOCK MODEL
VALIDATION
The imported Block Model is validated by undertaking several checks which includes:
- Randomly selected block comparison.
- Visual check.
- Resource tonnes and grade comparison.
PREPARATION
The Block Model is prepared to have sufficient information for Whittle.
Block Model is exported to *.mod and *.par format.
WHITTLE MODEL PREPARATION
*.mod and *.par files are imported into Whittle.
Input parameters are developed in Whittle.
A validation routine is undertaken which includes:
- Block value check.
- Mining cost check.
- Element processing cost check.
- Undiscounted cash flow check.
PIT OPTIMISATION Whittle Pit Optimisation is run to determine the ultimate shell at Revenue Factor 1.
PIT DESIGN The pit design is developed based on the optimum pit shell.
PROJECT EVALUATION AND RESERVES ESTIMATE
Project Financials are evaluated and reserves estimates concluded.
15.7.2 Block Model
The ‘Jiama_20130204sd.mdl.BM’ received by Mining One was developed by China Gold
geologists using Maptek Vulcan software. This was then imported into Datamine Studio 3 for
further mine planning works.
Several checks were undertaken to validate the block model to ensure all data was imported
correctly:
The block extents were checked to ensure the block model was adequate for the
optimisation, this involved checking maximum and minimum values;
The model was checked to ensure no null values existed in the model;
Grade distributions were checked to ensure there were no abnormal values in the model;
Ore totals were checked and validated against the resource statement;
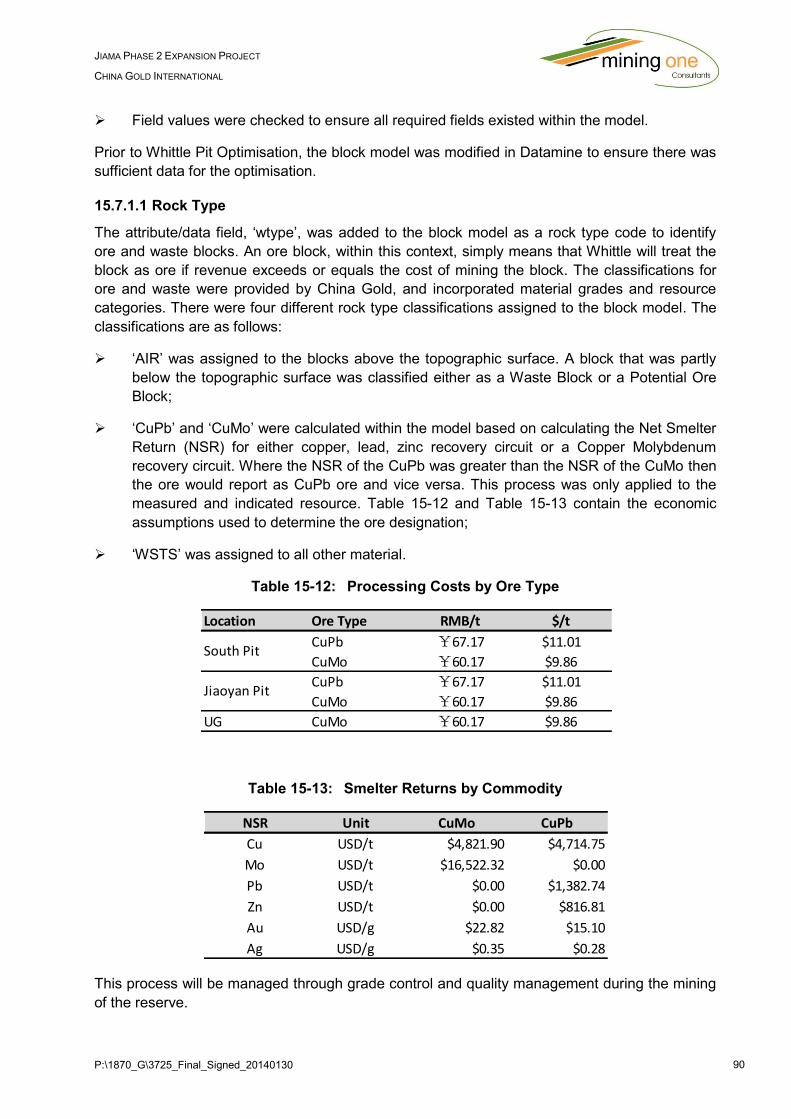
P:\1870_G\3725_Final_Signed_20140130 90
JIAMA PHASE 2 EXPANSION PROJECT
CHINA GOLD INTERNATIONAL
Field values were checked to ensure all required fields existed within the model.
Prior to Whittle Pit Optimisation, the block model was modified in Datamine to ensure there was
sufficient data for the optimisation.
15.7.1.1 Rock Type
The attribute/data field, ‘wtype’, was added to the block model as a rock type code to identify
ore and waste blocks. An ore block, within this context, simply means that Whittle will treat the
block as ore if revenue exceeds or equals the cost of mining the block. The classifications for
ore and waste were provided by China Gold, and incorporated material grades and resource
categories. There were four different rock type classifications assigned to the block model. The
classifications are as follows:
‘AIR’ was assigned to the blocks above the topographic surface. A block that was partly
below the topographic surface was classified either as a Waste Block or a Potential Ore
Block;
‘CuPb’ and ‘CuMo’ were calculated within the model based on calculating the Net Smelter
Return (NSR) for either copper, lead, zinc recovery circuit or a Copper Molybdenum
recovery circuit. Where the NSR of the CuPb was greater than the NSR of the CuMo then
the ore would report as CuPb ore and vice versa. This process was only applied to the
measured and indicated resource. Table 15-12 and Table 15-13 contain the economic
assumptions used to determine the ore designation;
‘WSTS’ was assigned to all other material.
Table 15-12: Processing Costs by Ore Type
Table 15-13: Smelter Returns by Commodity
This process will be managed through grade control and quality management during the mining
of the reserve.
Location Ore Type RMB/t $/t
CuPb ¥67.17 $11.01
CuMo ¥60.17 $9.86
CuPb ¥67.17 $11.01
CuMo ¥60.17 $9.86
UG CuMo ¥60.17 $9.86
South Pit
Jiaoyan Pit
NSR Unit CuMo CuPb
Cu USD/t $4,821.90 $4,714.75
Mo USD/t $16,522.32 $0.00
Pb USD/t $0.00 $1,382.74
Zn USD/t $0.00 $816.81
Au USD/g $22.82 $15.10
Ag USD/g $0.35 $0.28
P:\1870_G\3725_Final_Signed_20140130 91
JIAMA PHASE 2 EXPANSION PROJECT
CHINA GOLD INTERNATIONAL
15.7.1.2 Other Modifying Factors
Several others attributes were created during the preparation of the block model as required for
the Whittle optimisation process:
‘gtzone’ – code for geotechnical zone;
‘mcaf’ – Mining Cost Adjustment Factor. The factor is to adjust the mining cost based on
the depth of mining. MCAF is used in Whittle to represent the mining cost adjustment as
mining progresses deeper. MCAF acts as a multiplier on a reference mining cost;
‘pcaf’ – Processing Cost Adjustment Factor. Is Similar to MCAF. The PCAF was assigned
to differentiate processing costs based on the bench or pit location. PCAF acts as a
multiplier on a reference processing cost.
15.7.3 Whittle Re-blocked Model
The block model imported to Datamine had a block size of 50 m x 50 m x 10 m. To reduce the
wall angle variance during the pit optimisation process in Whittle, the blocks were split from a
50 m x 50 m x 10 m dimension to a 25 m x 25 m x 5 m dimension. This improves the resolution
of the optimisation enabling a more precise shell to be generated for the optimum pit design.
15.7.4 Whittle Geotechnical Input Parameters
Geotechnical parameters were provided by the Changsha Institute of Mining Research Limited
Liability Company. The geotechnical parameters specified an overall slope angle of 43° be
applied to the optimisation. This angle incorporates an intra-ramp angle as represented by the
maximum wall angle as well as allowance for the haul road.
15.7.5 Whittle Mining Input Parameters
The following whittle input parameters were used by China Gold for their optimisations.
The mining parameters consist of the following:
Mining Recovery was set at 95%, this was relatively low based on the massive nature of
the ore body combined with the adoption of bulk mining methods would inherently
consider that practical mining limits would be outside the theoretical ore / waste boundary;
Mining Dilution of 5% was applied to the resource based on the assumptions that the bulk
mining methods adopted would result in smearing at the ore / waste contact;
Mining Cost and Mining Cost Adjustment Factor (MCAF) – For the Jiaoyan Pit the mining
cost adjustment factor was not utilised and a mining cost of $2.247 per tonne was used for
the entirety of the pit. For the south pit a base mining cost of $2.171 per tonne was
applied and the Mining Cost Adjustment Factor calculated to incorporate a 0.008 $/m/t
escalation as the pit was excavated deeper.
Whittle processing parameters included:
The metallurgical assumptions (recoveries and concentrate Cu and Mo Grade) were
based on the metallurgical test work performed by the Beijing General Research Institute
of Mining and Metallurgy and Huatailong Mining Development Co. Ltd;
P:\1870_G\3725_Final_Signed_20140130 92
JIAMA PHASE 2 EXPANSION PROJECT
CHINA GOLD INTERNATIONAL
Processing cost represented milling and G&A costs. The cost was applied to every
processed rock type. Whittle processing cost was derived from the following:
- Milling Cost;
- G&A Cost; and
- Transport Cost
As MCAFs were assumed as an average of ore and waste mining cost, PCAF was not assigned
to differentiate ore mining cost and waste mining cost.
15.7.6 Whittle Selling Input Parameters
The selling parameters consist of the commodity price being adjusted down by the royalty.
Basic formula of price input parameter was as follows:
Effective Price = Price * (1 – royalty)
15.7.7 Whittle Processing Capacity
For initial pit optimisation, the processing limit was set to 6 Mtpa for Jiaoyan pit and 4.5 Mtpa for
South pit. These capacities reflected the anticipated maximum capacity from either pit during
the life of the respective asset.
15.7.8 Discount Rate
A discount rate of 10% was used for the strategic scheduling process. However, initially a zero
discount rate was used. This allowed for the clear identification of significant cash flow
increases between adjacent shells which would assist in the formulation of a cut-back strategy.
15.7.9 Mine Extent Limitations
Spatial limitations were assigned to the block model to restrict the size of the optimal pit shells.
These limitations were placed due to existing road and infrastructure for which relocation was
impractical.
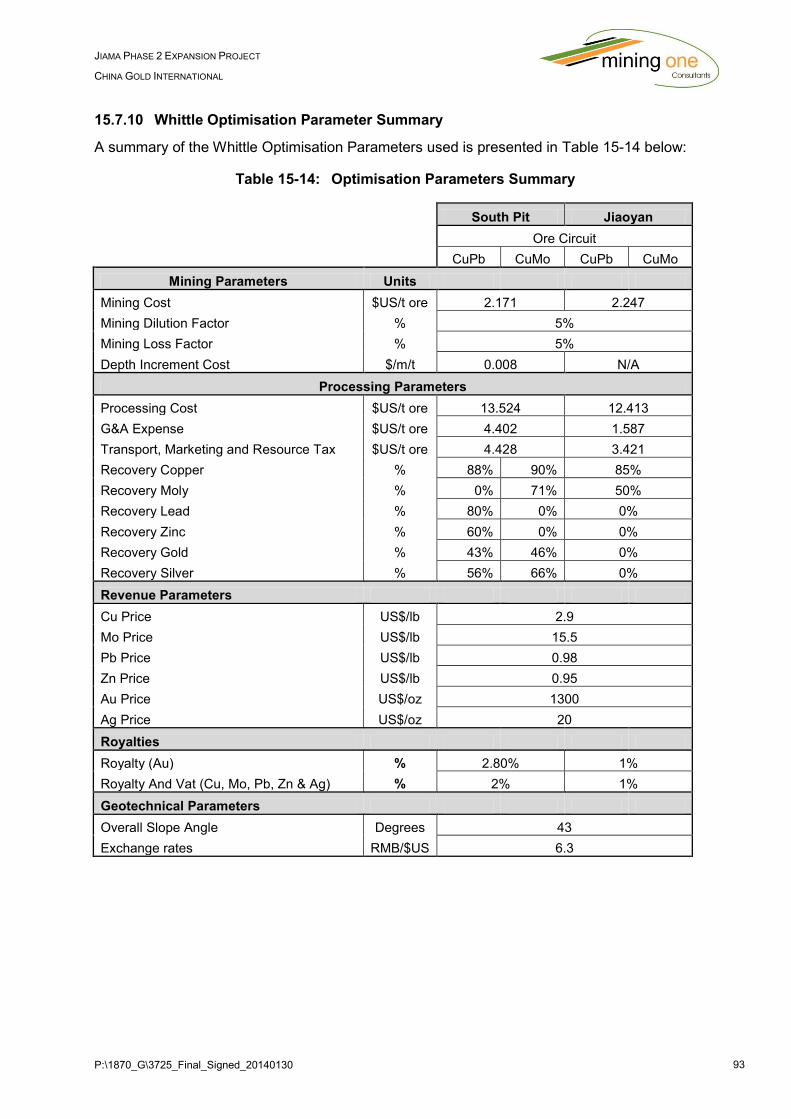
P:\1870_G\3725_Final_Signed_20140130 93
JIAMA PHASE 2 EXPANSION PROJECT
CHINA GOLD INTERNATIONAL
15.7.10 Whittle Optimisation Parameter Summary
A summary of the Whittle Optimisation Parameters used is presented in Table 15-14 below:
Table 15-14: Optimisation Parameters Summary
South Pit Jiaoyan
Ore Circuit
CuPb CuMo CuPb CuMo
Mining Parameters Units
Mining Cost $US/t ore 2.171 2.247
Mining Dilution Factor % 5%
Mining Loss Factor % 5%
Depth Increment Cost $/m/t 0.008 N/A
Processing Parameters
Processing Cost $US/t ore 13.524 12.413
G&A Expense $US/t ore 4.402 1.587
Transport, Marketing and Resource Tax $US/t ore 4.428 3.421
Recovery Copper % 88% 90% 85%
Recovery Moly % 0% 71% 50%
Recovery Lead % 80% 0% 0%
Recovery Zinc % 60% 0% 0%
Recovery Gold % 43% 46% 0%
Recovery Silver % 56% 66% 0%
Revenue Parameters
Cu Price US$/lb 2.9
Mo Price US$/lb 15.5
Pb Price US$/lb 0.98
Zn Price US$/lb 0.95
Au Price US$/oz 1300
Ag Price US$/oz 20
Royalties
Royalty (Au) % 2.80% 1%
Royalty And Vat (Cu, Mo, Pb, Zn & Ag) % 2% 1%
Geotechnical Parameters
Overall Slope Angle Degrees 43
Exchange rates RMB/$US 6.3
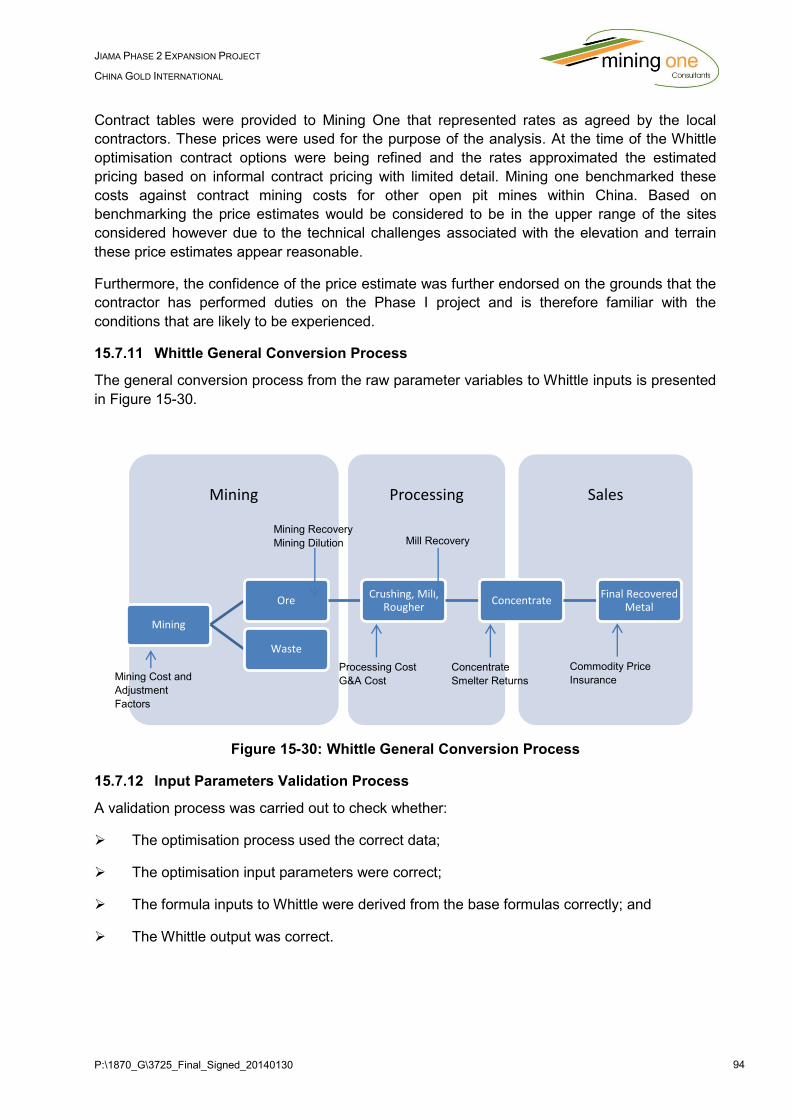
P:\1870_G\3725_Final_Signed_20140130 94
JIAMA PHASE 2 EXPANSION PROJECT
CHINA GOLD INTERNATIONAL
Contract tables were provided to Mining One that represented rates as agreed by the local
contractors. These prices were used for the purpose of the analysis. At the time of the Whittle
optimisation contract options were being refined and the rates approximated the estimated
pricing based on informal contract pricing with limited detail. Mining one benchmarked these
costs against contract mining costs for other open pit mines within China. Based on
benchmarking the price estimates would be considered to be in the upper range of the sites
considered however due to the technical challenges associated with the elevation and terrain
these price estimates appear reasonable.
Furthermore, the confidence of the price estimate was further endorsed on the grounds that the
contractor has performed duties on the Phase I project and is therefore familiar with the
conditions that are likely to be experienced.
15.7.11 Whittle General Conversion Process
The general conversion process from the raw parameter variables to Whittle inputs is presented
in Figure 15-30.
Figure 15-30: Whittle General Conversion Process
15.7.12 Input Parameters Validation Process
A validation process was carried out to check whether:
The optimisation process used the correct data;
The optimisation input parameters were correct;
The formula inputs to Whittle were derived from the base formulas correctly; and
The Whittle output was correct.
SalesProcessingMining
Mining
Ore Crushing, Mill,
RougherConcentrate
Final Recovered Metal
Waste
Mining Cost and
Adjustment
Factors
Mining Recovery
Mining Dilution
Mill Recovery
Processing Cost
G&A Cost
Concentrate
Smelter Returns
Commodity Price
Insurance
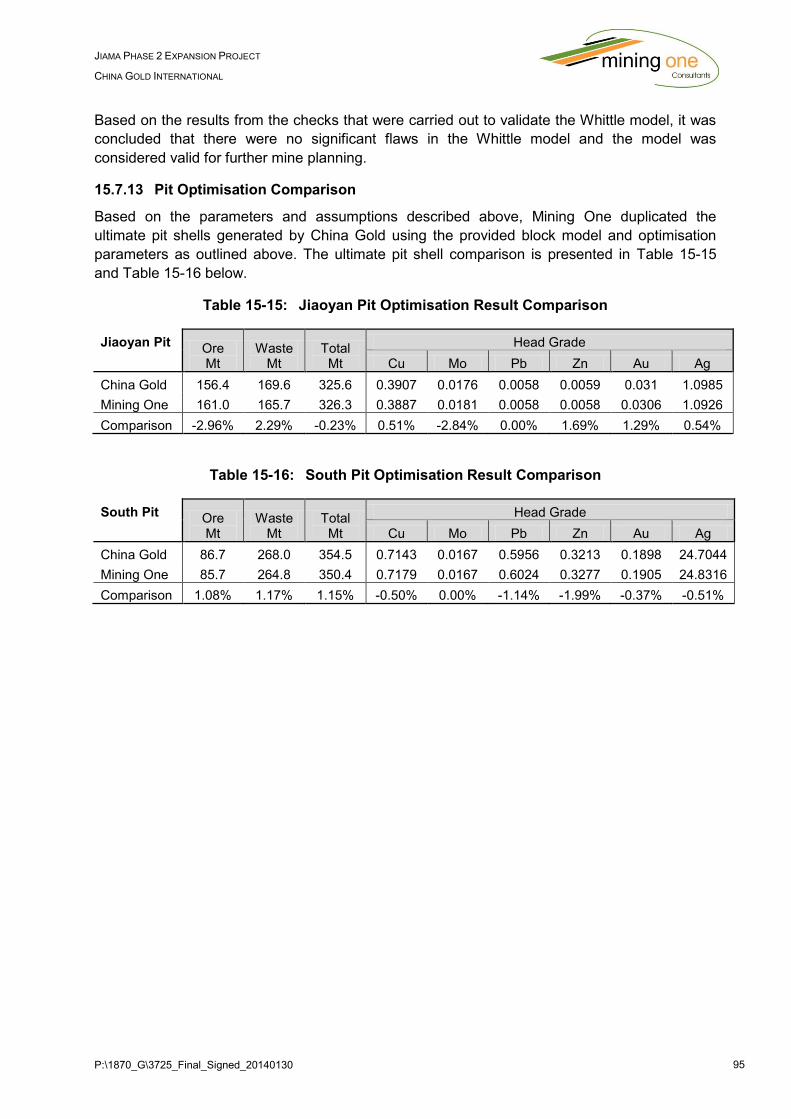
P:\1870_G\3725_Final_Signed_20140130 95
JIAMA PHASE 2 EXPANSION PROJECT
CHINA GOLD INTERNATIONAL
Based on the results from the checks that were carried out to validate the Whittle model, it was
concluded that there were no significant flaws in the Whittle model and the model was
considered valid for further mine planning.
15.7.13 Pit Optimisation Comparison
Based on the parameters and assumptions described above, Mining One duplicated the
ultimate pit shells generated by China Gold using the provided block model and optimisation
parameters as outlined above. The ultimate pit shell comparison is presented in Table 15-15
and Table 15-16 below.
Table 15-15: Jiaoyan Pit Optimisation Result Comparison
Jiaoyan Pit Ore Mt
Waste Mt
Total Mt
Head Grade
Cu Mo Pb Zn Au Ag
China Gold 156.4 169.6 325.6 0.3907 0.0176 0.0058 0.0059 0.031 1.0985
Mining One 161.0 165.7 326.3 0.3887 0.0181 0.0058 0.0058 0.0306 1.0926
Comparison -2.96% 2.29% -0.23% 0.51% -2.84% 0.00% 1.69% 1.29% 0.54%
Table 15-16: South Pit Optimisation Result Comparison
South Pit Ore Mt
Waste Mt
Total Mt
Head Grade
Cu Mo Pb Zn Au Ag
China Gold 86.7 268.0 354.5 0.7143 0.0167 0.5956 0.3213 0.1898 24.7044
Mining One 85.7 264.8 350.4 0.7179 0.0167 0.6024 0.3277 0.1905 24.8316
Comparison 1.08% 1.17% 1.15% -0.50% 0.00% -1.14% -1.99% -0.37% -0.51%

P:\1870_G\3725_Final_Signed_20140130 96
JIAMA PHASE 2 EXPANSION PROJECT
CHINA GOLD INTERNATIONAL
The differences between the optimal pit shells generated by China Gold and Mining One can be
attributed to the block model importation and the block size reduction in Whittle, and are considered
to be within acceptable limits.
15.7.14 Pit Optimisation Result
The pit optimisation was duplicated by Mining One to define the ultimate pit shell at various revenue
factors. Each scenario run in Whittle generated a series of pits including a cash flow for each pit.
Due to the spatial limitations for the Jiama project, two (2) separate areas were optimised; Jiaoyan
and South Pit. The selected pit for each area is the pit shell with the highest undiscounted cash
flow.
The cash flow for each ‘Whittle Pit’ generated and the pit selected for the base case for the Jiaoyan
area is illustrated in Figure 15-31.
Figure 15-31: Jiaoyan Pit Optimisation Results
The optimal pit shell for the Jiaoyan area is shown in Figure 15-32 and Figure 15-33 below.
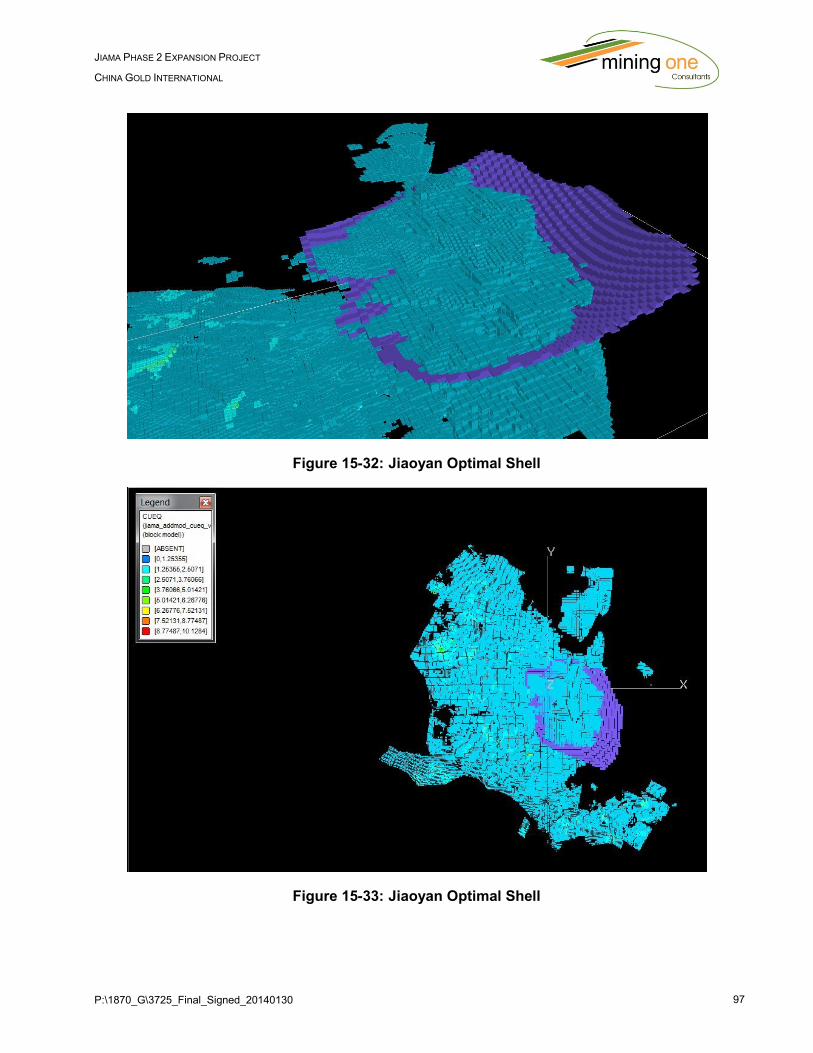
P:\1870_G\3725_Final_Signed_20140130 97
JIAMA PHASE 2 EXPANSION PROJECT
CHINA GOLD INTERNATIONAL
Figure 15-32: Jiaoyan Optimal Shell
Figure 15-33: Jiaoyan Optimal Shell

P:\1870_G\3725_Final_Signed_20140130 98
JIAMA PHASE 2 EXPANSION PROJECT
CHINA GOLD INTERNATIONAL
Table 15-17 below details the result of the shell for the Jiaoyan area.
Table 15-17: Jiaoyan Pit Shell Quantities
Item Unit Jiaoyan
Waste t 165,685,995
Ore t 161,031,074
Strip Ratio 1.03
Grade Cu % 0.3887
Grade Mo % 0.0181
Grade Pb % 0.0058
Grade Zn % 0.0058
Grade Au g/t 0.0306
Grade Ag g/t 1.0926
Tonnes Mined (Cu) t 62,431,163
Tonnes Mined (Mo) t 2,912,314
Tonnes Mined (Pb) t 926,213
Tonnes Mined (Zn) t 934,461
Ounces Mined (Au) oz. 158,029
Ounces Mined (Ag) oz. 5,642,720
Total Movement t 326,717,069
Mining Cost USD$ -$(733,228,641)
Processing Cost USD$ -$(2,798,300,000)
Revenue USD$ 3,890,308,868
Total Cash (Undisc.) USD$ 319,868,265
The cash flow for each ‘Whittle Pit’ generated and the pit selected for the base case for the South
area is illustrated in Figure 15-34.
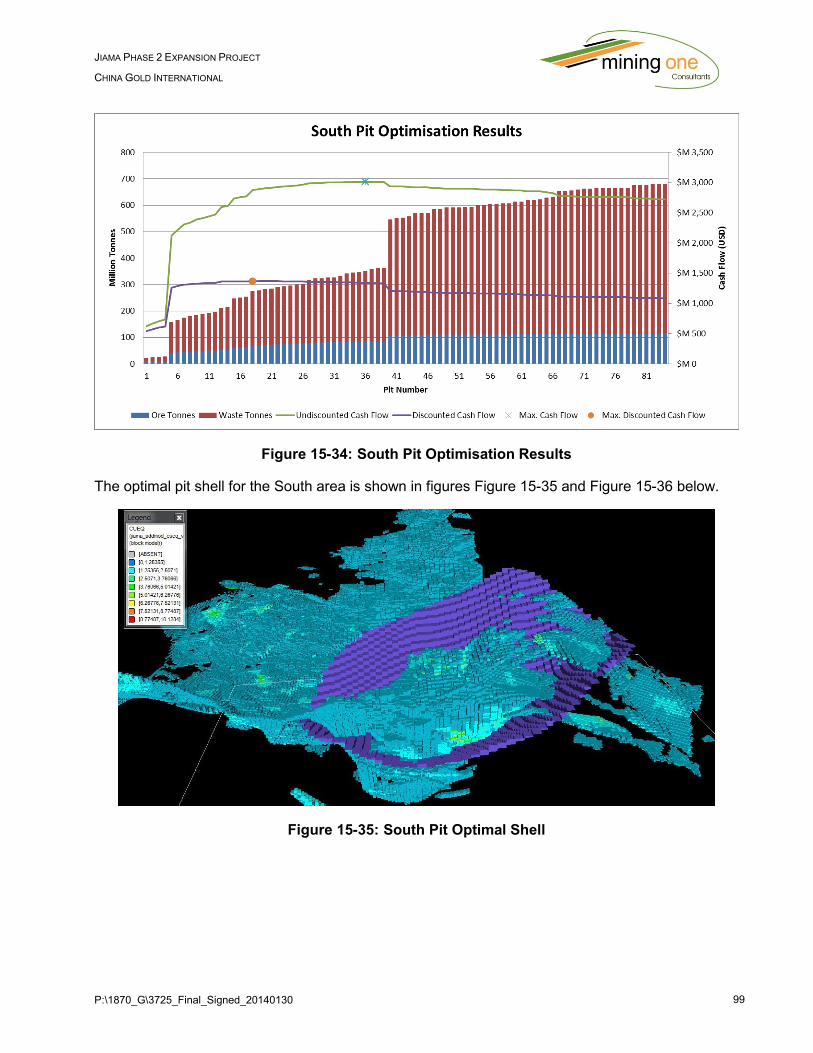
P:\1870_G\3725_Final_Signed_20140130 99
JIAMA PHASE 2 EXPANSION PROJECT
CHINA GOLD INTERNATIONAL
Figure 15-34: South Pit Optimisation Results
The optimal pit shell for the South area is shown in figures Figure 15-35 and Figure 15-36 below.
Figure 15-35: South Pit Optimal Shell
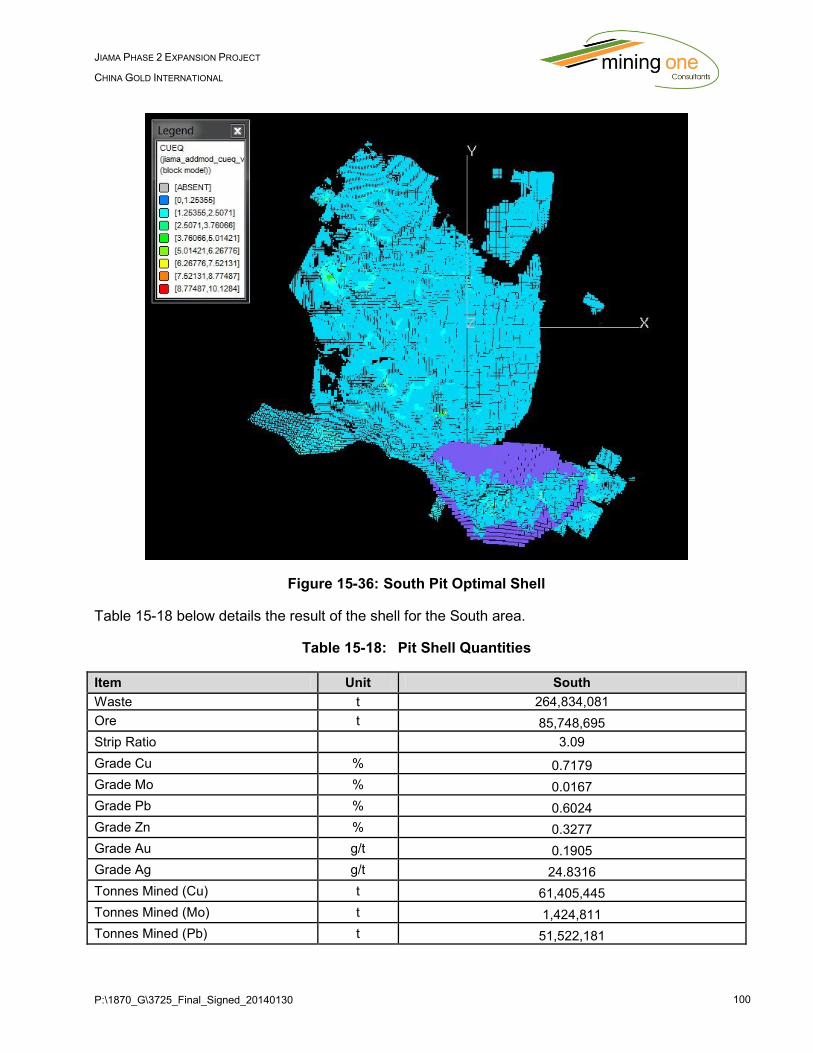
P:\1870_G\3725_Final_Signed_20140130 100
JIAMA PHASE 2 EXPANSION PROJECT
CHINA GOLD INTERNATIONAL
Figure 15-36: South Pit Optimal Shell
Table 15-18 below details the result of the shell for the South area.
Table 15-18: Pit Shell Quantities
Item Unit South
Waste t 264,834,081
Ore t 85,748,695
Strip Ratio 3.09
Grade Cu % 0.7179
Grade Mo % 0.0167
Grade Pb % 0.6024
Grade Zn % 0.3277
Grade Au g/t 0.1905
Grade Ag g/t 24.8316
Tonnes Mined (Cu) t 61,405,445
Tonnes Mined (Mo) t 1,424,811
Tonnes Mined (Pb) t 51,522,181
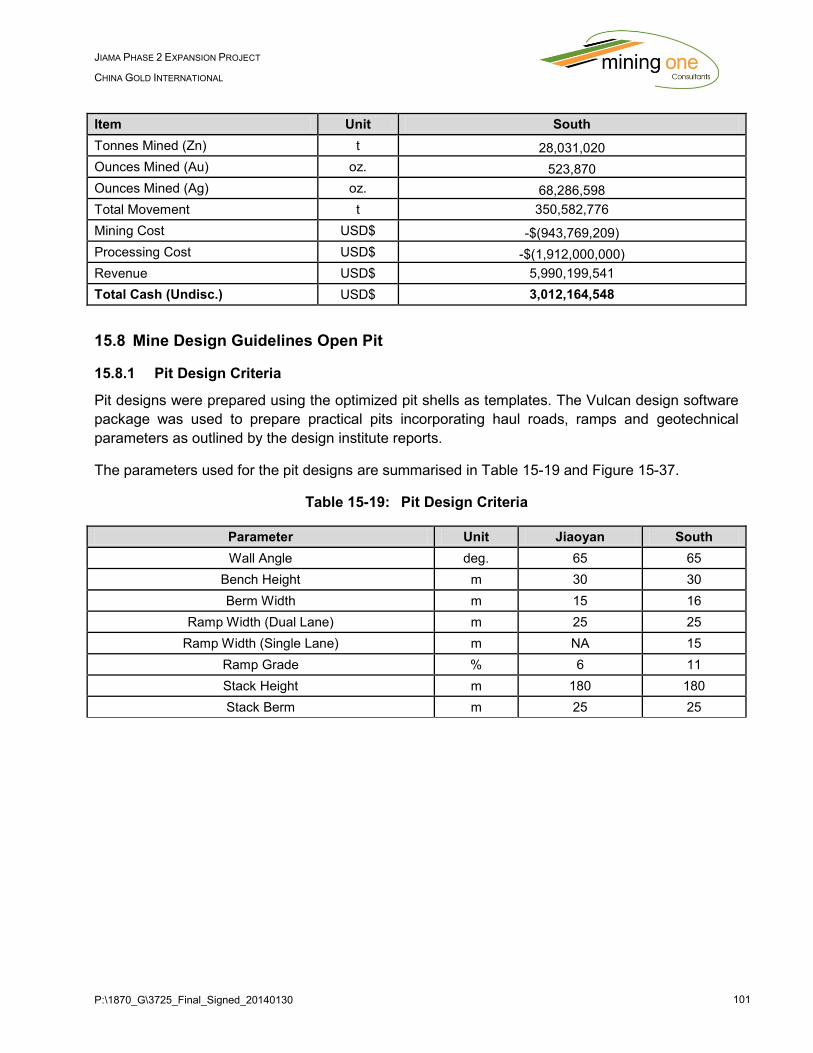
P:\1870_G\3725_Final_Signed_20140130 101
JIAMA PHASE 2 EXPANSION PROJECT
CHINA GOLD INTERNATIONAL
Item Unit South
Tonnes Mined (Zn) t 28,031,020
Ounces Mined (Au) oz. 523,870
Ounces Mined (Ag) oz. 68,286,598
Total Movement t 350,582,776
Mining Cost USD$ -$(943,769,209)
Processing Cost USD$ -$(1,912,000,000)
Revenue USD$ 5,990,199,541
Total Cash (Undisc.) USD$ 3,012,164,548
15.8 Mine Design Guidelines Open Pit
15.8.1 Pit Design Criteria
Pit designs were prepared using the optimized pit shells as templates. The Vulcan design software
package was used to prepare practical pits incorporating haul roads, ramps and geotechnical
parameters as outlined by the design institute reports.
The parameters used for the pit designs are summarised in Table 15-19 and Figure 15-37.
Table 15-19: Pit Design Criteria
Parameter Unit Jiaoyan South
Wall Angle deg. 65 65
Bench Height m 30 30
Berm Width m 15 16
Ramp Width (Dual Lane) m 25 25
Ramp Width (Single Lane) m NA 15
Ramp Grade % 6 11
Stack Height m 180 180
Stack Berm m 25 25
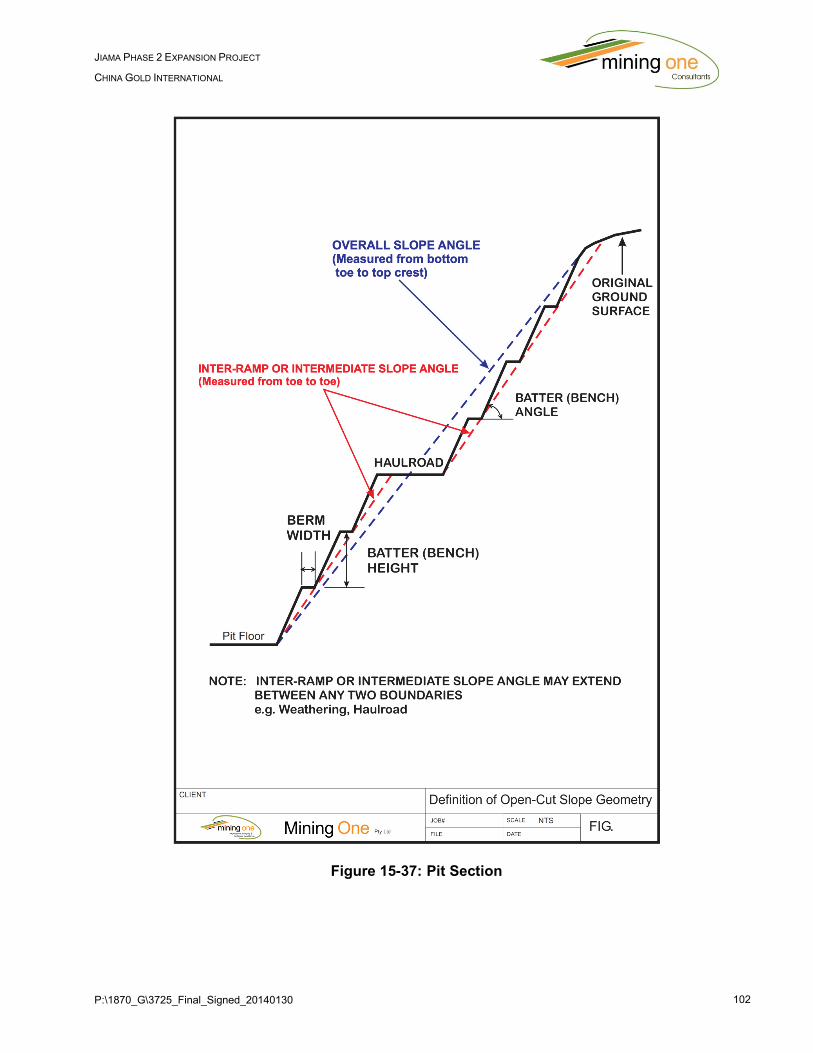
P:\1870_G\3725_Final_Signed_20140130 102
JIAMA PHASE 2 EXPANSION PROJECT
CHINA GOLD INTERNATIONAL
Figure 15-37: Pit Section

P:\1870_G\3725_Final_Signed_20140130 103
JIAMA PHASE 2 EXPANSION PROJECT
CHINA GOLD INTERNATIONAL
15.8.2 Pit Design Open Pit
The Whittle shells generated in section 0 were used as a guide for pit designs. The objective of the
pit design was to match as closely as possible to the shell but also consider practical mining
operation requirements.
Mining One validated the pit designs provided by China Gold using Whittle evaluation methods.
The cutbacks were not included as part of the evaluation but rather a comparison of total pit
utilising the whittle inputs evaluations. The whittle evaluations incorporated all costs and commodity
prices; using the mineral grade, processing recovery, mining dilution and product revenue to
calculate the potential economics of each mining block. The results of this evaluation are presented
in Table 15-20 and Table 15-21 below. A comparison between the design and the optimisation has
also been provided. All inferred material has been treated as waste - only indicated or measured
material may be used for the estimation of Mineral Reserves.
Table 15-20: Jiaoyan Pit – Whittle Evaluation Results
Jiaoyan
Item Unit Optimisation Design Difference
Waste t 165,685,995 202,660,549 18%
Ore t 161,031,074 175,364,203 8%
Strip Ratio
1.03 1.16 11%
Grade Cu % 0.3887 0.344 -13%
Grade Mo % 0.0181 0.016 -13%
Grade Pb % 0.0058 0.007 17%
Grade Zn % 0.0058 0.007 17%
Grade Au g/t 0.0306 0.029 -6%
Grade Ag g/t 1.0926 1.099 1%
Tonnes Mined (Cu) t 62,431,163 67,495,511 8%
Tonnes Mined (Mo) t 2,912,314 3,130,515 7%
Tonnes Mined (Pb) t 926,213 1,022,476 9%
Tonnes Mined (Zn) t 934,461 1,041,518 10%
Ounces Mined (Au) oz. 158,029 171,584 8%
Ounces Mined (Ag) oz. 5,642,720 6,165,837 8%
Total Movement t 326,717,069 378,024,752 14%
Mining Cost USD$ -($733,228,641) -($849,421,616) 14%
Processing Cost USD$ -($2,798,300,000) -($3,055,000,000) 8%
Revenue USD$ $3,890,308,868 $4,202,803,714 7%
Total Cash (Undisc.) USD$ $319,868,265 $256,334,287 -25%
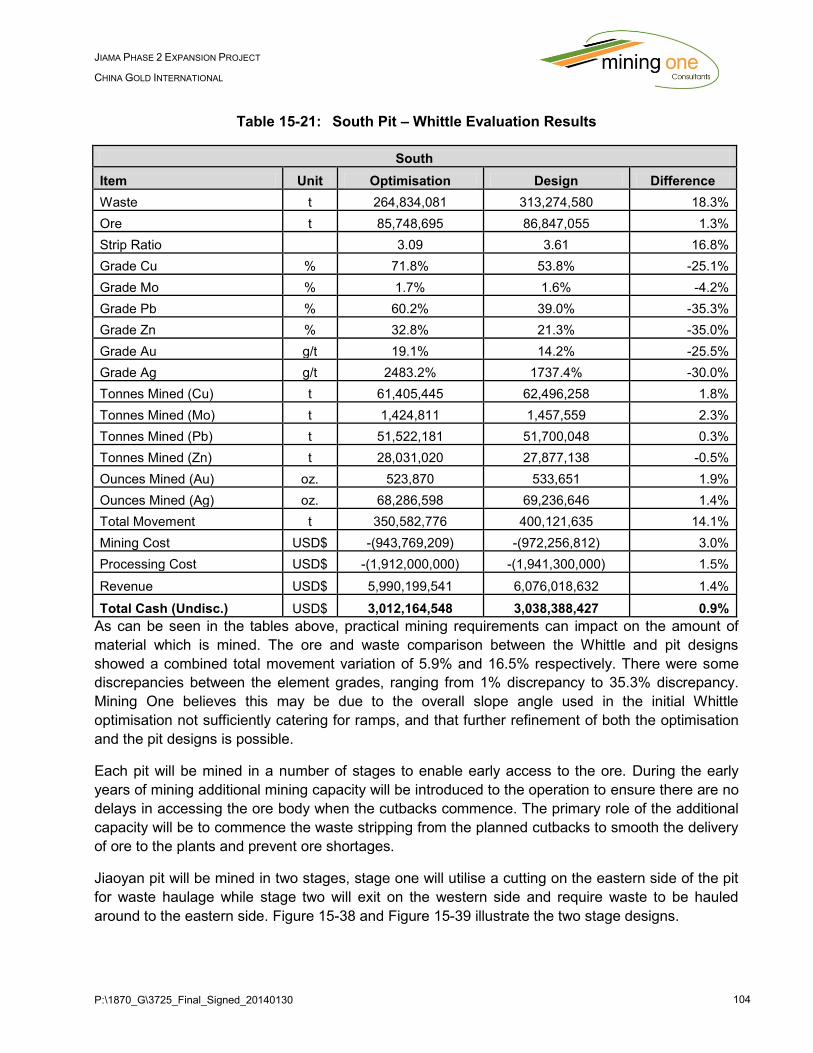
P:\1870_G\3725_Final_Signed_20140130 104
JIAMA PHASE 2 EXPANSION PROJECT
CHINA GOLD INTERNATIONAL
Table 15-21: South Pit – Whittle Evaluation Results
South
Item Unit Optimisation Design Difference
Waste t 264,834,081 313,274,580 18.3%
Ore t 85,748,695 86,847,055 1.3%
Strip Ratio
3.09 3.61 16.8%
Grade Cu % 71.8% 53.8% -25.1%
Grade Mo % 1.7% 1.6% -4.2%
Grade Pb % 60.2% 39.0% -35.3%
Grade Zn % 32.8% 21.3% -35.0%
Grade Au g/t 19.1% 14.2% -25.5%
Grade Ag g/t 2483.2% 1737.4% -30.0%
Tonnes Mined (Cu) t 61,405,445 62,496,258 1.8%
Tonnes Mined (Mo) t 1,424,811 1,457,559 2.3%
Tonnes Mined (Pb) t 51,522,181 51,700,048 0.3%
Tonnes Mined (Zn) t 28,031,020 27,877,138 -0.5%
Ounces Mined (Au) oz. 523,870 533,651 1.9%
Ounces Mined (Ag) oz. 68,286,598 69,236,646 1.4%
Total Movement t 350,582,776 400,121,635 14.1%
Mining Cost USD$ -(943,769,209) -(972,256,812) 3.0%
Processing Cost USD$ -(1,912,000,000) -(1,941,300,000) 1.5%
Revenue USD$ 5,990,199,541 6,076,018,632 1.4%
Total Cash (Undisc.) USD$ 3,012,164,548 3,038,388,427 0.9%
As can be seen in the tables above, practical mining requirements can impact on the amount of
material which is mined. The ore and waste comparison between the Whittle and pit designs
showed a combined total movement variation of 5.9% and 16.5% respectively. There were some
discrepancies between the element grades, ranging from 1% discrepancy to 35.3% discrepancy.
Mining One believes this may be due to the overall slope angle used in the initial Whittle
optimisation not sufficiently catering for ramps, and that further refinement of both the optimisation
and the pit designs is possible.
Each pit will be mined in a number of stages to enable early access to the ore. During the early
years of mining additional mining capacity will be introduced to the operation to ensure there are no
delays in accessing the ore body when the cutbacks commence. The primary role of the additional
capacity will be to commence the waste stripping from the planned cutbacks to smooth the delivery
of ore to the plants and prevent ore shortages.
Jiaoyan pit will be mined in two stages, stage one will utilise a cutting on the eastern side of the pit
for waste haulage while stage two will exit on the western side and require waste to be hauled
around to the eastern side. Figure 15-38 and Figure 15-39 illustrate the two stage designs.
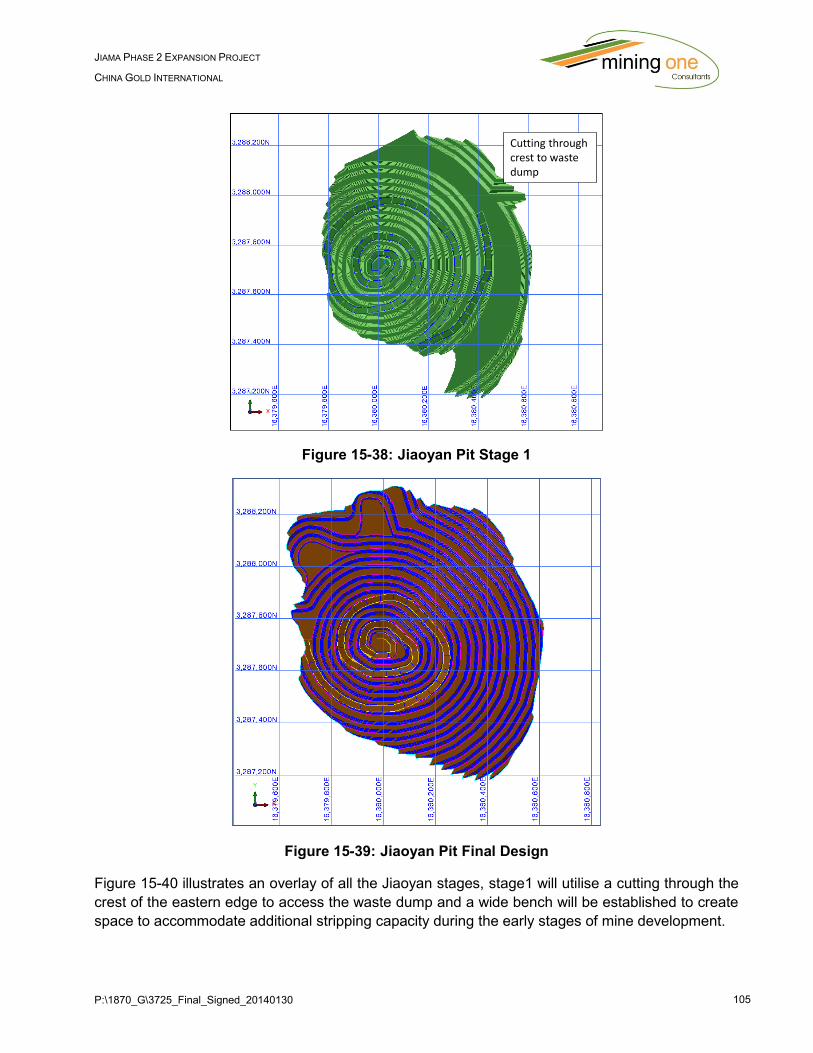
P:\1870_G\3725_Final_Signed_20140130 105
JIAMA PHASE 2 EXPANSION PROJECT
CHINA GOLD INTERNATIONAL
Figure 15-38: Jiaoyan Pit Stage 1
Figure 15-39: Jiaoyan Pit Final Design
Figure 15-40 illustrates an overlay of all the Jiaoyan stages, stage1 will utilise a cutting through the
crest of the eastern edge to access the waste dump and a wide bench will be established to create
space to accommodate additional stripping capacity during the early stages of mine development.
Cutting through crest to waste dump
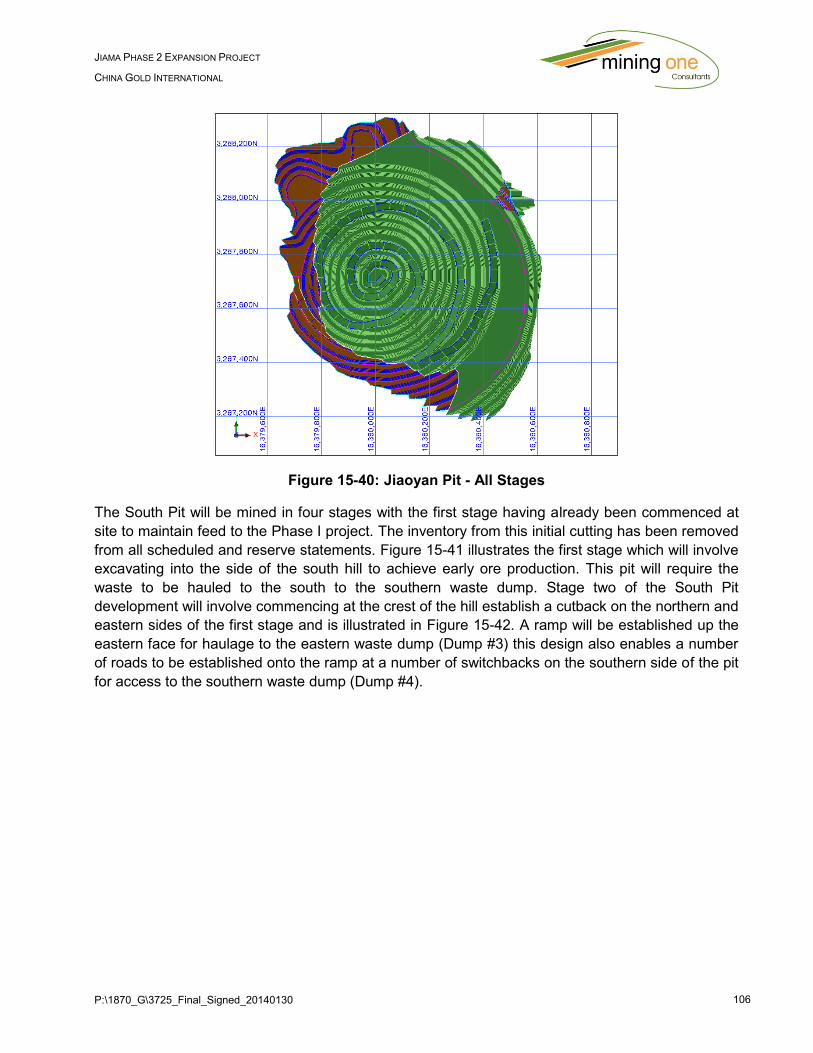
P:\1870_G\3725_Final_Signed_20140130 106
JIAMA PHASE 2 EXPANSION PROJECT
CHINA GOLD INTERNATIONAL
Figure 15-40: Jiaoyan Pit - All Stages
The South Pit will be mined in four stages with the first stage having already been commenced at
site to maintain feed to the Phase I project. The inventory from this initial cutting has been removed
from all scheduled and reserve statements. Figure 15-41 illustrates the first stage which will involve
excavating into the side of the south hill to achieve early ore production. This pit will require the
waste to be hauled to the south to the southern waste dump. Stage two of the South Pit
development will involve commencing at the crest of the hill establish a cutback on the northern and
eastern sides of the first stage and is illustrated in Figure 15-42. A ramp will be established up the
eastern face for haulage to the eastern waste dump (Dump #3) this design also enables a number
of roads to be established onto the ramp at a number of switchbacks on the southern side of the pit
for access to the southern waste dump (Dump #4).
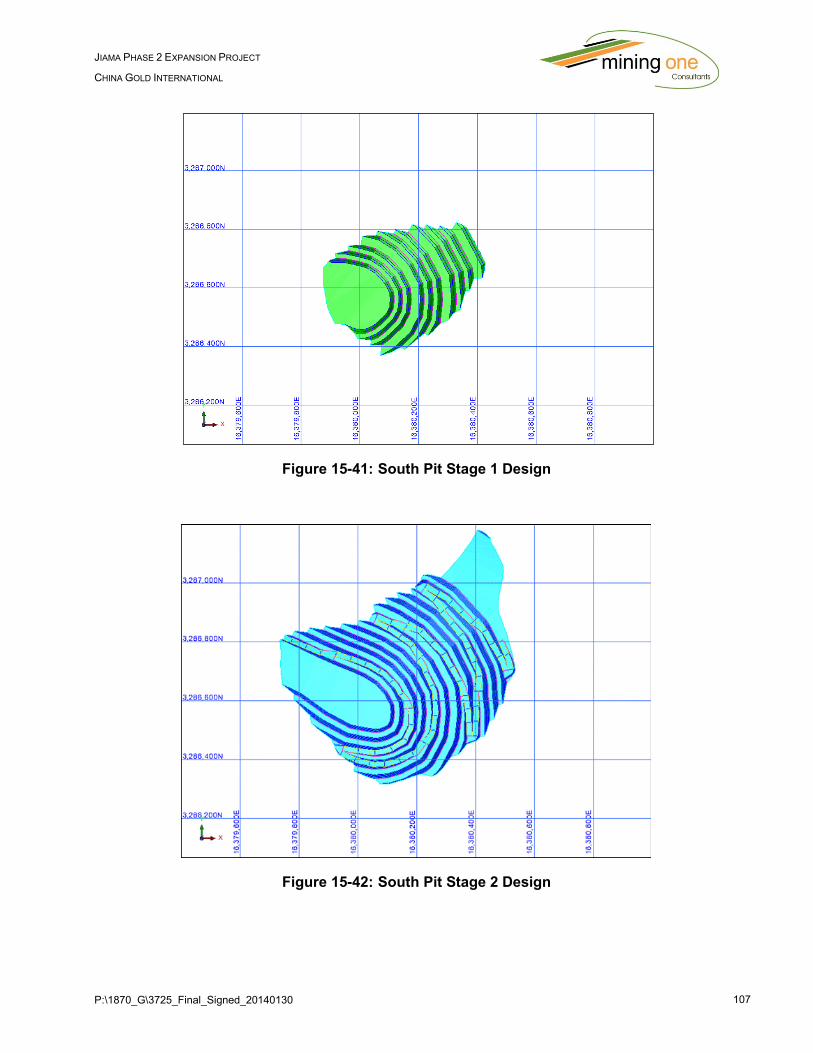
P:\1870_G\3725_Final_Signed_20140130 107
JIAMA PHASE 2 EXPANSION PROJECT
CHINA GOLD INTERNATIONAL
Figure 15-41: South Pit Stage 1 Design
Figure 15-42: South Pit Stage 2 Design
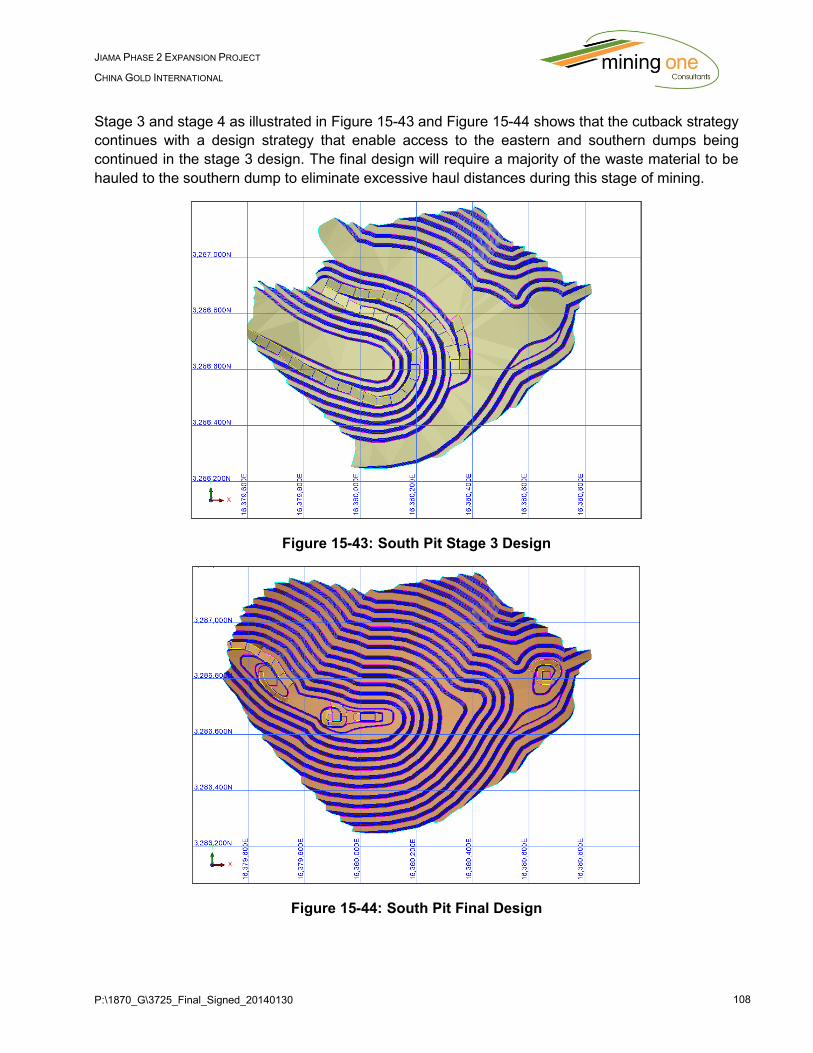
P:\1870_G\3725_Final_Signed_20140130 108
JIAMA PHASE 2 EXPANSION PROJECT
CHINA GOLD INTERNATIONAL
Stage 3 and stage 4 as illustrated in Figure 15-43 and Figure 15-44 shows that the cutback strategy
continues with a design strategy that enable access to the eastern and southern dumps being
continued in the stage 3 design. The final design will require a majority of the waste material to be
hauled to the southern dump to eliminate excessive haul distances during this stage of mining.
Figure 15-43: South Pit Stage 3 Design
Figure 15-44: South Pit Final Design
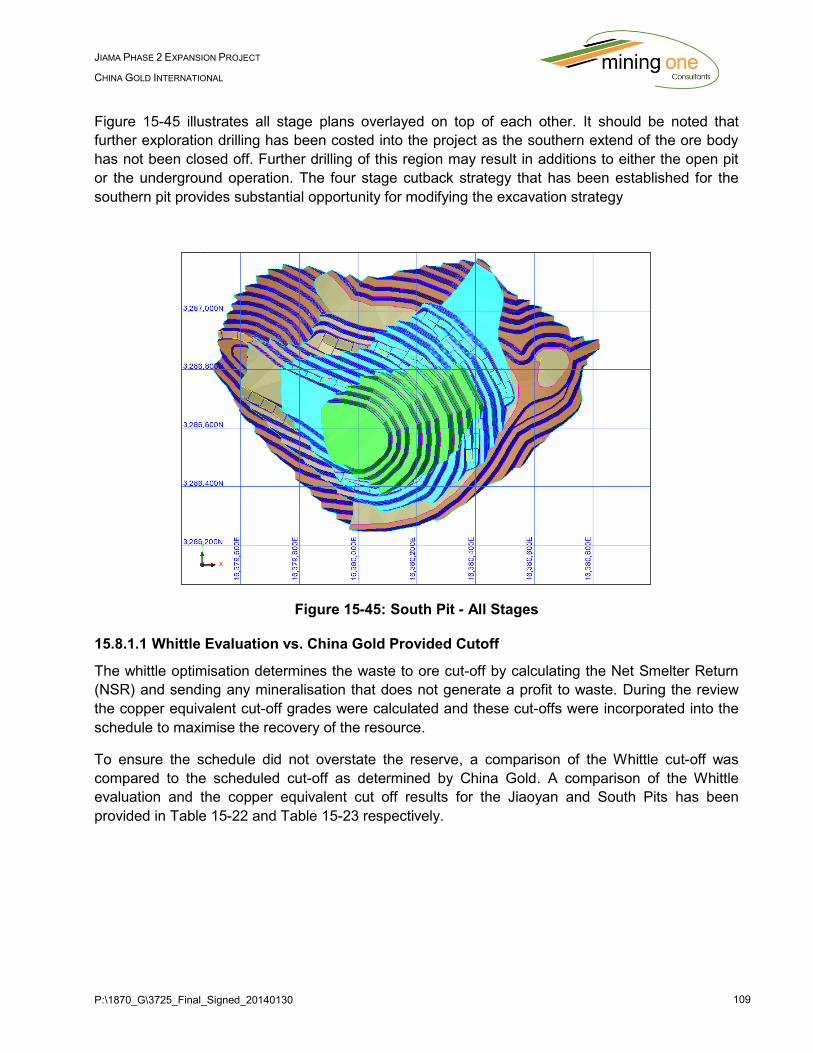
P:\1870_G\3725_Final_Signed_20140130 109
JIAMA PHASE 2 EXPANSION PROJECT
CHINA GOLD INTERNATIONAL
Figure 15-45 illustrates all stage plans overlayed on top of each other. It should be noted that
further exploration drilling has been costed into the project as the southern extend of the ore body
has not been closed off. Further drilling of this region may result in additions to either the open pit
or the underground operation. The four stage cutback strategy that has been established for the
southern pit provides substantial opportunity for modifying the excavation strategy
Figure 15-45: South Pit - All Stages
15.8.1.1 Whittle Evaluation vs. China Gold Provided Cutoff
The whittle optimisation determines the waste to ore cut-off by calculating the Net Smelter Return
(NSR) and sending any mineralisation that does not generate a profit to waste. During the review
the copper equivalent cut-off grades were calculated and these cut-offs were incorporated into the
schedule to maximise the recovery of the resource.
To ensure the schedule did not overstate the reserve, a comparison of the Whittle cut-off was
compared to the scheduled cut-off as determined by China Gold. A comparison of the Whittle
evaluation and the copper equivalent cut off results for the Jiaoyan and South Pits has been
provided in Table 15-22 and Table 15-23 respectively.
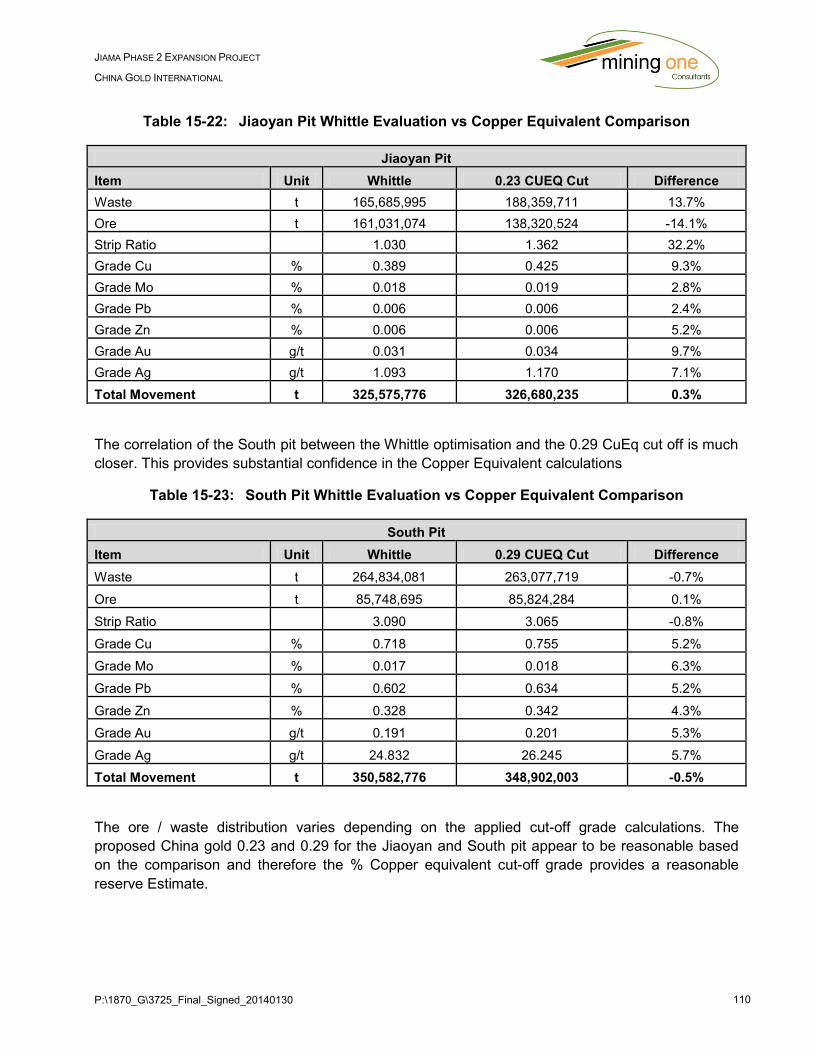
P:\1870_G\3725_Final_Signed_20140130 110
JIAMA PHASE 2 EXPANSION PROJECT
CHINA GOLD INTERNATIONAL
Table 15-22: Jiaoyan Pit Whittle Evaluation vs Copper Equivalent Comparison
Jiaoyan Pit
Item Unit Whittle 0.23 CUEQ Cut Difference
Waste t 165,685,995 188,359,711 13.7%
Ore t 161,031,074 138,320,524 -14.1%
Strip Ratio 1.030 1.362 32.2%
Grade Cu % 0.389 0.425 9.3%
Grade Mo % 0.018 0.019 2.8%
Grade Pb % 0.006 0.006 2.4%
Grade Zn % 0.006 0.006 5.2%
Grade Au g/t 0.031 0.034 9.7%
Grade Ag g/t 1.093 1.170 7.1%
Total Movement t 325,575,776 326,680,235 0.3%
The correlation of the South pit between the Whittle optimisation and the 0.29 CuEq cut off is much
closer. This provides substantial confidence in the Copper Equivalent calculations
Table 15-23: South Pit Whittle Evaluation vs Copper Equivalent Comparison
South Pit
Item Unit Whittle 0.29 CUEQ Cut Difference
Waste t 264,834,081 263,077,719 -0.7%
Ore t 85,748,695 85,824,284 0.1%
Strip Ratio 3.090 3.065 -0.8%
Grade Cu % 0.718 0.755 5.2%
Grade Mo % 0.017 0.018 6.3%
Grade Pb % 0.602 0.634 5.2%
Grade Zn % 0.328 0.342 4.3%
Grade Au g/t 0.191 0.201 5.3%
Grade Ag g/t 24.832 26.245 5.7%
Total Movement t 350,582,776 348,902,003 -0.5%
The ore / waste distribution varies depending on the applied cut-off grade calculations. The
proposed China gold 0.23 and 0.29 for the Jiaoyan and South pit appear to be reasonable based
on the comparison and therefore the % Copper equivalent cut-off grade provides a reasonable
reserve Estimate.

P:\1870_G\3725_Final_Signed_20140130 111
JIAMA PHASE 2 EXPANSION PROJECT
CHINA GOLD INTERNATIONAL
15.9 Mining Schedule Overview
A mining schedule was prepared incorporating the pit designs and their respective stage plans.
Annual ore production from the open pit system was targeted at 9.9Mt of ore per annum. This was
to compliment the underground mine schedule (6.6Mtpa) to generate total ROM feed of 16.5Mtpa
for the Jiama Phase II complex. The open pit has been designed to utilise 90t mining trucks
delivering ore to two waste dump areas as illustrated in Figure 15-46.
A spoil balance was conducted to confirm the capacity of the waste dumps at a swell factor of
0.25%. At the time of this study the Southern waste dump was under review as there is potential to
extend the size of the Southern pit as the ore body remains open to the south.
Conventional drill, blast, load, haul and dump mining practices will be used for the mining of both
Phase II pits.
Figure 15-46: Life of Mine Waste Dumps and Pit Designs
Contracts have been signed for the two open pits which includes all services for the open cut
operations. Two contractors will be employed to deliver the production capacity required.
South Pit
Jiaoyan PitEastern Waste Dump – Dump #3
Southern Waste Dump – Dump #4
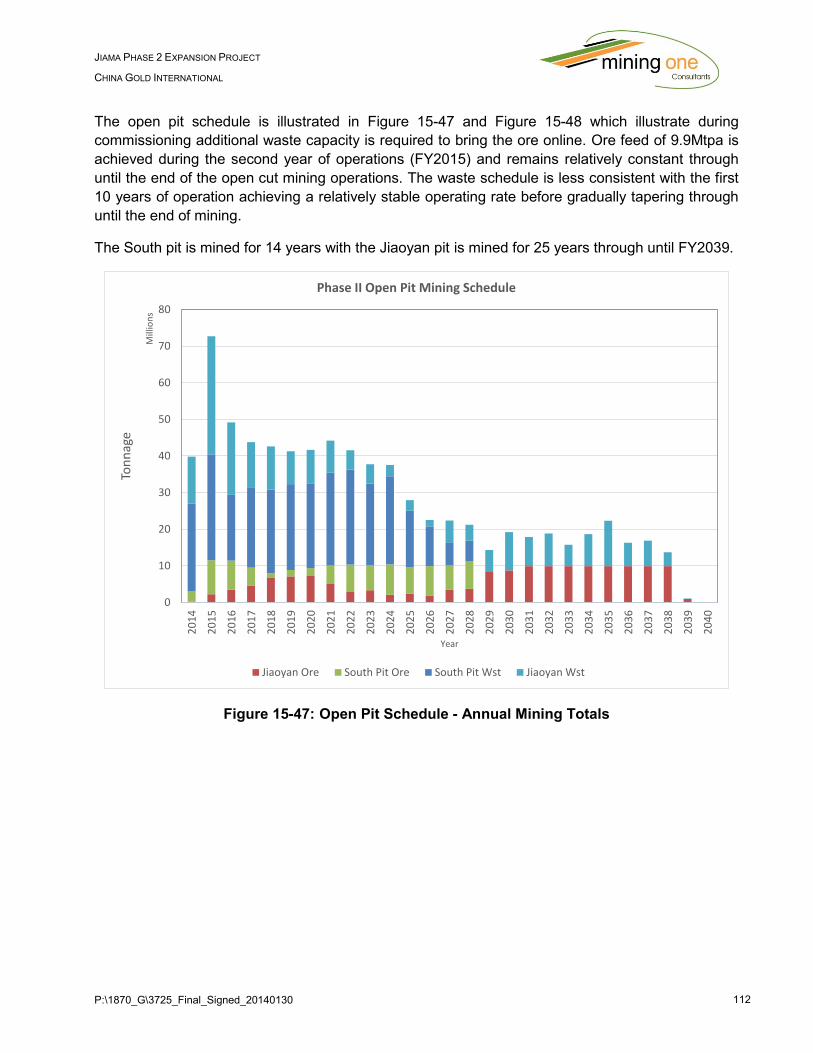
P:\1870_G\3725_Final_Signed_20140130 112
JIAMA PHASE 2 EXPANSION PROJECT
CHINA GOLD INTERNATIONAL
The open pit schedule is illustrated in Figure 15-47 and Figure 15-48 which illustrate during
commissioning additional waste capacity is required to bring the ore online. Ore feed of 9.9Mtpa is
achieved during the second year of operations (FY2015) and remains relatively constant through
until the end of the open cut mining operations. The waste schedule is less consistent with the first
10 years of operation achieving a relatively stable operating rate before gradually tapering through
until the end of mining.
The South pit is mined for 14 years with the Jiaoyan pit is mined for 25 years through until FY2039.
Figure 15-47: Open Pit Schedule - Annual Mining Totals
0
10
20
30
40
50
60
70
80
20
14
20
15
20
16
20
17
20
18
20
19
20
20
20
21
20
22
20
23
20
24
20
25
20
26
20
27
20
28
20
29
20
30
20
31
20
32
20
33
20
34
20
35
20
36
20
37
20
38
20
39
20
40
Ton
nag
e
Mill
ion
s
Year
Phase II Open Pit Mining Schedule
Jiaoyan Ore South Pit Ore South Pit Wst Jiaoyan Wst
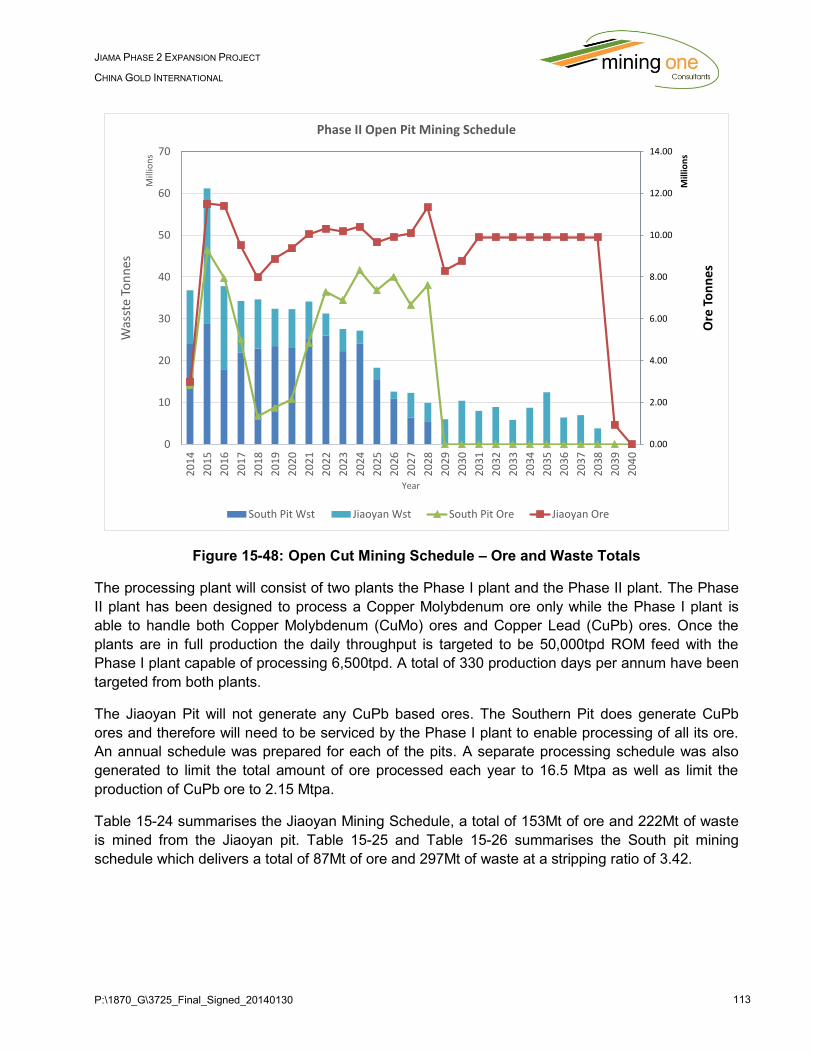
P:\1870_G\3725_Final_Signed_20140130 113
JIAMA PHASE 2 EXPANSION PROJECT
CHINA GOLD INTERNATIONAL
Figure 15-48: Open Cut Mining Schedule – Ore and Waste Totals
The processing plant will consist of two plants the Phase I plant and the Phase II plant. The Phase
II plant has been designed to process a Copper Molybdenum ore only while the Phase I plant is
able to handle both Copper Molybdenum (CuMo) ores and Copper Lead (CuPb) ores. Once the
plants are in full production the daily throughput is targeted to be 50,000tpd ROM feed with the
Phase I plant capable of processing 6,500tpd. A total of 330 production days per annum have been
targeted from both plants.
The Jiaoyan Pit will not generate any CuPb based ores. The Southern Pit does generate CuPb
ores and therefore will need to be serviced by the Phase I plant to enable processing of all its ore.
An annual schedule was prepared for each of the pits. A separate processing schedule was also
generated to limit the total amount of ore processed each year to 16.5 Mtpa as well as limit the
production of CuPb ore to 2.15 Mtpa.
Table 15-24 summarises the Jiaoyan Mining Schedule, a total of 153Mt of ore and 222Mt of waste
is mined from the Jiaoyan pit. Table 15-25 and Table 15-26 summarises the South pit mining
schedule which delivers a total of 87Mt of ore and 297Mt of waste at a stripping ratio of 3.42.
0.00
2.00
4.00
6.00
8.00
10.00
12.00
14.00
0
10
20
30
40
50
60
70
20
14
20
15
20
16
20
17
20
18
20
19
20
20
20
21
20
22
20
23
20
24
20
25
20
26
20
27
20
28
20
29
20
30
20
31
20
32
20
33
203
4
20
35
20
36
20
37
20
38
203
9
20
40
Ore
To
nn
es
Mill
ion
s
Was
ste
Ton
nes
Mill
ion
s
Year
Phase II Open Pit Mining Schedule
South Pit Wst Jiaoyan Wst South Pit Ore Jiaoyan Ore
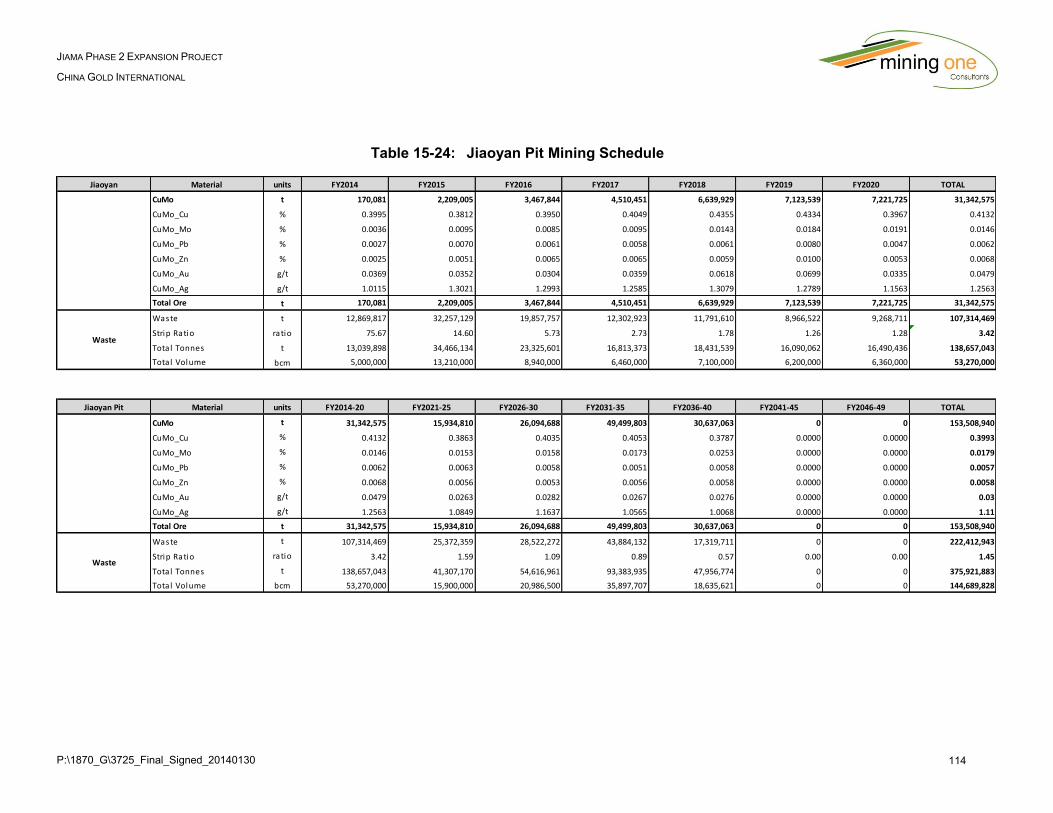
P:\1870_G\3725_Final_Signed_20140130 114
JIAMA PHASE 2 EXPANSION PROJECT
CHINA GOLD INTERNATIONAL
Table 15-24: Jiaoyan Pit Mining Schedule
Jiaoyan Material units FY2014 FY2015 FY2016 FY2017 FY2018 FY2019 FY2020 TOTAL
CuMo t 170,081 2,209,005 3,467,844 4,510,451 6,639,929 7,123,539 7,221,725 31,342,575
CuMo_Cu % 0.3995 0.3812 0.3950 0.4049 0.4355 0.4334 0.3967 0.4132
CuMo_Mo % 0.0036 0.0095 0.0085 0.0095 0.0143 0.0184 0.0191 0.0146
CuMo_Pb % 0.0027 0.0070 0.0061 0.0058 0.0061 0.0080 0.0047 0.0062
CuMo_Zn % 0.0025 0.0051 0.0065 0.0065 0.0059 0.0100 0.0053 0.0068
CuMo_Au g/t 0.0369 0.0352 0.0304 0.0359 0.0618 0.0699 0.0335 0.0479
CuMo_Ag g/t 1.0115 1.3021 1.2993 1.2585 1.3079 1.2789 1.1563 1.2563
Total Ore t 170,081 2,209,005 3,467,844 4,510,451 6,639,929 7,123,539 7,221,725 31,342,575
Waste t 12,869,817 32,257,129 19,857,757 12,302,923 11,791,610 8,966,522 9,268,711 107,314,469
Strip Ratio ratio 75.67 14.60 5.73 2.73 1.78 1.26 1.28 3.42
Total Tonnes t 13,039,898 34,466,134 23,325,601 16,813,373 18,431,539 16,090,062 16,490,436 138,657,043
Total Volume bcm 5,000,000 13,210,000 8,940,000 6,460,000 7,100,000 6,200,000 6,360,000 53,270,000
Jiaoyan Pit Material units FY2014-20 FY2021-25 FY2026-30 FY2031-35 FY2036-40 FY2041-45 FY2046-49 TOTAL
CuMo t 31,342,575 15,934,810 26,094,688 49,499,803 30,637,063 0 0 153,508,940
CuMo_Cu % 0.4132 0.3863 0.4035 0.4053 0.3787 0.0000 0.0000 0.3993
CuMo_Mo % 0.0146 0.0153 0.0158 0.0173 0.0253 0.0000 0.0000 0.0179
CuMo_Pb % 0.0062 0.0063 0.0058 0.0051 0.0058 0.0000 0.0000 0.0057
CuMo_Zn % 0.0068 0.0056 0.0053 0.0056 0.0058 0.0000 0.0000 0.0058
CuMo_Au g/t 0.0479 0.0263 0.0282 0.0267 0.0276 0.0000 0.0000 0.03
CuMo_Ag g/t 1.2563 1.0849 1.1637 1.0565 1.0068 0.0000 0.0000 1.11
Total Ore t 31,342,575 15,934,810 26,094,688 49,499,803 30,637,063 0 0 153,508,940
Waste t 107,314,469 25,372,359 28,522,272 43,884,132 17,319,711 0 0 222,412,943
Strip Ratio ratio 3.42 1.59 1.09 0.89 0.57 0.00 0.00 1.45
Total Tonnes t 138,657,043 41,307,170 54,616,961 93,383,935 47,956,774 0 0 375,921,883
Total Volume bcm 53,270,000 15,900,000 20,986,500 35,897,707 18,635,621 0 0 144,689,828
Waste
Waste
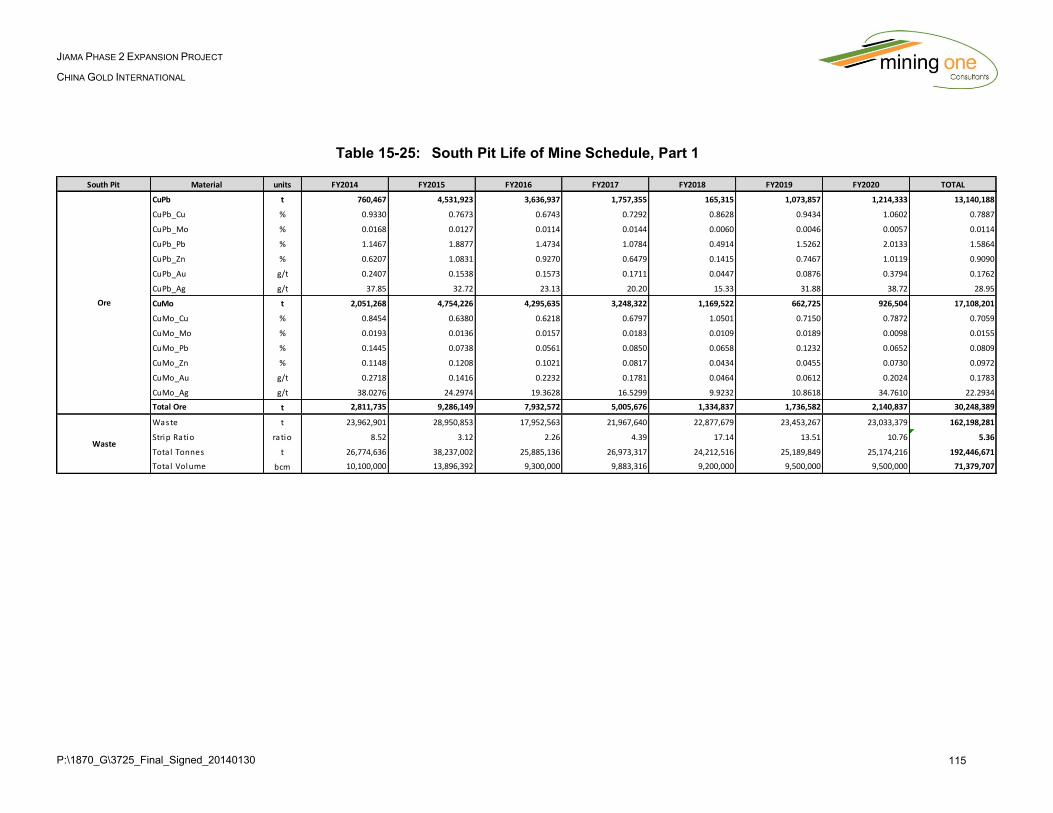
P:\1870_G\3725_Final_Signed_20140130 115
JIAMA PHASE 2 EXPANSION PROJECT
CHINA GOLD INTERNATIONAL
Table 15-25: South Pit Life of Mine Schedule, Part 1
South Pit Material units FY2014 FY2015 FY2016 FY2017 FY2018 FY2019 FY2020 TOTAL
CuPb t 760,467 4,531,923 3,636,937 1,757,355 165,315 1,073,857 1,214,333 13,140,188
CuPb_Cu % 0.9330 0.7673 0.6743 0.7292 0.8628 0.9434 1.0602 0.7887
CuPb_Mo % 0.0168 0.0127 0.0114 0.0144 0.0060 0.0046 0.0057 0.0114
CuPb_Pb % 1.1467 1.8877 1.4734 1.0784 0.4914 1.5262 2.0133 1.5864
CuPb_Zn % 0.6207 1.0831 0.9270 0.6479 0.1415 0.7467 1.0119 0.9090
CuPb_Au g/t 0.2407 0.1538 0.1573 0.1711 0.0447 0.0876 0.3794 0.1762
CuPb_Ag g/t 37.85 32.72 23.13 20.20 15.33 31.88 38.72 28.95
CuMo t 2,051,268 4,754,226 4,295,635 3,248,322 1,169,522 662,725 926,504 17,108,201
CuMo_Cu % 0.8454 0.6380 0.6218 0.6797 1.0501 0.7150 0.7872 0.7059
CuMo_Mo % 0.0193 0.0136 0.0157 0.0183 0.0109 0.0189 0.0098 0.0155
CuMo_Pb % 0.1445 0.0738 0.0561 0.0850 0.0658 0.1232 0.0652 0.0809
CuMo_Zn % 0.1148 0.1208 0.1021 0.0817 0.0434 0.0455 0.0730 0.0972
CuMo_Au g/t 0.2718 0.1416 0.2232 0.1781 0.0464 0.0612 0.2024 0.1783
CuMo_Ag g/t 38.0276 24.2974 19.3628 16.5299 9.9232 10.8618 34.7610 22.2934
Total Ore t 2,811,735 9,286,149 7,932,572 5,005,676 1,334,837 1,736,582 2,140,837 30,248,389
Waste t 23,962,901 28,950,853 17,952,563 21,967,640 22,877,679 23,453,267 23,033,379 162,198,281
Strip Ratio ratio 8.52 3.12 2.26 4.39 17.14 13.51 10.76 5.36
Total Tonnes t 26,774,636 38,237,002 25,885,136 26,973,317 24,212,516 25,189,849 25,174,216 192,446,671
Total Volume bcm 10,100,000 13,896,392 9,300,000 9,883,316 9,200,000 9,500,000 9,500,000 71,379,707
Ore
Waste
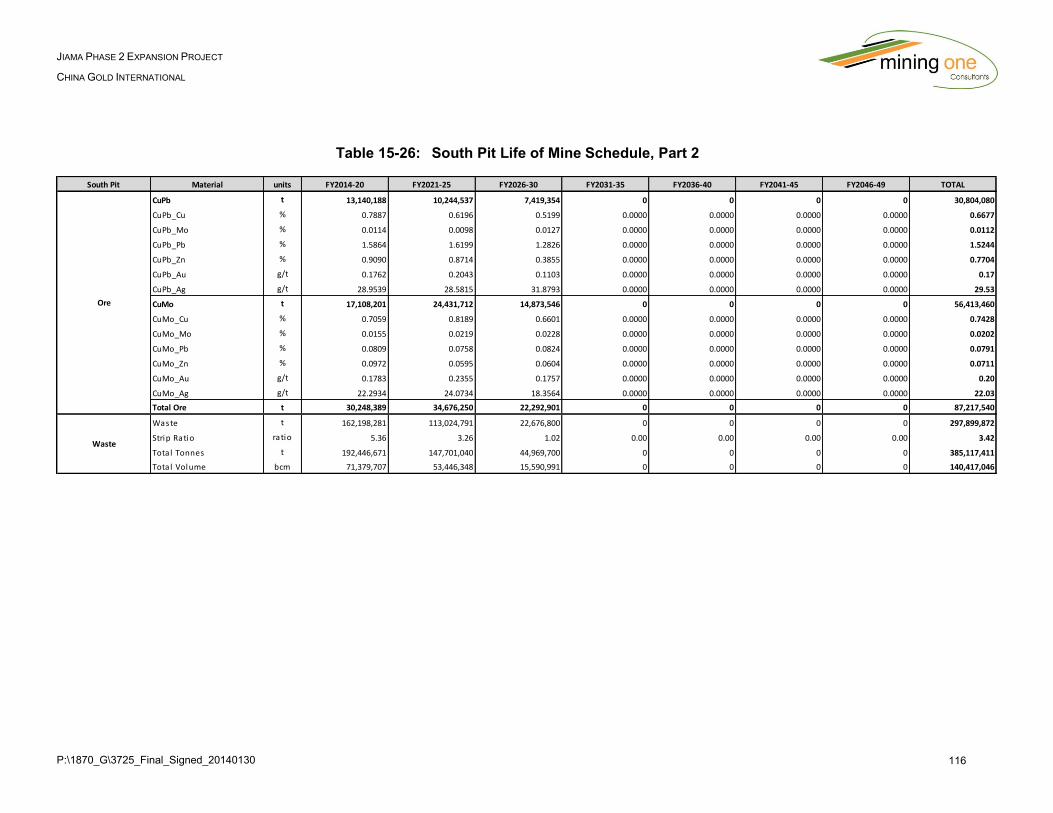
P:\1870_G\3725_Final_Signed_20140130 116
JIAMA PHASE 2 EXPANSION PROJECT
CHINA GOLD INTERNATIONAL
Table 15-26: South Pit Life of Mine Schedule, Part 2
South Pit Material units FY2014-20 FY2021-25 FY2026-30 FY2031-35 FY2036-40 FY2041-45 FY2046-49 TOTAL
CuPb t 13,140,188 10,244,537 7,419,354 0 0 0 0 30,804,080
CuPb_Cu % 0.7887 0.6196 0.5199 0.0000 0.0000 0.0000 0.0000 0.6677
CuPb_Mo % 0.0114 0.0098 0.0127 0.0000 0.0000 0.0000 0.0000 0.0112
CuPb_Pb % 1.5864 1.6199 1.2826 0.0000 0.0000 0.0000 0.0000 1.5244
CuPb_Zn % 0.9090 0.8714 0.3855 0.0000 0.0000 0.0000 0.0000 0.7704
CuPb_Au g/t 0.1762 0.2043 0.1103 0.0000 0.0000 0.0000 0.0000 0.17
CuPb_Ag g/t 28.9539 28.5815 31.8793 0.0000 0.0000 0.0000 0.0000 29.53
CuMo t 17,108,201 24,431,712 14,873,546 0 0 0 0 56,413,460
CuMo_Cu % 0.7059 0.8189 0.6601 0.0000 0.0000 0.0000 0.0000 0.7428
CuMo_Mo % 0.0155 0.0219 0.0228 0.0000 0.0000 0.0000 0.0000 0.0202
CuMo_Pb % 0.0809 0.0758 0.0824 0.0000 0.0000 0.0000 0.0000 0.0791
CuMo_Zn % 0.0972 0.0595 0.0604 0.0000 0.0000 0.0000 0.0000 0.0711
CuMo_Au g/t 0.1783 0.2355 0.1757 0.0000 0.0000 0.0000 0.0000 0.20
CuMo_Ag g/t 22.2934 24.0734 18.3564 0.0000 0.0000 0.0000 0.0000 22.03
Total Ore t 30,248,389 34,676,250 22,292,901 0 0 0 0 87,217,540
Waste t 162,198,281 113,024,791 22,676,800 0 0 0 0 297,899,872
Strip Ratio ratio 5.36 3.26 1.02 0.00 0.00 0.00 0.00 3.42
Total Tonnes t 192,446,671 147,701,040 44,969,700 0 0 0 0 385,117,411
Total Volume bcm 71,379,707 53,446,348 15,590,991 0 0 0 0 140,417,046
Ore
Waste
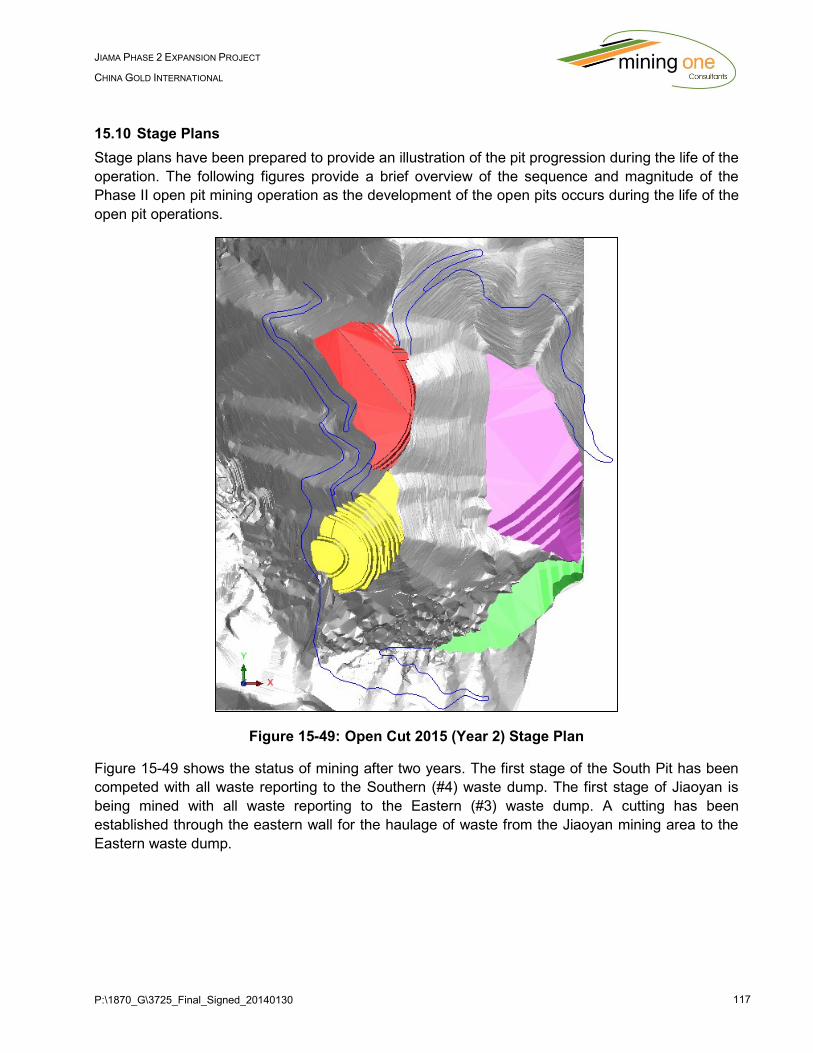
P:\1870_G\3725_Final_Signed_20140130 117
JIAMA PHASE 2 EXPANSION PROJECT
CHINA GOLD INTERNATIONAL
15.10 Stage Plans
Stage plans have been prepared to provide an illustration of the pit progression during the life of the
operation. The following figures provide a brief overview of the sequence and magnitude of the
Phase II open pit mining operation as the development of the open pits occurs during the life of the
open pit operations.
Figure 15-49: Open Cut 2015 (Year 2) Stage Plan
Figure 15-49 shows the status of mining after two years. The first stage of the South Pit has been
competed with all waste reporting to the Southern (#4) waste dump. The first stage of Jiaoyan is
being mined with all waste reporting to the Eastern (#3) waste dump. A cutting has been
established through the eastern wall for the haulage of waste from the Jiaoyan mining area to the
Eastern waste dump.

P:\1870_G\3725_Final_Signed_20140130 118
JIAMA PHASE 2 EXPANSION PROJECT
CHINA GOLD INTERNATIONAL
Figure 15-50: Open Cut 2017 (Year 4) Stage Plan
By the 4th year the second stage of the South pit has been completed and a start is made on the
third stage (Figure 15-50). Stage 3 provides the option to haul waste to either the Southern or
Eastern waste dump. The Jiaoyan Stage 1 pit design continues to be developed during this period.
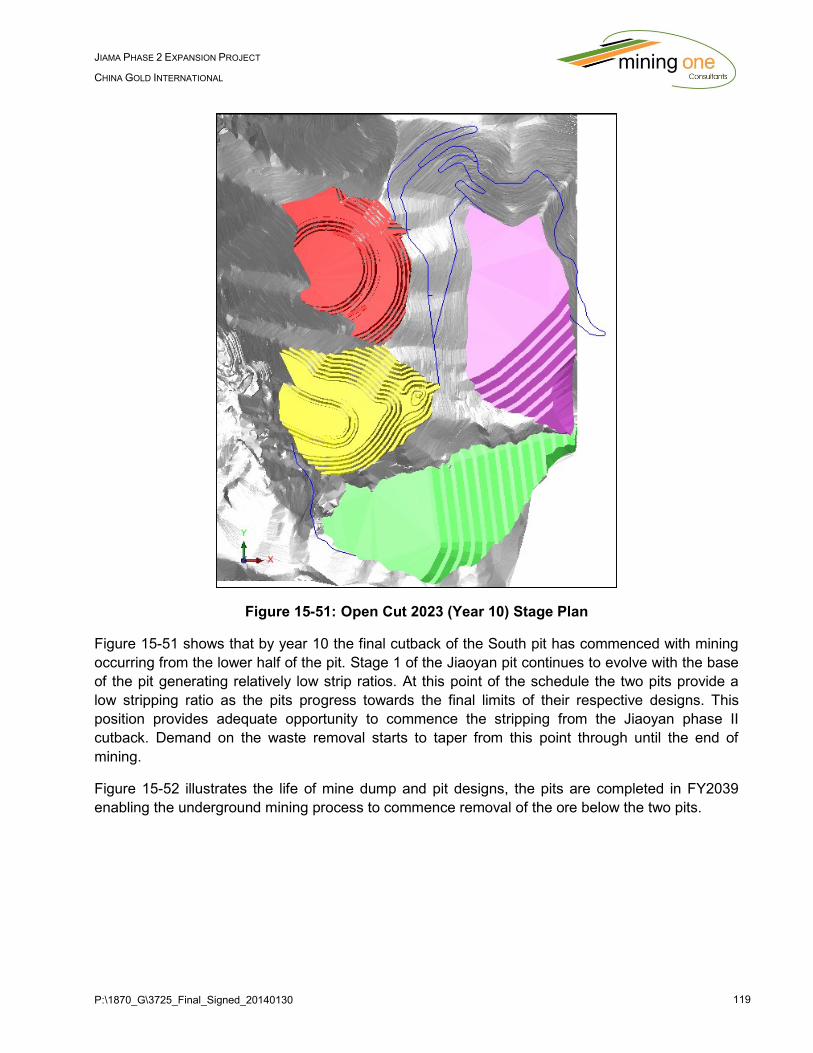
P:\1870_G\3725_Final_Signed_20140130 119
JIAMA PHASE 2 EXPANSION PROJECT
CHINA GOLD INTERNATIONAL
Figure 15-51: Open Cut 2023 (Year 10) Stage Plan
Figure 15-51 shows that by year 10 the final cutback of the South pit has commenced with mining
occurring from the lower half of the pit. Stage 1 of the Jiaoyan pit continues to evolve with the base
of the pit generating relatively low strip ratios. At this point of the schedule the two pits provide a
low stripping ratio as the pits progress towards the final limits of their respective designs. This
position provides adequate opportunity to commence the stripping from the Jiaoyan phase II
cutback. Demand on the waste removal starts to taper from this point through until the end of
mining.
Figure 15-52 illustrates the life of mine dump and pit designs, the pits are completed in FY2039
enabling the underground mining process to commence removal of the ore below the two pits.
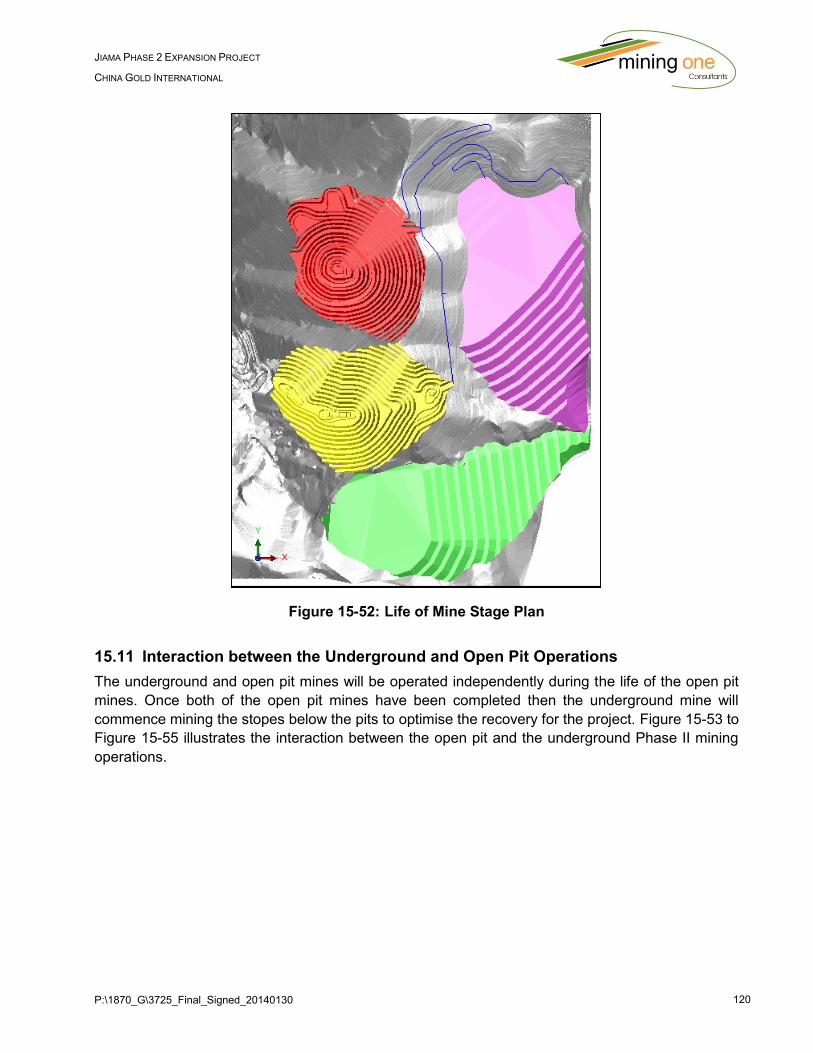
P:\1870_G\3725_Final_Signed_20140130 120
JIAMA PHASE 2 EXPANSION PROJECT
CHINA GOLD INTERNATIONAL
Figure 15-52: Life of Mine Stage Plan
15.11 Interaction between the Underground and Open Pit Operations
The underground and open pit mines will be operated independently during the life of the open pit
mines. Once both of the open pit mines have been completed then the underground mine will
commence mining the stopes below the pits to optimise the recovery for the project. Figure 15-53 to
Figure 15-55 illustrates the interaction between the open pit and the underground Phase II mining
operations.
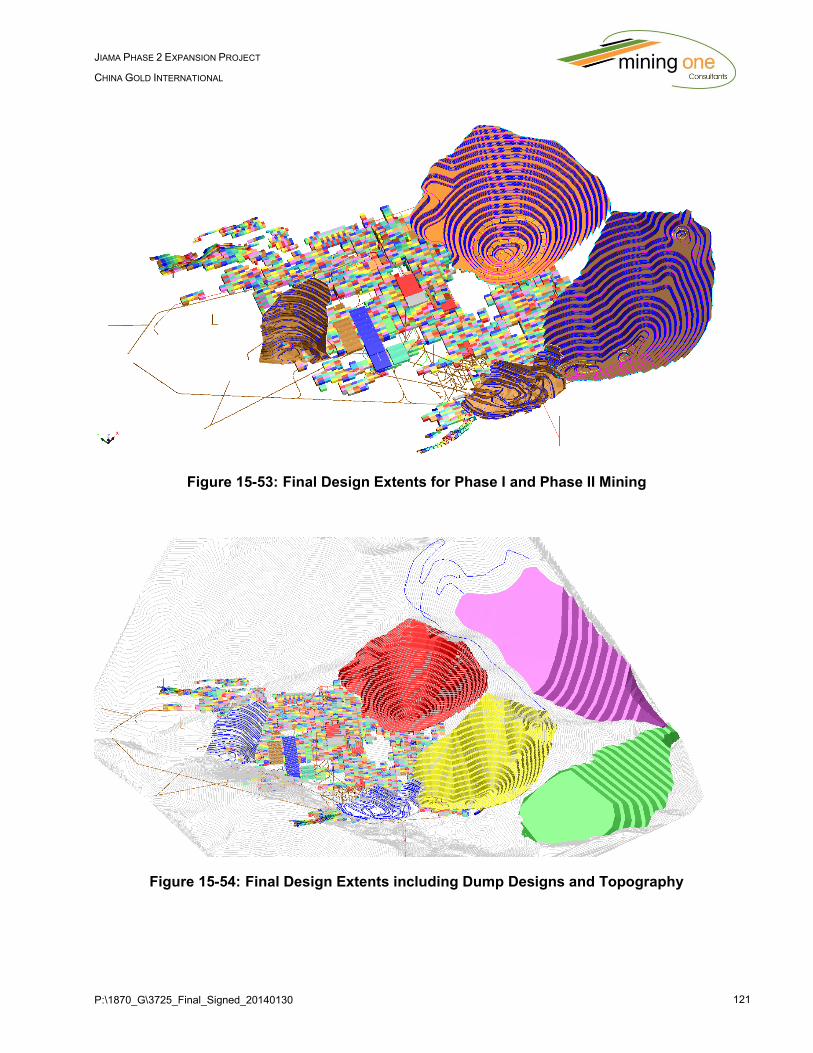
P:\1870_G\3725_Final_Signed_20140130 121
JIAMA PHASE 2 EXPANSION PROJECT
CHINA GOLD INTERNATIONAL
Figure 15-53: Final Design Extents for Phase I and Phase II Mining
Figure 15-54: Final Design Extents including Dump Designs and Topography

P:\1870_G\3725_Final_Signed_20140130 122
JIAMA PHASE 2 EXPANSION PROJECT
CHINA GOLD INTERNATIONAL
Figure 15-55: Section of Underground and Open Pit showing Small Pillar between Open Pit
and Underground Designs
15.12 Open Pit Mineral Reserve Statement
Based on the mine designs and mining schedules presented in this report, a Mineral Reserve has
been estimated for both the open pit and underground.
Mineral Reserves, shown in Table 15-27, are estimated based on the ore reported in the open pit
mining schedule; whereby proven and probable reserves have been estimated from the measured
and indicated resources respectively. Grades have been reported as a head grade from the block
model with an assumption that the model inherently considers sufficient internal and external
mining dilution.
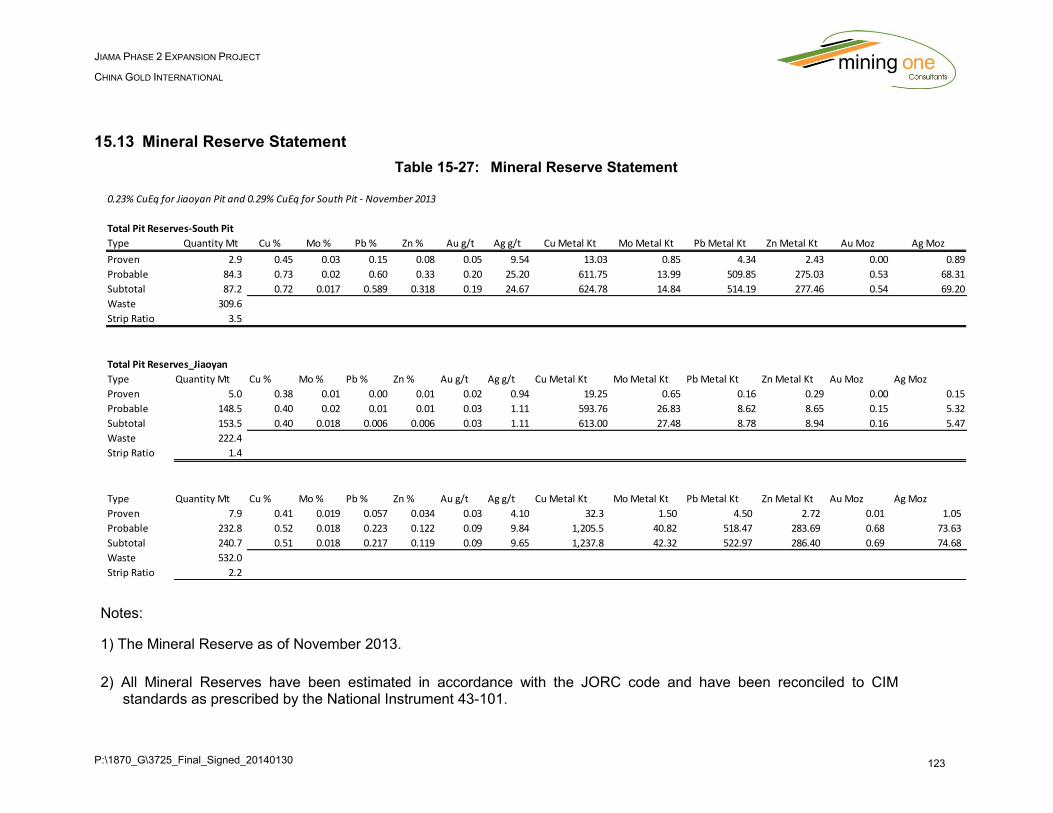
P:\1870_G\3725_Final_Signed_20140130 123
JIAMA PHASE 2 EXPANSION PROJECT
CHINA GOLD INTERNATIONAL
15.13 Mineral Reserve Statement
Table 15-27: Mineral Reserve Statement
Notes:
1) The Mineral Reserve as of November 2013.
2) All Mineral Reserves have been estimated in accordance with the JORC code and have been reconciled to CIM standards as prescribed by the National Instrument 43-101.
0.23% CuEq for Jiaoyan Pit and 0.29% CuEq for South Pit - November 2013
Total Pit Reserves-South Pit
Type Quantity Mt Cu % Mo % Pb % Zn % Au g/t Ag g/t Cu Metal Kt Mo Metal Kt Pb Metal Kt Zn Metal Kt Au Moz Ag Moz
Proven 2.9 0.45 0.03 0.15 0.08 0.05 9.54 13.03 0.85 4.34 2.43 0.00 0.89
Probable 84.3 0.73 0.02 0.60 0.33 0.20 25.20 611.75 13.99 509.85 275.03 0.53 68.31
Subtotal 87.2 0.72 0.017 0.589 0.318 0.19 24.67 624.78 14.84 514.19 277.46 0.54 69.20
Waste 309.6
Strip Ratio 3.5
Total Pit Reserves_Jiaoyan
Type Quantity Mt Cu % Mo % Pb % Zn % Au g/t Ag g/t Cu Metal Kt Mo Metal Kt Pb Metal Kt Zn Metal Kt Au Moz Ag Moz
Proven 5.0 0.38 0.01 0.00 0.01 0.02 0.94 19.25 0.65 0.16 0.29 0.00 0.15
Probable 148.5 0.40 0.02 0.01 0.01 0.03 1.11 593.76 26.83 8.62 8.65 0.15 5.32
Subtotal 153.5 0.40 0.018 0.006 0.006 0.03 1.11 613.00 27.48 8.78 8.94 0.16 5.47
Waste 222.4
Strip Ratio 1.4
Type Quantity Mt Cu % Mo % Pb % Zn % Au g/t Ag g/t Cu Metal Kt Mo Metal Kt Pb Metal Kt Zn Metal Kt Au Moz Ag Moz
Proven 7.9 0.41 0.019 0.057 0.034 0.03 4.10 32.3 1.50 4.50 2.72 0.01 1.05
Probable 232.8 0.52 0.018 0.223 0.122 0.09 9.84 1,205.5 40.82 518.47 283.69 0.68 73.63
Subtotal 240.7 0.51 0.018 0.217 0.119 0.09 9.65 1,237.8 42.32 522.97 286.40 0.69 74.68
Waste 532.0
Strip Ratio 2.2
P:\1870_G\3725_Final_Signed_20140130 124
JIAMA PHASE 2 EXPANSION PROJECT
CHINA GOLD INTERNATIONAL
3) Mineral Reserves were estimated using the following mining and economic factors:
a. A 5% dilution factor and 95% recovery was applied to the mining method ;
b. Wall angles of 43 degrees;
c. A copper price of USD$ 2.9/lbs;
d. An overall processing recovery of 88 - 90% for copper.
4) The cut-off grade for Mineral Reserves has been estimated at a copper equivalent grade of 0.23% Cueq for Jiaoyan Pit and 0.29% CuEq for South Pit at November 2013.
5) Mineral Reserve Estimates were prepared by Anthony R. Cameron who is a sub-consultant to Mining One Pty Ltd and is classified as an independent author. He is a Fellow of the Australasian Institute of Mining and Metallurgy and has over 26 years of relevant engineering experience and is the Qualified Person for Mineral Reserves.
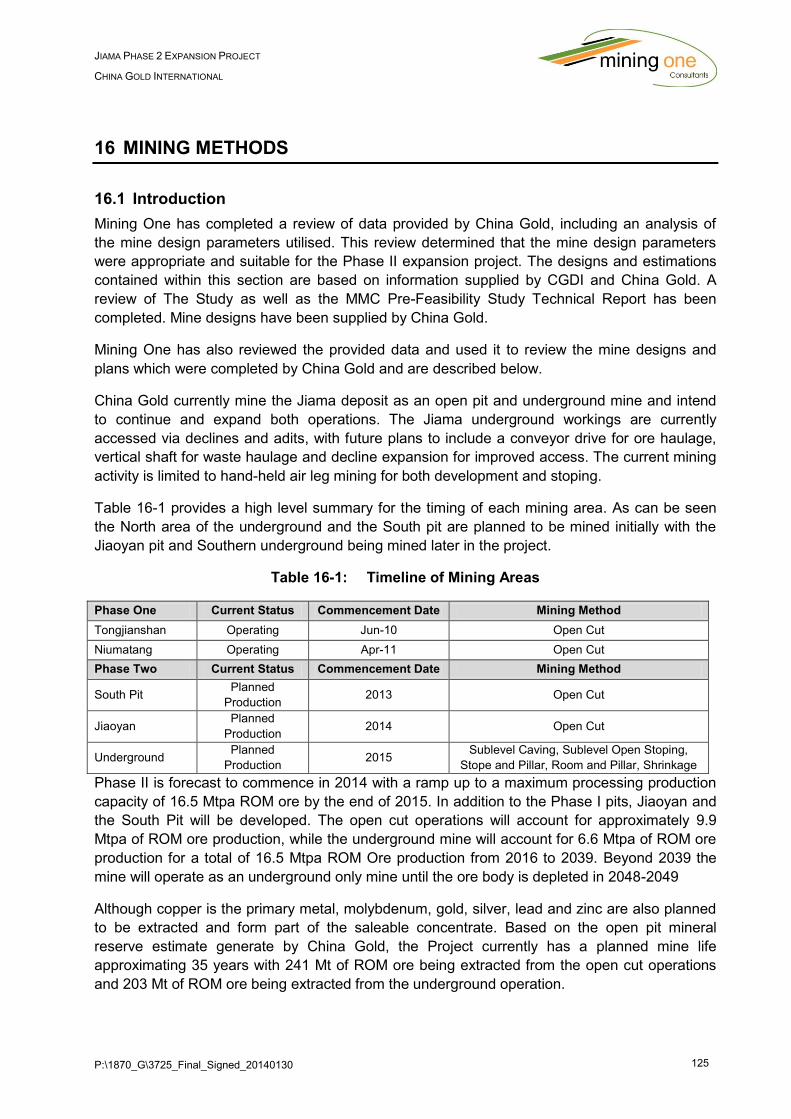
P:\1870_G\3725_Final_Signed_20140130 125
JIAMA PHASE 2 EXPANSION PROJECT
CHINA GOLD INTERNATIONAL
16 MINING METHODS
16.1 Introduction
Mining One has completed a review of data provided by China Gold, including an analysis of
the mine design parameters utilised. This review determined that the mine design parameters
were appropriate and suitable for the Phase II expansion project. The designs and estimations
contained within this section are based on information supplied by CGDI and China Gold. A
review of The Study as well as the MMC Pre-Feasibility Study Technical Report has been
completed. Mine designs have been supplied by China Gold.
Mining One has also reviewed the provided data and used it to review the mine designs and
plans which were completed by China Gold and are described below.
China Gold currently mine the Jiama deposit as an open pit and underground mine and intend
to continue and expand both operations. The Jiama underground workings are currently
accessed via declines and adits, with future plans to include a conveyor drive for ore haulage,
vertical shaft for waste haulage and decline expansion for improved access. The current mining
activity is limited to hand-held air leg mining for both development and stoping.
Table 16-1 provides a high level summary for the timing of each mining area. As can be seen
the North area of the underground and the South pit are planned to be mined initially with the
Jiaoyan pit and Southern underground being mined later in the project.
Table 16-1: Timeline of Mining Areas
Phase One Current Status Commencement Date Mining Method
Tongjianshan Operating Jun-10 Open Cut
Niumatang Operating Apr-11 Open Cut
Phase Two Current Status Commencement Date Mining Method
South Pit Planned
Production 2013 Open Cut
Jiaoyan Planned
Production 2014 Open Cut
Underground Planned
Production 2015
Sublevel Caving, Sublevel Open Stoping,
Stope and Pillar, Room and Pillar, Shrinkage
Phase II is forecast to commence in 2014 with a ramp up to a maximum processing production
capacity of 16.5 Mtpa ROM ore by the end of 2015. In addition to the Phase I pits, Jiaoyan and
the South Pit will be developed. The open cut operations will account for approximately 9.9
Mtpa of ROM ore production, while the underground mine will account for 6.6 Mtpa of ROM ore
production for a total of 16.5 Mtpa ROM Ore production from 2016 to 2039. Beyond 2039 the
mine will operate as an underground only mine until the ore body is depleted in 2048-2049
Although copper is the primary metal, molybdenum, gold, silver, lead and zinc are also planned
to be extracted and form part of the saleable concentrate. Based on the open pit mineral
reserve estimate generate by China Gold, the Project currently has a planned mine life
approximating 35 years with 241 Mt of ROM ore being extracted from the open cut operations
and 203 Mt of ROM ore being extracted from the underground operation.
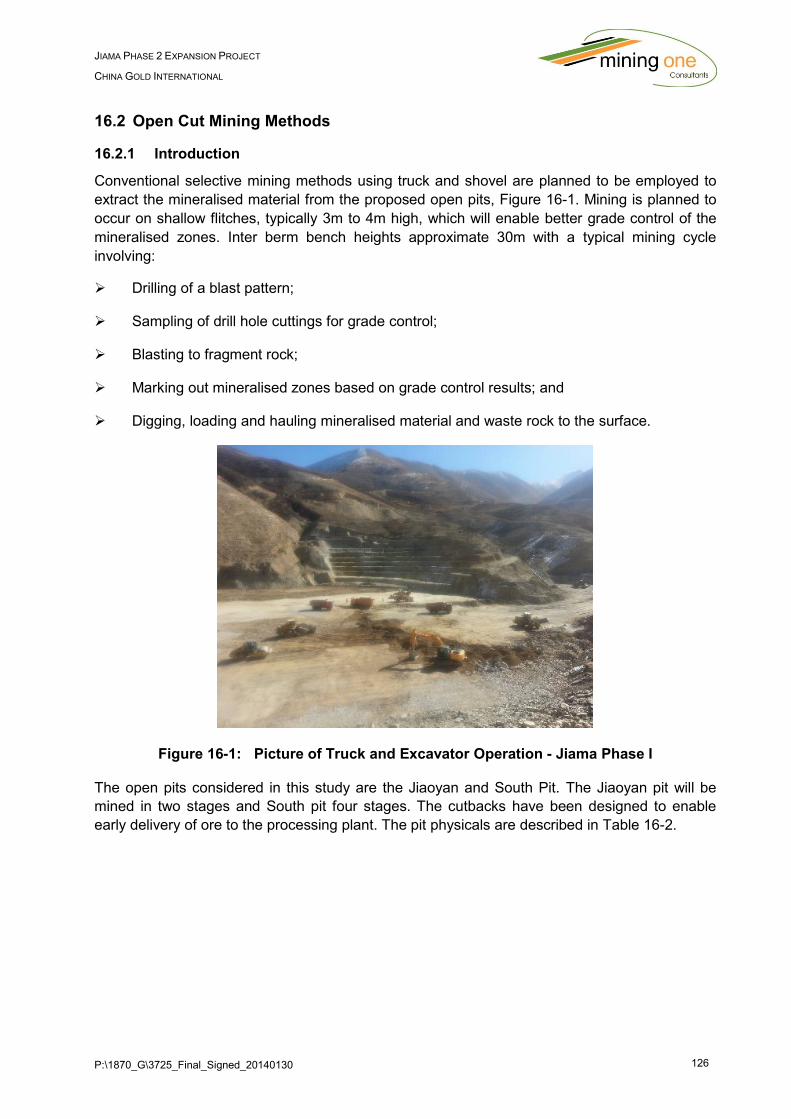
P:\1870_G\3725_Final_Signed_20140130 126
JIAMA PHASE 2 EXPANSION PROJECT
CHINA GOLD INTERNATIONAL
16.2 Open Cut Mining Methods
16.2.1 Introduction
Conventional selective mining methods using truck and shovel are planned to be employed to
extract the mineralised material from the proposed open pits, Figure 16-1. Mining is planned to
occur on shallow flitches, typically 3m to 4m high, which will enable better grade control of the
mineralised zones. Inter berm bench heights approximate 30m with a typical mining cycle
involving:
Drilling of a blast pattern;
Sampling of drill hole cuttings for grade control;
Blasting to fragment rock;
Marking out mineralised zones based on grade control results; and
Digging, loading and hauling mineralised material and waste rock to the surface.
Figure 16-1: Picture of Truck and Excavator Operation - Jiama Phase I
The open pits considered in this study are the Jiaoyan and South Pit. The Jiaoyan pit will be
mined in two stages and South pit four stages. The cutbacks have been designed to enable
early delivery of ore to the processing plant. The pit physicals are described in Table 16-2.
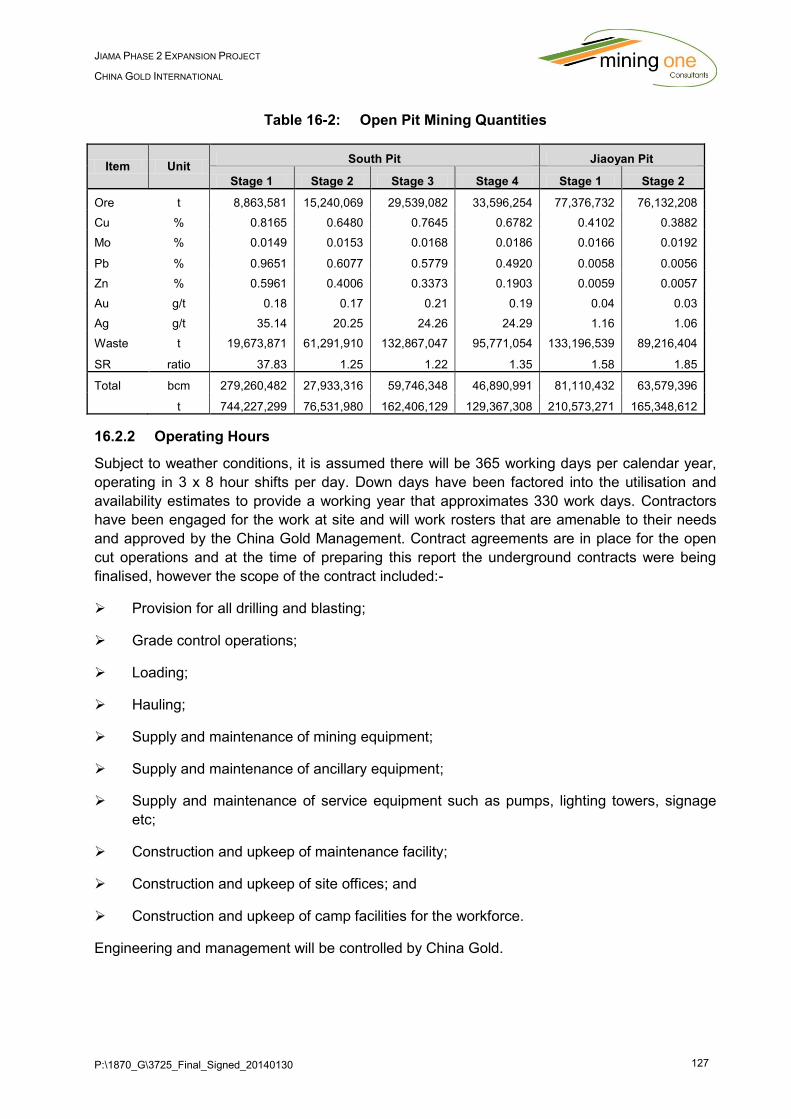
P:\1870_G\3725_Final_Signed_20140130 127
JIAMA PHASE 2 EXPANSION PROJECT
CHINA GOLD INTERNATIONAL
Table 16-2: Open Pit Mining Quantities
Item Unit South Pit Jiaoyan Pit
Stage 1 Stage 2 Stage 3 Stage 4 Stage 1 Stage 2
Ore t 8,863,581 15,240,069 29,539,082 33,596,254 77,376,732 76,132,208
Cu % 0.8165 0.6480 0.7645 0.6782 0.4102 0.3882
Mo % 0.0149 0.0153 0.0168 0.0186 0.0166 0.0192
Pb % 0.9651 0.6077 0.5779 0.4920 0.0058 0.0056
Zn % 0.5961 0.4006 0.3373 0.1903 0.0059 0.0057
Au g/t 0.18 0.17 0.21 0.19 0.04 0.03
Ag g/t 35.14 20.25 24.26 24.29 1.16 1.06
Waste t 19,673,871 61,291,910 132,867,047 95,771,054 133,196,539 89,216,404
SR ratio 37.83 1.25 1.22 1.35 1.58 1.85
Total bcm 279,260,482 27,933,316 59,746,348 46,890,991 81,110,432 63,579,396
t 744,227,299 76,531,980 162,406,129 129,367,308 210,573,271 165,348,612
16.2.2 Operating Hours
Subject to weather conditions, it is assumed there will be 365 working days per calendar year,
operating in 3 x 8 hour shifts per day. Down days have been factored into the utilisation and
availability estimates to provide a working year that approximates 330 work days. Contractors
have been engaged for the work at site and will work rosters that are amenable to their needs
and approved by the China Gold Management. Contract agreements are in place for the open
cut operations and at the time of preparing this report the underground contracts were being
finalised, however the scope of the contract included:-
Provision for all drilling and blasting;
Grade control operations;
Loading;
Hauling;
Supply and maintenance of mining equipment;
Supply and maintenance of ancillary equipment;
Supply and maintenance of service equipment such as pumps, lighting towers, signage
etc;
Construction and upkeep of maintenance facility;
Construction and upkeep of site offices; and
Construction and upkeep of camp facilities for the workforce.
Engineering and management will be controlled by China Gold.

P:\1870_G\3725_Final_Signed_20140130 128
JIAMA PHASE 2 EXPANSION PROJECT
CHINA GOLD INTERNATIONAL
16.2.3 Drill and Blast
Drilling for stripping operations will be carried out by the site contractors, it is anticipated that
250 mm diameter holes will be drilled and each will achieve a production rate approximating
2.8 Mbcm per year. Ore mining will involve drilling 165 mm diameter holes with a production
rate of 1.0 Mbcm per year per drill. Grade control will be carried out from the ore drills. In
addition, secondary rock breaking will be conducted by a rock breaker as necessary.
In waste the recommended pattern is a spacing of 8.5 m and burden of 7.5 m with a drill depth
of 17.5 m. This equates to the blast volume of 54.6 bcm/m per hole. Given the operating hours,
this equates to a productivity rate of 2.48 Mbcm per annum. The number of drills required to
meet the production schedule was calculated to be 2 however this will be regulated by the
contractor who have an agreed rate for the provision of excavation. Details of the calculations
related to the drill required for stripping are shown in Table 16-3.
During the second year of production the total capacity of the drills will peak at 30 Mbcm. After
the second year production demand reduces and stabilises to 16Mbcm per year over the initial
10 years. On average this calculates out to approximately 12 Mbcm of waste and 4 Mbcm of
ore.

P:\1870_G\3725_Final_Signed_20140130 129
JIAMA PHASE 2 EXPANSION PROJECT
CHINA GOLD INTERNATIONAL
Table 16-3: Drill Calculations for Stripping
Item Unit Value
Required Production bcm/yr 10.5
Working hours hrs 8,760
Utilisation % 65%
Availability % 80%
Effective Utilisation % 52%
Operating hours per year hrs 4,555
Density t/bc 2.75
Blasthole diameter m 250
Bench height m 15
Subdrill m 2.5
Total blasthole length m 17.5
Spacing m 8.5
Burden m 7.5
Blasting Volume/hole cu.m 956
Volume / Drill metre bcm/m 55
Penetration rate (Avg) m/hr 45
Annual production per drill m 204,984
Redrills % 5%
Annual drill capacity req'd m 195,223
Annual drilling productivity per dirll Mbcm 10.7
Calculated number of rigs # 0.98
Rounded number of rigs # 1
For ore mining, to control ore dilution and loss, a smaller drill rig will be employed to drill 165mm
diameter holes at an angle of up to 75 degrees. A drill pattern approximating a spacing of 5.5m
and a burden of 4.5m has been estimated for all ore blasts, however the drill and blast designs
will be refined upon the commencement of mining operations. Total depth of the ore shots will
be 17.5m. The calculated blast volume is 21.2 m3/m.
Given the operating hours, this equates to a productivity rate of 1.25 Mbcm per annum. The
number of drills required to meet the production schedule is calculated to be 2. The drill rigs will
also be used for presplit blasting, road cutting and any other auxiliary drilling requirements.
Details of the calculations related to the 165 mm diameter drill requirements are shown in Table
16-4.
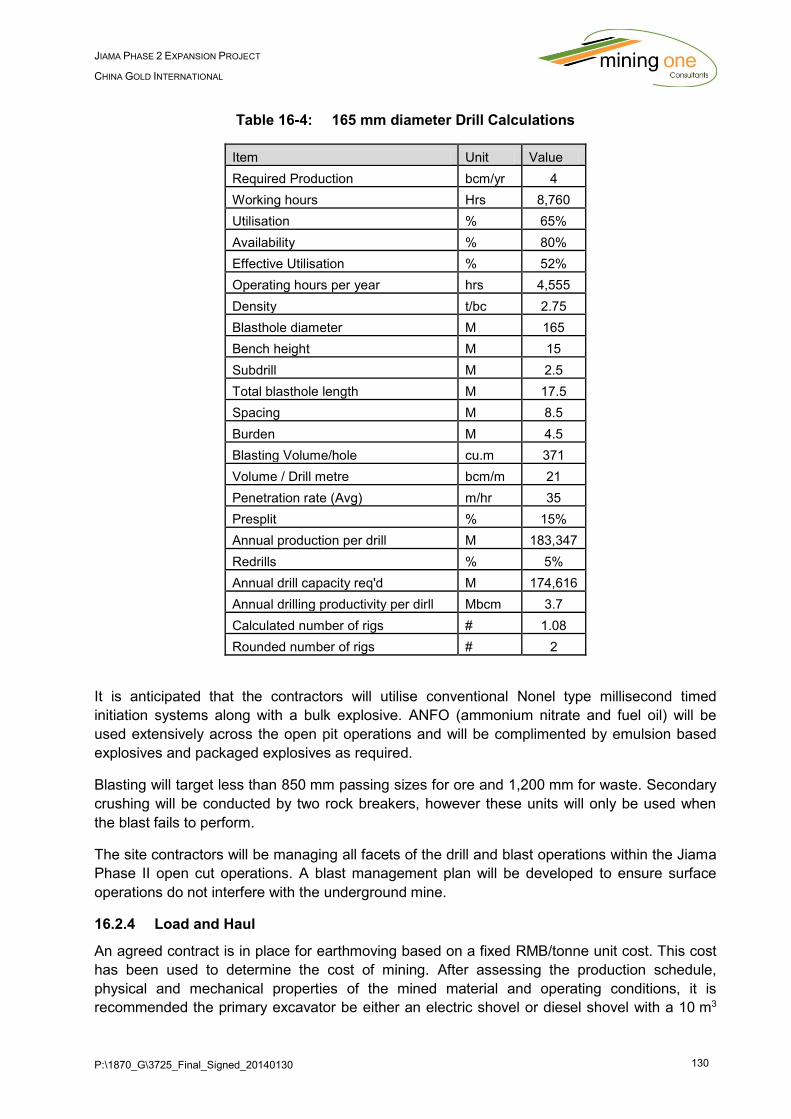
P:\1870_G\3725_Final_Signed_20140130 130
JIAMA PHASE 2 EXPANSION PROJECT
CHINA GOLD INTERNATIONAL
Table 16-4: 165 mm diameter Drill Calculations
Item Unit Value
Required Production bcm/yr 4
Working hours Hrs 8,760
Utilisation % 65%
Availability % 80%
Effective Utilisation % 52%
Operating hours per year hrs 4,555
Density t/bc 2.75
Blasthole diameter M 165
Bench height M 15
Subdrill M 2.5
Total blasthole length M 17.5
Spacing M 8.5
Burden M 4.5
Blasting Volume/hole cu.m 371
Volume / Drill metre bcm/m 21
Penetration rate (Avg) m/hr 35
Presplit % 15%
Annual production per drill M 183,347
Redrills % 5%
Annual drill capacity req'd M 174,616
Annual drilling productivity per dirll Mbcm 3.7
Calculated number of rigs # 1.08
Rounded number of rigs # 2
It is anticipated that the contractors will utilise conventional Nonel type millisecond timed
initiation systems along with a bulk explosive. ANFO (ammonium nitrate and fuel oil) will be
used extensively across the open pit operations and will be complimented by emulsion based
explosives and packaged explosives as required.
Blasting will target less than 850 mm passing sizes for ore and 1,200 mm for waste. Secondary
crushing will be conducted by two rock breakers, however these units will only be used when
the blast fails to perform.
The site contractors will be managing all facets of the drill and blast operations within the Jiama
Phase II open cut operations. A blast management plan will be developed to ensure surface
operations do not interfere with the underground mine.
16.2.4 Load and Haul
An agreed contract is in place for earthmoving based on a fixed RMB/tonne unit cost. This cost
has been used to determine the cost of mining. After assessing the production schedule,
physical and mechanical properties of the mined material and operating conditions, it is
recommended the primary excavator be either an electric shovel or diesel shovel with a 10 m3
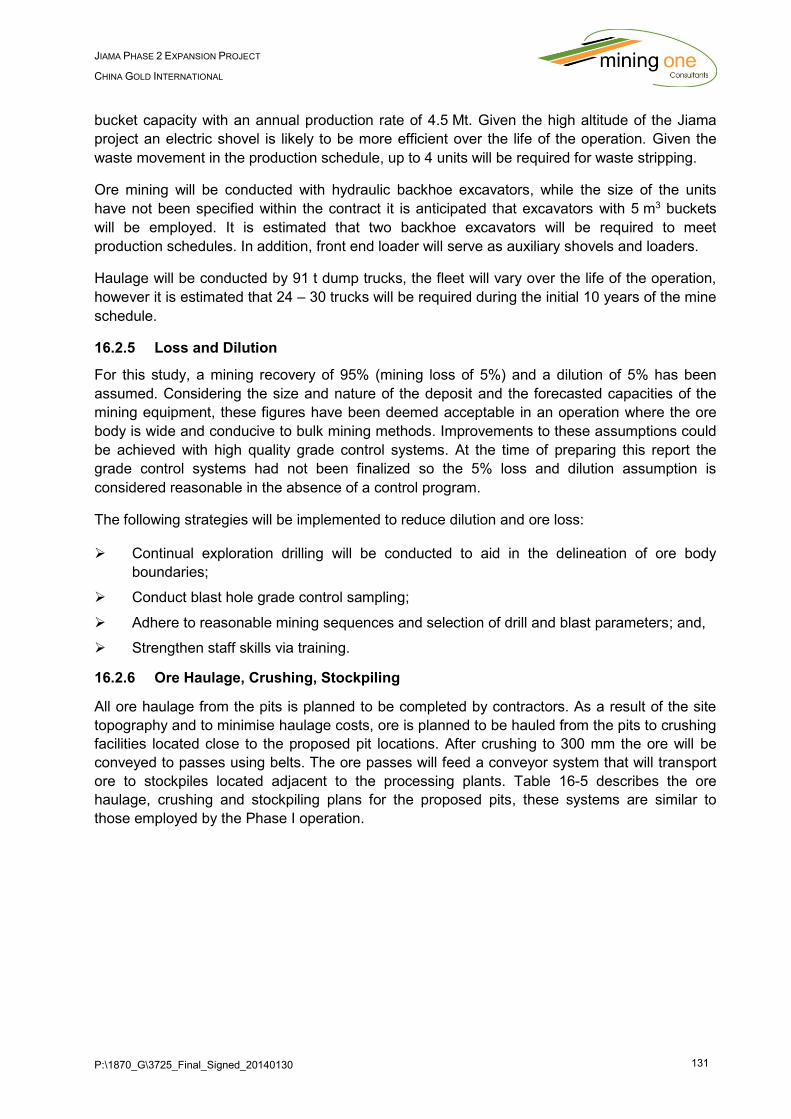
P:\1870_G\3725_Final_Signed_20140130 131
JIAMA PHASE 2 EXPANSION PROJECT
CHINA GOLD INTERNATIONAL
bucket capacity with an annual production rate of 4.5 Mt. Given the high altitude of the Jiama
project an electric shovel is likely to be more efficient over the life of the operation. Given the
waste movement in the production schedule, up to 4 units will be required for waste stripping.
Ore mining will be conducted with hydraulic backhoe excavators, while the size of the units
have not been specified within the contract it is anticipated that excavators with 5 m3 buckets
will be employed. It is estimated that two backhoe excavators will be required to meet
production schedules. In addition, front end loader will serve as auxiliary shovels and loaders.
Haulage will be conducted by 91 t dump trucks, the fleet will vary over the life of the operation,
however it is estimated that 24 – 30 trucks will be required during the initial 10 years of the mine
schedule.
16.2.5 Loss and Dilution
For this study, a mining recovery of 95% (mining loss of 5%) and a dilution of 5% has been
assumed. Considering the size and nature of the deposit and the forecasted capacities of the
mining equipment, these figures have been deemed acceptable in an operation where the ore
body is wide and conducive to bulk mining methods. Improvements to these assumptions could
be achieved with high quality grade control systems. At the time of preparing this report the
grade control systems had not been finalized so the 5% loss and dilution assumption is
considered reasonable in the absence of a control program.
The following strategies will be implemented to reduce dilution and ore loss:
Continual exploration drilling will be conducted to aid in the delineation of ore body
boundaries;
Conduct blast hole grade control sampling;
Adhere to reasonable mining sequences and selection of drill and blast parameters; and,
Strengthen staff skills via training.
16.2.6 Ore Haulage, Crushing, Stockpiling
All ore haulage from the pits is planned to be completed by contractors. As a result of the site
topography and to minimise haulage costs, ore is planned to be hauled from the pits to crushing
facilities located close to the proposed pit locations. After crushing to 300 mm the ore will be
conveyed to passes using belts. The ore passes will feed a conveyor system that will transport
ore to stockpiles located adjacent to the processing plants. Table 16-5 describes the ore
haulage, crushing and stockpiling plans for the proposed pits, these systems are similar to
those employed by the Phase I operation.

P:\1870_G\3725_Final_Signed_20140130 132
JIAMA PHASE 2 EXPANSION PROJECT
CHINA GOLD INTERNATIONAL
Table 16-5: Open Pit – Ore Haulage, Crushing and Stockpiling Summary
Operation Description
Pit to crusher ore haulage Truck haulage transport ore from the pit to the crushing system at the edge of Jiaoyan pit (4,880mRL) Distance from pit to crusing station: South Pit 1.1km Jiaoyan 200m
Crushing Ore crushed to minus 300mm
Crusher to ROM, stockpile ore haulage
Crushed ore is transported via conveyor system located in north -east of Phase1 dump.
Ore stockpile Ore transported 1.8 km using conveyor haulage system. Delivered to ROM stockpile at Phase 2 processing Plant (4,500mR)
16.2.7 Waste Dumps
Truck haulage will be used to transport waste material to surface dumps. Two dump locations
have been identified and preliminary designs prepared (Figure 16-2). Waste from South Pit and
Jiaoyan is planned to be dumped in an area to the south and to the East of the pits. There is
opportunity to reduce the cost of haulage by backfilling the South pit with waste from the
Jiaoyan Pit. This option has not been considered as the South Pit design may be subject to
change once the southern extents of the ore-body have been delineated. It is intended that
waste from Jiaoyan pit will report to the Eastern Dump while a majority of the waste from the
South Pit will be sent to the Southern Dump. The approximate waste haulage distance from
each pit to their respective dumps is provided below:
Jiaoyan to East Dump = 1.2 km;
South Pit to East Dump = 1.4 km;
South Pit to South Dump = 1.3 km;
Jiaoyan to South Pit = 1.1 km.
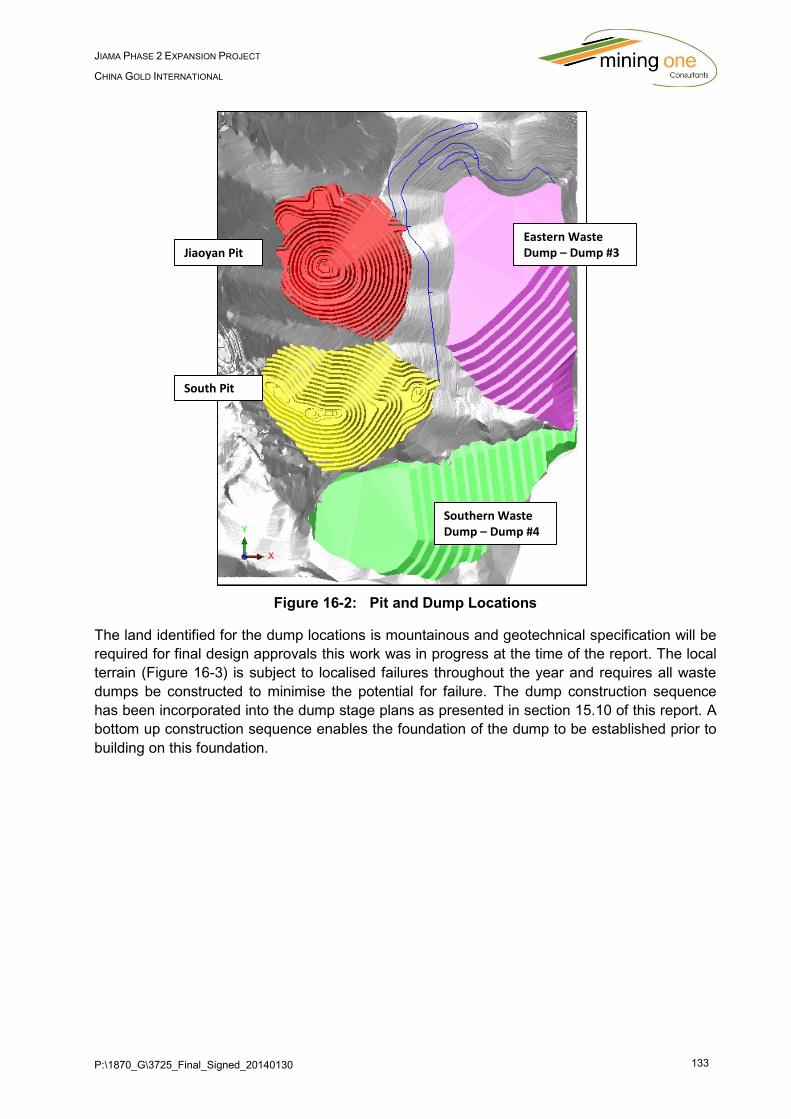
P:\1870_G\3725_Final_Signed_20140130 133
JIAMA PHASE 2 EXPANSION PROJECT
CHINA GOLD INTERNATIONAL
Figure 16-2: Pit and Dump Locations
The land identified for the dump locations is mountainous and geotechnical specification will be
required for final design approvals this work was in progress at the time of the report. The local
terrain (Figure 16-3) is subject to localised failures throughout the year and requires all waste
dumps be constructed to minimise the potential for failure. The dump construction sequence
has been incorporated into the dump stage plans as presented in section 15.10 of this report. A
bottom up construction sequence enables the foundation of the dump to be established prior to
building on this foundation.
South Pit
Jiaoyan PitEastern Waste Dump – Dump #3
Southern Waste Dump – Dump #4
P:\1870_G\3725_Final_Signed_20140130 134
JIAMA PHASE 2 EXPANSION PROJECT
CHINA GOLD INTERNATIONAL
Figure 16-3: Image of Local Terrain and Existing Operation
For these areas to be used, China Gold are required to obtain land usage permits in addition to
the current exploration licence covering these areas. Table 16-6 provides a summary of the
waste generated by the two open pits and the required volume for waste disposal against the
respective dump designs. An illustration of the pits and dump locations are identified in Figure
16-2.
Table 16-6: Waste Dump Capacities
Pit Waste Dump Capacity
Pit T t/cu.m Swell cu.m Number cu.m
Jiaoyan Pit 222,412,943 2.35 20% 113,572,567 Dump #3 144,612,065
South Pit 297,899,872 2.35 20% 152,119,084 Dump #4 129,395,646
Total 520,312,815 265,691,650 274,007,711
16.2.8 Open Cut Dewatering
Due to the nature of the topography, the pre-production mining and stripping will have natural
drainage away from operating areas.
In the 10th year, the development of the pit will reach a point where water will collect inside the
area of operations. At this point, a sump will be excavated at the lowest point where pumps will
be installed to transport water out of the pit.
16.2.9 Open Pit Mining Fleet
The mining equipment shown in Table 16-7 has been selected based upon the annual mine
production schedule and provides an estimate of the equipment requirements for the Jiama
Phase II open pit operations. These estimates have been determined by the CGDI and
approximate the contract fleet that is expected on site.
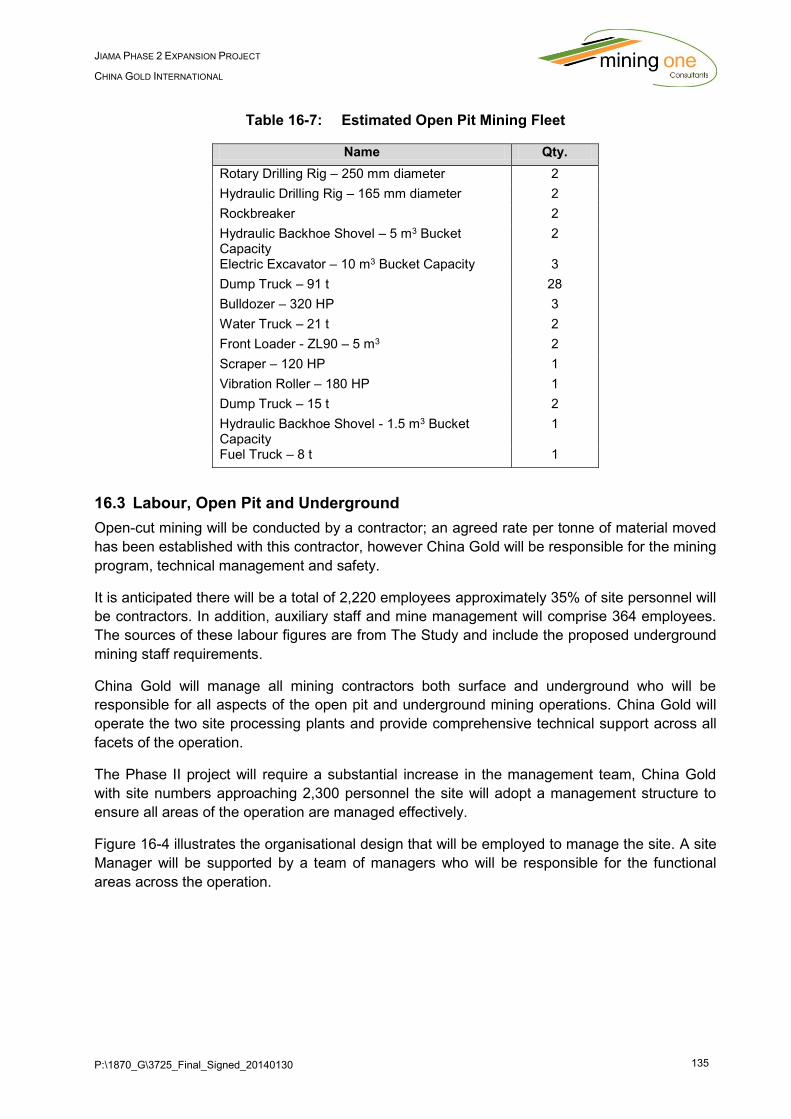
P:\1870_G\3725_Final_Signed_20140130 135
JIAMA PHASE 2 EXPANSION PROJECT
CHINA GOLD INTERNATIONAL
Table 16-7: Estimated Open Pit Mining Fleet
Name Qty.
Rotary Drilling Rig – 250 mm diameter 2
Hydraulic Drilling Rig – 165 mm diameter 2
Rockbreaker 2
Hydraulic Backhoe Shovel – 5 m3 Bucket Capacity
2
Electric Excavator – 10 m3 Bucket Capacity 3
Dump Truck – 91 t 28
Bulldozer – 320 HP 3
Water Truck – 21 t 2
Front Loader - ZL90 – 5 m3 2
Scraper – 120 HP 1
Vibration Roller – 180 HP 1
Dump Truck – 15 t 2
Hydraulic Backhoe Shovel - 1.5 m3 Bucket Capacity
1
Fuel Truck – 8 t 1
16.3 Labour, Open Pit and Underground
Open-cut mining will be conducted by a contractor; an agreed rate per tonne of material moved
has been established with this contractor, however China Gold will be responsible for the mining
program, technical management and safety.
It is anticipated there will be a total of 2,220 employees approximately 35% of site personnel will
be contractors. In addition, auxiliary staff and mine management will comprise 364 employees.
The sources of these labour figures are from The Study and include the proposed underground
mining staff requirements.
China Gold will manage all mining contractors both surface and underground who will be
responsible for all aspects of the open pit and underground mining operations. China Gold will
operate the two site processing plants and provide comprehensive technical support across all
facets of the operation.
The Phase II project will require a substantial increase in the management team, China Gold
with site numbers approaching 2,300 personnel the site will adopt a management structure to
ensure all areas of the operation are managed effectively.
Figure 16-4 illustrates the organisational design that will be employed to manage the site. A site
Manager will be supported by a team of managers who will be responsible for the functional
areas across the operation.
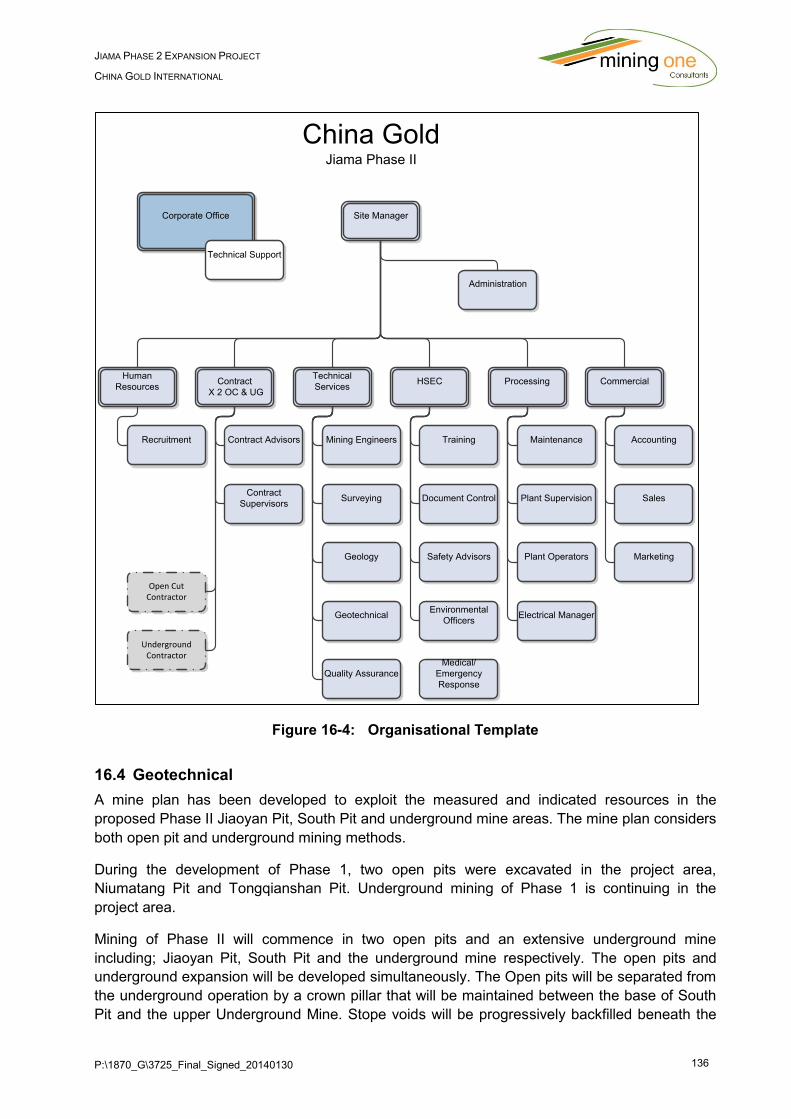
P:\1870_G\3725_Final_Signed_20140130 136
JIAMA PHASE 2 EXPANSION PROJECT
CHINA GOLD INTERNATIONAL
Figure 16-4: Organisational Template
16.4 Geotechnical
A mine plan has been developed to exploit the measured and indicated resources in the
proposed Phase II Jiaoyan Pit, South Pit and underground mine areas. The mine plan considers
both open pit and underground mining methods.
During the development of Phase 1, two open pits were excavated in the project area,
Niumatang Pit and Tongqianshan Pit. Underground mining of Phase 1 is continuing in the
project area.
Mining of Phase II will commence in two open pits and an extensive underground mine
including; Jiaoyan Pit, South Pit and the underground mine respectively. The open pits and
underground expansion will be developed simultaneously. The Open pits will be separated from
the underground operation by a crown pillar that will be maintained between the base of South
Pit and the upper Underground Mine. Stope voids will be progressively backfilled beneath the
Site Manager
Corporate Office
Contract
X 2 OC & UG
Processing
Technical
Services
HSEC
Commercial
Surveying
Geology
Geotechnical
Quality Assurance
Maintenance
Training
Document Control
Safety Advisors
Environmental
Officers
Medical/
Emergency
Response
Mining Engineers
Administration
Contract Advisors
Contract
Supervisors
Human
Resources
Recruitment
Accounting
Sales
Marketing
Plant Supervision
Plant Operators
Electrical Manager
Technical Support
Open CutContractor
UndergroundContractor
China GoldJiama Phase II
P:\1870_G\3725_Final_Signed_20140130 137
JIAMA PHASE 2 EXPANSION PROJECT
CHINA GOLD INTERNATIONAL
base of the pit floor to reduce the potential for open pit and underground mine interaction. The
two underground mining methods considered in this area are cut & fill mining and sub-level
caving. The area under the pit is not planned to be designed in the initial 10 years of operation.
The pit should be finished by this time which would make sub-level caving a possible option
here.
The underground and open pit mine designs were developed by the CGDI. The geotechnical
studies were undertaken by the Changsha Institute of Mining Research Co Ltd (CIMR) for all
mining areas and the waste dumps were designed by the CGDI with contribution from the
CIMR. The CIMR Feasibility Study reporting for the geotechnical studies are referenced in
Section 27, which forms part of The Study.
16.4.1 Rock Mechanics
Rock mechanics testing was completed by the Rock Mechanics Laboratory at CIMR, and CIMR
were responsible for all on-site geotechnical data collection and data collection quality control.
The CIMR Study addresses the geotechnical design considerations for the Phase II Jiaoyan Pit,
South Pit and Underground Mine in the areas discussed below (Sections 16.4.1.5 and 16.4.1.6).
The waste dump geotechnical stability design is addressed in Section 0.
16.4.1.1 Site Investigations and Geotechnical Database
Geotechnical data for the CIMR Feasibility Studies was collected during 2012 and 2013. This
included on site geotechnical mapping (in the existing open pits and underground mine),
geotechnical drill core logging including collecting oriented structural data from dedicated
geotechnical drill holes and back geotechnical logging of stored drill core from previous
resource drilling campaigns.
Geotechnical drill core logging was completed on seventy (70) resource drill holes, totalling
30,000 m of geotechnical data collection. A number of geotechnical mapping lines were
completed in 2012 and were included in the geotechnical database. 28 separate geotechnical
mapping lines collected geotechnical information from the existing batters in Niumatang and
Tongqianshan Pit.
At Jiaoyan Pit, ten (10) dedicated geotechnical holes were drilled (approximately 3,500m), with
four (4) of these holes selected for acoustic televiewer data collection.
At the South Pit, twenty five (25) dedicated geotechnical holes were drilled (approximately
10,000 m).
For the Underground Mine, to compliment the geotechnical database created for the South Pit
(i.e. directly above the Underground Mine), geotechnical mapping lines were mapped in the
existing underground workings on various mine levels at the 700mRL drive, 4,645 mRL drive,
Shaft 4,450 mRL access, 4,450 mRL access and ore drive, 4,650 mRL main drive and Line16
haulage drive.
The geotechnical data collection system was implemented at the Jiama site by consultant
engineers Pells Sullivan Meynink (PSM Sydney, Australia) with a two week geotechnical data
collection training package delivered to the site geotechnical data collection team.
P:\1870_G\3725_Final_Signed_20140130 138
JIAMA PHASE 2 EXPANSION PROJECT
CHINA GOLD INTERNATIONAL
At completion of data collection for the CIMR Feasibility Study, approximately 43,500 m of drill
core was logged to enable Bieniawski RMR89 and Rock Tunneling Quality Index Q calculations
to be conducted. Drill core was photographed for future reference.
16.4.1.2 Geomechanical Laboratory Testing Database
Samples from selected boreholes and differing rock types were collected for laboratory testing.
All samples were tested at the CIMR Rock Mechanics Laboratory in Changsha. Laboratory
Testing included: uniaxial compression, elasticity modulus, tensile tests, triaxial testing and
shear testing on intact rock samples.
A substantial testing database has been created to describe the rock characteristics across the
project: 64 UCS and rock modulus tests, 51 tensile tests, 8 shear tests and 49 triaxial tests.
In addition to these tests the database is complimented by testing on an additional 8 samples
collected during the underground mapping exercise.
16.4.1.3 Geotechnical Domaining and Rockmass Characterisation
The geotechnical logging database and the rock testing database were assessed as a part of
the CIMR Feasibility Study to determine the geotechnical domains for the purposes of mine
design. The geotechnical domains were shown to generally align with the geological units in the
project area.
The rockmass parameters for each geotechnical domain were characterised using a number of
different methods to enable comparison of results by a number of techniques and included the
Hoek-Brown failure criterion. The CIMR Feasibility Study derived rockmass parameters for each
geotechnical domain used in the geotechnical design process:
Hornfels Domain is a hard rock (UCS >100MPa) with RQD values which indicate intact
rock, however due to structure the Q system indicates a Poor rockmass, mainly due to the
influence of structure. The Hornfels Domain is present at the Jiaoyan Pit and in the
hanging wall of the Underground Mine;
Skarn Domain is a hard rock (UCS >100MPa) with RQD values which indicate intact rock,
however due to structure the Q system indicates a Fair rockmass. Skarn Domain is found
at the South Pit and the Underground Mine and hosts the ore;
Marble Domain is a hard rock (UCS >80MPa) with RQD values which indicate intact rock,
however due to structure the Q system indicates a Fair rockmass. Marble Domain is found
generally in the Footwall of the Underground Mine; and
Porphyry Granite is a hard rock (UCS >150MPa). Porphyry Domain is an intrusion and is
found the orebody hangingwall and footwall.
16.4.1.4 Rock Structure
16.4.1.4.1 Major Structures
The potential for major structures (faults) to influence the mine plan were a focus of the CIMR
Feasibility Study. Structural mapping and observation of the excavated Niumatang Pit and
Tongqianshan Pit indicated that major structures had no noticeable impact on the constructed
P:\1870_G\3725_Final_Signed_20140130 139
JIAMA PHASE 2 EXPANSION PROJECT
CHINA GOLD INTERNATIONAL
pit walls. Geotechnical cross sections cut through the open pit mining areas define faulting,
however the identified faults are not interpreted to impact on the stability of designed pit walls.
Faults were mapped during the underground geotechnical mapping and three fault types were
characterised for assessment during the underground geotechnical design.
16.4.1.4.2 Pervasive Structures
Structural geotechnical logging, acoustic televiewer structural data and geotechnical mapping
have contributed to form the project structural database.
In general, there are three to five joint sets interpreted across the geotechnical domains, which
describes blocky rockmass conditions.
16.4.1.5 Underground Analysis and Geotechnical Design
The underground ore body is variable in dip and thickness and two mining methods were
assessed as part of the CIMR Feasibility Study. An additional consideration during the design
process was the crown pillar, which will be formed when the underground mine extends
beneath the South Pit. An important geotechnical data input to the assessment was the use of
existing underground mine workings to collect geotechnical mapping data, rather than relying
only on drill core logging.
16.4.1.5.1 Design Standards
Chinese Government standards for the design and operation of underground mines were
considered and taken into account during the CIMR Feasibility Study geotechnical design
process. The design criterion was based on achieving a minimum factor of safety of 1.2, and
this compares to international minimum factor of safety values.
16.4.1.5.2 Crown Pillar
The crown pillar is formed when the Underground Mine is extended below South Pit. Following
characterisation of the rockmass forming the crown pillar, a number of assessment techniques
were used to optimise the crown pillar thickness while maintaining a requirement for operations
to occur in both the open pit and underground simultaneously. The design assessment included
consideration of crown pillar size and thickness at other mining operations, empirical
relationships (Carter, among others), and finite element analysis in two dimensions. The design
conclusion was that a crown pillar with 24m thickness meets the required Factor of Safety.
Recommendations were made to progressively fill the excavated stopes beneath the South Pit
to further reduce the chance that the underground and open pit operations could interact
unfavorably.
16.4.1.5.3 Stope Design
Stope dimensions were assessed for Room and Pillar and Sub Level Stoping with Fill. The
Room and Pillar assessment was based on a tributary area methodology and estimated the
design limits for respective room and pillar sizes.
The Sub Level Stoping with Fill design assessment was based on the Mathews Stability
Method, which takes into consideration the rockmass quality, the induced stress, structure
orientation and failure mechanism at the stope boundary. The results indicate that the dip of the
hangingwall will be a significant influence on the achievable stope dimensions.
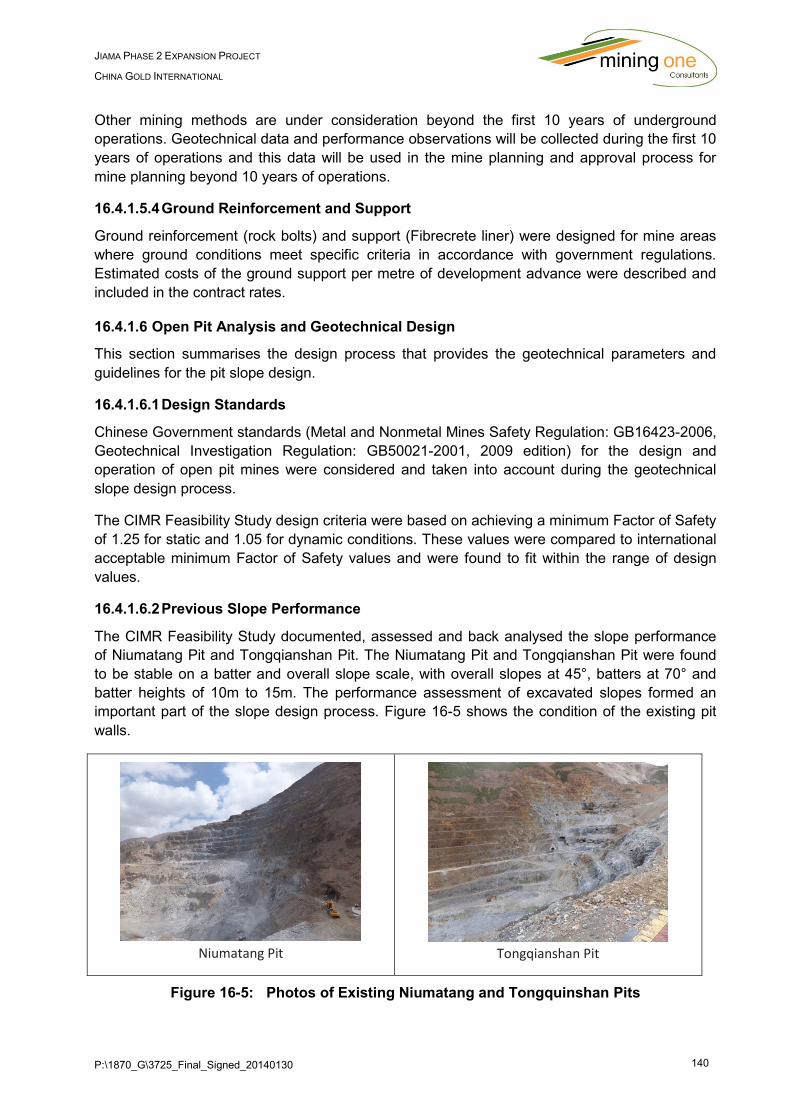
P:\1870_G\3725_Final_Signed_20140130 140
JIAMA PHASE 2 EXPANSION PROJECT
CHINA GOLD INTERNATIONAL
Other mining methods are under consideration beyond the first 10 years of underground
operations. Geotechnical data and performance observations will be collected during the first 10
years of operations and this data will be used in the mine planning and approval process for
mine planning beyond 10 years of operations.
16.4.1.5.4 Ground Reinforcement and Support
Ground reinforcement (rock bolts) and support (Fibrecrete liner) were designed for mine areas
where ground conditions meet specific criteria in accordance with government regulations.
Estimated costs of the ground support per metre of development advance were described and
included in the contract rates.
16.4.1.6 Open Pit Analysis and Geotechnical Design
This section summarises the design process that provides the geotechnical parameters and
guidelines for the pit slope design.
16.4.1.6.1 Design Standards
Chinese Government standards (Metal and Nonmetal Mines Safety Regulation: GB16423-2006,
Geotechnical Investigation Regulation: GB50021-2001, 2009 edition) for the design and
operation of open pit mines were considered and taken into account during the geotechnical
slope design process.
The CIMR Feasibility Study design criteria were based on achieving a minimum Factor of Safety
of 1.25 for static and 1.05 for dynamic conditions. These values were compared to international
acceptable minimum Factor of Safety values and were found to fit within the range of design
values.
16.4.1.6.2 Previous Slope Performance
The CIMR Feasibility Study documented, assessed and back analysed the slope performance
of Niumatang Pit and Tongqianshan Pit. The Niumatang Pit and Tongqianshan Pit were found
to be stable on a batter and overall slope scale, with overall slopes at 45°, batters at 70° and
batter heights of 10m to 15m. The performance assessment of excavated slopes formed an
important part of the slope design process. Figure 16-5 shows the condition of the existing pit
walls.
Niumatang Pit Tongqianshan Pit
Figure 16-5: Photos of Existing Niumatang and Tongquinshan Pits
P:\1870_G\3725_Final_Signed_20140130 141
JIAMA PHASE 2 EXPANSION PROJECT
CHINA GOLD INTERNATIONAL
16.4.1.6.4 Slope Design
The CIMR Feasibility Study for the Jiaoyan and South Pit slopes considered a number of design
approaches, including limit equilibrium and finite element methods, bench face angle design,
major structures influence on overall slope angle and previous slope performance. Dynamic
loadings due to earthquakes were applied during the stability assessment. Pit slope sectors
were assigned to separate pit wall areas with similar wall orientations to simplify the design
process. Groundwater was not expected to be a factor during the slope stability assessment
due to previous experience during mining of Niumatang and Tongqianshan Pits, and it was
therefore justified to analyse the pit walls as dry.
The slope design concludes that:
For Jiaoyan Pit, an overall slope angle was specified depending on the pit wall orientation
(sector) and varies between 45° and 50°; and
At South Pit, an overall slope angle was specified depending on the pit wall orientation
(sector) and varies between 42° and 50°.
Operational management of pit slopes was discussed in the CIMR Feasibility Study, with slope
monitoring techniques specified.
16.5.1 Hydrogeology / Mine Dewatering Concept
Rainfall in the mine area averages around 551 mm per year and the climate is dry for the
majority of the year with a rainy season monsoon between July and August. It was assumed
that 100% of the rainfall in the pit catchments would enter the open pit. It is envisaged that any
diversions above the pit rim would reduce sump pumping requirements.
The combination of steep terrain and relatively low annual rainfall, within a fractured rock setting
required groundwater management for pit and underground mine dewatering to facilitate
achieving pit slope stability. Pit wall depressurisation drilling was not completed during the
mining of Niumatang or Tongqianshan Pits.
It was proposed that most dewatering was achieved by pumping the collected in-pit rainfall
runoff and water infiltration via pit sumps installed at different levels within the pit as the mining
operation progresses.
The stability analyses and slope design were based on the assumption that the pit walls would
be fully depressurised. The pit wall depressurisation was achieved by diverting surface runoff
away from the crest, and continued in pit pumping. The natural landform of the areas around the
South Pit and Jioyan Pit is conducive to achieving this runoff strategy as both pits will include
mining the peak of respective areas.
A guide for Phase II pumping requirements have been based on an average of 83 litres/sec
combined from the Niumatang Pit, Tongqianshan Pit and the Phase I Underground Mine.
16.5.2 Waste Dump Design
The CIMR completed a geotechnical hazard assessment for the Jiama site in 2013. The hazard
assessment identified and rated potential landslide and mudslide locations, and actions were
recommended to address each identified issue. The CIMR geotechnical hazard assessment

P:\1870_G\3725_Final_Signed_20140130 142
JIAMA PHASE 2 EXPANSION PROJECT
CHINA GOLD INTERNATIONAL
applies to some of the Phase II mining areas and demonstrates that a process of geotechnical
hazard assessment has been followed.
The CGDI completed design and specification reporting for three (3) Phase II waste dumps.
Two (2) dumps are allocated to the Underground Mine and one (1) dump to the Open Pits.
These dumps have been designed in accordance with the Chinese Government regulations.
Dump 1 is located in the valley between Tong mountain and Qian mountain, with a dump
volume of ~ 8.5 Million cubic metres;
Dump 2 is located in the Phase 1 Niumatang Open Pit; below 4,650 mRL with a volume of
~ 9 Million cubic metres;
Dump 3 is located in the valley to the south east of Phase II Open Pits with a volume of ~
144.6 Million cubic metres; and
Dump 4 is located in the valley to the south of the south pit with a volume of 129.3 Million
cubic metres.
The CGDI reporting demonstrates that geotechnical parameters were derived and limit
equilibrium stability analysis completed for dry, saturated, static and dynamic conditions. The
results indicate that stable conditions can be expected for the dumps provided the model inputs
are of sufficient accuracy.
To further improve the safety management of the waste dumps relating to operations and
overall dump stability, construction requirements which include details regarding building the
dumps up from the base in lifts, surface drainage requirements and design specifications for the
preparation and installation of dump foundation drains prior to commencement of the first dump
lift have been documented. Waste dump foundation drains will report to a waste dump toe
sump.
16.5.3 Civil Geotechnical
The Jiama Mine area is an existing mine site, with significant infrastructure constructed
previously, including a Tailings Dam and Plant Site. No further major infrastructure is planned
as a part of the Phase II mine plan. No civil geotechnical investigations are currently required.
16.5.4 Recommendations
For any mining project, there are always unknown rock mechanics and hydrogeological
conditions that cannot be predicted ahead of actual mining. These unknown conditions, such as
faulting, zones of weak rock, or zones of unanticipated water inflow, may only be discovered
during mining and may require changes to the mining plan. While additional laboratory testing
and characterisation work should always be ongoing at every stage of project development to
reduce uncertainty, it is never possible to carry out enough drilling/characterisation work ahead
of time to identify all of these potential risks. This may in turn have effects on cost, as relates for
example to slope angles, dewatering and/or underground development, excavation size, etc.
Full time geotechnical personnel have been included within the organisational design. It is
recommended that this group establish an ongoing geotechnical monitoring program to ensure
a proactive approach to the management of failure mechanisms is established during the
excavation and mining of both the open pits and underground mines.
P:\1870_G\3725_Final_Signed_20140130 143
JIAMA PHASE 2 EXPANSION PROJECT
CHINA GOLD INTERNATIONAL
17 RECOVERY METHODS
17.1 Existing Site Plants
17.1.1 Huatailong No. 1 Plant
The 6,500 tpd Huatailong processing plant commenced operation in 2010, and was designed to
treat both Copper-Molybdenum and Copper-Molybdenum-Lead-Zinc ores. For treatment of the
copper-molybdenum ores, only the flotation cells installed to separate lead from copper
concentrates are not in operation, and if the Mo content is too low to be economic, the copper-
molybdenum separation flotation circuit is shutdown.
Currently, Copper-Molybdenum ore from the Tongquianshan and Niumatang open cut mines is
being treated. The molybdenum content of these ores is too low to be economic and only
copper concentrate containing gold and silver credits is being produced, through a conventional
beneficiation circuit suitable for treatment of the skarn ore.
For treatment of Copper-Molybdenum-Lead-Zinc ore, Run-of-Mine is reduced in three-stages of
crushing, then delivered to a fine ore storage bin. The bin discharges to parallel Primary Ball
Grinding Mills operating in closed circuit with hydro-cyclone classifiers.
The grinding circuit product at p70 of 74 microns reports to a bulk flotation rougher-scavenger
circuit, followed by three cleaning stages. The rougher-scavenger tailings feed a zinc flotation
circuit to produce a zinc concentrate and final tailings which is dewatered in a press filter press
and stockpiled.
The copper-molybdenum-lead concentrate is refloated to separate the lead, and the copper-
molybdenum tail is reground in a ball mill closed with hydrocyclones, then refloated to separate
molybdenum from the copper. In Column Cells, all concentrates are thickened and filtered in
ceramic disc filters and delivered to stockpiles.
Currently, Copper-Molybdenum ore from the Tongquianshan and Niumatang open cut mines is
being treated; the molybdenum content of these ores is too low to be economic and only copper
concentrate containing gold and silver credits is being produced. The copper-molybenum and
copper-lead-zinc circuits are not operating for this ore.
It should be noted that an existing 600 tpd pilot plant, described in 0 below, has enough
capacity to treat the small amount of Copper-Lead-Zinc ore shown in the current mine
production schedule.
The Huatailong plant is a conventional beneficiation concentrator suitable for treatment of the
Jiama skarn ore; it is well instrumented, with automatic control of key circuits. The on-site
laboratory is well equipped to provide the assays of geological, mining and process plant shift
samples
The fine regrind in the copper molybdenum circuit coupled with the high altitude location results
in high moisture content ~ 13% in the copper concentrate, through the ceramic disc filter. A filter
press with air blow facility would be necessary to improve this. The Huatailong plant flow-sheet
is presented in Figure 17-1.
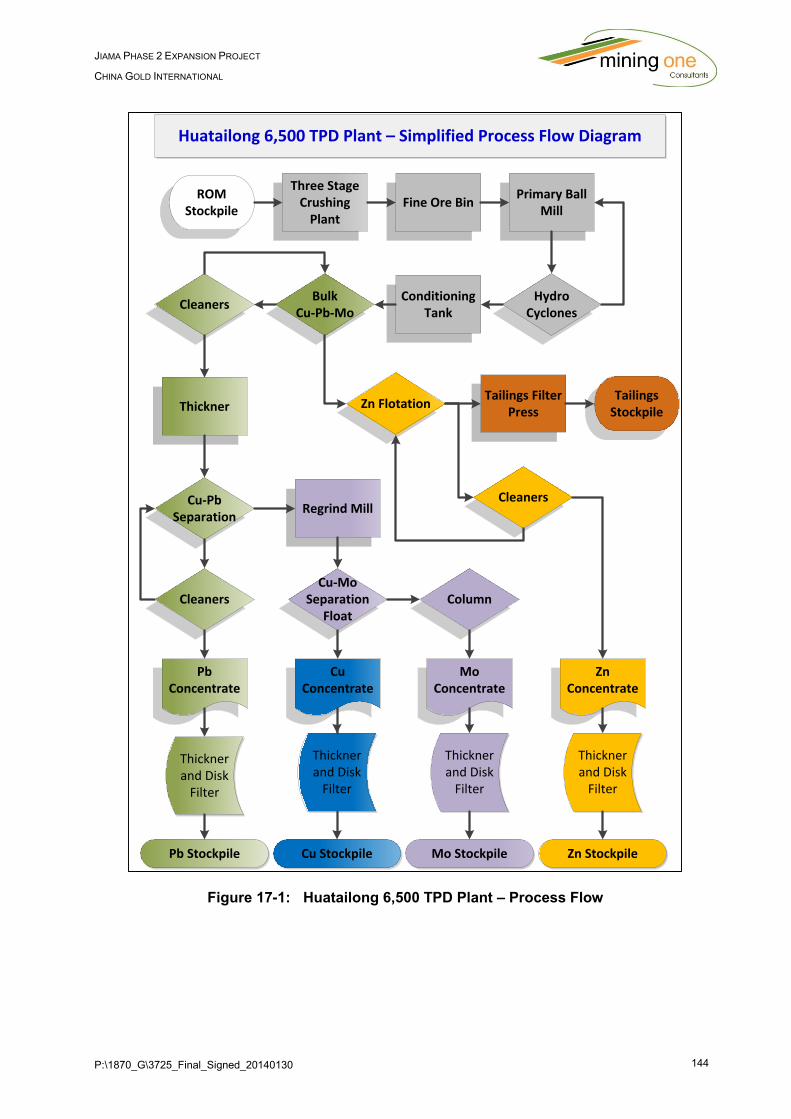
P:\1870_G\3725_Final_Signed_20140130 144
JIAMA PHASE 2 EXPANSION PROJECT
CHINA GOLD INTERNATIONAL
Figure 17-1: Huatailong 6,500 TPD Plant – Process Flow
Huatailong 6,500 TPD Plant – Simplified Process Flow Diagram
Conditioning Tank
Three Stage Crushing
PlantFine Ore Bin
Primary Ball Mill
Hydro Cyclones
Bulk Cu-Pb-Mo
Cleaners
Zn FlotationThicknerTailings Filter
PressTailings
Stockpile
Cleaners
Zn Concentrate
ROM Stockpile
Cu-Pb Separation
Regrind Mill
Cleaners
Pb Concentrate
Cu-Mo Separation
FloatColumn
Mo Concentrate
Cu Concentrate
Zn StockpileCu Stockpile Mo StockpilePb Stockpile
Thickner and Disk
Filter
Thickner and Disk
Filter
Thickner and Disk
Filter
Thickner and Disk
Filter
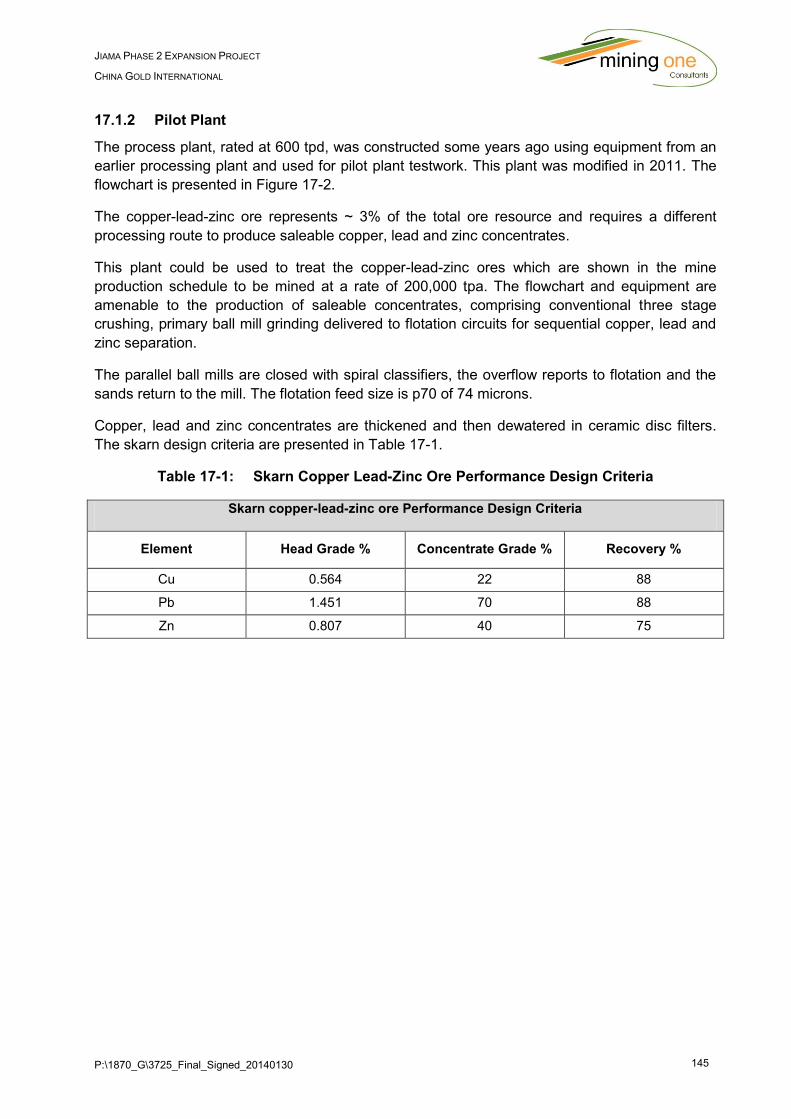
P:\1870_G\3725_Final_Signed_20140130 145
JIAMA PHASE 2 EXPANSION PROJECT
CHINA GOLD INTERNATIONAL
17.1.2 Pilot Plant
The process plant, rated at 600 tpd, was constructed some years ago using equipment from an
earlier processing plant and used for pilot plant testwork. This plant was modified in 2011. The
flowchart is presented in Figure 17-2.
The copper-lead-zinc ore represents ~ 3% of the total ore resource and requires a different
processing route to produce saleable copper, lead and zinc concentrates.
This plant could be used to treat the copper-lead-zinc ores which are shown in the mine
production schedule to be mined at a rate of 200,000 tpa. The flowchart and equipment are
amenable to the production of saleable concentrates, comprising conventional three stage
crushing, primary ball mill grinding delivered to flotation circuits for sequential copper, lead and
zinc separation.
The parallel ball mills are closed with spiral classifiers, the overflow reports to flotation and the
sands return to the mill. The flotation feed size is p70 of 74 microns.
Copper, lead and zinc concentrates are thickened and then dewatered in ceramic disc filters.
The skarn design criteria are presented in Table 17-1.
Table 17-1: Skarn Copper Lead-Zinc Ore Performance Design Criteria
Skarn copper-lead-zinc ore Performance Design Criteria
Element Head Grade % Concentrate Grade % Recovery %
Cu 0.564 22 88
Pb 1.451 70 88
Zn 0.807 40 75
P:\1870_G\3725_Final_Signed_20140130 146
JIAMA PHASE 2 EXPANSION PROJECT
CHINA GOLD INTERNATIONAL
Figure 17-2: TPD Pilot Plant – Simplified Process Flow Diagram
600 TPD Pilot Plant – Simplified Process Flow Diagram
Conditioning Tank
Three Stage Crushing
PlantFine Ore Bin
Primary Ball Mill
Spiral Classifier
Cu FlotationCleaners
Conditioning Tank
Tailings Filter Press
Tailings Stockpile
Cleaners
Zn Concentrate
ROM Stockpile
Pb Flotation
Pb Concentrate
Cu Concentrate
Zn StockpileCu Stockpile Pb Stockpile
Thickner and Disk
Filter
Thickner and Disk
Filter
Thickner and Disk
Filter
Zn Flotation
Conditioning Tank
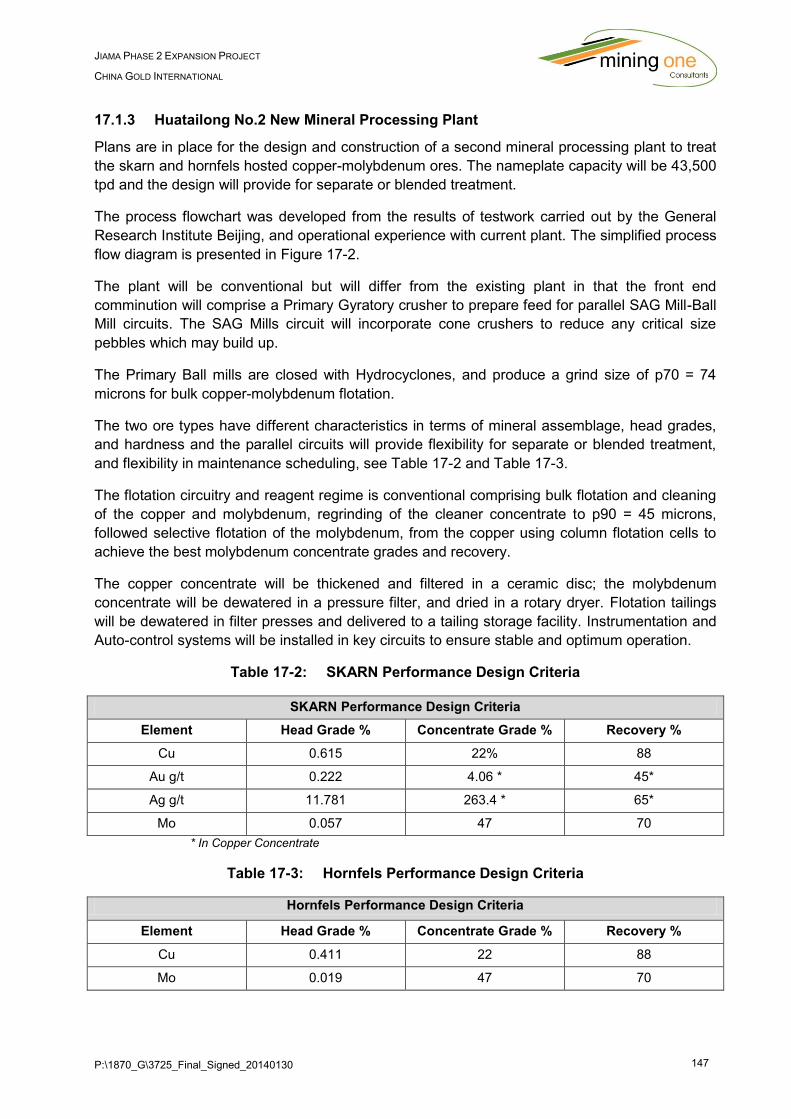
P:\1870_G\3725_Final_Signed_20140130 147
JIAMA PHASE 2 EXPANSION PROJECT
CHINA GOLD INTERNATIONAL
17.1.3 Huatailong No.2 New Mineral Processing Plant
Plans are in place for the design and construction of a second mineral processing plant to treat
the skarn and hornfels hosted copper-molybdenum ores. The nameplate capacity will be 43,500
tpd and the design will provide for separate or blended treatment.
The process flowchart was developed from the results of testwork carried out by the General
Research Institute Beijing, and operational experience with current plant. The simplified process
flow diagram is presented in Figure 17-2.
The plant will be conventional but will differ from the existing plant in that the front end
comminution will comprise a Primary Gyratory crusher to prepare feed for parallel SAG Mill-Ball
Mill circuits. The SAG Mills circuit will incorporate cone crushers to reduce any critical size
pebbles which may build up.
The Primary Ball mills are closed with Hydrocyclones, and produce a grind size of p70 = 74
microns for bulk copper-molybdenum flotation.
The two ore types have different characteristics in terms of mineral assemblage, head grades,
and hardness and the parallel circuits will provide flexibility for separate or blended treatment,
and flexibility in maintenance scheduling, see Table 17-2 and Table 17-3.
The flotation circuitry and reagent regime is conventional comprising bulk flotation and cleaning
of the copper and molybdenum, regrinding of the cleaner concentrate to p90 = 45 microns,
followed selective flotation of the molybdenum, from the copper using column flotation cells to
achieve the best molybdenum concentrate grades and recovery.
The copper concentrate will be thickened and filtered in a ceramic disc; the molybdenum
concentrate will be dewatered in a pressure filter, and dried in a rotary dryer. Flotation tailings
will be dewatered in filter presses and delivered to a tailing storage facility. Instrumentation and
Auto-control systems will be installed in key circuits to ensure stable and optimum operation.
Table 17-2: SKARN Performance Design Criteria
SKARN Performance Design Criteria
Element Head Grade % Concentrate Grade % Recovery %
Cu 0.615 22% 88
Au g/t 0.222 4.06 * 45*
Ag g/t 11.781 263.4 * 65*
Mo 0.057 47 70
* In Copper Concentrate
Table 17-3: Hornfels Performance Design Criteria
Hornfels Performance Design Criteria
Element Head Grade % Concentrate Grade % Recovery %
Cu 0.411 22 88
Mo 0.019 47 70
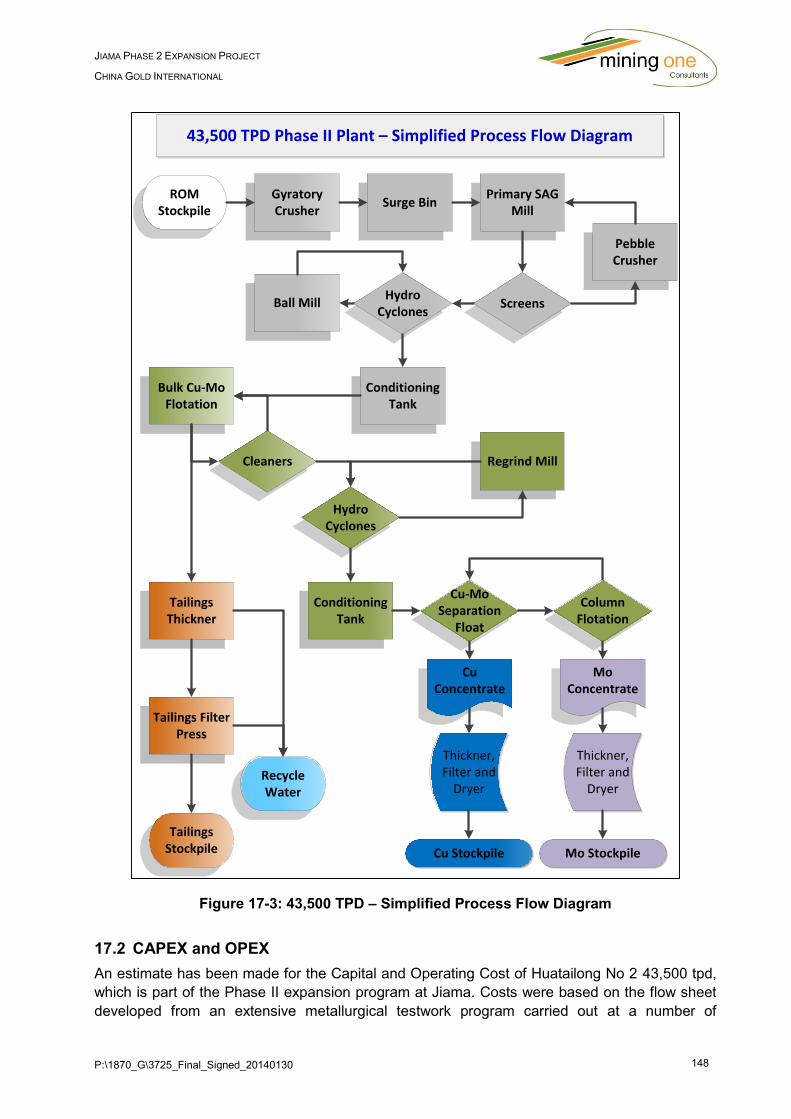
P:\1870_G\3725_Final_Signed_20140130 148
JIAMA PHASE 2 EXPANSION PROJECT
CHINA GOLD INTERNATIONAL
Figure 17-3: 43,500 TPD – Simplified Process Flow Diagram
17.2 CAPEX and OPEX
An estimate has been made for the Capital and Operating Cost of Huatailong No 2 43,500 tpd,
which is part of the Phase II expansion program at Jiama. Costs were based on the flow sheet
developed from an extensive metallurgical testwork program carried out at a number of
43,500 TPD Phase II Plant – Simplified Process Flow Diagram
Gyratory Crusher
Surge BinPrimary SAG
Mill
Screens
Tailings Thickner
Recycle Water
ROM Stockpile
Cu-Mo Separation
Float
Column Flotation
Mo Concentrate
Cu Concentrate
Cu Stockpile Mo Stockpile
Thickner, Filter and
Dryer
Thickner, Filter and
Dryer
Pebble Crusher
Hydro Cyclones
Ball Mill
Conditioning Tank
Bulk Cu-Mo Flotation
Tailings Filter Press
Tailings Stockpile
Cleaners
Conditioning Tank
Hydro Cyclones
Regrind Mill
P:\1870_G\3725_Final_Signed_20140130 149
JIAMA PHASE 2 EXPANSION PROJECT
CHINA GOLD INTERNATIONAL
laboratories, and from operational experience with the existing Huatailong No 1 plant. The
selected treatment rate is based on studies into achievable mining rates from open pits.
17.1.4 OPEX Process Plant
The process operating cost for copper molybdenum ore has been estimated using standard
project engineering methodology and has addressed all aspects of the specified process plant.
The main operating costs comprise:-
Labour;
Power;
Reagents;
Consumables; and
Maintenance.
Labour: Regarded as sufficient to operate and maintain all unit processes in the specified plant.
Manning costs are in-line with current pay rates in China. All unit processes in the plant
described above are catered for and provides for shift crews to run the plant on a roster which
will allow a 24 hour 7 day week operation. Adequate technical support and assay services are
provided for.
Power: Usage estimated is commensurate with requirements for installed power to drive
specified process equipment and based on grid power supplied via a new line into the region.
Consumables and Maintenance: Process reagents are in standard use in the industry, and
cover all necessary areas for this polymetallic extraction and environmental requirements.
Usage is in the same order of consumption as similar plants, and is backed up by the
metallurgical test work carried out on ore samples.
Reagents: Butyl Xanthate, Ammonium aero float, Turpentine oil, Kerosene, Engine Oil, Sodium
Sulphide, Lime, Flocculants, and Sodium Silicate, Consumables, Operating and Maintenance,
Crusher wear parts, SAG and ball mill liners, grinding balls, Screens, and Filter cloths
The reagent usage is based on the metallurgical test work and all reagents required for the
process have been provided for.
Crusher liners, SAG Mill and Ball Mill Liners, Grinding Ball Consumption were calculated from
the abrasion index and work index determined by physical tests carried on the ore samples
using standard Bond Formulae.
Ramp Up: Financial resources should be provided for the first year of operation for extra
personnel assistance and modifications which is normal during new plant commissioning.
The estimation of operating cost for copper- molybdenum ore has been carried out using
standard methodology and has addressed all aspects of the specified process plant.
An operating cost of 60.17 RMB/tonne ($9.86) post commissioning has been estimated and is
regarded as fair and reasonable for this type of process at the nominated treatment rate.
P:\1870_G\3725_Final_Signed_20140130 150
JIAMA PHASE 2 EXPANSION PROJECT
CHINA GOLD INTERNATIONAL
In regard to processing of copper-lead-zinc ore, which will be processed in either the Huatailong
No. 1 plant or the Pilot Plant. Operating costs have been estimated to be a further 13 RMB
/tonne ($2.13) due to lower throughput, and more reagents (73.17 RMB/t – USD$12.00).
In addition to these variable costs a fixed annual cost of 20,251,494 RMB ($3,319,917) has
been allocated for site salaries and organisational expenses as well as a 5,000,000 RMB per
year ($819,672) corporate overhead to cover the cost of any abnormal items.
17.1.5 Capital Cost – Process Plant
A standard approach to estimating the capital cost of the plant has been adopted in that multi-
vendor budget. Quotes were obtained from suppliers for the major equipment items as shown in
the process flow sheet described, and within the Battery Limits below.
Battery Limits
ROM pad;
Tailings disposal dam or filtration;
Concentrate storage at the process plant and delivery to port;
Power supply to on-site sub-station; and
Process water from the raw water dam.
Based on the result of vendor inquiries, preliminary designs, material take-offs and standard
engineering calculations applied to the major equipment, capital costs were estimated for a
complete plant including engineering design, procurement, construction and project
management. The procedures used to generate the estimate are well developed in the industry.
It should be noted that capital estimates for the studies have been based on new equipment.
However, if appropriate used equipment is already owned or optioned at the project
implementation stage, then any method to reduce costs including the use of second hand
equipment may be employed.
The life-of-mine Capital Costs for the Phase II Processing Plant was estimated at US $ 221.3
Million, estimated by the Changsha Institute and considered to be fair and reasonable within
The Study for this type of process, operating at the nominated treatment rate. This plant has
already commenced construction and at the time of this report the processing plant was over
50% complete. This was supported by the “Jiama Phase 2 Preliminary Design C 110apital Cost
Report” dated November 2013. Figure 17-4 provides a photo gallery of the progress made on
the construction of the site processing facilities. Progress on the project has been significant.
An allocation of $US 110.7 Million has been made to capital for the completion of all capital
works associated with the processing plant. In addition to this annual sustaining capital of 5%
the total plant capital has been factored in from year 4 through until the end of mining. This was
considered a reasonable estimate for ongoing capital upkeep of the plant.

P:\1870_G\3725_Final_Signed_20140130 151
JIAMA PHASE 2 EXPANSION PROJECT
CHINA GOLD INTERNATIONAL
SAG Mill
Concentrate Thickener
Flotation Circuits
Grinding and Milling
Substation
ROM Silo
Figure 17-4: Plant Construction Photos
P:\1870_G\3725_Final_Signed_20140130 152
JIAMA PHASE 2 EXPANSION PROJECT
CHINA GOLD INTERNATIONAL
18 PROJECT INFRASTRUCTURE
18.1 Introduction
Substantial infrastructure has been developed for the Phase I of the Project and includes
access roads, power supply and water supply for mining and mineral processing as well as a
tailings dam. The Company is in the process of upgrading these facilities to ensure that the
forecast production expansion to 16.5 Mtpa ROM ore can be achieved during Phase II. As
these upgrades are mostly further expansion of already built infrastructure, it is unlikely that any
material risks will be experienced.
The Project assets are generally located at high MSL elevations, ranging from 4,350 mRL to
5,410 mRL on the Tibetan Plateau. The site camp and existing processing facilities are located
at an elevation of approximately 4,000 mRL, while the proposed processing plant would be at
approximately elevation 4,420 mRL. The Project area has mountainous topography with steep
slopes and large differences in elevation. There are some sparsely-populated Tibetan villages
within the Project area.
The winter season occurs from October through to March and the Project experiences frequent
snow falls and is extremely cold. Only July and August are frost free months. The weather has a
typical continental plateau climate, which introduces difficulties to both construction and
operation.
18.2 Mining Facilities
The design of the mining facilities has been driven by the need to minimize costs, yet provide
substantial support systems for the life of mine. The major buildings have design lives of 50
years. They have also been designed taking into account the local climate.
The main working sites in the mine include the processing plant, tailing, water source, open pit
mine and waste dumps.
The following have been catered for in the design of the mining facilities:
Main facilities for the mines include:
- Crushing station;
- Open pit conveyor system;
- 110 kV substation;
- Mining ancillary facilities site;
- Mining water storage;
- Adits; and
- Dump sites.
Major buildings/facilities in the processing plant include:
P:\1870_G\3725_Final_Signed_20140130 153
JIAMA PHASE 2 EXPANSION PROJECT
CHINA GOLD INTERNATIONAL
- Ore yard, grinding and floating (includes grinding and copper-molybdenum
floatation);
- Copper-molybdenum separation plant;
- Ore concentrate plant;
- Concentrate dewatering plant;
- Tailings concentration plant;
- Tailings pressurization pump station;
- Pre-processing plant water reuse pump; and
- The crushing system is located in the mining area. Crushed ore is transported to the
ROM pad through a belt conveyor.
Auxiliary facilities in the processing plant include:
- Lime preparation plant;
- 110 kV substation; and
- Electric boiler room.
Auxiliary production facilities include:
- 110 kV substation;
- power distribution;
- water pumping station;
- booster pump; and
- Ore storage bin, concentrate pool, conveyor gallery.
Industrial buildings/constructions include:
- Back fill plant;
- Mining vehicle repair workshop;
- Conveyor gallery; and
- Drill core storage.
Auxiliary buildings include:
- Air compressor plant office;
- Heat pumping station; and
- Power distribution room.
P:\1870_G\3725_Final_Signed_20140130 154
JIAMA PHASE 2 EXPANSION PROJECT
CHINA GOLD INTERNATIONAL
18.2.1 Mining Equipment Workshop
Mining machinery and equipment installed have a total weight of 1,326 tonnes, including 1,260
tonnes of mining equipment and machine repair equipment of 66 tonnes. The North-South
District contains electric locomotives weighing 512 tonnes and mining vehicles weighing 1,448
tonnes.
18.2.1.1 Electric Locomotive and Mining Vehicle Repair
This workshop is responsible for repair works on electric locomotives, mining vehicles and
large/medium tracked vehicles. The workshop is equipped with a BZY300_6 15t/3t double hook
crane, a turbine and related welding station. Minor repairs of electric locomotives and mining
vehicles are carried out by the underground team. Fourteen staff are required in this workshop.
The building has the following dimensions: (Main span 12 m+ partial cross 4.5 m) × 30 m =
495 m2
18.2.1.2 Blacksmith, Forging Workshop
This workshop is responsible for the repair works of drill pipe, drill head and grind work. It is also
responsible for forging items that are under 15kg. The workshop composes of a blacksmith
room of 270m2 and a forging, soldering room of 27m2. The workshop consists of a PYZ-50T
hydraulic forging machine, a 150kg air hammer and other auxiliary equipment. Eight staff are
needed in this workshop.
18.2.1.3 Timber Processing Workshop
This workshop is responsible for processing timber pit prop, panels, etc.
Buildings: 9m × 36m = 324m2, 4.5 m height.
Major equipment includes a circular saw and a wood working planer. Ten staff are required in
this workshop.
18.2.1.4 Trackless Mining Equipment Workshop
The mine has more than 50 sets of cars and trackless mining equipment.
Spare parts are not manufactured in this workshop, they are either purchased or processed by
mining equipment workshop. This workshop requires 17 staff, which includes 8 fitters, 3
welders, 4 riveters and 2 electricians.
18.2.2 Building area
There is a total of 4 repair stations and a trench. Repairs can be carried out either outdoor or
indoor, including workstations and supporting areas.
Repair Room Area: (18m+6m) × 54m = 1296m2
Outdoor repair site area: 1000m2.
Major equipment includes:
1 x QD double girder crane, Q = 16/3.2 TH = 9/12m LK = 16.5m.
3 x AC/DC welding machines.
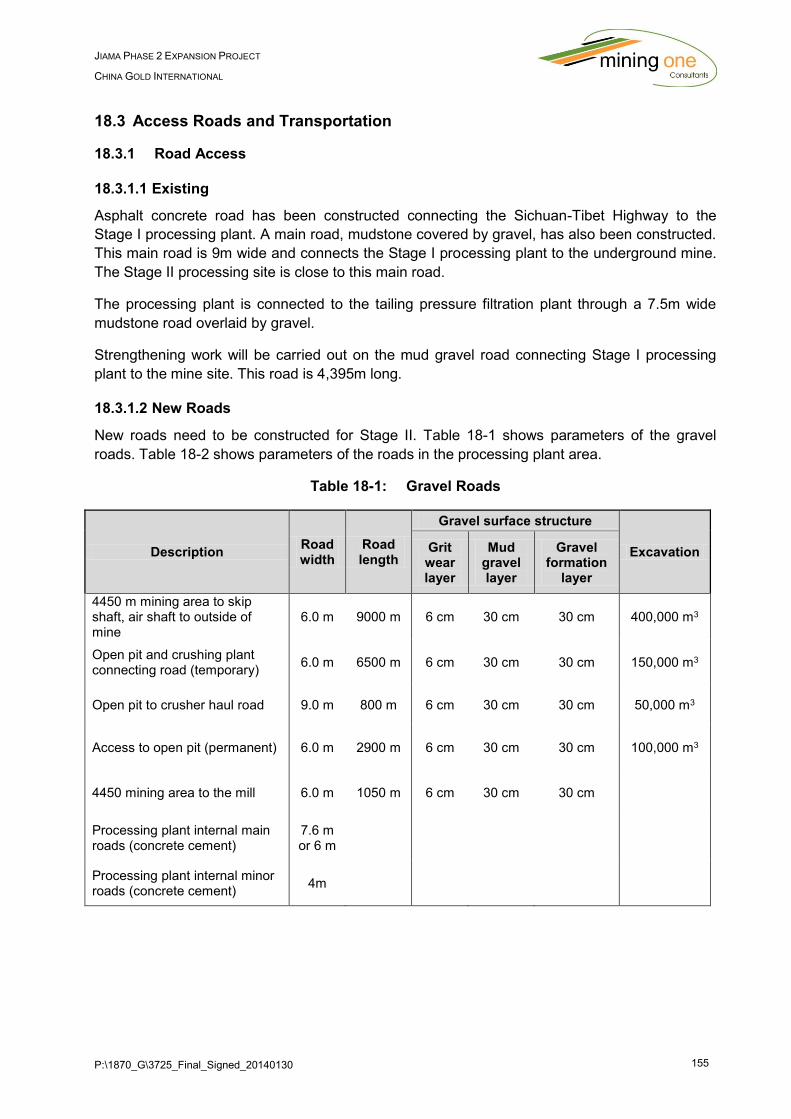
P:\1870_G\3725_Final_Signed_20140130 155
JIAMA PHASE 2 EXPANSION PROJECT
CHINA GOLD INTERNATIONAL
18.3 Access Roads and Transportation
18.3.1 Road Access
18.3.1.1 Existing
Asphalt concrete road has been constructed connecting the Sichuan-Tibet Highway to the
Stage I processing plant. A main road, mudstone covered by gravel, has also been constructed.
This main road is 9m wide and connects the Stage I processing plant to the underground mine.
The Stage II processing site is close to this main road.
The processing plant is connected to the tailing pressure filtration plant through a 7.5m wide
mudstone road overlaid by gravel.
Strengthening work will be carried out on the mud gravel road connecting Stage I processing
plant to the mine site. This road is 4,395m long.
18.3.1.2 New Roads
New roads need to be constructed for Stage II. Table 18-1 shows parameters of the gravel
roads. Table 18-2 shows parameters of the roads in the processing plant area.
Table 18-1: Gravel Roads
Description Road width
Road length
Gravel surface structure
Excavation Grit wear layer
Mud gravel layer
Gravel formation
layer
4450 m mining area to skip shaft, air shaft to outside of mine
6.0 m 9000 m 6 cm 30 cm 30 cm 400,000 m3
Open pit and crushing plant connecting road (temporary)
6.0 m 6500 m 6 cm 30 cm 30 cm 150,000 m3
Open pit to crusher haul road 9.0 m 800 m 6 cm 30 cm 30 cm 50,000 m3
Access to open pit (permanent) 6.0 m 2900 m 6 cm 30 cm 30 cm 100,000 m3
4450 mining area to the mill 6.0 m 1050 m 6 cm 30 cm 30 cm
Processing plant internal main roads (concrete cement)
7.6 m or 6 m
Processing plant internal minor roads (concrete cement)
4m
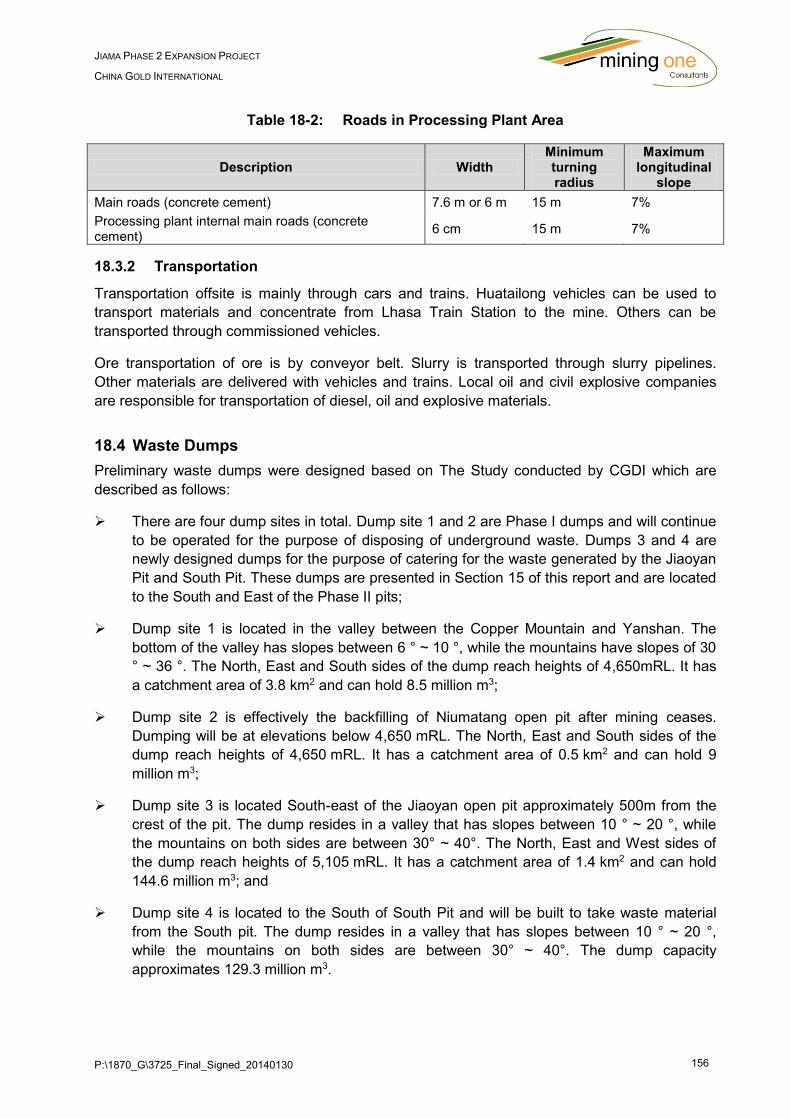
P:\1870_G\3725_Final_Signed_20140130 156
JIAMA PHASE 2 EXPANSION PROJECT
CHINA GOLD INTERNATIONAL
Table 18-2: Roads in Processing Plant Area
Description Width Minimum turning radius
Maximum longitudinal
slope
Main roads (concrete cement) 7.6 m or 6 m 15 m 7%
Processing plant internal main roads (concrete cement)
6 cm 15 m 7%
18.3.2 Transportation
Transportation offsite is mainly through cars and trains. Huatailong vehicles can be used to
transport materials and concentrate from Lhasa Train Station to the mine. Others can be
transported through commissioned vehicles.
Ore transportation of ore is by conveyor belt. Slurry is transported through slurry pipelines.
Other materials are delivered with vehicles and trains. Local oil and civil explosive companies
are responsible for transportation of diesel, oil and explosive materials.
18.4 Waste Dumps
Preliminary waste dumps were designed based on The Study conducted by CGDI which are
described as follows:
There are four dump sites in total. Dump site 1 and 2 are Phase I dumps and will continue
to be operated for the purpose of disposing of underground waste. Dumps 3 and 4 are
newly designed dumps for the purpose of catering for the waste generated by the Jiaoyan
Pit and South Pit. These dumps are presented in Section 15 of this report and are located
to the South and East of the Phase II pits;
Dump site 1 is located in the valley between the Copper Mountain and Yanshan. The
bottom of the valley has slopes between 6 ° ~ 10 °, while the mountains have slopes of 30
° ~ 36 °. The North, East and South sides of the dump reach heights of 4,650mRL. It has
a catchment area of 3.8 km2 and can hold 8.5 million m3;
Dump site 2 is effectively the backfilling of Niumatang open pit after mining ceases.
Dumping will be at elevations below 4,650 mRL. The North, East and South sides of the
dump reach heights of 4,650 mRL. It has a catchment area of 0.5 km2 and can hold 9
million m3;
Dump site 3 is located South-east of the Jiaoyan open pit approximately 500m from the
crest of the pit. The dump resides in a valley that has slopes between 10 ° ~ 20 °, while
the mountains on both sides are between 30° ~ 40°. The North, East and West sides of
the dump reach heights of 5,105 mRL. It has a catchment area of 1.4 km2 and can hold
144.6 million m3; and
Dump site 4 is located to the South of South Pit and will be built to take waste material
from the South pit. The dump resides in a valley that has slopes between 10 ° ~ 20 °,
while the mountains on both sides are between 30° ~ 40°. The dump capacity
approximates 129.3 million m3.
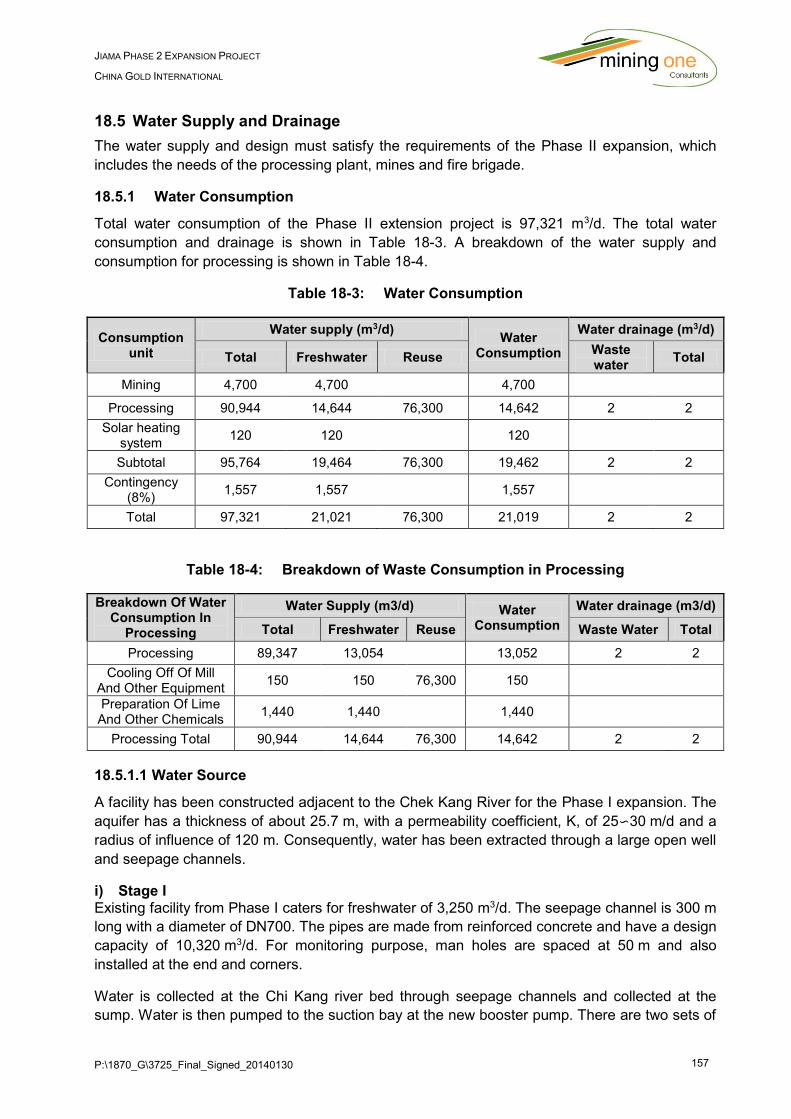
P:\1870_G\3725_Final_Signed_20140130 157
JIAMA PHASE 2 EXPANSION PROJECT
CHINA GOLD INTERNATIONAL
18.5 Water Supply and Drainage
The water supply and design must satisfy the requirements of the Phase II expansion, which
includes the needs of the processing plant, mines and fire brigade.
18.5.1 Water Consumption
Total water consumption of the Phase II extension project is 97,321 m3/d. The total water
consumption and drainage is shown in Table 18-3. A breakdown of the water supply and
consumption for processing is shown in Table 18-4.
Table 18-3: Water Consumption
Consumption unit
Water supply (m3/d) Water
Consumption
Water drainage (m3/d)
Total Freshwater Reuse Waste water
Total
Mining 4,700 4,700 4,700
Processing 90,944 14,644 76,300 14,642 2 2
Solar heating system
120 120 120
Subtotal 95,764 19,464 76,300 19,462 2 2
Contingency (8%)
1,557 1,557 1,557
Total 97,321 21,021 76,300 21,019 2 2
Table 18-4: Breakdown of Waste Consumption in Processing
Breakdown Of Water Consumption In
Processing
Water Supply (m3/d) Water Consumption
Water drainage (m3/d)
Total Freshwater Reuse Waste Water Total
Processing 89,347 13,054 13,052 2 2
Cooling Off Of Mill And Other Equipment
150 150 76,300 150
Preparation Of Lime And Other Chemicals
1,440 1,440 1,440
Processing Total 90,944 14,644 76,300 14,642 2 2
18.5.1.1 Water Source
A facility has been constructed adjacent to the Chek Kang River for the Phase I expansion. The
aquifer has a thickness of about 25.7 m, with a permeability coefficient, K, of 25∽30 m/d and a
radius of influence of 120 m. Consequently, water has been extracted through a large open well
and seepage channels.
i) Stage I Existing facility from Phase I caters for freshwater of 3,250 m3/d. The seepage channel is 300 m
long with a diameter of DN700. The pipes are made from reinforced concrete and have a design
capacity of 10,320 m3/d. For monitoring purpose, man holes are spaced at 50 m and also
installed at the end and corners.
Water is collected at the Chi Kang river bed through seepage channels and collected at the
sump. Water is then pumped to the suction bay at the new booster pump. There are two sets of
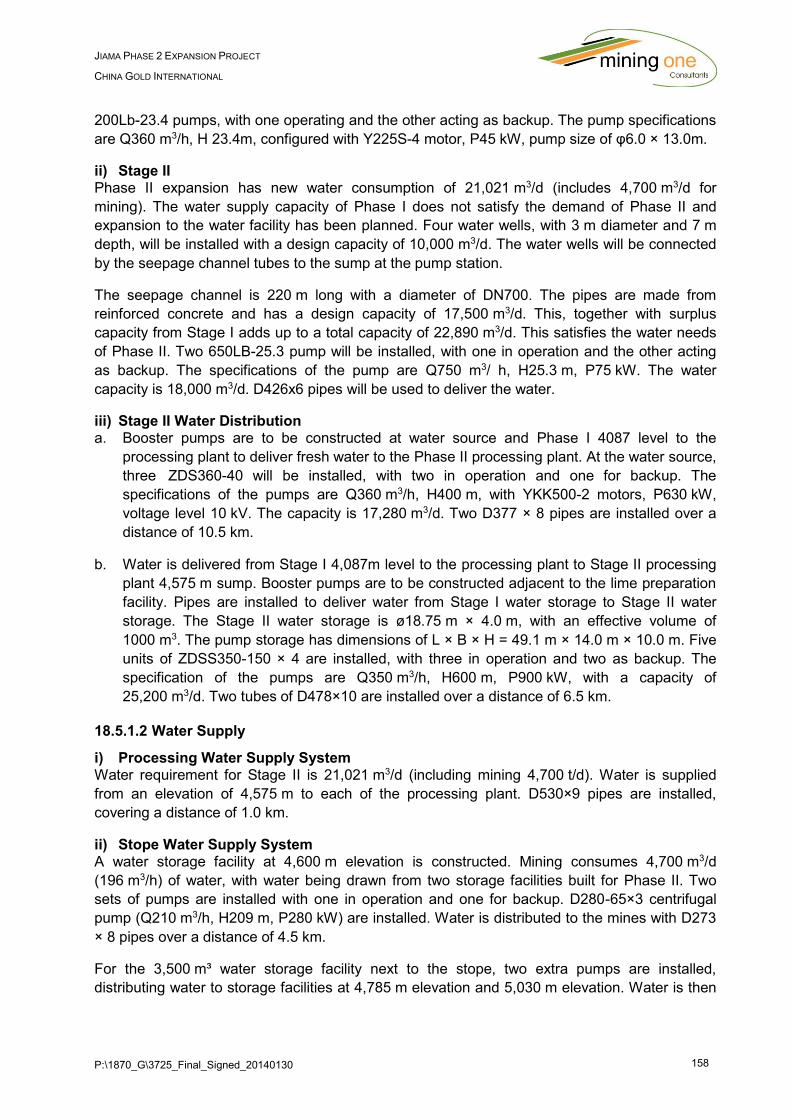
P:\1870_G\3725_Final_Signed_20140130 158
JIAMA PHASE 2 EXPANSION PROJECT
CHINA GOLD INTERNATIONAL
200Lb-23.4 pumps, with one operating and the other acting as backup. The pump specifications
are Q360 m3/h, H 23.4m, configured with Y225S-4 motor, P45 kW, pump size of φ6.0 × 13.0m.
ii) Stage II Phase II expansion has new water consumption of 21,021 m3/d (includes 4,700 m3/d for
mining). The water supply capacity of Phase I does not satisfy the demand of Phase II and
expansion to the water facility has been planned. Four water wells, with 3 m diameter and 7 m
depth, will be installed with a design capacity of 10,000 m3/d. The water wells will be connected
by the seepage channel tubes to the sump at the pump station.
The seepage channel is 220 m long with a diameter of DN700. The pipes are made from
reinforced concrete and has a design capacity of 17,500 m3/d. This, together with surplus
capacity from Stage I adds up to a total capacity of 22,890 m3/d. This satisfies the water needs
of Phase II. Two 650LB-25.3 pump will be installed, with one in operation and the other acting
as backup. The specifications of the pump are Q750 m3/ h, H25.3 m, P75 kW. The water
capacity is 18,000 m3/d. D426x6 pipes will be used to deliver the water.
iii) Stage II Water Distribution a. Booster pumps are to be constructed at water source and Phase I 4087 level to the
processing plant to deliver fresh water to the Phase II processing plant. At the water source,
three ZDS360-40 will be installed, with two in operation and one for backup. The
specifications of the pumps are Q360 m3/h, H400 m, with YKK500-2 motors, P630 kW,
voltage level 10 kV. The capacity is 17,280 m3/d. Two D377 × 8 pipes are installed over a
distance of 10.5 km.
b. Water is delivered from Stage I 4,087m level to the processing plant to Stage II processing
plant 4,575 m sump. Booster pumps are to be constructed adjacent to the lime preparation
facility. Pipes are installed to deliver water from Stage I water storage to Stage II water
storage. The Stage II water storage is ø18.75 m × 4.0 m, with an effective volume of
1000 m3. The pump storage has dimensions of L × B × H = 49.1 m × 14.0 m × 10.0 m. Five
units of ZDSS350-150 × 4 are installed, with three in operation and two as backup. The
specification of the pumps are Q350 m3/h, H600 m, P900 kW, with a capacity of
25,200 m3/d. Two tubes of D478×10 are installed over a distance of 6.5 km.
18.5.1.2 Water Supply
i) Processing Water Supply System Water requirement for Stage II is 21,021 m3/d (including mining 4,700 t/d). Water is supplied
from an elevation of 4,575 m to each of the processing plant. D530×9 pipes are installed,
covering a distance of 1.0 km.
ii) Stope Water Supply System A water storage facility at 4,600 m elevation is constructed. Mining consumes 4,700 m3/d
(196 m3/h) of water, with water being drawn from two storage facilities built for Phase II. Two
sets of pumps are installed with one in operation and one for backup. D280-65×3 centrifugal
pump (Q210 m3/h, H209 m, P280 kW) are installed. Water is distributed to the mines with D273
× 8 pipes over a distance of 4.5 km.
For the 3,500 m³ water storage facility next to the stope, two extra pumps are installed,
distributing water to storage facilities at 4,785 m elevation and 5,030 m elevation. Water is then
P:\1870_G\3725_Final_Signed_20140130 159
JIAMA PHASE 2 EXPANSION PROJECT
CHINA GOLD INTERNATIONAL
distributed to the ore conveyor belt shaft, conveyor gallery and surface crushing station,
unloading stations, etc.
Water delivery to the 4,785 mRL water storage facility utilises D25-30×7 multistage centrifugal
pump. Two sets of such pumps are installed with one in operation and one as backup. The
pumping parameters are Q = 25 m3/h, H=210 m, P=30 kW.
Water delivery to 5030 mRL water storage facility utilises D25-50×10 multistage centrifugal
pump. Two sets of such pumps are installed with one in operation and one as backup. The
pumping parameters are Q = 25 m3/h, H=500 m, P = 75 kW.
The pipes are to be installed underground over a distance of 2 km.
iii) Water Reuse Water reuse is classified into two types, those before processing plant and those from tailings.
Water reuse before processing plant is 68,670 m3/d (2,861 m3/h). Tailings reuse includes
collection of rainwater and tailings seepage. 39,162 t/d of material is transported to tailings and
backfill stations, with concentration of 64%. Total water included is 22,034 m3/d. Based on tests
on tailing moisture, after segregation and sedimentation of the tailings materials, water reuse is
estimated at 7,630 m3/d.
iv) Fire Brigade Water Use The outdoor fire brigade utilises a high pressure system. The fire brigade and plant district
share the same water supply system. The outdoor system has a capacity of 20 L/s while the
indoor system has a capacity of 10 L/s.
v) Water Drainage Water drainage in the processing plant area is mainly required for those from grinding and
flotation. It is transported to the thickener then taken to storage before the plant and pumped
back for reuse. Water consumption for toilets in the processing plant is 3 m3/d. Of this, 1 m3/d is
consumed while 2 m3/d is domestic sewage. After treatment, domestic sewage is recycled or
used to water the roads.
18.6 Power
This covers the power requirements of the mines and processing plant. It also takes into
account Phase I power system. The distribution voltage is 110/10/0.69 (0.4) kV. The mill and
processing plant each requires a 110 kV substation.
18.6.1 Power Supply
Power is connected from the Medro Gongkar 220 kV substation, with double-circuit
transmission 110 kV line. After entering the Huatailong mine, it is connected to various locations
including the processing plant 110 kV substation and the mining plant 110 kV substation.
The additional load summary for Phase II is presented in Table 18-5 and the electricity load in
the mining areas after expansion is depicted in Table 18-6.
P:\1870_G\3725_Final_Signed_20140130 160
JIAMA PHASE 2 EXPANSION PROJECT
CHINA GOLD INTERNATIONAL
Table 18-5: Total Electricity Load – Stage II Additional Load Summary
Item Value
Equipment capacity 150,198 kW
Working capacity 129,142 kW
Calculated power 94,659 kVA
Apparent power 93,107 kVA
Power factor 0.98
Annual power consumption 12,627x104 kWh
Table 18-6: Electricity Load – Total in Mining Areas after Expansion
Item Value
Installed capacity 34,384 kW
Working capacity 31,380 kW
Calculated power 20,715 kVA
Apparent power 21,068 kVA
Power factor 0.98
Annual power consumption 11,580x104 kWh
18.7 Heating, Ventilation
18.7.1 Heating
Main heat consumptions are from industrial buildings (grinding and mixing of copper and
molybdenum in plant, copper-molybdenum separation plant, concentrate dewatering workshop).
According to local meteorological records, winter sunny weather during the day and the outdoor
temperature can reach more than 5℃, with this having no effect on plant production. The project
mainly considers keeping ore at 5℃ at night, from 20:00 to 8:00 the next day.
Based on HVAC calculations, the maximum heat load required is 4280 kW, with the normal
design heating load being 3,960 kW. The workshop uses air cabinet and radiant panel for
heating ore. The indoor heating system uses 55℃ / 45℃ for water circulation temperatures.
The project is located in Tibet, which has a shortage of energy. The unique external
environment and conditions for the project brings with it a lot of constraints in sourcing heat.
Consequently, the design should be carried out keeping in mind local conditions. The following
factors should be considered:
1) Lhasa is a pure land, which uses an excessive amount of man-made energy, which
causes an adverse impact on the environment.
2) Energy efficiency of buildings is a key national energy strategy measure. Maximum use of
renewable energy to reduce the consumption of fossil fuel is China's national policy.
3) Energy shortage in the Lhasa area means energy needs to be transmitted from inland. If
problems occur in the transmission process, the project can no longer operate normally,
causing a serious impact on the project.
P:\1870_G\3725_Final_Signed_20140130 161
JIAMA PHASE 2 EXPANSION PROJECT
CHINA GOLD INTERNATIONAL
With consideration of the aforementioned factors, a solar collector system has been selected as
the main heat source for the processing plant. Heat from the electric boiler acts as a
secondary/back up unit. According to thermal equilibrium, the storage facility has capacity for 12
hours of the required energy, water supply temperature is set at 65℃, reuse temperature is set
at 50℃. It is heated at the plate heat exchanger 55℃ ~ 45℃ and sent through to the pipe
network for use in the solar collector system. The solar collectors convert light energy into heat
energy, the working fluid collects heat. The solar collector system pumps fluid into the tank for
storage. The solar collector heat storage system collects heat from 8:00 - 18:00. It then runs at
night from 20:00-8:00, heat is transferred from the storage tank to the heating plant. Since solar
energy is an unstable source of energy, impacted by clouds or snow, an electric boiler is set up
as an auxiliary heat source.
18.7.2 Ventilation and Dust
During production, ventilation and dust purification systems are installed at locations with dust
concerns and include; the underground conveyor gallery, chemical preparation rooms and
administration rooms, etc.
18.7.3 Processing Plant
Dust is generated from the ROM stockpile and secondary crushing workshop during the
crushing and subsequent transportation processes. Partial enclosure will be set up at locations
where the most dust is generated. This partial enclosure will be complemented by mechanical
ventilation.
Dusted air will be purified through pulse bag dust precipitator and discharged through an
exhaust fan. The size of the particulate matter is lower than the emission standard of 80mg/m3.
The filter cleaning system uses 0.8 MPa compressed air, supplied by the copper-molybdenum
separation air compressor station, see Table 18-7 which shows the structure and emission of
the dust collection system.
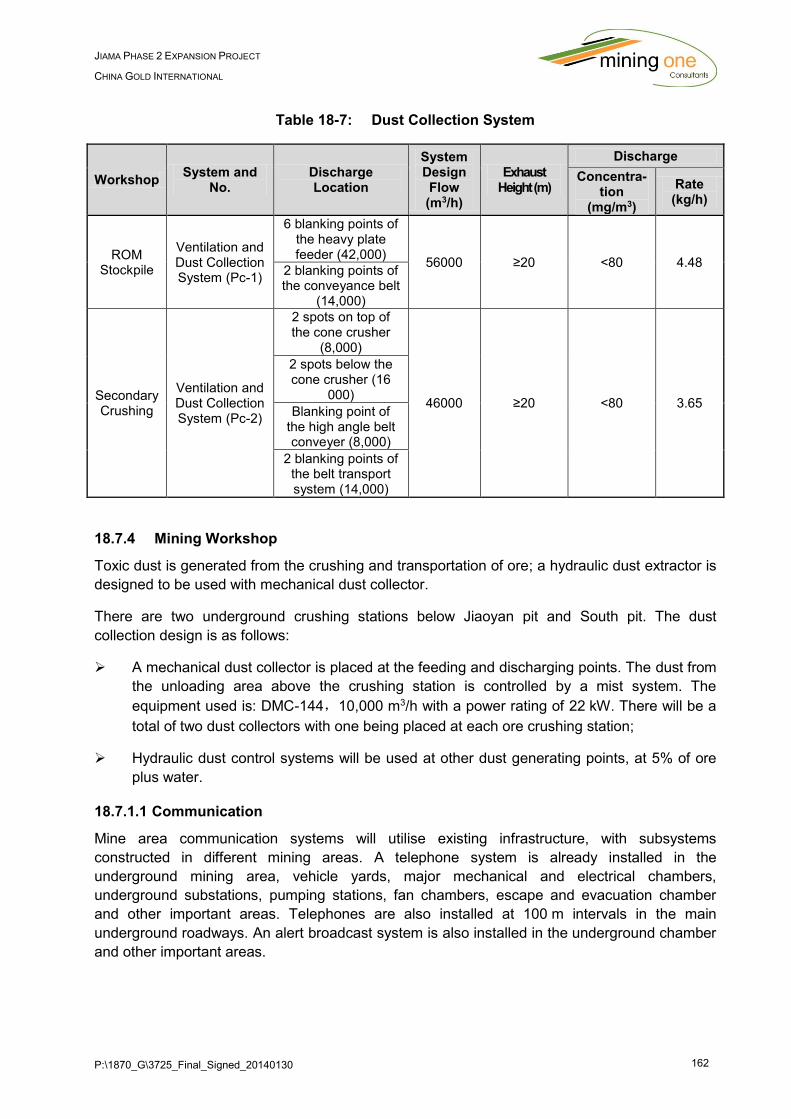
P:\1870_G\3725_Final_Signed_20140130 162
JIAMA PHASE 2 EXPANSION PROJECT
CHINA GOLD INTERNATIONAL
Table 18-7: Dust Collection System
Workshop System and
No. Discharge Location
System Design Flow (m3/h)
Exhaust Height (m)
Discharge
Concentra-tion
(mg/m3)
Rate (kg/h)
ROM Stockpile
Ventilation and Dust Collection System (Pc-1)
6 blanking points of the heavy plate feeder (42,000)
56000 ≥20 <80 4.48 2 blanking points of the conveyance belt
(14,000)
Secondary Crushing
Ventilation and Dust Collection System (Pc-2)
2 spots on top of the cone crusher
(8,000)
46000 ≥20 <80 3.65
2 spots below the cone crusher (16
000)
Blanking point of the high angle belt conveyer (8,000)
2 blanking points of the belt transport system (14,000)
18.7.4 Mining Workshop
Toxic dust is generated from the crushing and transportation of ore; a hydraulic dust extractor is
designed to be used with mechanical dust collector.
There are two underground crushing stations below Jiaoyan pit and South pit. The dust
collection design is as follows:
A mechanical dust collector is placed at the feeding and discharging points. The dust from
the unloading area above the crushing station is controlled by a mist system. The
equipment used is: DMC-144,10,000 m3/h with a power rating of 22 kW. There will be a
total of two dust collectors with one being placed at each ore crushing station;
Hydraulic dust control systems will be used at other dust generating points, at 5% of ore
plus water.
18.7.1.1 Communication
Mine area communication systems will utilise existing infrastructure, with subsystems
constructed in different mining areas. A telephone system is already installed in the
underground mining area, vehicle yards, major mechanical and electrical chambers,
underground substations, pumping stations, fan chambers, escape and evacuation chamber
and other important areas. Telephones are also installed at 100 m intervals in the main
underground roadways. An alert broadcast system is also installed in the underground chamber
and other important areas.
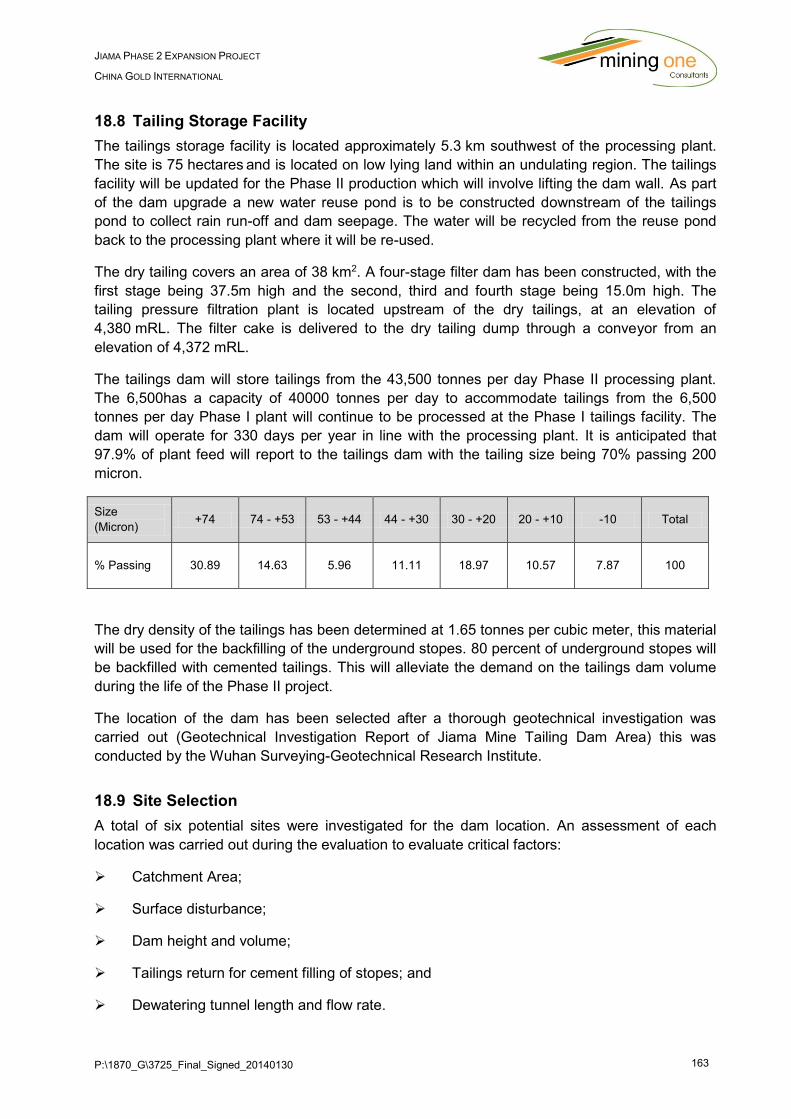
P:\1870_G\3725_Final_Signed_20140130 163
JIAMA PHASE 2 EXPANSION PROJECT
CHINA GOLD INTERNATIONAL
18.8 Tailing Storage Facility
The tailings storage facility is located approximately 5.3 km southwest of the processing plant.
The site is 75 hectares and is located on low lying land within an undulating region. The tailings
facility will be updated for the Phase II production which will involve lifting the dam wall. As part
of the dam upgrade a new water reuse pond is to be constructed downstream of the tailings
pond to collect rain run-off and dam seepage. The water will be recycled from the reuse pond
back to the processing plant where it will be re-used.
The dry tailing covers an area of 38 km2. A four-stage filter dam has been constructed, with the
first stage being 37.5m high and the second, third and fourth stage being 15.0m high. The
tailing pressure filtration plant is located upstream of the dry tailings, at an elevation of
4,380 mRL. The filter cake is delivered to the dry tailing dump through a conveyor from an
elevation of 4,372 mRL.
The tailings dam will store tailings from the 43,500 tonnes per day Phase II processing plant.
The 6,500has a capacity of 40000 tonnes per day to accommodate tailings from the 6,500
tonnes per day Phase I plant will continue to be processed at the Phase I tailings facility. The
dam will operate for 330 days per year in line with the processing plant. It is anticipated that
97.9% of plant feed will report to the tailings dam with the tailing size being 70% passing 200
micron.
Size
(Micron) +74 74 - +53 53 - +44 44 - +30 30 - +20 20 - +10 -10 Total
% Passing 30.89 14.63 5.96 11.11 18.97 10.57 7.87 100
The dry density of the tailings has been determined at 1.65 tonnes per cubic meter, this material
will be used for the backfilling of the underground stopes. 80 percent of underground stopes will
be backfilled with cemented tailings. This will alleviate the demand on the tailings dam volume
during the life of the Phase II project.
The location of the dam has been selected after a thorough geotechnical investigation was
carried out (Geotechnical Investigation Report of Jiama Mine Tailing Dam Area) this was
conducted by the Wuhan Surveying-Geotechnical Research Institute.
18.9 Site Selection
A total of six potential sites were investigated for the dam location. An assessment of each
location was carried out during the evaluation to evaluate critical factors:
Catchment Area;
Surface disturbance;
Dam height and volume;
Tailings return for cement filling of stopes; and
Dewatering tunnel length and flow rate.
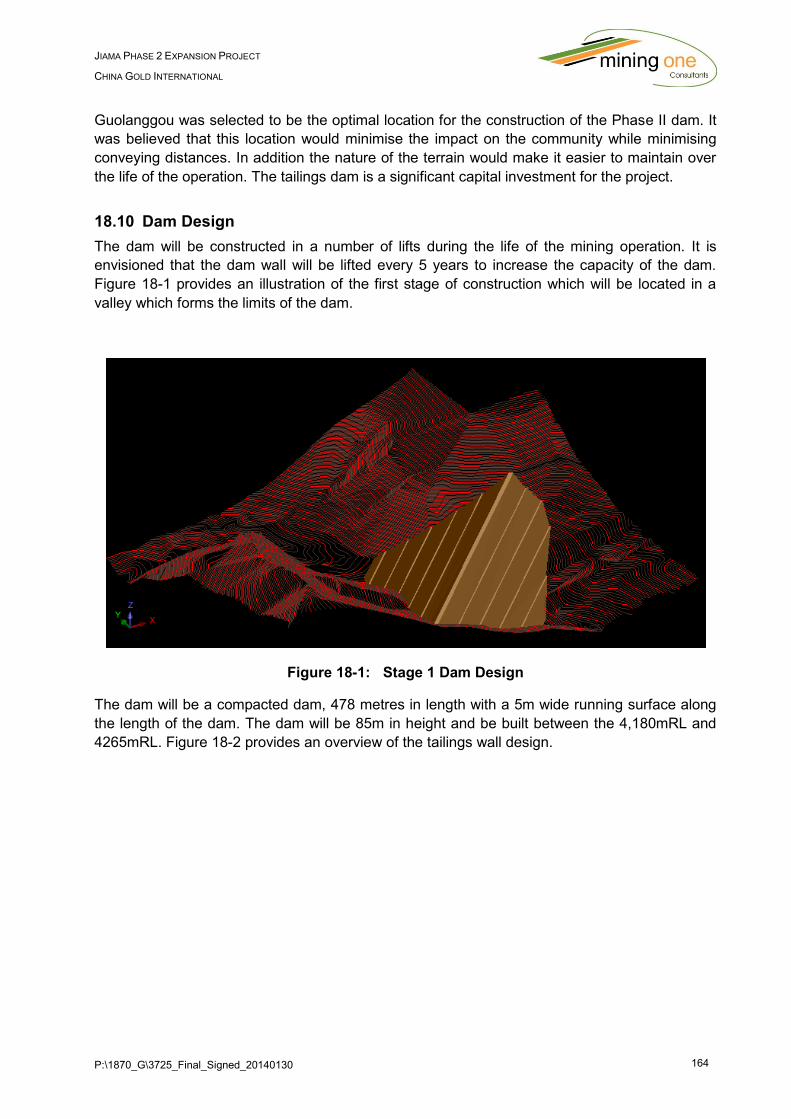
P:\1870_G\3725_Final_Signed_20140130 164
JIAMA PHASE 2 EXPANSION PROJECT
CHINA GOLD INTERNATIONAL
Guolanggou was selected to be the optimal location for the construction of the Phase II dam. It
was believed that this location would minimise the impact on the community while minimising
conveying distances. In addition the nature of the terrain would make it easier to maintain over
the life of the operation. The tailings dam is a significant capital investment for the project.
18.10 Dam Design
The dam will be constructed in a number of lifts during the life of the mining operation. It is
envisioned that the dam wall will be lifted every 5 years to increase the capacity of the dam.
Figure 18-1 provides an illustration of the first stage of construction which will be located in a
valley which forms the limits of the dam.
Figure 18-1: Stage 1 Dam Design
The dam will be a compacted dam, 478 metres in length with a 5m wide running surface along
the length of the dam. The dam will be 85m in height and be built between the 4,180mRL and
4265mRL. Figure 18-2 provides an overview of the tailings wall design.
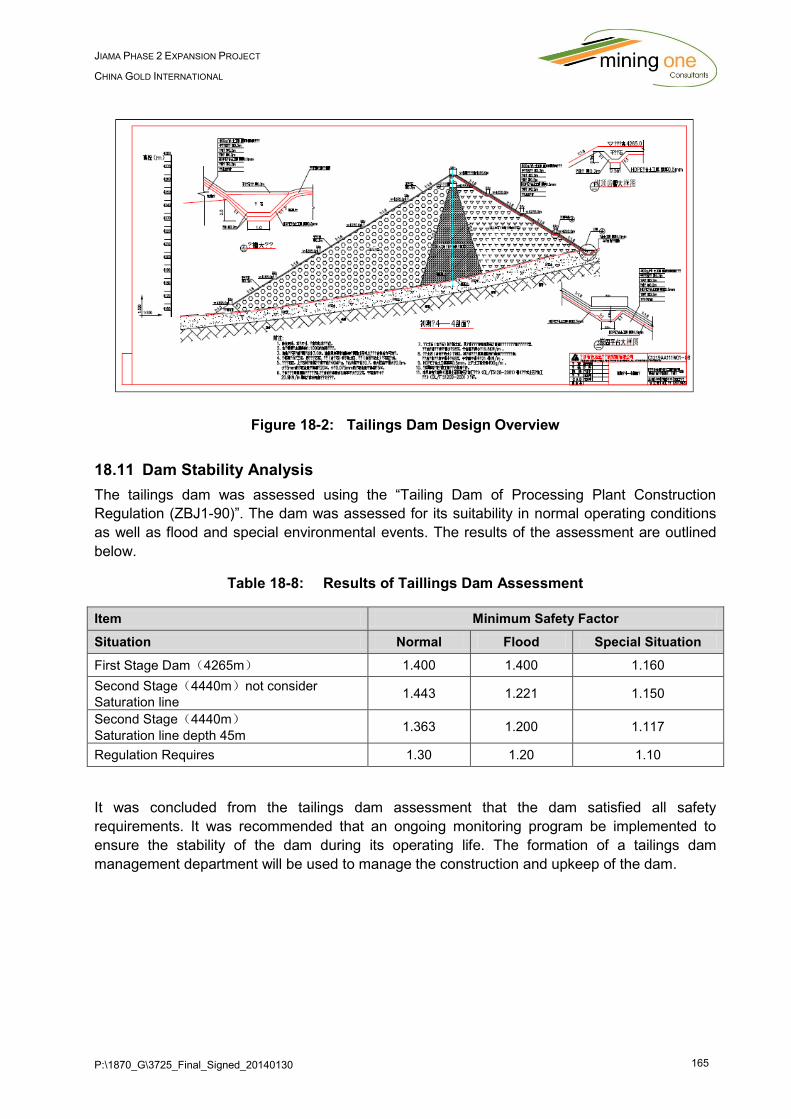
P:\1870_G\3725_Final_Signed_20140130 165
JIAMA PHASE 2 EXPANSION PROJECT
CHINA GOLD INTERNATIONAL
Figure 18-2: Tailings Dam Design Overview
18.11 Dam Stability Analysis
The tailings dam was assessed using the “Tailing Dam of Processing Plant Construction
Regulation (ZBJ1-90)”. The dam was assessed for its suitability in normal operating conditions
as well as flood and special environmental events. The results of the assessment are outlined
below.
Table 18-8: Results of Taillings Dam Assessment
Item Minimum Safety Factor
Situation Normal Flood Special Situation
First Stage Dam(4265m) 1.400 1.400 1.160
Second Stage(4440m)not consider
Saturation line 1.443 1.221 1.150
Second Stage(4440m)
Saturation line depth 45m 1.363 1.200 1.117
Regulation Requires 1.30 1.20 1.10
It was concluded from the tailings dam assessment that the dam satisfied all safety
requirements. It was recommended that an ongoing monitoring program be implemented to
ensure the stability of the dam during its operating life. The formation of a tailings dam
management department will be used to manage the construction and upkeep of the dam.
P:\1870_G\3725_Final_Signed_20140130 166
JIAMA PHASE 2 EXPANSION PROJECT
CHINA GOLD INTERNATIONAL
19 MARKET STUDIES AND CONTRACTS
19.1 Introduction
Previous market studies provided by China Gold has been updated. These previous studies
were conducted by the CGDI and Minarco-MineConsult. The following reports were used as a
base case and updated with the current market conditions:
Changchun Gold Design Institute – Preliminary Design Report (December 2012) – “the
CGDI Report (2011) – “the CGDI Report (2012)”;
Minarco MineConsult – Jiama Copper-Polymetalic Project – Pre-Feasibility Study
Technical Report (November 2012) – “the MMC Report (2012)”;
Changchun Gold Design Institute - Feasibility Study for the Phase II Expansion Project
(2011) – “the CGDI Report (2011).
19.2 Copper
Copper is used in many industries such as power, mechanical manufacturing, construction and
defence. It is only preceded by aluminium in the consumption of non-ferrous materials in China.
Copper consumption is the greatest in the electrical and electronics industry - accounting for
over half of the total consumption. It is used in the manufacturing of cables, wires, motors,
transformers, switches and printed circuit boards. Copper has numerous applications in a
number of industries including:
In machinery and transport vehicle manufacturing, copper is used for industrial valves and
fittings, instrumentations, plain journal bearings, moulds, heat exchangers and pumps,
etc;
In the chemical industry, copper is widely used in the production of items such as vacuum
apparatus, column boilers and brew kettles;
In the defence industry, copper is used to manufacture items such as bullets, cannon
balls, firearm parts; and
In the building industry, copper is used to produce a variety of channels, pipe fittings,
decorative devices.
19.2.1 Forecast of Copper Supply and Demand
19.2.1.1 Analysis of Supply-Demand Relationship in International Market
In recent decades, the global output of copper has been constantly increasing. Global copper
production in 2012 was 16,700 kt, an increase of 3.9% compared with the previous year
(International Copper Study Group, 2013b)
Based on the International Copper Study Group (ICSG) projections, copper productions will
increase gradually in 2013 and 2014 due to production from new operations and expansions of
existing facilities. It has been predicted that world mine production will grow by 5.5% per annum,
leading to an output of 17.6 Mt and 18.5 Mt in 2013 and 2014 respectively (International Copper
Study Group, 2013a).
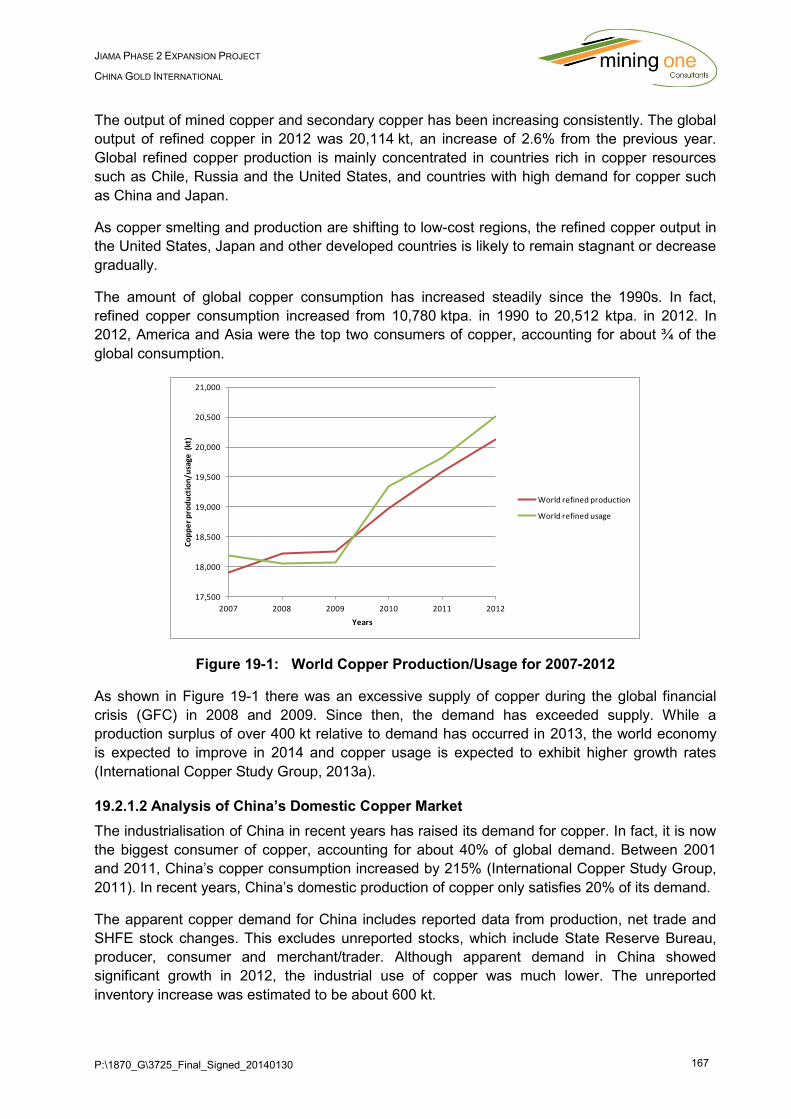
P:\1870_G\3725_Final_Signed_20140130 167
JIAMA PHASE 2 EXPANSION PROJECT
CHINA GOLD INTERNATIONAL
The output of mined copper and secondary copper has been increasing consistently. The global
output of refined copper in 2012 was 20,114 kt, an increase of 2.6% from the previous year.
Global refined copper production is mainly concentrated in countries rich in copper resources
such as Chile, Russia and the United States, and countries with high demand for copper such
as China and Japan.
As copper smelting and production are shifting to low-cost regions, the refined copper output in
the United States, Japan and other developed countries is likely to remain stagnant or decrease
gradually.
The amount of global copper consumption has increased steadily since the 1990s. In fact,
refined copper consumption increased from 10,780 ktpa. in 1990 to 20,512 ktpa. in 2012. In
2012, America and Asia were the top two consumers of copper, accounting for about ¾ of the
global consumption.
Figure 19-1: World Copper Production/Usage for 2007-2012
As shown in Figure 19-1 there was an excessive supply of copper during the global financial
crisis (GFC) in 2008 and 2009. Since then, the demand has exceeded supply. While a
production surplus of over 400 kt relative to demand has occurred in 2013, the world economy
is expected to improve in 2014 and copper usage is expected to exhibit higher growth rates
(International Copper Study Group, 2013a).
19.2.1.2 Analysis of China’s Domestic Copper Market
The industrialisation of China in recent years has raised its demand for copper. In fact, it is now
the biggest consumer of copper, accounting for about 40% of global demand. Between 2001
and 2011, China’s copper consumption increased by 215% (International Copper Study Group,
2011). In recent years, China’s domestic production of copper only satisfies 20% of its demand.
The apparent copper demand for China includes reported data from production, net trade and
SHFE stock changes. This excludes unreported stocks, which include State Reserve Bureau,
producer, consumer and merchant/trader. Although apparent demand in China showed
significant growth in 2012, the industrial use of copper was much lower. The unreported
inventory increase was estimated to be about 600 kt.
17,500
18,000
18,500
19,000
19,500
20,000
20,500
21,000
2007 2008 2009 2010 2011 2012
Co
pp
er
pro
du
ctio
n/u
sage
(kt
)
Years
World refined production
World refined usage
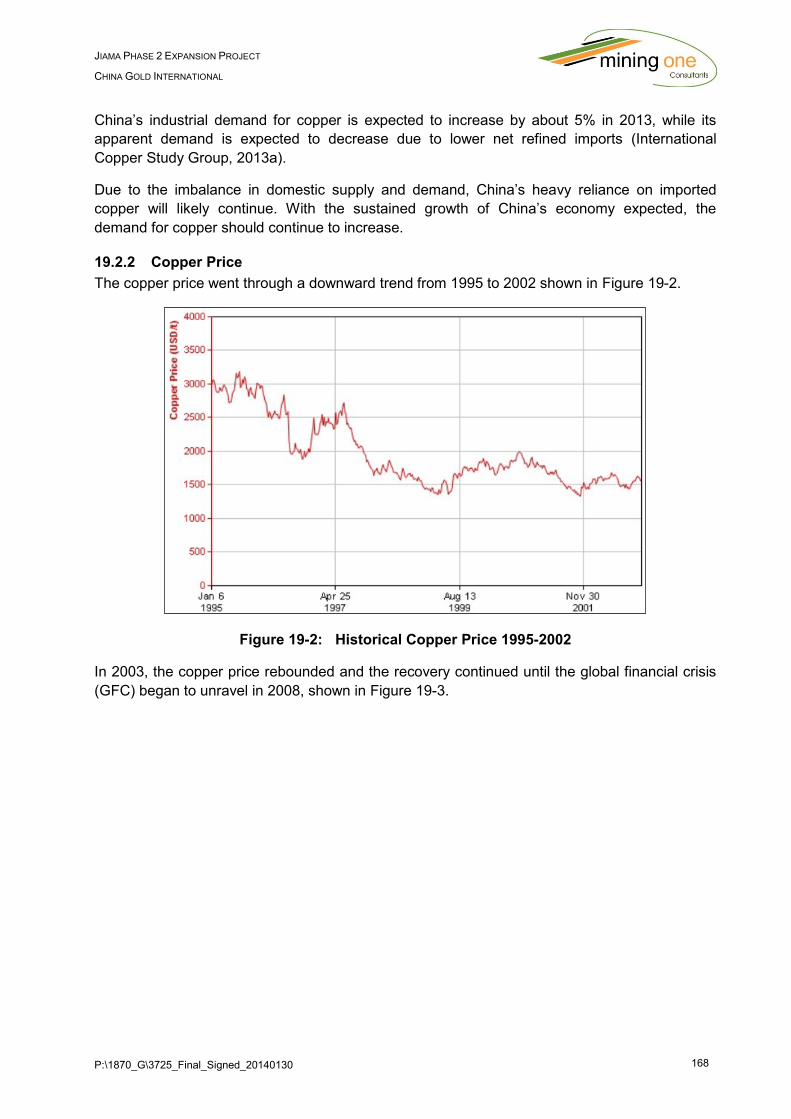
P:\1870_G\3725_Final_Signed_20140130 168
JIAMA PHASE 2 EXPANSION PROJECT
CHINA GOLD INTERNATIONAL
China’s industrial demand for copper is expected to increase by about 5% in 2013, while its
apparent demand is expected to decrease due to lower net refined imports (International
Copper Study Group, 2013a).
Due to the imbalance in domestic supply and demand, China’s heavy reliance on imported
copper will likely continue. With the sustained growth of China’s economy expected, the
demand for copper should continue to increase.
19.2.2 Copper Price
The copper price went through a downward trend from 1995 to 2002 shown in Figure 19-2.
Figure 19-2: Historical Copper Price 1995-2002
In 2003, the copper price rebounded and the recovery continued until the global financial crisis
(GFC) began to unravel in 2008, shown in Figure 19-3.
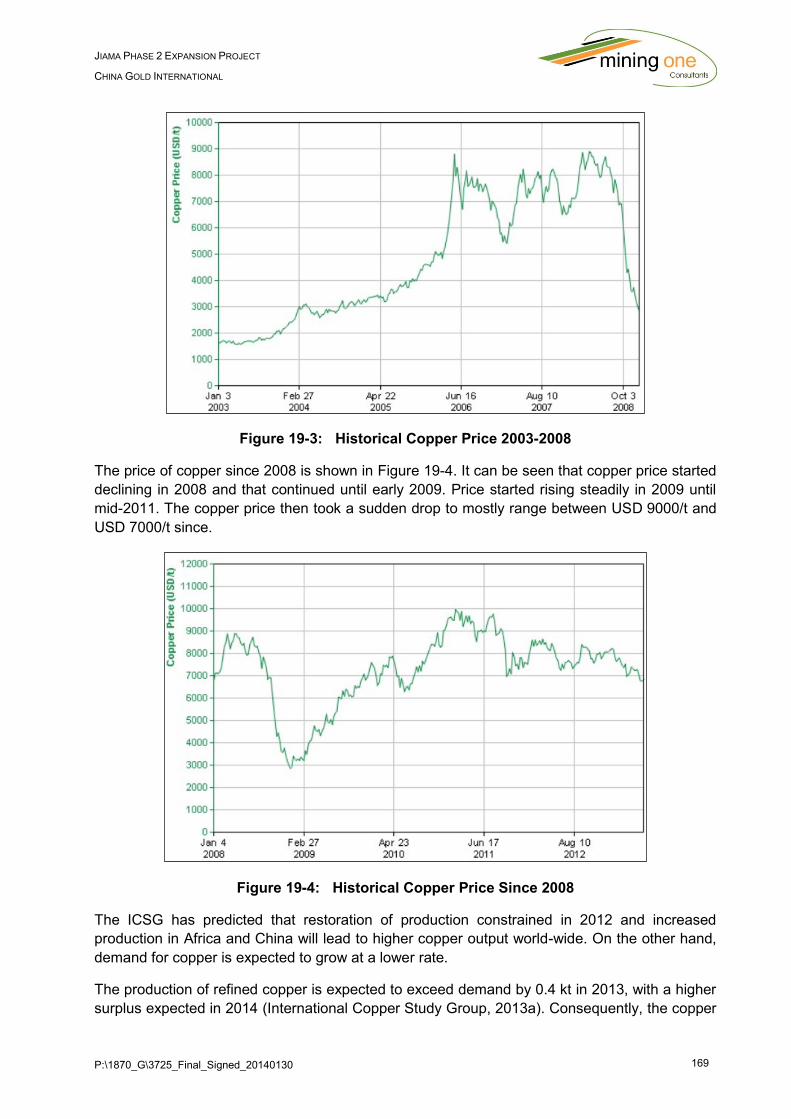
P:\1870_G\3725_Final_Signed_20140130 169
JIAMA PHASE 2 EXPANSION PROJECT
CHINA GOLD INTERNATIONAL
Figure 19-3: Historical Copper Price 2003-2008
The price of copper since 2008 is shown in Figure 19-4. It can be seen that copper price started
declining in 2008 and that continued until early 2009. Price started rising steadily in 2009 until
mid-2011. The copper price then took a sudden drop to mostly range between USD 9000/t and
USD 7000/t since.
Figure 19-4: Historical Copper Price Since 2008
The ICSG has predicted that restoration of production constrained in 2012 and increased
production in Africa and China will lead to higher copper output world-wide. On the other hand,
demand for copper is expected to grow at a lower rate.
The production of refined copper is expected to exceed demand by 0.4 kt in 2013, with a higher
surplus expected in 2014 (International Copper Study Group, 2013a). Consequently, the copper

P:\1870_G\3725_Final_Signed_20140130 170
JIAMA PHASE 2 EXPANSION PROJECT
CHINA GOLD INTERNATIONAL
price is unlikely to increase dramatically in the near future. However, there is potential for higher
copper price with improved global growth rates expected in 2014. With this in mind, the long-
term forecast copper price of USD 6,393.40/t is deemed reasonable. This value will continue to
be used in the economic analysis in this report.
19.3 Molybdenum
19.3.1 Usage of Molybdenum
Molybdenum has very high melting temperature, high thermal conductivity and low thermal
expansion compared with other engineering materials. When added to steel and cast iron,
molybdenum improves their strength, hardenability, weld-ability, toughness and corrosion
resistance (International Molybdenum Association, 2013). Molybdenum is widely used in steel,
chemicals, military equipment, electronics, biomedicine and agriculture. Molybdenum can also
be applied as an additive in refining alloy steel, stainless steel, heat-resistant steel, chisel tool
steel, cast iron, mill roll, super alloy and non-ferrous metals, etc. It assists in improving heat
resistance, abrasion resistance and impact resistance of metal.
In addition to this, molybdenum compounds, such as molybdenum trioxide, sodium molybdate
dehydrate, ammonium molybdate and alkyl ammonium molybdate can be used as catalysts in
the chemical industry. Some molybdenum compounds can be applied to pigments, dyes and
paints, and additives for fertilizer and vitamin.
Pure molybdenum disulphide, a premium lubricant, is used for lubricating automotive, turbine
and other heavy machinery.
19.3.2 Supply-Demand Situation in Molybdenum Market
19.3.1.1 International Molybdenum Supply-Demand Situation
Molybdenum is mainly sourced from single molybdenum and molybdenum concentrate, which is
a by-product of copper ore. Most of the world’s molybdenum is mined from the three countries
with the largest molybdenum reserves: China, the United States and Chile. Top 10 molybdenum
producers account for about 2/3 of the world’s output. The U.S. Freeport was the largest
molybdenum producer in 2012, followed by Chile’s Codelco and GMexico (International
Molybdenum Association, 2013).
From 1999 to 2003, global molybdenum output maintained at about 130 kt. Since 2003, strong
demand in steel and rising molybdenum metal price caused large increase in global
molybdenum output. The ultimate production was 143 kt in 2002, rising to 229 kt in 2012, which
equates to an average annual growth rate of 4.8%.
The world's largest regional consumers of molybdenum are China, Europe, the United States
and Japan. The increased demand in molybdenum from 2002 to 2007 led to a supply shortage
in the molybdenum market. Figure 19-5 classifies molybdenum production by region in more
recent years. It can be seen that production was affected by the GFC and dipped in 2009;
however, it has recovered steadily since then. Although production from North America and
South America has dropped off slightly in 2012, it has been offset by a substantial increase in
Chinese production. Figure 19-6 shows molybdenum demand of the major consuming
countries/regions in the years 2008-2012. With the exception of China, consumption in all major
countries reduced in 2009. From 2009 to 2011, the consumption of molybdenum has increased

P:\1870_G\3725_Final_Signed_20140130 171
JIAMA PHASE 2 EXPANSION PROJECT
CHINA GOLD INTERNATIONAL
steadily for all regions. In 2012, consumption eased off a little in the United States and Europe,
while demand in China and Japan still improved slightly compared to the previous year.
Figure 19-5: Molybdenum Production by Region
(International Molybdenum Association, 2013)
Figure 19-6: Molybdenum Demand of Major Consuming Countries/Regions
(International Molybdenum Association, 2013)
19.3.1.2 Supply and Demand of Molybdenum in China
Molybdenum concentrate output from China was 683 t in 1950, and the molybdenum
concentrate was mainly produced from Liaoning, accounting for 99% of the total production.
The production of molybdenum broke through 10,000 t in 1959 and production levels ranged
between 10,000 t and 20,000 t until 1985. Since the mid-1990s, China’s mining and processing
of molybdenum has developed rapidly and is now the world's largest producer.
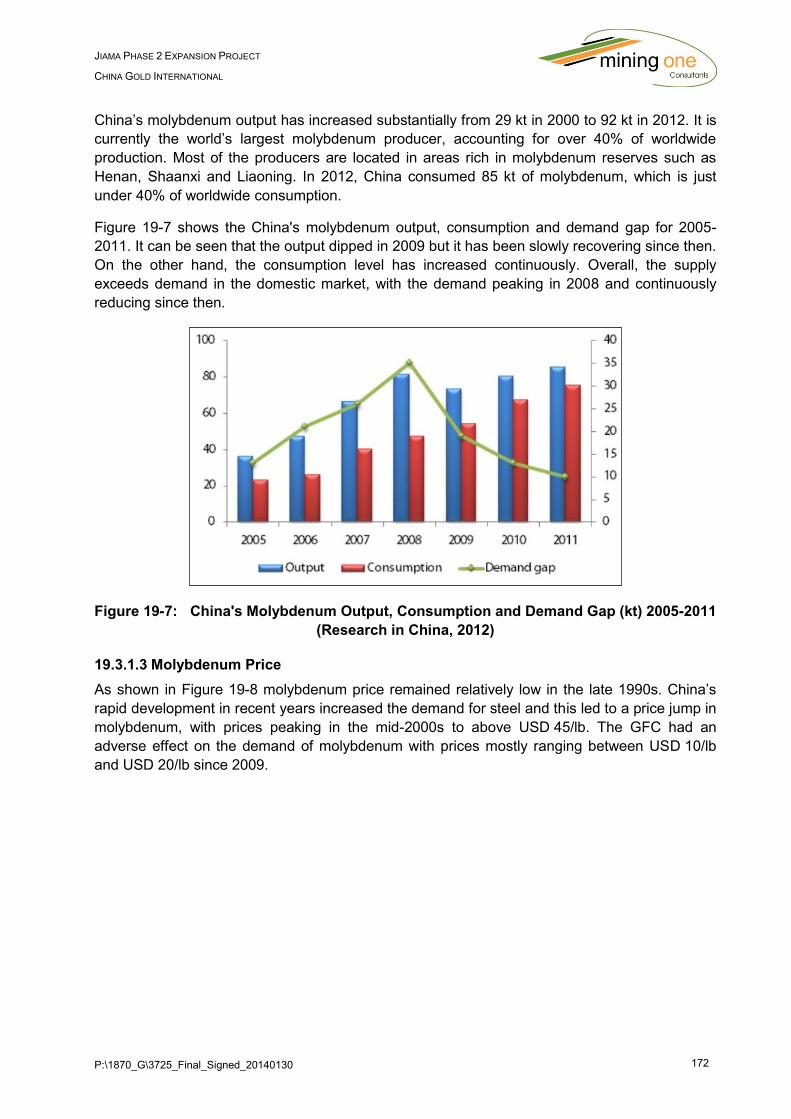
P:\1870_G\3725_Final_Signed_20140130 172
JIAMA PHASE 2 EXPANSION PROJECT
CHINA GOLD INTERNATIONAL
China’s molybdenum output has increased substantially from 29 kt in 2000 to 92 kt in 2012. It is
currently the world’s largest molybdenum producer, accounting for over 40% of worldwide
production. Most of the producers are located in areas rich in molybdenum reserves such as
Henan, Shaanxi and Liaoning. In 2012, China consumed 85 kt of molybdenum, which is just
under 40% of worldwide consumption.
Figure 19-7 shows the China's molybdenum output, consumption and demand gap for 2005-
2011. It can be seen that the output dipped in 2009 but it has been slowly recovering since then.
On the other hand, the consumption level has increased continuously. Overall, the supply
exceeds demand in the domestic market, with the demand peaking in 2008 and continuously
reducing since then.
Figure 19-7: China's Molybdenum Output, Consumption and Demand Gap (kt) 2005-2011
(Research in China, 2012)
19.3.1.3 Molybdenum Price
As shown in Figure 19-8 molybdenum price remained relatively low in the late 1990s. China’s
rapid development in recent years increased the demand for steel and this led to a price jump in
molybdenum, with prices peaking in the mid-2000s to above USD 45/lb. The GFC had an
adverse effect on the demand of molybdenum with prices mostly ranging between USD 10/lb
and USD 20/lb since 2009.
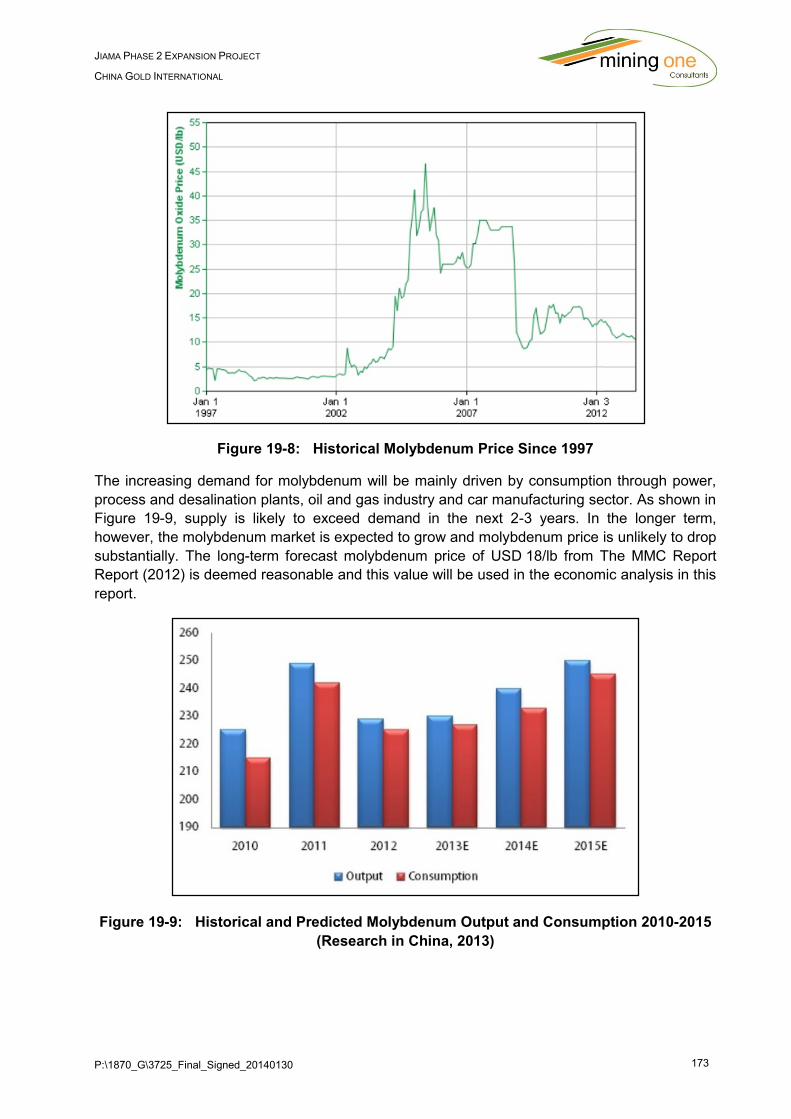
P:\1870_G\3725_Final_Signed_20140130 173
JIAMA PHASE 2 EXPANSION PROJECT
CHINA GOLD INTERNATIONAL
Figure 19-8: Historical Molybdenum Price Since 1997
The increasing demand for molybdenum will be mainly driven by consumption through power,
process and desalination plants, oil and gas industry and car manufacturing sector. As shown in
Figure 19-9, supply is likely to exceed demand in the next 2-3 years. In the longer term,
however, the molybdenum market is expected to grow and molybdenum price is unlikely to drop
substantially. The long-term forecast molybdenum price of USD 18/lb from The MMC Report
Report (2012) is deemed reasonable and this value will be used in the economic analysis in this
report.
Figure 19-9: Historical and Predicted Molybdenum Output and Consumption 2010-2015
(Research in China, 2013)
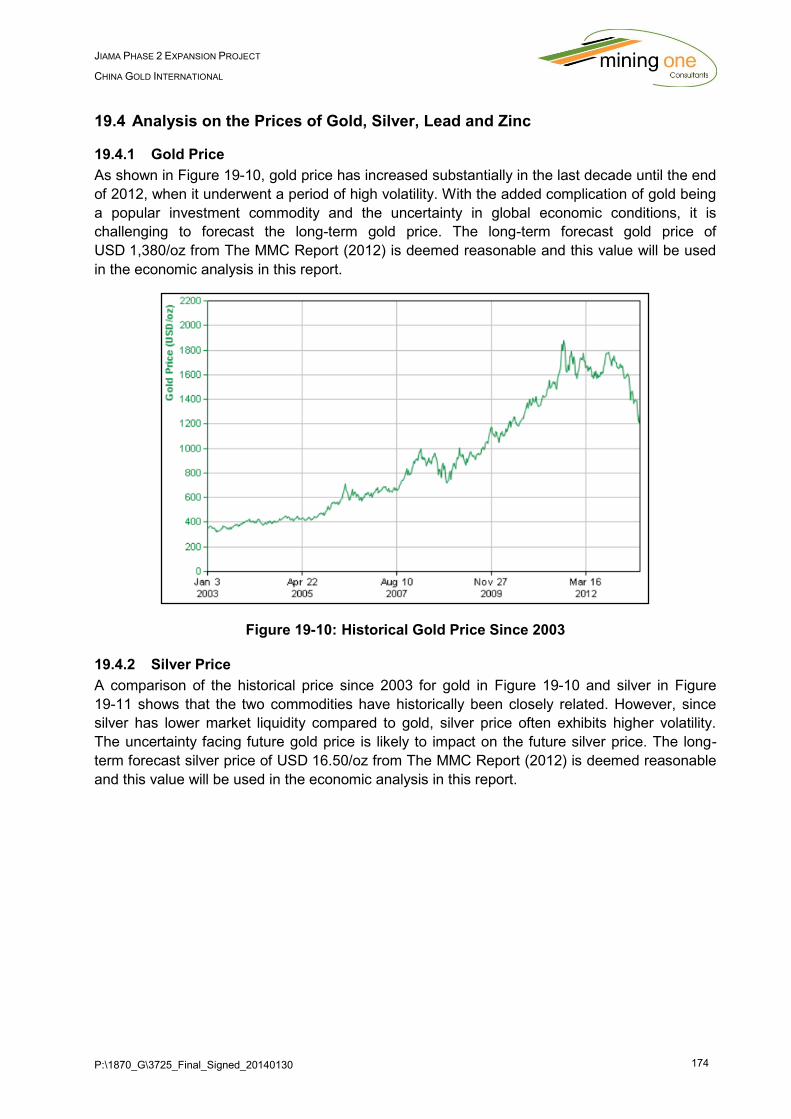
P:\1870_G\3725_Final_Signed_20140130 174
JIAMA PHASE 2 EXPANSION PROJECT
CHINA GOLD INTERNATIONAL
19.4 Analysis on the Prices of Gold, Silver, Lead and Zinc
19.4.1 Gold Price
As shown in Figure 19-10, gold price has increased substantially in the last decade until the end
of 2012, when it underwent a period of high volatility. With the added complication of gold being
a popular investment commodity and the uncertainty in global economic conditions, it is
challenging to forecast the long-term gold price. The long-term forecast gold price of
USD 1,380/oz from The MMC Report (2012) is deemed reasonable and this value will be used
in the economic analysis in this report.
Figure 19-10: Historical Gold Price Since 2003
19.4.2 Silver Price
A comparison of the historical price since 2003 for gold in Figure 19-10 and silver in Figure
19-11 shows that the two commodities have historically been closely related. However, since
silver has lower market liquidity compared to gold, silver price often exhibits higher volatility.
The uncertainty facing future gold price is likely to impact on the future silver price. The long-
term forecast silver price of USD 16.50/oz from The MMC Report (2012) is deemed reasonable
and this value will be used in the economic analysis in this report.
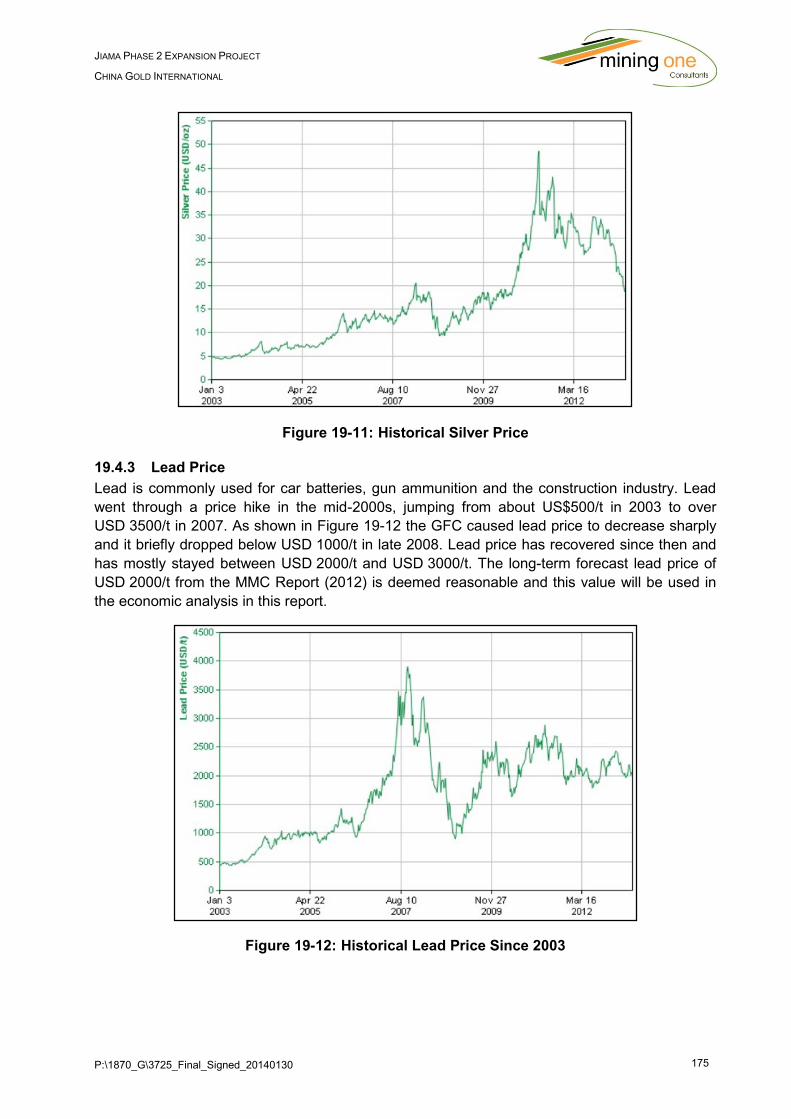
P:\1870_G\3725_Final_Signed_20140130 175
JIAMA PHASE 2 EXPANSION PROJECT
CHINA GOLD INTERNATIONAL
Figure 19-11: Historical Silver Price
19.4.3 Lead Price
Lead is commonly used for car batteries, gun ammunition and the construction industry. Lead
went through a price hike in the mid-2000s, jumping from about US$500/t in 2003 to over
USD 3500/t in 2007. As shown in Figure 19-12 the GFC caused lead price to decrease sharply
and it briefly dropped below USD 1000/t in late 2008. Lead price has recovered since then and
has mostly stayed between USD 2000/t and USD 3000/t. The long-term forecast lead price of
USD 2000/t from the MMC Report (2012) is deemed reasonable and this value will be used in
the economic analysis in this report.
Figure 19-12: Historical Lead Price Since 2003
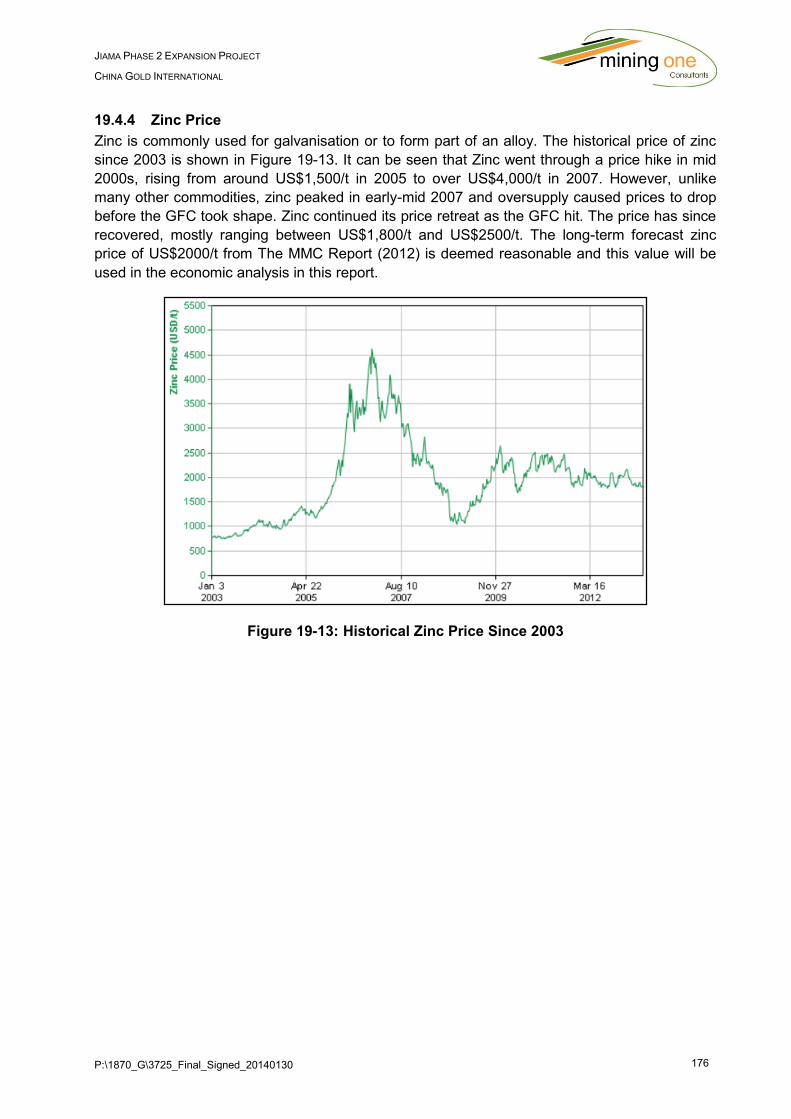
P:\1870_G\3725_Final_Signed_20140130 176
JIAMA PHASE 2 EXPANSION PROJECT
CHINA GOLD INTERNATIONAL
19.4.4 Zinc Price
Zinc is commonly used for galvanisation or to form part of an alloy. The historical price of zinc
since 2003 is shown in Figure 19-13. It can be seen that Zinc went through a price hike in mid
2000s, rising from around US$1,500/t in 2005 to over US$4,000/t in 2007. However, unlike
many other commodities, zinc peaked in early-mid 2007 and oversupply caused prices to drop
before the GFC took shape. Zinc continued its price retreat as the GFC hit. The price has since
recovered, mostly ranging between US$1,800/t and US$2500/t. The long-term forecast zinc
price of US$2000/t from The MMC Report (2012) is deemed reasonable and this value will be
used in the economic analysis in this report.
Figure 19-13: Historical Zinc Price Since 2003
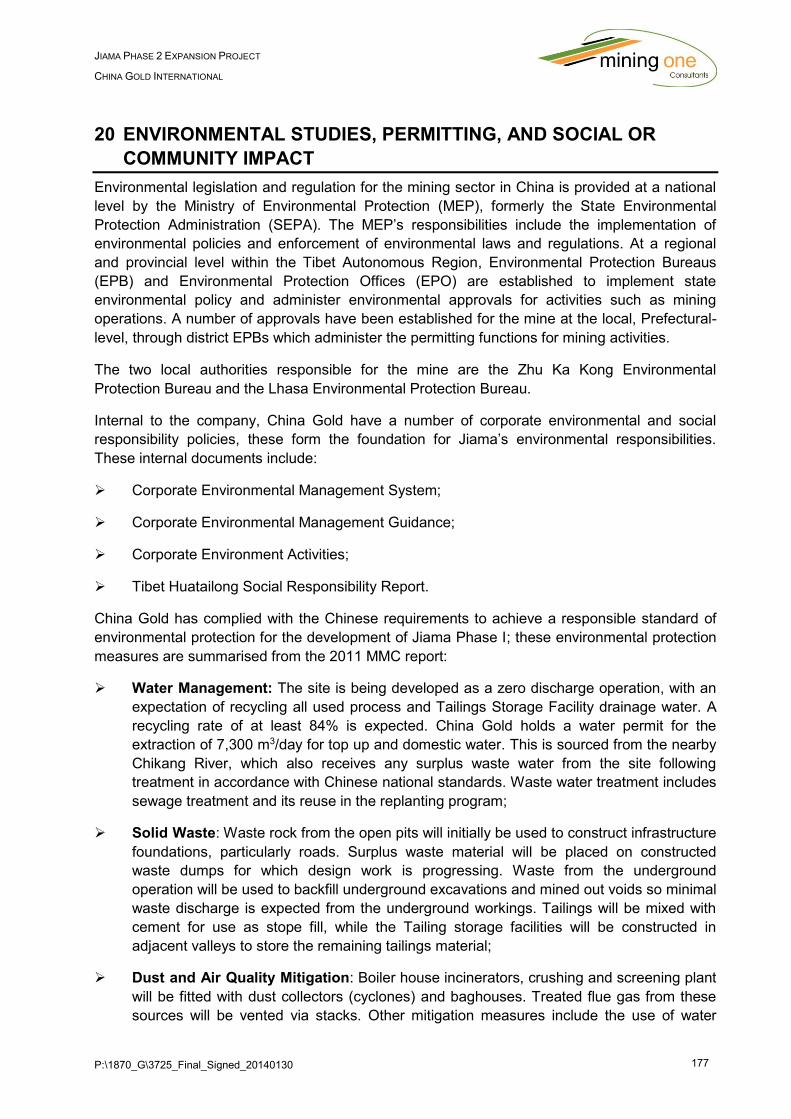
P:\1870_G\3725_Final_Signed_20140130 177
JIAMA PHASE 2 EXPANSION PROJECT
CHINA GOLD INTERNATIONAL
20 ENVIRONMENTAL STUDIES, PERMITTING, AND SOCIAL OR
COMMUNITY IMPACT
Environmental legislation and regulation for the mining sector in China is provided at a national
level by the Ministry of Environmental Protection (MEP), formerly the State Environmental
Protection Administration (SEPA). The MEP’s responsibilities include the implementation of
environmental policies and enforcement of environmental laws and regulations. At a regional
and provincial level within the Tibet Autonomous Region, Environmental Protection Bureaus
(EPB) and Environmental Protection Offices (EPO) are established to implement state
environmental policy and administer environmental approvals for activities such as mining
operations. A number of approvals have been established for the mine at the local, Prefectural-
level, through district EPBs which administer the permitting functions for mining activities.
The two local authorities responsible for the mine are the Zhu Ka Kong Environmental
Protection Bureau and the Lhasa Environmental Protection Bureau.
Internal to the company, China Gold have a number of corporate environmental and social
responsibility policies, these form the foundation for Jiama’s environmental responsibilities.
These internal documents include:
Corporate Environmental Management System;
Corporate Environmental Management Guidance;
Corporate Environment Activities;
Tibet Huatailong Social Responsibility Report.
China Gold has complied with the Chinese requirements to achieve a responsible standard of
environmental protection for the development of Jiama Phase I; these environmental protection
measures are summarised from the 2011 MMC report:
Water Management: The site is being developed as a zero discharge operation, with an
expectation of recycling all used process and Tailings Storage Facility drainage water. A
recycling rate of at least 84% is expected. China Gold holds a water permit for the
extraction of 7,300 m3/day for top up and domestic water. This is sourced from the nearby
Chikang River, which also receives any surplus waste water from the site following
treatment in accordance with Chinese national standards. Waste water treatment includes
sewage treatment and its reuse in the replanting program;
Solid Waste: Waste rock from the open pits will initially be used to construct infrastructure
foundations, particularly roads. Surplus waste material will be placed on constructed
waste dumps for which design work is progressing. Waste from the underground
operation will be used to backfill underground excavations and mined out voids so minimal
waste discharge is expected from the underground workings. Tailings will be mixed with
cement for use as stope fill, while the Tailing storage facilities will be constructed in
adjacent valleys to store the remaining tailings material;
Dust and Air Quality Mitigation: Boiler house incinerators, crushing and screening plant
will be fitted with dust collectors (cyclones) and baghouses. Treated flue gas from these
sources will be vented via stacks. Other mitigation measures include the use of water
P:\1870_G\3725_Final_Signed_20140130 178
JIAMA PHASE 2 EXPANSION PROJECT
CHINA GOLD INTERNATIONAL
sprays, including water trucks in the mining circuit. The construction of paved or watered
roads to reduce dust generated from transport activities, and enclosure of dusty activities
where possible. Personal protection devices will be issued to workers to provide personal
protection from dust and air quality exposures;
Noise Control: Includes the use of silencers, noise and vibration dampening on mobile
equipment, enclosure of noisy equipment, use of insulation, and regular equipment
maintenance. Company policy requires PPE use, such as ear muffs or ear plugs, for
noise-affected workers;
Environmental Monitoring: A comprehensive air, water and a climatic monitoring plan is
to be implemented, with analytical results complying with Chinese National Standards;
Rehabilitation: China Gold has advised that a mine closure plan has been produced and
approved as part of the Soil and Water Conservation Plan. The plan will be updated as
the operation evolves;
20.1 Environmental Approvals
The Tibet Autonomous Region Environmental Protection Bureau (EPB) and the two prefectural
EPBs (Zhu Ka Kong and Lhasa) have jointly issued a number of approvals for mining activities.
These approvals contain a number of conditions that must be adhered to during the operation of
the mine and include a specification to deliver environmental targets and objectives, these
documents are task specific. Over the past two years China Gold has had to obtain a significant
number of approvals for work on the Phase I expansion. Examples of recent approvals
completed during 2011/12 include:
Approval for Environmental Impact Report on Dangerous Goods Warehouse;
Approval for Environmental Impact Report on Niumatang Open Pit Mining;
Approval for Environmental Impact Report on the periphery of Jiama Mine Site Detailed
Environmental Investigation;
Approval for Environmental Impact Report on Industrial Laboratory Plant;
Approval for Environmental Impact Review Report on the completion of Niumatang Open
Pit Section; and
Approval for Environmental Impact Review Report on the completion of the Industrial
Laboratory Plant.
Conditions within the approvals relate to various requirements which include the completion of
additional reports and studies, specific actions and improvements, and duties to be completed
by the mine environmental department.
It is likely that many more approvals, permits and licences exist, however the details of which
have not been made available for review. Documentation demonstrating the level of compliance
with the conditions contained in such approvals and measuring the effectiveness of actions
required by the authorities was not sighted however the framework is in place.

P:\1870_G\3725_Final_Signed_20140130 179
JIAMA PHASE 2 EXPANSION PROJECT
CHINA GOLD INTERNATIONAL
20.2 Corporate Policy
China Gold’s corporate environmental policy documents have the over-arching objective of
ensuring the protection of the environment and to enhancing the corporate culture of
environmental protection. This includes instruction to strictly obey the environmental laws and
regulations, implement Health, Safety and Environment systems, create an energy saving
environment for China Gold companies and achieve sustainable development.
Evidence demonstrating how the successful implementation of corporate environmental and
social policies are monitored, and targets met has not been provided for in this study. It is likely
that other intermediate documents within the mine environmental management department exist
which have not been provided. The Mine Environmental Management Plan (EMP) is the key
document that was requested however was not provided. It must be noted that China presents
a very different landscape to other mining countries with respect to environmental and corporate
policies. It should be noted that Jiama Phase I has been operating for three years without
environmental driven intervention providing some indication that the environmental practices at
site are meeting local regulatory requirements.
The Corporate Environmental Management System (EMS) serves to strengthen the
environmental protection system, environmental management and monitoring activities. The
principals of the EMS are:
To strictly obey the environmental laws and regulations;
Implement the Health, Safety and Environment system;
Create an energy saving environment for China Gold companies and achieve sustainable
development.
In the long term, environmental protection is to be incorporated as part of the corporate culture.
Short, medium and long term environmental protection plans are required to be made. A
number of requirements have been identified to achieve the delivery of the corporate EMS
objectives which include:
Implementation of a reduction in polluted discharge as part of the yearly plan;
Establishment of an environmental protection responsibility system and include it as
criteria for quality assessment;
Establishment of a comprehensive environmental protection structure and internal
environmental management system;
Establishment of an environmental monitoring system with professional personnel and
monitoring equipment along with a system for the collection of accurate environmental
information;
Management to be familiar with all environmental regulations and standards and
personnel trained in environmental protection activities;
Establishment of contingency plans to prevent pollution incidents;
Ensure targets for discharging waste water and emissions to atmosphere are met;
P:\1870_G\3725_Final_Signed_20140130 180
JIAMA PHASE 2 EXPANSION PROJECT
CHINA GOLD INTERNATIONAL
Sources of pollution must be identified and pollution treatment process plans devised with
assigned responsibilities.
The EMS also contains the following instructions for all companies to:
Implement the environmental management and responsibility system;
Establish an internal management system, including accounts, database and other related
information;
Each project must include environmental control and include environmental evaluation as
a key criterion, to achieve sustainable development;
Implement environmental training for its personnel. The training will also assist personnel
improve their environmental awareness and skills in controlling and preventing pollution;
Environmental risk control must be implemented at tailing storages, waste dumps, cyanide
storage, etc, with regular maintenance and inspections to prevent any environmental
accidents;
Emergency drills must be practiced regularly.
Documents such as Mine Environmental Reviews and Audits demonstrating how the mine
responds to these requirements were not sighted.
20.3 Corporate Guidance
China Gold Corporate Environmental Management Guidance contains guidance on
environmental management for subsidiary companies. This guidance reiterates the principles of
the EMS, sets out objectives and details specific actions required.
Objectives set out in the guidance include:
Environmental management organisation system and responsibilities;
Studies to be carried out for specific environmental problems;
Inspections to be carried out regarding pollution and management;
Establishment of monitoring systems and collection of data regarding the environment;
Submission of monitoring reports;
Ensuring the function of equipment intended to prevent pollution;
Inclusion of environmental criteria in personnel award systems;
Establishment of a comprehensive set of management standards, including:
- Corporate environmental planning;
- Company pollution reduction plan;
P:\1870_G\3725_Final_Signed_20140130 181
JIAMA PHASE 2 EXPANSION PROJECT
CHINA GOLD INTERNATIONAL
- Corporate environmental standards, including detailed responsibilities, reporting
standards, environmental monitoring standards, tailing dam management standards,
hazard management and environmental training standards;
- Equipment management and maintenance systems;
- Supervision standards including equipment operation and inspection standards;
- Contingency plans including risk management, contingency plan reporting and
emergency drills;
- Personnel standards.
Establishment of a comprehensive records and information database to include:
- Environmental impact documents and approvals;
- Responsibility and management standards;
- Pollution treatment design, construction logs and approvals;
- Corporate environmental quality assurance;
- Pollution discharge totals and approval application forms;
- Daily logs and monitoring records;
- Waste water discharge monitoring equipment maintenance logs;
- Monitoring equipment analysis data and maintenance logs;
- Pollution discharge agreements and disposal of dangerous goods agreements;
- Company noise pollution, noise level and monitoring data;
- Contingency plans and emergency drill logs;
- Summary of environmental accidents;
- Safety maintenance and fire equipment maintenance log;
- Training record;
- Relevant laws, regulations and policies;
- Monitoring record prescribed under EIA; and
- Waste water network, waste water discharge plan and gas pollution plan;
Management and supervision responsibilities:
- Responsible persons including mine manager, managers and vice managers;
- Monitoring and guidance, including reports and database;
- Plans for pollution reduction;
P:\1870_G\3725_Final_Signed_20140130 182
JIAMA PHASE 2 EXPANSION PROJECT
CHINA GOLD INTERNATIONAL
- Setting up management standards;
- Set up organisational contingency plans regarding environmental disasters;
- Environmental budgets, environmental reviews, pollution treatment deadlines, etc;
- Establishing a responsibilities chart; and
- Technical responsibilities.
Within the guidance the following principal media are recognised:
- Polluted air;
- Waste water;
- Solid waste;
- Noise; and
- Eco system and soil erosion.
The guidance contains objectives for the improvement of environmental awareness
including:
- Incorporating environmental protection as part of technical training;
- Training for environment supervisors;
- Relevant knowledge for management, environment managers and technical
management.
Regular monitoring of the aforementioned principal media on site is evident in previous years
and this is expected to continue in the future.
20.4 Corporate Environmental Activities
The China Gold Corporate Environment Activities document outlines a set of Environmental
Protection Tasks. The China Gold Group companies recognise the development of resources
for environmental protection work. In the "Eleventh Five-Year Period” the following emphases
have been established:
Industrial wastewater COD levels;
Industrial air SO2 emissions;
Increase the value of energy consumption.
Main areas of work across all China Gold Group companies are identified as:
Implementation of the “Safety and Environmental Protection Greening and Beautifying
Project”;
Construction of “safe and harmonious environment-friendly green mines”;

P:\1870_G\3725_Final_Signed_20140130 183
JIAMA PHASE 2 EXPANSION PROJECT
CHINA GOLD INTERNATIONAL
Creation of a new situation of safety and environmental protection;
Dynamic risk management to ensure safe operation of the tailings facilities;
Improvement of the emergency response system and environmental emergency
management;
Strengthening the safety management of construction projects;
Implementing environmental organisation systems and monitoring systems;
Energy conservation;
Green landscaping; and
Land reclamation.
Several key projects are singled out for action including:
Gold industry heavy metal pollution emergency management pilot;
HSE management for the gold mining industry - heavy metal environmental emergency
management training; and
Safety and environmental protection cases at specific mines including the “Jiama Project
Green”.
20.5 Environmental Protection
It is stated in the Pre-Feasibility Study that “The Company complies with Chinese requirements
to achieve a responsible standard of environmental protection”. No environmental reviews have
been provided to this feasibility study to enable this statement to be verified.
The environmental protection measures for the Jiama mine site taken from the PFS, which have
not been verified here, include the following:
Water management. The mine operates to a target of zero discharge operation, with the
recycling of all used process and TSF drainage water. A recycling rate of at least 84% is
expected. Surplus treated waste water from the site is reused in the replanting program or
discharged to the Chikang River;
Water use. The Company holds a water permit for the extraction of 7,300 m3/day for top
up and domestic water, which is taken from the nearby Chikang River;
Solid waste. Waste rock is used to construct infrastructure foundations, particularly roads
with the surplus material placed on constructed waste dumps. Underground waste will be
mainly left underground or dumped into previously mine out voids;
Tailings management. Processed tailings are used as stope fill and surplus material
stored in adjacent valleys;
Air quality. Dusty activities are enclosed where possible with cyclone dust collectors and
baghouses operate in the boiler houses, incinerator, the crushing and screening plant,
and fine ore bin. Treated flue gas is vented via stacks. Dust mitigation measures
P:\1870_G\3725_Final_Signed_20140130 184
JIAMA PHASE 2 EXPANSION PROJECT
CHINA GOLD INTERNATIONAL
elsewhere include the use of water sprays and water trucks on paved roads to reduce
dust generated from mining and truck transport activities. Personal protection devices are
issued to workers to provide additional personal protection from dust; and
Noise. Silencers, noise and vibration dampening are used to reduce noise on mobile
equipment. Company policy requires appropriate PPE use for noise-affected workers.
The PFS also provides statements on the monitoring program and mine closure plan which
again are not verified here. These include:
A comprehensive air, water, and climatic monitoring plan is in place with data used to
build up an environmental baseline and contribute to the monitoring database. Analytical
results comply with Chinese national standards; and
A mine closure and rehabilitation plan has been produced and approved as part of the
Soil and Water Conservation Plan. The plan will be updated as the operation progresses
and expands.
20.6 Community and Social
Prior to the establishment of mining operations the area was used for low-intensity grazing of
yak and sheep with occasional scattered temporary shelters used by nomadic herdsmen and
subsistence farmers. The company has a policy of social responsibility towards the local
community, with a focus on providing assistance and contributing towards social and economic
development. This is achieved through financially supporting local business development,
education, employment, training initiatives, local transport, communications, drinking water
supply, and other initiatives.
Land was acquired for the mine site and associated infrastructure corridors in compliance with
PRC laws through both short-term and long-term leasing agreements, signed and approved by
local government authorities. Compensation for land and land use rights was paid under these
lease agreements in line with standard PRC guidelines. The community has, in general,
welcomed the opportunity for employment in the area and has participated in ongoing dialogue
with both the Company and the local government through the “Project Coordination and
Development Management Committee” concerning the development and operation of the mine,
potential environmental impacts and their management, and the scope and nature of community
benefits to be generated by the development.
20.6.1 Policies and Agreements
An agreement between the Tibet Huatailong Mining Development Co., Ltd. and the People's
Government of the Tibet Autonomous Region has been established to implement strategic
cooperation and co-ordinate resources for key projects aimed at fulfilling social responsibility
obligations. These projects cover areas that include:
Integration of tenements;
Geological exploration;
Production management;
Safety and environmental protection;
P:\1870_G\3725_Final_Signed_20140130 185
JIAMA PHASE 2 EXPANSION PROJECT
CHINA GOLD INTERNATIONAL
Green landscaping;
Building a harmonious enterprise culture; and
Effective promotion and stable development of the Jiama Mine.
The mine’s efforts to promote the fulfilment of its social responsibility includes the recognition
and support of all levels of government, the local people and the Ministry of Land and
Resources with an emphasis on harmonious labour relations, development of model business
enterprise, promotion of national ethnic unity and progression of activities to create a business
model. The mine aims to establish a good social image for the mining operations and to build a
harmonious mine that promotes the realisation of the enterprise model and sustainable
development.
To provide a good foundation for benefiting people’s livelihood, village based task forces have
been elected. These organisations work to improve the life of farmers and herdsmen through
practical projects to promote a harmonious co-existence with the mining operations.
The Jiama Industry and Trade Company was established in 2009 to develop the local economy
and co-ordinate investment in the village farming sector in areas such as engineering,
environmental protection and transportation. Examples of individual projects include the
establishment of greenhouses and the cultivation of vegetables, fruits and flowers,
The mine has established the construction of water control projects to reduce contamination
from acidic heavy metal rich waters and environmental management demonstration projects.
Practical projects include water treatment plants and sewage treatment facilities which benefit
downstream water quality objectives for crop irrigation.
To maintain the policy of promoting local labour employment the mine has training initiatives for
local young people and promotes the hiring of Tibetan college students.
The mine encourages educational activities that promote Tibetan culture and folk customs. A
comprehensive and in-depth understanding of the customs and habits of the Tibetan people in
all aspects of production, life, religion, is encouraged when dealing with local people so that all
employees respect local customs.
A culture of safe and civilised production management is strictly enforced with periodic safety
inspections and the implementation of a reward and punishment system. Staff safety
management concepts are backed up by safety training provided by international experts.
The mine has implemented a zero emission target for waste water through treatment and reuse.
This target plays a crucial role in the protection of Tibet’s water resources, the reduction of
water costs and reducing the impact of wastewater on groundwater.
The implementation of an afforestation project together with irrigation, water recycling and solar
heating initiatives are part of the overall beautification project for the construction of green
mines promoted by the company.
Other initiatives aimed at reducing poverty and benefiting the local population include:
Building of bridges and roads;
Donations to schools;
P:\1870_G\3725_Final_Signed_20140130 186
JIAMA PHASE 2 EXPANSION PROJECT
CHINA GOLD INTERNATIONAL
Gifts of school uniforms and bags;
Food donations to poor households;
Assistance with medical fees to combat disease and illness;
Construction of safe drinking water projects; and
Employment initiatives for farmers and herdsmen.
The company promotes the maintenance of stability and security that ensures the development
of the mine. This includes preventing any destabilising actions taken by domestic and foreign
organisations such as the creation of disturbances or acts of sabotage.
There is some information outlining the operation’s social contribution to the local community,
which are consistent with the corporate management objectives. However, national
requirements to implement Social Management/Impact Plans and Community Action Plans or
any reporting against statutory and corporate requirements were not sighted.
P:\1870_G\3725_Final_Signed_20140130 187
JIAMA PHASE 2 EXPANSION PROJECT
CHINA GOLD INTERNATIONAL
21 CAPITAL AND OPERATING COSTS
21.1 Introduction
The aim of the capital and operating cost estimates is to provide costs to an accuracy level of ±
15% that can be utilised to evaluate the economics of the Jiama Copper - Polymetallic Project.
All costs are presented in United States Dollars (USD) – this includes items such as wages
which are normally paid in RMB but are converted to USD for consistency using an exchange
rate of USD/RMB 6.10. An exchange rate of 6.3 USD/RMB was applied in the pre-feasibility
study however due to an improvement in Chinas economic position this has been reduced to
6.1 USD/RMB to reflect the exchange rate that was current at the time of preparing this report.
The costs detailed in this section have been sourced from China Gold, the CGDI Feasibility
Report (2011), Minarco MineConsult (MMC) NI 43-101 (November 2012), the CGDI Preliminary
Design Report (December 2012). Mining One has reviewed the cost estimates used and has
deemed them to be reasonable based on comparable mining operations in China.
21.2 Scope of Estimate
The capital and operating cost estimates were developed for an open pit operation, two
floatation process plants and support infrastructure for an operation capable of treating up to
16.5 million tonnes of ore per annum.
21.3 Estimate Accuracy
The estimation accuracy is dependent on the China Gold’s estimates of capital and operating
expenditure. Mining One has not verified the costs on a first principles basis. However, the
estimates seem to be within reasonable limits and in the case of mining are supported by
agreed contract rates. In some instances costs were observed to be higher than operations of a
similar size and nature currently operating within China. Based on these observations there is
reasonable confidence in the accuracy of the financial estimates.
21.4 Capital Cost Estimate
The total estimated cost of bringing the Project into production is USD 716.2 Million. The
following sections outline capital costs for mining, processing and other capital costs including
land leasing. These costs are summarised in Table 21-1.
As a mining contractor will be utilised, the mining equipment has been included as an operating
cost. Additional information relating to mining infrastructure can be found in Section 18. These
mining capital costs have been provided by China Gold and appear reasonable when compared
to other operations within China.
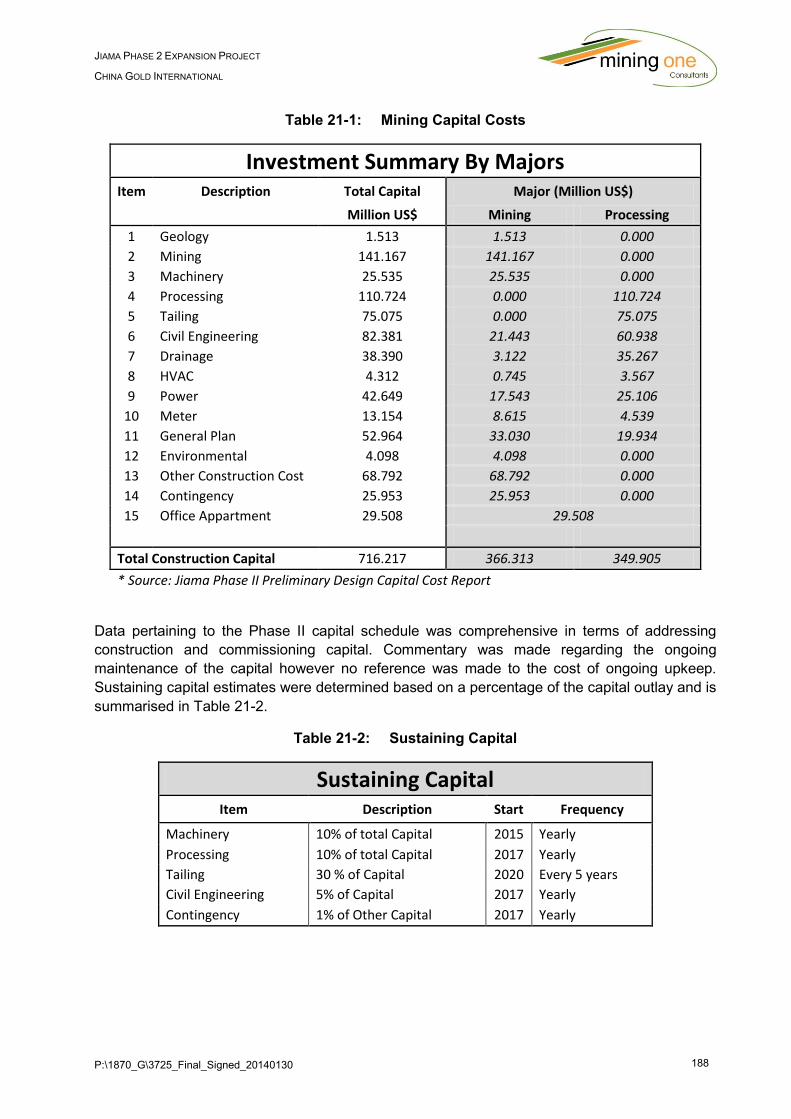
P:\1870_G\3725_Final_Signed_20140130 188
JIAMA PHASE 2 EXPANSION PROJECT
CHINA GOLD INTERNATIONAL
Table 21-1: Mining Capital Costs
Investment Summary By Majors Item Description Total Capital Major (Million US$)
Million US$ Mining Processing
1 Geology 1.513 1.513 0.000
2 Mining 141.167 141.167 0.000
3 Machinery 25.535 25.535 0.000
4 Processing 110.724 0.000 110.724
5 Tailing 75.075 0.000 75.075
6 Civil Engineering 82.381 21.443 60.938
7 Drainage 38.390 3.122 35.267
8 HVAC 4.312 0.745 3.567
9 Power 42.649 17.543 25.106
10 Meter 13.154 8.615 4.539
11 General Plan 52.964 33.030 19.934
12 Environmental 4.098 4.098 0.000
13 Other Construction Cost 68.792 68.792 0.000
14 Contingency 25.953 25.953 0.000
15 Office Appartment 29.508 29.508
Total Construction Capital 716.217 366.313 349.905
* Source: Jiama Phase II Preliminary Design Capital Cost Report
Data pertaining to the Phase II capital schedule was comprehensive in terms of addressing
construction and commissioning capital. Commentary was made regarding the ongoing
maintenance of the capital however no reference was made to the cost of ongoing upkeep.
Sustaining capital estimates were determined based on a percentage of the capital outlay and is
summarised in Table 21-2.
Table 21-2: Sustaining Capital
Sustaining Capital Item Description Start Frequency
Machinery 10% of total Capital 2015 Yearly
Processing 10% of total Capital 2017 Yearly
Tailing 30 % of Capital 2020 Every 5 years
Civil Engineering 5% of Capital 2017 Yearly
Contingency 1% of Other Capital 2017 Yearly

P:\1870_G\3725_Final_Signed_20140130 189
JIAMA PHASE 2 EXPANSION PROJECT
CHINA GOLD INTERNATIONAL
21.5 Operating Cost Estimate
21.5.1 Open Pit Mining
Mining will be conducted by an external contractor, two contract companies have committed to
10 year service agreements for the Phase II open cut mines a summary of the contract
companies and their rates is summarise in Table 21-3. The mining cost for Jiaoyan pit will be
38.23 RMB/bcm and South Pit will be 36.93 RMB/bcm.
An additional 3.05 RMB/bcm is included to cover open cut service overheads such as grade
control, power, ancillary fuel, dewatering, management and contingency. The unit cost of open
cut mining for the Phase II open cut project is outlined in Table 21-4. At an exchange rate of
6.10 RMB/USD the cost of mining is US$6.77 and US$6.55 per cubic metre for Jiaoyan and
South pit respectively.
Table 21-3: Open Cut Contractors and Mining Rates
Contractor Pit Rate
RMB/bcm
CTMG (China Tenth Metallurgy Group Limited Corporation) Jiaoyan Pit ¥38.23
CRCC ( The 2nd Engineering Co. LTD of China Railway 17 Bureau Group Corpration South Pit ¥36.93
CTMG (China Tenth Metallurgy Group Limited Corporation) South Pit ¥36.93
Table 21-4: Total Mining Cost per Cubic Metre
Pit Rate
RMB/cu.m O/Head $US/cu.m
Jiaoyan Pit ¥38.23 ¥3.05 $6.77
South Pit ¥36.93 ¥3.05 $6.55
South Pit ¥36.93
Contract agreements are in place for the initial 10 years of operation and therefore the
application of these rates without further estimates is considered reasonable. It was noted that
beyond this initial contract phase the mining depths will require that material is elevated from
the bottom of the pit to the waste dump. For this reason Mining One deemed it appropriate to
apply an additional cost to all material that is excavated below the depth of the cutting located
on the eastern edge of each pit.
A rate of 0.15 RMB/m3 per 5m of vertical advance was considered an appropriate contingency.
This was applied at the 5,120 mRL and 5,000 mRL respectively for the Jiaoyan and South Pit.
Table 21-5 provides an overview of all variable costs associated with the open pit mines.
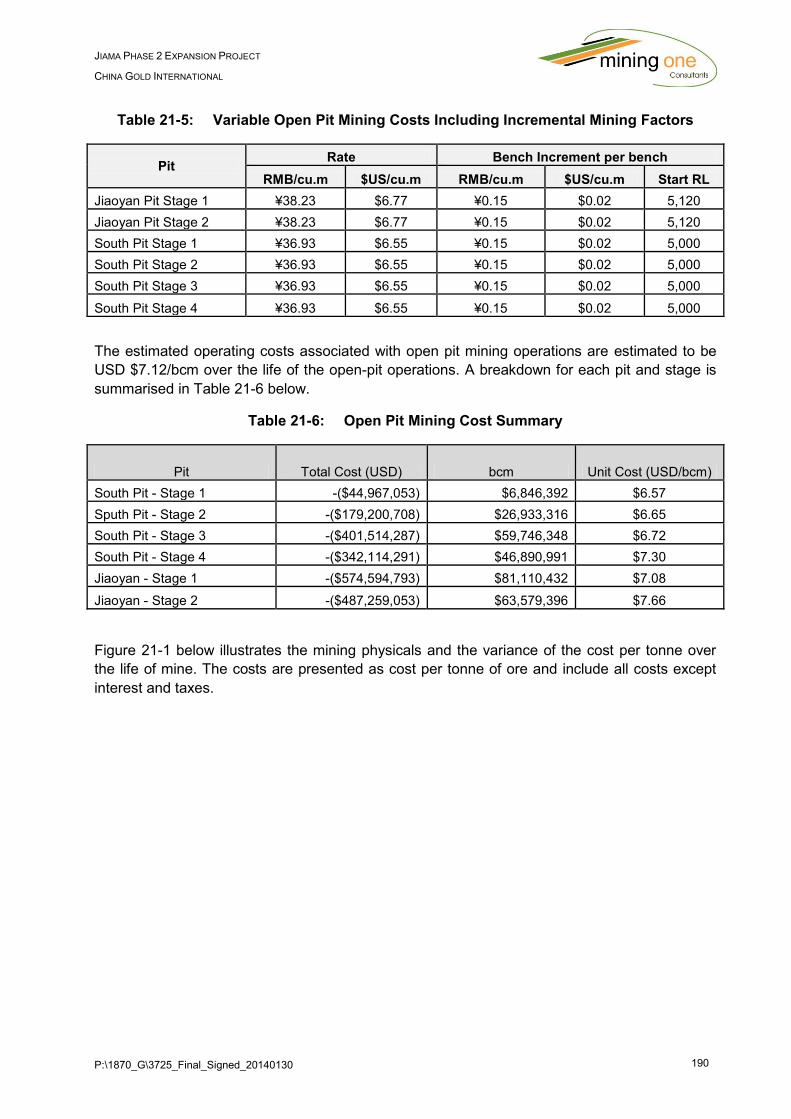
P:\1870_G\3725_Final_Signed_20140130 190
JIAMA PHASE 2 EXPANSION PROJECT
CHINA GOLD INTERNATIONAL
Table 21-5: Variable Open Pit Mining Costs Including Incremental Mining Factors
Pit Rate Bench Increment per bench
RMB/cu.m $US/cu.m RMB/cu.m $US/cu.m Start RL
Jiaoyan Pit Stage 1 ¥38.23 $6.77 ¥0.15 $0.02 5,120
Jiaoyan Pit Stage 2 ¥38.23 $6.77 ¥0.15 $0.02 5,120
South Pit Stage 1 ¥36.93 $6.55 ¥0.15 $0.02 5,000
South Pit Stage 2 ¥36.93 $6.55 ¥0.15 $0.02 5,000
South Pit Stage 3 ¥36.93 $6.55 ¥0.15 $0.02 5,000
South Pit Stage 4 ¥36.93 $6.55 ¥0.15 $0.02 5,000
The estimated operating costs associated with open pit mining operations are estimated to be
USD $7.12/bcm over the life of the open-pit operations. A breakdown for each pit and stage is
summarised in Table 21-6 below.
Table 21-6: Open Pit Mining Cost Summary
Pit Total Cost (USD) bcm Unit Cost (USD/bcm)
South Pit - Stage 1 -($44,967,053) $6,846,392 $6.57
Sputh Pit - Stage 2 -($179,200,708) $26,933,316 $6.65
South Pit - Stage 3 -($401,514,287) $59,746,348 $6.72
South Pit - Stage 4 -($342,114,291) $46,890,991 $7.30
Jiaoyan - Stage 1 -($574,594,793) $81,110,432 $7.08
Jiaoyan - Stage 2 -($487,259,053) $63,579,396 $7.66
Figure 21-1 below illustrates the mining physicals and the variance of the cost per tonne over
the life of mine. The costs are presented as cost per tonne of ore and include all costs except
interest and taxes.
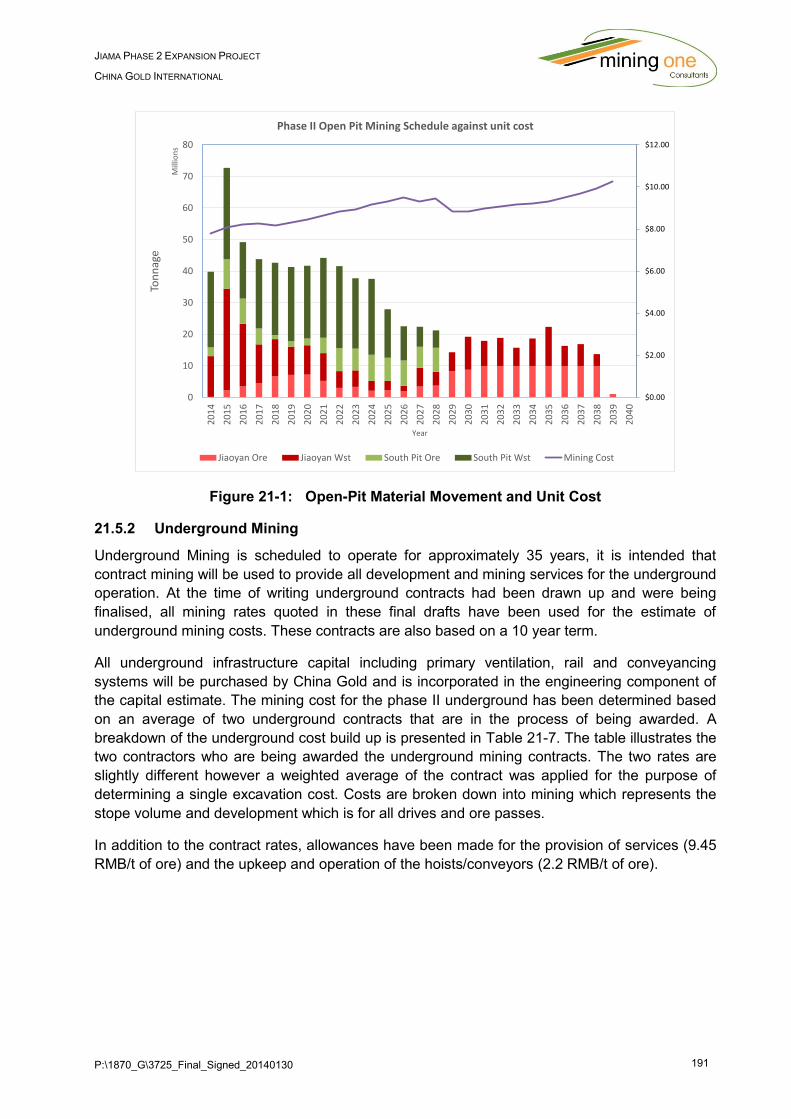
P:\1870_G\3725_Final_Signed_20140130 191
JIAMA PHASE 2 EXPANSION PROJECT
CHINA GOLD INTERNATIONAL
Figure 21-1: Open-Pit Material Movement and Unit Cost
21.5.2 Underground Mining
Underground Mining is scheduled to operate for approximately 35 years, it is intended that
contract mining will be used to provide all development and mining services for the underground
operation. At the time of writing underground contracts had been drawn up and were being
finalised, all mining rates quoted in these final drafts have been used for the estimate of
underground mining costs. These contracts are also based on a 10 year term.
All underground infrastructure capital including primary ventilation, rail and conveyancing
systems will be purchased by China Gold and is incorporated in the engineering component of
the capital estimate. The mining cost for the phase II underground has been determined based
on an average of two underground contracts that are in the process of being awarded. A
breakdown of the underground cost build up is presented in Table 21-7. The table illustrates the
two contractors who are being awarded the underground mining contracts. The two rates are
slightly different however a weighted average of the contract was applied for the purpose of
determining a single excavation cost. Costs are broken down into mining which represents the
stope volume and development which is for all drives and ore passes.
In addition to the contract rates, allowances have been made for the provision of services (9.45
RMB/t of ore) and the upkeep and operation of the hoists/conveyors (2.2 RMB/t of ore).
$0.00
$2.00
$4.00
$6.00
$8.00
$10.00
$12.00
0
10
20
30
40
50
60
70
80
20
14
20
15
20
16
20
17
20
18
20
19
20
20
202
1
20
22
20
23
20
24
20
25
20
26
20
27
20
28
20
29
20
30
20
31
203
2
20
33
20
34
20
35
20
36
20
37
20
38
20
39
20
40
Ton
nag
e
Mill
ion
s
Year
Phase II Open Pit Mining Schedule against unit cost
Jiaoyan Ore Jiaoyan Wst South Pit Ore South Pit Wst Mining Cost
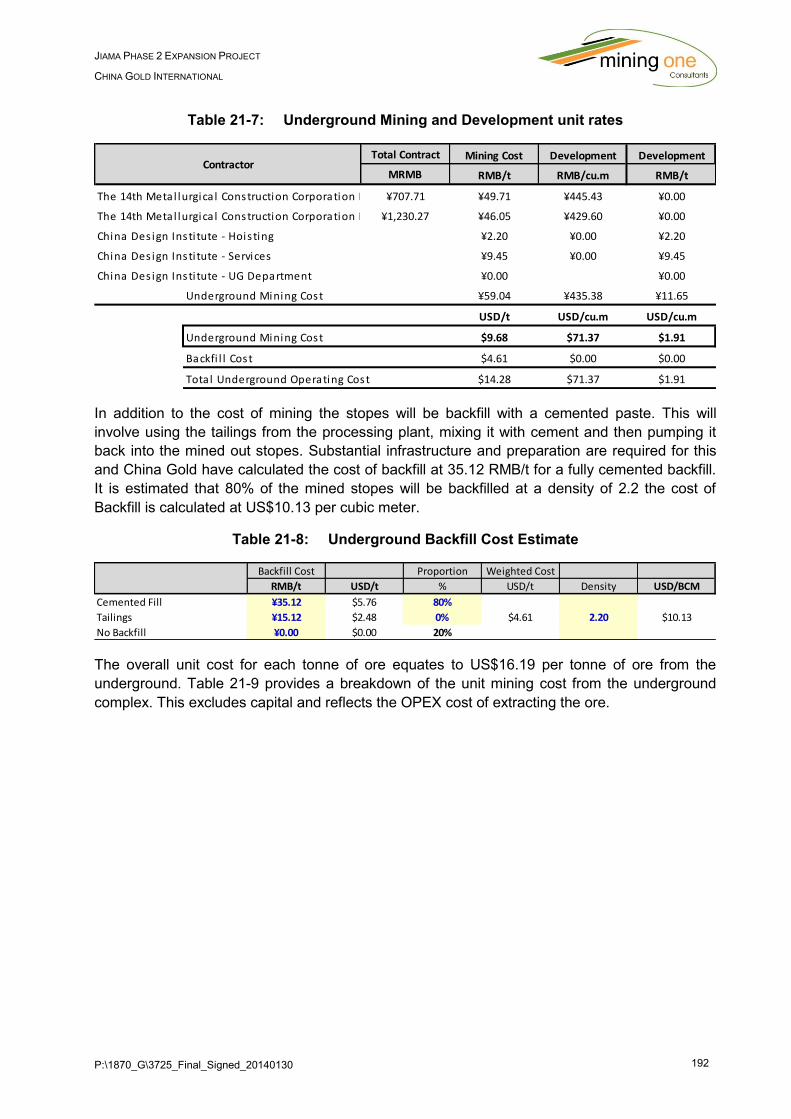
P:\1870_G\3725_Final_Signed_20140130 192
JIAMA PHASE 2 EXPANSION PROJECT
CHINA GOLD INTERNATIONAL
Table 21-7: Underground Mining and Development unit rates
In addition to the cost of mining the stopes will be backfill with a cemented paste. This will
involve using the tailings from the processing plant, mixing it with cement and then pumping it
back into the mined out stopes. Substantial infrastructure and preparation are required for this
and China Gold have calculated the cost of backfill at 35.12 RMB/t for a fully cemented backfill.
It is estimated that 80% of the mined stopes will be backfilled at a density of 2.2 the cost of
Backfill is calculated at US$10.13 per cubic meter.
Table 21-8: Underground Backfill Cost Estimate
The overall unit cost for each tonne of ore equates to US$16.19 per tonne of ore from the
underground. Table 21-9 provides a breakdown of the unit mining cost from the underground
complex. This excludes capital and reflects the OPEX cost of extracting the ore.
Total Contract Mining Cost Development Development
MRMB RMB/t RMB/cu.m RMB/t
The 14th Metal lurgica l Construction Corporation Ltd, Yunnan¥707.71 ¥49.71 ¥445.43 ¥0.00
The 14th Metal lurgica l Construction Corporation Ltd, China¥1,230.27 ¥46.05 ¥429.60 ¥0.00
China Des ign Insti tute - Hois ting ¥2.20 ¥0.00 ¥2.20
China Des ign Insti tute - Services ¥9.45 ¥0.00 ¥9.45
China Des ign Insti tute - UG Department ¥0.00 ¥0.00
Underground Mining Cost ¥59.04 ¥435.38 ¥11.65
USD/t USD/cu.m USD/cu.m
Underground Mining Cost $9.68 $71.37 $1.91
Backfi l l Cost $4.61 $0.00 $0.00
Total Underground Operating Cost $14.28 $71.37 $1.91
Contractor
Backfill Cost Proportion Weighted Cost
RMB/t USD/t % USD/t Density USD/BCM
Cemented Fill ¥35.12 $5.76 80%
Tailings ¥15.12 $2.48 0%
No Backfill ¥0.00 $0.00 20%
$4.61 2.20 $10.13
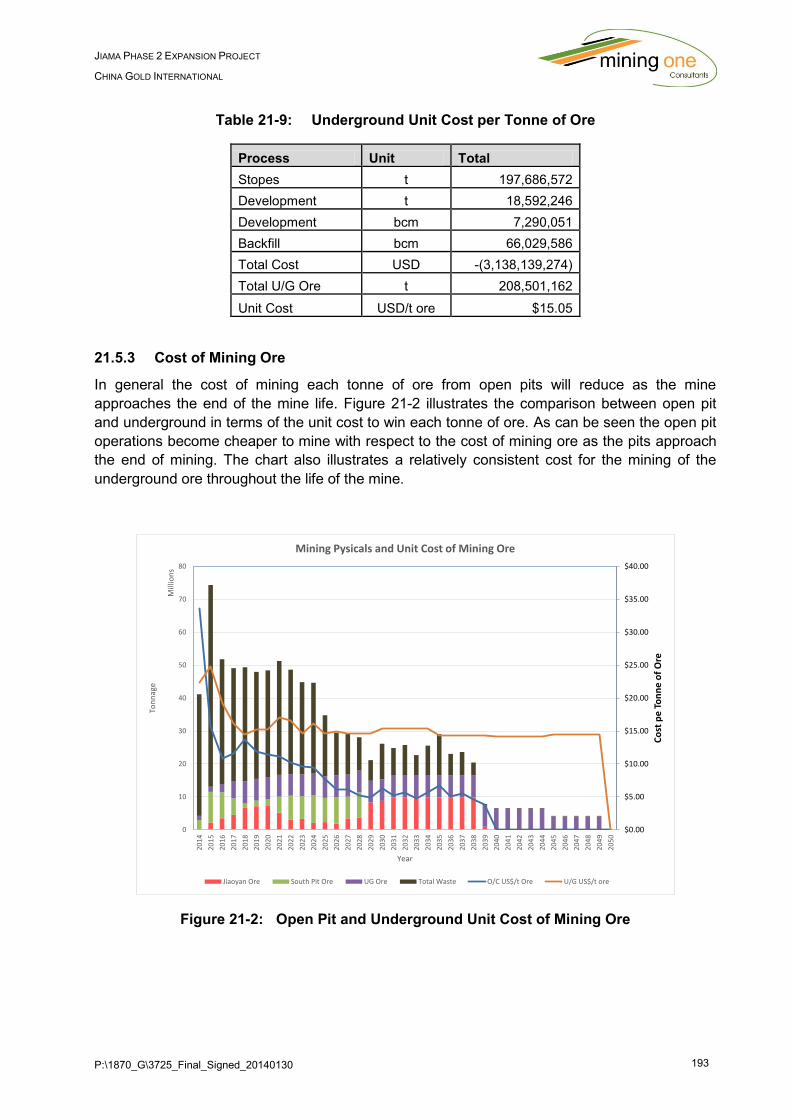
P:\1870_G\3725_Final_Signed_20140130 193
JIAMA PHASE 2 EXPANSION PROJECT
CHINA GOLD INTERNATIONAL
Table 21-9: Underground Unit Cost per Tonne of Ore
Process Unit Total
Stopes t 197,686,572
Development t 18,592,246
Development bcm 7,290,051
Backfill bcm 66,029,586
Total Cost USD -(3,138,139,274)
Total U/G Ore t 208,501,162
Unit Cost USD/t ore $15.05
21.5.3 Cost of Mining Ore
In general the cost of mining each tonne of ore from open pits will reduce as the mine
approaches the end of the mine life. Figure 21-2 illustrates the comparison between open pit
and underground in terms of the unit cost to win each tonne of ore. As can be seen the open pit
operations become cheaper to mine with respect to the cost of mining ore as the pits approach
the end of mining. The chart also illustrates a relatively consistent cost for the mining of the
underground ore throughout the life of the mine.
Figure 21-2: Open Pit and Underground Unit Cost of Mining Ore
$0.00
$5.00
$10.00
$15.00
$20.00
$25.00
$30.00
$35.00
$40.00
0
10
20
30
40
50
60
70
80
20
14
20
15
20
16
20
17
20
18
20
19
20
20
20
21
20
22
20
23
20
24
20
25
20
26
20
27
20
28
20
29
20
30
20
31
20
32
20
33
20
34
20
35
20
36
20
37
20
38
20
39
20
40
20
41
20
42
20
43
20
44
20
45
20
46
20
47
20
48
20
49
20
50
Co
st p
e T
on
ne
of
Ore
Ton
nag
e
Mill
ion
s
Year
Mining Pysicals and Unit Cost of Mining Ore
Jiaoyan Ore South Pit Ore UG Ore Total Waste O/C US$/t Ore U/G US$/t ore
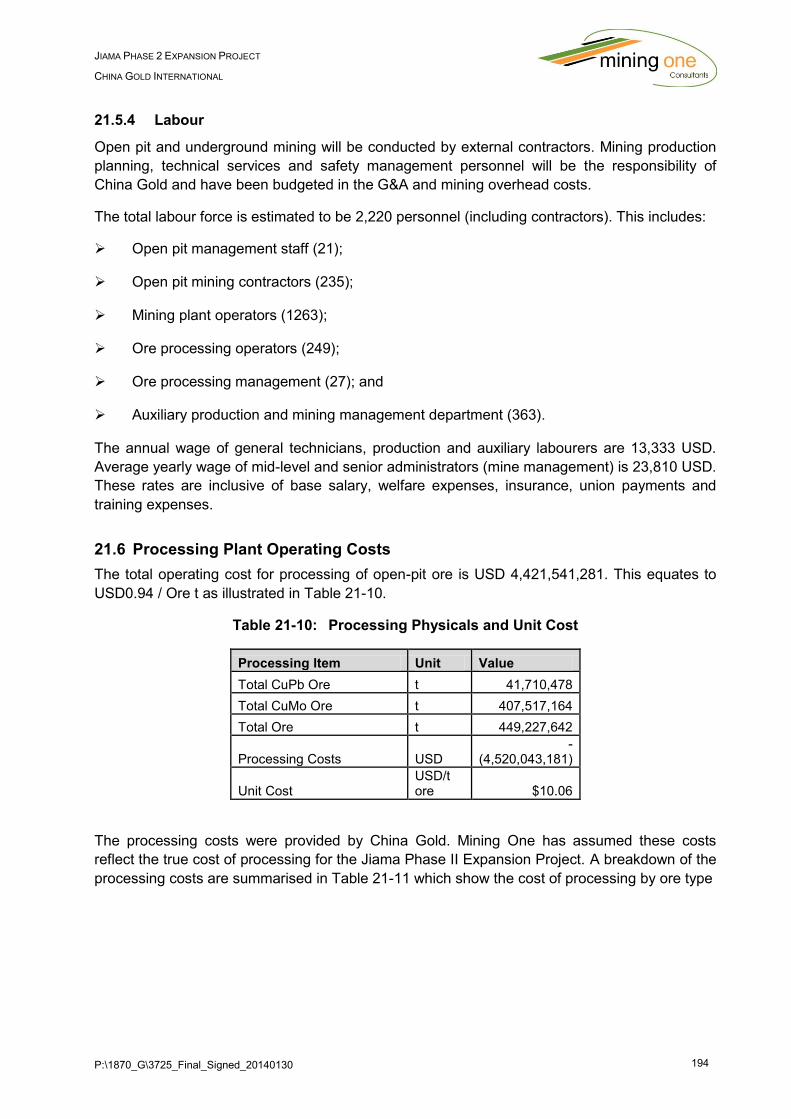
P:\1870_G\3725_Final_Signed_20140130 194
JIAMA PHASE 2 EXPANSION PROJECT
CHINA GOLD INTERNATIONAL
21.5.4 Labour
Open pit and underground mining will be conducted by external contractors. Mining production
planning, technical services and safety management personnel will be the responsibility of
China Gold and have been budgeted in the G&A and mining overhead costs.
The total labour force is estimated to be 2,220 personnel (including contractors). This includes:
Open pit management staff (21);
Open pit mining contractors (235);
Mining plant operators (1263);
Ore processing operators (249);
Ore processing management (27); and
Auxiliary production and mining management department (363).
The annual wage of general technicians, production and auxiliary labourers are 13,333 USD.
Average yearly wage of mid-level and senior administrators (mine management) is 23,810 USD.
These rates are inclusive of base salary, welfare expenses, insurance, union payments and
training expenses.
21.6 Processing Plant Operating Costs
The total operating cost for processing of open-pit ore is USD 4,421,541,281. This equates to
USD0.94 / Ore t as illustrated in Table 21-10.
Table 21-10: Processing Physicals and Unit Cost
Processing Item Unit Value
Total CuPb Ore t 41,710,478
Total CuMo Ore t 407,517,164
Total Ore t 449,227,642
Processing Costs USD -
(4,520,043,181)
Unit Cost USD/t ore $10.06
The processing costs were provided by China Gold. Mining One has assumed these costs
reflect the true cost of processing for the Jiama Phase II Expansion Project. A breakdown of the
processing costs are summarised in Table 21-11 which show the cost of processing by ore type
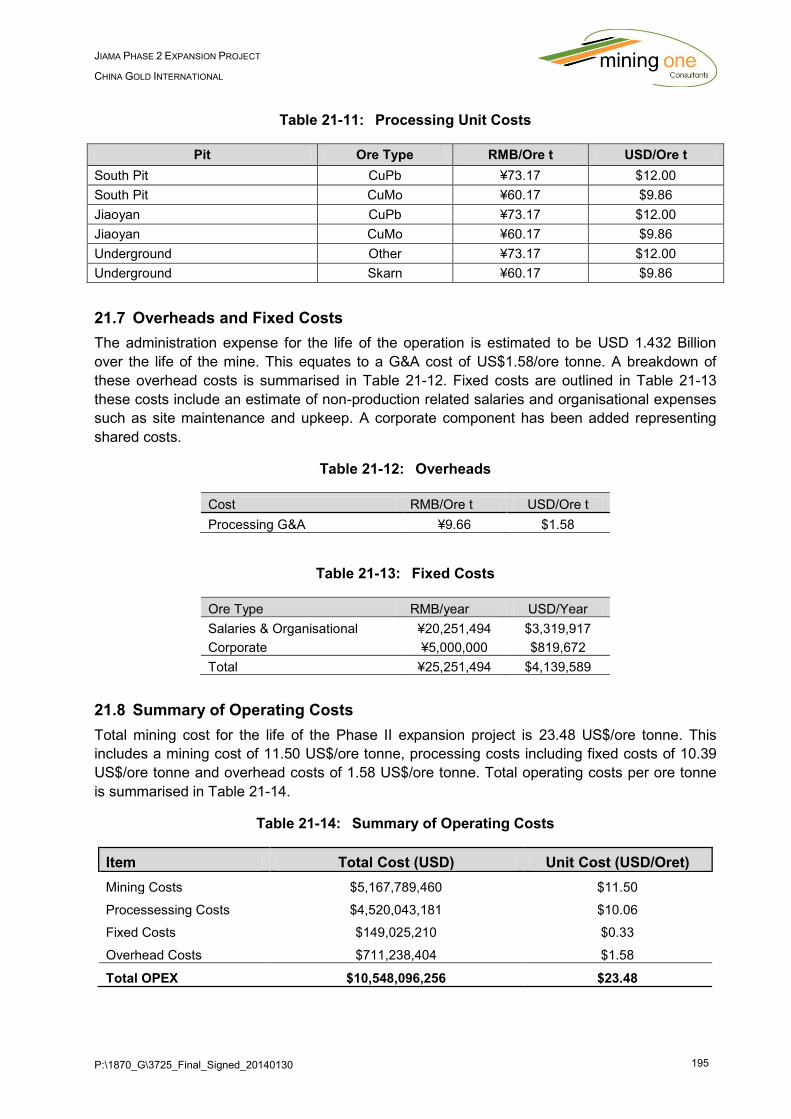
P:\1870_G\3725_Final_Signed_20140130 195
JIAMA PHASE 2 EXPANSION PROJECT
CHINA GOLD INTERNATIONAL
Table 21-11: Processing Unit Costs
Pit Ore Type RMB/Ore t USD/Ore t
South Pit CuPb ¥73.17 $12.00
South Pit CuMo ¥60.17 $9.86
Jiaoyan CuPb ¥73.17 $12.00
Jiaoyan CuMo ¥60.17 $9.86
Underground Other ¥73.17 $12.00
Underground Skarn ¥60.17 $9.86
21.7 Overheads and Fixed Costs
The administration expense for the life of the operation is estimated to be USD 1.432 Billion
over the life of the mine. This equates to a G&A cost of US$1.58/ore tonne. A breakdown of
these overhead costs is summarised in Table 21-12. Fixed costs are outlined in Table 21-13
these costs include an estimate of non-production related salaries and organisational expenses
such as site maintenance and upkeep. A corporate component has been added representing
shared costs.
Table 21-12: Overheads
Cost RMB/Ore t USD/Ore t
Processing G&A ¥9.66 $1.58
Table 21-13: Fixed Costs
Ore Type RMB/year USD/Year
Salaries & Organisational ¥20,251,494 $3,319,917
Corporate ¥5,000,000 $819,672
Total ¥25,251,494 $4,139,589
21.8 Summary of Operating Costs
Total mining cost for the life of the Phase II expansion project is 23.48 US$/ore tonne. This
includes a mining cost of 11.50 US$/ore tonne, processing costs including fixed costs of 10.39
US$/ore tonne and overhead costs of 1.58 US$/ore tonne. Total operating costs per ore tonne
is summarised in Table 21-14.
Table 21-14: Summary of Operating Costs
Item Total Cost (USD) Unit Cost (USD/Oret)
Mining Costs $5,167,789,460 $11.50
Processessing Costs $4,520,043,181 $10.06
Fixed Costs $149,025,210 $0.33
Overhead Costs $711,238,404 $1.58
Total OPEX $10,548,096,256 $23.48
P:\1870_G\3725_Final_Signed_20140130 196
JIAMA PHASE 2 EXPANSION PROJECT
CHINA GOLD INTERNATIONAL
21.9 Conclusion of Capital and Operating Costs
During the review it was evident that China Gold has spent a substantial amount of time and
effort generating studies and investigations into the construction of the Jiama mining complex.
In addition to the reports and studies there were a number of contracts that indicated the mining
costs that had been agreed. Based on the data provided by China Gold, the costs appear to be
reasonable when compared with other mining operations. There was insufficient transparency
of the technical data available to conduct a first principles comparison:
A comprehensive list of capital costs were provided to Mining One for inclusion in the cost model; and
China Gold have already commenced construction of Phase II infrastructure and the costs spent to date have been considered to be sunk costs.

P:\1870_G\3725_Final_Signed_20140130 197
JIAMA PHASE 2 EXPANSION PROJECT
CHINA GOLD INTERNATIONAL
22 ECONOMIC ANALYSIS
22.1 Introduction
An economic evaluation was conducted on the open cut portion of the Jiama Phase II
Expansion Project. The project is forecast to generate a post-tax net present value of USD
1.324 billion with an internal rate of return of 24.0%.
A summary of the key economic indicators are outlined in Table 22-1.
A sensitivity analysis was also conducted which revealed the project was most sensitive to
changes in revenue of metal sales of which metal prices would be the significant contributing
factor, however a variation of -20% would be required before a negative NPV was returned.
Table 22-1: Summary of Economic Analysis
Project KPI Unit Pre-Tax Post-Tax
Total Cash USD 7,406,783,715 5,785,209,159
Net Present Value (NPV) USD 1,873,148,514 1,324,968,062
Internal Rate of Return (IRR) % 29.7% 24.0%
Payback Period (Undisc. Cash) Years 5.62 6.72
Payback Period (Disc. Cash) Years 6.68 7.91
Max. Cash Draw Down (Undisc. Cash) USD -($401,548,388)
Max. Cash Draw Down (Disc. Cash) USD -($401,548,388)
Operating Margin (EBITA / Revenue) % 38.4%
22.2 Parameters
22.2.1 Discount Rate
A discount rate of 9% was used. It is assumed this is the cost of capital applicable to China
Gold and is representative of a discount rate used by other projects of this nature. Table 22-2
provides an overview of the general parameters used in the financial analysis
Table 22-2: General Parameters
Parameter Unit Value
Discount Rate %p.a 9%
Start Period Yr 2014
End Period Yr 2049
Kilogram lb 2.20
Troy Ounce g 31.10
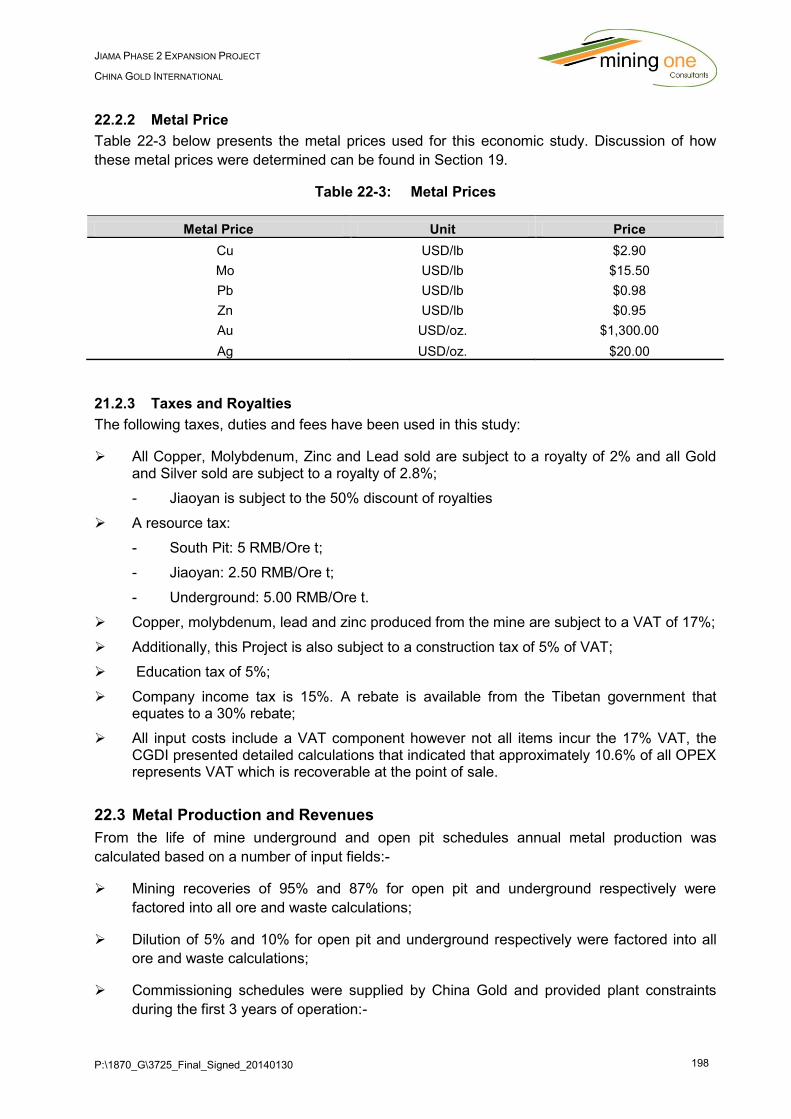
P:\1870_G\3725_Final_Signed_20140130 198
JIAMA PHASE 2 EXPANSION PROJECT
CHINA GOLD INTERNATIONAL
22.2.2 Metal Price
Table 22-3 below presents the metal prices used for this economic study. Discussion of how
these metal prices were determined can be found in Section 19.
Table 22-3: Metal Prices
Metal Price Unit Price
Cu USD/lb $2.90
Mo USD/lb $15.50
Pb USD/lb $0.98
Zn USD/lb $0.95
Au USD/oz. $1,300.00
Ag USD/oz. $20.00
21.2.3 Taxes and Royalties
The following taxes, duties and fees have been used in this study:
All Copper, Molybdenum, Zinc and Lead sold are subject to a royalty of 2% and all Gold and Silver sold are subject to a royalty of 2.8%;
- Jiaoyan is subject to the 50% discount of royalties
A resource tax:
- South Pit: 5 RMB/Ore t;
- Jiaoyan: 2.50 RMB/Ore t;
- Underground: 5.00 RMB/Ore t.
Copper, molybdenum, lead and zinc produced from the mine are subject to a VAT of 17%;
Additionally, this Project is also subject to a construction tax of 5% of VAT;
Education tax of 5%;
Company income tax is 15%. A rebate is available from the Tibetan government that equates to a 30% rebate;
All input costs include a VAT component however not all items incur the 17% VAT, the CGDI presented detailed calculations that indicated that approximately 10.6% of all OPEX represents VAT which is recoverable at the point of sale.
22.3 Metal Production and Revenues
From the life of mine underground and open pit schedules annual metal production was
calculated based on a number of input fields:-
Mining recoveries of 95% and 87% for open pit and underground respectively were
factored into all ore and waste calculations;
Dilution of 5% and 10% for open pit and underground respectively were factored into all
ore and waste calculations;
Commissioning schedules were supplied by China Gold and provided plant constraints
during the first 3 years of operation:-
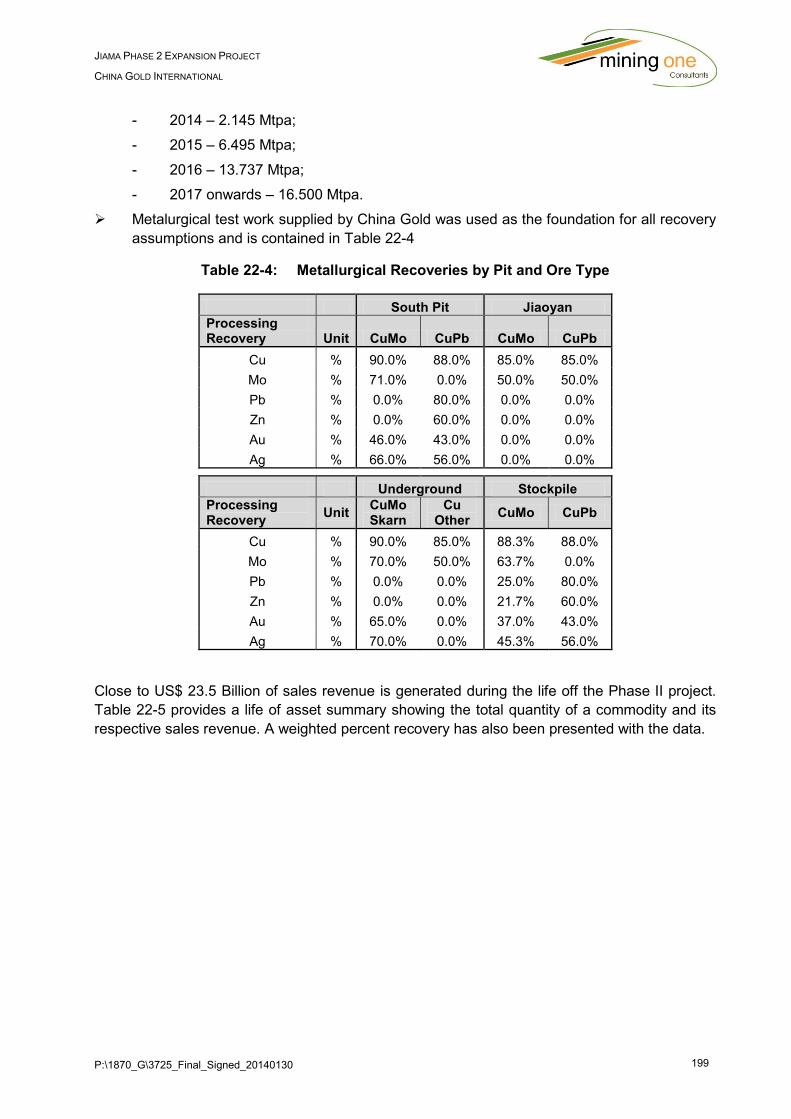
P:\1870_G\3725_Final_Signed_20140130 199
JIAMA PHASE 2 EXPANSION PROJECT
CHINA GOLD INTERNATIONAL
- 2014 – 2.145 Mtpa;
- 2015 – 6.495 Mtpa;
- 2016 – 13.737 Mtpa;
- 2017 onwards – 16.500 Mtpa.
Metalurgical test work supplied by China Gold was used as the foundation for all recovery
assumptions and is contained in Table 22-4
Table 22-4: Metallurgical Recoveries by Pit and Ore Type
South Pit Jiaoyan
Processing Recovery Unit CuMo CuPb CuMo CuPb
Cu % 90.0% 88.0% 85.0% 85.0%
Mo % 71.0% 0.0% 50.0% 50.0%
Pb % 0.0% 80.0% 0.0% 0.0%
Zn % 0.0% 60.0% 0.0% 0.0%
Au % 46.0% 43.0% 0.0% 0.0%
Ag % 66.0% 56.0% 0.0% 0.0%
Underground Stockpile
Processing Recovery
Unit CuMo Skarn
Cu Other
CuMo CuPb
Cu % 90.0% 85.0% 88.3% 88.0%
Mo % 70.0% 50.0% 63.7% 0.0%
Pb % 0.0% 0.0% 25.0% 80.0%
Zn % 0.0% 0.0% 21.7% 60.0%
Au % 65.0% 0.0% 37.0% 43.0%
Ag % 70.0% 0.0% 45.3% 56.0%
Close to US$ 23.5 Billion of sales revenue is generated during the life off the Phase II project.
Table 22-5 provides a life of asset summary showing the total quantity of a commodity and its
respective sales revenue. A weighted percent recovery has also been presented with the data.
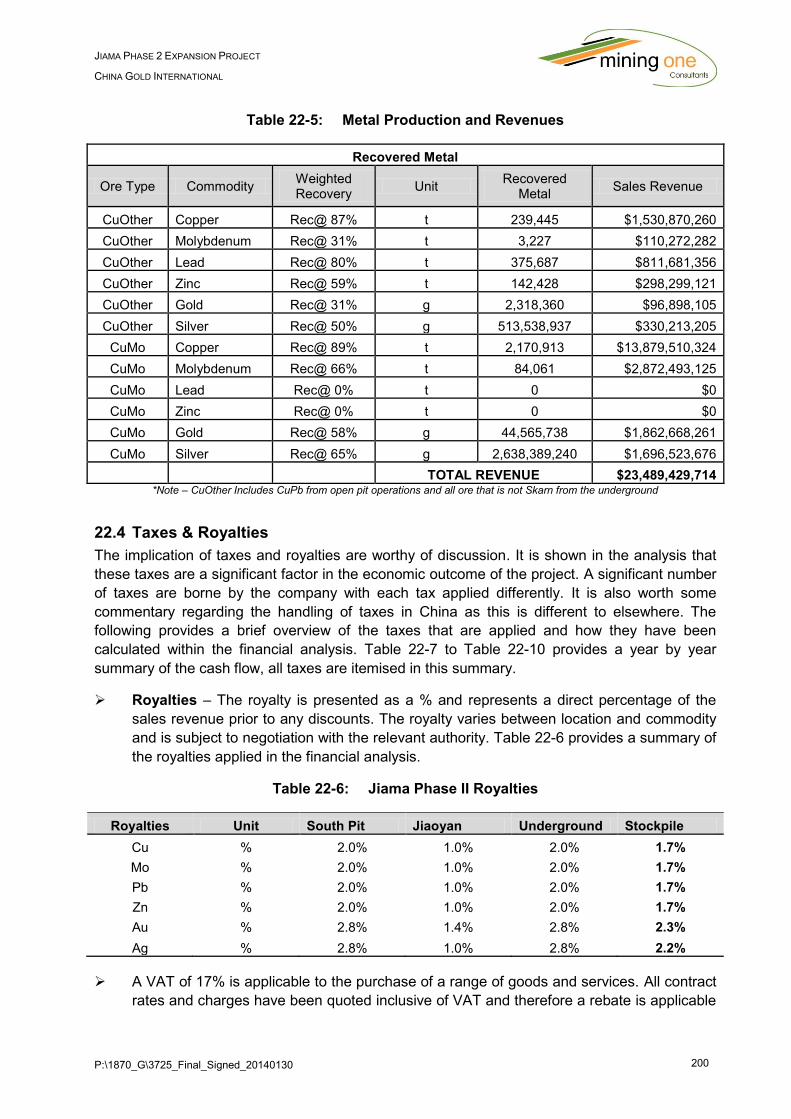
P:\1870_G\3725_Final_Signed_20140130 200
JIAMA PHASE 2 EXPANSION PROJECT
CHINA GOLD INTERNATIONAL
Table 22-5: Metal Production and Revenues
Recovered Metal
Ore Type Commodity Weighted Recovery
Unit Recovered
Metal Sales Revenue
CuOther Copper Rec@ 87% t 239,445 $1,530,870,260
CuOther Molybdenum Rec@ 31% t 3,227 $110,272,282
CuOther Lead Rec@ 80% t 375,687 $811,681,356
CuOther Zinc Rec@ 59% t 142,428 $298,299,121
CuOther Gold Rec@ 31% g 2,318,360 $96,898,105
CuOther Silver Rec@ 50% g 513,538,937 $330,213,205
CuMo Copper Rec@ 89% t 2,170,913 $13,879,510,324
CuMo Molybdenum Rec@ 66% t 84,061 $2,872,493,125
CuMo Lead Rec@ 0% t 0 $0
CuMo Zinc Rec@ 0% t 0 $0
CuMo Gold Rec@ 58% g 44,565,738 $1,862,668,261
CuMo Silver Rec@ 65% g 2,638,389,240 $1,696,523,676
TOTAL REVENUE $23,489,429,714
*Note – CuOther Includes CuPb from open pit operations and all ore that is not Skarn from the underground
22.4 Taxes & Royalties
The implication of taxes and royalties are worthy of discussion. It is shown in the analysis that
these taxes are a significant factor in the economic outcome of the project. A significant number
of taxes are borne by the company with each tax applied differently. It is also worth some
commentary regarding the handling of taxes in China as this is different to elsewhere. The
following provides a brief overview of the taxes that are applied and how they have been
calculated within the financial analysis. Table 22-7 to Table 22-10 provides a year by year
summary of the cash flow, all taxes are itemised in this summary.
Royalties – The royalty is presented as a % and represents a direct percentage of the
sales revenue prior to any discounts. The royalty varies between location and commodity
and is subject to negotiation with the relevant authority. Table 22-6 provides a summary of
the royalties applied in the financial analysis.
Table 22-6: Jiama Phase II Royalties
Royalties Unit South Pit Jiaoyan Underground Stockpile
Cu % 2.0% 1.0% 2.0% 1.7%
Mo % 2.0% 1.0% 2.0% 1.7%
Pb % 2.0% 1.0% 2.0% 1.7%
Zn % 2.0% 1.0% 2.0% 1.7%
Au % 2.8% 1.4% 2.8% 2.3%
Ag % 2.8% 1.0% 2.8% 2.2%
A VAT of 17% is applicable to the purchase of a range of goods and services. All contract
rates and charges have been quoted inclusive of VAT and therefore a rebate is applicable
P:\1870_G\3725_Final_Signed_20140130 201
JIAMA PHASE 2 EXPANSION PROJECT
CHINA GOLD INTERNATIONAL
within the cost model. This VAT recovery has been estimated at 10.6% of total operating
costs:
- A construction tax of 5% is applicable to the 17% VAT which is calculated from the
sales revenue;
- An education tax of 5% is applicable to the 17% VAT which is calculated from the
sales revenue;
A resource tax is applicable to every tonne of ore that is delivered to the ROM. This is
charged at 5RMB per ROM tonne with the exception of Jiaoyan pit which incurs a
resource tax of 2.5RMB per ROM tonne;
A company tax rate of 15% tax is payable on all after tax earnings, China gold receive a
30% rebate on this tax from the Tibetan Government.
22.5 Cashflows
The following tables, Table 22-7 to Table 22-10 provide a summary overview of the cashflow
model. This illustrates that the Jiama Phase II project is profitable.
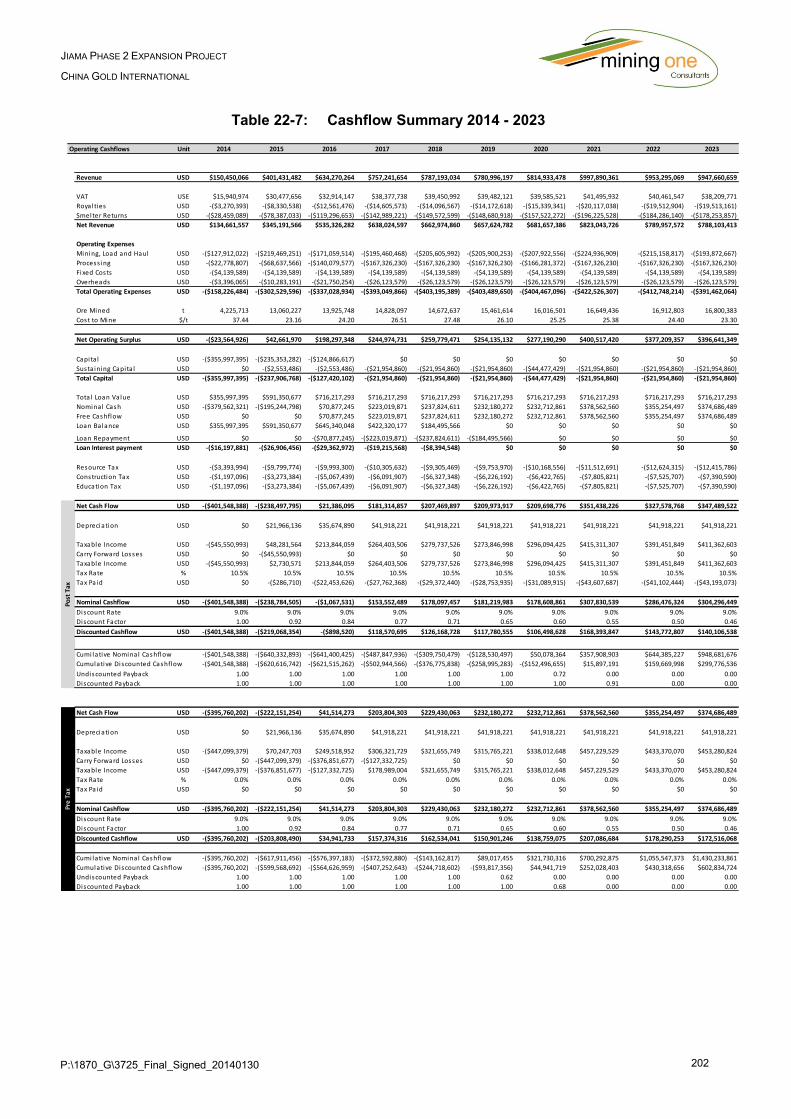
P:\1870_G\3725_Final_Signed_20140130 202
JIAMA PHASE 2 EXPANSION PROJECT
CHINA GOLD INTERNATIONAL
Table 22-7: Cashflow Summary 2014 - 2023
Operating Cashflows Unit 2014 2015 2016 2017 2018 2019 2020 2021 2022 2023
Revenue USD $150,450,066 $401,431,482 $634,270,264 $757,241,654 $787,193,034 $780,996,197 $814,933,478 $997,890,361 $953,295,069 $947,660,659
VAT USE $15,940,974 $30,477,656 $32,914,147 $38,377,738 $39,450,992 $39,482,121 $39,585,521 $41,495,932 $40,461,547 $38,209,771
Royalties USD -($3,270,393) -($8,330,538) -($12,561,476) -($14,605,573) -($14,096,567) -($14,172,618) -($15,339,341) -($20,117,038) -($19,512,904) -($19,513,161)
Smelter Returns USD -($28,459,089) -($78,387,033) -($119,296,653) -($142,989,221) -($149,572,599) -($148,680,918) -($157,522,272) -($196,225,528) -($184,286,140) -($178,253,857)
Net Revenue USD $134,661,557 $345,191,566 $535,326,282 $638,024,597 $662,974,860 $657,624,782 $681,657,386 $823,043,726 $789,957,572 $788,103,413
Operating Expenses
Mining, Load and Haul USD -($127,912,022) -($219,469,251) -($171,059,514) -($195,460,468) -($205,605,992) -($205,900,253) -($207,922,556) -($224,936,909) -($215,158,817) -($193,872,667)
Process ing USD -($22,778,807) -($68,637,566) -($140,079,577) -($167,326,230) -($167,326,230) -($167,326,230) -($166,281,372) -($167,326,230) -($167,326,230) -($167,326,230)
Fixed Costs USD -($4,139,589) -($4,139,589) -($4,139,589) -($4,139,589) -($4,139,589) -($4,139,589) -($4,139,589) -($4,139,589) -($4,139,589) -($4,139,589)
Overheads USD -($3,396,065) -($10,283,191) -($21,750,254) -($26,123,579) -($26,123,579) -($26,123,579) -($26,123,579) -($26,123,579) -($26,123,579) -($26,123,579)
Total Operating Expenses USD -($158,226,484) -($302,529,596) -($337,028,934) -($393,049,866) -($403,195,389) -($403,489,650) -($404,467,096) -($422,526,307) -($412,748,214) -($391,462,064)
Ore Mined t 4,225,713 13,060,227 13,925,748 14,828,097 14,672,637 15,461,614 16,016,501 16,649,436 16,912,803 16,800,383
Cost to Mine $/t 37.44 23.16 24.20 26.51 27.48 26.10 25.25 25.38 24.40 23.30
Net Operating Surplus USD -($23,564,926) $42,661,970 $198,297,348 $244,974,731 $259,779,471 $254,135,132 $277,190,290 $400,517,420 $377,209,357 $396,641,349
Capita l USD -($355,997,395) -($235,353,282) -($124,866,617) $0 $0 $0 $0 $0 $0 $0
Susta ining Capita l USD $0 -($2,553,486) -($2,553,486) -($21,954,860) -($21,954,860) -($21,954,860) -($44,477,429) -($21,954,860) -($21,954,860) -($21,954,860)
Total Capital USD -($355,997,395) -($237,906,768) -($127,420,102) -($21,954,860) -($21,954,860) -($21,954,860) -($44,477,429) -($21,954,860) -($21,954,860) -($21,954,860)
Tota l Loan Value USD $355,997,395 $591,350,677 $716,217,293 $716,217,293 $716,217,293 $716,217,293 $716,217,293 $716,217,293 $716,217,293 $716,217,293
Nominal Cash USD -($379,562,321) -($195,244,798) $70,877,245 $223,019,871 $237,824,611 $232,180,272 $232,712,861 $378,562,560 $355,254,497 $374,686,489
Free Cashflow USD $0 $0 $70,877,245 $223,019,871 $237,824,611 $232,180,272 $232,712,861 $378,562,560 $355,254,497 $374,686,489
Loan Balance USD $355,997,395 $591,350,677 $645,340,048 $422,320,177 $184,495,566 $0 $0 $0 $0 $0
Loan Repayment USD $0 $0 -($70,877,245) -($223,019,871) -($237,824,611) -($184,495,566) $0 $0 $0 $0
Loan Interest payment USD -($16,197,881) -($26,906,456) -($29,362,972) -($19,215,568) -($8,394,548) $0 $0 $0 $0 $0
Resource Tax USD -($3,393,994) -($9,799,774) -($9,993,300) -($10,305,632) -($9,305,469) -($9,753,970) -($10,168,556) -($11,512,691) -($12,624,315) -($12,415,786)
Construction Tax USD -($1,197,096) -($3,273,384) -($5,067,439) -($6,091,907) -($6,327,348) -($6,226,192) -($6,422,765) -($7,805,821) -($7,525,707) -($7,390,590)
Education Tax USD -($1,197,096) -($3,273,384) -($5,067,439) -($6,091,907) -($6,327,348) -($6,226,192) -($6,422,765) -($7,805,821) -($7,525,707) -($7,390,590)
Net Cash Flow USD -($401,548,388) -($238,497,795) $21,386,095 $181,314,857 $207,469,897 $209,973,917 $209,698,776 $351,438,226 $327,578,768 $347,489,522
Depreciation USD $0 $21,966,136 $35,674,890 $41,918,221 $41,918,221 $41,918,221 $41,918,221 $41,918,221 $41,918,221 $41,918,221
Taxable Income USD -($45,550,993) $48,281,564 $213,844,059 $264,403,506 $279,737,526 $273,846,998 $296,094,425 $415,311,307 $391,451,849 $411,362,603
Carry Forward Losses USD $0 -($45,550,993) $0 $0 $0 $0 $0 $0 $0 $0
Taxable Income USD -($45,550,993) $2,730,571 $213,844,059 $264,403,506 $279,737,526 $273,846,998 $296,094,425 $415,311,307 $391,451,849 $411,362,603
Tax Rate % 10.5% 10.5% 10.5% 10.5% 10.5% 10.5% 10.5% 10.5% 10.5% 10.5%
Tax Pa id USD $0 -($286,710) -($22,453,626) -($27,762,368) -($29,372,440) -($28,753,935) -($31,089,915) -($43,607,687) -($41,102,444) -($43,193,073)
Nominal Cashflow USD -($401,548,388) -($238,784,505) -($1,067,531) $153,552,489 $178,097,457 $181,219,983 $178,608,861 $307,830,539 $286,476,324 $304,296,449
Discount Rate 9.0% 9.0% 9.0% 9.0% 9.0% 9.0% 9.0% 9.0% 9.0% 9.0%
Discount Factor 1.00 0.92 0.84 0.77 0.71 0.65 0.60 0.55 0.50 0.46
Discounted Cashflow USD -($401,548,388) -($219,068,354) -($898,520) $118,570,695 $126,168,728 $117,780,555 $106,498,628 $168,393,847 $143,772,807 $140,106,538
Cumi lative Nominal Cashflow -($401,548,388) -($640,332,893) -($641,400,425) -($487,847,936) -($309,750,479) -($128,530,497) $50,078,364 $357,908,903 $644,385,227 $948,681,676
Cumulative Discounted Cashflow -($401,548,388) -($620,616,742) -($621,515,262) -($502,944,566) -($376,775,838) -($258,995,283) -($152,496,655) $15,897,191 $159,669,998 $299,776,536
Undiscounted Payback 1.00 1.00 1.00 1.00 1.00 1.00 0.72 0.00 0.00 0.00
Discounted Payback 1.00 1.00 1.00 1.00 1.00 1.00 1.00 0.91 0.00 0.00
Net Cash Flow USD -($395,760,202) -($222,151,254) $41,514,273 $203,804,303 $229,430,063 $232,180,272 $232,712,861 $378,562,560 $355,254,497 $374,686,489
Depreciation USD $0 $21,966,136 $35,674,890 $41,918,221 $41,918,221 $41,918,221 $41,918,221 $41,918,221 $41,918,221 $41,918,221
Taxable Income USD -($447,099,379) $70,247,703 $249,518,952 $306,321,729 $321,655,749 $315,765,221 $338,012,648 $457,229,529 $433,370,070 $453,280,824
Carry Forward Losses USD $0 -($447,099,379) -($376,851,677) -($127,332,725) $0 $0 $0 $0 $0 $0
Taxable Income USD -($447,099,379) -($376,851,677) -($127,332,725) $178,989,004 $321,655,749 $315,765,221 $338,012,648 $457,229,529 $433,370,070 $453,280,824
Tax Rate % 0.0% 0.0% 0.0% 0.0% 0.0% 0.0% 0.0% 0.0% 0.0% 0.0%
Tax Pa id USD $0 $0 $0 $0 $0 $0 $0 $0 $0 $0
Nominal Cashflow USD -($395,760,202) -($222,151,254) $41,514,273 $203,804,303 $229,430,063 $232,180,272 $232,712,861 $378,562,560 $355,254,497 $374,686,489
Discount Rate 9.0% 9.0% 9.0% 9.0% 9.0% 9.0% 9.0% 9.0% 9.0% 9.0%
Discount Factor 1.00 0.92 0.84 0.77 0.71 0.65 0.60 0.55 0.50 0.46
Discounted Cashflow USD -($395,760,202) -($203,808,490) $34,941,733 $157,374,316 $162,534,041 $150,901,246 $138,759,075 $207,086,684 $178,290,253 $172,516,068
Cumi lative Nominal Cashflow -($395,760,202) -($617,911,456) -($576,397,183) -($372,592,880) -($143,162,817) $89,017,455 $321,730,316 $700,292,875 $1,055,547,373 $1,430,233,861
Cumulative Discounted Cashflow -($395,760,202) -($599,568,692) -($564,626,959) -($407,252,643) -($244,718,602) -($93,817,356) $44,941,719 $252,028,403 $430,318,656 $602,834,724
Undiscounted Payback 1.00 1.00 1.00 1.00 1.00 0.62 0.00 0.00 0.00 0.00
Discounted Payback 1.00 1.00 1.00 1.00 1.00 1.00 0.68 0.00 0.00 0.00
Post
Tax
Pre
Tax

P:\1870_G\3725_Final_Signed_20140130 203
JIAMA PHASE 2 EXPANSION PROJECT
CHINA GOLD INTERNATIONAL
Table 22-8: Cashflow Summary 2024 - 2033
Operating Cashflows Unit 2024 2025 2026 2027 2028 2029 2030 2031 2032 2033
Revenue USD $1,006,766,955 $1,034,626,647 $1,020,546,587 $904,379,526 $842,836,381 $748,083,429 $700,679,451 $662,188,205 $667,661,198 $671,904,159
VAT USE $39,491,187 $35,836,122 $34,525,942 $34,459,429 $34,169,348 $32,266,760 $33,823,925 $33,390,310 $33,778,386 $32,890,744
Royalties USD -($21,289,817) -($21,419,580) -($21,466,898) -($18,487,673) -($17,069,266) -($13,149,004) -($12,333,003) -($11,466,518) -($11,521,195) -($11,563,624)
Smelter Returns USD -($188,379,642) -($200,437,877) -($199,593,304) -($177,977,307) -($167,783,206) -($149,935,193) -($133,694,620) -($127,380,506) -($127,779,587) -($128,568,540)
Net Revenue USD $836,588,683 $848,605,312 $834,012,327 $742,373,976 $692,153,257 $617,265,992 $588,475,753 $556,731,491 $562,138,803 $564,662,738
Operating Expenses
Mining, Load and Haul USD -($205,985,950) -($171,434,440) -($159,049,242) -($158,420,495) -($155,678,341) -($137,693,079) -($154,962,017) -($152,034,075) -($155,702,579) -($147,311,652)
Process ing USD -($167,326,230) -($167,326,230) -($167,326,230) -($167,326,230) -($167,326,230) -($167,326,230) -($164,777,248) -($163,606,209) -($163,606,209) -($163,606,209)
Fixed Costs USD -($4,139,589) -($4,139,589) -($4,139,589) -($4,139,589) -($4,139,589) -($4,139,589) -($4,139,589) -($4,139,589) -($4,139,589) -($4,139,589)
Overheads USD -($26,123,579) -($26,123,579) -($26,123,579) -($26,123,579) -($26,123,579) -($26,123,579) -($26,123,579) -($26,123,579) -($26,123,579) -($26,123,579)
Total Operating Expenses USD -($403,575,348) -($369,023,838) -($356,638,639) -($356,009,892) -($353,267,738) -($335,282,477) -($350,002,433) -($345,903,452) -($349,571,957) -($341,181,030)
Ore Mined t 17,060,817 16,218,552 16,516,066 16,743,468 17,970,093 14,895,671 15,312,654 16,447,016 16,447,187 16,447,190
Cost to Mine $/t 23.66 22.75 21.59 21.26 19.66 22.51 22.86 21.03 21.25 20.74
Net Operating Surplus USD $433,013,335 $479,581,474 $477,373,688 $386,364,083 $338,885,519 $281,983,515 $238,473,319 $210,828,039 $212,566,846 $223,481,709
Capita l USD $0 $0 $0 $0 $0 $0 $0 $0 $0 $0
Susta ining Capita l USD -($21,954,860) -($44,477,429) -($21,954,860) -($21,954,860) -($21,954,860) -($21,954,860) -($44,477,429) -($21,954,860) -($21,954,860) -($21,954,860)
Total Capital USD -($21,954,860) -($44,477,429) -($21,954,860) -($21,954,860) -($21,954,860) -($21,954,860) -($44,477,429) -($21,954,860) -($21,954,860) -($21,954,860)
Tota l Loan Value USD $716,217,293 $716,217,293 $716,217,293 $716,217,293 $716,217,293 $716,217,293 $716,217,293 $716,217,293 $716,217,293 $716,217,293
Nominal Cash USD $411,058,475 $435,104,046 $455,418,828 $364,409,223 $316,930,659 $260,028,655 $193,995,891 $188,873,179 $190,611,986 $201,526,849
Free Cashflow USD $411,058,475 $435,104,046 $455,418,828 $364,409,223 $316,930,659 $260,028,655 $193,995,891 $188,873,179 $190,611,986 $201,526,849
Loan Balance USD $0 $0 $0 $0 $0 $0 $0 $0 $0 $0
Loan Repayment USD $0 $0 $0 $0 $0 $0 $0 $0 $0 $0
Loan Interest payment USD $0 $0 $0 $0 $0 $0 $0 $0 $0 $0
Resource Tax USD -($13,125,669) -($12,349,888) -($12,759,629) -($12,317,429) -($13,207,992) -($8,813,870) -($8,958,955) -($9,423,858) -($9,423,928) -($9,423,929)
Construction Tax USD -($7,812,000) -($8,137,684) -($8,039,280) -($7,127,280) -($6,687,645) -($6,024,151) -($5,585,205) -($5,284,979) -($5,331,504) -($5,367,569)
Education Tax USD -($7,812,000) -($8,137,684) -($8,039,280) -($7,127,280) -($6,687,645) -($6,024,151) -($5,585,205) -($5,284,979) -($5,331,504) -($5,367,569)
Net Cash Flow USD $382,308,806 $406,478,790 $426,580,639 $337,837,235 $290,347,379 $239,166,483 $173,866,526 $168,879,363 $170,525,051 $181,367,783
Depreciation USD $41,918,221 $41,918,221 $41,918,221 $31,502,555 $26,649,830 $26,649,830 $26,649,830 $26,649,830 $26,649,830 $26,649,830
Taxable Income USD $446,181,887 $492,874,440 $490,453,720 $391,294,650 $338,952,069 $287,771,173 $244,993,785 $217,484,053 $219,129,741 $229,972,473
Carry Forward Losses USD $0 $0 $0 $0 $0 $0 $0 $0 $0 $0
Taxable Income USD $446,181,887 $492,874,440 $490,453,720 $391,294,650 $338,952,069 $287,771,173 $244,993,785 $217,484,053 $219,129,741 $229,972,473
Tax Rate % 10.5% 10.5% 10.5% 10.5% 10.5% 10.5% 10.5% 10.5% 10.5% 10.5%
Tax Pa id USD -($46,849,098) -($51,751,816) -($51,497,641) -($41,085,938) -($35,589,967) -($30,215,973) -($25,724,347) -($22,835,826) -($23,008,623) -($24,147,110)
Nominal Cashflow USD $335,459,708 $354,726,974 $375,082,999 $296,751,297 $254,757,411 $208,950,510 $148,142,178 $146,043,537 $147,516,428 $157,220,673
Discount Rate 9.0% 9.0% 9.0% 9.0% 9.0% 9.0% 9.0% 9.0% 9.0% 9.0%
Discount Factor 0.42 0.39 0.36 0.33 0.30 0.27 0.25 0.23 0.21 0.19
Discounted Cashflow USD $141,701,806 $137,468,355 $133,355,031 $96,793,936 $76,235,255 $57,364,864 $37,312,535 $33,746,744 $31,272,559 $30,577,797
Cumi lative Nominal Cashflow $1,284,141,384 $1,638,868,358 $2,013,951,356 $2,310,702,653 $2,565,460,064 $2,774,410,574 $2,922,552,753 $3,068,596,290 $3,216,112,719 $3,373,333,391
Cumulative Discounted Cashflow $441,478,342 $578,946,697 $712,301,728 $809,095,665 $885,330,919 $942,695,783 $980,008,319 $1,013,755,063 $1,045,027,622 $1,075,605,419
Undiscounted Payback 0.00 0.00 0.00 0.00 0.00 0.00 0.00 0.00 0.00 0.00
Discounted Payback 0.00 0.00 0.00 0.00 0.00 0.00 0.00 0.00 0.00 0.00
Net Cash Flow USD $411,058,475 $435,104,046 $455,418,828 $364,409,223 $316,930,659 $260,028,655 $193,995,891 $188,873,179 $190,611,986 $201,526,849
Depreciation USD $41,918,221 $41,918,221 $41,918,221 $31,502,555 $26,649,830 $26,649,830 $26,649,830 $26,649,830 $26,649,830 $26,649,830
Taxable Income USD $488,100,108 $534,792,661 $532,371,941 $422,797,204 $365,601,899 $314,421,004 $271,643,615 $244,133,883 $245,779,572 $256,622,303
Carry Forward Losses USD $0 $0 $0 $0 $0 $0 $0 $0 $0 $0
Taxable Income USD $488,100,108 $534,792,661 $532,371,941 $422,797,204 $365,601,899 $314,421,004 $271,643,615 $244,133,883 $245,779,572 $256,622,303
Tax Rate % 0.0% 0.0% 0.0% 0.0% 0.0% 0.0% 0.0% 0.0% 0.0% 0.0%
Tax Pa id USD $0 $0 $0 $0 $0 $0 $0 $0 $0 $0
Nominal Cashflow USD $411,058,475 $435,104,046 $455,418,828 $364,409,223 $316,930,659 $260,028,655 $193,995,891 $188,873,179 $190,611,986 $201,526,849
Discount Rate 9.0% 9.0% 9.0% 9.0% 9.0% 9.0% 9.0% 9.0% 9.0% 9.0%
Discount Factor 0.42 0.39 0.36 0.33 0.30 0.27 0.25 0.23 0.21 0.19
Discounted Cashflow USD $173,635,542 $168,617,111 $161,917,208 $118,862,507 $94,840,379 $71,387,758 $48,861,699 $43,643,525 $40,408,548 $39,194,890
Cumi lative Nominal Cashflow $1,841,292,337 $2,276,396,382 $2,731,815,211 $3,096,224,434 $3,413,155,093 $3,673,183,748 $3,867,179,639 $4,056,052,818 $4,246,664,804 $4,448,191,652
Cumulative Discounted Cashflow $776,470,266 $945,087,377 $1,107,004,585 $1,225,867,093 $1,320,707,472 $1,392,095,230 $1,440,956,929 $1,484,600,454 $1,525,009,002 $1,564,203,892
Undiscounted Payback 0.00 0.00 0.00 0.00 0.00 0.00 0.00 0.00 0.00 0.00
Discounted Payback 0.00 0.00 0.00 0.00 0.00 0.00 0.00 0.00 0.00 0.00
Po
st T
axP
re T
ax
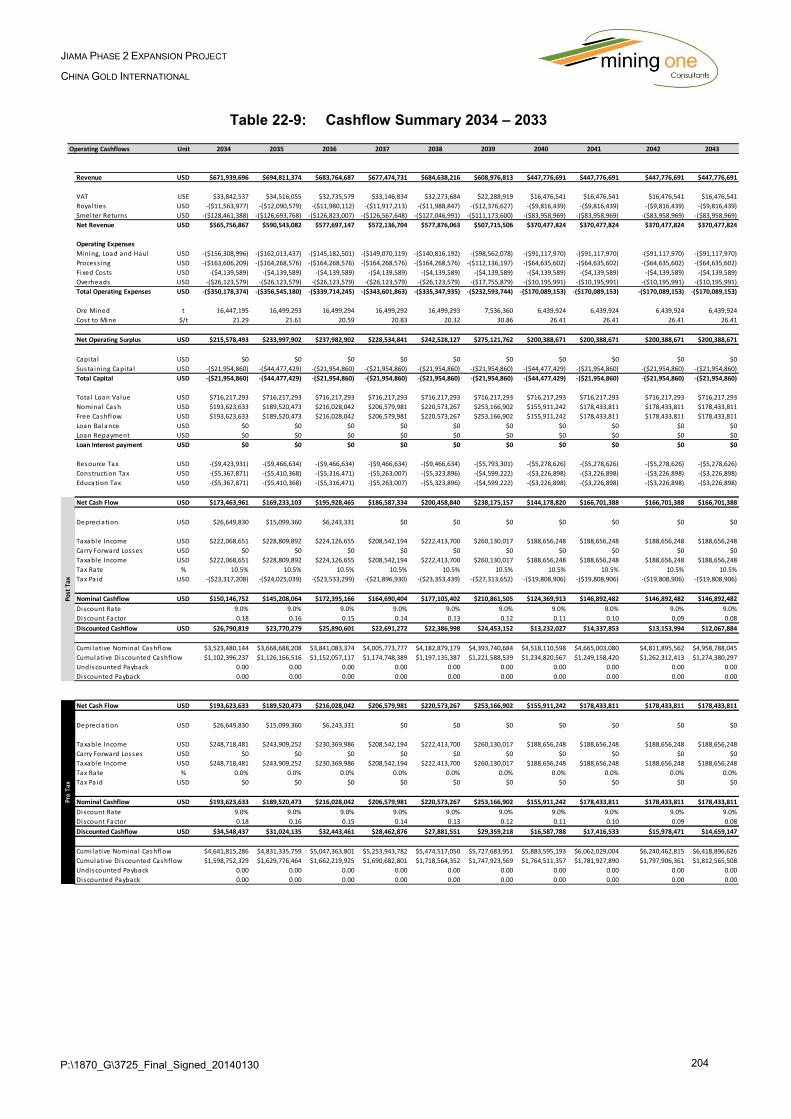
P:\1870_G\3725_Final_Signed_20140130 204
JIAMA PHASE 2 EXPANSION PROJECT
CHINA GOLD INTERNATIONAL
Table 22-9: Cashflow Summary 2034 – 2033
Operating Cashflows Unit 2034 2035 2036 2037 2038 2039 2040 2041 2042 2043
Revenue USD $671,939,696 $694,811,374 $683,764,687 $677,474,731 $684,638,216 $608,976,813 $447,776,691 $447,776,691 $447,776,691 $447,776,691
VAT USE $33,842,537 $34,516,055 $32,735,579 $33,146,834 $32,273,684 $22,288,919 $16,476,541 $16,476,541 $16,476,541 $16,476,541
Royalties USD -($11,563,977) -($12,090,579) -($11,980,112) -($11,917,213) -($11,988,847) -($12,376,627) -($9,816,439) -($9,816,439) -($9,816,439) -($9,816,439)
Smelter Returns USD -($128,461,388) -($126,693,768) -($126,823,007) -($126,567,648) -($127,046,991) -($111,173,600) -($83,958,969) -($83,958,969) -($83,958,969) -($83,958,969)
Net Revenue USD $565,756,867 $590,543,082 $577,697,147 $572,136,704 $577,876,063 $507,715,506 $370,477,824 $370,477,824 $370,477,824 $370,477,824
Operating Expenses
Mining, Load and Haul USD -($156,308,996) -($162,013,437) -($145,182,501) -($149,070,119) -($140,816,192) -($98,562,078) -($91,117,970) -($91,117,970) -($91,117,970) -($91,117,970)
Process ing USD -($163,606,209) -($164,268,576) -($164,268,576) -($164,268,576) -($164,268,576) -($112,136,197) -($64,635,602) -($64,635,602) -($64,635,602) -($64,635,602)
Fixed Costs USD -($4,139,589) -($4,139,589) -($4,139,589) -($4,139,589) -($4,139,589) -($4,139,589) -($4,139,589) -($4,139,589) -($4,139,589) -($4,139,589)
Overheads USD -($26,123,579) -($26,123,579) -($26,123,579) -($26,123,579) -($26,123,579) -($17,755,879) -($10,195,991) -($10,195,991) -($10,195,991) -($10,195,991)
Total Operating Expenses USD -($350,178,374) -($356,545,180) -($339,714,245) -($343,601,863) -($335,347,935) -($232,593,744) -($170,089,153) -($170,089,153) -($170,089,153) -($170,089,153)
Ore Mined t 16,447,195 16,499,293 16,499,294 16,499,292 16,499,293 7,536,360 6,439,924 6,439,924 6,439,924 6,439,924
Cost to Mine $/t 21.29 21.61 20.59 20.83 20.32 30.86 26.41 26.41 26.41 26.41
Net Operating Surplus USD $215,578,493 $233,997,902 $237,982,902 $228,534,841 $242,528,127 $275,121,762 $200,388,671 $200,388,671 $200,388,671 $200,388,671
Capita l USD $0 $0 $0 $0 $0 $0 $0 $0 $0 $0
Susta ining Capita l USD -($21,954,860) -($44,477,429) -($21,954,860) -($21,954,860) -($21,954,860) -($21,954,860) -($44,477,429) -($21,954,860) -($21,954,860) -($21,954,860)
Total Capital USD -($21,954,860) -($44,477,429) -($21,954,860) -($21,954,860) -($21,954,860) -($21,954,860) -($44,477,429) -($21,954,860) -($21,954,860) -($21,954,860)
Total Loan Value USD $716,217,293 $716,217,293 $716,217,293 $716,217,293 $716,217,293 $716,217,293 $716,217,293 $716,217,293 $716,217,293 $716,217,293
Nominal Cash USD $193,623,633 $189,520,473 $216,028,042 $206,579,981 $220,573,267 $253,166,902 $155,911,242 $178,433,811 $178,433,811 $178,433,811
Free Cashflow USD $193,623,633 $189,520,473 $216,028,042 $206,579,981 $220,573,267 $253,166,902 $155,911,242 $178,433,811 $178,433,811 $178,433,811
Loan Balance USD $0 $0 $0 $0 $0 $0 $0 $0 $0 $0
Loan Repayment USD $0 $0 $0 $0 $0 $0 $0 $0 $0 $0
Loan Interest payment USD $0 $0 $0 $0 $0 $0 $0 $0 $0 $0
Resource Tax USD -($9,423,931) -($9,466,634) -($9,466,634) -($9,466,634) -($9,466,634) -($5,793,301) -($5,278,626) -($5,278,626) -($5,278,626) -($5,278,626)
Construction Tax USD -($5,367,871) -($5,410,368) -($5,316,471) -($5,263,007) -($5,323,896) -($4,599,222) -($3,226,898) -($3,226,898) -($3,226,898) -($3,226,898)
Education Tax USD -($5,367,871) -($5,410,368) -($5,316,471) -($5,263,007) -($5,323,896) -($4,599,222) -($3,226,898) -($3,226,898) -($3,226,898) -($3,226,898)
Net Cash Flow USD $173,463,961 $169,233,103 $195,928,465 $186,587,334 $200,458,840 $238,175,157 $144,178,820 $166,701,388 $166,701,388 $166,701,388
Depreciation USD $26,649,830 $15,099,360 $6,243,331 $0 $0 $0 $0 $0 $0 $0
Taxable Income USD $222,068,651 $228,809,892 $224,126,655 $208,542,194 $222,413,700 $260,130,017 $188,656,248 $188,656,248 $188,656,248 $188,656,248
Carry Forward Losses USD $0 $0 $0 $0 $0 $0 $0 $0 $0 $0
Taxable Income USD $222,068,651 $228,809,892 $224,126,655 $208,542,194 $222,413,700 $260,130,017 $188,656,248 $188,656,248 $188,656,248 $188,656,248
Tax Rate % 10.5% 10.5% 10.5% 10.5% 10.5% 10.5% 10.5% 10.5% 10.5% 10.5%
Tax Pa id USD -($23,317,208) -($24,025,039) -($23,533,299) -($21,896,930) -($23,353,439) -($27,313,652) -($19,808,906) -($19,808,906) -($19,808,906) -($19,808,906)
Nominal Cashflow USD $150,146,752 $145,208,064 $172,395,166 $164,690,404 $177,105,402 $210,861,505 $124,369,913 $146,892,482 $146,892,482 $146,892,482
Discount Rate 9.0% 9.0% 9.0% 9.0% 9.0% 9.0% 9.0% 9.0% 9.0% 9.0%
Discount Factor 0.18 0.16 0.15 0.14 0.13 0.12 0.11 0.10 0.09 0.08
Discounted Cashflow USD $26,790,819 $23,770,279 $25,890,601 $22,691,272 $22,386,998 $24,453,152 $13,232,027 $14,337,853 $13,153,994 $12,067,884
Cumi lative Nominal Cashflow $3,523,480,144 $3,668,688,208 $3,841,083,374 $4,005,773,777 $4,182,879,179 $4,393,740,684 $4,518,110,598 $4,665,003,080 $4,811,895,562 $4,958,788,045
Cumulative Discounted Cashflow $1,102,396,237 $1,126,166,516 $1,152,057,117 $1,174,748,389 $1,197,135,387 $1,221,588,539 $1,234,820,567 $1,249,158,420 $1,262,312,413 $1,274,380,297
Undiscounted Payback 0.00 0.00 0.00 0.00 0.00 0.00 0.00 0.00 0.00 0.00
Discounted Payback 0.00 0.00 0.00 0.00 0.00 0.00 0.00 0.00 0.00 0.00
Net Cash Flow USD $193,623,633 $189,520,473 $216,028,042 $206,579,981 $220,573,267 $253,166,902 $155,911,242 $178,433,811 $178,433,811 $178,433,811
Depreciation USD $26,649,830 $15,099,360 $6,243,331 $0 $0 $0 $0 $0 $0 $0
Taxable Income USD $248,718,481 $243,909,252 $230,369,986 $208,542,194 $222,413,700 $260,130,017 $188,656,248 $188,656,248 $188,656,248 $188,656,248
Carry Forward Losses USD $0 $0 $0 $0 $0 $0 $0 $0 $0 $0
Taxable Income USD $248,718,481 $243,909,252 $230,369,986 $208,542,194 $222,413,700 $260,130,017 $188,656,248 $188,656,248 $188,656,248 $188,656,248
Tax Rate % 0.0% 0.0% 0.0% 0.0% 0.0% 0.0% 0.0% 0.0% 0.0% 0.0%
Tax Pa id USD $0 $0 $0 $0 $0 $0 $0 $0 $0 $0
Nominal Cashflow USD $193,623,633 $189,520,473 $216,028,042 $206,579,981 $220,573,267 $253,166,902 $155,911,242 $178,433,811 $178,433,811 $178,433,811
Discount Rate 9.0% 9.0% 9.0% 9.0% 9.0% 9.0% 9.0% 9.0% 9.0% 9.0%
Discount Factor 0.18 0.16 0.15 0.14 0.13 0.12 0.11 0.10 0.09 0.08
Discounted Cashflow USD $34,548,437 $31,024,135 $32,443,461 $28,462,876 $27,881,551 $29,359,218 $16,587,788 $17,416,533 $15,978,471 $14,659,147
Cumi lative Nominal Cashflow $4,641,815,286 $4,831,335,759 $5,047,363,801 $5,253,943,782 $5,474,517,050 $5,727,683,951 $5,883,595,193 $6,062,029,004 $6,240,462,815 $6,418,896,626
Cumulative Discounted Cashflow $1,598,752,329 $1,629,776,464 $1,662,219,925 $1,690,682,801 $1,718,564,352 $1,747,923,569 $1,764,511,357 $1,781,927,890 $1,797,906,361 $1,812,565,508
Undiscounted Payback 0.00 0.00 0.00 0.00 0.00 0.00 0.00 0.00 0.00 0.00
Discounted Payback 0.00 0.00 0.00 0.00 0.00 0.00 0.00 0.00 0.00 0.00
Post
Tax
Pre
Tax
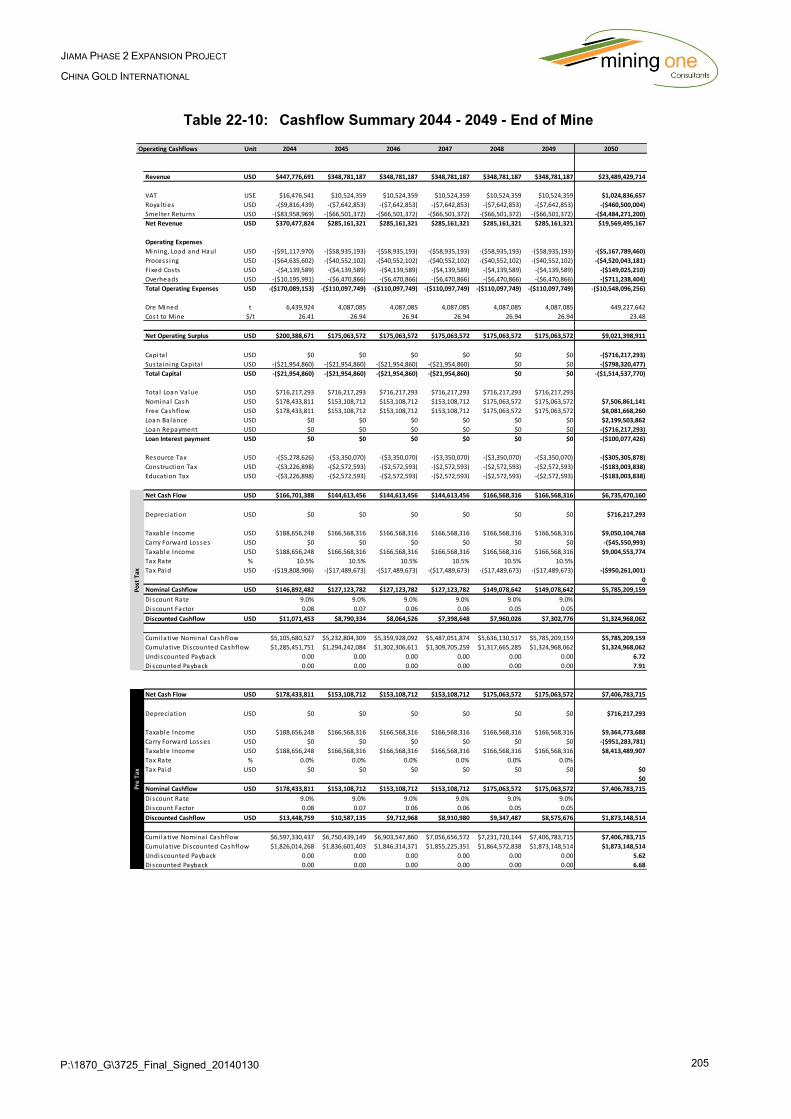
P:\1870_G\3725_Final_Signed_20140130 205
JIAMA PHASE 2 EXPANSION PROJECT
CHINA GOLD INTERNATIONAL
Table 22-10: Cashflow Summary 2044 - 2049 - End of Mine
Operating Cashflows Unit 2044 2045 2046 2047 2048 2049 2050
Revenue USD $447,776,691 $348,781,187 $348,781,187 $348,781,187 $348,781,187 $348,781,187 $23,489,429,714
VAT USE $16,476,541 $10,524,359 $10,524,359 $10,524,359 $10,524,359 $10,524,359 $1,024,836,657
Royalties USD -($9,816,439) -($7,642,853) -($7,642,853) -($7,642,853) -($7,642,853) -($7,642,853) -($460,500,004)
Smelter Returns USD -($83,958,969) -($66,501,372) -($66,501,372) -($66,501,372) -($66,501,372) -($66,501,372) -($4,484,271,200)
Net Revenue USD $370,477,824 $285,161,321 $285,161,321 $285,161,321 $285,161,321 $285,161,321 $19,569,495,167
Operating Expenses
Mining, Load and Haul USD -($91,117,970) -($58,935,193) -($58,935,193) -($58,935,193) -($58,935,193) -($58,935,193) -($5,167,789,460)
Process ing USD -($64,635,602) -($40,552,102) -($40,552,102) -($40,552,102) -($40,552,102) -($40,552,102) -($4,520,043,181)
Fixed Costs USD -($4,139,589) -($4,139,589) -($4,139,589) -($4,139,589) -($4,139,589) -($4,139,589) -($149,025,210)
Overheads USD -($10,195,991) -($6,470,866) -($6,470,866) -($6,470,866) -($6,470,866) -($6,470,866) -($711,238,404)
Total Operating Expenses USD -($170,089,153) -($110,097,749) -($110,097,749) -($110,097,749) -($110,097,749) -($110,097,749) -($10,548,096,256)
Ore Mined t 6,439,924 4,087,085 4,087,085 4,087,085 4,087,085 4,087,085 449,227,642
Cost to Mine $/t 26.41 26.94 26.94 26.94 26.94 26.94 23.48
Net Operating Surplus USD $200,388,671 $175,063,572 $175,063,572 $175,063,572 $175,063,572 $175,063,572 $9,021,398,911
Capita l USD $0 $0 $0 $0 $0 $0 -($716,217,293)
Susta ining Capita l USD -($21,954,860) -($21,954,860) -($21,954,860) -($21,954,860) $0 $0 -($798,320,477)
Total Capital USD -($21,954,860) -($21,954,860) -($21,954,860) -($21,954,860) $0 $0 -($1,514,537,770)
Tota l Loan Value USD $716,217,293 $716,217,293 $716,217,293 $716,217,293 $716,217,293 $716,217,293
Nominal Cash USD $178,433,811 $153,108,712 $153,108,712 $153,108,712 $175,063,572 $175,063,572 $7,506,861,141
Free Cashflow USD $178,433,811 $153,108,712 $153,108,712 $153,108,712 $175,063,572 $175,063,572 $8,081,668,260
Loan Balance USD $0 $0 $0 $0 $0 $0 $2,199,503,862
Loan Repayment USD $0 $0 $0 $0 $0 $0 -($716,217,293)
Loan Interest payment USD $0 $0 $0 $0 $0 $0 -($100,077,426)
Resource Tax USD -($5,278,626) -($3,350,070) -($3,350,070) -($3,350,070) -($3,350,070) -($3,350,070) -($305,305,878)
Construction Tax USD -($3,226,898) -($2,572,593) -($2,572,593) -($2,572,593) -($2,572,593) -($2,572,593) -($183,003,838)
Education Tax USD -($3,226,898) -($2,572,593) -($2,572,593) -($2,572,593) -($2,572,593) -($2,572,593) -($183,003,838)
Net Cash Flow USD $166,701,388 $144,613,456 $144,613,456 $144,613,456 $166,568,316 $166,568,316 $6,735,470,160
Depreciation USD $0 $0 $0 $0 $0 $0 $716,217,293
Taxable Income USD $188,656,248 $166,568,316 $166,568,316 $166,568,316 $166,568,316 $166,568,316 $9,050,104,768
Carry Forward Losses USD $0 $0 $0 $0 $0 $0 -($45,550,993)
Taxable Income USD $188,656,248 $166,568,316 $166,568,316 $166,568,316 $166,568,316 $166,568,316 $9,004,553,774
Tax Rate % 10.5% 10.5% 10.5% 10.5% 10.5% 10.5%
Tax Pa id USD -($19,808,906) -($17,489,673) -($17,489,673) -($17,489,673) -($17,489,673) -($17,489,673) -($950,261,001)
0
Nominal Cashflow USD $146,892,482 $127,123,782 $127,123,782 $127,123,782 $149,078,642 $149,078,642 $5,785,209,159
Discount Rate 9.0% 9.0% 9.0% 9.0% 9.0% 9.0%
Discount Factor 0.08 0.07 0.06 0.06 0.05 0.05
Discounted Cashflow USD $11,071,453 $8,790,334 $8,064,526 $7,398,648 $7,960,026 $7,302,776 $1,324,968,062
Cumi lative Nominal Cashflow $5,105,680,527 $5,232,804,309 $5,359,928,092 $5,487,051,874 $5,636,130,517 $5,785,209,159 $5,785,209,159
Cumulative Discounted Cashflow $1,285,451,751 $1,294,242,084 $1,302,306,611 $1,309,705,259 $1,317,665,285 $1,324,968,062 $1,324,968,062
Undiscounted Payback 0.00 0.00 0.00 0.00 0.00 0.00 6.72
Discounted Payback 0.00 0.00 0.00 0.00 0.00 0.00 7.91
Net Cash Flow USD $178,433,811 $153,108,712 $153,108,712 $153,108,712 $175,063,572 $175,063,572 $7,406,783,715
Depreciation USD $0 $0 $0 $0 $0 $0 $716,217,293
Taxable Income USD $188,656,248 $166,568,316 $166,568,316 $166,568,316 $166,568,316 $166,568,316 $9,364,773,688
Carry Forward Losses USD $0 $0 $0 $0 $0 $0 -($951,283,781)
Taxable Income USD $188,656,248 $166,568,316 $166,568,316 $166,568,316 $166,568,316 $166,568,316 $8,413,489,907
Tax Rate % 0.0% 0.0% 0.0% 0.0% 0.0% 0.0%
Tax Pa id USD $0 $0 $0 $0 $0 $0 $0
$0
Nominal Cashflow USD $178,433,811 $153,108,712 $153,108,712 $153,108,712 $175,063,572 $175,063,572 $7,406,783,715
Discount Rate 9.0% 9.0% 9.0% 9.0% 9.0% 9.0%
Discount Factor 0.08 0.07 0.06 0.06 0.05 0.05
Discounted Cashflow USD $13,448,759 $10,587,135 $9,712,968 $8,910,980 $9,347,487 $8,575,676 $1,873,148,514
Cumi lative Nominal Cashflow $6,597,330,437 $6,750,439,149 $6,903,547,860 $7,056,656,572 $7,231,720,144 $7,406,783,715 $7,406,783,715
Cumulative Discounted Cashflow $1,826,014,268 $1,836,601,403 $1,846,314,371 $1,855,225,351 $1,864,572,838 $1,873,148,514 $1,873,148,514
Undiscounted Payback 0.00 0.00 0.00 0.00 0.00 0.00 5.62
Discounted Payback 0.00 0.00 0.00 0.00 0.00 0.00 6.68
Pre
Tax
Po
st T
ax

P:\1870_G\3725_Final_Signed_20140130 206
JIAMA PHASE 2 EXPANSION PROJECT
CHINA GOLD INTERNATIONAL
22.6 Summary
A summary of the economic analysis is shown in Table 22-11 for the pre and post-tax amounts
at the discount rate of 9%.
The Open Pits of the Jiama Phase II Expansion project are expected to have a combined post-
tax net present value of USD 1.324 billion with an internal rate of return of 24.0%.
Given the discussed capital costs, the project will pay itself off in approximately 8 years.
Table 22-11: Economic Analysis Results
Project KPI Unit Pre-Tax Post-Tax
Total Cash USD 7,406,783,715 5,785,209,159
Net Present Value (NPV) USD 1,873,148,514 1,324,968,062
Internal Rate of Return (IRR) % 29.7% 24.0%
Payback Period (Undisc. Cash) Years 5.62 6.72
Payback Period (Disc. Cash) Years 6.68 7.91
Max. Cash Draw Down (Undisc. Cash) USD -($401,548,388)
Max. Cash Draw Down (Disc. Cash) USD -($401,548,388)
Operating Margin (EBITA / Revenue) % 38.4%
Figure 22-1 shows the pre-tax cumulative discounted cash flow at 9% to be equal to USD 1.873
Billion. The graph shows that the project has negative cash flows in the first three years. This is
due to large initial capital expenditures which includes stripping and development and
processing plant upgrade. In addition, low metal production revenue relative to costs in these
initial years contribute to negative cash flows. However, the cumulative cash flow becomes
positive in Year 6 as metal production ramps up.
Mining One estimates that the post-tax payback period of this project is equal to approximately
8 years. Figure 22-1 and Figure 22-2 show the cumulative discounted and undiscounted pre-tax
cash flows and NPV of the project.
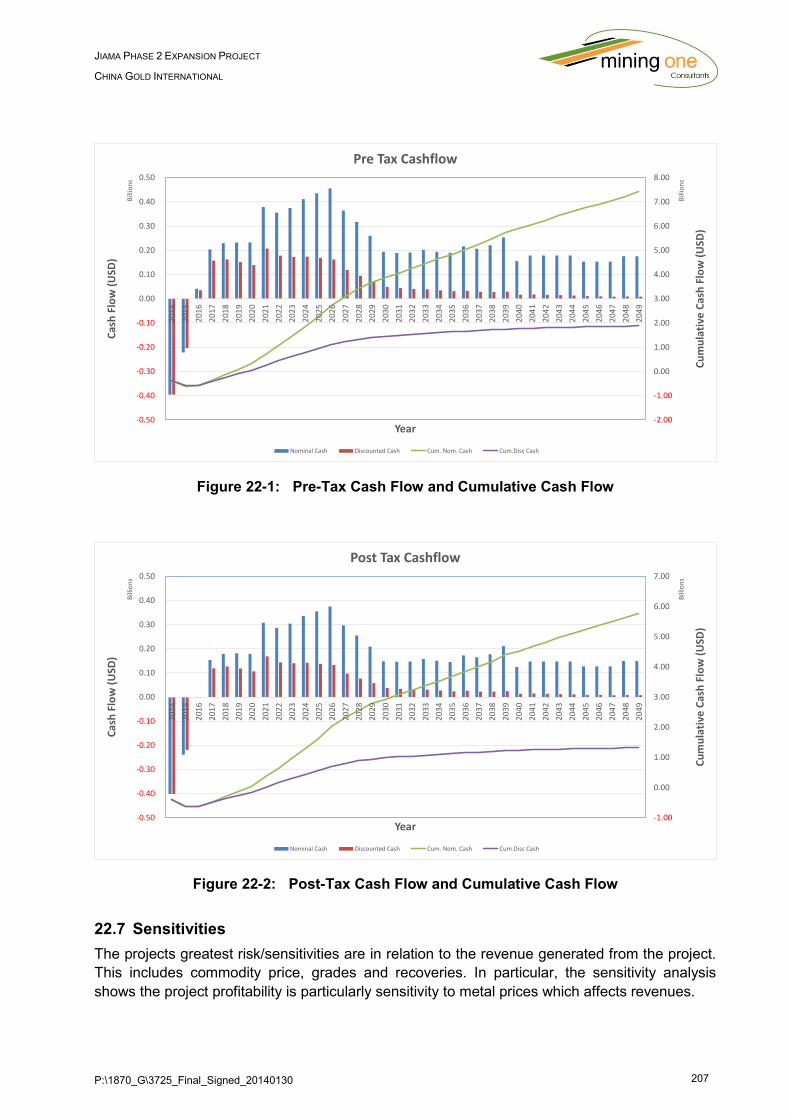
P:\1870_G\3725_Final_Signed_20140130 207
JIAMA PHASE 2 EXPANSION PROJECT
CHINA GOLD INTERNATIONAL
Figure 22-1: Pre-Tax Cash Flow and Cumulative Cash Flow
Figure 22-2: Post-Tax Cash Flow and Cumulative Cash Flow
22.7 Sensitivities
The projects greatest risk/sensitivities are in relation to the revenue generated from the project.
This includes commodity price, grades and recoveries. In particular, the sensitivity analysis
shows the project profitability is particularly sensitivity to metal prices which affects revenues.
-2.00
-1.00
0.00
1.00
2.00
3.00
4.00
5.00
6.00
7.00
8.00
-0.50
-0.40
-0.30
-0.20
-0.10
0.00
0.10
0.20
0.30
0.40
0.502
01
4
20
15
201
6
20
17
20
18
20
19
20
20
20
21
20
22
20
23
20
24
20
25
20
26
20
27
20
28
20
29
20
30
20
31
20
32
20
33
20
34
20
35
203
6
20
37
20
38
20
39
20
40
20
41
20
42
20
43
20
44
20
45
20
46
20
47
20
48
20
49
Cu
mu
lati
ve C
ash
Flo
w (
USD
)
Bill
ion
s
Cas
h F
low
(U
SD)
Bill
ion
s
Year
Pre Tax Cashflow
Nominal Cash Discounted Cash Cum. Nom. Cash Cum.Disc Cash
-1.00
0.00
1.00
2.00
3.00
4.00
5.00
6.00
7.00
-0.50
-0.40
-0.30
-0.20
-0.10
0.00
0.10
0.20
0.30
0.40
0.50
20
14
20
15
20
16
20
17
20
18
20
19
20
20
20
21
20
22
20
23
20
24
20
25
20
26
20
27
20
28
20
29
203
0
20
31
20
32
20
33
20
34
20
35
20
36
20
37
20
38
20
39
20
40
20
41
20
42
204
3
20
44
20
45
20
46
20
47
20
48
20
49
Cu
mu
lati
ve C
ash
Flo
w (
USD
)
Bill
ion
s
Cas
h F
low
(U
SD)
Bill
ion
s
Year
Post Tax Cashflow
Nominal Cash Discounted Cash Cum. Nom. Cash Cum.Disc Cash
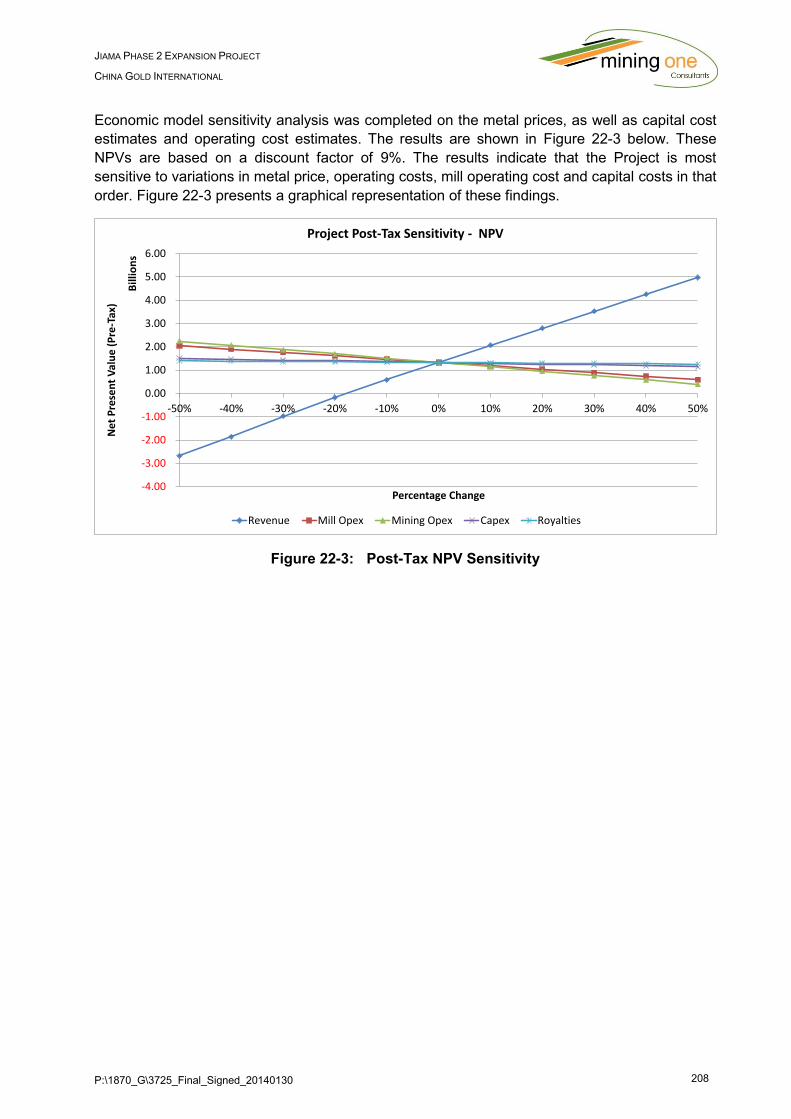
P:\1870_G\3725_Final_Signed_20140130 208
JIAMA PHASE 2 EXPANSION PROJECT
CHINA GOLD INTERNATIONAL
Economic model sensitivity analysis was completed on the metal prices, as well as capital cost
estimates and operating cost estimates. The results are shown in Figure 22-3 below. These
NPVs are based on a discount factor of 9%. The results indicate that the Project is most
sensitive to variations in metal price, operating costs, mill operating cost and capital costs in that
order. Figure 22-3 presents a graphical representation of these findings.
Figure 22-3: Post-Tax NPV Sensitivity
-4.00
-3.00
-2.00
-1.00
0.00
1.00
2.00
3.00
4.00
5.00
6.00
-50% -40% -30% -20% -10% 0% 10% 20% 30% 40% 50%
Net
Pre
sen
t V
alu
e (
Pre
-Tax
)
Bill
ion
s
Percentage Change
Project Post-Tax Sensitivity - NPV
Revenue Mill Opex Mining Opex Capex Royalties
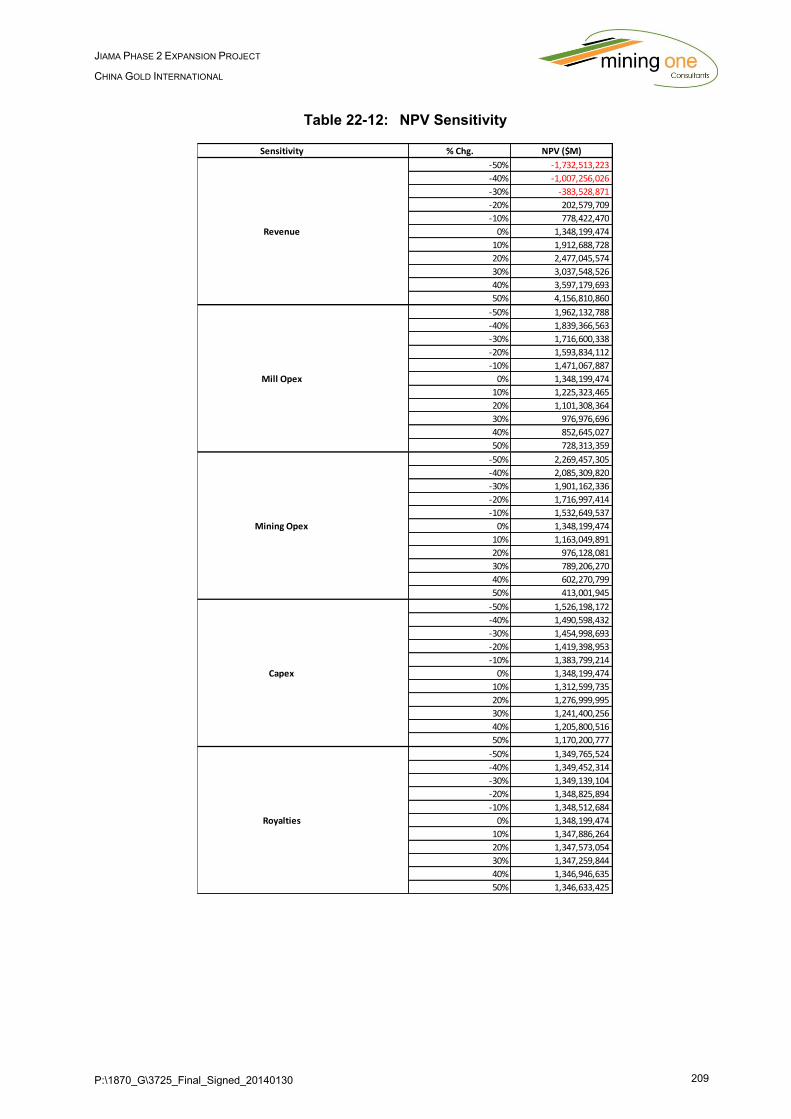
P:\1870_G\3725_Final_Signed_20140130 209
JIAMA PHASE 2 EXPANSION PROJECT
CHINA GOLD INTERNATIONAL
Table 22-12: NPV Sensitivity
Sensitivity % Chg. NPV ($M)
-50% -1,732,513,223
-40% -1,007,256,026
-30% -383,528,871
-20% 202,579,709
-10% 778,422,470
0% 1,348,199,474
10% 1,912,688,728
20% 2,477,045,574
30% 3,037,548,526
40% 3,597,179,693
50% 4,156,810,860
-50% 1,962,132,788
-40% 1,839,366,563
-30% 1,716,600,338
-20% 1,593,834,112
-10% 1,471,067,887
0% 1,348,199,474
10% 1,225,323,465
20% 1,101,308,364
30% 976,976,696
40% 852,645,027
50% 728,313,359
-50% 2,269,457,305
-40% 2,085,309,820
-30% 1,901,162,336
-20% 1,716,997,414
-10% 1,532,649,537
0% 1,348,199,474
10% 1,163,049,891
20% 976,128,081
30% 789,206,270
40% 602,270,799
50% 413,001,945
-50% 1,526,198,172
-40% 1,490,598,432
-30% 1,454,998,693
-20% 1,419,398,953
-10% 1,383,799,214
0% 1,348,199,474
10% 1,312,599,735
20% 1,276,999,995
30% 1,241,400,256
40% 1,205,800,516
50% 1,170,200,777
-50% 1,349,765,524
-40% 1,349,452,314
-30% 1,349,139,104
-20% 1,348,825,894
-10% 1,348,512,684
0% 1,348,199,474
10% 1,347,886,264
20% 1,347,573,054
30% 1,347,259,844
40% 1,346,946,635
50% 1,346,633,425
Mining Opex
Capex
Royalties
Revenue
Mill Opex

P:\1870_G\3725_Final_Signed_20140130 210
JIAMA PHASE 2 EXPANSION PROJECT
CHINA GOLD INTERNATIONAL
23 ADJACENT PROPERTIES
Mining One are not aware of any adjacent properties in the immediate vicinity of the mine that
could potential materially impacts the Resource and Reserve Estimate.

P:\1870_G\3725_Final_Signed_20140130 211
JIAMA PHASE 2 EXPANSION PROJECT
CHINA GOLD INTERNATIONAL
24 OTHER RELEVANT DATA AND INFORMATION
Mining One personnel have reviewed a significant amount of material and identified the
pertinent material that materially impacts the Resource and Reserve estimate. There is
significantly more supportive data contained within various prefeasibility and feasibility studies
that provides the foundation for much of the data contained within this report but was not
specifically reviewed.
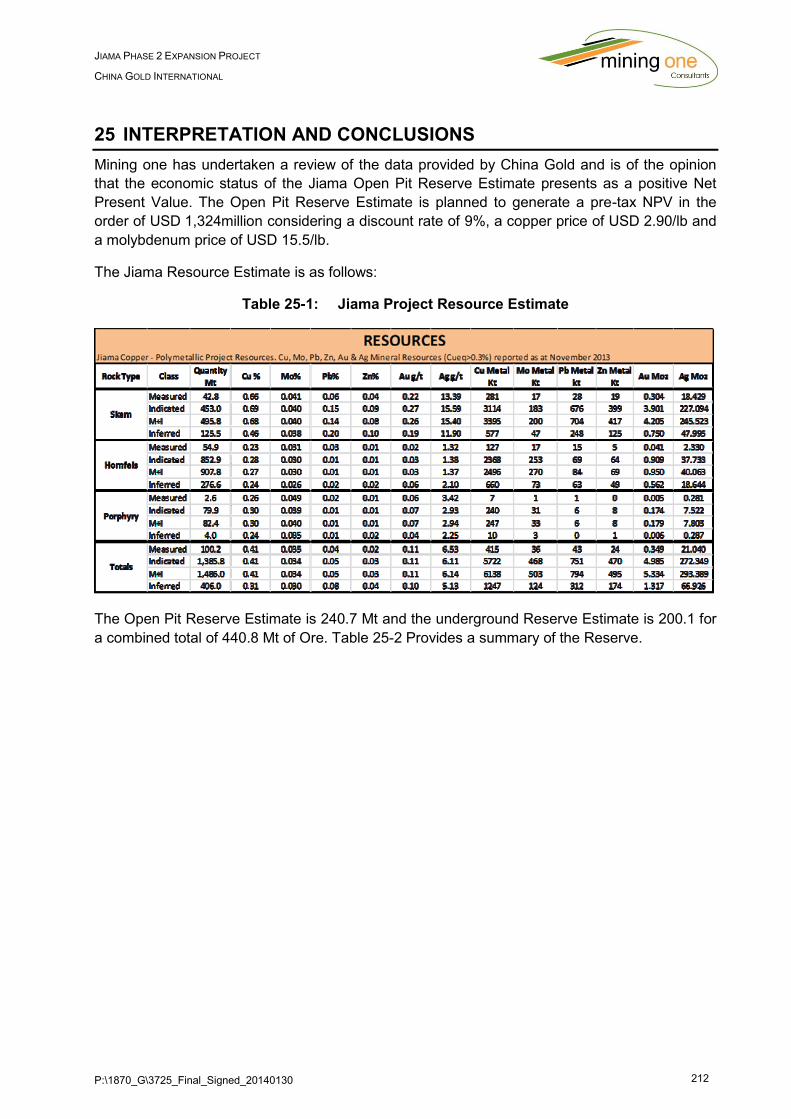
P:\1870_G\3725_Final_Signed_20140130 212
JIAMA PHASE 2 EXPANSION PROJECT
CHINA GOLD INTERNATIONAL
25 INTERPRETATION AND CONCLUSIONS
Mining one has undertaken a review of the data provided by China Gold and is of the opinion
that the economic status of the Jiama Open Pit Reserve Estimate presents as a positive Net
Present Value. The Open Pit Reserve Estimate is planned to generate a pre-tax NPV in the
order of USD 1,324million considering a discount rate of 9%, a copper price of USD 2.90/lb and
a molybdenum price of USD 15.5/lb.
The Jiama Resource Estimate is as follows:
Table 25-1: Jiama Project Resource Estimate
The Open Pit Reserve Estimate is 240.7 Mt and the underground Reserve Estimate is 200.1 for
a combined total of 440.8 Mt of Ore. Table 25-2 Provides a summary of the Reserve.
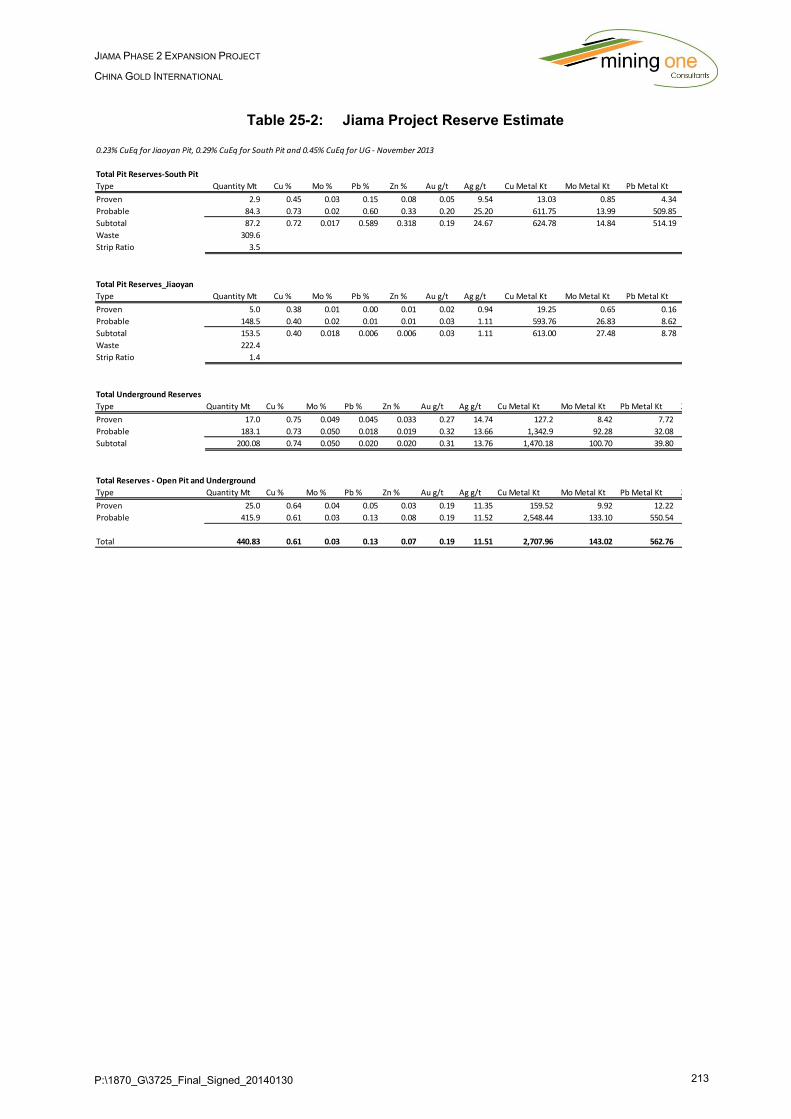
P:\1870_G\3725_Final_Signed_20140130 213
JIAMA PHASE 2 EXPANSION PROJECT
CHINA GOLD INTERNATIONAL
Table 25-2: Jiama Project Reserve Estimate
0.23% CuEq for Jiaoyan Pit, 0.29% CuEq for South Pit and 0.45% CuEq for UG - November 2013
Total Pit Reserves-South Pit
Type Quantity Mt Cu % Mo % Pb % Zn % Au g/t Ag g/t Cu Metal Kt Mo Metal Kt Pb Metal Kt Zn Metal Kt Au Moz Ag Moz
Proven 2.9 0.45 0.03 0.15 0.08 0.05 9.54 13.03 0.85 4.34 2.43 0.00 0.89
Probable 84.3 0.73 0.02 0.60 0.33 0.20 25.20 611.75 13.99 509.85 275.03 0.53 68.31
Subtotal 87.2 0.72 0.017 0.589 0.318 0.19 24.67 624.78 14.84 514.19 277.46 0.54 69.20
Waste 309.6
Strip Ratio 3.5
Total Pit Reserves_Jiaoyan
Type Quantity Mt Cu % Mo % Pb % Zn % Au g/t Ag g/t Cu Metal Kt Mo Metal Kt Pb Metal Kt Zn Metal Kt Au Moz Ag Moz
Proven 5.0 0.38 0.01 0.00 0.01 0.02 0.94 19.25 0.65 0.16 0.29 0.00 0.15
Probable 148.5 0.40 0.02 0.01 0.01 0.03 1.11 593.76 26.83 8.62 8.65 0.15 5.32
Subtotal 153.5 0.40 0.018 0.006 0.006 0.03 1.11 613.00 27.48 8.78 8.94 0.16 5.47
Waste 222.4
Strip Ratio 1.4
Total Underground Reserves
Type Quantity Mt Cu % Mo % Pb % Zn % Au g/t Ag g/t Cu Metal Kt Mo Metal Kt Pb Metal Kt Zn Metal Kt Au Moz Ag Moz
Proven 17.0 0.75 0.049 0.045 0.033 0.27 14.74 127.2 8.42 7.72 5.54 0.15 8.06
Probable 183.1 0.73 0.050 0.018 0.019 0.32 13.66 1,342.9 92.28 32.08 34.87 1.85 80.43
Subtotal 200.08 0.74 0.050 0.020 0.020 0.31 13.76 1,470.18 100.70 39.80 40.40 2.00 88.49
Total Reserves - Open Pit and Underground
Type Quantity Mt Cu % Mo % Pb % Zn % Au g/t Ag g/t Cu Metal Kt Mo Metal Kt Pb Metal Kt Zn Metal Kt Au Moz Ag Moz
Proven 25.0 0.64 0.04 0.05 0.03 0.19 11.35 159.52 9.92 12.22 8.25 0.15 9.11
Probable 415.9 0.61 0.03 0.13 0.08 0.19 11.52 2,548.44 133.10 550.54 318.55 2.53 154.06
Total 440.83 0.61 0.03 0.13 0.07 0.19 11.51 2,707.96 143.02 562.76 326.81 2.69 163.17
P:\1870_G\3725_Final_Signed_20140130 214
JIAMA PHASE 2 EXPANSION PROJECT
CHINA GOLD INTERNATIONAL
26 RECOMMENDATIONS
The current open pit operation is being mined utilising contractors, based on a thorough
examination of the data supplied to Mining One a flat rate of 38.23 RMB/bcm and 36.93
RMB/bcm for Jiaoyan and South Pit respectively has been applied for the excavation and
haulage of both waste and ore. While a thorough review of the agreement was not
undertaken it is the opinion of the author that Mining loss and dilution could be
compromised due to the pricing mechanisms. A flat rate provides minimal incentive for
optimising the loss and dilution parameters and provides motivation for bulk earthworks.
With this said, the contract was not sighted to validate if other mechanisms have been
included in the agreement.
The underground schedule provides an adequate overview of the mining reserves for the
life of mine. It would be recommended that further definition of the underground be carried
out to better define the mining methods and the use of bottom up stoping as opposed to
the currently scheduled top down method.
Based on an earlier high level review of the Jiama deposit, it is Mining One’s opinion that
there is opportunity to increase the size of the current open pit operations:
- The southern extent of the ore body has not been closed off by the exploration
program, therefore there is potential of further mineralisation to the south. It is
recommended that further drilling be conducted to understand the true extents of the
resource.
- Current market prices have been applied to the financial modelling. A number of the
commodities are believed to be reflective of a soft market and therefore there is
opportunity for improvements in the sales revenue if a shift in pricing occurred.
- The current waste management (waste dumps) present a risk to further extension of
the ore body to the south as waste dump #4 is located directly to the south of the
South pit. It is recommended that sterilisation drilling be conducted prior to the
commencement of this and other waste dumps.
Mining and exploration licences are current however the rates of mining that have been
nominated on these licences is below the production rates anticipated from the Phase II
development. It is advisable that these licences be reviewed in line with or above the
current production expectations. This has been noted previously and it is Mining One’s
understanding that new titles will not be issued by the Chinese authorities until the expiry
of the current titles.
P:\1870_G\3725_Final_Signed_20140130 215
JIAMA PHASE 2 EXPANSION PROJECT
CHINA GOLD INTERNATIONAL
27 REFERENCES
1. Beher Dolbear – Resource update Report on the Jiama Copper-Polymetallic Project in
Metrorkongak Country, Tibet Autonomous Region, Peoples Republic of China’, dated
March 2012.
2. Changchun Gold Design Institute – Jiama Phase 2 Preliminary Design Capital Cost
Report (November 2013).
3. Changsha Institute of Mining Research limited liability company of Tibet, Huatai Dragon
mining limited February 2013 “Methyl – Ma Cu – polymetallic deposit in Tibet South Pit,
Open Pit Slope Stability Studies”.
4. Minarco MineConsult – Jiama Copper-Polymetalic Project – Pre-Feasibility Study
Technical Report (12th November 2012) – “the MMC Report (2012)”.
5. MMC20130510_ADV-HK-03709 China Gold Tibet Jiama Gold NI 43-101_PFS.
6. Changchun Gold Design Institute - Feasibility Study for the Phase II Expansion Project
(2011) – “the CGDI Report (2011).
7. Beijing General Research Institute of Mining and Metallurgy and Huatailong Mining
Development Co. Ltd.
8. Burchfiel, B.C., and Zhiliang, C., 2012. Tectonics of the Southeastern Tibetan Plateau and
Its Adjacent Foreland.
9. (International Copper Study Group, 2013a).
10. (International Copper Study Group, 2013b).
11. International Molybdenum Association, 2013.
12. Chinese Institute Preliminary Design Report December 2012 – Translated.
13. Mining One, 18th June 2013, “Geotechnical Review of the Jiama Polymetallic Deposit,
Tibet – Southern Pit Slope Stability Studies”.
14. Changchun Gold Design, February 2013, “Tibet, Jiama polymetallic Phase I and II
infrastructure engineering; Open Pit Slope Stability Study”.
15. Changsha Institute of Mining Research Co. Ltd, Feb 2013, "Methyl-Ma CU-polymetallic
deposit in Tibet nankeng open-pit slope stability studies", Tibet huatai Dragon mining
limited. SOUTH PIT.
16. Changsha Institute of Mining Research Co. Ltd, Feb 2013, "Methyl-Ma CU-polymetallic
deposit in Tibet nankeng open-pit slope stability studies", Tibet huatai Dragon mining
limited. JIAOYAN PIT.
17. Changsha Institute of Mining Research Co. Ltd, March 2013, "Jiama copper polymetallic
ore two construction projects, Underground mining rock mechanics research report",
Huatailong Mining Development Co. Ltd. UNDERGROUND MINE.
18. Changsha Institute of Mining Research Co. Ltd, 19 Aug 2013, "Jiama Post Incident
Report".
19. Changchun Design Institute, Oct 2013, "Jiaoyan Open Pit Safety Specifications".
20. Changchun Design Institute, Oct 2013, "Jiama Phase II Underground Project Safety
Specifications".
P:\1870_G\3725_Final_Signed_20140130 216
JIAMA PHASE 2 EXPANSION PROJECT
CHINA GOLD INTERNATIONAL
21. Changsha Nonferrous Metallurgy Design and Research Institute Co., Ltd. 2012 June.
22. Guolanggou Tailing Dam Feasibility Report.
23. Metal and nonmetal mines safety regulations” (GB16423-2006).
P:\1870_G\3725_Final_Signed_20140130 217
JIAMA PHASE 2 EXPANSION PROJECT
CHINA GOLD INTERNATIONAL
28 SIGNATURE PAGE
CERTIFICATE OF QUALIFIED PERSON
I, Bin Guo, do hereby certify that:
1. I am a Geologist. My address is 93 Kent Road, North Ryde, NSW, Australia. My
current occupation is director of GL resources Pty Ltd.
2. I am an author of the Technical Report entitled Jiama Phase II Expansion Project Mineral Resources and Reserves – with an effective date of 20th of December 2013 (the “Technical Report”) prepared for China Gold International
3. I am a graduate of Jilin University, Changchun, China with a Bachelor of Science (Geology), graduating in 1992. I am a Member in good standing of the Australian Institute of Geoscientists AIG, membership number 4201. I have over 13 years’ experience in the exploration, development and mining of mineral properties in Australia and China and am familiar with and have visited a variety of styles of mineral deposits worldwide including estimating and reporting of Mineral Resources for copper projects to NI43-101 standards
4. I have read the definition of “qualified person’ set out in National Instrument 43-101 (“NI 43-101) and certify by reason of my education, affiliation with a professional association (as defined in NI 43-101) and experience, I am a “Qualified Person” for purposes of NI 43-101.
5. I have visited the Property that is the subject of this Technical Report on behalf of China Gold International on the 14th to 16th of July 2013.
6. I am responsible for Sections 1 – 14 of this Technical Report titled “NI 43-101 Technical Report Jiama Phase 2 Expansion Project, Mineral Resources and Reserves for China Gold International” dated September, 2013 (“Technical Report”).
7. I am independent of China Gold International as defined by Section 1.5 of NI 43-101.
8. I have had no prior association or involvement with the property that is subject of this Technical Report.
9. I have read National Instrument 43-101 and Form 43-101F1, and this Technical Report has been prepared in compliance with that instrument and form.
10. As of the date of this certificate, to the best of my knowledge, information and belief, this Technical Report contains all scientific and technical information that is required to be disclosed to make the technical report not misleading.
Dated this 20th Day of December 2013
Bin Guo, BSc Geology Ph.D. Geophysics, MAIG, MAusIMM
Director GL Resources Pty Ltd.
P:\1870_G\3725_Final_Signed_20140130 218
JIAMA PHASE 2 EXPANSION PROJECT
CHINA GOLD INTERNATIONAL
CERTIFICATE OF QUALIFIED PERSON
I Anthony R. Cameron do hereby certify that:
1. I am a Mining Engineer. My address is 20/F Central Tower, 28 Queen’s Road, Central, Hong Kong. My current occupation is Director and Principal Mining Engineer.
2. I am an author of the Technical Report entitled Jiama Phase II Expansion Project Mineral Resources and Reserves – with an effective date of 20th of December 2013 (the “Technical Report”) prepared for China Gold International
3. I am a graduate of the University of Queensland, B.E. (Mining), graduating in 1988. I am a Fellow in good standing of the AUSIMM, membership number 108264. In addition I was awarded a Graduate Diploma in Business by Curtin University in Western Australia in 2000, and a Masters in Commercial Law by the University of Melbourne in 2004. I have worked as a mining engineer for 26 years, 13 of those years being directly involved in Mineral Reserve estimation, and 11 of those years being directly involved in estimating and reporting Mineral Reserves for copper projects to NI 43-101 standards.
4. I have read the definition of “qualified person’ set out in National Instrument 43-101 (“NI 43-101) and certify by reason of my education, affiliation with a professional association (as defined in NI 43-101) and experience, I am a “Qualified Person” for purposes of NI 43-101.
5. I have visited the Property that is the subject of this Technical Report on behalf of China Gold International in May 2012. On the 14th to 17th of July 2013, I deputised Mr Jeff Zhang, a mining engineer employed by Micromine Consulting Services, to carry out a site visit on my behalf and under my instructions.
6. I am responsible for Sections 1 – 3 and 15 – 27 of this Technical Report titled “NI 43-101 Technical Report Jiama Phase 2 Expansion Project, Mineral Resources and Reserves for China Gold International” dated September, 2013 (“Technical Report”).
7. I am independent of China Gold International as defined by Section 1.5 of NI 43-101.
8. I have had no prior association or involvement with the property that is subject of this Technical Report.
9. I have read National Instrument 43-101 and Form 43-101F1, and this Technical Report has been prepared in compliance with that instrument and form.
10. As of the date of this certificate, to the best of my knowledge, information and belief, this Technical Report contains all scientific and technical information that is required to be disclosed to make the technical report not misleading.
Dated this 20th Day of December 2013
Anthony R. Cameron , BE(Mining), Grad Dip Bus, M Comm Law, FAusIMM.
Director and Principal Mining Engineer
CMC Ltd
P:\1870_G\3725_Final_Signed_20140130 219
JIAMA PHASE 2 EXPANSION PROJECT
CHINA GOLD INTERNATIONAL
DOCUMENT INFORMATION
Status Final
Version 2
Print Date 18th December 2013
Author(s) Stuart Hutchin, Cameron Farrington
Reviewed By Dean Basile (All Sections), Kevin Dugan (Geotechnical), Mark Van Leuven
(All Sections)
Pathname P:\1870_G China Gold International - Jiama
Feasibility\WPO\Drafts\3725_Final.docx
File Name 3725_Final.docx
Job No 1870_G
Distribution PDF placed on FTP for client
DOCUMENT CHANGE CONTROL
Version Description of changes/amendments Author (s) Date
2 Final Report S. Hutchin,
C. Farrington
18/12/13
DOCUMENT REVIEW AND SIGN OFF
Version Reviewer Position Signature Date
2 Dean Basile Manager Mining
18/12/13


![[3937]-101 P553](https://static.fdokumen.com/doc/165x107/63338430a6138719eb0aa5bc/3937-101-p553.jpg)