Paracatu Mine Brazil National Instrument 43-101 Technical ...
158
Paracatu Mine Brazil National Instrument 43-101 Technical Report Prepared for: Kinross Gold Corporation Prepared by: John Sims, AIPG Certified Professional Geologist Effective Date: March 10, 2020
-
Upload
khangminh22 -
Category
Documents
-
view
0 -
download
0
Transcript of Paracatu Mine Brazil National Instrument 43-101 Technical ...

Paracatu Mine Brazil
National Instrument 43-101 Technical Report
Prepared for: Kinross Gold Corporation Prepared by: John Sims, AIPG Certified Professional Geologist Effective Date: March 10, 2020
Kinross Gold Corporation Paracatu Project
Brazil NI 43-101 Technical Report
TOC i
C O N T E N T S
1. SUMMARY ....................................................................................................................................... 7 1.1 Executive Summary ............................................................................................................. 7 1.2 Technical Summary ............................................................................................................. 7
2. INTRODUCTION ............................................................................................................................ 14 2.1 Qualified Person ................................................................................................................ 14 2.2 Information Sources .......................................................................................................... 14 2.3 Effective Dates .................................................................................................................. 15 2.4 List of Abbreviations .......................................................................................................... 16
3. RELIANCE ON OTHER EXPERTS ................................................................................................ 17
4. PROPERTY DESCRIPTION AND LOCATION .............................................................................. 18 4.1 Location ............................................................................................................................. 18 4.2 Mineral Tenure .................................................................................................................. 18 4.3 Mineral Rights .................................................................................................................... 20 4.4 Royalties and Other Encumbrances .................................................................................. 21 4.5 Permitting........................................................................................................................... 21
5. ACCESSIBILITY, CLIMATE, LOCAL RESOURCES, INFRASTRUCTURE AND PHYSIOGRAPHY ........................................................................................................................... 26 5.1 Accessibility ....................................................................................................................... 26 5.2 Climate ............................................................................................................................... 26 5.3 Local Resources and Infrastructure .................................................................................. 26 5.4 Physiography and Environment ........................................................................................ 27
6. HISTORY ........................................................................................................................................ 28 6.1 Prior Ownership ................................................................................................................. 28 6.2 Exploration and Development History ............................................................................... 28 6.3 Historical Resource Estimates........................................................................................... 29 6.4 Past Production ................................................................................................................. 30
7. GEOLOGICAL SETTING ............................................................................................................... 32 7.1 Regional Geology .............................................................................................................. 32 7.2 Local Geology .................................................................................................................... 34 7.3 Property Geology ............................................................................................................... 37 7.4 Mineralization .................................................................................................................... 39
8. DEPOSIT TYPES ........................................................................................................................... 42
9. EXPLORATION .............................................................................................................................. 43 9.1 Mining Leases ................................................................................................................... 43 9.2 Exploration Licences ......................................................................................................... 43
10. DRILLING ....................................................................................................................................... 44 10.1 Drilling Programs ............................................................................................................... 44 10.2 Logging Procedures .......................................................................................................... 45 10.3 Collar Surveys ................................................................................................................... 45 10.4 Down-hole Surveys ........................................................................................................... 45 10.5 Core Recovery ................................................................................................................... 47

Kinross Gold Corporation Paracatu Project
Brazil NI 43-101 Technical Report
TOC ii
10.6 Comments on Drill Programs ............................................................................................ 48
11. SAMPLE COLLECTION, PREPARATION, ANALYSES, AND SECURITY ................................... 49 11.1 Sampling Method and Approach ....................................................................................... 49 11.2 Sample Security and Chain of Custody ............................................................................. 50 11.3 Sample Preparation, Analyses and Security ..................................................................... 50 11.4 Background on Quality Assurance and Quality Control .................................................... 51 11.5 Quality Assurance and Quality Control for Drilling Programs ........................................... 52 11.6 Database ........................................................................................................................... 54 11.7 Comment on Sample Collection, Preparation, Analysis and Security .............................. 54
12. DATA VERIFICATION .................................................................................................................... 56
13. MINERAL PROCESSING AND METALLURGICAL TESTING ...................................................... 57 13.1 Deposit Mineralogical Characterization ............................................................................. 57 13.2 Rougher Tails Characterization ......................................................................................... 60 13.3 Leaching ............................................................................................................................ 62 13.4 Clay Minerals ..................................................................................................................... 65 13.5 Gravity and GRG ............................................................................................................... 66 13.6 BWI and Throughput Model............................................................................................... 66
14. MINERAL RESOURCE ESTIMATE ............................................................................................... 68 14.1 Summary of Mineral Resources ........................................................................................ 68 14.2 Resource Database ........................................................................................................... 69 14.3 Geological Model and Estimation Domains ....................................................................... 70 14.4 Statistical Analysis and Compositing ................................................................................. 76 14.5 Variography and Continuity Analysis ................................................................................. 87 14.6 Estimation Methodology .................................................................................................... 92 14.7 Cut-off Grade and Pit Constraint ....................................................................................... 97 14.8 Classification ..................................................................................................................... 98 14.9 Mineral Resource Validation............................................................................................ 100 14.10 Ore Control ...................................................................................................................... 107 14.11 Reconciliation .................................................................................................................. 108 14.12 Estimate Acceptance ....................................................................................................... 110
15. MINERAL RESERVE ESTIMATE ................................................................................................ 111 15.1 Basis of Reserve Estimate and Pit Optimization ............................................................. 111 15.2 Recovery.......................................................................................................................... 113 15.3 Mining Costs .................................................................................................................... 113 15.4 Process Costs ................................................................................................................. 113 15.5 Selling Costs .................................................................................................................... 114 15.6 Cut-Off Grade .................................................................................................................. 114 15.7 Comment on Mineral Reserves ....................................................................................... 114
16. MINING METHODS ...................................................................................................................... 115 16.1 Mining Operations ........................................................................................................... 115 16.2 Mine Design ..................................................................................................................... 115 16.3 Geotechnical Considerations........................................................................................... 119 16.4 Production Schedule ....................................................................................................... 120 16.5 Waste Rock ..................................................................................................................... 123 16.6 Equipment........................................................................................................................ 124 16.7 Personnel Requirements ................................................................................................. 124

Kinross Gold Corporation Paracatu Project
Brazil NI 43-101 Technical Report
TOC iii
17. RECOVERY METHODS .............................................................................................................. 125 17.1 Process Description ......................................................................................................... 125 17.2 ROM Crusher .................................................................................................................. 125 17.3 Plant I ............................................................................................................................... 126 17.4 Plant II .............................................................................................................................. 128 17.5 Hydro ............................................................................................................................... 129
18. PROJECT INFRASTRUCTURE ................................................................................................... 131 18.1 Access ............................................................................................................................. 131 18.2 Power ............................................................................................................................... 131 18.3 Water ............................................................................................................................... 133
19. MARKET STUDIES AND CONTRACTS ...................................................................................... 135
20. ENVIRONMENTAL STUDIES, PERMITTING, AND SOCIAL OR COMMUNITY IMPACT ......... 136 20.1 Environmental Studies and Management ....................................................................... 136 20.2 Permitting......................................................................................................................... 142 20.3 Social and Community-Related Requirements ............................................................... 145 20.4 Mine Closure Requirements and Costs ........................................................................... 146
21. CAPITAL AND OPERATING COSTS .......................................................................................... 149 21.1 Capital Costs ................................................................................................................... 149 21.2 Operating Costs ............................................................................................................... 149
22. ECONOMIC ANALYSIS ............................................................................................................... 150 23. ADJACENT PROPERTIES .......................................................................................................... 151
24. OTHER RELEVANT DATA AND INFORMATION ....................................................................... 152
25. INTERPRETATION AND CONCLUSIONS .................................................................................. 154
26. RECOMMENDATIONS ................................................................................................................ 155
27. REFERENCES ............................................................................................................................. 156 28. DATE AND SIGNATURE PAGE .................................................................................................. 157

Kinross Gold Corporation Paracatu Project
Brazil NI 43-101 Technical Report
TOC iv
T A B L E S
Table 1-1: Mineral Resources exclusive of Mineral Reserves – December 31, 2019 ................................ 10 Table 1-2: Proven and Probable Mineral Reserves – December 31, 2019................................................. 10 Table 1-3: PSAT and PET summary results ............................................................................................... 11 Table 1-4: Operating cost estimate for LOM (January 1, 2020 forward) ..................................................... 13 Table 4-1: Paracatu mineral rights .............................................................................................................. 22 Table 6-1: Paracatu historical drilling .......................................................................................................... 29 Table 6-2: Paracatu life of mine production summary ................................................................................. 31 Table 10-1: Drill holes database summary .................................................................................................. 46 Table 11-1: Drilling program summary table ............................................................................................... 52 Table 11-2: Summary of analytical quality control data - blanks 2012 to 2019 ........................................... 53 Table 11-3: Summary of analytical quality control data CRM´s 2012 to 2019 ............................................ 53 Table 13-1: Deposit mineralogical characterization .................................................................................... 58 Table 13-2: Gold distribution (C1 – S-rich; C2 – quartizite/silica; C3 – lower alkali; C4 – life of mine) ....... 58 Table 13-3: 2017 CIL Feed and CIL tails characterization .......................................................................... 64 Table 13-4: E-GRG test results ................................................................................................................... 66 Table 14-1: Mineral Resources exclusive of Mineral Reserves – December 31, 2019 .............................. 68 Table 14-2: Geologic model units / gold estimate domains ........................................................................ 70 Table 14-3: Gold subdomains in the resource model.................................................................................. 73 Table 14-4: EOY 2018 - density database summary – raw data vs composite .......................................... 81 Table 14-5: Summary of variography for gold domains. ............................................................................. 89 Table 14-6: Variables used to build the 2019 MRMR block model ............................................................. 92 Table 14-7: Parameters used to estimate gold domain in the model. ......................................................... 94 Table 14-8: Parameters used to estimate gold domain in the model. ......................................................... 95 Table 14-9: Parameters used to estimate sulfur domain into the model. .................................................... 95 Table 14-10: Classification criteria for Measured, Indicated and Inferred ................................................... 99 Table 14-11: Gold composite vs block model by domains. ....................................................................... 101 Table 14-12: Density composite vs block model by domains. .................................................................. 101 Table 14-13: Sulfur composite vs block model by domains. ..................................................................... 102 Table 14-14: 2019 Mineral inventory constrained by US$1,400/oz resource pit shell. ............................. 106 Table 14-15: Kinross guidelines for reconciliation ..................................................................................... 109 Table 14-16: Reconciliation figures for the past three years ..................................................................... 109 Table 15-1: Proven and Probable Mineral Reserves – December 31, 2019............................................. 111 Table 15-2: Pit Optimization parameters ................................................................................................... 112 Table 15-3: Mineral Reserve cut-off grade calculation .............................................................................. 114 Table 16-1: Grade and tonnage values in the design pit .......................................................................... 115 Table 16-2: Base case open pit design parameters .................................................................................. 116 Table 16-3: Pit slope angles used in open pit mine optimization .............................................................. 119 Table 16-4: Paracatu LOM mining schedule ............................................................................................. 120 Table 16-5: Paracatu life of mine processing schedule ............................................................................ 121 Table 16-6: Current Paracatu mine equipment schedule .......................................................................... 124 Table 16-7: Operations personnel requirements ....................................................................................... 124 Table 21-1: Sustaining capital estimate for LOM (January 1, 2020 forward) ............................................ 149 Table 21-2: Operating cost estimate for LOM (January 1, 2020 forward) ................................................. 149
Kinross Gold Corporation Paracatu Project
Brazil NI 43-101 Technical Report
TOC v
Table 24-1: PSAT and PET summary results ........................................................................................... 153
F I G U R E S
Figure 4-1: Paracatu mine location map ..................................................................................................... 19 Figure 4-2: Paracatu mining and exploration claims map ........................................................................... 25 Figure 5-1: Satellite images showing of the location of Paracatu and Morro do Ouro Mine (Google
Image ™) ................................................................................................................................. 26 Figure 6-1: Paracatu mine historical production .......................................................................................... 30 Figure 7-1: Simplified geology of the Brasilia Belt ....................................................................................... 33 Figure 7-2: Local geology ............................................................................................................................ 35 Figure 7-3: Stratigraphic column, Morro do Ouro member region. ............................................................. 36 Figure 7-4: Property geology of the Paracatu deposit ................................................................................. 38 Figure 7-5: Cross section of the Paracatu deposit (vertical exaggeration 2x). ........................................... 39 Figure 7-6: Mineralization types and veins, sulfides and boudins morphology. .......................................... 40 Figure 8-1: Schematic diagrams illustrating the proposed mechanism of formation of the Morro do
Ouro deposit (Oliver et al., 2015) ............................................................................................. 42 Figure 10-1: Drill rig operated by Kinross team in pit area. ......................................................................... 44 Figure 10-2 Plan view of Kinross Paracatu showing existing drill holes (blue dots) relative to
December 2019 pit topography ................................................................................................ 47 Figure 10-3: Drill hole location in the pit area showing zone with lower and higher recovery. ................... 48 Figure 11-1: Example of geostats standard (G311-3) chart of quality control 2019 YTD. .......................... 54 Figure 13-1: Sample locations for characterization program ...................................................................... 57 Figure 13-2: Gold grain size – D50.............................................................................................................. 60 Figure 13-3: Rougher tails mineralogical characterization .......................................................................... 61 Figure 13-4: Gold and particle size distribution ........................................................................................... 62 Figure 13-5: CIL tails characterization from 2011 to 2017 .......................................................................... 63 Figure 13-6: Hydro (CIL) tails and TOC correlation ..................................................................................... 65 Figure 13-7: Clay mineral development ...................................................................................................... 65 Figure 13-8: 50 x 50 x 12 m block kriging for BWI ...................................................................................... 67 Figure 14-1: Plan view location of Mineral Resource estimate cut by ultimate resource. ........................... 69 Figure 14-2: Cross section and 3D view of domains for gold estimation. ................................................... 71 Figure 14-3: Cross section domains and gold grades. ................................................................................ 72 Figure 14-4: Schematic weathering profile and correlation with cores........................................................ 74 Figure 14-5: Location of re-logged cores. ................................................................................................... 75 Figure 14-6: Quartzite model showing lens locations.................................................................................. 76 Figure 14-7: Histograms showing statistics of gold raw data and 6 m composites. .................................... 77 Figure 14-8: Interpolant grade shell showing low continuity of capped values in the deposit. ................... 78 Figure 14-9: Histograms for uncapped and capped data for Northeast domains. ...................................... 79 Figure 14-10: Histograms for uncapped and capped data for Southwest domains .................................... 80 Figure 14-11: 3D view of drill hole gold samples. ........................................................................................ 81 Figure 14-12: Bimodal histogram showing overall distribution of composited density (SGC) used to
update the 2019 resource model. ............................................................................................ 82 Figure 14-13: Density block model results by domains. .............................................................................. 83

Kinross Gold Corporation Paracatu Project
Brazil NI 43-101 Technical Report
TOC vi
Figure 14-14: 3D view of drill hole sulfur samples. ...................................................................................... 84 Figure 14-15: Summary of statistics: Sulfur overall domain 1 (high sulfur) / composite 6 m. ..................... 85 Figure 14-16: ANC composite Length. ........................................................................................................ 86 Figure 14-17: Spatial distribution of the ANC variable. ............................................................................... 87 Figure 14-18: Search volume and orientation ellipse, isometric view of southwest region of pit ................ 88 Figure 14-19: Variography: Au Domain 1 NE side (110), major, semi-major and minor. ............................ 90 Figure 14-20: Variography: Au Domain 1 SW side (120), major, semi-major and minor. ........................... 90 Figure 14-21: Variography: Au Domain 2 NE side (210), major, semi-major and minor. ............................ 90 Figure 14-22: Variography: Au Domain 2 SW side (220), major, semi-major and minor. ........................... 91 Figure 14-23: Variography: Au Domain 3 NE side (310), major, semi-major and minor. ............................ 91 Figure 14-24: Variography: Au Domain 3 SW side (320), major, semi-major and minor. ........................... 91 Figure 14-25: ARD classification in the block model ................................................................................... 95 Figure 14-26: Quartzite percentage calculated in block model grid (25mx25mx12m). ............................... 97 Figure 14-27: Plan view of pit shell for Mineral Resource calculated at US$1400/oz. ................................ 98 Figure 14-28: Plan view showing the classification in estimated block model constrained by resource
pit shell @$1400/oz. .............................................................................................................. 100 Figure 14-29: Histogram and cumulative distribution comparing composite 6m and estimated block
model by domain. ................................................................................................................... 103 Figure 14-30: Visual comparison between composite 6 m and estimated block model to domain 1
northeast (110) ....................................................................................................................... 104 Figure 14-31: Histogram and cumulative distribution comparing composite 6 m and estimated block
model to domain 1 northeast (110) ........................................................................................ 104 Figure 14-32: Swath plot comparison between composite 6m and estimated block model to domain 1
northeast (110). ...................................................................................................................... 105 Figure 14-33: Swath plot comparison between nearest neighbour using composite 12 m and
estimated block model to domain 1 northeast (110). ............................................................. 106 Figure 14-34: Grade tonnage curve 2017 vs 2019 updated model constrained by US$1,400/oz pit
shell. ....................................................................................................................................... 107 Figure 14-35: Blast hole drill rig (Pit Viper) left side and geology sampling team collecting samples on
the drilled cones on the right side. ......................................................................................... 108 Figure 16-1: Typical haul road profile ........................................................................................................ 118 Figure 16-2: Mining phases ....................................................................................................................... 119 Figure 16-3: Slope regions in Paracatu pit ................................................................................................ 120 Figure 16-4: Waste dumps ........................................................................................................................ 123 Figure 17-1: Paracatu general flowsheet .................................................................................................. 125 Figure 17-2: P1 grinding circuit (4 x Primary ball mill; 1 x Secondary ball mill ; 1 x Rod Mill)................... 127 Figure 18-1: Site infrastructure .................................................................................................................. 132 Figure 18-2: Kinross-owned hydroelectric generating stations ................................................................. 134 Figure 24-1: Conceptual drawing explaining particle segregation ............................................................ 152 Figure 24-2: PSAT and PET areas ............................................................................................................ 153

Kinross Gold Corporation Paracatu Project
Brazil NI 43-101 Technical Report
Page 7
1. SUMMARY
1.1 Executive Summary Kinross Gold Corporation (Kinross) has prepared a Technical Report (the Technical Report) for the wholly-owned and operated Paracatu Project (Paracatu or the Project), located in the northwestern region of the state of Minas Gerais, Brazil. Kinross Brasil Mineração S.A. (KBM, Kinross or the Company) is Kinross’ operating entity for Paracatu. KBM was previously known as Rio Paracatu Mineração S.A. (RPM), before the name was changed in 2010.
Paracatu is a large open pit gold mine located in the Minas Gerais region of Brazil. Operations include conventional shovel/truck open pit mining, tailings reprocessing operations, two process plants with extraction of gold using gravity/ flotation/ carbon-in-leach (CIL) recovery processes. Since production started in 1987, Paracatu has produced 8.9 million ounces of gold as of the end of 2019.
1.2 Technical Summary Property Description, Location and Land Tenure
The Paracatu property is located in northwestern region of the Minas Gerais State approximately 230 km southeast of the national capital Brasilia, and 480 km northwest of the state capital Belo Horizonte. The property consists of five mining leases merged into one mining group. In addition, Kinross holds title to 17 exploration permits totalling approximately 15,568 ha and has applications for an additional 71 permits (exploration and mining applications) totalling approximately 119,599 ha. It comprises an open pit mine as well as processing plants, tailings facilities and associated infrastructure. The property is easily accessible by road from the nearby municipality of Paracatu. It is centred at approximately 17°13’15”S latitude and 46°52’30”W longitude.
Kinross first acquired a 49% interest in the mine upon completion of the merger with TVX Gold Inc. (TVX) and Echo Bay Mines Ltd. (Echo Bay) on January 31, 2003. On December 31, 2004, Kinross purchased the remaining 51% interest in the mine from Rio Tinto for US$260 million. Kinross’ interest in the property is subject to a royalty of 1.5% of net sales due to Agencia Nacional de Mineracao (ANM) and an additional royalty of 0.5% is due to the holders of surface rights in the mine area not already owned by Kinross.
History
The mining history of the Paracatu region extends back to the 18th century. Beginning in 1970, Paracatu attracted some attention from mineral exploration companies looking for lead and zinc deposits in the area. In 1984, Riofinex do Brasil (Riofinex) embarked on a

Kinross Gold Corporation Paracatu Project
Brazil NI 43-101 Technical Report
Page 8
surface exploration program that focused on the oxidized and weathered horizons of the Morro do Ouro area. Production at Paracatu commenced in October 1987 with the treatment of oxidized and highly weathered ore. The first gold bar was poured in December 1987. As a result of a series of expansion projects, the design capacity has increased to its current nominal throughput of 61 Mt/a ROM. Total production to-date is 8.9 million gold ounces.
Geology and Mineralization
The Paracatu Property is hosted within the Brasília Belt, a north-south trending Neoproterozoic belt that extends along the western side of the São Franscisco-Congo Craton. Sedimentary units are mostly preserved in the northern part of the belt, whereas in the southern part where Paracatu is located, there is intense deformation and metamorphism, and contacts between metasedimentary units are primarily tectonic. A series of east-northeast trending thrust faults is developed extensively along the belt. Metamorphic grade increases towards the west as the thickness of the fold belt increases. The timing of deformation is estimated at 800 Ma to 600 Ma which coincides with the Brasiliano orogenic cycle.
The host phyllites of the Paracatu Formation exhibit feature well-developed quartz boudins and associated sulfide mineralization. Sericite minerals are common, likely as a result of extensive metamorphic alteration of the host rocks. Primary sedimentary features and bedding planes are easily recognizable, but are intensively deformed by thrusting, particularly along bedding planes, and the development of sygmoidal and boudinage structures.
The mineralization at Paracatu exhibits distinct mineralogical zoning with the arsenopyrite content increasing towards the centre and west and in the zones of intense deformation. Gold grade increases with increasing arsenopyrite content. Pyrrhotite occurs in the western part of the deposit and gold grades are elevated where higher pyrrhotite content is observed. The deposit formation model proposed for Paracatu suggests that gold and arsenopyrite were introduced concurrently during the deformation event. Gold occurs either as free gold or electrum. The central part of the deposit contains a high amount of boudins, whereas along the margins fewer boudins are present. The boudins in general contain more than 90% of the sulfides and gold.
Exploration
Since Kinross acquired the Project in 2003, exploration efforts have been focused primarily on the main mining area. Exploration outside of the immediate mine area was initiated in 2006. In the licensed exploration areas immediately bordering the mine leases, exploration activities were concentrated on soil and termite-mound geochemical sampling and interpretation of airborne magnetic survey data to look for nearby features

Kinross Gold Corporation Paracatu Project
Brazil NI 43-101 Technical Report
Page 9
similar to Paracatu. Some target areas were generated, mostly located west and west-northwest of the mine. Follow-up exploration returned no significant results.
Drilling
All drill hole data are stored in acQuire database software. The database contains 4,543 diamond drill holes collected between 1984 and the beginning of 2019. The hole spacing varies from 25 to 200 m. Core diameters for holes drilled by Kinross include HX (76.2 mm), HQ (63.5 mm), HTW (70.9 mm), and NQ (47.6 mm). Substantially all of this drilling has been completed on the mining leases.
Mineral Resources and Mineral Reserves
Mineral Resources exclusive of Mineral Reserves are reported between the EOY2019 ultimate pit design and the $1,400/oz LG pit shell. The Mineral Resources also include Inferred and some incremental Measured and Indicated material situated in the pit design. Cut-off grades were determined using a long-term gold price of US$1,400/oz. Processing recoveries, material hardness and associated operating conditions were used to generate an optimized pit shell using the pseudo-flow algorithm.
The life of mine plan and Mineral Reserves include one year (2020) of tailings for reprocessing (from the Santo Antônio facility). Tailings reprocessing operations are expected to continue after 2020, but given limitations on drilling and sampling, only one year’s worth of production can be characterized with sufficient confidence for inclusion in the mine plan and Mineral Reserves.
Inferred Mineral Resources include an estimated 367 koz of gold contained (47,159 kt with 0.2 g/t) in the Santo Antônio tailings deposit (Processing Santo Antônio Tailings – PSAT). The remaining 1 koz (107 kt with 0.3 g/t) of Inferred is in situ material in the resource pit shell.
The Mineral Resource and Mineral Reserve estimates as of year-end 2019 are summarized in Tables 1-1 and 1-2.

Kinross Gold Corporation Paracatu Project
Brazil NI 43-101 Technical Report
Page 10
Table 1-1: Mineral Resources exclusive of Mineral Reserves – December 31, 2019 Tonnes
(kt) Gold (g/t)
Gold Ounces (koz)
Measured (M) 181,341 0.3 2,001 Indicated (I) 163,562 0.4 2,072 M+I 344,903 0.4 4,073 Inferred 47,267 0.2 368
Notes: 1. Mineral Resources are exclusive of Mineral Reserves. 2. Mineral Resources estimated according to CIM Definitions. 3. Mineral Resources estimated at $1,400/oz Au. 4. Mineral Resources are reported at gold cut-off grade that varies by BWI and global recovery
from 0.11 g/t to 0.19 g/t. Table 1-2: Proven and Probable Mineral Reserves – December 31, 2019
Tonnes
(kt) Gold (g/t)
Gold Ounces (koz)
Proven 518,934 0.4 7,428 Probable 28,354 0.4 355 Reserve Stockpile 30,735 0.3 278 Total Reserve 578,023 0.4 8,060
Notes: 1. Mineral Reserves estimated according to CIM Definitions. 2. Mineral Reserves estimated at $1,200/oz Au. 3. Stockpile balances above the reserve cut-off grade is considered as reserve and it includes
estimated gold production from PSAT in 2020 4. Mineral Reserves are reported at gold cut-off grade that varies by BWI and global recovery
from 0.16 g/t to 0.24 g/t. Mining Method
The Paracatu operation consists of an open pit mine, two process plants, two tailings facilities, and related surface infrastructure and support buildings. Ore hardness increases with depth and characterizing the hardness of the Paracatu deposit is important for costing and process throughput parameters.
Recovery Methods
Paracatu has two processing plants known as Plant I and Plant II. Plant I has operated continuously since 1987 and Plant II since 2008. Paracatu has been reprocessing the tailings since 2015.
Plant I has operated continuously since 1987 and had expansion upgrades in 1997 and 1999. In 2018, the plant processed 8.25 Mt. The plant consists of primary and secondary crushing, rougher and cleaner flotation, concentrate regrinding, and cyanide leaching.

Kinross Gold Corporation Paracatu Project
Brazil NI 43-101 Technical Report
Page 11
Plant II was developed as part of the Paracatu Expansion III Project and consists of one in-pit crusher (MMD toothed roll type), a 1.8 km conveyor to a covered stockpile area, one semi-autogenous grinding (SAG) mill and two ball mills. A third ball mill was installed in June 2011 and a fourth ball mill was installed in August 2012. In 2018, the plant processed 35.4 Mt of run-of-mine material.
In August 2015, Paracatu began the PSAT project, and in mid-2017, the Eustáquio Tailings (PET) project commenced. The target for these projects is gold that has segregated naturally in the tailings basins. Coarser material from PSAT and PET is excavated and hauled by truck to the Plant II stockpile, where the tailings are comingled with ROM to feed the SAG mill. Finer material from PSAT is hydraulically mined using a high-pressure water jet and pumped to the Plant I flotation circuit.
Production for PSAT and PET is shown in Table 1-3. PET ounces from 2018 onward are not shown separately, and are counted towards recovery because the PET material can be considered part of the circuit in current production.
Table 1-3: PSAT and PET summary results Years 2015 2016 2017 2018 2019 Total
PSAT
Feed (tonnes) 363 6,043 8,675 10,440 10,437 35,958 Grade (g/t) 1.090 0.521 0.387 0.261 0.262 0.344 Recovery (%) 79.42 75.88 68.95 61.03 62.37 66.01 Ounces 9,857 73,990 76,560 51,533 56,431 268,371
PET
Feed (tonnes) - 482 1,736 1,661 1,789 5,668 Grade (g/t) - 0.535 0.439 0.449 0.400 0.438 Recovery (%) - 73.43 75.11 NA NA NA Ounces - 6,091 18,038 NA NA NA
Site Infrastructure
Paracatu infrastructure and services have been designed to support an operation of 61 Mt/a. The mine site consists of two processing plants, related mine services facilities (truck shop, truck wash facility, warehouse, fuel storage and distribution facilities, reagent storage and distribution facilities), and other facilities to support operations (safety/security/first aid/emergency response building, assay laboratory, plant guard house, dining facilities, offices etc.).
In 2011, a road was constructed directly from the highway west of the mine exclusively for access to the mine and plants. This four lane paved road is separated by a median and is 3.4 km long.
The mine draws its power from the Brazilian national power grid which relies mainly on hydroelectric power generation with outstanding reliability. Kinross is furnished with a

Kinross Gold Corporation Paracatu Project
Brazil NI 43-101 Technical Report
Page 12
230 kV connection by a substation that converts power from 500 kV transmission lines. A 34 km overhead transmission line connects the substation to the mine site substation which feeds 13.8 kV electricity to Plant II and 138 kV to Plant I.
In Brazil, the electricity is subject to a free market environment with consumers able to select their supplier of choice. Approximately 60-70% of Kinross’s power needs are fed by a self-generation structure located approximately 660 km from the mine in the state of Goias (Hydro Power Plants: Caçu and Barra dos Coqueiros owned by Kinross).The remainder is contracted bilaterally in the free market through PPAs (power purchase agreements).
The main sources of water for Kinross operations are run-off water collected in mine sumps, run-off water collected in the tailings dam catchment basins, recirculated effluent from the process, and makeup water from three local surface water streams. The majority of process water is captured and maintained in the mine sumps and tailings catchment basins during the rainy season for use during the dry season.
Environmental, Permitting and Social Considerations
Paracatu is constantly seeking excellence in its occupational health and safety, environmental and social responsibility system. The site maintains Certifications in ISO 14001, OHSAS 18001, SA 8000 and compliance with the International Cyanide Management Code.
Environmental analyses focus on operations in the Kinross mining licence area and related facilities. An Environmental Impact Control Plan (PCIAM) has been implemented to ensure compliance with environmental permits. This plan focuses on such topics as air and soil quality, noise and vibration control, preservation of waterways, re-vegetation and tree planting, the safety and hygiene of workers, and reclamation projects as well as occupation proposals and future use of the areas affected by mining. The key aspects and environmental impacts addressed in the plan include deforestation, relocation of mammals and birds, soil removal and compacting, dust mitigation, fossil fuel emissions, rainwater runoff, noise and vibrations from operations and blasting, and changes to the landscape.
Kinross’ Environmental Impact Control Plan and Closure Plan were updated in 2018 and 2019 to reflect changes in mining activities, processing, and final disposal of waste and tailings.
Tailings management programs at Paracatu incorporate best-in-class standards and meet or exceed international standards for dam safety.

Kinross Gold Corporation Paracatu Project
Brazil NI 43-101 Technical Report
Page 13
Capital and Operating Costs
Planned capital costs at Paracatu are primarily sustaining capital, which includes mine equipment replacement and $512 million for the tailings dam expansions. Total sustaining capital costs are $997.2 million in real terms.
Operating costs are tracked and are well understood. Unit operating costs for the LOM production schedule are shown in Table 1-4.
Table 1-4: Operating cost estimate for LOM (January 1, 2020 forward) Area Unit Cost1 Mining US$/t mined2 $1.76 Rehandle US$/t rehandled $1.22 Processing US$/t processed3 $3.77 PSAT US$/t processed4 $1.80 Site Admin million US$/year 42.0 Notes: 1. Average life-of-mine costs. 2. Excludes sustaining capital. 3. Based on combined Plant 1 and Plant 2 costs, includes PET costs, excludes PSAT and
sustaining capital costs. 4. Includes mining, pumping and processing cost.
Kinross Gold Corporation Paracatu Project
Brazil NI 43-101 Technical Report
Page 14
2. INTRODUCTION
Kinross Gold Corporation (Kinross) has prepared a Technical Report (the Technical Report) for the wholly-owned and operated Paracatu Project in the northwestern region of the state of Minas Gerais, Brazil. Kinross Brasil Mineração S.A. (KBM Kinross or the Company) is Kinross’ operating entity for Paracatu. KBM Kinross was previously known as Rio Paracatu Mineração S.A. (RPM), before the name was changed in 2010.
The purpose of this Technical Report is to support disclosure of end-of-year 2019 Mineral Resources and Mineral Reserves. The Technical Report conforms to NI 43-101 Standards of Disclosure for Mineral Projects and has an effective date of March 10, 2020.
Currency is expressed in US dollars unless stated otherwise. The currency of Brazil is the Real.
Information used to support this Technical Report has been derived from the reports and documents listed in the References section of this Technical Report.
The use of the terms “we”, “us”, “our” or “Kinross” in this Technical Report refer to Kinross Gold Corporation.
2.1 Qualified Person The Qualified Person (QP) for this Technical Report is:
• John Sims, AIPG Certified Professional Geologist, Senior Vice-President and Chief Geologist, Mineral Resources & Brownfields for Kinross
Mr. Sims last visited the site in January 2020, when he inspected core and surface outcrops, drill platforms and sample cutting and logging areas; discussed geology and mineralization with Project staff; and inspected the major infrastructure and current mining operations.
2.2 Information Sources Information used to support this Technical Report was derived from previous technical reports on the property, and from the reports and documents listed in the References section of this Technical Report.

Kinross Gold Corporation Paracatu Project
Brazil NI 43-101 Technical Report
Page 15
Preparation of the revised Mineral Resource estimates included in this report was supervised by Racquel Kolkert, Senior Director, Resource & Mine Geology, and Paulo Henrique Netto, Manager of Technical Services at Paracatu.
The revised Mineral Reserve estimate included in this report was prepared by Muhanad Jalil, Director, Kinross Technical Services at Paracatu.
2.3 Effective Dates Several effective dates (cut-off dates for the information prepared) are appropriate for information included in this Technical Report. The effective date for the Mineral Resources and Mineral Reserves was December 31, 2019 (EOY2019). There were no material changes to the information on the Project between the effective date and the signature date of the Technical Report.

Kinross Gold Corporation Paracatu Project
Brazil NI 43-101 Technical Report
Page 16
2.4 List of Abbreviations µ Micron kt/d thousand tonnes per day °C degree Celsius kPa kilopascal °F degree Fahrenheit kWh/t kilowatt-hour per tonne µg Microgram kW kilowatt a Annum kWh kilowatt-hour Au Gold L litre Bbl Barrels LFO light fuel oil BRL Brazilian Real L/s liters per second Btu British thermal units m metre C$ Canadian dollars M mega (million) CIL carbon-in-leach m2 square metre cm Centimeter m3 cubic metre cm2 square centimetre mbgl metres below ground level CV coefficient of variation min minute d Day masl metres above sea level dia. Diameter mm millimetre dmt dry metric tonne Mt/a million tonne per year dwt dead-weight ton MTO material take-off ft Foot MW megawatt ft/s foot per second MWe megawatt-electrical ft2 square foot m3/h cubic metres per hour ft3 cubic foot Opt ounce per short ton g Gram Oz Troy ounce (31.1035g) G giga (billion) PAU preassembly unit gal Imperial gallon ppm part per million g/L gram per liter Psig pound per square inch gauge g/t gram per tonne S second gpm Imperial gallons per minute st short ton gr/ft3 grain per cubic foot stpa short ton per year gr/m3 grain per cubic metre stpd short ton per day ha Hectare T metric tonne HFO heavy fuel oil t/a metric tonne per year hp Horsepower t/d metric tonne per day in Inch US$ United States dollar in2 square inch USg United States gallon J Joule USgpm US gallon per minute k thousand (kilo) V volt kg Kilogram WBS work breakdown structure km Kilometer wmt wet metric tonne km/h kilometre per hour yd3 cubic yard km2 square kilometre yr year

Kinross Gold Corporation Paracatu Project
Brazil NI 43-101 Technical Report
Page 17
3. RELIANCE ON OTHER EXPERTS
In the preparation of the Technical Report, the Qualified Person relied on information provided by internal Kinross legal counsel for the discussion of legal matters in Sections 4, 19, and 20.
Except for the purposes legislated under provincial securities law, any other use of this report by any third parties is at this party’s sole risk.

Kinross Gold Corporation Paracatu Project
Brazil NI 43-101 Technical Report
Page 18
4. PROPERTY DESCRIPTION AND LOCATION
4.1 Location The Paracatu Mine, also referred to as the Morro do Ouro Mine, is located immediately north of the city of Paracatu and 230 km southeast of the national capital of Brasilia in northwestern Minas Gerais State, Brazil (Figure 4-1). The Project comprises an open pit mine as well as processing plants, tailings facilities and associated infrastructure. The mine commenced production in 1987 and currently processes ore at a nominal plant throughput rate of 61 Mt/a.
4.2 Mineral Tenure The Paracatu mine, represented by mining group number 931.299/2009, is composed of five mining licenses. Kinross also has exploration permits, exploration permit applications and mining permit applications (Figure 4-2 and Table 4-1). The Universal Transverse Mercator (UTM) co-ordinates for the approximate centre of the Property are 8,098,500 m S and 298,000 m E (WGS84, Zone 23). The geographic coordinates are approximately 17°13’15”S latitude and 46°52’30”W longitude.
As of the effective date of this report, all the leases and permits comprising the property are in good standing.
Kinross pays R$ 3.42 per hectare in annual exploration permit renewal fees to the National Mining Agency (ANM – Agencia Nacional de Mineracao, formerly known by the acronym DNPM) during the initial three years of exploration. Renewed exploration permits beyond the initial three year exploration period require an annual renewal fee of R$ 5.13 per hectare.
Kinross first acquired a 49% interest in the Project upon completion of the merger with TVX Gold Inc. (TVX) and Echo Bay Mines Ltd. (Echo Bay) on January 31, 2003. On December 31, 2004, Kinross purchased the remaining 51% interest in the mine from Rio Tinto for US$260 million.
The grouped mining leases are located within the municipality of Paracatu. They are licensed as Mining Group number 238/2010 and are tied to process number 931.299/2009 which is a combination of process numbers 800.005/1975, 830.241/1980, 832.225/1993, 832.228/1993 and 830.907/1999. The mining leases are confirmed by legal survey.

Kinross Gold Corporation Paracatu Project
Brazil NI 43-101 Technical Report
Page 19
Figure 4-1: Paracatu mine location map

Kinross Gold Corporation Paracatu Project
Brazil NI 43-101 Technical Report
Page 20
The Paracatu mine area is located on properties that are owned by Kinross, or on easements that are on a planned acquisition schedule. The current tailings impoundment is located on lands to which Kinross has negotiated surface rights with the former landowner(s).
In addition, Kinross holds title to 17 exploration permits totalling approximately 15,568 ha and has applications for an additional 71 permits (exploration and mining applications) totalling approximately 119,598.90 ha. These exploration permits and applications for exploration permits comprise a significant land package around the Paracatu Mine, covering the northern and southern strike extensions of the Morro do Ouro Member of the Paracatu Formation.
4.3 Mineral Rights In Brazil, the ANM issues all mining leases and exploration concessions. Mining leases are renewable annually and have no set expiry date. Each year Kinross is required to provide information to the ANM summarizing mine production statistics.
Exploration permits are granted for a period of three years. Once a company has applied for an exploration permit, the applicant holds a priority right to the concession area as long as there is no previous ownership. The owner of the concession can apply to have the exploration permit successively renewed. Renewal is at the sole discretion of ANM. Granted exploration concessions are published in the Official Gazette of the Republic (OGR), which lists individual concessions and their change in status. The exploration concession grants the owner the sub-surface mineral rights. The owner of an exploration permit is guaranteed, by law, access to perform exploration field work, provided adequate compensation is paid to third party landowners and the owner accepts all environmental liabilities resulting from the exploration work.
In instances where third party landowners have denied surface access to an exploration permit, the owner maintains full title to the concession until such time as the issue of access is negotiated or legally enforced by the courts. Access is guaranteed under law and the owner of an exploration concession will eventually gain easements to access the title. Kinross has previously used the easement process to obtain surface rights from landowners during development of the Paracatu mine.
Once access is obtained, the owner has three years to submit an Exploration Report (ER) on the concession. The owner of a mineral concession is obligated to explore the mineral potential of the concession and submit an ER to the ANM summarizing the results of the fieldwork and providing conclusions as to the economic viability of the mineralization. The content and structure of the report is dictated by the ANM and a person with suitable professional qualifications must prepare the report.

Kinross Gold Corporation Paracatu Project
Brazil NI 43-101 Technical Report
Page 21
The ANM will review the ER for the concessions and will either:
• approve the report provided ANM concurs with the report’s conclusions regarding the potential to exploit the mineralization;
• dismiss the report should the report not address all requirements, in which case the owner is given a term in which to address any identified deficiencies in the report; or
• postpone a decision on the report should it be decided that exploitation of the deposits are temporarily non-economic.
Approval, dismissal or postponement of the ER is at the discretion of the ANM. There is no set time limit for the ANM to complete the review of the ER. The owner is notified of the ANM’s decision on the ER and the decision is published in the OGR.
On ANM approval of the ER, the owner of an exploration permit has one year to apply for a mining lease. The application must include a detailed Development Plan (DP) outlining how the deposit will be mined.
ANM reviews the DP and decides whether or not to grant the application. The decision is at the discretion of ANM, but approval is virtually assured unless development of the project is considered harmful to the public or the development of the project compromises interests more relevant than industrial exploitation. Should the application for a mining lease be denied for exploration concessions for which the ER has been approved, the owner is entitled to government compensation.
On approval of the DP, ANM grants the mining licence, which remains in force until the mineral resource is depleted.
4.4 Royalties and Other Encumbrances Kinross must pay a royalty equivalent to 1.5% of net sales to the ANM. An additional royalty of 0.5% is due to the holders of surface rights in the mine area, in areas that are not owned by the mine.
4.5 Permitting Kinross has obtained required permits for current activities and expects to obtain permits for future proposed work on the property as necessary. Permitting is discussed further in Section 20.2.
Kinross Gold Corporation Paracatu Project
Brazil NI 43-101 Technical Report
Page 22
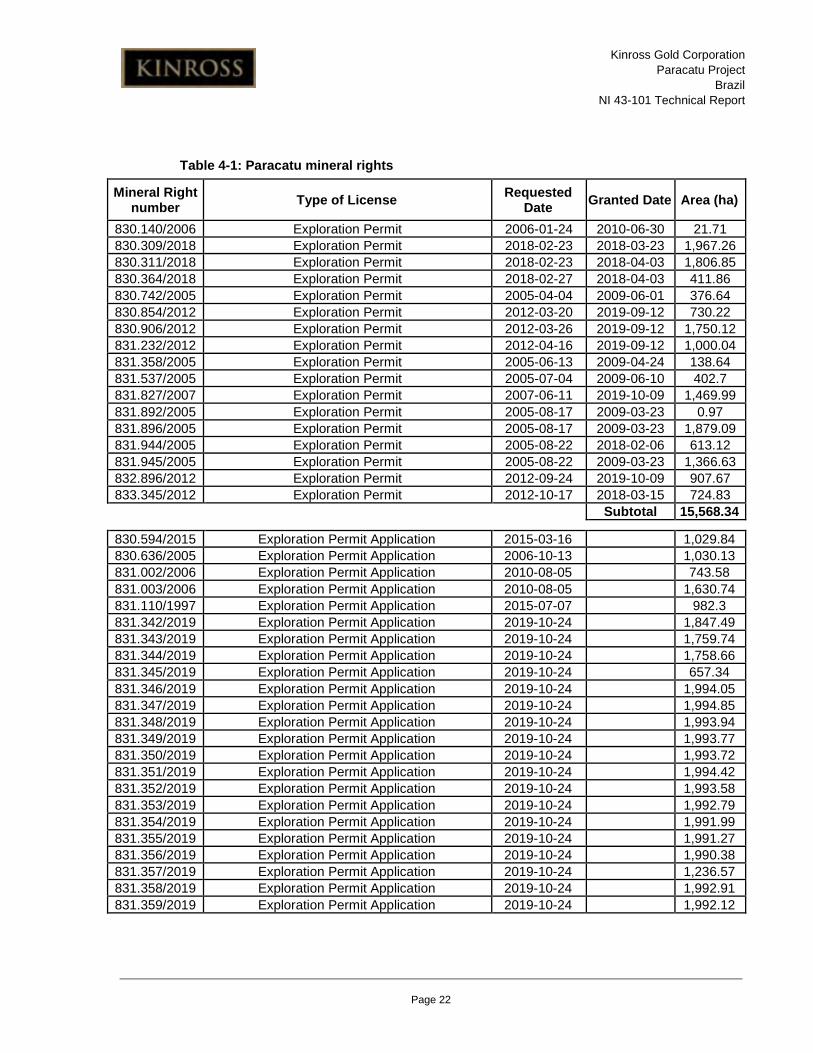
Table 4-1: Paracatu mineral rights
Mineral Right number Type of License Requested
Date Granted Date Area (ha)
830.140/2006 Exploration Permit 2006-01-24 2010-06-30 21.71 830.309/2018 Exploration Permit 2018-02-23 2018-03-23 1,967.26 830.311/2018 Exploration Permit 2018-02-23 2018-04-03 1,806.85 830.364/2018 Exploration Permit 2018-02-27 2018-04-03 411.86 830.742/2005 Exploration Permit 2005-04-04 2009-06-01 376.64 830.854/2012 Exploration Permit 2012-03-20 2019-09-12 730.22 830.906/2012 Exploration Permit 2012-03-26 2019-09-12 1,750.12 831.232/2012 Exploration Permit 2012-04-16 2019-09-12 1,000.04 831.358/2005 Exploration Permit 2005-06-13 2009-04-24 138.64 831.537/2005 Exploration Permit 2005-07-04 2009-06-10 402.7 831.827/2007 Exploration Permit 2007-06-11 2019-10-09 1,469.99 831.892/2005 Exploration Permit 2005-08-17 2009-03-23 0.97 831.896/2005 Exploration Permit 2005-08-17 2009-03-23 1,879.09 831.944/2005 Exploration Permit 2005-08-22 2018-02-06 613.12 831.945/2005 Exploration Permit 2005-08-22 2009-03-23 1,366.63 832.896/2012 Exploration Permit 2012-09-24 2019-10-09 907.67 833.345/2012 Exploration Permit 2012-10-17 2018-03-15 724.83
Subtotal 15,568.34 830.594/2015 Exploration Permit Application 2015-03-16 1,029.84 830.636/2005 Exploration Permit Application 2006-10-13 1,030.13 831.002/2006 Exploration Permit Application 2010-08-05 743.58 831.003/2006 Exploration Permit Application 2010-08-05 1,630.74 831.110/1997 Exploration Permit Application 2015-07-07 982.3 831.342/2019 Exploration Permit Application 2019-10-24 1,847.49 831.343/2019 Exploration Permit Application 2019-10-24 1,759.74 831.344/2019 Exploration Permit Application 2019-10-24 1,758.66 831.345/2019 Exploration Permit Application 2019-10-24 657.34 831.346/2019 Exploration Permit Application 2019-10-24 1,994.05 831.347/2019 Exploration Permit Application 2019-10-24 1,994.85 831.348/2019 Exploration Permit Application 2019-10-24 1,993.94 831.349/2019 Exploration Permit Application 2019-10-24 1,993.77 831.350/2019 Exploration Permit Application 2019-10-24 1,993.72 831.351/2019 Exploration Permit Application 2019-10-24 1,994.42 831.352/2019 Exploration Permit Application 2019-10-24 1,993.58 831.353/2019 Exploration Permit Application 2019-10-24 1,992.79 831.354/2019 Exploration Permit Application 2019-10-24 1,991.99 831.355/2019 Exploration Permit Application 2019-10-24 1,991.27 831.356/2019 Exploration Permit Application 2019-10-24 1,990.38 831.357/2019 Exploration Permit Application 2019-10-24 1,236.57 831.358/2019 Exploration Permit Application 2019-10-24 1,992.91 831.359/2019 Exploration Permit Application 2019-10-24 1,992.12

Kinross Gold Corporation Paracatu Project
Brazil NI 43-101 Technical Report
Page 23
Mineral Right number Type of License Requested
Date Granted Date Area (ha)
831.360/2019 Exploration Permit Application 2019-10-24 1,992.73 831.361/2019 Exploration Permit Application 2019-10-24 1,990.45 831.362/2019 Exploration Permit Application 2019-10-24 1,993.02 831.363/2019 Exploration Permit Application 2019-10-24 1,992.19 831.364/2019 Exploration Permit Application 2019-10-24 1,991.39 831.365/2019 Exploration Permit Application 2019-10-24 1,990.26 831.366/2019 Exploration Permit Application 2019-10-24 467.7 831.367/2019 Exploration Permit Application 2019-10-24 1,956.24 831.368/2019 Exploration Permit Application 2019-10-24 1,992.29 831.369/2019 Exploration Permit Application 2019-10-24 1,991.51 831.370/2019 Exploration Permit Application 2019-10-24 1,990.71 831.371/2019 Exploration Permit Application 2019-10-24 1,989.88 831.372/2019 Exploration Permit Application 2019-10-24 1,598.71 831.373/2019 Exploration Permit Application 2019-10-24 1,624.62 831.374/2019 Exploration Permit Application 2019-10-24 1,254.02 831.375/2019 Exploration Permit Application 2019-10-24 1,992.79 831.376/2019 Exploration Permit Application 2019-10-24 1,992.62 831.377/2019 Exploration Permit Application 2019-10-24 1,991.82 831.378/2019 Exploration Permit Application 2019-10-24 1,992 831.379/2019 Exploration Permit Application 2019-10-24 1,738.66 831.380/2019 Exploration Permit Application 2019-10-24 1,957.24 831.381/2019 Exploration Permit Application 2019-10-24 1,628.77 831.397/2015 Exploration Permit Application 2015-06-02 635.38 831.492/2019 Exploration Permit Application 2019-11-21 1,927.59 831.494/2019 Exploration Permit Application 2019-11-21 1,927.61 831.495/2019 Exploration Permit Application 2019-11-21 1,927.59 831.496/2019 Exploration Permit Application 2019-11-21 1,927.63 831.497/2019 Exploration Permit Application 2019-11-21 734.83 831.498/2019 Exploration Permit Application 2019-11-21 1,926.87 831.499/2019 Exploration Permit Application 2019-11-21 1,926.90 831.500/2019 Exploration Permit Application 2019-11-21 1,926.85 831.501/2019 Exploration Permit Application 2019-11-21 1,722.86 831.502/2019 Exploration Permit Application 2019-11-21 1,463.74 831.503/2019 Exploration Permit Application 2019-11-21 1,463.69 831.504/2019 Exploration Permit Application 2019-11-21 897.78 831.505/2019 Exploration Permit Application 2019-11-21 1,883.54 831.506/2019 Exploration Permit Application 2019-11-21 1,793.45 831.507/2019 Exploration Permit Application 2019-11-21 1,882.65 831.508/2019 Exploration Permit Application 2019-11-21 1,824.59 832.080/2015 Exploration Permit Application 2015-08-10 986.43 860.767/2019 Exploration Permit Application 2019-10-24 1,993.58 860.768/2019 Exploration Permit Application 2019-10-24 1,993.99 860.769/2019 Exploration Permit Application 2019-10-24 1,095.44

Kinross Gold Corporation Paracatu Project
Brazil NI 43-101 Technical Report
Page 24
Mineral Right number Type of License Requested
Date Granted Date Area (ha)
860.770/2019 Exploration Permit Application 2019-10-24 1,994.68 860.771/2019 Exploration Permit Application 2019-10-24 1,994.63 860.772/2019 Exploration Permit Application 2019-10-24 1,994.50
Subtotal 118,542.60 831.628/1985 Mining Application 2009-02-09 800.0 832.229/1993 Mining Application 1993-06-21 2003-01-22 256.3
Subtotal 1,056.30 800.005/1975 Mining Lease (Replaced by 931.299/2009) 1975-01-02 1995-06-22 430.40 830.241/1980 Mining Lease (Replaced by 931.299/2009) 1980-03-11 1985-08-09 827.56 830.907/1999 Mining Lease (Replaced by 931.299/2009) 1999-05-17 2007-03-06 45.88 832.225/1993 Mining Lease (Replaced by 931.299/2009) 1993-06-21 2009-05-04 210.57 832.228/1993 Mining Lease (Replaced by 931.299/2009) 1993-06-21 2009-05-13 402.23 931.299/2009 Morro do Ouro Mining Concession 2009-05-19 2010-03-25
Subtotal 1,916.64

Kinross Gold Corporation Paracatu Project
Brazil NI 43-101 Technical Report
Page 25
Figure 4-2: Paracatu mining and exploration claims map

Kinross Gold Corporation Paracatu Project
Brazil NI 43-101 Technical Report
Page 26
5. ACCESSIBILITY, CLIMATE, LOCAL RESOURCES, INFRASTRUCTURE AND PHYSIOGRAPHY
5.1 Accessibility The Paracatu Property is located immediately north and west of the Municipality of Paracatu, Minas Gerais state (Figure 5-1), which has a population of approximately 93,000. Access from Paracatu is by vehicle via a four lane paved mine access road.
Paracatu is located approximately 230 km southeast of the national capital, Brasilia (population 2.97 million), and 480 km northwest of the state capital Belo Horizonte (population 2.5 million). Both are modern cities with industrial and manufacturing facilities.
Figure 5-1: Satellite images showing of the location of Paracatu and Morro do Ouro Mine (Google Image ™)
A small paved airstrip that can accommodate small, charter aircraft also services Paracatu.
5.2 Climate The climate is tropical sub-humid with a mean temperature of around 21°C that typically ranges from 17°C to 28°C. A peak temperature of 30°C usually occurs in August or September, while a low of 14°C is usually experienced in June or July. The rainy season is from October to March, although there is precipitation throughout the year. The relative humidity is at least 75% at least six months of the year.
The mine operates year round in this climate.
5.3 Local Resources and Infrastructure Various services are available at Paracatu including housing, temporary accommodations, health services and police services. Building supplies and fuel are

Kinross Gold Corporation Paracatu Project
Brazil NI 43-101 Technical Report
Page 27
also available. A greater range of services, including mining equipment suppliers, mining contractors and trained manpower, can be obtained in Belo Horizonte.
The mine is connected to the national power grid, which relies mainly on hydroelectric generation.
5.4 Physiography and Environment Paracatu is located in the Brazilian savannah, a region characterized by low rolling hills that have been largely cleared of vegetation to support farming and cattle ranching. The elevation at the mine site is approximately 780 masl. The region is largely dependent on agriculture, with soy beans being the predominant crop.

Kinross Gold Corporation Paracatu Project
Brazil NI 43-101 Technical Report
Page 28
6. HISTORY
6.1 Prior Ownership Billiton acquired the original licences in what is now the Project and in 1980 entered into a joint venture partnership with Riofinex do Brasil (Riofinex), a subsidiary of Rio Tinto. In 1984, Riofinex acquired Billiton’s interest in the property.
In 1985, RTZ Mineracão, a successor company to Riofinex, entered into a joint venture with Autram Mineracão e Participaçoes (Autram). A new entity, Rio Paracatu Mineracão (RPM), was formed to hold the joint venture interests, with Rio Tinto holding a 51% interest and Autram holding a 49% interest in RPM.
Subsequently, Autram’s interest in RPM was acquired by TVX Participaçoes which later became TVX. TVX then entered into an agreement with Newmont Mining Corporation (Newmont) which resulted in Newmont and TVX each holding a 24.5% interest in RPM. In early 2003, TVX acquired Newmont’s 24.5% interest to hold a 49% interest in RPM. In late January 2003, Kinross acquired its interest in the property by merging with TVX and Echo Bay. On December 31, 2004, Kinross purchased the remaining 51% interest in RPM from Rio Tinto for US$260 million. In 2010, the name of the operating entity was changed to Kinross Brasil Mineracao or KBM.
6.2 Exploration and Development History The mining history of the Paracatu region is closely associated with the activities of the Portuguese bandeirantes who prospected for gold in Brazil’s interior, arriving in the Paracatu region in 1722 after the discovery of gold in alluvial deposits.
Alluvial mining peaked during the second half of the 18th century. These activities were not limited to the placer deposits along Rico Creek, but also extended to the oxidized ore outcrop on the top of Morro do Ouro or the “Hill of Gold”.
Gold production declined sharply during the first decade of the 19th century. From this point forward, production was limited to subsistence mining practiced by local inhabitants known as garimpeiros. Various prospectors explored the region but economically viable operations were limited as a result of the low-grade nature of the deposits.
Beginning in 1970, Paracatu attracted some attention from mineral exploration companies looking for lead and zinc deposits in the area. Interest in the gold of Morro do Ouro was limited as the majority of the companies were not attracted by low grades that were initially considered to be too low to be extracted economically.

Kinross Gold Corporation Paracatu Project
Brazil NI 43-101 Technical Report
Page 29
In 1984, Riofinex embarked on a surface exploration program that focused on the oxidized and weathered horizons of the Morro do Ouro area.
Table 6-1 shows the Paracatu historical drilling programs, up to the year Kinross took over the Project (2003).
Table 6-1: Paracatu historical drilling Year Campaign Hole Type Number Total
(Diameter) of Holes (m) 1984 PMO 6" 44 2,462 1988 PAR 6" 26 1,014 1989 PRF RC 67 2,791 1990 PRI 6" 15 652 1992-1997, 1999, 2000 PMP 6" 275 7,958 1993, 1996, 1997 PB2 6" 36 1,857 1993-1996 FPA 6" 97 3,405 1996 ALB 6" 11 335 1996 RAB 6" 20 583 2000 MA HX (3") 2 35 2000 PEC HX (3") 32 2,658 2000, 2004 WCR HX (3") 9 2,031 2001 PPC HX (3") 38 1,732 2001 PTE HX (3") 2 56
Totals 674 27,569
A 1984 “reserve” estimate only included the near surface oxidized ore. Despite the low gold grade, Riofinex believed that profitable extraction of the ore could be realized. In 1985, this was confirmed by a feasibility study. Total investment up to that period was $7.3 million including ground acquisition costs, exploration costs, and the cost of the feasibility study. Approval was granted by Rio Tinto to construct a mining project at a capital cost of approximately $65 million.
Production at Paracatu commenced in October 1987, treating oxidized and highly weathered ore. The first gold bar was poured in December 1987.
6.3 Historical Resource Estimates At the end of 1984, based on data from test pits and further supported by a total of 44 drill holes, a “reserve” of 97.5 million tonnes at 0.587 g/t Au was estimated at what is currently the Paracatu Mine. This estimate only included the superficial oxidized ore.

Kinross Gold Corporation Paracatu Project
Brazil NI 43-101 Technical Report
Page 30
Kinross notes that this estimate pre-dates NI 43-101, cannot be relied upon, and is quoted for historical purposes only.
6.4 Past Production The property has been in continuous operation since 1987. Figure 6-1 and Table 6-2 summarize the historical life of mine production at Paracatu since commencement of commercial production based on run of mine statistics. These figures include production from Santo Antônio and Eustáquio tailings reprocessing, which is detailed in the Chapter 24.
Figure 6-1: Paracatu mine historical production

Kinross Gold Corporation Paracatu Project
Brazil NI 43-101 Technical Report
Page 31
Table 6-2: Paracatu life of mine production summary
Year Tonnes milled Feed grade Gold Produced (million) (Au g/t) (koz) 1987* 1* 0.78 4 1988 6 0.77 113 1989 8 0.67 146 1990 9 0.64 160 1991 10 0.61 166 1992 10 0.58 167 1993 13 0.50 175 1994 13 0.50 169 1995 14 0.49 163
1996** 14 0.50 166 1997 15 0.47 157 1998 16 0.48 181 1999 17 0.45 189 2000 20 0.47 229 2001 16 0.48 187 2002 18 0.44 225 2003 18 0.44 201 2004 17 0.42 189 2005 17 0.38 180 2006 18 0.38 173
2007*** 19 0.37 175 2008 21 0.38 190 2009 40 0.41 354 2010 43 0.45 482 2011 45 0.42 453 2012 53 0.38 467 2013 56 0.38 500 2014 51 0.41 521 2015 45 0.44 478 2016 47 0.44 483 2017 38 0.41 360 2018 54 0.43 522 2019 58 0.43 620 Total 840 0.45 8,917
*1987 historical production was 500 thousand tonnes. ** Before 1996, grade values are approximate. *** Equivalent Ounces.

Kinross Gold Corporation Paracatu Project
Brazil NI 43-101 Technical Report
Page 32
7. GEOLOGICAL SETTING
7.1 Regional Geology The Paracatu Property is hosted within the Brasília Belt, a north-south trending Neoproterozoic belt that extends along the western side of the São Francisco-Congo Craton (Figure 7-1).
The Brasilia Belt resulted from the collision between three cratonic blocks: the Amazonian, the São Francisco-Congo and a third block concealed under Phanerozoic sediments of the Parana Basin. Sedimentary units are mostly preserved in the northern part of the belt, whereas in the southern part where Paracatu is located, there is intense deformation and metamorphism, and contacts between metasedimentary units are primarily tectonic (Rodrigues et al., 2010).
The Brasília Belt has four main components (Rodrigues et al., 2010 and references therein):
• A continental block of Archaean rock units (the Crixás-Goiás region).
• Reworked sialic basement of Paleoproterozoic age, exposed mainly in the Almas-Cavalcante region.
• The Goiás Magmatic Arc, consisting of volcano-sedimentary rocks and tonalite/granodiorite gneisses.
• Thick sedimentary and metasedimentary sequences, including coarse and fine grained sediments with some carbonates, volcanic layers, phyllites, quartzites, and schists.
A series of east-northeast trending thrust faults is developed extensively along the belt. Metamorphic grade increases towards the west as the thickness of the fold belt increases. The timing of deformation is estimated at 800 Ma to 600 Ma during the Brasiliano orogenic cycle.

Kinross Gold Corporation Paracatu Project
Brazil NI 43-101 Technical Report
Page 33
Figure 7-1: Simplified geology of the Brasilia Belt

Kinross Gold Corporation Paracatu Project
Brazil NI 43-101 Technical Report
Page 34
7.2 Local Geology The local scale geology is composed of sandy and shaley metasedimentary rocks, metamorphosed to greenschist grade, of the Canastra Group. , The stratigraphy is not fully understood because of intense deformation. The Project is underlain by a thick sequence of phyllites belonging to the basal part of the Paracatu Formation of the Upper Proterozoic Canastra Group, which is exposed along the south-central portion of the Brasília Belt (Figure 7-2).
Around Paracatu, the Canastra Group is subdivided into three formations: at the base is Serra do Landim Formation, overlain by the Paracatu Formation, followed by the Chapada dos Piloes Formation.
Figure 7-3 shows the stratigraphic column for the Canastra Group and the overlying Ibiá Group. The Canastra Group is made up of the following lithostratigraphic units, from base to top, which are separated from each other by thrust faults (Rodrigues et al., 2010).
Serra do Landim Formation
This unit mainly consists of calciferous shales and schists, with marble and limestone lenses.
Paracatu Formation
The Paracatu Formation includes the basal Morro do Ouro Member, a 100 m thick layer of dark carbonaceous phyllite, and the overlying Serra da Anta Member, a sericitic phyllite. Both phyllites display fine-grained quartzite intercalations.
Chapada dos Pilões Formation
This unit includes the basal Serra da Urucânia Member, a succession of quartzite and phyllite, and the upper Hidroelétrica Batalha Member, consisting of fine-grained quartzite and thinly-bedded phyllite.

Kinross Gold Corporation Paracatu Project
Brazil NI 43-101 Technical Report
Page 35
Figure 7-2: Local geology

Kinross Gold Corporation Paracatu Project
Brazil NI 43-101 Technical Report
Page 36
Figure 7-3: Stratigraphic column, Morro do Ouro member region.

Kinross Gold Corporation Paracatu Project
Brazil NI 43-101 Technical Report
Page 37
7.3 Property Geology In the property area, the rocks are phyllites and quartzite intensively altered by hydrothermal processes associated with regional metamorphism.
The property geology has extensive deformation and well-developed quartz boudins and associated sulfide mineralization. Sericite minerals are common, likely as a result of extensive metamorphic alteration of the host rocks. Primary sedimentary features and bedding planes are recognizable, but are intensely deformed by sigmoidal and boudinage structures, and by thrusting, particularly along bedding planes.
Mineralization at Paracatu is closely related to a period of ductile deformation, shearing and thrust faulting. Overall, the Morro do Ouro sequence has been thrust to the northeast. Intense, low angle isoclinal folds are commonly observed. The mineralization plunges to the west southwest at 15° to 20° and there is secondary folding with axial planes striking to the northwest resulting in kink bands, and dome and basin folds in some areas.
The mineralization appears to be truncated to the north by a major normal fault trending east-northeast as shown in Figure 7-4. The displacement along this fault is currently unknown but the fault is used as a hard boundary during mineral resource estimation. The current interpretation is that the fault has displaced the mineralization upwards and erosion has removed the mineralization in the up-thrown block.
Figure 7-5 presents a conceptualized geological cross section looking to the northwest through the deposit. The section shows the high strain zone in red surrounded by the weakly mineralized phyllites of the Morro do Ouro Member.

Kinross Gold Corporation Paracatu Project
Brazil NI 43-101 Technical Report
Page 38
Figure 7-4: Property geology of the Paracatu deposit

Kinross Gold Corporation Paracatu Project
Brazil NI 43-101 Technical Report
Page 39
Figure 7-5: Cross section of the Paracatu deposit (vertical exaggeration 2x).
7.4 Mineralization
The entire mineralized system lies within a thick, heterogeneously deformed zone that contains both abundant NE vergent shallowly dipping shear fabrics and a strong planar or tabular (flattened) strain signature.
The Paracatu mineralization has two characteristic visual features. The first is the presence of a sulfide suite intimately associated with gold, comprising, in order of abundance, arsenopyrite, pyrite, pyrrhotite, sphalerite, galena, and chalcopyrite. The photos in Figure 7-6 illustrate the various types of mineralized boudins:
A. Typical features showing base metals (sphalerite “sph”) and dolomitic to ankeritic carbonate (“carb”) in the vein core, along with carbonaceous wall-rock seams, with arsenopyrite (“aspy”) developed on the vein rim and as disseminated grains close to the veins, and pyrite (including gold) on the vein edge and in the boudin necks.
B. A segment of a large laminated vein away from the boudin necks, showing sphalerite and carbonate developed in the vein within individual bands formed during veining, pyrite on the vein edge, and pyrrhotite (“po”) in discordant shear bands, overprinting pyrite.
C. Deformed sulfides in the vein shown by arrows (black), along with more than one phase of quartz veining, are boudinaged along the foliation that is axial planar to adjacent folded bedding of intercalated graphitic shale and siltier material, with sulfides also segregated, or grown, in the fold hinges (white arrows).

Kinross Gold Corporation Paracatu Project
Brazil NI 43-101 Technical Report
Page 40
D. A more massive type A boudin with milky quartz and coarse arsenopyrite overgrown by pyrite.
E. A laminated type A boudin, here showing an angle between the margin of the boudin and the internal banding, indicating that veining and formation of the internal banded structure predated the main phase of boudinage.
Figure 7-6: Mineralization types and veins, sulfides and boudins morphology.

Kinross Gold Corporation Paracatu Project
Brazil NI 43-101 Technical Report
Page 41
The sulfides occur in a variety of forms, predominantly within boudinaged quartz veins or on their edges, and in the necks of the boudins. Some sulfides (pyrite, arsenopyrite, and pyrrhotite, very rare chalcopyrite and sphalerite, no galena) are also present in the host shales as veinlets and disseminations, usually in the cm- to m-scale in the vicinity of the sulfide-bearing quartz veins. (Oliver et al., 2015).
The second characteristic feature of Paracatu mineralization is the occurrence of boudinaged quartz ± carbonate ± sulfide veins.
Boudins make up, on average, 8% to 10% by volume of the mineralized rock, though there are wide variations. The central part of the orebody may contain >20% boudin material, but at the margins volumes drop off to 1% to 2% or less. Boudins and their immediate host rocks contain >90% of the sulfides and gold, based on comparison of bulk ore analyses, boudin analyses, and spatial analysis of boudin/vein distribution.
Deformation has produced distinctly separated boudins, distributed along linear trains at a low angle to the bedding of the host stratigraphy. These structures were affected by predominantly oblate flattening strains, producing “chocolate-tablet” boudinage, with less common examples of simple log-like boudins expected from a plane strain deformation (Oliver et al., 2015).
Gold occurs either as free gold or electrum. Microscopic analysis indicates that 92% of the gold at Paracatu is free-milling with less than 8% encapsulated by sulfide grains or silica.

Kinross Gold Corporation Paracatu Project
Brazil NI 43-101 Technical Report
Page 42
8. DEPOSIT TYPES
The Morro do Ouro is a metamorphic gold system with finely disseminated gold mineralization hosted within metasedimentary rocks.
Gold mineralization was introduced syn-tectonically as the result of metamorphic alteration during thrusting of the Morro do Ouro Sequence over the rocks of the younger Vazante Formation (Figure 8-1). Structural interpretation suggests that mineralization was precipitated within a high strain zone where silica and carbonate were depleted from host phyllites, resulting in an increase in graphite content that may have acted as a chemical trap, precipitating out gold and sulfide mineralization remobilized during the metamorphic alteration of the Morro do Ouro Sequence.
The deposit has extraordinary lateral and longitudinal continuity. The majority of exploration efforts have sought to better define the continuous longitudinal continuity of mineralized phyllites at depth west of Rico Creek and the lateral limits of the economic mineralization.
Figure 8-1: Schematic diagrams illustrating the proposed mechanism of formation of the Morro do Ouro deposit (Oliver et al., 2015)

Kinross Gold Corporation Paracatu Project
Brazil NI 43-101 Technical Report
Page 43
9. EXPLORATION
9.1 Mining Leases Since acquiring the Project in 2003, Kinross has completed a significant amount of drilling within the main mining area. Chapter 10 of this report documents drilling activities on the property.
9.2 Exploration Licences In January 2005, Kinross commenced the exploration drill program west of Rico Creek. The outputs of this campaign led to the expansion project (Plant II).
In the licensed exploration areas immediately bordering the mine leases, exploration activities were concentrated on soil and termite-mound geochemical sampling and interpretation of airborne magnetic survey data to look for nearby features similar to Paracatu. Some target areas were generated, mostly located west and west-northwest of the mine. Follow-up exploration returned no significant results.
A near-pit geophysical survey was performed in 2008 to define the induced polarization (IP) and resistivity geophysical signature of the known buried mineralization of the down-dip southwest extension of the mineralized ore zone and fresh rock below and west of Rico Creek. A pattern was identified indicating higher chargeability in the non-mineralized zone above the ore zone, and high resistivity at depth within the ore zone.
Geophysical data was the primary driver of exploration in the licensed exploration areas located 10 km or more from the mine. Definition of favourable structural zones using regional airborne magnetic data yielded three targets which were then surveyed for IP and resistivity. Two targets were located approximately 50 km to 60 km from the mine and the third target was 10 km from the mine. Carbon-rich phyllites with quartz boudins and pyrite similar in lithologic character to the Paracatu deposit, but without gold and arsenopyrite, were identified in one of the targets located further from the mine. Although the samples did not contain gold mineralization, the program was successful in detecting litho-structural controls similar to those associated with the Paracatu deposit.

Kinross Gold Corporation Paracatu Project
Brazil NI 43-101 Technical Report
Page 44
10. DRILLING
10.1 Drilling Programs At the start of mining at Paracatu, exploration campaigns focused on the upper levels of the orebody, within 25 m to 30 m of surface. As mining advanced, deeper drilling campaigns were required to better model the orebody. Currently, a 70m x 70m diamond drill hole (DDH) infill campaign is in progress.
Drilling programs were completed primarily by Rio Tinto until 2004. Since 2005, all campaigns has been carried out by KBM or under ownership supervision. The drilling activities were conducted by various drilling contractors and supervised by geological staff. In 2013, Kinross purchased two drill rigs (Figure 10-1). Table 10-1 summarizes the drilling program history, and Figure 10-2 shows the drill hole distribution across the pit area.
Figure 10-1: Drill rig operated by Kinross team in pit area.
All drill hole data are stored in acQuire database software. The database contains 4,543 diamond drill holes collected between 1984 and the beginning of 2019. The hole spacing within the resource pit varies from 25 to 200 m.
Core diameters for holes drilled by Kinross between 2005 and 2019 included HX (76.2 mm), HQ (63.5 mm), HTW (70.9 mm), and NQ (47.6 mm).
Core was collected continuously from the collar. Wooden tags were placed in the core trays and labelled according to the drill run. All core boxes were clearly labelled with the

Kinross Gold Corporation Paracatu Project
Brazil NI 43-101 Technical Report
Page 45
hole number and drilled interval. Lids were nailed on each core box at the drill site to facilitate transport to the core shed logging facility.
Drill reports identified all zones of broken ground, fault zones and water gain or loss. Water gain or loss was almost non-existent. Rusty water seams in the mineralized zone horizon were extremely rare, suggesting that active water flow occurs almost exclusively in the weathered zone. Table 10-1 shows summary of DDH by year.
10.2 Logging Procedures Drill core logging is recorded in the acQuire system. All pertinent features are logged, including lithology, alteration, weathering, structure, boudins, percent sulfides, etc. Currently the transcription is checked by site geology prior to entry in acQuire to ensure that logged fields match expected codes. Any changes made must be noted as revisions in the logs so that they can be checked against the acQuire database.
10.3 Collar Surveys Drill hole length varies from 10 m to nearly 600 m (west of Rico Creek). All drill hole collars were established in the field by mine survey using standard Trimble R8 or R10 GPS system. The drill holes are surveyed as close as possible to the collar coordinates established by the surveyors with most holes being surveyed within five metres of their planned location.
10.4 Down-hole Surveys Since 2015, azimuth and inclination have been surveyed for all drill holes longer than 120 m. Drill holes shorter than 120 m in downhole length are considered vertical.
All drill setups (-85° to -90°) are checked by Kinross geologists before drilling starts, and geologists control the hole completion depths as well. Since 2018, the hole completion criterion has been a minimum of 24 m of barren core, with no significant sulfidation and no boudins, beyond the interpreted foot wall contact.

Kinross Gold Corporation Paracatu Project
Brazil NI 43-101 Technical Report
Page 46
Table 10-1: Drill holes database summary Campaign Year Diameter No. Holes Length (m)
PMO 1984 6" 44 2462 POÇOS (wells) 1983-1986 1m 458 5070 PAR 1988 6" 26 1014 PRF 1989 - 67 2791 PRI 1990 6" 15 652 PMP 1992 6" 32 417 PMP 1993 6" 33 724 PB2 1993 6" 9 308 FPA 1993 6" 8 240 PMP 1994 6" 42 1330 FPA 1994 6" 33 1158 PMP 1995 6" 50 1518 FPA 1995 6" 22 805 PMP 1996 6" 20 402 PB2 1996 6" 13 945 FPA 1996 6" 34 1203 RAB 1996 6" 20 584 ALB 1996 6" 11 335 PMP 1997 6" 52 1654 PB2 1997 6" 14 604 PMP 1999 6" 29 1320 PMP 2000 HX (3") 17 594 PEC 2000 HX (3") 32 2658 WCR 2000 HX (3") 6 939 MA 2000 HX (3") 2 35 PTE 2001 HX (3") 2 56 PPC 2001 HX (3") 38 1732 PE 2004 HX (3") 60 1997 WCR 2004 HX (3") 3 1091 K 2005 HQ, HTW, NQ 267 48660 KAB 2006 HQ 35 3586 KMA 2006 HQ 5 574 KOP 2007 HQ 93 2365 KGM 2008 HQ 36 2445 K09 2009 HQ 64 2001 K10 2010 HTW 117 6013 K11 2011 HTW 95 6186 K12 2012 HTW 307 16774 K13 2013 HQ 776 20768 K14 2014 HQ 624 20539 K15 2015 HQ 616 20177 K16 2016 HQ 404 22999 K17 2017 HQ 199 27800 K18 2018 HQ 119 9370 K19 2019 HQ 52 10025 Total 5,001 254,917

Kinross Gold Corporation Paracatu Project
Brazil NI 43-101 Technical Report
Page 47
Figure 10-2 Plan view of Kinross Paracatu showing existing drill holes (blue dots)
relative to December 2019 pit topography
10.5 Core Recovery Some campaigns prior to 2005 do not have sufficient recovery information. Post 2005, most diamond surveys on gold estimation campaigns have included recovery information. Low sample recovery is highly correlated with weathered (friable) rock and soil saprolite zones (Figure 10-3).
Global average recoveries are reported to be greater than 95%. Kinross is not aware of any drilling, sampling, or recovery factors that could materially impact the accuracy and reliability of the results.

Kinross Gold Corporation Paracatu Project
Brazil NI 43-101 Technical Report
Page 48
Figure 10-3: Drill hole location in the pit area showing zone with lower and higher
recovery. 10.6 Comments on Drill Programs
In the opinion of the QP, the quantity and quality of the lithological, geotechnical, collar and down hole survey data collected in exploration and infill drill programs are sufficient to support mineral resource and mineral reserve estimation as follows:
• Core logging meets industry standards for gold exploration • Collar surveys have been performed using industry-standard instrumentation • Down hole surveys have been performed using industry-standard
instrumentation • Recoveries from core drill programs are acceptable • Drilling is normally perpendicular to the strike of the mineralization, which is
appropriate for the mineralization style, and orebody geometry. Depending on the plunge of the drill hole, and the dip of the mineralization, drill intercept widths are typically greater than true widths.

Kinross Gold Corporation Paracatu Project
Brazil NI 43-101 Technical Report
Page 49
11. SAMPLE COLLECTION, PREPARATION, ANALYSES, AND SECURITY
Kinross uses industry standard sample preparation, analysis, data management and security procedures for its drill programs. Kinross is of the opinion that the adequacy of the samples taken, the security of the storage and shipping procedures, the sample preparation, and analytical procedures used meet industry standard practices and that the results are suitable to estimate mineral resources and mineral reserves.
The geology team is responsible for:
• Sample collection; • Core Logging; • Delivery of samples to the preparation and analytical laboratories; • Sample storage; and • Sample security at final destination (archive).
11.1 Sampling Method and Approach Drill core is transported by KBM personnel from the drill site to the core logging facility for logging and sampling. Technicians check depth markers and box numbers, reconstruct the core, and calculate core recovery. The core is logged descriptively and marked for sampling by Kinross geologists. Logging and sampling data are recorded in digital logs in acQuire software. Core is photographed prior to sampling.
Upon completion of geological and geotechnical core logging of a diamond drill hole, a core logging geologist identifies the sections of core to be sampled and analysed for gold and other variables (Sulfur, Density, acid neutralising capacity, multi-element, base metals, etc.).
After core is logged, samples are collected and then delivered to the preparation laboratory for sample preparation. The sample dispatch and batch number is sent in digital format.
The greatest areas of core loss were from the collar to 15 m down the hole in laterite (or weathered) zones. Kinross employs a systematic sampling approach where drill core is sampled using standard one metre sample lengths. This standard was used for 83% of the assays. Starting 2018, sample lengths increased to 3 m.
Reference pieces of 8-10 cm are collected and used for density testing. These pieces are labelled and stored at the core logging facility. This practice is acceptable for

Kinross Gold Corporation Paracatu Project
Brazil NI 43-101 Technical Report
Page 50
deposits with a low average grade and good grade continuity. Kinross does not consider the sampling of whole core to be a concern considering its production history.
Usually only mineralized zones are sampled for gold. The samples vary from 1 to 3 m for gold, whereas BWI and ANC sampling uses 12 m composits as per the procedure for those tests.
11.2 Sample Security and Chain of Custody Core samples for analysis are stored in a secure warehouse (core shed) at site prior to sample preparation. The core shed is either locked or under direct supervision of the geological staff. Prior to shipping, drill core samples are placed in large plastic bags and sealed. A sample transmittal form that identifies each batch of samples is prepared. The samples are transported directly to the laboratory for sample preparation and analysis.
All core boxes are covered with wooden lids and nailed shut before being transported by Kinross personnel from Kinross drill rigs to the logging facility located inside the fenced mine gates. After photographing, logging and marking 3 m sample intervals, the whole core is placed in heavy gauge plastic bags with a unique sample tag. The sample tag number is also written in permanent marker on the outside of each sample bag.
Samples are loaded onto pickup trucks and transported to the Kinross Paracatu preparation lab for preparation. Approximately-2.5 kg are prepared and reduced to pulverized sample (100#). The pulverised sample is then collected and transported via pickup truck to the Kinross analytical lab for analysis. . For each sample approximately 6 kg of coarse reject is retained and stored at the core shed for 18 months.
Analytical results are received electronically and managed using a laboratory information management system (LIMS) and imported into the acQuire database. Assay batches are reviewed for acceptance by the database administrator (DBA).
11.3 Sample Preparation, Analyses and Security Prior to the start-up of the mine, all samples were shipped to independent analytical laboratories in Brazil for analysis. After the construction of the mine, most samples were processed at the on-site laboratory. However, in order to meet the demands of the extensive 2005 drill program, Kinross used the following two independent laboratories to perform the analyses:
• ALS Chemex sample preparation facility in Luziânia and ALS Chemex analytical facility in Vancouver, Canada
• SGS Lakefield laboratories – Belo Horizonte, Brazil

Kinross Gold Corporation Paracatu Project
Brazil NI 43-101 Technical Report
Page 51
Most samples were 1 m long until the end of 2017. Since 2018, a 3 m lengh was applied resulting in 27 kg core samples. The samples are crushed to 95% passing in 8 mesh (2.36 mm) and homogenized. Approximately 6 kg of sample is stored as coarse reject and 4.5 kg is discarded. The remaining 2.5 kg is split and pulverized to 95% passing 100 mesh (150 µm). This sample is homogenized and three 50 g aliquots are selected for fire assaying with an Atomic Absorption (AA) finish. The remaining pulverized sample is discarded. These processes are performed in on-site laboratories. The results are based on the average of the three aliquots to decrease the assay variability inherent in the low-grade nature of the deposit.
Until 2005, Kinross reduced the nugget effect by combining results from six separate fire assays of 50 g sample aliquots. Each sub-sample was fire assayed followed by an AA finish. In June 2005, Kinross commissioned Agoratek International to conduct a review of exploration sampling procedures and to assess the requirements for six 50 g aliquot assays per sample (Bongarcon, 2005). Agoratek, led by Dominique Francois-Bongarcon, a recognized expert in sampling, reviewed the sampling procedures and concluded that three 50 g aliquots would be sufficient for the purposes of the exploration program. Since then, three sub-samples have been used.
11.4 Background on Quality Assurance and Quality Control Quality assurance (QA) measures involve collecting evidence to demonstrate that the precision and accuracy of the assay data is within generally accepted limits for the sampling and analytical methods used in order to have confidence in resource estimation. Quality control (QC) consists of procedures used to ensure that an adequate level of quality is maintained throughout the process of sampling, preparing, and assaying the samples. In general, QA/QC programs are designed to prevent or detect contamination and allow analytical precision and accuracy to be quantified. In addition, a QA/QC program can disclose the overall sampling and assaying variability of the sampling method itself.
Accuracy is assessed by a review of results of Certified Reference Material (CRM) standards, and by check-assaying at external accredited laboratories. Assay precision is assessed by reprocessing duplicate samples from each stage of the analytical process from the primary stage of sample splitting, through to the sample preparation stages of crushing/splitting, pulverizing/splitting, and assaying.
QA/QC programs were limited during KBM’s early exploration at Paracatu. The primary QC procedure was the use of inter-laboratory check assays where results from Kinross’ analytical lab were compared with results from Lakefield Research in Canada. Additional check assay work was carried out at the AngloGold laboratories in Brazil (Crixás and Morro Velho).

Kinross Gold Corporation Paracatu Project
Brazil NI 43-101 Technical Report
Page 52
The Kinross lab procedure includes insertion of certified analytical standards (CRMs) and blanks. At least one blank and standard is inserted with each analytical batch of 21 aliquots (from 7 samples). Results are statistically analysed and if they lie outside the acceptable range, all the samples within the batch are repeated. Other checks are also conducted throughout the fire assay process, such as lead recovery to the buttons and silver recovery for the prills. The analyses are repeated if recoveries are below the criteria.
Kinross compiles, analyses, and documents results of the QA/QC programs on a campaign by campaign basis. Details on the methods and results from two of the more extensive drill campaigns are described below.
11.5 Quality Assurance and Quality Control for Drilling Programs Kinross has completed a significant amount of drilling since 2012. A total of 3,097 drill holes with a total length of 148,451 m were completed (Table 11-1). QA/QC results for each program are summarized separately below.
Table 11-1: Drilling program summary table Campaign Year Diameter No. Holes Length (m)
K12 2012 HTW 307 16,774 K13 2013 HQ 776 20,768 K14 2014 HQ 624 20,539 K15 2015 HQ 616 20,177 K16 2016 HQ 404 22,999 K17 2017 HQ 199 27,800 K18 2018 HQ 119 9,370 K19 2019 HQ 52 10,025
Total 3,097 148,452
From 2012 to 2018 a total of 9,588 coarse blanks of crushed limestone and quartz (silica) and 10,865 standards were analysed at the Kinross, ALS and SGS laboratories, This represents an insertion rate of 13.2% for coarse blanks and 14.3% for the standards.
By year, the failure rate of blanks has been between 0.29% and 1.74% (average 0.43%) and for standards the failure rate has been between 1.77% and 16.38% (Table 11-2).

Kinross Gold Corporation Paracatu Project
Brazil NI 43-101 Technical Report
Page 53
Table 11-2: Summary of analytical quality control data - blanks 2012 to 2019
Year Min Au
(g/t)
Max Au
(g/t) Average Au (g/t)
Accepted Max Value
(g/t) No.
Submitted No.
Returned No.
Pass %
Pass No. Fail % Fail
2012 0.005 0.032 0.006 0.032 755 748 735 98.26 13 1.738 2013 0.002 0.028 0.004 0.032 973 965 953 98.76 12 1.244 2014 0.001 0.028 0.004 0.036 2033 2031 2026 99.75 5 0.246 2015 0.001 0.034 0.005 0.036 1577 1555 1553 99.87 2 0.129 2016 0.001 0.030 0.005 0.036 1701 1640 1636 99.76 4 0.244 2017 0.001 0.026 0.005 0.036 1908 1876 1873 99.84 3 0.160 2018 0.001 0.020 0.004 0.036 438 434 433 99.77 1 0.230 2019 0.001 0.026 0.004 0.036 339 339 338 99.71 1 0.295
Global 0.001 0.029 0.005 0.035 9,724 9,588 9,547 99.57 41 0.428
A significant improvement was observed between 2013 and 2014 (number of failures decreased). (Table 11-3).
Table 11-3: Summary of analytical quality control data CRM´s 2012 to 2019
Year Min Au
(g/t)
Max Au
(g/t) Average Au (g/t)
Certified Value (g/t)
No. Submitted
No. Returned
No. Pass
% Pass
No. Fail % Fail %
Bias
2012 0.433 0.809 0.593 0.608 1567 1565 1407 89.90 158 10.096 -0.025 2013 0.529 0.603 0.566 0.564 1242 1239 1036 83.62 203 16.384 0.003 2014 0.598 0.678 0.645 0.631 2080 2080 2000 96.15 80 3.846 0.023 2015 0.386 0.530 0.454 0.464 1588 1587 1537 96.85 50 3.151 -0.021 2016 0.352 0.493 0.420 0.425 1702 1664 1585 95.25 79 4.748 -0.012 2017 0.297 0.441 0.354 0.347 1909 1883 1841 97.77 42 2.230 0.020 2018 0.425 0.562 0.489 0.483 438 435 421 96.78 14 3.218 0.012 2019 0.547 0.758 0.652 0.636 339 339 333 98.23 6 1.770 0.026
Global 0.434 0.592 0.507 0.506 10,865 10,792 10,160 94.14 632 5.856 0.002
Analytical results of standards (Figure 11-1) submitted for review to corporate Kinross Technical Services indicate good lab performance.

Kinross Gold Corporation Paracatu Project
Brazil NI 43-101 Technical Report
Page 54
Figure 11-1: Example of geostats standard (G311-3) chart of quality control 2019 YTD.
11.6 Database
Since 2008, all the drill hole and geological data in Paracatu have been collected and stored in acQuire database software, and the LIMS was implemented in 2013. The implementation of both systems promoted a robust process to control information from the field to the laboratories.
11.7 Comment on Sample Collection, Preparation, Analysis and Security In the opinion of the QP, the sampling methods are acceptable, meet industry-standard practice, and are adequate for mineral resource and mineral reserve estimation and mine planning purposes, based on the following:
• Data are collected following industry standard sampling protocols • Sampling has been performed in accordance with industry best practices • Sample intervals used (1 and 3 m) are typical for the gold industry, and these
intervals are considered to be adequately representative of the true thicknesses of mineralization at Paracatu
• The specific gravity determination procedure is consistent with industry-standard procedures
• There are sufficient specific gravity determinations to support the specific gravity values used in waste and mineralization tonnage interpolations
• Geochemical sampling covers a sufficient area and is adequately spaced to generate first-order geochemical anomalies, and thus is representative of first-pass exploration sampling

Kinross Gold Corporation Paracatu Project
Brazil NI 43-101 Technical Report
Page 55
• Drill sampling has been adequately spaced to first define, then infill, gold anomalies to produce prospect-scale and deposit-scale drill data. In general, the drill collar spacing ranges from 25 m x 25 m, to 70 m x 70 m
• The QA/QC program incorporates the insertion of blank, duplicate and CRM samples
• Sample security is ensured by locking samples in appropriate sample storage areas prior to dispatch to the sample preparation facility. At other times, samples are always accompanied by Kinross employees. Chain of custody procedures consist of completing sample submittal forms, which are sent to the laboratory with sample shipments, to make certain that all samples are received by the laboratory
• No factors were identified in the drill programs that could affect mineral resource or mineral reserve estimation
• Current sample storage procedures and storage areas are consistent with industry standards.

Kinross Gold Corporation Paracatu Project
Brazil NI 43-101 Technical Report
Page 56
12. DATA VERIFICATION
The resource database was reviewed and verified during site visits, a series of verification exercises by different entities and a review of QA/QC results. Results from the QA/QC exercises are presented in Section 11. All other checks are described in this section.
Rio Tinto applied a rigorous data verification process at Paracatu where the database was manually verified against original assay and field certificates. Rio Tinto also completed biennial reviews of its procedures and methodology. The 1998, 2000 and 2002 reviews concluded that the procedures met Rio Tinto’s corporate guidelines for resource modelling and reserve estimation.
RPM independently verified 10% of the data collected between 1999 and 2004 against original source documents. The holes were chosen at random and any errors against original sources were documented. No significant or material errors were identified. The Kinross geology department recently verified 5% of the data collected between 2010 and 2012 against original source documents. This verification activity also did not identify any concerns regarding the quality or accuracy of the data or database.
As part of external auditing in 2006, 2009, and 2012, Roscoe Postle Associates (RPA, 2012) verified the gold values in the database with the assay certificates for a total of 1,192 assays from 13 drill holes. No significant errors were identified. RPA also checked the downhole survey values and found no significant errors.
Paracatu has been improving the quality assurance and quality control methods and systems since the completion of 2014. These improvements provide confidence in the integrity of the geological/geochemical database.
The QP, John Sims, has reviewed the reports and is of the opinion that the data verification programs undertaken adequately support the geological interpretations, the analytical work and database quality.
Data used to support mineral resource and mineral reserve estimates have been subjected to validation, using software triggers that automatically check data for a range of data entry errors. Verification checks on surveys, collar coordinates, lithology, and assay data have also been conducted. The checks are appropriate, and consistent with industry standards.

Kinross Gold Corporation Paracatu Project
Brazil NI 43-101 Technical Report
Page 57
13. MINERAL PROCESSING AND METALLURGICAL TESTING
13.1 Deposit Mineralogical Characterization In May 2018, a characterization program was completed by SGS Minerals Service in Canada. For this work, four different samples, as described below (C1 to C4) were composited, and prepared for bulk mineralogy and gold deportment studies (Figure 13-1). The four composites represent key groupings of ore characteristics, which are expected to be encountered over the remaining life of mine.
• C1 – Sulfur Rich - Zone of more intense alteration based on sulfur content and base metal content, high sulfur grade and enriched in base metals.
• C2 – Upper Oxide - Zone of higher oxidation and low sulfur grade. • C3 – Lower Alkali - Halo zone or more distal mineralization based on sulfur content
and base metal content and increased alkali content. • C4 – Life of mine – composition based on the proportion of the ore types in the mine
remaining to be processed over life of mine.
Figure 13-1: Sample locations for characterization program
The bulk mineral abundance (including clay mineralogy), determined by XRD semi-quantitative analysis, is listed in Table 13-1. The composite samples contain major amounts of quartz (40% to 43%) and mica (31% to 35%), minor amounts of albite and

Kinross Gold Corporation Paracatu Project
Brazil NI 43-101 Technical Report
Page 58
siderite (5% to 10%), and trace amounts (<2%) of ankerite, microcline, pyrite, arsenopyrite, ilmenite, brookite, and possible other minerals. Minor amounts of clay minerals including illite (3% to 4%) and chlorite (2% to 4%) were also identified in the four composites.
Table 13-1: Deposit mineralogical characterization
The overall gold deportment including microscopic gold (presented as liberated, exposed, and locked gold) and submicroscopic gold distribution (%) for all four composite samples, is shown in Table 13-2. These results are based on an approximate P80 of 125 µm for all composites, which was in-line with the flotation feed P80 at the time. In Table 13-2:
• Liberated - ≥80% of gold surface area exposure • Exposed - <80% of surface area exposure • Locked - A gold grain totally enclosed in another mineral or particle
Table 13-2: Gold distribution (C1 – S-rich; C2 – quartizite/silica; C3 – lower alkali; C4 – life of mine)

Kinross Gold Corporation Paracatu Project
Brazil NI 43-101 Technical Report
Page 59
The total amount of microscopic gold in composite sample C4 accounts for 96.9% of the head assay, including liberated (33.2%), exposed (16.4%), and locked (47.3%) gold, with average sizes of 38.4 µm, 3.9 µm, and 1.8 µm, respectively. The main gold minerals found in sample C4 are Au-Ag alloys, including native gold (88%), electrum (8%), and kustelite (4%). The exposed and locked gold is mainly associated with pyrite (63%), moderate amounts with arsenopyrite/silicate binaries (18%), arsenopyrite (17%), and trace (<2%) occurrences with other minerals.
Gold size distribution
The mineralogical characterization of Paracatu ROM ore indicates that gold grains are generally fine, F50~14µm and shows that there is a significant difference in the gold grain sizes in the tailings and concentrate products as detailed in Figure 13-2, which shows that the gold with smaller grain size ends up in the tailings.
Figure 13-2 also shows the size of the gold grain (D50) at key processing points. For the construction of this flowsheet, different characterization test programs are considered, as referenced below:
• (1) SGS Lakefield (May 2018) / Samples representing the LOM • (2), (3) LCT – São Paulo University (April 2018) • (4), (5) LCT – São Paulo University (July 2017) / Sampled at Plant I

Kinross Gold Corporation Paracatu Project
Brazil NI 43-101 Technical Report
Page 60
Figure 13-2: Gold grain size – D50
13.2 Rougher Tails Characterization In April 2018, a sample from Plant II rougher tails was sent to USP – São Paulo University and characterization was completed to determine the gold association and liberation. Only 37% of gold is exposed and the main association is with sulfide minerals (Figure 13-3). No liberated gold particles were noted in the sample.
ROM1
D(50) – Au ~14 microns
Flotation Tails2
D(50) – Au ~ 9 microns
Tailings Reproc. Hauled4
D(50) – Au ~18 microns
Tailings Reproc. Pumping5
D(50) – Au ~6 microns
Flotation Concentrate3
D(50) – Au ~28 microns
Gold Poured
Hydro (CIL) Tails
Liquid
Solid

Kinross Gold Corporation Paracatu Project
Brazil NI 43-101 Technical Report
Page 61
Figure 13-3: Rougher tails mineralogical characterization

Kinross Gold Corporation Paracatu Project
Brazil NI 43-101 Technical Report
Page 62
Gold and Sulfur distribution by size – Plant II Rougher Tails
The particle size distribution shows that most of the mass, gold and sulfur, is below 38 microns. The sample tested was a composite of tailings from July 2019 (Figure 13-4).
Figure 13-4: Gold and particle size distribution
13.3 Leaching CIL solid tails samples were sent annually to AMTEL for characterization in 2011 and from 2013 to 2017 (Figure 13-5). Typically, the samples were collected over a period of about one week.

Kinross Gold Corporation Paracatu Project
Brazil NI 43-101 Technical Report
Page 63
Figure 13-5: CIL tails characterization from 2011 to 2017
For the samples from 2015 and 2016, respectively 56% and 57% of the losses were caused by preg-robbing/borrowing effect.
In 2017, characterization analysis also included a CIL feed sample. Comments on the comparison of the CIL feed and tails samples are provided below and details are shown in Table 13-3.
• Water-soluble gold salts are insignificant (<0.001g/t); indicating good activated carbon management
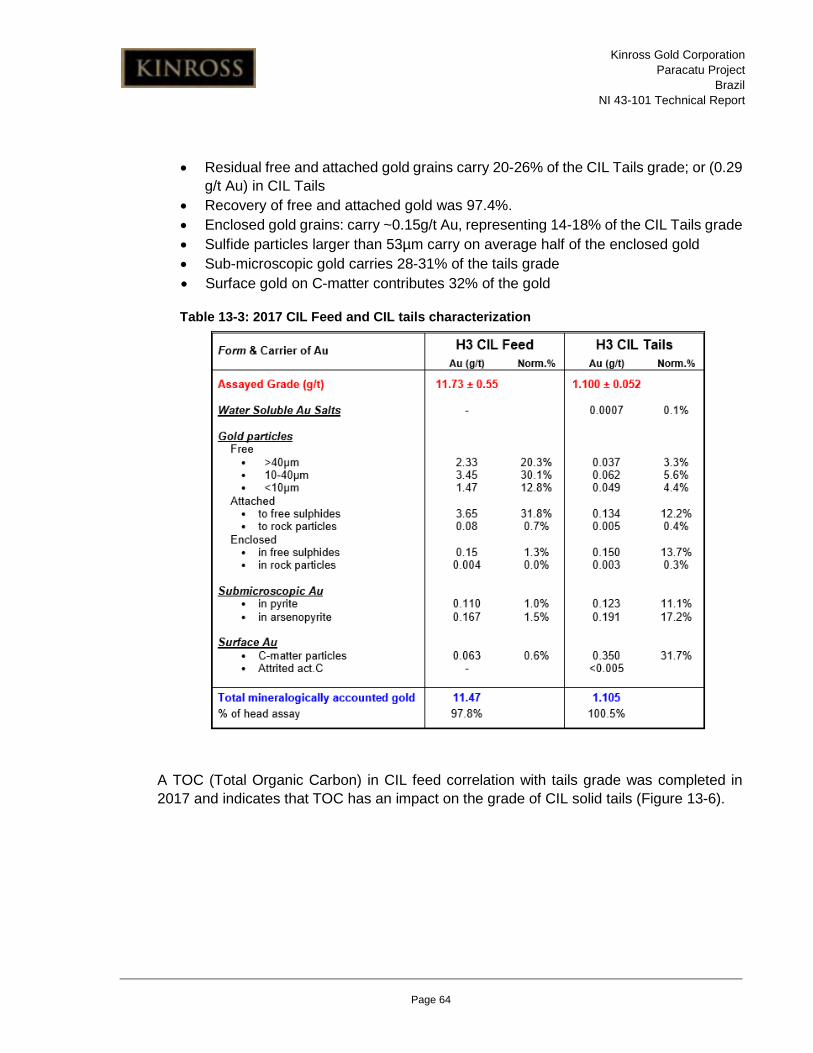
Kinross Gold Corporation Paracatu Project
Brazil NI 43-101 Technical Report
Page 64
• Residual free and attached gold grains carry 20-26% of the CIL Tails grade; or (0.29 g/t Au) in CIL Tails
• Recovery of free and attached gold was 97.4%. • Enclosed gold grains: carry ~0.15g/t Au, representing 14-18% of the CIL Tails grade • Sulfide particles larger than 53µm carry on average half of the enclosed gold • Sub-microscopic gold carries 28-31% of the tails grade • Surface gold on C-matter contributes 32% of the gold
Table 13-3: 2017 CIL Feed and CIL tails characterization
A TOC (Total Organic Carbon) in CIL feed correlation with tails grade was completed in 2017 and indicates that TOC has an impact on the grade of CIL solid tails (Figure 13-6).

Kinross Gold Corporation Paracatu Project
Brazil NI 43-101 Technical Report
Page 65
Figure 13-6: Hydro (CIL) tails and TOC correlation
13.4 Clay Minerals
Chemical interactions such as weathering or hydrothermal alteration (i.e., mineralization events) between water and rock transform nominally anhydrous materials formed by volcanic and igneous processes into hydrous phases, including clay minerals, which incorporate OH or H2O in their structures (Figure 13-7).
Figure 13-7: Clay mineral development
Original mineralFe-silicates
Olivine, pyroxene, amphibole, biotite
FeldsparQuartz
MuscoviteCalcite
Chemical WeatheringTectonic UpliftSoil Formation
Weathering Product
Clay Minerals, Fe-Oxides
Clay Minerals, K+, Na+, Ca+
QuartzClay Minerals, K+
Ca, CO32-
BurialSedimentary
Rock Formation
IlliteFormation

Kinross Gold Corporation Paracatu Project
Brazil NI 43-101 Technical Report
Page 66
Metallurgical testing was undertaken in 2016 to characterize the impact of clay minerals in the deposit on flotation performance. The test work indicated that clay content in the flotation feed above 10% resulted in a negative impact on flotation performance. A program has been implemented to limit mill feed to a maximum clay content of 10%.
13.5 Gravity and GRG The results of four Extended Gravity Recoverable Gold (E-GRG) tests carried out by SGS and reviewed by FLS are presented in Table 13-4. The GRG is moderate to coarse in size, and highly amenable to gravity recovery. In closed circuit grinding, the largest process risk is over-grinding of GRG to very fine size, leading to high gold losses in the finest fractions.
Table 13-4: E-GRG test results
13.6 BWI and Throughput Model Bond Work Index (BWI) is measured in an on-site lab. The BWI is estimated in the block model by kriging. Paracatu has run approximately 11,600 BWI tests, and hardness is well defined in the mine model (Figure 13-8).
A throughput vs. BWI curve has been developed to predict throughput in the plants based on the ore hardness as estimated by BWI. Continuous improvement principles have been applied to maintain and improve upon predicted plant performance based on the BWI vs. throughput curve.

Kinross Gold Corporation Paracatu Project
Brazil NI 43-101 Technical Report
Page 67
Figure 13-8: 50 x 50 x 12 m block kriging for BWI
Quartzite impact on BWI
The quantity of quartzite present has an impact on BWI and other hardness characteristics of the ore. As a result, areas containing meaningful quantities of quartzite are identified in the mine and a processing strategy has been implemented to optimally process these areas.
2 4 6 8 10 12 14 16 18 20
bwi1
0.0
0.5
1.0
1.5
2.0
2.5
3.0
3.5
4.0
4.5
5.0Fr
eque
ncy
(% o
f 607
664)
bwi1 Histogrammgm25 50 75
countmin
maxmeanstdev
skewnesskurtosisvariance
CVgeom mean
25%median
75%
bwi16076641.43220.77714.1753.251-1.531.7010.570.2313.62913.52715.17316.241

Kinross Gold Corporation Paracatu Project
Brazil NI 43-101 Technical Report
Page 68
14. MINERAL RESOURCE ESTIMATE
14.1 Summary of Mineral Resources Mineral Resources are stated in accordance with the definitions of National Instrument 43-101 – Standards of Disclosure for Mineral Projects (NI 43-101). Mineral Resources have an effective date of December 31, 2019.
Mineral Resources are reported using a gold price of $1,400/oz and variable cut-off grades based on BWI and global recovery. Processing recoveries and associated operating conditions were used to generate an optimized pit shell. Mineral Resources are exclusive of Mineral Reserves and are reported between the EOY 2019 projected topography and ultimate pit design (Table 14-1). The Mineral Resources also include Inferred material which is stated separately. Figure 14-1 illustrates the extent of the mineral resource.
Inferred Mineral Resources include an estimated 367 koz of gold contained (47,159 kt with 0.2 g/t) in the Santo Antônio tailings deposit (PSAT). The remaining 1 koz (107 kt with 0.3 g/t) of Inferred is in situ material in the resource pit shell.
Table 14-1: Mineral Resources exclusive of Mineral Reserves – December 31, 2019 Tonnes
(kt) Gold (g/t)
Gold Ounces (koz)
Measured (M) 181,341 0.3 2,001 Indicated (I) 163,562 0.4 2,072 M+I 344,903 0.4 4,073 Inferred 47,267 0.2 368
Notes: 1. Mineral Resources are exclusive of Mineral Reserves. 2. Mineral Resources estimated according to CIM Definitions. 3. Mineral Resources estimated at $1,400/oz Au. 4. Mineral Resources are reported at gold cut-off grade that varies by BWI and global recovery
from 0.11 g/t to 0.19 g/t.

Kinross Gold Corporation Paracatu Project
Brazil NI 43-101 Technical Report
Page 69
Figure 14-1: Plan view location of Mineral Resource estimate cut by ultimate resource.
14.2 Resource Database Drill hole data are stored and maintained in an acQuire software database. The database is maintained at site and updated as new validated data become available. The drill hole data for the 2019 model were exported as comma separated files (.csv) and imported into Datamine software. A total of 157,482 samples corresponding to 179,016 m of diamond core samples were available to estimate gold mineral resources. Channel and trench samples were not used for the estimation process.
Sections 11 and 12 describe the steps to validate the acQuire database. Kinross is confident that the drill hole database is valid and suitable to estimate mineral resources.
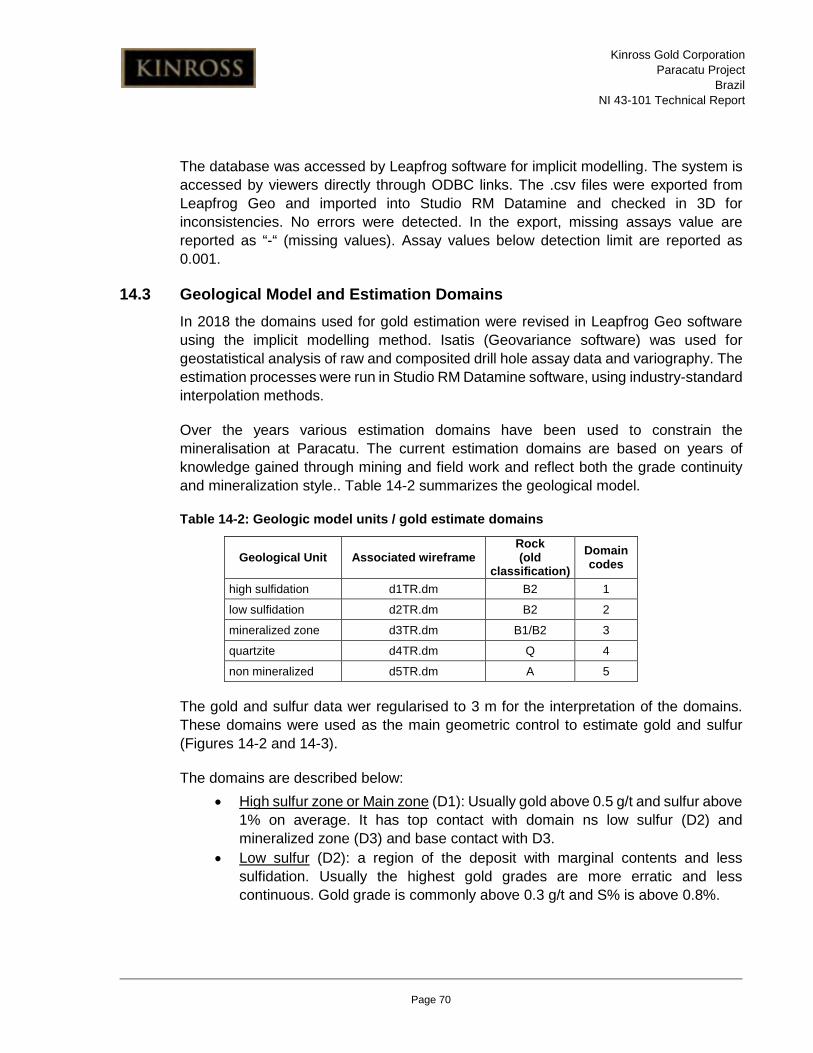
Kinross Gold Corporation Paracatu Project
Brazil NI 43-101 Technical Report
Page 70
The database was accessed by Leapfrog software for implicit modelling. The system is accessed by viewers directly through ODBC links. The .csv files were exported from Leapfrog Geo and imported into Studio RM Datamine and checked in 3D for inconsistencies. No errors were detected. In the export, missing assays value are reported as “-“ (missing values). Assay values below detection limit are reported as 0.001.
14.3 Geological Model and Estimation Domains In 2018 the domains used for gold estimation were revised in Leapfrog Geo software using the implicit modelling method. Isatis (Geovariance software) was used for geostatistical analysis of raw and composited drill hole assay data and variography. The estimation processes were run in Studio RM Datamine software, using industry-standard interpolation methods.
Over the years various estimation domains have been used to constrain the mineralisation at Paracatu. The current estimation domains are based on years of knowledge gained through mining and field work and reflect both the grade continuity and mineralization style.. Table 14-2 summarizes the geological model.
Table 14-2: Geologic model units / gold estimate domains
Geological Unit Associated wireframe Rock (old
classification) Domain codes
high sulfidation d1TR.dm B2 1
low sulfidation d2TR.dm B2 2
mineralized zone d3TR.dm B1/B2 3
quartzite d4TR.dm Q 4
non mineralized d5TR.dm A 5
The gold and sulfur data wer regularised to 3 m for the interpretation of the domains. These domains were used as the main geometric control to estimate gold and sulfur (Figures 14-2 and 14-3).
The domains are described below: • High sulfur zone or Main zone (D1): Usually gold above 0.5 g/t and sulfur above
1% on average. It has top contact with domain ns low sulfur (D2) and mineralized zone (D3) and base contact with D3.
• Low sulfur (D2): a region of the deposit with marginal contents and less sulfidation. Usually the highest gold grades are more erratic and less continuous. Gold grade is commonly above 0.3 g/t and S% is above 0.8%.
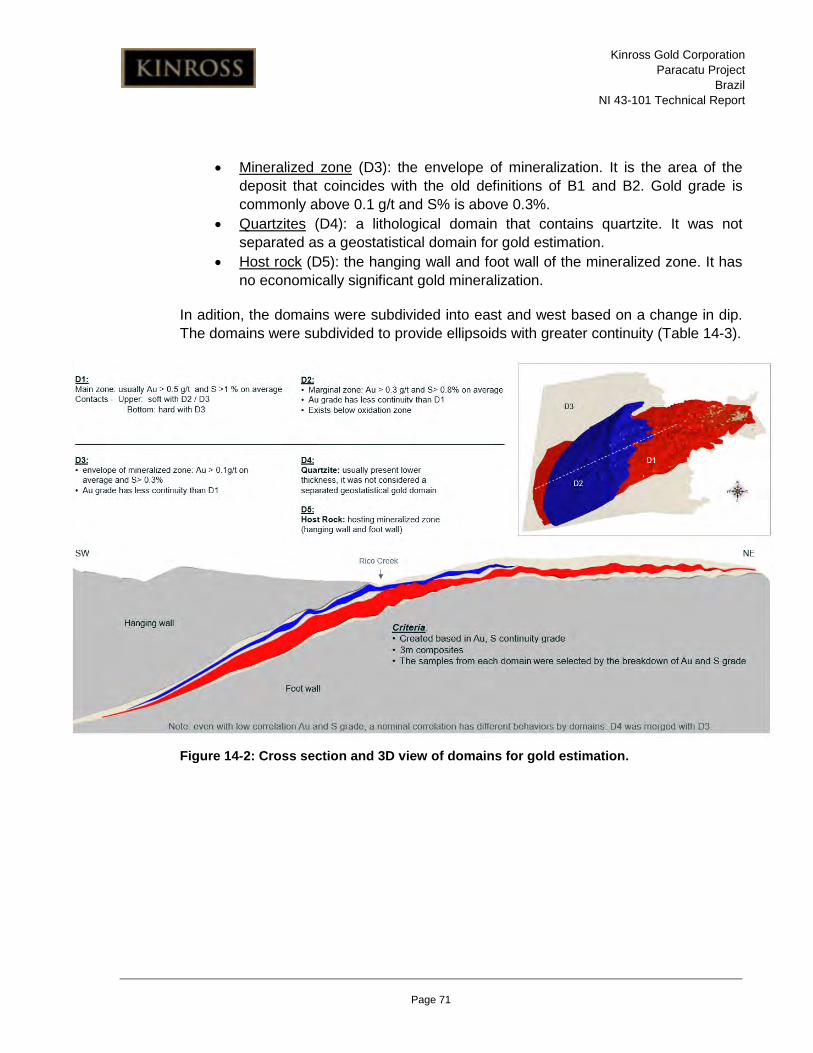
Kinross Gold Corporation Paracatu Project
Brazil NI 43-101 Technical Report
Page 71
• Mineralized zone (D3): the envelope of mineralization. It is the area of the deposit that coincides with the old definitions of B1 and B2. Gold grade is commonly above 0.1 g/t and S% is above 0.3%.
• Quartzites (D4): a lithological domain that contains quartzite. It was not separated as a geostatistical domain for gold estimation.
• Host rock (D5): the hanging wall and foot wall of the mineralized zone. It has no economically significant gold mineralization.
In adition, the domains were subdivided into east and west based on a change in dip. The domains were subdivided to provide ellipsoids with greater continuity (Table 14-3).
Figure 14-2: Cross section and 3D view of domains for gold estimation.

Kinross Gold Corporation Paracatu Project
Brazil NI 43-101 Technical Report
Page 72
Figure 14-3: Cross section domains and gold grades.
Kinross Gold Corporation Paracatu Project
Brazil NI 43-101 Technical Report
Page 73
Table 14-3: Gold subdomains in the resource model
Domain Code Subdomain code Associated wireframe Description
1 110 d1neTR.dm Domain 1 side NE 1 120 d1swTR.dm Domain 1 side SW 2 210 d2neTR.dm Domain 2 side NE 2 220 d2swTR.dm Domain 2 side SW 3 310 d3neTR.dm Domain 3 side NE 3 320 d3swTR.dm Domain 3 side SW 5 510 d5neTR.dm Domain 5 side NE 5 520 d5swTR.dm Domain 5 side SW
Weathering
Weathering models are used for resource estimation and associated variables (clay, ARD, etc.), as well as waste management and environmental parameters. The weathering profile was correlated with the occurrence of clay.
The weathering model was updated in 2018 using all validated data and a considerable amount of re-logging of the photographic database. As part of reinterpretation, 917 drill holes were re-logged using the photographic database as shown in Figures 14-4 and 14-5.

Kinross Gold Corporation Paracatu Project
Brazil NI 43-101 Technical Report
Page 74
Figure 14-4: Schematic weathering profile and correlation with cores.

Kinross Gold Corporation Paracatu Project
Brazil NI 43-101 Technical Report
Page 75
Figure 14-5: Location of re-logged cores.
Quartzite Zone
Large quartzite boulders pose a risk at Paracatu as they lead to uncontrolled increases in the BWI of process feed. In 2018, Kinross reviewed all available geological information related to massive quartz occurrences inside and around the pit. Field mapping was used to understand, map and interpret the lateral extension and complex geometry of quartzite lenses in the pit face. A thick (up to 10 m) quartzite lens is present in the north east section of the pit, referred to as the “quartzite zone”. Starting in 2017, Kinross revisited drill core and reinterpreted the quartzite zone. Figure 14-6 shows the model of quartzite lens geometry (L1 - L6).

Kinross Gold Corporation Paracatu Project
Brazil NI 43-101 Technical Report
Page 76
Figure 14-6: Quartzite model showing lens locations.
Acid Rock Drainage (ARD)
Net acid producing potential (NAPP) is the acid base accounting method used to determine the likelihood of a material generating acidic conditions. NAPP is calculated from sulfide (S) content and the inherent acid neutralising (ANC) capacity of the material.
A negative NAPP indicates an excess of ANC and hence the material is unlikely to acidify (i.e., Non-Acid Forming, NAF) while a positive NAPP indicates a deficiency of ANC and the sample is likely to generate acid (i.e., Potentially Acid Forming, PAF). These criteria were applied to develop the ARD model.
14.4 Statistical Analysis and Compositing Various tools (Leapfrog Geo, Isatis, Phinar X10 Geo) were used for exploratory data analysis, contact analysis and variography.
Gold
Of the assay intervals, 83% are of equal length and measure 1 m. Compositing was applied to reduce the variability and ensure the same support. Assays were composited using a 6 m length, which is half of the mining bench height. Composites honoured the mineralized domain boundaries. The small intervals (<3 m) resulting from the compositing were merged to adjust the total length inside the domains. (Figure 14-7).

Kinross Gold Corporation Paracatu Project
Brazil NI 43-101 Technical Report
Page 77
Figure 14-7: Histograms showing statistics of gold raw data and 6 m composites. Capping analysis was completed on composited data. Capping was assessed by log probability plots, histograms and spatial analysis to ensure that capped samples were not in specific high grade zones or domains (Figure 14-8).
Gold assays were capped at approximately the 99th percentile where a break in the distribution was observed in the curve. In the current resource estimate, each domain was analyzed. The maximum capping value is 1.807 g/t for gold in domains D1, D2 and D3. Histograms, cumulative frequency plots and sensitivity analysis (variance vs. cut-off) were examined to determine the impact of the grade cap.

Kinross Gold Corporation Paracatu Project
Brazil NI 43-101 Technical Report
Page 78
Figure 14-8: Interpolant grade shell showing low continuity of capped values in the deposit.
Summary statistics are shown in Figures 14-9 and 14-10.

Kinross Gold Corporation Paracatu Project
Brazil NI 43-101 Technical Report
Page 79
Figure 14-9: Histograms for uncapped and capped data for Northeast domains.

Kinross Gold Corporation Paracatu Project
Brazil NI 43-101 Technical Report
Page 80
Figure 14-10: Histograms for uncapped and capped data for Southwest domains

Kinross Gold Corporation Paracatu Project
Brazil NI 43-101 Technical Report
Page 81
Figure 14-11 shows the distribution of gold samples in relation to the final pit.
Figure 14-11: 3D view of drill hole gold samples.
Density
Kinross has collected a large density dataset, primarily from drill hole core. A total of 45,970 records was available by end of 2018, and 37,869 raw data samples were composited to build the spatial density model, which resulted in 36,838 composite samples. Table 14-4 summarizes the density measurements to date.
Table 14-4: EOY 2018 - density database summary – raw data vs composite
Database Long
Range Drillholes
Short Range
Drillholes
Long + Short
Drillholes LRS
Samples
Density (raw) 1,490 1,776 3,266 37,869
Density (Comp) 1,490 1,776 3,266 36,838

Kinross Gold Corporation Paracatu Project
Brazil NI 43-101 Technical Report
Page 82
The capping analysis was completed on raw length weighted assays. It included a visual review of the probability plots, and a statistical assessment of 99.95th percentiles. Blanks were defined “-“ and filled 0.0001, and later removed from compositing processes. Figure 14-12 shows the density distribution by domain in oxidized and fresh rock weathering zones.
Figure 14-12: Bimodal histogram showing overall distribution of composited density
(SGC) used to update the 2019 resource model.
Density measurements for recent drilling use 8-10 cm samples collected every 4 m.
Density data are recorded and stored in the acQuire database for use in model estimation. Figure 14-13 illustrates the distribution by domain after density is capped at of 3.8 t/m³.

Kinross Gold Corporation Paracatu Project
Brazil NI 43-101 Technical Report
Page 83
Figure 14-13: Density block model results by domains.
Due to the difficulties in measuring density in friable material, a fixed value was assigned, based on in situ tests:
• Soil = 1.6 t/m³ • Saprolite = 1.8 t/m³
Only the densities of the transition zone and fresh rock domains were considered for estimation. In the case of non-estimated blocks, the mean of the samples of each domain was used:
• Transition zone = 2.45 t/m³ • Fresh Rock = 2.75 t/m³
The methodology and validation of density estimation is discussed in Section 14.6.
1 2 3 5
DOM
2.2
2.4
2.6
2.8
3.0
3.2
3.4
3.6
3.8
SGC
SGC Box Plot
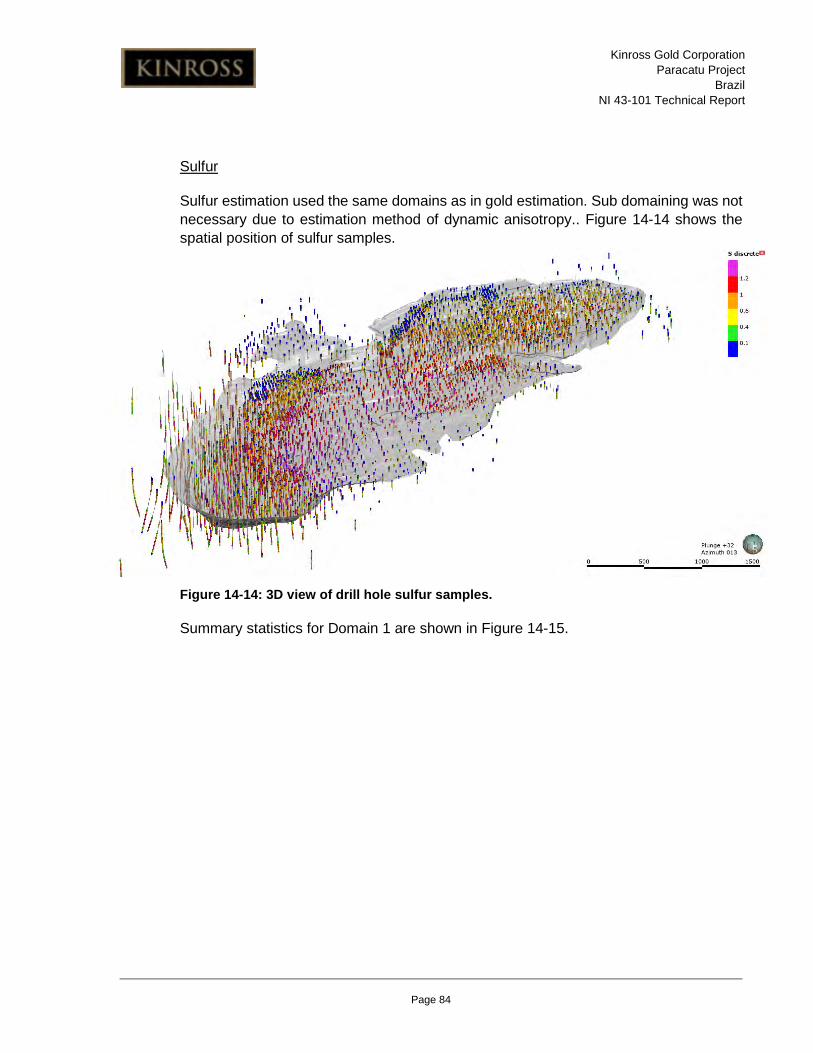
Kinross Gold Corporation Paracatu Project
Brazil NI 43-101 Technical Report
Page 84
Sulfur
Sulfur estimation used the same domains as in gold estimation. Sub domaining was not necessary due to estimation method of dynamic anisotropy.. Figure 14-14 shows the spatial position of sulfur samples.
Figure 14-14: 3D view of drill hole sulfur samples.
Summary statistics for Domain 1 are shown in Figure 14-15.

Kinross Gold Corporation Paracatu Project
Brazil NI 43-101 Technical Report
Page 85
Figure 14-15: Summary of statistics: Sulfur overall domain 1 (high sulfur) / composite 6
m.
ANC
ANC was analyzed with a support length of 12 m (Figure 14-16). Figure 14-17 illustrates the spatial distribution of ANC.

Kinross Gold Corporation Paracatu Project
Brazil NI 43-101 Technical Report
Page 86
Figure 14-16: ANC composite Length.

Kinross Gold Corporation Paracatu Project
Brazil NI 43-101 Technical Report
Page 87
Figure 14-17: Spatial distribution of the ANC variable.
14.5 Variography and Continuity Analysis Variography was completed separately for all variables by domain (as required).
Downhole variograms, using a lag distance equal to the composite length, were created for each of the domains. From the down hole variograms, the nugget was estimated and applied to subsequent spatial variography for each domain. For gold (and most of the other variables) a 70 m lag distance was used which corresponds with the average distance between drill holes. Different lag distances appeared to generate inferior variograms.
Experimental variography was subsequently used to calculate best-fit modeled variography. Data points with fewer than 100 sample pairs in down hole variography or fewer than 350 pairs for spatial variography were ignored. Similarly, calculations were weighted by pairs. Two spherical structures were used for both downhole and directional modeling. Search lag distances and search angles were adjusted to best fit the data and maintain the highest resolution.
Only gold variography in this report, but the same methodology has been used for all other variables.

Kinross Gold Corporation Paracatu Project
Brazil NI 43-101 Technical Report
Page 88
For elements where inverse distance has been used as the estimation technique, variography has still been performed and is used as the basis for the orientation and distances of the search ellipsoid.
Gold
Variography was completed separately based on the spatial and geologic differences on each side of Rico Creek. The internal low grade zones and the quartzite were included in the encompassing domains. Domain ellipses in the context of the domain and mine surface are shown in Figure 14-18.
Figure 14-18: Search volume and orientation ellipse, isometric view of southwest region of pit

Kinross Gold Corporation Paracatu Project
Brazil NI 43-101 Technical Report
Page 89
The variogram parameters used for resource estmation are listed in Table 14-5.
Table 14-5: Summary of variography for gold domains.
Domain Direction (axes)
Nugget (C0) Sill (C1) Sill (C2) 1st ST
(m) 2nd ST
(m) -Z +X -Z
D1N
E Major (U) 0.021 0.012 0.0075 100 700 -40 0 0 SMajor (V) 0.021 0.025 0.0053 50 350
Minor (W) 0.021 0.025 0.0053 6 12
D1S
W Major (U) 0.012 0.022 0.0195 80 700
90 12 65 SMajor (V) 0.012 0.022 0.0195 52 700 Minor (W) 0.012 0.022 0.0195 12 25
D2N
E Major (U) 0.005 0.00575 0.0067 100 400 -40 0 0 SMajor (V) 0.005 0.00575 0.0067 95 200
Minor (W) 0.005 0.00575 0.0067 9 18
D2S
W Major (U) 0.012 0.005 0.003 110 550
90 12 65 SMajor (V) 0.012 0.005 0.003 80 350 Minor (W) 0.012 0.005 0.003 12 48
D3N
E Major (U) 0.01 0.014 0.0095 75 600 -40 0 0 SMajor (V) 0.01 0.014 0.0095 75 455
Minor (W) 0.01 0.014 0.0095 12 40
D3S
W Major (U) 0.01 0.002 0.0096 100 680
90 12 65 SMajor (V) 0.01 0.002 0.0096 65 375 Minor (W) 0.01 0.002 0.0096 12 18
Figures 14-19 through 14-24 show the variograms obtained for each of the domains estimated by ordinary kriging.

Kinross Gold Corporation Paracatu Project
Brazil NI 43-101 Technical Report
Page 90
Figure 14-19: Variography: Au Domain 1 NE side (110), major, semi-major and minor.
Figure 14-20: Variography: Au Domain 1 SW side (120), major, semi-major and minor.
Figure 14-21: Variography: Au Domain 2 NE side (210), major, semi-major and minor.
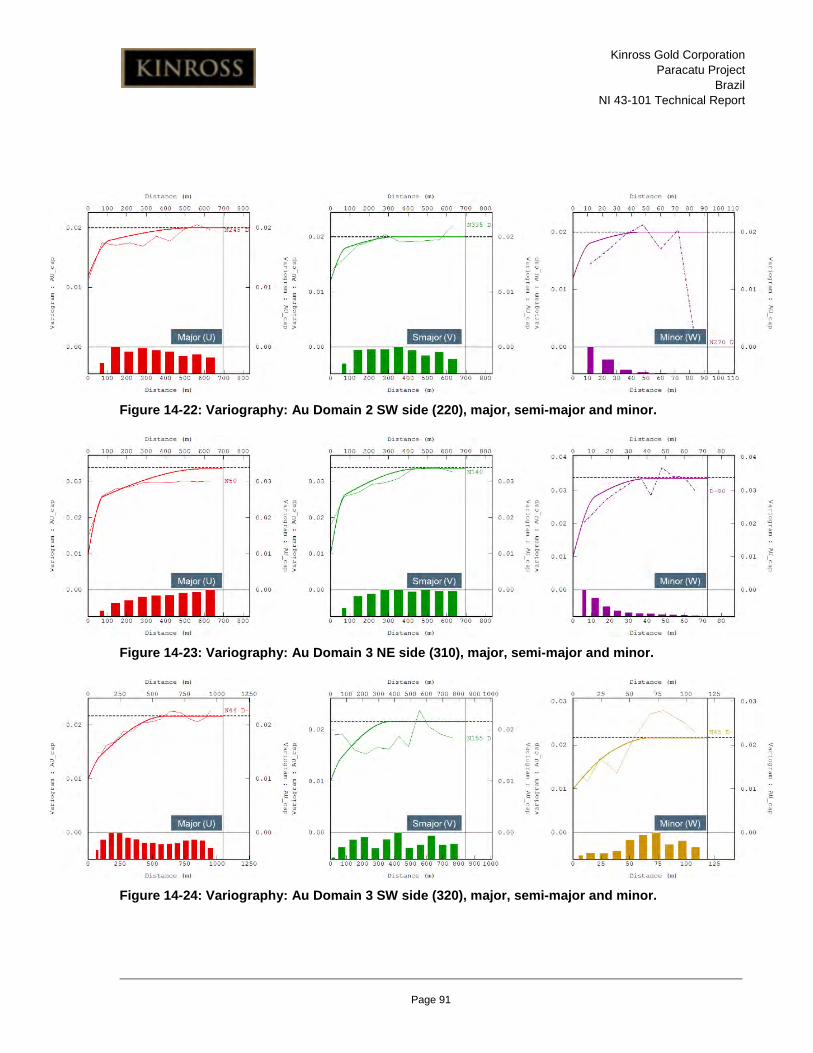
Kinross Gold Corporation Paracatu Project
Brazil NI 43-101 Technical Report
Page 91
Figure 14-22: Variography: Au Domain 2 SW side (220), major, semi-major and minor.
Figure 14-23: Variography: Au Domain 3 NE side (310), major, semi-major and minor.
Figure 14-24: Variography: Au Domain 3 SW side (320), major, semi-major and minor.

Kinross Gold Corporation Paracatu Project
Brazil NI 43-101 Technical Report
Page 92
14.6 Estimation Methodology Estimation Parameters Set-Up
The 2019 block model was constructed using Datamine software. Parent cell size for the block model is 25 x 25 x 12 m, with a non-rotated block model.
The resource block model contains estimates for Au, S, density, and BWI, which support mineral resource and reserve estimation, and strategic business planning. Table 14-6 summarizes the 2019 model variables.
Table 14-6: Variables used to build the 2019 MRMR block model
Origin Variable Description Estimate method
Block model IJK default block identifier XC X centroid YC Y centroid ZC Z centroid
XMORIG X origin YMORIG Y origin ZMORIG Z origin
XINC X increment - block size YINC Y increment - block size ZINC Z increment - block size NX X count blocks NY Y count blocks NZ Z count blocks
Category Litho AH (waste hanging wall), B1 (oxide), B2 (sulfide), AF (waste foot wall)
Flagging
WEATHER (N) 1-Soil, 2-Saprolite, 3-Oxidized Rock, 4-Fresh rock
Flagging
Oxide oxidation surface: 0 - bellow , 1 – above Flagging DOM integer domain (1, 2, 3, 4 and 5) Flagging
DOMAIN subdomaining by dip (110/120, 210/220, 310/320, 410 and 510/520)
Flagging
Mined 1 - Air, 2 - mined, 3 - 2015 ultimate pit, 4 – resource
Flagging
Wireframe flag mag_zone magnetic zone percentile vol claypct clay percent by wireframe percentile vol qtzpct quartzite percent by wireframe percentile vol
qtz_tck_mn quartzite thickness – Min percentile vol qtz_tck_md quartzite thickness – Mean percentile vol qtz_tck_mx quartzite thickness – Max percentile vol
wth_pct weathering percentage percentile vol Estimation Density Density ID2
Au kriged Au (g/t) OK

Kinross Gold Corporation Paracatu Project
Brazil NI 43-101 Technical Report
Page 93
Origin Variable Description Estimate method
S kriged S (%) OK H2SO4 kriged H2SO4 (kg/t) OK
As kriged As (%) OK Cu kriged Cu (ppm) OK Fe kriged Fe (ppm) OK Pb kriged Pb (ppm) OK Zn kriged Zn (ppm) OK
Classification CLASS resource categorization 1 - Measured, 2 - Indicated, 3 - Inferred, 4 – Potential
calculated
NAPP net acid potential production (only calculated where ANC is available)
calculated
ARD Acid Rock Drainage (NAF, PAF_LC, PAF) calculated Benefit
Function RECV RECV=((P1F*(AU-0.065)/(AU))+(P2F*(AU-0.048)/(AU)))/(P1F+P2F)
calculated
P1F proportion planned to feed per year constant 0.178
calculated
P2F proportion planned to feed per year constant 0.822
calculated
COG1 CUTOFF GRADE (CUTOFF GRADE @ RESERVE GOLD PRICE)
calculated
COG2 CUTOFF GRADE (CUTOFF GRADE @ RESERVE GOLD PRICE)
calculated
DEST DEST - DESTINATION (1-ORE, 2-WASTE, 3-MINERALISED WASTE)
calculated
PCAF PROCESSING COST (PCAF = 1.759 + 0.684* (BWI^0.465)
calculated
AUREVRV GOLD REVENUE $USD/g (BASED ON RESERVE GOLD PRICE)
calculated
AUREVRS GOLD REVENUE $USD/g (BASED ON RESOURCE GOLD PRICE)
calculated
REFGR REFINING COSTS $USD/gram calculated
ROYGR ROYOZ - ROYALTY AND SALES TAX $USD/tr. Oz
calculated
AUCSG COST OF SALES (REFINING + ROYALTY) $USD/gram (AUCSG=REFGR+ROYGR)
calculated
Geometallurgy BLEND Variable to control percent of clay material feeding in the crusher.
calculated
BWI kriged BWI based on QTZ=17.5BWI assumption OK + calculated
Gold Estimation
Gold estimation was done using Ordinary Kriging. A hard boundary was assumed between the mineralized domains (110, 120, 210, 220, 310, 320) and non-mineralized domains (510, 520). Model Checks were completed for all domains using ID and NN

Kinross Gold Corporation Paracatu Project
Brazil NI 43-101 Technical Report
Page 94
(composited by 12 m). Search volume and estimation parameters are shown in Table 14-7.
Table 14-7: Parameters used to estimate gold domain in the model.
Search Volume Samples
Domain Pass -Z +X -Z Major Semi Minor Min samples
Max samples
Max per hole
D1N
E 1 -40 0 0 100 50 8 8 12 2 2 -40 0 0 200 100 16 6 10 2 3 -40 0 0 400 200 32 4 8 2
D1S
W 1 90 12 65 125 100 8 8 16 2
2 90 12 65 250 200 16 6 12 2 3 90 12 65 375 300 24 4 8 2
D2N
E 1 -40 0 0 133 70 8 8 12 2 2 -40 0 0 266 140 16 6 10 2 3 -40 0 0 399 210 24 4 8 2
D2S
W 1 90 12 65 183 117 12 8 12 2
2 90 12 65 367 233 24 6 10 2 3 90 12 65 733 467 48 4 8 2
D3N
E 1 -40 0 0 100 50 8 8 12 2 2 -40 0 0 200 100 16 6 10 2 3 -40 0 0 400 200 32 4 8 2
D3S
W 1 90 12 65 227 125 8 8 16 2
2 90 12 65 341 188 12 6 12 2 3 90 12 65 681 375 24 4 8 2
Density Estimation
Density was estimated using the inverse distance squared (ID2) method. Dynamic anisotropy was used to achieve better adjusted interpolation and geometric domain variability. Search volume and estimate parameters are shown in Table 14-8.

Kinross Gold Corporation Paracatu Project
Brazil NI 43-101 Technical Report
Page 95
Table 14-8: Parameters used to estimate gold domain in the model.
X Y Z -Z +X -Z Min samples Max
Samples 200 150 12 -35 0 0 6 16
Sulfur Estimation
Sulfur was estimated by ordinary kriging using dynamic anisotropy to achieve better adjusted interpolation and geometric domain variability. Search volume and estimate parameters are shown in Table 14-9.
Table 14-9: Parameters used to estimate sulfur domain into the model.
X Y Z -Z +X -Z Min samples Max
Samples 250 200 12 -35 0 0 6 16
ARD Estimation
ARD was estimated using ordinary kriging controlled by stationary domains. Figure 14-25 shows a typical vertical section in the ARD model.
Figure 14-25: ARD classification in the block model

Kinross Gold Corporation Paracatu Project
Brazil NI 43-101 Technical Report
Page 96
Bond Work Index Estimation
In the 2019 block model, Bond Work Index (BWI or WI) was updated in the quartzite zone only and not estimated in the other domains.
BWI is defined as:
Es = 10 * WI * (1/√P80 - 1/√F80)
Es (specific comminution energy; kilowatt hour per short ton, kWh/T)
WI (specific power consumption)
Samples for BWI testing are collected during sample preparation of the 1 or 3 m raw samples. Composite samples are based on a 12 m downhole length, representing the current mining bench height. Each composite is composed of a fraction of each metre of sample, after the initial sample is crushed to 3.34 mm. The BWI test is completed at the Kinross Process Laboratory according to the BWI standard test methodology.
BWI was weighted by percentage of quartzite estimated in the regular selective mining unit (SMU; 25 x 25 x 12 m):
BWI_X= ((20*qtz_pct) + (BWI*(1-qtz_pct)))
For places with a significant amount of quartzite, some increment in BWI is observed (Figure 14-26).

Kinross Gold Corporation Paracatu Project
Brazil NI 43-101 Technical Report
Page 97
Figure 14-26: Quartzite percentage calculated in block model grid (25mx25mx12m).
14.7 Cut-off Grade and Pit Constraint
The 2019 Paracatu resource model was confined by the $1400/oz Au optimized pit shell. The majority of resource blocks within this pit shell are classified as Measured or Indicated.
Resources and reserves are reported above a minimum cut-off grade that represents the incremental cut-off. Mining costs are considered during pit optimization to value each block in the resource model when determining the optimum pit. The internal cut-off grade, which does not include sustaining capital costs, represents the cut-off grade once the ore reaches the pit rim and the decision must be made to process it or send it to the waste dump.
Ore is processed in one of two plants: Plant I and Plant II. Descriptions of each plant are provided in Section 17 of this report. The resource pit shell was determined using the following assumptions:
• Gold prices: US$1,400/oz • Exchange Rate: 3.50 BRL to US$1 • Mining Cost: US$1.79/t mined

Kinross Gold Corporation Paracatu Project
Brazil NI 43-101 Technical Report
Page 98
• Process Cost: US$4.01/t ore • Site Admin Cost: US$0.75/t ore • Sales and Refining Cost: US$8.41/oz Au • Royalty: US$19.81/oz Au • Recovery: 82.0%
The Figure 14-27 illustrates the $1400/oz pit shell used to constrain the mineral resource in the Morro do Ouro Paracatu deposit.
Figure 14-27: Plan view of pit shell for Mineral Resource calculated at US$1400/oz.
14.8 Classification The Morro do Ouro deposit has been assigned the resource classifications of Measured, Indicated and Inferred, as defined by the CIM Definition Standards for Mineral

Kinross Gold Corporation Paracatu Project
Brazil NI 43-101 Technical Report
Page 99
Resources and Mineral Reserves. Kinross has defined the specific criteria for resource classification for the 25 m x 25 m x 12 m block model. These characteristics were used in the Datamine Nearest Neighbor search estimation parameter file, and were estimated throughout the block model:
Measured: A Measured block has three drill holes with at least three assays within a distance of 100 m. A Measured block is assigned the variable “CLASS” equal to 1.
Indicated: An Indicated block has at least one drill hole with at least 3 assays within a distance of 200 m. An Indicated block is assigned the variable “CLASS” equal to 2.
Inferred: An Inferred block is one which has at least one drill hole with at least 3 samples within a distance of 400 m. An Inferred block is assigned the variable “CLASS” equal to 3.
Potential: All remaining drilled blocks within the model extents without drill hole support within 400 m are assigned the variable “CLASS” equal to 4. Potential Resource is not included in the Mineral Resources.
Table 14-10 summarizes the classification parameters.
Table 14-10: Classification criteria for Measured, Indicated and Inferred Classification Measured Indicated Inferred Potential
Estimated variable AU AU AU AU
Estimation parameter file class_ep class_ep class_ep
Search parameter file class1_sv class2_sv class3_sv
Search condition 100m 200m 400m
Drillhole condition > = 3 > = 3 > = 3
sample condition > = 3 > = 3 > = 3
grade condition > = 0.001
CLASS 1 2 3
Figure 14-28 compares the 2017 and 2019 block model classification.

Kinross Gold Corporation Paracatu Project
Brazil NI 43-101 Technical Report
Page 100
Figure 14-28: Plan view showing the classification in estimated block model constrained
by resource pit shell @$1400/oz. 14.9 Mineral Resource Validation
The resultant block model was validated using a number of techniques to confirm the assignment of appropriate variables and grade estimation. These techniques include visual confirmation of block grades with respect to assay grades, statistical comparison with estimation data (composited drill hole data), and a comparative Nearest Neighbor interpolation model. Geostatistics were used to compare global variations in block means, standard deviations, variance and covariance. Swath plots were employed to interrogate local differences in tonnes and grade between models with respect to composited samples used for estimation. No outstanding discrepancies were encountered. Figure 14-29 shows the histogram for Au estimation.
Statistical comparisons by domain are shown in Table 14-11.

Kinross Gold Corporation Paracatu Project
Brazil NI 43-101 Technical Report
Page 101
Table 14-11: Gold composite vs block model by domains. Data Domain Count Min Max Mean Variance StDev CV Median
Block Model 110 18,544 0.089 1.354 0.497 0.01 0.12 0.24 0.487 comp6_in 110 6,913 0.003 1.589 0.491 0.04 0.20 0.40 0.458 Block Model 120 29,440 0.179 1.295 0.560 0.02 0.14 0.25 0.549 comp6_in 120 5,693 0.005 1.797 0.572 0.06 0.24 0.41 0.535 Block Model 210 923 0.054 0.552 0.314 0.01 0.09 0.29 0.322 comp6_in 210 553 0.041 0.744 0.331 0.02 0.15 0.44 0.318 Block Model 220 18,101 0.119 0.688 0.294 0.01 0.08 0.26 0.284 comp6_in 220 3,064 0.012 0.841 0.319 0.02 0.14 0.45 0.287 Block Model 310 53,833 0.011 1.024 0.294 0.02 0.15 0.51 0.266 comp6_in 310 11,559 0.003 1.100 0.298 0.03 0.18 0.60 0.262 Block Model 320 38,152 0.009 0.962 0.218 0.01 0.11 0.48 0.196 comp6_in 320 4,050 0.001 1.100 0.248 0.02 0.16 0.62 0.214
Tables 14-12 and 14-13 summarize statistical comparisons between density and sulfur composites, and block model estimation.
Table 14-12: Density composite vs block model by domains. Data Variable Domain Count Min Max Mean Total Variance StDev CV Median
bm_sg_val SGID overall 185,187 2.222 3.33 2.749 509,096 0.020 0.134 0.050 2.800
comp4_sg_all SGC overall 36,838 2.101 3.80 2.750 101,319 0.020 0.139 0.050 2.785
bm_sg_val SGID 1 54,380 2.294 3.09 2.791 151,790 0.010 0.086 0.030 2.819
comp4_sg_all SGC 1 13,641 2.15 3.80 2.782 35,966 0.010 0.098 0.040 2.797
bm_sg_val SGID 2 20,457 2.222 3.06 2.783 56,941 0.010 0.089 0.030 2.810
comp4_sg_all SGC 2 3,782 2.11 3.80 2.749 10,088 0.020 0.136 0.050 2.788
bm_sg_val SGID 3 110,350 2.222 3.33 2.722 300,364 0.020 0.153 0.060 2.791
comp4_sg_all SGC 3 15,129 2.101 3.80 2.715 41,372 0.030 0.170 0.060 2.775

Kinross Gold Corporation Paracatu Project
Brazil NI 43-101 Technical Report
Page 102
Table 14-13: Sulfur composite vs block model by domains. Data Variable Domain Count Min Max Mean Total Variance StDev CV Median bm_s_val SOK overall 406,824 0.005 1.70 0.69 279,448 0.090 0.300 0.440 0.657
comp6_s_all SC overall 28,086 0.0001 1.84 0.81 22,469 0.180 0.427 0.530 0.832
bm_s_val SOK 1 54,500 0.028 1.70 1.14 62,022 0.050 0.230 0.200 1.174
comp6_s_all SC 1 10,901 0.0001 1.84 1.12 11,992 0.090 0.293 0.260 1.133
bm_s_val SOK 2 20,167 0.143 1.65 0.97 19,508 0.070 0.274 0.280 0.994
comp6_s_all SC 2 3,317 0.0001 1.75 0.91 2,915 0.090 0.308 0.340 0.877
bm_s_val SOK 3 128,804 0.005 1.37 0.55 70,153 0.100 0.319 0.590 0.589
comp6_s_all SC 3 13,868 0.0001 1.31 0.54 7,561 0.130 0.357 0.660 0.607

Kinross Gold Corporation Paracatu Project
Brazil NI 43-101 Technical Report
Page 103
Figure 14-29: Histogram and cumulative distribution comparing composite 6m and
estimated block model by domain.
Sectional validation and swath plot analysis for domain 110 are shown in Figures 14-30 to 14-33.

Kinross Gold Corporation Paracatu Project
Brazil NI 43-101 Technical Report
Page 104
Figure 14-30: Visual comparison between composite 6 m and estimated block model to
domain 1 northeast (110)
Figure 14-31: Histogram and cumulative distribution comparing composite 6 m and
estimated block model to domain 1 northeast (110)

Kinross Gold Corporation Paracatu Project
Brazil NI 43-101 Technical Report
Page 105
Figure 14-32: Swath plot comparison between composite 6m and estimated block model
to domain 1 northeast (110).

Kinross Gold Corporation Paracatu Project
Brazil NI 43-101 Technical Report
Page 106
Figure 14-33: Swath plot comparison between nearest neighbour using composite 12 m
and estimated block model to domain 1 northeast (110).
Table 14-14 shows the 2019 mineral inventory by cut-off and resource pit shell based on US$ 1,400/oz.
Table 14-14: 2019 Mineral inventory constrained by US$1,400/oz resource pit shell.
Cutoff Tonnage (Mt) Au g/t Moz 0.1 983 0.39 12.35 0.2 885 0.42 11.81 0.3 579 0.50 9.36 0.4 403 0.57 7.41 0.5 262 0.64 5.37 0.6 142 0.71 3.25 0.7 64 0.79 1.63 0.8 24 0.88 0.68 0.9 8 0.96 0.24 1 1 1.071 0.04

Kinross Gold Corporation Paracatu Project
Brazil NI 43-101 Technical Report
Page 107
Grade-tonnage curve comparison between the new model (2019) and the previous model (2017) is shown in Figure 14-34.
Figure 14-34: Grade tonnage curve 2017 vs 2019 updated model constrained by US$1,400/oz pit shell.
14.10 Ore Control In 2018, blast hole ore control was implemented at Paracatu to support the mine's short term plans. This implementation was consolidated and currently there are short-term models to assist with decisions on material destination from the mine to the plant.

Kinross Gold Corporation Paracatu Project
Brazil NI 43-101 Technical Report
Page 108
Blast holes are sampled in a grid approximately 5 m by 10 m. The wider spacing direction is aligned with the direction of greatest continuity in the trend of the mineralization. Two thin slices of diametrically opposite sections of the cone are collected from the opened radial trenches. Approxiamtely 10 kg of sample is collected from the blast hole cuttings. These samples are sent to the internal laboratory and analyzed for gold by fire assay.
The blast holes are drilled in the open pit benches using conventional blast hole drill rigs (Figure 14-35).
Figure 14-35: Blast hole drill rig (Pit Viper) left side and geology sampling team collecting
samples on the drilled cones on the right side.
14.11 Reconciliation Reconciliation measures the quality of the resource and reserve estimation, planning process, and actual performance. Reconciliation allows us to identify problems and prompt corrective actions.
The F1 factor measures the accuracy of orebody knowledge in the reserves to the demarcation of ore and waste by ore control practices (short-term model). The F1 factor may be used to check and calibrate the selectivity of mineral resource models and/or planned dilution assumed in the conversion of mineral resources to reserves. The F2 factor enables a check on unplanned dilution entering the ore stream between ore

Kinross Gold Corporation Paracatu Project
Brazil NI 43-101 Technical Report
Page 109
control and the mill. The F3 factor is the product of the F1 and F2 factors and therefore assesses the ability to recover the tonnage, grade and metal content as estimated in the resource model. The F3 factor provides a good indication of the overall reliability of the resource model.
Kinross has corporate guidleines for each of the reconciliation metrics for different time periods as Table 14-15 (monthly, quarterly and annual).
Table 14-15: Kinross guidelines for reconciliation
KPI Month Quarter Year
F1 ±25% ±15% ±10%
F2 ±10% ±7.5% ±5%
F3 ±25% ±15% ±10%
Over the last three years, 2017 - 2019, the F1, F2, and F3 factors on tonnage, gold grade, and contained ounces are summarized in Table 14-16. This indicates that the variance is well within the accepted industry standards.
Table 14-16: Reconciliation figures for the past three years Year F1 (%) F2 (%) F3 (%)
Ton Grade Oz Ton Grade Oz Ton Grade Oz 2017 100 99 99 100 91 91 100 90 90 2018 100 101 101 101 91 92 101 92 93 2019 98 103 101 103 96 99 101 99 100

Kinross Gold Corporation Paracatu Project
Brazil NI 43-101 Technical Report
Page 110
14.12 Estimate Acceptance The Qualified Person (QP) is responsible for determining the resource classification of the Morro do Ouro mineral estimate (i.e. Inferred, Indicated or Measured).
The characteristics, as outlined in Section 14.10, were calculated within the block model as a function of the mineral resource estimation process utilizing a Datamine™ macro routine. The attribute “CLASS” was calculated into each block for this purpose. This resource estimation was reviewed by Racquel Kolkert, Director, Resource Geology and John Sims, SVP and Chief Geologist, Mineral Resources & Brownfields.
Kinross is not aware of any environmental, permitting, legal, title, location, socio-economic, marketing, and political or other modifying factors which could materially affect the open pit Mineral Resource estimate.

Kinross Gold Corporation Paracatu Project
Brazil NI 43-101 Technical Report
Page 111
15. MINERAL RESERVE ESTIMATE
The Mineral Reserve for the Paracatu open pit mine was estimated using a planning model derived from the 2019 resource model, as discussed in Section 14.
The mineral reserves, effective December 31, 2019, are solely based on the Measured and Indicated mineral resources, which correspond to Proven and Probable Mineral Reserves shown in Table 15-1.
Table 15-1: Proven and Probable Mineral Reserves – December 31, 2019 Tonnes
(kt) Gold (g/t)
Gold Ounces (koz)
Proven 518,934 0.4 7,428 Probable 28,354 0.4 355 Reserve Stockpile 30,735 0.3 278 Total Reserve 578,023 0.4 8,060
Notes: 1. Mineral Reserves estimated according to CIM Definitions. 2. Mineral Reserves estimated at $1,200/oz Au. 3. Stockpile balances above the reserve cut-off grade is considered as reserve and it includes
estimated PSAT gold production in 2020. 4. Mineral Reserves are reported at gold cut-off grade that varies by BWI and global recovery
from 0.16 g/t to 0.24 g/t.
The economic assumptions used in the optimization process are detailed in Table 15-2.
The life of mine plan and Mineral Reserves include one year (2020) of tailings for reprocessing (from the Santo Antônio facility). Tailings reprocessing operations are expected to continue after 2020, but given limitations on drilling and sampling, only one year’s worth of production can be characterized with sufficient confidence for inclusion in the mine plan and Mineral Reserves.
15.1 Basis of Reserve Estimate and Pit Optimization An economic pit shell generated at a gold price of $1200/oz, with cost criteria, metallurgical recoveries, geologic and geotechnical considerations guides the final pit design. The economic pit shell used to define the final pit limits was created using Datamine’s NPV Scheduler software (NPVS). NPVS uses the pseudo-flow algorithm to define blocks that can be mined economically.
The program then creates an economic shell based on the following information:
• Starting topography • Overall slope angles by geotechnical sectors

Kinross Gold Corporation Paracatu Project
Brazil NI 43-101 Technical Report
Page 112
• Metallurgical recoveries by gold grade • Geologic grade model with gold grades, density and lithology • Incremental vertical bench mining cost • Downstream costs, such as gold refining, freight and marketing • Sustaining capital for future equipment replacements and tailings dam expansion • General and Administrative costs applied to processing
The optimization parameters are detailed in Table 15-2. The Mineral Reserve estimate was prepared using the projected December 31, 2019 topography
Table 15-2: Pit Optimization parameters
Optimization Parameter Cost / Assumption1 Unit
Ore Mining Cost (at 740 reference bench)2 2.10 US$/t mined Waste Mining Cost (at 740 reference bench)3 1.83 US$/t mined Incremental vertical bench mining cost 0.02 US$/t mined/bench Base Process Cost (Considering BWI = 13 kWh for reference) 4.01 US$/t processed Site Admin 0.75 US$/t processed Sustaining Capital (Process + Site Admin) 0.08 US$/t processed Sustaining Capital (Tailings) 0.77 US$/t processed Gold Price 1200 US$/oz Selling cost 28.23 US$/oz Discount rate 5 %
Notes: 1. Pit optimization parameters are based on the most recent strategic business plan costs
developed in 2019 and may differ slightly from the estimated costs stated in this report but within acceptable range.
2. Includes sustaining capital/capitalized maintenance. 3. Includes sustaining capital/capitalized maintenance. Lower than ore mining cost due to wider
drill and blast patterns and lower cost.
Mineral Reserves are stated within an ultimate pit design at cut-off grades that are based on BWI, operating costs and metallurgical recovery.
Slope parameters based on geotechnical considerations were applied to the pit design along with ramps and geotechnical catch benches, and subsequently used to generate overall slope angles. The overall slope angles used in pit optimization are shown in Table 16-3.

Kinross Gold Corporation Paracatu Project
Brazil NI 43-101 Technical Report
Page 113
Mineral reserves incorporate appropriate allowances for mining dilution and mining recovery based on the selected mining method and SMU dimensions of 25x25x12 m.
15.2 Recovery The recovery formula considers fixed tailings grade per plant. Plant I tails grade is 0.065 g/t and Plant II tails grade is 0.048 g/t. Plant I feed represents 18% of total mill feed and Plant II represents 82%.
Plant I = ((gold grade - 0.065) / gold grade)
Plant II= ((gold grade - 0.048) / gold grade)
Hydrometallurgical recovery = 91.4%
Global Recovery = (18% * Plant I + 82% * Plant II) * Hydrometallurgical recovery
15.3 Mining Costs
The mine operating costs used for pit optimization include ongoing major mine equipment sustaining capital costs.
The top-down discount method was used during pit optimization. This is a procedure based on multiplying the block value by a discount factor that is a function of the annual cost of capital, an estimate of the average annual vertical advance rate of mining, and the relative depth of the block. This method simulates the actual mine plan discounted cash flow that is burdened with up front stripping costs and aids in the selection of a higher value pit.
15.4 Process Costs The processing cost includes fixed and variable operating costs, process sustaining capital, and tailings storage facility capital.
The Process operating cost is expressed as a function of BWI as follows:
Process Operating Cost = 1.759 + 0.684* (BWI^0.465)
The process sustaining capital and tailing storage facility capital is US$0.08/t and US$0.77/t respectively.

Kinross Gold Corporation Paracatu Project
Brazil NI 43-101 Technical Report
Page 114
15.5 Selling Costs Royalty and Sales Taxes represent 1.5 % of the net revenue. Refining costs are based on budget figures developed in 2019 for 2020.
15.6 Cut-Off Grade Cut-off grade (COG) varies based on processing cost driven by BWI, and metallurgical recovery is driven by head grade. Reserve COG ranges from 0.16 g/t and 0.24 g/t. Table 15-3 ilustrates the calculation using an average BWI of 13 kWh and head grade of 0.44g/t.
Table 15-3: Mineral Reserve cut-off grade calculation
Area Units Cost Total Ore Cost US$/t ore 5.61 Refining/Sales US$/oz 8.41 Royalty US$/oz 19.81 Total US$/oz 28.22 Gold Price US$/oz 1,200 Recovery % 82.0% COG g/t 0.18
15.7 Comment on Mineral Reserves
Muhanad Jalil, a professional engineer registered with the Association of Professional Engineers and Geoscientists of Saskatchewan and Director of Technical Services at Kinross Paracatu, has certified that, to the best of his professional judgment, the Mineral Reserve estimates have been prepared in compliance with NI 43-101, including the CIM Definition Standards incorporated by reference, and conform to generally accepted mining industry practices.
The results of the economic analysis to support Mineral Reserves represent forward looking information that is subject to a number of known and unknown risks. These uncertainties and other factors may cause actual results to differ materially from those presented here. Areas of uncertainty that may materially impact mineral reserve estimation include:
• Commodity price and exchange rate assumptions; • Capital and operating cost estimates; and • Geotechnical slope design criteria for pit walls.

Kinross Gold Corporation Paracatu Project
Brazil NI 43-101 Technical Report
Page 115
16. MINING METHODS
16.1 Mining Operations The Paracatu operation consists of an open pit mine, two process plants, two tailings facilities, and related surface infrastructure and support buildings.
At Paracatu, ore hardness increases with depth and, as a result, modelling the hardness of the Paracatu deposit is important for costing and process throughput parameters. Kinross modeled ore hardness based on Bond Work Index (BWI) analyses from diamond drill samples. KBM estimated that blasting of the Paracatu ore would be necessary for blocks with a BWI greater than 8.5 kWh/t.
As mining progresses to the southwest area of the pit, it is necessary to increase hauling capacity because of waste stripping. Currently the truck fleet consist of 25 CAT 793 and the life of mine peak is 35 trucks in 2024.
16.2 Mine Design The design process for the open pit mine at Paracatu began by completing a series of pit optimizations in order to create a pit shell that would form the basis for the open pit design.
Pit optimization was completed using Datamine NPV Scheduler (NPVS). The mining sequences are developed using Deswik CAD software.
Table 16-1 shows the Cumulative Grade-Tonnage contained in the design pit.
Table 16-1: Grade and tonnage values in the design pit Cutoff Grade
(Au g/t)
Tonnes
(kt) Grade
(Au g/t) Au
(koz) 0.2 550,401 0.44 7,821 0.3 415,118 0.50 6,681 0.4 286,040 0.57 5,249 0.5 184,971 0.64 3,791 0.6 99,787 0.71 2,286 0.7 45,597 0.79 1,164 0.8 17,029 0.88 480 0.9 5,263 0.96 163
Open pit design parameters consider the operating costs, process recovery, metal price and pit slope angles. The parameters used for this exercise are shown in Table 16-2.

Kinross Gold Corporation Paracatu Project
Brazil NI 43-101 Technical Report
Page 116
Table 16-2: Base case open pit design parameters Assumptions and Inputs Unit Economic Assumptions
Au Reserve Price US$/oz 1,200 Brazilian Reais to US$ BRL 3.50
Production Assumptions Production Rate / Day - Plant I t/day 22,439 Production Rate / Day - Plant II t/day 105,354 Total Material - Mine t/day 220,000 Mining Dilution % 0% Mining Recovery % 100%
Recovery Assumptions - Plant I % Section 15.2 Recovery Assumptions - Plant II % Section 15.2 Mining Cost Assumptions (Incl. Sust. CapEx)
Increment/Bench Below (Reference Bench 740) US$/t mined/bench 0.02 Ore mining cost (at 740 reference bench) US$/t mined 2.10 Waste mining cost (at 740 reference bench) US$/t mined 1.83 Average mining cost (at 740 reference bench) US$/t mined 2.00
Processing Operating Cost Assumptions
Processing Costs US$/t processed 1.759 + 0.684* (BWI^0.465)
Other Operating Cost Assumptions Site Admin Costs US$/t processed 0.75 Refining and Shipping Costs US$/oz 8.41 Royalty Costs @ $1,200 Au US$/oz 19.81
Sustaining Capital Cost Assumptions Mining Cost (e.g., Fleet Replacement) US$/t moved 0.40 Process Cost (e.g., Process and Tailings Pond) US$/t processed 0.85
Geotechnical* Overall Slope Angle Slope Sector Name/Number
1 Degrees 26.6° 2 Degrees 38.8° 4 Degrees 47.2° 5 Degrees 50.6° 6 Degrees 54.0°
(* See Geotechnical Section for more detail)

Kinross Gold Corporation Paracatu Project
Brazil NI 43-101 Technical Report
Page 117
The open pit design criteria are summarized below:
• Bench Height 12 or 24 m • Bench Face Angle 45 to 75° • Berm Width 8 to 12 m • Berm Interval 20 m • Inter-ramp Angles (Weathered Rock) 38.8° • Inter-ramp Angles (Fresh Rock) 49.2 to 56.4° • Inter-ramp Angles (Soil) 26.6º
Haul roads and in-pit ramps were designed to be 40 m wide with a gradient of 10%. A typical road cross-section is shown in Figure 16-1.

Kinross Gold Corporation Paracatu Project
Brazil NI 43-101 Technical Report
Page 118
Figure 16-1: Typical haul road profile

Kinross Gold Corporation Paracatu Project
Brazil NI 43-101 Technical Report
Page 119
Figure 16-2 shows the mining phases and the mining license.
Figure 16-2: Mining phases 16.3 Geotechnical Considerations
The pit slope angles used in the pit optimization are based on an independent geotechnical report by Knight Piésold (2015) and reviewed by Jerry Ran (Director, Geotechnical, Kinross). These pit slope angles are shown in Table 16-3. For reference, Figure 16-3 gives a visual indication of the different slope regions in the Paracatu mine pit and their corresponding azimuths.
Table 16-3: Pit slope angles used in open pit mine optimization

Kinross Gold Corporation Paracatu Project
Brazil NI 43-101 Technical Report
Page 120
Figure 16-3: Slope regions in Paracatu pit
16.4 Production Schedule The mine operates 24 hours a day, 365 days a year. Production rates vary by BWI. The life-of-mine (LOM) schedule is shown in Table 16-4, which will be depleted in 2031.
Table 16-4: Paracatu LOM mining schedule Year Ore Waste Mined Rehandled Moved
(kt) (kt) (kt) (kt) (kt) 2020 50,598 37,463 88,061 14,354 102,415 2021 50,536 40,800 91,336 11,463 102,799 2022 48,510 39,886 88,396 10,996 99,392 2023 48,879 32,939 81,818 10,774 92,592 2024 47,154 34,093 81,247 10,144 91,391 2025 46,751 45,941 92,692 12,911 105,603 2026 46,482 44,128 90,610 18,770 109,380 2027 44,316 32,046 76,362 9,465 85,827 2028 38,703 38,281 76,984 23,700 100,684 2029 41,335 26,054 67,389 32,907 100,296 2030 46,524 7,856 54,380 12,816 67,196 2031 37,499 2,972 40,471 8,161 48,632 Total 547,287 382,459 929,746 176,461 1,106,207

Kinross Gold Corporation Paracatu Project
Brazil NI 43-101 Technical Report
Page 121
Table 16-5 shows the processing schedule for the Project, which includes tailings reprocessing.
Table 16-5: Paracatu life of mine processing schedule
Plant I Year Tonnes Recovery Grade BWI Au Produced
(kt) (%) (g/t) (kWh/t) (koz) 2020 8,575 77% 0.41 12 87
2021 8,995 77% 0.42 12 94
2022 9,126 78% 0.43 13 97
2023 8,701 77% 0.42 12 92
2024 8,393 78% 0.44 14 92
2025 8,513 78% 0.43 13 92
2026 8,841 78% 0.44 12 98
2027 7,888 79% 0.49 15 100
2028 8,133 78% 0.44 14 90
2029 8,746 76% 0.39 13 83
2030 8,169 79% 0.49 14 103
2031 6,747 79% 0.46 12 79
Plant II Year Tonnes Recovery Grade BWI Au Produced
(kt) (%) (g/t) (kWh/t) (koz)
2020 40,867 80% 0.41 12 431
2021 41,540 81% 0.42 12 455
2022 40,875 81% 0.43 13 456
2023 40,179 81% 0.42 12 445
2024 38,760 81% 0.44 14 443
2025 39,311 81% 0.43 13 445
2026 40,829 82% 0.44 12 472
2027 36,428 83% 0.49 15 478
2028 37,557 82% 0.44 14 433
2029 40,390 80% 0.39 13 403
2030 37,722 83% 0.49 14 492
2031 31,158 82% 0.46 12 379

Kinross Gold Corporation Paracatu Project
Brazil NI 43-101 Technical Report
Page 122
PSAT Year Tonnes Recovery Grade BWI Au Produced
(kt) (%) (g/t) (kWh/t) (koz)
2020 11,580 54% 0.24 12 49 2021
2022
2023
2024
2025
2026
2027
2028
2029
2030
2031
Total 11,580 54% 0.24 12 49
Total Combined Year Tonnes Recovery Grade BWI Au Produced
(kt) (%) (g/t) (kWh/t) (koz) 2020 61,022 75% 0.38 12 567
2021 50,536 80% 0.42 12 549
2022 50,001 80% 0.43 13 553
2023 48,879 81% 0.42 12 537
2024 47,154 81% 0.44 14 535
2025 47,824 81% 0.43 13 537
2026 49,670 81% 0.44 12 569
2027 44,316 82% 0.49 15 578
2028 45,689 81% 0.44 14 523
2029 49,136 79% 0.39 13 486
2030 45,891 82% 0.49 14 595
2031 37,905 81% 0.46 12 457
Total 578,023 80% 0.43 13 6,488

Kinross Gold Corporation Paracatu Project
Brazil NI 43-101 Technical Report
Page 123
16.5 Waste Rock Paracatu has completed two waste dumps, Sul and Oeste. By the end of the mine life, another two dumps will be completed: the Central (in-pit) and the Ex-Pit dumps. Golder Associates (2018) developed conceptual designs for the Central and Ex-Pit dumps. Knight Piésold (2018) developed a feasibility design for the Ex-Pit waste pile.
The Central waste dump is planned to receive both NAF (Non-Acid Forming) and PAF (Potentially Acid Forming) material. Waste encapsulation is planned for this dump using soil and saprolite. In the current plan, encapsulation is predicted to take place from 2029 to 2031.
The external waste dump is located on the North West side of the ultimate pit. This dump will be required once the in-pit waste dump does not provide sufficient capacity for waste deposition in the life-of-mine plan. These dumps will only receive NAF (Non-Acid Forming) material. The deposition in these piles begin in 2020.
The temporary waste dump will store soil and saprolite only. The purpose of this pile is to stockpile material required for closure of the in-pit dump. This structure is not planned to remain once mine operation is shut down. Figure 16-4 shows the wastes dumps.
Figure 16-4: Waste dumps

Kinross Gold Corporation Paracatu Project
Brazil NI 43-101 Technical Report
Page 124
16.6 Equipment The production fleet consists of twenty five Caterpillar 793 haul trucks. In 2020, the Caterpillar 793 fleet will expand to twenty eight trucks.
The loading fleet consists of three Caterpillar 992 loaders, four Caterpillar 994 loaders and two Caterpillar 7495HD shovels. In 2020, the Caterpillar 7495HD fleet will expand to three shovels.
The diesel-powered drill fleet consists of two Atlas Copco DM45 rigs, two Atlas Copco DM50 rigs, one Bucyrus 35R and one Atlas Copco ROC D7. Shovel and drill fleets will be replaced with comparable units upon retirement.
Mine equipment currently in use is summarized in Table 16-6.
Table 16-6: Current Paracatu mine equipment schedule
Equipment Type Quantity Model Haul Truck 25 Caterpillar 793D Loader 2 Caterpillar 992G Loader 1 Caterpillar 992K Loader 4 Caterpillar 994F Shovel 2 Caterpillar 7495HD Blasthole Drill 1 Atlas Copco Roc-D7 Blasthole Drill 1 Ingersoll-Rand DM45 Blasthole Drill 3 Ingersoll-Rand DM50 Blasthole Drill 3 Pit Viper – PV271 Dozer 2 Caterpillar D10 Dozer 7 Caterpillar D11
16.7 Personnel Requirements Paracatu operates 24 hours per day, 365 days per year, with 2 x 12h shifts to ensure continuous operation. The administrative team works Monday through Friday from 7:20 am to 5:20 pm and observes national holidays. Personnel requirements for the LOM schedule are shown in Table 16-7.
Table 16-7: Operations personnel requirements
Area 2019-2023 2024-2030 Mining 436 413 Processing 455 399 Site Admin 147 144 Total 1,038 956

Kinross Gold Corporation Paracatu Project
Brazil NI 43-101 Technical Report
Page 125
17. RECOVERY METHODS
17.1 Process Description Paracatu has two processing plants known as Plant I and Plant II. Plant I has operated continuously since 1987 and Plant II since 2008. Paracatu has been reprocessing tailings since 2015 (described in Section 24).A general flowsheet is shown in Figure 17-1.
Figure 17-1: Paracatu general flowsheet
17.2 ROM Crusher The primary crusher is located in the open pit. Run-of-mine (ROM) ore is delivered by haul trucks to the 480 t crusher dump hopper. An apron feeder withdraws ROM ore from the dump hopper and feeds an MMD 1300 Series Twin Shaft Sizer. The MMD sizer crushes the rock from a maximum size of 1,300 mm to a nominal size of 350 mm and discharges material directly onto a sacrificial conveyor, which in turn discharges onto the 1.8 km overland conveyor.

Kinross Gold Corporation Paracatu Project
Brazil NI 43-101 Technical Report
Page 126
A stationary hydraulic rock breaker located at the MMD sizer feed chamber is used to break oversize rock that may be delivered. The MMD sizer can be removed from its operating position to a maintenance position by use of a winch and slide rails.
Stockpile
The crushed ore is sent to a covered ore stockpile with a rectangular “A” frame. Ore is delivered to the stockpile by a tripper conveyor. The stockpile provides 45,000 t of live volume. The volume of this stockpile can reach 282,000 t when dozers push ore to its borders.
The reclaim tunnel has six variable speed belt feeders. The reclaim tunnel has a bag house, dust collector and escape tunnel.
17.3 Plant I Plant I has operated continuously since 1987 and underwent expansion upgrades in 1997 and 1999. In 2018, the plant processed 8.25 Mt at a BWI of approximately 13.9 kWh/t.
P1 Crusher
The Crushing circuit consists of four independent parallel operating lines (A; B; C and D), each consisting of a primary screen (Metso – 8’ x 20’), a primary crusher (APSM Hazemag), a secondary screen (Metso – 6’ x 16’) and a secondary crusher (HP300). The lines are fed with front end loaders with material from the Plant II stockpile and pebbles from Plant II.
The crushing circuit product has a P80 of 12 mm.
Grinding
The grinding circuit consists of four primary ball mills with 4.5 m diameter by 5.7 m long Effective Grinding Length (EGL) and 1.8 MW gearless drives, one secondary ball mill with 5 m diameter by 7.6 m long EGL and 3 MW drives and one rod mill used to regrind the primary ball mill’s oversize (Figure 17-2).
The ball mills operate in closed circuit with hydrocyclones (GMAX20).
The grinding circuit is operated to produce a product with a particle size distribution with a P80 of 150 microns.
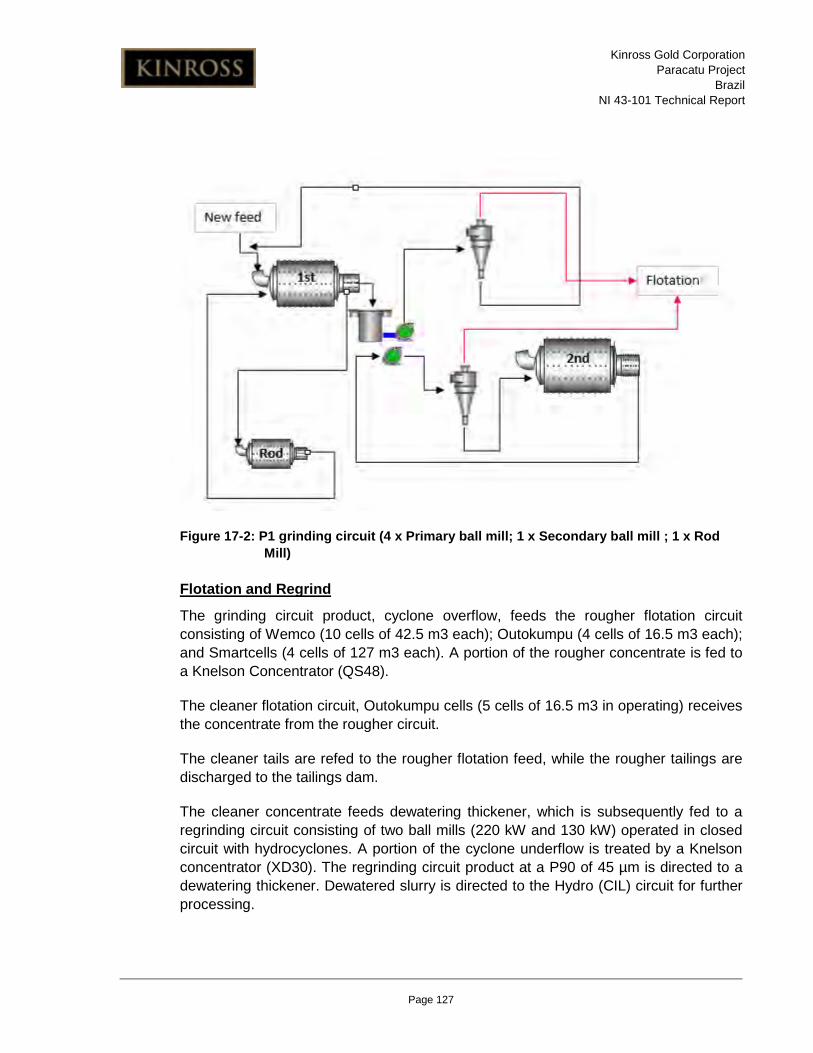
Kinross Gold Corporation Paracatu Project
Brazil NI 43-101 Technical Report
Page 127
Figure 17-2: P1 grinding circuit (4 x Primary ball mill; 1 x Secondary ball mill ; 1 x Rod Mill)
Flotation and Regrind
The grinding circuit product, cyclone overflow, feeds the rougher flotation circuit consisting of Wemco (10 cells of 42.5 m3 each); Outokumpu (4 cells of 16.5 m3 each); and Smartcells (4 cells of 127 m3 each). A portion of the rougher concentrate is fed to a Knelson Concentrator (QS48).
The cleaner flotation circuit, Outokumpu cells (5 cells of 16.5 m3 in operating) receives the concentrate from the rougher circuit.
The cleaner tails are refed to the rougher flotation feed, while the rougher tailings are discharged to the tailings dam.
The cleaner concentrate feeds dewatering thickener, which is subsequently fed to a regrinding circuit consisting of two ball mills (220 kW and 130 kW) operated in closed circuit with hydrocyclones. A portion of the cyclone underflow is treated by a Knelson concentrator (XD30). The regrinding circuit product at a P90 of 45 µm is directed to a dewatering thickener. Dewatered slurry is directed to the Hydro (CIL) circuit for further processing.

Kinross Gold Corporation Paracatu Project
Brazil NI 43-101 Technical Report
Page 128
Concentrates from the Knelson concentrator are processed in an Acacoa intensive leaching system. The thickener overflow water returns to the Plant I grinding circuit.
17.4 Plant II Plant II was developed as part of the Paracatu Expansion III Project and consists of one in-pit crusher (MMD toothed roll type), a 1.8 km conveyor to a covered stockpile area, one 20 MW semi-autogenous grinding (SAG) mill and two 13 MW ball mills.
Subsequently, a 15 MW third ball mill was installed in June 2011 and a fourth 15 MW ball mill was installed in August 2012.
In 2018, the plant processed 35.4 Mt of ROM at a BWI of approximately 13.9 kWh/t.
Grinding
The Plant II grinding circuit consists of one 11.6 m diameter by 6.7 m long Effective Grinding Length (EGL) SAG mill with a 20 MW gearless drive, two 7.3 m diameter by 12.0 m long EGL with 13 MW drive and two 8 m diameter by 12.8 m long EGL ball mills with 15 MW drive. The ball mills are equipped with dual pinion gear drives. The SAG mill operates in open/closed circuit with a trommel screen and vibrating screen, and the pebbles have the option to be fed to Plant I (open circuit) or back to the SAG (closed circuit).
Oversize rejects from the SAG mill are transferred to the SAG mill feed conveyor by three pebble conveyors in series when operated in closed circuit. When it operates in open circuit, the oversize rejects are transferred by a conveyor to the Plant I crushing circuit.
SAG mill discharge screen undersize and trommel screen undersize flow to a pump box from which are pumped to the ball mill circuits. Each ball mill operates in closed circuit with a set of hydrocyclones. The grinding circuit is operated to obtain a nominal flotation feed particle size distribution with a P80 of 150 μm. Cyclone overflow reports to the flotation circuit, while underflow reports back to the ball mill.Two liner handlers are provided for the SAG mills and the ball mills. One liner handler services the SAG mill and the other services the four ball mills. Jib cranes are located at each mill feed end to transfer new liners and scrap liners between the floor area and the liner handlers.
A 100 t capacity overhead crane with a 25 t auxiliary hoist is provided for the grinding bay.

Kinross Gold Corporation Paracatu Project
Brazil NI 43-101 Technical Report
Page 129
Flotation, Gravity and Regrinding
The flotation rougher circuit receives fresh feed plus circulating load from cleaner flotation cells.
The rougher circuit consists of 24 rougher flotation cells, arranged in four rows of six cells each, which are fed by cyclone overflow from the grinding circuit. The cells are 160 m3 tanks fitted with self-aspirating mechanisms. Reagents (collectors and frother) required for rougher flotation are supplied from reagent tanks to head tanks in the grinding circuit, fitted with metering pumps adding reagents to the grinding hydrocyclone overflow launder.
First rougher concentrate is processed by three Knelson concentrators (QS48). The rougher concentrate is treated in a cleaner circuit consisting of two rows of five self-aspirated 60 m3 tank cells. Cleaner tailings flow to a pump box and are pumped by a horizontal slurry pump to the rougher flotation feed distribution box. Cleaner concentrate is collected in a single pump box and pumped by horizontal slurry pumps to the dewatering thickener. Water from thickener overflow returns to the ball mill discharge boxes and the dewatered concentrate is then fed to a vertimill (13.5 m high, 931 kW vertical stirred type) where it is ground to 90% passing 45 microns. The mill operates in closed circuit with ten 254 mm diameter hydrocyclones (GMAX26). A Knelson concentrator (Model XD40) treats the circulating load (underflow) of the vertimill.
The vertimill product, hydrocyclone overflow, reports to the dewatering thickener. Dewatered slurry is directed to the Hydro circuit for further processing.
The gravity concentrates are transported to the Hydro (CIL) Plant for further processing in an Acacia reactor.
17.5 Hydro Carbon in Leach
Hydro receives the flotation concentrate from Plant I and Plant II. The typical concentrate gold grade is 10-15 g/t and total sulfur content is 20-25%. The concentrate is fed to an agitated pre-aeration tank where lime is added to adjust the pH to approximately 10.5. Pre-aeration residence time is approximately four hours and CIL residence time is 30-40 hours. The CIL circuit consists of 8 tanks with a volume of 750 m3 each.
Oxygen is injected into the pre-aeration tank using a fillblast system to increase the dissolved oxygen concentration to approximately 9-10 mg/L. The slurry flows by gravity through an eight stage CIL circuit. Cyanide is added into the first CIL tank and is adjusted to a concentration of approximately 700-750 mg/L NaCN. The cyanide concentration is allowed to decrease down the CIL circuit, reaching 150-200 mg/L NaCN in the final tank.

Kinross Gold Corporation Paracatu Project
Brazil NI 43-101 Technical Report
Page 130
The leached slurry passes out of CIL 8 into the 2x cyanide treatment tanks (250 m3 each).
The tailings slurry is treated for cyanide destruction in an agitated tank using ammonium bisulfite and oxygen.
Carbon Elution and Regeneration
Loaded carbon is transferred out of CIL twice a day. The loaded carbon is screened and flows by gravity to an acid washing column. The carbon is treated with 5% hydrochloric acid for 4 hours to remove calcium carbonate deposits and other inorganic contaminants. Spent acid is neutralized with sodium hydroxide before discarding it to the tails pump box. From the acid wash vessel (1 column, 14t capacity; 36 m3) carbon is pumped to the elution columns (2 columns, 14t capacity; 36 m3). The elution cycle operates with a 0.2% sodium cyanide and 2-3% sodium hydroxide solution at a temperature of 140°C and a pressure of 300 kPa for approximately eight hours. After elution is complete, carbon is pumped to the regeneration kilns. Two electrically powered kilns with 600 kg/h of capacity each, regenerate the carbon at 700°C. Regenerated carbon is screened to remove fines before being reintroduced to the CIL circuit.
Intensive Cyanidation
Gravity concentrates produced from the Plant I and Plant II gravity circuits are treated by intensive cyanidation. Plant I gravity concentrate is treated in an Acacia CS2000, while Plant II concentrate is treated in an Acacia CS8000. The pregnant leach solution from the Acacia systems are pumped to the electrowinning circuit. The solids residue from the Acacia system is sampled and pumped to the CIL circuit.
Electrowinning and Refining
Pregnant solution from elution is combined with the solution from the gravity circuit and is pumped to four electrowinning cells, which are sludging cathode type and were fabricated by Summit Valley; Model 125 EC33; 3.5 m3 each. Periodically, the cathodes are cleaned using a high pressure washer and the gold-bearing sludge is recovered by a filter press. The resulting filter cake is dried, mixed with fluxes, usually borax, soda ash and occasionally sodium nitrate and fed to electric induction furnaces. The doré metal and slag separate in the furnace, and the slag is poured off into slag pots. The doré metal is then poured into bars.

Kinross Gold Corporation Paracatu Project
Brazil NI 43-101 Technical Report
Page 131
18. PROJECT INFRASTRUCTURE
Paracatu infrastructure and services have been designed to support an operation of 61 Mt/a. The mine site consists of two processing plants, related mine services facilities (truck shop, truck wash facility, warehouse, fuel storage and distribution facilities, reagent storage and distribution facilities), and other facilities to support operations (safety/security/first aid/emergency response building, assay laboratory, plant guard house, dining facilities, offices, etc.). The site infrastructure layout is illustrated in Figure 18-1.
18.1 Access Access to the mine site was initially through the town of Paracatu, which sits on the border of the southern side of the pit. However, as traffic to the mine intensified over time, the town requested a change to the access road route. After receiving governmental authorization in 2011, KBM constructed a road directly from the BR-040 highway west of the mine to the mine and plants. The paved road has four lanes that are separated by a median and its 3.4 km length is exclusively for mine traffic.
18.2 Power The mine draws its power from the Brazilian national power grid which is largely based on hydroelectric power generation. Kinross is connected to the 500 kV national grid via a 500 kV/230 kV substation owned by the mine. A 230 kV transmission line, approximately 34 km long, feeds the mine from this substation. This transmission line is connected to substation 43-SE-501 located at the mine site which subsequently feeds the Plant II distribution system at 13.8 kV and Plant I transmission line at 138 kV. The 138 kV Plant I transmission line feeds a 138 kV/13.8 kV substation located at Plant I, which subsequently feeds the Plant I distribution system.
Kinross obtains power for Paracatu from hydroelectric plants owned by Kinross (self-generation) and power purchase contracts in the open market.
Self-Generation
In 2018 Kinross acquired Barra dos Coqueiros (BCO) and Caçu hydro power plants (Figure 18-2) located on the Claro River in the neighbouring state of Goias, approximately 660 km west of Paracatu. The Claro River is a tributary of the Paranaiba River which is a major river in the country. The power is “wheeled” from these generating plants to Paracatu using existing transmission infrastructure and market mechanisms.

Kinross Gold Corporation Paracatu Project
Brazil NI 43-101 Technical Report
Page 132
Figure 18-1: Site infrastructure

Kinross Gold Corporation Paracatu Project
Brazil NI 43-101 Technical Report
Page 133
Both plants are “run of the river” facilities and have been in operation since 2010 with a total installed capacity of 155MW (BCO-90 MW; Caçu-65 MW). They are expected to supply approximately 70% of Paracatu’s future power needs. The BCO plant has 2 Kaplan turbines (originally manufactured by Alstom), each with a rated capacity of 45 MW and 36 m nominal hydraulic head. The Cacu plant has 2 Kaplan turbines (originally manufactured by Alstom), each with a rated capacity of 32.5 MW and 27 m nominal hydraulic head. Both plants have 230 kV transmission line (owned by Kinross - 2 km for BCO and 29 km for Cacu) connections to the national grid electrical substation. The operation and maintenance of the plants is contracted to an established external provider specializing in such services. Kinross has implemented a comprehensive dam safety management plan for both sites. The operating concessions for both plants expire in 2037, after Paracatu’s mine life is expected to end.
The acquisition allows Kinross to significantly lower AISC costs at Paracatu by eliminating approximately 70% of future power purchases. Part of the savings is due to lower regulatory charges for self-generation. As typical with hydroelectric generation, these plants are expected to have relatively low operating costs.
Power Purchase Agreements
The remaining 30% of Paracatu’s power demand will be fulfilled by established power marketers under fixed term power purchase agreements. In order to reduce risk and provide flexibility, these purchases are based on a portfolio approach with a combination of short and long term contracts from a number of marketers.
Emergency Power
In addition, the mine has a small emergency power capability, used for critical process equipment that cannot be curtailed, such as thickeners and CIL tank agitators.
18.3 Water The main water sources for KBM operations are run-off water collected in the mine sumps, run-off water collected in the tailings dam catchment basins, recirculated effluent from processing activities, and make-up water from streams and wells. The majority of process water is captured and maintained in the mine sumps and tailings catchment basins during the rainy season for use during the dry season. The current operating plan has all water in mine sumps pumped to the plants continuously with Eustáquio recycle water pumping set to the desired rate to maintain total demand.

Kinross Gold Corporation Paracatu Project
Brazil NI 43-101 Technical Report
Page 134
Figure 18-2: Kinross-owned hydroelectric generating stations
Main water losses outside of process uses are from evaporation, water trapped in the tailings, percolation to groundwater, seepage from the tailings dam toe drains which maintain the ecological water flows of downstream creeks, pumping to Rico Creek to maintain ecological flow and using water for dust control around the mine and surface infrastructure.
Make-up water is pumped from four local streams and 13 wells. River flow rates vary seasonally and the pumping is performed when flows exceed nominal stream flows, as specified in the extraction permit. The São Pedro stream can be pumped at a rate between 1,130 m³/h and 1,598 m³/h over a 24 hour period. The Santa Rita/São Domingos streams are permitted for 24 hour pumping rates between 317 m³/h and 508 m³/h from both. Additionally, the wells are permitted for 24 hour pumping rates of 1500m³/h. A pipeline connects the catchments at the streams and wells to the existing reservoir at the São Domingos pumping station. Water from the São Domingos pumping station is pumped to the Santo Antônio Tailings Dam for storage until it is used. Another make-up water source is from Banderinha stream, which is permitted for 24 hour pumping rates of 900 m³/h during the rainy season (April to October) and is discharged to the Eustáquio Tailings Dam.

Kinross Gold Corporation Paracatu Project
Brazil NI 43-101 Technical Report
Page 135
19. MARKET STUDIES AND CONTRACTS
Kinross typically establishes refining agreements with third parties for the refining of doré bars. The Company retains marketing experts in-house to facilitate the sale of bullion on the spot market or as doré. The terms contained within the refining contracts and sales contracts are typical and consistent with standard industry practice, and are similar to contracts for the supply of bullion and doré elsewhere in the world.

Kinross Gold Corporation Paracatu Project
Brazil NI 43-101 Technical Report
Page 136
20. ENVIRONMENTAL STUDIES, PERMITTING, AND SOCIAL OR COMMUNITY IMPACT
20.1 Environmental Studies and Management KBM is constantly seeking excellence in its occupational health and safety, environmental and social responsibility system. The site maintains certifications in ISO 14001, OHSAS 18001, SA 8000 and is in compliance with the International Cyanide Management Code.
Environmental analyses focus on operations in the KBM mining license area and related facilities. An Environmental Impact Control Plan (PCA) has been implemented to ensure compliance with environmental permits and best practices. This plan focuses on such topics as air and soil quality, noise and vibration control, preservation of waterways, re-vegetation and tree canopy planning, the safety and hygiene of workers, and reclamation projects as well as occupation proposals and future use of the areas affected by mining. The key aspects and environmental impacts addressed in the plan include deforestation, relocation of mammals and birds, soil removal and compaction, dust mitigation, fossil fuel emissions, rainwater runoff, noise and vibrations from operations and blasting, and changes to the landscape.
KBM’s environmental performance report was updated in 2016 in the context of its last operation license renewal and it reflects the changes in mining activities, processing, and final disposal of waste and tailings.
Tailings
Tailings management programs at Kinross operations incorporate best-in-class standards, align with guidance from the Mining Association of Canada, Canadian Dam Association and the International Commission on Large Dams. The programs incorporate best practices such as periodic independent reviews and detailed Operating, Maintenance and Surveillance (OMS) Manuals.
The Paracatu Mine contains two tailings storage facilities; the older Santo Antônio Tailings Storage Facility (SATSF) and the newer Eustáquio Tailings Storage Facility (ETSF). These facilities contain flotation tailings (non hazardous tails) which are the biggest part of the tailings generated in the industrial plants. The tailings dams for both facilities are constructed from compacted earthfill, with modified centerline construction, internal chimney drains and foundation drainage blankets. The dams are classified as “B” (low risk, high consequence) under Brazilian law.
The Engineer-of-Record for the Paracatu TSFs, Knight Piésold, provides technical direction on behalf of Kinross, and verifies that the facilities meet appropriate design

Kinross Gold Corporation Paracatu Project
Brazil NI 43-101 Technical Report
Page 137
standards and that the facilities are constructed and operated per the design. The Engineer-of-Record has concluded that “Tailings management at the Paracatu mine has followed a high level of quality and integrity” and that the dams “meet or exceed international standards for dam safety” (Knight Piésold, 2019).
The Santo Antônio Dam is located north of the pit and processing plant. The tailings were deposited from the upstream side of the facility, which created a beach upstream of the main embankment. The facility construction began early in the operation of the mine and has been expanded with successive raises of the main embankment dam. The dam material is a clay and silty material from borrow areas downstream of the dam. The dam has reached its ultimate crest elevation of 676 m, and tailings deposition ceased in August 2015.
Until 1997, the tailings deposited in Santo Antônio were entirely from B1 oxide ore and were classified as non-acid generating. Since then, Santo Antônio received a blend of tailings of B1 oxide ore and B2 sulfide ores. KBM has added limestone to the tailings in Santo Antônio to aid in neutralizing acid generated in the facility.
Run-off is captured in the impoundment pond area. The spillway is located on the southeast abutment of the main embankment.
Seepage of water through the tailings embankment flows through a passive treatment system installed in Santo Antônio Creek just downstream of the main embankment. The passive treatment system consists of limestone gravel, which increases the alkalinity of the water passing through it, and induces metals to precipitate out of solution as the water becomes more alkaline. Flow rates and quality are monitored and reported to the environmental agency.
A final drainage system was completed in 2019 with 13 chutes along the embankment.
In 2015, KBM developed and concluded the feasibility studies for reprocessing part of the tailings in Santo Antônio. The exploration survey showed an opportunity to reprocess the upstream area. In October 2015, KBM started the PSAT (Processing Santo Antônio Tailings) project mining the area using haul trucks and reprocessing the tailings in the industrial plants.
In 2017, KBM started to mine the area using hydraulic mining and pumping the tailings pulp to the industrial plant. The two different mining methodology are called PSAT Pumping and PSAT Hauling. The first one uses water cannons to enable the tailings to be pumped as a pulp. Where the tailings are dryer, the mining is performed with excavators and regular haul trucks. The KBM current plan is to resume discharging tailings in Santo Antônio after PSAT is concluded, completing the closure design.

Kinross Gold Corporation Paracatu Project
Brazil NI 43-101 Technical Report
Page 138
The project aims to improve gold recovery as well as to reduce the sulfide content in the tailings. The project was expanded to Eustáquio TSF, where the same methodology applies, with both hauling and pumping activities. The project at Eustáquio is called PET (Processing Eustáquio Tailings).
The Santo Antônio borrow areas have been progressively reclaimed. Most part of the 450 ha has been regraded and planted with seeds and seedlings. Drainage channels have been implemented in the main critical areas (three drainage channels installed up to 2019) and regular vegetation maintenance is carried out each year.
The new Eustáquio tailings facility was commissioned in 2012. It has a planned footprint of 1,300 ha, significantly expanding KBM’s water storage and tailings capacity. The dam is being constructed in stages and has a planned final design crest up to a level of 740 m. In 2013, a passive treatment system was installed in the Eustáquio creek slightly downstream of the dam. This system is similar to the one installed at the Santo Antônio Tailings Storage Facility (TSF).
The Eustáquio Tailings Storage Facility (ETSF) is located northwest of the open pit and west of the existing SATSF. The valley in which it is located runs north and south. The main embankment runs east and west. There are also two smaller embankments: Dam A runs north to south, and the Saddle Dam runs east-northeast to west-southwest. The facility limits with Specific Tank 12 in the south.
The operational spillway at ETSF is located on the east abutment of the main embankment, and it will be raised in tandem with the embankment lifts. The operational spillway is designed for the Probable Maximum Precipitation (PMP) (400 mm in 24 hours). The tailings maximum elevation is designed to provide a 1 m freeboard below the spillway invert. The spillway invert is 2 m below the embankment crest. The spillway is designed to have a 300 mm freeboard when conveying the PMP flow. Depending on the abutment characteristics, the spillway can be constructed on the main embankment as well as on the Saddle Dam abutment.
Tailings deposition has been performed at two points through the use of the PL 30 and PL 20 pipelines. The first one is upstream of the main embankment while the second one is close to the Dam A embankment. There is a causeway or dike located in the impoundment area which prevents tailings deposited by the PL 20 pipeline to ingress into the bay where the barge is located. The barge is a metal structure with pumps and other infrastructure that is used to recycle water back to the process plants. The Eustáquio reservoir complements the storage capacity provided by the Santo Antônio reservoir.

Kinross Gold Corporation Paracatu Project
Brazil NI 43-101 Technical Report
Page 139
One of the permitting conditions for the ETSF is to maintain an ecological flow of 160 m3/hr of water to Eustáquio Creek. The water is currently supplied by springs diverted around the tailings facility and by seepage of water through the tailings embankment. The water flows through a passive treatment system installed in Eustáquio Creek just downstream of the main embankment, similar to the system at SATSF. In 2020 KBM plans to maintain the ecological flow of Eustáquio Creek with other freshwater sources already granted. In that sense, the toe drain water will be pumped and recirculated in the process.
In 2018, KBM renewed its Operational Permit (LO Nº 016/2018) granted from the Environmental Regulatory Authorities, which covers mining activities, waste stockpiling, ore treatment, tailings disposal, tailings reprocessing, solid waste treatment and disposal and fuel stations. This permit is valid until March 2028.
Acid and Cyanide Management
To reduce the potential of tailings to produce acid, sulfur levels in tailings is reduced via floatation during the gold recovery process. Concentrated sulfur material is placed in lined ponds (referred to as specific tanks).
Since 1991, Morro do Ouro mining has been conducting research applied to the control of acid rock drainage (ARD). In 1994, a dedicated laboratory was installed on-site to conduct kinetic tests to evaluate the long-term acid generation potential and investigate potential covers and the required environmental controls.
In 1998, Morro do Ouro site started mining the B2 sulfide ore and already had its processing and environmental processes defined from the ARD research program. This included the use of a geological model with PAF and NAF materials information to manage the waste and sulfur grade in the ores fed in the plant, the segregation of the sulfides in the flotation process and stoichiometric addition of limestone to prevent acid generation from residual sulfides contained in the final tailings to be discharged in the dams. As KBM improved the research and data acquisition capacity, these controls have been reviewed and improved.
Since 2004, KBM has maintained passive treatment systems in the springs located around the Morro do Ouro Mine, aiming to ensure the surface water quality of the areas surrounding the mine. These systems are called alkaline drains and promote the correction of the spring pH by limestone (dolomitic gravel), increasing the alkalinity and favoring the precipitation of metals and metalloids. Also, to assure the water quality around the mine, all stormwater is collected and maintained within the pit. This water is used for dust control and in the industrial process.

Kinross Gold Corporation Paracatu Project
Brazil NI 43-101 Technical Report
Page 140
A small fraction of the mill feed is recovered as sulfide concentrate. After gold recovery by cyanide leaching, the residual solids (sulfide tailings), including the residual cyanide solution, are permanently stored in lined waste repositories referred to as “specific tanks” that were specially designed to prevent leakage into the groundwater and any contamination of the environment. The potential liabilities of these tailings are related to the high sulfide mineral content and the concentration of cyanide. The total cyanide concentration averages below 50 ppm, following the International Cyanide Management Code.
There have been 12 tanks constructed in the KBM site for sulfide concentrate tailings storage. Tanks 1 through 11 have been covered (with exception of Tanks 9B and 10 which are planned to be covered in the following years) and Specific Tank 12 is currently in operation. Tank 12 was designed to be progressively raised and will be used to end of mine life.
The current management of these sulfide tailings, including the installation of composite liners in the specific tanks and sub-drains to intercept and collect any potential leakage, is considered to provide appropriate containment. The final cover will be completed on reclaimed specific tanks as part of the closure process. At present, there are eight specific tanks that have been closed with an initial compaction layer. The final cover design of specific tanks will be implemented. KBM has re-processed the tailings disposal at specific tanks I and II, and completely removed the contained sulfur concentrate.
KBM has used cyanide as part of its final hydrometallurgical carbon-in-leach (CIL) circuit, where it is used to leach the gold into solution. Prior to discharge of tailings, cyanide levels are reduced below 50 ppm as required by the "International Cyanide Management Code for the Manufacture, Transport, and Use of Cyanide in the Production of Gold".
In recent years, KBM has implemented a series of improvements to reduce cyanide consumption, including the implementation of automatic feed systems, which has reduced the consumption of this reagent in kg/t ore processed.
Dust, Vibration and Noise Management
In the last few years, KBM has implemented many actions regarding dust, vibration and noise control, seeking continuous improvement in compliance with internal standards and local legislation.
Air emissions from mining occur primarily as fugitive dust from mining, transportation, waste rock handling and ore crushing from the in-pit crusher.

Kinross Gold Corporation Paracatu Project
Brazil NI 43-101 Technical Report
Page 141
In order to minimize emissions from fugitive dust from the mine, KBM operates water trucks 24 hours per day. Dust suppressant (polymer) is also applied annually to avoid particulate dispersion due to wind disturbance. Additionally, some roads are covered with laterite or coarse limestone to reduce dust generation.
In the Plant I crusher, dust is controlled by the use of water sprinklers and Venturi scrubbers. In the in-pit crusher, the dust generated during ore unloading is controlled by a water spray system at various points in the hopper. In addition, a polymer called Golden West is used to bind the finest dust particles together. The stockpile is covered to avoid dust dispersion and contains water sprays to limit dust generation.
Frequent inspections of dust control systems are performed. A program of Opacity Measurement is in place to standardize and facilitate the inspections.
In addition to dust-generating mining activities, there are also point source stack emissions from on-site facilities that perform carbon regeneration, electro-winning, smelting and laboratory processes. Emission controls such as bag filters and gas washers are used at the point sources and an annual emission inventory is maintained on-site.
Other control actions in the mining operation area are:
• Rehabilitation of impacted areas; • Water sprinkling on main access roads; • Control and optimization of vehicle traffic; • Use of water sprinklers on conveyor belts (ore transfer points) and crushers; • Mine planning with control of the average transport distance; • Operational control of mine clearance activity observing predominant wind
direction; and • Application of polymers in areas where they will not be plowed and in waste piles
and rehabilitation of waste piles located near the community.
As explosives are required for blasting, KBM has an air pressure and vibration management program.
All mine planning takes the noise and vibration impacts associated with blasting into consideration. To minimize disturbance, the daily blast occurs at 3:00 pm on weekdays only, as per an agreement with the residential community. Any changes to this schedule are agreed upon with the community prior to blasting. KBM uses the best technologies and procedures to minimize the amount of vibration in the city of Paracatu. These procedures include careful planning of blast layout patterns and consideration of wind direction to avoid carrying dust towards the city. Monitoring is carried out at strategic

Kinross Gold Corporation Paracatu Project
Brazil NI 43-101 Technical Report
Page 142
points in the neighborhoods surrounding the mine during the time of blasting. There is a community monitoring program in place in which community members are trained to follow up on the monitoring. This brings transparency and reliability to the relationship with the community.
KBM adopts continuous daily noise monitoring from 7 pm to 6 am. All acoustic measurements are performed by a contractor in accordance with the recommendations of ABNT (Brazilian Standards). The noises generated in the mine are due to the operation of equipment, machinery, heavy vehicles, dismantling, ore and waste transportation and other activities inherent to the operation of the enterprise.
In order to reduce the noise levels associated with mining activities, KBM conducts a series of precautions such as:
• A mine plan that optimizes truck routes and areas mined during day and night; • Equipment reverse alarms are disabled during the night shift; • Equipment maintenance; • Deepening of the pit; • Acoustic barrier between the boundary of the pit and the vicinity of the residential
community. Besides reducing the noise level in the residential community, this barrier also minimizes the visual impact of the mine.
20.2 Permitting Brazilian environmental policy is executed at the federal, state and municipal levels of public administration. Coordinating and formulating the Brazilian Environmental Policy is the responsibility of the Environmental Ministry. Directly linked to this body is the National Environmental Council (CONAMA), the deliberative and consultative board for environmental policy. CONAMA’s responsibility is to establish the rules, standards and guidelines so that environmental licensing can be granted and controlled by the state and municipal environmental agencies. These agencies are part of the National Environmental System (SISNAMA), and the Brazilian Institute for the Environment and Renewable Resources (IBAMA). IBAMA is the government agency under the jurisdiction of the Environmental Ministry and is the agency responsible for executing Brazilian Environmental Policy at the federal level.
The basic environmental impact assessment process is initiated with the collection of baseline data following the submission of a conceptual mine plan. Baseline data collection is followed by a formal Environmental Impact Assessment (EIA). The Environmental Impact Report (RIMA) is a summary of the EIA presented in language adequate for public communication and consultation. The EIA and RIMA are made available for public review and comment during the public hearings.

Kinross Gold Corporation Paracatu Project
Brazil NI 43-101 Technical Report
Page 143
Once the EIA/RIMA process is complete, there are three components of the Environmental License that must be completed. The License is issued by the State Agency (SUPRAM NOR) in an integrated process that includes the Forest Agency (IEF), Water Agency (IGAM) and Environmental Agency (FEAM). This integration was consolidated in the Minas Gerais State in 2007 with the creation of eight Regional Agencies. KBM reports to the office in Unaí, located 100 km from Paracatu. The additional permits required for the Environmental License are described below.
Previews Permit (LP) - This is relevant to the mining project’s preliminary planning stage. The permit contains the basic requirements of the municipal, state and federal agencies for soil use during the location, installation and operation stages.
Requirements must meet regulations, criteria and standards set out in the general guidelines for environmental licensing issued at the State Level (DN 217/2017), providing there is no conflict with federal level requirements.
The Mining Plan and the EIA/RIMA are technical documents required in order to obtain the Previews Permit. This process is concurrent with the request for a mining concession.
This phase is related to the environmental feasibility and contains the location and technological alternatives of the project. It also contains an environmental and social assessment, potential impacts inherent to the activities and programs to control these impacts.
Installation Permit (LI) – This authorizes the installation and implementation of the mining project according to the specifications in the approved Environmental Control Plan. The LI can be requested only after the completion of the LP. The Environmental Control Plan (PCA) is based on the impacts registered in the EIA. This plan is required for the Installation Permit and the land clearing (deforestation) permit to be issued. At this stage, a closure plan is made and submitted to the ANM for approval.
Operating Permit (LO) – This authorizes the start of permitted operation activities according to what was established in the Preview and Installation Permits. The LO has a duration of 10 years and can be renewed. The revalidation permit is granted after the submission of the Environmental Performance Report (RADA) and its evaluation by the environmental agency (SUPRAM NOR). During the operating phase of the Project, the Annual Mining Report (RAL) is submitted by the Company for the approval of the ANM. In the closure phase, after the decommissioning, restoration and environmental monitoring operations have been completed, the Company applies for a Conformity Certificate from the environmental agency and ANM. As part of these permitting requirements, KBM must submit an environmental report.

Kinross Gold Corporation Paracatu Project
Brazil NI 43-101 Technical Report
Page 144
In 2017, Mina Gerais State updated the environmental licensing legislation (COPAM 217/2017) including the possibility of a concomitant process where LP, LI and LO are analyzed and issued together. The update also included the Simplified Licencing category (LAS), which is conducted in a single stage which can include only the information registration or the submission of a simplified environmental report (LAS-RAS).
The Operation Permit (LO) for a 61 Mt/a throughput pit was granted in July 2010. In 2018, KBM has renewed its Operational Permit (LO Nº 016/2018) granted from the Environmental Regulatory Authorities, which gathered in one single document the permit for mining activities, waste stockpiling, ore treatment, tailings disposal, tailings reprocessing, solid waste treatment and disposal and fuel stations. Deforestation required to enable the above-mentioned activities is also part of the permit. Before LO Nº 016/2018, all of these activities used to be permitted in different documents. This permit is valid until March 2028.
Besides the main permit, KBM has granted the LP+LI+LO N°048/2017 (concomitant licensing) for Non-ferrous Metallurgy in primary forms valid until September 2027; LO N°049/2017 for the ore conveyor valid until September 2027; and LAS-RAS N°094/2018 for reprocessing tailings at TSFs valid until March 2028.
In August 2019, KBM was granted with LP+LI+LO nº 071/2019 for pit optimization. This permit includes the expansion of the pit (phases 13, 15, and 17) and also permitted an ex-pit waste rock dump.
Besides environmental permits, KBM also owns and manages water grants for different purposes related to its activities, for example, water storage and pumping from the TSFs; stream channeling/interference (alkaline drains); collective water grant for pumping; pit dewatering; stream deviation; and grants for hydrological research (Acqua Project).
Following the pit expansion permitted through the LP+LI+LO nº 071/2019, as KBM will increase the drainage area of the pit, a new grant request was submitted for pit dewatering considering this new scenario. The process is in its final stages of analysis and it is expected to be approved by early 2020.
Due to the drought experienced in past years, KBM started in 2015 to look for other alternatives for water supply to guarantee its production while causing less impact on other water users. The Acqua Project started with hydrogeological research and mapping in areas surrounding the site. An important karstic aquifer was identified. Wells and piezometers were installed and since 2015, wells were granted with a hydrogeological permit to integrate into KBM’ water supply system. In 2018 KBM initiated the process to request the final grant to the agency.

Kinross Gold Corporation Paracatu Project
Brazil NI 43-101 Technical Report
Page 145
As part of the operating permit renewal process, the agencies complete a comprehensive review of KBM Paracatu’s environmental and operating performance over the previous four years and determine if the site has been in compliance with its obligations.
20.3 Social and Community-Related Requirements Given the proximity of the mine to the city of Paracatu, the primary concern for community impact relates to dust, vibration and noise, as discussed above. KBM Paracatu also has various projects designed to focus on the community, with the goal of preserving the cultural identity of the region and supporting community health and education.
KBM coordinates an external communication strategy aiming to improve the relationship with communities and stakeholders as well as to facilitate the information process with the public. In 2018, KBM also strengthened its open dialogue on social media, and has been working proactively and transparently on its channels. KBM has expanded its participation in social media, increasing the number of engagements, as well as creating a new profile on the Instagram social network.
KBM also holds a visit program called Inside Kinross, receiving different groups of visitors every Wednesday and every last Saturday of the month. Visitors include students from schools, universities, civil organizations and any community member interested in knowing the process from the inside.
Another program is the Dialogue Committee for Solutions. Representatives of neighbor communities attend the meetings. The Committee also monitors and discusses KBM environmental monitoring processes, the Company's social and environmental projects, and guidelines to be reported in the community journal, made for these communities.
One of the practical outcomes of the Dialogue Committee for Solutions was the training of residents of KBM neighborhoods as volunteers of the Environmental Monitoring Program. KBM employees conduct training with these participants, who also accompany the entire technical scope and operation of the rock blasting activity. With this, volunteers are at the same time gaining knowledge and working with residents' associations.
Another important social action is the Integrar Program, which has four pillars: Education, Culture, Environment, and Job and Income Generation. The program has a long term perspective, aiming to bring long term results for the city and communities.
Other programs include the Local Vendor Prioritization Program; Suppliers Training Program; Social Program with Quilombola Communities; Archaeological, Historical and Cultural Heritage Management Program; and Paracatu Springs Protection.

Kinross Gold Corporation Paracatu Project
Brazil NI 43-101 Technical Report
Page 146
20.4 Mine Closure Requirements and Costs KBM has a comprehensive and updated closure plan that includes an estimation of closure cost. The plan is based on the closure plan strategy developed by Knight Piésold (2015). The cost estimates are reviewed annually while the written plan is reviewed every four years to reflect changes and updates. The closure plan covers all affected areas including the mine pit area, tailings dams, and ponds that are used to dispose of the sulfide concentrate. KBM is committed to implementing specific measures to safely close down its facilities as described below.
Mine Pit Area
Oxidized or non-sulfide areas will be reclaimed by direct treatment of the surface (grading) and growing of grass and legume species. Sulfide-exposed areas will receive a cover of waste material and soil to act as a capillary break and prevent acid mine generation. A drainage system for controlling runoff water will be implemented and maintained until the reclaimed areas become stable. A pit lake will be formed in the west part of the mine. The Company conducted hydrogeological studies to identify the potential risk of impacting groundwater flow and quality. These studies recommended reducing the exposure time of sulfides and addressing poor water quality by pumping water from the tailings dam to the pit lake. Those studies are frequently reviewed and consider both water balance and water quality analysis.
Tailings Dam Areas
The closure of the tailings dam areas will occur in a progressive way approaching the end of operations. The first phase is a partial closure of Santo Antônio Dam, which has already been started. For this facility, KBM has concluded the executive plan, which defines the areas to be covered (downstream area) and the area to form a lake. KBM has started reclamation of the dam wall and borrow areas, covered and revegetated 65% of the covered area and completed the final drainage system on the embankment as per closure executive design.
Field experiments were conducted in 2016 on the surface of the tailings to study cover thickness for closure. A 1.5 m cover of saprolite is currently planned to be placed over the tailings placed in the basins. This cover will considerably reduce the risk of exposing any residual sulfides contained in the tailings materials to atmospheric oxygen and reduce the risk of generating acid drainage.
Upon conclusion of PSAT, the area will be partially filled again with flotation tailings to enable the formation of a lake on top of the basin. A relief channel will be constructed to interconnect the PSAT and barge lakes. The barge lake is connected with the embankment spillway. The ecological flow to Santo Antônio Creek will be maintained

Kinross Gold Corporation Paracatu Project
Brazil NI 43-101 Technical Report
Page 147
and the passive treatment system, which treats the seepage from the tailings embankment, will also be maintained. Following Engineer-of-Record recommendations and recent legal requirements regarding water storage in dams, it is planned to lower the spillway level of Santo Antônio, from its current 673 masl to 668 masl.
For Eustáquio Tailings Dam, closure and reclamation activities are expected to be conducted only in the final years and after operations. The deposition pipes will be dismantled and disposed of at an offsite facility. The remaining ponded water will be located in the center of the facility where a lake will be formed. The border areas, especially the zone upstream of the embankments, will have dry cover (saprolite cover). A relief channel will be constructed to connect the pond to the permanent emergency spillway. The tailings beach will be covered and revegetated as with Santo Antônio. The ecological flow to Eustáquio Creek is to be maintained. A surface drainage network will be installed on the downstream embankment faces. The embankment faces and borrow areas will be revegetated. Reclamation of the inactive borrow areas is underway, conforming the topography and revegetating the surface.
CIL Sulfide Concentrate Specific Tanks
The sulfur concentrate disposal facilities (“specific tanks”) require a special strategy for closure in order to prevent atmospheric exposure and potential acid generation.
The specific tanks that have not yet been closed will be covered and revegetated once they have reached capacity. Specific Tank 12 will be covered with flotation tailings or other inert material at the end of mine life, and will be incorporated into the final tailings deposition within the Eustáquio Tailings Facility. The area will be covered and revegetated in the same manner as the tailings beaches of Eustáquio.
Studies from 2012 developed a cover design for specific pond closure considering a complex cover. It considered a trafficability layer of oxide material directly over the tailings, followed by a thin layer of coarse material (ground limestone or saprolite) to act as a capillary break, topped with a clay layer, followed by a layer of fine silt material. Finally, an organic soil would be placed on the top of the surface and selected grass and legume species would be planted. This concept is being reviewed by field experiments and engineering designs in order to optimize material requirements and cover execution.
In order to reduce the seepage of water to lower levels, and to prevent erosion, a drainage system to collect and divert runoff water will be installed. Periodic maintenance of surface drain systems and of re-vegetation will be required for at least five years after the closure of the specific ponds to ensure sustainable reclamation.

Kinross Gold Corporation Paracatu Project
Brazil NI 43-101 Technical Report
Page 148
Buildings and Ancillary Facilities
Any remaining buildings that would not be demolished, and ancillary facilities such as roads, power lines and pumps, will be offered to local Paracatu authorities for municipal use.
Future Land Use and Sustainability of Closure
KBM intends to integrate its closure strategy with local expectations, but there will be restricted use of some areas (sulfide mined areas, tailings dams and specific ponds). Future potential land uses include the development of parks and the potential for areas to be used for educational and recreational purposes.
KBM has started a detailed process of studies and planning for future use. In 2019 the first Future Use workshop was conducted with the senior leadership of the Company where the issue was discussed and the first results of the studies were presented. A risk-based analysis was performed considering six potential alternative uses (Agriculture and Fish Farming, Environmental Conservation, Tourism and Preservation of Historical Mining Heritage, Research/Academic, Industrial, and Residential). According to the studies, the most recommended future uses are Environmental Conservation, Tourism and Historical Heritage, Research/Academic and Industrial.
It is important to understand the construction process of future use optons. Before any final decision, KBM is committed to performing all the required technical studies to better understand the requirements and restrictions for each area of the site. KBM will consider stakeholder engagement and communication plans to validate and construct the agreed alternative.
Funding Closure
Reclamation activities that are performed during the life of mine are funded from the mine’s cash flow. Reclamation activities performed after the mine has completed operation will be funded by Kinross’ portfolio of operating mines. Based on the current reserve pit, the estimated cost of closure is approximately US$ 191.9 million.

Kinross Gold Corporation Paracatu Project
Brazil NI 43-101 Technical Report
Page 149
21. CAPITAL AND OPERATING COSTS
21.1 Capital Costs Remaining capital costs at Paracatu are primarily sustaining capital, which includes mine equipment replacement and $512 million for the tailings dam expansions. Total sustaining capital costs are $997.2 million in real terms (Table 21-1).
Table 21-1: Sustaining capital estimate for LOM (January 1, 2020 forward)
Area Sustaining Capital (US$000s)
Mine Mobile Equipment 320,015 Mine Other 33,954 Processing Facilities 125,377 Tailings Facilities 512,472 Site Infrastructure 15,187 Major Development Projects 0,000 Information Technology 8,923 Salvage value -18,705 Total 997,222
21.2 Operating Costs Operating costs are tracked and are well understood. Unit operating costs for the LOM production schedule are shown in Table 21-2.
Table 21-2: Operating cost estimate for LOM (January 1, 2020 forward) Area Unit Cost1 Mining US$/t mined2 $1.76 Rehandle US$/t rehandled $1.22 Processing US$/t processed3 $3.77 PSAT US$/t processed4 $1.80 Site Admin million US$/year 42.0
Notes: 1. Average life-of-mine costs. 2. Excludes sustaining capital. 3. Based on combined Plant 1 and Plant 2 costs, includes PET costs, excludes PSAT and
sustaining capital costs. 4. Includes mining, pumping and processing cost.

Kinross Gold Corporation Paracatu Project
Brazil NI 43-101 Technical Report
Page 150
22. ECONOMIC ANALYSIS
Under NI 43-101 rules, a producing issuer may exclude the information required for Item 22 – Economic Analysis on properties currently in production, unless the Technical Report prepared by the issuer includes a material expansion of current production. Kinross is a producing issuer, the Paracatu mine is currently in production, and a material expansion is not included in the current LOM plans. Kinross has carried out an economic analysis of the mine using the estimates presented in this report and confirms that the outcome is a positive cash flow that supports the statement of Mineral Reserves.

Kinross Gold Corporation Paracatu Project
Brazil NI 43-101 Technical Report
Page 151
23. ADJACENT PROPERTIES
There are no other producing mines near the Paracatu mine. There are undeveloped gold showings in the vicinity of Paracatu, but they have not proven to be viable exploration targets.
No reliance was placed on any information from adjacent properties in the estimation and preparation of the resources and reserves reported in this Technical Report. Adjacent properties are therefore not deemed material to this report.

Kinross Gold Corporation Paracatu Project
Brazil NI 43-101 Technical Report
Page 152
24. OTHER RELEVANT DATA AND INFORMATION
In August 2015, Paracatu began the project Processing Santo Antônio Tailings (PSAT) with the intention of recovering gold sent to the tailings dam over the operating life of Paracatu. The target for the project is gold that has segregated naturally in the tailings impoundment (Figure 24-1).
For the coarser material, a strip mining method is applied. Material is hauled by truck to the Plant II stockpile, directed to only one of the 6 feeders, where the tailings are comingled with ROM to feed the SAG mill.
For the finer material, hydraulic mining by a high-pressure water jet is applied. PSAT material is pumped to the Plant I flotation circuit, where it is directed to a dedicated rougher line. The rougher concentrate produced feed is directed to the cleaner circuit where it combines with rougher concentrate from ROM roughers. Rougher tailings are final tailings and are sampled separately.
There are two main regions in PSAT labeled Area A and Area B (Figure 24-2). Area A has coarse grained material that is currently being extracted with a conventional truck and shovel operation. Area B has finer grained material extracted with hydraulic mining method by using water jets to transport tailings to four principal barges.
Figure 24-1: Conceptual drawing explaining particle segregation

Kinross Gold Corporation Paracatu Project
Brazil NI 43-101 Technical Report
Page 153
In mid-2017, the Eustáquio Tailings (PET) project commenced near a tailings discharge point (Figure 24-2). The PET project involves the mechanical (truck and shovel) mining of recently deposited tailings to a depth of approximately 6 m. Due to the ore body, mining process, and location near the deposition point, the PET re-mining area tends to be in primarily coarse tailings. As with coarse material from PSAT, PET tailings are hauled to Plant II for processing. In April 2019, Kinross expanded the Eustáquio re-mining with PET 2 project, which uses a barge with a dredge and pump. Knight Piésold has design responsibility as the Engineer-of-Record for this facility.
Figure 24-2: PSAT and PET areas Production for PSAT and PET is shown in Table 24-1. From 2018 onward, PET ounces and recovery are shown as “NA”, and PET ounces have been counted towards recovery because the PET material can be considered part of the circuit in current production.
Table 24-1: PSAT and PET summary results Years 2015 2016 2017 2018 2019 Total
PSAT
Feed (Tons) 363 6,043 8,675 10,440 10,437 35,958 Grade (g/t) 1.090 0.521 0.387 0.261 0.262 0.344 Recovery (%) 79.42 75.88 68.95 61.03 62.37 66.01 Ounces 9,857 73,990 76,560 51,533 56,431 268,371
PET
Feed (Tons) - 482 1,736 1,661 1,789 5,668 Grade (g/t) - 0.535 0.439 0.449 0.400 0.438 Recovery (%) - 73.43 75.11 NA NA NA Ounces - 6,091 18,038 NA NA NA

Kinross Gold Corporation Paracatu Project
Brazil NI 43-101 Technical Report
Page 154
25. INTERPRETATION AND CONCLUSIONS
Kinross is confident in the technical and economic assessment presented in this Technical Report. However, the results of this Technical Report are subject to many risks including, but not limited to: commodity and foreign exchange assumptions (particularly relative movement of gold and oil prices), unanticipated inflation of capital or operating costs, significant changes in equipment productivities, geotechnical assumptions in pit designs, ore dilution or loss, throughput and recovery rate assumptions, availability of financing and changes in modelled taxes.

Kinross Gold Corporation Paracatu Project
Brazil NI 43-101 Technical Report
Page 155
26. RECOMMENDATIONS
There are no recommendations at this time as Paracatu is a fully operational mine.

Kinross Gold Corporation Paracatu Project
Brazil NI 43-101 Technical Report
Page 156
27. REFERENCES
CIM, 2010. CIM Definition Standards - For Mineral Resources and Mineral Reserves, Prepared by the CIM Standing Committee on Reserve Definitions, Adopted by CIM Council on November 27, 2010.
Golder Associates, 2018. Central and Ex-Pit waste dump design report.
Bongarcon, D.F., 2005. Study of Sampling Protocols and Ore Heterogeneity.
Knight Piésold, 2015. Paracatu Mine Closure Plan.
Knight Piésold, 2015. Paracatu Pit Slope Stability Evaluation.
Knight Piésold, 2018. Feasibility Design for Ex-Pit Waste Pile.
Knight Piésold, 2019. Safety and Integrity of the Tailings Dams at Paracatu.
Oliver, N.H.S.; Thomson, B.; Freitas-Silva, F.H.; Holcombe, R.J.; Rusk, B.; Almeida, B.S.; Faure, K.; Davidson, G.R.; Esper, E.L.; Guimarães, P.J.; Dardenne, M.A., 2015. Local and regional mass transfer during thrusting, veining, and boudinage in the genesis of the giant shale-hosted Paracatu Gold Deposit, Minas Gerais, Brazil. Economic Geology, v. 110, p. 1803-1834.
Rodrigues, J.B., Pimentel, M.M., Dardenne, M.A. and Armstrong, R.A., 2010. Age, provenance and tectonic setting of the Canastra and Ibiá Groups (Brasília Belt, Brazil): Implications for the age of a Neoproterozoic glacial event in central Brazil. Journal of South American Earth Sciences.
RPA, 2012. Mineral Resource and Mineral Reserve Audit of the Paracatu Gold Mine, Minas Gerais, Report by Luke Evans and Rick Lambert. July 11, 2012, 109 p.

Kinross Gold Corporation Paracatu Project
Brazil NI 43-101 Technical Report
Page 157
28. DATE AND SIGNATURE PAGE
The effective date of this Technical Report entitled “Kinross Gold Corporation, Paracatu Project, Brazil, NI 43-101 Technical Report” is March 10, 2020.
“Signed and sealed”
John Sims, AIPG Certified Professional Geologist
Dated March 10, 2020


![[5437]-101 M.Sc ENVIRONMENTAL SCIENCE EVSC 101](https://static.fdokumen.com/doc/165x107/631d8020ec7900c0c80d1eb7/5437-101-msc-environmental-science-evsc-101.jpg)