
Costerfield Property NI 43-101 Technical Report
343
Mandalay Resources - Costerfield Property NI 43-101 Technical Report
-
Upload
khangminh22 -
Category
Documents
-
view
3 -
download
0
Transcript of Costerfield Property NI 43-101 Technical Report

Mandalay Resources - Costerfield Property NI
43-101 Technical Report

MANDALAY RESOURCES - COSTERFIELD PROPERTY
NI 43-101 TECHNICAL REPORT
PROJECT COMPLETION DATE: 25 March 2022
MANDALAY RESOURCES LTD
Document Control Information
Customer
Mandalay Resources - Costerfield Property NI 43-101 Technical Report
REVISION
No. DATE
9601 Costerfield NI43-101 TR R5 05 25/03/2022

Revision Tracking
Revision Prepared By Reviewed By Issued For Approved By Date
00 Andrew Goode Andrew Fowler RC Andrew Fowler 4/03/2022
01 Andrew Goode Gabby Kirk RC Andrew Goode 5/03/2022
02 Andrew Goode Mandalay RC Mandalay 7/03/2022
03 Andrew Goode Aaron Spong QP Aaron Spong 24/03/2022
04 Andrew Goode Simon Walsh QP Simon Walsh 23/03/2022
05 Andrew Goode Richard Buerger QP Richard Buerger 23/03/2022
06 Andrew Goode Andrew Fowler FV Andrew Fowler 25/03/2022
Issued For: Review and Comment (RC), Information Only (IO), Implementation (IM), Final Version (FV).
Quality Control
Principal Report Compiler ANDREW GOODE Date 30 MARCH 2022
Principal Report Reviewer ANDREW FOWLER Date 14 MARCH 2022
QUALIFIED PERSONS
AARON SPONG Date 24 MARCH 2022
SIMON WALSH Date 23 MARCH 2022
ANDREW FOWLER Date 25 MARCH 2022
RICHARD BUERGER Date 23 MARCH 2022
Additional Reviewers GABBY KIRK, JOSHUA GREENE, ELAINE BELLAMY

Mandalay Resources - Costerfield Property NI 43-101 Technical Report
D E F I N E | P L A N | O P E R A T E 4
1 EXECUTIVE SUMMARY
The Costerfield Property (“The Property”), wholly owned by Mandalay Resources Corporation
("Mandalay Resources" or “Mandalay”) is located within the Costerfield mining district,
approximately 10 km northeast of the town of Heathcote, Victoria. The Property mining and
processing facilities include an underground mine and a conventional flotation processing
plant (Brunswick Processing Plant) with a current capacity of approximately 150,000 t/year of
feed.
Mandalay Resources is a publicly listed company trading on the Toronto Stock Exchange (TSX)
under the symbol MND, with the head office at 76 Richmond Street East, Suite 330, Toronto,
Ontario, Canada M5C 1P1.
Mining Plus was commissioned by Mandalay to provide Qualified Persons (QPs) to undertake
personal inspections of the Property, complete detailed reviews of the work completed by
Mandalay personnel and take QP responsibility for the 2021 Technical Report and any
associated public disclosure. Mining Plus QPs have independently reviewed the work
completed by Mandalay Resources and take responsibility for all sections of this Technical
Report, with some reliance placed on external experts to the extent permitted under the
Canadian National Instrument 43-101 (NI 43-101).
The Mineral Resource and Mineral Reserve Statement reported herein was prepared in
accordance with the Canadian Institute of Mining, Metallurgy and Petroleum (CIM)
“Definition Standards” (CIM, 2014), “Mineral Exploration Best Practice Guidelines” (CIM,
2018) and “Estimation of Mineral Resource and Mineral Reserves Best Practice Guidelines”
(CIM, 2019).
During 2021, Mandalay drilled a total of 36.3 kilometres (“km”) of exploration diamond core
at a cost of $6.0 million. The breakdown of this significant drilling campaign is as follows:
• 27.0 km to test extensions of the Youle and Shepherd orebodies;
• 2.6 km to test other near-mine targets; and
• 6.7 km to test regional targets beyond current mine operations.
In addition to drilling, 4,585 m of on-vein development was completed within the Youle ore
body, with 75 m development from October 2021, into the Shepherd ore body. Rock chip
samples used in mine grade control were also included in the geological database and used
in the Mineral Resources estimation process to improve Mineral Resources classification in
areas accessed by development.

Mandalay Resources - Costerfield Property NI 43-101 Technical Report
D E F I N E | P L A N | O P E R A T E 5
Drill core was logged and sampled by Costerfield geologists, who also performed mine
sampling. All samples were submitted to Onsite Laboratory Services in Bendigo, Victoria,
Australia for sample preparation and assay. Site geological and metallurgical personnel have
implemented a QA/QC process that includes the regular submission of site specific and
externally sourced standard reference materials, duplicates and blanks with drill and face
samples submitted for assay. Site specific standard reference materials were both produced
and certified by Geostats Pty Ltd. or ORE Research and Exploration Pty Ltd. (OREAS). Both
Geostats Pty Ltd. and OREAS are Australian consultancies who specialize in laboratory quality
control systems.
The acQuire™ Geoscientific Information Management (“GIM”) system was used to store and
validate all geological data used for the Mineral Resource Estimate. A two-dimensional (“2D”)
accumulation estimation method was used for all models. This method is considered most
applicable for the narrow veins of Costerfield. The Datamine™ Studio RM platform supports
2D accumulation estimation and was used to complete the Mineral Resource Estimation.
Validated drilling and mine sampling data were imported into Datamine and composited to
true vein width. Gold accumulation, antimony accumulation (accumulation = vein true width
x vein grade) and true vein width were estimated into a 2D block model for each lode using
ordinary kriging interpolation. Estimated gold and antimony vein grades were back-calculated
from the block estimated accumulated data and true vein width.
Where vein true widths are less than 1.2 m, vein grades were diluted to a minimum mining
width of 1.2 m using dilution grades of zero g/t gold and zero percent antimony for host
lithologies. Where vein true widths are greater than or equal to 1.2 m grades were not diluted.
Mineral Resources were estimated at a cut-off grade of 3.0 g/t gold equivalent (“AuEq”) which
was determined using Costerfield’s 2021 production costs, and using a gold price of
$1,700/oz, and an antimony price of $8,500/t. Cut-off grade is expressed as AuEq to allow for
the inclusion and expression of the secondary metal (Sb) in terms of the primary metal (Au).
AuEq is calculated using the formula AuEq= Au + (Sb x 1.58) where Sb is expressed as a
percentage, and Au is in grams per tonne, both based on 1.2 m diluted grades.
Table 1-1: Mineral Resources at Costerfield, Inclusive of Mineral Reserves as of December 31, 2021
Resource Category Tonnes (kt) Au Grade
(g/t) Sb Grade (%)
Cont. Au
(koz) Cont. Sb (kt)
Measured Resources
Underground 408 15.4 5.0 202 20.4
Stockpile 41 10.1 3.3 14 1.4
Indicated Resources

Mandalay Resources - Costerfield Property NI 43-101 Technical Report
D E F I N E | P L A N | O P E R A T E 6
Underground 938 8.6 1.9 259 17.5
Total Measured and
Indicated 1,387 10.6 2.8 474 39.3
Inferred Resources
Underground 532 6.7 1.3 114 6.7
Notes:
1. The Mineral Resource is estimated as of December 31, 2021 with depletion through to this date. 2. The Mineral Resource is stated according to CIM guidelines and include Mineral Reserves. 3. Tonnes are rounded to the nearest thousand; contained gold (oz) is rounded to the nearest thousand; contained
antimony (t) is rounded to nearest hundred. 4. Totals may appear different from the sum of their components due to rounding. 5. 3.0 g/t AuEq cut-off grade over a minimum mining width of 1.2 m is applied where AuEq is calculated using the
formula: AuEq = Au g/t + 1.58 * Sb % 6. The AuEq factor of 1.58 is calculated at a gold price of $1,700/oz, an antimony price of $8,500/t, and 2021 total
year metal recoveries of 93% for Au and 95% for Sb. 7. Veins were diluted to a minimum mining width of 1.2m before applying the cut-off grade and peripheral
mineralisation far from current development was excluded to comply with the Reasonable Prospects for Eventual Economic Extraction (RPEEE) criteria.
8. The Stockpile Mineral Resource is estimated based upon surveyed volumes supplemented by production data. 9. Geological modelling, sample compositing and Mineral Resource Estimation for updated models was performed
by Joshua Greene, MAusIMM, a full-time employee of Mandalay Resources. 10. The Mineral Resource Estimate was independently reviewed and verified by Dr Andrew Fowler MAusIMM CP
(Geo), a full time employee of Mining Plus. Dr Fowler fulfils the requirements to be a "Qualified Person" for the purposes of NI 43-101, and is the Qualified Person under NI 43-101 for the Mineral Resource Estimate.
The Measured and Indicated categories of Mineral Resources were used to update the mine
plan using predominantly a long-hole stoping mining method with cemented rock fill. A cut-
off grade of 3.8 g/t AuEq was determined from Costerfield’s 2021 production costs, and
minimum stoping width of 1.5 m were used, with planned and unplanned dilution at zero
grade for both Au and Sb. AuEq grade for Mineral Reserves is calculated using commodity
prices of $1,500/oz for Au, and $7,500/t Sb). AuEq is calculated using the formula AuEq= Au
+ (Sb x 1.06) where Sb is in % and Au is in grams per tonne.
Financial viability of Proven and Probable Mineral Reserves was demonstrated at metal prices
of $1,500/oz Au and $7,500/t Sb.
Table 1-2: Mineral Reserves at Costerfield as of December 31, 2021
Reserves Category Tonnes (kt) Au Grade
(g/t) Sb Grade (%) Cont. Au (koz) Cont. Sb (kt)
Proven Reserves
Underground 267 15.9 4.4 136 11.7
Stockpile 41 10.1 3.3 14 1.4
Probable Reserves

Mandalay Resources - Costerfield Property NI 43-101 Technical Report
D E F I N E | P L A N | O P E R A T E 7
Underground 460 10.9 1.4 162 6.5
Total Proven and
Probable 769 12.6 2.5 312 19.6
Notes:
1. Mineral Reserve estimated as of December 31, 2021, and depleted for production through to December 31, 2021. 2. Tonnes are rounded to the nearest thousand; contained gold (oz) is rounded to the nearest thousand; contained
antimony (t) rounded to nearest hundred. 3. Totals may appear different from the sum of their components due to rounding. 4. Lodes have been diluted to a minimum mining width of 1.5 m for stoping and 1.8 m for ore development. 5. A 3.8 g/t AuEq cut-off grade is applied. 6. Commodity prices applied are gold price of USD1,500/oz, antimony price of USD7,500/t and exchange rate
USD:AUD of 0.71. 7. The (AuEq) is calculated using the formula: AuEq = Au g/t + 1.06 * Sb %. 8. The Mineral Reserve is a subset, a Measured and Indicated only Schedule, of a Life of Mine Plan that includes
mining of Measured, Indicated and Inferred Resources. 9. The Mineral Reserve Estimate was prepared by Dylan Goldhahn, AusIMM under the direction of Daniel Fitzpatrick,
MAusIMM, who are both full time employees of Mandalay Resources. The Mineral Reserve estimate was independently verified by Aaron Spong FAusIMM CP (Min) who is a full-time employee of Mining Plus. Mr Spong fulfils the requirements to be a "Qualified Person" for the purposes of NI 43-101, and is the Qualified Person under NI 43-101 for the Mineral Reserve.
The net increase of 57,000 ounces of gold in Proven and Probable Mineral Reserves for 2021,
relative to 2020, consists of the addition of 113,000 ounces of gold added by Mineral Resource
conversion and addition of resources to the Youle and Shepherd ore bodies and a total of
55,000 ounces of gold depleted from the 2020 Mineral Reserves through mining production
in 2021. The 2,200 tonnes of antimony net decrease in Proven and Probable Mineral Reserves
consist of 3,600 tonnes of antimony added by Mineral Resources conversion and addition of
Mineral Resources to Youle and Shepherd and 5,800 tonnes of antimony depleted from the
2020 Mineral Reserves through mining production in 2021. The Mineral Reserves of the Youle
and Shepherd ore bodies were added at an exploration cost of $30.79 per gold equivalent
ounce.

Mandalay Resources - Costerfield Property NI 43-101 Technical Report
D E F I N E | P L A N | O P E R A T E 8
CONTENTS
1 EXECUTIVE SUMMARY ............................................................................................... 4
CONTENTS ........................................................................................................................ 8
FIGURES & TABLES .......................................................................................................... 17
2 INTRODUCTION ....................................................................................................... 26
2.1 Terms of Reference ........................................................................................... 26
2.2 Effective Date ................................................................................................... 27
2.3 Qualified Persons .............................................................................................. 27
2.4 Acknowledgements .......................................................................................... 28
3 RELIANCE ON OTHER EXPERTS ................................................................................. 29
3.1 Land and Mineral Tenure .................................................................................. 29
3.2 Marketing ......................................................................................................... 29
4 PROPERTY, DESCRIPTION AND LOCATION ................................................................ 30
4.1 Property Location ............................................................................................. 30
4.2 Land Tenure ...................................................................................................... 31
4.3 Underlying Agreements .................................................................................... 34
4.4 Environmental Liability ..................................................................................... 34
4.5 Royalty ............................................................................................................. 35
4.6 Taxes ................................................................................................................ 36
4.7 Legislation and Permitting ................................................................................ 36
5 ACCESSIBILITY,CLIMATE,LOCAL RESOURCES, INFRASTRUCTURE AND PHYSIOGRAPHY
38
5.1 Accessibility ...................................................................................................... 38
5.2 Land Use ........................................................................................................... 38
5.3 Topography ...................................................................................................... 38
5.4 Climate ............................................................................................................. 39
5.5 Infrastructure and Local Resources .................................................................... 39
5.5.1 Augusta Mine ..................................................................................................... 40
5.5.2 Brunswick Complex ............................................................................................ 41
5.5.3 Power Supply ..................................................................................................... 41
5.5.4 Brunswick Processing Plant ............................................................................... 42
5.5.5 Evaporation and Tailings Facilities ..................................................................... 42
6 HISTORY .................................................................................................................. 43

Mandalay Resources - Costerfield Property NI 43-101 Technical Report
D E F I N E | P L A N | O P E R A T E 9
6.1 Ownership and Exploration Work ..................................................................... 43
6.1.1 Mid-East Minerals (1968-1971) ......................................................................... 44
6.1.2 Metals Investment Holdings (1971) ................................................................... 44
6.1.3 Victorian Mines Department (1975-1981) ........................................................ 45
6.1.4 Federation Resources NL (1983-2000) .............................................................. 45
6.1.5 Australian Gold Development NL/Planet Resources JV (1987-1988) ................ 45
6.1.6 Australian Gold Development NL (1987-1997) .................................................. 45
6.1.7 AGD Operations Pty Ltd (2001-2009) ................................................................ 45
6.1.8 Mandalay Resources Corporation – trading as AGD (2009-2013) ..................... 49
6.1.9 Mandalay Resources Costerfield Operations Pty Ltd (2013-present) ............... 51
6.2 Historical Resource and Reserve Estimates ........................................................ 54
6.3 Historical Production ........................................................................................ 57
7 GEOLOGICAL SETTING AND MINERALISATION .......................................................... 58
7.1 Regional Geology .............................................................................................. 58
7.2 Property Geology .............................................................................................. 60
7.3 Property Stratigraphy ....................................................................................... 63
7.3.1 The Darraweit Guim Province ............................................................................ 63
7.3.2 The Costerfield Formation ................................................................................. 64
7.4 Property Structural Geology .............................................................................. 66
7.4.1 South Costerfield Area ....................................................................................... 66
7.4.2 Brunswick Area .................................................................................................. 67
7.4.3 Costerfield – Youle Area .................................................................................... 69
7.5 Property Mineralisation .................................................................................... 73
7.6 Deposit Mineralisation ...................................................................................... 75
8 DEPOSIT TYPES ........................................................................................................ 78
9 EXPLORATION.......................................................................................................... 80
9.1 Costeans/Trenching .......................................................................................... 80
9.2 Petrophysical Analysis ...................................................................................... 80
9.3 Geophysics ....................................................................................................... 81
9.3.1 Ground Geophysics ............................................................................................ 81
9.3.2 Airborne Geophysics .......................................................................................... 81
9.4 Geochemistry ................................................................................................... 82
9.4.1 Mobile Metal Ion (MMI) .................................................................................... 82

Mandalay Resources - Costerfield Property NI 43-101 Technical Report
D E F I N E | P L A N | O P E R A T E 10
9.4.2 Soil Geochemistry .............................................................................................. 82
9.4.3 Bedrock Geochemistry – Auger and Aircore Drilling ......................................... 83
9.5 Aerial Photogrammetry Survey ......................................................................... 88
9.6 Surface Mapping and 3D Geological Modelling .................................................. 88
10 DRILLING ................................................................................................................. 91
10.1 Mandalay Resources (2009 to Present).............................................................. 91
10.1.1 2009 to 2010 ...................................................................................................... 92
10.1.2 2010 to 2011 ...................................................................................................... 92
10.1.3 2011 to 2012 ...................................................................................................... 92
10.1.4 2012 to 2013 – Cuffley Lode Drilling .................................................................. 93
10.1.5 2014 – Cuffley and N Lode Drilling..................................................................... 93
10.1.6 2015 – Cuffley, N Lode, Cuffley Deeps and Sub King Cobra Drilling .................. 94
10.1.7 2016 – Cuffley Deeps, Cuffley South, M Lode, New Lode, Sub King Cobra,
Margaret and Brunswick Drilling ..................................................................................... 95
10.1.8 2017 – Brunswick, K Lode and N Lode ............................................................... 95
10.1.9 2018 – Youle and Brunswick .............................................................................. 96
10.1.10 2019 Youle and Brunswick ................................................................................. 97
10.1.11 2020 Youle, Brunswick, Minerva, Browns/Robinsons, True Blue, Damper Gully,
Costerfield Deeps, and Minerva Testing. ......................................................................... 98
10.1.12 2021 Youle Plunge, Shepherd, Brunswick, Margaret Deeps, Browns, Cuffley
Deeps, Fox Fault, Bogong. ................................................................................................ 99
10.2 Drilling Methods ............................................................................................. 104
10.3 Collar Surveys ................................................................................................. 104
10.4 Downhole Surveys .......................................................................................... 105
10.5 Data Management .......................................................................................... 105
10.6 Logging Procedures ......................................................................................... 105
10.7 Drilling Pattern and Quality ............................................................................. 106
10.7.1 Augusta ............................................................................................................ 106
10.7.2 Cuffley .............................................................................................................. 107
10.7.3 Brunswick ......................................................................................................... 107
10.7.4 Youle ................................................................................................................ 107
10.8 Interpretation of Drilling Results ..................................................................... 108
10.9 Factors that could Materially Impact the Accuracy of the Results .................... 108

Mandalay Resources - Costerfield Property NI 43-101 Technical Report
D E F I N E | P L A N | O P E R A T E 11
11 SAMPLE PREPARATION, ANALYSES AND SECURITY ................................................. 110
11.1 Sampling Techniques ...................................................................................... 110
11.1.1 Diamond Core Sampling .................................................................................. 110
11.1.2 Underground Channel sampling ...................................................................... 111
11.2 Data Spacing and Distribution ......................................................................... 112
11.3 Assaying Laboratories ..................................................................................... 113
11.4 Sample Preparation ........................................................................................ 113
11.5 Sample Analysis .............................................................................................. 115
11.5.1 Gold Analysis .................................................................................................... 115
11.5.2 Antimony Analysis ............................................................................................ 116
11.5.3 Arsenic, and Iron Analysis ................................................................................ 116
11.6 Laboratory Reviews ........................................................................................ 116
11.6.1 Umpire Check Analyses .................................................................................... 116
11.7 Assay Quality Assurance/Quality Control ........................................................ 117
11.7.2 Blanks ............................................................................................................... 132
11.7.3 Pulp Duplicates ................................................................................................ 134
11.7.4 Umpire Check Assay Program – pulp samples ................................................. 139
11.8 Sample Transport and Security ........................................................................ 149
11.9 Qualified Persons Opinion ............................................................................... 150
12 DATA VERIFICATION .............................................................................................. 151
13 MINERAL PROCESSING AND METALLURGICAL TESTING .......................................... 155
13.1 Metallurgical Testing ...................................................................................... 155
13.1.1 Metallurgical Testwork Summary .................................................................... 156
13.2 Ore Blend Effect on Throughput and Recovery Forecasts ................................. 158
13.3 Throughput ..................................................................................................... 159
13.4 Metallurgical Recovery ................................................................................... 161
13.4.1 Youle Ores ........................................................................................................ 162
13.4.2 Antimony Recovery .......................................................................................... 163
13.4.3 Gold Recovery .................................................................................................. 164
13.4.4 Circuit upgrades ............................................................................................... 165
14 MINERAL RESOURCE ESTIMATES ............................................................................ 166
14.1 Diamond Drill Hole and Underground Face Sample Statistics ........................... 167
14.2 Geological Interpretation and Domaining ........................................................ 173
14.3 Grade Capping ................................................................................................ 174

Mandalay Resources - Costerfield Property NI 43-101 Technical Report
D E F I N E | P L A N | O P E R A T E 12
14.4 Estimation Domain Boundaries ....................................................................... 183
14.5 Vein Orientation Domains ............................................................................... 184
14.6 Bulk Density Determinations ........................................................................... 189
14.6.1 Mineralised Material ........................................................................................ 190
14.6.2 Unmineralised Material ................................................................................... 194
14.6.3 Bulk Density Discussion.................................................................................... 196
14.7 Variography .................................................................................................... 196
14.8 Search and Estimation Parameters .................................................................. 205
14.9 Block Model Definitions .................................................................................. 210
14.10 Block Model Validation ................................................................................... 211
14.11 Mineral Resource Classification ....................................................................... 217
14.12 Mineral Resources .......................................................................................... 218
14.13 Comparison to 2020 Mineral Resource ............................................................ 223
14.14 Reasonable Prospects of Eventual Economic Extraction ................................... 224
14.15 Reconciliation ................................................................................................. 225
14.15.1 Review of 2020 Resource Models .................................................................... 231
14.15.2 Performance of 2021 Resource Models .......................................................... 232
14.15.3 Reconciliation Discussion ................................................................................. 233
14.16 Other Material Factors .................................................................................... 234
15 MINERAL RESERVE ESTIMATES ............................................................................... 235
15.1 Modifying Factors ........................................................................................... 236
15.1.1 Mining Dilution ................................................................................................ 236
15.1.2 Mining Recovery .............................................................................................. 237
15.2 Cut-off Grade .................................................................................................. 238
15.3 Mine Design and Planning Process .................................................................. 239
16 MINING METHODS ................................................................................................ 241
16.1 Geotechnical ................................................................................................... 247
16.1.1 Rock Properties ................................................................................................ 247
16.1.2 Mine Design Parameters .................................................................................. 250
16.1.3 Ground Support ............................................................................................... 253
16.2 Mine Design.................................................................................................... 254
16.2.1 Method Selection ............................................................................................. 254
16.2.2 Method Description ......................................................................................... 254
16.2.3 Materials Handling ........................................................................................... 257
16.3 Mine Design Guidelines .................................................................................. 258

Mandalay Resources - Costerfield Property NI 43-101 Technical Report
D E F I N E | P L A N | O P E R A T E 13
16.3.1 Level Development .......................................................................................... 258
16.3.2 Vertical Development ...................................................................................... 258
16.3.3 Stoping ............................................................................................................. 258
16.3.4 Mine Design Inventory ..................................................................................... 259
16.4 Ventilation ...................................................................................................... 260
16.4.1 Primary Ventilation Circuit – Augusta/Cuffley ................................................. 260
16.4.2 Primary Ventilation Circuit – Brunswick/Youle ................................................ 262
16.4.3 Primary Ventilation Rises and Fans.................................................................. 264
16.4.4 Secondary Ventilation Auxilliary Fans .............................................................. 268
16.5 Mine Services ................................................................................................. 269
16.5.1 Compressed Air ................................................................................................ 269
16.5.2 Raw Mine Water .............................................................................................. 270
16.5.3 Dewatering ....................................................................................................... 270
16.6 Backfill ............................................................................................................ 270
16.7 Mineral Reserve Schedule Assumptions .......................................................... 271
16.7.1 Equipment Requirements ................................................................................ 271
16.7.2 Personnel ......................................................................................................... 272
16.8 Schedule Summary ......................................................................................... 273
17 RECOVERY METHODS............................................................................................. 275
17.1 Brunswick Processing Plant ............................................................................. 275
17.1.1 Crushing and Screening Circuit ........................................................................ 277
17.1.2 Milling Circuit ................................................................................................... 277
17.1.3 Flotation Circuit................................................................................................ 277
17.1.4 Concentrate Thickening and Filtration ............................................................ 278
17.1.5 Tailings Circuit .................................................................................................. 278
17.1.6 Throughput ...................................................................................................... 278
17.1.7 Metallurgical Recovery .................................................................................... 279
17.2 Services .......................................................................................................... 280
17.2.1 Water ............................................................................................................... 280
17.2.2 Air ..................................................................................................................... 281
17.2.3 Power ............................................................................................................... 281
17.3 Plant Upgrades ............................................................................................... 282
17.3.1 Crushing and Screening Circuit ........................................................................ 282

Mandalay Resources - Costerfield Property NI 43-101 Technical Report
D E F I N E | P L A N | O P E R A T E 14
17.3.2 Milling Circuit ................................................................................................... 282
17.3.3 Flotation Circuit................................................................................................ 283
17.3.4 Concentrate Thickening and Filtration ............................................................ 283
17.3.5 Tailings Circuit .................................................................................................. 283
17.3.6 Reagent Mixing and Storage ............................................................................ 284
18 PROJECT INFRASTRUCTURE .................................................................................... 285
18.1 Surface Infrastructure ..................................................................................... 285
18.1.1 Augusta Mine Site ............................................................................................ 285
18.1.2 Brunswick Mine Site ......................................................................................... 286
18.1.3 Splitters Creek Evaporation Facility ................................................................. 287
18.1.4 Margarets Aquifer Recharge Borefield ............................................................ 288
18.2 Underground Infrastructure ............................................................................ 288
18.2.1 Secondary Means of Egress ............................................................................. 288
18.2.2 Refuge Chambers and Fresh Air Bases ............................................................ 289
18.2.3 Compressed Air ................................................................................................ 289
18.2.4 Ventilation System ........................................................................................... 290
18.2.5 Dewatering System .......................................................................................... 291
18.2.6 Other Underground Infrastructure .................................................................. 292
18.3 Tailings Storage .............................................................................................. 292
18.4 Power Supply .................................................................................................. 292
18.5 Water Supply .................................................................................................. 295
18.6 Water Management ........................................................................................ 295
18.7 Waste Rock Storage ........................................................................................ 296
18.8 Surface Ore and Waste Haulage ...................................................................... 296
18.9 Diesel Storage ................................................................................................. 296
18.10 Explosives Storage .......................................................................................... 296
18.11 Maintenance Facilities .................................................................................... 297
18.12 Housing and Land ........................................................................................... 297
19 MARKET STUDIES AND CONTRACTS ....................................................................... 298
19.1 Antimony........................................................................................................ 298
19.1.1 Concentrate Transport ..................................................................................... 298
19.1.2 Contracts .......................................................................................................... 298
19.1.3 Markets ............................................................................................................ 298
19.2 Gold ............................................................................................................... 302

Mandalay Resources - Costerfield Property NI 43-101 Technical Report
D E F I N E | P L A N | O P E R A T E 15
19.2.1 Markets ............................................................................................................ 302
19.2.2 Global Outlook ................................................................................................. 302
19.2.3 Resource and Reserve Pricing .......................................................................... 303
20 ENVIRONMENTAL STUDIES, PERMITTING AND SOCIAL OR COMMUNITY IMPACT ... 305
20.1 Environment and Social Aspects ...................................................................... 305
20.1.1 Mine Ventilation .............................................................................................. 305
20.1.2 Water Disposal ................................................................................................. 305
20.1.3 Waste Rock ...................................................................................................... 307
20.1.4 Tailings Disposal ............................................................................................... 307
20.1.5 Air Quality ........................................................................................................ 307
20.1.6 Groundwater .................................................................................................... 308
20.1.7 Noise ................................................................................................................ 310
20.1.8 Blasting and Vibration ...................................................................................... 310
20.1.9 Native Vegetation ............................................................................................ 310
20.1.10 Visual Amenity ................................................................................................. 311
20.1.11 Heritage ............................................................................................................ 311
20.1.12 Community ....................................................................................................... 312
20.1.13 Mine Closure and Revegetation ...................................................................... 312
20.2 Regulatory Approvals ...................................................................................... 313
20.2.1 Work Plan Variation ......................................................................................... 313
20.2.2 Other Permitting .............................................................................................. 313
21 CAPITAL AND OPERATING COSTS ........................................................................... 315
21.1 Capital Costs ................................................................................................... 315
21.1.1 Processing Plant ............................................................................................... 316
21.1.2 Administration ................................................................................................. 316
21.1.3 Environmental .................................................................................................. 316
21.1.4 Occupational Health and Safety ...................................................................... 316
21.1.5 Mining .............................................................................................................. 316
21.1.6 Capital Development ....................................................................................... 317
21.1.7 Closure ............................................................................................................. 317
21.2 Operating Costs .............................................................................................. 317
21.2.1 Lateral Development ....................................................................................... 318

Mandalay Resources - Costerfield Property NI 43-101 Technical Report
D E F I N E | P L A N | O P E R A T E 16
21.2.2 Production Stoping .......................................................................................... 319
21.2.3 Mining Administration ..................................................................................... 319
21.2.4 Geology ............................................................................................................ 319
21.2.5 ROM Haulage ................................................................................................... 320
21.3 Processing Plant .............................................................................................. 320
21.4 Site Services .................................................................................................... 320
21.5 General and Administrative ............................................................................ 320
21.6 Selling Expenses .............................................................................................. 321
22 ECONOMIC ANALYSIS ............................................................................................ 322
22.1 Principal Assumptions ..................................................................................... 322
22.1.1 Metal Sale Prices .............................................................................................. 323
22.1.2 Concentrate and Gold Sales ............................................................................. 323
22.1.3 Exchange Rate .................................................................................................. 323
22.1.4 Taxes ................................................................................................................ 323
22.1.5 Royalties/Agreements ..................................................................................... 323
22.1.6 Project Financing .............................................................................................. 324
22.2 Economic Summary ........................................................................................ 324
22.2.1 Cash Flow Forecast .......................................................................................... 324
22.2.2 NPV ................................................................................................................... 327
22.2.3 Sensitivity ......................................................................................................... 327
23 ADJACENT PROPERTIES .......................................................................................... 329
24 OTHER RELEVANT DATA AND INFORMATION ......................................................... 331
25 INTERPRETATION AND CONCLUSIONS .................................................................... 332
25.1 Geology and the Mineral Resource .................................................................. 332
25.2 Mining, Ore Reserve and the Mining Schedule ................................................ 333
25.3 Mineral Processing & Metallurgical Testwork .................................................. 334
26 RECOMMENDATIONS ............................................................................................ 335
26.1 Geology .......................................................................................................... 335
26.2 Mining ............................................................................................................ 335
26.3 Mineral Processing & Metallurgical Testwork .................................................. 336
27 REFERENCES .......................................................................................................... 337

Mandalay Resources - Costerfield Property NI 43-101 Technical Report
D E F I N E | P L A N | O P E R A T E 17
FIGURES & TABLES
Figure 4-1: Costerfield Property Location Map ....................................................................... 30
Figure 4-2: Mandalay Resources ML and EL Tenement Boundaries, displaying two EL licence
applications to the east and west of the current licences and two Retention licence
applications .............................................................................................................................. 33
Figure 5-1: Monthly average temperature and rainfall ........................................................... 39
Figure 5-2: Augusta mine site with Boxcut, Augusta Portal (foreground), Workshop, Offices
and Evaporation Dams ............................................................................................................. 40
Figure 5-3: Aerial View of the Brunswick Complex with Brunswick Portal (middle of image),
Brunswick Processing Plant, offices and tailing storage facilities. .......................................... 41
Figure 7-1: Geological map of the Bendigo - Heathcote region (Welch et al 2011) ............... 59
Figure 7-2: Geological map of the Heathcote – Colbinabbin - Nagambie region, modified from
Vandenberg et al., 2000 ........................................................................................................... 61
Figure 7-3: Regional geology and the Costerfield Property geology ....................................... 62
Figure 7-4: Regional stratigraphy of the Darraweit Guim Province, by locality ...................... 64
Figure 7-5: Stratigraphy of the Costerfield Formation, illustrating the relative positions of the
newly defined informal stratigraphic units.............................................................................. 65
Figure 7-6: Cross-section 5,880N, through the Brunswick System.......................................... 68
Figure 7-7: Cross section 7,030N through the Costerfield – Youle System ............................. 70
Figure 7-8: Cross-section 7,200N, through the Costerfield – Youle-Shepherd System ........... 72
Figure 7-9: Paragenetic history and vein genesis of the Costerfield region ............................ 74
Figure 7-10: Typical Youle vein in 837 level on cross-section 6,955N ..................................... 75
Figure 7-11: Schematic long-section and plan view of Augusta, Cuffley, Brunswick and Youle
Lodes ........................................................................................................................................ 77
Figure 9-1: Surface Topography and Mining Lease Overlaid with the Existing Geochemical
Lines and Acquired 2021 Soil Sampling Lines .......................................................................... 83
Figure 9-2: Auger Drilling Geochemistry Results for Antimony ............................................... 85
Figure 9-3: Perspective view to the northwest: Leapfrog Geo Geological Model, Regional
Geology .................................................................................................................................... 89
Figure 9-4: Perspective view to the northwest: Leapfrog Geo Geological Model, Robinsons
Prospect ................................................................................................................................... 90
Figure 10-1: Longitudinal Projection Displaying Significant Intercepts in the Youle 2021 Drilling
(BC drill holes) ........................................................................................................................ 101

Mandalay Resources - Costerfield Property NI 43-101 Technical Report
D E F I N E | P L A N | O P E R A T E 18
Figure 10-2: Longitudinal Projection of the Shepherd (600) Vein Showing Significant Intercepts
to 31 December 2021 ............................................................................................................ 102
Figure 10-3: Cross Section at 7,050N Displaying the Relationship Between the Youle and
Shepherd Zone Veins ............................................................................................................. 103
Figure 10-4: Example Cross-section of the Augusta Deposit at 4,300 mN, Post Drilling and
Geological Interpretation ....................................................................................................... 108
Figure 11-1: Analysis for gold via Fire Assay or Screen Fire Assay, illustrating a comparison of
449 pairs on a logarithmic scale ............................................................................................ 116
Figure 11-2: CRM GSB-02, umpire check assay batches, Au ................................................. 121
Figure 11-3: CRM MR-C2, umpire check assay batches, Au .................................................. 121
Figure 11-4: CRM MR-F2, umpire check assay batches, Au .................................................. 122
Figure 11-5: CRM OREAS239, umpire check assay batches, Au ............................................ 122
Figure 11-6: CRM OREAS247, umpire check assay batches, Au ............................................ 123
Figure 11-7: CRM MR11-01, umpire check assay batches, Au .............................................. 123
Figure 11-8: CRM GSB-02, umpire check assay batches, Sb .................................................. 124
Figure 11-9: CRM MR-C2, umpire check assay batches, Sb ................................................... 124
Figure 11-10: CRM MR-F2, umpire check assay batches, Sb ................................................. 125
Figure 11-11: MR11-01, umpire check assay batches, Sb, plotted against certification and the
internal statistics from routine analysis ................................................................................ 125
Figure 11-12: OREAS247, umpire check assay batches, Sb, plotted against certification and the
internal statistics from routine analysis ................................................................................ 126
Figure 11-13: GSB-02 gold standard CRM control plot.......................................................... 126
Figure 11-14: GSB-02 antimony standard CRM control plot ................................................. 127
Figure 11-15: MR11-01 gold standard CRM control plot ...................................................... 127
Figure 11-16: MR11-01 antimony standard CRM control plot, with routine analysis derived
internal statistics illustrated showing a high bias to the certification ................................... 128
Figure 11-17: MR-C2 gold standard CRM control plot .......................................................... 128
Figure 11-18: MR-C2 antimony standard CRM control plot .................................................. 129
Figure 11-19: MR-F2 gold standard CRM control plot ........................................................... 129
Figure 11-20: MR-F2 antimony standard CRM control plot .................................................. 130
Figure 11-21: OREAS239 gold standard CRM control plot .................................................... 130
Figure 11-22: OREAS gold standard CRM control plot .......................................................... 131
Figure 11-23: OREAS247 antimony standard CRM Plot with routine analysis derived internal
statistics illustrated showing a high bias to the certification ................................................ 131

Mandalay Resources - Costerfield Property NI 43-101 Technical Report
D E F I N E | P L A N | O P E R A T E 19
Figure 11-24: Gold Blank assay control plot .......................................................................... 133
Figure 11-25: Antimony Blank assay control plot .................................................................. 133
Figure 11-26: Gold quartz washes control plot ..................................................................... 134
Figure 11-27: Scatter plot of On Site gold pulp duplicates (g/t) ............................................ 136
Figure 11-28: Scatter plot of On Site antimony duplicates (%) ............................................. 137
Figure 11-29: Relative paired difference plot, gold pulp duplicates (g/t) ............................. 138
Figure 11-30: Relative paired difference plot, antimony pulp duplicates (%) ....................... 139
Figure 11-31: Relative paired difference plot, original vs umpire checks, gold (g/t) ............ 142
Figure 11-32: Scatter plot original vs umpire check duplicates, gold (g/t) ............................ 143
Figure 11-33: Relative paired difference plot, original vs umpire checks, low level gold (< 20
g/t).......................................................................................................................................... 144
Figure 11-34: Scatter plot for On Site original vs umpire checks, low level gold (< 20 g/t) .. 145
Figure 11-35: Relative pair difference plot for On Site original vs umpire checks, antimony (%)
................................................................................................................................................ 146
Figure 11-36: Scatter plot comparing On Site original vs Umpire checks for antimony (%) . 147
Figure 11-37: Relative pair difference plot for On Site original vs umpire checks, low level
antimony (< 5%) ..................................................................................................................... 148
Figure 11-38: Scatter plot for On Site original vs umpire checks, low level antimony (< 5 %)
................................................................................................................................................ 149
Figure 13-1: Youle High Grade Testwork Sample Locations .................................................. 158
Figure 13-2: Youle Low Grade Testwork Sample Locations ................................................... 158
Figure 13-3: Historic Brunswick Processing Plant Throughput – 2015 to 2021 .................... 160
Figure 13-4: Antimony and Gold Grade versus Recovery Trends – January 2015 to December
2021 ....................................................................................................................................... 162
Figure 14-1: Log Q-Q plot of Sb-Accumulation and Au-Accumulation comparisons of drill hole
data and face sample data, showing all data (500 block model). 40x40x40 cell declustering
applied ................................................................................................................................... 170
Figure 14-2: Log Q-Q plot of true-thickness comparisons of drill data and face sample data
(500 block model). Left hand side shows all data, right hand side the filtered subset as above
................................................................................................................................................ 171
Figure 14-3: Log probability plot of Au-Accumulation, drill hole data in black and face sample
data in red .............................................................................................................................. 171
Figure 14-4: Log probability plot of Sb-Accumulation, drill hole data in black and face sample
data in red .............................................................................................................................. 172
Mandalay Resources - Costerfield Property NI 43-101 Technical Report
D E F I N E | P L A N | O P E R A T E 20
Figure 14-5: Log probability plot of true thickness, drill hole data in black and face sample data
in red ...................................................................................................................................... 172
Figure 14-6: Longitudinal projection of the Youle Lode, displaying domains determined by
grade and structural controls on mineralisation ................................................................... 174
Figure 14-7: Youle Domain 2 – Grade capping statistical plots for Au-Accumulation .......... 175
Figure 14-8: Youle Domain 2 – Grade capping statistical plots for Sb-Accumulated ............ 176
Figure 14-9: Youle Domain 2 – Grade capping statistical plots for true thickness ................ 177
Figure 14-10: Example of a disintegration plot, used in data heavy Au-accumulation domains
................................................................................................................................................ 178
Figure 14-11: Shepherd-600 Lode estimation domain boundaries ....................................... 183
Figure 14-12: Suffolk-620 Lode estimation domain boundaries ........................................... 184
Figure 14-13: Shepherd 600 alpha true-thickness versus the dip-domain true thickness,
highlighting the undercall of true thickness by the more global dip-domains ..................... 185
Figure 14-14: Flow map of true thickness calculations in the resource estimation for the 600,
605, 620 Shepherd series models, illustrating the correction for drill core alpha derived true
thickness ................................................................................................................................ 186
Figure 14-15: Youle-500 Lode dip and dip-direction domains .............................................. 187
Figure 14-16: Shepherd-600 Lode dip and dip-direction domains ........................................ 188
Figure 14-17: Suffolk-620 Lode dip and dip direction domains ............................................ 189
Figure 14-18: Q-Q Plots of A) the original bulk density formula (OPRED, Equation 1) against
measured BD from the 2021 Youle and Shepherd testwork and B) Equation 2 with 2.69 gangue
constant (269) against measured BD ..................................................................................... 192
Figure 14-19: Comparison of the 2021 bulk density test work for Youle and Shepherd against
the new gangue constant in Equation 2 ................................................................................ 193
Figure 14-20: Bulk Density test work for samples below 1% antimony versus the predicted
bulk density from the linear Fe regression in equation 3 ...................................................... 194
Figure 14-21: Histogram of unmineralised rock bulk density values at Youle-Shepherd ..... 195
Figure 14-22: Youle 500 domain 1 Au-Accumulation (AUACC) variograms .......................... 197
Figure 14-23: Youle 500 domain 1 Sb-Accumulation (SBACC) variograms ............................ 198
Figure 14-24: Youle 500 domain 1 true thickness (TT) variograms ....................................... 198
Figure 14-25: Shepherd 600 domain 1 Au-Accumulation (AUACC) variograms .................... 199
Figure 14-26: Shepherd 600 domain 1 Sb-Accumulation (SBACC) variograms ..................... 200
Figure 14-27: Shepherd 600 domain 1 true thickness (TT) variograms ................................ 200
Figure 14-28: Youle long-section with grade domains and Au-Accumulation for intercepts
shown with the Domain 1 search ellipse for Au-Accumulation ............................................ 201

Mandalay Resources - Costerfield Property NI 43-101 Technical Report
D E F I N E | P L A N | O P E R A T E 21
Figure 14-29: Youle long-section with grade domains and Au-Accumulation for intercepts
shown with the Domain 1 search ellipse for Au-Accumulation ............................................ 201
Figure 14-30: Youle 500 global Au-Accumulation swathe plot by Northing and Elevation .. 214
Figure 14-31: Youle 500 Global Sb-Accumulation swathe plot by Northing and Elevation .. 215
Figure 14-32: Youle 500 Global True Thickness swathe plot by Northing and Elevation ...... 215
Figure 14-33: Shepherd 600 Global Au-Accumulation swathe plot by Northing and Elevation
................................................................................................................................................ 216
Figure 14-34: Shepherd 600 Global Sb-Accumulation swathe plot by Northing and Elevation
................................................................................................................................................ 216
Figure 14-35: Shepherd 600 Global True Thickness swathe plot by Northing and Elevation
................................................................................................................................................ 217
Figure 14-36: Youle 500 Block Model showing model grade in gold equivalent g/t diluted to
resource width of 1.2 metres ................................................................................................ 220
Figure 14-37: Youle 500 Block Model with Resource Category Boundaries ......................... 220
Figure 14-38: Shepherd 600 Block Model showing model grade in gold equivalent g/t diluted
to resource width of 1.2 metres ............................................................................................ 221
Figure 14-39: Shepherd 600 Block Model with Resource Category Boundaries – note that blue
is unclassified and not reported ............................................................................................ 221
Figure 14-40: Comparison between 2020 and 2021 Mineral Resource Estimates ............... 224
Figure 14-41: Costerfield Property stockpile inventory – 2020 to 2021 ............................... 227
Figure 14-42: Reconciliation of the 2020 and 2021 Mineral Resource versus 2021 mine
production – tonnes ............................................................................................................... 229
Figure 14-43: Reconciliation of the 2020 and 2021 Mineral Resource versus 2021 mine
production – gold ounces ...................................................................................................... 229
Figure 14-44: Reconciliation of the 2020 and 2021 Mineral Resource versus 2021 mine
production – antimony tonnes .............................................................................................. 230
Figure 14-45: Reconciliation of the 2020 and 2021 Mineral Resource versus 2021 mine
production – gold grade ......................................................................................................... 230
Figure 14-46: Reconciliation of the 2020 and 2021 Mineral Resource versus 2021 mine
production – antimony grade ................................................................................................ 231
Figure 16-1: Long-section of the as-built and Mineral Reserve des–gns - Augusta, Cuffley,
Brunswick and Youle .............................................................................................................. 243
Figure 16-2: Long-section of Cuffley & Augusta Mineral Reserve mine design (Red - planned
development, green - production, grey – depleted workings).............................................. 244

Mandalay Resources - Costerfield Property NI 43-101 Technical Report
D E F I N E | P L A N | O P E R A T E 22
Figure 16-3: Long-section of Brunswick Mineral Reserve mine design (Red - planned operating
development, green – planned stoping, grey – as built) ....................................................... 245
Figure 16-4: Long-section of proposed Youle mine design on Youle and Shepherd lodes (Blue
– planned capital development, red-planned operating development, green – planned Youle
stoping, yellow – planned Shepherd stoping and grey – as built) ......................................... 246
Figure 16-5: Cross-section of the Augusta, Cuffley and Brunswick systems ......................... 248
Figure 16-7: Long-hole CRF stoping method (Source: Potvin, Thomas, Fourie, 2005) .......... 257
Figure 16-8: Augusta primary ventilation circuit ................................................................... 261
Figure 16-9: Cuffley primary ventilation circuit ..................................................................... 262
Figure 16-10: Brunswick primary ventilation circuit .............................................................. 263
Figure 16-11: Youle primary ventilation circuit ..................................................................... 264
Figure 16-12: Standard secondary ventilation installation for Youle level access ................ 269
Figure 17-1: Brunswick Processing Plant Summary Flowsheet ............................................. 276
Figure 17-2: Plant Gold Recovery Improvement with Changing Feed Source from Brunswick to
Youle – 2018 to 2021 ............................................................................................................. 280
Figure 18-1: August Mine Site – aerial view .......................................................................... 286
Figure 18-2: Brunswick Mine Site – aerial view ..................................................................... 287
Figure 18-3: Costerfield Power Reticulation Diagram ........................................................... 294
Figure 19-1: Largest Antimony Producers (Roskill, 2020)...................................................... 299
Figure 19-2: Metallurgical versus Non-Metallurgical Consumption of Antimony (Roskill, 2020)
................................................................................................................................................ 300
Figure 19-3: Consumption of Antimony in Non-Metallurgical Applications (Roskill, 2020) .. 300
Figure 19-4: Antimony Price Low monthly average over 5 years [Source: Fastmarkets Metals
Bulletin ................................................................................................................................... 301
Figure 19-5: Antimony Price Low actual price over 1 year [Source: Fastmarkets Metals Bulletin
................................................................................................................................................ 302
Figure 19-6: Gold Price AM monthly average over 5 years [Source: www.transamine.com]
................................................................................................................................................ 303
Figure 19-7: Gold Price AM actual price over 1 year [Source: www.transamine.com]......... 303
Figure 20-1: Groundwater elevation contour map of the areas surrounding the Augusta Mine,
as at December 2021 ............................................................................................................. 309
Figure 22-1: Sensitivity analysis ............................................................................................. 328
Figure 23-1: Augusta Mine adjacent properties (Geovic, 2022)............................................ 329

Mandalay Resources - Costerfield Property NI 43-101 Technical Report
D E F I N E | P L A N | O P E R A T E 23
Table 1-1: Mineral Resources at Costerfield, Inclusive of Mineral Reserves as of December 31,
2021 ........................................................................................................................................... 5
Table 1-2: Mineral Reserves at Costerfield as of December 31, 2021 ...................................... 6
Table 4-1: Property Tenement Package Details....................................................................... 31
Table 4-2: Total Rehabilitation Bond Liability Calculations, 2018 ........................................... 35
Table 4-3: Total Rehabilitation Bond Liability Self-Assessment, 2021 .................................... 35
Table 6-1: Historical Drilling Statistics for the Costerfield Property ........................................ 43
Table 6-2: Historical Mineral Resources – Costerfield Property .............................................. 55
Table 6-3: Historical Mineral Reserves – Costerfield Property ................................................ 55
Table 6-4: Costerfield Property Mining Production History .................................................... 57
Table 7-1: Individual Lodes at the Costerfield Property separated by deposit ....................... 76
Table 10-1: Drill Hole Summary ............................................................................................... 91
Table 11-1: Summary of Sample Weights in the 2021 MRE for the re-estimated 2021 Models
................................................................................................................................................ 110
Table 11-2: Statistics for percentage passing a 75µm grind size; target is 90% .................... 114
Table 11-3: Certified Reference Materials and certified assay methods .............................. 118
Table 11-4: Results for CRMs submitted to participating labs for umpire checks ................ 120
Table 11-5: Pulp duplicate gold statistics .............................................................................. 134
Table 11-6: Pulp duplicate antimony statistics ...................................................................... 135
Table 11-7: Gold: Summary of On Site original, On Site duplicate, ALS, and BV umpire check
statistics ................................................................................................................................. 140
Table 11-8: Low-level gold (< 20 g/t): Summary of On Site original, On Site duplicate, ALS, and
BV, umpire check statistics .................................................................................................... 140
Table 11-9: Antimony: Summary of On Site original vs On Site duplicate, ALS, BV, umpire check
statistics ................................................................................................................................. 140
Table 11-10: Low-level (< 5 %) antimony: Summary of On Site original vs On Site duplicate,
ALS, BV, umpire check statistics ............................................................................................ 141
Table 12-1: Bulk density test results ...................................................................................... 154
Table 13-1: Historic Metallurgical Testwork .......................................................................... 157
Table 14-1: List of changes made to lodes at year-end 2021 ................................................ 166
Table 14-2: Raw face and diamond drilling sample statistics; uncapped .............................. 168
Table 14-3: Number of grade domains used in 2021 resource models ................................ 173
Table 14-4: Youle estimation domains and geological context ............................................. 174
Table 14-5: Sample statistics for the 2021 models, before and after grade caps ................. 179

Mandalay Resources - Costerfield Property NI 43-101 Technical Report
D E F I N E | P L A N | O P E R A T E 24
Table 14-6: Youle-500 Lode dip domains – dip and dip direction ......................................... 187
Table 14-7: Shepherd-600 Lode dip domains – dip and dip direction .................................. 188
Table 14-8: Suffolk-620 Lode dip domains – dip and dip direction ....................................... 189
Table 14-9: Descriptive statistics of semi-dry versus oven-dry bulk density determination in
lode material .......................................................................................................................... 190
Table 14-10: Summary of the 3 derivations of the bulk density formula in use for the mineral
resource estimate .................................................................................................................. 190
Table 14-11: Descriptive statistics of bulk density in waste material, Augusta, Brunswick,
Cuffley .................................................................................................................................... 194
Table 14-12: Descriptive statistics of bulk density in waste material, Youle-Shepherd ........ 195
Table 14-13: Case study on the effect of bulk density changes on Youle 500 model, pre-
depletion ................................................................................................................................ 196
Table 14-14: Youle 500 variogram model parameters .......................................................... 203
Table 14-15: Shepherd 600 variogram model parameters ................................................... 204
Table 14-16: Youle block model search parameters ............................................................. 207
Table 14-17: Shepherd 600 block model search parameters ................................................ 209
Table 14-18: Block model dimensions ................................................................................... 210
Table 14-19: Global validation of Youle 500 block model by domain against composites and
polygonally declustered composites ..................................................................................... 212
Table 14-20: Global validation of Shepherd 600 block model by domain against composites
and polygonally declustered composites .............................................................................. 213
Table 14-21: Mineral Resources at the Costerfield Property, inclusive of Mineral Reserves, as
at 31 December 2021 ............................................................................................................. 219
Table 14-22: Summary of in-situ Augusta, Cuffley, Brunswick, Youle and Shepherd Mineral
Resources, inclusive of Mineral Reserves .............................................................................. 222
Table 14-23: Trucked payload wet and calculated dry weights ............................................ 226
Table 14-24: ROM tonnes and Brunswick Processing Plant production – year ended 31
December 2021 ...................................................................................................................... 227
Table 14-25: Parameters used for average mining width estimation ................................... 228
Table 14-26: Tonnage Reconciliation of 2020 Mineral Resource versus 2021 mine production
................................................................................................................................................ 231
Table 14-27: Metal Reconciliation of 2020 Mineral Resource versus 2021 mine production
................................................................................................................................................ 231
Table 14-28: Grade Reconciliation of 2020 Mineral Resource versus 2021 mine production
................................................................................................................................................ 232

Mandalay Resources - Costerfield Property NI 43-101 Technical Report
D E F I N E | P L A N | O P E R A T E 25
Table 14-29: 2020 Resource Models breakdown by resource category for the 2021 production
................................................................................................................................................ 232
Table 14-30: Tonne Reconciliation of 2021 Mineral Resource versus 2021 mine production
................................................................................................................................................ 233
Table 14-31: Metal Reconciliation of 2021 Mineral Resource versus 2021 mine production
................................................................................................................................................ 233
Table 14-32: Grade Reconciliation of 2021 Mineral Resource versus 2021 mine production
................................................................................................................................................ 233
Table 15-1: Mineral Reserve at the Costerfield Property, as at December 31, 2021............ 235
Table 15-2: Costerfield Property mine recovery and dilution assumptions .......................... 236
Table 15-3: Mineral Reserve cut-off grade variables and cut-off grades .............................. 238
Table 16-1: Mineral Reserve inventory by lode ..................................................................... 259
Table 16-2: Primary ventilation fan details ............................................................................ 265
Table 16-3: Primary ventilation records, January 2022 survey ............................................. 267
Table 16-4: Schedule assumptions ........................................................................................ 271
Table 16-5: Underground mobile equipment fleet ............................................................... 272
Table 16-6: Summary of schedule physicals .......................................................................... 273
Table 18-1: Current Augusta Licence Maximum Quantities and Types of Explosives ........... 297
Table 19-1: Gold and Antimony prices used for Resource and Reserve ............................... 304
Table 20-1: Rainfall Measurements from 2013 to 2021 ........................................................ 305
Table 20-2: Permit requirements ........................................................................................... 313
Table 21-1: Costerfield Operation – capital cost estimate .................................................... 315
Table 21-2: Costerfield Property Operating cost inputs ........................................................ 318
Table 21-3: Summary of lateral development requirements ................................................ 318
Table 22-1: Project criteria .................................................................................................... 322
Table 22-2: Project economics ............................................................................................... 324
Table 22-3: Estimated pre-tax cash flow summary ............................................................... 325
Table 22-4: Project NPV sensitivity summary ........................................................................ 327
Table 23-1: Ownership details – Augusta Mine adjacent properties .................................... 330

Mandalay Resources - Costerfield Property NI 43-101 Technical Report
D E F I N E | P L A N | O P E R A T E 26
2 INTRODUCTION
Mining Plus Pty Ltd (Mining Plus) has overseen the preparation of this Costerfield Property
Technical Report. The report demonstrates the viability of continued mining and processing
operations at the Property and was largely compiled by Mandalay Resources personnel.
The Costerfield Property is located within the Costerfield mining district, approximately 10 km
northeast of the town of Heathcote, Victoria. The Property’s Augusta Mine has been
operational since 2006 and has been the sole ore source for the Brunswick Processing Plant,
with multiple zones, Augusta (from 2006), Cuffley (from 2013), Brunswick (from 2018), Youle
(from 2019), and Shepherd (from 2021), constituting ore sources. The drilling and mining of
the Youle and Shepherd Deposits has extended the current mine life of the Costerfield
Operation, with mining of the Youle Deposit commencing in 2019.
The Costerfield Property mining and processing facilities are contained within Mining Lease
MIN4644 and comprise the following:
• An underground mine with production from the Youle and Shepherd Lodes,
• A conventional flotation processing plant (Brunswick Processing Plant) with a current
capacity of approximately 150,000 t/year of feed,
• Mine and mill infrastructure including office buildings, workshops, core shed and
equipment.
Mandalay Resources is a publicly listed company trading on the Toronto Stock Exchange (TSX)
under the symbol MND, with the head office at 76 Richmond Street East, Suite 330, Toronto,
Ontario, Canada M5C 1P1. On 1 December 2009, Mandalay Resources completed the
acquisition of AGD Mining Pty Ltd (AGD) from Cambrian Mining Limited (Cambrian), a wholly-
owned subsidiary of Western Canadian Coal Corporation (WCC), resulting in AGD becoming a
wholly-owned subsidiary of Mandalay Resources.
2.1 Terms of Reference
Mining Plus was commissioned by Mandalay Resources to provide Qualified Persons (QPs) to
undertake personal inspections of the Property, complete detailed reviews of the work
completed by Mandalay personnel and take QP responsibility for the 2021 Technical Report
and any associated public disclosure. Mining Plus QPs have independently reviewed the work
completed by Mandalay Resources and take responsibility for all sections of this Technical
Report, with some reliance placed on external experts to the extent permitted under the
Canadian National Instrument 43-101 (NI 43-101).

Mandalay Resources - Costerfield Property NI 43-101 Technical Report
D E F I N E | P L A N | O P E R A T E 27
The Mineral Resource and Mineral Reserve Statement reported herein was prepared in
accordance with the Canadian Institute of Mining, Metallurgy and Petroleum (CIM)
“Definition Standards” (CIM, 2014), “Mineral Exploration Best Practice Guidelines” (CIM,
2018) and “Estimation of Mineral Resource and Mineral Reserves Best Practice Guidelines”
(CIM, 2019).
This Technical Report has been prepared in accordance with NI43-101 and Form 43-101 F1.
The Technical Report was assembled in Melbourne and Perth during the months of January
to March 2022.
2.2 Effective Date
This report is dated 25th March 2022 and has an effective date of 31 December 2021.
This date coincides with the following:
• Depletion due to mining up to 31 December 2021,
• Survey of stockpiled ore that was mined and awaiting processing as of 31 December
2021.
All relevant diamond drill hole and underground face samples in the Costerfield Property,
available as of 6 December 2021 for the Augusta, Cuffley, Brunswick, and Youle Deposits, and
as of 17 December 2021 for the Shepherd Deposit, were used to inform the Mineral Resource
Estimate.
2.3 Qualified Persons
Dr Andrew Fowler: Mining Plus Principal Geologist, PhD, MAusIMM CP (Geol), reviewed all
aspects of the construction of the geological models and the estimation of the Mineral
Resource. He conducted a personal inspection of the Property in December 2020. He is
independent of Mandalay Resources, however has had prior involvement with the Property
during 2006-2008 when he was employed by AGD Operations Pty Ltd. By virtue of his
education, membership to a recognised professional association and relevant work
experience is an independent QP as defined by NI 43-101.
Aaron Spong: Mining Plus Principal Mining Engineer, BEng, FAusIMM CP (Mining), reviewed
all aspects of the estimation of the Mineral Reserve and associated information. He
conducted a personal inspection of the Property in February 2022. By virtue of his education,
membership to a recognised professional association and relevant work experience is an
independent QP as defined by NI 43-101.
Simon Walsh: Mining Plus Associate Principal Metallurgist, BSc (Extractive Metallurgy &
Chemistry), MBA Hons, MAusIMM CP (Met), GAICD undertook a review of the mineral

Mandalay Resources - Costerfield Property NI 43-101 Technical Report
D E F I N E | P L A N | O P E R A T E 28
processing and metallurgical testing, recovery methods and infrastructure aspects of the
project. He conducted a personal inspection of the Property in September 2015. By virtue of
his education, membership to a recognised professional association and relevant work
experience is an independent QP as defined by NI 43-101.
Richard Buerger: Formerly Mining Plus Principal Geologist, MAIG (6031), reviewed all aspects
of the geological data collection and storage. He conducted a personal inspection of the
Property in September 2021. He is independent of Mandalay Resources. By virtue of his
education, membership to a recognised professional association and relevant work
experience is an independent QP as defined by NI 43-101.
Internal Mining Plus peer review has been completed by Andrew Goode, Principal Geologist
and Gabby Kirk, Geology Manager for Mining Plus.
2.4 Acknowledgements
Mining Plus would like to acknowledge the support and collaboration provided by Mandalay
Resources personnel during the completion of this project. In particular, Mining Plus would
like to thank the following people:
• Chloe Cavill: Geological oversight and operational information,
• Joshua Greene: Mineral Resource estimation, and geological modelling,
• Dylan Goldhahn: Ore Reserve, scheduling, and mine design,
• Dan Fitzpatrick: Engineering and economic oversight,
• Paul Omizzolo: Mineral processing and metallurgical testwork,
• April Westcott: Geological technical report writing.

Mandalay Resources - Costerfield Property NI 43-101 Technical Report
D E F I N E | P L A N | O P E R A T E 29
3 RELIANCE ON OTHER EXPERTS
The Qualified Person has relied upon, in respect of legal and marketing aspects, the work of
the Experts listed below.
To the extent permitted under NI 43-101, the Qualified Persons disclaim responsibility for the
relevant sections of the Report.
3.1 Land and Mineral Tenure
The land and mineral tenure information detailed in this report in Section 4.2 and Section 4.7
was verified by Michael Davie Smyth of Tenement Administration Services as being in good
standing.
• Expert: Michael Davie Smyth, Tenement Administration Services,
• Report, opinion or statement relied upon: Information on mineral tenure and status,
title issues, royalty obligations, etc,
• Extent of reliance: full reliance following a review by the Qualified Person,
• Portion of Technical Report to which disclaimer applies: Section 4.
3.2 Marketing
Marketing information for this report, specifically Section 19, relies entirely on information
by Roskill Information Services Ltd. A specific marketing study was not completed for this
report.
• Roskill Information Services Ltd,
• Report, opinion, or statement relied upon: Information on marketing, concentrate
transport, and contractual arrangements,
• Extent of reliance: full reliance following a review by the Qualified Person,
• Portion of Technical Report to which disclaimer applies: Section 19.

Mandalay Resources - Costerfield Property NI 43-101 Technical Report
D E F I N E | P L A N | O P E R A T E 30
4 PROPERTY, DESCRIPTION AND LOCATION
4.1 Property Location
The Costerfield Operation (the Property) is located within the Costerfield mining district of
Central Victoria, approximately 10 km northeast of the town of Heathcote and 50 km east of
the city of Bendigo (Figure 4-1).
Figure 4-1: Costerfield Property Location Map

Mandalay Resources - Costerfield Property NI 43-101 Technical Report
D E F I N E | P L A N | O P E R A T E 31
The Property encompasses the underground Augusta Mine including the Augusta, Cuffley,
Brunswick, Youle and Shepherd Deposits; the Brunswick Processing Plant; Splitters Creek
Evaporation Facility; Brunswick and Bombay Tailings Storage Facilities (TSF) and associated
infrastructure.
The Augusta Mine (Augusta) is located at latitude of 36°52’ 27” south and longitude
144 47’ 38” east. The Cuffley Deposit is located approximately 500 m north-northwest of the
Augusta workings. The Brunswick Deposit is located approximately 1.4 km north-northwest
of the Augusta workings and 680 m north-northwest of the Cuffley Deposit. The Youle
Deposit is located north of the Augusta workings and Cuffley Deposits approximately 2.2 km
and 1.6 km respectively. The Shepherd deposit is located vertically below the Youle deposit.
The Brunswick Processing Plant is located approximately 2 km northwest of the Augusta
Mine.
The deposits are primarily accessed via the decline at Augusta. Ore haulage to the ROM takes
place through the Brunswick portal, which opened in November 2020.
4.2 Land Tenure
Tenure information for the Costerfield Property has been detailed in Table 4-1. Information
has been provided for the two Mining Licences (ML), two Exploration Licences (EL), two
Exploration Licences under application (ELA), one expired Exploration License (EXEL) and two
Retention Licences under application (RLA).
Table 4-1: Property Tenement Package Details
Licence Name Status Company Area Grant Date Expiry Date
MIN4644 Costerfield Granted AGD Operations P/L 1,219.3 ha 25/02/1986 30/06/2026
MIN5567 Splitters Creek
Granted Mandalay Resources
Costerfield Operations Pty Ltd
30.0 ha 21/02/2013 20/02/2023
EL5432 Peels Track
Granted AGD Operations P/L 2.0 graticules
23/08/2012 22/08/2022
EL5519 Antimony Creek South
Granted Mandalay Resources
Costerfield Operations Pty Ltd
4.0 graticules
28/05/2015 27/05/2023
ELA6842 Costerfield West
Under Application
Mandalay Resources
Costerfield Operations Pty Ltd
29.0 graticules
Submitted
2/10/2018
Pending
ELA6847 Costerfield East
Under Application
Mandalay Resources
Costerfield Operations Pty Ltd
35.0 graticules
Submitted
2/10/2018
Pending

Mandalay Resources - Costerfield Property NI 43-101 Technical Report
D E F I N E | P L A N | O P E R A T E 32
Licence Name Status Company Area Grant Date Expiry Date
RLA7485 Costerfield Under Application
(covers expired EL3310 area)
Mandalay Resources
Costerfield Operations Pty Ltd
3,170.4 ha Submitted 15/09/2020
Pending
RLA7492 Costerfield Under Application
(covers expired EL3310 area)
Mandalay Resources
Costerfield Operations Pty Ltd
23.3 ha Submitted 15/09/2020
Pending
NB – 1 graticule is equivalent to 1 km2
Mandalay Resources manages the Costerfield Property and holds a 100% interest in licences
MIN4644, MIN5567, EL5432, and EL5519 (Figure 4-2).
On 2 November 2018, two EL applications (ELA6847 and ELA6842) were submitted to the
Department of Jobs, Precincts and Regions (DJPR). These two licences were located to the
east and west of the existing Costerfield Operation tenement package and cover 64 km2,
(Figure 4-2).

Mandalay Resources - Costerfield Property NI 43-101 Technical Report
D E F I N E | P L A N | O P E R A T E 33
Figure 4-2: Mandalay Resources ML and EL Tenement Boundaries, displaying two EL licence applications to the east and west of the current licences and two Retention licence applications
The licence applications have undergone the Right to Negotiate process (RTN) in accordance
with the Native Title Act (NTA) to allow any potential indigenous claimant/s, if they exist, to
reach a Section 31 agreement with Mandalay Resources.
The native title requirements for the EL applications have now been determined and an
assessment has been completed in accordance with the Traditional Owners Settlement Act
2010 (TOSA). It has now been determined that the application areas lie wholly within the
Taungurung Recognition and Settlement Area.
In September 2020, Mandalay Resources indicated their intention to comply with the
standard conditions outlined in Schedule 4 of the Land Use Activity Agreement (LUAA). The
DPJR acknowledged receipt of correspondence consenting to the Schedule 4 conditions and
the DPJR is currently assessing the remaining EL applications in accordance with the Mineral
Resources Sustainable Development (MRSD) Act, 1990. As it stands currently, a recent
decision of the Native Title Registrar not to register the Indigenous Land Use Agreement
(ILUA) has held up the approval process. Government department Earth Resources Regulation
(ERR) is currently waiting on the advice from the Department of Justice on what options are
available for Taungurung in regard to the implications of the deregistration.

Mandalay Resources - Costerfield Property NI 43-101 Technical Report
D E F I N E | P L A N | O P E R A T E 34
On 17 September 2020, tenement EL3310 expired and on 15 September 2020, Retention
Licence applications (RLA7485 of 3,170.4 ha and RLA7492 of 23.3 ha, Figure 4-2) were lodged
in order to retain the licence area, except for an area of National Park that will be excised on
any granting of the new licence. As of December 2021, the Retention licence applications
remained pending approval from ERR. As part of the Retention licence application, Mandalay
Resources applied for a s16A of the MRSDA (Mineral Resources Sustainable Development Act
1990) to allow work to continue until such time that the Retention Licence application has
been determined.
4.3 Underlying Agreements
The sustainable and responsible development of Mineral Resources in Victoria is regulated by
the State Government of Victoria through the MRSD Act, 1990, administered by the DJPR
(formally the DEDJPR), and requires that negotiation of access and/or compensation
agreements with landowners affected by the work plans is undertaken between the mining
licence applicant and the relevant landowner prior to an ML being granted or renewed.
In accordance with this obligation, Mandalay Resources has compensation agreements in
place for land allotments owned by third party landowners that are situated within the
boundaries of the ML MIN4644.
Mandalay Resources owns the land that contains the ML MIN5567 and as such no
compensation agreements are required, nor are they in place.
4.4 Environmental Liability
In October 2018 a bond review was completed, and the value of the rehabilitation policy
increased by AUD$224,000 to a total of AUD$4,079,000 for both ML’s MIN4644 and MIN5567.
The total bond of AUD$4,079,000 has been fully funded.
There are additional bonds of AUD$10,000 each that comprise three held by the DJPR for EL
licences EL3310, EL5519 and EL5432, and one by Vic Roads for licences where pipelines cross
roads.
The rehabilitation bond for MIN5567 which holds the Splitters Creek Evaporation Facility was
calculated in October 2018 and an amount of AUD$748,000 has been set aside.
The total bond for tenement MIN4464 which incorporates the Augusta mine site and
Brunswick Processing Plant was estimated to be AUD$3.331 M. This bond has increased
during the latest bond review due to the addition of the Brunswick vent shaft in 2018.
Rehabilitation is being undertaken progressively at the Costerfield Operation, with the
environmental bond only being reduced when rehabilitation of an area or site has been
deemed successful by the DJPR. This rehabilitation bond is based on the assumption that all

Mandalay Resources - Costerfield Property NI 43-101 Technical Report
D E F I N E | P L A N | O P E R A T E 35
rehabilitation is undertaken by an independent third party. Therefore, various project
management and equipment mobilisation costs are incorporated into the rehabilitation bond
liability calculation. In practice, rehabilitation costs may be less if Mandalay Resources choose
to utilise internal resources to complete the rehabilitation.
Other than the rehabilitation bond, the project is not subject to any other environmental
liabilities. Table 4-2 presents the breakdown of the liability costs from the recent bond
review.
Table 4-2: Total Rehabilitation Bond Liability Calculations, 2018
Area AUD$
Total Rehabilitation Liability – Augusta Mine Site (MIN4644) $1,419,000
Total Rehabilitation Liability – Brunswick Process Plant site (MIN4644) $1,912,000
Total Rehabilitation Liability – Splitters Creek Evaporation Facility (MIN5567) $748,000
Total Rehabilitation Liability – Costerfield Operations $4,079,000
During 2021 Mandalay Resources was requested by the DJPR to complete a self-assessment
of the rehabilitation bond using updated rates for activities provided by the regulator. Table
4-3 presents the breakdown of the liability costs from the self-assessment. This self-
assessment of rehabilitation bonds remains to be accepted by the regulator.
Table 4-3: Total Rehabilitation Bond Liability Self-Assessment, 2021
Area AUD$
Total Rehabilitation Liability – Augusta Mine Site (MIN4644) $1,750,000
Total Rehabilitation Liability – Brunswick Process Plant site (MIN4644) $2,563,000
Total Rehabilitation Liability – Splitters Creek Evaporation Facility (MIN5567) $942,000
Total Rehabilitation Liability – Costerfield Operations $5,255,000
4.5 Royalty
Royalties apply to the production of antimony and gold and are payable to the Victorian State
Government through the DJPR. The royalty applies at a rate of 2.75% on the revenue realised
from the sale of antimony and gold produced, less the selling costs. A royalty exemption
applies on the first 2,500 oz of gold produced each year.
There are no royalty agreements in place with previous owners.

Mandalay Resources - Costerfield Property NI 43-101 Technical Report
D E F I N E | P L A N | O P E R A T E 36
Additional royalties are payable to the Victorian State Government through the DJPR at a rate
of AUD$0.87/t if waste rock or tailings is sold or provided to any third parties, since they are
deemed to be quarry products.
4.6 Taxes
Mandalay Resources reports that, as at December 2021, no tax loss has been carried forward.
Income Tax on Australian company profits is currently set at 30%.
4.7 Legislation and Permitting
Mandalay Resources operates under an approved Work Plan in accordance with Section 39
of the MRSD Act, 1990. Work Plan Variations (WPVs) are required when there are significant
changes from the Work Plan and it is deemed that the works will have a material impact on
the environment and/or community. Various WPVs have been approved by the DJPR and are
registered against the licence.
Mining lease MIN4644 includes a series of specific conditions that must be met which become
the controlling conditions upon which all associated WPVs are filed with the regulatory
authority.
Apart from the primary mining legislation, which consists of the MRSD Act, 1990, operations
on MIN4644 remain subject to the additional following legislation and regulations, for which
all appropriate permits and approvals have been obtained.
Legislation:
• Environment Protection Act 1970
• Planning and Environment Act 1987
• Environmental Protection and Biodiversity Conservation Act 1999
• Flora and Fauna Guarantee Act 1988
• Catchment and Land Protection Act 1994
• Archaeological and Aboriginal Relics Preservation Act 1972
• Heritage Act 1995
• Forest Act 1958
• Dangerous Goods Act 1985
• Drugs, Poisons and Controlled Substances Act 1981
• Public Health and Wellbeing Act 2008

Mandalay Resources - Costerfield Property NI 43-101 Technical Report
D E F I N E | P L A N | O P E R A T E 37
• Water Act 1989
• Crown Land (Reserves) Act 1978
• Radiation Act 2005
• Conservation, Forests and Lands Act 1987
• Wildlife Act 1975
Regulations:
• Dangerous Goods (Explosives) Regulations 2011
• Dangerous Goods (Storage and Handling) Regulations 2000
• Dangerous Goods (HCDG) Regulations 2005
• Drugs, Poisons and Controlled Substances (Commonwealth Standard) Regulations
2011
• Mineral Resources Development Regulations 2002
To the best of the QP’s knowledge, there is no other significant factor or risk that may affect
access, title, or the right or ability to perform work on the Property.
Mandalay Resources - Costerfield Property NI 43-101 Technical Report
D E F I N E | P L A N | O P E R A T E 38
5 ACCESSIBILITY,CLIMATE,LOCAL RESOURCES,
INFRASTRUCTURE AND PHYSIOGRAPHY
5.1 Accessibility
Access to the Costerfield Operation is via the sealed Heathcote–Nagambie Road which is
accessed off the Northern Highway to the south of Heathcote. The Northern Highway links
Central and North-Central Victoria with Melbourne.
The Augusta Mine site is accessed off the Heathcote–Nagambie Road via McNichols Lane,
which comprises a sealed/gravel road that continues for approximately 1.5 km to the Augusta
site offices.
The Brunswick Processing Plant and Brunswick Portal are located on the western side of the
Heathcote–Nagambie Road, approximately 1 km further north from the McNichols Lane
turnoff. The Brunswick site offices are accessed by a gravel road that is approximately 600 m
long.
5.2 Land Use
Land use surrounding the Costerfield Property is mainly small scale farming, consisting of
grazing on cleared land, bordered by areas of lightly timbered Box-Ironbark forest. The
majority of the undulating land and alluvial flats are privately held freehold land.
The surrounding forest is largely rocky, rugged hill country administered by the DJPR as State
Forest. The Puckapunyal Military Area is located on the eastern boundary of the Costerfield
Property.
The Augusta Mine site is located on privately held land, while the Brunswick Processing Plant
and the Brunswick Portal are located on Unrestricted Crown land.
The Cuffley Deposit, accessed via the Augusta Mine, is located beneath unrestricted Crown
land that consists of sparse woodland, with numerous abandoned shafts and workings along
the Historical Alison and New Alison mineralised zone.
The Brunswick Deposit is accessed via an incline ramp from the Cuffley mine and the Youle
and Shepherd Deposits are accessed from the Brunswick incline.
5.3 Topography
The topography of the Costerfield Property area consists of relatively flat to undulating terrain
with elevated areas to the south and west sloping down to a relatively flat plain to the north
and east.

Mandalay Resources - Costerfield Property NI 43-101 Technical Report
D E F I N E | P L A N | O P E R A T E 39
The area ranges in elevation from approximately 160 m Above Sea Level (ASL) in the east
along Wappentake Creek, to 288 m ASL in the northwest. The low-lying areas are typically
floodplains.
5.4 Climate
The climate of central Victoria is ‘Mediterranean’ in nature and consists of hot, dry summers
followed by cool and wet winters. Annual rainfall in the area is approximately 500 mm to
600 mm, with the majority occurring between April and October. The annual pan evaporation
is between 1,300 to 1,400 mm.
The temperature ranges from -2°C in winter (May to August) to +40°C in summer (November
to February). Monthly average temperature and rainfall data from Redesdale, the nearest
weather recording station to the Costerfield Property, located 39 km to the northeast, is
shown in Figure 5-1. The weather is amendable to year round mining operations; however,
occasional significant high rainfall events may restrict surface construction activity for a small
number of days.
Figure 5-1: Monthly average temperature and rainfall Source: Bureau of Meteorology
5.5 Infrastructure and Local Resources
The nearest significant population to the Costerfield Property is Bendigo, located 50 km to
the west-northwest, with a population of approximately 100,000. The Costerfield Property is

Mandalay Resources - Costerfield Property NI 43-101 Technical Report
D E F I N E | P L A N | O P E R A T E 40
a residential operation with personnel residing throughout central Victoria as well as
Melbourne. Local infrastructure and services are available in Heathcote.
5.5.1 Augusta Mine
The Augusta Mine site consists of a bunded area that includes site offices, underground
portal, workshop facilities, waste rock storage area, settling ponds, mine dam, change house
facilities and laydown area. Augusta has operated as an underground mine since the
commencement of operations in 2006. The Cuffley, Brunswick, Youle and Shepherd
operations use the infrastructure associated with the current Augusta operations (Figure 5-2).
Figure 5-2: Augusta mine site with Boxcut, Augusta Portal (foreground), Workshop, Offices and Evaporation Dams
On 28 July 2018, the first ore was extracted from the Brunswick Deposit and was accessed via
an incline ramp from the Cuffley Mine. In December 2019 the first ore was extracted from
the Youle Deposit which was accessed via capital development from the Brunswick incline.
The Shepherd Deposit is accessed from the lower Youle Decline with production of first ore
taking place in October 2021.

Mandalay Resources - Costerfield Property NI 43-101 Technical Report
D E F I N E | P L A N | O P E R A T E 41
5.5.2 Brunswick Complex
The Brunswick Complex consists of the Brunswick Processing Plant, Run-of-Mine (ROM) pad,
underground portal, site offices, tailing storage facilities, and the Brunswick Open Pit as
shown in Figure 5-3.
Figure 5-3: Aerial View of the Brunswick Complex with Brunswick Portal (middle of image), Brunswick Processing Plant, offices and tailing storage facilities.
5.5.3 Power Supply
The Costerfield Property has a current agreement with Powercor for 3.227 mVA at a power
factor of not less than 0.95 from Substation 1, the only high voltage supply point, located at
the Augusta mine. The entire power requirement is supplied via this location, including the
underground operations and the Brunswick Processing Plant. The site also has 750 kVAR to
assist with power factor correction.
In addition, the Costerfield Property has just under 1 mVA of diesel power generation which
can be automatically synchronised to connect to all the infrastructure in the event the power
demand increases above the 3.277 mVA which can be provided by Powercor. During periods
of high demand on the Victorian electrical network, Mandalay Resources can manually
activate this power source to decrease the burden on the network and assist with the State’s
grid power supply.

Mandalay Resources - Costerfield Property NI 43-101 Technical Report
D E F I N E | P L A N | O P E R A T E 42
5.5.4 Brunswick Processing Plant
The Brunswick Processing Plant consists of a 150,000 tonnes per annum (tpa) gravity-flotation
gold-antimony processing plant, with additional workshop facilities, site offices, TSFs, core
shed and core farm located nearby. The plant produces an antimony-gold concentrate that
is trucked to the Port of Melbourne, 130 km to the south where it is transferred onto ships
for export to foreign smelters.
Process water for the Brunswick Processing Plant is drawn from the brine stream of the
Reverse Osmosis (RO) Plant and is supplemented by stored brine, while the Augusta Mine
re-uses groundwater that has been dewatered from the underground workings.
Potable water is trucked in from Heathcote, while grey water is stored in tanks and sewage is
captured in sewage tanks before being trucked off site by a local contractor.
5.5.5 Evaporation and Tailings Facilities
The Splitters Creek Evaporation Facility evaporates groundwater extracted from the
operations to maintain dewatering rates from the underground workings (Section 20.1.2).
The Brunswick TSF was operational between June 2015 and December 2018, and from
November 2020 to the report date. At the Bombay TSF a 2.5 m wall lift for another 140,000 m3
of storage was completed in 2018 and the TSF was operated between December 2018 and
November 2020. A feasibility study to consider an embankment raise for the Bombay facility
was in progress at the report date.

Mandalay Resources - Costerfield Property NI 43-101 Technical Report
D E F I N E | P L A N | O P E R A T E 43
6 HISTORY
Beginning with the initial discovery of the Costerfield Reef in the 1860s, until 1953, several
companies have developed and mined antimony deposits within the Costerfield Property.
Some underground diamond drilling is known to have occurred during the period 1934 to
1939, when Gold Exploration and Finance Company of Australia operated the Costerfield
Mine, however details of these drill holes are scarce and poorly recorded.
Significant exploration of the Costerfield Property using modern exploration techniques did
not occur until 1966.
6.1 Ownership and Exploration Work
This section describes the work carried out by different owners of the operation over time.
Table 6-1 provides details of the historical drilling statistics completed by each company at
the Costerfield Property since 1966.
Table 6-1: Historical Drilling Statistics for the Costerfield Property
Company Year Diamond Core
(m)
Percussion/Auger
(m)
Mid-East Minerals 1966–1971 3,676.2
Metals Investment Holdings 1971 1,760.8
Victoria Mines Department 1975–1981 3,213.0
Federation Resources NL 1983–2000 2,398.3
AGD/Planet Resources JV 1987–1988 1,349.2
AGD NL 1987–1988 1,680.8
1994–1995 1,368.5 5,536.0
1996 195.5 2,310.0
1997 725.0
AGD Operations
*NB: From 2004 drilling descriptions have
been reported in double years (ie 2004-2005)
due to the fact that reporting has been in
keeping with the Australian fiscal year (1 July
to 30 June). Please note that from 2016,
descriptions, including drilling metres for
exploration will be reported in calendar year
2001 3,361.1
2002 907.5
2003 1,522.0
2004 3,159.9
2005 4,793.4
2006–2007 4,763.4
2007–2008 2,207.2
2008–2009 2585.95
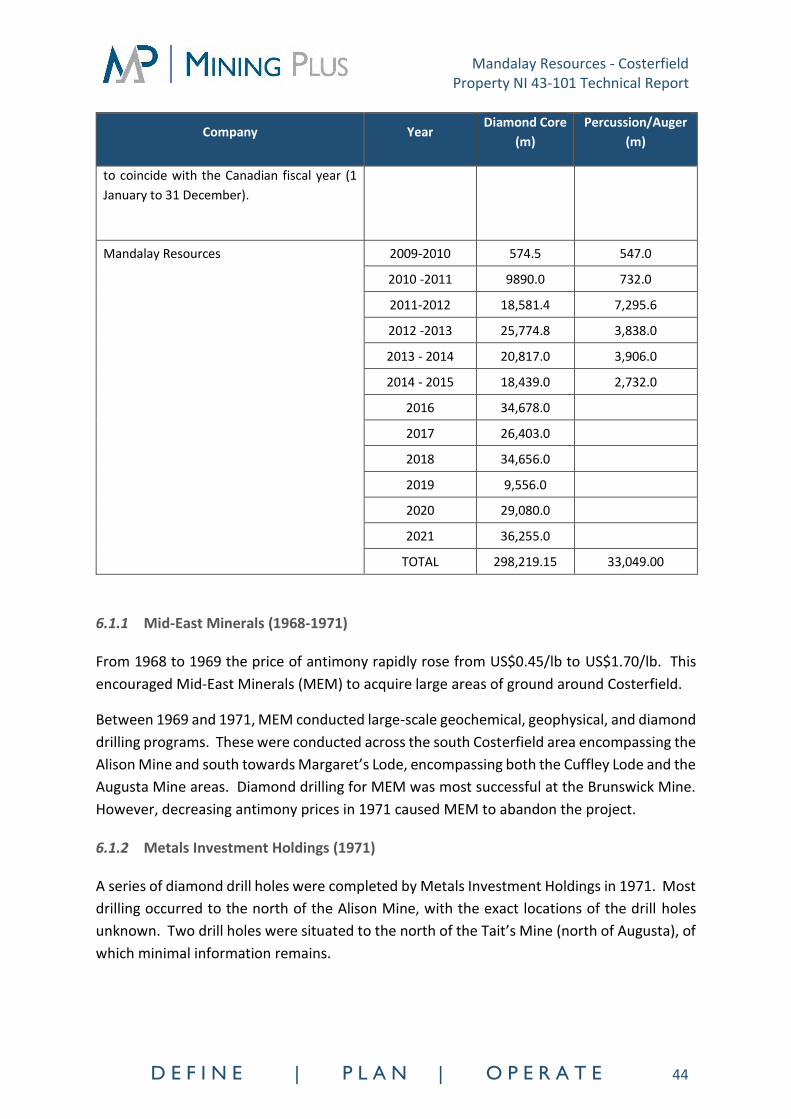
Mandalay Resources - Costerfield Property NI 43-101 Technical Report
D E F I N E | P L A N | O P E R A T E 44
Company Year Diamond Core
(m)
Percussion/Auger
(m)
to coincide with the Canadian fiscal year (1
January to 31 December).
Mandalay Resources
2009-2010 574.5 547.0
2010 -2011 9890.0 732.0
2011-2012 18,581.4 7,295.6
2012 -2013 25,774.8 3,838.0
2013 - 2014 20,817.0 3,906.0
2014 - 2015 18,439.0 2,732.0
2016 34,678.0
2017 26,403.0
2018 34,656.0
2019 9,556.0
2020 29,080.0
2021 36,255.0
TOTAL 298,219.15 33,049.00
6.1.1 Mid-East Minerals (1968-1971)
From 1968 to 1969 the price of antimony rapidly rose from US$0.45/lb to US$1.70/lb. This
encouraged Mid-East Minerals (MEM) to acquire large areas of ground around Costerfield.
Between 1969 and 1971, MEM conducted large-scale geochemical, geophysical, and diamond
drilling programs. These were conducted across the south Costerfield area encompassing the
Alison Mine and south towards Margaret’s Lode, encompassing both the Cuffley Lode and the
Augusta Mine areas. Diamond drilling for MEM was most successful at the Brunswick Mine.
However, decreasing antimony prices in 1971 caused MEM to abandon the project.
6.1.2 Metals Investment Holdings (1971)
A series of diamond drill holes were completed by Metals Investment Holdings in 1971. Most
drilling occurred to the north of the Alison Mine, with the exact locations of the drill holes
unknown. Two drill holes were situated to the north of the Tait’s Mine (north of Augusta), of
which minimal information remains.

Mandalay Resources - Costerfield Property NI 43-101 Technical Report
D E F I N E | P L A N | O P E R A T E 45
6.1.3 Victorian Mines Department (1975-1981)
A series of diamond drill holes were completed by the Victorian Mines Department in the late
1970s. Most drilling occurred to the south of the Brunswick Mine. However, two drill holes
(M31 and M32), were drilled approximately 150 m to the south of the South Costerfield Shaft
in the Augusta mine area and intersected a high-grade reef. This reef was interpreted as the
East Reef, which was mined as part of the South Costerfield Mine.
6.1.4 Federation Resources NL (1983-2000)
Federation Resources NL undertook several campaigns of exploration in the Costerfield
Property area but focused on the Browns-Robinsons prospects to the east of the Alison Mine.
The exploration conducted identified a gold target with no evidence of antimony.
Federation Resources NL conducted desktop studies on the area above the Augusta mine,
noting the anomalous results of the soil geochemistry programs conducted by The Victorian
Mines Department and Mid-East Minerals, however they did not conduct any drilling at this
location.
6.1.5 Australian Gold Development NL/Planet Resources JV (1987-1988)
Australian Gold Development NL conducted a short Reverse Circulation (RC) drilling program
in 1987, in conjunction with their JV partner Planet Resources. This drilling consisted of a
total of 21 drill holes for 1,235 m across the broader Costerfield Property area. Gold was
assayed via Atomic Absorption Spectrometry (AAS), which compromised antimony grades.
The drilling was completed using a tri-cone bit, which could have led to serious downhole
contamination.
6.1.6 Australian Gold Development NL (1987-1997)
From 1987 to 1997, Australian Gold Development NL undertook several programs of
exploration and mining activities predominantly focused around the Brunswick Mine. A series
of RC drill holes were drilled during 1997, testing for shallow oxide gold potential to the north
of the Alison Mine. Several occurrences of yellow antimony sulphides were noted but these
were not followed up.
6.1.7 AGD Operations Pty Ltd (2001-2009)
In 2001, AGD Operations Pty Ltd (formerly Australian Gold Development NL) and Deepgreen
Minerals Corporation Ltd entered into an agreement to form a joint venture to explore the
Costerfield Property tenements. The agreed starting target was the MH Zone, now known as
the Augusta Mine.

Mandalay Resources - Costerfield Property NI 43-101 Technical Report
D E F I N E | P L A N | O P E R A T E 46
6.1.7.1 2001
The AGD Operations Pty Ltd (AGD) drilling of the MH Zone commenced on 5 April 2001. In
total, 27 diamond drill holes were completed for 3,301.1 m. All drill holes were drilled with
an initial PQ or HQ collar to approximately 25 m depth and then completed using an NQ drill
bit, the purpose of which was to maximize core recoveries. Triple-tube drilling was also
employed in areas to maximize recoveries. Cobar Drilling Company Pty Ltd, based in
Rushworth, was contracted for the drilling program. Less competent rock adjacent to the
mineralisation was successfully recovered during this program however core loss was still
estimated to be up to 15% within the mineralised zones. All drill holes were downhole
surveyed and orientated during drilling. Collar locations were surveyed by Cummins &
Associates from Bendigo.
This drilling was confined to an area 180 m south of the South Costerfield Shaft and over
approximately 400 m of the strike of the mineralisation.
It was identified that due to the prolonged mining and exploration completed in the
Costerfield Property area, up to three different metric grids were in use. The drilling
undertaken in 2001 at Augusta was drilled using the mine grid established in the late 1950s,
which remains in use in present day mining and exploration activities.
6.1.7.2 2002
In 2002, AGD completed a further five drill holes at the MH Zone for a total 732.3 m, including
41.7 m of blade drilling, 309.3 m of RC hammer drilling and 381.3 m of HQ diamond drilling.
Drill hole MH034 intersected a fault zone at 55 m downhole. This is hypothesised to represent
the Alison line of lode towards the south.
Towards the east of the MH Zone, AGD completed two lines of soil sampling comprising
400.5 m of aircore drilling in 88 drill holes. The known MH lodes were highly anomalous, and
a weak, gold-only trend was outlined 180 m east of the MH Zone. This zone was drilled by
diamond drill hole MH028, which contained a large siliceous lode zone with low-grade gold
values.
To the south of the MH Zone, AGD sampled two soil lines in 42 drill holes. It was later
recognised that these drill holes were not drilled deep enough to sample the basement
siltstones. A further line of 21 soil drill holes confirmed this theory. These drill holes picked
up widespread anomalous gold geochemistry within a central strong anomaly. A total of
218 m of aircore drilling was completed.

Mandalay Resources - Costerfield Property NI 43-101 Technical Report
D E F I N E | P L A N | O P E R A T E 47
6.1.7.3 2003
In 2003, the MH Zone was renamed the Augusta Deposit. In total, 30 diamond drill holes for
1,514 m were drilled by AGD as part of an infill and extension program to the Augusta Deposit.
The main purpose of this drilling was to prove continuity of the deposit to near surface, in
preparation for open-pit mining and to extend the mineralised system both north and south.
Mineralisation was shown to extend north to the South Costerfield Shaft and upwards to the
surface. To the south, drilling confirmed that the lode system, although being present, was
not economic.
Each drill hole was logged in detail and geological lode thickness and recovered thicknesses
were recorded. Core loss was estimated to be less in this drill program when compared to
previous drilling programs, even though the majority of drill holes were drilled in the
weathered zone.
In addition to the infill and extension program, 14 RC drill holes were drilled as part of a
metallurgical test work programme. These drill holes were drilled at low angles to the lodes,
specifically designed to obtain the required sample mass for the metallurgical test work.
6.1.7.4 2004/2005
Between October 2004 and April 2005, AGD completed a 26 hole diamond program at the
Augusta Deposit. Apart from 5 m percussion pre-collars and 4 RC geotechnical drill holes, the
drill holes were all drilled by HQ triple-tube diamond drilling.
The objectives of the diamond drilling program were:
• Improvement in mineralisation definition by increasing drill hole density
• Extension of the mineralisation model by drilling around the deposit periphery
• Increasing the Mineral Resource and Mineral Reserve.
6.1.7.5 2006/2007
AGDs drilling activities throughout 2006 and 2007 comprised grid drilling of the Brunswick
Deposit and drilling of the periphery of the Augusta Deposit for a total of 7,562 m of diamond
drilling. This comprised the following drill holes:
• 31 drill holes, totalling 4,994 m, drilled under the old Brunswick open pit for resource
estimation
• 17 drill holes, totalling 755 m, drilled into the upper northern end of W Lode

Mandalay Resources - Costerfield Property NI 43-101 Technical Report
D E F I N E | P L A N | O P E R A T E 48
• 20 drill holes, totalling 1,813 m, drilled north of the Augusta Mine to test E Lode’s
northern extent.
The Brunswick Resource definition drilling was drilled using HQ triple tube with a modified
Longyear LM75 drill rig by Boart Longyear drilling. The area under the pit was drilled on a
40 m x 40 m pattern.
Due to initial difficulty with following W Lode underground, a Bobcat mounted Longyear LM30
diamond drilling rig was used to infill drill the near-surface portion of W lode. This drilling
was completed using a thin-kerf LTK60 sized bit and barrel, with a total of 17 drill holes for
755 m being drilled adjacent to the Augusta box cut.
On completion of the Brunswick and W Lode drilling, both the LM75 and the LM30 rigs were
used to drill north of the Augusta Mine, tracing the northern extent of E Lode towards the old
South Costerfield workings. A total of 20 drill holes for 1,813 m were drilled north of the
Augusta Mine.
Development of the Augusta decline commenced during the first quarter 2006. By the end
of the second quarter all the surface infrastructure had been completed together with open
cut mining of E and C lodes. Decline development commenced during June 2006 with
underground in production by the end of the third quarter of 2006.
6.1.7.6 2007/2008
AGDs drilling activities throughout 2007 and 2008 comprised reconnaissance drilling of the
Tin Pot Gully Prospect, drilling along-strike and down-dip of the existing Augusta Deposit. A
total of 3,395.6 m of diamond drilling was carried out during the year. This comprised the
following:
• 13 drill holes, totalling 1,188 m, drilled under the Tin Pot Gully Prospect
• 11 drill holes, totalling 2,207 m, drilled into the Augusta Deposit, particularly to test W
and E Lodes.
Encouraging results highlighted down-dip and strike extensions in terms of vein widths and
grades, as described below:
• W Lode: 8 of the 11 drill holes confirmed W Lode continuity down-dip, with true
thicknesses ranging from 0.254 m to 0.814 m at 22.50 g/t to 89.26 g/t gold and 16.19%
to 47.20% antimony.
• E Lode: 3 of the 8 drill holes confirmed E Lode continuity down-dip, with true thickness
ranging from 0.074 m to 0.215 m at 4.24 g/t to 35.1 g/t gold and 3.25% to 32.2%
antimony.

Mandalay Resources - Costerfield Property NI 43-101 Technical Report
D E F I N E | P L A N | O P E R A T E 49
• N Lode: 6 of the 11 drill holes intercepted N Lode or a similar structure in the hanging
wall of W lode, showing true thicknesses from 0.09 m to 0.293 m at 6.82 g/t to 46.9 g/t
gold and 6.81% to 27% antimony.
Based on these results, AGD commissioned AMC Consultants to undertake a resource
estimate for the Augusta Deposit, in January 2008.
Between February and June 2008 11 drill holes were completed, totalling 2,207.2 m that were
drilled on the northern section of the Augusta Deposit, particularly from 4,411 mN to
4,602 mN.
The 11 surface drill holes covered an area of approximately 18,740 m2, delineating a 120 m
down-dip continuation of mineralisation below 4 Level, in the three dominant Augusta Lodes:
W Lode, E Lode, and N Lode. The drill holes ranged in size from HQ to NQ and LTK46.
By June 2008, capital development had reached 7 Level (1,081 mRL). Development was
completed on E Lode on 5 Level and was half way through completion on 6 Level. W Lode
development was completed down to 4 Level and development on 5 Level was just
commencing. Handheld airleg rise mining had begun.
6.1.7.7 2008/2009
AGDs drilling activities throughout 2008 and 2009 comprised drilling along-strike and down-
dip from the existing Augusta resource. A total of 2,585.95 m of diamond drilling was
completed.
Drilling during 2008 and 2009 was concentrated on the definition of the W Lode resource.
Five drill holes tested the depth extent of W Lode. Another 13 drill holes were designed as
infill drill holes to test ore shoots and gather geotechnical data. Drill holes ranged in size from
HQ to NQ and LTK46.
By June 2009, capital development had reached 9 Level (1,070 mRL). Ore drive development
was constrained to levels along E and W Lodes. Stoping along W Lode was being conducted
and additional mining along E Lode using 3 different mining methods, floor benching, cut and
fill and long-hole stoping was underway.
6.1.8 Mandalay Resources Corporation – trading as AGD (2009-2013)
On 1 December 2009 AGD was acquired by Mandalay Resources Corporation, however the
company continued to trade as AGD Mining Pty Ltd/AGD Operations Pty Ltd up until
7 September 2013 when the company changed its trading name to Mandalay Resources
Corporation.

Mandalay Resources - Costerfield Property NI 43-101 Technical Report
D E F I N E | P L A N | O P E R A T E 50
6.1.8.1 2009/2010
Drilling from July 2009 to June 2010 comprised mainly drilling along-strike and down-dip from
the existing Augusta resource (MIN 4644). In total 332.5 m of diamond drilling was
undertaken targeting the Augusta resource.
In addition, 547 m of bedrock geochemistry aircore drilling was completed at Augusta South
within ML MIN4644.
Outside of the main field, 120.5 m of diamond drilling was completed at the True Blue Reef
prospect within EL3310 and 122.8 m of diamond drilling at Hirds Reef prospect within EL4848.
Drilling during this reporting period was concentrated on the definition of the W Lode
resource. Four drill holes tested the depth extent of W lode. Another 6 drill holes were
designed as infill drill holes to test ore shoots and gather geotechnical data.
From July 2009 to June 2010 capital development reached 1,020 mRL, 155 m below surface.
Ore drive development was carried out on E Lode and W Lode.
6.1.8.2 2010/2011
Drilling from July 2010 to June 2011 was undertaken on two projects, the Augusta Deeps
drilling project and the Brownfields Exploration project. The Augusta Deeps project was
undertaken with the view to extending the Augusta resource to depth, on licence MIN4644.
The objective of the Brownfields Exploration project was to find additional ore sources within
Mandalay Resources tenements, in order to supplement the Augusta Deposit ore. The initial
emphasis of the Brownfields Project was to identify sources of ore within 1 km of the Augusta
Decline. In total 9,890.7 m of diamond drilling and 732 m of auger drilling was undertaken as
part of the two projects from July 2010 to June 2011.
Capital development reached 976 mRL, 200 m below surface. Ore drive development was
carried out on E and W Lodes.
6.1.8.3 2011/2012
Drilling was undertaken on four projects; the Augusta Deeps drilling project, the
Alison/Cuffley drilling project, the Brownfields/Target Testing drilling project and the Target
Generation – Bedrock Geochemistry auger drilling project.
The Augusta Deeps project was undertaken with the view to extending the current Augusta
resource to depth and along-strike, on licence MIN4644. The Alison/Cuffley Project was
undertaken to outline the recently discovered Cuffley Lode and to define an initial Inferred
Resource.

Mandalay Resources - Costerfield Property NI 43-101 Technical Report
D E F I N E | P L A N | O P E R A T E 51
The objective of the Brownfields Target Exploration project remained as per 2010/2011 and
represented a more regional program.
The Bedrock Geochemistry auger drilling project revealed anomalous mineralised zones
beneath shallow alluvial/colluvial cover throughout the tenements.
In total 18,581.4 m of diamond drilling and 7,295.6 m of auger drilling was undertaken as part
of the four projects from July 2011 to June 2012. On 17 June 2011 drill hole MB007
intersected the Cuffley Lode, just below a flat fault that had stopped production at 5 Level in
the Alison mine in 1922. Resource drilling commenced in July 2011.
The Cuffley Lode is located 500 m north-northwest of the Augusta Deposit workings and
scoping studies commenced in 2011 to access the deposit from the Augusta Decline. From
July 2011 to June 2012 capital development reached 926 mRL, 252 m below surface, and ore
drive development was undertaken on E and W Lodes.
6.1.9 Mandalay Resources Costerfield Operations Pty Ltd (2013-present)
On 7 February 2013 AGD Operations Pty Ltd underwent a name change to Mandalay
Resources Costerfield Operations Pty Ltd.
6.1.9.1 2012/2013
Drilling was undertaken on two primary projects; Cuffley Resource Drilling and Augusta
Resource Drilling. In total, 25,774.8 m of diamond drilling and 3,838 m of auger drilling were
undertaken from July 2012 to June 2013.
During the same period capital development reached 878 mRL, 300 m below surface, and ore
drive development was carried out on E, W and N Lodes.
6.1.9.2 2013/2014
In 2013/2014 the focus was on finalising the Cuffley and Augusta Resource Drilling. In total,
20,817 m of diamond drilling and 3,906 m of auger drilling was undertaken.
During 2014, mining took place along the Augusta and Cuffley Deposits. Development on C1
and C2 lodes within the Cuffley Deposit began in January 2014. Both deposits were accessed
through the Augusta portal, with Cuffley capital infrastructure exiting the Augusta Decline at
the 1030 Level.
6.1.9.3 2014/2015
Exploration in 2015 was focused on extending the Cuffley and Augusta resource both along-
strike and down-dip at depth. Expansion of the Cuffley resource included the commencement

Mandalay Resources - Costerfield Property NI 43-101 Technical Report
D E F I N E | P L A N | O P E R A T E 52
of drilling in the Cuffley Deeps and Sub King Cobra regions. In total, 18,439 m of diamond
drilling and 2,732 m of RC drilling was undertaken during 2015.
Mining took place along the Augusta and Cuffley Deposits. Development on C1 and C2 lodes
within the Cuffley Deposit began in January 2014.
6.1.9.4 2016
Mining Plus notes that from 2004, drilling descriptions have been reported in double years (ie
2004-2005) due to the fact that reporting has been in keeping with the Australian fiscal year
(1 July to 30 June). However, from 2016, descriptions, including drilling metres for exploration
have been reported in calendar years to coincide with the Canadian fiscal year (1 January to
31 December).
Exploration in 2016 was focussed predominantly on near mine and opportunistic targets close
to the existing infrastructure and capital development, with the primary focus to extend the
Life of Mine (LoM). In addition, near-mine exploration was carried out on targets within 1 km
of the existing portal. In total, 34,678 m of diamond drilling was undertaken.
Throughout the year, mining took place along the Augusta and Cuffley Deposits. Within the
Augusta Deposit, ore was extracted through drive development and stoping along N Lode
north, with a small amount of development and stoping occurring on B and E Lodes.
Development and stoping continued on the Cuffley C1 and C2 lodes.
6.1.9.5 2017
Exploration in 2017 was focused predominantly on near mine and opportunistic targets close
to existing infrastructure and capital development, with the primary focus to increase
immediate mine life. A strong focus for the year was infill and extension drilling of the
Brunswick resource whilst also increasing in-mine resources through Opportunistic Drilling
Projects. A successful target testing campaign investigated the depth continuation of
mineralisation underneath the Costerfield mine. In total, 26,403 m of diamond drilling was
undertaken.
Throughout the year, mining took place along the Augusta and Cuffley Deposits. Within the
Augusta Deposit, ore was extracted through drive development and stoping along N Lode
north and NV Lode. A small amount of development and stoping occurred on B, K, and NE
Lodes. Development and stoping continued the Cuffley C1, C2 and CD Lodes.
6.1.9.6 2018
Throughout the year, the Augusta, Cuffley and Brunswick Deposits were mined, all of which
were accessed through the Augusta portal with Cuffley’s capital infrastructure exiting the
Augusta Decline at 1,030 mRL.

Mandalay Resources - Costerfield Property NI 43-101 Technical Report
D E F I N E | P L A N | O P E R A T E 53
Exploration in 2018 resulted in the inclusion of the high-grade Youle Lode into the Mineral
Reserves. A total of 94,282 oz gold and 7,000 t antimony were added to the Mineral Reserves
at grades of 11.2 g/t gold and 2.7% antimony.
Exploration also included infill and extension drilling of the Brunswick and Youle resources
while also increasing in-mine resources through Opportunistic Drilling Projects. In total,
34,656 m of diamond drilling was undertaken (Refer to Drilling, Section 10).
6.1.9.7 2019
Mining continued dominantly on the Brunswick lode, with the underground access to Youle
finished in Q4 and the first ore accessed. Infill drilling of Youle commenced with underground
access, and additional resource definition drilling occurred at Brunswick. Throughout the year
9,556 m of diamond drilling was undertaken (Refer to Drilling, Section 10).
6.1.9.8 2020
Brunswick and Youle were dominantly mined through 2020, with minor remnant material
from Augusta. The Brunswick Portal was also completed, linking underground access between
sites.
With the commencement of mining on the Youle Lode in September 2019, underground
Resource definition drilling continued at Youle, together with optimisation of production in
areas to be mined in within 6 to 12 months. Mine geology advancement was undertaken
through POD to provide confidence in grade, location of veining, geotechnical performance
and viability ahead of mining. For information about drilling programs and their
achievements, refer to Drilling, Section 10.
Capital access was to the 895 RL at Youle.
6.1.9.9 2021
Mining focus was dominantly on the Youle orebody, with minor material from Brunswick. The
Shepherd zone was discovered in early 2021 and first access achieved at the start of October
the same year. Capital access reached the 729 RL, 450m below surface and the deepest
development in the Costerfield operation.
The Shepherd Lodes was the dominant focus of exploration drilling, with the successful
delineation and conversion to an indicated resource of the orebody (refer to Section 14).
Additional information on the individual drill programs for the year is detailed in Drilling,
Section 10.
In addition to diamond drilling, a campaign of soil geochemistry was undertaken in October
and November 2021. The sampled areas include the swath of ground between the Costerfield

Mandalay Resources - Costerfield Property NI 43-101 Technical Report
D E F I N E | P L A N | O P E R A T E 54
township and Browns/Robinsons Prospects (424 samples), and extension of the 2013/14
Mountain Creek/West Costerfield auger sampling to the south and east (226 samples).
Further details on the technique and area of investigation are given in Soil Geochemistry,
Section 9.4.2 and figures within.
Soil samples were assayed in a preliminary fashion using the company’s handheld Olympus
pXRF analyser, and a subset of the total samples in areas of interest dispatched for full
laboratory assay analysis during 2022. A campaign of deep ground-penetrating radar using
Ultramag Geophysics was planned to be conducted over much of the Costerfield tenement
during the year. A pilot test conducted over known structures returned unsatisfactory results
likely due to relatively saline groundwater attenuating the return signal.
6.2 Historical Resource and Reserve Estimates
Mandalay Resources has reported Mineral Resources and Reserves for the Costerfield
Property from 2010 onwards. A record of the annual mineral resource and mineral reserves
over this period has been provided in Table 6-2 and Table 6-3.
Technical Reports for each of the historical estimates are available for download from SEDAR
by reference to their effective dates. The historical estimates are considered relevant for
historical understanding of the development of the Property. They were reliable at the time
of reporting as they followed similar processes of sampling, assaying, interpretation and
estimation as are currently in use. The historical estimates use the same resource categories
as the current estimate. The current estimate is summarised in section 1 of this Technical
Report.
A qualified person is not classifying the historical estimates as current mineral resources or
mineral reserves and the issuer is not treating the historical estimates as current mineral
resources or mineral reserves.

Mandalay Resources - Costerfield Property NI 43-101 Technical Report
D E F I N E | P L A N | O P E R A T E 55
Table 6-2: Historical Mineral Resources – Costerfield Property
Effective
Date
USD$/
oz Au
USD$/
oz Sb
Cut-off Grade
(AuEq g/t)
Measured Resource Indicated Resource Inferred Resource
Tonnes
(kt)
Au
(g/t)
Sb
(%)
Au Ounces
(koz)
Sb
Tonnes
Tonnes
(kt)
Au
(g/t)
Sb
(%)
Au Ounces
(koz)
Sb
Tonnes
Tonnes
(kt)
Au
(g/t)
Sb
(%)
Au Ounces
(koz)
Sb
Tonnes
1/03/2010 1,000 6,000
67.2 16.9 10.0 36.4 6,749 189.6 9.6 4.6 58.4 8,683 245.7 7.8 4.2 61.5 10,202
31/12/2011 1,600 12,000 4.6 158.4 12.9 7.8 65.5 12,291 202.4 7.3 3.7 47.7 7,502 375.0 12.7 5.6 152.9 21,183
31/12/2012 1,600 12,500 4.7 167.0 8.0 4.9 42.7 8,202 367.0 10.0 3.5 117.9 12,912 610.0 7.1 3.2 139.8 19,490
31/12/2013 1,400 12,000 3.9 191.4 8.4 4.3 51.5 8,157 606.0 9.6 4.0 186.4 24,237 570.0 7.4 3.7 135.3 21,342
31/12/2014 1,400 12,000 3.8 213 9.8 4.5 67 9,600 786 6.9 3.3 175 26,300 519.0 5.3 2.6 89.0 13,700
31/12/2015 1,400 11,000 3.8 247 12.1 4.6 96 11,000 798 7.6 3.4 194 27,000 491 4.3 2.0 68.0 9,700
31/12/2016 1,400 10,000 3.5 286 9.5 4 88 11,400 812 5.9 2.5 155 20,600 611 5.5 1.5 108.0 9000
31/12/2017 1,400 10,000 3.5 290 9.2 4.2 86 12,100 971 5.7 2.5 177 23,900 379 6.6 1.1 80.0 4,000
31/12/2018 1,400 10,000 3.5 245 8.5 4.0 67 9,800 1073 8.2 2.9 283 31,000 497 8.0 1.9 128 9,500
31/12/2019 1,500 10,000 3.5 283 9.6 4.5 87 12,700 830 9.6 2.9 256 24,000 533 6.8 1.7 117 9,000
31/12/2020 1,700 8,000 3.0 360 14.1 5.7 164 20,600 798 8.5 2.4 218 18,800 473 5.8 1.3 89 6,000
Table 6-3: Historical Mineral Reserves – Costerfield Property
Effective Date
USD$/ oz Au
USD$/ oz Sb
Cut-off Grade (AuEq
g/t)
Proven Reserves Probable Reserves Total Reserves
Tonnes (kt)
Au (g/t)
Sb (%)
Au Ounces (koz)
Sb Tonnes
Tonnes (kt)
Au (g/t)
Sb (%)
Au Ounces (koz)
Sb Tonnes
Tonnes (kt)
Au (g/t)
Sb (%)
Au Ounces (koz)
Sb Tonnes
1/03/2010 1,000 6,000
20.1 16.9 9.7 10.9 1,953 45.4 11.4 5.8 16.7 2,636 65.6 13.1 7.0 27.6 4,588
31/12/2011 1,600 12,000 4.6 41.9 13.2 7.9 17.7 3,300 46.5 6.4 4.0 9.6 1,860 88.4 9.6 5.8 27.3 5,160
31/12/2012 1,600 12,500 4.7 48.1 11.0 6.5 17.0 3,128 130.0 8.1 3.2 33.9 4,161 178.2 8.9 4.1 50.9 7,289
31/12/2013 1,200 10,000 5.0 71.0 8.3 4.4 18.9 3,124 350.0 9.4 3.4 106.0 11,900 421.0 9.2 3.6 124.9 15,024

Mandalay Resources - Costerfield Property NI 43-101 Technical Report
D E F I N E | P L A N | O P E R A T E 56
Effective Date
USD$/ oz Au
USD$/ oz Sb
Cut-off Grade (AuEq
g/t)
Proven Reserves Probable Reserves Total Reserves
Tonnes (kt)
Au (g/t)
Sb (%)
Au Ounces (koz)
Sb Tonnes
Tonnes (kt)
Au (g/t)
Sb (%)
Au Ounces (koz)
Sb Tonnes
Tonnes (kt)
Au (g/t)
Sb (%)
Au Ounces (koz)
Sb Tonnes
31/12/2014 1,200 10,000 5.0 98.0 10.4 4.5 32.0 4,400 333.0 7.4 3.3 80.0 11,200 431.0 8.1 3.6 112.0 15,600
31/12/2015 1,200 9,000 4.0 125 12.0 3.9 48.0 5,500 366 8.2 3.7 97.0 13,400 491 9.2 3.9 145.0 18,900
31/12/2016 1,200 8,000 4.0 184 8.1 3.5 48 6,400 434 5.7 2.6 80.0 11,100 619 6.5 2.8 128.0 17,501
31/12/2017 1,200 8,500 4.0 152 7.3 3.5 36 5,300 470 5.7 2.5 86.0 12,000 622 6.1 2.8 122.0 17,200
31/12/2018 1,200 8,500 4.0 76 8.4 4.0 20 3100 461 10.8 3.1 160.0 14,200 537 10.4 3.2 180.0 17,200
31/12/2019 1,300 7,000 4.0 114 9.5 4.8 35 5,400 360 14.6 3.4 169 12,400 474 13.4 3.8 204 17,800
31/12/2020 1,500 7,000 4.0 222 15.26 5.7 110 12,800 394 11.5 2.3 145 9,000 616 12.8 3.5 255 21,700
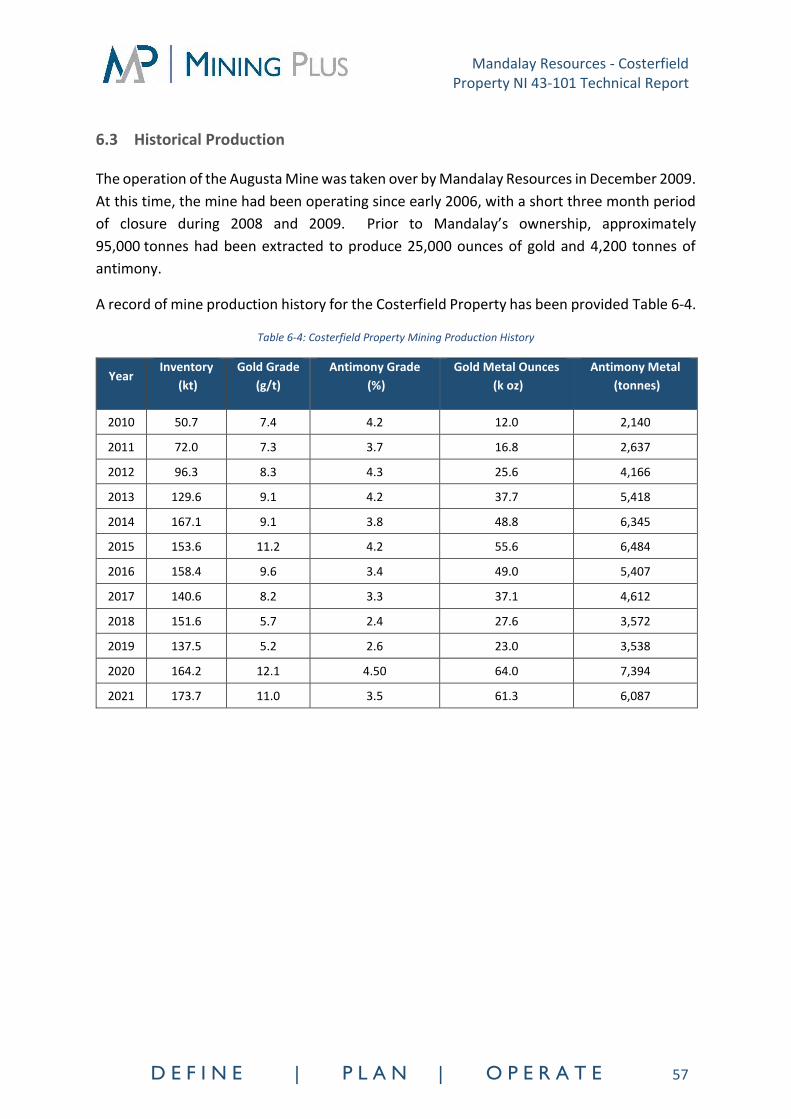
Mandalay Resources - Costerfield Property NI 43-101 Technical Report
D E F I N E | P L A N | O P E R A T E 57
6.3 Historical Production
The operation of the Augusta Mine was taken over by Mandalay Resources in December 2009.
At this time, the mine had been operating since early 2006, with a short three month period
of closure during 2008 and 2009. Prior to Mandalay’s ownership, approximately
95,000 tonnes had been extracted to produce 25,000 ounces of gold and 4,200 tonnes of
antimony.
A record of mine production history for the Costerfield Property has been provided Table 6-4.
Table 6-4: Costerfield Property Mining Production History
Year Inventory
(kt)
Gold Grade
(g/t)
Antimony Grade
(%)
Gold Metal Ounces
(k oz)
Antimony Metal
(tonnes)
2010 50.7 7.4 4.2 12.0 2,140
2011 72.0 7.3 3.7 16.8 2,637
2012 96.3 8.3 4.3 25.6 4,166
2013 129.6 9.1 4.2 37.7 5,418
2014 167.1 9.1 3.8 48.8 6,345
2015 153.6 11.2 4.2 55.6 6,484
2016 158.4 9.6 3.4 49.0 5,407
2017 140.6 8.2 3.3 37.1 4,612
2018 151.6 5.7 2.4 27.6 3,572
2019 137.5 5.2 2.6 23.0 3,538
2020 164.2 12.1 4.50 64.0 7,394
2021 173.7 11.0 3.5 61.3 6,087

Mandalay Resources - Costerfield Property NI 43-101 Technical Report
D E F I N E | P L A N | O P E R A T E 58
7 GEOLOGICAL SETTING AND MINERALISATION
7.1 Regional Geology
The Costerfield Property gold-antimony mineralisation zone is located at the northern end of
the Darraweit Guim province, in the Western portion of the Melbourne Zone. In the
Heathcote area of the Melbourne Zone, the Murrindindi Supergroup within the Darraweit
Guim Province encompasses a very thick sequence of Siluro-Devonian marine sediments,
which consist predominantly of siltstone, mudstone, and turbidite sequences (Figure 7-1).
The western boundary of the Darraweit Guim Province is demarcated by the Cambrian
Heathcote Volcanic Belt and north-trending Mt William Fault, a major structural terrain
boundary which separates the Bendigo Zone from the Melbourne Zone.
The Lower Silurian Costerfield Siltstone is the oldest unit in the Heathcote area and is
conformably overlain by the Wappentake Formation (sandstone/siltstone), the Dargile
Formation (mudstone), the McIvor Sandstone and the Mount Ida Formation
(sandstone/mudstone).
The Melbourne Zone sedimentary sequence has been deformed into a series of large-scale
domal folds, which tend to be upright, open folds with large wavelength curvilinear
structures. The major north-trending sub-parallel folds in the Darraweit Guim Province
include, from west to east:
• The Mount Ida Syncline
• The Costerfield Dome/Anticline
• The Black Cat and Graytown anticlines
• The Rifle Range Syncline.
The folds have been truncated by significant offsets along two major north trending faults,
the Moormbool and Black Cat faults. The Moormbool Fault has truncated the eastern limb
of the Costerfield Anticline, resulting in an asymmetric dome structure. The Moormbool Fault
is a major structural boundary separating two structural subdomains in the Melbourne Zone.
West of the Moormbool Fault is the Siluro-Devonian sedimentary sequence, hosting the gold-
antimony lodes. The thick, predominantly Devonian Broadford Formation sequence occurs
to the east of the fault and contains minor gold-dominant mineralisation.

Mandalay Resources - Costerfield Property NI 43-101 Technical Report
D E F I N E | P L A N | O P E R A T E 59
Figure 7-1: Geological map of the Bendigo - Heathcote region (Welch et al 2011)

Mandalay Resources - Costerfield Property NI 43-101 Technical Report
D E F I N E | P L A N | O P E R A T E 60
7.2 Property Geology
The Costerfield Property gold-antimony mineralisation is located in the Costerfield Dome,
which contains poorly exposed Lower Silurian Costerfield Siltstone at its core (Figure 7-2).
Within the Costerfield Property, four north-northwest trending zones of mineralisation have
been identified, which comprise from west to east:
• Antimony Creek Zone, approximately 6.5 km southwest of Costerfield, on the outer
western flank of the Costerfield Dome.
• Western Zone, approximately 1.5 km west of Costerfield, on the western flank of the
Costerfield Dome and includes the True Blue and West Costerfield Deposits.
• Costerfield Zone, near the crest of the dome, centred on the Costerfield township and
hosting the major producing mines and deposits.
• Robinsons – Browns (R-B) Zone, 2 km east of Costerfield.
The Costerfield Property Siltstone-hosted quartz/sulphide lodes in the Costerfield Zone are
controlled by north-northwest trending faults and fractures located predominantly on the
western flank of the Costerfield Anticline. The host rocks are the Silurian Costerfield
Formation siltstones and mudstones which are estimated to be between 450 m and 550 m
thick and are the oldest exposed rocks in the local area.

Mandalay Resources - Costerfield Property NI 43-101 Technical Report
D E F I N E | P L A N | O P E R A T E 61
Figure 7-2: Geological map of the Heathcote – Colbinabbin - Nagambie region, modified from Vandenberg et al., 2000
Locally, the sedimentary succession of the Costerfield Property has been deformed into a
broad anticlinal dome structure with numerous cross-cutting reverse thrust faults. This domal
structure is thought to have resulted from two separate tectonic events, the first producing
shortening in an east-west direction (folding and thrust faulting) and the second producing

Mandalay Resources - Costerfield Property NI 43-101 Technical Report
D E F I N E | P L A N | O P E R A T E 62
north-south shortening (gentle warping and mild folding). The anticlinal hinge zone of the
Costerfield Anticline has been thrust over its eastern limb by the north-south trending King
Cobra Fault zone (Figure 7-3).
Figure 7-3: Regional geology and the Costerfield Property geology

Mandalay Resources - Costerfield Property NI 43-101 Technical Report
D E F I N E | P L A N | O P E R A T E 63
7.3 Property Stratigraphy
Stratigraphic investigations, focused around the currently active Augusta workings within the
South Costerfield area, have found many previously unrecognised stratigraphic units and
structural features. Sub-surface stratigraphic mapping from drill hole data, has indicated that
the local host of the mineralisation, the Costerfield Formation, is far more stratigraphically
complex than previous investigations have documented.
7.3.1 The Darraweit Guim Province
The oldest outcropping strata documented in the region is the Costerfield Formation and is
believed to be Lower Silurian in age (Sandford and Holloway, 2006). The Costerfield
Formation, in the Costerfield area, is overlain by muddy siltstones and sandstones of the
Lower Silurian aged Wappentake Formation, and Dargile Formation. Upper Silurian
sedimentation is recorded in coarser silici-clastic successions of the McIvor Sandstone which
is then finally overlain by the early-Devonian Mt Ida Formation. The Mt Ida Formation records
the final phase of sedimentation in the greater Heathcote region.
The overall stratigraphic thickness of the Darraweit Guim Province is unknown, however
estimates of the true stratigraphic thickness are in the range of 6 km to 7 km, all of which
occurred without any significant depositional hiatus (Figure 7-4).

Mandalay Resources - Costerfield Property NI 43-101 Technical Report
D E F I N E | P L A N | O P E R A T E 64
Figure 7-4: Regional stratigraphy of the Darraweit Guim Province, by locality Modified from Edwards et al., 1998
7.3.2 The Costerfield Formation
The Costerfield Formation (as defined by Talent, 1965) is a series of thickly bedded mudstones
and siltstones featuring heavy bioturbation. The ‘Formation’ nomenclature of Talent (1965),
has been adopted for use within this report instead of the later re-assigned name of
‘Costerfield Siltstone’, as re-defined by Vandenburg (1988), since the formation consists of
dominantly mudstone lithologies, with siltstones and sandstones representing the lesser
constituents as relatively thin interbedded occurrences. It is recommended that the
‘Siltstone’ nomenclature be abandoned since it has become a misleading term, inferring that
the unit is composed of siltstone dominant lithologies, when this is not the case.

Mandalay Resources - Costerfield Property NI 43-101 Technical Report
D E F I N E | P L A N | O P E R A T E 65
The Costerfield Formation is dominated by weakly bedded mudstones and silty mudstones
with some lesser siltstone and sandstone constituents. The Formation is informally divided
into lower and upper portions based on a significant lithological change mid-way through the
succession. Estimates of the true stratigraphic thickness of the Formation are made difficult
due to significant faulting in the area; however, it is estimated to be in the range of 450 m to
550 m in thickness, with the lower and upper portions of the Formation being around 200 m
and 300 m thick respectively.
Informal lithostratigraphic units of the Lower Costerfield Formation are named the Siliciclastic
unit and Quartzite beds, while the lithostratigraphic units of the Upper Costerfield Formation
are named the Lower siltstone unit, Augusta beds and the Upper siltstone unit (Figure 7-5).
Figure 7-5: Stratigraphy of the Costerfield Formation, illustrating the relative positions of the newly defined informal stratigraphic units

Mandalay Resources - Costerfield Property NI 43-101 Technical Report
D E F I N E | P L A N | O P E R A T E 66
7.4 Property Structural Geology
7.4.1 South Costerfield Area
Resource-definition diamond drilling for the Augusta and Cuffley Deposits has resulted in the
collection of a large volume of geological data in the South Costerfield area, enabling the
construction of highly refined cross-sectional interpretations. These cross-sections have
revealed that the Augusta and Cuffley Deposits are bounded vertically between two large,
low angle west-dipping parallel thrust faults named the Adder Fault (upper) and the King
Cobra Fault (lower). The faults are typically 250 m apart in the South Costerfield area where
they have been recognised.
The area between these two large structures is also heavily faulted, resulting in a defined zone
of intense brittle deformation. Three significant second-order faults occur within the fault
zone, the Flat, Red Belly and Tiger Faults, which are interpreted as having listric geometry,
most likely mimicking the larger structure of the Adder and King Cobra Faults.
The faults are all observed to be extremely brittle structures. The large-scale Adder and King
Cobra Faults are typically represented by a 1 m to 2 m zone of fault pug, associated with
several metres of extremely heavily fractured and sheared lithologies in both the footwall
(FW) and hangingwall (HW) blocks, which is regarded as representing regional scale thrust
faults or a thrust zone. This zone has been informally named the Costerfield Thrust.
Mandalay Resources interprets the Costerfield Thrust to be the southern extent of the
historically recognised Costerfield Fault. Stratigraphic interpretations suggest that the overall
shortening and stratigraphic displacement across the Costerfield Thrust is in the order of
approximately 1 km.
An additional series of brittle faults are observed within this thrust system, striking in a north-
northeast direction, such as the East Fault. These faults have a sub-vertical dip and are
generally observed as 1 m to 2 m thick zones of unconsolidated breccia with minor pug on
the fault plane itself. The lateral extent of these faults is uncertain, however they appear to
be localised structures as the interpretation of these structures between drilling sections is
highly difficult. Offsets across these steep dipping faults appears to mostly represent strike-
slip and overall vertical movement, estimated to be on the scale of less than 50 m. Lateral
offset on the faults is presently unknown.
Ductile deformation of the Costerfield Formation occurs as a broad anticlinal structure with a
wavelength estimated in the range of 1.5 km to 2 km. Smaller parasitic folds are observed to
have a northerly striking fold-axis that dips slightly to the east and are assumed to mimic the
larger scale folding of the area. Ductile to semi-ductile veining and/or faulting is evident
within the Costerfield Formation and occurs as 20 mm to 100 mm laminated quartz veins.
They are typically bedding parallel, although laminated veins cross-cutting stratigraphy are
Mandalay Resources - Costerfield Property NI 43-101 Technical Report
D E F I N E | P L A N | O P E R A T E 67
not uncommon. Displacement across these faults/veins is uncertain as their bedding-parallel
characteristics make the determination of displacement through stratigraphic observations
difficult. The veins that cross-cut the bedding, however, do appear to record displacement in
the range of 10 m to potentially hundreds of metres.
7.4.2 Brunswick Area
Resource-definition diamond drilling of the Brunswick Deposit has resulted in the collection
of a large volume of geological data, particularly below the previously mined Brunswick Lode.
The Brunswick Deposit is located northwest of the current Cuffley workings, proximal to the
Brunswick Processing Plant. Drilling completed in 2008, confirmed that the deposit is
composed of a single main thrust structure, which occurs as a strongly sheared, well-
mineralised pug zone as well as a large stibnite-bearing quartz vein/lode.
Since late 2015, the conceptual structural model of the Brunswick Lode evolved from a
relatively linear single plane fault, into a series of thrusted panels, progressively separated by
low-angle thrust faults. The flat dipping thrust faults have the effect of transposing each lode
panel above several metres toward the east (Figure 7-6). Flat faults bisect the lode structures
in many other places throughout the field, including Alison-Cuffley, Costerfield (the Kendall
system), Margaret and Margaret East, and N Lode to varying degrees.

Mandalay Resources - Costerfield Property NI 43-101 Technical Report
D E F I N E | P L A N | O P E R A T E 68
Figure 7-6: Cross-section 5,880N, through the Brunswick System
The Penguin to Kiwi (PK) panel, located between 900 mRL and 1000 mRL, is the first down-
dip, major offset of the Brunswick Lode, with an apparent displacement of around 15 m to
the west. The panel is separated into two portions in the north by a HW splay of the Penguin

Mandalay Resources - Costerfield Property NI 43-101 Technical Report
D E F I N E | P L A N | O P E R A T E 69
Fault. Most drill holes in the splay-bound portion of the PK panel are low grade, although
typically they are close to the bounding faults and potentially reflect fault blanks.
The Brunswick Emperor to Kiwi Panel is bounded down-dip by the FW plane of the Kiwi Fault
and is interpreted to dip predominantly to the west with proximity to the fault plane.
The Brunswick Kiwi to Rooster Panel is bounded up-dip by the HW plane of the Kiwi Fault. A
duplex of the Kiwi Fault is seen to the west of the Emperor to Kiwi Panel and is interpreted to
be an indicator of post mineralisation movement on the Kiwi Fault. The complex relationship
between the FW and HW blocks of the Kiwi Fault is now interpreted to represent both pre-syn
and post Brunswick Shear mineralisation. This interpretation is key to identifying the
presence of mineralisation on the different bounding fault planes. The continuity of
mineralised shoots across the flat thrust faults, such as the Kiwi Fault, highlight the potential
for mineralisation to continue at depth below the Kiwi Fault.
7.4.3 Costerfield – Youle Area
The Youle Lode, named after one of the original prospectors in the district, dips west and is
identified as the down-dip continuation of the vertical Kendall Lode, which has been offset
westward over the west dipping No.4 thrust fault (Figure 7-7). The Youle Lode extends over
a strike length of approximately 600 m in horizontal length and has a vertical length of
approximately 150 m.
Mineralisation exists at the surface and is vertically continuous in one plane until the
intersection with a flat fault (Whitelaw back) where mineralisation switches planes to the
west (Section 8). Historically, both the east dipping Costerfield Reef and west dipping Kendal
Reefs were mined underground to a depth of approximately 270 m below surface (Figure 7-7).
Mandalay Resources drilled the historic Costerfield Mine area in three campaigns during
2011, 2014 and 2017-2018. The Company reported significant early results from the Youle
drilling program in July 2017 and in April 2018. Drilling was accelerated in late 2017 after
Mandalay Resources committed to developing the Brunswick Lode as the access to Youle,
utilising the Brunswick decline. In September 2019, Mandalay Resources commenced
development of the Youle Lode, which lies approximately 800 m north of the Brunswick Lode.
Mine development of the Shepherd Zone commenced in October 2021, with 75 m of
development completed over 2 levels to the report date.

Mandalay Resources - Costerfield Property NI 43-101 Technical Report
D E F I N E | P L A N | O P E R A T E 70
Figure 7-7: Cross section 7,030N through the Costerfield – Youle System

Mandalay Resources - Costerfield Property NI 43-101 Technical Report
D E F I N E | P L A N | O P E R A T E 71
The Shepherd Zone is a recently discovered swarm of mineralised veins proximal to and
underlying the Youle orebody (Figure 7-8). Parallel, subvertical to east dipping quartz veins
exhibit coarse gold with intense sulphide alteration surrounding the veins. The Shepherd Zone
extends approximately 550 m in strike and 150 m vertically.

Mandalay Resources - Costerfield Property NI 43-101 Technical Report
D E F I N E | P L A N | O P E R A T E 72
Figure 7-8: Cross-section 7,200N, through the Costerfield – Youle-Shepherd System

Mandalay Resources - Costerfield Property NI 43-101 Technical Report
D E F I N E | P L A N | O P E R A T E 73
7.5 Property Mineralisation
Significant portions of the local area are obscured by alluvium and colluvium deposits, which
have been washed over the surrounding flood plains by braided streams flowing east off the
uplifted Heathcote Fault Zone. Some of this alluvial material has been worked for gold but
workings are small-scale and limited in extent. Most of the previously mined hard rock
deposits were found either out-cropping or discovered by trenching within a few metres of
the surface.
The Augusta Deposit was discovered late in the history of the field (1970) by bedrock
geochemistry, buried less than 2 m to 6 m below the alluvium, which was deposited at the
meandering Mountain Creek/Wapentake Creek confluence.
The mineralised structures in the Costerfield Zone, which typically dip steeply east or west
(Augusta, Brunswick, Kendall), or moderately west (Youle) are likely to be related to the
formation of the Costerfield Dome and the subsequent development of the Moormbool Fault.
The main reef system(s) appear to be developed in proximity to the axial planar region of the
Costerfield Dome or hosted in reactivated west-dipping thrust faults.
The economic mineralisation at the Costerfield Property occurs in a north-south corridor that
includes the Costerfield, Brunswick and Augusta zones. The moderately west to steeply-
dipping quartz-stibnite-gold lodes have thicknesses ranging from several millimetres to one
metre, and extend over a strike of at least four kilometres. The lode system is centred in the
core of the doubly-plunging Costerfield Anticline and is hosted by Costerfield siltstones.
Individual lodes can persist for up to 800 m along-strike and 300 m down-dip.
The mineralogy of the vein contents and mineral proportions differ from vein to vein
throughout the Augusta, Cuffley, Brunswick and Youle lodes. However, the texture and
chronological order of each vein/mineral generation remains remarkably consistent across all
lodes.
A diagrammatic illustration of the paragenesis of the Augusta and Cuffley Deposits is
illustrated in Figure 7-9. The overall paragenetic sequence is ordered as follows:
• Laminated quartz,
• Fibrous carbonate (siderite and ankerite),
• Crystalline quartz (rhombic quartz),
• Stibnite,
• Opaline quartz,

Mandalay Resources - Costerfield Property NI 43-101 Technical Report
D E F I N E | P L A N | O P E R A T E 74
• Milky quartz.
Acicular stibnite and botryoidal calcite are not generally associated with the main quartz-
stibnite vein structures, and are therefore regarded as post-mineralisation mineralogical
occurrences, most likely associated with meteoric events.
Figure 7-9: Paragenetic history and vein genesis of the Costerfield region
The Costerfield Property lodes are typically anastomosing, en-echelon style, narrow-vein
systems, which dip from 25° to 70° west to 70° to 90° east. Mineralised shoots are observed
to plunge to the north, when structurally controlled, and south when bedding controlled.
The mineralisation occurs as single lodes and vein stockworks associated with brittle fault
zones. These bedding and cleavage parallel faults, that influence the lode structures, range
from sharp breaks of less than 1 mm to dilated shears up 3 m wide that locally contain fault
gouge, quartz, carbonate and stibnite.
Cross faults, such as those seen offsetting other Costerfield Property lodes, have been
identified in both open-pit and underground workings.
The mineralised lodes vary from massive stibnite with microscopic gold to quartz-stibnite,
with minor visible gold, pyrite, and arsenopyrite. The stibnite is clearly seen to replace quartz,
and gold can also be hosted by quartz.

Mandalay Resources - Costerfield Property NI 43-101 Technical Report
D E F I N E | P L A N | O P E R A T E 75
A photograph of typical mineralised Youle Lode within an underground development face
heading has been displayed in Figure 7-10. This vein averaged 0.29 m at 143 g/t Au and 22.6%
Sb, with a diluted average face grade of 24.1 g/t AuEq.
Figure 7-10: Typical Youle vein in 837 level on cross-section 6,955N
7.6 Deposit Mineralisation
Mandalay Resources has estimated Mineral Resources within the Augusta, Cuffley, Sub King
Cobra, Brunswick and Youle Deposits at the Costerfield Property.

Mandalay Resources - Costerfield Property NI 43-101 Technical Report
D E F I N E | P L A N | O P E R A T E 76
Each deposit consists of multiple lodes that are within close proximity of each other as
outlined in Table 7-1 and shown in Figure 7-11.
Table 7-1: Individual Lodes at the Costerfield Property separated by deposit
Augusta Cuffley Sub King Cobra Brunswick Youle Zone Shepherd Zone
E Lode CM Lode SKC C Brunswick
Main Youle Main Lode
Shepherd
B Lode CE Lode SKC CE Brunswick KR Youle East Ryeland
B Splay CD Lode SKC LQ Kendal Splay (North
Splay) Merino
W Lode CDL Lode SKC W Peacock Vein Dorset
N Lode AS Lode Youle South Splay Suffolk
NS 48 Peacock Splay Drysdale
NW Lode
P1 Lode
K Lode
C Lode

Mandalay Resources - Costerfield Property NI 43-101 Technical Report
D E F I N E | P L A N | O P E R A T E 77
Figure 7-11: Schematic long-section and plan view of Augusta, Cuffley, Brunswick and Youle Lodes

Mandalay Resources - Costerfield Property NI 43-101 Technical Report
D E F I N E | P L A N | O P E R A T E 78
8 DEPOSIT TYPES
The Costerfield Property lies within a broad gold-antimony province mainly confined to the
Siluro-Devonian Melbourne Zone of Victoria. The narrow quartz-stibnite-gold veins of the
Melbourne Zone are mesothermal to orogenic in nature and are a product of a 380 Ma to
370 Ma tectonic event. Gold in Central Victoria is believed to have been derived from the
Cambrian greenstones that underlie the entire province at depth, however the origin of the
associated antimony has been less studied.
The mineralisation at Costerfield occurs as narrow veins or lodes, typically less than 50 cm
wide and hosted within unmetamorphosed (anchizone) mudstone and siltstone of the Lower
Silurian Costerfield Formation.
Typical lode material at Costerfield consists of gold-bearing quartz and carbonate with
massive stibnite either as the latest stage vein fill or segregated to one contact of the vein.
The average grade of this material is approximately 9 g/t Au (often greater than 20 g/t) and
4% antimony (Fromhold et. al. 2017). A variety of accessory minerals are associated with the
mineralisation, including pyrite, arsenopyrite, aurostibite, pyrrhotite, muscovite, sphalerite
and galena within the vein. Wallrock alteration minerals are dominantly pyrite, arsenopyrite
and ferroan carbonate spotting, surrounded by a broader, visually cryptic halo of muscovite
replacing phengite. Small crystals of barite and bournonite are often seen in chlorite-coated
joints near the lodes.
The character of the ore material does vary between the different Costerfield lodes in a broad
sense. For example, the Augusta C, D, E Lodes, N Lode, Cuffley and Youle generally contain
the ‘typical’ quartz-stibnite material described above. The Brunswick Lode is notable for
containing proportionally less quartz than usual and the lode material usually comprising
sheared host rock with massive stibnite as either solid vein fill or as breccia matrix with lesser
quartz infill.
The Shepherd veins are unusual in a local context for containing relatively little stibnite and
the mineralisation encountered to date has comprised simple coarse gold in quartz-carbonate
veining. The southern portions of the Shepherd veins have displayed a more consistent
stibnite component in the completed exploration drilling.
Mineralised shoots at the Costerfield Property known to date are understood to be
structurally controlled, typically by the intersection of the lodes with major cross-cutting,
gouge filled fault structures and shears. Exploration at the property is guided by projections
of where these fault/lode intersections might be located using data from structural/geological
mapping, diamond drill hole logging and 3D computer modelling utilising Leapfrog Geo
software.

Mandalay Resources - Costerfield Property NI 43-101 Technical Report
D E F I N E | P L A N | O P E R A T E 79
Notable west to northwest dipping thrust faults typically bound the mineralisation packages
at the Costerfield Property but can become significantly mineralised themselves along the
fault planes. Shallower and dominantly west dipping thrust faults, typically at very low angles
or even parallel to bedding with a laminated quartz component, link between the larger order
thrust faults. The link faults can also offset the vertical lode structures up to 50 m in an east-
west sense.
These flat dipping structures have influenced the lifespan of some historic mining at
Costerfield. The Alison Mine, where lodes were initially discovered in 1863, ceased mining a
depth extension in 1871 because the lodes were truncated against a flat west-dipping fault.
A crosscut established below the ‘slide’ unsuccessfully passed back into the hangingwall of
the fault before any lode continuation was located. Intermittent mining finally ceased at the
Alison mine in 1922 after strike extensions were finally exhausted.
Drilling of the Allison Lodes in 2011 successfully intersected a westerly-displaced lode below
the truncating fault. This continuation was named Cuffley Lode and became a major source
of ore for the Costerfield mine for several years, no doubt eclipsing the production of the
overlying historic mine by a significant margin.

Mandalay Resources - Costerfield Property NI 43-101 Technical Report
D E F I N E | P L A N | O P E R A T E 80
9 EXPLORATION
The exploration work that led to the discovery of the Augusta, Cuffley, Brunswick, Youle, and
Shepherd Deposits has included predominantly diamond drilling of interpreted geological
targets complimented by geological mapping, geophysical and geochemical analysis.
Geochemical exploratory methods have proven to be applicable in detecting gold-antimony
mineralisation.
9.1 Costeans/Trenching
Previous owners have undertaken trenching at the Costerfield Property, however records of
these exploration activities were inconsistent and have not been relied upon for quantitative
means.
9.2 Petrophysical Analysis
In 2006, AGD submitted 22 whole-rock and mineralised samples from all known deposits
around the Costerfield Property for testing by Systems Exploration (NSW) Pty Ltd. The aim of
the work was to determine the petrophysical properties of the mineralisation and identify the
most effective geophysical exploration methods that could be used at the project to detect
similar styles of mineralisation. The breakdown of the 22 samples submitted is:
• 13 mineralised samples sourced from Augusta, Margaret, Antimony Creek,
Costerfield, Bombay, Alison and Brunswick.
• 2 weathered mineralised samples sourced from Augusta.
• 7 unmineralised samples.
The following petrophysical measurements were completed:
• Mass properties
• Dry bulk density
• Apparent porosity
• Grain density
• Wet bulk density
• Inductive properties:
• Magnetic susceptibility

Mandalay Resources - Costerfield Property NI 43-101 Technical Report
D E F I N E | P L A N | O P E R A T E 81
• Diamagnetic susceptibility
• Electromagnetic conductivity
• Galvanic properties:
• Galvanic resistivity
• Chargeability
Although measurable differences in the physical properties of the mineralised and non-
mineralised material at the Costerfield Property was identified, the contrast proved to be
marginal at best, and it was deemed unlikely that these differences would deliver clear
geophysical signatures.
The only field geophysical techniques recommended for trialling were ground-based
magnetics, ground-based gravity and induced polarisation (IP) profiling.
9.3 Geophysics
Several programs of geophysical surveys were completed at the Costerfield Property.
9.3.1 Ground Geophysics
Based on the results of the petrophysical testing, a limited program of ground-based
magnetics, gravity and IP profiling, with optimal measurement parameters, was carried out
across the Augusta Deposit. None of the techniques were found to be effective at detecting
the known mineralisation at Augusta.
9.3.2 Airborne Geophysics
A low-level detailed airborne magnetic and radiometric survey was undertaken in 2008 by
AGD over their tenements, including both Augusta and Cuffley. The airborne survey was
conducted on east-west lines spaced 50 m apart, with a terrain clearance of approximately
50 m. Survey details are included in a logistics report prepared by UTS (UTS, 2008).
Magnetic data was recorded at 0.1 second intervals and radiometric data was recorded at
1 second intervals. Additional processing was undertaken by Greenfields Geophysics.
The interpretation of the radiometric and magnetic data resulted in the generation of regional
lineament trends across the tenements, which assisted in interpreting the local buried
structures.

Mandalay Resources - Costerfield Property NI 43-101 Technical Report
D E F I N E | P L A N | O P E R A T E 82
9.4 Geochemistry
Geochemical exploration has been undertaken extensively at the Costerfield Property.
9.4.1 Mobile Metal Ion (MMI)
Based on historic geochemical surveys over the Augusta Deposit, as described by Stock and
Zaki in 1972, and informal recommendations by Dr G McArthur of McArthur Ore Deposit
Assessments Pty Ltd (MODA), it was decided in 2005 to trial Mobile Metal Ion (MMI) analytical
techniques on samples collected from traverses across the Augusta Lodes.
Utilising two geophysical traverse lines across the Augusta Deposit, 5 m spaced samples were
collected from the soil horizon and submitted to Genalysis Laboratory Services for MMI
analysis of gold, arsenic, mercury, molybdenum, and antimony via Inductively Coupled Plasma
(ICP).
While the other elements showed no correlation to the underlying mineralisation, the gold
and antimony results appeared to show a broad anomaly across the mineralisation, indicating
that the technique could be useful for regional exploration.
9.4.2 Soil Geochemistry
In October 2017, a soil geochemistry program was conducted at Brunswick South to verify
historical sample lines along the southern strike of the Brunswick Lode. A mechanical
hand-held auger was used to take 28 samples over two traverse lines at an average depth of
720 mm. This program successfully verified the historical assay data and demonstrated a
possible strike extension to the Brunswick lode.
In September 2021, a soil geochemistry campaign was conducted to cover the areas south of
True Blue and the eastern corridor (Brown and Robinson Prospects). A mechanical hand-held
auger was used to take 854 samples over 200 m spaced traverse lines with samples spaced at
50 m intervals (Figure 9-1).
Samples were first analysed using a portable X-Ray Fluorescence (XRF) and followed up by
aqua regia digest ICP-MS analysis. The work aimed at producing a large surface geochemical
dataset and to aid target generation along known mineralised corridors.
Data interrogation and analysis was ongoing at the time of writing with assay results pending.

Mandalay Resources - Costerfield Property NI 43-101 Technical Report
D E F I N E | P L A N | O P E R A T E 83
Figure 9-1: Surface Topography and Mining Lease Overlaid with the Existing Geochemical Lines and Acquired 2021 Soil Sampling Lines
9.4.3 Bedrock Geochemistry – Auger and Aircore Drilling
The effectiveness of bedrock geochemistry was demonstrated by MEM in 1968 to 1970, when
a grid south of the South Costerfield/Tait’s Shafts was sampled. What is now known as the
Augusta Deposit was highlighted by the resultant anomalies.
Although MEM drilled three shallow diamond drill holes, which ranged from 22 m to 57 m, to
test the anomalies and intersected stibnite stringers, they did not proceed any further. Both
conventional surface soil and drilled-bedrock samples were collected to compare techniques;
although the surface samples were anomalous and cheaper to collect, the drilled-bedrock
samples defined the lodes more precisely.
A geochemical aircore drilling program was carried out during March 2010 to test the zone
between Augusta South and the Margaret Mine, south of the operating Augusta Mine. The
three east-west traverses were completed across cleared grazing paddocks, south of Tobin’s
Lane, Costerfield. A total of 104 aircore drill holes were drilled for a cumulative total of 547
m, with the average drill hole depth being 5.2 m. The identified antimony halo was subdued
in areas where the high-grade lode was greater than 50 m below the top of bedrock,

Mandalay Resources - Costerfield Property NI 43-101 Technical Report
D E F I N E | P L A N | O P E R A T E 84
considered to infer that either a low-grade lode existed at shallow depth or a high-grade lode
existed at depth.
From December 2011, Mandalay Resources engaged Starwest Pty Ltd to undertake the
Augusta East Auger drilling program. A total of 2,615 auger drill holes were drilled for 7,295.6
m between December 2011 and June 2012. The survey revealed three anomalous zones
(Figure 9-2).

Mandalay Resources - Costerfield Property NI 43-101 Technical Report
D E F I N E | P L A N | O P E R A T E 85
Figure 9-2: Auger Drilling Geochemistry Results for Antimony

Mandalay Resources - Costerfield Property NI 43-101 Technical Report
D E F I N E | P L A N | O P E R A T E 86
A total of 1,375 auger drill holes were then drilled by Mandalay Resources from 15 April 2014
to June 2014 for 3,906 m. Drill holes were completed on exploration leases EL3310 and
EL5432 and mining lease MIN4644 covering six of the prospect areas comprising Augusta,
Cuffley, Brunswick, West Costerfield and Margaret’s Reef.
9.4.3.1 Cuffley
76 drill holes were drilled on two lines over the underground Cuffley Deposit to test the
relationship between bedrock geochemistry and known gold-antimony ore bodies below
surface. The Cuffley orebody does not outcrop at surface due to termination of the vein
system by a flat fault approximately 100 m below surface. The depth to the ore zone
explained the low to moderate level of anomalism displayed in the auger drilling. The
anomaly covered a broad zone that approximated the Cuffley orebody at depth.
9.4.3.2 Augusta Mine Extension
To the east, west and south of the existing Augusta mine site, 124 drill holes were drilled to
explore for extensions of the known underground orebodies. The auger drilling to the east
and west detected no elevated levels of either gold or antimony, and no further work was
planned in these areas.
The two lines drilled to the south displayed a narrow zone of high-grade anomalism, which
correlated directly to extensions of known ore bodies. Diamond drilling between this area
and the mine intersected no economic mineralisation and therefore this area was
downgraded to a low priority drilling target.
9.4.3.3 Brunswick
To the west and south of the Brunswick open cut, 247 drill holes were drilled to test for
extension of the known ore body. No elevated anomalism was detected to the west, however
a narrow high-grade intersection was returned from drilling 500 m south of the Brunswick pit
suggesting an extension of the orebody.
In 2017, soil sampling was conducted over two lines where bedrock geochemistry had been
previously completed, in order to test the effectiveness of soil sampling. The results of the
soil sampling indicated anomalism broadly corresponding to the anomalism in the bedrock
geochemistry data. No further testing of the appropriateness of this method has been
completed to date.
9.4.3.4 Margaret’s Reef
Margaret’s Reef auger drilling was carried out on private property 1 km south of the current
Augusta mining operations with a total of 536 drill holes being completed. Previous auger

Mandalay Resources - Costerfield Property NI 43-101 Technical Report
D E F I N E | P L A N | O P E R A T E 87
drilling in this area was done on a wider sample spacing of 40 m and was not considered deep
enough to provide consistent results, therefore the lines were re-drilled. Sample spacing of
10 m over the previous anomalous results gave a clearer indication of the mineralised
structures at depth.
Margaret’s Reef appears to be composed of several reef/vein systems as suggested from
previous RC and diamond drilling. The veins strike approximately northwest, which is a similar
vein orientation to those seen underground at Augusta and Cuffley and may represent a fault-
displaced extension of one of these systems. The close proximity to the King Cobra Fault to
the east appears to have structurally complicated the vein systems, which explains the
discontinuous nature of the anomalism identified. Broad zones of high anomalism were seen
to correlate with known historic workings over the reef. The highest grade result present in
drill holes distal to the mining operations at the time, was received from the northern most
line at Margaret’s Reef, returning grades of 5.42 g/t gold and 3.25% antimony, suggesting the
presence of economic mineralisation at surface.
Several high-priority diamond drill targets were planned, including a target beneath the above
mentioned high-grade result, in order to provide further structural information on the
mineralised vein system. However, recent diamond drilling failed to follow up on a high-grade
intersection in drill hole MM001, drilled in 2001, of 1 m at 33 g/t gold and 14% antimony.
Further diamond drill holes are planned to determine if an economic resource exists in this
area.
9.4.3.5 West Costerfield
A total of 336 auger drill holes were drilled in 2014 at West Costerfield, designed to test areas
near historic workings to the east and determine mineralisation continuity to the south of the
previous auger program, which delineated the True Blue anomaly to the west however only
the northern portion of the West Costerfield reef was explored at the time.
A broad anomaly was defined over the West Costerfield reef and was identified to continue
south with high gold values and moderate antimony results. The anomaly is located along
the Mountain Creek drainage zone to the south, but widens and changes orientation slightly
towards the north, near the small historic pits that define the West Costerfield reef. Although
the antimony anomalism identified was subdued in contrast to the high gold, the interpreted
gold-antimony veins below surface are considered to be similar in style to those intersected
in the single diamond drill hole into True Blue.
In 2015, a follow up program of 38 RC drill holes was drilled to test the anomaly identified in
the 2014 Auger drilling program. The RC drilling resulted in the identification of
mineralisation that has not yet been drilled by diamond drilling.
Mandalay Resources - Costerfield Property NI 43-101 Technical Report
D E F I N E | P L A N | O P E R A T E 88
9.5 Aerial Photogrammetry Survey
AGD commissioned Quarry Survey Solutions of Healesville, and United Photo and Graphic
Services Pty Ltd of Melbourne, to organise and complete aerial photogrammetry of the
Costerfield Property tenement package and the Augusta Mine Site in 2005.
A high-level photo survey was completed in November 2005 at 24,000 ft. This was followed
by low-level photo survey over the Augusta Mine Site in January 2006 at 8,000 ft.
A second low-level photo survey was completed in April 2006 at a height of 4,000 ft, at the
time of maximum surface excavation, prior to the commencement of backfilling of the E Lode
Pit.
The various photo surveys were subsequently used to generate a digital terrain model (DTM)
and a referenced ortho-photographic scan of the Costerfield central mine area. This area
essentially extended from Costerfield South to the Margaret’s Reefs area, thereby
encompassing most of ML MIN4644.
In 2019, Mandalay Resources engaged AAM Group to carry out a detailed Light Detection and
Ranging (LiDAR) aerial survey over a 175 km2 area, covering the entire tenement package.
This survey generated a highly accurate and detailed photographic model of the surface with
accuracy to +/- 10 cm. The survey had a two-fold benefit both for Mandalay Resources Future
Ore project and the Youle in-rush risk assessment. The LiDAR survey provided an accurate
topographical surface that assisted the company to undertake flood simulation studies in
order to plan for any 100-year flooding events at the Costerfield Property.
9.6 Surface Mapping and 3D Geological Modelling
The Mandalay Resources Future Ore project continued throughout 2021, with the ongoing
collection of surface geological information from traverse mapping and continued refinement
of a comprehensive regional three-dimensional (3D) model using Leapfrog Geo implicit 3D
software (Figure 9-3 and Figure 9-4).

Mandalay Resources - Costerfield Property NI 43-101 Technical Report
D E F I N E | P L A N | O P E R A T E 89
Figure 9-3: Perspective view to the northwest: Leapfrog Geo Geological Model, Regional Geology

Mandalay Resources - Costerfield Property NI 43-101 Technical Report
D E F I N E | P L A N | O P E R A T E 90
Figure 9-4: Perspective view to the northwest: Leapfrog Geo Geological Model, Robinsons Prospect
Traverse mapping and compilation of geological data onto comprehensive geological maps of
the Costerfield Property has been completed since 2018.

Mandalay Resources - Costerfield Property NI 43-101 Technical Report
D E F I N E | P L A N | O P E R A T E 91
10 DRILLING
Drilling at the Costerfield Property is undertaken in line with industry best practices including:
• Drilling is undertaken by reputable drilling contractors, with modern drilling
equipment.
• The accurate location of Mandalay Resources drill hole collars by differential GPS or
theodolite surveying methods, either by external Surveyors or Mandalay Resources
Surveyors.
• Measurement of downhole surveys at 30 m intervals.
• Transporting of diamond core in stacked core trays and secured in a dedicated facility.
10.1 Mandalay Resources (2009 to Present)
On 1 December 2009, Mandalay Resources took over the Costerfield Operations from AGD
and continued with exploration across tenements MIN4644, EL3310, and EL4848.
As of December 2021, Mandalay Resources held tenements MIN4644, MIN5567, EL5519 and
EL5432. Tenement applications ELA6847 and ELA6842 are pending, along with Retention
Licence applications RLA7485 and RLA7492.
A summary of drilling completed by Mandalay Resources from 2009 to 2021 has been outlined
in Table 10-1. Table 10-1: Drill Hole Summary
Year Diamond Core (m) Percussion/Auger (m)
2009 458.9 547.0
2010 4,032.0 Nil
2011 13,515.0 Nil
2012 18,581.4 7,295.6
2013 24,329.0 3,838.0
2014 20,817.0 3,906.0
2015 18,439.0 2,732.0
2016 32,995.0 Nil
2017 27,827.0 Nil
2018 34,656.0 Nil
2019 9,556.0 Nil
2020 29,080.0 Nil
2021 36,255.0 Nil
TOTAL 270,541.3
18,318.6

Mandalay Resources - Costerfield Property NI 43-101 Technical Report
D E F I N E | P L A N | O P E R A T E 92
10.1.1 2009 to 2010
Drilling from 1 July 2009 to 30 June 2010 mainly consisted of drilling along-strike and down-
dip from the existing Augusta Resource. In total, 458.9 m of diamond drilling was undertaken.
In addition, 547 m of bedrock geochemistry aircore drilling was completed within MIN4644
at Augusta South.
Augusta drilling during from 1 July 2009 to 30 June 2010 concentrated on the definition of the
W Lode Resource. Four drill holes tested the depth extent of W Lode, while another six drill
holes were designed as infill drill holes to test mineralised shoots and gather geotechnical
data.
10.1.2 2010 to 2011
Exploration from 1 July 2010 to 30 June 2011 was undertaken on two projects, the Augusta
Deeps project and the Brownfields Exploration project. The Augusta Deeps project was
undertaken with the view to extending the existing Augusta Resource to depth.
Augusta drilling concentrated on the infill and extension beneath Augusta to further define
the Resource below 1,000 mRL. In total, 10,622.7 m of drilling was completed beneath the
Augusta mine workings and resulted in the definition of further Indicated and Inferred
Mineral Resources.
10.1.3 2011 to 2012
Exploration from 1 July 2011 to 30 June 2012 was undertaken on four projects; the Augusta
Deeps drilling project (W Lode and N Main Lode), the Alison/Cuffley drilling project, the
Brownfields/Target Testing drilling project and the Target Generation/Bedrock Geochemistry
auger drilling project.
In total 18,581.4 m of diamond drilling and 7,295.6 m of auger drilling were undertaken over
the four projects. All drilling was carried out by Starwest Pty Ltd using one LM75 diamond
drill rig, two LM90 diamond rigs, one Kempe underground diamond drill rig and a modified
Gemco 210B track-mounted auger rig.
10.1.3.1 Augusta Deeps
Drilling of the Augusta Deposit from 1 July 2011 to 30 December 2012 was undertaken with
the view to extend the W Lode, E Lode and N Main Lode Inferred and Indicated Mineral
Resource, and give confidence in the structural continuity of W Lode and N Main Lode.
A total of 78 drill holes were drilled from surface and underground, totalling 16,170.4 m of
drilling.

Mandalay Resources - Costerfield Property NI 43-101 Technical Report
D E F I N E | P L A N | O P E R A T E 93
10.1.3.2 Cuffley
The Alison/Cuffley drilling project was designed to infill drill a portion of the lode and upgrade
it to the Indicated Resource category, and to extend the limits of the lode in the Inferred
Resource category.
The Cuffley Lode resource drilling programme began in July 2011 with the AD series of drill
holes, following the MB007 discovery. As a follow-up programme, four drill holes were drilled
(AD001-ADD004). AD004 intersected the fault blank and AD003 appeared to have only
intersected the Alison Lode above the Adder Fault in the vicinity of some old stopes. From
drill hole AD005 onwards, the drilling strategy involved drilling at least two drill holes on each
mine grid cross-section, at an approximate spacing of 80 m to 100 m. Drill holes were drilled
on both west to east and east to west orientations, depending on the site logistics.
One deep drill hole, AD022, on the 5,025N cross-section, intersected the Cuffley Lode at
700 mRL, 490 m below the surface with results of 1.04 m at 59.7 g/t Au, 0.37% Sb returned.
This drill hole provided confidence in the depth continuity of the lode to Inferred Resource
category.
A portion of the drilling in 2011 to 2012 was infill drilling, 100 m below the Alison Shaft 5 level,
at a spacing of 40 m, in order to define the lode to Indicated Resource category where the
planned access decline was expected to first intersect the lode.
10.1.4 2012 to 2013 – Cuffley Lode Drilling
From 1 July 2012 to 30 June 2013 Mandalay Resources drilled 24,329 m of diamond drilling,
targeting the Cuffley Lode from surface. These drill holes focussed on infill drilling the central,
high-grade portion of the Cuffley Lode in order to convert a portion of the Inferred Mineral
Resources to the Indicated category.
10.1.5 2014 – Cuffley and N Lode Drilling
In 2014 the focus was on finalising the Cuffley and Augusta Resource Drilling. The goals
achieved included:
• Expanding the existing Inferred Resource of the Cuffley Lode, both along-strike and at
depth.
• Increasing the confidence of the central portion of the Cuffley Lode to aid mine
development and stoping of the Cuffley Lode.
• Expanding the existing Inferred Resource of the Augusta Deposit, specifically targeting
N Lode along-strike from the existing N Lode development.

Mandalay Resources - Costerfield Property NI 43-101 Technical Report
D E F I N E | P L A N | O P E R A T E 94
• Infill and extension of the Cuffley resource to the north and south along with Cuffley
Shallows in between the flat fault and the Adder fault.
In total, 20,817 m of diamond drilling and 3,906 m of auger drilling was undertaken. A total
of 5,735 m was drilled for the purposes of target testing, 9,390 m for resource expansion and
resource conversions, and 5,692 m for resource infill drilling.
All drilling activity was conducted by Starwest Pty Ltd using two Boart Longyear LM90s, one
Boart Longyear LM75, one pneumatic Kempe U2 rig and a modified Gemco 210B Track-
mounted Auger.
10.1.6 2015 – Cuffley, N Lode, Cuffley Deeps and Sub King Cobra Drilling
Drilling in 2015 was focused on extending the Cuffley and Augusta Resources, both along-
strike and at depth. The expansion of the Cuffley resource included the commencement of
drilling in the Cuffley Deeps and Sub King Cobra regions. The goals achieved included:
• Expanding the existing Inferred Resource of the Cuffley Lode along-strike and
definition of a resource below the Cuffley Lode at depth.
• Commencement of drilling at depth below the Cuffley Deposit into the Cuffley Deeps
and Sub King Cobra areas.
• Increased the confidence of the central portion of the Cuffley Lode to aid mine
development and stoping.
• Expanding the existing Inferred Resource of the Augusta Deposit, specifically targeting
N Lode along-strike from the existing N Lode development.
• Infill and extension of the Cuffley resource to the north and south along with Cuffley
Shallows in between the flat fault and the Adder fault.
• Follow up RC drilling at West Costerfield to test the geochemical anomaly identified in
2014 by the Auger Bedrock drilling program.
In total, 18,439 m of diamond drilling and 2,732 m of RC drilling was undertaken. The majority
of drilling was conducted by Starwest Pty Ltd using two Boart Longyear LM90s, one Boart
Longyear LM75 and one pneumatic Kempe U2 rig. The RC drilling was conducted by Blacklaws
Drilling utilising a Hanjin surface rig.

Mandalay Resources - Costerfield Property NI 43-101 Technical Report
D E F I N E | P L A N | O P E R A T E 95
10.1.7 2016 – Cuffley Deeps, Cuffley South, M Lode, New Lode, Sub King Cobra, Margaret
and Brunswick Drilling
Exploration from January to December 2016 was focused on extending and upgrading the
Cuffley and Augusta Resources to extend the life of mine plan, replace the mined portion of
the Mineral Resource and explore near-mine targets in close proximity to existing
underground infrastructure.
The expansion of the Cuffley resource included the continuation of drilling in the Cuffley
Deeps, Cuffley South and Sub King Cobra regions, along with the addition of new target areas.
The goals achieved included:
• Expanding the existing Inferred Resource in the Cuffley Lode, and further defining the
Cuffley Deeps and Sub King Cobra Resources below the Cuffley Lode at depth.
• Infill and exploration drilling of the Cuffley Deeps and Sub King Cobra areas, leading to
a resource expansion in Cuffley Deeps and an Inferred Resource at the Sub King Cobra
area.
• Infill drilling of Cuffley Deeps delineated further prospective zones and a new ore
system, namely Mid Lode (M Lode) located between the Cuffley line of lode and N
Lode.
• Further development on the Cuffley Lode informed the understanding of, and
increased confidence in the Cuffley Deeps Deposit at depth and along-strike.
• Infill and extension of the Cuffley resource to the north and south along with Cuffley
Shallows in between the flat fault and the Adder fault.
• Recommencement of drilling on Brunswick and further testing of the deposit to the
south and at depth.
• Brownfields drilling on the Margaret Reef identified the Margaret East mineralisation.
In total 32,995 m of diamond drilling was undertaken. All drilling activity was conducted by
Starwest Pty Ltd using four Boart Longyear LM90s, one Boart Longyear LM75 and one
pneumatic Kempe U2 rig.
10.1.8 2017 – Brunswick, K Lode and N Lode
Exploration from January to December 2017 was focused on extending and upgrading the
Brunswick Resource with the aim to convert as much to Reserve as possible. The focus in the
second half of 2017 was also on extending the Resource around Cuffley and Augusta to extend
the life of mine plan, replace the mined portion of the Mineral Resource and explore near-

Mandalay Resources - Costerfield Property NI 43-101 Technical Report
D E F I N E | P L A N | O P E R A T E 96
mine targets in close proximity to existing underground infrastructure. The goals achieved
included:
• Expanding and increasing the existing Indicated Resource of the Brunswick Lode, and
further definition and testing of Brunswick at depth and Brunswick South.
• Expanding the geological knowledge of and resource in the near mine environment,
in particular the extension and infill of the K Lode and N Lode splays, including the N
Lode East in the Augusta system.
• Definition and grade increase of C Lode.
In total 26,403 m of diamond drilling was undertaken. All drilling activity was conducted by
Starwest Pty Ltd using four Boart Longyear LM90s, one Boart Longyear LM75 and one
pneumatic Kempe U2 rig.
10.1.9 2018 – Youle and Brunswick
Exploration from January to December 2018 was predominantly focused on extending,
defining and upgrading the Youle Mineral Resource. A total of 20,847 m was devoted to
resource expansion and conversion drilling, with the remaining 13,809 m invested in target
generation.
Additionally, the focus for the second half of 2018 was on increasing the Resource around
Brunswick and Augusta to extend the life of mine, replace the mined portion of the Mineral
Resource and explore near-mine targets in close proximity to existing underground
infrastructure. The goals achieved included:
• Defined the Youle Lode, a west-dipping, high-grade ore body, identified as a
continuation of Kendall-style mineralisation.
• Delineated an Indicated Resource around Youle, which could be integrated into the
life of mine plan.
• Completed further definition and testing of Brunswick at depth.
• Expanded the geological knowledge of and resources in the near mine environment.
This included the extension and infill of Cuffley North Lode (1,272 m), D Lode (240 m)
and Cuffley line drilling (335 m).
• Brownfields drilling was also undertaken at Augusta East (1,479 m) looking for the
southern extension of the Augusta Deposit, and Mountain Creek (1,253 m) testing to
the south of the Brunswick Deposit.

Mandalay Resources - Costerfield Property NI 43-101 Technical Report
D E F I N E | P L A N | O P E R A T E 97
In total, 34,656 m of diamond drilling was undertaken. All drilling activity was conducted by
Starwest Pty Ltd using five Boart Longyear LM90s, one Boart Longyear LM75 and one
pneumatic Kempe U2 rig.
10.1.10 2019 Youle and Brunswick
Drilling from January to December 2019 was predominantly focused on extending, defining
and upgrading the Youle Resource. This drilling involved both infill and extensional drilling,
designed to delineate the high-grade Youle zone to the north and define mineralisation near
current and planned development. A total of 3,863 m was devoted to resource expansion
and resource conversion drilling, with the remaining 5,693 m designed for target generation.
The main focus of the target generation drilling was the close proximity to the Youle Resource,
in particular the northern extension of Youle and the McDonald’s Prospect to the north.
In May 2019, Mandalay Resources kicked off the Costerfield Property deep drilling program,
targeting below the Youle orebody. One parent drill hole and wedge were drilled as part of
this program totalling 2,510 m.
With the commencement of mining on the Youle Lode, underground resource definition
drilling continued at Youle together with the extensional drilling of production areas to be
mined in the next six to twelve months. Further confirmation of capital development was
undertaken through production optimisation drilling (POD), in order to provide confidence in
the grade, location of veining, geotechnical performance and viability of the mineralisation
ahead of mining.
As Mandalay Resources continued with the Youle expansion program, it also commenced
deep target testing of the Costerfield line of lode with the view to testing and understanding
the gold enrichment environment. This drilling program provided additional context for
previous deep high-grade gold intercepts at Augusta.
In 2019, the goals achieved included:
• Commencement of mining to the Youle Lode in September 2019.
• Initiation of the northern Youle extension program, aimed at extending the Youle
Resource to the north and at depth.
• Expanding and increasing the existing Indicated Resource of the Youle Lode.
• Regional target generation by conducting extensive surface mapping, drill hole
database integration, soil geochemistry and evaluation of geophysical data. This work
aided in the generation of a three dimensional Leapfrog Geo integrated structural and
geological model of the Costerfield Property region.

Mandalay Resources - Costerfield Property NI 43-101 Technical Report
D E F I N E | P L A N | O P E R A T E 98
• Expanding the orebody knowledge and resource tonnage in the near mine
environment, in particular the extension and infill of the Brunswick mineralised
system.
In total 9,556.0 m of diamond drilling was undertaken. All drilling activity was conducted by
Starwest Pty Ltd using five Boart Longyear LM90s, one Boart Longyear LM75, one pneumatic
Kempe U2 rig and one LM30 rig.
10.1.11 2020 Youle, Brunswick, Minerva, Browns/Robinsons, True Blue, Damper
Gully, Costerfield Deeps, and Minerva Testing.
Exploration drilling during 2020 was predominantly focused on extending, defining and
upgrading the Youle Resource. It involved both infill and extensional drilling designed to
delineate the high-grade Youle zone to the north, south, down-plunge, and above the
orebody in areas of historical mining, adjacent to current and planned development.
The focus of target generation was near the Youle Resource, in particular the northern
extension and at depth. Throughout 2020, 29,080 m of diamond drilling was undertaken, the
goals achieved included:
• Continued extensional drilling at depth, north and south of Youle, allowing the
definition of a high-grade gold domain at depth, as well as another emerging high-
grade plunge extension to the north at depth.
• Expansion of the existing Indicated Mineral Resource of the Youle Lode.
• Drilling above Youle to investigate instances of veining that were not extracted during
the historic mining at the Costerfield Property, suggesting the potential for further
undiscovered mineralisation around the historic workings that could be accessed from
the Youle infrastructure.
• A series of regional diamond testing programs (Browns, Robinsons, Damper Gully and
True Blue prospects) were designed and executed with the intent of testing the
potential around the Costerfield Property that could add to the life of the operation.
• Continued generation of the Leapfrog Geo integrated structural and geological model
of the Costerfield region.
• Expansion of the Youle orebody knowledge and resource tonnage in the near-mine
environment.
• Installation of the Brunswick portal.

Mandalay Resources - Costerfield Property NI 43-101 Technical Report
D E F I N E | P L A N | O P E R A T E 99
A four drill hole program testing the line of lode, designed to develop the understanding of
the gold mineralisation system, was completed for 1,977 m and provided additional
geological context for the previously intersected deep high-grade intercepts at Augusta.
With the commencement of mining on the Youle Lode in September 2019, underground
resource definition drilling continued at Youle, together with extensional drilling of
production areas to be mined in the next six to twelve months.
A series of regional diamond drilling programs were executed in Browns/Robinsons (6,123 m),
True Blue (695 m) and Damper Gully (561 m). Near-mine drilling, designed to drill-test areas
immediately adjacent to the current mining operations that could add to the life of mine plan,
included Kendell Upper (4,579 m), Youle Growth, Youle North, Youle South extension drilling
(13,990 m), and Minerva Testing (1,253 m).
In addition, Brunswick KR panel definition drilling (315 m) was undertaken in an attempt to
define mineralisation in the Kiwi to Rooster panel below the existing Brunswick mine
workings.
10.1.12 2021 Youle Plunge, Shepherd, Brunswick, Margaret Deeps, Browns, Cuffley
Deeps, Fox Fault, Bogong.
In total, 36.2 km of exploration drilling was completed during 2021 at Costerfield. A majority
(26.4 km) of this drilling focussed on the testing and conversion of mineralisation at the Youle
and newly identified Shepherd orebodies. The following was achieved:
• Down-plunge northern extension of the Youle orebody was realised, along with the
identification of a new series of gold-rich veins intersecting the footwall of Youle early
in the year (Shepherd zone).
• The Shepherd zone was then tested and expanded in all dimensions, resolving into
several discrete veins. A considerable amount of material was brought into the
Reserve, with scope to continue expansion drilling into 2022.
• A significant portion of the down-dip central portion of Youle with sparse drilling (the
“Youle Bight”) was infilled and converted.
• A deep hole (Shepherd Deeps, CD003) was drilled from underground at Youle, aimed
to locate a significant down-dip continuation of the Shepherd veining in the
hangingwall of the King Cobra Fault as delineated by the earlier CD001 deep testing
hole.
• An attempt to infill and upgrade the Cuffley Deeps mineralisation panel was made.
• Surface drill testing of the Fox Fault and associated mineralisation known from historic
Cuffley Deeps drilling, immediately down-dip of Cuffley Deeps.

Mandalay Resources - Costerfield Property NI 43-101 Technical Report
D E F I N E | P L A N | O P E R A T E 100
• Down-dip testing of the Brunswick system, between the Rooster and Adder Faults was
initiated.
• Continued testing of several different targets at Browns Prospect. The deep
Swallowtail thrust fault target was found to be mineralised in several drill holes,
although narrow and of moderate grade. The Bogong vein testing was completed early
in the year with mixed results, and earned a follow-up program to extend the highest-
grade portion identified in the previous program. The final drill hole of the Browns
Bogong follow-up program resulted in the highest grade intercept on the lode system
to date.
• Deep drilling at the Margaret Prospect was undertaken to test a newly generated
model of the area suggesting the zone of mineralisation at depth had not been
adequately tested with previous drilling.
Significant intercepts recovered for the Youle Lode have been presented in longitudinal
projection view in Figure 10-1 and Figure 10-2, and in cross-sectional view in Figure 10-3.

Mandalay Resources - Costerfield Property NI 43-101 Technical Report
D E F I N E | P L A N | O P E R A T E 101
Figure 10-1: Longitudinal Projection Displaying Significant Intercepts in the Youle 2021 Drilling (BC drill holes)

Mandalay Resources - Costerfield Property NI 43-101 Technical Report
D E F I N E | P L A N | O P E R A T E 102
Figure 10-2: Longitudinal Projection of the Shepherd (600) Vein Showing Significant Intercepts to 31 December 2021

Mandalay Resources - Costerfield Property NI 43-101 Technical Report
D E F I N E | P L A N | O P E R A T E 103
Figure 10-3: Cross Section at 7,050N Displaying the Relationship Between the Youle and Shepherd Zone Veins

Mandalay Resources - Costerfield Property NI 43-101 Technical Report
D E F I N E | P L A N | O P E R A T E 104
10.2 Drilling Methods
The Augusta Deposit has been subject to ongoing development and diamond drilling since
commencement of mining operations in 2006. The current Mineral Resource estimates are
completed using all historic drilling and then depleted for areas already mined.
Between 2006 and 2011, several drilling companies were contracted to provide both surface
and underground drilling services at the Costerfield Property. To ensure consistent results
and quality of drilling, Starwest Drilling Pty Ltd was selected as the preferred drilling services
supplier in 2011 and has been operating on site since.
Prior to 2011, various sized drill holes and drilling methods were used, including HQ2, HQ3,
NQ2, LTK60, LTK48 diamond core sizes, and 5”1/8’ to 5”5/8’ RC hammers. Details of these
drill holes were not always recorded, however, because the majority of this drilling was in
areas that have now been depleted by mining, any risk associated with this drilling is
considered to be low.
Since 2011, underground diamond drilling has been completed predominantly using an LM90
drill rig in HQ2 or NQ2 sized diamond drill holes. Underground Grade Control (UGGC) drilling
has been completed by either a Kempe or Diamec drill rig producing LTK48-sized diamond
core. Data collected from these drill holes has provided both structural and detailed grade
information.
In 2019, a LM30 drill rig, drilling BQ™TK, was utilised underground for additional UGGC
drilling. Surface drilling was undertaken using HQ2 and NQ2 sized core barrels, with HQ3 used
in zones of poor ground conditions or for noise reduction reasons.
10.3 Collar Surveys
Between the late 1990s and 2001, the majority of drill holes appear to have been located
using a Global Positioning Survey (GPS) survey instrument, while drill hole collar locations
prior to the 1990s were usually sighted by tape and compass. Where possible, historic drill
holes were surveyed in 2005 by Adrian Cummins and Associates, but this was not always
possible.
Collars surveyed after 2001 have been recorded in the acQuire™ drill hole database as being
surveyed, while unsurveyed/unknown drill holes have been recorded as being surveyed by
either GPS or an unknown method, and have been given an accuracy of within 1 m.
In 2006, drill hole collars began being surveyed using the Costerfield Property Mine Grid, and
were surveyed either by Mandalay Resources surveyors or by GWB Survey Pty Ltd. In
addition, between 2006 and 2011, Adrian Cummins & Associates provided surveying of both
underground and surface collar locations.

Mandalay Resources - Costerfield Property NI 43-101 Technical Report
D E F I N E | P L A N | O P E R A T E 105
Currently, initial collar locations are sighted and pegged using a hand-held GPS, with drilling
azimuths set-out by compass. Drill holes are then surveyed by Mandalay Resources surveyors
on completion. In some instances, drill hole collar data is modified to account for known and
quantified survey error within the mine.
10.4 Downhole Surveys
Between 2001 and 2018, all drill holes have been downhole surveyed by either electronic
single-shot or film single-shot survey methods. Prior to 2001, survey information exists for
the majority of drill holes, however the method of collection and records of these surveys are
no longer available.
The exclusive use of an electronic, single-shot survey tool has been in place since 2011. An
initial check survey is completed at 15 m to ensure that the collar set-up is accurate.
Thereafter, surveys are conducted at 30 m intervals, unless ground conditions are unsuitable
to conduct a survey, in which case the survey is completed when suitable ground conditions
are re-encountered.
In 2021, the IMDEX Hub-IQ™ system for recording, storing and transferring downhole survey
measurements was implemented onsite. This system removed the need for transcription of
surveys between the tool and the database.
Coinciding with the implementation of IMDEX Hub-IQ™, the REFLEX EZ-TRAC™ down hole
survey tool replaced all Reflex EZ-Shot™ single-shot downhole tool. The REFLEX EZ-TRAC™
provided the ability for direct interfacing with IMDEX Hub-IQ™ and to complete multi-shot
surveys, which became routine for end of hole surveys in 2021. Multi-shot surveys are
completed at 3 m intervals unless ground conditions or magnetic interference is unsuitable.
10.5 Data Management
In November 2016, Mandalay Resources Exploration purchased the Geoscientific Information
Management software acQuire™, due to the high rate of data collection occurring at the
Costerfield Property.
The installation of acQuire™ has improved the overall efficiency of the data collection and
handling systems, and the improved data integrity by minimising the likelihood of human
error.
10.6 Logging Procedures
The following information only relates to drilling completed after 1 January 2010 and below
the 1,000 mRL in the Augusta and Cuffley Deposits. Details of the full procedures are captured
in the internal SOP EXG_EXP_3007_PRC_Diamond Drilling Core Logging Procedure.

Mandalay Resources - Costerfield Property NI 43-101 Technical Report
D E F I N E | P L A N | O P E R A T E 106
Augusta diamond core is geologically logged at the core preparation facility located at the
Brunswick Complex. Core is initially brought to the facility by either the drill crews at the end
of shift or by field technicians who work in the core preparation facility. Core is generally
stored on pallets while waiting for processing.
Field technicians initially orientate all core using the orientation line provided by the drill
crews through the use of an electronic core orientation device during drilling. The orientation
line is transferred down along the length of the core run, where possible. If no orientation is
recorded by the drill crews, the core is simply rotated to a consistent alignment of bedding or
cleavage, with no orientation mark made on the core.
Downhole depths are marked on the core at one-metre intervals using a tape measure, taking
into account core loss and any over-drill. If core loss is encountered, a block is placed in the
zone of core loss and the core loss is recorded.
Field technicians collect rock quality designation (RQD) data directly onto a digital tablet
device using acQuire™ software. RQD data is collected corresponding to drill runs and
includes the from-depth, to-depth, run length in metres, the recovered length in metres, the
recovery as a percentage, the length of recovered core greater than or equal to 10 cm, and
the number of fractures. From this data, an RQD value is calculated. This data is logged
directly into acQuire™ via a Toughbook computer and stored on the company server.
After depth marks are placed on the core, site geologists log the lithology, structural data,
geotechnical data (if applicable) and mark the sampling intervals, all of which is then uploaded
directly to the acQuire™ database.
All measurements of structural features, such as bedding, cleavage, faults, and shears are
collected using an orientated core, wrap-around protractor for measuring beta angles and a
standard protractor for measuring alpha angles. If no orientation line is available, only alpha
measurements are collected. Measurements are recorded directly into the acQuire™
database via the Toughbook computer, and are also scribed onto the core using a wax pencil.
After geological logging has been completed and the core marked up, all core trays are
photographed before sampling. Once sampling is completed, the trays are placed on pallets
and moved to the permanent core storage area.
10.7 Drilling Pattern and Quality
10.7.1 Augusta
Drilling completed prior to 1 January 2010 informed areas of the resource that have largely
been mined, therefore, the following discussion relates to drilling completed after 1 January
2010 and below the 1,000 mRL.

Mandalay Resources - Costerfield Property NI 43-101 Technical Report
D E F I N E | P L A N | O P E R A T E 107
Drilling is generally conducted at a spacing of approximately 40 m by 30 m in the dip plane.
Since most drilling at Augusta is now competed from underground, the pattern and density
achieved on N Main Lode can vary greatly.
Where increased geological confidence is required, infill drill holes specifically targeting NE
Lodes or E Lodes have been drilled at a nominal 40 m spacing.
Surface drilling, targeting depth extensions of the Augusta Deposit, is generally conducted on
100 m sections along-strike, with intersections spaced at 80 m to 100 m in the dip plane.
10.7.2 Cuffley
Initial drilling of the Cuffley Lode was intended to be done in a dice-five pattern on an
approximate 50 m by 50 m offset grid. This pattern started with AD001 through to and
including AD004, however in order to aid interpretation, the drill spacing was expanded to a
100 m grid based on mine grid northings, with 50 m to 80 m between drill holes on each
section. This change of drill pattern enabled the interpretation to be completed on mine
northing sections.
Infill drilling between the 820 mRL and 1,020 mRL used a dice-five pattern to maximize
information in the strike direction. This infill drilling was conducted on a nominal 30 m (RL)
by 40 m (Northing) grid.
10.7.3 Brunswick
Drilling post 2010 has been conducted by defining and infilling the existing Inferred Resource,
based on the updated fault interpretation. Extension within the Penguin to Kiwi fault panel
used an initial dice-five pattern, which was then infilled using daughter wedge drill holes.
The Kiwi to Rooster fault panel was also drilled using a dice-five pattern with an approximate
spacing of 40 m.
10.7.4 Youle
Drilling was completed on an initial spacing of approximately 100 m to define the extent of
the mineralisation and determine an Inferred Resource. The infill drill hole spacing
accomplished was approximately 40 m to 50 m, using a combination of parent and daughter
wedge drill holes. Several drill holes were twinned by daughter wedge drill holes in order to
obtain metallurgical samples and duplicates of several high-grade gold zones.
A combination of west to east, and east to west drill holes were used to test both west-dipping
Youle style mineralisation, and Augusta/Brunswick style vertical mineralisation, however the
dominant drill hole orientation in the infill program at Youle was drilled west to east.

Mandalay Resources - Costerfield Property NI 43-101 Technical Report
D E F I N E | P L A N | O P E R A T E 108
Youle underground drilling was completed to provide increased geological confidence ahead
of mining, and for near mine exploration along-strike and down-dip of the Youle Lode.
10.8 Interpretation of Drilling Results
Drilling results are initially interpreted on paper cross-sections, which are then scanned and
geo-referenced in the mine planning software package Surpac™ or Leapfrog Geo™. The
scanned sections are then used to generate wireframes (Figure 10-4). Mappable stratigraphic
units have been represented by various colours, while faults and mineralised lodes have been
marked with heavy black lines.
Figure 10-4: Example Cross-section of the Augusta Deposit at 4,300 mN, Post Drilling and Geological Interpretation
Mandalay Resources have recently implemented the use of the implicit software package
Leapfrog Geo to assist in the structural, geological and geochemical interpretation of drill hole
data and surface mapping in 3D space.
10.9 Factors that could Materially Impact the Accuracy of the Results
The factor that has the greatest potential to materially impact the accuracy of drilling results
is the core recovery. Historically, this was an issue for all methods of drilling in the Augusta
area. Mandalay Resources has employed methods of drilling and associated procedures to
ensure the highest recovery of sample possible. Where sample recovery is poor (typically

Mandalay Resources - Costerfield Property NI 43-101 Technical Report
D E F I N E | P L A N | O P E R A T E 109
>0.1 mcore loss, or when there is clear textual evidence), a repeat drill hole is completed by
drilling a daughter wedge drill hole.
Information gained from historical drilling has been used in resource estimation of the
Augusta and Brunswick deposits, however, as much of the historically drilled area has now
been depleted by mining, the risk associated with these historical holes was considered
minimal.
Surveys of the collar location and downhole surveying methods applied at the Costerfield
Property follow industry best practice. The location of each drill hole is surveyed within
millimetre accuracy.
Sampling is of a consistent and repeatable nature, with appropriate QAQC sampling
methodologies employed, and the assay method used is considered to be appropriate for the
style of mineralisation.

Mandalay Resources - Costerfield Property NI 43-101 Technical Report
D E F I N E | P L A N | O P E R A T E 110
11 SAMPLE PREPARATION, ANALYSES AND SECURITY
The sample preparation and analysis processes detailed in this section of the Technical Report
has been in place for several years and are considered by the QP to be adequate for use in
the estimation of a Mineral Resource.
11.1 Sampling Techniques
Samples were routinely collected and analysed from diamond drill core and channel samples
from the ore development drive faces.
Sample weights for samples used in the 2021 MRE are summarised in Table 11-1, contrasting
the two primary sample methods of diamond drilling and face sampling.
Table 11-1: Summary of Sample Weights in the 2021 MRE for the re-estimated 2021 Models
Diamond Drill Hole Samples
Underground Channel Samples
All Samples Combined
Count 843 3221 4064
Mean (kg) 1.22 2.22 2.0
Standard Deviation (kg)
0.79 0.92 0.98
Minimum (kg) 0.17 0.20 0.17
Maximum (kg) 5.81 8.58 8.58
11.1.1 Diamond Core Sampling
The mineralisation style at the Costerfield Property is now well-understood and the geological
controls on mineralisation well-established. Sampling intervals were based on geological
characteristics and marked on the diamond drill core by Mandalay Resources geologists.
Mineralisation was always clearly visible and therefore, systematic sampling of complete drill
holes was not required.
The general rules that were followed in the selection of sample intervals were:
• All stibnite-bearing veins were sampled,
• Intersections of stockwork veins, laminated quartz veins or massive quartz veins were
routinely sampled,
• Waste samples were collected from either side of the mineralized vein in order to
determine the grade of the waste material immediately adjacent to the
mineralisation. These waste samples ranged from 0.3 m to 1 m in downhole length,

Mandalay Resources - Costerfield Property NI 43-101 Technical Report
D E F I N E | P L A N | O P E R A T E 111
• Siltstone was sampled where disseminated arsenopyrite was observed,
• Fault gouge zones were sampled at the discretion of the geologist.
Diamond core sampling intervals were standardised wherever possible and ranged from 5 cm
to 1 m in length. The average sample length for drill core samples within the 2021 Youle and
Shepherd drilling program was approximately 0.35 m.
Where there was a definitive lithological contact that marked the boundary of a sample, the
sample was cut along the contact. If by doing this, the sample was less than 5 cm in length,
the boundary of the sample was taken at a perpendicular distance from the centre of the
sample, which achieved the 5 cm minimum sample length requirement.
A Mandalay Resources exploration field technician undertook the sampling of the diamond
drill core. To obtain consistent samples for analysis and retention, the diamond drill core was
cut perpendicular to the core axis at the downhole sampling points and then cut in half (where
half core sampling was completed) lengthways with an Almonte automated diamond saw. In
response to the visible gold in Shepherd, whole core samples were taken through the
Shepherd orebody.
Drill holes that were designed for metallurgical analysis were sampled in intervals up to 2 m
in length.
11.1.2 Underground Channel sampling
Ore drive face channel samples (face samples) were taken by Mandalay Resources geologists
at a frequency of between 1.8 m and 5 m along the drive. The data was collected on portable
handheld computers (iPad) utilising the digital capture software RockMapper™. The following
method was used:
• The face was marked up by the sampler to show the contacts of the mineralisation,
the bedding angle, and any geological structures that may offset the lode,
• Sample locations were determined so that the sample was collected perpendicular to
the dip of the mineralisation, from the FW to the HW,
• The face size and sample lengths were measured,
• Each sample was collected as a channel sample using a geological hammer or
pneumatic chisel, and placed into pre-numbered sample bag with a unique ID,
• Care was taken to obtain a sample considered representative by the sampling
geologist,

Mandalay Resources - Costerfield Property NI 43-101 Technical Report
D E F I N E | P L A N | O P E R A T E 112
• Where there were two or more mineralised structures in the face, samples were also
taken of the intervening waste,
• Sample lengths ranged from 5 cm to 1.5 m across the mineralisation, and typically
weighed between 1 kg and 3 kg,
• The face was labelled with the heading, dated and photographed into RockMapper™,
• The area of lode and waste was drawn onto the photo in RockMapper™,
• Key features were sketched digitally directly onto the RockMapper™ software and
sampling and structural data recorded,
• On completion, data from the RockMapper™ files were automatically uploaded to the
drill hole database,
• A record of the face photos, annotations, and sampling files was saved on the
Mandalay Resources server,
• The location and orientation of the face was derived using the distance from survey
marks and the survey pickup of the drive using Surpac™ and RockMapper™ to produce
a georeferenced face photo.
• The coordinates, orientation and dip of the channel were derived from the
georeferenced face photo using RockMapper™ with the resulting data stored in the
drill hole database.
• The face photo and channel data were validated against the survey pickup.
• A digital mesh derived from photogrammetry by RockMapper™ had the drive photo
overlayed and were then displayed in Leapfrog for validation against the channel
sample.
Wall channel samples were rarely taken at the Costerfield Property and where they were
taken the procedure followed the same process as above.
11.2 Data Spacing and Distribution
Within the Augusta, Cuffley, Brunswick and Youle Deposits, the distance between drill hole
intercepts was approximately 40 m by 40 m. This was reduced to 20 m by 20 m in areas of
structural complexity. For the Shepherd Zone the distance between drill hole intercepts was
set at a nominal spacing of 40 m.

Mandalay Resources - Costerfield Property NI 43-101 Technical Report
D E F I N E | P L A N | O P E R A T E 113
11.3 Assaying Laboratories
Routine assaying of the diamond drill core and face samples was completed by On Site
Laboratory Services (On Site) in Bendigo, which is independent of Mandalay Resources and
holds current ISO/IEC 17025 accreditation.
Mandalay Resources dispatch samples to On Site after which the On Site assay laboratory’s
personnel completed sample preparation and chemical analysis. Results were returned to
Mandalay Resources staff, who validated and loaded the assay data into the relevant
databases.
ALS Global Brisbane and Bureau Veritas Perth have been used to verify the accuracy of assays
completed by On Site through the completion of quarterly umpire check analyses of selected
samples (Section 11.6.1).
11.4 Sample Preparation
The following sample preparation activities were undertaken by Mandalay Resources staff for
both diamond drill core and underground channel samples:
• Sample information and characteristics were measured, logged, in the case of drill
core, and recorded in the acQuire™ database and a unique sample ID assigned,
• Sample material was placed into a calico bag previously marked with the unique
sample ID,
• Calico bags were loaded into plastic bags such that the plastic bags weighed less than
10 kg,
• An assay submission sheet was generated and placed into the plastic bag,
• Plastic bags containing samples were sealed with a metal tie and transported to On
Site in Bendigo via private courier or Mandalay Resources staff.
The following sample preparation activities were undertaken by On Site staff:
• Samples were received and checked for labelling, missing samples etc. against the
submission sheet,
• If the sample batch matched the submission sheet, sample metadata was entered in
the On Site’s Laboratory Information Management System (LIMS). In the event that
discrepancies were noted, Mandalay Resources was contacted by On Site to resolve
the discrepancy prior to further work commencing. Records of all discrepancies and
corrective actions taken are recorded by the Mandalay database administrator,

Mandalay Resources - Costerfield Property NI 43-101 Technical Report
D E F I N E | P L A N | O P E R A T E 114
• A job number was assigned, and worksheets and sample bags prepared,
• Samples were placed in an oven and dried overnight at 106°C,
• Samples were weighed and recorded,
• The entire dried sample was crushed using a Rocklabs Smart Boyd Crusher RSD
Combo1 with a jaw closed side setting of 2mm,
• If the dried sample weight was less than 3 kg, the entire sample was retained for
pulverisation. If the dried sample weight was greater than 3kg, the sample was spilt
to 3kg using the rotary splitter that is incorporated in the Boyd crusher,
• Rejects from greater than 3 kg splits were retained as coarse rejects in labelled calico
bags and returned to Mandalay Resources,
• The 3kg sample was then pulverized in an Essa® LM5 Pulverising Mill2 to 90% passing
75µm,
• The 3kg pulverised samples were then subsampled to take a 200g split for assay by a
manual scooping procedure across the full width and depth of the mill bowl and
loaded sequentially into labelled pulp packets,
• For every 21 primary samples, two samples are randomly selected by the Laboratory
Information Management System (LIMS), and a duplicate 200g split was taken, loaded
into labelled pulp packets, and submitted for analysis using the same analytical
procedure as the primary sample,
• The remaining pulp was returned to its sample bag and then returned to Mandalay
Resources for retention following the completion of assay.
The percentage of sample passing < 75µm was checked as part of the 2021 screen fire assay
campaign. A mean of 93.5% was achieved (Table 11-2) which is within the target 90% passing
< 75µm.
Table 11-2: Statistics for percentage passing a 75µm grind size; target is 90%
Percentage Passing 75µm
Mean 93.5%
1 https://www.scottautomation.com/assets/Resources/Smart-BOYD-RSD-Brochure-English.pdf 2 https://flsmidth-prod-cdn.azureedge.net/-/media/brochures/brochures-products/sampling-preparation-
and-analysis/essa-lm5-pulverising-mill.pdf

Mandalay Resources - Costerfield Property NI 43-101 Technical Report
D E F I N E | P L A N | O P E R A T E 115
Median 92.9%
Standard Deviation
3.6%
Minimum 85.6%
Maximum 99.9%
11.5 Sample Analysis
Diamond drill core and face/wall channel samples were routinely assayed by On Site for gold,
antimony, arsenic, and iron.
11.5.1 Gold Analysis
Gold grades were determined by Fire Assay (FA) with an Atomic Absorption Spectroscopy
(AAS) finish.
A campaign of Screen Fire Assays (SFA) was used in the Shepherd deposit throughout 2021 in
response to an observed increase in visible gold.
SFA analysis was completed at On Site using the entire core sample mass and 75µm meshes.
The greater than 75µm was fired to extinction and two samples taken from less than 75µm
component. Homogenisation of the less than 75µm sample component (N=482, mean of
22g/t Au) was excellent with an observed correlation coefficient of 0.998.
In total, 449 sample pairs were completed by an initial FA and base metal report, before SFA
was completed on the remainder. The relationship shown in Figure 11-1 demonstrated the
strong agreement between the two sample sets. It was interpreted by Mandalay Resources
and the QP from this relationship that both FA and SFA were suitable for the resource
estimation of the Shepherd mineralisation.

Mandalay Resources - Costerfield Property NI 43-101 Technical Report
D E F I N E | P L A N | O P E R A T E 116
Figure 11-1: Analysis for gold via Fire Assay or Screen Fire Assay, illustrating a comparison of 449 pairs on a logarithmic scale
11.5.2 Antimony Analysis
Antimony concentrations were determined using an aqua regia based acid digest with an ICP-
OES finish at low-detection levels, and with an AAS finish at high antimony levels (>0.6% Sb).
11.5.3 Arsenic, and Iron Analysis
Arsenic and iron were prepared as above with aqua regia digestion and an AAS or ICP-OES
finish.
11.6 Laboratory Reviews
Mandalay Resources personnel have conducted periodic visits to the On Site facility in
Bendigo and met regularly with the laboratory managers to review laboratory performance.
During 2021 the scheduled in-person visits were suspended due to COVID19 restrictions.
Tours of the laboratory were normally completed in the presence of On Site’s Laboratory
Manager, Mr Rob Robinson. Notes and minutes from laboratory visits and meetings with
laboratory staff have been maintained as records on the Mandalay Resources server.
11.6.1 Umpire Check Analyses
Mandalay Resources have conducted umpire check analysis programs quarterly. This process
involved obtaining pulp sample splits from On Site and submitting a pulp-duplicate sample to

Mandalay Resources - Costerfield Property NI 43-101 Technical Report
D E F I N E | P L A N | O P E R A T E 117
two different laboratories for umpire analysis (Section 11.7.4). The process used to split the
samples for analysis by umpire laboratories is consistent with Method C Standard Practice in
ASTM Designation C702 C702M-11 (ASTM, 2011), with a 50g aliquot of pulverized material
being extracted per sample for each umpire laboratory.
11.7 Assay Quality Assurance/Quality Control
The following sections relate to the Quality Assurance/Quality Control (QAQC) samples
submitted and returned to Mandalay Resources from 1st January 2021 to 31st December 2021.
A detailed review of the QAQC from previous drilling programs informing the 2021 year-end
block models can be found in the following previously issued NI 43-101 Technical Reports:
Youle Block Models (500 series):
• 2020 Youle Ongoing Extension (MP, 2021),
• 2019 Youle Mining and Expansion Program (SRK, 2020),
• 2018 Youle Infill Program (SRK, 2019),
• 2017 Youle Exploration Program (SRK, 2018).
Brunswick Block Model (310):
• 2019 Brunswick Development (SRK, 2020),
• 2018 Brunswick Mining and Extension Drill Program (SRK, 2019),
• 2017 Brunswick Conversion Drill Program (SRK, 2018),
• 2016 Brunswick Recommencement Program (SRK, 2017).
QAQC results of pre-2021 block models that were not re-estimated as part of this Mineral
Resource and Mineral Reserve update can be found in the previous NI 43-101 Technical
reports. For the relevant report years, the reader is referred to the drilling summary (Section
10.1).
In total, four project specific certified reference materials (CRM) produced from Costerfield
Property ore and two commercial CRMs were routinely inserted into dispatches during 2021
to monitor the performance of assay quality and accuracy (Table 11-3).
The four project specific CRMs, MR-C2, MR-F2, MR11-01 and GSB-02, have been prepared
from ore grade material collected from the Augusta and Brunswick Deposits. The
homogenisation, analysis and certification of these CRMs was performed and/or coordinated

Mandalay Resources - Costerfield Property NI 43-101 Technical Report
D E F I N E | P L A N | O P E R A T E 118
by Geostats Pty Ltd (Geostats). Mandalay Resources also used two commercially available
CRMs from ORE Research and Exploration Pty Ltd (OREAS).
Table 11-3: Certified Reference Materials and certified assay methods
CRM Name Material Source Certifying
Laboratory Au
Method Sb Method 1 Sb Method 2
MR-C2 Costerfield – Ore Geostats Fire
Assay 4AD/ICP Fusion/ICP
MR-F2 Costerfield – Ore Geostats Fire
Assay 4AD/ICP Fusion/ICP
MR11-01 Costerfield – Concentrate Geostats Fire
Assay 4AD/ICP Fusion/ICP
GSB-02 Commercial Geostats Fire
Assay Fusion/ICP Fusion/XRF
OREAS239 Commercial OREAS Fire
Assay Aqua Regia/ICP NA
OREAS247 Commercial OREAS Fire
Assay 4AD/ICP NA
At least one CRM was submitted with every batch of diamond core samples and typically at a
rate of 1 standard per 25 samples. CRMs were submitted at a similar rate in the underground
face/wall channel sample batches, which typically included two different CRMs per batch.
An assay result for a CRM was considered acceptable when the returned assay fell within
three standard deviations (SD) of the CRM certification grade. Outside this range, the CRM
assay was considered to have failed and all significant mineralised samples within the batch
were re-assayed, where significant grades were defined as mineralised samples that may have
a material-impact in future resource estimates. All actions or outcomes were recorded as
comments in the QAQC register.
11.7.1.1 Antimony analysis precipitation issues
The geochemical analysis of antimony may suffer from two key issues:
− Precipitation issues as an antimony-chloride in the presence of hydrochloric acid (HCl)
that is used in an aqua regia and four-acid digestion (4AD; Hu and Qi, 2014),
− Volatilisation as an antimony fluoride in 4AD (Hu and Qi, 2014).
The precipitation issue of antimony chloride may extend to fusion digestion methods if the
fusion bead is dissolved by hydrochloric acid (HCl) for nebulisation in ICP analysis, but with
the reduced acid dilution factors to dissolve the bead relative to 4AD, and active observation
for evidence of precipitation this issue can be managed.

Mandalay Resources - Costerfield Property NI 43-101 Technical Report
D E F I N E | P L A N | O P E R A T E 119
The routine lab, On Site Laboratory, have considerable experience in the analysis of high-
grade antimony samples typical of the Costerfield Property and other regional operations,
and it follows a proprietary assaying method that has been developed to report ore-grade
level antimony values. On Site uses an Aqua Regia style preparation to negate analytical
technique issues encountered with antimony chloride precipitation and is finished with an
ICP-OES (low-level detection limit) or an AAS finish (high-level detection limit).
Umpire lab checks of quarterly results were undertaken by fusion digestion with an XRF finish.
The use of an XRF finish negated the issues associated with dissolution and chloride
precipitation and are considered by Mandalay and the QP to be the most reliable.
To address the uncertainty in the CRM performance described in the 2021 NI43-101 Technical
Report (MP, 2021), where MR-C2 and MR-F2 were observed to have a high bias, the following
work was undertaken:
- All CRM certificates were reviewed.
- An internal review of the On Site (routine lab) assay results versus the certified values.
- Additional CRM material sent with the quarterly umpire check-assay programs.
MR-C2 and MR-F2 were found to have been reported against the 4AD values for the 2021
NI43-101 (MP, 2021) and were corrected to the Fusion/ICP certification values, which were
assessed by Mandalay and the QP as performing adequately to ensure quality control in
routine analysis. Refer also to the routine antimony control plots in Figure 11-18 (MR-C2) and
Figure 11-19 (MR-F2) for discussion of analysis by On Site.
Umpire lab check assay results for the CRMs are presented in the following Section 11.7.1.2
and the primary check-assay results in Section 11.7.4. Table 11-4 details the performance of
the CRMs in use at Costerfield relative to the umpire labs, the routine lab, certification, and
the internal value derived from the year’s routine analysis.
11.7.1.2 Umpire Check Assay Program – CRMs
As part of the CRM improvement work, additional CRMs were added to the umpire checks
through each quarter to verify antimony certifications utilising Fusion/XRF. A total of 105
CRMs were submitted during this process, divided between the three participating
laboratories. Table 11-4 details the results of this study. The final column in the table also
displays the mean value, after removal of outliers, of all Sb assay results reported by On Site
during the reporting period. These results are subsequently referred to as the “Sb Internal
Values”. The detection limit for Sb analyses was 0.01.

Mandalay Resources - Costerfield Property NI 43-101 Technical Report
D E F I N E | P L A N | O P E R A T E 120
Table 11-4: Results for CRMs submitted to participating labs for umpire checks
CRM by Lab Number Submitted
Average Au Value g/t
Average Value Sb %
Au cert. Value g/t
Sb cert. Value %
Sb Internal Value % (N)
GSB-02 21 23.95 30.43 23.64 31.08 31.04 (484)
ALS 7 23.07 29.81 23.64 31.08 BV 7 23.70 30.63 23.64 31.08 OSLS 7 24.94 30.86 23.64 31.08
MR11-01 15 115.61 55.54 116.00 54.50 55.14 (75)
ALS 5 115.20 56.00 116.00 54.50 BV 5 116.03 55.66 116.00 54.50 OSLS 5 115.60 54.96 116.00 54.50
MR-C2 15 75.89 53.25 76.70 53.25 53.99 (215)
ALS 5 74.58 52.42 76.70 53.25 BV 5 77.12 53.08 76.70 53.25 OSLS 5 75.98 54.26 76.70 53.25
MR-F2 18 12.13 3.89 12.15 3.96 3.98 (325)
ALS 6 11.77 3.83 12.15 3.96 BV 6 12.59 4.00 12.15 3.96 OSLS 6 12.05 3.86 12.15 3.96
OREAS239 18 3.54 0.10 3.55 0.05 0.05 (781)
ALS 6 3.47 0.07 3.55 0.05 BV 6 3.61 0.16 3.55 0.05 OSLS 6 3.54 0.06 3.55 0.05
OREAS247 18 39.98 0.39 42.96 0.33 0.35 (214)
ALS 6 40.75* 0.41 42.96 0.33 BV 6 42.60 0.42 42.96 0.33 OSLS 6 42.93 0.35 42.96 0.33
* Two outliers removed for gold, OREAS247
The umpire lab check assays of the CRMs confirm that all bar two of the CRMs in use at the
Costerfield Operation are performing well against their certification. This includes MR-C2 and
MR-F2 that were of concern in the 2021 NI43-101 (MP,2021).
MR11-01 (FUS/ICP) and OREAS 247 (4AD/ICP) indicated higher results in both routine analysis
and umpire check program, likely for the reasons described above (see Section 11.7.1.1). The
routine analysis control plots for MR11-01 and OREAS247 are presented in Figure 11-16 and
Figure 11-23, with both the certification and the Sb Internal Values indicated. Both CRM
results display a visual high bias, with MR11-01 results falling within +/-3σ of the certification,
and the spread of OREAS247 falling outside +/-3σ.
Due to the agreement between the routine analysis, the umpire labs, and with an
understanding of the analysis issues, the Sb Internal Values were relied on for routine quality
control of OREAS 247 and MR11-01 antimony values.

Mandalay Resources - Costerfield Property NI 43-101 Technical Report
D E F I N E | P L A N | O P E R A T E 121
The graphical control plots of the average CRM results by lab have been provided in Figure
11-2 to Figure 11-12 below. They show comparable results against the certified values for
gold, with two removed outliers and a lower overall ALS result for OREAS247 being the
exception. The antimony results, as discussed above, display good accuracy for all CRMs
except for OREAS247 and MR11-01. OREAS247 (Figure 11-12) and MR11-01 (Figure 11-11)
certified values are displayed in addition to the routine analysis derived internal statistics.
These plots show departure from the certification for both the umpire lab and routine analysis
results, which Mandalay and the QP consider acceptable.
Figure 11-2: CRM GSB-02, umpire check assay batches, Au
Figure 11-3: CRM MR-C2, umpire check assay batches, Au

Mandalay Resources - Costerfield Property NI 43-101 Technical Report
D E F I N E | P L A N | O P E R A T E 122
Figure 11-4: CRM MR-F2, umpire check assay batches, Au
Figure 11-5: CRM OREAS239, umpire check assay batches, Au

Mandalay Resources - Costerfield Property NI 43-101 Technical Report
D E F I N E | P L A N | O P E R A T E 123
Figure 11-6: CRM OREAS247, umpire check assay batches, Au
Figure 11-7: CRM MR11-01, umpire check assay batches, Au

Mandalay Resources - Costerfield Property NI 43-101 Technical Report
D E F I N E | P L A N | O P E R A T E 124
Figure 11-8: CRM GSB-02, umpire check assay batches, Sb
Figure 11-9: CRM MR-C2, umpire check assay batches, Sb

Mandalay Resources - Costerfield Property NI 43-101 Technical Report
D E F I N E | P L A N | O P E R A T E 125
Figure 11-10: CRM MR-F2, umpire check assay batches, Sb
Figure 11-11: MR11-01, umpire check assay batches, Sb, plotted against certification and the internal statistics from routine analysis

Mandalay Resources - Costerfield Property NI 43-101 Technical Report
D E F I N E | P L A N | O P E R A T E 126
Figure 11-12: OREAS247, umpire check assay batches, Sb, plotted against certification and the internal statistics from routine analysis
11.7.1.3 CRM Results
The assay results for the reporting period are presented in the below control plots against
certification values. Comparisons are made relative to the routine-derived internal values for
antimony results of OREAS-247 and MR11-01 for the reasons described in the preceding
sections. Bias and trends were visually assessed via the control plots and calculated when
observed.
A review of the CRM results for the reporting period indicated the following:
• GSB-02: CRM Certified Result 23.64 g/t Au and 31.08% Sb
o Au +2.2% bias describing a routine-analysis mean of 24.15 g/t Au for the reporting
period with consistent precision. This bias is being followed up with the routine
laboratory. (Figure 11-13).
Figure 11-13: GSB-02 gold standard CRM control plot

Mandalay Resources - Costerfield Property NI 43-101 Technical Report
D E F I N E | P L A N | O P E R A T E 127
o Sb: Slight positive trend at the start of the period that nor malised to good
compliance for the remaining period (Figure 11-14).
Figure 11-14: GSB-02 antimony standard CRM control plot
• MR11-01: CRM Certified Result 116.04 g/t Au, 54.5% Sb; Internal Value: 55.14% Sb
(N=75)
o Au: Good compliance with a tight precision (Figure 11-15).
Figure 11-15: MR11-01 gold standard CRM control plot
o Sb: Good compliance with the internal mean value and range. +1.2% bias against
certification with routine analysis performing within +3σ of certification. Umpire
lab analysis utilising Fusion/XRF supports the higher internal value obtained
through the reporting period and indicates this bias is not of concern. Both the
CRM and internal values, as well as respective standard deviations, are presented
in Figure 11-16.

Mandalay Resources - Costerfield Property NI 43-101 Technical Report
D E F I N E | P L A N | O P E R A T E 128
Figure 11-16: MR11-01 antimony standard CRM control plot, with routine analysis derived internal statistics illustrated showing a high bias to the certification
• MR-C2: CRM Certified Result 76.7/t Au and 53.25% Sb
o Au: Good compliance with a slight upward trend towards the end of the period.
One outlier returned over ±2σ (Figure 11-17).
Figure 11-17: MR-C2 gold standard CRM control plot
o Sb: Good compliance to certification with a slight high bias and tight precision (see
Figure 11-18).

Mandalay Resources - Costerfield Property NI 43-101 Technical Report
D E F I N E | P L A N | O P E R A T E 129
Figure 11-18: MR-C2 antimony standard CRM control plot
• MR-F2: CRM Certified Result 12.15 g/t Au and 3.96% Sb
o Au: slight low trend in first half of the period but otherwise good compliance
(Figure 11-19).
Figure 11-19: MR-F2 gold standard CRM control plot
o Sb: Good compliance through the period. Two low failures outside +3SD. Of the
two failures, one was accepted due to the immaterial Sb grades and the second
failure was accepted due to the potential under-call being immaterial to the high-
grade antimony present in the face sample batch (Figure 11-20). MR-F2 was
removed from grade-control use as a result.

Mandalay Resources - Costerfield Property NI 43-101 Technical Report
D E F I N E | P L A N | O P E R A T E 130
Figure 11-20: MR-F2 antimony standard CRM control plot
• OREAS239: CRM Certified Result 3.55 g/t Au and 0.05% Sb
o Au: Moderate compliance with undulating trends throughout the period (Figure
11-21). This CRM was utilised predominantly for regional exploration drilling
programs.
Figure 11-21: OREAS239 gold standard CRM control plot
o Sb: The reference value for this CRM was below the range of interest and this
standard has been treated as a gold only CRM in dispatches and paired with a
higher-grade additional Sb CRM.
• OREAS247: CRM Certified Result: 42.96 Au g/t and 0.33% Sb. Internal value of 0.35%
Sb (N=214)
o Au: Good compliance for the first half of the period before a solitary high and then
low trend in the second half (see Figure 11-22). There was one high failure and two

Mandalay Resources - Costerfield Property NI 43-101 Technical Report
D E F I N E | P L A N | O P E R A T E 131
low failures, which were accepted due to immaterial primary results in the batch
and/or additional supporting CRMs.
Figure 11-22: OREAS gold standard CRM control plot
o Sb: Relative to the certification value the routine analysis (Figure 11-23) shows a
+6.2% bias and performed in part outside +3σ a due to the precipitation issues
affecting the 4AD/ICP method. Relative to the internal statistics derived from
routine-analysis there is good compliance with the internal mean and deviation,
with a trend to low results appearing towards the end of reporting. One failure at
the end of the reporting period in a gold-only assay batch was accepted due to
being non-material.
Figure 11-23: OREAS247 antimony standard CRM Plot with routine analysis derived internal statistics illustrated showing a high bias to the certification

Mandalay Resources - Costerfield Property NI 43-101 Technical Report
D E F I N E | P L A N | O P E R A T E 132
11.7.1.4 CRM Results Discussion
The routine analysis undertaken by On Site is deemed by Mandalay Resources and the QP to
be performing well relative to the CRMs used for the 2021 period. This represents an overhaul
in the CRM performance relative to the 2021 NI43-101 (MP, 2021) and meets the QP’s
recommendations from the previous report.
In general, tight precision was obtained for the gold and antimony CRM results through the
period with only minor trends. Accuracy was generally good, with a minor bias observed in
GSB-02 (2.2%) for gold and MR-C2 (1.4%) for antimony. These biases are not deemed material
when considered with the umpire lab results for the routine analysis duplicates (Section
11.7.4).
OREAS247 and MR11-01 illustrated certification issues, discussed in Sections 11.7.1.1 and
11.7.1.2, with the CRM value found to be under-calling during both routine and umpire lab
analysis. The routine analysis derived internal values for both OREAS247 and MR11-01,
supported by the umpire lab checks, is deemed to be adequate for routine quality control. In
the case of MR11-01 this internal mean and routine results still fall within 3σ of the certified
value.
Additional CRMs are being prepared to replace MR-C2, MR11-01, MR-F2 and GSB-02, and are
scheduled to be available Q1 of 2022. The CRMs will have Fusion/XRF and Aqua Regia based
certifications to permit tighter quality control.
11.7.2 Blanks
Mandalay Resources submitted uncrushed samples of basalt as Blank material sourced from
GeoStats into assay sample lots, at a rate of 1 in every 30 samples, to test for contamination
during sample preparation. Additionally, quartz washes were added after every material
sample to prevent contamination from high grade gold for all samples assayed in the 2021
period (Figure 11-26).
Measures to control contamination at On Site include cleaning of the mill pulverisers and the
crusher with a high-pressure air gun as well as each mill pulveriser being placed in venting
cabinets with high-power extraction fans and the use of quartz washes between samples
The failure threshold for gold is 0.10 g/t, which was chosen since it represents ten times the
detection limit of 0.01 g/t for AAS. The failure threshold for antimony is 0.05%, which was
chosen for being five times the detection limit of 0.01% for AAS.
The Blank results, as displayed in Figure 11-24 and Figure 11-25, demonstrated a 99% passing
rate for gold blanks and a 99% pass for antimony blanks. There were two gold failures, which
were accepted due to assayed quartz washes included in the batch confirming contamination
had been limited to the Blank samples. There was one antimony failure which was accepted

Mandalay Resources - Costerfield Property NI 43-101 Technical Report
D E F I N E | P L A N | O P E R A T E 133
due to being deemed a non-material fail relative to the low tenor of face grades of the
submission.
The quartz wash analyses (N=472) displayed in Figure 11-26 illustrated good hygiene of the
routine analysis at On Site, with a mean of 0.07g/t Au and only 17 samples above 0.2g/t Au.
One outlier was present, at 8.9g/t Au, with the remainder non-material to the grade of the
veins being analysed.
Figure 11-24: Gold Blank assay control plot
Figure 11-25: Antimony Blank assay control plot

Mandalay Resources - Costerfield Property NI 43-101 Technical Report
D E F I N E | P L A N | O P E R A T E 134
Figure 11-26: Gold quartz washes control plot
11.7.3 Pulp Duplicates
A total of 735 results for pulp duplicated with > 0.16 Au g/t have been completed by On Site
for gold and 353 over > 0.16 Sb % for antimony (Table 11-5 and Table 11-6). The duplicates
were assayed as separate aliquots from the same sample pulp from both exploration drill core
samples and mine face/wall channel samples.
Table 11-5: Pulp duplicate gold statistics
Description Original Duplicate
Number of samples 735 735
Mean 51.71 51.61
Maximum 1,350 1,160
Minimum 0.16 0.12
Population Std Dev 112.74 111.74
Coefficient of Variation 2.18 2.17
Bias 0.18%
Correlation Coefficient 0.98
Percentage of samples < 10% Relative Paired Difference 75.65
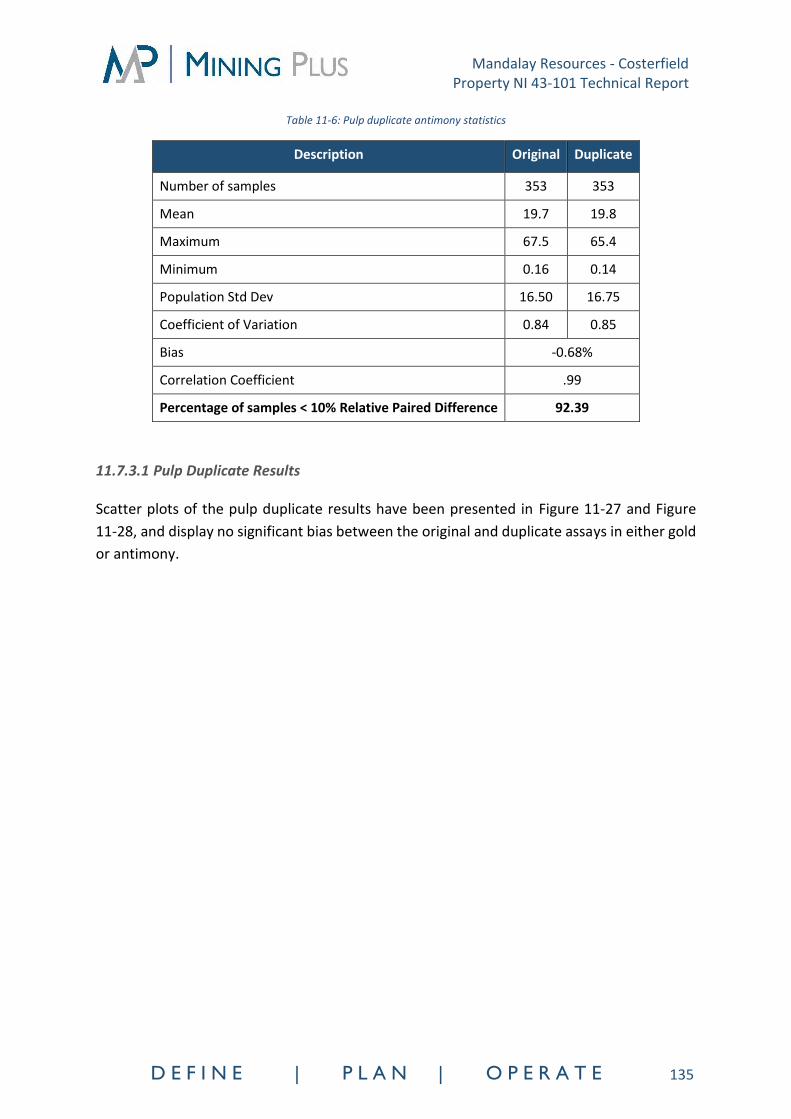
Mandalay Resources - Costerfield Property NI 43-101 Technical Report
D E F I N E | P L A N | O P E R A T E 135
Table 11-6: Pulp duplicate antimony statistics
Description Original Duplicate
Number of samples 353 353
Mean 19.7 19.8
Maximum 67.5 65.4
Minimum 0.16 0.14
Population Std Dev 16.50 16.75
Coefficient of Variation 0.84 0.85
Bias -0.68%
Correlation Coefficient .99
Percentage of samples < 10% Relative Paired Difference 92.39
11.7.3.1 Pulp Duplicate Results
Scatter plots of the pulp duplicate results have been presented in Figure 11-27 and Figure
11-28, and display no significant bias between the original and duplicate assays in either gold
or antimony.
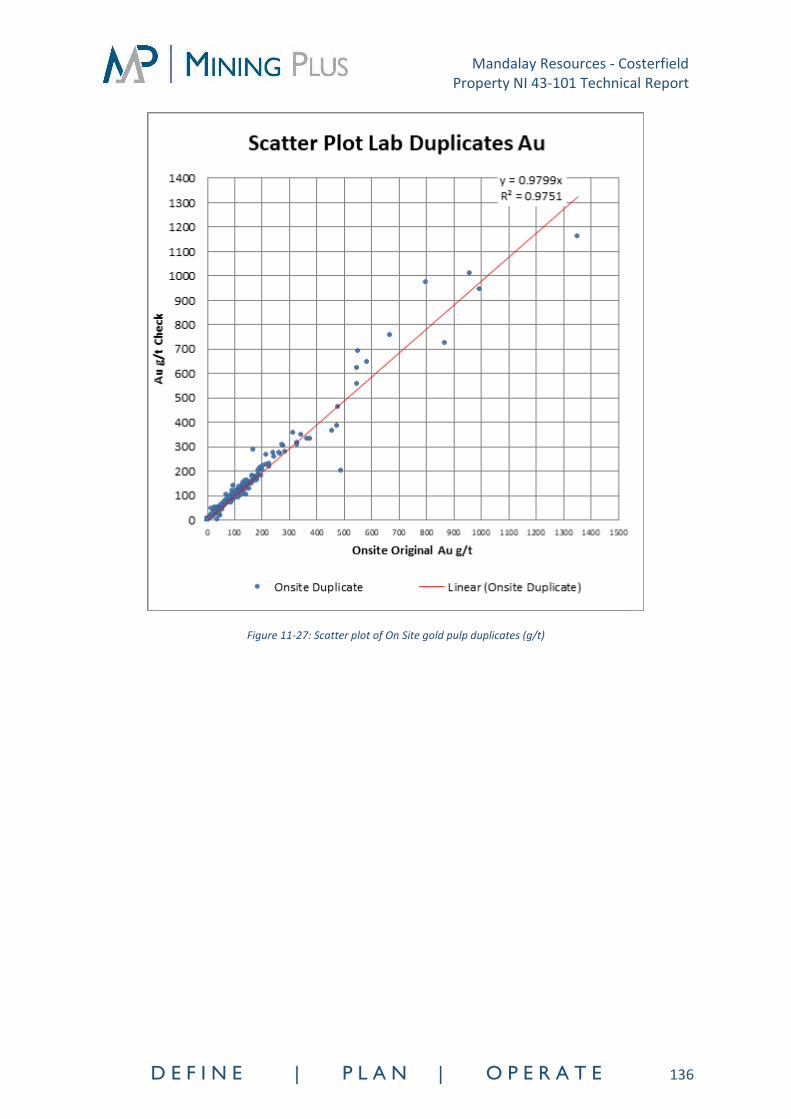
Mandalay Resources - Costerfield Property NI 43-101 Technical Report
D E F I N E | P L A N | O P E R A T E 136
Figure 11-27: Scatter plot of On Site gold pulp duplicates (g/t)

Mandalay Resources - Costerfield Property NI 43-101 Technical Report
D E F I N E | P L A N | O P E R A T E 137
Figure 11-28: Scatter plot of On Site antimony duplicates (%)
Relative paired difference (RPD) plots are utilised in the determination of precision between
paired datasets, such as original assay results and pulp duplicate results (Figure 11-29 and
Figure 11-30). It is desirable to achieve 90% of pairs at less than 10% RPD in the same sample
batch, or less than 20% in different batches or from different laboratories (Stoker, 2006).

Mandalay Resources - Costerfield Property NI 43-101 Technical Report
D E F I N E | P L A N | O P E R A T E 138
Figure 11-29: Relative paired difference plot, gold pulp duplicates (g/t)

Mandalay Resources - Costerfield Property NI 43-101 Technical Report
D E F I N E | P L A N | O P E R A T E 139
Figure 11-30: Relative paired difference plot, antimony pulp duplicates (%)
The pulp duplicate gold dataset achieved 75.65% of pairs at less than 10% RPD and 93.74% of
pairs at less than 20% RPD, which demonstrated acceptable precision for gold assays returned
by On Site.
The pulp duplicate antimony dataset achieved 92. 39% of pairs less than 10% RPD, which is
comparable to results from 2020 of 93.89%, and was considered acceptable.
11.7.4 Umpire Check Assay Program – pulp samples
Quarterly pulp umpire lab check assay programs were conducted for the reporting period in
Q1, Q2, and Q3 2021 for the routine pulp samples assayed by On Site. Selected pulp samples
were dispatched to ALS Global Brisbane (ALS) and Bureau Veritas Perth (BV) for re-analysis of
gold and antimony. Results from the umpire checks have been summarised in Table 11-7 and
Table 11-9.
Q2 check assay program included three samples that were clear outliers in reference to the
On Site primary and duplicate results. As both umpire labs antimony and gold results were in
agreeance, these are interpreted as manual sample labelling issues and have been removed
from the analysis.

Mandalay Resources - Costerfield Property NI 43-101 Technical Report
D E F I N E | P L A N | O P E R A T E 140
Low level gold (< 20 g/t) and antimony (< 5 %) results were also analysed and are detailed in
Table 11-8 and Table 11-10.
Table 11-7: Gold: Summary of On Site original, On Site duplicate, ALS, and BV umpire check statistics
Description On Site
Original
On Site
Duplicate ALS Umpire BV Umpire
Number of samples 202 202 202 202
Mean 60.20 60.74 71.78 71.65
Maximum 729.00 692.00 2280.00 2112.30
Minimum 0.01 0.04 0.02 0.02
Population Std Dev 92.00 92.14 183.67 175.70
Coefficient of Variation 1.53 1.52 2.56 2.45
Bias -0.90% -19.25% -19.02%
Correlation Coefficient 0.91 0.57 0.61
Percent of samples < 20% RPD 81.91 71.36 70.35
Table 11-8: Low-level gold (< 20 g/t): Summary of On Site original, On Site duplicate, ALS, and BV, umpire check statistics
Description On Site
Original
On Site
Duplicate ALS Umpire BV Umpire
Number of samples 84 84 84 84
Mean 7.39 9.13 9.72 8.93
Maximum 19.80 85.40 95.10 91.70
Minimum 0.01 0.04 0.02 0.02
Pop Std Dev. 5.69 10.92 12.40 11.62
CV 0.77 1.20 1.28 1.30
Bias -23.61% -31.64% -20.90%
Correlation Coefficient 0.31 0.55 0.61
Percent of samples < 20% RPD 80.25 61.73 62.96
Table 11-9: Antimony: Summary of On Site original vs On Site duplicate, ALS, BV, umpire check statistics
Description On Site
Original
On Site
Duplicate ALS Umpire BV Umpire
Number of samples 202 202 202 202
Mean 18.77 19.27 18.30 18.67
Maximum 65.20 66.40 67.10 69
Minimum 0.01 0.01 0.03 0.075
Population Std Dev 16.37 16.82 16.32 16.53

Mandalay Resources - Costerfield Property NI 43-101 Technical Report
D E F I N E | P L A N | O P E R A T E 141
Coefficient of Variation 0.87 0.87 0.89 0.89
Bias -2.71% 2.48% 1%
Correlation Coefficient 0.99 0.99 0.99
Percent of samples < 20% RPD 100.00 89.64 89.12
Table 11-10: Low-level (< 5 %) antimony: Summary of On Site original vs On Site duplicate, ALS, BV, umpire check statistics
Description On Site
Original
On Site
Duplicate ALS Umpire BV Umpire
Number of samples 58 58 58 58
Mean 2.24 2.41 2.39 2.48
Maximum 4.96 5.53 7.07 7.36
Minimum 0.01 0.01 0.03 0.075
Population Std Dev 1.65 1.80 1.84 1.88
Coefficient of Variation 0.74 0.75 0.77 0.76
Bias -7.84% -6.93% -11%
Correlation Coefficient 1.00 0.98 0.98
Percent of samples < 20% RPD 100.00 83.67 77.55
11.7.4.1 Umpire Check Assay Program Results
The results of the 2021 umpire check assay program are detailed below:
Gold check assay results:
• A comparison of results between On Site and the umpire labs, BV and ALS, using the
complete gold dataset showed a negative bias that suggested a relative under call of
gold results by On site in their routine analysis. Further investigation was considered
necessary.
• The gold RPD plot (Figure 11-31) demonstrated that on average 74% of all umpire
check duplicate pairs were at less than 20% RPD when compared to the original On
Site assay result, which is decrease on 79% from the 2020 data but considered

Mandalay Resources - Costerfield Property NI 43-101 Technical Report
D E F I N E | P L A N | O P E R A T E 142
satisfactory.
Figure 11-31: Relative paired difference plot, original vs umpire checks, gold (g/t)
• The gold scatter plot of this data (Figure 11-32) demonstrated an increased range of
scatter for samples greater than 60 g/t, while grade comparisons below 60 g/t
displayed no significant difference between laboratories.

Mandalay Resources - Costerfield Property NI 43-101 Technical Report
D E F I N E | P L A N | O P E R A T E 143
Figure 11-32: Scatter plot original vs umpire check duplicates, gold (g/t)
On Site performed at a lower RPD than ALS and BV, which were more closely grouped.
Low level gold (< 20 g/t) check assay results:
• Biases observed using the low-level gold dataset were more pronounced than the
complete dataset, which suggested an under call of gold results by Onsite in their
routine analysis and required further investigation.
• Low level gold RPD plot (Figure 11-33) also demonstrated an average of 68% of all
umpire check duplicate pairs were at less than 20% RPD, which illustrated the poor
performance at the lower gold grade.

Mandalay Resources - Costerfield Property NI 43-101 Technical Report
D E F I N E | P L A N | O P E R A T E 144
Figure 11-33: Relative paired difference plot, original vs umpire checks, low level gold (< 20 g/t)
• Low level gold scatter plot (Figure 11-34) demonstrated a generally strong correlation
below 10 g/t. One series of outliers, at 85-95 g/t Au, plotted outside the graph. Several
other samples plotted as outliers in the check results and caused the negative bias
relative to the originals.

Mandalay Resources - Costerfield Property NI 43-101 Technical Report
D E F I N E | P L A N | O P E R A T E 145
Figure 11-34: Scatter plot for On Site original vs umpire checks, low level gold (< 20 g/t)
Antimony check assay results:
• Biases observed between On Site, ALS and BV using the complete antimony dataset
were considered acceptable,
• The antimony statistics from On Site had a consistently lower RPD compared to ALS
and BV (Figure 11-35), both which utilise Fusion/XRF. Overall the batches met 89% of
pairs at less than 20% RPD. This was considered an acceptable result.

Mandalay Resources - Costerfield Property NI 43-101 Technical Report
D E F I N E | P L A N | O P E R A T E 146
Figure 11-35: Relative pair difference plot for On Site original vs umpire checks, antimony (%)
• The antimony scatter plot (Figure 11-36) demonstrated good agreement through the
low range to 20% Sb, with increased scatter above this level. On Site demonstrated a
partial high bias on the second analysis through this range.

Mandalay Resources - Costerfield Property NI 43-101 Technical Report
D E F I N E | P L A N | O P E R A T E 147
Figure 11-36: Scatter plot comparing On Site original vs Umpire checks for antimony (%)
Low level antimony (< 5 %) check assay results:
• The observed bias between On Site, ALS and BV for the low-level antimony dataset
was considered acceptable,
• The low level antimony RPD plot (Figure 11-37) also meets of desirable range at 87%
of pairs at less than 20% RPD. This is supported in the scatter plot (Figure 11-38),
which displays a tight linear scatter.

Mandalay Resources - Costerfield Property NI 43-101 Technical Report
D E F I N E | P L A N | O P E R A T E 148
•
Figure 11-37: Relative pair difference plot for On Site original vs umpire checks, low level antimony (< 5%)

Mandalay Resources - Costerfield Property NI 43-101 Technical Report
D E F I N E | P L A N | O P E R A T E 149
Figure 11-38: Scatter plot for On Site original vs umpire checks, low level antimony (< 5 %)
11.8 Sample Transport and Security
In 2021, Brunswick and Augusta sites were securely gated, with video surveillance, and time
stamped swipe card access. This included areas used for storage and collection of drill and
face samples.
All sample bags that contained sampled material were placed in heavy duty plastic bags, along
with the sample submission sheet. The plastic bags were sealed with a metal twisting wire or
heavy-duty plastic cable ties. This process was applied to both underground channel samples
and diamond drill core samples.
Samples were delivered by a private contractor or directly by Mandalay Resources staff on a
daily basis to On Site in Bendigo, where they were accepted by On Site laboratory personnel.
A delivery consignment note system was enacted at the end of Q3 2021 which includes signed
confirmation on pickup and on delivery of the samples to the laboratory.
Returned sample pulps from the On Site laboratory for 2021 remained in a secure On Site
warehouse with a scheduled return to Mandalay Resources for storage in secured and
monitored shipping containers, wrapped in plastic.
Mandalay Resources - Costerfield Property NI 43-101 Technical Report
D E F I N E | P L A N | O P E R A T E 150
11.9 Qualified Persons Opinion
The analysis of the CRM certifications for antimony satisfies the recommendation in the
previous Technical Report for the Property that the antimony standards be completely
overhauled. The QP considers that the assay QAQC results, when taken together,
demonstrate the reliability of the assays for the reporting period, and that they are suitable
for use in Mineral Resource Estimation.

Mandalay Resources - Costerfield Property NI 43-101 Technical Report
D E F I N E | P L A N | O P E R A T E 151
12 DATA VERIFICATION
In fulfilment of the NI43-101 requirements, Mining Plus Principal Geologist and Qualified
Person, Richard Buerger completed a personal inspection of the Property on 23 September
2021. The Property inspection focused on a review of the geological setting and
mineralisation style, as well as the processes and procedures in place to ensure that they are
at an acceptable standard for the mineralisation style, with the resultant information being
suitable for use in the upcoming Mineral Resource estimation work.
The QP completed the following activities during the Property inspection or immediately
following the visit:
• Source data validation checks for 10% of the drill holes completed within the 12
months since the last MRMR, with a focus on verifying the Au and Sb assays, bulk
density measurements and locational data (collar and downhole surveys).
• Locational data storage and management processes including:
o Collar and downhole survey methods, storage and data entry processes.
o Downhole survey camera calibration certificates and test bed results.
• Drill core logging and sampling processes including:
o Core processing procedures from initial mark-up through to sample selection and
sampling.
o Inspection and verification of some significant Shepherd lode intercepts for the
year.
o Storage and security of the core processing facility.
o Chain of custody process for core samples to the laboratory.
• Assay and bulk density data accuracy, precision and data management process
including:
o Bulk density measurement methods and data storage.
o Sampling and analytical protocols in place.
o QAQC reports and raw results.
• Underground inspection to review face mapping and sampling processes.

Mandalay Resources - Costerfield Property NI 43-101 Technical Report
D E F I N E | P L A N | O P E R A T E 152
• Discussion of the geological interpretation and key changes since the discovery of the
Shepherd lode
• Review of some typical drill hole intersections from the Shepherd Lode.
The following observations have been made from the Property inspection and subsequent
data checks:
• Source data checks of the assays revealed no errors for the 10% of the samples
checked.
• The digital collar survey records supplied by the surveyors were consistent with the
database entries apart from very minor errors in the X and Y coordinates identified in
two drill holes – these errors are <1 mm difference and are considered to be most
likely due to rounding errors.
• The IMDEX Hub-IQ™ system for recording, storing and transferring downhole survey
measurements has been implemented during 2021, with this new system considered
industry best practice as it removes the potential for transcription errors from the
drillers and geologists. The source data checks for the downhole surveys identified no
errors for the drill holes checked.
• The change to full-core sampling of the drill hole intercepts is considered appropriate
given the style of mineralisation at Costerfield and the change in analytical method.
The procedure for sampling of drill core is appropriate. This change to full-core
sampling of significant intercepts removes many of the issues surrounding sample
security for the most recent drilling.
• The change in analytical method from Fire Assay to full-sample Screen Fire Assay for
all drill core intercepts is considered to be in line with industry best practice for this
style of mineralisation.
• The adoption of digital data capture for face mapping and sampling underground using
the Rock Mapper system is considered to be a significant improvement in recording
and capturing the mineralisation grades and changes in thickness in strike drive
development.
• The chain of custody protocols in place at the time of the visit were inadequate.
• The communication with the analytical laboratory has improved significantly with
regular QAQC reports and meetings held between the two parties.

Mandalay Resources - Costerfield Property NI 43-101 Technical Report
D E F I N E | P L A N | O P E R A T E 153
• The implementation of systematic and routine bulk density measurements using the
water immersion method is considered a key improvement. However, the QP noted
that the current procedure does not measure true dry bulk density as the core being
used has not been dried either in an oven or by sunlight. Therefore, the bulk density
values derived cannot be considered as representative of the true bulk densities as
the moisture content within the core samples has not been taken into consideration.
• The QP’s discussions with key people on-site gave confidence that the geological
understanding of the mineralisation has, and continues to underpin its ongoing
success. The potential for increased complexity around the intersection of the Youle
and Shepherd lodes is understood and steps are being taken to update procedures
and methods for testing and estimating the grade of this area.
After the visit, the QP made several recommendations, which were acted on by Mandalay.
The following improvements were made to its processes in response to the
recommendations:
Collar Data:
Underground drill holes up to the present have been compiled on the server and Pre-June
surface drill holes have likewise been compiled, with extracts from personal emails.
Chain of Custody:
The Chain of Custody System have been improved with consignment notes created for all
Exploration and Mining assay submission. The con-note is signed on pickup by the delivery
driver and counter-signed by the lab on receipt. The number of bags with tamper-tags
delivered is checked at each stage. This system was enacted 30/9/2021.
In addition:
• All 2022, 2021 and the majority of 2020 pulps, covering most of the Youle project,
remain at the secure storage warehouse of On Site Laboratory Services.
• Single Door shipping containers have been delivered to site as secure storage for
returned pulps.
Bulk Density:
Bulk density test work has been undertaken to determine if moisture is a factor in the semi-
dry density determination method employed at site. Stibnite samples between 5-80%
stibnite, averaging 40% (visual), were taken from the ROM and washed, drip dried (overnight)
and then tested for bulk density using the immersion method. These were then taken to OSLS
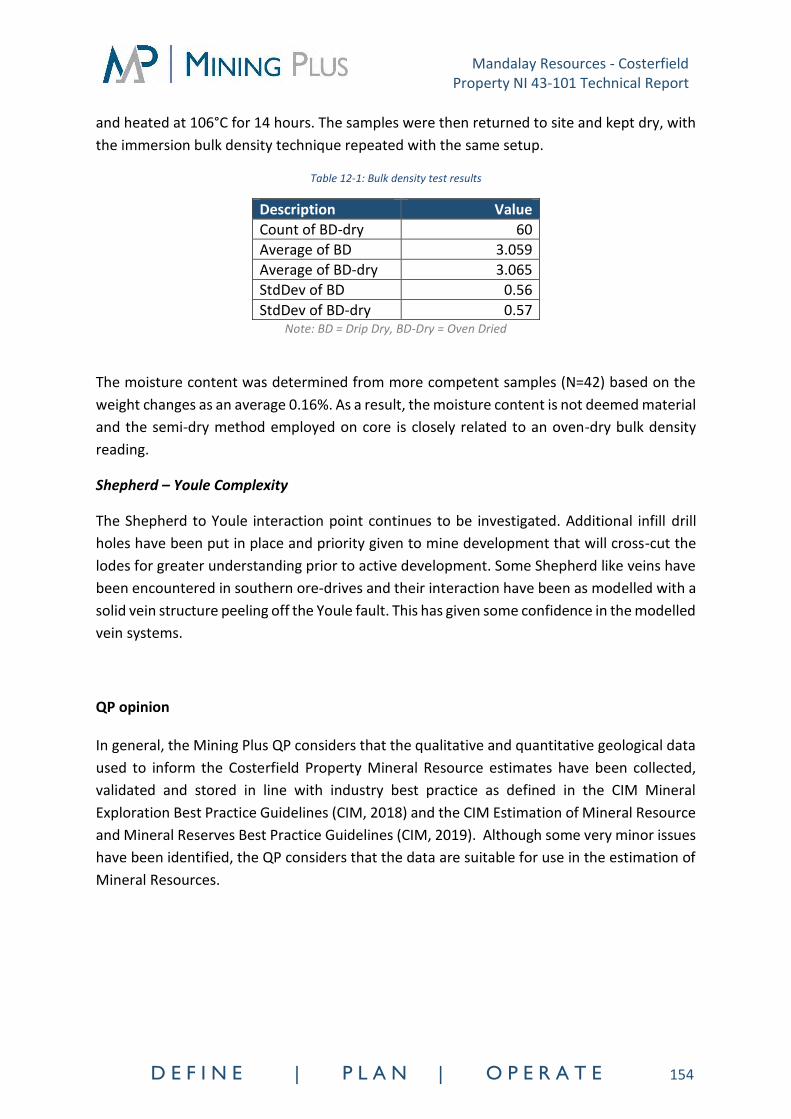
Mandalay Resources - Costerfield Property NI 43-101 Technical Report
D E F I N E | P L A N | O P E R A T E 154
and heated at 106°C for 14 hours. The samples were then returned to site and kept dry, with
the immersion bulk density technique repeated with the same setup.
Table 12-1: Bulk density test results
Description Value
Count of BD-dry 60
Average of BD 3.059
Average of BD-dry 3.065
StdDev of BD 0.56
StdDev of BD-dry 0.57 Note: BD = Drip Dry, BD-Dry = Oven Dried
The moisture content was determined from more competent samples (N=42) based on the
weight changes as an average 0.16%. As a result, the moisture content is not deemed material
and the semi-dry method employed on core is closely related to an oven-dry bulk density
reading.
Shepherd – Youle Complexity
The Shepherd to Youle interaction point continues to be investigated. Additional infill drill
holes have been put in place and priority given to mine development that will cross-cut the
lodes for greater understanding prior to active development. Some Shepherd like veins have
been encountered in southern ore-drives and their interaction have been as modelled with a
solid vein structure peeling off the Youle fault. This has given some confidence in the modelled
vein systems.
QP opinion
In general, the Mining Plus QP considers that the qualitative and quantitative geological data
used to inform the Costerfield Property Mineral Resource estimates have been collected,
validated and stored in line with industry best practice as defined in the CIM Mineral
Exploration Best Practice Guidelines (CIM, 2018) and the CIM Estimation of Mineral Resource
and Mineral Reserves Best Practice Guidelines (CIM, 2019). Although some very minor issues
have been identified, the QP considers that the data are suitable for use in the estimation of
Mineral Resources.

Mandalay Resources - Costerfield Property NI 43-101 Technical Report
D E F I N E | P L A N | O P E R A T E 155
13 MINERAL PROCESSING AND METALLURGICAL TESTING
13.1 Metallurgical Testing
Over the years, extensive metallurgical testwork has been undertaken on samples taken from
the Augusta deposit from 2004, the Cuffley deposit from 2012, the Brunswick deposit from
2016 and most recently, the Youle deposit from 2018. Historical operating data now validates
the testwork from each of these deposits. No additional testwork was done in 2021 on the
Youle deposit as it is now superseded by processing this feed.
When required, mill feed blend characterisation and metallurgical tests are routinely
undertaken by Mandalay in order to verify the expected behaviour of new domains, lithology
types, lodes, or deposits. The following reputable, accredited, and appropriately experienced
metallurgical laboratories have been involved with various aspects of the original
metallurgical evaluation and ongoing testwork:
• ALS Metallurgy – New South Wales (previously Metcon Laboratories)
• Amdel Mineral Services Laboratory (now Bureau Veritas Minerals) – South Australia
• Australian Minmet Metallurgical Laboratories (AMML) – New South Wales
The Brunswick Processing Plant has been operated by Mandalay since late 2009, with several
years of operating data on the Cuffley/Augusta ore blend, on the Brunswick ore from Q3 2018
and Youle underground ore from late Q3 2019. The Youle samples exhibited similar
metallurgical behaviour to the Cuffley/Augusta ores during testwork and operations so
initially used historic Cuffley and Augusta production data for forecasting purposes. The Youle
deposit now provides the sole feed to the plant. As a result, the metallurgical testwork on all
deposits, including the most recently tested Youle ore, has been replaced by actual plant
performance. The use of comprehensive historical operating data is considered to be a more
accurate basis upon which to forecast future metallurgical behaviour when processing similar
ores.
The Youle underground deposit, was first processed in September 2019. It was initially
processed in separate campaigns, i.e. not in a blend, to confirm the expected metallurgical
behaviours. Youle became the predominant mill plant feed from July 2020, steadily displacing
the Brunswick underground ores, since the start of the same year. The Youle underground
ore will remain the dominant feed for the forward Life of Mine (LoM) production schedule.
This body of standalone Youle operating data now provides a much better understanding of
the processing behaviour expected on these and similar ores. Youle also exhibits similar
metallurgical behaviours to the Cuffley/Augusta ores. This historical operating data can also
be used to expand the Youle dataset if required.

Mandalay Resources - Costerfield Property NI 43-101 Technical Report
D E F I N E | P L A N | O P E R A T E 156
This data allows antimony and gold recovery relationships to be developed and used to
forecast future recoveries as well as forecasting plant throughput capacity.
13.1.1 Metallurgical Testwork Summary
A summary of metallurgical characterisation testwork is provided in Table 13-1. This testwork
remains valid. Testing of the Brunswick Main ores had indicated a decrease in gravity gold
recovery, flotation antimony and gold recovery and flotation kinetics. The full extent of the
recovery impacts of the Brunswick ores are now understood after processing this ore as part
of the overall feed blend between 2018 and 2020. The Brunswick ores had been largely
depleted by the end of 2020; only small parcels have been processed since. The 2022 forecast
is for 153,398 t of Youle ore and 1,531 t of Brunswick ore. Brunswick will continue to
represent a very small percentage of the feed, representing approximately 1% of the blend.
The metallurgical testwork and historical performance of the Youle deposit is of the most
importance to the production forecast.
Metallurgical testwork was undertaken on two areas of the Youle deposit designated as
‘Youle High Grade’, and ‘Youle Low Grade’. The location of these samples is provided in Figure
13-1 and Figure 13-2. This testwork showed that the Youle ores would demonstrate similar
metallurgical behaviour to the Cuffley and Augusta ores historically fed to the plant. Both
antimony and gold recoveries were high and reflected historical plant levels. It was expected
that with further optimisation of the testwork conditions, the recoveries could be increased
further. Plant operating data from late 2020 confirms this, with significantly improved plant
performance on a predominantly Youle feed blend, particularly after flotation circuit
upgrades were completed.
The two Youle Bond Ball Mill Work Index (BBMWi) tests returned similar values; 16.1 kWh/t
for the low-grade sample and 15.2 kWh/t for the high-grade sample. These were similar when
compared against the ore types previously processed, i.e. Cuffley at 16.0 kWh/t and Augusta
at 15.5 kWh/t. The two Brunswick samples tested were softer at 14.3 kWh/t and 12.9 kWh/t.
During actual operations, the Youle throughput has not been limited by grindability. A higher-
than-average feed throughout was achieved in the latter part of 2020 on a predominantly
Youle plant feed blend (refer to Figure 13-3) which supports this moderation in hardness. The
drop in the first quarter of 2021 was associated with a mill reline and prioritisation of recovery
over throughput.
Historical testwork results for the Youle metallurgical testwork are provided in Table 13-1
alongside testing for the other deposits. As expected, recoveries were higher for the high-
grade sample compared to the low-grade sample. Testwork antimony recoveries were higher
for both samples when compared to historic plant values. Flotation testing has shown the
Youle recoveries to be relatively insensitive to a grind size between 38 µm and 75 µm and
stable across a range of reagent addition regimes. The average gold recovery for both Youle

Mandalay Resources - Costerfield Property NI 43-101 Technical Report
D E F I N E | P L A N | O P E R A T E 157
samples was marginally higher than historic production records. These benchscale test
results were initially moderated back to historic plant recovery levels for forecasting purposes
in order to adopt a more conservative position. The gravity gold recovery was increased
slightly in the LoM model to 45% (from 40%) to account for the higher percentage of Youle
ore in the blend from 2021 onwards.
Table 13-1: Historic Metallurgical Testwork
Variable Brunswick
Main
Brunswick Penguin to
Kiwi
Cuffley LG 0358-1
Cuffley HG
M2569
Youle Low
Grade
Youle High
Grade
BBMWi 12.9 14.3 16.0 16.0 16.1 15.2
Feed Au g/t 8.65 11.9 9.0 17.7 4.89 13
Feed Sb % 3.31 3.88 3.00 7.98 2.56 5.1
Feed As % 0.50 0.13 0.12 0.07 0.02 0.03
Concentrate As % 3.20 0.87 0.98 0.002 0.22 0.25
Gravity Au Rec. % 22.1-25.5 30.0 41 54 43 57
Recovery Au % 87.1 93.7 98 95 96 97
Recovery Sb % 98.3 99 99 95 99 99
Compared to the Brunswick ores, Youle has lower arsenic grades and therefore, elevated
arsenic grades in the antimony-gold concentrate are not considered to be an issue to
saleability or payability of the product. In the current off-take agreement, there are no
arsenic penalties below 0.5% in the concentrate. Arsenic grades between 0.5% - 2.0% incur a
penalty of US$2/t concentrate for each 0.1% above 2.0%. This increases to US$2.5/t between
2.0% arsenic and 3.0% but it remains saleable. As a gold/antimony concentrate, it is not
subject to the same arsenic grade importation limits that some base metal concentrates are
imposed with. With proper management, the penalty element payments can be minimised
and are not a risk to the ongoing operation.

Mandalay Resources - Costerfield Property NI 43-101 Technical Report
D E F I N E | P L A N | O P E R A T E 158
Figure 13-1: Youle High Grade Testwork Sample Locations
Figure 13-2: Youle Low Grade Testwork Sample Locations
13.2 Ore Blend Effect on Throughput and Recovery Forecasts
From January 2014, Cuffley ores were processed in a blend with Augusta ores. Prior to this,
only Augusta ore was processed. The Cuffley ores and remaining Augusta ores were depleted
by January 2020, replaced gradually by Brunswick feed. The proportion of Brunswick ores
reduced significantly from the beginning of 2020 and continues to represent only a small

Mandalay Resources - Costerfield Property NI 43-101 Technical Report
D E F I N E | P L A N | O P E R A T E 159
fraction (~1%) of the mill feed (refer to Figure 17-2). Since this time, Youle has dominated the
feed blend. The historic blend ratios of Augusta, Cuffley, Brunswick and Youle ores and the
proposed forward LoM blend are summarised below:
• 2014: 44% Augusta and 56% Cuffley
• 2015: 42% Augusta and 58% Cuffley
• 2016: 52% Augusta and 48% Cuffley
• 2017: 64% Augusta and 36% Cuffley
• 2018: 72% Augusta, 21% Cuffley and 7% Brunswick (Brunswick from Q3)
• 2019: 38% Augusta, 5% Cuffley, 47% Brunswick and 10% Youle
• 2020: 14% Brunswick and 86% Youle
• 2021: 1% Brunswick and 99% Youle
• 2022: 1% Brunswick and 99% Youle
• LoM 2022: Principally Youle mill feed
Over the same period, plant throughput has been relatively consistent, i.e. it has been robust
to changes in the feed blend. On this basis, throughput (and recovery) data from 2016 – 2021
has been used to predict mill performance, given the similar (marginally superior)
performance of the Youle samples in both testwork and actual plant performance.
It is noted that during 2019 there was a deterioration in metallurgical performance,
particularly for gold recovery. This was due to the introduction of Brunswick ore as the
dominant component of the mill feed blend. The moderate decline of the plant gold recovery
performance from the start of 2019 through to mid-2020 is shown in Figure 13-4 and Figure
17-2. This period is considered to represent outlying behaviour associated with Brunswick
ores and has been excluded from the data used to develop the gold recovery algorithm.
Instead, operating data from when the mill has been fed with predominantly Youle ore has
been used to develop the current recovery equations.
13.3 Throughput
Historical throughput is considered to be the best indicator of future forecast throughput
when processing similar ores. Through ongoing optimisation and relatively minor, low capital
cost debottlenecking projects, the capacity of the Brunswick Concentrator has been increased
to the current capacity which can consistently exceed 13,000 t/month and has regularly

Mandalay Resources - Costerfield Property NI 43-101 Technical Report
D E F I N E | P L A N | O P E R A T E 160
approached 14,000 t/month. Annual production data from 2015 to 2021 demonstrates this
rate can be consistently achieved as presented in Figure 13-3.
The reduction in plant throughput in the latter half of 2019 was not process related, i.e. it was
not a mill constraint. It was related to constrained underground mine production and as a
result of the historical scats stockpile being depleted (it had previously provided up to
400 tonnes per month in 2018). In respect to the February 2021 drop in throughput, it is
explained by the Ball Mill #2 being relined and afterwards, mill throughput was intentionally
slightly constrained. This was due to excellent mill feed grades resulting in a focus on
maintaining grind and recovery rather than maximising throughput. The budget 2022 mill
throughput has remained the same as for 2021 at 152.3 kt.
Figure 13-3: Historic Brunswick Processing Plant Throughput – 2015 to 2021
With mining production rates marginally exceeding processing throughput over the last 24
months, there is currently approximately 40,000 tonnes stored on the ROM pad. A conscious
decision has been made to maintain a stockpile around this level. It provides a comfortable
buffer for any disruption to mining and allows for more stable mill operations. Budgeted mine
production is matched to mill throughput for 2022 in order to maintain these ROM stocks.
The mill capacity still exceeds the forecast LoM production rate of 12,700 t/month. The
forecast processing rates are therefore considered to be justified and are well supported by
historical production. No other changes are expected that would impact the scheduled
throughput such as increasing ore hardness or a reduction to the target grind size P80 of

Mandalay Resources - Costerfield Property NI 43-101 Technical Report
D E F I N E | P L A N | O P E R A T E 161
60 µm. At this rate, the plant will be operating marginally below maximum capacity. This
provides potential modest production upside if mining production rates increase.
13.4 Metallurgical Recovery
There is a relationship between the plant feed head grade and the recovery for both gold and
antimony. This is a common occurrence across flotation type concentrators as it is a function
of having a relatively constant tail grade. Over the years, the Costerfield operation has shown
these relationships to be generally robust and effective in predicting both the antimony and
total gold recovery.
Forecast antimony and gold recoveries used for LoM planning, budgeting and economic
modelling are based on historical feed grades and metallurgical recovery relationships
developed using historical production data. This is the best method of forecasting recovery
when processing a similar feed blend. These algorithms are updated annually. The latest
update uses the recovery data between April 2021 – December 2021.
A period of lower gold recovery is highlighted in Figure 13-4. This deterioration was a direct
result of introducing the Brunswick underground ore into the feed blend. The subsequent
improvement was due to the depletion of Brunswick ores and the introduction of Youle into
the mill feed blend, particularly from mid-2020 (see Figure 17-2). The Brunswick ore had a
lower gold feed grade, lower gravity recovery and presented further challenges to the gold
recovery due to the gold mineral associations including those with arsenopyrite and slower
flotation kinetics.
The 2021 end of year (EOY) reconciled plant recoveries were 94.6% and 93.1% for antimony
and gold respectively. There was a significant improvement again on gold recovery from
90.6% in 2020 to 93.1% in 2021, which can be mainly attributed to improvements in the
flotation circuit and the installation of the CavTube® columns, which were commissioned in
April 2021.

Mandalay Resources - Costerfield Property NI 43-101 Technical Report
D E F I N E | P L A N | O P E R A T E 162
Figure 13-4: Antimony and Gold Grade versus Recovery Trends – January 2015 to December 2021
13.4.1 Youle Ores
With the addition of the Youle ores into the LoM plan, additional confirmatory testwork was
undertaken in 2018. This ensured the metallurgical behaviour of the new underground
deposit reflected historical performance and confirmed the Youle ores were amenable to
processing through the Brunswick concentrator.
Subsequent batch campaigns of Youle underground development ore of approximately
1,500 tonnes and 2,200 tonnes, processed in October and November 2019, confirmed the
expected higher gravity recoverable gold component and improved gold flotation recoveries
and hence, total gold recovery of approximately 89%. The Youle trial campaign performance
was considered more akin to the Cuffley ores.
The Youle deposit became the dominant mill feed source from mid-2020 as shown in Figure
17-2. Plant performance since on a predominantly Youle feed, particularly through the latter
part of 2020 and 2021, has shown the modelled recovery predictions to be conservative,
especially for gold, in the order of up to a few percent. The higher gravity gold recovery is the
main contributing factor.
Actual Youle operating performance has now been incorporated into the recovery algorithms
used to forecast the LoM antimony and gold recoveries. Due to flotation circuit upgrades in
April 2021, data between April and December 2021 were used to formulate the gold recovery
relationship.

Mandalay Resources - Costerfield Property NI 43-101 Technical Report
D E F I N E | P L A N | O P E R A T E 163
13.4.2 Antimony Recovery
The antimony recovery forecast is based on algorithms based on the relationship between
the antimony feed grade and metallurgical recovery using historic operating data. The most
recent algorithm incorporates daily plant operating data from January 2021 – December
2021. The antimony recovery algorithm used for mine planning, and process budgeting and
forecasting is provided below:
Sb recovery = (0.0039 x Sb head grade) + 0.9299
The linear model is capped at 99% recovery at feed grades of 7% antimony or above to
account for high grade ore block anomalies in the ore reserve and probable mine inventory.
Previous algorithms have utilised a more extensive operating period but this is now less
appropriate as the feed is almost entirely from the Youle deposit and plant upgrades have
resulted in improved antimony recovery performance.
Recent historical and forecast antimony recoveries for the LoM were/are:
• 2016 actual Sb recovery = 95.4% at a 3.7% Sb feed grade
• 2017 actual Sb recovery = 95.3% at a 3.3% Sb feed grade
• 2018 actual Sb recovery = 93.8% at a 2.3% Sb feed grade
• 2019 actual Sb recovery = 95.3% at a 3.9% Sb feed grade
• 2020 actual Sb recovery = 96% at a 3.03% Sb feed grade
• 2021 actual Sb recovery = 94.6% at a 3.97% Sb feed grade
• 2022 (modelled) Sb recovery = 94.1% at a 2.74% Sb feed grade
It is noted that the average antimony concentrate grade dropped marginally to 52.4% in 2017,
52.2% in 2018 and further to 51.4% in 2019, due to falling antimony feed grade. This lower
concentrate grade was targeted intentionally, in order to maintain recovery. However, in
2020, the antimony in concentrate grade returned to the long-term target of 54% Sb due to
the higher head grade and installation of a new StackCell® in a rougher flotation cell duty. In
2021 the antimony concentrate grade was 52.4% and this was due to concentrate produced
from the CavTubes® which is at a lower Sb concentration than the main plant.
A marginally lower flotation concentrate grade of 51.5% Sb is incorporated in the LoM plan.
The operating aim going forward is to maximise recovery from the CavTubes® whilst ensuring
that the concentrate grade stays above 50% as this is the minimum grade in the concentrate
offtake agreements. The forward forecast concentrate grade is 51.5% Sb remains the

Mandalay Resources - Costerfield Property NI 43-101 Technical Report
D E F I N E | P L A N | O P E R A T E 164
budgeted target. This provides a buffer against discrepancies between internal concentrate
analysis and customer analysis.
There is a high degree of confidence in the relationship and the associated antimony recovery
algorithm across a range of feed grades. It is supported by historical operating data and
verified by metallurgical testwork. It provides the most reliable method of estimating the
antimony recovery at variable head grades assuming a constant final Sb concentrate grade of
51.5%, the value used in the forward LoM plan.
13.4.3 Gold Recovery
The gold in feed reports to the gravity gold concentrate and to the flotation concentrate,
together making up the overall gold recovery. Historically, the total gold recovery has been
relatively consistent and independent of gravity recovery, i.e. the gold not recovered initially
through the gravity circuit is recovered through flotation. Therefore, the difference in the
calculated gravity gold recovery and overall recovery is apportioned to the flotation circuit.
The recent installation of CavTubes® was done in order to increase total gold recovery across
the plant. Pilot testwork had shown the potential to reduce the gold in final tailings by
approximately 30%. Significant improvement in gold recoveries have been realised with their
installation and because of this, an update to the gold recovery algorithm was warranted for
the 2022 forecast. It was determined that the most appropriate time period for the updated
algorithm would be from the time the columns were commissioned (April 2021) until the end
of 2021. A logarithmic relationship was used for gold recovery as it plateaus at higher grade,
drops at lower grades, and has a better correlation than a linear relationship. The updated
relationship is presented below:
Au recovery = (0.0609 x ln(Au feed grade)) + 0.7727
This is used to calculate the total gold recovery for any given feed grade. The gold recovery
data used to develop the algorithms for LoM recovery forecasting for 2022 is provided below:
• 2021 April to December
• Total gold recovery 93.0%
• Gravity recovery 47.3%
• 10.7 g/t Au head grade.
The LoM modelled forecast gold recovery weighted averages are:
• Model (2022) 92.7% at a 12.56 g/t head grade

Mandalay Resources - Costerfield Property NI 43-101 Technical Report
D E F I N E | P L A N | O P E R A T E 165
• Model (2022) fixed gravity deportment at 45%
The gravity gold recovery shows a level of variability but is typically between 40 – 55% Au
(absolute). This gravity gold trend has continued with the predominantly Youle feed blend.
A nominal gravity gold recovery factor is used for forecasting purposes as the operating data
variability complicates the application of a more sophisticated gravity gold recovery
relationship.
The annual gold recovery has been consistent over many years and there is a high degree of
confidence in the gold recovery algorithm across a range of feed grades in forecasting the
annual gold recovery. It is supported by historical operating data and verified by metallurgical
testwork. It provides the most reliable method of estimating the gold recovery at variable
head grades. It is likely to be conservative.
13.4.4 Circuit upgrades
Two flotation circuit upgrades were completed in 2021 with a material increase in gold
recovery realised as a result. The planned circuit upgrades for 2022 include new filtration
technology for the flotation concentrates, and the crushing circuit being upgraded to two-
stage crushing from current single stage crushing operation. Both upgrades aim to increase
redundancy across the plant and will contribute to less overall plant downtime. Crushing a
finer mill feed may also lead to increased mill throughput, although this has not been forecast
into the LoM plan. Neither of these upgrades are envisaged to improve either gold or
antimony recoveries.

Mandalay Resources - Costerfield Property NI 43-101 Technical Report
D E F I N E | P L A N | O P E R A T E 166
14 MINERAL RESOURCE ESTIMATES
Gold and antimony grades, and lode thicknesses were estimated using the two-dimensional
(2D) accumulation estimation method for all lodes. This method has been discussed in Bertoli
et. Al., 2003, and is considered by the QP to be more suitable for modelling narrow vein
systems than conventional three-dimensional (3D) block grade estimation due to its ability to
more accurately model thin tabular geometry. The 2D accumulation method has remained
the preferred Mineral Resource estimation methodology for the Costerfield Property lodes
since 2008 (AMC, 2008), and is often called a seam-model estimation method.
The 2D accumulation method requires that gold and antimony grades are multiplied by the
true thickness of the intersection in order to generate variables referred to as accumulations
or accumulated grades, measured in gram/metres or percent/metres. This method assigns
weights to composites of different lengths during estimation. Estimated gold and antimony
block grades are then back-calculated from the estimated accumulated block grade by
dividing by the estimated true vein thickness.
Only those lode models that feature new drilling, face sampling and assay data and/or revised
geological interpretation have been re-estimated for the production year 2021. The focus of
mining, exploration and the estimations were Youle (500 series models) and Shepherd (600
series models) with additional drill information and re-estimation on the KR Model (310) at
Brunswick.
A summary of the changes made to the lode models within this Mineral Resource Estimate
are summarised in Table 14-1.
Table 14-1: List of changes made to lodes at year-end 2021
Lode Zone Code
New data captured
during 2021
New Estimation
New Resource Classification
Depleted during 2021
Reported above cut-off
Removed from
Resource
E Lode 10 No No No No Yes No
B Lode 15 No No No No Yes No
BSP Lode 16 No No No No Yes No
W Lode 20 No No No No Yes No
C Lode 30 No No No No Yes No
NM Lode 40 No No No No Yes No
NW Lode 47 No No No No Yes No
NSP 48 Lode 48 No No No No Yes No
P1 Lode 55 No No No No Yes No
K Lode 60 No No No No Yes No
CM Lode 210 No No No No Yes No
CE Lode 211 No No No No Yes No

Mandalay Resources - Costerfield Property NI 43-101 Technical Report
D E F I N E | P L A N | O P E R A T E 167
Lode Zone Code
New data captured
during 2021
New Estimation
New Resource Classification
Depleted during 2021
Reported above cut-off
Removed from
Resource
CD Lode 220 Yes3 No No No Yes No
CDL Lode 225 No No No No Yes No
AS Lode 230 No No No No Yes No
Brunswick 300 No No No Yes Yes No
Brunswick KR
310 Yes Yes Yes No Yes No
SKC CE 400 No No No No Yes No
SKC LQ 405 No No No No Yes No
SKC C 410 No No No No Yes No
SKC W 420 No No No No Yes No
Youle 500 Yes Yes Yes Yes Yes No
Youle East 501 No No No No Yes No
Kendal Splay
503 Yes Yes Yes Yes Yes No
Peacock 508 Yes Yes Yes Yes Yes No
Youle South Splay
525 Yes Yes Yes Yes Yes No
Peacock Splay
531 Yes Yes Yes Yes Yes No
Shepherd 600 Yes Yes Yes Yes Yes No
Ryeland 604 Yes Yes Yes Yes Yes No
Merino 605 Yes Yes Yes No Yes No
Dorset 606 Yes Yes Yes No Yes No
Suffolk 620 Yes Yes Yes No Yes No
Drysdale 621 Yes Yes Yes No Yes No
14.1 Diamond Drill Hole and Underground Face Sample Statistics
The resource estimation was undertaken on full-length composites of vein intercepts with no
residuals for both face samples and drill hole samples. Raw sample intervals were weighted
by bulk density when compositing, with stibnite (SG = 4.63) percentage having the dominant
influence on bulk density of a raw sample. This represented a change from the pre-2021
models and has not been retrospectively applied to the reconciled historic models in this
resource estimate.
Refer to Section 14.6.1 for more information on the mineralised density and regression
formula based on antimony percent applied.
3 Additional drilling was completed on the Cuffley Deeps Lode (220) that is not material to the existing resource
and is the focus of ongoing exploration

Mandalay Resources - Costerfield Property NI 43-101 Technical Report
D E F I N E | P L A N | O P E R A T E 168
Statistics for composited gold grades, antimony grades, and true thickness for the Shepherd,
Youle, and KR lodes are presented in Table 14-2.
Table 14-2: Raw face and diamond drilling sample statistics; uncapped
Lode Zone Type Variable No. of
Samples Min Max Mean CV
KR- Brunswick
310 Drill Hole
Au (g/t)
41
0.01 155.4 16.5 1.7
Sb (%) 0.001 25.1 5.3 1.2
Vein Width (m) 0.06 2.8 0.56 1.0
Youle 500
Drill Hole
Au (g/t)
241
0.001 540.2 35.7 1.8
Sb (%) 0.001 56.6 9.9 1.3
Vein Width (m) 0.009 1.9 0.4 0.9
Face Sample
Au (g/t)
2,435
0.001 2480.0 97.3 1.5
Sb (%) 0.001 67.1 27.2 0.7
Vein Width (m) 0.005 3.7 0.3 1.2
Peacock 508
Drill Hole
Au (g/t)
41
0.001 52.3 15.1 1.2
Sb (%) 0.001 50.3 13.1 1.1
Vein Width (m) 0.059 1.5 0.3 1.1
Face Sample
Au (g/t)
158
0.1 1950.0 95.7 1.9
Sb (%) 0.001 62.3 33.1 0.5
Vein Width (m) 0.02 1.8 0.3 1.0
Youle South Splay
525
Drill Hole
Au (g/t)
6
0.09 264.0 57.6 1.6
Sb (%) 0.14 28.6 14.3 0.8
Vein Width (m) 0.139 0.4 0.2 0.3
Face Sample
Au (g/t)
97
0.29 582.0 65.1 1.2
Sb (%) 0.21 59.9 25.1 0.5
Vein Width (m) 0.03 0.5 0.2 0.5
Peacock Splay
531
Drill Hole
Au (g/t)
3
0.11 10.2 3.6 1.3
Sb (%) 1.4 10.9 4.7 0.9
Vein Width (m) 0.073 0.5 0.2 0.8
Face Sample
Au (g/t)
22
0.431 263.0 37.5 1.5
Sb (%) 0.01 50.6 19.2 0.7
Vein Width (m) 0.02 1.2 0.2 1.4
Shepherd 600
Drill Hole
Au (g/t)
84
0.02 817.5 57.3 1.9
Sb (%) 0.001 36.5 3.5 2.2
Vein Width (m) 0.059 1.7 0.5 0.8
Face Sample
Au (g/t)
12
2.02 196.0 54.8 1.0
Sb (%) 0.11 49.8 15.6 1.0
Vein Width (m) 0.12 1.1 0.4 0.7
Ryeland 604 Drill Hole
Au (g/t)
18
0.001 657.0 66.9 2.2
Sb (%) 0.001 4.8 0.3 3.6
Vein Width (m) 0.046 1.2 0.2 1.2
Au (g/t) 4 47.7 196.0 102.9 0.6

Mandalay Resources - Costerfield Property NI 43-101 Technical Report
D E F I N E | P L A N | O P E R A T E 169
Lode Zone Type Variable No. of
Samples Min Max Mean CV
Face Sample
Sb (%) 29.9 36.6 34.4 0.1
Vein Width (m) 0.09 0.1 0.1 0.1
Merino 605 Drill Hole
Au (g/t)
21
0.001 120.6 20.6 1.7
Sb (%) 0.001 1.0 0.1 3.4
Vein Width (m) 0.073 1.0 0.3 0.8
Dorset 606 Drill Hole
Au (g/t)
9
0.001 124.0 30.0 1.3
Sb (%) 0.001 0.0 0.0 1.3
Vein Width (m) 0.04 0.5 0.2 0.9
Suffolk 620 Drill Hole
Au (g/t)
50
0.001 308.0 36.4 1.8
Sb (%) 0.001 10.5 0.6 3.3
Vein Width (m) 0.04 1.3 0.3 0.8
Drysdale 621 Drill Hole
Au (g/t)
10
0.001 115.0 24.7 1.5
Sb (%) 0.001 13.5 1.7 2.4
Vein Width (m) 0.043 0.2 0.1 0.5
The tabulated data indicates that the unweighted average gold and antimony grades are
higher within the face sample data than the drill holes. This is attributed to the following
factors:
1. Face sample data is collected representatively within ore drives, however, these ore
drives exist only in areas of the deposit that are deemed economically viable.
Therefore, the average grade of these samples is higher than that of the drilling data
which includes intercepts within areas that are sub-economic.
2. Separation between face samples can be as little as a production cut of 1.8 m versus
the ~40 m indicated spacing for drilling, leading to highly clustered data in economic
areas.
3. Drill core is sampled at an angle perpendicular to the long axis of the core rather than
along the boundary of the targeted vein. The sample is taken so that the entire vein
is within the sample, and therefore, there is invariably a wedge of waste rock that is
included with the lode sample. During face sampling the material is only collected
within the vein boundary. This difference in sampling manifests as proportional lower
average grades and higher average widths within drill data when compared to face
sample data.
The Shepherd Lode system (600 series) shows a marked difference to the Youle Lode system
(500 series) in the prevalence of gold relative to antimony, with zones of little to no antimony
in many of the grade domains and lodes. This agrees with visual observations of the drillcore,

Mandalay Resources - Costerfield Property NI 43-101 Technical Report
D E F I N E | P L A N | O P E R A T E 170
which show increased and dominant quartz percentages in the gangue, as well as the increase
in visible gold.
A comparison of face samples and drill holes was completed for the dominant mining area at
Youle (500), by restricting the face sample dataset to only include face samples within 10 m
of a drill hole intersection. Results showed face sampling had a positive bias in low-grades in
both Au-Accumulation and Sb-Accumulation (Figure 14-1), with a decreasing bias above the
resource cut-off grade (3.0 g/t Au Equivalent diluted to a 1.2 m resource width, corresponding
to 3.6 Au Accumulation and 2.4 Sb Accumulation independently).
Figure 14-1: Log Q-Q plot of Sb-Accumulation and Au-Accumulation comparisons of drill hole data and face sample data, showing all data (500 block model). 40x40x40 cell declustering applied
True thickness of intersections displayed the reverse bias, for the reasons outlined in point 3
above, with a positive bias at low widths, changing to a negative bias at a true thickness above
one metre thickness (Figure 14-2).
The log probability of this face sample and drill hole subset indicates that a large degree of
the discrepancy exists below the cut-off grades (Figure 14-3, Figure 14-4 and Figure 14-5).
Refer also to Section 14.15 for a discussion on the performance of the models against
production when reconciled.

Mandalay Resources - Costerfield Property NI 43-101 Technical Report
D E F I N E | P L A N | O P E R A T E 171
Figure 14-2: Log Q-Q plot of true-thickness comparisons of drill data and face sample data (500 block model). Left hand side shows all data, right hand side the filtered subset as above
Figure 14-3: Log probability plot of Au-Accumulation, drill hole data in black and face sample data in red

Mandalay Resources - Costerfield Property NI 43-101 Technical Report
D E F I N E | P L A N | O P E R A T E 172
Figure 14-4: Log probability plot of Sb-Accumulation, drill hole data in black and face sample data in red
Figure 14-5: Log probability plot of true thickness, drill hole data in black and face sample data in red

Mandalay Resources - Costerfield Property NI 43-101 Technical Report
D E F I N E | P L A N | O P E R A T E 173
The QP considers that, at grades and thicknesses of economic interest, the small positive
biases seen in the grade accumulation variables and negative bias seen in thickness variable
in the face samples relative to the drill hole samples are not material and support the
combination of these two datasets for the purposes of Mineral Resource Estimation.
14.2 Geological Interpretation and Domaining
Data and observations from drill logs, core photography, underground face mapping,
georeferenced face photography and backs mapping were considered during the process of
wireframe modelling. The identified intervals within both drill hole data and underground
face sample data are incorporated into the wireframe of each lode structure. This wireframe
is then used to flag the selected data with the corresponding zone code. Each lode structure
has been modelled separately and assigned a unique numeric zone code. The assays have
been composited over the full width of the intersections (including any intervening waste),
by lode.
Grade domaining on each lode/zone code was driven by geological interpretations of the
structural context and grade-tenure. Grade domains were used on both the Youle 500 series
and Shepherd 600 series models (Table 14-3) in order to separate high-grade and low-grade
populations to an acceptable degree, and to further limit data trends of grade-shoots.
Table 14-3: Number of grade domains used in 2021 resource models
Youle series models
Model # Num. Grade
Domains Shepherd
series models Model #
Num. Grade Domains
Youle 500 6 Shepherd 600 2
Peacock 508 4 Ryeland 604 1
Youle Splay 525 1 Merino 605 1
Peacock Splay 531 1 Dorset 606 1
Suffolk 620 3
Drysdale 621 1
Where there was limited data attributed to a lode, a single grade domain coincident with the
model boundary string was used. The KR Lode (310) is the only new estimate outside of Youle
and Shepherd that utilised >1 grade domain.
Domains for the Youle Lode, including sample locations, are displayed in Figure 14-6 as an
example, with a brief description of the domains and their geological context outlined in Table
14-4.

Mandalay Resources - Costerfield Property NI 43-101 Technical Report
D E F I N E | P L A N | O P E R A T E 174
Figure 14-6: Longitudinal projection of the Youle Lode, displaying domains determined by grade and structural controls on mineralisation
Table 14-4: Youle estimation domains and geological context
Domain Description Domain
Code Description
Youle – shallow dip 1 ~50 degree dip. Reactivated and mineralised west-dip thrust
Youle – steep dip 2 High-grade upper domain, steeper dip than lower Youle
Youle – shallow –
lower grade
3 Waste domain after major grade drop-off of Youle. Structure
Only, shallowing down-dip
Kendal Style 4 Sub-vertical Au-Sb extension veining as Youle flattens over the
anticline to the East. Connects with historical workings
Vulture Fault 5 Fault disruption. Thin and low-grade
South Zone 6 Southern ore pod driven by a structural flex to a more north-east
strike that interacts between the Doyle hangingwall and footwall
14.3 Grade Capping
Grade capping was conducted as a part of the estimation process to mitigate the
disproportionally large influence of extremely high grades on the estimated mean grade.
Statistical analysis of each domain for all lodes included in the 2021 Mineral Resource
Estimation was completed using Datamine Supervisor (formerly Snowden) software to
identify statistical outliers that may cause over-estimation of grade.

Mandalay Resources - Costerfield Property NI 43-101 Technical Report
D E F I N E | P L A N | O P E R A T E 175
Although true thickness is a physical measurement of the lode geometry rather than chemical
assay, it is also subject to grade capping to ensure that instances of the effects of significant
localised dilation of the lode, or blowouts, are minimised in the same way that
disproportionately high gold and antimony grades are capped.
Histograms, log probability plots, disintegration plots and cumulative metal plots were
utilised to determine the appropriate grade caps for gold accumulation (AUACC), antimony
accumulation (SBACC) and true thickness (TT). Examples of statistical plots generated with
the Datamine Supervisor package, and used in this process, are provided in Figure 14-7 to
Figure 14-9 for Youle Domain 2. Figure 14-10 provides an example of a disintegration plot and
has been completed following the method of Glacken (2020).
Figure 14-7: Youle Domain 2 – Grade capping statistical plots for Au-Accumulation

Mandalay Resources - Costerfield Property NI 43-101 Technical Report
D E F I N E | P L A N | O P E R A T E 176
Figure 14-8: Youle Domain 2 – Grade capping statistical plots for Sb-Accumulated

Mandalay Resources - Costerfield Property NI 43-101 Technical Report
D E F I N E | P L A N | O P E R A T E 177
Figure 14-9: Youle Domain 2 – Grade capping statistical plots for true thickness

Mandalay Resources - Costerfield Property NI 43-101 Technical Report
D E F I N E | P L A N | O P E R A T E 178
Figure 14-10: Example of a disintegration plot, used in data heavy Au-accumulation domains
The uncapped and grade capped values, and the effect of grade outliers on the overall sample
statistics for the 2021 models are provided in Table 14-5.

Mandalay Resources - Costerfield Property NI 43-101 Technical Report
D E F I N E | P L A N | O P E R A T E 179
Table 14-5: Sample statistics for the 2021 models, before and after grade caps M
od
el
Var
iab
le
Do
mai
n Number of Samples Mean Grade
Capping Value
Standard Deviation Coeff of Variation
Max Un-capped Grade
Capped %ile Un-capped Capped Un-capped Capped Diff (%) Un-capped Capped Un-capped Capped
KR
(B
run
swic
k) –
31
0 AUACC
1 37 1 5.14 4.92 -4% 32.5 7.83 6.78 1.52 1.38 46.54 97.3%
2 4 0 66.3 - - - 71.6 - 1.08 - 182 100.0%
SBACC 1 37 0 2.28 - - - 3.95 - 1.73 - 17.74 100.0%
2 4 0 12.4 - - - 10 - 0.8 - 26.7 100.0%
TT 1 37 2 0.53 0.5 -6% 1.5 0.48 0.37 0.91 0.75 2.78 94.6%
2 4 0 0.73 - - - 0.31 - 0.42 - 1.17 100.0%
YOU
LE –
50
0
AUACC
1 1421 2 33.26 33.11 0% 405 51.78 50.39 1.56 1.52 603 99.9%
2 379 6 46.9 45.31 -0.0339 250 60.83 53.34 1.3 1.18 429.35 98.4%
3 53 1 0.03 0.03 0 0.3 0.1 0.07 3.04 2.51 0.66 98.1%
4 490 1 13.6 13.3 -0.02206 135 20.86 17.87 1.53 1.34 280.72 99.8%
5 10 2 3.53 0.58 -84% 1.5 7.72 0.59 2.18 1.02 25.98 80.0%
6 324 3 4.61 4.46 -0.03254 26 6.17 5.41 1.34 1.21 50.64 99.1%
SBACC
1 1421 2 6.89 6.86 0% 70 8.83 8.56 1.28 1.25 94.6 99.9%
2 379 1 17.9 17.89 -0.00056 80 15.93 15.9 0.89 0.89 82.97 99.7%
3 53 2 0.02 0.02 0 0.2 0.08 0.05 3.41 2.98 0.47 96.2%
4 490 4 7.15 7.06 -0.01259 38 7.69 7.22 1.08 1.02 55.61 99.2%
5 10 2 0.52 0.28 -46% 0.55 0.71 0.21 1.37 0.72 2.48 80.0%
6 324 2 3 2.94 -0.02 17 3.74 3.42 1.25 1.16 28.44 99.4%
TT
1 1421 3 0.31 0.31 0% 2.6 0.34 0.33 1.1 1.08 3.04 99.8%
2 379 3 0.67 0.67 0 3 0.62 0.61 0.92 0.91 3.7 99.2%
3 53 1 0.27 0.25 -0.07407 0.95 0.28 0.2 1.06 0.81 1.86 98.1%

Mandalay Resources - Costerfield Property NI 43-101 Technical Report
D E F I N E | P L A N | O P E R A T E 180
Mo
de
l
Var
iab
le
Do
mai
n Number of Samples Mean Grade
Capping Value
Standard Deviation Coeff of Variation
Max Un-capped Grade
Capped %ile Un-capped Capped Un-capped Capped Diff (%) Un-capped Capped Un-capped Capped
4 490 5 0.21 0.2 -0.04762 1.2 0.23 0.21 1.11 1.04 1.75 99.0%
5 10 2 0.1 0.09 -10% 0.16 0.08 0.06 0.78 0.69 0.23 80.0%
6 324 3 0.21 0.2 -0.04762 1.2 0.2 0.19 0.98 0.92 1.52 99.1%
PEA
CO
CK
– 5
08
AUACC
1 91 2 42.92 30.87 -28% 235 133.14 46.28 3.1 1.5 1268.75 97.8%
2 74 2 8.24 7.25 -0.12015 35 13.05 8.68 1.58 1.2 78.3 97.3%
3 9 1 0.06 0.04 -0.33333 0.1 0.08 0.04 1.42 1.01 0.26 88.9%
4 25 1 0.96 0.56 -0.41667 1.5 1.54 0.5 1.6 0.89 5.27 96.0%
SBACC
1 91 0 8.66 - - - 6.97 - 0.8 - 34.79 100.0%
2 74 0 3.92 - - - 3.52 - 0.9 - 13.22 100.0%
3 9 1 0.02 0.01 -50% 0.02 0.05 0.01 2.29 0.98 0.16 88.9%
4 25 1 5.08 3.5 -0.31102 10 7.24 3.32 1.42 0.95 24.71 96.0%
TT
1 91 3 0.32 0.31 -0.03125 1 0.3 0.23 0.93 0.76 1.8 96.7%
2 74 1 0.21 0.16 -0.2381 0.65 0.32 0.15 1.53 0.91 1.53 98.6%
3 9 1 0.39 0.38 -3% 0.8 0.27 0.25 0.7 0.66 0.94 88.9%
4 25 3 0.27 0.22 -0.18519 0.45 0.24 0.16 0.9 0.73 0.76 88.0%
You
le S
ou
th
Spla
y –
52
5
AUACC 1 103 2 12.24 11.86 -3% 80 17.32 15.53 1.41 1.31 101.43 98.1%
SBACC 1 103 1 4.4 4.38 -0.00455 11.5 3.1 3.06 0.7 0.7 13.18 99.0%
TT 1 103 2 0.19 0.19 0 0.45 0.1 0.09 0.52 0.5 0.51 98.1%
53
1
AUACC 1 18 0 4.64 - -1 - 4.63 - 0.95 - 18.4 100.0%
2 18 0 3.24 - -100% - 2.49 - 0.77 - 8.96 100.0%
SBACC 1 18 0 0.304 - -1 - 0.362 - 1.19 - 1.2 100.0%
2 7 0 0.139 - -100% - 0.159 - 1.143 - 0.38 100.0%
TT 1 7 0 0.34 - -1 - 0.3 - 0.87 - 0.8 100.0%

Mandalay Resources - Costerfield Property NI 43-101 Technical Report
D E F I N E | P L A N | O P E R A T E 181
Mo
de
l
Var
iab
le
Do
mai
n Number of Samples Mean Grade
Capping Value
Standard Deviation Coeff of Variation
Max Un-capped Grade
Capped %ile Un-capped Capped Un-capped Capped Diff (%) Un-capped Capped Un-capped Capped
2 7 0 0.06 - -1 - 0.038 - 0.63 - 0.12 100.0%
60
0
AUACC 1 34 0 21.87 - - - 19.63 - 0.9 - 103.62 100.0%
2 62 1 22.52 20.03 -11% 160 50.23 35.95 2.23 1.8 375.01 98.4%
SBACC 1 34 1 6.69 6.47 -0.03288 25 7.85 7.07 1.17 1.09 41.58 97.1%
2 62 6 0.18 0.05 -72% 0.32 0.53 0.1 3.02 2.16 3.18 90.3%
TT 1 34 0 0.6 - - - 0.47 - 0.78 - 1.72 100.0%
2 62 0 0.41 - - - 0.33 - 0.8 - 1.37 100.0%
60
4
AUACC 1 22 2 9.47 7.51 -21% 30 14.62 9.5 1.54 1.26 50.71 90.9%
SBACC 1 22 5 0.76 0.05 -93% 0.25 1.78 0.09 2.35 1.98 5.93 77.3%
TT 1 22 1 0.19 0.19 0% 0.45 0.1 0.09 0.52 0.5 0.51 98.1%
60
5
AUACC 1 21 1 8.5 5.18 -39% 25 20.36 7.9 2.39 1.52 94.72 95.2%
SBACC 1 21 1 0.01 0.01 0% 0.05 0.02 0.01 2.15 1.89 0.09 95.2%
TT 1 21 1 0.3 0.29 -3% 0.8 0.24 0.21 0.82 0.74 1.04 95.2%
60
6
AUACC 1 9 1 7.18 4.32 -40% 30 17.41 8.2 2.42 1.9 63.98 88.9%
SBACC 1 9 0 0 - - - 0 - 1.58 - 0 100.0%
TT 1 9 1 0.14 0.12 -14% 0.3 0.13 0.08 0.91 0.64 0.52 88.9%
62
0
AUACC
1 23 1 13.96 13.01 -7% 80 25.6 22.35 1.83 1.72 111.71 95.7%
2 12 0 15.41 - - - 17.2 - 1.12 - 49.53 100.0%
3 15 0 0.22 - - - 0.33 - 1.51 - 1.02 100.0%
SBACC
1 23 1 0 0 0% 0.02 0.01 0.01 2.09 1.62 0.04 95.7%
2 12 0 0.5 - - - 0.73 - 1.48 - 2.26 100.0%
3 16 1 0 0 - 0.01 0.01 0 1.89 1.36 0.03 93.8%

Mandalay Resources - Costerfield Property NI 43-101 Technical Report
D E F I N E | P L A N | O P E R A T E 182
Mo
de
l
Var
iab
le
Do
mai
n Number of Samples Mean Grade
Capping Value
Standard Deviation Coeff of Variation
Max Un-capped Grade
Capped %ile Un-capped Capped Un-capped Capped Diff (%) Un-capped Capped Un-capped Capped
True Thickness (TT)
1
23 0 0.33 - - - 0.21 - 0.64 - 0.84 100.0%
2 12 0 0.43 - - - 0.4 - 0.94 - 1.29 100.0%
3 15 0 0.3 - - - 0.2 - 0.67 - 0.78 93.3%
62
1
AUACC 1 10 0 2.58 - - - 4.25 - 1.65 - 13.9 100.0%
SBACC 1 10 1 0.18 0.08 -56% 0.4 0.44 0.15 2.41 1.98 1.47 90.0%
TT 1 10 0 0.12 - - - 0.06 - 0.5 - 0.23 90.0%

Mandalay Resources - Costerfield Property NI 43-101 Technical Report
D E F I N E | P L A N | O P E R A T E 183
14.4 Estimation Domain Boundaries
Structural controls on mineralisation have been identified through underground mapping and
structural interpretation of drill core. These relationships have been used to guide estimation
domain boundaries, which are dominantly hard boundaries. One soft boundary has been
estimated between the 500 and 525 models, which show a strong grade relation, with
mineralisation alternating between proximal structures. Grade domain boundaries are shown
for the major Youle 500 (Figure 14-6), Shepherd 600 (Figure 14-11), and Suffolk 620 lodes
(Figure 14-12). Refer also to Section 14.2 for the Youle 500 example tied back to geological
interpretation.
In both the 600 and 620 models, a strong flexure divides the lode into a distinct north and
south zone, and is spatially correlated with a change in antimony and gold grades in the lodes
(see figures and tables in Vein Orientation Domains 14.5).
Figure 14-11: Shepherd-600 Lode estimation domain boundaries

Mandalay Resources - Costerfield Property NI 43-101 Technical Report
D E F I N E | P L A N | O P E R A T E 184
Figure 14-12: Suffolk-620 Lode estimation domain boundaries
14.5 Vein Orientation Domains
In order to use the 2D accumulation method to estimate true thickness from the drill hole
intersections and convert the 2D tonnes and grade estimates to 3D tonnes and grade
estimates, dip and dip-direction domains were interpreted in long section, identified visually
from the wireframe of each lode structure.
The dip and dip-direction of each domain was determined by adjusting a plane of best fit to
the dip and dip-direction of the domain. The details of this plane were then coded into the
drill data associated with the domain.
A check of true thickness derived from this methodology was completed on Shepherd using
the vein alpha of the intercept in drill core. The drill core alpha-derived true thickness was
compared to the dip-domain derived true thickness and in the case of the 600, 605, and 620
models a bias between 20-30% was observed between alpha to dip-domain true thickness
(example Figure 14-13).

Mandalay Resources - Costerfield Property NI 43-101 Technical Report
D E F I N E | P L A N | O P E R A T E 185
Figure 14-13: Shepherd 600 alpha true-thickness versus the dip-domain true thickness, highlighting the undercall of true thickness by the more global dip-domains
The variance between the true-thickness values was interpreted to be due to the presence of
minor lode offsets by west-dipping apparent thrust faults and lode flexures that were unable
to be resolved in the resolution of exploration drilling. This led to a smoothed west-dipping
wireframe when the lode orientation was more sub-vertical between the apparent fault
panels. This geology interpretation was consistent with areas of sub-vertical mineralisation
mined at Youle, such as in the north domain 4 on the 500 model.
As the alpha true thickness was more representative in those cases, an alpha true-thickness
correction factor based on a linear regression of the dip-domain and alpha true thickness
datasets was applied to derive the final true-thickness used in the estimation. The process
workflow is summarised in Figure 14-14.

Mandalay Resources - Costerfield Property NI 43-101 Technical Report
D E F I N E | P L A N | O P E R A T E 186
Figure 14-14: Flow map of true thickness calculations in the resource estimation for the 600, 605, 620 Shepherd series models, illustrating the correction for drill core alpha derived true thickness
In using an alpha true-thickness correction factor, the relationship between the global dip-
domain derived block model volume correction factors and true thickness was maintained.
The dip and dip-direction domains have been used to create volume correction factors for 2D
to 3D conversion within the Z and Y directions using the following formula:
Z Correction Factor = 1/ sin (dip)
Y Correction Factor = Absolute (1/ sin (dip-direction)).
Volume Correction Factor = Z Correction Factor × Y Correction Factor.
The vein orientation domain examples are given for the major Youle 500 in Figure 14-15 and
Table 14-6, for Shepherd 600 Lode in Figure 14-16 and Table 14-7, for Suffolk 620 Lode in
Figure 14-17 and Table 14-8.

Mandalay Resources - Costerfield Property NI 43-101 Technical Report
D E F I N E | P L A N | O P E R A T E 187
Figure 14-15: Youle-500 Lode dip and dip-direction domains
Table 14-6: Youle-500 Lode dip domains – dip and dip direction
Dip Domain Dip (degrees) Dip-Direction (degrees)
1 85 272
2 70 280
3 65 275
4 31 278
5 65 278
6 80 288
7 35 280
8 44 281
9 53 291
10 43 293
11 52 305
12 25 312
13 53 304
14 49 286
15 55 256
16 46 292
17 27 317

Mandalay Resources - Costerfield Property NI 43-101 Technical Report
D E F I N E | P L A N | O P E R A T E 188
Figure 14-16: Shepherd-600 Lode dip and dip-direction domains
Table 14-7: Shepherd-600 Lode dip domains – dip and dip direction
Dip Domain Dip (degrees) Dip Direction (degrees)
1 57 292
2 52 284
3 85 291
4 88 274
5 68 282
6 82 267
7 85 271
8 66 273

Mandalay Resources - Costerfield Property NI 43-101 Technical Report
D E F I N E | P L A N | O P E R A T E 189
Figure 14-17: Suffolk-620 Lode dip and dip direction domains
Table 14-8: Suffolk-620 Lode dip domains – dip and dip direction
Dip Domain Dip (degrees) Dip Direction (degrees)
1 81 262
2 85 278
3 83 270
14.6 Bulk Density Determinations
Bulk density was assessed in underground and drill core samples during 2021 throughout the
Youle and Shepherd Lode systems. The determinations were from whole-core samples, which
were aligned with assay sample intervals.
The determinations were completed utilising a Dynamics G-Ex Bulk Density weighing station
with an Adam Equipment Cruiser CKT 8H scale using a variation of the water immersion
method 3 calculation as described in Lipton and Horton (2014):
𝐷𝑟𝑦 𝐵𝑢𝑙𝑘 𝐷𝑒𝑛𝑠𝑖𝑡𝑦 = 𝑆𝑎𝑚𝑝𝑙𝑒 𝐷𝑟𝑦 𝑀𝑎𝑠𝑠
𝑆𝑎𝑚𝑝𝑙𝑒 𝐷𝑟𝑦 𝑀𝑎𝑠𝑠 − 𝑆𝑎𝑚𝑝𝑙𝑒 𝑀𝑎𝑠𝑠 𝑖𝑛 𝑊𝑎𝑡𝑒𝑟
The standard procedure employed by Mandalay differs from Lipton and Horton’s (2014)
water immersion method 3 that recommends oven-drying, as Mandalay only air-dried the
samples. Oven-drying was not employed and samples were not coated in wax. The scales
were monitored daily with A.C.M Laboratory PTY. LTD. Certified 0.5 kg, 1 kg and 2 kg weights.

Mandalay Resources - Costerfield Property NI 43-101 Technical Report
D E F I N E | P L A N | O P E R A T E 190
As the samples were not oven-dried following the Lipton and Horton (2014) procedure, the
impact of air-drying only was tested. Testing was undertaken by measuring bulk density as
per the air-dry method, oven-drying at 106oC for 14 hours at On Site Laboratory, and then
returning the samples to site and completing the bulk density utilising the same method on
the oven-dried samples. A total of 60 samples ranging between 5-80% stibnite with an
average of 40% stibnite were completed. Gangue was dominantly quartz with minor siltstone.
The summary statistics from this test work is presented in Table 14-9. The results show that
there is no material difference in the bulk density determination by the air-dry or oven-dry
methods, and therefore, the QP considers that the air-dry method is acceptable.
Table 14-9: Descriptive statistics of semi-dry versus oven-dry bulk density determination in lode material
Statistic Value
Mean BD, Semi-dry (g/cm3) 3.059
Mean BD, Oven-dry (g/cm3) 3.065
SD, Semi-dry 0.56
SD, Oven-dry 0.57
Count 60
Correlation Coeff. 1.00
Avg. Moisture (n=42) 0.16%
Estimation of bulk density was assessed using two methods for mineralised and
unmineralised material as follows.
14.6.1 Mineralised Material
A summary of the bulk densities applied to mineralised material in the resource models is
given in Table 14-10. Stibnite concentration continued to have the dominant effect on bulk
density, and the formulas retain the stoichiometric based formula, except in Shepherd
(Equation 3) where quartz occurred as the dominant gangue mineral in some locations.
Table 14-10: Summary of the 3 derivations of the bulk density formula in use for the mineral resource estimate
Models Equation
No.
Equation
Augusta, Cuffley,
Brunswick Lodes
1 𝐵𝐷 = ((1.3951 ∗ Sb%) + (100 − (1.3951 ∗ Sb%)))/(((1.3951 ∗ Sb%)/4.56) + ((100
− (1.3951 ∗ Sb%))/2.74))
Youle 500 Series
Lodes
2 𝐵𝐷 = ((1.3951 ∗ Sb%) + (100 − (1.3951 ∗ Sb%)))/(((1.3951 ∗ Sb%)/4.56) + ((100
− (1.3951 ∗ Sb%))/2.69))
Shepherd 600
Series Lodes
3 𝐼𝑓 (𝑆𝑏% > 1) 𝐵𝐷 =
((1.3951 ∗ Sb%) + (100 − (1.3951 ∗ Sb%)))/(((1.3951 ∗ Sb%)/4.56) + ((100 −
(1.3951 ∗ Sb%))/2.69) ) 𝐼𝑓(𝑆𝑏% < 1) 𝐵𝐷 = (0.05661 ∗ Fe%) + 2.5259

Mandalay Resources - Costerfield Property NI 43-101 Technical Report
D E F I N E | P L A N | O P E R A T E 191
14.6.1.1 Augusta, Cuffley and Brunswick Models
The bulk density (BD) for all Augusta, Cuffley and Brunswick lodes have historically been
estimated using a stoichiometric formula which uses the assayed antimony grade as the
principal variable, and the BD of waste rock set as a constant value as displayed below, using
Equation 1.
𝐸𝑞 1 − 𝐵𝐷 = ((1.3951 ∗ 𝑆𝑏%) + (100 − (1.3951 ∗ 𝑆𝑏%)))/(((1.3951 ∗ 𝑆𝑏%)/4.56)
+ ((100 − (1.3951 ∗ 𝑆𝑏%))/2.74))
Where:
• Empirical formula of stibnite: Sb2S3
• Sb%: Antimony assay as a percentage by mass
• Molecular weight of Antimony (Sb): 121.757
• Molecular weight of Sulphur: (S): 32.066
• 1.3951 is a constant calculated by 339.712/243.514 where 339.712 is the molar mass
of Sb2S3, and 243.514 is the molar mass of antimony contained in one mole of pure
stibnite
• BD of pure stibnite: 4.56
• BD of unmineralised waste: 2.74
This method of bulk density estimation for mineralisation was developed and implemented
in the 2005 Mineral Resource Estimate conducted by McArthur Ore Deposit Assessments Pty
Ltd (“MODA”) (MODA, 2005), and has continued to be used in the estimation of the Augusta,
Cuffley and Brunswick mineralisation since that date. Equation 1 was applied to the
Brunswick-KR (310) estimate.
14.6.1.2 Youle Models
The bulk density (BD) for all Youle and Shepherd lodes in presence of stibnite has been
estimated using a variation of the stoichiometric formula presented in Equation 1, with an
adjustment to gangue constant to create Equation 2:
𝐸𝑞 2 − 𝑌𝑜𝑢𝑙𝑒 𝐵𝐷
= ((1.3951 ∗ Sb%) + (100 − (1.3951 ∗ Sb%)))/(((1.3951 ∗ Sb%)/4.56)
+ ((100 − (1.3951 ∗ Sb%))/2.69))
Where:
• Empirical formula of stibnite: Sb2S3
• Sb%: Antimony assay as a percentage by mass
• Molecular weight of Antimony (Sb): 121.757
• Molecular weight of Sulphur: (S): 32.066

Mandalay Resources - Costerfield Property NI 43-101 Technical Report
D E F I N E | P L A N | O P E R A T E 192
• 1.3951 is a constant calculated by 339.712/243.514 where 339.712 is the molar mass
of Sb2S3, and 243.514 is the molar mass of antimony contained in one mole of pure
stibnite
• BD of pure stibnite: 4.56
• BD of unmineralised gangue: 2.69, representing a ratio of 1:3 siltstone to quartz
Gangue density has decreased due to the increase in quartz percentage relative to siltstone
in the lodes at Youle and Shepherd, with the observation of an average of 75% quartz in
gangue material in Youle face samples. Figure 14-18 highlights the improved fit of Equation 2
to the observed bulk density data at Youle and Shepherd relative to the Equation 1 gangue
constant. The predicted and observed bulk density for Equation 2 is presented against
antimony in Figure 14-19. Equation 2 was used for all Youle Lodes.
Figure 14-18: Q-Q Plots of A) the original bulk density formula (OPRED, Equation 1) against measured BD from the 2021 Youle and Shepherd testwork and B) Equation 2 with 2.69 gangue constant (269) against measured BD
14.6.1.3 Shepherd Models
Gold-only grade domains have been interpreted in the Shepherd deposit where the dominant
gangue material was quartz. These lodes often contained <1% antimony rendering an
antimony-based equation unsuitable at this low grade.
In the bulk density measurements on Shepherd drill core with grades less than 1% antimony,
iron (Fe%) analysis had a 0.72 correlation with the measured bulk density. This is interpreted
to be due to decreasing silt or carbonate gangue while quartz increases and bulk density falls.
The weight percent decrease of iron also occurs at high antimony concentrations as stibnite
becomes prevalent, rendering a linear multivariate regression unsuitable. An iron-based
regression formula (R2= 0.73) was applied to all Shepherd Lodes when antimony was <1%
(Equation 3 and Figure 14-20).
𝐸𝑞 3 − 𝑆ℎ𝑒𝑝ℎ𝑒𝑟𝑑 𝐵𝐷
𝐼𝑓(𝑆𝑏% > 1)𝐵𝐷
= ((1.3951 ∗ Sb%) + (100 − (1.3951 ∗ Sb%)))/(((1.3951 ∗ Sb%)/4.56)
+ ((100 − (1.3951 ∗ Sb%))/2.69) )
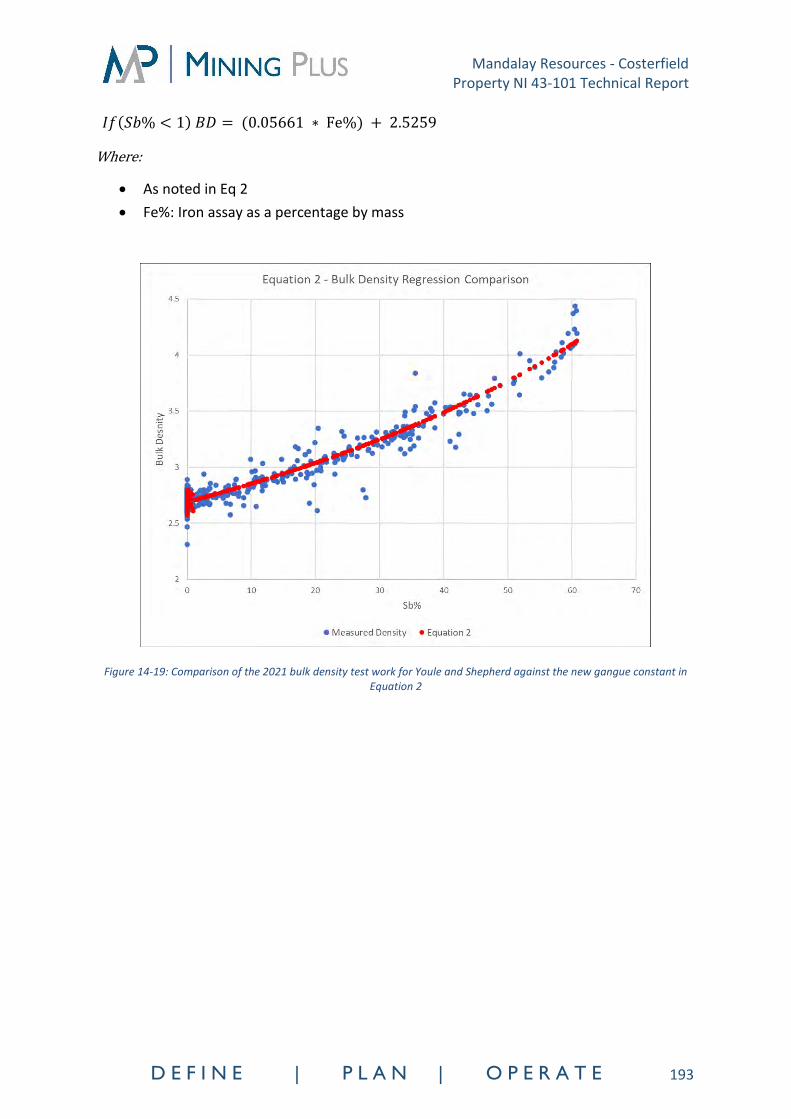
Mandalay Resources - Costerfield Property NI 43-101 Technical Report
D E F I N E | P L A N | O P E R A T E 193
𝐼𝑓(𝑆𝑏% < 1) 𝐵𝐷 = (0.05661 ∗ Fe%) + 2.5259
Where:
• As noted in Eq 2
• Fe%: Iron assay as a percentage by mass
Figure 14-19: Comparison of the 2021 bulk density test work for Youle and Shepherd against the new gangue constant in Equation 2

Mandalay Resources - Costerfield Property NI 43-101 Technical Report
D E F I N E | P L A N | O P E R A T E 194
Figure 14-20: Bulk Density test work for samples below 1% antimony versus the predicted bulk density from the linear Fe regression in equation 3
14.6.2 Unmineralised Material
14.6.2.1 Augusta, Brunswick and Cuffley
The unmineralised rock bulk density of 2.74 g/cm3 has been averaged from 1,060 samples of
drill core measured using the water immersion method during 2014.
The basic statistics for this series of samples has been shown in Table 14-11 and demonstrates
very little variability in the waste material bulk densities. Waste rock density remained
unchanged for pre-2021 models and has been maintained in the KR-Brunswick 310 estimate.
Table 14-11: Descriptive statistics of bulk density in waste material, Augusta, Brunswick, Cuffley
Statistic Bulk Density (g/cm3)
Mean 2.74
Median 2.77
Mode 2.80
Standard Deviation 0.11
Sample Variance 0.01
Range 1.23
Minimum 2.01
Maximum 3.24

Mandalay Resources - Costerfield Property NI 43-101 Technical Report
D E F I N E | P L A N | O P E R A T E 195
Count 1,060
14.6.2.2 Youle and Shepherd
Testwork on the bulk density of unmineralised Youle and Shepherd underground samples and
drill core was completed during 2021. Summary statistics for waste material with <5% quartz
have been presented in Table 14-12 and Figure 14-21; these showed very little variation
around the mean of 2.76 g/cm3. Therefore, 2.76 g/cm3 has been applied to waste material in
the 2021 Youle and Shepherd estimates.
Table 14-12: Descriptive statistics of bulk density in waste material, Youle-Shepherd
Statistic Bulk Density (g/cm3)
Mean 2.76
Median 2.76
Mode 2.78
Standard Deviation 0.03
Sample Variance 0.01
Range 0.27
Minimum 2.62
Maximum 2.89
Count 368
Figure 14-21: Histogram of unmineralised rock bulk density values at Youle-Shepherd

Mandalay Resources - Costerfield Property NI 43-101 Technical Report
D E F I N E | P L A N | O P E R A T E 196
14.6.3 Bulk Density Discussion
The effect on the MRE of the two changes in the application of bulk density for Youle and
Shepherd when compared to previous estimations has been investigated. The two changes
were the following:
• Bulk density weighting during compositing.
• The use of Equation 2 and Equation 3.
The materiality of these changes is given below in a case study of the Youle 500 model (Table
14-13). The 500 model contributes most of the material in the 2021 MRE and contains the
greatest antimony endowment. As demonstrated in Table 14-13, the two changes in the
application of bulk density in the MRE partially counteracted each other, with an overall minor
increase to contained metal pre-depletion.
Table 14-13: Case study on the effect of bulk density changes on Youle 500 model, pre-depletion
Model Tonnes AuEq. Oz Δtonnes Δtonnes % Δ AuEq. Oz Δ AuEq.
Oz % Youle (500) 2021 397,769 276,185
Youle (500) Unweighted Sample Composite
395,210 271,145 - 2,559 -0.64% - 5,040 -1.82%
Youle (500) BD Eq 1
399,324 279,558 1,554 0.39% 3,373 1.22%
Note: Gold equivalent ounces (AuEq. Oz) was determined by applying the ratio of resource metal prices ($8500/$1700) to antimony
percentage and adding to gold ounces.
In addition, the MRE was not sensitive to the waste rock bulk density change from 2.74 g/cm3
to 2.76 g/cm3 with a decrease in gold-equivalent ounces of 0.01% (93 AuEq. ounces) and an
increase in tonnes of 0.12% across all Youle and Shepherd depleted models.
14.7 Variography
A variographic analysis was carried out on the combined composited face and drill hole
samples for true thickness, gold accumulation and antimony accumulation. The aim was to
identify principal directions of continuity of both grade and thickness, and to assist in the
selection of search ranges for subsequent estimation. Variography was undertaken in two
dimensions after projecting the data onto a constant easting.
Anisotropic normal score variograms were modelled on individual and grouped domains
where required. Variograms were produced using Supervisor v8.12 software after grade
capping of the grade accumulation and true thickness variables had taken place. The
variogram models were back-transformed prior to importing into Datamine software for the
estimate.

Mandalay Resources - Costerfield Property NI 43-101 Technical Report
D E F I N E | P L A N | O P E R A T E 197
The nugget value was estimated using omnidirectional variograms with a short lag, as
downhole variograms cannot be calculated on this dataset due to the samples being
composited to the full width of the mineralisation. Therefore, the omnidirectional variogram
with short lag most closely represents the small-scale geological and/or sampling grade
variability of the data.
Example experimental normal scores variograms and fitted models for the Youle (500) and
Shepherd (600) Lodes showing gold and antimony accumulation, and lode true thickness are
displayed in Figure 14-22 to Figure 14-27. Where a model lacked sufficient pairs to produce
meaningful variograms, variograms were borrowed from other domains of similar geological
character and controls on mineralisation.
Figure 14-22: Youle 500 domain 1 Au-Accumulation (AUACC) variograms

Mandalay Resources - Costerfield Property NI 43-101 Technical Report
D E F I N E | P L A N | O P E R A T E 198
Figure 14-23: Youle 500 domain 1 Sb-Accumulation (SBACC) variograms
Figure 14-24: Youle 500 domain 1 true thickness (TT) variograms

Mandalay Resources - Costerfield Property NI 43-101 Technical Report
D E F I N E | P L A N | O P E R A T E 199
Figure 14-25: Shepherd 600 domain 1 Au-Accumulation (AUACC) variograms

Mandalay Resources - Costerfield Property NI 43-101 Technical Report
D E F I N E | P L A N | O P E R A T E 200
Figure 14-26: Shepherd 600 domain 1 Sb-Accumulation (SBACC) variograms
Figure 14-27: Shepherd 600 domain 1 true thickness (TT) variograms
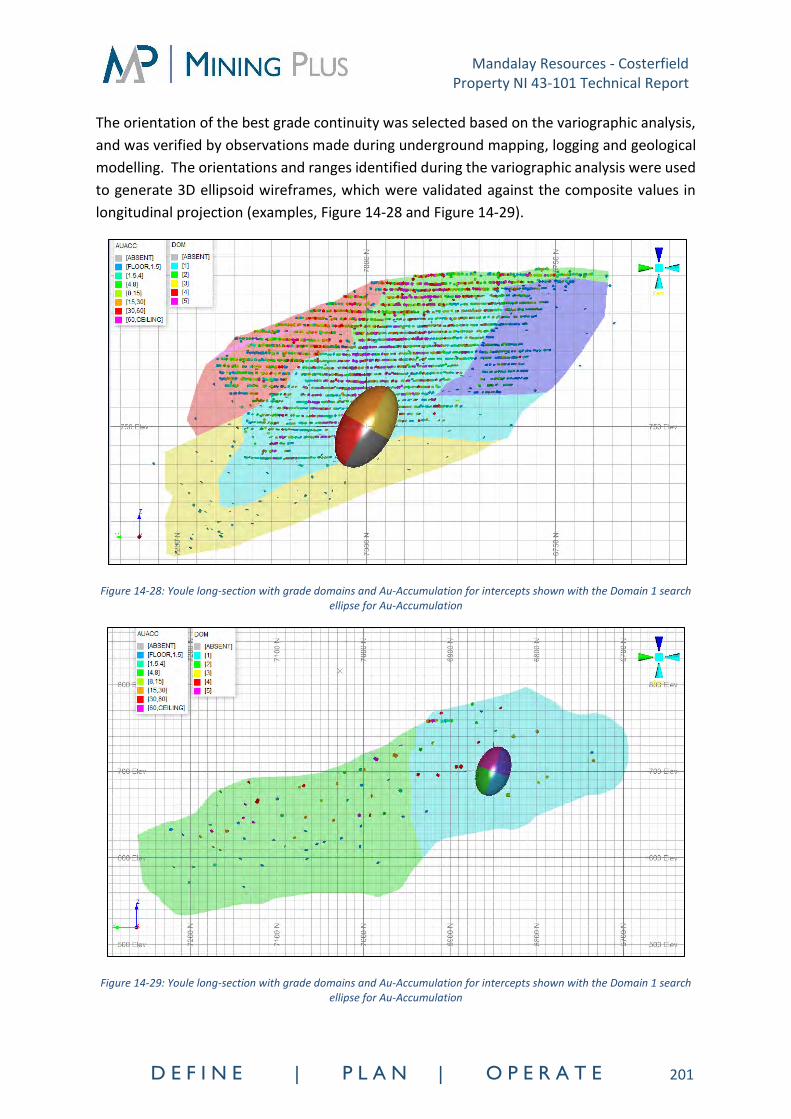
Mandalay Resources - Costerfield Property NI 43-101 Technical Report
D E F I N E | P L A N | O P E R A T E 201
The orientation of the best grade continuity was selected based on the variographic analysis,
and was verified by observations made during underground mapping, logging and geological
modelling. The orientations and ranges identified during the variographic analysis were used
to generate 3D ellipsoid wireframes, which were validated against the composite values in
longitudinal projection (examples, Figure 14-28 and Figure 14-29).
Figure 14-28: Youle long-section with grade domains and Au-Accumulation for intercepts shown with the Domain 1 search ellipse for Au-Accumulation
Figure 14-29: Youle long-section with grade domains and Au-Accumulation for intercepts shown with the Domain 1 search ellipse for Au-Accumulation

Mandalay Resources - Costerfield Property NI 43-101 Technical Report
D E F I N E | P L A N | O P E R A T E 202
The variographic parameters determined for the Youle 500 and Shepherd 600 Lodes are
detailed in Table 14-14 and Table 14-15.

Mandalay Resources - Costerfield Property NI 43-101 Technical Report
D E F I N E | P L A N | O P E R A T E 203
Table 14-14: Youle 500 variogram model parameters
Model Domain Element Variogram Orientations Datamine Rotations Variographic parameters
Dir 1 Dir 2 Dir 3 Dir 1 Dir 2 Dir 3 C0 C1 A1 C2 A2
Yo
ule
50
0
Domain 1 AuACC 90 90 -120 Z X Z 0.45
Dir 1
0.37
13 Dir 1
0.18
100
Dir 2 15 Dir 2 60
Dir 3 15 Dir 3 60
Domain 1 SBACC 90 90 -160 Z X Z 0.31
Dir 1
0.45
18 Dir 1
0.24
329
Dir 2 16 Dir 2 45
Dir 3 16 Dir 3 45
Domain 1 TT 90 90 -120 Z X Z 0.30
Dir 1
0.43
15 Dir 1
0.28
53
Dir 2 14 Dir 2 25
Dir 3 14 Dir 3 25
Domain 2 AuACC 90 90 -130
Z X Z 0.30
Dir 1
0.37
17 Dir 1
0.32
39
Dir 2 17 Dir 2 34
Dir 3 17 Dir 3 34
Domain 2 SBACC 90 90 -120
Z X Z 0.27
Dir 1
0.53
28 Dir 1
0.20
43
Dir 2 28 Dir 2 29
Dir 3 28 Dir 3 29
Domain 2 TT 90 90 -160
Z X Z 0.22
Dir 1
0.62
13 Dir 1
0.16
32
Dir 2 19 Dir 2 20
Dir 3 19 Dir 3 20
Domain 3 Utilises Domain 1 Variogram
Domain 4 AuACC 90 90 -140
Z X Z 0.45
Dir 1
0.44
28 Dir 1
0.12
74
Dir 2 28 Dir 2 59
Dir 3 29 Dir 3 59
Domain 4 SBACC 90 90 -150
Z X Z 0.26
Dir 1
0.60
29 Dir 1
0.14
77
Dir 2 31 Dir 2 60
Dir 3 31 Dir 3 60
Domain 4 TT 90 90 -150
Z X Z 0.39
Dir 1
0.11
5 Dir 1
0.50
29
Dir 2 4 Dir 2 26
Dir 3 4 Dir 3 26
Domain 5 Utilises Domain 4 Variogram
Domain 6 AuACC 90
-110
Z
X
Z
0.3
0.34
Dir 1 0.53
19 Dir 1 0.13
118
Dir 2 22 Dir 2 23
Dir 3 22 Dir 3 23
Domain 6 SBACC 90
90
-120
Z
X
Z
0.26
Dir 1 0.45
12 Dir 1 0.29
53
Dir 2 29 Dir 2 30
Dir 3 20 Dir 3 40

Mandalay Resources - Costerfield Property NI 43-101 Technical Report
D E F I N E | P L A N | O P E R A T E 204
Model Domain Element Variogram Orientations Datamine Rotations Variographic parameters
Dir 1 Dir 2 Dir 3 Dir 1 Dir 2 Dir 3 C0 C1 A1 C2 A2
Domain 6 TT 90
90
-110
Z
X
Z
0.36
Dir 1 0.53
11 Dir 1 0.11
44
Dir 2 11 Dir 2 22
Dir 3 11 Dir 3 22
Dir 1: Major, Dir 2: Semi-Major, Dir 3: Minor, C0: nugget variance, C1 & C2: sills of autocorrelated variance, A1 & A2: Range of spatial dependence
Table 14-15: Shepherd 600 variogram model parameters
Model Domain Element Variogram Orientations Datamine Rotations Variographic parameters
Dir 1 Dir 2 Dir 3 Dir 1 Dir 2 Dir 3 C0 C1 A1 C2 A2
Shep
her
d 6
00
Domain 1 AuACC 90 90 -120 Z X Z 0.39
Dir 1
0.38
55 Dir 1
0.23
58
Dir 2 32 Dir 2 40
Dir 3 32 Dir 3 40
Domain 1 SBACC 90 90 -110 Z X Z 0.12
Dir 1
0.69
42 Dir 1
0.19
67
Dir 2 17 Dir 2 50
Dir 3 17 Dir 3 50
Domain 1 TT 90 90 -120 Z X Z 0.49
Dir 1
0.14
57 Dir 1
0.37
58
Dir 2 17 Dir 2 50
Dir 3 17 Dir 3 50
Domain 2 AuACC 90 90 -100 Z X Z 0.62
Dir 1
0.26
34 Dir 1
0.12
60
Dir 2 55 Dir 2 60
Dir 3 55 Dir 3 60
Domain 2 SBACC 90 90 -105 Z X Z 0.62
Dir 1
0.27
41 Dir 1
0.11
66
Dir 2 43 Dir 2 51
Dir 3 45 Dir 3 51
Domain 2 TT 90 90 -110 Z X Z 0.56
Dir 1
0.34
65 Dir 1
0.09
75
Dir 2 62 Dir 2 75
Dir 3 62 Dir 3 75
Dir 1: Major, Dir 2: Semi-Major, Dir 3: Minor, C0: nugget variance, C1 & C2: sills of autocorrelated variance, A1 & A2: Range of spatial dependence

Mandalay Resources - Costerfield Property NI 43-101 Technical Report
D E F I N E | P L A N | O P E R A T E 205
14.8 Search and Estimation Parameters
True thickness, gold accumulation, and antimony accumulation were estimated into the block
model for each lode. The models were oriented north-south and were one block wide in the
east-west direction. This type of block model is subsequently referred to as a two-
dimensional (2D) seam block model. All search ellipses used for this method were parallel
with the north-south block model orientation.
The following summarises the estimation process:
• Drill hole and face samples for each lode were projected into an arbitrary north-south
oriented vertical plane.
• The orientation and anisotropy of the search ellipsoid for each lode was guided by the
grade and thickness continuity modelled in the variographic analysis.
• The variogram parameters for the Youle and Shepherd Lodes are detailed above in
Section 14.7. Where the variogram lacked sufficient data pairs to produce meaningful
variograms, variograms were borrowed from the adjacent lode domains that have a
comparable geological setting. For example, the 508 Peacock borrowed the 500 Youle
variograms and the 620 Suffolk the 600 Shepherd variograms.
• Each estimate involved three search passes:
o The first search pass dimensions were approximately equivalent to half of the gold
accumulation variogram model range.
o The second was twice the first pass in all three directions.
o The third pass was six times the first pass in all three directions.
• Where grade sub-domains were present, the estimation was completed separately
within each sub-domain with the sub-domains having hard boundaries in most cases
to divide high and low-grade domains. In some cases, soft boundaries were employed
as noted in Section 14.4.
• The estimation was undertaken using a combined dataset of face sample and drill hole
data. A limit to the number of face samples was applied to the regions of the estimate
with low sample density (exploration drilling) zones. These regions correspond to the
large blocks in Table 14-18. The face sample limit was imposed by giving all face
samples the same drill hole name and setting the maximum number of samples from
one drill hole.

Mandalay Resources - Costerfield Property NI 43-101 Technical Report
D E F I N E | P L A N | O P E R A T E 206
The estimation parameters applied to the estimation of the Youle 500 and Shepherd 600
models are detailed in Table 14-16and Table 14-17. As iron percentage (Fe%) was required
for density determinations (Equation 3, section 14.6.1.3) in the Shepherd deposit, iron-
accumulation was calculated using the antimony-accumulation estimation parameters.

Mandalay Resources - Costerfield Property NI 43-101 Technical Report
D E F I N E | P L A N | O P E R A T E 207
Table 14-16: Youle block model search parameters
Resource Class
Domain
Variable
First Pass Second Pass Third Pass
Search # Samples DH Second Pass # Samples DH Third Pass # Samples DH
Major Semi-Major Minor Min Max Limit Major Semi-Major Minor Min Max Limit Major Semi-Major Minor Min Max Limit
MEA
SUR
ED
1 & 3 AuACC 50 30 30 2 8 - 100 60 60 2 10 - 300 180 180 1 15 -
AUTT 50 30 30 2 8 - 100 60 60 2 10 - 300 180 180 1 15 -
SbACC 50 30 30 2 8 - 100 60 60 2 10 - 300 180 180 1 15 -
SBTT 50 30 30 2 8 - 100 60 60 2 10 - 300 180 180 1 15 -
TT 50 30 30 2 8 - 100 60 60 2 10 - 300 180 180 1 15 -
2 AuACC 20 15 15 2 8 - 40 30 30 2 10 - 120 90 90 1 10 -
AUTT 20 15 15 2 8 - 80 30 20 2 10 - 240 90 60 1 10 -
SbACC 20 15 15 2 8 - 40 30 30 2 10 - 120 90 90 1 10 -
SBTT 20 15 15 2 8 - 40 30 30 2 10 - 120 90 90 1 10 -
TT 20 15 15 2 12 - 40 30 30 2 12 - 120 90 90 1 10 -
4 AuACC 35 30 30 2 6 - 70 60 60 2 10 - 210 180 180 1 10 -
AUTT 35 30 30 2 6 - 60 50 20 2 10 - 180 150 60 1 10 -
SbACC 35 30 30 2 6 - 70 60 60 2 10 - 210 180 180 1 10 -
SBTT 35 30 30 2 6 - 70 60 60 2 10 - 210 180 180 1 10 -
TT 35 30 30 2 6 - 70 60 60 2 12 - 210 180 180 1 12 -
5 AuACC 35 30 30 2 8 - 70 60 60 1 10 - 210 180 180 1 10 -
AUTT 35 30 30 2 8 - 70 60 60 1 10 - 210 180 180 1 10 -
SbACC 35 30 30 2 8 - 70 60 60 1 10 - 210 180 180 1 10 -
SBTT 35 30 30 2 8 - 70 60 60 1 10 - 210 180 180 1 10 -
TT 35 30 30 2 12 - 70 60 60 1 12 - 210 180 180 1 10 -
6 AuACC 25 15 15 2 8 - 50 30 30 1 10 - 150 90 90 1 10 -
AUTT 25 15 15 2 8 - 50 30 30 1 10 - 150 90 90 1 10 -
SbACC 25 15 15 2 8 - 50 30 30 1 10 - 150 90 90 1 10 -
SBTT 25 15 15 2 8 - 50 30 30 1 10 - 150 90 90 1 10 -
TT 25 15 15 2 8 - 50 30 30 1 12 - 150 90 90 1 10 -
IND
ICA
TED
& IN
FER
RED
1 & 3 AuACC 50 30 30 2 8 2 100 60 60 2 10 2 300 180 180 1 15 2
AUTT 50 30 30 2 8 2 100 60 60 2 10 2 300 180 180 1 15 2
SbACC 50 30 30 2 8 2 100 60 60 2 10 2 300 180 180 1 15 2
SBTT 50 30 30 2 8 2 100 60 60 2 10 2 300 180 180 1 15 2
TT 50 30 30 2 8 2 100 60 60 2 10 2 300 180 180 1 15 2
2 AuACC 20 15 15 4 8 2 40 30 30 2 10 2 120 90 90 1 10 2
AUTT 20 15 15 4 8 2 40 30 30 2 10 2 120 90 90 1 10 2

Mandalay Resources - Costerfield Property NI 43-101 Technical Report
D E F I N E | P L A N | O P E R A T E 208
Resource Class
Domain
Variable
First Pass Second Pass Third Pass
Search # Samples DH Second Pass # Samples DH Third Pass # Samples DH
Major Semi-Major Minor Min Max Limit Major Semi-Major Minor Min Max Limit Major Semi-Major Minor Min Max Limit
SbACC 20 15 15 4 8 2 40 30 30 2 10 2 120 90 90 1 10 2
SBTT 20 15 15 4 8 2 40 30 30 2 10 2 120 90 90 1 10 2
TT 20 15 15 4 12 2 40 30 30 2 12 2 120 90 90 1 10 2
4 AuACC 50 30 30 3 8 2 100 60 60 2 10 2 300 180 180 1 15 2
AUTT 50 30 30 3 8 2 100 60 60 2 10 2 300 180 180 1 15 2
SbACC 50 30 30 3 8 2 100 60 60 2 10 2 300 180 180 1 15 2
SBTT 50 30 30 3 8 2 100 60 60 2 10 2 300 180 180 1 15 2
TT 50 30 30 3 8 2 100 60 60 2 10 2 300 180 180 1 15 2
5 AuACC 35 30 30 4 8 2 70 60 60 2 10 2 210 180 180 1 10 2
AUTT 35 30 30 4 8 2 70 60 60 2 10 2 210 180 180 1 10 2
SbACC 35 30 30 4 8 2 70 60 60 2 10 2 210 180 180 1 10 2
SBTT 35 30 30 4 8 2 70 60 60 2 10 2 210 180 180 1 10 2
TT 35 30 30 4 6 2 70 60 60 2 12 2 210 180 180 1 12 2
6 AuACC 25 15 15 2 8 2 50 30 30 2 10 2 150 90 90 1 10 2
AUTT 25 15 15 2 8 2 50 30 30 2 10 2 150 90 90 1 10 2
SbACC 25 15 15 2 8 2 50 30 30 2 10 2 150 90 90 1 10 2
SBTT 25 15 15 2 8 2 50 30 30 2 10 2 150 90 90 1 10 2
TT 25 15 15 2 8 2 50 30 30 2 12 2 150 90 90 1 12 2

Mandalay Resources - Costerfield Property NI 43-101 Technical Report
D E F I N E | P L A N | O P E R A T E 209
Table 14-17: Shepherd 600 block model search parameters
Resource Class
Domain
Variable
First Pass Second Pass Third Pass
Search # Samples DH Second Pass # Samples DH Third Pass # Samples DH
Major Semi-Major Minor Min Max Limit Major Semi-Major Minor Min Max Limit Major Semi-Major Minor Min Max Limit
MEA
SUR
ED
1
AuACC 30 20 20 2 8 - 60 40 40 2 10 - 180 120 120 1 15 -
SbACC 30 20 20 2 8 - 60 40 40 2 10 - 180 120 120 1 15 -
TT 30 20 20 2 8 - 60 40 40 2 10 - 180 120 120 1 15 -
IND
ICA
TED
& IN
FER
RED
1
AuACC 30 20 20 2 8 3 60 40 40 2 10 3 180 120 120 1 15 3
SbACC 30 20 20 2 8 3 60 40 40 2 10 3 180 120 120 1 15 3
TT 30 20 20 2 6 3 60 40 40 2 10 3 180 120 120 1 15 3
2
AuACC 30 20 20 2 8 3 60 40 40 2 10 3 180 120 120 1 15 3
SbACC 30 20 20 2 8 3 60 40 40 2 10 3 180 120 120 1 15 3
TT 30 20 20 2 6 3 60 40 40 2 10 3 180 120 120 1 15 3
Iron-accumulation (FeACC) calculated utilising the antimony-accumulation (SbACC) parameters
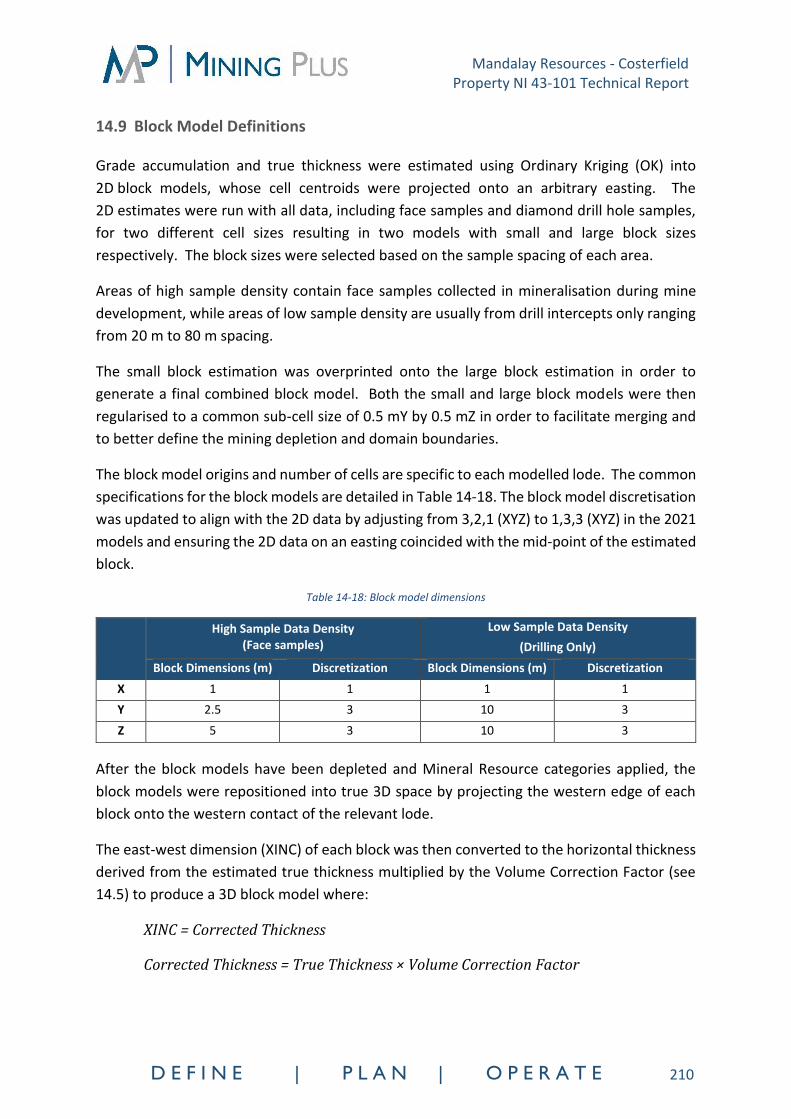
Mandalay Resources - Costerfield Property NI 43-101 Technical Report
D E F I N E | P L A N | O P E R A T E 210
14.9 Block Model Definitions
Grade accumulation and true thickness were estimated using Ordinary Kriging (OK) into
2D block models, whose cell centroids were projected onto an arbitrary easting. The
2D estimates were run with all data, including face samples and diamond drill hole samples,
for two different cell sizes resulting in two models with small and large block sizes
respectively. The block sizes were selected based on the sample spacing of each area.
Areas of high sample density contain face samples collected in mineralisation during mine
development, while areas of low sample density are usually from drill intercepts only ranging
from 20 m to 80 m spacing.
The small block estimation was overprinted onto the large block estimation in order to
generate a final combined block model. Both the small and large block models were then
regularised to a common sub-cell size of 0.5 mY by 0.5 mZ in order to facilitate merging and
to better define the mining depletion and domain boundaries.
The block model origins and number of cells are specific to each modelled lode. The common
specifications for the block models are detailed in Table 14-18. The block model discretisation
was updated to align with the 2D data by adjusting from 3,2,1 (XYZ) to 1,3,3 (XYZ) in the 2021
models and ensuring the 2D data on an easting coincided with the mid-point of the estimated
block.
Table 14-18: Block model dimensions
High Sample Data Density
(Face samples)
Low Sample Data Density
(Drilling Only)
Block Dimensions (m) Discretization Block Dimensions (m) Discretization
X 1 1 1 1
Y 2.5 3 10 3
Z 5 3 10 3
After the block models have been depleted and Mineral Resource categories applied, the
block models were repositioned into true 3D space by projecting the western edge of each
block onto the western contact of the relevant lode.
The east-west dimension (XINC) of each block was then converted to the horizontal thickness
derived from the estimated true thickness multiplied by the Volume Correction Factor (see
14.5) to produce a 3D block model where:
XINC = Corrected Thickness
Corrected Thickness = True Thickness × Volume Correction Factor

Mandalay Resources - Costerfield Property NI 43-101 Technical Report
D E F I N E | P L A N | O P E R A T E 211
14.10 Block Model Validation
The grade and thickness estimates were validated by:
• Visual comparison of the sample thicknesses, accumulated grades, and back-
calculated grades with the estimated model grades in longitudinal projection,
• Global statistical comparisons by domain of the declustered input composites with the
corresponding estimated variables: Au-Accumulation, Sb-Accumulation and True
Thickness,
• Local validation using Y and Z swath plots, comparing the declustered and I composites
against estimated values.
Declustering was required for all block models due to the strong clustering of the face samples
along the ore-drives. The input composite declustering was completed using the polygonal
declustering process in Datamine software, constrained by the model boundary. Model
dimensions for declustering were 10 mX x 1 mY x 2.5 mZ. This process resulted in some
samples receiving a zero value weight due to closely spaced data, and these were corrected
to a nominal 0.001 weighting. These zero value weights were encountered in 3.8% of 500
Youle samples, and 1% of the 508 Peacock. No zero weights were recorded in other model
validations.
Visually, the estimation shows good agreement with the plunge and continuity of the grades
evident in the face samples, and the degree of smoothing is considered acceptable. The
influence of the high-density face sampling on the areas of diamond drilling was appropriately
limited in accordance with the search parameters.
An example of the global statistical comparison by domain for the Youle and Shepherd Lodes
is detailed in Table 14-19 and Table 14-20. A percentage difference less than 10% between
the declustered samples and estimated grades is considered acceptable.
Domain 6 global validation displays a positive bias (Table 14-19). This was further investigated,
and it was concluded from the swathe plots, visual long section, and a secondary declustering
performed on the Measured Resource material that the estimate was reasonable and that
several low-grade samples between domain 1 and domain 6 were having undue influence on
the sample statistics.
Domain 5 of the Youle Lode returned a poor validation result (>10% threshold), however the
QP considers that result immaterial for the MRE as this lode has low tonnage and a low
composite count.

Mandalay Resources - Costerfield Property NI 43-101 Technical Report
D E F I N E | P L A N | O P E R A T E 212
Table 14-19: Global validation of Youle 500 block model by domain against composites and polygonally declustered composites
Block Model- Mean
Composite Mean Comparisons Declustered Composite
Variable Domain No. Comps Estimated
Grade Composite Grade (TC)
Polygonal Declustered Composite Grade
(TC)
%Diff Est. Grade to Composite
%Diff Est. Grade to Declustered Composite
Au-Accumulation Global 2676 15.88 26.97 15.91 -41% -0.2%
Sb-Accumulation Global 2676 4.36 7.82 4.49 -44% -2.9%
True Vein Thickness Global 2676 0.28 0.33 0.29 -14% -2.1%
Au-Accumulation 1 1420 26.71 33.12 28.28 -19% -5.6%
Au-Accumulation 2 379 43.61 45.31 40.34 -4% 8.1%
Au-Accumulation 3 53 0.02 0.03 0.02 -26% -9%
Au-Accumulation 4 490 10.62 13.30 10.31 -20% 3.0%
Au-Accumulation 5 10 0.37 0.58 0.76 -35% -50.8%
Au-Accumulation 6 324 2.46 4.46 2.23 -45% 10%
Sb-Accumulation 1 1420 5.05 6.86 5.33 -26% -5.3%
Sb-Accumulation 2 379 16.68 17.89 16.40 -7% 1.7%
Sb-Accumulation 3 53 0.01 0.02 0.01 -18% 8%
Sb-Accumulation 4 490 5.94 7.06 5.60 -16% 6.1%
Sb-Accumulation 5 10 0.22 0.28 0.34 -23% -36%
Sb-Accumulation 6 324 1.62 2.94 1.46 -45% 11.1%
True Vein Thickness 1 1420 0.29 0.31 0.30 -6% -3.0%
True Vein Thickness 2 379 0.66 0.67 0.72 -1% -7.7%
True Vein Thickness 3 53 0.25 0.25 0.25 -2% -2%
True Vein Thickness 4 490 0.19 0.21 0.18 -6% 9.0%
True Vein Thickness 5 10 0.11 0.09 0.07 19% 48.6%
True Vein Thickness 6 324 0.21 0.20 0.21 1% 0%

Mandalay Resources - Costerfield Property NI 43-101 Technical Report
D E F I N E | P L A N | O P E R A T E 213
Table 14-20: Global validation of Shepherd 600 block model by domain against composites and polygonally declustered composites
Block Model- Mean
Composite Mean Comparisons Declustered Composite
Variable Domain No. Comps Estimated
Grade Composite Grade (TC)
Polygonal Declustered Composite Grade
(TC)
%Diff Est. Grade to Composite
%Diff Est. Grade to Declustered Composite
Au-Accumulation Global 96 18.97 21.96 17.82 -14% 6.4%
Sb-Accumulation Global 96 2.67 2.31 2.76 16% -3.3%
True Vein Thickness Global 96 0.53 0.48 0.54 11% -1.7%
Au-Accumulation 1 34 19.71 23.13 18.72 -15% 5.3%
Au-Accumulation 2 62 18.30 21.32 17.01 -14% 7.6%
Sb-Accumulation 1 34 5.57 6.43 5.78 -13% -3.6%
Sb-Accumulation 2 62 0.04 0.05 0.04 -8% 4.8%
True Vein Thickness 1 34 0.65 0.56 0.69 16% -5.9%
True Vein Thickness 2 62 0.42 0.43 0.41 -2% 4.2%

Mandalay Resources - Costerfield Property NI 43-101 Technical Report
D E F I N E | P L A N | O P E R A T E 214
Swathe plots were generated in the north-south (Y) and vertical (Z) directions for the
complete lode (global) and for each domain at a nominal spacing of 20 m. The naïve
composite (red lines) and declustered composite (blue lines) mean grades of the
accumulation variables are compared with the estimated accumulation variables within the
block models (black lines). The Youle 500 and Shepherd 600 block model swathe plots are
provided as examples of the validation methodology applied (Youle: Figure 14-30 to Figure
14-32, Shepherd: Figure 14-33 to Figure 14-35). Youle domains 3 and 5 are not material with
limited samples and are not presented.
The declustered means presented in the swathe plots are generated by Supervisor using the
cell declustering method and therefore are different to the declustered means presented in
Table 14-19. The QP considers that the means generated by the polygonal declustering
method in Datamine are more reliable than the cell declustering means generated by
Supervisor and therefore, preference is given to the table over the swathe plots where there
is an apparent discrepancy.
Figure 14-30: Youle 500 global Au-Accumulation swathe plot by Northing and Elevation

Mandalay Resources - Costerfield Property NI 43-101 Technical Report
D E F I N E | P L A N | O P E R A T E 215
Figure 14-31: Youle 500 Global Sb-Accumulation swathe plot by Northing and Elevation
Figure 14-32: Youle 500 Global True Thickness swathe plot by Northing and Elevation

Mandalay Resources - Costerfield Property NI 43-101 Technical Report
D E F I N E | P L A N | O P E R A T E 216
Figure 14-33: Shepherd 600 Global Au-Accumulation swathe plot by Northing and Elevation
Figure 14-34: Shepherd 600 Global Sb-Accumulation swathe plot by Northing and Elevation

Mandalay Resources - Costerfield Property NI 43-101 Technical Report
D E F I N E | P L A N | O P E R A T E 217
Figure 14-35: Shepherd 600 Global True Thickness swathe plot by Northing and Elevation
14.11 Mineral Resource Classification
Classification of the MRE takes into account Mandalay Resources’ experience in mining the
deposit, the satisfactory reconciliation observed over many years and the well-established
sampling, assaying, interpretation and estimation processes in place.
Mandalay Resources’ ongoing mining experience continues to improve the geological
confidence and understanding of the controls on the mineralisation, which guides decisions
made during the construction of the geological model and the block models.
The classification criteria include the following:
• The Measured Resources are located within, and are defined by, the developed areas
of the mine. This criterion ensures the block model estimate is supported by close-
spaced underground face sampling, at approximately 2 m to 5 m spacing, and
mapping.
• The Indicated Resources are located where the drill hole spacing in longitudinal
projection is on a nominal 40 mN by 40 mRL grid, and where there is high geological
confidence in the geological interpretation and the block model estimations.
o The Slope of Regression (SoR) is used to assess the quality of the estimate and
natural breaks are referenced to inform confidence boundaries, with a confidence
of greater than 0.5 SoR used to guide the Indicated category.
o The 1st search pass is used as an additional guide, related to sample density, which
means that the majority of zones in the Indicated category are limited to
approximately half the range of variogram for each domain.

Mandalay Resources - Costerfield Property NI 43-101 Technical Report
D E F I N E | P L A N | O P E R A T E 218
• The Inferred Resource has irregular or widely-spaced drill hole intercepts that display
geological continuity but limited or patchy grade continuity,
o The SoR is typically below 0.5 and the blocks have been estimated in search pass
of 2 or 3.
The classification criteria are consistent with the previous Mineral Resource Estimate
reported in March 2021 (MP, 2021).
14.12 Mineral Resources
The Mineral Resources are stated here for the Augusta, Cuffley, Brunswick and Youle Deposits
with an effective date of 31 December 2021. This date coincides with the following:
• Depletion due to mining up to 31 December 2021.
• Survey of stockpiled ore that was mined and awaiting processing as of 31 December
2021.
All relevant diamond drill hole and underground face samples in the Costerfield Property,
available as of 6 December 2021 for the Augusta, Cuffley, Brunswick, and Youle Deposits, and
as of 17 December 2021 for the Shepherd Deposit, were used to inform the Mineral Resource
Estimate.
The in-situ Augusta, Cuffley, Brunswick, Youle and Shepherd Deposits consist of a combined
Measured and Indicated Mineral Resource of 1,387,000 tonnes at 10.6 g/t gold and 2.8%
antimony, and an Inferred Mineral Resource of 532,000 tonnes at 6.7 g/t gold and 1.3%
antimony.
Stockpiles retained at the Brunswick Processing Plant represent a Measured Mineral Resource
of 41,000 tonnes at 10.1 g/t gold, and 3.3% antimony. Stockpile tonnage balances were
calculated using drone acquired survey pickups, bulk density factors, and grades from
production movements. For the Mineral Resource Estimate, only surface stockpiles with
accurate surveyed volumes were included.
The Mineral Resources are reported at a cut-off grade of 3.0 g/t gold equivalent (AuEq), after
diluting to a minimum mining width of 1.2 m.
The gold equivalence formula used is calculated using recoveries achieved at the Costerfield
Property Brunswick Processing Plant during 2021, and is as follows:
AuEq = Au (g/t) + 1.58 x Sb (%)
Where the AuEq factor of 1.58 is calculated:
• at a gold price of $1,700/oz

Mandalay Resources - Costerfield Property NI 43-101 Technical Report
D E F I N E | P L A N | O P E R A T E 219
• an antimony price of $8,500/t
• 2021 total year metal recoveries of 93% for Au and 95% for Sb.
Commodity prices used in the equivalence formula are USD$1,700/ounce gold and
USD$8,500/tonne for antimony. Refer to Market Studies and Contracts, Section 19, for an
explanation on the source of the prices.
The 2021 Mineral Resource is detailed in Table 14-21.
Table 14-21: Mineral Resources at the Costerfield Property, inclusive of Mineral Reserves, as at 31 December 2021
Category Inventory
(t)
Gold
Grade
(g/t)
Antimony Grade
(%)
Contained Gold (koz)
Contained Antimony
(kt)
Measured (Underground)
408,000 15.4 5.0 202 20.4
Measured (Stockpile)
41,000 10.1 3.3 14 1.4
Indicated 938,000 8.6 1.9 259 17.5
Measured + Indicated
1,387,000 10.6 2.8 474 39.3
Inferred 532,000 6.7 1.3 114 6.7
Notes:
1. The Mineral Resource is estimated as of December 31, 2021 with depletion through to this date. 2. The Mineral Resource is stated according to CIM guidelines and include Mineral Reserves. 3. Tonnes are rounded to the nearest thousand; contained gold (oz) is rounded to the nearest thousand; contained
antimony (t) is rounded to nearest hundred. 4. Totals may appear different from the sum of their components due to rounding. 5. 3.0 g/t AuEq cut-off grade over a minimum mining width of 1.2 m is applied where AuEq is calculated using the
formula: AuEq = Au g/t + 1.58 * Sb % 6. The AuEq factor of 1.58 is calculated at a gold price of $1,700/oz, an antimony price of $8,500/t, and 2021 total
year metal recoveries of 93% for Au and 95% for Sb. 7. Veins were diluted to a minimum mining width of 1.2m before applying the cut-off grade and peripheral
mineralisation far from current development was excluded to comply with the Reasonable Prospects for Eventual Economic Extraction (RPEEE) criteria.
8. The Stockpile Mineral Resource is estimated based upon surveyed volumes supplemented by production data. 9. Geological modelling, sample compositing and Mineral Resource Estimation for updated models was performed
by Joshua Greene, MAusIMM, a full-time employee of Mandalay Resources. 10. The Mineral Resource Estimate was independently reviewed and verified by Dr Andrew Fowler MAusIMM CP
(Geo), a full time employee of Mining Plus. Dr Fowler fulfils the requirements to be a “qualified person” for the purposes of NI 43-101, and is the Qualified Person under NI 43-101 for the Mineral Resource Estimate.
Longitudinal projections of the Youle Lode and Shepherd Lode block models are displayed in
Figure 14-36 to Figure 14-39 where drill hole intersections are displayed as black dots. Figure
14-36 displays diluted AuEq while Figure 14-37 displays Mineral Resource categories for the
Youle Lode. Figure 14-38 displays diluted AuEq while Figure 14-39 displays Mineral Resource
categories for the Shepherd Lode.

Mandalay Resources - Costerfield Property NI 43-101 Technical Report
D E F I N E | P L A N | O P E R A T E 220
Figure 14-36: Youle 500 Block Model showing model grade in gold equivalent g/t diluted to resource width of 1.2 metres
Figure 14-37: Youle 500 Block Model with Resource Category Boundaries

Mandalay Resources - Costerfield Property NI 43-101 Technical Report
D E F I N E | P L A N | O P E R A T E 221
Figure 14-38: Shepherd 600 Block Model showing model grade in gold equivalent g/t diluted to resource width of 1.2 metres
Figure 14-39: Shepherd 600 Block Model with Resource Category Boundaries – note that blue is unclassified and not reported
Details of the in-situ Augusta, Cuffley, Brunswick, Youle and Shepherd Mineral Resources, by
area and lode are outlined in Table 14-22.
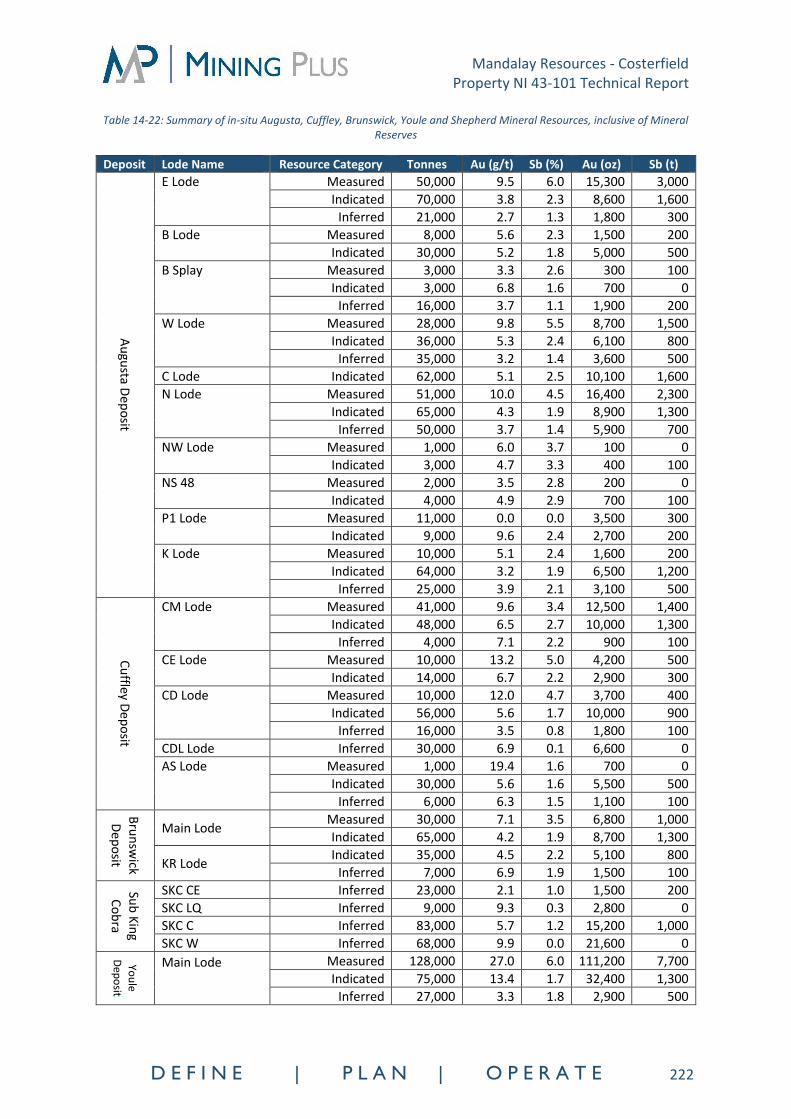
Mandalay Resources - Costerfield Property NI 43-101 Technical Report
D E F I N E | P L A N | O P E R A T E 222
Table 14-22: Summary of in-situ Augusta, Cuffley, Brunswick, Youle and Shepherd Mineral Resources, inclusive of Mineral Reserves
Deposit Lode Name Resource Category Tonnes Au (g/t) Sb (%) Au (oz) Sb (t)
Au
gusta D
epo
sit
E Lode Measured 50,000 9.5 6.0 15,300 3,000
Indicated 70,000 3.8 2.3 8,600 1,600
Inferred 21,000 2.7 1.3 1,800 300
B Lode Measured 8,000 5.6 2.3 1,500 200
Indicated 30,000 5.2 1.8 5,000 500
B Splay Measured 3,000 3.3 2.6 300 100
Indicated 3,000 6.8 1.6 700 0
Inferred 16,000 3.7 1.1 1,900 200
W Lode Measured 28,000 9.8 5.5 8,700 1,500
Indicated 36,000 5.3 2.4 6,100 800
Inferred 35,000 3.2 1.4 3,600 500
C Lode Indicated 62,000 5.1 2.5 10,100 1,600
N Lode Measured 51,000 10.0 4.5 16,400 2,300
Indicated 65,000 4.3 1.9 8,900 1,300
Inferred 50,000 3.7 1.4 5,900 700
NW Lode Measured 1,000 6.0 3.7 100 0
Indicated 3,000 4.7 3.3 400 100
NS 48 Measured 2,000 3.5 2.8 200 0
Indicated 4,000 4.9 2.9 700 100
P1 Lode Measured 11,000 0.0 0.0 3,500 300
Indicated 9,000 9.6 2.4 2,700 200
K Lode Measured 10,000 5.1 2.4 1,600 200
Indicated 64,000 3.2 1.9 6,500 1,200
Inferred 25,000 3.9 2.1 3,100 500
Cu
ffley Dep
osit
CM Lode Measured 41,000 9.6 3.4 12,500 1,400 Indicated 48,000 6.5 2.7 10,000 1,300
Inferred 4,000 7.1 2.2 900 100
CE Lode Measured 10,000 13.2 5.0 4,200 500
Indicated 14,000 6.7 2.2 2,900 300
CD Lode Measured 10,000 12.0 4.7 3,700 400
Indicated 56,000 5.6 1.7 10,000 900
Inferred 16,000 3.5 0.8 1,800 100
CDL Lode Inferred 30,000 6.9 0.1 6,600 0
AS Lode Measured 1,000 19.4 1.6 700 0
Indicated 30,000 5.6 1.6 5,500 500
Inferred 6,000 6.3 1.5 1,100 100
Bru
nsw
ick
Dep
osit
Main Lode Measured 30,000 7.1 3.5 6,800 1,000
Indicated 65,000 4.2 1.9 8,700 1,300
KR Lode Indicated 35,000 4.5 2.2 5,100 800
Inferred 7,000 6.9 1.9 1,500 100
Sub
Kin
g
Co
bra
SKC CE Inferred 23,000 2.1 1.0 1,500 200
SKC LQ Inferred 9,000 9.3 0.3 2,800 0
SKC C Inferred 83,000 5.7 1.2 15,200 1,000
SKC W Inferred 68,000 9.9 0.0 21,600 0
You
le
Dep
osit
Main Lode
Measured 128,000 27.0 6.0 111,200 7,700
Indicated 75,000 13.4 1.7 32,400 1,300
Inferred 27,000 3.3 1.8 2,900 500

Mandalay Resources - Costerfield Property NI 43-101 Technical Report
D E F I N E | P L A N | O P E R A T E 223
Deposit Lode Name Resource Category Tonnes Au (g/t) Sb (%) Au (oz) Sb (t)
South Splay Measured 1,000 3.8 3.7 100 0
Indicated 2,000 3.3 2.3 200 0
Kendal Splay Measured 1,000 49.2 18.2 1,600 200
Peacock Vn
Measured 13,000 21.3 7.3 8,900 1,000
Indicated 18,000 2.1 3.2 1,200 600
Inferred 1,000 3.2 2.4 100 0
Youle South Splay Measured 8,000 11.1 4.4 2,900 400
Peacock Splay Measured 1,000 4.3 2.7 100 0
Indicated 1,000 6.3 1.7 200 0
Sh
eph
erd D
epo
sit
Shepherd Lode
Measured 1,000 24.9 6.5 1,000 100
Indicated 143,000 20.2 2.1 92,900 3,000
Inferred 53,000 14.0 3.8 24,000 2,000
Ryeland Splay
Measured 1,000 8.9 0.2 100 0
Indicated 21,000 8.5 0.1 5,700 0
Inferred 7,000 4.3 0.0 900 0
Merino Splay Indicated 25,000 7.7 0.0 6,200 0
Dorset Splay Indicated 5,000 6.4 0.0 1,100 0
Suffolk Lode Indicated 48,000 16.6 0.2 25,500 100
Inferred 47,000 10.8 0.5 16,300 300
Drysdale Splay Indicated 8,000 4.6 0.2 1,200 0
Inferred 2,000 3.6 0.1 200 0
Measured and Indicated 1,345,000 10.6 2.8 460,000 37,900
Inferred 532,000 6.7 1.3 114,100 6,700 Refer to notes for Table 14-21
14.13 Comparison to 2020 Mineral Resource
A high-level comparison between the 2020 and 2021 Mineral Resource Estimates has been
undertaken (Figure 14-40). In order to demonstrate areas of variance between the two
reporting periods, the gold and antimony grades have been converted into AuEq values
determined using the equation:
AuEq (oz) = Au (oz) + (Sb (t) x (Sb price/t / Au price/oz)
Where Sb price = USD$8,500/t and Au price = USD$1,700/oz

Mandalay Resources - Costerfield Property NI 43-101 Technical Report
D E F I N E | P L A N | O P E R A T E 224
Figure 14-40: Comparison between 2020 and 2021 Mineral Resource Estimates
Key areas of variance between the two Mineral Resources are:
• The Mineral Resource was depleted by 84 koz AuEq, with majority from the Youle 500
series models.
• The Youle models increased by 24 koz AuEq, as a result of higher grades in the lower
ore drives than previously estimated, density weighting of interval composites and
additional exploration testing.
• The Shepherd block models were added to the MRE containing 150 koz AuEq, as a
result of the 2021 exploration program.
• The density regression was refined at Youle and Shepherd leading to a 7 koz AuEq
decrease (see Section 14.6 Bulk Density Determinations)
• Stockpiles continued to increase throughout 2021, adding 8 koz AuEq.
• The AuEq factor was increased from 1.5 to 1.58 due to stronger antimony resource
prices and when combined with the KR 310 model re-estimation contributed to 1 koz
AuEq.
14.14 Reasonable Prospects of Eventual Economic Extraction
The reasonable prospects for eventual economic extraction (RPEEE) have been satisfied by
applying a minimum mining width of 1.2 m and ensuring that isolated blocks above cut-off

Mandalay Resources - Costerfield Property NI 43-101 Technical Report
D E F I N E | P L A N | O P E R A T E 225
grade, which are unlikely to ever be mined due to distance from the main body of
mineralisation, were excluded from the Mineral Resource.
The width of 1.2 m is the practical minimum mining width applied at the Costerfield Property
for stoping. For blocks with widths less than 1.2 m, diluted grades were estimated by adding
a waste envelope with zero grade and 2.74 t/m3 (Augusta, Brunswick and Cuffley) or 2.76 t/m3
(Youle and Shepherd) bulk density to the lode.
A 3.0 g/t AuEq cut-off grade over a minimum mining width of 1.2 m has been applied. The
cut-off has been derived by Mandalay Resources based on cost, revenue, mining and recovery
data from the year ending 31 December 2021, and updated commodity price forecasts and
exchange rates. This remains the same as the previous Mineral Resource cut-off grade of
3.0 g/t AuEq used in the Mineral Resource Estimate effective 31 December 2020 (MP, 2021).
Pillars and remnant material that is above 3.0 g/t AuEq has been included in the Measured
Resource. From 2017 onwards, extraction of these areas has been an ongoing success due to
the use of remote loaders and recovered Au (oz) and Sb (t) reconcile well with the Resource
block model. Due to this success, these areas are now considered viable under RPEEE.
14.15 Reconciliation
2021 production consisted of stopes and development from the Youle Lode system (500
series models) with minor contributions from Brunswick (300) and the Shepherd (600) and
Ryeland (604) Lodes on Shepherd. The greatest proportion of ore mined during 2021 was
produced from the Youle Lode (96%) with the balance of 4% being sourced from the
Brunswick Lode (3%) and from Shepherd (1%). There were no Augusta remnants mined for
the period.
Run-of-mine (ROM) ore is currently stockpiled according to grade bins rather than by named
mining area or mining level, therefore reconciliation by individual named deposit is not
possible. The reconciliation presented below is therefore combined for the Brunswick and
Youle lodes.
Mine production has been defined using the conservation of mass equation below, for both
tonnes and metal content.
Mine Production = Milled Production + Change (Δ) in Stockpile Inventory
End of month stockpile tonnage balances are estimated using drone acquired survey pickups
and bulk density factors. The bulk density of the stockpiles is based on the results of a series
of measurements collected in September 2013 where 15 truckloads of ore were hauled by
rigid bodied road truck and weighed at a weighbridge located at the old service station, later
demolished in 2016, at 55-57 High Street, Heathcote Vic 3523. Ore was subsequently hauled
and dumped at a pre-surveyed pad at the Augusta process plant. The final stockpile was

Mandalay Resources - Costerfield Property NI 43-101 Technical Report
D E F I N E | P L A N | O P E R A T E 226
surveyed using a Trimble Total Station, and the difference between the two surfaces used to
determine stockpile volume.
The moisture content, combined dry mass and surveyed volume of the stockpile were used
to calculate the moisture as well as wet and dry bulk density. A fixed moisture content of
3.42% is used for all stockpile calculations. This is derived from, and validated against, the
daily moisture content for ROM material reported daily by the Brunswick Processing Plant for
2021. Bulk density of stockpiled material is estimated by this methodology as 1.93 t/m3 (dry),
and 1.99 t/m3 (wet).
Wet and calculated dry weights of each load measured are detailed in Table 14-23.
Table 14-23: Trucked payload wet and calculated dry weights
Stockpile grades are populated from production movements using a combination of assay and
block model estimated data.
Stockpile inventories increased 25.2 kt from 16.2 kt at the beginning of the year to 41.4 kt.
Closing grades of the stockpiles were 10.1 g/t Au and 3.3% Sb for a contained metal content
of 13.5 koz gold and 1.4 kt antimony. Figure 14-41 illustrates the change in stockpile
inventories from 2020-2021.
Load No Truck Wet Weight (Weighed)
(t) Dry Weight (Calculated)
(t) Moisture
(t)
1 XCU 15.1 14.6 0.5
2 NNP 15.0 14.5 0.5
3 NNP 15.2 14.8 0.5
4 XCU 14.4 13.9 0.5
5 NNP 15.7 15.2 0.5
6 XCU 14.5 14.1 0.5
7 NNP 13.7 13.3 0.4
8 XCU 13.6 13.2 0.4
9 NNP 14.2 13.8 0.5
10 XCU 14.0 13.5 0.4
11 NNP 13.4 13.0 0.4
12 XCU 13.9 13.4 0.4
13 NNP 14.0 13.5 0.4
14 XCU 14.9 14.4 0.5
15 NNP 13.8 13.3 0.4
TOTAL 215.4 208.5 6.9

Mandalay Resources - Costerfield Property NI 43-101 Technical Report
D E F I N E | P L A N | O P E R A T E 227
Figure 14-41: Costerfield Property stockpile inventory – 2020 to 2021
The current 2022 block model estimate was reconciled against the year-end 2021 production
according to the following process:
• A string was digitised in longitudinal projection for each of the relevant lodes to outline
areas that were mined each month during 2021.
• The mined material was then coded into the 2022 2D diluted block models for each
lode so that tonnes, grades and contained metal could be reported by type, month
and level.
• These values were reconciled against tonnes, grades and produced metals reported
by the Brunswick Processing Plant.
Tonnage and grades reported by the Brunswick Process Plant were 173,726 tonnes grading
at 11.0 g/t Au and 3.5% Sb for 61,307 ounces of contained gold and 6,088 tonnes of antimony
(Table 14-24). The Brunswick Processing Plant production data is considered authoritative for
tonnages since it is measured and validated using belt weightometer and Loadrite scales on-
board the loader that feeds the process plant. ROM tonnages are provided for guidance only
as they are based on visual estimates of mining dimensions and grade. They include the
increase in stockpiles as listed above, and an additional 2,995 t in unsurveyed material in
underground stockpiles and the boxcut.
Table 14-24: ROM tonnes and Brunswick Processing Plant production – year ended 31 December 2021
Production Year 2020 ROM* Plant Feed** Produced Metal
Month Dry Tonnes Dry Tonnes Au (oz) Sb (t)
Jan 16,382 13,779 7,323 762
Feb 14,988 9,766 5,524 691
Mar 13,107 12,516 2,795 315
Apr 14,003 12,596 3,043 399
May 13,187 13,006 4,235 543
Jun 13,333 11,946 5,013 671
Jul 13,771 11,846 4,473 234
Aug 10,665 12,109 5,041 539

Mandalay Resources - Costerfield Property NI 43-101 Technical Report
D E F I N E | P L A N | O P E R A T E 228
Production Year 2020 ROM* Plant Feed** Produced Metal
Month Dry Tonnes Dry Tonnes Au (oz) Sb (t)
Sep 15,119 11,752 5,576 432
Oct 17,334 12,422 6,019 458
Nov 15,229 12,509 5,356 577
Dec 16,607 11,233 6,909 467
Total 173,726 145,480 61,307 6,088
Notes:
*ROM tonnes are based on visual estimates of mining dimensions, grade, and bulk density of ore and waste as set out in Section
14.6 of this document. The figure includes the increase in stockpiles and an estimated additional 2,995 t in unsurveyed material
in underground stockpiles and the boxcut.
**Feed tonnes at the mill are weighed and validated by belt weightometer and Loadrite scales onboard the loader that feeds the
process plant
In order to achieve a direct tonnage comparison against processed ore, the estimated
resource tonnes were diluted by the production widths of 2.6 m for ore-drive development
and 2.0 m for stopes, which represented the weighted average of observed mining widths for
2021, summarised in Table 14-25.
Table 14-25: Parameters used for average mining width estimation
Mining Method Mining Width Estimation Method Production % Width (m)
Development Average observed width for development weighted by height x advance
50.3% 2.6
Stoping Average observed width weighted by 2D stope area height x strike
49.7% 2.0
Average for 2021
2.3
The reconciliation is presented below as a comparison by quarter of the previous 2020
Resource models with the current 2021 models to understand the performance of the
estimation method with all available 2021 data. Figure 14-42 displays a comparison between
the combined and diluted 2020/2021 resource block models tonnes and 2021 produced
tonnes, while Figure 14-43 and Figure 14-44 display the comparison between the actual and
predicted ounces of gold and tonnes of antimony respectively. Figure 14-45 and Figure 14-46
display the comparison between actual and predicted gold and antimony grade respectively.

Mandalay Resources - Costerfield Property NI 43-101 Technical Report
D E F I N E | P L A N | O P E R A T E 229
Figure 14-42: Reconciliation of the 2020 and 2021 Mineral Resource versus 2021 mine production – tonnes
Figure 14-43: Reconciliation of the 2020 and 2021 Mineral Resource versus 2021 mine production – gold ounces

Mandalay Resources - Costerfield Property NI 43-101 Technical Report
D E F I N E | P L A N | O P E R A T E 230
Figure 14-44: Reconciliation of the 2020 and 2021 Mineral Resource versus 2021 mine production – antimony tonnes
Figure 14-45: Reconciliation of the 2020 and 2021 Mineral Resource versus 2021 mine production – gold grade

Mandalay Resources - Costerfield Property NI 43-101 Technical Report
D E F I N E | P L A N | O P E R A T E 231
Figure 14-46: Reconciliation of the 2020 and 2021 Mineral Resource versus 2021 mine production – antimony grade
14.15.1 Review of 2020 Resource Models
The previous 2020 resource models (MP, 2021) selected inside the 2021 depletion wireframes
report 173,726 tonnes at 10.1 Au g/t and 3.1 Sb % for an estimated contained 56,178 ounces
of gold and 5,437 tonnes of antimony (Table 14-26 to Table 14-28). The reconciliation of the
2020 resource model is summarised against the 2021 mine production by tonnes, metal and
grade in Figure 14-42 to Figure 14-46. The breakdown of the 2020 resource models by
resource category for the 2021 production in both tonnage and gold-equivalent metal is
presented in Table 14-29.
Table 14-26: Tonnage Reconciliation of 2020 Mineral Resource versus 2021 mine production
Production Year 2021 Tonnes Reconciliation (t)
Month 2020 Mineral Resources, dmt Produced, dmt Tonnage Variance (%)
Q1 41,566 44,478 -6.5%
Q2 44,641 40,524 10.2%
Q3 42,713 39,554 8.0%
Q4 44,153 49,170 -10.2%
Total 173,073 173,726 -0.4%
Table 14-27: Metal Reconciliation of 2020 Mineral Resource versus 2021 mine production
Production Year 2021 Metal Reconciliation
Month
2020 Resource
Produced Au Variance
(%)
2020 Resource Produced Sb Variance
(%) Au (oz) Au (oz) Sb (t) Sb (t)
Q1 14,079 15,642 -10.0% 1,477 1,768 -16.5%
Q2 12,997 12,291 5.7% 1,483 1,613 -8.1%

Mandalay Resources - Costerfield Property NI 43-101 Technical Report
D E F I N E | P L A N | O P E R A T E 232
Production Year 2021 Metal Reconciliation
Month
2020 Resource
Produced Au Variance
(%)
2020 Resource Produced Sb Variance
(%) Au (oz) Au (oz) Sb (t) Sb (t)
Q3 15,809 15,090 4.8% 1,320 1,205 9.6%
Q4 13,294 18,284 -27.3% 1,157 1,501 -22.9%
Total 56,178 61,307 -8.4% 5,437 6,088 -10.7%
Table 14-28: Grade Reconciliation of 2020 Mineral Resource versus 2021 mine production
Production Year 2021
Grade Reconciliation
Month 2020 Resource
Produced Au Variance
(%)
2020 Resource Produced Sb Variance
(%) Au (g/t) Au (g/t) Sb (%) Sb (%)
Q1 10.5 10.9 -3.7% 3.6 4.0 -10.6%
Q2 9.1 9.4 -4.0% 3.3 4.0 -16.5%
Q3 11.5 11.9 -3.0% 3.1 3.0 1.5%
Q4 9.4 11.6 -19.0% 2.6 3.1 -14.2%
Total 10.1 11.0 -8.0% 3.1 3.5 -10.3%
Table 14-29: 2020 Resource Models breakdown by resource category for the 2021 production
2020 Resource Models
Resource Category % Tonnes % AuEq Ounces
Measured 45% 57%
Indicated 48% 40%
Inferred 7% 10%
14.15.2 Performance of 2021 Resource Models
The 2021 resource models selected inside the 2021 depletion wireframes report
167,149 tonnes at 11.3 g/t Au and 3.8% Sb for an estimated contained 60,737 ounces of gold
and 6,055 tonnes of antimony. The reconciliation of the 2021 resource model is summarised
against the 2021 mine production by tonnes, metal and grade in Table 14-30 to Table 14-32.
See also Figure 14-42 to Figure 14-46 above.

Mandalay Resources - Costerfield Property NI 43-101 Technical Report
D E F I N E | P L A N | O P E R A T E 233
Table 14-30: Tonne Reconciliation of 2021 Mineral Resource versus 2021 mine production
Production Year 2021 Tonnes Reconciliation (t)
Month 2020 Mineral Resources, dmt Produced, dmt Tonnage Variance (%)
Q1 41,764 44,478 -6.1%
Q2 41,858 40,524 3.3%
Q3 39,835 39,554 0.7%
Q4 43,692 49,170 -11.1%
Total 167,149 173,726 -3.8%
Table 14-31: Metal Reconciliation of 2021 Mineral Resource versus 2021 mine production
Production Year 2021
Metal Reconciliation
Month 2021 Resource
Produced Au Variance
(%)
2021 Resource Produced Sb Variance
(%) Au (oz) Au (oz) Sb (t) Sb (t)
Q1 14,098 15,642 -9.9% 1,621 1,768 -8.3%
Q2 12,695 12,291 3.3% 1,554 1,613 -3.7%
Q3 18,348 15,090 21.6% 1,545 1,205 28.2%
Q4 15,595 18,284 -14.7% 1,334 1,501 -11.1%
Total 60,737 61,307 -0.9% 6,055 6,088 -0.5%
Table 14-32: Grade Reconciliation of 2021 Mineral Resource versus 2021 mine production
Production Year 2021
Grade Reconciliation
Month 2021 Resource
Produced Au Variance
(%)
2021 Resource Produced Sb Variance (%)
Au (g/t) Au (g/t) Sb (%) Sb (%)
Q1 10.5 10.9 -4.0% 3.9 4.0 -2.4%
Q2 9.4 9.4 0.0% 3.7 4.0 -6.7%
Q3 14.3 11.9 20.7% 3.9 3.0 27.3%
Q4 11.1 11.6 -4.0% 3.1 3.1 0.0%
Total 11.3 11.0 3.0% 3.6 3.5 3.4%
14.15.3 Reconciliation Discussion
The review of the 2020 Resource models has demonstrated the suitability of the estimation
methodology and drill testing over the twelve-month period. It is the opinion of Mandalay
Resources staff and the QP that the variance of -8.4% for gold ounces and -10.7% for antimony
tonnes is an acceptable result considering that 55% of the Mineral Resource extracted for the
period came from Indicated and Inferred categories.

Mandalay Resources - Costerfield Property NI 43-101 Technical Report
D E F I N E | P L A N | O P E R A T E 234
The 2021 Resource models reconciled particularly well with the 2021 production with a
variance of -0.9% and -0.5% for gold and antimony. This indicates that the estimation
methodology is performing well at representing reconciled production. This is an
improvement on the reconciliation work of the 2020 resource models (MP, 2021) which had
shown a variance of 4.90% for gold, and 9.95% for Antimony. Refinements to the bulk density
calculations through a detailed sampling campaign in 2021 (Section 14.6.3), as well as
incorporation of bulk density weighting in composite files is attributed to this improvement.
As highlighted in the data presented in Table 14-26 to Table 14-32, there remains a degree of
variation from quarter to quarter. This fluctuation has become more pronounced with the
increase in stockpiles, now representing over 3 months of mill feed. Additional improvements
in stockpile tracking and grade management are currently underway to improve resolution
by area and lode.
14.16 Other Material Factors
Mining Plus is not aware of any environmental, permitting, legal, title, taxation, socio-
economic, marketing, or political factors that could materially influence the Mineral
Resources other than the modifying factors already described in other sections of this report.

Mandalay Resources - Costerfield Property NI 43-101 Technical Report
D E F I N E | P L A N | O P E R A T E 235
15 MINERAL RESERVE ESTIMATES
A mine plan was prepared from the 2021 Mineral Resource, based only on Measured and
Indicated Resource blocks, mined primarily using a long-hole stoping mining method with
cemented rock fill (CRF). The minimum stoping width of 1.5 m was used, with planned and
unplanned dilution at zero grade for both Au and Sb.
A gold equivalent (AuEq) grade for Mineral Reserve has been calculated using commodity
prices of USD $1,500/oz Au and USD $7,500/t Sb. AuEq grade is calculated using the formula:
AuEq = Au + (Sb × 1.06)
Where Sb is in % and Au is in grams/tonne
The cut-off grade of 3.8 g/t AuEq was determined from the Costerfield Property 2021
production costs.
The financial viability of Proven and Probable Mineral Reserve was demonstrated at metal
prices of USD $1,500/oz Au and USD $7,500/t Sb. Refer to Market Studies and Contracts,
Section 19, for an explanation on the source of the prices.
The 2021 Mineral Reserve is detailed in Table 15-1.
Table 15-1: Mineral Reserve at the Costerfield Property, as at December 31, 2021
Category Tonnes
(kt) Gold
Grade (g/t) Antimony Grade (%)
Contained Gold (koz)
Contained Antimony (kt)
Proven Underground 267 15.9 4.4 136 11.7
Proven Stockpile 41 10.1 3.3 14 1.4
Probable 460 10.9 1.4 162 6.5
Proven + Probable 769 12.6 2.5 312 19.6
Notes: 1. Mineral Reserve estimated as of December 31 2021 and depleted for production through to December 31, 2021. 2. Tonnes are rounded to the nearest thousand; contained gold (oz) Rounded to the nearest thousand and contained
antimony (t) rounded to nearest hundred. 3. Totals may appear different from the sum of their components due to rounding. 4. Lodes have been diluted to a minimum mining width of 1.5 m for stoping and 1.8 m for ore development. 5. A 3.8 g/t Au Equivalent (AuEq) cut-off grade has been applied. 6. Commodity prices applied are; gold price of USD $1,500/oz, antimony price of USD $7,500/t and exchange rate
AUD:USD of 0.71. 7. The Au Equivalent value (AuEq) is calculated using the formula: AuEq = Au g/t + 1.06 * Sb %. 8. The Mineral Reserve is a subset, a Measured and Indicated only Schedule, of a Life of Mine Plan that includes
mining of Measured, Indicated and Inferred Resources. 9. The Mineral Reserve Estimate was prepared by Dylan Goldhahn, MAusIMM under the direction of Daniel
Fitzpatrick, MAusIMM, who are both full-time employees of Mandalay Resources. The Mineral Reserve estimate was independently verified by Aaron Spong FAusIMM CP (Min) who is a full-time employee of Mining Plus. Mr

Mandalay Resources - Costerfield Property NI 43-101 Technical Report
D E F I N E | P L A N | O P E R A T E 236
Spong fulfils the requirements to be a Qualified Person for the purposes of NI 43-101 and is the Qualified Person under NI 43-101 for the Mineral Reserve.
There is a net increase of 57 koz of gold in the Proven and Probable Reserve for 2021, relative
to 2020, this consists of the addition of 113 koz of gold added by Resource conversion and
addition of resources to the Youle and Shepherd ore bodies. A total of 55 koz of gold has
been depleted from the 2020 Reserve through mining production in 2021.
The net decrease of 2,200 tonnes of antimony in the Proven and Probable Reserve for 2021
consists of 3,600 tonnes of antimony added by Resource conversion, and additional resources
to Youle and Shepherd ore bodies. A total of 5,800 tonnes of antimony has been depleted
from the 2020 Reserve through mining production in 2021.
15.1 Modifying Factors
The modifying factors of mining dilution and recovery have been taken into account when
generating the Mineral Reserve. The modifying factors applied based on mining method, lode
type and structural considerations.
15.1.1 Mining Dilution
Jumbo development, long-hole stoping with CRF, long-hole half-upper stoping with no backfill
(HUS) and remnant pillar slash stopes are the current mining methods utilised at the
Costerfield Property for the extraction of underground Mineral Reserve.
Due to the narrow width of mineralisation at the Augusta, Cuffley, Brunswick, Youle and
Shepherd Lodes, the Mineral Reserve includes a portion of planned mining dilution, since the
Mineral Reserve is reported to conform to a minimum 1.5 m mining width. Where the lode
width is greater than 1.2 m, the minimum mining width is the lode width plus a total of 0.3 m
planned dilution from the HW and FW. Unplanned dilution includes waste rock from outside
the planned drive profile or stope limits which is loaded and hauled to the mill. Unplanned
dilution is generally the sum of overbreak caused by excessive explosive energy and/or
geotechnical failures due to unfavourable ground conditions.
Surveys of the mined development drives and stopes to date are consistent with the recovery
and dilution factors applied to the generation of the Mineral Reserve (Table 15-2).
Table 15-2: Costerfield Property mine recovery and dilution assumptions
Mining Method Planned
Width (m)
Unplanned
Dilution (%)
Tonnage Recovery
Factor (%)
Ore Development 1.8 to 4.5 5 to 20 100
Long-hole CRF 1.5 to 4.5 10 to 33 95

Mandalay Resources - Costerfield Property NI 43-101 Technical Report
D E F I N E | P L A N | O P E R A T E 237
Long-hole Half Upper Stopes 1.5 to 2.0 10 to 33 93
Remnant Pillar Slash Stopes 1.5 to 1.6 10 to 33 70
The long-hole overbreak and dilution factors are consistent with operational results since
there is adequate reconciliation between forecast tonnes and actual tonnes. These factors
are based on stope inspections as well as stope scans that produce a 3D model of the open
void which is then interrogated using mine planning software to generate the final void
volume. Development dilution is based on the end of month survey reports which compare
actual drive volume against the designed volume.
Both planned and unplanned dilution has been considered for establishing the production
schedule. Planned dilution includes waste rock that will be mined and is not segregated from
the design. Sources of planned dilution include:
• Waste rock that is drilled and blasted within the drive profile and the overall grade of
the blasted material is economically justified,
• Waste rock within the confines of the stope limits, including FW and/ or HW material
that has been drilled and blasted to maximise mining recovery and/or maintain
favourable wall geometry for stability.
Operating practices attempt to mine the stope as close to the lode width as possible, in order
to limit the amount of planned and unplanned dilution reporting to the stope drawpoint. All
planned and unplanned mining dilution is assumed to have a grade of zero.
15.1.2 Mining Recovery
The tonnage recovery factors (Table 15-2) represent the recovered portion of the planned
mining areas for the different mining methods and include in-situ ore plus dilution material.
In stoping areas, visual inspections are carried out to estimate the stope void volume and
determine if any ore is left in the stopes, which is recorded on the stope inspection sheets.
Stope volumetric scans are also conducted to confirm the qualitative data captured during
the stope inspections. This data is used in combination to estimate the recovery factors
applied to the Mineral Reserve.
The remnant pillar slash stoping method is applied on a minor portion of the Mineral Reserve.
This mining method has a reduced mining recovery in comparison to other long-hole stoping
methods, having a recovery factor of 70% estimated. This value considers the factors of
limited remote loader access when extracting ore from the remnant drive/draw point and
unfavourable ground conditions around draw points that may potentially limit the recovery
of material.

Mandalay Resources - Costerfield Property NI 43-101 Technical Report
D E F I N E | P L A N | O P E R A T E 238
15.2 Cut-off Grade
The cut-off grade determined for Mineral Reserve is based on the 2021 operating costs,
operational data and the Mineral Reserve economic parameters.
Parameters input into the cut-off grade calculation are:
• Gold price of USD $1,500/oz,
• Antimony Price of USD $7,500/t,
• AUD:USD exchange rate of 0.71,
• Process recoveries are the weighted average recoveries of the 2022 LoM Budget,
• Product payables are the weighted average payables of the 2022 LoM Budget,
• The production schedule is sourced from the Mineral Reserve LoM plan,
• Unit costs for mining are based on 2021 operating cost data,
• Variable mining cost per tonne is the weighted average of development and stoping
from 2021 operating cost data,
• Mining costs are in AUD and commodity prices are in USD,
• The cut-off grade determination does not include sustaining or planned capital costs.
The resulting operating and incremental cut-off grades determined for the Mineral Reserve is
summarised in Table 15-3, along with the values utilised in the determination of each cut-off
grade.
Table 15-3: Mineral Reserve cut-off grade variables and cut-off grades
Operating COG Incremental COG
Mining Cost (AUD$/t) 172.07 84.28
Processing Cost (AUD$/t) 64.73 37.75
G&A Cost (AUD$/t) 66.87 20.52
Gold Price (USD$/oz) 1,500 1,500
AUD:USD conversion value 0.71 0.71
Au Payable & Recovery 86.12% 86.12%
Cut-off grade (g/t AuEq) 5.2 2.4
Based on the cut-off grade determination of operating and incremental categories, an
average cut-off grade of 3.8 g/t AuEq was selected for Mineral Reserve design and reporting.

Mandalay Resources - Costerfield Property NI 43-101 Technical Report
D E F I N E | P L A N | O P E R A T E 239
15.3 Mine Design and Planning Process
The mine design work is completed using Deswik.CAD™ and Deswik.ASD™. The Mineral
Reserve Life of Mine (LoM) scheduling is completed through Deswik.AdvUGM™ and
Deswik.IS™.
The Mineral Reserve is calculated from mine designs applied to 2021 Mineral Resource block
models, which have been depleted for the production through to 31 December 2021.
The mine design methodology considers the Mineral Reserve cut-off grade, mining feasibility
and economic assessment of individual mining blocks, and comprises the following general
methodology:
• Determination of the mining method applied to individual areas, based on access
options, geological grade distribution, geometry of the lode, historic mining shapes
and geotechnical constraints,
• Design of ore development and stope mining shapes in order to capture the geological
block model using manual design (Deswik.CAD) and optimization packages
(Deswik.ASD),
• Assessment and validation of the output mining shapes and apply adjustments as
required,
• Determination of the mining dilution and recovery factors to apply to design shapes,
• Interrogation of the mining shapes against 3D geological block models in Deswik.IS to
calculate and assign ore tonnes and grade,
• Mining shapes of Measured and Indicated material above the cut-off grade are
identified for further design and assessment,
• Assessment and design of the waste development required to access ore development
and stope blocks,
• Economic assessment of individual ore development and stope blocks on a level-by-
level basis, based on variable mining costs applicable to the mining method and is
inclusive of waste access, haulage, processing, selling, royalty, and administrative
costs,
• Economically viable areas are included in the Mineral Reserve LoM schedule.
Uneconomic areas are removed or may be re-designed and included in the plan if re-
assessment proves to be profitable,
• Dependency rules, mining rates and schedule constraints are applied to the design
shapes to link the mining activities in a logical manner within the Deswik.IS scheduling
project,

Mandalay Resources - Costerfield Property NI 43-101 Technical Report
D E F I N E | P L A N | O P E R A T E 240
• The resulting Reserve LoM schedule is exported for further economic validation
through the financial model.

Mandalay Resources - Costerfield Property NI 43-101 Technical Report
D E F I N E | P L A N | O P E R A T E 241
16 MINING METHODS
The Augusta Mine is serviced by a decline haulage system developed from a portal within a
box-cut. The Augusta decline dimensions are primarily 4.8 m high by 4.5 m wide at a gradient
of 1:7 down. The majority of the decline development has been completed with a twin-boom
jumbo; however, development of the decline from the portal to 2 Level was completed with
a road-header, this section of decline has dimensions of 4.0 m high by 4.0 m wide. The
Augusta decline provides primary access for personnel, equipment and materials to the
underground workings.
The Brunswick Incline development was mined to breakthrough into the Brunswick Open pit,
establishing the Brunswick Portal during the second half of 2020. The Brunswick Incline has
the dimensions 4.8 m high by 4.5m wide at a gradient of 1:7 up and was mined with a twin-
boom jumbo. The Brunswick Open Pit was prepared for the portal breakthrough with a
pushback completed by a combination of road-header and drill and blast supported by a twin-
boom jumbo. The first 20 m advance of Brunswick Portal was completed by a road-header
with the dimensions 5.0 m high by 5.0 m wide at a gradient of 1:25 up. The establishment of
the Brunswick Portal provides an additional means of egress from the mine and is the primary
material haulage route from underground to the Brunswick Mill for ore processing and waste
storage.
Mill feed is produced from three different mining methods: full-face jumbo development,
long-hole CRF stoping and half upper stoping. All mined ore material is hauled from the
underground working areas to the Brunswick ROM via the Brunswick Incline and Portal.
Waste material produced from mining is stored underground for use as stope backfill.
The Cuffley Decline extends as a branch off the Augusta Decline at 1028 mRL and continues
down to approximately 895 mRL. At the 935 mRL, the Cuffley Incline extends off the Cuffley
Decline and accesses mineral resources from the 945 mRL to the 1,050 mRL. This incline was
used to extract N and NV lodes. Mining in the Cuffley incline is complete and it is now the
location of the High Explosive (HE) Magazine. A second decline within Cuffley, known as the
4800 decline, accesses the southern part of the Cuffley Lode which is positioned south of the
East Fault. This decline commences at the 960 mRL and extends to 814 mRL. The Mineral
Reserve in the 4800 decline consists of remnant pillars from past stoping and long-hole HUS
and CRF stopes.
The Mineral Reserve LoM Plan, based on the December 2021 Mineral Resource model,
predominantly includes mining of the Brunswick, Youle and Shepherd Deposits. The
Brunswick access, 5.5 m high by 4.5 m wide development, starts from the 925 mRL on the
Cuffley Decline and accesses the Brunswick Deposit at 955 mRL. The Brunswick Incline
continues from 955 mRL up to the Brunswick Portal. The Youle access, 5.5 m high by 5.5 m
wide, extends from the Brunswick Incline at 961 mRL and accesses the Youle Deposit at 957

Mandalay Resources - Costerfield Property NI 43-101 Technical Report
D E F I N E | P L A N | O P E R A T E 242
mRL. From this level, the Youle Decline, 4.8 m high and 4.5 m wide, continues down to 617
mRL, accessing both the Youle and Shepherd deposits, and is planned to extend down to 580
mRL.
A schematic of the Augusta, Cuffley, Brunswick and Youle underground workings is presented
in Figure 16-1 and the designed Reserve stope shapes are presented in Figure 16-2 to Figure
16-4.

Mandalay Resources - Costerfield Property NI 43-101 Technical Report
D E F I N E | P L A N | O P E R A T E 243
Figure 16-1: Long-section of the as-built and Mineral Reserve des–gns - Augusta, Cuffley, Brunswick and Youle
(Red – planned development, green– planned production, grey – depleted workings)

Mandalay Resources - Costerfield Property NI 43-101 Technical Report
D E F I N E | P L A N | O P E R A T E 244
Figure 16-2: Long-section of Cuffley & Augusta Mineral Reserve mine design (Red - planned development, green - production, grey – depleted workings)
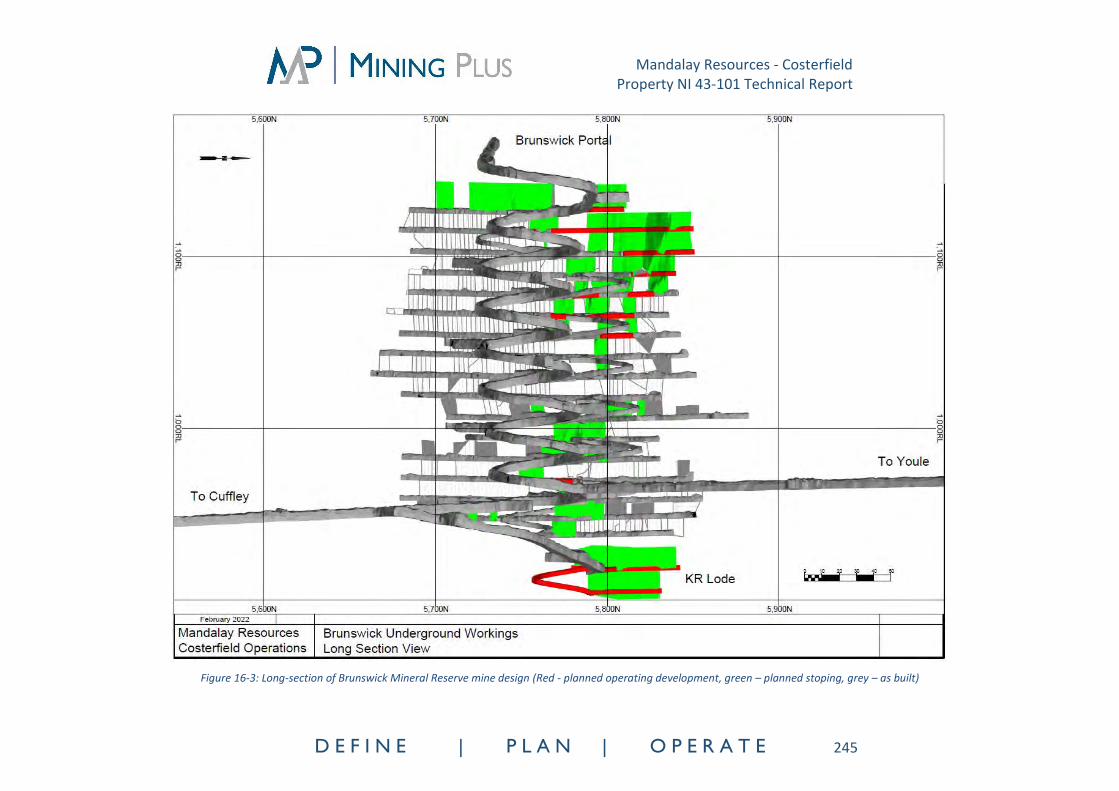
Mandalay Resources - Costerfield Property NI 43-101 Technical Report
D E F I N E | P L A N | O P E R A T E 245
Figure 16-3: Long-section of Brunswick Mineral Reserve mine design (Red - planned operating development, green – planned stoping, grey – as built)

Mandalay Resources - Costerfield Property NI 43-101 Technical Report
D E F I N E | P L A N | O P E R A T E 246
Figure 16-4: Long-section of proposed Youle mine design on Youle and Shepherd lodes (Blue – planned capital development, red-planned operating development, green – planned Youle stoping, yellow – planned Shepherd stoping and grey – as built)

Mandalay Resources - Costerfield Property NI 43-101 Technical Report
D E F I N E | P L A N | O P E R A T E 247
16.1 Geotechnical
16.1.1 Rock Properties
16.1.1.1 Lithology and Structures
Active underground mine workings are hosted within weakly metamorphosed siltstones of
the lower Silurian-aged Costerfield Formation. Underground operations target the north-
northwest striking, mineralised structures which are typically less than 500 mm in true width.
Targeted sub-vertical mineralised structures within the Cuffley and Augusta orebodies are
bounded up-dip and down-dip by the Adder and King Cobra thrust faults respectively. The
King Cobra fault is observed as separate HW and FW structures filled with strongly deformed
siltstone and quartz horsetails. The zone of deformation within the King Cobra fault can be
up to 10 m wide, and the offset across the King Cobra fault is unknown. The Adder fault is
also filled with quartz and rubble and varies in width from less than 0.3 m to greater than 2 m.
The sub-vertical Brunswick lode sits above the HW of the Adder fault. It is offset by shallow
west dipping faults by over 20 m. The Kiwi fault is one of the shallow dipping structures,
which is characterised by strong shearing and lode offset in the vicinity of the Brunswick lode
and shows minor shearing, in the order of less than 0.5 m, distal to the lode.
Significant second order structures include the northeast striking, northwest dipping faults
that offset lode mineralisation (East Fault, Brown Fault, Kiwi and Penguin) as shown in cross-
section (Figure 16-5). There are other significant second order structures that can contain
strongly associated shearing when intercepting the lodes (Flat, Krait, Red Belly, Bushmaster
Tiger, Emperor and Cassowary).

Mandalay Resources - Costerfield Property NI 43-101 Technical Report
D E F I N E | P L A N | O P E R A T E 248
Figure 16-5: Cross-section of the Augusta, Cuffley and Brunswick systems

Mandalay Resources - Costerfield Property NI 43-101 Technical Report
D E F I N E | P L A N | O P E R A T E 249
The steeply East-West dipping Youle lode sits below the No.3 fault and at the point of
intersection with the No.4 fault, starts running along the No.4 becoming a shallower dipping
mineralised structure as was shown in the cross-section Figure 7-7. The No.4 fault is
characterised as a laminated quartz structure with a large lithology offset.
Significant second order structures include the low angle west dipping Doyle Fault and the
Youle lode sub-parallel Peacock Fault which generally contain strongly associated shearing
when in close proximity (~10 m) of the lode.
The Shepherd lode consists of sub-vertical East and West mineralised veins splaying off the
Youle with the extents currently unknown.
Significant second order structures (not pictured in Figure 7-7) are currently unnamed
however consist of shallow east-west dipping crosscutting LQ structures which generally
contain strongly associated shearing when in proximity to the lode or each other.
A 3D structural model of all intersected mine scale faults is maintained and is a key driver of
pre-emptive ground control strategies.
16.1.1.2 Rock Strength
The Costerfield Formation siltstone has had a total of 84 Unconfined Compressive Strength
(UCS) tests carried out since 2009. Test results indicate that intact rock strength increases
with depth due to sustained weathering in the upper strata. At levels less than 100 m below
surface, intact rock strength exceeds 80 MPa.
16.1.1.3 Rock Stress
In-situ stress measurements have been undertaken at the Costerfield Property in proximity
to the Youle lode, utilising the Deformation Rate Analysis (DRA) technique on core samples at
520 m and 903 m below the surface.
At 520 m below the surface, the maximum principal stress is orientated at 300o/43o
(trend/plunge) with a magnitude of 25 MPa, the intermediate principal stress is oriented at
184°/25° with a magnitude of 12.6 MPa and the minimum principal stress is oriented at
074°/36° with a magnitude of 8.3 MPa.
At 903 m the maximum principal stress is oriented at 346°/5.2° and a magnitude of 30 MPa,
the intermediate principal stress is oriented at 091°/71° with a magnitude of 19.6 MPa and
the minimum principal stress is oriented at 018°/15° with a magnitude of 15 MPa.
In-situ stress in levels below 895 mRL in Cuffley, and 936 mRL in Brunswick has caused minor
convergence, or squeezing ground, in isolated areas around major fault zones. In the Youle at
around 880mrL there has been an isolated case where induced stress has caused squeezing

Mandalay Resources - Costerfield Property NI 43-101 Technical Report
D E F I N E | P L A N | O P E R A T E 250
ground as stoping retreated in close proximity to the drive access. In both cases the
magnitude of this squeezing is small enough to be contained by dynamic support.
In October 2021 stress modelling for the LoM extraction of the Youle was completed. The
modelling did not identify any areas where mining induced stress would cause regional
instability. However due to the complex nature of the rock mass isolated cases of converging
ground may occur from either in-situ or induced stresses.
16.1.1.4 Rock Mass Alteration
Rock mass in the vicinity of mineralised structures is heavily fractured with multiple joint
orientations, often with a portion of clay fill and smooth planar joint surfaces. In waste rock,
away from mineralised lodes and discrete structures, the rock mass improves with lower
fracture frequency and rough tightly healed joint surfaces present.
16.1.1.5 Hydrogeology
The regional hydrogeology is comprised of two main aquifers, the Shallow Alluvial Aquifer
(SAA) and the Regional Basement Aquifer (RBA).
• The SAA is comprised of silts, sands and gravels, and is a perched groundwater system
occurring across the site and within the confines of the creek and valley floors. There
is clear evidence that this aquifer is perched, is laterally discontinuous and is less
common in the area,
• The RBA is comprised of Silurian metasediments and forms the basement aquifer,
where groundwater mainly occurs within and is transmitted through fracture systems
beneath the upper weathered profile, at depths of greater than 20 m below the
natural surface.
Dewatering of underground workings, in Augusta, Cuffley and Brunswick, is achieved via
controlled drainage to an underground pump station in the 4800 decline that pumps to the
Cuffley 945 pump station. Dewatering of Youle and Shepherd is achieved by pumping from
two linked pump stations straight to the Cuffley 945 pump station. From the Cuffley pump
station Rising Main, water is fed to the Augusta mine dam and distributed for treatment at
the RO facility or Splitters Creek evaporation facility. Recently water inflow has been
approximately 1.5 ML per day.
16.1.2 Mine Design Parameters
16.1.2.1 Mining Methods
The dominant mining method is longitudinal long-hole stoping filled using CRF, with stope
panels generally consisting of three to four operating levels mined bottom-up over CRF with

Mandalay Resources - Costerfield Property NI 43-101 Technical Report
D E F I N E | P L A N | O P E R A T E 251
a longitudinal retreat to a quasi-central access. Several other mining methods are applied to
access and optimise the extraction of ore at the Costerfield Property:
• Capital development with twin-boom jumbo,
• Operating development with single boom jumbo. (Note: in 2020 the usage of the airleg
hand-held drill were limited to specialised projects thus are no longer used for
operating development),
• Blind up-hole longitudinal long-hole open stoping (‘half uppers’),
• Floor benching of level ore development,
• Downhole vertical crater retreat (VCR),
• Avoca stoping with CRF (‘reverse fill’),
• Avoca stoping with rockfill (‘reverse fill’),
• Overhand cut and fill (Flat backing ore level development),
• Air leg rise mining.
Mining methods are selected to suit ore drive/lode geometry and maximise ore recovery
while minimising unplanned dilution.
16.1.2.2 Development Geometry
Standard development profiles adopted at the Costerfield Property include:
• 1.8m wide x 3.0m high ore drives,
• 2.0m wide x 3.0m high access drives,
• 3.5m wide x 4.0m high access drives,
• 3.5m wide x 4.2m high access drives,
• 4.5 m wide x 4.8m high decline/incline,
• 5.5 m wide x 5.5m high decline/incline,
• 5.0 m wide x 4.8m high level access,
• 5.0 m wide x 6.5m high truck tips,
• 4.5 m wide x 4.8m high ore stockpiles,
• 6.5 m wide x 4.8 m high vent rise access drives.

Mandalay Resources - Costerfield Property NI 43-101 Technical Report
D E F I N E | P L A N | O P E R A T E 252
Non-standard development profiles may be mined for major infrastructure, such as pump
stations, explosives magazines, fan chambers etc., or for variations to the applied mining
methods, such as flat-backing, and floor benching etc. Development spans and associated
ground support are designed using empirical data to ensure the stability of mined spans.
16.1.2.3 Stope Geometry
In response to observed ground conditions and production drill capability, inter-level spacing
at the Costerfield Property is variable. Stope strike length varies based on the applied mining
method, observed ground conditions and machinery capability. Stope geometry parameters
include:
• Stope height: Up to 17 m,
• Stope strike length: Depends on ground conditions generally 2.7 m – 13 m but some
‘HUS' have recently extended beyond 20 m,
• Stope design width: 1.5 m,
• Stope dip: 45-900.
Non-standard stope geometry may be mined to maximise ore extraction under unique
circumstances, such as remnant mining, flat dipping ore bodies and geological complexity.
The empirical stope performance chart is consulted to ensure that designed stope spans will
allow safe efficient extraction of target mineralisation.
16.1.2.4 Pillars and Offsets
In mine design and planning, the following pillars and offsets are observed to ensure the
stability of mined excavations:
• Decline development is designed and mined with a 30 m offset to target mineralised
structures; to date stope production blasting has not influenced decline stability
having applied the 30 m offset. This distance has been maintained as a minimum for
the Brunswick, Youle and Shepherd lode,
• The minimum inter-level pillar width to height ratio is 1:2, for example for 1.8 m wide
ore drives, the minimum inter-level spacing is 3.6 m,
• Minimum horizontal clearance between sub-parallel ore drives is 2 m,
• The minimum pillar strike between unfilled blind up-hole longitudinal open stopes or
half-upper stopes is 3 m.

Mandalay Resources - Costerfield Property NI 43-101 Technical Report
D E F I N E | P L A N | O P E R A T E 253
16.1.2.5 Backfill
CRF is the most commonly used backfill at the Costerfield Property. CRF is exposed vertically
in the longitudinal retreat of CRF filled long-hole open stopes, and horizontally in the mining
of sill pillars at the toe of blind up-hole longitudinal open stopes (half uppers). Loose rockfill
is used where vertical and horizontal exposures to filled voids are not required, such as in
level close out stopes and adjacent to waste pillars.
Previously Cement Aggregate Fill (CAF) was primarily used in areas where re-access is
required through or adjacent to the filled stope however as the Youle lode has required the
mining of shallow dipping stopes, with dips less than 500, the usage of CAF over CRF has
become more prominent in the Youle.
16.1.3 Ground Support
16.1.3.1 Development Ground Support
Ground support elements installed in standard development profiles include:
• 3.0 m 25 mm Dia. galvanised resin bolts,
• 2.4 m 25 mm Dia. galvanised resin bolts,
• 2.4 m 20 mm Dia. galvanised resin bolts,
• 2.1 m 20 mm Dia. galvanised resin bolts,
• 2.4 m 47 mm Dia. galvanised friction bolts,
• 1.5 m 33 mm Dia. galvanised friction bolts,
• 1.8 m 33 mm Dia. galvanised friction bolts,
• 2.4 m x 3.6 m 5.6 mm Dia. gauge galvanised mesh,
• 2.4 m x 4.2 m 5.6 mm Dia. gauge galvanised mesh,
• 2.4 m x 3.0 m 4.0 mm Dia. gauge galvanised mesh,
• 2.4 m x 1.5 m 4.0 mm Dia. gauge galvanised mesh
When spans exceed 5.5 m in development intersections or in response to deteriorating
ground conditions and discreet structures, cement grouted single strand or twin strand, non-
galvanised, bulbed, 4.5 m – 6.0 m cable bolts are installed and tensioned to ensure the
stability of development profiles.
Additional ground support may be installed to support non-standard development profiles or
in response to poor ground conditions. Fibrecrete, resin injection, spiling, sets and straps have

Mandalay Resources - Costerfield Property NI 43-101 Technical Report
D E F I N E | P L A N | O P E R A T E 254
been installed in the past to support poor ground, development/stoping interactions and
faults/shear zones. In addition, 2.4 m and 1.8 m yield lok bolts are installed in areas where
squeezing ground is expected.
16.1.3.2 Stoping Ground Support
Additional support for designed stopes is installed on an as required basis in response to
compromised stope geometry, poor rock mass, interactions with faults/shears or interactions
with other stopes and development. Single strand, non-galvanised, bulbed, 4.5 m – 6 m cable
bolts are generally installed as secondary support for stopes.
Other forms of ground support including resin bolts, friction bolts, mesh, fibrecrete, resin
injection and straps may also be installed to provide secondary support for designed stopes.
16.2 Mine Design
16.2.1 Method Selection
Long-hole CRF stoping has been selected as the preferred mining method for the Mineral
Reserve on the Youle and Shepherd lodes. This is based on the orebody geometry and current
production fleet, as well as the experience gained through the application of this method
during mining of Cuffley and Brunswick.
The long-hole CRF stoping method allows for a ‘bottom-up’ mining sequence with the benefit
of minimizing the number of crown/sill pillars required to remain in place. The location of the
crown and sill pillars is determined by the grade distribution of the orebody and the local
mine stability requirements. Recovery of the pillars is planned to be undertaken with the use
of half-upper production stoping and remnant pillar extraction where grade and ground
conditions permit.
16.2.2 Method Description
Mining within the Augusta Mine has targeted several individual lodes, including W, NM, E, K
and Cuffley Lodes, which vary in width from 0.1 m to 1.5 m and dip between 45° to 85°. This
lode geometry is favourable for long-hole CRF and half-upper stoping when using mechanised
mining techniques. However, in the past ore was also extracted using air-leg CRF and half
upper stoping methods.
The current Mineral Reserve in the Augusta Mine is planned to be extracted using various
mechanised methods depending on the ore location, access requirements, and the proximity
to previously mined areas. The majority of Augusta Mineral Reserve is planned to be extracted
using long-hole half upper stoping due to limited development access for fill drives. Areas
that have access for both an extraction and fill drive utilize long-hole CRF stoping method.

Mandalay Resources - Costerfield Property NI 43-101 Technical Report
D E F I N E | P L A N | O P E R A T E 255
Remnant pillar slashing is the planned method for areas where half-upper stoping has
previously been undertaken. This method involves developing a waste access parallel to the
original production drive, with draw points breaking through to the ore zone. Production
slash-holes are drilled into the remnant rib pillars to be fired and the ore extracted with
remote loading operations. Areas of remnant ore are individually assessed and those deemed
both economically viable and safe to extract remotely have been included in the Mineral
Reserve.
Throughout the Cuffley lodes, a sub-level spacing of 10 m floor to floor, or 7 m backs to the
floor, and has been established to ensure stable spans, acceptable drilling accuracies and
blast-hole lengths. A sub-level spacing of 15 m was developed for two select areas. This
involved drilling up from the lower level to 8 m and drilling and firing the remainder from the
upper level using down-holes. Whilst this has been a success it has not been implemented
elsewhere in the mine.
The Brunswick orebody has applied a sub-level spacing of 12 m floor to floor, or 9 m backs to
the floor. This has been established due to improved drill accuracy, steep lode geometry and
the wider orebody, with the average diluted stope width of 2.0 m vs 1.5 m in Cuffley and
Augusta. Brunswick has primarily been mined with long-hole CRF stoping due to it being
accessed and developed from the bottom-up. The Brunswick Mineral Reserve consists of the
remaining level closeout stopes, ore development and CRF/HUS stoping on northern extents,
and remnant extraction of pillars left in place for localised ground stability.
The Youle orebody has been mined with a sub-level spacing of 9 m floor to floor, or 6 m backs
to the floor vertically and 6 m to 13 m backs to the floor along the dip of the ore body. This
sub-level spacing has been implemented in order to minimise dilution and improve recovery
in the flatter dipping Youle ore. It also allows for stable vertical spacing between levels and
optimal stope height for drilling accuracy. The ore body dip varies greatly in Youle between
38° to 85°, which is dependent on the influence of major structures interacting with the Youle
lode. In areas where the dip of the ore is below 40°, extraction drives are widened to steepen
the footwall of the stope to ensure full recovery. Stope HWs designed less than 45° require
backfill with CAF rather than CRF to ensure fill confinement and stability of the HW.
The Shepherd ore deposit consists of multiple lodes that are positioned in the footwall of the
Youle structure which range from moderately flat dipping (~55°) to sub vertical between 70°-
90° dip. The Shepherd deposit was first mined in the second half of 2021 on the extents of
the southern Youle lode at 757 mRL. The Youle mine predominantly accesses the sub-vertical
Shepherd deposit below 650 mRL. Here the sub-level spacing has been increased to 11-12 m
floor to floor to account for the sub-verticality of the lodes. The increased level spacing
ensures that final stope height is optimised within the limits of the mining method, as well as
improving design efficiency by reducing overall ore and waste development. The Shepherd
deposit is designed to be extracted primarily by a long-hole CRF stoping method on each of

Mandalay Resources - Costerfield Property NI 43-101 Technical Report
D E F I N E | P L A N | O P E R A T E 256
the individual lodes. Where separate lodes run parallel and the separation between the lodes
does not allow individual ore drives or stope panels, ore drives and stopes have been designed
to capture the mineralisation up to a width of 4.5 m. This method has been used successfully
on the Youle lodes by stripping the development out to the required width on retreat with
stoping.
The production cycle for long-hole CRF/CAF stoping, as illustrated by Figure 16-6, comprises
the following:
• Develop access to the orebody,
• Establish bottom sill drive and upper fill drive,
• Drill production blast-holes in a minimum 2 hole per ring pattern, depending on the
ore width. The nominal stope design width is 1.5 m,
• Fire the blast of 2.7 m to 13 m strike and extract ore with a tele-remote loader,
• Place rock bund at the brow of the empty stope and place mesh tubes in the stope.
Mesh tubes are tightly rolled steel mesh placed in the leading edge of stope prior to
filling and eliminates the need for boring reamer holes in next stoping panel,
• Place CRF into the stope,
• Remove rock bund at the brow of the stope,
• Commence extraction of adjacent stope once the CRF has cured for 24 hours.

Mandalay Resources - Costerfield Property NI 43-101 Technical Report
D E F I N E | P L A N | O P E R A T E 257
Figure 16-6: Long-hole CRF stoping method (Source: Potvin, Thomas, Fourie, 2005)
The half upper stope method is similar to CRF stope method however, it is implemented
where there is no access to a fill drive. The mining cycle comprises the following:
• Drill up to 13 m length blind production long-holes for a strike length of 3 to 13 m,
• Fire stope and extract ore with a tele-remote loader,
• Leave a 3 m strike rib pillar where required by ground conditions,
• Commence the next stope.
16.2.3 Materials Handling
Since the completion of the Brunswick Portal, all underground ore is trucked to the surface
via the Brunswick Incline. Once on the surface, the ore is transferred to the Brunswick ROM
pad where it is stockpiled, screened, blended and crushed prior to being fed into the
Brunswick processing plant.
Waste material from development headings is trucked internally underground and used for
backfill or trucked to the surface and stockpiled at the Bombay Waste Rock Storage Facility.
Small portions of suitable waste material is screened on the surface and trucked underground
to be utilised as road base and CAF fill. In times of reduced underground waste production,

Mandalay Resources - Costerfield Property NI 43-101 Technical Report
D E F I N E | P L A N | O P E R A T E 258
trucks are backloaded on the surface with stockpiled waste to haul underground and use in
stope filling.
16.3 Mine Design Guidelines
The mining schedule follows a predominantly bottom-up stoping sequence where possible,
mining from the northern and southern extents retreating toward the central access. This
sequence enables a consistent production profile to be maintained because it allows for dual
development headings on each level.
Brunswick is mined using a bottom-up sequence with primarily CRF stopes that do not include
any crown pillars.
The current and planned sequence for the Youle and Shepherd orebodies utilises crown pillars
at various intervals to allow for a consistent production profile and optimized recovery of ore.
16.3.1 Level Development
Production drive development is mined to ensure the ore is positioned in the face for
maximum recovery and feasible long-hole production drilling. Production development is
mostly directed under geology control and sometimes survey control where stand-off/pillars
need to be maintained. Production drives are excavated and supported with a single boom
jumbo and are loaded with a manual or tele-remote operated LHD.
16.3.2 Vertical Development
Vertical development at the Costerfield Property exists in the way of primary ventilation
shafts, return/fresh ventilation rises and escapeway ladders. Throughout Cuffley, ventilation
rises of 3.5 m x 3.5 m have been excavated between levels to extend the existing primary
exhaust system both above and below the Cuffley fan chamber and exhaust shaft. The
Brunswick Mine utilised a 3.5 m diameter shaft to supply fresh air to the workings and act as
a second means of egress. Since the Brunswick Portal breakthrough, the Brunswick shaft has
been decommissioned and the portal is now the fresh air intake. The Youle ventilation shaft
has a diameter of 4.0 m, exhausting air from Youle workings and a providing secondary means
of egress. The Youle primary exhaust system is extended with 4.0 m x 4.0 m ventilation rises
between the levels as development progresses below the ventilation shaft and fan chamber.
Ladder rising with a diameter 0.8 m to 1.2 m has been developed for the installation of escape
ways providing a second means of egress between working levels.
16.3.3 Stoping
The strike length of stopes is determined using a case-by-case assessment of the overall
mining sequence, ore orientation, geological considerations and geotechnical stability. All

Mandalay Resources - Costerfield Property NI 43-101 Technical Report
D E F I N E | P L A N | O P E R A T E 259
blasted material is assumed to have a swell factor of 30% and non-mineralised material is
allocated a default relative density of 2.74 t/m3. The relative density of mineralised material
is estimated within the geological resource block model.
16.3.4 Mine Design Inventory
The planned mining inventory for each lode is summarised in Table 16-1.
Table 16-1: Mineral Reserve inventory by lode
Lode Ore Tonnes Au g/t Sb %
YOULE 226,253 17.2 3.3
YOULE 501 824 2.5 2.2
YOULE 503 1,425 33.9 10.6
YOULE 508 17,459 11.0 4.6
YOULE 525 6,067 7.1 2.8
YOULE 531 1,325 3.8 1.6
SHEPHERD 600 209,285 13.4 1.4
SHEPHERD 604 15,490 6.6 0.1
SHEPHERD 605 13,489 6.9 0.0
SHEPHERD 606 1,477 4.3 0.0
SHEPHERD 620 56,024 12.0 0.1
BRKR 7,253 5.0 3.1
BRUNSWICK 31,643 5.6 2.8
AS 500 3.1 2.4
BOB 4,055 5.3 3.0
BOBSPL 2,245 5.7 1.8
C 11,117 4.6 2.9
CD 2,651 10.0 3.4
CE 2,600 13.3 1.6
CM 34,817 9.3 3.3
E 32,126 8.1 5.1
K 4,053 6.1 2.9
NM 25,352 10.5 4.5
NSP48 883 6.2 4.0
NW 1,228 5.2 3.6
P1 9,027 8.5 2.0

Mandalay Resources - Costerfield Property NI 43-101 Technical Report
D E F I N E | P L A N | O P E R A T E 260
Lode Ore Tonnes Au g/t Sb %
W 8,962 9.8 6.1
TOTAL 727,631 12.8 2.5
16.4 Ventilation
The current Costerfield Property mine ventilation circuit is comprised of fresh air being
sourced from four surface intakes, these being:
• The Augusta portal, and the Augusta ladder ways, where fresh air enters the ladder
ways via a 20 m shaft from the surface,
• The Augusta Fresh Air Rise (FAR),
• The Brunswick Portal and a small amount of airflow entering the mine through the
Brunswick FAR, regulated to 98%, which services the 1056 Fresh Air Base (FAB). This
airflow is pulled into the mine via two separate underground primary chambers that
exhaust air out of the mine via the Cuffley return airway (RAW) at a flow rate of 54mᶟ/s
and the Youle RAW, at 103mᶟ/s.
16.4.1 Primary Ventilation Circuit – Augusta/Cuffley
At Augusta/Cuffley fresh air travels to the bottom of the old Augusta workings via internal
rises and enters the Augusta side of the mine at the 900 mRL, at which point it flows back up
the Augusta decline where it enters the Cuffley decline and joins the primary flow entering
the mine from the Augusta portal. This airflow travelling down the Cuffley decline, splits at
the 4800 decline and the Cuffley incline, with the remaining airflow continuing towards the
Brunswick access. At the Brunswick access, the airflow splits and travels towards the Youle
via the Brunswick straight (24mᶟ/s), with the remaining airflow (34mᶟ/s) reporting to the
Cuffley 915 RAW, where it will exhaust via the Cuffley RAW.
The Cuffley incline is also where the current HE magazine is located. Primary airflow in the
4800 decline and Cuffley incline reports to the Cuffley RAW where it exhausts to surface.
The primary ventilation circuit for Augusta is presented in Figure 16-7 below. Fresh air intakes
through the Augusta FAR and ladder ways (in blue), with primary flow continuing to the
Cuffley decline.

Mandalay Resources - Costerfield Property NI 43-101 Technical Report
D E F I N E | P L A N | O P E R A T E 261
Figure 16-7: Augusta primary ventilation circuit
The primary ventilation circuit for Cuffley is presented in Figure 16-8 below. Fresh air is drawn
through the Cuffley decline from Augusta and return air (in red) is exhausted through the
Cuffley RAR by either the 4800 decline or 915 RAW.

Mandalay Resources - Costerfield Property NI 43-101 Technical Report
D E F I N E | P L A N | O P E R A T E 262
Figure 16-8: Cuffley primary ventilation circuit
16.4.2 Primary Ventilation Circuit – Brunswick/Youle
The Brunswick workings are supplied primary airflow from the Brunswick portal (80mᶟ/s),
while the Youle workings are currently supplied fresh air from the Brunswick portal (80mᶟ/s)
and primary airflow from the Augusta/Cuffley side of the mine (24mᶟ/s). The Youle working
levels are supplied airflow via the use of secondary ventilation fans.
The primary ventilation circuit for Brunswick is presented in Figure 16-9 below. Fresh air is
drawn through the Brunswick Portal and Brunswick FAR which joins the primary flow from
Cuffley at the bottom of the Brunswick Incline and continues to Youle.

Mandalay Resources - Costerfield Property NI 43-101 Technical Report
D E F I N E | P L A N | O P E R A T E 263
Figure 16-9: Brunswick primary ventilation circuit
The Youle primary ventilation circuit is presented in Figure 16-10 below. Fresh air is drawn
through the Youle Access and down the Youle Decline to the 657 RAW. From the 657 RAW,air
is exhausted through the Youle RAW system to the Youle 957 RAR shown in red.
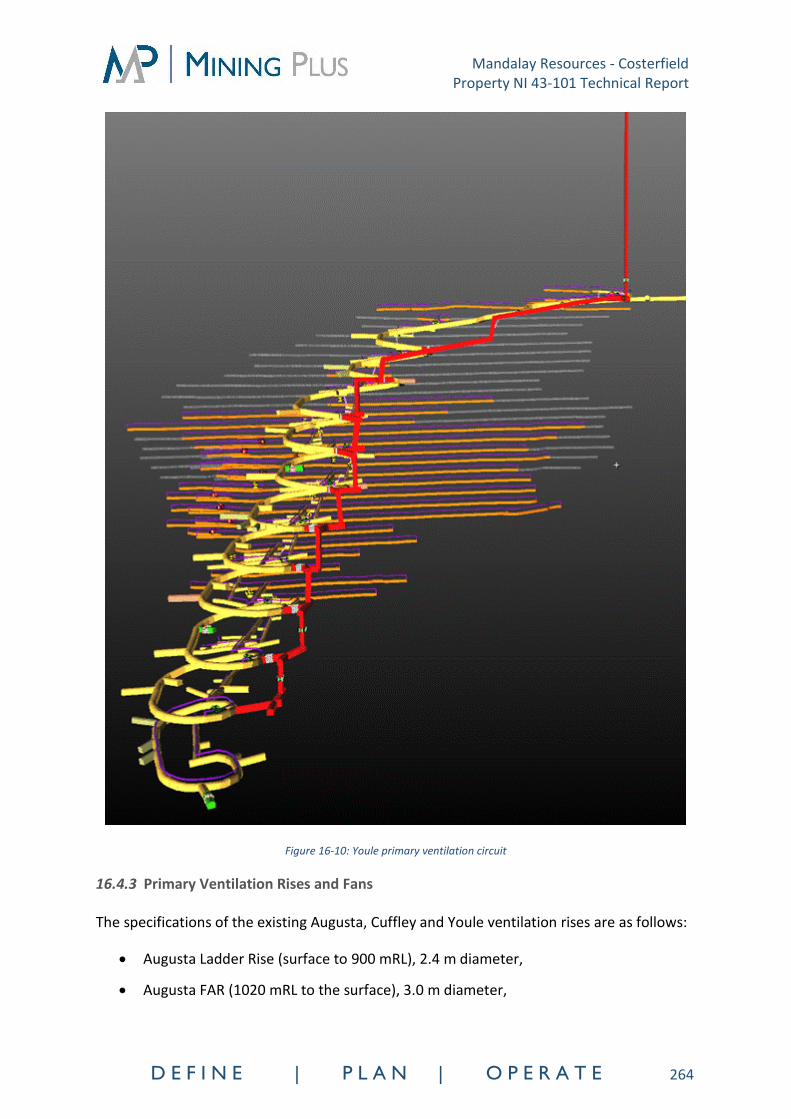
Mandalay Resources - Costerfield Property NI 43-101 Technical Report
D E F I N E | P L A N | O P E R A T E 264
Figure 16-10: Youle primary ventilation circuit
16.4.3 Primary Ventilation Rises and Fans
The specifications of the existing Augusta, Cuffley and Youle ventilation rises are as follows:
• Augusta Ladder Rise (surface to 900 mRL), 2.4 m diameter,
• Augusta FAR (1020 mRL to the surface), 3.0 m diameter,

Mandalay Resources - Costerfield Property NI 43-101 Technical Report
D E F I N E | P L A N | O P E R A T E 265
• Cuffley RAR (950 mRL to the surface), 3.0 m diameter,
• Cuffley RAR (above the 955mRL – From the 1010 level), 3.5 m x 3.5 m diameter,
• Cuffley RAR (below the 955mRL – From the 814 level), 3.5 m x 3.5 m diameter,
• Brunswick FAW (1056 mRL to the surface) – 3.5 m diameter – Regulated Shaft,
• Youle RAW (Current) 957 mRL – 4.0 m diameter.
Three single stage 110 kW axial fans have been built into a bulkhead at the 950 mRL Cuffley
RAW, however only one fan is currently operational. This was designed as to lower resistance
along the Brunswick straight, whilst still providing adequate airflow to the 4800 decline and
the Cuffley incline where the HE magazine is located, ensuring that the HE magazine
ventilation reports directly to the Cuffley RAW. There are no current working levels in the
4800 decline.
The Cuffley primary ventilation fan has been designed with a final duty of 54m³/s. One of the
primary 110kW fans in the Cuffley ventilation chamber will be re-located to the Youle primary
chamber to increase airflow in the Youle as mining gets deeper.
The existing Cuffley primary fan is a Clemcorp CC1400 MK4 single stage 110 kW axial fan
installed in a bulkhead on the 950 mRL. The operating parameters of this fan are:
• Current operating fan total pressure of 343 Pa for 56 m3/s,
• Maximum operating fan static pressure of 2,350 Pa at 30 m3/s.
The Youle primary fans comprises of two Clemcorp CC1400 MK4 single-stage fans, located at
the 957mRL Youle RAW. These two fans are installed in parallel in a fit for purpose bulkhead,
capable of running four primary fans. The operating parameters of two fans in parallel are:
• Current operating fan total pressure of 975 Pa for 103mᶟ/s,
• Maximum operating fan total pressure of 2,600 Pa for 31mᶟ/s per fan.
A summary of the primary ventilation fan statistics are detailed in Table 16-2 below.
Table 16-2: Primary ventilation fan details
Fan Location Fan Type Quantity Installation
Type Operating
Pressure (Pa) Total
Airflow (mᶟ/s) Fan Shaft
Power (kW)
950 Cuffley RAW Clemcorp
CC1400 MK4 110kW
1 Parallel 343
56 110
957 Youle RAW Clemcorp
CC1400 MK4 110kW
2 Parallel 975
103 110

Mandalay Resources - Costerfield Property NI 43-101 Technical Report
D E F I N E | P L A N | O P E R A T E 266
16.4.3.1 January 2022 Ventilation Survey
The latest ventilation survey, conducted in January 2022, measured total primary airflow at
162m3/s within the Costerfield Property underground mine. This survey was conducted with
a total of 3 primary fans operating:
• One in Cuffley at a fan total pressure of 343 Pa,
• Two primary fans in Youle, which recorded a fan total pressure of 975 Pa.
All airflow velocities measured throughout the mine are currently measuring under 6m/s.
There were also no temperature readings recorded above 27° wet bulb, showing that the
primary circuit has no areas of concerns due to heat.
Figure 16 11 below details the airflow measurements from the ventilation survey conducted
in January 2022. This demonstrates how the primary circuit is split between the different
areas of the mine throughout Augusta, Cuffley, Brunswick and Youle with a balance between
the intakes and exhausts.

Mandalay Resources - Costerfield Property NI 43-101 Technical Report
D E F I N E | P L A N | O P E R A T E 267
Table 16-3: Primary ventilation records, January 2022 survey

Mandalay Resources - Costerfield Property NI 43-101 Technical Report
D E F I N E | P L A N | O P E R A T E 268
16.4.4 Secondary Ventilation Auxilliary Fans
The Costerfield Property is currently adopting a secondary ventilation strategy utilising single
and twin stage Clemcorp and Zitron fans no larger than 1200 mm diameter. Secondary fan
selection is determined by:
• The dimensions of the excavation,
• The rate of extraction,
• Diesel equipment requirement,
• The length of ventilation ducting,
• The primary airflow available,
• Maintaining a minimum air velocity of 0.5m/s where diesel equipment operates.
The secondary ventilation ducting used at the Costerfield Property consists of ventilation bag
with diameters of:
• 1,400 mm,
• 1,220 mm,
• 1,075 mm,
• 605 mm twin duct.
Generally, 55 kW single or twin stage fans are utilised to ventilate level access and ore drives.
Twin stage fans are used when ore drives are scheduled to extend further than typical
development. Capital decline development is ventilated by a 75 kW twin stage fan and
1,400 mm diameter ducting.
A standard secondary ventilation installation for an operating level in Youle is shown in Figure
16-11. The installation includes a fan placed in primary flow above a working level access
which ventilates three ore drive levels and six ore drive headings. Ventilation chokers are
utilised in all levels for when additional flow may be required in other areas on the same
secondary system. The return air from the ore drives joins the primary flow on the decline
and continues to the Youle RAW.

Mandalay Resources - Costerfield Property NI 43-101 Technical Report
D E F I N E | P L A N | O P E R A T E 269
Figure 16-11: Standard secondary ventilation installation for Youle level access
16.5 Mine Services
16.5.1 Compressed Air
Compressed air is generated for the underground workings by the surface compressed air
plant, which is comprised of three 593 cfm compressors for an overall plant capacity is 840L/s
(1779 cfm).
Compressed air is delivered underground via a 4” HDPE ‘poly’ pipe run through the mine
development, with each level supplied from the decline via 2” HDPE piping. Air receivers have
been placed at the Brunswick 1,006 mRL and Stockpile 5 Youle to increase the system
efficiency. Compressed air is used to power pneumatic equipment and/or activities including:
• Airleg drills for miscellaneous bolting activities,
• Pneumatic ammonium nitrate-fuel oil (ANFO) loaders,
• Blast-hole cleaning/prepping for development rounds,
• Diaphragm air pumps,
• Long-hole cleaning/prepping.

Mandalay Resources - Costerfield Property NI 43-101 Technical Report
D E F I N E | P L A N | O P E R A T E 270
16.5.2 Raw Mine Water
Raw mine water is sourced from the Augusta Mine Dam located on the Augusta site, and
water is delivered to the underground workings through two separate supply lines. The
Augusta and Cuffley areas of the mine are suppled from header tanks at the Augusta portal
via 4” HDPE pipe run through mine development. Youle and Brunswick are supplied via a
service-hole connected to a header tank on surface at the Brunswick site. Pressure reducer
valves are installed in the water supply lines at 60 m vertical intervals to manage the water
pressure underground.
The Augusta Mine Dam is fed directly from the rising main that extends from the Cuffley 945
Pump Station.
16.5.3 Dewatering
Dewatering of the underground workings is managed through a series of collection sumps
that report to various pump stations throughout the mine. From the intermediate pump
stations and sumps, ground water reports to the bottom of the 4800 decline Settlement Sump
via gravity for silt management. From the 4800 decline the water is pumped to the
underground Cuffley 945 Pump Station where it is discharged via the Rising Main to the
surface storage dams.
16.6 Backfill
The practice of placing CRF in stope voids has been undertaken in Cuffley, Augusta, Brunswick
and Youle to improve local ground stability, reduce unplanned dilution and improve mining
recoveries. CAF fill is also selectively utilized as an alternative to CRF in Youle for improved
confinement and stability in flat dipping stopes. Loose rockfill is placed as backfill in stopes
where the filled void will not be exposed by an adjacent stope. Loose sand fill is used on a
limited basis where a low slump material is required to fill voids that cannot be filled
adequately with CAF or CRF. The use of paste fill was also considered as a possible alternative,
but it was found that the tailings from the Brunswick Processing Plant were unsuitable for
backfill purposes due to the high moisture, clay content and cost considerations.
The CRF uses waste rock sourced from development with the addition of a cement slurry mix
that results in a final product composing of 4% cement. CAF uses waste rock that is screened
to a smaller diameter aggregate, with the addition of a cement slurry to form a final product
composing of 8% cement.
Dry cement is stored on surface at the Brunswick site in a cement silo on contract by Mawson
Concrete. The dry cement is delivered underground to mixing bays via an Iveco Acco 2350
cement truck. At the mixing bay, the dry cement is hydrated and dumped by the cement truck
to be mixed with waste rock in varying size batches using a Caterpillar 1700G loader.

Mandalay Resources - Costerfield Property NI 43-101 Technical Report
D E F I N E | P L A N | O P E R A T E 271
Once mixed, the cemented fill is trammed to the fill point of the open stope using a Toro 151
or Sandvik LH203 loader. A bund is placed at an appropriate distance from the top of the
stope to minimise potential for loader to overbalance or drive into the stope void. Care is
taken during placement of the fill that the mesh tube is not displaced which is secured by
chains during the filling process.
The quality of the cemented fill is ensured by the use of a PLC control at the cement batching
plant and standardised bucket filling of the waste rock. Records are kept of batch quantities
for all batches.
The nominal curing time before firing the adjacent stope is 24 hours. After 12 hours, the rock
bund placed at the brow of the stope can be removed in preparation for drilling and/or
charging the adjacent stope panel.
The cemented fill methods have proved effective in minimising dilution during subsequent
panel extraction as well as providing better ground stability and has improved recovery by
eliminating the requirement for rib pillars.
16.7 Mineral Reserve Schedule Assumptions
The Mineral Reserve schedule was completed using the assumed mining rates shown in Table
16-4. Total development and production rates are constrained by the combination of
development headings or stoping fronts available at the one time and the resources available.
Table 16-4: Schedule assumptions
16.7.1 Equipment Requirements
The existing development, production and auxiliary underground equipment fleet will
continue to be used, where applicable, with additional equipment purchased to meet the
planned replacement schedule or meet increased production demands.
The existing mobile equipment fleet is summarised in Table 16-5.
Description Value
Operating Dev m advance/cut 1.8
Max. Operating Dev m/mth/heading 40
Max. Total Operating Dev m/mth 350
Capital Dev m advance/cut 3.7
Max. Capital Dev m/mth/heading 170
Max. stope tonnes/mth/heading 700-1,000
Max. Total stope tonnes/ mth 10,000

Mandalay Resources - Costerfield Property NI 43-101 Technical Report
D E F I N E | P L A N | O P E R A T E 272
Table 16-5: Underground mobile equipment fleet
Equipment Type Equipment Model Existing Fleet
Single-Boom Jumbo Resemin Muki FF 3
Production Drill Resemin Muki LHBP 2R 2
LHD - Loader CAT R1700G 2
LHD - Loader Toro 151-D 3
LHD - Loader Sandvik LH203 4
Haulage Truck Atlas Copco MT436 1
Haulage Truck Epiroc MT42 1
Cement Agi Jacon Transmixer 5003 1
Cement Truck Iveco Acco 2350 1
Telehandler Dieci 33.11 2
Service Tractor Carraro TN5800 5
Light Vehicle Toyota Land Cruiser 14
Light Vehicle Kubota 4x4 Utility 7
Total 46
16.7.2 Personnel
An existing core group of management, environmental, technical services (Engineering,
Survey, Geology), administration, maintenance, supervisory, and production personnel
continue to operate at the Costerfield Property. As a residential operation, all employees
commute daily from their place of residence.
Level access capital development in Youle is currently completed by a contractor using their
own twin-boom jumbo and Normet charge rig.
16.7.2.1 Shift Schedule
The Costerfield Property functions a continuous mining operation, 24 hours a day, 365 days
per year. Operators and maintenance personnel work 11-hour shifts, seven days on, seven
days off, alternating between dayshift and nightshift.
Augusta support staff work a standard Australian working week of five days on, two days off,
eight-hours per workday.
All on-costs for annual/ sick leave and training have been estimated in the direct and indirect
operating costs respectively.

Mandalay Resources - Costerfield Property NI 43-101 Technical Report
D E F I N E | P L A N | O P E R A T E 273
16.7.2.2 Personnel Levels
All equipment has been assigned with one operator per crew per machine where applicable.
Cross-training occurs for all operators, ensuring that each shift panel is adequately multi-
skilled to cover for any unplanned sickness, annual leave and general absenteeism.
The current personnel numbers for the Mandalay Resources workforce totals 218 employees.
16.8 Schedule Summary
A summary of the key physicals in the Mineral Reserve schedule is presented in Table 16-6.
Table 16-6: Summary of schedule physicals
Description Units Quantity
Capital Development m 797
Operating Development (Waste) m 9,852
Operating Development (Ore) m 9,378
Development Ore Tonnes tonnes 173,318
Development Ore Grade Au g/t 7.5
Development Ore Grade Sb % 0.8
Stoping Ore Tonnes tonnes 590,069
Stoping Ore Grade Au g/t 13.5
Stoping Ore Grade Sb % 2.8
Total Ore Tonnes tonnes 763,386
Total Ore Grade Au g/t 12.2
Contained Au ounces 298,295
Total Ore Grade Sb % 2.4
Contained Sb tonnes 18,235
Opening Stocks
ROM Ore Tonnes tonnes 41,443
ROM Ore Grade Au g/t 10.1
ROM Ore Grade Sb % 3.3

Mandalay Resources - Costerfield Property NI 43-101 Technical Report
D E F I N E | P L A N | O P E R A T E 274
Note:
Ore tonne totals differ from reported Reserve tonnes. The Reserve schedule includes mining of inferred and below cut-off grade
development (assigned zero grade) to access proven and probable material.

Mandalay Resources - Costerfield Property NI 43-101 Technical Report
D E F I N E | P L A N | O P E R A T E 275
17 RECOVERY METHODS
17.1 Brunswick Processing Plant
The Brunswick Processing Plant treats an antimony and gold rich sulphide ore through a
conventional comminution and flotation style concentrator. It has been operating since 2007,
and by Mandalay Resources since late 2009. Since then, several plant upgrades have resulted
in production capacity increases to the current rate of approximately 13,000 t/month over
the 2015 to 2021 calendar years. The concentrator operates 24 hours per day, 7 days per
week, while crushing operates under noise restriction guidelines during extended dayshift
hours.
The surface crushing and screening facility processes underground feed down to a particle
size range suitable for milling through a two-stage, closed circuit ball milling circuit.
Centrifugal style gravity concentrators are used on the combined primary milling product and
secondary mill discharge to recover a gold-rich gravity concentrate. This is upgraded further
over a shaking table and sold as a separate gold concentrate product which is transported to
local refineries.
Secondary milled products are classified according to size and processed through a simple
flotation circuit comprising of two StackCell® roughers, two additional rougher tank cells
followed by the original flotation train rougher, scavenger and single stage cleaning. Two
CavTube® flotation columns were added to the tailings end of the existing flotation circuit and
were successfully commissioned in April 2021.
The flotation concentrate is dewatered through thickeners and with filtration to produce a
final antimony-gold concentrate product which is bagged, packed into shipping containers
and shipped to customers overseas. The flotation tailings are thickened before being pumped
to one of two tailings storage facilities (TSFs) with one located to the east and one to the north
of the Brunswick Processing Plant.
The Brunswick Processing Plant flowsheet is a simple, conventional, well-proven circuit with
more than 14 years of operation and is suited to processing of the Costerfield ores remaining
in the Life of Mine (LoM) plan. A summary processing flowsheet has been provided in Figure
17-1.
Further incremental plant upgrades scheduled for 2022 include a second filter press (or an
alternate filtration technology) in order to build redundancy around concentrate filtration. A
third impact crusher (Finlay I-140RS) is to be purchased in early 2022 and thereafter crushing
will become a two-stage operation as opposed to the current single stage configuration.
These upgrades have not yet been initiated.

Mandalay Resources - Costerfield Property NI 43-101 Technical Report
D E F I N E | P L A N | O P E R A T E 276
Figure 17-1: Brunswick Processing Plant Summary Flowsheet

Mandalay Resources - Costerfield Property NI 43-101 Technical Report
D E F I N E | P L A N | O P E R A T E 277
17.1.1 Crushing and Screening Circuit
The crushing and screening plant consists of a primary crushing circuit in closed circuit with a
12 mm vibrating screen. It uses a duty and a standby diesel-powered Finlay I-130RS mobile
impact crusher. Having two crushing units provides additional capacity and crushing circuit
redundancy. Crushed ore is conveyed to two 120 tonne fine ore bins operating in parallel.
The crushing and milling circuit have a demonstrated average throughput capacity of 13,000
dry metric tonnes (dmt) per month.
17.1.2 Milling Circuit
Crushed ore is reclaimed from the fine ore bins which both discharge onto the primary mill
feed conveyor and feed into the milling circuit. The milling circuit comprises two ball mills in
series, both operating in closed circuit. The primary mill operates in closed circuit with a
Dutch State Mines (DSM) screen, with the screen oversize returning to the primary mill for
further grinding and the screen undersize being fed to a centrifugal style gravity concentrator.
This recovers a small mass of high-grade gold concentrate that is sent to the gold room for
further gravity upgrading using a shaking table. The final gravity concentrate is sent directly
to a local gold refinery as a separate saleable product. The gravity gold production varies but
recoveries from the Youle feed are typically around 40 to 50% and can be as high as 55% of
the gold delivered in the feed. The gravity tailings are pumped to classifying hydrocyclones
(cyclones) with the overflow going to feed for the flotation plant. The underflow is returned
to the secondary ball mill for further grinding. The milling circuit has a target grind size P80 of
60 µm. The secondary ball mill discharge is combined with the DSM screen undersize so is
also fed to the centrifugal gravity concentrator.
17.1.3 Flotation Circuit
The flotation circuit is designed to recover an antimony-gold rich sulphide concentrate. The
flotation circuit is fed from the secondary ball mill cyclone overflow. The cyclone overflow is
fed to a conditioning tank where lead nitrate, an activator and potassium amyl xanthate
(PAX), (a collector), are added. The conditioning tank feeds two 48 inch flotation StackCells®
currently operating in series with two site fabricated rougher tank style flotation cells again
in series. The StackCell® and rougher tank cell concentrates are combined with the final
cleaner concentrate as the final product.
The rougher tank cell tailings flow to the original flotation circuit. This consists of eight square
Denver DR100 cells for the remaining rougher and scavenging duties, followed by six Denver
DR15 cells used for cleaning duties. The concentrate from the Denver rougher flotation cells
is pumped to the cleaner flotation cells while the tailing becomes feed for the scavenger
flotation cells. The concentrate from the scavenger flotation cells is recycled to the feed of
the Denver rougher flotation cells while the scavenger tailing is pumped to the tailings
Mandalay Resources - Costerfield Property NI 43-101 Technical Report
D E F I N E | P L A N | O P E R A T E 278
thickener. The concentrate from the cleaner flotation cells is pumped to the concentrate
thickener while the cleaner tailing is also recycled to the rougher flotation cells.
Following the Denver scavenger cells, rougher and cleaner CavTube® column flotation cells
have been installed. These were supplied by Eriez and were commissioned in April 2021. They
produce a separate low-grade antimony-gold concentrate. The first stage of this circuit, the
rougher column tail, has now become the final tail stream. The flotation circuit effectively
recovers the antimony and any gold not collected in the gravity gold circuit.
17.1.4 Concentrate Thickening and Filtration
Product from the Final Concentrate, the combined StackCell® and tank rougher cell products
and the Cleaner flotation products are all pumped to Concentrate Thickener 1. Product from
the CavTube® cleaner concentrate is pumped to Concentrate thickener 2. The thickened
underflow is pumped directly to a plate and frame pressure filter for final dewatering.
The concentrate filter cake is discharged directly into concentrate bags. The filtrate is
recycled to the concentrate thickener while the concentrate thickener overflow is recycled
back to the plant as process water to maximise water re-use and minimise concentrate losses.
An additional smaller concentrate thickener was installed in late 2019 to increase the
dewatering capacity of the flotation plant concentrate.
17.1.5 Tailings Circuit
The flotation circuit tailings are settled in a thickener. The tailings thickener overflow is
recycled back to the plant as process water and the thickened solids are pumped to a TSF
where it is discharged via a conventional spigot system. Any additional water from the tailings
is decanted and pumped back to the plant for use as recycled process water.
17.1.6 Throughput
The Brunswick Processing Plant has a throughput capacity of up to 14,000 dmt/month but
typically averages closer to 13,000 dmt/month. Since operations commenced, the plant has
demonstrated ongoing production creep, from around 5,000 t/month achieved in January
2012 to its current status.
Annual plant throughput has been matched to mining rates in recent years as the
underground mine production has at times limited the available mill feed. Average plant
throughput budgeted for 2022 is 12,688 dmt/month. The forecast production rates are well
supported by consistent historical production over several years as well as ongoing plant
upgrades and debottlenecking projects. Average throughput was 12,867 dmt/month,
12,647 dmt/month, 12,979 dmt/month, 11,900 dmt/month, 12,536 dmt/month and

Mandalay Resources - Costerfield Property NI 43-101 Technical Report
D E F I N E | P L A N | O P E R A T E 279
12,123 dmt/month between 2016 and 2021 respectively. The moderate fall in 2019 was
largely due to restrictions in plant feed supply.
There is currently approximately 40,000 dmt of feed on the ROM pad, and for 2022 mining
volumes will be maintained at similar levels to milling volumes so as to maintain a ROM of
approximately the same size throughout the year.
Further discussion of historical production and forecast LoM plant throughput on the current
ore feed blend is provided in Section 13.
17.1.7 Metallurgical Recovery
Simple head grade versus recovery relationships have been developed for both antimony and
gold using plant operating data (Figure 17-2). The gold head grade versus tailings grade
recovery relationship has used the 2021 daily production data, although this can generate
some daily fluctuations associated with gravity gold content. The data set used is between
April 2021 and December 2021. Previously a more expansive data set has been used, as far
back as 2015, however with the changes made to the flotation circuit completed in April
improving the plant performance and enhanced gold recovery, particularly the StackCell® and
CavTube® flotation cells, and the treatment of Youle-only feed, it is justified to remove the
older Brunswick ore data from 2015 to 2020 that had previously been included.
Similarly, the antimony recovery algorithm has been updated due to the circuit modifications
and processing of Youle ores only. The daily operational data for January to December 2021
has been used. The difference between the full year dataset and April to December 2021 is
arbitrary.

Mandalay Resources - Costerfield Property NI 43-101 Technical Report
D E F I N E | P L A N | O P E R A T E 280
Figure 17-2: Plant Gold Recovery Improvement with Changing Feed Source from Brunswick to Youle – 2018 to 2021
Forecast antimony and gold recoveries used for LoM planning, budgeting and economic
modelling are based on these recovery relationships. This is the best method of forecasting
recovery when processing a similar feed blend. These algorithms are updated annually.
Based on these algorithms, the forecast average LoM 2022 recoveries are 94.1% and 92.7%
for antimony and gold respectively. These are not dissimilar to the 2021 end of year (EOY)
reconciled plant recoveries of 94.6% Sb and 93% Au.
The recovery relationships are well understood and are appropriate for metallurgical recovery
estimation purposes. They are supported by historic concentrator recoveries at similar feed
grades and compare well to previous grade/recovery relationships on Youle feed and other
similar ores. Further recovery confidence is provided by the consistent recoveries of both
antimony and gold achieved over a number of years across a range of feed grades. Full details
have been provided in Section 13 of this report.
17.2 Services
17.2.1 Water
The water services at the Brunswick Processing Plant consist of the raw water, process water
and excess water disposal systems. The process water supply consists of concentrate
thickener overflow, tailings thickener overflow and TSF decant return water.

Mandalay Resources - Costerfield Property NI 43-101 Technical Report
D E F I N E | P L A N | O P E R A T E 281
Most of the raw make-up water is provided by dewatering of the underground operations at
approximately 1.5 ML/day to 2 ML/day. The plant operates with a positive water balance
with excess water requiring disposal. Mandalay constructed a 2 ML/day permeate reverse
osmosis (RO) plant at the Brunswick Processing Plant in 2014. The 2 ML/day plant has
remained in operation as per regulatory approvals. A pre-treatment plant to feed the RO
plant was installed in 2017. This has enhanced the robustness of the RO operation, limiting
downtime and reducing consumables consumption.
The Splitters Creek evaporation facility has the capacity to treat approximately 104 ML/year
net (evaporation minus rainfall) and treats the bulk of the excess water. Aquifer Recharge
(AR) is being used as an additional water disposal method and has been trialled successfully
during 2017 through to 2021.
The TSF and process water is stored in and distributed from a dedicated tank system. As the
site has a positive water balance due to underground dewatering, adequate process water
supplies are available to meet the LoM requirements.
17.2.2 Air
The Brunswick Processing Plant requires both low pressure (LP) and high pressure (HP) air
supplies. Currently, three separate LP blowers supply the rougher, scavenger and cleaner
cells, with the existing tank cells running off HP air.
The HP air supply was upgraded to a variable speed compressor in 2017 in order to increase
the capacity and availability of high-pressure air and reduce the shock load on the power
supply on start-up of the fixed speed compressor units. The pressure filter also runs off high
pressure air.
The processing facility has adequate air to meet the LoM requirements and no current
upgrades are required or planned.
17.2.3 Power
Due to the need for additional electrical power for the development of the Brunswick and
Youle underground orebodies, upgrades to the power supply and reticulation circuits were
completed in 2019. This involved consolidating three separate incoming sources of electrical
supply into a single supply source and distributing electrical power from that single point.
This has allowed for greater efficiencies through minimising losses from each supply point and
also allows additional local site back-up generation to occur from a single point.
This has simplified starting and stopping of supplementary site diesel fired power depending
on the demand. The mill and RO plant will continue to be powered from this single point.

Mandalay Resources - Costerfield Property NI 43-101 Technical Report
D E F I N E | P L A N | O P E R A T E 282
There is also provision for additional power demand for the mill up to 2 kVA (refer to
Section 18).
Further improvements to electrical switchboard controls have been ongoing in order to
remove local power boards and relocate them to a central location. This electrical
consolidation work will continue in 2022 in parallel with the inclusion of extra plant
mechanical equipment such as another filter press for concentrate filtering.
17.3 Plant Upgrades
The major plant upgrade in 2021 included the installation and commissioning of a second
StackCell® as well as rougher and cleaner CavTube® columns in the flotation circuit. For 2022
the budgeted major plant upgrades will include the installation of a second filter press or
alternative concentrate filtration technology, as well as the purchase of another impact
crusher.
Further details of recent plant upgrades in each processing circuit are provided in the
following sub-sections.
17.3.1 Crushing and Screening Circuit
A mobile crusher trial in 2012 identified significant improvements to the throughput of the
Brunswick Processing Plant. A larger portable crushing unit later become a permanent
component in the process flowsheet configuration. Another mobile crusher was purchased
in 2015 to allow for a duty and standby arrangement for additional capacity and redundancy.
This addition enabled average throughput to increase to over 13,500 t/month and peak
capacity of over 14,000 t/month to be reliably maintained.
In early 2022 a Finlay I-140RS mobile Impact Crusher is scheduled to be delivered to site. The
configuration of how the new crusher fits into the existing crusher circuit remains to be
determined after delivery with the new crusher initially being positioned ahead of the existing
crushers and oversize from the new crusher being fed to one of the existing crushers. A key
consideration in the configuration will be how best to manage wear through the crushing
circuit and benefit throughput during wetter months when crushed feed can become crusher
capacity constrained.
17.3.2 Milling Circuit
The milling circuit remains unchanged. The finer crushed ore feed size allows the target
throughput to be achieved. No further major work has been planned.

Mandalay Resources - Costerfield Property NI 43-101 Technical Report
D E F I N E | P L A N | O P E R A T E 283
17.3.3 Flotation Circuit
An additional flotation cell was commissioned in November 2018 and a second cell in July
2021. The two 48-inch diameter StackCell® units supplied by Eriez Flotation are installed in
front of the existing rougher tank cells. They are fed directly from the flotation conditioning
tank. The new cells increase the overall residence time and promote flotation kinetics
through their hydrodynamic design. By doing so, recoveries from the slower floating sulphide
minerals are improved. The StackCell® units have a nominal capacity comparable to that of
the existing, larger 8 m3 to 9 m3 tank cells #1 and #2.
Rougher and cleaner CavTube® column flotation cells were installed and commissioned on
the flotation tail in April 2021. This new flotation circuit on the tailings stream produces a
separate low-grade antimony-gold concentrate, which has been blended with existing plant
concentrate and sold to customers in regular shipments. The rougher column tail from this
additional circuit is the final plant tail. The new columns are sized for the full tailings slurry
capacity.
17.3.4 Concentrate Thickening and Filtration
In anticipation of higher antimony feed grades from the Youle deposit, an additional 2.4 m3
capacity concentrate thickener with rake and lift was purchased second-hand. It was installed
in the plant along with its own Verderflex product pump. An additional froth pump has been
installed to allow separate loading of the new thickener.
The additional concentrate thickener operates in parallel with current 4 metre diameter
concentrate thickener. The splitting of concentrate produced from the front StackCell® and
tank cells and the Denver cleaner cells provides an appropriate mass split between each
thickener.
Both thickeners feed the pressure plate and frame filter press in parallel. Loading and
pressing time for the filter press is not a bottleneck for production, whereas settling capacity
in the concentrate thickener can be a bottleneck at higher metal production rates and needs
to be carefully managed.
The new lower grade concentrate produced by the CavTube® column style flotation circuit
treating the tailings is dewatered on a campaign basis through the existing filter press.
17.3.5 Tailings Circuit
The tailings thickener has sufficient capacity to meet the current throughput and allows for
the changes associated with the CavTube® flotation column upgrade project. The average
tails thickener underflow solids density will be maintained at approximately 50% w/w solids
(+/- 10%).

Mandalay Resources - Costerfield Property NI 43-101 Technical Report
D E F I N E | P L A N | O P E R A T E 284
The increased capacity provided by the 2018 lift of the Bombay TSF was exhausted in August
2020. The Brunswick TSF returned to service as the replacement storage facility following the
completion of a hybrid wall lift and was used as the primary storage facility during 2021.
Capacity of the Brunswick TSF is anticipated to be exhausted in April 2022.
The Bombay facility has been undergoing pre-work for a wall lift and is planned to be available
for deposition during February/March 2022. Studies are continuing to determine the most
effective way to further increase tailings capacity through future TSF lifts to meet the full LoM
plan. Further details have been provided in Section 18.
17.3.6 Reagent Mixing and Storage
No upgrade work is required for the reagent mixing and storage area.

Mandalay Resources - Costerfield Property NI 43-101 Technical Report
D E F I N E | P L A N | O P E R A T E 285
18 PROJECT INFRASTRUCTURE
The infrastructure associated with the Costerfield Property consists of surface, underground,
tailings storage, power and water supply, waste rock storage, diesel storage, explosives
storage, maintenance and housing facilities.
18.1 Surface Infrastructure
The Costerfield Property’s surface infrastructure facilities are typical of a conventional
flotation style concentrator and underground mining operation of this size.
18.1.1 Augusta Mine Site
The Augusta Mine site comprises the following infrastructure which is also referenced in
Figure 18-1:
• Office and administration complex, including change house,
• Store and laydown facilities,
• Heavy underground equipment workshop,
• Evaporation and storage dams,
• Temporary surface waste rock stockpile area,
• Augusta Mine box-cut and portal,
• Ventilation exhaust raise,
• Ventilation intake raises,
• Mine water recirculation dam and silt settlement channel,
• Exploration drilling contractor offices and workshop; and
• Capital development contractor workshop.

Mandalay Resources - Costerfield Property NI 43-101 Technical Report
D E F I N E | P L A N | O P E R A T E 286
Figure 18-1: August Mine Site – aerial view
18.1.2 Brunswick Mine Site
The Brunswick site comprises the following infrastructure, refer to Figure 18 2:
• Gold-antimony processing plant and associated facilities;
• Central administration complex;
• Process plant workshop;
• Tailings storage facilities;
• Run of Mine (ROM) stockpiles;
• Waste rock stockpiles;
• Reverse Osmosis (RO) Plant capable of treating 2 ML of water per day;
• Previously mined Brunswick Open Pit;
• Brunswick mine portal and backfill cement silo;
• Brunswick Primary Ventilation Raise;
• Youle Primary Ventilation Raise and

Mandalay Resources - Costerfield Property NI 43-101 Technical Report
D E F I N E | P L A N | O P E R A T E 287
• Exploration Geology offices, Core farm and core processing facility.
Figure 18-2: Brunswick Mine Site – aerial view
18.1.3 Splitters Creek Evaporation Facility
The Splitters Creek Evaporation Facility is situated on a 30 ha parcel of land that is located
approximately 3 kilometres from the Augusta site and lies within mining lease MIN 5567. The
Facility facilitates the evaporation of a combination of groundwater extracted from the
Costerfield Property mines and brine which is a bi-product of Reverse Osmosis (RO) filtration
plant. The Facility enables underground dewatering rates to be maintained ahead of mining
operations.
The evaporation facility site comprises the following:
• 150 ML storage dam;
• 40 ML evaporation terraces;
• Recirculation pumping system that directs water from the storage dam to the
evaporation terraces;
• Splitters Creek rising main that feeds water from the Augusta Mine Dam to the
evaporation terraces; and
• Leakage detection system on the Splitters Creek rising main.

Mandalay Resources - Costerfield Property NI 43-101 Technical Report
D E F I N E | P L A N | O P E R A T E 288
In 2020 permits were amended and approved to allow brine to be discharged to the Splitters
Creek Evaporation Facility.
18.1.4 Margarets Aquifer Recharge Borefield
The Margarets Aquifer Recharge Borefield is located approximately 1km south of the Augusta
operations. Aquifer recharge infrastructure at the Margarets borefield includes two injection
bores that are licensed to dispose of 730 ML of mine wastewater via injection into the
Margaret’s Aquifer over an operational period of 24 months.
18.2 Underground Infrastructure
The underground infrastructure at the Costerfield Property is typical of an underground
mining operation.
18.2.1 Secondary Means of Egress
The secondary means of egress consists of a ladderway system that connects all underground
workings to the surface in parallel with the main development declines. The ladderway
system comprises:
• The Augusta ladderways from Surface to the 900 mRL within the Augusta underground
workings;
• The Cuffley ladderways extend from the Cuffley Incline, Cuffley Decline and 4800
Decline to the 945 mRL. From the 945 mRL level, extraction is performed via the
Cuffley Primary Ventilation Shaft in an emergency gig.
• The Brunswick ladderways which are mined between every second operating level
cross-cut allowing a secondary means of egress parallel to the main decline travel way
to the 1056 Fresh Air Base, where the emergency gig can be landed for final extraction
to surface
• The Youle ladderways are mined between every operating level of the Youle
development with the exception of the 947, 957 and 967 Levels. These ladderways
allow a secondary means of access to the bottom of the Youle Primary Ventilation
Shaft. The 947, 957 and 967 levels have secondary access to the bottom of the Youle
Primary Ventilation Shaft via the Youle decline and parallel return airway
development. The emergency gig can also be operated in the Youle Primary
Ventilation Shaft to allow extraction of personnel from this point if required.
• The emergency gig attaches to a standard crane hook and hoists personnel in an
emergency up and down the Cuffley Primary Ventilation Shaft using a 200-tonne

Mandalay Resources - Costerfield Property NI 43-101 Technical Report
D E F I N E | P L A N | O P E R A T E 289
mobile crane as the hoist. The emergency jig is capable of evacuating 5 persons or 600
kg (120 kg per person) at a time;
18.2.2 Refuge Chambers and Fresh Air Bases
Six underground refuge chambers and two permanent fresh air bases (FABs) are strategically
placed within the mine to mitigate hazards posed by irrespirable atmospheres and
entrapment.
The capacity of the refuge chamber required is dictated by the number of personnel planned
to be working in the immediate vicinity serviced by the refuge chamber. The position of the
refuge chamber facilities enables all personnel to be within 750 metres of a refuge chamber,
as recommended in the Western Australian ‘Refuge Chambers in Underground Metalliferous
Mines’ Guideline (Department of Mine and Petroleum, 2013).
It is not intended for refuge chambers to substitute a secondary means of egress, but to
provide refuge during an incident where the underground atmosphere is irrespirable or when
ladderways may be inoperative or inaccessible.
The refuge chambers and FABs are located in:
• The Brunswick workings has a 10-man refuge chamber located at stockpile #4 in the
Brunswick access, a 16-man refuge chamber on the 1006 level (RL) and a FAB at the
1056 Vent Access.
• The Youle workings has a 20-man refuge chamber located at stockpile 10, a 16-man
refuge chamber located at the 807 Refuge Chamber Cuddy and a 20-man refuge
chamber at the 687 Refuge Chamber Cuddy.
• The 4-man refuge chamber is a travelling chamber that may be positioned in areas not
serviced by fixed refuge chambers if the need arises.
18.2.3 Compressed Air
The existing compressed air plant comprises three 593 cfm compressors. The overall plant
capacity is 840 L/s (1779 cfm). Compressed air is delivered underground via a 4-inch HDPE
‘poly’ pipe. Each level is then supplied from the decline via 2-inch HDPE piping.
Air receivers have been placed at the Brunswick 1006 mRL and stockpile 5 Youle to increase
the system efficiency. Compressed air is used to power pneumatic equipment and/or
activities including:
• Airleg drills;

Mandalay Resources - Costerfield Property NI 43-101 Technical Report
D E F I N E | P L A N | O P E R A T E 290
• Pneumatic Ammonium Nitrate-Fuel Oil (ANFO) loaders;
• Blasthole cleaning/prepping for development rounds;
• Diaphragm air pumps; and
• Long-hole cleaning/preparation.
18.2.4 Ventilation System
The primary ventilation infrastructure currently consists of five fresh air intakes and two
primary exhaust shafts. The fresh air intake system consists of the following :
• Augusta Portal which has 56 m³/s (of air) entering the portal,
• Augusta Fresh Air Intake (FAI) which is a series of air leg rises from the surface to the
1020 Level (RL) in the Augusta workings, contributing 12 m³/s of air flow,
• The Augusta Fresh Air Rise (FAR) is a 150 m vertical raisebore shaft from surface to the
1020 Level in the Augusta workings. The Augusta FAR is 3m diameter and
approximately 11 m³/s of fresh air enters the mine through this shaft,
• Brunswick Fresh Air Rise (FAR) is a 230m, 3.5m diameter, vertical raise bore shaft from
the surface to the 956m RL in the Brunswick workings. The shaft is currently backfilled
with waste rock up to the 1056m RL. Approximately 3m³/s enters the mine through
the Brunswick FAR, which is currently regulated to 98% closed. The air flow through
the Brunswick FAR supplies adequate air flow to the 1056 FAB which serves as a
refuge point in the event of an emergency.
• Brunswick Portal is a 5mW x 5mH arched profile which reduces to 4.5mW x 4.8mH
after approximately20m of development. The Brunswick Portal allows 83m3/s of fresh
air to enter the mine under the current configuration.
The Return Air Rise (RAR) system includes:
• Cuffley RAR is a 230m, 3m diameter, vertical raise bore shaft from surface to the 950
Return Air Way (RAW). The Cuffley primary fan chamber is positioned at the bottom
of this shaft, which is capable of running three single stage Clemcorp CC1400 Mk4 fans
driven by 110kW motors. The three fans are installed in a fan bulkhead in parallel.
Currently, the primary ventilation is configured such that only one of the three primary
fans at the Cuffley primary fan chamber is required to operate. The Cuffley RAR
exhausts 54 m3/s from the mine workings.

Mandalay Resources - Costerfield Property NI 43-101 Technical Report
D E F I N E | P L A N | O P E R A T E 291
• Youle RAR is a 232m, 4m diameter, vertical raise bore shaft from surface to the 957
RAW. The Youle primary fan chamber is positioned at the bottom of this shaft which
is capable of housing four single stage Clemcorp CC1400 Mk4 fans driven by 110kW
motors. The four fans are installed in a fan bulkhead in parallel. Currently, the primary
ventilation is configured such that only two of the four primary fans at the Youle
primary fan chamber are required to operate. The Youle RAR exhausts 103m3/s.
The primary ventilation flow is distributed through the mine using secondary fans positioned
in areas of primary air flow that force ventilate the active development and stoping levels as
required.
18.2.5 Dewatering System
The process of dewatering in advance of the mining level development is achieved by leaving
diamond drill holes drilled from underground open to drain. Due to the fractured nature of
the aquifer, the groundwater inflows are not predictable. Total mine inflow for the active
workings is approximately 1.5 ML per day.
In order to manage silt, all inflowing ground water is pumped, or gravity fed to the 4800
Decline Silt Settlement Sump. Clarified water is transferred from the 4800 Pump Station
(comprising two duty and one standby WT084 Wear Tuff Mono Pumps), to the 945 Pump
Station and Rising Main infrastructure (comprised of four WT088 Wear Tuff Mono Pumps)
where it is discharged to surface storage and transfer dams.
The Cuffley, 4800 and Augusta workings are all gravity fed systems to feed the 4800 Decline
silt settlement sump.
Brunswick has a series of sumps connected by gravity fed drain holes that feed into the decline
sump at the 956mRL, a 20kW pump transfers water from this sump to the 4800 Decline Silt
Settlement Sump.
Youle has a series of sumps connected by gravity fed drain holes that feed into two linked
pump stations, (each comprising one duty and one standby WT084 Wear Tuff Mono Pump),
located at the 897mRL and 777 mRL pump stations. A third pumping station at Youle is under
construction at 657mRL. It also comprises two WT084 wear tuff mono pumps in duty/standby
configuration.
The Rising Main extends to the mine dam. From here water is distributed, to the RO water
treatment facility or to the Splitters Creek evaporation facility.

Mandalay Resources - Costerfield Property NI 43-101 Technical Report
D E F I N E | P L A N | O P E R A T E 292
18.2.6 Other Underground Infrastructure
An underground crib room is positioned at the 957 mRL Youle and the underground magazine
is positioned at the 955 mRL Cuffley Incline. The magazine allows for the safe storage of mine
explosives.
In addition to fixed plant, Mandalay owns, operates and maintains a full underground mining
equipment fleet including production drills, loaders, trucks, jumbos and ancillary equipment
required to undertake ore development and production operations.
18.3 Tailings Storage
Two tailings dams are currently in operation comprising the Bombay Tailings Storage Facility
(TSF) and the Brunswick TSF.
Both TSFs were constructed based on a conventional turkeys nest type design with earthen
embankments.
Tailings are currently deposited in the Brunswick TSF, which currently has capacity to allow
tailings to be deposited until Q2 2022. Tailings storage beyond Q2 2022 will be facilitated with
the following:
• An additional lift is permitted and planned to take place on the Bombay TSF facility.
Construction of this lift is planned to commence in Q1 2022. The Bombay lift will
provide tailings storage through to Q4 2023.
• Tailings storage beyond Q4 2023 will require permitting and construction of a new TSF
facility.
18.4 Power Supply
The Costerfield Property’s electrical power is supplied by grid power and supplemented on
site, by on demand diesel fired generator sets. This is comprised of High Voltage (HV) 22 kV,
11 kV and low voltage (LV) 415 V systems.
The HV infrastructure is supplied via a 22 kV feeder from Powercor (the grid network
provider). The system then steps down this power on site to 11kV using transformers. The
11kV power is dispersed to six (6) HV substations via a network of HV cable. At the six (6) 11kV
transformers, power is stepped down further to 1kV and 415V.
The 11 kV system extends from the underground operations back to the surface to supply the
Brunswick Processes Plant where it is stepped down to 415 V from 11 kV.
The majority of site electrical power demand is provided by 3 MVA of network power with
the remainder provided through synchronised diesel fired generation on site if needed. The

Mandalay Resources - Costerfield Property NI 43-101 Technical Report
D E F I N E | P L A N | O P E R A T E 293
system’s power quality is also supported by means of an 11 kV Power Factor Correction Unit
(PFCU).
The main power system equipment on site consists of:
• Overhead powerlines,
• High Voltage substations,
• High Voltage RMU’s (Ring main units),
• High Voltage transformers,
• High Voltage PFCU,
• Three (3) synchronised generators, one (1) island mode generator,
• Site electrical power reticulation.
The operations uses between 3 MVA to 3.5 MVA of demand at any given time. The summary
Costerfield electrical power reticulation diagram is presented below in Figure 18-3.

Mandalay Resources - Costerfield Property NI 43-101 Technical Report
D E F I N E | P L A N | O P E R A T E 294
Figure 18-3: Costerfield Power Reticulation Diagram
Powercor netwoork 22kV 3mVA supply
6mVA 22kV/11kV Transformer
11kV 750kVAR Powerfactor correction
Substation 2 Underground 11kV/1kV 1mVA
Substation 4 Underground 11kV/1kV 1.5mVA
Substation 5 Underground 11kV/1kV 1.5mVA
Substation 6 Underground 11kV/1kV 1.5mVA
Substation 7 Surface 11kV/0.415kV 3mVA Process plant
Substation 8 Underground 11kV/1kV 1.5mVA
Substation 9 Underground 11kV/1kV 1.5mVA
Substation 10 Underground 11kV/1kV 1.5mVA
1.5mVA 22kV/0.415kVA Transformer
Compressor shed, Mine dam pump station, Office blocks, workshops, Undergrouns operation to 1060L
Generator supply 1.5mVA
0.415kV/22kV Transformer
Atlas Copco 550kVA Generator
Generator supply 1.5mVA
0.415kV/22kV Transformer
Atlas Copco 330kVA Generator
Atlas Copco 125kVA Generator

Mandalay Resources - Costerfield Property NI 43-101 Technical Report
D E F I N E | P L A N | O P E R A T E 295
18.5 Water Supply
Water for underground and surface operations is sourced from the Augusta Mine Dam which
is fed directly from the rising main that extends from the Cuffley 945 Pump Station to surface,
i.e. raw water is sourced from underground dewatering.
The Brunswick Processing Facility sources water from a number of sources including recycled
process water from the Brunswick and Bombay TSFs.
Potable water is trucked to site by a private contractor and is placed in surface holding tanks
for use in the change house and office amenities. Potable water for drinking is provided in 15
litre containers.
Water disposal is discussed in Section 20.1.2.
18.6 Water Management
Groundwater is currently pumped from the underground workings to the Mine Dam at a rate
of approximately 1.5 ML per day. Mine water is then pumped from the Mine Dam to either
the Splitters Creek Evaporation Facility, or a series of water treatment and disposal facilities
(located at the Brunswick site.
The Augusta Evaporation Facility comprises of three dams with a total storage capacity of 137
ML. Total site water storage capacity including smaller catchment and operational dams at
Splitters Creek, Brunswick and Augusta, is approximately 289 ML.
The water services at the Brunswick Processing Plant consists of the raw water, process water
and excess water disposal systems. The process water supply consists of concentrate
thickener overflow, tailing thickener overflow and Brunswick TSF decant return water. Whilst
the process plant utilises water from a closed circuit, make-up process water is required to
supplement water evaporated at the Brunswick TSF.
Total evaporation and water disposal capacity including discharge of RO treated water and
from the Splitters Creek Evaporation Facility and is currently estimated at 555ML per year,
assuming the long term average Heathcote climatic conditions.
Aquifer Recharge trials have been successful and the Costerfield Property has established the
Margarets Aquifer Recharge Borefield, located approximately 1km South of the Augusta
operations. The Aquifer Recharge infrastructure at Margarets includes two injection bores
and is licensed to dispose of a maximum 730 ML of mine wastewater via injection to
groundwater in the Margarets Aquifer over an operational period of 24 months.

Mandalay Resources - Costerfield Property NI 43-101 Technical Report
D E F I N E | P L A N | O P E R A T E 296
18.7 Waste Rock Storage
Waste from underground capital and operating waste development is hauled to surface at
the Brunswick site via the Brunswick portal. Surface haulage trucks shift waste from
intermediate stockpiles predominantly to the Bombay Waste Stockpile, where it is stored for
future use in Cemented Rock Fill (CRF), capital projects (e.g. Tailings dam construction) and
for rehabilitation purposes.
A small percentage of waste material hauled to surface is screened or crushed, to be used for
road base underground and Cemented Aggregate Fill (CAF). Further detail is provided in
Section 20.1.3.
18.8 Surface Ore and Waste Haulage
The completion of the Brunswick Portal Project in 2020 allowed a significant reduction in the
requirement to haul ore and waste in road registered trucks along Heathcote-Nagambie Rd.
Underground trucks now haul directly to the Brunswick Pit where a surface haulage
contractor manages the load, haul, dump operations for both Ore and Waste rock to their
respective final stockpiles.
18.9 Diesel Storage
A self-bunded diesel storage tank of 68,000 L capacity exists at the Augusta Mine site. This
diesel storage caters for all underground and surface diesel needs for Augusta.
The Brunswick site is catered by a self-bunded diesel storage tank of 65,000 L capacity.
18.10 Explosives Storage
All storage, import, transport and use of explosives is conducted in accordance with the
WorkSafe Dangerous Goods (Explosives) Regulations 2011.
Mandalay utilises its own licenced personnel and equipment to handle, store, transport and
use explosives on the Augusta site. The designated explosives supplier produces all the
explosives products off site. The ANFO is supplied in 20 kg bags, while the emulsion is supplied
as a packaged product. ANFO is primarily used for development and production purposes,
with emulsion used when wet conditions are encountered.
The current Underground Magazine is located at the 955 mRL and is operated under the
control of the designated ‘black ticket holder’ on behalf of Mandalay Resources who is the
licensee. The current Augusta Magazine licence allowances are summarised in Table 18-1.

Mandalay Resources - Costerfield Property NI 43-101 Technical Report
D E F I N E | P L A N | O P E R A T E 297
Table 18-1: Current Augusta Licence Maximum Quantities and Types of Explosives
Class Code Type of Explosive Maximum Quantity
1.1D Blasting Explosives 40,000 kg
1.1D Detonating Cord 10,000 m
1.1B Detonators 21,000 items
18.11 Maintenance Facilities
Maintenance facilities at the Costerfield Property comprise:
• A surface mine maintenance workshop facility is located adjacent to the box-cut at
Augusta. This workshop is capable of servicing all mobile UG equipment both
electrically and mechanically. The surface mine maintenance workshop also includes
a bay for an on-site boiler maker, facilities for an auto-electrician and mobile fleet
parts stores are also incorporated into this facility.
• A mine electrical workshop allows electrical maintenance of all electrical assets,
including fixed, mobile, Low Voltage and High Voltage.
• The Brunswick Processing Plant is equipped with under-cover maintenance facilities
capable of servicing fixed and mobile processing plant, including the Finlay primary
crushers. This facility also allows for fabrication works where necessary.
18.12 Housing and Land
Mandalay owns fourteen land allotments surrounding the Augusta, Brunswick and Splitters
Creek Evaporation Facility sites. Of these properties, seven have residential dwellings. The
remaining seven consist of vacant land. The residential dwellings are used as temporary
housing for company employees.
The land allotment located on Peels Lane and Costerfield South, acts as an offset area for the
Mandalay’s mining and processing activities. It has been identified that the Peels Lane Offset
has ‘the potential to generate a total of 4.35 habitat hectares’ and associated large trees
(Biosis Research, 2005).
The Peels Lane Offset was purchased as part of the Work Plan for MIN 4644 and acted as an
offset for the vegetation loss due to the construction of the Augusta Mine Site. The offset
site has also been used to meet the offset requirements for the Brunswick TSF.

Mandalay Resources - Costerfield Property NI 43-101 Technical Report
D E F I N E | P L A N | O P E R A T E 298
19 MARKET STUDIES AND CONTRACTS
The following market studies and contracts have been undertaken and/or are in place.
19.1 Antimony
19.1.1 Concentrate Transport
The concentrate is discharged directly into 1.5 tonne capacity bulk bags ready for
transportation by road train to the Port of Melbourne, for shipping to overseas markets. The
average payload of each road train is approximately 42 tonnes, and sea shipments are
scheduled at least once per month on a Cartage, Insurance, Freight (CIF) basis to the
destination port.
A third-party haulage company collects the concentrate from the Brunswick site, transports,
stores and loads the concentrate at the port.
All logistics and shipping documentation services are provided by Minalysis Pty Ltd.
19.1.2 Contracts
The antimony-gold concentrate produced from the Costerfield Property is sold directly to
smelters capable of recovering both the gold and antimony from the concentrates, such that
Mandalay Resources receives payment based on the concentration of the antimony and gold
within the concentrate.
The terms and conditions of commercial sale are not disclosed, pursuant to confidentiality
requirements and agreements.
19.1.3 Markets
The antimony price is determined through the Metals Bulletin as outlined in the contractual
agreement with the customer, in US dollars. The payable factor is dependent on the quality
and form of antimony product sold.
19.1.3.1 Global Outlook
The comments in this section are based on a review of market reports by Roskill (recently
bought out by Wood Mackenzie) and other sources as stated.
Globally, world antimony mine production in 2021 was estimated to have been between
110,000 tonnes and 120,000 tonnes of contained antimony. A further 70,000 to 80,000
tonnes is sourced through recycling product (Roskill, 2020).

Mandalay Resources - Costerfield Property NI 43-101 Technical Report
D E F I N E | P L A N | O P E R A T E 299
China continues to be the largest mining country but at a declining rate. Mining of antimony
in Russia has been steadily increasing where they are targeting up to 15% of global output
(Reuters, 2018; Figure 19-1).
Figure 19-1: Largest Antimony Producers (Roskill, 2020)
Antimony can be processed into two forms allowing the product to be used in two different
ways. In one form the metal is used metallurgically in various alloys. Because antimony has
a rare characteristic of expanding on solidifying, it can be used for strengthening of the alloy
as it increases the hardness. The addition of antimony to an alloy, even in small quantities
allows it to be used in batteries, in bullets, covering for cables, and in equipment such as
pumps and tanks. Antimony’s use in batteries comprises around 80-90% of use.
As a non-metallurgical product, antimony is used as a flame retardant and in other antimony
compounds used as paint pigments (Britannica, 2022). Non-metallurgical applications
account for around 60% of the annual consumption of antimony (Figure 19-2).

Mandalay Resources - Costerfield Property NI 43-101 Technical Report
D E F I N E | P L A N | O P E R A T E 300
Figure 19-2: Metallurgical versus Non-Metallurgical Consumption of Antimony (Roskill, 2020)
There has been little change in the consumption of non-metallurgical applications, with the
percentage of consumption remaining consistent over several years. The consumption chart
presented in Figure 19-3 is for the 2019 year however it remains basically the same as
information gathered in 2016.
Figure 19-3: Consumption of Antimony in Non-Metallurgical Applications (Roskill, 2020)

Mandalay Resources - Costerfield Property NI 43-101 Technical Report
D E F I N E | P L A N | O P E R A T E 301
Whilst consumption has remained stable, prices saw a steady increase during the latter part
of 2020, and have stabilised at the higher price during 2021 (Figure 19-4 and Figure 19-5).
According to a spokesperson with Fastmarkets Metals Bulletin these price increases have
been driven by “logistic-related supply constraints” due to COVID-19 coupled with potential
mine closures due to environmental and licencing impacts in China. The COVID-19 pandemic
has had considerable impact on the supply of antimony and the supply chain and with
relatively flat demand prices have increased.
Figure 19-4: Antimony Price Low monthly average over 5 years [Source: Fastmarkets Metals Bulletin4
4 https://dashboard.fastmarkets.com/w/g2vYKvLrTyutgZAYuebxV8/antimony
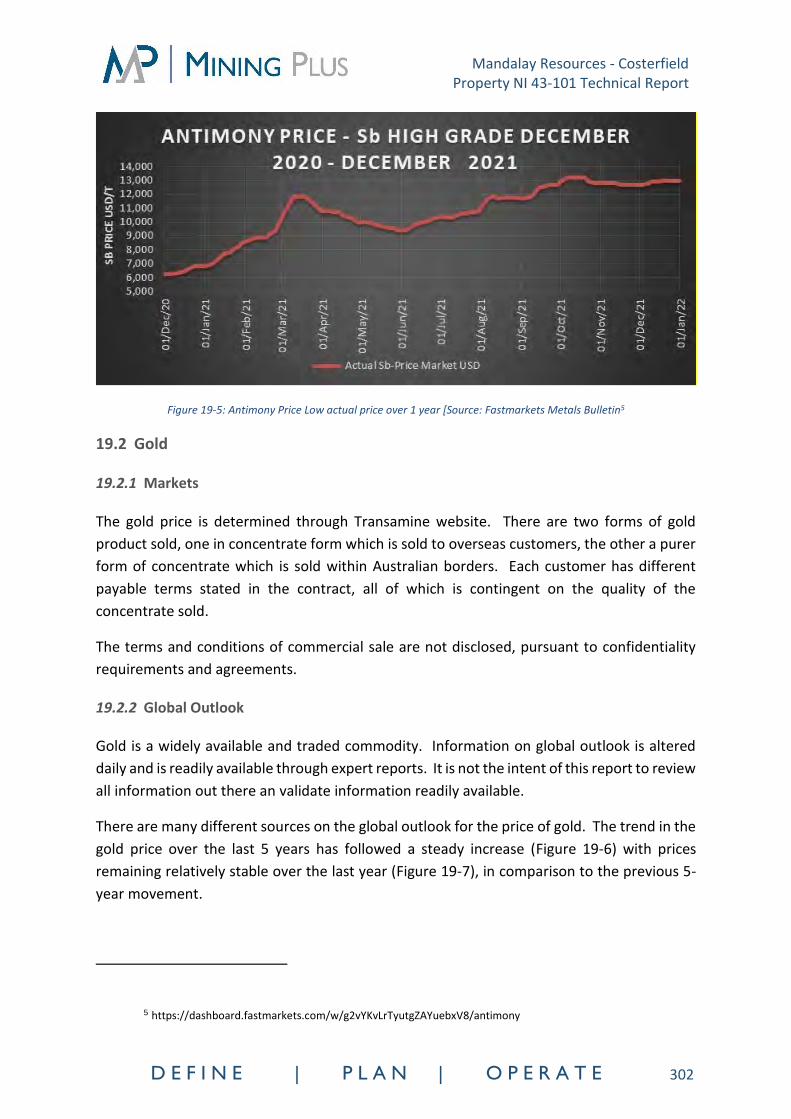
Mandalay Resources - Costerfield Property NI 43-101 Technical Report
D E F I N E | P L A N | O P E R A T E 302
Figure 19-5: Antimony Price Low actual price over 1 year [Source: Fastmarkets Metals Bulletin5
19.2 Gold
19.2.1 Markets
The gold price is determined through Transamine website. There are two forms of gold
product sold, one in concentrate form which is sold to overseas customers, the other a purer
form of concentrate which is sold within Australian borders. Each customer has different
payable terms stated in the contract, all of which is contingent on the quality of the
concentrate sold.
The terms and conditions of commercial sale are not disclosed, pursuant to confidentiality
requirements and agreements.
19.2.2 Global Outlook
Gold is a widely available and traded commodity. Information on global outlook is altered
daily and is readily available through expert reports. It is not the intent of this report to review
all information out there an validate information readily available.
There are many different sources on the global outlook for the price of gold. The trend in the
gold price over the last 5 years has followed a steady increase (Figure 19-6) with prices
remaining relatively stable over the last year (Figure 19-7), in comparison to the previous 5-
year movement.
5 https://dashboard.fastmarkets.com/w/g2vYKvLrTyutgZAYuebxV8/antimony

Mandalay Resources - Costerfield Property NI 43-101 Technical Report
D E F I N E | P L A N | O P E R A T E 303
Figure 19-6: Gold Price AM monthly average over 5 years [Source: www.transamine.com6]
Figure 19-7: Gold Price AM actual price over 1 year [Source: www.transamine.com7]
19.2.3 Resource and Reserve Pricing
This report has relied on pricing obtained from the sources stated above. For the Mineral
Reserve the gold price used is between the 3 and 5 year trailing average while for the Mineral
Resource the gold price used is the rounded sum of the Mineral Reserve price + 15%. This
calculation is also representative of the 2-year trailing average (figure 19.8).
For antimony the Mineral Reserve price is the 5-year training average, and for the Mineral
Resource is the Mineral Reserve price +15%. This calculation also is indicative of currently
6 https://www.transamine.com/price-and-review.html 7 https://www.transamine.com/price-and-review.html
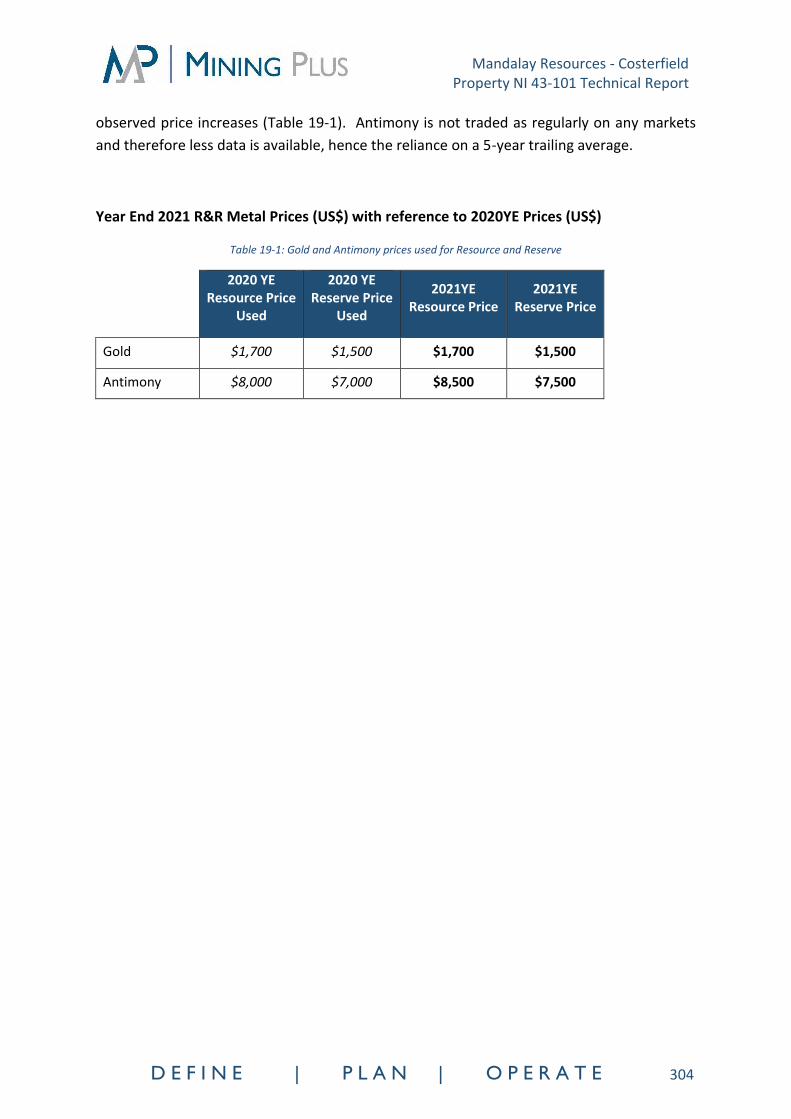
Mandalay Resources - Costerfield Property NI 43-101 Technical Report
D E F I N E | P L A N | O P E R A T E 304
observed price increases (Table 19-1). Antimony is not traded as regularly on any markets
and therefore less data is available, hence the reliance on a 5-year trailing average.
Year End 2021 R&R Metal Prices (US$) with reference to 2020YE Prices (US$)
Table 19-1: Gold and Antimony prices used for Resource and Reserve
2020 YE
Resource Price Used
2020 YE Reserve Price
Used
2021YE Resource Price
2021YE Reserve Price
Gold $1,700 $1,500 $1,700 $1,500
Antimony $8,000 $7,000 $8,500 $7,500

Mandalay Resources - Costerfield Property NI 43-101 Technical Report
D E F I N E | P L A N | O P E R A T E 305
20 ENVIRONMENTAL STUDIES, PERMITTING AND SOCIAL OR
COMMUNITY IMPACT
20.1 Environment and Social Aspects
20.1.1 Mine Ventilation
Ventilation shafts have been installed in the Cuffley, Brunswick and Youle mines to maintain
suitable air quality and volumes within the expanded underground mine.
The Cuffley ventilation shaft is located on freehold land owned by Mandalay Resources and
is an exhaust air outlet.
The Brunswick ventilation shaft is located on crown land nearby the Brunswick Processing
Plant and is a fresh air intake.
The Youle ventilation shaft is located on freehold land owned by Mandalay Resources and is
an exhaust air outlet.
20.1.2 Water Disposal
The disposal of groundwater extracted from the mine workings is a critical aspect of the
Costerfield Property. The current approved Work Plan does not allow for off-site disposal of
groundwater or surface water.
The climate in Central Victoria enables water to be removed through evaporation. Average
pan evaporation is 1,400 mm per year according to the nearest Bureau of Meteorology
monitoring station at Tatura, 65 km north-west of Costerfield. Mean rainfall in the area is
576 mm per year, recorded at the Bureau of Meteorology monitoring station at Heathcote,
with the highest annual rainfall recorded in 1973 as 1,048 mm. The average rainfall by year
in the Heathcote area between 2013 and 2019 is detailed in Table 20-1.
Table 20-1: Rainfall Measurements from 2013 to 2021
Year Rainfall (mm) Above/Below Average
2013 554 Below
2014 510 Below
2015 299 Below
2016 687 Above
2017 504 Below
2018 379 Below
2019 350 Below

Mandalay Resources - Costerfield Property NI 43-101 Technical Report
D E F I N E | P L A N | O P E R A T E 306
2020 675 Above
2021 590 Above
The Costerfield Property currently operates a series of water storage and evaporation dams,
including the following major storage facilities:
• Splitters Creek Evaporation facility, comprising 20 terraces and a HDPE lined storage
dam,
• Three HDPE lined evaporation and storage dams at the Augusta site.
A Reverse Osmosis (RO) plant was installed in 2014 at the Brunswick processing plant in order
to treat ground water pumped to surface for mine dewatering purposes. In 2017, an actiflow
unit was also installed as a pre-treatment to the RO plant, which is used to decrease the
antimony and dissolved solid levels prior to RO treatment.
The treated water is licenced to be discharged into a neighbouring waterway, to be provided
to local community members for stock watering or gardening or can be used for dust
suppression purposes on roads around the site. The creek discharge is licenced by the EPA,
and permits up to 360 ML/year of RO treated permeate to be discharged into the Mountain
Creek South diversion, which feeds into the Wappentake creek at a maximum rate of 2.0
ML/day.
The waste product from the RO plant, known as brine, contains concentrated levels of salt,
antimony and other elements removed from the groundwater. The RO plant brine is stored
in the plastic lined evaporation dams at Augusta, discharged to the Splitter Creek Evaporation
Facility or reused in the Brunswick Processing Plant or evaporated in the tailing storage
facilities.
The Splitters Creek Evaporation Facility, completed in 2015, has the capacity to treat 104
ML/year net (evaporation minus rainfall). The purpose of the facility is to evaporate water
surplus to the operations needs that is extracted from the Costerfield Property and thereby
allow continued dewatering from the underground workings. The facility consists of a series
of shallow evaporation terraces that follow the natural topographic contours. Groundwater
is pumped from the Augusta mine site and discharged to the terraces. The water cascades
down the slope via the terrace spillways to the Storage Dam at the lowest point. A water
pump reticulates water from the Storage Dam back up to the terraces, in order to enable the
evaporation terraces to be filled from the Storage Dam as evaporation rates allow.
Current evaporation, RO plant processing and re-use capacity is calculated to be
approximately equivalent to the current dewatering rates, however additional

Mandalay Resources - Costerfield Property NI 43-101 Technical Report
D E F I N E | P L A N | O P E R A T E 307
complementary treatment options are being investigated and trialled to ensure adequate
capacity in the future.
20.1.3 Waste Rock
Waste rock that is surplus to underground backfilling requirements is stockpiled on the
surface in various locations. Testing of the waste rock has confirmed that the material is non-
acid generating and therefore does not pose an acid-mine drainage risk.
Waste rock is currently stockpiled next to the Augusta Mine box-cut, with the maximum
height and shape of the stockpile prescribed in the approved Work Plan. The approved Work
Plan requires that this stockpile will be removed on closure in order to return the land to the
prior use as grazing pasture. The waste rock will ultimately be used to fill the box-cut and cap
the TSFs.
Waste rock has also been transported to both the Bombay and Brunswick TSF to increase the
height of the TSF’s and was used for construction of the Splitters Creek Evaporation Facility.
A portion of waste rock is screened and utilised in backfilling of the underground stopes,
however, sufficient waste rock will need to be retained in order to fulfil rehabilitation and TSF
expansion requirements.
20.1.4 Tailings Disposal
The tailings thickener has sufficient capacity to handle the current throughput. The average
tailings thickener underflow solids density continues to be maintained at around 50% (+/-
10%).
Mandalay Resources have two operational TSF’s, being the Brunswick TSF and the Bombay
TSF, and has conditional approval to raise the height of the Bombay TSF an additional 2.7 m
has been gained, since the capacity provided by the 2018 lift of the Bombay TSF was
exhausted in August 2020.
The Brunswick TSF returned to service as the replacement storage facility after the
completion of a hybrid wall lift and remained the primary storage facility for 2021.
Studies are underway to determine the most effective way to further increase tailings
capacity to meet the LOM plan (Section 18).
20.1.5 Air Quality
The approved Environmental Monitoring Plan for the Augusta Mine includes an air quality
monitoring programme, consisting of dust deposition gauges located at various places

Mandalay Resources - Costerfield Property NI 43-101 Technical Report
D E F I N E | P L A N | O P E R A T E 308
surrounding the Costerfield Property, and five dust deposition gauges at the Splitters Creek
Evaporation Facility.
The monitoring data is provided to the regulatory authorities and Community
Representatives through the quarterly Environmental Review Committee (ERC) meetings.
Control measures currently in place to manage dust emissions from the operations include:
• Road watering programme with treated groundwater,
• Proactive monitoring of dust with portable Dust Trak monitors,
• Moisture control of mill feed during processing,
• Sealing of sections of haul roads,
• Maintaining moisture on TSFs and waste rock stockpiles.
Ventilation shafts emission detection reports are carried out bi-annually and indicate that the
ventilation shafts are not a significant source of dust emissions. These results are
communicated quarterly at the ERC meetings.
20.1.6 Groundwater
A conceptual hydrogeological model was developed for the Costerfield Property in 2014
based on current groundwater monitoring data, which indicated that the Augusta and Cuffley,
Brunswick and Youle Deposits are located in the regional groundwater aquifer.
Key aspects of the groundwater for the reporting year include the following :
• Dewatering from the mine totalled 559 ML in 2021.
• The current groundwater extraction licence of 700 ML/year has been approved by
Goulburn-Murray Water and is up for renewal in June 2034.
The groundwater model was reviewed in 2021 to confirm the current impact on groundwater
levels by dewatering from the mine as the underground workings extended laterally and
vertically. The model shows a cone of depression in the bedrock aquifer trending in a north
to south orientation, parallel to the deposits (Figure 20-1).

Mandalay Resources - Costerfield Property NI 43-101 Technical Report
D E F I N E | P L A N | O P E R A T E 309
Figure 20-1: Groundwater elevation contour map of the areas surrounding the Augusta Mine, as at December 2021

Mandalay Resources - Costerfield Property NI 43-101 Technical Report
D E F I N E | P L A N | O P E R A T E 310
The regional groundwater aquifer is confined to semi-confined, and is comprised of Silurian
siltstones and mudstones, with groundwater flow occurring within fractures and fissures in
the rock. This is overlain by a perched alluvial aquifer comprised of recent gravels, sands and
silt, which is connected to the surface water system.
Based on the monitoring data and the conceptual hydrogeological model, it appears that the
current dewatering activities at Augusta do not affect the alluvial aquifer. Therefore, there is
no impact to local landowners or the surface water system.
20.1.7 Noise
The approved Environmental Monitoring Plan for the Costerfield Property includes a noise
monitoring program which comprises routine attended and unattended noise monitoring at
six locations, and reactive monitoring at sensitive receptors in the event of complaints or
enquiries. Monitoring is carried out in accordance with Environmental Protection Agency
(EPA) Victoria’s SEPP N1 policy.
Noise from the Costerfield Property is a sensitive issue for nearby neighbours, and Mandalay
Resources operates a 24-hour, 7 days a week complaints line in order to deal with noise
complaints or any other issues from members of the public. The Mandalay Resources
Complaints Procedure includes processes to record complaints, identify and implement
immediate and longer term actions. All complaints are discussed at the quarterly
Environmental Review Committee meetings.
The current Costerfield Property is not expected to significantly change the nature of noise
emissions from the site. Construction of new waste rock storage, TSF or evaporation facilities
may require some additional noise monitoring which will be identified as part of the WPV
approval process.
During construction, an additional 10 dBA of noise is permitted to be generated. Existing
resources and procedures are adequate to accommodate any required modifications to the
noise monitoring program.
20.1.8 Blasting and Vibration
The DJPR prescribes blast vibration limits for the protection of buildings and public amenities.
Mandalay Resources undertakes constant blast vibration monitoring in order to assess
compliance with the prescribed limits and reports this information to the ERC quarterly.
20.1.9 Native Vegetation
The Costerfield Property has been developed and is operated with the aim of avoiding and
minimising impacts on native vegetation. Where native vegetation has been impacted,
Mandalay Resources has obligations to secure native vegetation offsets.
Mandalay Resources - Costerfield Property NI 43-101 Technical Report
D E F I N E | P L A N | O P E R A T E 311
Mandalay Resources has purchased approved native vegetation offset at Peels Lane in
Costerfield to fulfil obligations relating to Victoria’s Native Vegetation Management – A
Framework for Action, associated with the original clearing of native vegetation at the
Augusta Mine site and the Bombay TSF. The Peels Lane offset site has been assessed as
containing 4.35 habitat hectares of various Ecological Vegetation Classes (EVCs) and
associated large trees, in accordance with the framework guidelines.
Expansion of the Costerfield Operation through construction of the Splitters Creek
Evaporation Facility, Brunswick TSF and Bombay TSF has had a minimal impact on the native
vegetation and the Peel Lane site has sufficient offset credits to meet the site’s foreseeable
future needs.
20.1.10 Visual Amenity
The key aspect of the Costerfield Operation that may affect visual amenity was the
construction of the Splitters Creek Evaporation Facility.
Community consultation took place as part of the planning for the facilities, and mitigation
measures were implemented where appropriate. Screening vegetation was planted, in
consultation with the relevant land manager and nearby neighbours.
20.1.11 Heritage
A heritage survey of the South Costerfield Shaft, Alison and New Alison surface workings was
completed by LRGM Consultants in the first quarter of 2012. The purpose of this survey was
to identify and record cultural heritage features in the areas of interest that exist within the
current ML (MIN4644). The Taungurung Clans Aboriginal Corporation is the Registered
Aboriginal Party designated as the traditional owners of the land on which Mining Licence
MIN4644 is located.
The survey identified that no features of higher than local cultural heritage significance were
identified, with the following features of local cultural heritage significance being noted:
• South Costerfield (Tait’s) Mine Shaft,
• Old Alison Mine Shaft,
• New Alison Mine Shaft.
The expansion of the mining operations did not result in any disturbance of historic mine
workings or other heritage features.

Mandalay Resources - Costerfield Property NI 43-101 Technical Report
D E F I N E | P L A N | O P E R A T E 312
20.1.12 Community
The Costerfield Operation is one of the largest employers in the region and is a significant
contributor to the local economy. Mandalay Resources preferentially employs appropriately
skilled personnel from the local community and sources goods and services from local
suppliers wherever possible.
Mandalay Resources has developed and implemented the Costerfield Property’s Community
Engagement Plan, which has been approved by the DJPR in accordance with the requirements
of the MRSD Act 1990. This Plan sets the framework for communication with all of the
business’ stakeholders in order to ensure transparent and ongoing consultative relationships
are developed and maintained.
The Community Engagement Plan includes processes to manage community inquiries and
complaints to ensure timely and effective responses to issues affecting members of the
community. The current Community Engagement Plan is considered an appropriate
framework to address the needs of stakeholders through the planning and implementation
of the proposed mine expansion.
In early 2016, Mandalay Resources initiated regular community reference meetings under the
auspices of the ERC. This forum, the Community Reference Sub-Committee, gives community
members the opportunity to find out about current and future issues at the mine, to provide
their input and ask questions.
20.1.13 Mine Closure and Revegetation
The MRSD Act 1990 requires proponents to identify rehabilitation requirements as part of the
Work Plan approvals process, and ensures that rehabilitation bonds are lodged in the form of
a bank guarantee to cover the full cost of rehabilitation up front, prior to commencing work.
Rehabilitation bonds are also reviewed on a regular basis to ensure that unit cost assumptions
and the scope of work is kept up to date. WPVs also trigger a review of the rehabilitation
bond if the work to be carried out affects final rehabilitation.
Mandalay Resources has developed a Mine Closure Plan, which provides an overview of the
various aspects of closure and rehabilitation that have been included in the rehabilitation
bond calculation, and reflects the rehabilitation requirements described in the approved
Work Plans and Variations.
The Mine Closure Plan describes how the Augusta site, including the box-cut, waste rock
storage, office area and evaporation dams, will be rehabilitated back to the former land use
as grazing pasture. The mine decline will be blocked and the portal backfilled with waste rock,
with the box-cut being levelled back to its original surface contours. Topsoil and subsoil have
been stored on site to facilitate the final revegetation.
Mandalay Resources - Costerfield Property NI 43-101 Technical Report
D E F I N E | P L A N | O P E R A T E 313
The rehabilitation plan for the Brunswick Complex includes removal of all plant and
infrastructure, returning the disturbed area back to native forest, and to create a safe and
stable landform that can be used for passive recreation. The TSFs will be dried out, capped
with waste rock and topsoil, and planted with native vegetation. The plan includes provisions
for monitoring the TSFs post closure.
The rehabilitation plan for the Splitters Creek Evaporation Facility includes evaporation of the
remaining stored groundwater and removing the clay lining from the terraces, which is placed
back into the HDPE line storage dam. The liner in the storage dam will be folded back over
the clay and capped with waste rock, clay and topsoil, and planted with grasses. Topsoil and
subsoil has been stored on site to enable this final vegetation.
20.2 Regulatory Approvals
20.2.1 Work Plan Variation
Future changes to mining activities, such as potential changes to waste rock storage facilities,
will require a risk based Work Plan Variation (WPV) to be approved. The DJPR facilitates this
approval process and will engage with relevant referral authorities, as required. The DJPR
may prescribe certain conditions on the approval, which may include amendments to the
environmental monitoring programme. The Work Plan approval process involves a thorough
consultation process with regulatory authorities, and any conditions or proposed
amendments requested to the WPV are generally negotiated to the satisfaction of both
parties.
All onsite and offsite risks must be assessed in the new Work Plan review process and
adequate controls and monitoring programs implemented to mitigate any negative impacts.
20.2.2 Other Permitting
In addition to the approval of a WPV, any future expansion of the current Costerfield
Operation will require a number of other potential consents, approvals and permits (Table
20-2).
Table 20-2: Permit requirements
Stakeholder Instrument
Private Landholders Consent/compensation agreement with owner of the land on which the mine is located.
City of Greater Bendigo Planning Permit required modification to existing and new TSFs.

Mandalay Resources - Costerfield Property NI 43-101 Technical Report
D E F I N E | P L A N | O P E R A T E 314
DEWLP Compliance with Native Vegetation Management Framework for removal of native vegetation associated with the power supply, evaporation facility and expansion of TSF footprints.
EPA EPA consent to discharge reverse osmosis treated water to a local waterway.

Mandalay Resources - Costerfield Property NI 43-101 Technical Report
D E F I N E | P L A N | O P E R A T E 315
21 CAPITAL AND OPERATING COSTS
The capital and operating cost estimates for the Costerfield Operation, described in the
following section have been derived from a variety of sources, including:
• Historic production from the Costerfield Property, predominantly the past 12 to 36
months completed by Mandalay Resources.
• Manufacturers and suppliers.
• First principle calculations, based on historic production values.
• Costs including allowances for power, consumables, labour and maintenance.
All cost estimates are provided in 2021 Australian dollars (AUD) and are to a level of accuracy
of ± 10%. Escalation, taxes, import duties and custom fees have been excluded from the cost
estimates.
21.1 Capital Costs
The estimated total capital requirements for the Costerfield Operation are outlined in Table
21-1.
A detailed breakdown of the individual capital items included in the Economic Model was
sourced from the 2022 budget document. Sustaining capital costs listed in the 2022 budget
are extended out through the duration of the reserves in the life of mine.
Table 21-1: Costerfield Operation – capital cost estimate
Area Total CY 22
(AUD$ M)
CY 23
(AUD$ M)
CY 24
(AUD$ M)
CY 25
(AUD$ M)
CY 26
(AUD$ M)
CY 27
(AUD$ M)
Capital Development 5.1 5.1 0.0 0.0 0.0 0.0 0.0
Processing Plant 13.7 3.8 3.6 3.3 1.3 1.3 0.5
Admin 1.7 1.1 0.2 0.2 0.2 0.0 0.0
Environmental 3.6 0.4 0.9 0.8 0.6 0.6 0.3
OH&S 0.4 0.1 0.1 0.1 0.1 0.1 0.0
Operational Geology 0.1 0.1 0.0 0.0 0.0 0.0 0.0
Exploration 0.3 0.2 0.1 0.1 0.0 0.0 0.0
Mining 12.3 5.3 3.9 2.6 0.3 0.1 0.1
Total Capital Cost 37.5 16.4 8.7 7.0 2.4 2.1 0.9 Note: Totals may not sum due to rounding.
Mandalay Resources - Costerfield Property NI 43-101 Technical Report
D E F I N E | P L A N | O P E R A T E 316
21.1.1 Processing Plant
Mandalay Resources has identified and estimated the capital costs associated with the
maintenance of the Brunswick Processing Plant and other mill site related initiatives including:
• Bombay TSF embankment raise,
• Installation of secondary filter press or alternative filtration technology to provide
redundancy to existing filter press,
• Purchase of I-140RS Terex Finlay Impact Crusher to complement the 2 existing I-130RS
Terex Finlay Impact Crushers,
• Refurbishment of existing plant and key components,
• Purchase of critical spares,
• Miscellaneous upgrades to surface facilities.
The main processing plant infrastructure cost items are the I-140RS Terex Finlay Impact
Crusher and secondary filter press as well as works associated with the raise on the Bombay
TSF. All associated costs are based on tendered rates.
21.1.2 Administration
Administration related capital costs include optic fibre to site internet upgrade, a forklift for
mine stores, software improvements and IT infrastructure including a server room upgrade.
21.1.3 Environmental
Capital costs related to environment activities will include drilling and installation of
additional ground water monitoring bores, equipment for environmental monitoring, tailings
management strategy permitting and other tailings storage investment expenses.
21.1.4 Occupational Health and Safety
OH&S planned capital expenditure includes upgrading of the Emergency Response Team
breathing apparatus equipment, a site entry breathalyser and undercover parking
infrastructure for the Emergency Response fire truck.
21.1.5 Mining
Mining related capital costs consist of sustaining capital to ensure production rates are
achieved, and project capital that further improves the efficiency of the mining process.

Mandalay Resources - Costerfield Property NI 43-101 Technical Report
D E F I N E | P L A N | O P E R A T E 317
Planned costs will include additional expenditure on safety initiatives including tele-remote
loader upgrades and vehicle and personnel tracking systems.
Sustaining capital allows for replacement of light vehicles, LH 203 loaders, production drills
and development drills.
The cost estimates have been based on recent quotations or agreements from appropriate
suppliers.
21.1.6 Capital Development
Decline development quantities have been based on the mine designs prepared for the
project. The lateral development quantities are based on each production level in the mine
being accessed by the decline system with allowance for stockpiles, level access, sumps,
refuge chamber cuddies, vent accesses, truck tips and CRF mixing bays.
The unit cost for lateral development has been based on a combination of the agreed
development rates with the mining contractor undertaking the capital development and
historical costs for consumables (explosives, fuel, ground support and rehab) and services.
The Contractor development rates include an allowance for the haulage of waste rock to the
surface and also haulage, handling and stockpiling of waste once it is on surface.
21.1.7 Closure
Closure costs are estimated using a calculation tool to estimate rehabilitation bonds. Bond
amounts are reviewed when major changes are made to the operation, for example
construction of a tailings storage facility. Closure costs are expected to be refunded by the
current rehabilitation bonds held by the regulatory authorities; hence no additional closure
costs have been included in reserves economic analysis.
21.2 Operating Costs
Operating costs are derived from tracked historic expenditure under opex cost codes;
financial analysis split costs using a combination of mining and milling physicals; along with
mining operations timesheet and payroll data. This method ensures an accurate split of
operational costs for estimating purposes.
The operating cost estimates applied in this Technical Report are summarised in Table 21-2
and described further in the following sections.

Mandalay Resources - Costerfield Property NI 43-101 Technical Report
D E F I N E | P L A N | O P E R A T E 318
Table 21-2: Costerfield Property Operating cost inputs
Description Unit AUD$ Data Source
Jumbo Operational Development AUD/m 3,115 2021 average
Stoping AUD/t 131 2021 average
Mining Admin AUD/day 13,398 2021 average
Geology AUD/day 5,667 2021 average
ROM Haulage AUD/t 3 2021 average
Processing Plant AUD/t milled 65 2021 average
Site Services AUD/day 5,862 2021 average
General and Administrative AUD/day 14,929 2021 average
Selling Expenses excluding Royalty AUD/t con 137 2021 average
Royalty costs are calculated in accordance with royalty payment structures. Sb royalty is paid at a rate of 2.75% of revenue less selling costs.
Au royalty is also paid at 2.75% of revenue less selling costs with 2,500 of saleable Au ounces exempt from royalty payment.
21.2.1 Lateral Development
The estimated unit cost for lateral development has been developed from 2021 average costs
for labour, equipment, consumables, services, as well as achieved development physicals. An
allowance for the haulage to surface has also been included.
The lateral development (operating) for Augusta, Cuffley, Brunswick and Youle will continue
to be undertaken on an owner-operator basis.
The required lateral development is summarised in Table 21-3.
Table 21-3: Summary of lateral development requirements
Description Metres
Capital Development 797
Operating Development (Waste) 9,852
Operating Development (Ore) 9,378
The direct operating costs related to lateral development include:
• Direct labour including superannuation, workers compensation, payroll tax and partial
allowances for leave accrual.
• Drilling consumables, such as drill steel, bits, hammers, etc.
• Explosives.

Mandalay Resources - Costerfield Property NI 43-101 Technical Report
D E F I N E | P L A N | O P E R A T E 319
• Ground support supplies.
• Direct mobile plant operating costs for fuel and lubricants, tyres and spare parts.
• Services materials including poly pipe, ventilation bag and electrical cables
• Reallocation of costs associated with maintenance, ventilation, power supply,
compressed air supply, dewatering, water supply and underground communications.
• Miscellaneous materials required to support development activities.
21.2.2 Production Stoping
The direct costs for stoping have been developed from 2021 average costs for direct labour
(including superannuation, workers compensation, payroll tax and partial allowances for
leave accrual), consumable materials, equipment operating and maintenance as well as
achieved productivities associated with the following:
• Installation of secondary ground support,
• Drilling, loading, and blasting long-holes by Mandalay Resources employees,
• Production from the stope with an underground loader (remote or manual) and
tramming to a stockpile or truck loading area,
• Loading haul trucks from stockpile (if required),
• Backfill preparation and placement,
• Reallocation of costs associated with maintenance, ventilation, power supply,
compressed air supply, dewatering, water supply and underground communications.
21.2.3 Mining Administration
Mining administration includes costs associated with mining management, supervision and
technical services, such as Mining Engineering, Survey, Geotechnical Engineering and Mine
Geology. These costs have been estimated from actual Mandalay Resources 2021 mining
administration costs.
21.2.4 Geology
Geology includes costs associated with resource estimation, resource definition drilling,
sampling, assaying, and laboratory expenses as well as associated management and labour.
These costs have been estimated from actual Mandalay Resources 2021 geology costs.
Mandalay Resources - Costerfield Property NI 43-101 Technical Report
D E F I N E | P L A N | O P E R A T E 320
21.2.5 ROM Haulage
The cost of trucking from the Brunswick Pit ROM to the Brunswick Processing Plant ROM pad
has been calculated based on the average of the 2021 total costs of this short distance surface
haulage. Costs calculated include indirect costs and profit.
21.3 Processing Plant
The Brunswick Processing Plant costs include:
• Tailings disposal.
• ROM management.
• Ball mill crushing and grinding.
• General operating and maintenance.
• Reagent mixing, thickening and flotation.
• Gold room expenses.
• All flocculants and reagent chemicals.
• Plant maintenance and reallocated electrical costs associated with Plant operation.
The processing costs have been estimated from 2021 average processing costs.
21.4 Site Services
Site service costs refer to indirect costs related to Health and Safety, Environment and
Community Relations, as well as costs related to the water treatment plant, water disposal
and the reverse osmosis plant. Compensation expenses are also included in this cost item.
These costs have been estimated from actual Mandalay Resources 2021 site services costs.
21.5 General and Administrative
The general and administrative costs refer to site-wide operational costs rather than costs
directly associated with operational departments. This cost includes General Site
Management, including all staff costs, Human Resources, Finance and Administration.
These costs have been sourced from Mandalay Resources actual 2021 general and
administration costs.

Mandalay Resources - Costerfield Property NI 43-101 Technical Report
D E F I N E | P L A N | O P E R A T E 321
21.6 Selling Expenses
Mandalay Resources utilises a third-party company to arrange the sale and transport of
concentrate from the Brunswick Processing Plant to the smelter in China. The Mandalay
Resources portion of the selling expenses is calculated from historical costs and comprises
road transport from the Brunswick Processing Plant to the Port of Melbourne, shipping from
Melbourne to China, shipment documentation, freight administration and assay
exchange/returns.
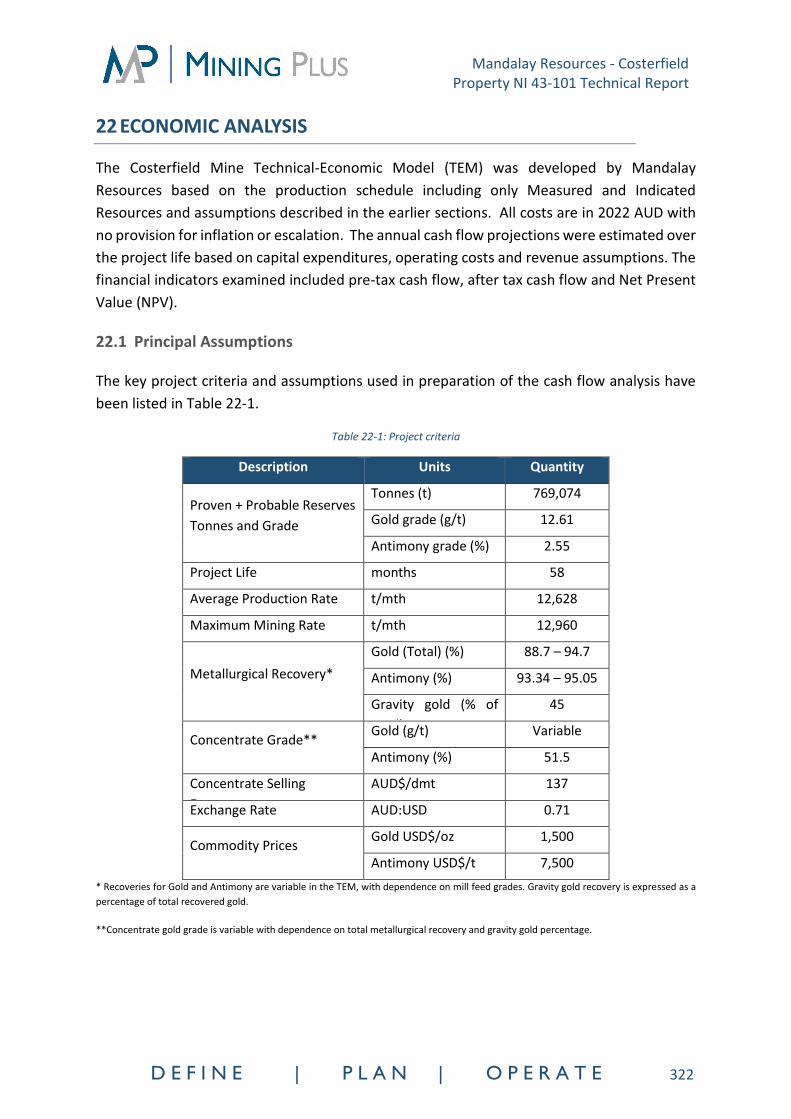
Mandalay Resources - Costerfield Property NI 43-101 Technical Report
D E F I N E | P L A N | O P E R A T E 322
22 ECONOMIC ANALYSIS
The Costerfield Mine Technical-Economic Model (TEM) was developed by Mandalay
Resources based on the production schedule including only Measured and Indicated
Resources and assumptions described in the earlier sections. All costs are in 2022 AUD with
no provision for inflation or escalation. The annual cash flow projections were estimated over
the project life based on capital expenditures, operating costs and revenue assumptions. The
financial indicators examined included pre-tax cash flow, after tax cash flow and Net Present
Value (NPV).
22.1 Principal Assumptions
The key project criteria and assumptions used in preparation of the cash flow analysis have
been listed in Table 22-1.
Table 22-1: Project criteria
Description Units Quantity
Proven + Probable Reserves
Tonnes and Grade
Tonnes (t) 769,074
Gold grade (g/t) 12.61
Antimony grade (%) 2.55
Project Life months 58
Average Production Rate t/mth 12,628
Maximum Mining Rate t/mth 12,960
Metallurgical Recovery*
Gold (Total) (%) 88.7 – 94.7
Antimony (%) 93.34 – 95.05
Gravity gold (% of
total)
45
Concentrate Grade** Gold (g/t) Variable
Antimony (%) 51.5
Concentrate Selling
Expenses
AUD$/dmt 137
Exchange Rate AUD:USD 0.71
Commodity Prices Gold USD$/oz 1,500
Antimony USD$/t 7,500
* Recoveries for Gold and Antimony are variable in the TEM, with dependence on mill feed grades. Gravity gold recovery is expressed as a
percentage of total recovered gold.
**Concentrate gold grade is variable with dependence on total metallurgical recovery and gravity gold percentage.

Mandalay Resources - Costerfield Property NI 43-101 Technical Report
D E F I N E | P L A N | O P E R A T E 323
22.1.1 Metal Sale Prices
Sale prices of metals are based on analysis of metal price prediction and the review of current
and historical prices. A sensitivity analysis demonstrates the expected financial returns at a
range of gold and antimony prices. Further information regarding the selected metal sale
prices is provided in Section 19.
22.1.2 Concentrate and Gold Sales
The TEM assumes that concentrate shipments and gold sales are made at the end of each
month. The payables of the shipments and gold sales, as well as associated selling expenses,
are assumed to occur at the time of production and shipping in the economic model.
The payable metal terms adopted in the economic model are consistent with the current sales
contract terms for the gold and antimony concentrate grades and quality as at December 31
2021.
22.1.3 Exchange Rate
The economic model has assumed an exchange rate of AUD:USD 0.71 for the entire project
life.
22.1.4 Taxes
The Australian government taxes on Mandalay Resources Costerfield Operations include:
• A Goods and Services Tax (GST) at a rate of 10%, as levied by the federal government
on purchases by individuals and corporations on non-exempt goods and services.
Businesses can claim back GST on most business inputs. It is assumed that all of the
product sales will be to overseas customers, therefore no GST is applicable.
• Company tax, payable at a rate of 30%, which is calculated on the profits generated
by the operation.
As at the end of December 2021, Mandalay Resources Costerfield Operations had zero carried
forward tax losses.
22.1.5 Royalties/Agreements
Under the Mineral Resources Development (Mining) Amendment Regulation 2010 of the
Victorian State Government, royalties apply to the sale of antimony and gold. This royalty is
applied at 2.75% of the revenue realised from the sale of antimony and gold sold, less the
selling costs. The Victorian Government amended the above stated legislation to include gold
effective from the 1st of January 2020. This amendment excludes the first 2,500 gold ounces

Mandalay Resources - Costerfield Property NI 43-101 Technical Report
D E F I N E | P L A N | O P E R A T E 324
from the royalty calculation. All financials and forecasting are aligned with Government
Regulations. There are compensation agreements in place with land holders and
neighbouring residents which are affected by the Costerfield Property. It has been assumed
that the current agreements will remain in place for the remaining project life and that no
new agreements will be required as the Augusta and Brunswick site footprint will remain
largely unchanged. Both the royalties and compensation agreements have been factored into
the financial model as an indirect cost and calculated monthly.
22.1.6 Project Financing
No assumptions have been made about project financing in the TEM.
22.2 Economic Summary
A summary of the economic factors associated with the project are presented in Table 22-2.
Table 22-2: Project economics
Description Units Units
Proven + Probable Tonnes Milled Tonnes 769,074
Contained gold Ounces 311,796
Contained Antimony Tonnes 19,592
Recovered Gold Ounces 297,688
Recovered Antimony Tonnes 18,121
Payable Gold Ounces 287,720
Payable Antimony Tonnes 18,302
Payable (Saleable) Metal, Au Eq Oz Eq1 379,230
Operating Cost AUD$ M 272.1 USD$ M 193.2
Operating Cost per Payable ounce AUD$/Oz Eq1
718 AUD$/Oz Eq1
509
Capital Cost AUD$ M 37.5
USD$ M 26.6
Net Revenue (less selling costs and royalties)
AUD$ M 660.7 USD$ M 469.1
Pre-tax cash flow AUD$ M 351.0 USD$ M 249.2
After Tax Cash Flow AUD$ M 268.3 USD$ M 190.5
Pre-tax NPV discounted at 5% AUD$ M 310.9 USD$ M 220.7
After-tax NPV discounted at 5% AUD$ M 233.2 USD$ M 165.6 1. Oz Eq = Gold Ounces + (Antimony Price / Gold Price) * Antimony Tonnes, Tonnes and Ounces rounded to nearest thousand, dollars rounded to the nearest hundred thousand.
22.2.1 Cash Flow Forecast
The estimated cash flow forecast has been provided in Table 22-3.

Mandalay Resources - Costerfield Property NI 43-101 Technical Report
D E F I N E | P L A N | O P E R A T E 325
Table 22-3: Estimated pre-tax cash flow summary
Total 2022 Q1 2022 Q2 2022 Q3 2022 Q4 2023 Q1 2023 Q2 2023 Q3 2023 Q4 2024 Q1 2024 Q2 2024 Q3 2024 Q4 2025 Q1 2025 Q2 2025 Q3 2025 Q4 2026 Q1 2026 Q2 2026 Q3 2026 Q4 2027 Q1 2027 Q2 2027 Q3
PHYSICALS
Development
Capita l Development m 797 149 107 426 114 0 0 0 0 0 0 0 0 0 0 0 0 0 0 0 0 0 0 0
Operating Development m 19,230 1,051 1,051 1,051 1,050 961 961 961 960 959 959 942 901 900 902 900 899 901 900 902 901 218 0 0
Vertica l Development m 124 14 9 56 24 6 15 0 0 0 0 0 0 0 0 0 0 0 0 0 0 0 0 0
Underground Ore
Proven + probable mined t 727,631
Total Ore Mined (includes inferred and below cut-
off grade materia l ass igned zero grade) t 762,238 38,671 38,759 38,729 38,713 38,731 38,783 38,723 38,745 38,716 37,223 33,966 34,802 34,811 31,539 30,960 32,445 32,213 31,390 33,824 33,248 30,498 15,080 1,669
Mined Grade Au g/t Au 12.15 10.37 12.41 14.31 12.31 10.03 13.17 14.01 14.51 15.84 13.61 10.81 11.97 10.80 11.66 15.88 13.78 7.86 11.67 11.80 8.25 10.19 8.96 11.07
Mined Au ounces 297,688 12,888 15,463 17,820 15,316 12,485 16,420 17,441 18,072 19,713 16,285 11,808 13,397 12,091 11,819 15,806 14,375 8,139 11,774 12,832 8,816 9,989 4,346 594
Mined Grade Sb % Sb 2.38 2.77 2.79 2.68 2.17 2.47 2.93 2.62 1.88 2.22 2.45 1.96 1.36 1.12 1.93 2.56 2.71 1.72 2.49 2.09 2.69 3.50 3.96 4.47
Mined Sb tonnes 18,121 1,070 1,080 1,039 839 958 1,137 1,013 730 860 913 665 473 389 609 792 878 554 780 706 893 1,069 597 75
Stockpi le Ore
Proven ROM Stockpi le mi l l feed tonnes 41,000 2,729 2,641 2,671 2,687 2,669 2,617 2,677 2,655 2,684 4,177 7,434 5,358 0 0 0 0 0 0 0 0 0 0 0
Proven ROM Stockpi le grade Au g/t Au 10.13 10.13 10.13 10.13 10.13 10.13 10.13 10.13 10.13 10.13 10.13 10.13 10.13 0.00 0.00 0.00 0.00 0.00 0.00 0.00 0.00 0.00 0.00 0.00
Proven ROM Stockpi le grade Sb % Sb 3.27 3.27 3.27 3.27 3.27 3.27 3.27 3.27 3.27 3.27 3.27 3.27 3.27 0.00 0.00 0.00 0.00 0.00 0.00 0.00 0.00 0.00 0.00 0.00
METALLURGY
Proven and probable mi l l feed t 769,074
t 803,238 41,400 41,400 41,400 41,400 41,400 41,400 41,400 41,400 41,400 41,400 41,400 40,160 34,811 31,539 30,960 32,445 32,213 31,390 33,824 33,248 30,498 15,080 1,669
Feed Grade Au g/t 12.04 10.35 12.26 14.04 12.16 10.03 12.97 13.76 14.22 15.46 13.25 10.68 11.72 10.80 11.66 15.88 13.78 7.86 11.67 11.80 8.25 10.19 8.96 11.07
Feed Grade Sb % 2.42 2.80 2.82 2.72 2.24 2.53 2.96 2.66 1.97 2.29 2.54 2.20 1.62 1.12 1.93 2.56 2.71 1.72 2.49 2.09 2.69 3.50 3.96 4.47
Metal lurgica l Recovery Au % 92.42% 91.50% 92.53% 93.36% 92.48% 91.31% 92.88% 93.23% 93.44% 93.95% 93.01% 91.70% 92.26% 91.76% 92.23% 94.11% 93.25% 89.83% 92.23% 92.30% 90.12% 91.41% 90.63% 91.91%
Metal lurgica l Recovery Sb % 93.94% 94.08% 94.09% 94.05% 93.86% 93.98% 94.14% 94.03% 93.76% 93.88% 93.98% 93.85% 93.62% 93.43% 93.74% 93.99% 94.05% 93.66% 93.96% 93.80% 94.04% 94.36% 94.53% 94.73%
Payable Gold ounces 287,720 12,604 15,103 17,446 14,972 12,192 16,040 17,071 17,692 19,338 16,408 13,041 13,965 11,095 10,900 14,875 13,404 7,311 10,859 11,844 7,945 9,130 3,939 546
Payable Gravi ty Gold ounces 129,474 5,672 6,796 7,851 6,737 5,486 7,218 7,682 7,961 8,702 7,384 5,869 6,284 4,993 4,905 6,694 6,032 3,290 4,887 5,330 3,575 4,109 1,772 246
Payable Gold in Concentrate ounces 158,246 6,932 8,306 9,595 8,235 6,706 8,822 9,389 9,730 10,636 9,024 7,173 7,681 6,102 5,995 8,181 7,372 4,021 5,973 6,514 4,370 5,022 2,166 300
Payable Antimony tonnes 18,302 1,092 1,099 1,060 871 983 1,152 1,036 766 891 988 855 608 363 571 745 825 519 733 663 840 1,009 564 71
Payable Gold Equiva lent AuEq ounces 379,230 18,062 20,595 22,748 19,325 17,106 21,800 22,251 21,524 23,792 21,345 17,314 17,006 12,911 13,756 18,598 17,531 9,905 14,525 15,157 12,145 14,173 6,761 899
REVENUE
Payable Au (gravi ty) % 100.0% 100% 100% 100% 100% 100% 100% 100% 100% 100% 100% 100% 100% 100% 100% 100% 100% 100% 100% 100% 100% 100% 100% 100%
Payable Au (concentrate) % 86.4% 86.4% 86.4% 86.4% 86.4% 86.4% 86.4% 86.4% 86.4% 86.4% 86.4% 86.4% 86.4% 86.4% 86.4% 86.4% 86.4% 86.4% 86.4% 86.4% 86.4% 86.4% 86.4% 86.4%
Payable Sb % 62.5% 62.5% 62.5% 62.5% 62.5% 62.5% 62.5% 62.5% 62.5% 62.5% 62.5% 62.5% 62.5% 62.5% 62.5% 62.5% 62.5% 62.5% 62.5% 62.5% 62.5% 62.5% 62.5% 62.5%
Price Au $/oz 1,500 1,500 1,500 1,500 1,500 1,500 1,500 1,500 1,500 1,500 1,500 1,500 1,500 1,500 1,500 1,500 1,500 1,500 1,500 1,500 1,500 1,500 1,500 1,500
Price Sb $/t 7,500 7,500 7,500 7,500 7,500 7,500 7,500 7,500 7,500 7,500 7,500 7,500 7,500 7,500 7,500 7,500 7,500 7,500 7,500 7,500 7,500 7,500 7,500 7,500
Exchange Rate AUD:USD 0.71 0.71 0.71 0.71 0.71 0.71 0.71 0.71 0.71 0.71 0.71 0.71 0.71 0.71 0.71 0.71 0.71 0.71 0.71 0.71 0.71 0.71 0.71 0.71
CAPITAL COSTS
Plant AUD M 13.7 2.8 0.7 0.3 0.0 2.6 0.3 0.3 0.3 1.3 0.3 0.3 1.3 0.3 0.3 0.3 0.3 0.3 0.3 0.3 0.3 0.3 0.2 0.1
Admin AUD M 1.7 0.3 0.6 0.1 0.0 0.1 0.1 0.0 0.0 0.1 0.0 0.1 0.0 0.1 0.0 0.1 0.0 0.0 0.0 0.0 0.0 0.0 0.0 0.0
Environment AUD M 3.6 0.2 0.1 0.1 0.0 0.3 0.2 0.2 0.2 0.2 0.2 0.2 0.2 0.2 0.2 0.2 0.2 0.2 0.2 0.2 0.2 0.2 0.1 0.0
OH & S AUD M 0.4 0.0 0.0 0.0 0.0 0.0 0.0 0.0 0.0 0.0 0.0 0.0 0.0 0.0 0.0 0.0 0.0 0.0 0.0 0.0 0.0 0.0 0.0 0.0
Geology AUD M 0.1 0.1 0.0 0.0 0.0 0.0 0.0 0.0 0.0 0.0 0.0 0.0 0.0 0.0 0.0 0.0 0.0 0.0 0.0 0.0 0.0 0.0 0.0 0.0
Exploration AUD M 0.3 0.2 0.0 0.0 0.0 0.0 0.0 0.0 0.0 0.0 0.0 0.0 0.0 0.0 0.0 0.0 0.0 0.0 0.0 0.0 0.0 0.0 0.0 0.0
Mining AUD M 12.3 2.2 1.6 1.1 0.3 3.0 0.3 0.3 0.3 0.9 1.1 0.4 0.3 0.1 0.1 0.1 0.0 0.0 0.0 0.0 0.0 0.0 0.0 0.0
Tota l PPE AUD M 32.0 5.8 3.0 1.7 0.4 6.1 0.9 0.8 0.8 2.6 1.6 1.0 1.8 0.7 0.6 0.6 0.5 0.5 0.5 0.5 0.5 0.5 0.3 0.1
Capita l Development AUD M 5.1 1.0 0.7 2.7 0.7 0.0 0.0 0.0 0.0 0.0 0.0 0.0 0.0 0.0 0.0 0.0 0.0 0.0 0.0 0.0 0.0 0.0 0.0 0.0
Vertica l Development AUD M 0.3 0.0 0.0 0.2 0.0 0.0 0.0 0.0 0.0 0.0 0.0 0.0 0.0 0.0 0.0 0.0 0.0 0.0 0.0 0.0 0.0 0.0 0.0 0.0
Total Capital Cost AUD M 37.5 6.8 3.7 4.7 1.2 6.1 0.9 0.8 0.8 2.6 1.6 1.0 1.8 0.7 0.6 0.6 0.5 0.5 0.5 0.5 0.5 0.5 0.3 0.1
202720262022 2023 2024 2025
Tota l Mi l l Feed (includes inferred and below cut-off grade
materia l ass igned zero grade)
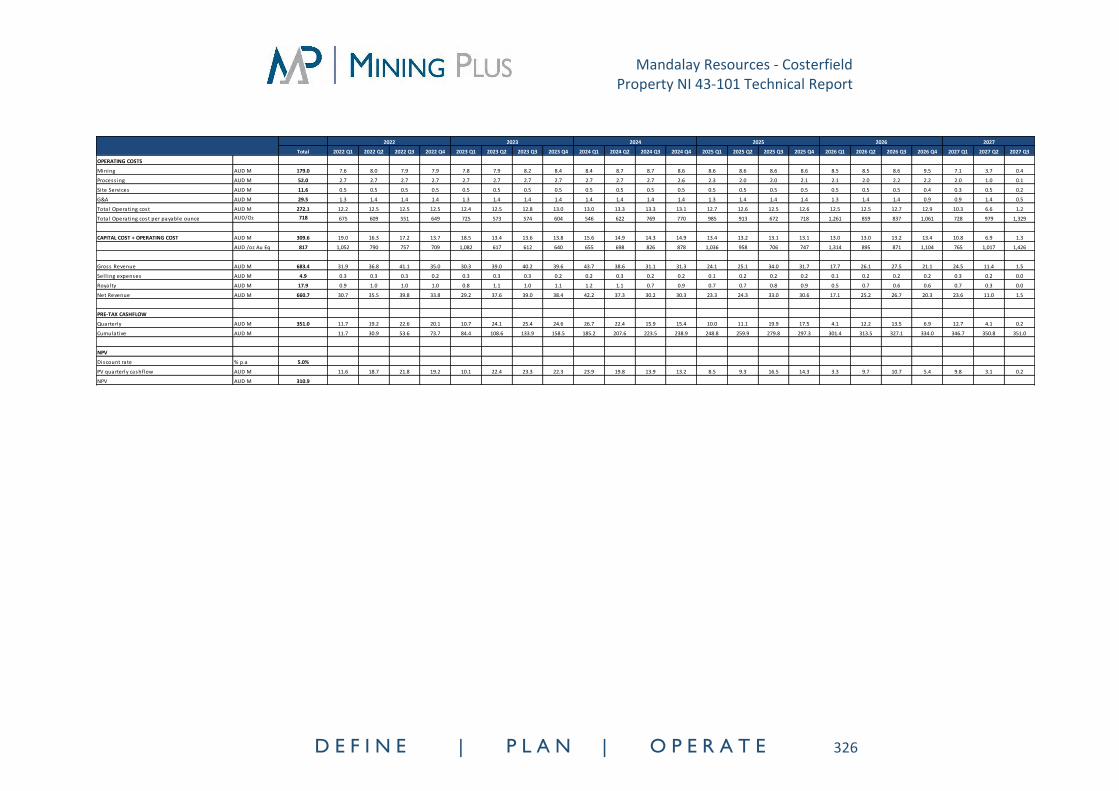
Mandalay Resources - Costerfield Property NI 43-101 Technical Report
D E F I N E | P L A N | O P E R A T E 326
Total 2022 Q1 2022 Q2 2022 Q3 2022 Q4 2023 Q1 2023 Q2 2023 Q3 2023 Q4 2024 Q1 2024 Q2 2024 Q3 2024 Q4 2025 Q1 2025 Q2 2025 Q3 2025 Q4 2026 Q1 2026 Q2 2026 Q3 2026 Q4 2027 Q1 2027 Q2 2027 Q3
OPERATING COSTS
Mining AUD M 179.0 7.6 8.0 7.9 7.9 7.8 7.9 8.2 8.4 8.4 8.7 8.7 8.6 8.6 8.6 8.6 8.6 8.5 8.5 8.6 9.5 7.1 3.7 0.4
Process ing AUD M 52.0 2.7 2.7 2.7 2.7 2.7 2.7 2.7 2.7 2.7 2.7 2.7 2.6 2.3 2.0 2.0 2.1 2.1 2.0 2.2 2.2 2.0 1.0 0.1
Si te Services AUD M 11.6 0.5 0.5 0.5 0.5 0.5 0.5 0.5 0.5 0.5 0.5 0.5 0.5 0.5 0.5 0.5 0.5 0.5 0.5 0.5 0.4 0.3 0.5 0.2
G&A AUD M 29.5 1.3 1.4 1.4 1.4 1.3 1.4 1.4 1.4 1.4 1.4 1.4 1.4 1.3 1.4 1.4 1.4 1.3 1.4 1.4 0.9 0.9 1.4 0.5
Total Operating cost AUD M 272.1 12.2 12.5 12.5 12.5 12.4 12.5 12.8 13.0 13.0 13.3 13.3 13.1 12.7 12.6 12.5 12.6 12.5 12.5 12.7 12.9 10.3 6.6 1.2
Total Operating cost per payable ounce AUD/Oz 718 675 609 551 649 725 573 574 604 546 622 769 770 985 913 672 718 1,261 859 837 1,061 728 979 1,329
CAPITAL COST + OPERATING COST AUD M 309.6 19.0 16.3 17.2 13.7 18.5 13.4 13.6 13.8 15.6 14.9 14.3 14.9 13.4 13.2 13.1 13.1 13.0 13.0 13.2 13.4 10.8 6.9 1.3
AUD /oz Au Eq 817 1,052 790 757 709 1,082 617 612 640 655 698 826 878 1,036 958 706 747 1,314 895 871 1,104 765 1,017 1,426
Gross Revenue AUD M 683.4 31.9 36.8 41.1 35.0 30.3 39.0 40.2 39.6 43.7 38.6 31.1 31.3 24.1 25.1 34.0 31.7 17.7 26.1 27.5 21.1 24.5 11.4 1.5
Sel l ing expenses AUD M 4.9 0.3 0.3 0.3 0.2 0.3 0.3 0.3 0.2 0.2 0.3 0.2 0.2 0.1 0.2 0.2 0.2 0.1 0.2 0.2 0.2 0.3 0.2 0.0
Royalty AUD M 17.9 0.9 1.0 1.0 1.0 0.8 1.1 1.0 1.1 1.2 1.1 0.7 0.9 0.7 0.7 0.8 0.9 0.5 0.7 0.6 0.6 0.7 0.3 0.0
Net Revenue AUD M 660.7 30.7 35.5 39.8 33.8 29.2 37.6 39.0 38.4 42.2 37.3 30.2 30.3 23.3 24.3 33.0 30.6 17.1 25.2 26.7 20.3 23.6 11.0 1.5
PRE-TAX CASHFLOW
Quarterly AUD M 351.0 11.7 19.2 22.6 20.1 10.7 24.1 25.4 24.6 26.7 22.4 15.9 15.4 10.0 11.1 19.9 17.5 4.1 12.2 13.5 6.9 12.7 4.1 0.2
Cumulative AUD M 11.7 30.9 53.6 73.7 84.4 108.6 133.9 158.5 185.2 207.6 223.5 238.9 248.8 259.9 279.8 297.3 301.4 313.5 327.1 334.0 346.7 350.8 351.0
NPV
Discount rate % p.a 5.0%
PV quarterly cashflow AUD M 11.6 18.7 21.8 19.2 10.1 22.4 23.3 22.3 23.9 19.8 13.9 13.2 8.5 9.3 16.5 14.3 3.3 9.7 10.7 5.4 9.8 3.1 0.2
NPV AUD M 310.9
202720262022 2023 2024 2025
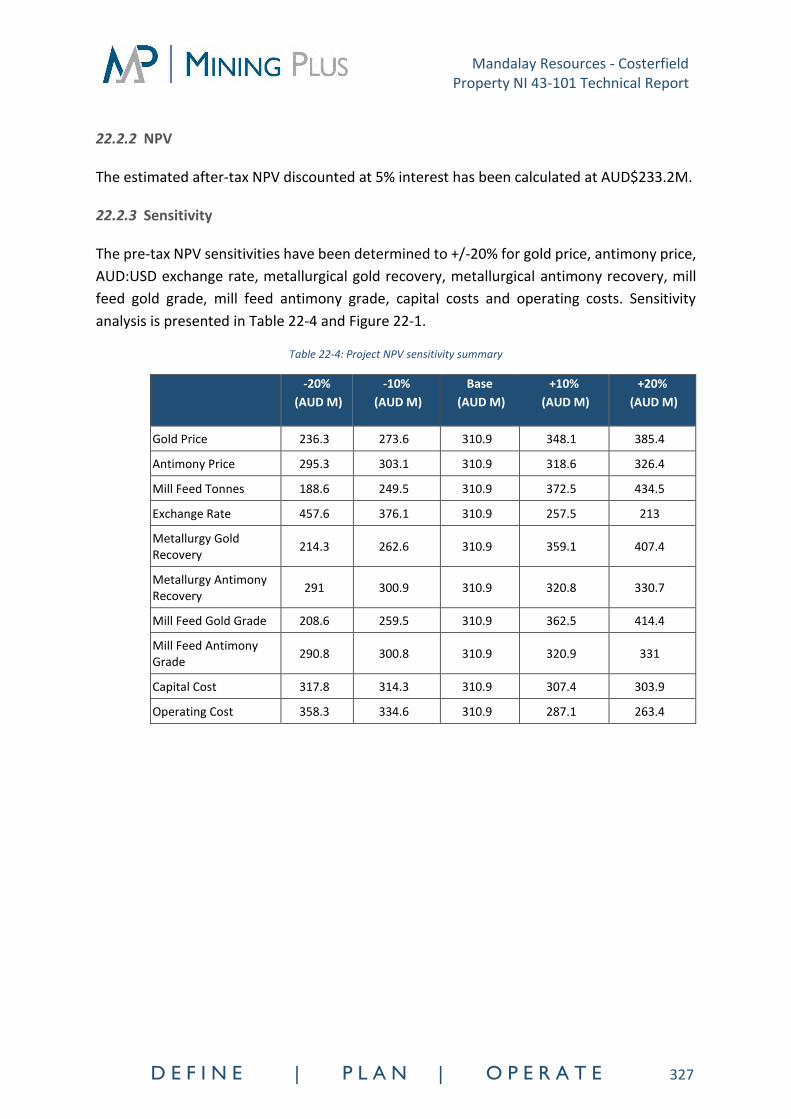
Mandalay Resources - Costerfield Property NI 43-101 Technical Report
D E F I N E | P L A N | O P E R A T E 327
22.2.2 NPV
The estimated after-tax NPV discounted at 5% interest has been calculated at AUD$233.2M.
22.2.3 Sensitivity
The pre-tax NPV sensitivities have been determined to +/-20% for gold price, antimony price,
AUD:USD exchange rate, metallurgical gold recovery, metallurgical antimony recovery, mill
feed gold grade, mill feed antimony grade, capital costs and operating costs. Sensitivity
analysis is presented in Table 22-4 and Figure 22-1.
Table 22-4: Project NPV sensitivity summary
-20%
(AUD M)
-10%
(AUD M)
Base
(AUD M)
+10%
(AUD M)
+20%
(AUD M)
Gold Price 236.3 273.6 310.9 348.1 385.4
Antimony Price 295.3 303.1 310.9 318.6 326.4
Mill Feed Tonnes 188.6 249.5 310.9 372.5 434.5
Exchange Rate 457.6 376.1 310.9 257.5 213
Metallurgy Gold Recovery
214.3 262.6 310.9 359.1 407.4
Metallurgy Antimony Recovery
291 300.9 310.9 320.8 330.7
Mill Feed Gold Grade 208.6 259.5 310.9 362.5 414.4
Mill Feed Antimony Grade
290.8 300.8 310.9 320.9 331
Capital Cost 317.8 314.3 310.9 307.4 303.9
Operating Cost 358.3 334.6 310.9 287.1 263.4

Mandalay Resources - Costerfield Property NI 43-101 Technical Report
D E F I N E | P L A N | O P E R A T E 328
Figure 22-1: Sensitivity analysis
Cashflow is most sensitive to mill feed tonnes, exchange rate, metallurgical gold recovery and
mill feed gold grade.

Mandalay Resources - Costerfield Property NI 43-101 Technical Report
D E F I N E | P L A N | O P E R A T E 329
23 ADJACENT PROPERTIES
Mandalay Resources manages the Costerfield Operation and holds a 100% interest in licences
MIN4644, MIN5567, EL5432, and EL5519, which comprise the Property. There are no
advanced projects in the immediate vicinity of the Property, and there are no other Augusta-
style antimony-gold operations in production within the Costerfield district.
Exploration on adjacent tenements (EL5546, EL006504, EL006280, EL5490, EL006001, EL6951,
EL7352, EL007348, EL007366, EL007382, EL007498, EL007499 and EL007481), are shown in
Figure 23-1. The ownership and status of each of the surrounding ELs are detailed in Table
23-1.
Figure 23-1: Augusta Mine adjacent properties (Geovic, 2022)

Mandalay Resources - Costerfield Property NI 43-101 Technical Report
D E F I N E | P L A N | O P E R A T E 330
Table 23-1: Ownership details – Augusta Mine adjacent properties
Title Owner Status First Granted Expiry
EL5490 Golden Camel Mining Pty Ltd
Current 23/08/2013 5/12/2023
EL006504 Kirkland Lake Gold Current 19/03/2018 19/03/2023
EL007352 Fosterville Gold Mine Pty Ltd
Under Application
EL007348 Syndicate Minerals Pty Ltd Under Application
EL007382 Syndicate Minerals Pty Ltd Under Application
EL007498 Nagambie Resources Ltd Current 28/05/21 27/05/26
EL007499 Nagambie Resources Ltd Current 28/05/21 27/05/26
EL007481 Torrens Gold Exploration Ltd
Under Application
EL007366 Torrens Gold Exploration Ltd
Granted 15/03/21 14/03/26
EL5546 Nagambie Mining Current 8/05/2017 7/05/2022
EL006001 AIS Resources Aust Pty Ltd Current 01/10/2015 30/09/2025
EL006280 Mercator Gold Australia Pty Ltd
Current 11/07/2017 10/07/2022
EL6951 Petrartherm Ltd Under Application
Mandalay Resources - Costerfield Property NI 43-101 Technical Report
D E F I N E | P L A N | O P E R A T E 331
24 OTHER RELEVANT DATA AND INFORMATION
There is no other relevant data or information material to the Costerfield Property that has
not been documented in the other sections of this Technical Report.

Mandalay Resources - Costerfield Property NI 43-101 Technical Report
D E F I N E | P L A N | O P E R A T E 332
25 INTERPRETATION AND CONCLUSIONS
The QPs summarise here the results and interpretations of the information and analysis being
reported on.
25.1 Geology and the Mineral Resource
The Costerfield Property is contained within a broad gold-antimony province mainly confined
to the Siluro-Devonian Melbourne Zone. The mineralisation occurs as narrow veins or lodes,
typically less than 50 cm wide and hosted within mudstone and siltstone of the Lower Silurian
Costerfield Formation.
Gold mineralisation of greater than 20 g/t with an average grade of approximately 9 g/t is
typically hosted within and/or alongside veined stibnite that contains approximately 4%
antimony.
Mineralised shoots at the Costerfield Property are structurally controlled by the intersection
of the lodes with major cross-cutting, puggy, and sheared fault structures. Exploration in the
Property is guided by predictions of where these fault/lode intersections might be located
using data from structural/geological mapping, diamond drill hole logging and 3D computer
modelling.
During 2021, Mandalay drilled a total of 36.3 kilometres of exploration diamond core at a cost
of $6.0 million. The breakdown of this significant drilling campaign is as follows:
• 27.0 km to test extensions of the Youle and Shepherd orebodies;
• 2.6 km to test other near-mine targets; and
• 6.7 km to test regional targets beyond current mine operations.
In addition to drilling, 4,585 m of on-vein development was completed within the Youle ore
body, with 75 m development from October 2021, into the Shepherd ore body. Rock chip
samples used in mine grade control were also included in the geological database and used
in the MRE process to improve resource classification in areas accessed by development.
All relevant diamond drill holes and underground face samples in the Costerfield Property,
available as of 6 December 2021 for the Augusta, Cuffley, Brunswick, and Youle Deposits, and
as of 17 December 2021 for the Shepherd Deposit, were used to inform the MRE. The Mineral
Resource is estimated as of December 31, 2021, with depletion through to this date.
The in-situ Augusta, Cuffley, Brunswick, Youle and Shepard Deposits plus stockpiles consist of
a combined Measured and Indicated Mineral Resource of 1,387,000 tonnes at 10.6 g/t gold

Mandalay Resources - Costerfield Property NI 43-101 Technical Report
D E F I N E | P L A N | O P E R A T E 333
and 2.8% antimony, and an Inferred Mineral Resource of 532,000 tonnes at 6.7 g/t gold and
1.3% antimony.
The MRE is reported at a cut-off grade of 3.0 g/t gold equivalent (AuEq), after diluting to a
minimum mining width of 1.2 m.
The gold equivalence formula used is calculated using recoveries achieved at the Costerfield
Property Brunswick Processing Plant during 2020, and is as follows:
𝐴𝑢𝐸𝑞 = 𝐴𝑢 (𝑔/𝑡) + 1.58 × 𝑆𝑏 (%)
Commodity prices used in the equivalence formula are USD$1,700/ounce gold and
USD$8,500/tonne for antimony, and 2021 total year metal recoveries of 93% for Au and 95%
for Sb.
The reasonable prospects for eventual economic extraction (RPEEE) has been satisfied by
applying the minimum mining width of 1.2 m and ensuring that isolated blocks above cut-off
grade, which are unlikely to ever be mined due to distance from the main body of
mineralisation, were excluded from the Mineral Resource.
The width of 1.2 m is the practical minimum mining width applied at the Costerfield Property
for stoping. For blocks with widths less than 1.2 m, diluted grades were estimated by adding
a waste envelope with zero grade and 2.76 t/m3 bulk density (Youle and Shepherd) to the
lode.
The QP for the Mineral Resource considers that the geological and assay data used as input
to the Mineral Resource Estimate have been collected, interpreted and estimated in line with
best practice as defined by the CIM (CIM 2018, 2019). Data verification work showed the
geological data are suitable for use as input to the Mineral Resource Estimate. Validation of
the MRE block model showed good agreement with the input data. A retrospective
reconciliation exercise showed good agreement between 2021 production tonnes and grades
with the equivalent tonnes and grades reported out of the current block model.
Additionally, the QP for the Mineral Resource considers that the key risk to the operation is
being able to maintain the resource base to stay ahead of ongoing mining depletion, and does
not consider any other significant risks or uncertainties could reasonably be expected to affect
the reliability or confidence in the exploration information or Mineral Resource Estimate.
25.2 Mining, Ore Reserve and the Mining Schedule
Mining Plus makes the following observations regarding the mining operations:
• Inferred resources have not been included in the economic evaluation,

Mandalay Resources - Costerfield Property NI 43-101 Technical Report
D E F I N E | P L A N | O P E R A T E 334
• There has been a history of conversion of Inferred to Indicated Resources resulting in
additional Resources from outside the Mineral Reserve being included into the life of
mine plans that have the potential to improve the project economics.
• Mandalay Resources has demonstrated an ability to improve the mining method and
productivity based on continuing to increase and improve the geological information
and thus mine designs and planning.
25.3 Mineral Processing & Metallurgical Testwork
Mining Plus makes the following observations regarding the processing aspects of the
operation:
• The Brunswick Concentrator is a conventional flotation style concentrator
incorporating a gravity gold recovery circuit. It has a well demonstrated production
record of consistent throughput and metallurgical recoveries across a range of feed
types. The forecast LoM feed is similar to the ores historically processed and the
metallurgical behaviours of the Youle ores are not expected to materially change.
Mining Plus consider that the processing facility is, and will remain, amenable to
processing the LoM ores.
• The updated antimony and gold feed grade versus metallurgical recovery algorithms
used for the 2022 Mineral Reserve Estimation, budgeting and forecasting purposes
utilises a much smaller operational dataset from the 2021 calendar year, but better
reflects the forecast LoM Youle dominated feed and incorporates the recovery
enhancement projects completed in the period. Mining Plus endorses its use for the
purposes of the Mineral Reserve Estimation.
• The forecast throughput and associated processing costs reflects the historical
capacity of the plant and are appropriate for use as metallurgical modifying factors for
the Mineral Reserve Estimate.

Mandalay Resources - Costerfield Property NI 43-101 Technical Report
D E F I N E | P L A N | O P E R A T E 335
26 RECOMMENDATIONS
26.1 Geology
The Costerfield Property is an advanced operation and Mandalay Resources has a history of
successful exploration and mining on the Property. The QP for the Mineral Resource Estimate
has observed that the degree of technical competency evident in the work performed by
Mandalay Resources geologists is high, particularly in the structural analysis of the local
geology.
Improvements made in 2021 have addressed recommendations made in the 2021 NI43-101
report. No further technical geology recommendations are required at this point.
Ongoing exploration work programmes targeting additions to the Mineral Resource are
planned in 2022 at the Costerfield Property by Mandalay Resources. A total of approximately
$8M USD for 40k diamond drill metres is budgeted for exploration in 2022 in support of both
near-mine and regional target testing.
Near Mine Exploration:
It is recommended that near-mine targets continue to be developed and tested along the
Augusta-Cuffley-Brunswick-Youle-Shepherd corridor for mineralisation proximal to existing
infrastructure.
The Shepherd deposit series of lodes were major exploration additions to the MRE in 2021
and remains open in almost all directions. Additional testing and infilling of the vein system is
recommended to identify potential upsides along strike and at depth.
Regional Exploration:
The Costerfield Property covers several kilometres of area around the current operation that
is prospective for additional Au-Sb and Au-only styles of mineralisation and includes extensive
historical workings. It is recommended that a pipeline of targets should continue to be
conceptualised and explored for by the exploration team.
This proposed workplan and budget is in-line with previous years in which resource addition
has outpaced resource depletion and therefore, the QP considers that it should be sufficient
to sustain the Costerfield Mine operation.
26.2 Mining
Mining Plus makes the following recommendations regarding the mining operations:

Mandalay Resources - Costerfield Property NI 43-101 Technical Report
D E F I N E | P L A N | O P E R A T E 336
• Mining Plus recommends that Mandalay Resources continually reviews the activity
cost centres to optimise the cut-off grades to enhance the value generation of the
project the review.
• Investigate the practicalities of an analysis of the mine economics through a Net
Smelter Return (NSR) value, this will allow for greater flexibility the mine design and
identify higher value material to process.
• Investigate the bottlenecks at the operation to identify opportunities to increase the
profitability of the mine.
26.3 Mineral Processing & Metallurgical Testwork
Mining Plus recommends that Mandalay continue to update the gold and antimony
metallurgical recovery algorithms annually based on actual production data. These
relationships should then be applied to any mineral reserve estimate and LoM production
schedule updates.
This is particularly relevant this 2022 calendar year in order to expand the operating dataset,
as the feed blend will continue to be dominated by the Youle underground ore for the full 12
months, and will incorporate the recovery benefits now being realised through the
completion of the two upgrade projects; the additional StackCell® primary rougher flotation
cells, and the installation of additional CavTube® flotation cells on the final tailings.
Mandalay has reliably undertaken annual metallurgical recovery algorithm updates. This
exercise has contributed to the reliable forecasting of antimony and gold recoveries over
many years.

Mandalay Resources - Costerfield Property NI 43-101 Technical Report
D E F I N E | P L A N | O P E R A T E 337
27 REFERENCES
AMC Consultants Pty Ltd, 2008. Resource estimate of the Augusta Deposit, Costerfield
Victoria Australia (author R Webster), Technical Report prepared for AGD Operations.
Bertoli, O., Vann, J., & Dunham, S. 2003. Two-dimensional geostatistical methods—theory,
practice and a case study from the 1A shoot nickel deposit, Leinster, Western Australia.
In 5th International Mining Geology Conference.
Biosis Research, 2005. Flora, Fauna and habitat hectare values of native vegetation at Peels
Lane, Costerfield South, Victoria.
Britannica, The Editors of Encyclopaedia. "antimony". Encyclopedia Britannica, 5 Jan. 2022,
https://www.britannica.com/science/antimony. Accessed 10 February 2022.
CIM, 2018. CIM Mineral Exploration Best Practice Guidelines. Canadian Institute of Mining,
Metallurgy and Petroleum, West Westmount, Quebec, Canada, www.cim.org.
CIM, 2019. CIM Estimation of Mineral Resources and Mineral Reserves Best Practice
Guidelines. Canadian Institute of Mining, Metallurgy and Petroleum, West Westmount,
Quebec, Canada, www.cim.org.
Department of Mines and Petroleum, 2013. Refuge chambers in underground mines —
guideline: Resources Safety, Department of Mines and Petroleum, Western Australia, 41 pp.
Edwards, J., Wohlt, K.E., Slater, K.R., Olshina, A., and Hutchinson, D.F., 1998. Heathcote and
parts of Woodend and Echuca 1:100,000 map area geological report. Geological Survey of
Victoria Report No. 108.
Fredericksen D., 2009. Costerfield Gold and Antimony Project, Augusta and Brunswick
Deposits. Fredericksen Geological Solutions Pty Ltd.
Fredericksen D., 2011. Augusta Project Mineral Resource Estimate for Mandalay Resources –
Costerfield Operations. Fredericksen Geological Solutions Pty Ltd.
Glacken I., 2020. Resource Estimation and Evaluation. Short Course. Optiro Pty Ltd.
Haines Surveys, 2005. Job 0599 Costerfield Gravity Survey. AGD Operations Pty Ltd.
Hanson N., February 1995. Costerfield Project Brunswick Reef Mine Resource Modelling and
Estimations. Imago, Unpub. Report for Australian Gold Development NL.
Hu, Z. and Qi, L., 2014. 15.5 - Sample Digestion Methods, Treatise on Geochemistry (Second
Edition)

Mandalay Resources - Costerfield Property NI 43-101 Technical Report
D E F I N E | P L A N | O P E R A T E 338
Huxtable D., August 1972. Ore Potential of Brunswick Reef. Internal Mid-East Minerals NL
report.
Lipton, I.T. and Horton, J.A., 2014. Measurement of bulk density for resource estimation –
methods, guidelines and quality control. Mineral Resource and Ore Reserve Estimation – The
AusIMM Guide to Good Practice. 2nd edition, Monograph 30.
Kitch R., 2001. Independent Fairness Valuation of Costerfield Joint Venture. Rob Kitch and
Associates Pty Ltd Unpublished Report for AGD Mining Ltd.
Mining Plus, 2021, Mandalay Resources - Costerfield Property; NI 43-101 Technical Report, 31
March 2021.
Reuters, 2018, Russia’s top gold miner wants to become global player in antimony market,
https://www.mining.com/web/russias-top-gold-miner-wants-become-global-player-
antimony-market/
Roskill, 2020, Antimony: Outlook to 2030, 14th edition, 2020.
Sandford, A. C., & Holloway, D. J., 2006. Early Silurian phacopide trilobites from central
Victoria, Australia. Memoirs of Museum Victoria, 63(2), 215-255.
Shakesby R.A., 1998. Notes on Visit to the Costerfield Project, 23rd and 24th July 1998.
Unpublished Report for AGD Mining Pty Ltd.
SRK, 2017. Mandalay Resources Corporation, Costerfield Operation, Victoria, Australia; NI 43-
101 Technical Report. 31 March 2017.
SRK, 2018. Mandalay Resources Corporation, Costerfield Operation, Victoria, Australia; NI 43-
101 Technical Report. 29 March 2018.
SRK, 2019. Mandalay Resources Corporation, Costerfield Operation, Victoria, Australia; NI 43-
101 Technical Report. 28 March 2019.
SRK, 2020. Mandalay Resources Corporation, Costerfield Operation, Victoria, Australia; NI 43-
101 Technical Report. 30 March 2020.
Stock E. and Zaki N., 1972. Antimony Dispersion Patterns at Costerfield. Mining and Geological
Journal Vol. 7 No. 2 (1972) Geological Survey of Victoria.
Stockton I., August 1998. Brunswick Shear Project Prefeasibility Study.
Stoker P.T., 2006. Newmont Australia Technical Services Sampling Notes. AMC Report.
January 2006, 03-05pp.

Mandalay Resources - Costerfield Property NI 43-101 Technical Report
D E F I N E | P L A N | O P E R A T E 339
Systems Exploration Project #40, 2005; Petrophysical Results Mesoscale Laboratory Data,
October 2005.
Talent, J.A., 1965. The Silurian and Early Devonian faunas of the Heathcote district Victoria.
Geological Survey of Victoria Memoir 26. Department of Mines, Victoria, 55 pp.
Thomas D.E., 1937. Some notes on the Silurian Rocks of the Heathcote Area. Mining and
Geological Journal Vol. 1 No. 1 Geological Survey of Victoria.
Thomas D.E., 1941. Parish of Costerfield 1:31,680 Geological Map. Mines Department of
Victoria.
UTS, 2008. UTS Geophysics Logistics Report for a Detailed Magnetic, Radiometric and Digital
Terrain Survey for the Costerfield Project, carried out on behalf of AGD Operations Pty Ltd.
(UTS Job #B054).
Vandenberg A.H.M, Willman CE, Maher S, Simons BA, Cayley RA, Taylor DH, Morand VJ,
Moore DH & Radojkovic A, 2000. The Tasman Fold Belt System in Victoria. Geological Survey
of Victoria Special Publication.
VandenBerg, A.H.M, 1988. Palaeozoic stratotectonic map of Victoria. Geological Survey of
Victoria.
Weber and Associates, December 2004. Resource Calculations: Brunswick Mine Area (2004).
For AGD Operations Pty Limited.
Webster R., 2008. Resource estimate of the Augusta Deposit, Costerfield Victoria Australia.
Technical Report prepared for AGD Operations. AMC Consultants Pty Ltd.
Welch, S.I., Higgins, D.V., Callaway, G.A. (eds), 2011. Surface Geology of Victoria 1:250 000.
Geological Survey of Victoria, Department of Primary Industries
Zonge, 2012. Report No. 944, Costerfield Downhole Induced Polarisation and Downhole Self
Potential Surveys, Logistics Summary. November 2011 for Mandalay Resources, Compiled by
S Mann, March 2012, Zonge Engineering and Research Organisation (Australia) Pty Ltd.

CERTIFICATE OF QUALIFIED PERSON
I, Andrew Fowler, Ph.D., MAusIMM, CP(Geo), do hereby certify that:
1. I am currently employed as a Principal Geologist with Mining Plus, Level 17, 127 Creek Street, Brisbane,
Queensland, Australia;
2. This certificate applies to the Technical Report titled “Mandalay Resources – Costerfield Property, NI43-101
Technical Report” (the “Technical Report”) prepared for Mandalay Resources (“the Issuer”), which has an
effective date of 31 December 2021 – the date of the most recent technical information;
3. I am a graduate of the University of Melbourne (Ph.D., 2004). I am a Chartered Professional in the discipline of Geology and a registered member of the Australasian Institute of Mining and Metallurgy. I have practiced my profession continuously since November 2004. My relevant experience includes two years as Exploration Geologist with a junior greenfields explorer, Mithril Resources, two years as Project Geologist/Head Geologist with the Costerfield gold-antimony mine operated by AGD Operations, eight years as a Senior Geologist with AMC Consultants Pty Ltd, one year as Manager of Mineral Resources at MMG Las Bambas, and three years as Principal Geologist at Mining Plus. I have read the definition of "qualified person" set out in National Instrument 43-101 (NI 43-101) and certify that by reason of my education, affiliation with a professional association (as defined in NI 43-101) and past relevant work experience, I fulfil the requirements to be a "qualified person" for the purposes of NI 43-101;
4. I completed a personal inspection of the Property from the 17 to 18 December 2020;
5. I am responsible for Items 2 to 12, Items 14, 20 and 23 and for sections pertaining thereto in Item 1 and
Items 24 to 27;
6. I am independent of the Issuer and related companies applying all of the tests in Section 1.5 of the NI 43-
101;
7. I have had prior involvement with the property that is the subject of the Technical Report in my role as
Project Geologist/Head Geologist from 2006 to 2008 at the Costerfield gold-antimony mine, which was then
operated by AGD Operations;
8. I have read NI 43-101, and the Technical Report has been prepared in compliance with NI 43-101 and Form
43-101F1;
9. As of the effective date of the Technical Report and the date of this certificate, to the best of my
knowledge, information and belief, this Technical Report contains all scientific and technical information
that is required to be disclosed to make the Technical Report not misleading.
Effective Date: 31 December 2021
Signing Date: 25 March 2021
(Signed) Andrew Fowler, Ph.D., MAusIMM, CP(Geo)

CERTIFICATE OF QUALIFIED PERSON
I, Aaron Spong FAusIMM CP(Mining), do hereby certify that:
1. I am currently employed as a Principal Mining Consultant and Manager – Underground Mining with Mining
Plus Pty Ltd, Level 14, 500 Collins Street, Melbourne, Victoria 3000, Australia;
2. This certificate applies to the Technical Report titled “Mandalay Resources – Costerfield Property, NI43-101
Technical Report” (the “Technical Report”) prepared for Mandalay Resources (“the Issuer”), which has an
effective date of 31 December 2021 – the date of the most recent technical information;
3. I graduated from University of Ballarat in 2001 with a Bachelor Degree in Engineering (Mining). I am a member and Chartered Professional (Mining) in good standing with the Australasian Institute of Mining and Metallurgy (Membership No: 307001). I have practiced professionally since graduation in 2001. In that time, I have been directly involved in the construction of infrastructure at the Telfer Gold mine and the Leinster Nickel mine. I have also been directly in involved in the operation of the Agnew Gold mine for 5 years. I have been employed Mining Plus Pty Ltd for the last 12 years and have contributed to relevant studies in gold, copper and nickel. I have read the definition of "qualified person" set out in National Instrument 43-101 (NI 43-101) and certify that by reason of my education, affiliation with a professional association (as defined in NI 43-101) and past relevant work experience, I fulfil the requirements to be a "qualified person" for the purposes of NI 43-101;
4. I have visited the Costerfield Project site;
5. I am responsible for Items 15, 16, 18, 19, 21 and 22 and for sections pertaining thereto in Item 1 and Items
25 to 27 of the Technical Report;
6. I am independent of the Issuer and related companies applying all of the tests in Section 1.5 of the NI 43-
101;
7. I have read NI 43-101, and the Technical Report has been prepared in compliance with NI 43-101 and Form
43-101F1;
8. As of the effective date of the Technical Report and the date of this certificate, to the best of my
knowledge, information and belief, this Technical Report contains all scientific and technical information
that is required to be disclosed to make the Technical Report not misleading.
Effective Date: 31 December 2021
Signing Date: 24 March 2022
(Signed) Aaron Spong, BEng (Mining), FAusIMM CP (Min)

CERTIFICATE OF QUALIFIED PERSON
I, Simon Walsh, BSc (Extractive Metallurgy), MBA Hons, MAusIMM CP(Met), GAICD, do hereby certify that:
1. I am currently employed as a Principal Metallurgist and Director with Simulus Engineers with a business
address of 82 John St, Welshpool, Western Australia, 6106, and have been engaged by Mining Plus, Level
17, 127 Creek Street, Brisbane, Queensland, Australia, 4000;
2. This certificate applies to the Technical Report titled “Mandalay Resources – Costerfield Property, NI43-101
Technical Report” (the “Technical Report”) prepared for Mandalay Resources (“the Issuer”), which has an
effective date of 31 December 2021 – the date of the most recent technical information;
3. I am a graduate of Murdoch University and Curtin University, Western Australia. I am a Chartered Professional member in good standing of the Australasian Institute of Mining & Metallurgy (MAusIMM CP(Met), member number 226023). My relevant experience is over 25 years in mineral processing, process engineering and extractive metallurgy. Of particular relevance for the study in support of the practical experience, I have spent the past 16 years in consulting roles at Simulus Engineers in a similar capacity. Furthermore, I have undertaken the annual technical review of this site since 2015 and am familiar with the operation;
4. I have read the definition of "qualified person" set out in National Instrument 43-101 (NI 43-101) and certify that by reason of my education, affiliation with a professional association (as defined in NI 43-101) and past relevant work experience, I fulfil the requirements to be a "qualified person" for the purposes of NI 43-101;
5. My most recent personal inspection of the Property was on 1 September 2015;
6. I am responsible for Items 13 and 17, and sections pertaining thereto in Item 18 that form part of the
Technical Report;
7. I am independent of the Issuer and related companies applying all of the tests in Section 1.5 of the NI 43-
101;
8. I have no prior involvement with the property that is the subject of the Technical Report other than that
stated;
9. I have read NI 43-101, and the Technical Report has been prepared in compliance with NI 43-101 and Form
43-101F1;
10.As of the effective date of the Technical Report and the date of this certificate, to the best of my
knowledge, information and belief, this Technical Report contains all scientific and technical information
that is required to be disclosed to make the Technical Report not misleading;
Effective Date: 31 December 2021
Signing Date: 23 March 2022
(Signed) Simon Walsh, BSc (Extractive Metallurgy), MBA Hons, MAusIMM CP(Met), GAICD

CERTIFICATE OF QUALIFIED PERSON
I, Richard Buerger, MAIG, BSc., do hereby certify that:
1. I am the Manager – Resources with Navarre Minerals Ltd and previously employed as Manager – Geology
with Mining Plus;
2. This certificate applies to the Technical Report titled “Mandalay Resources – Costerfield Property, NI43-101
Technical Report” (the “Technical Report”) prepared for Mandalay Resources (“the Issuer”), which has an
effective date of 31 December 2021 – the date of the most recent technical information;
3. I graduated in 1997 from the University of WA with a Bachelor of Science degree with Honours majoring in Geology. I have worked as a geologist in the field of mineral exploration, resource estimation and underground and open pit production mine geologist for over 20 years, specialising in gold, nickel sulphide and base metal deposits;
4. I am a Member of the Australian Institute of Geoscientists (MAIG);
5. I have read the definition of "qualified person" set out in National Instrument 43-101 (NI 43-101) and certify that by reason of my education, affiliation with a professional association (as defined in NI 43-101) and past relevant work experience, I fulfil the requirements to be a "qualified person" for the purposes of NI 43-101;
6. My most recent personal inspection of the Property was 23rd September 2021;
7. I am responsible for Item 12 and those sections of items 1 and 25 to 27 pertaining thereto;
8. I am independent of the Issuer and related companies applying all of the tests in Section 1.5 of the NI 43-
101;
9. I have had prior involvement with the property having completed a number of site inspections and QAQC
training courses in late 2020 and early 2021;
10.I have read NI 43-101, and the Technical Report has been prepared in compliance with NI 43-101 and Form
43-101F1;
11.As of the effective date of the Technical Report and the date of this certificate, to the best of my
knowledge, information and belief, this Technical Report contains all scientific and technical information
that is required to be disclosed to make the Technical Report not misleading;
Effective Date: 31 December 2021
Signing Date: 25 March 2021
(Signed) Richard Buerger, MAIG, BSc.


![[5437]-101 M.Sc ENVIRONMENTAL SCIENCE EVSC 101](https://static.fdokumen.com/doc/165x107/631d8020ec7900c0c80d1eb7/5437-101-msc-environmental-science-evsc-101.jpg)