Costerfield Operation, Victoria, Australia NI 43 ... - Mining News
234
Costerfield Operation, Victoria, Australia NI 43-101 Technical Report Prepared for: Mandalay Resources Corporation 76 Richmond Street Toronto ONTARIO MSC1P1 Canada Prepared by: SRK Consulting (Australia) Pty Ltd ABN 56 074 271 720 Level 1, 10 Richardson Street West Perth Western Australia 6005 SRK Project Number: PLI028 Qualified Persons: Anne-Marie Ebbels, BEng (Mining), MAusIMM(CP), Principal Consultant Simon Walsh, BSc (Extractive Metallurgy & Chemistry), MBA (Hons), MAusIMM (CP), GAICD, Associate Principal Consultant (Metallurgy) Danny Kentwell, MSc Mathematics & Planning (Geostatistics), FAusIMM, Principal Consultant Date of Report: 6 February 2019
-
Upload
khangminh22 -
Category
Documents
-
view
2 -
download
0
Transcript of Costerfield Operation, Victoria, Australia NI 43 ... - Mining News
Costerfield Operation, Victoria, AustraliaNI 43-101 Technical Report
Prepared for:
Mandalay Resources Corporation76 Richmond Street
Toronto ONTARIO MSC1P1 Canada
Prepared by:
SRK Consulting (Australia) Pty Ltd
ABN 56 074 271 720Level 1, 10 Richardson Street
West Perth Western Australia 6005
SRK Project Number: PLI028
Qualified Persons:
Anne-Marie Ebbels, BEng (Mining), MAusIMM(CP), Principal Consultant
Simon Walsh, BSc (Extractive Metallurgy & Chemistry), MBA (Hons), MAusIMM (CP),
GAICD, Associate Principal Consultant (Metallurgy)
Danny Kentwell, MSc Mathematics & Planning (Geostatistics), FAusIMM, Principal
Consultant
Date of Report: 6 February 2019
SRK Consulting Page ii
KENT/WALS/FAIR/EBBE/wulr PLI028_Costerfield Operations_NI-43 101 Technical Report_2018_Rev1 6 February 2019
Date and Signature Page
SRK Project Number: PLI028
SRK Consulting (Australasia) Pty Ltd
Level 1, 10 Richardson StreetWest Perth Western Australia 6005
Mandalay Resources Corporation
Costerfield OperationVictoria, Australia
NI 43-101 Technical Report
Project Manager: Anne-Marie Ebbels
Date of Report: 6 February 2019
Effective Date: 1 December 2018
Signature Qualified Persons:
Danny Kentwell, MSc Mathematics & Planning (Geostatistics), FAusIMM, Principal Consultant
Simon Walsh, BSc (Extractive Metallurgy & Chemistry), MBA, MAusIMM(CP), GAICD, Associate Principal Consultant
Anne-Marie Ebbels, BEng (Mining), MAusIMM (CP), Principal Consultant
SRK Consulting Page iii
KENT/WALS/FAIR/EBBE/wulr PLI028_Costerfield Operations_NI-43 101 Technical Report_2018_Rev1 6 February 2019
Important NoticeThis Technical Report has been prepared as a National Instrument 43-101 Technical Report, as
prescribed in Canadian Securities Administrators’ National Instrument 43-101, Standards of
Disclosure for Mineral Projects (NI 43-101) for Mandalay Resources Corporation. The data,
information, estimates, conclusions and recommendations contained herein, as prepared and
presented by the Authors, are consistent with:
Information available at the time of preparation
Data supplied by outside sources, which has been verified by the authors as applicable
The assumptions, conditions and qualifications set forth in this Technical Report.
CAUTIONARY NOTE WITH RESPECT TO FORWARD-LOOKING INFORMATION
This document contains forward-looking information as defined in applicable securities laws.
Forward-looking information includes, but is not limited to, statements with respect to the future
production, costs and expenses of the project; the other economic parameters of the project, as set
out in this technical report, including; the success and continuation of exploration activities, including
drilling; estimates of mineral reserves and mineral resources; the future price of gold; government
regulations and permitting timelines; requirements for additional capital; environmental risks; and
general business and economic conditions. Often, but not always, forward-looking information can be
identified by the use of words such as plans, expects, is expected, budget, scheduled, estimates,
continues, forecasts, projects, predicts, intends, anticipates or believes, or variations of, or the
negatives of, such words and phrases, or statements that certain actions, events or results may, could,
would, should, might or will be taken, occur or be achieved. Forward-looking information involves
known and unknown risks, uncertainties and other factors which may cause the actual results,
performance or achievements to be materially different from any of the future results, performance or
achievements expressed or implied by the forward-looking information. These risks, uncertainties and
other factors include, but are not limited to: the assumptions underlying the production estimates not
being realized, decrease of future gold prices, cost of labour, supplies, fuel and equipment rising, the
availability of financing on attractive terms, actual results of current exploration, changes in project
parameters, exchange rate fluctuations, delays and costs inherent to consulting and accommodating
rights of local communities, title risks, regulatory risks and uncertainties with respect to obtaining
necessary permits or delays in obtaining same, and other risks involved in the gold production,
development and exploration industry, as well as those risk factors discussed in Mandalay Resources
Corporation’s latest Annual Information Form and its other SEDAR filings from time to time. Forward-
looking information is based on a number of assumptions which may prove to be incorrect, including,
but not limited to: the availability of financing for Mandalay Resources Corporation’s production,
development and exploration activities; the timelines for Mandalay Resources Corporation’s
exploration and development activities on the property; the availability of certain consumables and
services; assumptions made in mineral resource and mineral reserve estimates, including geological
interpretation grade, recovery rates, price assumption, and operational costs; and general business
and economic conditions. All forward-looking information herein is qualified by this cautionary
statement. Accordingly, readers should not place undue reliance on forward-looking information.
Mandalay Resources Corporation and the authors of this technical report undertake no obligation to
update publicly or otherwise revise any forward-looking information whether as a result of new
information or future events or otherwise, except as may be required by applicable law.
SRK Consulting Page iv
KENT/WALS/FAIR/EBBE/wulr PLI028_Costerfield Operations_NI-43 101 Technical Report_2018_Rev1 6 February 2019
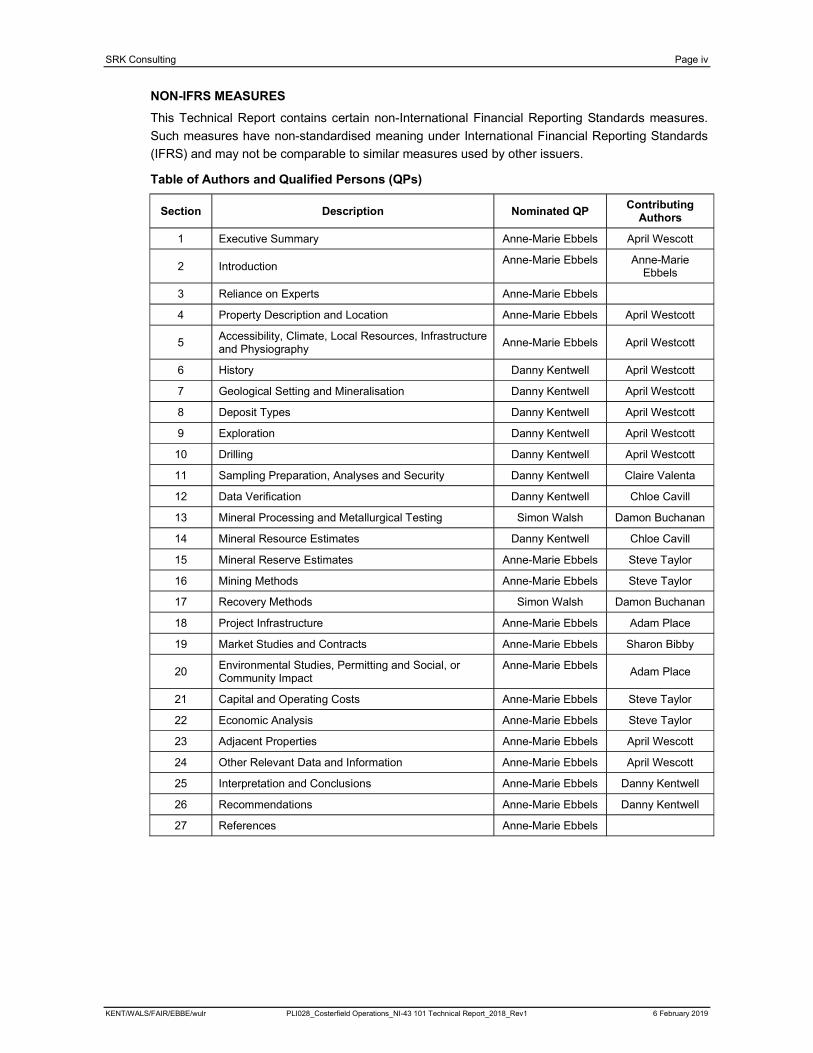
NON-IFRS MEASURES
This Technical Report contains certain non-International Financial Reporting Standards measures.
Such measures have non-standardised meaning under International Financial Reporting Standards
(IFRS) and may not be comparable to similar measures used by other issuers.
Table of Authors and Qualified Persons (QPs)
Section Description Nominated QPContributing
Authors
1 Executive Summary Anne-Marie Ebbels April Wescott
2 IntroductionAnne-Marie Ebbels Anne-Marie
Ebbels
3 Reliance on Experts Anne-Marie Ebbels
4 Property Description and Location Anne-Marie Ebbels April Westcott
5 Accessibility, Climate, Local Resources, Infrastructure and Physiography
Anne-Marie Ebbels April Westcott
6 History Danny Kentwell April Westcott
7 Geological Setting and Mineralisation Danny Kentwell April Westcott
8 Deposit Types Danny Kentwell April Westcott
9 Exploration Danny Kentwell April Westcott
10 Drilling Danny Kentwell April Westcott
11 Sampling Preparation, Analyses and Security Danny Kentwell Claire Valenta
12 Data Verification Danny Kentwell Chloe Cavill
13 Mineral Processing and Metallurgical Testing Simon Walsh Damon Buchanan
14 Mineral Resource Estimates Danny Kentwell Chloe Cavill
15 Mineral Reserve Estimates Anne-Marie Ebbels Steve Taylor
16 Mining Methods Anne-Marie Ebbels Steve Taylor
17 Recovery Methods Simon Walsh Damon Buchanan
18 Project Infrastructure Anne-Marie Ebbels Adam Place
19 Market Studies and Contracts Anne-Marie Ebbels Sharon Bibby
20Environmental Studies, Permitting and Social, or Community Impact
Anne-Marie EbbelsAdam Place
21 Capital and Operating Costs Anne-Marie Ebbels Steve Taylor
22 Economic Analysis Anne-Marie Ebbels Steve Taylor
23 Adjacent Properties Anne-Marie Ebbels April Wescott
24 Other Relevant Data and Information Anne-Marie Ebbels April Wescott
25 Interpretation and Conclusions Anne-Marie Ebbels Danny Kentwell
26 Recommendations Anne-Marie Ebbels Danny Kentwell
27 References Anne-Marie Ebbels

SRK Consulting Page v
KENT/WALS/FAIR/EBBE/wulr PLI028_Costerfield Operations_NI-43 101 Technical Report_2018_Rev1 6 February 2019
List of AbbreviationsAbbreviation Meaning
2D two dimensional
3D three dimensional
AAS atomic absorption spectroscopy
AGD AGD Mining Pty Ltd
ALS ALS Minerals
AMC AMC Consultants Pty Ltd
Amdel Amdel Limited Mineral Services Laboratory
AMML Australian Minmet Metallurgical Laboratories
ANFO ammonium nitrate-fuel oil
As Arsenic
ASL above sea level
Au gold
AUD Australian dollar
AuEq gold equivalent
BBMWi Bond Ball Mill Work Index
BEng Bachelor of Engineering
BSc Bachelor of Science
BV Bureau Veritas
CIM Canadian Institute of Mining, Metallurgy and Petroleum
CRF cemented rock fill
CV Coefficient of Variation
dBA A-weighted decibels - expression of the relative loudness of sounds in air as perceived by the human ear
DEDJTR Department of Economic Development, Jobs, Transport and Resources
DTM digital terrain model
EPA Environmental Protection Agency
ERC Environmental Review Committee
EVCs Ecological Vegetation Classes
FAR fresh air rise
FAusIMM Fellow of The Australasian Institute of Mining and Metallurgy
FSP Fan Static Pressure
g/t grams per tonne
GAICD Graduate of the Australian Institute of Company Directors
GDip Graduate Diploma
Genalysis Genalysis Laboratory Services
Geostats Geostats Pty Ltd
GPS global positioning system
Ha Hectare
HBr hydrobromic acid
HCl hydrochloric acid
SRK Consulting Page vi
KENT/WALS/FAIR/EBBE/wulr PLI028_Costerfield Operations_NI-43 101 Technical Report_2018_Rev1 6 February 2019
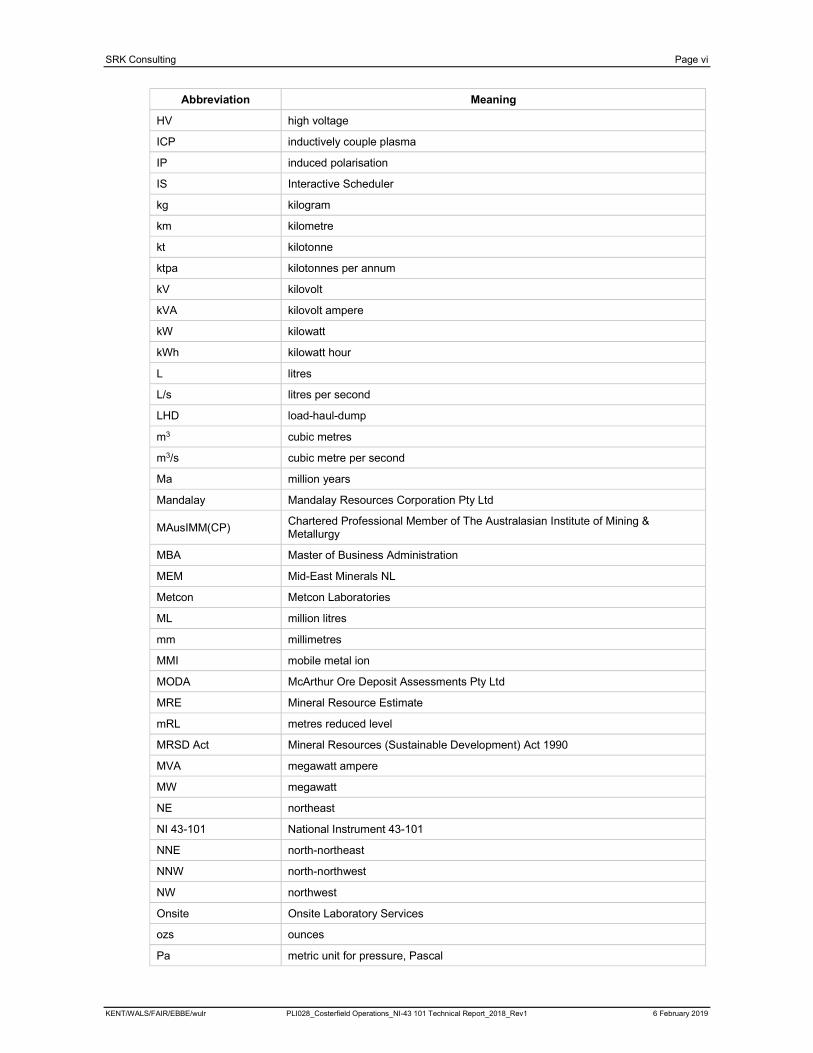
Abbreviation Meaning
HV high voltage
ICP inductively couple plasma
IP induced polarisation
IS Interactive Scheduler
kg kilogram
km kilometre
kt kilotonne
ktpa kilotonnes per annum
kV kilovolt
kVA kilovolt ampere
kW kilowatt
kWh kilowatt hour
L litres
L/s litres per second
LHD load-haul-dump
m3 cubic metres
m3/s cubic metre per second
Ma million years
Mandalay Mandalay Resources Corporation Pty Ltd
MAusIMM(CP)Chartered Professional Member of The Australasian Institute of Mining & Metallurgy
MBA Master of Business Administration
MEM Mid-East Minerals NL
Metcon Metcon Laboratories
ML million litres
mm millimetres
MMI mobile metal ion
MODA McArthur Ore Deposit Assessments Pty Ltd
MRE Mineral Resource Estimate
mRL metres reduced level
MRSD Act Mineral Resources (Sustainable Development) Act 1990
MVA megawatt ampere
MW megawatt
NE northeast
NI 43-101 National Instrument 43-101
NNE north-northeast
NNW north-northwest
NW northwest
Onsite Onsite Laboratory Services
ozs ounces
Pa metric unit for pressure, Pascal
SRK Consulting Page vii
KENT/WALS/FAIR/EBBE/wulr PLI028_Costerfield Operations_NI-43 101 Technical Report_2018_Rev1 6 February 2019
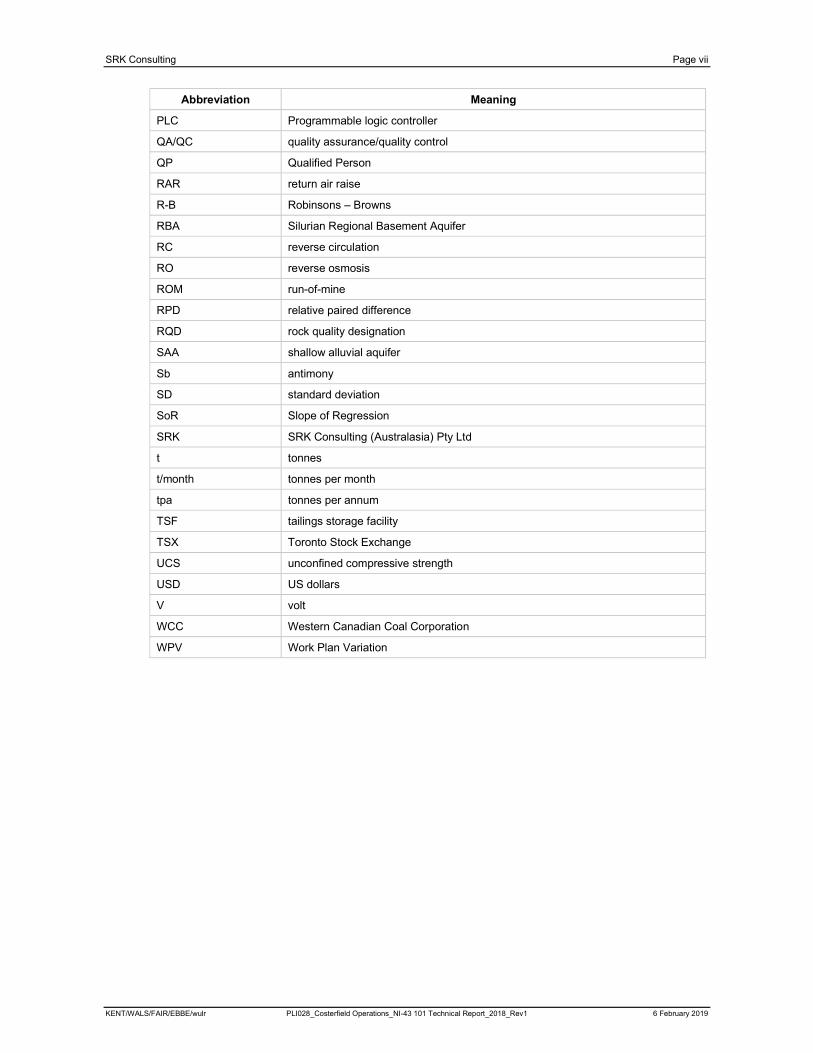
Abbreviation Meaning
PLC Programmable logic controller
QA/QC quality assurance/quality control
QP Qualified Person
RAR return air raise
R-B Robinsons – Browns
RBA Silurian Regional Basement Aquifer
RC reverse circulation
RO reverse osmosis
ROM run-of-mine
RPD relative paired difference
RQD rock quality designation
SAA shallow alluvial aquifer
Sb antimony
SD standard deviation
SoR Slope of Regression
SRK SRK Consulting (Australasia) Pty Ltd
t tonnes
t/month tonnes per month
tpa tonnes per annum
TSF tailings storage facility
TSX Toronto Stock Exchange
UCS unconfined compressive strength
USD US dollars
V volt
WCC Western Canadian Coal Corporation
WPV Work Plan Variation

SRK Consulting Page viii
KENT/WALS/FAIR/EBBE/wulr PLI028_Costerfield Operations_NI-43 101 Technical Report_2018_Rev1 6 February 2019
Table of Contents
Important Notice.......................................................................................................................................... iii
List of Abbreviations..................................................................................................................................... v
1 Executive Summary ..................................................................................................... 1
1.1 Introduction ......................................................................................................................................... 1
1.2 Property Description and Location...................................................................................................... 1
1.3 Accessibility, Climate, Local Resources, Infrastructure and Physiography........................................ 1
1.4 History ................................................................................................................................................. 2
1.5 Geological Setting and Mineralisation................................................................................................. 2
1.6 Deposit Types ..................................................................................................................................... 3
1.7 Mineral Resource Estimates ............................................................................................................... 3
1.8 Mining Methods................................................................................................................................... 4
1.9 Mineral Reserve Estimate................................................................................................................... 5
1.10 Metallurgy and Recovery Methods ..................................................................................................... 5
1.11 Project Infrastructure........................................................................................................................... 7
1.12 Underground Infrastructure................................................................................................................. 7
1.13 Services .............................................................................................................................................. 7
1.14 Contracts............................................................................................................................................. 8
1.15 Environmental Studies, Permitting and Social Impacts ...................................................................... 8
1.16 Capital and Operating Costs............................................................................................................... 8
1.17 Offsite Costs........................................................................................................................................ 9
1.18 Economic Analysis.............................................................................................................................. 9
1.19 Adjacent Properties............................................................................................................................. 9
1.20 Other Relevant Data and Information ...............................................................................................10
1.21 Interpretation and Conclusions .........................................................................................................10
1.22 Recommendations ............................................................................................................................10
2 Introduction ................................................................................................................11
2.1 Scope of Work...................................................................................................................................11
2.2 Work program ...................................................................................................................................12
2.3 Basis of Technical Report .................................................................................................................12
2.4 Qualifications of SRK and SRK Team ..............................................................................................12
2.5 Acknowledgements...........................................................................................................................13
2.6 Declaration........................................................................................................................................13
3 Reliance on Other Experts.........................................................................................15
3.1 Marketing ..........................................................................................................................................15
4 Property Description and Location...........................................................................16
4.1 Property location ...............................................................................................................................16
4.2 Land tenure.......................................................................................................................................17

SRK Consulting Page ix
KENT/WALS/FAIR/EBBE/wulr PLI028_Costerfield Operations_NI-43 101 Technical Report_2018_Rev1 6 February 2019
4.3 Underlying agreements.....................................................................................................................19
4.4 Environmental liability .......................................................................................................................19
4.5 Royalties ...........................................................................................................................................20
4.6 Taxes ................................................................................................................................................20
4.7 Legislation and permitting .................................................................................................................20
5 Accessibility, Climate, Local Resources, Infrastructure and Physiography.........22
5.1 Accessibility.......................................................................................................................................22
5.2 Land use ...........................................................................................................................................22
5.3 Topography.......................................................................................................................................22
5.4 Climate ..............................................................................................................................................22
5.5 Infrastructure and local resources.....................................................................................................23
6 History .........................................................................................................................26
6.1 Introduction .......................................................................................................................................26
6.2 Ownership and exploration work.......................................................................................................26
6.2.1 Mid-East Minerals (1968–1971) ............................................................................................27
6.2.2 Metals Investment Holdings (1971).......................................................................................27
6.2.3 Victorian Mines Department (1975–1981) ............................................................................27
6.2.4 Federation Resources NL (1983–2000)................................................................................27
6.2.5 Australian Gold Development NL/Planet resource JV (AGD) (1987–1988) .........................27
6.2.6 Australian Gold Development NL (AGD) (1987–1997) .........................................................27
6.2.7 AGD Operations Pty Ltd (2001–2009) ..................................................................................27
6.3 Historical Resource and Reserve estimates.....................................................................................33
6.4 Historical production..........................................................................................................................35
7 Geological Setting and Mineralisation......................................................................36
7.1 Regional Geology..............................................................................................................................36
7.2 Property Geology ..............................................................................................................................36
7.3 Stratigraphy of the Costerfield Formation .........................................................................................40
7.4 Structural Geology of the South Costerfield area .............................................................................42
7.5 Structural Geology of Brunswick area...............................................................................................42
7.6 Structural Geology of Youle area......................................................................................................44
8 Deposit Types.............................................................................................................45
8.1 Property mineralisation .....................................................................................................................45
8.2 Deposit mineralisation.......................................................................................................................48
9 Exploration..................................................................................................................57
9.1 Costean/ trenching............................................................................................................................57
9.2 Petrophysical analysis ......................................................................................................................57
9.3 Geophysics .......................................................................................................................................57
9.3.1 Ground geophysics ...............................................................................................................57
9.3.2 Airborne geophysics..............................................................................................................58
9.4 Geochemistry ....................................................................................................................................58
SRK Consulting Page x
KENT/WALS/FAIR/EBBE/wulr PLI028_Costerfield Operations_NI-43 101 Technical Report_2018_Rev1 6 February 2019
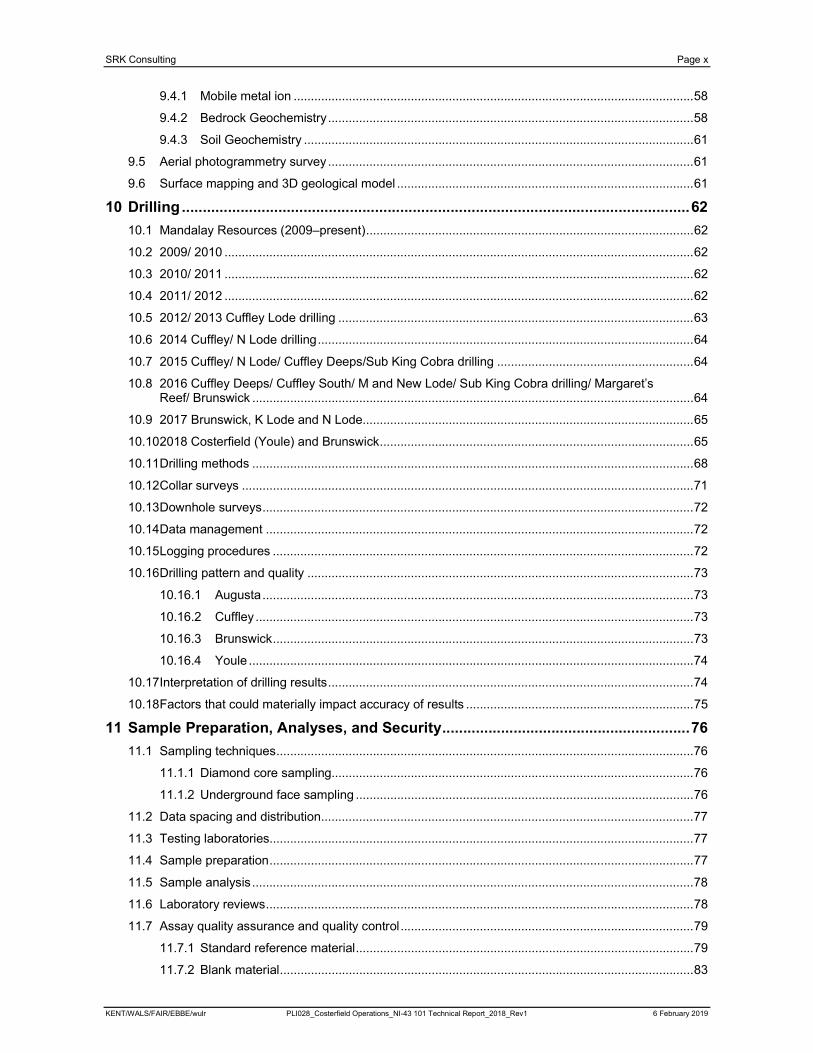
9.4.1 Mobile metal ion ....................................................................................................................58
9.4.2 Bedrock Geochemistry..........................................................................................................58
9.4.3 Soil Geochemistry .................................................................................................................61
9.5 Aerial photogrammetry survey ..........................................................................................................61
9.6 Surface mapping and 3D geological model ......................................................................................61
10 Drilling.........................................................................................................................62
10.1 Mandalay Resources (2009–present)...............................................................................................62
10.2 2009/ 2010 ........................................................................................................................................62
10.3 2010/ 2011 ........................................................................................................................................62
10.4 2011/ 2012 ........................................................................................................................................62
10.5 2012/ 2013 Cuffley Lode drilling .......................................................................................................63
10.6 2014 Cuffley/ N Lode drilling.............................................................................................................64
10.7 2015 Cuffley/ N Lode/ Cuffley Deeps/Sub King Cobra drilling .........................................................64
10.8 2016 Cuffley Deeps/ Cuffley South/ M and New Lode/ Sub King Cobra drilling/ Margaret’s Reef/ Brunswick ................................................................................................................................64
10.9 2017 Brunswick, K Lode and N Lode................................................................................................65
10.10 2018 Costerfield (Youle) and Brunswick...........................................................................................65
10.11 Drilling methods ................................................................................................................................68
10.12 Collar surveys ...................................................................................................................................71
10.13 Downhole surveys.............................................................................................................................72
10.14 Data management ............................................................................................................................72
10.15 Logging procedures ..........................................................................................................................72
10.16 Drilling pattern and quality ................................................................................................................73
10.16.1 Augusta.............................................................................................................................73
10.16.2 Cuffley ...............................................................................................................................73
10.16.3 Brunswick..........................................................................................................................73
10.16.4 Youle ................................................................................................................................. 74
10.17 Interpretation of drilling results..........................................................................................................74
10.18 Factors that could materially impact accuracy of results ..................................................................75
11 Sample Preparation, Analyses, and Security...........................................................76
11.1 Sampling techniques.........................................................................................................................76
11.1.1 Diamond core sampling.........................................................................................................76
11.1.2 Underground face sampling ..................................................................................................76
11.2 Data spacing and distribution............................................................................................................77
11.3 Testing laboratories...........................................................................................................................77
11.4 Sample preparation...........................................................................................................................77
11.5 Sample analysis................................................................................................................................78
11.6 Laboratory reviews............................................................................................................................78
11.7 Assay quality assurance and quality control.....................................................................................79
11.7.1 Standard reference material..................................................................................................79
11.7.2 Blank material........................................................................................................................83
SRK Consulting Page xi
KENT/WALS/FAIR/EBBE/wulr PLI028_Costerfield Operations_NI-43 101 Technical Report_2018_Rev1 6 February 2019
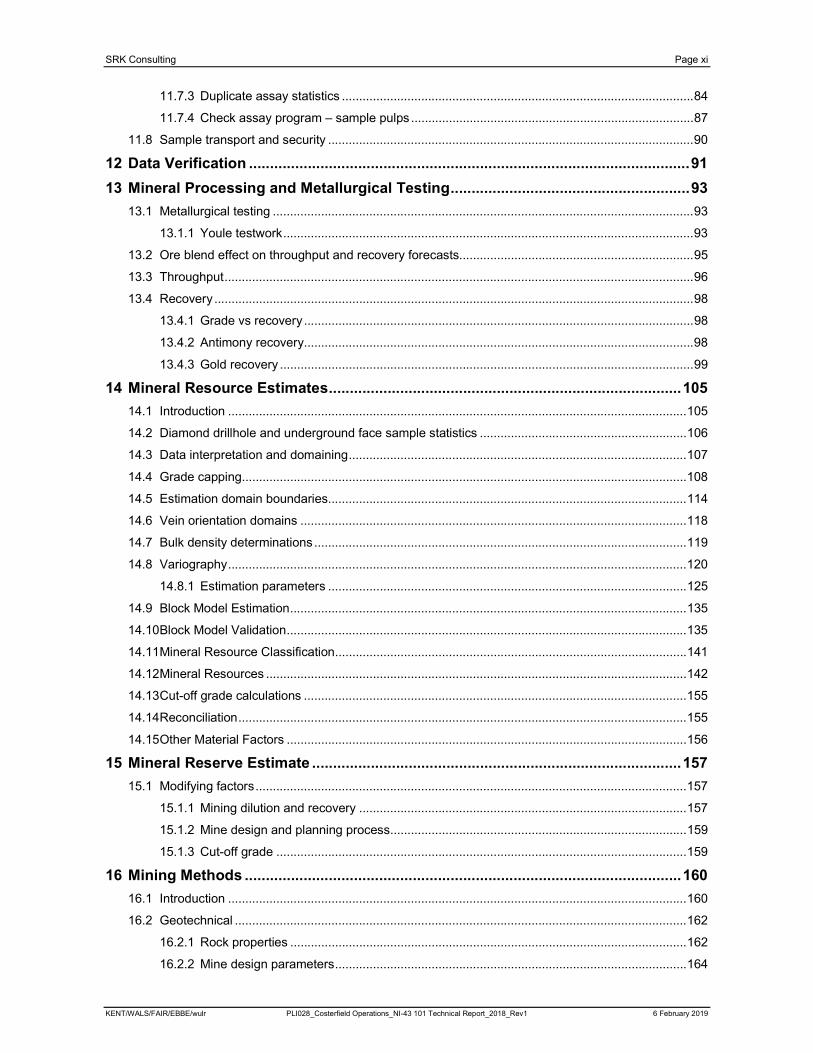
11.7.3 Duplicate assay statistics ......................................................................................................84
11.7.4 Check assay program – sample pulps ..................................................................................87
11.8 Sample transport and security ..........................................................................................................90
12 Data Verification .........................................................................................................91
13 Mineral Processing and Metallurgical Testing.........................................................93
13.1 Metallurgical testing ..........................................................................................................................93
13.1.1 Youle testwork.......................................................................................................................93
13.2 Ore blend effect on throughput and recovery forecasts....................................................................95
13.3 Throughput........................................................................................................................................96
13.4 Recovery ...........................................................................................................................................98
13.4.1 Grade vs recovery.................................................................................................................98
13.4.2 Antimony recovery.................................................................................................................98
13.4.3 Gold recovery ........................................................................................................................99
14 Mineral Resource Estimates....................................................................................105
14.1 Introduction .....................................................................................................................................105
14.2 Diamond drillhole and underground face sample statistics ............................................................106
14.3 Data interpretation and domaining..................................................................................................107
14.4 Grade capping................................................................................................................................. 108
14.5 Estimation domain boundaries........................................................................................................114
14.6 Vein orientation domains ................................................................................................................118
14.7 Bulk density determinations ............................................................................................................119
14.8 Variography.....................................................................................................................................120
14.8.1 Estimation parameters ........................................................................................................125
14.9 Block Model Estimation...................................................................................................................135
14.10 Block Model Validation....................................................................................................................135
14.11 Mineral Resource Classification......................................................................................................141
14.12 Mineral Resources ..........................................................................................................................142
14.13 Cut-off grade calculations ...............................................................................................................155
14.14 Reconciliation..................................................................................................................................155
14.15 Other Material Factors ....................................................................................................................156
15 Mineral Reserve Estimate ........................................................................................157
15.1 Modifying factors.............................................................................................................................157
15.1.1 Mining dilution and recovery ...............................................................................................157
15.1.2 Mine design and planning process......................................................................................159
15.1.3 Cut-off grade .......................................................................................................................159
16 Mining Methods ........................................................................................................160
16.1 Introduction .....................................................................................................................................160
16.2 Geotechnical ...................................................................................................................................162
16.2.1 Rock properties ...................................................................................................................162
16.2.2 Mine design parameters......................................................................................................164
SRK Consulting Page xii
KENT/WALS/FAIR/EBBE/wulr PLI028_Costerfield Operations_NI-43 101 Technical Report_2018_Rev1 6 February 2019
16.2.3 Ground support ...................................................................................................................166
16.3 Mine design.....................................................................................................................................167
16.3.1 Method selection .................................................................................................................167
16.3.2 Method description..............................................................................................................167
16.3.3 Materials handling ...............................................................................................................168
16.4 Mine design guidelines ...................................................................................................................168
16.4.1 Level development ..............................................................................................................169
16.4.2 Vertical development...........................................................................................................169
16.4.3 Stoping ................................................................................................................................169
16.4.4 Mine design inventory .........................................................................................................169
16.5 Ventilation .......................................................................................................................................173
16.5.1 Ventilation circuit .................................................................................................................173
16.6 Backfill .............................................................................................................................................175
16.7 Mineral Reserve schedule ..............................................................................................................176
16.7.1 Development schedule........................................................................................................176
16.7.2 Equipment requirements .....................................................................................................176
16.7.3 Personnel ............................................................................................................................176
16.8 Schedule summary .........................................................................................................................177
17 Recovery Methods....................................................................................................178
17.1 Brunswick Processing Plant............................................................................................................178
17.1.1 Crushing and screening circuit............................................................................................178
17.1.2 Milling circuit........................................................................................................................178
17.1.3 Flotation circuit ....................................................................................................................178
17.1.4 Concentrate thickening and filtration...................................................................................179
17.1.5 Tailings circuit......................................................................................................................179
17.1.6 Throughput ..........................................................................................................................179
17.1.7 Recovery .............................................................................................................................179
17.1.8 Concentrate grade...............................................................................................................180
17.2 Services ..........................................................................................................................................180
17.2.1 Water...................................................................................................................................180
17.2.2 Air ........................................................................................................................................180
17.2.3 Power ..................................................................................................................................180
17.3 Plant upgrades................................................................................................................................183
17.3.1 Crushing and screening circuit............................................................................................183
17.3.2 Milling circuit........................................................................................................................183
17.3.3 Flotation circuit ....................................................................................................................183
17.3.4 Concentrate thickening and filtration...................................................................................183
17.3.5 Tailings circuit......................................................................................................................183
17.3.6 Recovery projects................................................................................................................184
17.3.7 Reagent mixing and storage ...............................................................................................184
SRK Consulting Page xiii
KENT/WALS/FAIR/EBBE/wulr PLI028_Costerfield Operations_NI-43 101 Technical Report_2018_Rev1 6 February 2019
18 Project Infrastructure ...............................................................................................185
18.1 Surface infrastructure......................................................................................................................185
18.2 Underground infrastructure .............................................................................................................187
18.2.1 Secondary means of egress ...............................................................................................187
18.2.2 Refuge chambers ................................................................................................................187
18.2.3 Compressed air ...................................................................................................................187
18.2.4 Ventilation system ...............................................................................................................188
18.2.5 Dewatering system..............................................................................................................188
18.2.6 Infrastructure .......................................................................................................................189
18.3 Tailings storage...............................................................................................................................189
18.4 Power supply...................................................................................................................................189
18.5 Water supply ...................................................................................................................................190
18.6 Water management.........................................................................................................................191
18.7 Waste rock storage .........................................................................................................................191
18.8 Augusta to Brunswick ROM Pad transport .....................................................................................191
18.9 Diesel storage ................................................................................................................................. 191
18.10 Explosives storage..........................................................................................................................191
18.11 Maintenance facilities......................................................................................................................192
18.12 Housing and land ............................................................................................................................192
19 Market Studies and Contracts.................................................................................193
19.1 Concentrate Transport ....................................................................................................................193
19.2 Marketing ........................................................................................................................................193
19.3 Contracts.........................................................................................................................................196
20 Environmental Studies, Permitting, and Social or Community Impact ...............197
20.1 Environment and social aspects .....................................................................................................197
20.1.1 Mine ventilation ...................................................................................................................197
20.1.2 Water disposal.....................................................................................................................197
20.1.3 Waste rock ..........................................................................................................................198
20.1.4 Tailings disposal..................................................................................................................198
20.1.5 Air quality.............................................................................................................................198
20.1.6 Groundwater........................................................................................................................199
20.1.7 Noise ...................................................................................................................................200
20.1.8 Blasting and vibration..........................................................................................................200
20.1.9 Native vegetation.................................................................................................................200
20.1.10 Visual amenity.................................................................................................................200
20.1.11 Heritage...........................................................................................................................200
20.1.12 Community ......................................................................................................................201
20.1.13 Mine closure and revegetation........................................................................................201
20.2 Regulatory approvals ......................................................................................................................202
20.2.1 Work Plan Variation.............................................................................................................202
SRK Consulting Page xiv
KENT/WALS/FAIR/EBBE/wulr PLI028_Costerfield Operations_NI-43 101 Technical Report_2018_Rev1 6 February 2019
20.2.2 Other permitting...................................................................................................................202
21 Capital and Operating Costs ...................................................................................203
21.1 Capital costs....................................................................................................................................203
21.1.1 Processing plant..................................................................................................................203
21.1.2 Administration......................................................................................................................203
21.1.3 Environmental .....................................................................................................................204
21.1.4 Mining..................................................................................................................................204
21.1.5 Capital development............................................................................................................204
21.1.6 Closure ................................................................................................................................204
21.2 Operating costs ...............................................................................................................................204
21.2.1 Lateral development............................................................................................................205
21.2.2 Production stoping...............................................................................................................205
21.2.3 Mining administration ..........................................................................................................205
21.2.4 Geology ...............................................................................................................................206
21.2.5 ROM haulage ......................................................................................................................206
21.3 Processing plant..............................................................................................................................206
21.4 Site services....................................................................................................................................206
21.5 General and Administration ............................................................................................................206
21.6 Selling expenses.............................................................................................................................206
22 Economic Analysis...................................................................................................207
23 Adjacent Properties..................................................................................................208
23.1 General statement about adjacent properties.................................................................................208
24 Other Relevant Data and Information .....................................................................210
24.1 Remnant mining..............................................................................................................................210
25 Interpretation and Conclusions...............................................................................211
25.1 Geology...........................................................................................................................................211
25.2 Mining..............................................................................................................................................212
26 Recommendations ...................................................................................................213
26.1 Geology...........................................................................................................................................213
26.2 Mining..............................................................................................................................................213
27 References ................................................................................................................214
List of TablesTable 1-1: Mineral Resources at Costerfield, inclusive of Mineral Reserves, as at 1 December 2018 ........4
Table 1-2: Mineral Reserves at Costerfield as at 1 December 2018 ............................................................5
Table 1-3: Costerfield operation – Capital cost estimate ..............................................................................8
Table 1-4: Costerfield operation – Operating cost estimate..........................................................................9
Table 2-1: List of Qualified Persons ............................................................................................................14
SRK Consulting Page xv
KENT/WALS/FAIR/EBBE/wulr PLI028_Costerfield Operations_NI-43 101 Technical Report_2018_Rev1 6 February 2019
Table 4-1: Tenement details........................................................................................................................17
Table 4-2: Total liability bond calculations for 2018 ....................................................................................20
Table 6-1: Historical drilling statistics for the Costerfield Property..............................................................26
Table 6-2: Historical Mineral Resources – Mandalay Resources – Costerfield Project..............................34
Table 6-3: Historical Mineral Reserves – Mandalay Resources – Costerfield Project................................34
Table 6-4: Historical production – Mandalay Resources – Costerfield Project...........................................35
Table 10-1: Drilling summary ........................................................................................................................62
Table 10-2: Significant intercepts in Brunswick (BD holes) and Youle (BC holes) – 2018 ...........................66
Table 11-1: Summary of Onsite duplicate gold statistics ..............................................................................84
Table 11-2: Summary of Onsite duplicate antimony statistics ......................................................................85
Table 11-3: Summary statistics for gold assays – Onsite original vs Onsite duplicate, ALS, BV duplicates ...................................................................................................................................88
Table 11-4: Summary statistics for antimony assays – Onsite original vs Onsite duplicate, ALS, BV duplicates ...................................................................................................................................88
Table 13-1: Brunswick samples vs current operational data ........................................................................94
Table 13-2: Brunswick processing plant - key processing results – Jan 2014 to Dec 2018.......................101
Table 14-1: Changes to models at year-end 2018......................................................................................105
Table 14-2: Face and diamond drilling sample statistics ............................................................................106
Table 14-3: Sample statistics of the data selected for analysis in K Lode..................................................107
Table 14-4: Sample statistics before and after application of top-cuts .......................................................109
Table 14-5: Variogram model parameters ..................................................................................................126
Table 14-6: Search parameters for top-cut estimate...................................................................................129
Table 14-7: Search parameters for influence limitation estimate................................................................134
Table 14-8: Block Model dimensions ..........................................................................................................135
Table 14-9: Declustered thickness-weighted, composited sample grades and widths compared to estimated model grades and true thickness values.................................................................137
Table 14-10: Mineral Resources, inclusive of Mineral Reserves, as at 1 December 2018 ..........................143
Table 14-11: Augusta, Cuffley and Brunswick Mineral Resource, inclusive of Mineral Reserves................143
Table 15-1: Mineral Reserves – Costerfield – as at 1 December 2018 ......................................................157
Table 15-2: Costerfield Mine – recovery and dilution assumptions ............................................................158
Table 16-1: Stope and development inventory by lode...............................................................................169
Table 16-2: Development and stoping inventory by level for all lodes........................................................170
Table 16-3: Development rates...................................................................................................................176
Table 16-4: Underground mobile equipment fleet.......................................................................................176
Table 16-5: Summary of design physicals ..................................................................................................177
Table 18-1: Current Augusta licence maximum quantities and types of explosives...................................192
Table 20-1: Permit requirements.................................................................................................................202
Table 21-1: Costerfield Operation – Capital cost estimate .........................................................................203
Table 21-2: Operating cost inputs ...............................................................................................................204
Table 21-3: Summary of development requirements..................................................................................205
Table 23-1: Ownership of Augusta mine adjacent properties .....................................................................208
Table 23-2: Distance from Augusta mine site to other mining projects in the region..................................209
SRK Consulting Page xvi
KENT/WALS/FAIR/EBBE/wulr PLI028_Costerfield Operations_NI-43 101 Technical Report_2018_Rev1 6 February 2019
List of FiguresFigure 1-1: Cuffley/ Augusta and Brunswick blend feed grade vs. recoveries 2014 to 2018.........................6
Figure 4-1: Location of Costerfield operation ...............................................................................................16
Figure 4-2: Plan of Aaea – Mining Licence No. 4644...................................................................................18
Figure 4-3: Current Mining and Exploration Lease boundaries showing two exploration licence applications to the east and west of current tenures ................................................................. 19
Figure 5-1: Monthly average temperature and rainfall .................................................................................23
Figure 5-2: Augusta mine box-cut, portal and workshop..............................................................................24
Figure 5-3: Aerial view of Brunswick Processing Plant and Brunswick open pit..........................................24
Figure 7-1: Geological map of the Heathcote – Colbinabbin – Nagambie region........................................37
Figure 7-2: Costerfield Property geology and old workings .........................................................................39
Figure 7-3: Regional stratigraphic chart of the Costerfield region illustrating age relationships of defined sedimentary succession of the Darraweit Guim Province ............................................40
Figure 7-4: Stratigraphic column of the Costerfield Formation illustrating the relative positions of newly defined (informal) stratigraphic units................................................................................41
Figure 7-5: Cross section through Brunswick system showing progressive panel offsets with depth .........43
Figure 7-6: Cross section through the Costerfield system showing west-dipping Youle and Doyle systems ......................................................................................................................................44
Figure 8-1: Paragenetic history and vein genesis of the Costerfield region.................................................46
Figure 8-2: Two views of E Lode (1070 mRL looking south) with annotation on right-hand side ................47
Figure 8-3: Close-up of mineralisation in west-dipping E Lode (1070 mRL looking south) .........................47
Figure 8-4: Cuffley deposit looking north – 895L C2 North lode ..................................................................50
Figure 8-5: Plan view of Augusta, Cuffley, Brunswick and Youle lodes.......................................................51
Figure 8-6: Cross section 5880N showing Brunswick Main Lode and the K-R panel..................................52
Figure 8-7: Brunswick ore drive photo at 966 N mRL ..................................................................................53
Figure 8-8: Cross section through Costerfield system showing west-dipping Youle and Doyle lode systems54
Figure 8-9: Deposit wireframes ....................................................................................................................55
Figure 8-10: Structural relationship between the Augusta, Cuffley and Brunswick lode systems .................56
Figure 10-1: Known drillhole collar locations for Augusta and Cuffley lodes .................................................69
Figure 10-2: Known drillhole collar locations for Youle Lode .........................................................................70
Figure 10-3: Known drillhole collar locations for the Brunswick Lode ............................................................71
Figure 10-44: Example of cross section at 4,300 mN post drilling geological interpretation of the Augusta deposit .........................................................................................................................74
Figure 11-1: GSB-02 Au standard reference material – assay results for 2018 ............................................80
Figure 11-2: G310-6 Au standard reference material – assay results for 2018 .............................................80
Figure 11-3: MR04/6 Au standard reference material – assay results for 2018 ............................................81
Figure 11-4: MR-C1 Au standard reference material – assay results for 2018..............................................81
Figure 11-5: MR-F1 Au standard reference material – assay results for 2018 ..............................................81
Figure 11-6: GSB-02 Sb standard reference material – assay results for 2018 ............................................82
Figure 11-7: MR04/6 Sb standard reference material – assay results for 2018 ............................................82
Figure 11-8: MR-C1 Sb standard reference material – assay results for 2018..............................................82
SRK Consulting Page xvii
KENT/WALS/FAIR/EBBE/wulr PLI028_Costerfield Operations_NI-43 101 Technical Report_2018_Rev1 6 February 2019
Figure 11-9: MR-F1 Sb standard reference material – assay results for 2018 ..............................................83
Figure 11-10: Gold Blank assay results for 2018 .............................................................................................83
Figure 11-11: Antimony Blank assay results for 2017......................................................................................84
Figure 11-12: Scatter plot for Onsite gold duplicates – 2018 ...........................................................................85
Figure 11-13: Relative paired difference plot for Onsite gold duplicates – 2018 .............................................86
Figure 11-14: Scatter plot for Onsite antimony duplicates – 2018 ...................................................................86
Figure 11-15: Relative paired difference plot for Onsite antimony duplicates – 2018......................................87
Figure 11-16: Relative pair difference plot for Onsite original vs Onsite duplicate, ALS, BV gold duplicates ...................................................................................................................................88
Figure 11-17: Relative pair difference plot for Onsite original vs Onsite duplicate, ALS, BV antimony duplicates ...................................................................................................................................89
Figure 11-18: Scatter plot for Onsite original vs Onsite duplicate, ALS, BV gold duplicates ...........................89
Figure 11-19: Scatter plot for Onsite original vs Onsite duplicate, ALS, BV antimony duplicates ...................90
Figure 12-1: Cuffley Main lower drive south end showing mineralised structures (gold-bearing quartz – pink, stibnite – yellow) and bedding.............................................................................92
Figure 13-1: Youle high grade testwork sample locations .............................................................................95
Figure 13-2: Youle low grade testwork sample locations...............................................................................95
Figure 13-3: Historical Brunswick processing plant throughput – Apr 2007 to Dec 2018 ..............................96
Figure 13-4: Historical Brunswick processing plant throughput – Jan 2012 to Dec 2018..............................96
Figure 13-5: Historical Brunswick processing plant throughput – Jan 2014 to Dec 2018..............................97
Figure 13-6: Cuffley/Augusta and Brunswick blend – feed grade vs recoveries: 2014–2018.......................98
Figure 13-7: Metallurgical recoveries vs throughput for Cuffley/ Augusta/ Brunswick ore blend: 2014–2018 ...............................................................................................................................100
Figure 13-8: Metallurgical recoveries vs throughput – 2017 and 2018 ........................................................103
Figure 13-9: Feed grade vs recoveries – 2017 and 2018 ............................................................................104
Figure 14-1: Long section of data collected for the sample comparison analysis........................................107
Figure 14-2: Long section of CM Lode showing sub-domains informed by structural controls on mineralisation ...........................................................................................................................108
Figure 14-3: Estimation domain boundaries and composite samples – CM Lode.......................................114
Figure 14-4: Estimation domain boundaries and composite samples – NM Lode.......................................114
Figure 14-5: Estimation domain boundaries and composite samples – CD (220) Lode..............................115
Figure 14-6: Estimation domain boundaries and composite samples – Brunswick Lode ............................115
Figure 14-7: Estimation domain boundaries and composite samples – NV43 Lode ...................................116
Figure 14-8: Estimation domain boundaries and composite samples – E Lode ..........................................116
Figure 14-9: Estimation domain boundaries and composite samples – NE Lode .......................................117
Figure 14-10: Estimation domain boundaries and composite samples – Youle Lode ...................................117
Figure 14-11: Estimation domain boundaries and composite samples – W Lode .........................................118
Figure 14-12: Dip and dip direction domains coloured by volume correction factor – CM Lode....................119
Figure 14-13: Dip and dip direction (dip/dip direction) domains coloured by volume correction factor –NM Lode...................................................................................................................................119
Figure 14-14: Bulk density determinations .....................................................................................................120
Figure 14-15: Major direction experimental variogram for gold accumulation in Domain 1 of W Lode .........121
Figure 14-16: Semi-major experimental variogram for gold accumulation in Domain 1 of W Lode...............121
SRK Consulting Page xviii
KENT/WALS/FAIR/EBBE/wulr PLI028_Costerfield Operations_NI-43 101 Technical Report_2018_Rev1 6 February 2019
Figure 14-17: Long section view of W Lode Domain 1 composites coloured by gold accumulated grade and variogram used .......................................................................................................122
Figure 14-18: Major direction experimental variogram for antimony accumulation in Domain 1 of W Lode.....................................................................................................................................122
Figure 14-19: Semi-major experimental variogram for antimony accumulation in Domain 1 of W Lode.......123
Figure 14-20: Long section view of CM Lode Domain 3 composites coloured by antimony accumulated grade and search ellipse used .................................................................................................123
Figure 14-21: Major direction experimental variogram for true thickness in Domain 1 of W Lode ................124
Figure 14-22: Semi-major experimental variogram for true thickness in Domain 1 of W Lode......................124
Figure 14-23: Long section view of CM Domain 3 composites coloured by true thickness grade and search ellipse used ..................................................................................................................125
Figure 14-24: Youle Lode Domain 1 gold accumulation swath plot by northing ............................................139
Figure 14-25: Youle Lode Domain 1 gold accumulation swath plot by elevation...........................................139
Figure 14-26: Youle Lode Domain 1 antimony accumulation swath plot by northing ....................................139
Figure 14-27: Youle Lode Domain 1 antimony accumulation swath plot by elevation...................................140
Figure 14-28: W Lode Domain 1 gold accumulation swath plot by northing..................................................140
Figure 14-29: W Lode Domain 1 gold accumulation swath plot by elevation ................................................140
Figure 14-30: W Lode Domain 1 vein width swath plot by northing ...............................................................141
Figure 14-31: W Lode Domain 1 vein width swath plot by elevation..............................................................141
Figure 14-32: Brunswick Lode through the 5783 northing at 976 mRL showing lode width variability..........142
Figure 14-33: Brunswick Resources, showing geology, drillholes and Mineral Resource category boundaries ...............................................................................................................................145
Figure 14-34: Youle Resource showing geology, drillholes and Mineral Resource category boundaries .....146
Figure 14-35: NM Lode resource block model with resource category boundaries.......................................146
Figure 14-36: CM Main Lode block model with resource category boundaries .............................................147
Figure 14-37: E Lode block model with resource category boundaries .........................................................147
Figure 14-38: CD (220) Lode block model with resource category boundaries.............................................148
Figure 14-39: AS (230) Lode block model with resource category boundaries .............................................148
Figure 14-40: P1 (55) Lode block model with resource category boundaries................................................149
Figure 14-41: NV (44) Lode block model with resource category boundaries ...............................................149
Figure 14-42: K Lode block model with resource category boundaries .........................................................150
Figure 14-43: C Lode block model with resource category boundaries .........................................................150
Figure 14-44: NE Lode block model with resource category boundaries.......................................................151
Figure 14-45: Brunswick Lode block model with resource category boundaries ...........................................151
Figure 14-46: NSP 39 Lode block model with resource category boundaries ...............................................152
Figure 14-47: NSP 48 Lode block model with resource category boundaries ...............................................152
Figure 14-48: NSP 49 Lode block model with resource category boundaries ...............................................153
Figure 14-49: Youle block model with resource category boundaries ...........................................................153
Figure 14-50: Doyle block model with resource category boundary ..............................................................154
Figure 14-51: W Lode block model with resource category boundary ...........................................................154
Figure 14-52: Model reconciliation – antimony grade ....................................................................................155
Figure 14-53: Model reconciliation – gold grade ............................................................................................155
SRK Consulting Page xix
KENT/WALS/FAIR/EBBE/wulr PLI028_Costerfield Operations_NI-43 101 Technical Report_2018_Rev1 6 February 2019
Figure 14-54: Model reconciliation (excluding Cuffley Deeps) – antimony grade..........................................156
Figure 14-55: Model reconciliation (excluding Cuffley Deeps) – gold grade..................................................156
Figure 16-1: Long section of as-built and designs for Augusta, Cuffley, Brunswick and Youle lodes .........160
Figure 16-2: Long section of proposed Cuffley and Augusta Mine Design..................................................161
Figure 16-3: Long section of proposed Brunswick Mine Design ..................................................................161
Figure 16-4: Long section of proposed Youle Mine Design .........................................................................162
Figure 16-5: Schematic cross section of the Augusta and Cuffley systems ................................................163
Figure 16-6: Schematic cross section of the Augusta and Brunswick systems ...........................................163
Figure 16-7: Longhole CRF stoping method ................................................................................................168
Figure 16-8: Augusta ventilation circuit ........................................................................................................174
Figure 16-9: Cuffley ventilation circuit ..........................................................................................................174
Figure 16-10: Brunswick ventilation circuit .....................................................................................................175
Figure 17-1: Brunswick Processing Plant summary flowsheet ....................................................................182
Figure 18-1: Augusta mine site.....................................................................................................................185
Figure 18-2: Brunswick site area ..................................................................................................................186
Figure 18-3: Site power reticulation..............................................................................................................190
Figure 19-1: Estimate of global antimony demand by end-use segment .....................................................194
Figure 19-2: Antimony metal prices 2010–2017...........................................................................................194
Figure 19-3: World antimony production and consumption: 2000–2020.....................................................195
Figure 20-1: Groundwater elevation contour map of areas surrounding the Augusta mine as at December 2016........................................................................................................................199
Figure 23-1: Augusta mine adjacent properties ...........................................................................................208
SRK Consulting Page 1
KENT/WALS/FAIR/EBBE/wulr PLI028_Costerfield Operations_NI-43 101 Technical Report_2018_Rev1 6 February 2019
SRK Consulting (Australasia) Pty Ltd (SRK) in conjunction with Mandalay Resources Costerfield
Operations Pty Ltd has prepared the Costerfield Operation NI 43-101 Technical Report for the
continuing operations at Augusta Mine in connection with the addition of mineralisation sourced from
the Cuffley Lode. This report updates the finding of the Mineral Resources and Mineral
Reserves previously filed NI 43-101 compliant Technical Report of 2 March 201 .
This Technical Report is based on Mineral Resources that conform to Canadian Securities
Administrators’ National Instrument 43-101 Standards of Disclosure for Mineral Projects (NI 43-101).
Mandalay Resources Corporation (Mandalay) is a publicly traded company listed on the Toronto Stock
Exchange and trading under the symbol MND. On 1 December 2009, Mandalay completed the
acquisition of AGD Mining Pty Ltd (AGD), the sole owner of the Costerfield Operation, resulting in AGD
becoming a wholly-owned subsidiary of Mandalay.
The Costerfield Operation is located within the Costerfield mining district, approximately 10 km
northeast of the town of Heathcote, Victoria. The Augusta Mine has been operational since 2006 and
has been the sole ore source for the Brunswick Processing Plant until December 2013 when ore
production started from the Cuffley Deposit located approximately 500 m to the north of the Augusta
mine workings. The Cuffley and Brunswick deposits are being mined in conjunction with ore from the
Augusta deposit to extend the current mine life of the Costerfield Operation. The new Youle deposit
will be introduced during the second half of 2019.
The Costerfield Operation encompasses the underground Augusta Mine (Augusta), the Cuffley and
Brunswick and Youle deposits, the Brunswick Processing Plant, and associated infrastructure, all of
which are located within mining licence MIN 4644. The mining licence is located within exploration
lease EL 3310 which is held 100% by Mandalay Resources Costerfield Operations Pty Ltd.
The Augusta Mine is located at latitude of 36° 52’ 27” south and longitude 144° 47’ 38” east.
The Brunswick Processing Plant is located approximately 2 km northwest of Augusta. The Cuffley
Lode is located approximately 500 m north-northwest of the Augusta workings and is accessed by an
underground decline from Augusta. The Brunswick deposit is located approximately 1.4 km
north-northwest of the Augusta workings and 680 m north-northwest of the Cuffley Deposit. The Youle
Deposit is located north of the Augusta workings and Cuffley deposits approximately 2.2 km and
1.6 km respectively.
Access to the Costerfield Operation is via the sealed Heathcote–Nagambie Road, which is accessed
off the Northern Highway to the south of Heathcote. The Northern Highway links Bendigo with
Melbourne.
The nearest significant population to Costerfield is Bendigo with a population of approximately 100,000
people, located 50 km to the west-northwest. The Costerfield Operation is a residential operation with
personnel residing throughout central Victoria and Melbourne. Local infrastructure and services are
available in Heathcote, the largest town within the vicinity of the Costerfield Operation.
SRK Consulting Page 2
KENT/WALS/FAIR/EBBE/wulr PLI028_Costerfield Operations_NI-43 101 Technical Report_2018_Rev1 6 February 2019
The Augusta mine-site is located on privately held land, while the Brunswick Processing Plant is
located on unrestricted Crown land. The surrounding land is largely rocky, rugged hill country
administered by the Department of Environment and Primary Industries (DEPI) as State Forest.
The Puckapunyal Military Area is located on the eastern boundary of the Project Area.
The area has a Mediterranean climate with temperature ranges from -2°C in winter (May to August) to
+40°C in summer (November to February). Annual rainfall in the area is approximately 500 mm to
600 mm, with the majority occurring between April and October. The annual pan evaporation is
between 1,300 mm to 1,400 mm.
The weather is amendable to year-round mining operations; however, construction activity is restricted
to the summer months as high winter rainfall can lead to saturated ground conditions that can affect
surface activities.
Exploration for antimony gold deposits in the Costerfield area of Central Victoria started in the early
1850s and resulted in the discovery of the main Costerfield Reef in 1860. At around the same time,
the Kelburn (Alison) Reef and Tait’s Reef were discovered at South Costerfield.
The Alison Mine ceased operations in 1923, while the South Costerfield/ Tait’s Mine operated
sporadically from the 1860s until 1978 and was the last shaft mine to operate on the field.
In 1970, Mid-East Minerals NL identified a large bedrock geochemistry anomaly south of Tait’s Shaft,
which they called ‘Tait-Margaret’. This was subsequently drilled by the Mines Department in 1977 and
mineralised veins were intersected.
In 2001 AGD drilled the ‘Tait-Margaret’ anomaly, which was re-named ‘Augusta’. AGD commenced
underground mining of the Augusta resource (N, C, W and E Lodes) in 2006. Brownfield exploration
core drilling by Mandalay in 2011 located a faulted offset of the Alison Lode beneath the old Alison
Mine and New Alison Mine workings. The deeper offset mineralisation was renamed the Cuffley Lode.
Subsequent definition drilling throughout 2011 and 2012 resulted in an initial Inferred Resource for the
Cuffley Lode being established in January 2012. Further infill and extension drilling has continued and
converted more this Inferred Resource to Measured and Indicated in 2013. During 2014, mining of
the Augusta and Cuffley deposits was undertaken. Both deposits are accessed through the Augusta
portal, with Cuffley capital infrastructure exiting the Augusta Decline at the 1030 Level. In 2018, mining
commenced in the Brunswick deposit, and capital development commenced to access the Youle
deposit underneath the historic Costerfield workings.
The Costerfield Gold-Antimony field is located within the Costerfield Dome, in the Melbourne Zone,
which consists of a very thick sequence of Siluro-Devonian marine sedimentary rocks.
The western boundary of the Costerfield Dome is demarcated by the Cambrian Heathcote Volcanic
Belt and north trending Mt William Fault. The Mt William Fault is a major structural terrain boundary
that separates the Bendigo Zone from the Melbourne Zone. The Dome is bounded to the east by the
Moormbool Fault which has truncated the eastern limb of the Costerfield Anticline, resulting in an
asymmetric dome structure.
The quartz-stibnite lodes are controlled by north-northwest trending faults and fractures located
predominantly near the crest, on the western flank of the Costerfield Dome.
The Augusta Deposit currently comprises seventeen lodes: E Lode, B Lode, BSP Lode, W Lode, NM
Lode, NE Lode, NV Lode, NSW Lode, NSP 49 Lode, NSP 39 Lode, NSP 48 Lode, NW Lode, P1 Lode,
SRK Consulting Page 3
KENT/WALS/FAIR/EBBE/wulr PLI028_Costerfield Operations_NI-43 101 Technical Report_2018_Rev1 6 February 2019
P2 Lode, K Lode and C Lode. The Cuffley Deposit is currently comprises seven lode structures,
Cuffley Main (CM Lode), Cuffley East (CE Lode), Cuffley South (CS lode), Cuffley South East (CSE
lode), Cuffley Deeps (CD Lode), Cuffley Deeps Lower (CDL lode) and Alison South (AS Lode). The
Sub King Cobra domain below Cuffley consists of SKC C, SKC CE, SKC LQ and SKC W. The
Brunswick deposit comprises the main lode structure Brunswick (Brunswick shear) and Brunswick KR
and includes a portion of mineralisation between the Kiwi and Rooster faults. The Youle deposit
consists of Youle and Doyle lodes.
Mining has demonstrated that mineralised splay veins and that oblique, cross-cutting fault structures
influence grade in the north-northwest trending lodes. The lodes can vary from massive stibnite with
microscopic gold to quartz-stibnite with minor visible gold, pyrite and arsenopyrite. In some cases,
gold occurs in quartz veins with little or no stibnite.
The Costerfield Gold-Antimony Field is part of a broad gold-antimony province mainly confined within
the Siluro-Devonian Melbourne Zone. Although antimony commonly occurs in an epithermal setting
(in association with silver, bismuth, tellurium and molybdenum), the quartz-stibnite-gold narrow veins
of the Melbourne Zone are mesothermal-orogenic and are part of a 380–370 Ma tectonic event.
The quartz-stibnite-gold veins contain only accessory amounts of pyrite and arsenopyrite and trace
amounts of galena, sphalerite and chalcopyrite. Pyrite and arsenopyrite also occurs in the wall-rocks
in narrow alteration halos around the lodes; traces of gold are also found in the Brunswick Reef wall
rocks. Gold in Central Victoria is believed to have been derived from underlying Cambrian
greenstones. The origin of the antimony is less certain.
The mineralisation at Costerfield consists of fault-hosted veins that are mostly less than 1.5 m in width
and that have been formed in multiple phases. The earliest phase consists of bedding parallel
laminated quartz veins, which are barren. The laminated quartz phase is followed by a quartz-pyrite-
arsenopyrite phase that contains erratic coarse gold. The last phase consists of massive stibnite,
which contains evenly distributed fine-grained gold. The Costerfield ‘lodes’ or ‘reefs’ are typical
anastomosing, en echelon-style narrow vein systems dipping 25° to 70° west to steep east (70° to 90°
east). Mineralised shoots plunge steeply north at the southern end of the field.
The Mineral Resources are stated here for the Augusta, Cuffley, Brunswick and Youle deposits with
an effective date of 1 December 2018. The Mineral Resource is depleted for mining up to
30 November 2018.
The Mineral Resources are reported at a cut-off grade of 3.5 g/t gold equivalent (AuEq), with a
minimum mining width of 1.2 m. The gold equivalence formula used is calculated using typical
recoveries at the Costerfield processing plant and using a gold price of USD1,400 per ounce and an
antimony price of USD10,000 per tonne as follows:
AuEq =Au (g/t) + 1.67 x Sb (%)
All relevant diamond drillhole and underground face samples in the Costerfield Property, available as
of 7 October 2018 for the Augusta, Cuffley, Brunswick and Youle deposits were used to inform the
estimate.
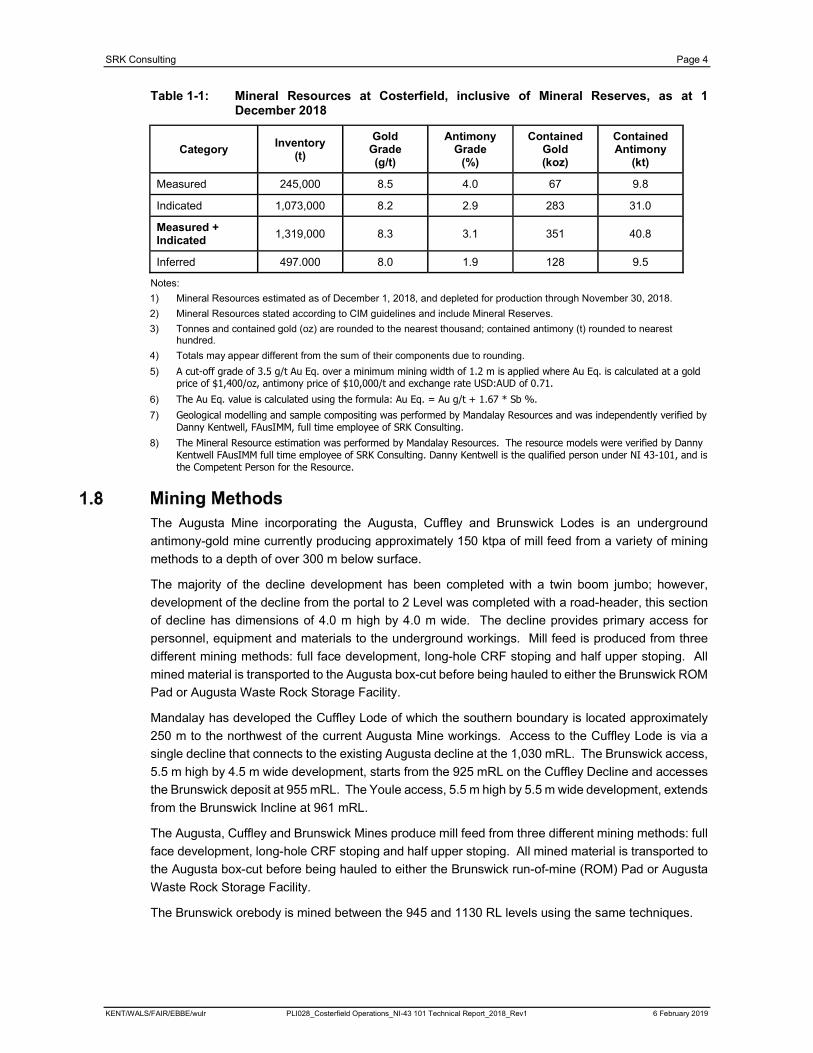
SRK Consulting Page 4
KENT/WALS/FAIR/EBBE/wulr PLI028_Costerfield Operations_NI-43 101 Technical Report_2018_Rev1 6 February 2019
Table 1-1: Mineral Resources at Costerfield, inclusive of Mineral Reserves, as at 1December 2018
CategoryInventory
(t)
GoldGrade(g/t)
Antimony Grade
(%)
Contained Gold (koz)
ContainedAntimony
(kt)
Measured 245,000 8.5 4.0 67 9.8
Indicated 1,073,000 8.2 2.9 283 31.0
Measured + Indicated
1,319,000 8.3 3.1 351 40.8
Inferred 497.000 8.0 1.9 128 9.5
Notes:
1) Mineral Resources estimated as of December 1, 2018, and depleted for production through November 30, 2018.
2) Mineral Resources stated according to CIM guidelines and include Mineral Reserves.
3) Tonnes and contained gold (oz) are rounded to the nearest thousand; contained antimony (t) rounded to nearest hundred.
4) Totals may appear different from the sum of their components due to rounding.
5) A cut-off grade of 3.5 g/t Au Eq. over a minimum mining width of 1.2 m is applied where Au Eq. is calculated at a gold price of $1,400/oz, antimony price of $10,000/t and exchange rate USD:AUD of 0.71.
6) The Au Eq. value is calculated using the formula: Au Eq. = Au g/t + 1.67 * Sb %.
7) Geological modelling and sample compositing was performed by Mandalay Resources and was independently verified by Danny Kentwell, FAusIMM, full time employee of SRK Consulting.
8) The Mineral Resource estimation was performed by Mandalay Resources. The resource models were verified by Danny Kentwell FAusIMM full time employee of SRK Consulting. Danny Kentwell is the qualified person under NI 43-101, and is the Competent Person for the Resource.
The Augusta Mine incorporating the Augusta, Cuffley and Brunswick Lodes is an underground
antimony-gold mine currently producing approximately 150 ktpa of mill feed from a variety of mining
methods to a depth of over 300 m below surface.
The majority of the decline development has been completed with a twin boom jumbo; however,
development of the decline from the portal to 2 Level was completed with a road-header, this section
of decline has dimensions of 4.0 m high by 4.0 m wide. The decline provides primary access for
personnel, equipment and materials to the underground workings. Mill feed is produced from three
different mining methods: full face development, long-hole CRF stoping and half upper stoping. All
mined material is transported to the Augusta box-cut before being hauled to either the Brunswick ROM
Pad or Augusta Waste Rock Storage Facility.
Mandalay has developed the Cuffley Lode of which the southern boundary is located approximately
250 m to the northwest of the current Augusta Mine workings. Access to the Cuffley Lode is via a
single decline that connects to the existing Augusta decline at the 1,030 mRL. The Brunswick access,
5.5 m high by 4.5 m wide development, starts from the 925 mRL on the Cuffley Decline and accesses
the Brunswick deposit at 955 mRL. The Youle access, 5.5 m high by 5.5 m wide development, extends
from the Brunswick Incline at 961 mRL.
The Augusta, Cuffley and Brunswick Mines produce mill feed from three different mining methods: full
face development, long-hole CRF stoping and half upper stoping. All mined material is transported to
the Augusta box-cut before being hauled to either the Brunswick run-of-mine (ROM) Pad or Augusta
Waste Rock Storage Facility.
The Brunswick orebody is mined between the 945 and 1130 RL levels using the same techniques.
SRK Consulting Page 5
KENT/WALS/FAIR/EBBE/wulr PLI028_Costerfield Operations_NI-43 101 Technical Report_2018_Rev1 6 February 2019
From the Mineral Resource, a mine plan was designed based only on Measured and Indicated
Resource using, predominantly, the cemented rock fill blast hole stoping method. A cut-off grade of
4.0 g/t AuEq and minimum stoping width of 1.2 m were applied, with planned and unplanned dilution
at zero grade. AuEq grade (using USD1,200/oz Au and USD8,500/t Sb), AuEq is calculated using the
formula AuEq= Au + (Sb x 1.68) where Sb is in % and Au is in grams per tonne
Financial viability of Proven and Probable Mineral Reserves was demonstrated at metal prices of
USD1,200/oz Au and USD8,500/t Sb. The Mineral Reserve estimate is presented in Table 1-2.
Table 1-2: Mineral Reserves at Costerfield as at 1 December 2018
Category Inventory
(kt)
GoldGrade(g/t)
Antimony Grade
(%)
ContainedGold(koz)
ContainedAntimony
(kt)
Proven 76 8.4 4.0 20 3.1
Probable 461 10.8 3.1 160 14.2
Proven + Probable 537 10.4 3.2 180 17.2
Notes:
1) Mineral Reserve estimated as of December 1, 2018, and depleted for production through to November 30, 2018.
2) Tonnes are rounded to the nearest thousand; contained gold (oz) rounded to the nearest thousand and contained antimony (t) rounded to the nearest hundred.
3) Totals are subject to rounding.
4) Lodes have been diluted to a minimum mining width of 1.2 m for stoping and 1.8 m for ore development.
5) A 4.0 g/t gold equivalent (AuEq) cut-off grade is applied.
6) Commodity prices applied are; gold price of $1,200/oz, antimony price of $8,500/t and exchange rate USD:AUD of 0.71.
7) The gold equivalent value (AuEq) is calculated using the formula: AuEq = Au g/t + 1.68 * Sb %.
8) The Mineral Reserve is a subset of a Measured and Indicated only Schedule, of a Life of Mine Plan that includes mining of Measured, Indicated and Inferred Resources.
9) The Mineral Reserve estimate was prepared by Steven Taylor BTech (Mining Engineering) MAusIMM, and Chris Lynch BEng (Mining) MAusIMM who are full time employees of Mandalay Resources and was independently verified by Anne-Marie Ebbels, MAusIMM, CP (Mining) who is a full-time employee of SRK Consulting who is a qualified person under NI 43-101.
The net increase of 58 koz Au in Proven and Probable Reserves for 2018 relative to 2017 consists of
a total of 23 koz Au depleted from the 2017 Reserves, which has been positively offset by the addition
of 81 koz Au added by resource conversion and mining re-evaluation. The total Sb in Proven and
Probable Reserves consists of 3.1 kt Sb depleted from the 2017 Reserves, with 3.1 kt added by
resource conversion and mining re-evaluation.
The majority of the increase in Au oz has been due to the inclusion of the Youle deposit into the mine
plan.
All mill feed is processed at the existing Brunswick Processing Plant at Costerfield, near the town of
Heathcote in central Victoria. This operation started as a pilot plant and has been converted into a
full-time processing plant that is capable of processing sulphide gold-antimony containing material to
produce gold-antimony concentrate. The plant consists of a two-stage crushing circuit, two ball mills
in series with classification and gravity concentration in closed circuit. The flotation circuit consists of
a rougher, scavenger and single stage cleaner circuit for the production of antimony-gold flotation
concentrate. The gravity gold concentrates can be either blended with the final flotation concentrate
and bagged for shipment to customers in China or further refined via tabling to make a gravity
concentrate which is sent to a refinery. The current flotation tailings are sent to a tailings storage
facility to the north of the Brunswick Processing Plant – the Bombay tailings storage facility.
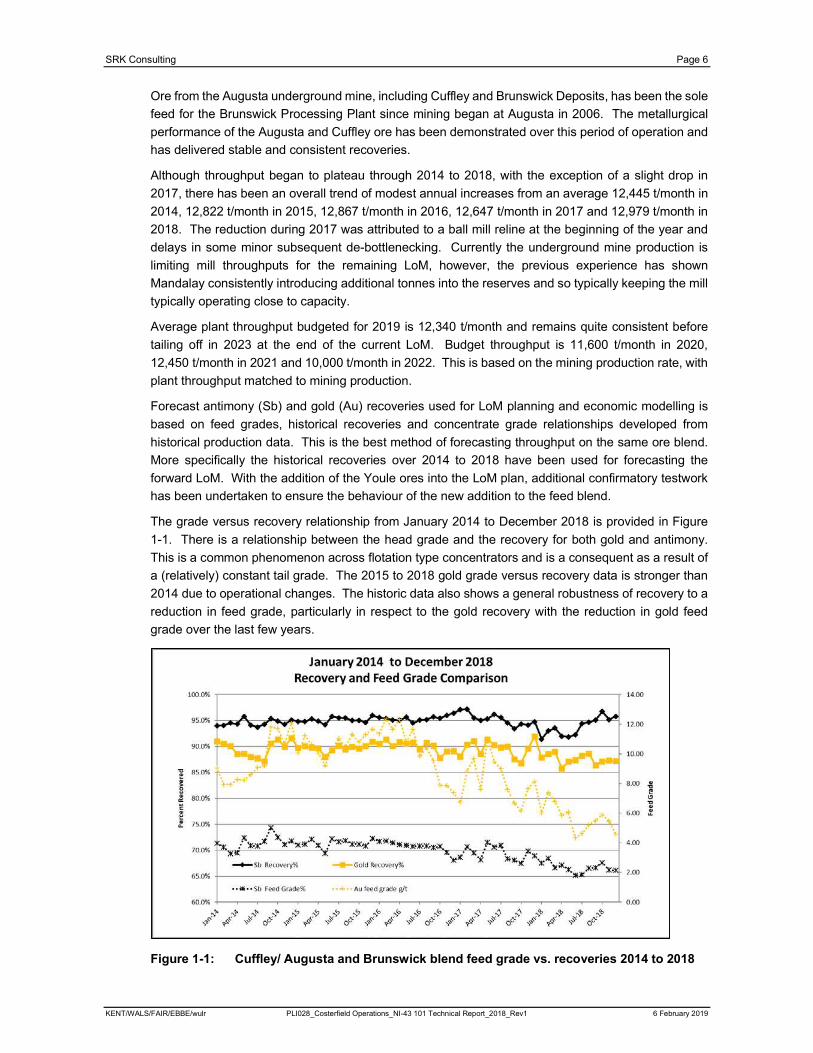
SRK Consulting Page 6
KENT/WALS/FAIR/EBBE/wulr PLI028_Costerfield Operations_NI-43 101 Technical Report_2018_Rev1 6 February 2019
Ore from the Augusta underground mine, including Cuffley and Brunswick Deposits, has been the sole
feed for the Brunswick Processing Plant since mining began at Augusta in 2006. The metallurgical
performance of the Augusta and Cuffley ore has been demonstrated over this period of operation and
has delivered stable and consistent recoveries.
Although throughput began to plateau through 2014 to 2018, with the exception of a slight drop in
2017, there has been an overall trend of modest annual increases from an average 12,445 t/month in
2014, 12,822 t/month in 2015, 12,867 t/month in 2016, 12,647 t/month in 2017 and 12,979 t/month in
2018. The reduction during 2017 was attributed to a ball mill reline at the beginning of the year and
delays in some minor subsequent de-bottlenecking. Currently the underground mine production is
limiting mill throughputs for the remaining LoM, however, the previous experience has shown
Mandalay consistently introducing additional tonnes into the reserves and so typically keeping the mill
typically operating close to capacity.
Average plant throughput budgeted for 2019 is 12,340 t/month and remains quite consistent before
tailing off in 2023 at the end of the current LoM. Budget throughput is 11,600 t/month in 2020,
12,450 t/month in 2021 and 10,000 t/month in 2022. This is based on the mining production rate, with
plant throughput matched to mining production.
Forecast antimony (Sb) and gold (Au) recoveries used for LoM planning and economic modelling is
based on feed grades, historical recoveries and concentrate grade relationships developed from
historical production data. This is the best method of forecasting throughput on the same ore blend.
More specifically the historical recoveries over 2014 to 2018 have been used for forecasting the
forward LoM. With the addition of the Youle ores into the LoM plan, additional confirmatory testwork
has been undertaken to ensure the behaviour of the new addition to the feed blend.
The grade versus recovery relationship from January 2014 to December 2018 is provided in Figure
1-1. There is a relationship between the head grade and the recovery for both gold and antimony.
This is a common phenomenon across flotation type concentrators and is a consequent as a result of
a (relatively) constant tail grade. The 2015 to 2018 gold grade versus recovery data is stronger than
2014 due to operational changes. The historic data also shows a general robustness of recovery to a
reduction in feed grade, particularly in respect to the gold recovery with the reduction in gold feed
grade over the last few years.
Figure 1-1: Cuffley/ Augusta and Brunswick blend feed grade vs. recoveries 2014 to 2018
SRK Consulting Page 7
KENT/WALS/FAIR/EBBE/wulr PLI028_Costerfield Operations_NI-43 101 Technical Report_2018_Rev1 6 February 2019
The Costerfield Operations surface facilities are representative of a modern gold-antimony mining
operation. The Augusta Mine site comprises the Office and administration complex, underground
workshops and surface infrastructure to support he underground operations. The Brunswick site
comprises the gold-antimony processing plant and associated facilities, surface workshop, tailings
storage facilities, Reverse Osmosis (RO) Plant, and the Core farm and core processing facility.
The Splitters Creek Evaporation Facility is situated on a 30 ha parcel of land that is located
approximately 3 km from the Augusta site. The facility provides an additional 120 ML per year of net
evaporation. The purpose of the facility is to evaporate groundwater extracted from the Costerfield
Operations and thereby maintain dewatering rates from the underground workings.
The Augusta Decline has been developed from a portal within a box-cut with the majority dimensions
of 4.8 m high by 4.5 m wide at a gradient of 1:7 down. The majority of the decline development has
been completed with a twin boom jumbo; however, development of the decline from the portal to
2 Level was completed with a road-header, this section of decline has dimensions of 4.0 m high by
4.0 m wide. The decline provides primary access for personnel, equipment and materials to the
underground workings.
Access to the Cuffley Lode is via a single decline that connects to the existing Augusta decline at the
1,030 mRL. The Cuffley Decline currently extends down to approximately 895 mRL. At the 935 mRL,
the Cuffley Incline extends off the Cuffley Decline and accesses mineral resources from the 945 mRL
to the 1,020 mRL. A second decline within Cuffley known as the 4800 Decline was commenced during
2014 to access the southern part of the Cuffley Lode which is positioned south of the East Fault. This
Decline commences at the 960 mRL and extended to 804 mRL. Access to the Brunswick Lode is via
a single incline, connecting to the existing Cuffley decline at 925 mRL. The Brunswick access, 5.5 m
high by 4.5 m wide development, starts from the 925 mRL on the Cuffley Decline and accesses the
Brunswick deposit at 955 mRL. The Youle access, 5.5 m high by 5.5 m wide development, extends
from the Brunswick Incline at 961 mRL.
The Costerfield Operation purchases electricity directly from the main national electricity grid and has
connections at the Brunswick Processing Plant, Cuffley Mine and Augusta Mine. Powercor owns and
manages the central Victorian electrical distribution infrastructure. ERM Business Energy is the
current electrical retailer.
The Costerfield Operation has an existing arrangement for High Voltage electrical supply of 2,222 kVA
shared between the Augusta Mine and Cuffley and a 1,000 kVA supply at the Brunswick Processing
Plant. This is planned to be transferred to a single point of supply to the Augusta site during 2019.
Powercor owns and manages the central Victorian electrical distribution infrastructure. ERM Business
Energy is the current electrical retailer.
Currently, a 1 MVA 4.5V/ 11kV step up transformer is located on Cuffley site to allow emergency
generator backup. Once the single point of supply is established, the Augusta substation will have
capacity to run up to 3 MVA embedded Co-Generation, for any emergency or additional (to the 3 MVA
from Powercor) power requirements.
SRK Consulting Page 8
KENT/WALS/FAIR/EBBE/wulr PLI028_Costerfield Operations_NI-43 101 Technical Report_2018_Rev1 6 February 2019
The antimony-gold concentrate produced from the Costerfield Operations is sold directly to smelters
capable of recovering both the gold and antimony from the concentrates, such that Mandalay receives
payment based on the concentration of the antimony and gold within the concentrate. The terms and
conditions of commercial sale are not disclosed pursuant to confidentiality requirements. The
marketing of the concentrate is conducted through the agency of Penfold Limited.
The environmental and community impacts associated with the proposed expansion of the current
Costerfield Operation have been assessed with the aim of defining permitting and approvals required
and evaluating whether risks to the project can be appropriately managed.
Establishing a sustainable means for disposing of groundwater from the mine is a critical aspect that
requires significant investment and needs to be to be carefully managed. Existing controls in relation
to noise, air quality, blast vibration, waste rock and groundwater are expected to be appropriate but
will require ongoing focus.
Mandalay has implemented a Community Engagement Plan which describes processes and
strategies to manage community expectations and provide transparent information to keep
stakeholders informed. This plan is considered an appropriate framework to manage any community
concerns associated with the mine’s expansion and to foster ongoing support for the operation.
The Department of Economic Development, Jobs, Transport and Resources (DEDJTR) facilitates this
approval process and will engage with relevant referral authorities, as required. The DEDJTR may
prescribe certain conditions on the approval, which may include amendments to the environmental
monitoring programme. The Work Plan approval process involves a thorough consultation process
with the regulatory authorities, and any conditions or proposed amendments requested to the Work
Plan Variation (WPV) are generally negotiated to the satisfaction of both parties.
The costs for the project, described in the following section have been derived from a variety of
sources, including:
Historical production from the Costerfield Operation, predominantly the past twelve months
completed by Mandalay
Manufacturers and suppliers
First principles calculations (based on Historical production values)
Costs include allowances for power, consumables and maintenance.
All cost estimates are provided in 2018 Australian dollars (AUD) and are to a level of accuracy of
±10%. Escalation, taxes, import duties and custom fees have been excluded from the cost estimates.
The total capital required for the Costerfield Operation is summarised in Table 1-3.
Table 1-3: Costerfield operation – Capital cost estimate
TotalCY 19
(AUD M)CY 20
(AUD M)CY 21
(AUD M)CY 22
(AUD M)
Plant 5.0 1.1 2.2 1.6 0.1
Admin 0.2 0.1 0.0 0.0 0.0
Environment 5.2 3.4 0.9 0.4 0.6
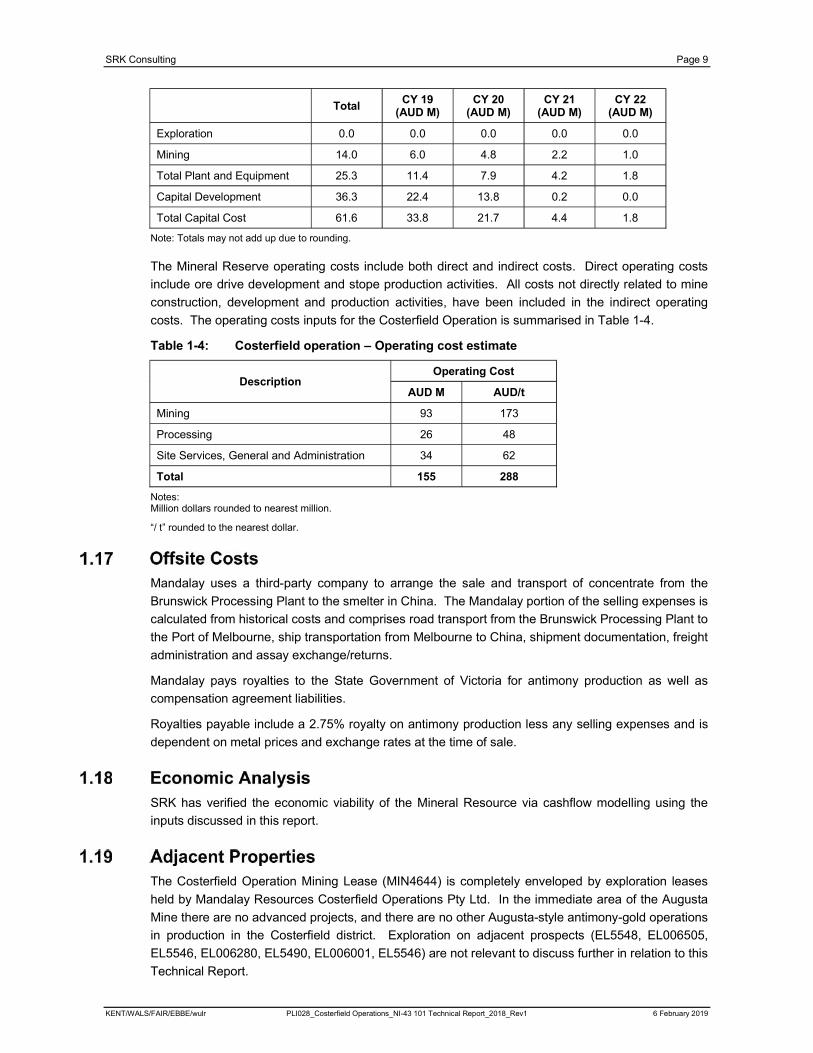
SRK Consulting Page 9
KENT/WALS/FAIR/EBBE/wulr PLI028_Costerfield Operations_NI-43 101 Technical Report_2018_Rev1 6 February 2019
TotalCY 19
(AUD M)CY 20
(AUD M)CY 21
(AUD M)CY 22
(AUD M)
Exploration 0.0 0.0 0.0 0.0 0.0
Mining 14.0 6.0 4.8 2.2 1.0
Total Plant and Equipment 25.3 11.4 7.9 4.2 1.8
Capital Development 36.3 22.4 13.8 0.2 0.0
Total Capital Cost 61.6 33.8 21.7 4.4 1.8
Note: Totals may not add up due to rounding.
The Mineral Reserve operating costs include both direct and indirect costs. Direct operating costs
include ore drive development and stope production activities. All costs not directly related to mine
construction, development and production activities, have been included in the indirect operating
costs. The operating costs inputs for the Costerfield Operation is summarised in Table 1-4.
Table 1-4: Costerfield operation – Operating cost estimate
DescriptionOperating Cost
AUD M AUD/t
Mining 93 173
Processing 26 48
Site Services, General and Administration 34 62
Total 155 288
Notes:Million dollars rounded to nearest million.
“/ t” rounded to the nearest dollar.
Mandalay uses a third-party company to arrange the sale and transport of concentrate from the
Brunswick Processing Plant to the smelter in China. The Mandalay portion of the selling expenses is
calculated from historical costs and comprises road transport from the Brunswick Processing Plant to
the Port of Melbourne, ship transportation from Melbourne to China, shipment documentation, freight
administration and assay exchange/returns.
Mandalay pays royalties to the State Government of Victoria for antimony production as well as
compensation agreement liabilities.
Royalties payable include a 2.75% royalty on antimony production less any selling expenses and is
dependent on metal prices and exchange rates at the time of sale.
SRK has verified the economic viability of the Mineral Resource via cashflow modelling using the
inputs discussed in this report.
The Costerfield Operation Mining Lease (MIN4644) is completely enveloped by exploration leases
held by Mandalay Resources Costerfield Operations Pty Ltd. In the immediate area of the Augusta
Mine there are no advanced projects, and there are no other Augusta-style antimony-gold operations
in production in the Costerfield district. Exploration on adjacent prospects (EL5548, EL006505,
EL5546, EL006280, EL5490, EL006001, EL5546) are not relevant to discuss further in relation to this
Technical Report.
SRK Consulting Page 10
KENT/WALS/FAIR/EBBE/wulr PLI028_Costerfield Operations_NI-43 101 Technical Report_2018_Rev1 6 February 2019
Additional information that is deemed relevant to ensure this Technical Report is understandable and
not misleading is as follows:
It is the QP’s opinion that the positive results of the financial analysis demonstrates Mandalay’s ability
to maintain and manage the economics of the project. The work has been undertaken at an
appropriate level to support the release of the Mineral Resource and Ore Reserve estimates.
Reconciliation results show good precision and reasonable accuracy between the resource block
model data and the processing plant data. Unquantified errors such as stockpiling, ore-waste
misallocation, and unplanned dilution influenced the reconciliation data. Over the period, the ounces
of gold predicted by the model were 10% higher than produced by the plant. The tonnes of Antimony
predicted by the model were 16% lower than produced by the plant. After exclusion, the model overcall
is reduced significantly – to 4% gold and 10% antimony. This overcall is likely due to the inclusion of
discontinuous splay veins in the wireframe that were not captured during stoping.
SRK makes the following observations:
Inferred resources have not been included in the economic evaluation.
There has been a history of conversion of Inferred to Indicated Resources resulting in additional
Resources from outside the Mineral Reserve being included into the life of mine plans that have
the potential to improve the project economics.
Mandalay has demonstrated an ability to improve the mining method and productivity based on
improved geological information and thus mine designs and planning.
The Costerfield Property is an advanced property and Mandalay has a history of successful exploration
and mining on the Property. SRK has observed that the degree of technical competency evident in
the work performed by Mandalay geologists is high, particularly in the structural analysis of the local
geology. Therefore, there is no requirement for additional work programmes over and above the
existing operational plans.
SRK recommends that ongoing exploration and resource definition drilling at West Costerfield,
Brunswick, and North and South of Youle lode as well as near mine drilling continue as planned to
target ongoing Resource extension.
SRK recommends that Mandalay continually review the cut-off grade strategy to balance cash-flow,
NPV and mine life.
SRK Consulting Page 11
KENT/WALS/FAIR/EBBE/wulr PLI028_Costerfield Operations_NI-43 101 Technical Report_2018_Rev1 6 February 2019
SRK has worked in conjunction with Mandalay Resources Corporation (Mandalay) to prepare the
Costerfield Operation NI 43-101 Technical Report. The report validates the viability of mining and
processing mineralisation from continuing operations at the Costerfield Operation. The Costerfield
Operation is located in the Costerfield mining district, approximately 10 km northeast of the town of
Heathcote in Victoria. The Augusta mine has been operational since 2006 and has been the sole ore
source for the Brunswick Processing Plant until December 2013 when ore production started from the
Cuffley deposit located approximately 500 m to the north of the Augusta mine workings. The Cuffley
and Brunswick deposits are being mined in conjunction with ore from the Augusta deposit to extend
the current mine life of the Costerfield Operation. The new Youle deposit will be introduced during the
second half of 2019.
The Costerfield Operation is contained within Mining Lease MIN4644 and comprises the following:
Underground mine (Augusta) with production from the Augusta, Cuffley, and Brunswick lodes
A conventional flotation processing plant (Brunswick) with a current capacity of approximately
150,000 tpa feed
Mine and mill infrastructure including office buildings, workshops, core shed and equipment.
Mandalay is a publicly traded company listed on the Toronto Stock Exchange (TSX) and trading under
the symbol MND with the head office at 76 Richmond Street East, Suite 330, Toronto, Ontario, Canada
M5C 1P1. On 1 December 2009, Mandalay completed the acquisition of AGD Mining Pty Ltd (AGD)
from Cambrian Mining Limited, a wholly-owned subsidiary of Western Canadian Coal Corporation
(WCC), resulting in AGD becoming a wholly-owned subsidiary of Mandalay.
Units of measurement used in this report conform to the SI (metric) system as listed in the List of
Abbreviations.
The scope of work, as defined in a letter of engagement executed during August 2018 and subsequent
discussions between Mandalay and SRK, includes the review of documents provided by Mandalay
and preparation of documentation as required for the NI 43-101 Technical Report on the Costerfield
Operation in compliance with NI 43-101 and Form 43-101 F1 guidelines.
This work involved the review of the following aspects:
Review the Mineral Resource estimate (MRE) and update for Augusta and Cuffley deposits
prepared by Mandalay
Review of the Brunswick, Sub King Cobra, Cuffley Deeps and Youle MREs
Review of mine design and mining schedules for Augusta, Cuffley, Brunswick and Youle lodes
Review and comment on the Project’s infrastructure aspects
Review and comment on the metallurgical and processing aspects
Review of environmental considerations
Review of capital and operating cost estimates
Review of financial modelling
Recommendations for additional work.

SRK Consulting Page 12
KENT/WALS/FAIR/EBBE/wulr PLI028_Costerfield Operations_NI-43 101 Technical Report_2018_Rev1 6 February 2019
The Costerfield NI 43-101 Technical Report is a collaborative effort between Mandalay and SRK.
SRK has independently reviewed the work completed by Mandalay.
The Mineral Resource and Mineral Reserve Statements reported herein was prepared in conformity
with generally accepted CIM “Exploration Best Practices” and “Estimation of Mineral Resource and
Mineral Reserves Best Practices” guidelines. This Technical Report was prepared following the
guidelines of the Canadian Securities Administrators National Instrument 43-101 and Form 43-101 F1.
The Technical Report was compiled in Melbourne during the months of January and February 2019.
This Technical Report is based on information provided by Mandalay to SRK and verified during site
visits conducted between 2012 and 2018, as well as additional information provided by Mandalay
throughout the course of SRK’s investigations. SRK has no reason to doubt the reliability of the
information provided by Mandalay. The most recent site visit was undertaken on 26 October 2018.
The SRK Group comprises over 1,400 professionals, offering expertise in a wide range of resource
engineering disciplines. The SRK Groups independence is ensured by the fact that it holds no equity
in any project and that its ownership rests solely with its staff. This fact permits SRK to provide its
clients with conflict-free and objective recommendations on crucial judgment issues. SRK has a
demonstrated track record in undertaking independent assessments of Mineral Resources and Mineral
Reserves, project evaluations and audits, technical reports and independent feasibility evaluations to
bankable standards on behalf of exploration and mining companies and financial institutions
worldwide. The SRK Group has also worked with a large number of major international mining
companies and their projects, providing mining industry consultancy service inputs.
The compilation of this Technical Report was completed by the lead author Anne-Marie Ebbels,
Principal Consultant (Mining), BEng (Mining), MAusIMM (No 111006), CP(Mining). By virtue of her
education, membership of a recognised professional association and relevant work experience, Anne-
Marie Ebbels is an independent QP as this term is defined by NI 43-101.
Danny Kentwell, Principal Consultant (Resource Evaluation), MSc Mathematics and Planning
(Geostatistics), FAusIMM, conducted a review of the Mineral Resources and geological aspects of the
Technical Report. By virtue of his education, membership of a recognised professional association
and relevant work experience, Danny Kentwell is an independent QP as this term is defined by
NI 43-101.
Simon Walsh, SRK Associate Principal Metallurgist, BSc (Extractive Metallurgy & Chemistry), MBA
Hons, MAusIMM CP(Met), GAICD, undertook a review of the metallurgical, mineral processing and
infrastructure aspects. By virtue of his education, membership of a recognised professional association
and relevant work experience, Simon Walsh is an independent QP as this term is defined by
NI 43-101.
Internal SRK Peer Review of this Technical Report was completed by Peter Fairfield.
Peter Fairfield, Principal Consultant (Project Evaluation), BEng (Mining), FAusIMM (No 106754),
CP(Mining), conducted a peer review of non-geological aspects of the Technical Report. By virtue of
his education, membership of a recognised professional association and relevant work experience,
Peter Fairfield is an independent QP as this term is defined by NI 43-101.

SRK Consulting Page 13
KENT/WALS/FAIR/EBBE/wulr PLI028_Costerfield Operations_NI-43 101 Technical Report_2018_Rev1 6 February 2019
Table 2-1 lists the individuals who, by virtue of their education, experience and professional
association, are considered QPs as defined in NI 43-101, and defines the areas of responsibility for
the QPs who all meet the requirements of independence as defined in NI 43-101.
SRK would like to acknowledge the support and collaboration provided by Mandalay personnel for this
assignment. Their collaboration was greatly appreciated and instrumental to the success of this
project. The majority of the resource estimation and mine planning work was completed by Mandalay
personnel with supervision and review by SRK. The Mandalay personnel with significant roles were
Chris Davis, Chloe Cavill and Chris Lynch, who undertook the geological modelling and resource
estimation work, and Steve Taylor, Chris Lynch, Danny Grellet, who were involved in the reserves,
scheduling and mine design work. Damon Buchanan undertook the mineral processing and
metallurgical testwork, and April Westcott was responsible for the geological technical report writing
and report compilation.
SRK’s opinion contained herein and effective as at 1 December 2018 is based on information collected
by SRK throughout the course of SRK’s investigations, which in turn reflect various technical and
economic conditions at the time of writing. Given the nature of the mining business, these conditions
can change significantly over relatively short periods of time. Consequently, actual results may be
significantly more or less favourable.
This report may include technical information that requires subsequent calculations to derive
subtotals, totals and weighted averages.
Such calculations inherently involve a degree of rounding and consequently introduce a margin of
error. Where these occur, SRK does not consider them to be material.
SRK is not an insider, associate or an affiliate of Mandalay, and neither SRK nor any affiliate has acted
as advisor to Mandalay, its subsidiaries or its affiliates in connection with this Technical Report.
The results of SRK’s technical review are not dependent on any prior agreements concerning the
conclusions to be reached, nor are there any undisclosed understandings concerning any future
business dealings.
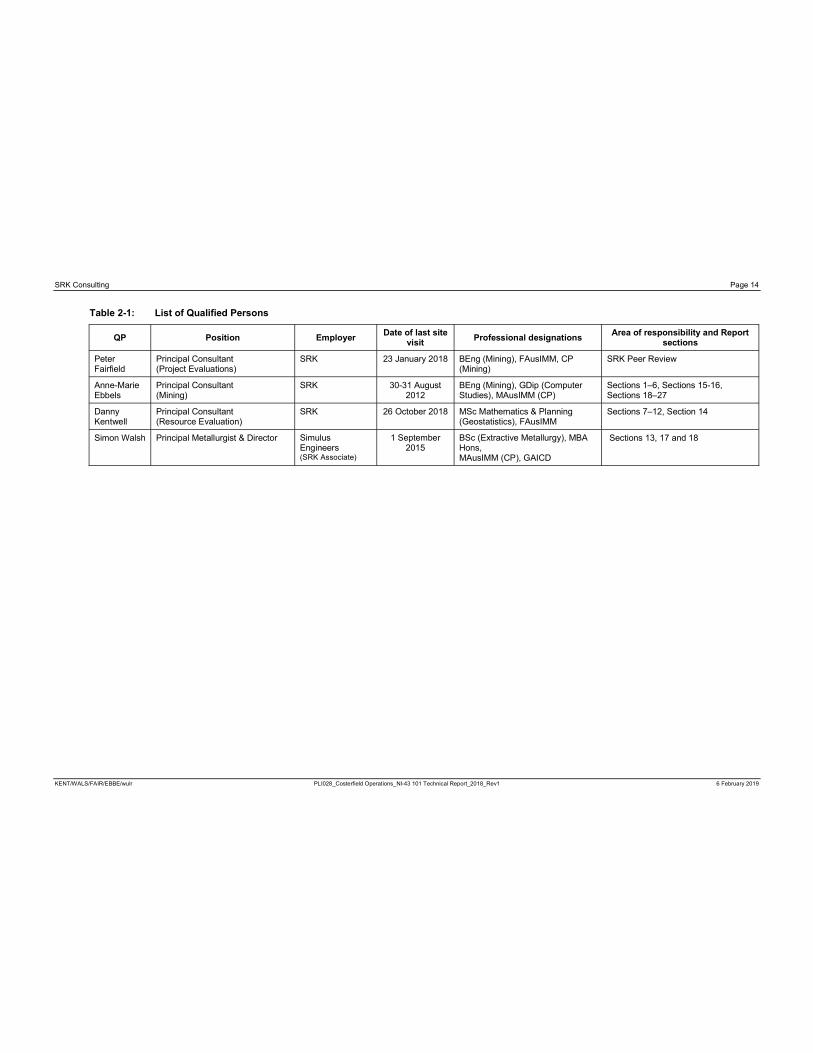
SRK Consulting Page 14
KENT/WALS/FAIR/EBBE/wulr PLI028_Costerfield Operations_NI-43 101 Technical Report_2018_Rev1 6 February 2019
Table 2-1: List of Qualified Persons
QP Position EmployerDate of last site
visit Professional designations
Area of responsibility and Report sections
Peter Fairfield
Principal Consultant (Project Evaluations)
SRK 23 January 2018 BEng (Mining), FAusIMM, CP (Mining)
SRK Peer Review
Anne-Marie Ebbels
Principal Consultant (Mining)
SRK 30-31 August 2012
BEng (Mining), GDip (Computer Studies), MAusIMM (CP)
Sections 1–6, Sections 15-16, Sections 18–27
Danny Kentwell
Principal Consultant (Resource Evaluation)
SRK 26 October 2018 MSc Mathematics & Planning (Geostatistics), FAusIMM
Sections 7–12, Section 14
Simon Walsh Principal Metallurgist & Director Simulus Engineers(SRK Associate)
1 September 2015
BSc (Extractive Metallurgy), MBA Hons, MAusIMM (CP), GAICD
Sections 13, 17 and 18

SRK Consulting Page 15
KENT/WALS/FAIR/EBBE/wulr PLI028_Costerfield Operations_NI-43 101 Technical Report_2018_Rev1 6 February 2019
Marketing information for this report, specifically Section 19, relies entirely on information by Roskill
Information Services Ltd.
A specific marketing study was not completed for this Technical Report.
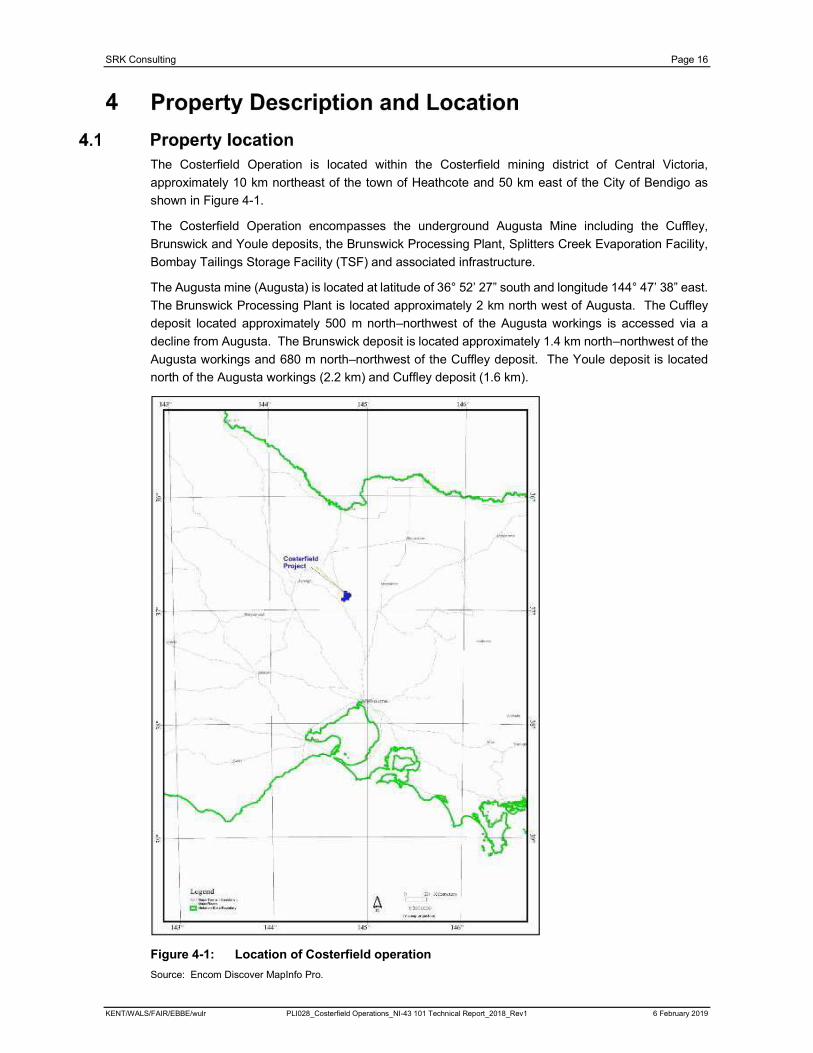
SRK Consulting Page 16
KENT/WALS/FAIR/EBBE/wulr PLI028_Costerfield Operations_NI-43 101 Technical Report_2018_Rev1 6 February 2019
The Costerfield Operation is located within the Costerfield mining district of Central Victoria,
approximately 10 km northeast of the town of Heathcote and 50 km east of the City of Bendigo as
shown in Figure 4-1.
The Costerfield Operation encompasses the underground Augusta Mine including the Cuffley,
Brunswick and Youle deposits, the Brunswick Processing Plant, Splitters Creek Evaporation Facility,
Bombay Tailings Storage Facility (TSF) and associated infrastructure.
The Augusta mine (Augusta) is located at latitude of 36° 52’ 27” south and longitude 144° 47’ 38” east.
The Brunswick Processing Plant is located approximately 2 km north west of Augusta. The Cuffley
deposit located approximately 500 m north–northwest of the Augusta workings is accessed via a
decline from Augusta. The Brunswick deposit is located approximately 1.4 km north–northwest of the
Augusta workings and 680 m north–northwest of the Cuffley deposit. The Youle deposit is located
north of the Augusta workings (2.2 km) and Cuffley deposit (1.6 km).
Figure 4-1: Location of Costerfield operation
Source: Encom Discover MapInfo Pro.
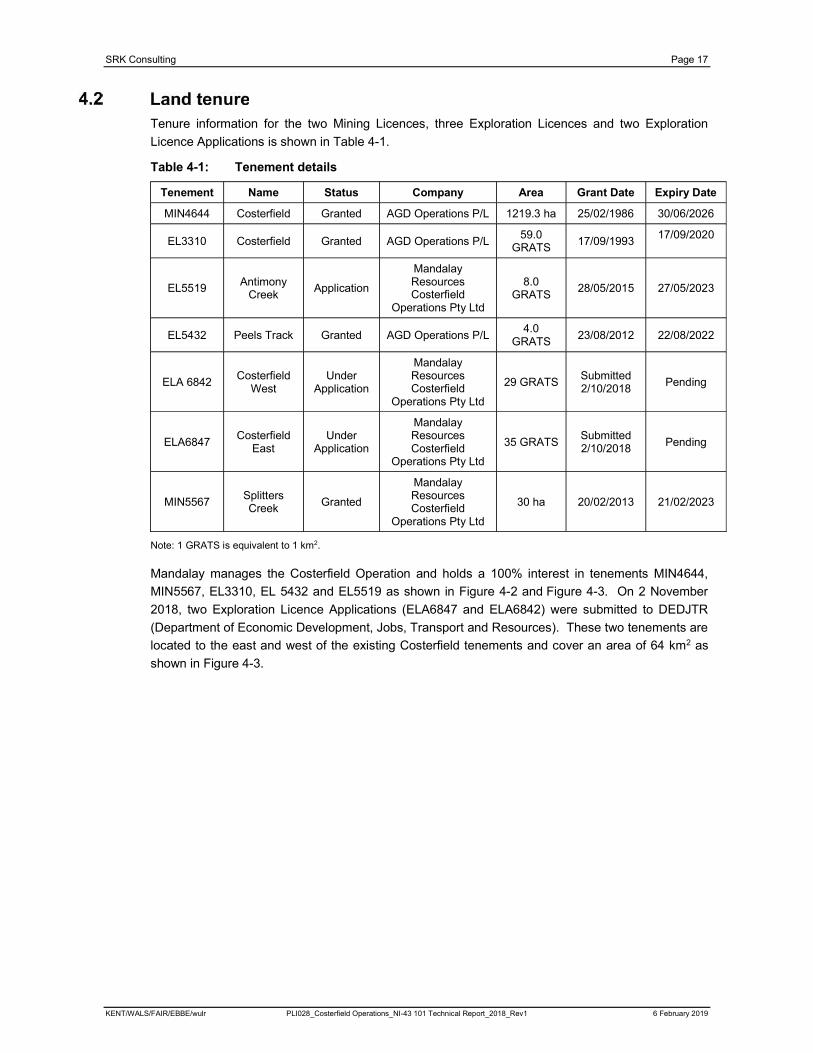
SRK Consulting Page 17
KENT/WALS/FAIR/EBBE/wulr PLI028_Costerfield Operations_NI-43 101 Technical Report_2018_Rev1 6 February 2019
Tenure information for the two Mining Licences, three Exploration Licences and two Exploration
Licence Applications is shown in Table 4-1.
Table 4-1: Tenement details
Tenement Name Status Company Area Grant Date Expiry Date
MIN4644 Costerfield Granted AGD Operations P/L 1219.3 ha 25/02/1986 30/06/2026
EL3310 Costerfield Granted AGD Operations P/L59.0
GRATS17/09/1993
17/09/2020
EL5519Antimony
CreekApplication
Mandalay ResourcesCosterfield
Operations Pty Ltd
8.0 GRATS
28/05/2015 27/05/2023
EL5432 Peels Track Granted AGD Operations P/L4.0
GRATS23/08/2012 22/08/2022
ELA 6842Costerfield
WestUnder
Application
Mandalay ResourcesCosterfield
Operations Pty Ltd
29 GRATSSubmitted2/10/2018
Pending
ELA6847Costerfield
EastUnder
Application
Mandalay ResourcesCosterfield
Operations Pty Ltd
35 GRATSSubmitted2/10/2018
Pending
MIN5567Splitters Creek
Granted
Mandalay ResourcesCosterfield
Operations Pty Ltd
30 ha 20/02/2013 21/02/2023
Note: 1 GRATS is equivalent to 1 km2.
Mandalay manages the Costerfield Operation and holds a 100% interest in tenements MIN4644,
MIN5567, EL3310, EL 5432 and EL5519 as shown in Figure 4-2 and Figure 4-3. On 2 November
2018, two Exploration Licence Applications (ELA6847 and ELA6842) were submitted to DEDJTR
(Department of Economic Development, Jobs, Transport and Resources). These two tenements are
located to the east and west of the existing Costerfield tenements and cover an area of 64 km2 as
shown in Figure 4-3.
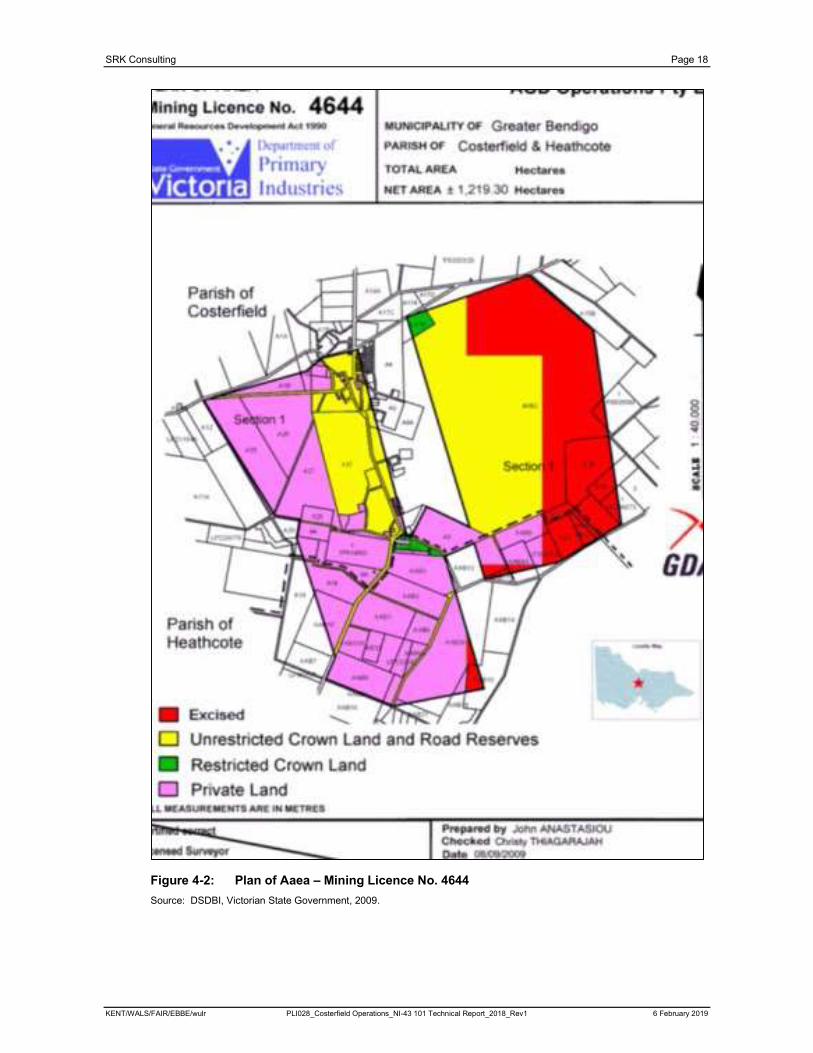
SRK Consulting Page 18
KENT/WALS/FAIR/EBBE/wulr PLI028_Costerfield Operations_NI-43 101 Technical Report_2018_Rev1 6 February 2019
Figure 4-2: Plan of Aaea – Mining Licence No. 4644
Source: DSDBI, Victorian State Government, 2009.
SRK Consulting Page 19
KENT/WALS/FAIR/EBBE/wulr PLI028_Costerfield Operations_NI-43 101 Technical Report_2018_Rev1 6 February 2019
Figure 4-3: Current Mining and Exploration Lease boundaries showing two exploration licence applications to the east and west of current tenures
Source: Mandalay Resources, October 2018.
The sustainable and responsible development of Mineral Resources in Victoria is regulated by the
State Government of Victoria through the MRSD Act.
The MRSD Act, which is administered by DEDJTR, requires that negotiation of access and/ or
compensation agreements with landowners affected by the Work Plans is undertaken between the
mining tenement applicant and the relevant landowner prior to a Mining Licence being granted, or
renewed. In accordance with this obligation, Mandalay has compensation agreements in place for
land allotments owned by third-party landowners that are situated within the boundaries of MIN4644.
Mandalay owns the land that contains MIN5567 and no compensation agreements are therefore
required.
In October 2018, a bond review was carried out and the value of the rehabilitation policy has increased
by AUD224,000 to AUD4,079,000 in total for MIN4644 and MIN5567. The rehabilitation bond for
MIN4644 is currently AUD3.331M.
A further AUD10,000 bond is paid to the DEDJTR for tenements EL3310 and EL5432 and with Vic
Roads for licences for pipelines that are crossing roads.
The rehabilitation bond for MIN5567, the lease on which the Splitters Creek Evaporation Facility has
been constructed, was calculated in October 2018 and set aside AUD748,000.
The total bond for MIN4464, the lease where the Augusta mine site and Brunswick Processing Plant
SRK Consulting Page 20
KENT/WALS/FAIR/EBBE/wulr PLI028_Costerfield Operations_NI-43 101 Technical Report_2018_Rev1 6 February 2019
are situated, is AUD3.331M. The bond has increased in the latest bond review due to the addition of
the Brunswick vent shaft in 2018.
Rehabilitation is undertaken progressively at the Costerfield Operation, with the environmental bond
only being reduced when rehabilitation of an area or site has been deemed successful by the DEDJTR.
This rehabilitation bond assumes that all rehabilitation is undertaken by an independent third party.
Therefore, various project management and equipment mobilisation costs are incorporated into the
rehabilitation bond liability calculation. In practice, rehabilitation costs may be less if Mandalay
chooses to use internal resources to complete rehabilitation.
Other than the rehabilitation bond, the Costerfield Operation is not subject to any other environmental
liabilities. Table 4-2 presents the breakdown of liability bond from recent bond review.
Table 4-2: Total liability bond calculations for 2018
Source: Mandalay Resources, October 2018.
Royalties apply to the production of antimony and are payable to the Victorian State Government
through the DEDJTR. This royalty is applied at 2.75% of the revenue realised from the sale of
antimony produced, less the selling costs.
No royalty is payable on gold production, nor is there any royalty agreement in place with previous
owners.
Royalties are payable to the Victorian State Government through the DEDJTR if waste rock or tailings
is sold (or provided to) to third parties, because they are deemed to be quarry products. The royalty
rate is AUD0.87/t.
Mandalay reports that, as at December 2017, a tax loss is available with fraction carried forward.
Income tax on Australian company profits is set at 30%.
MIN4644 has a series of licence conditions that must be met and are the controlling conditions upon
which all associated Work Plan Variations (WPVs) are filed with the regulatory authority. Apart from
the primary mining legislation which consists of the MRSD Act, operations on MIN4644 are subject to
the additional following legislation and regulations for which all appropriate permits and approvals have
been obtained.
Legislation:
Environment Protection Act 1970
Planning and Environment Act 1987
Environmental Protection and Biodiversity Conservation Act 1999
Flora and Fauna Guarantee Act 1988
SRK Consulting Page 21
KENT/WALS/FAIR/EBBE/wulr PLI028_Costerfield Operations_NI-43 101 Technical Report_2018_Rev1 6 February 2019
Catchment and Land Protection Act 1994
Archaeological and Aboriginal Relics Preservation Act 1972
Heritage Act 1995
Forest Act 1958
Dangerous Goods Act 1985
Drugs, Poisons and Controlled Substances Act 1981
Public Health and Wellbeing Act 2008
Water Act 1989
Crown Land (Reserves) Act 1978
Radiation Act 2005
Conservation, Forests and Lands Act 1987
Wildlife Act 1975.
Regulations:
Dangerous Goods (Explosives) Regulations 2011
Dangerous Goods (Storage and Handling) Regulations 2000
Dangerous Goods (HCDG) Regulations 2005
Drugs, Poisons and Controlled Substances (Commonwealth Standard) Regulations 2011
Mineral Resources Development Regulations 2002.
Mandalay is currently operating under an approved Work Plan in accordance with Section 39 of the
MRSD Act. WPVs are required when significant changes from the Work Plan exist and it is deemed
that the works will have a material impact on the environment and/ or community. Various WPVs have
been approved by the DEDJTR and are registered against the tenement.
EL5519 was granted for 5 years in September 2018 and will expire on the 27/05/2023. In October
2018, EL3310 was renewed for a further 2 years and will expire on 17/09/2020.
To the best of the author’s knowledge, there is no other significant factor or risk that may affect access,
title, or the right or ability to perform work on the Costerfield Property.
SRK Consulting Page 22
KENT/WALS/FAIR/EBBE/wulr PLI028_Costerfield Operations_NI-43 101 Technical Report_2018_Rev1 6 February 2019
Access to the Costerfield Operation is via the sealed Heathcote–Nagambie Road which is accessed
off the Northern Highway to the south of Heathcote. The Northern Highway links Central and North-
Central Victoria with Melbourne.
The Augusta mine site is accessed off the Heathcote–Nagambie Road via McNicols Lane which
comprises a sealed/ gravel road that continues for approximately 1.5 km to the Augusta site offices.
The Brunswick Processing Plant is located on the western side of the Heathcote–Nagambie Road,
approximately 1 km further north of the McNicols Lane turnoff. The Brunswick site offices are
accessed by a gravel road approximately 600 m long.
Land use surrounding the site is mainly small-scale farming consisting of grazing on cleared land,
surrounded by areas of lightly timbered Box-Ironbark forest. The majority of the undulating land and
alluvial flats is privately held freehold land.
The surrounding forest is largely rocky, rugged hill country administered by the DEDJTR as State
Forest. The Puckapunyal Military Area is located on the eastern boundary of the Project area.
The Augusta mine site is located on privately held land, while the Brunswick Processing Plant is
located on Unrestricted Crown land.
The Cuffley deposit, accessed via the Augusta mine, is located beneath unrestricted Crown land that
comprises sparse woodland, with numerous abandoned shafts and workings along the Historical
Alison and New Alison mineralised zone.
The Brunswick deposit will be accessed via an incline ramp from the Cuffley mine.
The topography of the Costerfield area consists of relatively flat to undulating terrain with elevated
areas to the south and west sloping down to a relatively flat plain to the north and east. The low-lying
areas of the plain are a floodplain. The area ranges in elevation from about 160 m ASL in the east,
along Wapentake Creek, to 288 m ASL in the northwest.
Central Victoria has a Mediterranean climate with hot, dry summers followed by cool, wet winters.
Annual rainfall in the area is approximately 500–600 mm, with the majority occurring between April
and October. The annual pan evaporation is 1,300–1,400 mm.
The temperature ranges from -2°C in winter (May to August) to +40°C in summer (November to
February). Monthly average temperature and rainfall data from Redesdale (the nearest weather
recording station to Costerfield, some 19 km southwest of Heathcote) is shown in Figure 5-1.
The weather is amendable to year-round mining operations; however, occasional significant high
rainfall events may restrict surface construction activity for a limited number of days.

SRK Consulting Page 23
KENT/WALS/FAIR/EBBE/wulr PLI028_Costerfield Operations_NI-43 101 Technical Report_2018_Rev1 6 February 2019
Figure 5-1: Monthly average temperature and rainfall
Source: Bureau of Meteorology.
The nearest significant population to Costerfield is Bendigo, located 50 km to the west–northwest, with
a population of approximately 100,000. The Costerfield Operation is a residential operation with
personnel residing throughout central Victoria as well as in Melbourne. Local infrastructure and
services are available in Heathcote.
The Augusta mine site consists of a bunded area that includes site offices, underground portal,
workshop facilities, waste rock storage area, settling ponds, mine dam, changehouse facilities and a
laydown area. Augusta has operated as an underground mine since the commencement of operations
in 2006. The Cuffley and Brunswick operations use the infrastructure associated with the current
Augusta operations. Figure 5-2 shows the Augusta mine box-cut, portal and workshop.
On 28 July 2018, the first ore was extracted from the Brunswick deposit and was accessed via an
incline ramp from the Cuffley mine. In August 2018, capital development from the Brunswick incline
to the Youle deposit commenced and it is envisioned that production at Youle will be commenced by
year-end of 2019.
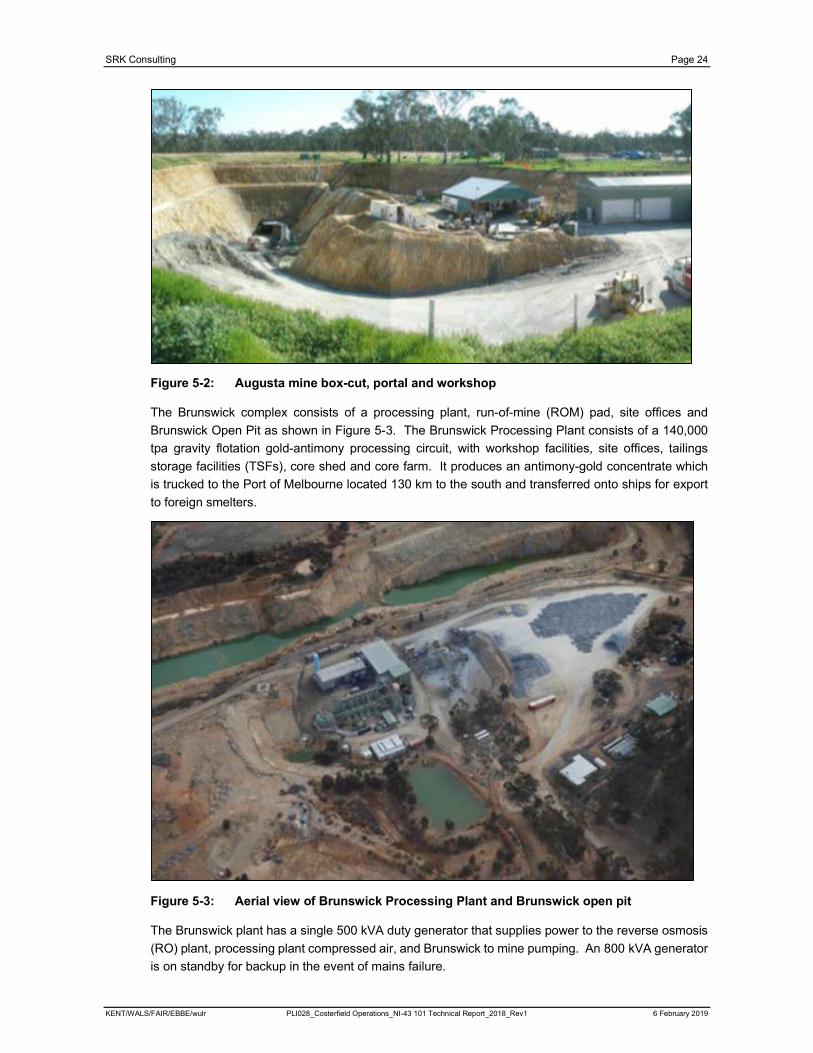
SRK Consulting Page 24
KENT/WALS/FAIR/EBBE/wulr PLI028_Costerfield Operations_NI-43 101 Technical Report_2018_Rev1 6 February 2019
Figure 5-2: Augusta mine box-cut, portal and workshop
The Brunswick complex consists of a processing plant, run-of-mine (ROM) pad, site offices and
Brunswick Open Pit as shown in Figure 5-3. The Brunswick Processing Plant consists of a 140,000
tpa gravity flotation gold-antimony processing circuit, with workshop facilities, site offices, tailings
storage facilities (TSFs), core shed and core farm. It produces an antimony-gold concentrate which
is trucked to the Port of Melbourne located 130 km to the south and transferred onto ships for export
to foreign smelters.
Figure 5-3: Aerial view of Brunswick Processing Plant and Brunswick open pit
The Brunswick plant has a single 500 kVA duty generator that supplies power to the reverse osmosis
(RO) plant, processing plant compressed air, and Brunswick to mine pumping. An 800 kVA generator
is on standby for backup in the event of mains failure.
SRK Consulting Page 25
KENT/WALS/FAIR/EBBE/wulr PLI028_Costerfield Operations_NI-43 101 Technical Report_2018_Rev1 6 February 2019
The Costerfield Operation has a current agreement with Powercor for 2 MW to be shared across the
2 HV supply points (Cuffley and Augusta). Once above 2 MVA, the customer is required to maintain
a power factor (PF) of 0.9. With 2 MW at 0.9 PF equating to 2.222 MVA, there is a requirement to
remain below 2.222 MVA across the 2 HV supply points. The Brunswick site has a contracted amount
for 706 kVA.
Process water for the Brunswick Processing Plant is drawn from the brine stream of the RO plant and
is supplemented by brine currently in storage when the RO plant is not in operation. The Augusta
mine re-uses groundwater for underground dewatering. Potable water is trucked in from Heathcote,
while grey water is stored in tanks and sewage is captured in sewage tanks before being trucked off
site by a local contractor.
The Splitters Creek Evaporation Facility evaporates groundwater extracted from the mining
operations, thereby maintaining dewatering rates from the underground workings. Additional detail is
provided in Section 20.
Construction of a 2.5 m raise to the Brunswick TSF to provide an additional 150,000 m3 of storage
capacity was completed in May 2017. The Bombay TSF had a 2.5 m (140,000 m3 capacity) lift
completed in 2018 and will be used until Q1 2020. Mandalay has existing conditional approval to raise
the height of the Bombay TSF an additional 2.7 m. Additional detail is provided in Section, 17, 18 and
20.

SRK Consulting Page 26
KENT/WALS/FAIR/EBBE/wulr PLI028_Costerfield Operations_NI-43 101 Technical Report_2018_Rev1 6 February 2019
From the 1860s, beginning with the initial discovery of the Costerfield Reef, until 1953, several
companies have developed and mined antimony deposits in the Costerfield area. Some underground
diamond drilling is known to have occurred during the period between 1934 and 1939 when Gold
Exploration and Finance Company of Australia operated the Costerfield Mine, but details of these
holes are scarce and poorly recorded. Significant exploration of the Costerfield area using modern
exploration techniques did not occur until 1966.
This section describes the work carried out by different owners over time. Table 6-1 presents a
summary of the historical drilling statistics of drilling by different operators at Costerfield since 1966.
Table 6-1: Historical drilling statistics for the Costerfield Property
Company YearMetres
(Diamond)Metres
(Percussion/ Auger)
Mid-East Minerals 1966–1971 3,676.2
Metals Investment Holdings 1971 1,760.8
Victoria Mines Department 1975–1981 3,213.0
Federation Resources NL 1983–2000 2,398.3
AGD/ Planet Resources JV 1987–1988 1,349.2
AGD NL
1987–1988 1,680.8
1994–1995 1,368.5 5,536.0
1996 195.5 2,310.0
1997 725.0
AGD Operations
*NB: From 2004, drilling descriptions have been reported in double years (i.e. 2004–2005) due to the fact that reporting has been in keeping with the Australian fiscal year (1 July to 30 June). Note that from 2016, descriptions, including drilling metres for exploration will be reported in calendar year to coincide with the Canadian fiscal year (1 January to 31 December).
2001 3,361.1
2002 907.5
2003 1,522.0
2004 3,159.9
2005 4,793.4
2006–2007 4,763.4
2007–2008 2,207.2
2008–2009 2585.95
Mandalay Resources 2009–2010 574.5 547.0
2010–2011 9890.0 732.0
2011–2012 18,581.4 7,295.6
2012–2013 25,774.8 3,838.0
2013–2014 20,817.0 3,906.0
2014–2015 18,439.0 2,732.0
2016 34,678.0
2017 26,403.0
2018 34,656.0
Subtotal 223,328.15 33,049.00

SRK Consulting Page 27
KENT/WALS/FAIR/EBBE/wulr PLI028_Costerfield Operations_NI-43 101 Technical Report_2018_Rev1 6 February 2019
From 1968 to 1969 the price of antimony rapidly rose from USD0.45/lb to USD1.70/lb.
This encouraged Mid-East Minerals (MEM) to acquire large amounts of ground around Costerfield.
Between 1969 and 1971, MEM conducted large-scale geochemical, geophysical, and diamond drilling
programs. These were conducted across the south Costerfield area encompassing the Alison Mine
and south towards Margaret’s, encompassing both the Cuffley Lode and the Augusta mine areas.
Diamond drilling was most successful at the Brunswick mine. Dropping antimony prices in 1971 led
to MEM’s decision to abandon its projects.
A series of diamond drillholes were completed by Metals Investment Holdings in 1971. Most drilling
occurred to the north of the Alison mine, with the exact locations of the holes unknown.
Two drillholes were situated to the north of the Tait’s mine (north of Augusta), of which minimal detail
remains.
A series of diamond drillholes were completed by the Victorian Mines Department in the late 1970s.
Most drilling occurred to the south of the Brunswick mine. However, two holes (M31 and M32), drilled
approximately 150 m to the south of the South Costerfield Shaft (in the Augusta mine area), intersected
a high-grade reef. This reef was interpreted as the East Reef, which was mined as part of the South
Costerfield mine.
Federation Resources undertook several campaigns of exploration in the Costerfield area, but focused
on the Browns-Robinsons prospects to the east of the Alison mine. The exploration conducted
identified a gold target with no evidence of antimony. This target has yet to be followed up by Mandalay
because it is viewed as low-priority target.
Federation Resources conducted desktop studies on the area above the Augusta mine, noting the
anomalous results of the soil geochemistry programs conducted by the Victorian Mines Department
and MEM but did not conduct drilling at this location.
Australian Gold Development NL conducted a short reverse circulation drilling (RC) program in
conjunction with its joint venture partner, Planet Resources, in 1987. This drilling consisted of a total
of 21 holes for 1,235 m across the broader Costerfield area. Gold was assayed via atomic absorption
spectrometry (AAS), which compromised antimony grades. Drilling was also done with a tri-cone bit,
which may have led to serious contamination.
From 1987 to 1997, Australian Gold Development undertook several programs of exploration and
mining activities dominantly focused around the Brunswick mine. A series of RC holes were drilled
during 1997, testing for shallow oxide gold potential to the north of the Alison mine. Several
occurrences of yellow antimony sulphides were noted but were not followed up.
In 2001, AGD (formerly Australian Gold Development) and Deepgreen Minerals Corporation Ltd
entered into an agreement to form a joint venture to explore the Costerfield tenements. The agreed
SRK Consulting Page 28
KENT/WALS/FAIR/EBBE/wulr PLI028_Costerfield Operations_NI-43 101 Technical Report_2018_Rev1 6 February 2019
starting target was the MH Zone, now known as the Augusta mine.
2001
AGD’s drilling of the MH Zone commenced on 5 April 2001; a total of 27 holes for 3,301.1 m were
completed. All holes were drilled with an initial PQ or HQ collar to approximately 25 m depth and then
finished with a NQ-sized drill bit, the purpose of which was to maximise core recoveries. Triple-tube
drilling was also employed in areas to maximise recoveries. Cobar Drilling Company Pty Ltd, based
in Rushworth, was contracted for the drilling program. Less competent rock adjacent to the
mineralisation was successfully recovered during this program, but core loss was still estimated to be
up to 15% within the mineralised zones. All holes were downhole surveyed and orientated during
drilling. Collar locations were surveyed by Adrian Cummins & Associates from Bendigo.
This drilling was confined to an area 180 m south of the South Costerfield Shaft and over approximately
400 m of strike.
It was identified that because of prolonged mining and exploration undertaken in the Costerfield area,
up to three metric grids were in use. The drilling undertaken in 2001 at Augusta was based on the
mine grid established in the late 1950s. This grid set-up remains in use in present day mining and
exploration activities.
2002
In 2002, AGD completed a further five holes at the MH Zone for a total 732.3 m, including 41.7 m of
blade, 309.3 m of RC hammer and 381.3 m of HQ diamond drilling. Drillhole MH034 intersected an
unmineralised zone at 55 m downhole. This is hypothesised to represent the Alison line of lode
towards the south.
Towards the east of the MH Zone, AGD completed two lines of soil sampling comprising 400.5 m of
aircore drilling in 88 holes. The known MH lodes were highly anomalous, and a weak, gold-only trend
was outlined 180 m east of the MH Zone. This zone was drilled by diamond drillhole MH028, which
contained a large siliceous lode zone with low-grade gold values.
To the south of the MH Zone, AGD sampled two soil lines in 42 holes. It was later recognised that
these holes probably did not sample basement siltstones. A further line of 21 soil holes confirmed this
prognosis. These holes picked up widespread anomalous gold geochemistry with a central strong
anomaly. A total of 218 m of aircore drilling was completed.
2003
In 2003, the MH Zone was renamed the Augusta deposit. In total, 30 diamond drillholes for 1,514 m
were drilled by AGD as part of an infill and extension program to the Augusta deposit. The main
purpose of this drilling was to prove continuity of the deposit to near surface, in preparation for open
pit mining and to extend the mineralised system to the north and south. Mineralisation was shown to
extend north to the South Costerfield Shaft and upwards to the surface. To the south, drilling confirmed
that the lode system, although present, was not economic.
Each hole was logged in detail and geological lode thickness and recovered thicknesses were
recorded. Core loss was estimated to be less in this drill program when compared to previous drilling
programs, even though the majority of drillholes were drilled in the weathered zone.
In addition to the infill and extension program, 14 RC drillholes were drilled as part of a metallurgical
testwork program. These holes were drilled at low angles to the lodes, specifically to obtain the
required sample mass for the metallurgical testwork.
SRK Consulting Page 29
KENT/WALS/FAIR/EBBE/wulr PLI028_Costerfield Operations_NI-43 101 Technical Report_2018_Rev1 6 February 2019
2004/ 2005
Between October 2004 and April 2005, AGD completed a 26-hole diamond drilling program at the
Augusta deposit. Apart from 5 m percussion pre-collars and four RC geotechnical holes, the holes
were drilled by HQ triple-tube diamond drilling. The objectives of the diamond drilling program were:
Improvement in mineralisation definition by increasing drillhole density
Extension of the mineralisation model by drilling around the deposit periphery
Increasing the Mineral Resource and Mineral Reserve.
2006/ 2007
AGD’s drilling activities in 2006–2007 involved grid drilling of the Brunswick deposit and drilling of the
periphery of the Augusta deposit for 7,562 m of diamond drilling, comprising the following drillholes:
31 holes, totalling 4,994 m, drilled under the old Brunswick open pit for resource estimation
17 holes, totalling 755 m, drilled into the upper northern end of W Lode
20 holes, totalling 1,813 m, drilled north of the Augusta mine to test the northern extent of the E
Lode.
The Brunswick Resource definition drilling was drilled using HQ triple tube with a modified Longyear
LM75 drill rig by Boart Longyear drilling. The area under the pit was drilled on a 40 × 40 m pattern.
Due to initial difficulty in following W Lode underground, a bobcat-mounted Longyear LM30 diamond
drilling rig was used to infill drill the near-surface portion of W Lode. This drilling was done using a
narrow-kerf LTK60-sized core barrel, with a total of 17 holes, totalling 755 m, being drilled adjacent to
the Augusta box-cut.
On completion of the Brunswick and W Lode drilling, both the LM75 and the LM30 rigs were used to
drill north of the Augusta mine, tracing the northern extent of E Lode towards the old South Costerfield
workings. A total of 20 holes for 1,813 m were drilled north of the Augusta mine.
Development of the Augusta decline commenced during the first quarter of 2006. By the end of the
second quarter, all the surface infrastructure had been completed together with open cut mining of the
E and C lodes. Decline development commenced during June 2006 and underground production
commenced by the end of the third quarter of 2006.
2007/ 2008
AGD’s drilling activities throughout 2007 and 2008 comprised reconnaissance drilling of the Tin Pot
Gully prospect and drilling along strike and down-dip of the existing Augusta deposit. A total of
3,395.6 m of diamond drilling was carried out during the year, comprising the following:
13 holes, totalling 1,188 m, drilled under the Tin Pot Gully prospect
11 holes, totalling 2,207 m, drilled into the Augusta deposit, particularly to test the W and E lodes.
Encouraging results highlighted down-dip and strike extensions in terms of vein widths and grades, as
described below:
W Lode: 8 out of the 11 drillholes confirmed W Lode continuity down-dip, with true thicknesses
ranging from 0.254 m to 0.814 m at 22.50–89.26 g/t Au and 16.19%–47.20% Sb
E Lode: 3 out of the 8 holes drillholes confirmed E Lode continuity down-dip, with true thickness
ranging from 0.074 m to 0.215 m at 4.24–35.1 g/t Au and 3.25%–32.2% Sb
N Lode: 6 holes out of the 11 holes intercepted N Lode or a similar structure in the hanging wall
of W Lode, showing true thicknesses from 0.09 m to 0.293 m at 6.82–46.9 g/t Au and
6.81%–27% Sb.
SRK Consulting Page 30
KENT/WALS/FAIR/EBBE/wulr PLI028_Costerfield Operations_NI-43 101 Technical Report_2018_Rev1 6 February 2019
Based on these results, AGD commissioned AMC Consultants Pty Ltd (AMC) to undertake a resource
estimate for the Augusta deposit in January 2008.
Between February and June 2008, Silver City Drilling Company completed 11 drillholes, totalling
2,207.2 m that were drilled on the northern section of the Augusta deposit, particularly from 4,411 mN
to 4,602 mN.
The 11 surface drillholes covered an area of approximately 18,740 m2, delineating a 120 m down-dip
continuation, below 4 Level, of the three dominant Augusta Lodes – W Lode, E Lode and N Lode.
Holes ranged in size from HQ to NQ and LTK46.
By June 2008, capital development reached 7 Level (1,081 mRL). Development was completed on
E Lode on 5 Level and was halfway through completion on 6 Level. W Lode development was
completed down to 4 Level and development on 5 Level was just beginning. Handheld/ airleg rise
mining had begun.
2008/ 2009
AGD’s drilling activities throughout 2008 and 2009 comprised drilling along strike and down-dip from
the existing Augusta resource. A total of 2,585.95 m of diamond drilling was completed.
Drilling during 2008 and 2009 was concentrated on the definition of the W Lode resource.
Five drillholes tested the depth extent of W Lode. Another 13 holes were designed as infill holes to
test ore shoots and gather geotechnical data. Holes ranged in size from HQ to NQ and LTK46.
By June 2009, capital development reached 9 Level (1,070 mRL). Ore drive development was
constrained to levels along the E and W lodes. Stoping along W Lode was conducted and additional
development along E Lode using three mining methods – floor benching, cut-and-fill and longhole
stoping.
2009/ 2010
On 1 December 2009, AGD Mining Pty Ltd/ AGD Operations Pty Ltd was acquired by Mandalay
Resources Corporation.
Drilling from July 2009 to June 2010 mainly comprised drilling along strike and down-dip from the
existing Augusta resource (MIN4644). In total, 332.5 m of diamond coring was undertaken, targeting
the Augusta resource.
In addition, 547 m of bedrock geochemistry (Augusta South) aircore drilling was completed within
MIN4644.
Outside of the main field, 120.5 m of diamond drilling was completed at the True Blue Reef prospect
in EL3310 and 122.8 m of diamond drilling at Hirds Reef prospect in EL4848.
Drilling during this reporting period has been concentrated on the definition of the W Lode resource.
Four drillholes tested the depth extent of W Lode, and another six holes were designed as infill holes
to test ore shoots and gather geotechnical data.
From July 2009 to June 2010, capital development reached 1,020 mRL (155 m below surface).
Ore drive development was carried out on E Lode and W Lode.
2010/ 2011
Drilling from July 2010 to June 2011 was undertaken on two projects, the ‘Augusta Deeps’ drilling
project and the ‘Brownfields Exploration’ project. The Augusta Deeps project was undertaken with the
view to extending the current Augusta resource to depth (MIN4644). The objective of the Brownfields
Exploration project was to find additional ore sources within Mandalay’s tenements, to supplement the
SRK Consulting Page 31
KENT/WALS/FAIR/EBBE/wulr PLI028_Costerfield Operations_NI-43 101 Technical Report_2018_Rev1 6 February 2019
Augusta ore. The initial emphasis of the Brownfields Exploration project was to identify ore sources
within 1 km of the Augusta Decline. In total 9,890.7 m of diamond coring and 732 m of auger drilling
was undertaken as part of the two projects.
Capital development reached 976 mRL (200 m below surface). Ore drive development was carried
out on E Lode and W Lode.
2011/ 2012
Drilling was undertaken on four projects – the ‘Augusta Deeps’ project, the Alison/ Cuffley project, the
‘Brownfields’/ Target Exploration drilling project and the Target Generation – Bedrock Geochemistry
auger drilling project.
The Augusta Deeps project was undertaken with the view to extending the current Augusta resource
to depth and along strike (MIN4644). The Alison/ Cuffley project was undertaken to outline the recently
discovered Cuffley Lode and to define an initial Inferred Mineral Resource.
The objective of the Brownfields/ Target Exploration project was to find additional ore sources within
Mandalay’s tenements to supplement the Augusta ore. The initial emphasis of the Brownfields project
was to identify sources of ore within 1 km of the Augusta Decline. The drilling program is now more
regional.
The Bedrock Geochemistry auger drilling project is revealing anomalous zones under shallow alluvial/
colluvial cover throughout the tenements.
In total 18,581.4 m of diamond coring and 7,295.6 m of auger drilling was undertaken as part of the
four projects from July 2011 to June 2012.
On 17 June 2011, MB007 intersected the Cuffley Lode just below a flat fault that had stopped
production at 5 Level in the Alison mine in 1922. Resource drilling commenced in July 2011.
The Cuffley Lode is 500 m north–northwest of the Augusta deposit workings and scoping studies
commenced in 2011 to access the deposit from the Augusta Decline.
From July 2011 to June 2012, capital development reached 926 mRL (252 m below surface) and ore
drive development was carried out on E Lode and W Lode.
2012/ 2013
On 7 February 2013, AGD Operations Pty Ltd underwent a name change to Mandalay Resources
Costerfield Operations Pty Ltd.
Drilling was undertaken on two primary projects – Cuffley Resource Drilling and Augusta Resource
Drilling.
In total, 25,774.8 m of diamond drilling and 3,838 m of auger drilling were undertaken on Mandalay’s
tenements at Costerfield from July 2012 to June 2013. Capital development reached 878 mRL (300 m
below surface) and ore drive development was carried out on E, W and N Lodes.
2013/ 2014
In 2013/ 2014, the focus was on finalising the Cuffley and Augusta Resource Drilling.
In total, 20,817 m of diamond drilling was undertaken, and 3,906 m of auger drilling was undertaken
on Mandalay’s tenements at Costerfield during 2013/ 2014.
During 2014, mining of the Augusta and Cuffley deposits commenced. Development on C1 and C2
lodes in the Cuffley deposit began in January 2014. Both deposits were accessed through the Augusta
portal, with Cuffley’s capital infrastructure exiting the Augusta Decline at 1030 mRL.
SRK Consulting Page 32
KENT/WALS/FAIR/EBBE/wulr PLI028_Costerfield Operations_NI-43 101 Technical Report_2018_Rev1 6 February 2019
2014/ 2015
Exploration in 2015 was focused on extending the Cuffley and Augusta resources both along strike
and at depth. The expansion of the Cuffley resource included the commencement of drilling in the
Cuffley Deeps and Sub King Cobra regions.
In total, 18,439 m of diamond drilling and 2,732 m of RC drilling was undertaken on Mandalay’s
tenements at Costerfield during 2015.
During 2015, the Augusta and Cuffley deposits were mined. Development on C1 and C2 lodes in the
Cuffley deposit began in January 2014. Both deposits were accessed through the Augusta portal, with
Cuffley’s capital infrastructure exiting the Augusta Decline at 1030 mRL.
2016
*NB: From 2004 drilling descriptions have been reported in double years (i.e. 2004–2005) due to the
fact that reporting has been in keeping with the Australian fiscal year (1 July to 30 June). Note that
from 2016, descriptions, including drilling metres for exploration will be reported in calendar year to
coincide with the Canadian fiscal year (1 January to 31 December).
Exploration in 2016 was focused predominantly on near-mine and opportunistic targets close to
existing infrastructure and capital development, with the primary focus to extend the mine life.
In addition to near-mine exploration Mandalay carried out exploration drilling on accessible targets
within 1 km of the existing portal.
In total, 34,678 m of diamond drilling was undertaken on Mandalay’s Costerfield tenements during
2016, and the Augusta and Cuffley deposits were mined. Within the Augusta deposit, ore was
extracted through drive development and stoping along N Lode north, with a small amount of
development and stoping occurring on B Lode and E Lode. Development and stoping continued on
the C1 and C2 lodes during 2016 and both the Augusta and Cuffley lodes were accessed through the
Augusta portal with Cuffley’s capital infrastructure exiting the Augusta Decline at 1030 mRL.
2017
Exploration in 2017 was focused predominantly on near-mine and opportunistic targets close to
existing infrastructure and capital development, with the primary focus to increase immediate mine
life. A strong focus for the year was in carrying out infill and extension of the Brunswick resource while
also increasing in-mine resources through Opportunistic Drilling Projects. A successful target testing
campaign has also been underway to investigate the depth continuation of mineralisation underneath
the Costerfield mine.
In total, 26,403 m of diamond drilling was undertaken on Mandalay’s tenements at Costerfield during
2017. Throughout the year, the Augusta and Cuffley deposits were mined. Within the Augusta
deposit, ore was extracted through drive development and stoping along N Lode north and NV Lode.
A small amount of development and stoping occurred on the B, K, and NE lodes. Development and
stoping continued on the C1, C2 and CD lodes during 2017. Both the Augusta and Cuffley lodes were
accessed through the Augusta portal with Cuffley’s capital infrastructure exiting the Augusta Decline
at 1,030 mRL.
2018
A strong focus for 2018 exploration was on replacing depletion, increasing reserve grade and
extending the mine life. Exploration in 2018 resulted in the inclusion of the high-grade Youle Lode in
Mineral Reserves. At Youle, 94,282 oz Au and 7,000 t Sb was added to the Mineral Reserves at
grades of 11.2 g/t Au and 2.7% Sb.
SRK Consulting Page 33
KENT/WALS/FAIR/EBBE/wulr PLI028_Costerfield Operations_NI-43 101 Technical Report_2018_Rev1 6 February 2019
Exploration also involved carrying out infill and extension drilling of the Brunswick and Youle resources
while also increasing in-mine resources through Opportunistic Drilling Projects. The Youle resource
drilling has also informed the decision to mine the Youle Lode.
The goals achieved in 2018 include:
Successful infill and resource drilling of the Youle deposit
Commencement of capital development at the Youle deposit
Regional exploration with drill testing of the Costerfield mine extension, Augusta East and
Brunswick line of lode
Commencement of mining of the Brunswick deposit.
In total, 34,656 m of diamond drilling was undertaken on Mandalay’s tenements at Costerfield during
2018.
Throughout the year, the Augusta, Cuffley and Brunswick deposits were mined, all of which were
accessed through the Augusta portal with Cuffley’s capital infrastructure exiting the Augusta Decline
at 1,030 mRL.
Mandalay Resources has reported Mineral Resources and Mineral Reserves from 2010 to 2018.
Mineral Resources are presented in Table 6-2 and Mineral Reserves are presented in Table 6-3.
These estimates have been superseded by the resource and reserve estimates in this report.
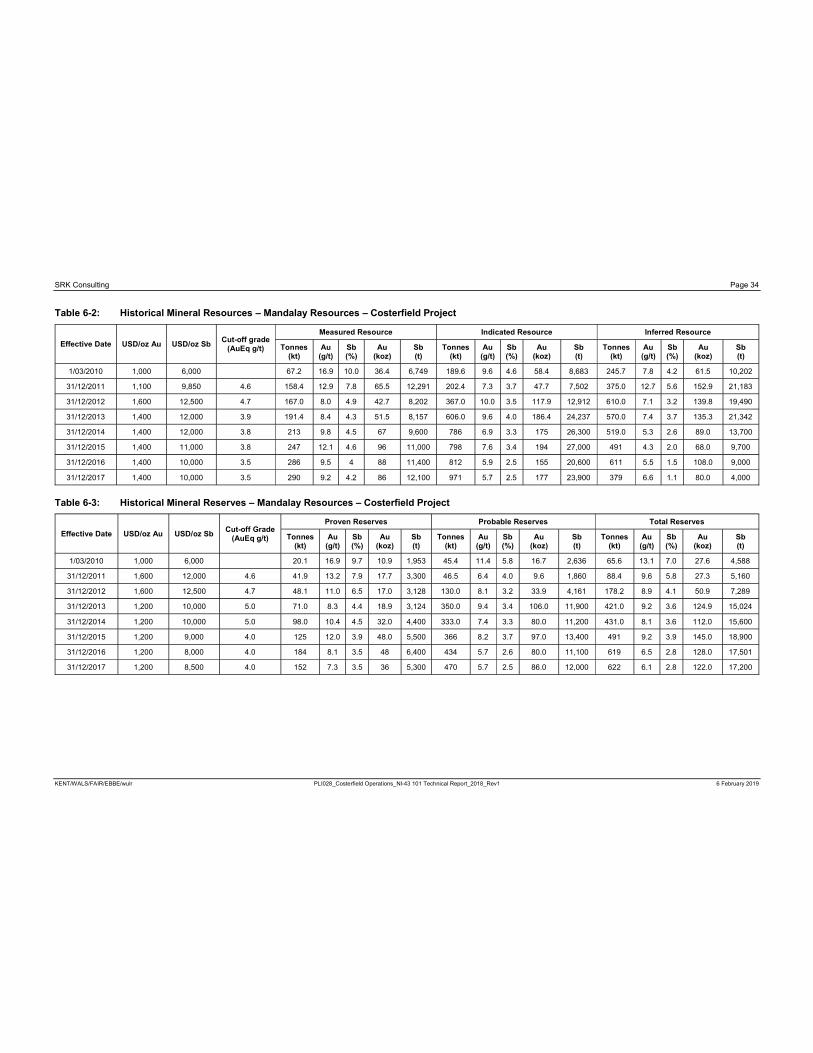
SRK Consulting Page 34
KENT/WALS/FAIR/EBBE/wulr PLI028_Costerfield Operations_NI-43 101 Technical Report_2018_Rev1 6 February 2019
Table 6-2: Historical Mineral Resources – Mandalay Resources – Costerfield Project
Effective Date USD/oz Au USD/oz SbCut-off grade
(AuEq g/t)
Measured Resource Indicated Resource Inferred Resource
Tonnes (kt)
Au (g/t)
Sb (%)
Au (koz)
Sb (t)
Tonnes (kt)
Au (g/t)
Sb (%)
Au (koz)
Sb (t)
Tonnes (kt)
Au (g/t)
Sb (%)
Au (koz)
Sb (t)
1/03/2010 1,000 6,000 67.2 16.9 10.0 36.4 6,749 189.6 9.6 4.6 58.4 8,683 245.7 7.8 4.2 61.5 10,202
31/12/2011 1,100 9,850 4.6 158.4 12.9 7.8 65.5 12,291 202.4 7.3 3.7 47.7 7,502 375.0 12.7 5.6 152.9 21,183
31/12/2012 1,600 12,500 4.7 167.0 8.0 4.9 42.7 8,202 367.0 10.0 3.5 117.9 12,912 610.0 7.1 3.2 139.8 19,490
31/12/2013 1,400 12,000 3.9 191.4 8.4 4.3 51.5 8,157 606.0 9.6 4.0 186.4 24,237 570.0 7.4 3.7 135.3 21,342
31/12/2014 1,400 12,000 3.8 213 9.8 4.5 67 9,600 786 6.9 3.3 175 26,300 519.0 5.3 2.6 89.0 13,700
31/12/2015 1,400 11,000 3.8 247 12.1 4.6 96 11,000 798 7.6 3.4 194 27,000 491 4.3 2.0 68.0 9,700
31/12/2016 1,400 10,000 3.5 286 9.5 4 88 11,400 812 5.9 2.5 155 20,600 611 5.5 1.5 108.0 9,000
31/12/2017 1,400 10,000 3.5 290 9.2 4.2 86 12,100 971 5.7 2.5 177 23,900 379 6.6 1.1 80.0 4,000
Table 6-3: Historical Mineral Reserves – Mandalay Resources – Costerfield Project
Effective Date USD/oz Au USD/oz SbCut-off Grade
(AuEq g/t)
Proven Reserves Probable Reserves Total Reserves
Tonnes (kt)
Au (g/t)
Sb (%)
Au (koz)
Sb (t)
Tonnes (kt)
Au (g/t)
Sb (%)
Au (koz)
Sb (t)
Tonnes (kt)
Au (g/t)
Sb (%)
Au (koz)
Sb (t)
1/03/2010 1,000 6,000 20.1 16.9 9.7 10.9 1,953 45.4 11.4 5.8 16.7 2,636 65.6 13.1 7.0 27.6 4,588
31/12/2011 1,600 12,000 4.6 41.9 13.2 7.9 17.7 3,300 46.5 6.4 4.0 9.6 1,860 88.4 9.6 5.8 27.3 5,160
31/12/2012 1,600 12,500 4.7 48.1 11.0 6.5 17.0 3,128 130.0 8.1 3.2 33.9 4,161 178.2 8.9 4.1 50.9 7,289
31/12/2013 1,200 10,000 5.0 71.0 8.3 4.4 18.9 3,124 350.0 9.4 3.4 106.0 11,900 421.0 9.2 3.6 124.9 15,024
31/12/2014 1,200 10,000 5.0 98.0 10.4 4.5 32.0 4,400 333.0 7.4 3.3 80.0 11,200 431.0 8.1 3.6 112.0 15,600
31/12/2015 1,200 9,000 4.0 125 12.0 3.9 48.0 5,500 366 8.2 3.7 97.0 13,400 491 9.2 3.9 145.0 18,900
31/12/2016 1,200 8,000 4.0 184 8.1 3.5 48 6,400 434 5.7 2.6 80.0 11,100 619 6.5 2.8 128.0 17,501
31/12/2017 1,200 8,500 4.0 152 7.3 3.5 36 5,300 470 5.7 2.5 86.0 12,000 622 6.1 2.8 122.0 17,200
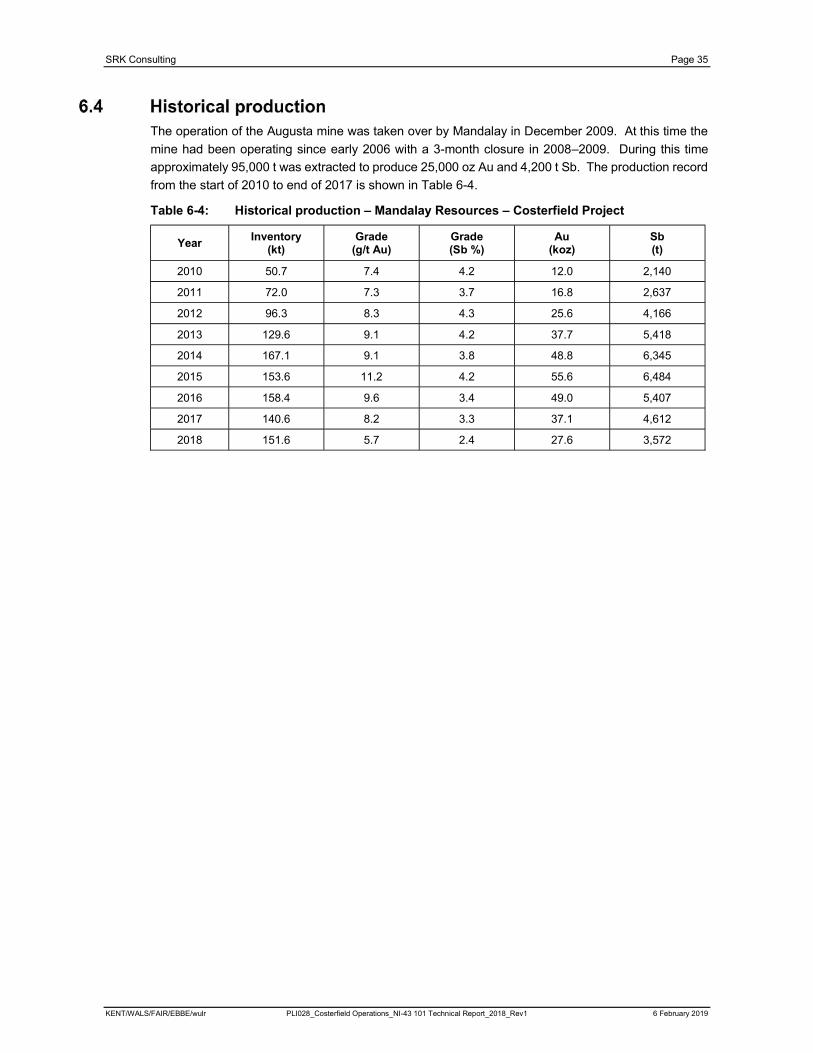
SRK Consulting Page 35
KENT/WALS/FAIR/EBBE/wulr PLI028_Costerfield Operations_NI-43 101 Technical Report_2018_Rev1 6 February 2019
The operation of the Augusta mine was taken over by Mandalay in December 2009. At this time the
mine had been operating since early 2006 with a 3-month closure in 2008–2009. During this time
approximately 95,000 t was extracted to produce 25,000 oz Au and 4,200 t Sb. The production record
from the start of 2010 to end of 2017 is shown in Table 6-4.
Table 6-4: Historical production – Mandalay Resources – Costerfield Project
YearInventory
(kt)Grade
(g/t Au)Grade (Sb %)
Au(koz)
Sb (t)
2010 50.7 7.4 4.2 12.0 2,140
2011 72.0 7.3 3.7 16.8 2,637
2012 96.3 8.3 4.3 25.6 4,166
2013 129.6 9.1 4.2 37.7 5,418
2014 167.1 9.1 3.8 48.8 6,345
2015 153.6 11.2 4.2 55.6 6,484
2016 158.4 9.6 3.4 49.0 5,407
2017 140.6 8.2 3.3 37.1 4,612
2018 151.6 5.7 2.4 27.6 3,572
SRK Consulting Page 36
KENT/WALS/FAIR/EBBE/wulr PLI028_Costerfield Operations_NI-43 101 Technical Report_2018_Rev1 6 February 2019
The Costerfield gold-antimony mineralisation zone is located at the northern end of the Darraweit Guim
province, in the Western portion of the Melbourne Zone. In the Heathcote area of the Melbourne Zone,
the Murrindindi Supergroup within the Darraweit Guim Province encompasses a very thick sequence
of Siluro-Devonian marine sediments. These consist predominantly of siltstone, mudstone and
turbidite sequences.
The western boundary of the Darraweit Guim Province is demarcated by the Cambrian Heathcote
Volcanic Belt and north-trending Mt William Fault. The Mt William Fault is a major structural terrain
boundary that separates the Bendigo Zone from the Melbourne Zone.
The lower Silurian Costerfield Siltstone is the oldest unit in the Heathcote area and is conformably
overlain by the Wapentake Formation (sandstone/ siltstone), the Dargile Formation (mudstone), the
McIvor Sandstone, and the Mt Ida Formation (sandstone/ mudstone).
The Melbourne Zone sedimentary sequence has been deformed into a series of large-scale domal
folds. These major north-trending, sub-parallel folds in the Darraweit Guim Province include, from
west to east, the Mt Ida Syncline; the Costerfield Dome/ Anticline; the Black Cat and Graytown
anticlines; and the Rifle Range Syncline. These folds tend to be upright, open, large wavelength
curvilinear structures.
The folds have been truncated by significant movements along two major north-trending faults, the
Moormbool and Black Cat faults.
The Moormbool Fault has truncated the eastern limb of the Costerfield Anticline, resulting in an
asymmetric dome structure. The Moormbool Fault is a major structural boundary separating two
structural subdomains in the Melbourne Zone. West of the Moormbool Fault is the Siluro-Devonian
sedimentary sequence, hosting the gold-antimony lodes. The thick, predominantly Devonian
Broadford Formation sequence occurs to the east of the fault and contains minor gold-dominant
mineralisation.
The Costerfield gold-antimony mineralisation is located on the Costerfield Dome which contains
poorly-exposed lower Silurian Costerfield Siltstone at its core. Within the Costerfield area, four north–
northwest trending zones of mineralisation have been identified. They are, from the west:
Antimony Creek Zone, about 6.5 km southwest of Costerfield, on the outer western flank of the
Costerfield Dome
Western Zone, about 1.5 km west of Costerfield, on the western flank of the Costerfield Dome
Costerfield Zone, near the crest of the dome, centred on the Costerfield township and hosting the
major producing mines and deposits
Robinsons–Browns (R-B) Zone, 2 km east of Costerfield.
The Costerfield Siltstone-hosted quartz/ sulphide lodes in the Costerfield Zone are controlled by north–
northwest trending faults and fractures located predominantly on the west flank of the Costerfield
Anticline. This is shown in Figure 7-1.
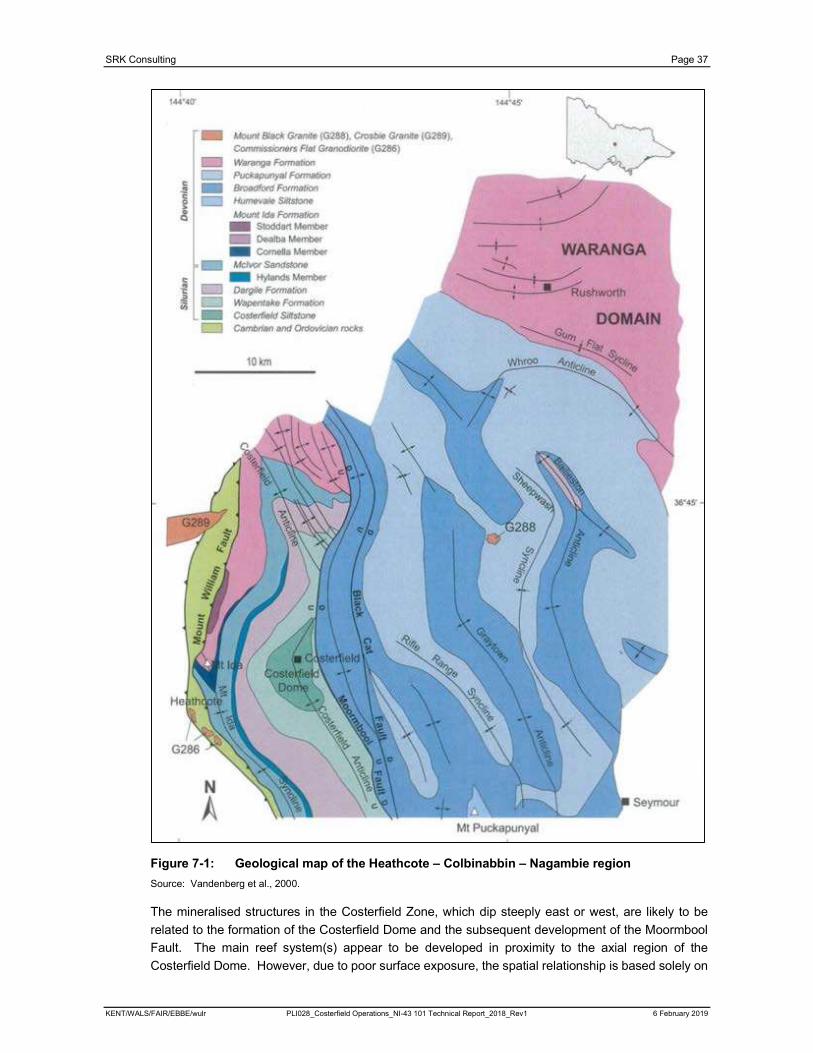
SRK Consulting Page 37
KENT/WALS/FAIR/EBBE/wulr PLI028_Costerfield Operations_NI-43 101 Technical Report_2018_Rev1 6 February 2019
Figure 7-1: Geological map of the Heathcote – Colbinabbin – Nagambie region
Source: Vandenberg et al., 2000.
The mineralised structures in the Costerfield Zone, which dip steeply east or west, are likely to be
related to the formation of the Costerfield Dome and the subsequent development of the Moormbool
Fault. The main reef system(s) appear to be developed in proximity to the axial region of the
Costerfield Dome. However, due to poor surface exposure, the spatial relationship is based solely on
SRK Consulting Page 38
KENT/WALS/FAIR/EBBE/wulr PLI028_Costerfield Operations_NI-43 101 Technical Report_2018_Rev1 6 February 2019
limited underground mapping at the northern end of the zone. The mapping also shows that later
faulting (conjugate northwest and northeast faulting) has severely disrupted the mineralised system in
the north.
Host rocks are Silurian Costerfield Formation siltstones and mudstones (Costerfield Siltstone). These
siltstones and mudstones are estimated to be approximately m thick and are the oldest exposed rocks
in the local area.
Significant portions of the local area are obscured by alluvium and colluvium deposits, which have
washed out over the plains via braided streams flowing east off the uplifted Heathcote Fault Zone.
Some of this alluvial material has been worked for gold, but workings are small scale and limited in
extent. Most of the past mined hard rock deposits were found either outcropping or discovered by
trenching within a few metres of surface. The Augusta deposit was discovered late in the history of
the field (1970) by bedrock geochemistry, buried under 2–6 m of alluvium which was deposited at the
meandering Mountain Creek/ Wapentake Creek confluence.
Locally, the sedimentary succession of the Costerfield area has been deformed into a broad anticlinal
dome structure with numerous cross-cutting reverse thrust faults. This domal structure is thought to
have resulted from two separate tectonic events, the first producing shortening in an east–west
direction (folding and thrust faulting) and the second producing north–south shortening (gentle warping
and mild folding). The anticlinal hinge zone of the Costerfield Anticline has been thrust over its eastern
limb by the north–south trending King Cobra Fault zone (Figure 7-2).
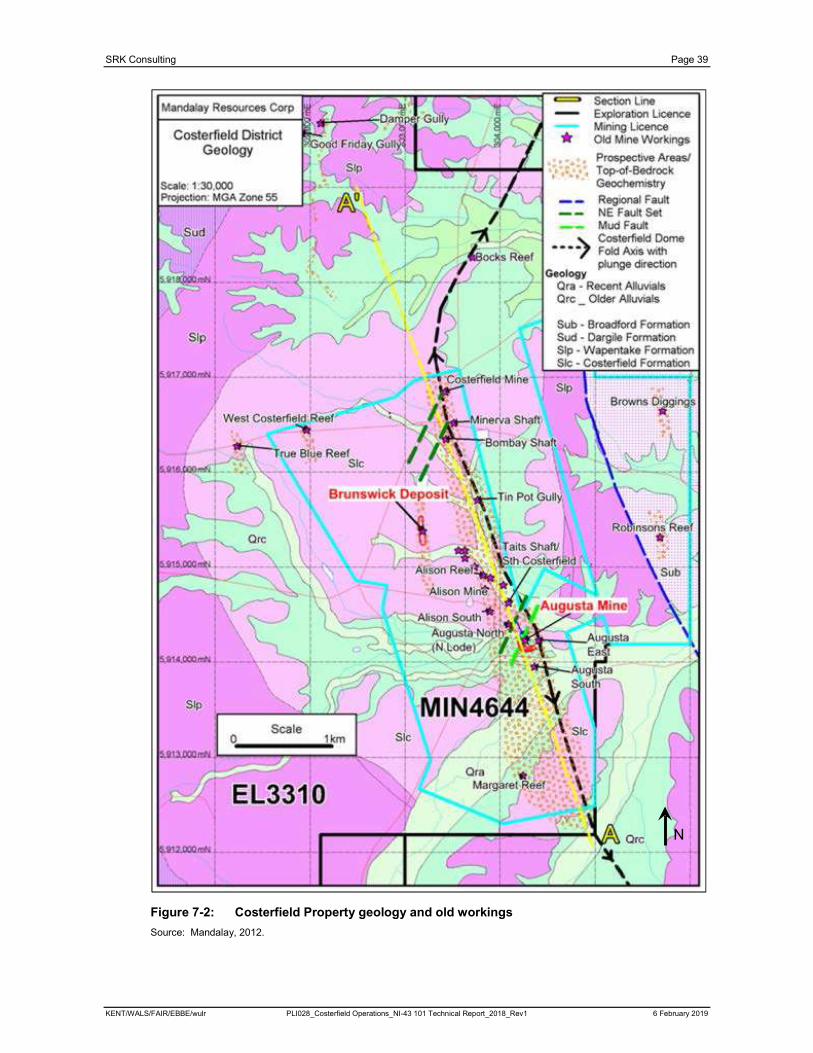
SRK Consulting Page 39
KENT/WALS/FAIR/EBBE/wulr PLI028_Costerfield Operations_NI-43 101 Technical Report_2018_Rev1 6 February 2019
Figure 7-2: Costerfield Property geology and old workings
Source: Mandalay, 2012.
N
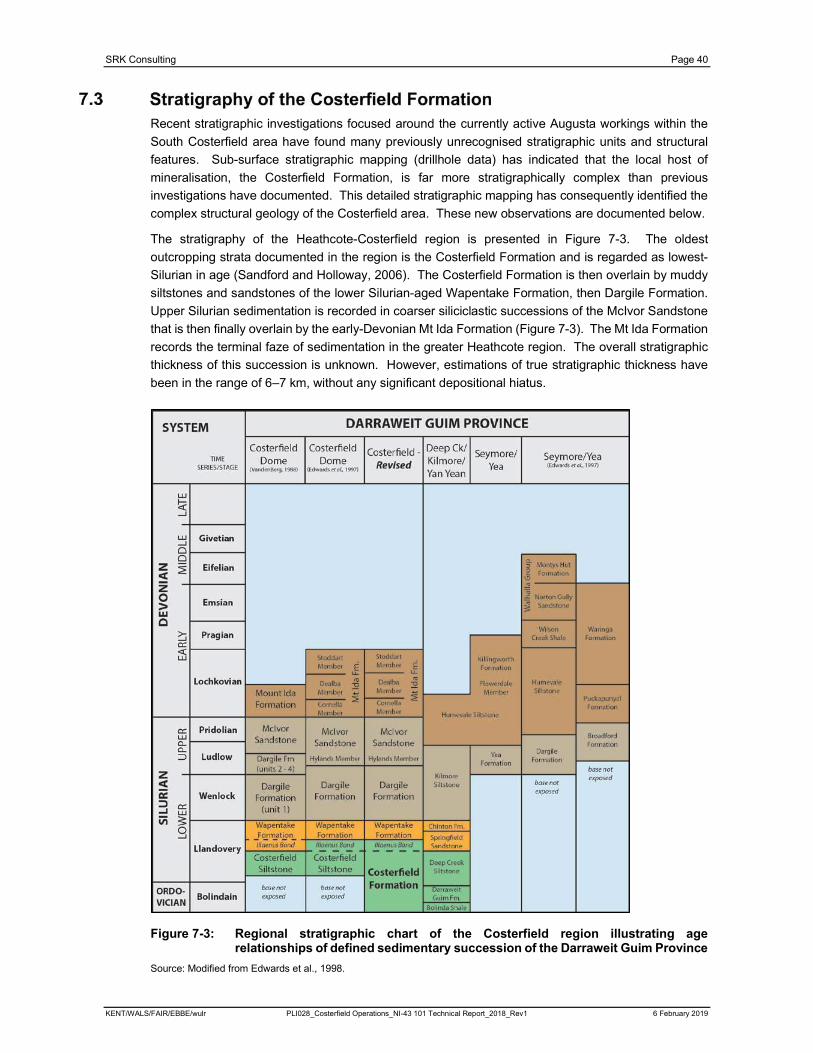
SRK Consulting Page 40
KENT/WALS/FAIR/EBBE/wulr PLI028_Costerfield Operations_NI-43 101 Technical Report_2018_Rev1 6 February 2019
Recent stratigraphic investigations focused around the currently active Augusta workings within the
South Costerfield area have found many previously unrecognised stratigraphic units and structural
features. Sub-surface stratigraphic mapping (drillhole data) has indicated that the local host of
mineralisation, the Costerfield Formation, is far more stratigraphically complex than previous
investigations have documented. This detailed stratigraphic mapping has consequently identified the
complex structural geology of the Costerfield area. These new observations are documented below.
The stratigraphy of the Heathcote-Costerfield region is presented in Figure 7-3. The oldest
outcropping strata documented in the region is the Costerfield Formation and is regarded as lowest-
Silurian in age (Sandford and Holloway, 2006). The Costerfield Formation is then overlain by muddy
siltstones and sandstones of the lower Silurian-aged Wapentake Formation, then Dargile Formation.
Upper Silurian sedimentation is recorded in coarser siliciclastic successions of the McIvor Sandstone
that is then finally overlain by the early-Devonian Mt Ida Formation (Figure 7-3). The Mt Ida Formation
records the terminal faze of sedimentation in the greater Heathcote region. The overall stratigraphic
thickness of this succession is unknown. However, estimations of true stratigraphic thickness have
been in the range of 6–7 km, without any significant depositional hiatus.
Figure 7-3: Regional stratigraphic chart of the Costerfield region illustrating age relationships of defined sedimentary succession of the Darraweit Guim Province
Source: Modified from Edwards et al., 1998.
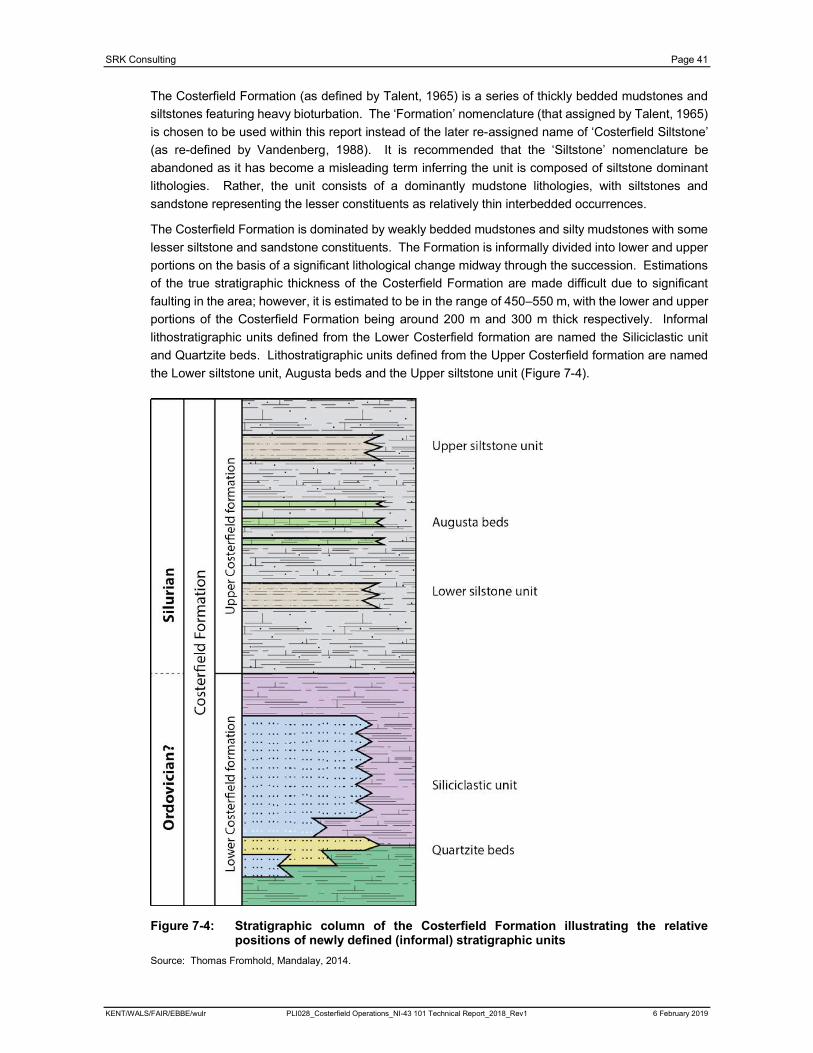
SRK Consulting Page 41
KENT/WALS/FAIR/EBBE/wulr PLI028_Costerfield Operations_NI-43 101 Technical Report_2018_Rev1 6 February 2019
The Costerfield Formation (as defined by Talent, 1965) is a series of thickly bedded mudstones and
siltstones featuring heavy bioturbation. The ‘Formation’ nomenclature (that assigned by Talent, 1965)
is chosen to be used within this report instead of the later re-assigned name of ‘Costerfield Siltstone’
(as re-defined by Vandenberg, 1988). It is recommended that the ‘Siltstone’ nomenclature be
abandoned as it has become a misleading term inferring the unit is composed of siltstone dominant
lithologies. Rather, the unit consists of a dominantly mudstone lithologies, with siltstones and
sandstone representing the lesser constituents as relatively thin interbedded occurrences.
The Costerfield Formation is dominated by weakly bedded mudstones and silty mudstones with some
lesser siltstone and sandstone constituents. The Formation is informally divided into lower and upper
portions on the basis of a significant lithological change midway through the succession. Estimations
of the true stratigraphic thickness of the Costerfield Formation are made difficult due to significant
faulting in the area; however, it is estimated to be in the range of 450–550 m, with the lower and upper
portions of the Costerfield Formation being around 200 m and 300 m thick respectively. Informal
lithostratigraphic units defined from the Lower Costerfield formation are named the Siliciclastic unit
and Quartzite beds. Lithostratigraphic units defined from the Upper Costerfield formation are named
the Lower siltstone unit, Augusta beds and the Upper siltstone unit (Figure 7-4).
Figure 7-4: Stratigraphic column of the Costerfield Formation illustrating the relative positions of newly defined (informal) stratigraphic units
Source: Thomas Fromhold, Mandalay, 2014.
SRK Consulting Page 42
KENT/WALS/FAIR/EBBE/wulr PLI028_Costerfield Operations_NI-43 101 Technical Report_2018_Rev1 6 February 2019
Resource-definition diamond-drilling for the Augusta and Cuffley deposits has resulted in an enormous
collection of geological data from the South Costerfield area. From this, construction of highly refined
cross section interpretations has been possible. These cross sections have revealed that the Augusta
and Cuffley deposits are bounded between two large, low angle west-dipping parallel thrust faults
named the Adder Fault (upper) and the King Cobra Fault (lower). They are typically in the range of
250 m apart in the South Costerfield area where they are recognised.
The area between these two large faults is also heavily faulted resulting in a defined zone of intense
brittle deformation. Three significant second order faults occur within the fault zone. These faults
(named the Flat, Red Belly and Tiger faults) are interpreted as having listric geometry, most likely
mimicking the larger structure of the Adder and King Cobra faults.
These faults are all observed as extremely brittle structures, with larger faults (namely the Adder and
King Cobra faults) occurring as a 1–2 m zone of fault pug, with several metres of extremely heavily
fractured and sheered rock in the footwalls and hanging walls. This zone of intense brittle deformation
and shortening is bounded by the larger Adder and King Cobra faults and regarded to represent a
regional-scale thrust fault or thrust zone. It has been informally named the Costerfield Thrust.
Mandalay interprets the Costerfield Thrust to be the southern extent of the historically recognised
‘Costerfield Fault’. Stratigraphic interpretations suggest that overall shortening (stratigraphic
displacement) across the Costerfield Thrust is in the order of around 1 km.
An additional series of brittle faults are observed within this thrust system striking in a north–northeast
direction (i.e. the East Fault). These faults have a subvertical dip and are generally observed as
1–2 m thick zones of unconsolidated breccia with minor pug on the fault plane itself. The lateral extent
of these faults is uncertain; however, they appear to be localised structures as correlation through the
entire suite of drilling data is highly difficult. Offset across these steep dipping faults appears mostly
strike-slip and overall vertical offset tentatively estimated to be on the scale of less than 50 m. Lateral
offset is at present unknown.
Ductile deformation of the Costerfield Formation occurs as a broad anticlinal structure with a
wavelength in an estimated range of 1.5–2 km. Smaller parasitic folds are observed to have a northerly
striking fold axis that dips slightly to the east. These parasitic folds are assumed to mimic the larger
scale folding of the area. Ductile to semi-ductile veining/ faulting is evident within the Costerfield
Formation and occur as 20–100 mm laminated quartz veins. They are typically bedding parallel,
although laminated veins cross-cutting stratigraphy are not uncommon. Displacement across these
faults/ veins in uncertain as their bedding-parallel characteristics mean estimations of displacement
through stratigraphic observations are not possible. Veins that cross-cut bedding, do appear to record
displacement in the range of tens to potentially hundreds of metres.
Recent resource definition diamond drilling of the Brunswick deposit has resulted in an increase of
geological data, particularly at depth below the previously mined Brunswick shear.
The Brunswick deposit is located northwest of the current Cuffley workings, proximal to the Brunswick
plant. Drilling completed in 2008 confirmed the deposit is comprised of a single main thrust structure
that occurs as a strongly sheared, well mineralised pug zone as well as a stibnite quartz vein.
Since late 2015, the conceptual model of the Brunswick lode evolved from a relatively linear, single
plane into a series of panels, progressively separated by low-angle thrust faults. These flat faults have
the effect of transposing the lode panel below a number of metres westward. Flat faults bisect lode
structures in many other places throughout the field, including Alison-Cuffley, Costerfield (the Kendall
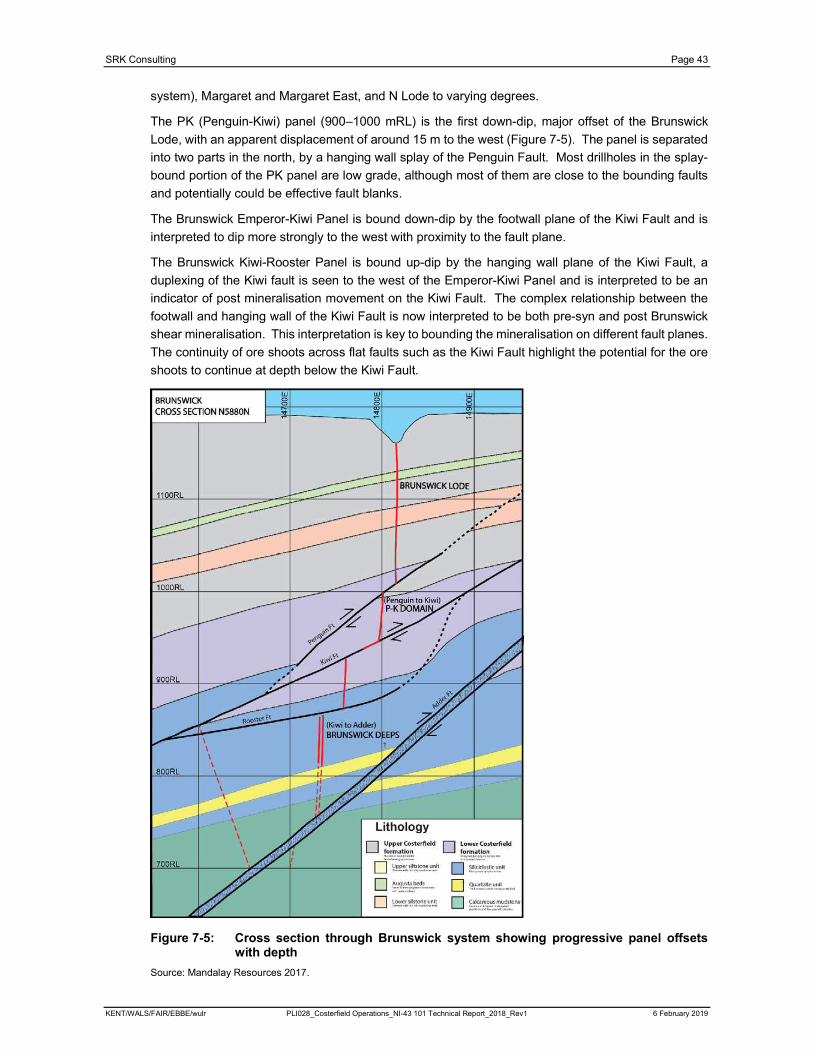
SRK Consulting Page 43
KENT/WALS/FAIR/EBBE/wulr PLI028_Costerfield Operations_NI-43 101 Technical Report_2018_Rev1 6 February 2019
system), Margaret and Margaret East, and N Lode to varying degrees.
The PK (Penguin-Kiwi) panel (900–1000 mRL) is the first down-dip, major offset of the Brunswick
Lode, with an apparent displacement of around 15 m to the west (Figure 7-5). The panel is separated
into two parts in the north, by a hanging wall splay of the Penguin Fault. Most drillholes in the splay-
bound portion of the PK panel are low grade, although most of them are close to the bounding faults
and potentially could be effective fault blanks.
The Brunswick Emperor-Kiwi Panel is bound down-dip by the footwall plane of the Kiwi Fault and is
interpreted to dip more strongly to the west with proximity to the fault plane.
The Brunswick Kiwi-Rooster Panel is bound up-dip by the hanging wall plane of the Kiwi Fault, a
duplexing of the Kiwi fault is seen to the west of the Emperor-Kiwi Panel and is interpreted to be an
indicator of post mineralisation movement on the Kiwi Fault. The complex relationship between the
footwall and hanging wall of the Kiwi Fault is now interpreted to be both pre-syn and post Brunswick
shear mineralisation. This interpretation is key to bounding the mineralisation on different fault planes.
The continuity of ore shoots across flat faults such as the Kiwi Fault highlight the potential for the ore
shoots to continue at depth below the Kiwi Fault.
Figure 7-5: Cross section through Brunswick system showing progressive panel offsets with depth
Source: Mandalay Resources 2017.
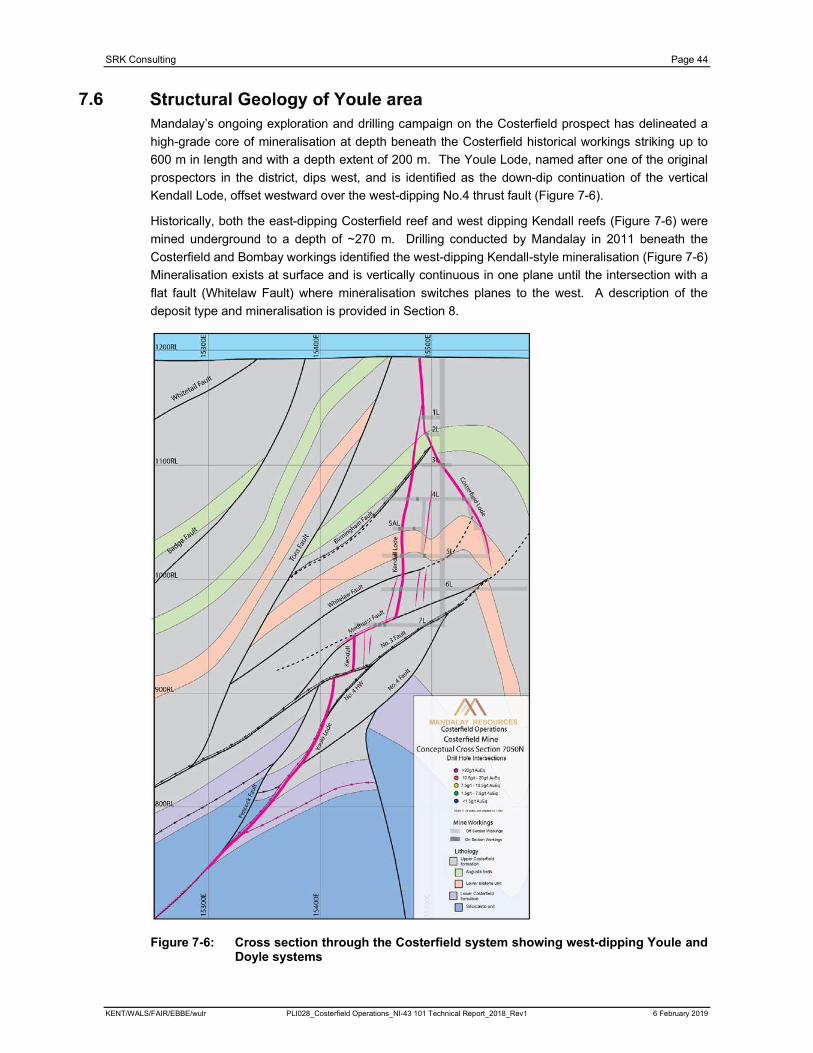
SRK Consulting Page 44
KENT/WALS/FAIR/EBBE/wulr PLI028_Costerfield Operations_NI-43 101 Technical Report_2018_Rev1 6 February 2019
Mandalay’s ongoing exploration and drilling campaign on the Costerfield prospect has delineated a
high-grade core of mineralisation at depth beneath the Costerfield historical workings striking up to
600 m in length and with a depth extent of 200 m. The Youle Lode, named after one of the original
prospectors in the district, dips west, and is identified as the down-dip continuation of the vertical
Kendall Lode, offset westward over the west-dipping No.4 thrust fault (Figure 7-6).
Historically, both the east-dipping Costerfield reef and west dipping Kendall reefs (Figure 7-6) were
mined underground to a depth of ~270 m. Drilling conducted by Mandalay in 2011 beneath the
Costerfield and Bombay workings identified the west-dipping Kendall-style mineralisation (Figure 7-6)
Mineralisation exists at surface and is vertically continuous in one plane until the intersection with a
flat fault (Whitelaw Fault) where mineralisation switches planes to the west. A description of the
deposit type and mineralisation is provided in Section 8.
Figure 7-6: Cross section through the Costerfield system showing west-dipping Youle and Doyle systems
SRK Consulting Page 45
KENT/WALS/FAIR/EBBE/wulr PLI028_Costerfield Operations_NI-43 101 Technical Report_2018_Rev1 6 February 2019
The Costerfield field is part of a broad gold-antimony province mainly confined to the Siluro-Devonian
Melbourne Zone. Although antimony often occurs in an epithermal setting (in association with silver,
bismuth, tellurium, molybdenum and other minerals), the quartz-stibnite-gold narrow veins of the
Melbourne Zone are mesothermal-orogenic and are part of a 380–370 Ma tectonic event. Gold in
Central Victoria is believed to have been derived from the underlying Cambrian greenstones.
The origin of the antimony is less certain.
The mineralisation occurs as narrow veins or lodes, typically 500 mm wide, hosted within low-grade
(anchizone) mudstone and siltstone of the Lower Silurian Costerfield Formation. Gold mineralisation
of >20 g/t with an average grade of ~9 g/t is typically hosted within and/ or alongside veined stibnite
with ~4% antimony (Fromhold et al., 2016). Mineralised shoots in the Costerfield Property are
structurally controlled by the intersection of the lodes with major cross-cutting, puggy, sheared fault
structures. Exploration is guided by predictions of where these fault/ lode intersections might be, using
data from structural/ geological mapping, diamond drill logging and three-dimensional (3D) computer
modelling in Surpac software.
Large, flat, west- and northwest-dipping reverse faults have displaced the lodes in the Costerfield mine
at the northern end of the mineralisation extent. It has been recognised that such faults occur
throughout the field. Production at the Alison mine stopped in 1922 because the lodes were ‘lost’ on
a flat, west-dipping fault, since named the Adder Fault. Drilling in 2011 successfully intersected a
displaced lode below the fault, now known as the Cuffley Main Lode. Since the discovery of the Cuffley
Lode, exploration has continued with success at depth and along strike and the persistent low-angle,
west-dipping faults that continue to influence gold-antimony mineralisation.
The economic mineralisation in the property occurs at the southern end of a system of steeply-dipping
quartz-stibnite lodes, with thicknesses ranging from millimetres to 1 m, and extending over a strike of
at least 4 km. Individual lodes can persist for up to 800 m strike and 300 m down-dip. The lode system
is centred in the core of the doubly-plunging Costerfield Anticline and is hosted by Costerfield
Siltstones.
Vein fill mineralogical contents and proportions are found to differ from vein to vein throughout the
Augusta, Cuffley and Brunswick lodes. However, the texture and chronological order of each vein
mineral generation remains remarkably consistent across all lodes. A diagrammatic illustration of this
chronological order of vein history (i.e. paragenesis) of the August and Cuffley deposits is illustrated
in Figure 8-1. The overall paragenetic sequence is ordered as follows: laminated quartz, fibrous
carbonate (siderite and ankerite), crystalline quartz (rhombic quartz), stibnite, opaline quartz and milky
quartz. Acicular stibnite and botryoidal calcite are not generally associated with the main quartz-
stibnite vein structures and are therefore regarded as a post-mineralisation mineralogical occurrence
most likely associated with meteoric events.
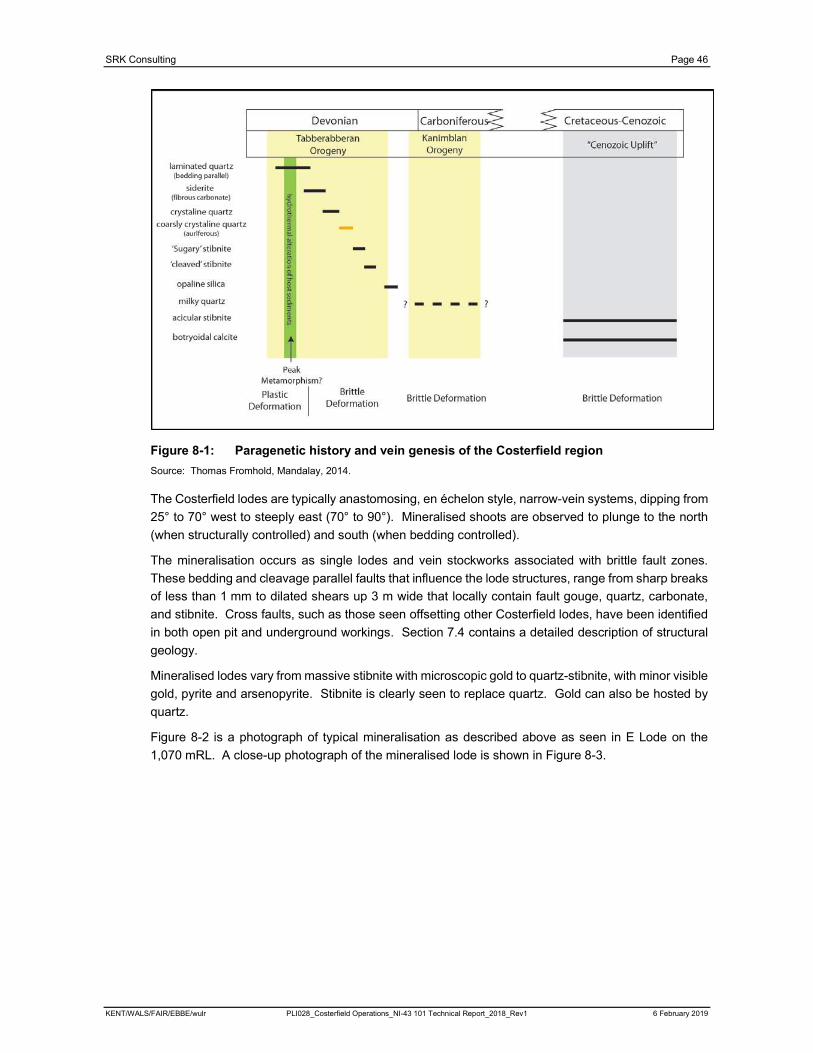
SRK Consulting Page 46
KENT/WALS/FAIR/EBBE/wulr PLI028_Costerfield Operations_NI-43 101 Technical Report_2018_Rev1 6 February 2019
Figure 8-1: Paragenetic history and vein genesis of the Costerfield region
Source: Thomas Fromhold, Mandalay, 2014.
The Costerfield lodes are typically anastomosing, en échelon style, narrow-vein systems, dipping from
25° to 70° west to steeply east (70° to 90°). Mineralised shoots are observed to plunge to the north
(when structurally controlled) and south (when bedding controlled).
The mineralisation occurs as single lodes and vein stockworks associated with brittle fault zones.
These bedding and cleavage parallel faults that influence the lode structures, range from sharp breaks
of less than 1 mm to dilated shears up 3 m wide that locally contain fault gouge, quartz, carbonate,
and stibnite. Cross faults, such as those seen offsetting other Costerfield lodes, have been identified
in both open pit and underground workings. Section 7.4 contains a detailed description of structural
geology.
Mineralised lodes vary from massive stibnite with microscopic gold to quartz-stibnite, with minor visible
gold, pyrite and arsenopyrite. Stibnite is clearly seen to replace quartz. Gold can also be hosted by
quartz.
Figure 8-2 is a photograph of typical mineralisation as described above as seen in E Lode on the
1,070 mRL. A close-up photograph of the mineralised lode is shown in Figure 8-3.
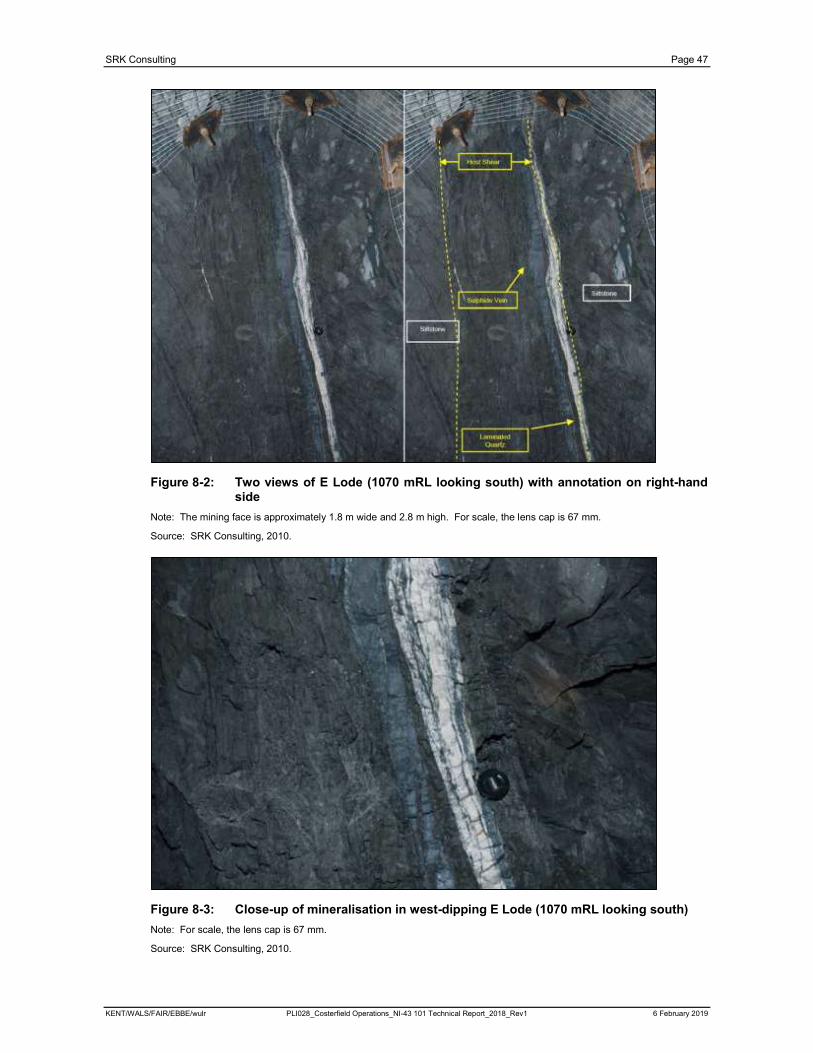
SRK Consulting Page 47
KENT/WALS/FAIR/EBBE/wulr PLI028_Costerfield Operations_NI-43 101 Technical Report_2018_Rev1 6 February 2019
Figure 8-2: Two views of E Lode (1070 mRL looking south) with annotation on right-hand side
Note: The mining face is approximately 1.8 m wide and 2.8 m high. For scale, the lens cap is 67 mm.
Source: SRK Consulting, 2010.
Figure 8-3: Close-up of mineralisation in west-dipping E Lode (1070 mRL looking south)
Note: For scale, the lens cap is 67 mm.
Source: SRK Consulting, 2010.
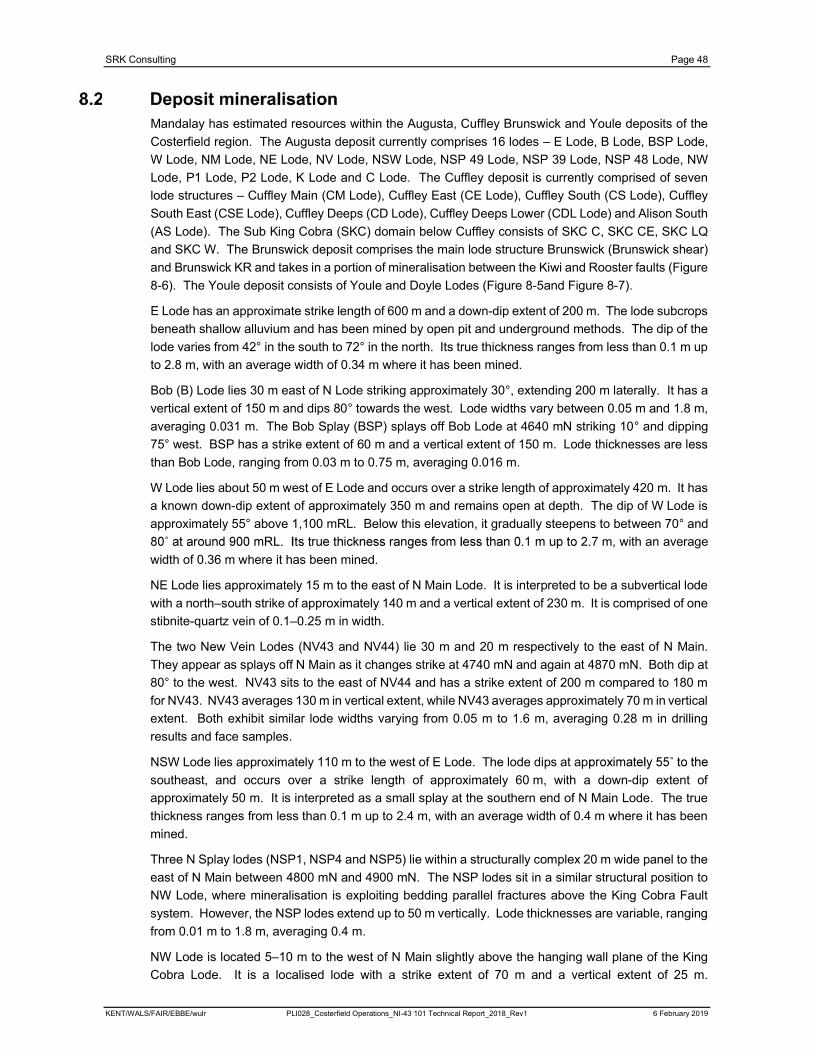
SRK Consulting Page 48
KENT/WALS/FAIR/EBBE/wulr PLI028_Costerfield Operations_NI-43 101 Technical Report_2018_Rev1 6 February 2019
Mandalay has estimated resources within the Augusta, Cuffley Brunswick and Youle deposits of the
Costerfield region. The Augusta deposit currently comprises 16 lodes – E Lode, B Lode, BSP Lode,
W Lode, NM Lode, NE Lode, NV Lode, NSW Lode, NSP 49 Lode, NSP 39 Lode, NSP 48 Lode, NW
Lode, P1 Lode, P2 Lode, K Lode and C Lode. The Cuffley deposit is currently comprised of seven
lode structures – Cuffley Main (CM Lode), Cuffley East (CE Lode), Cuffley South (CS Lode), Cuffley
South East (CSE Lode), Cuffley Deeps (CD Lode), Cuffley Deeps Lower (CDL Lode) and Alison South
(AS Lode). The Sub King Cobra (SKC) domain below Cuffley consists of SKC C, SKC CE, SKC LQ
and SKC W. The Brunswick deposit comprises the main lode structure Brunswick (Brunswick shear)
and Brunswick KR and takes in a portion of mineralisation between the Kiwi and Rooster faults (Figure
8-6). The Youle deposit consists of Youle and Doyle Lodes (Figure 8-5and Figure 8-7).
E Lode has an approximate strike length of 600 m and a down-dip extent of 200 m. The lode subcrops
beneath shallow alluvium and has been mined by open pit and underground methods. The dip of the
lode varies from 42° in the south to 72° in the north. Its true thickness ranges from less than 0.1 m up
to 2.8 m, with an average width of 0.34 m where it has been mined.
Bob (B) Lode lies 30 m east of N Lode striking approximately 30°, extending 200 m laterally. It has a
vertical extent of 150 m and dips 80° towards the west. Lode widths vary between 0.05 m and 1.8 m,
averaging 0.031 m. The Bob Splay (BSP) splays off Bob Lode at 4640 mN striking 10° and dipping
75° west. BSP has a strike extent of 60 m and a vertical extent of 150 m. Lode thicknesses are less
than Bob Lode, ranging from 0.03 m to 0.75 m, averaging 0.016 m.
W Lode lies about 50 m west of E Lode and occurs over a strike length of approximately 420 m. It has
a known down-dip extent of approximately 350 m and remains open at depth. The dip of W Lode is
approximately 55° above 1,100 mRL. Below this elevation, it gradually steepens to between 70° and
m, with an average
width of 0.36 m where it has been mined.
NE Lode lies approximately 15 m to the east of N Main Lode. It is interpreted to be a subvertical lode
with a north–south strike of approximately 140 m and a vertical extent of 230 m. It is comprised of one
stibnite-quartz vein of 0.1–0.25 m in width.
The two New Vein Lodes (NV43 and NV44) lie 30 m and 20 m respectively to the east of N Main.
They appear as splays off N Main as it changes strike at 4740 mN and again at 4870 mN. Both dip at
80° to the west. NV43 sits to the east of NV44 and has a strike extent of 200 m compared to 180 m
for NV43. NV43 averages 130 m in vertical extent, while NV43 averages approximately 70 m in vertical
extent. Both exhibit similar lode widths varying from 0.05 m to 1.6 m, averaging 0.28 m in drilling
results and face samples.
NSW Lode lies approximately 110 m to the west of E Lode. The lode dips at ap
southeast, and occurs over a strike length of approximately 60 m, with a down-dip extent of
approximately 50 m. It is interpreted as a small splay at the southern end of N Main Lode. The true
thickness ranges from less than 0.1 m up to 2.4 m, with an average width of 0.4 m where it has been
mined.
Three N Splay lodes (NSP1, NSP4 and NSP5) lie within a structurally complex 20 m wide panel to the
east of N Main between 4800 mN and 4900 mN. The NSP lodes sit in a similar structural position to
NW Lode, where mineralisation is exploiting bedding parallel fractures above the King Cobra Fault
system. However, the NSP lodes extend up to 50 m vertically. Lode thicknesses are variable, ranging
from 0.01 m to 1.8 m, averaging 0.4 m.
NW Lode is located 5–10 m to the west of N Main slightly above the hanging wall plane of the King
Cobra Lode. It is a localised lode with a strike extent of 70 m and a vertical extent of 25 m.
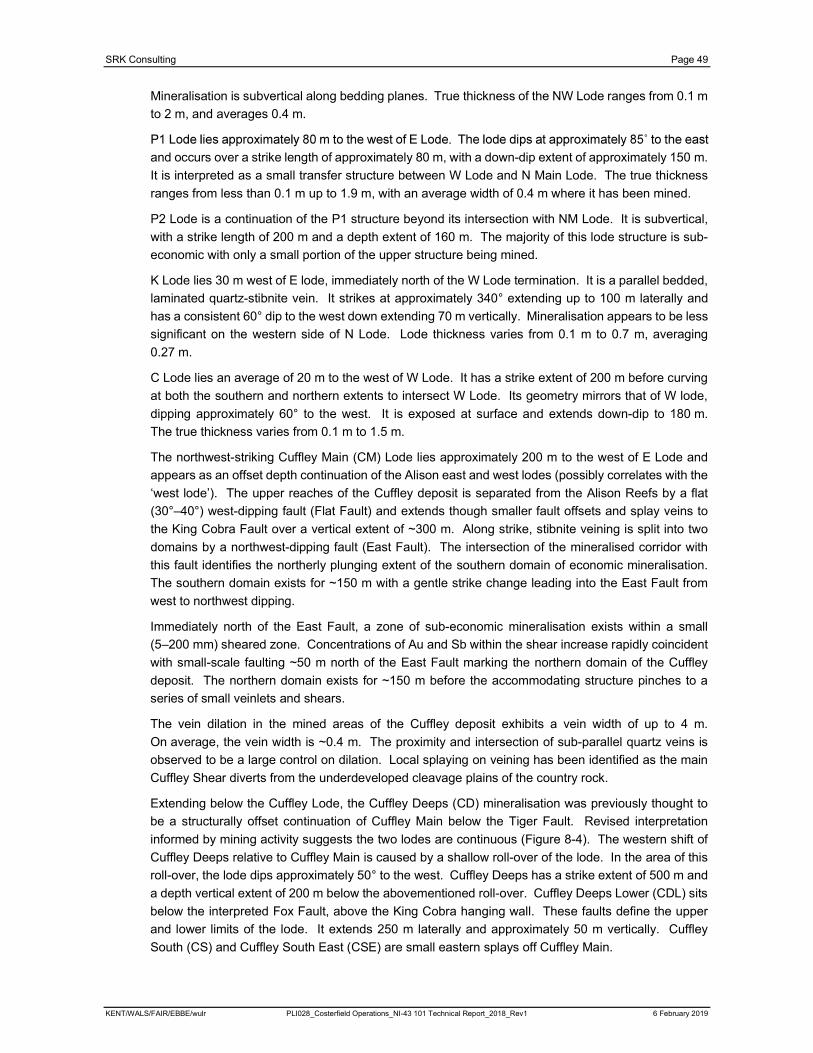
SRK Consulting Page 49
KENT/WALS/FAIR/EBBE/wulr PLI028_Costerfield Operations_NI-43 101 Technical Report_2018_Rev1 6 February 2019
Mineralisation is subvertical along bedding planes. True thickness of the NW Lode ranges from 0.1 m
to 2 m, and averages 0.4 m.
and occurs over a strike length of approximately 80 m, with a down-dip extent of approximately 150 m.
It is interpreted as a small transfer structure between W Lode and N Main Lode. The true thickness
ranges from less than 0.1 m up to 1.9 m, with an average width of 0.4 m where it has been mined.
P2 Lode is a continuation of the P1 structure beyond its intersection with NM Lode. It is subvertical,
with a strike length of 200 m and a depth extent of 160 m. The majority of this lode structure is sub-
economic with only a small portion of the upper structure being mined.
K Lode lies 30 m west of E lode, immediately north of the W Lode termination. It is a parallel bedded,
laminated quartz-stibnite vein. It strikes at approximately 340° extending up to 100 m laterally and
has a consistent 60° dip to the west down extending 70 m vertically. Mineralisation appears to be less
significant on the western side of N Lode. Lode thickness varies from 0.1 m to 0.7 m, averaging
0.27 m.
C Lode lies an average of 20 m to the west of W Lode. It has a strike extent of 200 m before curving
at both the southern and northern extents to intersect W Lode. Its geometry mirrors that of W lode,
dipping approximately 60° to the west. It is exposed at surface and extends down-dip to 180 m.
The true thickness varies from 0.1 m to 1.5 m.
The northwest-striking Cuffley Main (CM) Lode lies approximately 200 m to the west of E Lode and
appears as an offset depth continuation of the Alison east and west lodes (possibly correlates with the
‘west lode’). The upper reaches of the Cuffley deposit is separated from the Alison Reefs by a flat
(30°–40°) west-dipping fault (Flat Fault) and extends though smaller fault offsets and splay veins to
the King Cobra Fault over a vertical extent of ~300 m. Along strike, stibnite veining is split into two
domains by a northwest-dipping fault (East Fault). The intersection of the mineralised corridor with
this fault identifies the northerly plunging extent of the southern domain of economic mineralisation.
The southern domain exists for ~150 m with a gentle strike change leading into the East Fault from
west to northwest dipping.
Immediately north of the East Fault, a zone of sub-economic mineralisation exists within a small
(5–200 mm) sheared zone. Concentrations of Au and Sb within the shear increase rapidly coincident
with small-scale faulting ~50 m north of the East Fault marking the northern domain of the Cuffley
deposit. The northern domain exists for ~150 m before the accommodating structure pinches to a
series of small veinlets and shears.
The vein dilation in the mined areas of the Cuffley deposit exhibits a vein width of up to 4 m.
On average, the vein width is ~0.4 m. The proximity and intersection of sub-parallel quartz veins is
observed to be a large control on dilation. Local splaying on veining has been identified as the main
Cuffley Shear diverts from the underdeveloped cleavage plains of the country rock.
Extending below the Cuffley Lode, the Cuffley Deeps (CD) mineralisation was previously thought to
be a structurally offset continuation of Cuffley Main below the Tiger Fault. Revised interpretation
informed by mining activity suggests the two lodes are continuous (Figure 8-4). The western shift of
Cuffley Deeps relative to Cuffley Main is caused by a shallow roll-over of the lode. In the area of this
roll-over, the lode dips approximately 50° to the west. Cuffley Deeps has a strike extent of 500 m and
a depth vertical extent of 200 m below the abovementioned roll-over. Cuffley Deeps Lower (CDL) sits
below the interpreted Fox Fault, above the King Cobra hanging wall. These faults define the upper
and lower limits of the lode. It extends 250 m laterally and approximately 50 m vertically. Cuffley
South (CS) and Cuffley South East (CSE) are small eastern splays off Cuffley Main.
SRK Consulting Page 50
KENT/WALS/FAIR/EBBE/wulr PLI028_Costerfield Operations_NI-43 101 Technical Report_2018_Rev1 6 February 2019
Figure 8-4: Cuffley deposit looking north – 895L C2 North lode
Note: For scale, the end of rock bolt is 300 mm × 300 mm.
Extending below the Cuffley Deeps mineralisation, four zones of mineralisation in the Sub King Cobra
Lode have been identified – the Central Main (SKC C), Central East (SKC CE), Central LQ (SKC LQ)
and Western targets (SKC W). These targets sit to the west of and below the Cuffley Deeps
mineralisation. The known Central Target high grade portion extends vertically 100 m and 300 m along
strike and is situated on the eastern limb of a large anticline. The mineralisation is also breached by
the King Cobra thrust system. The Western target sits below and to the west of the Central target and
is likely to be an offset depth extension of the Central target.
The Brunswick deposit comprises the main lode structure Brunswick (Brunswick Shear) and the
Brunswick KR panel which takes in a portion of mineralisation between the Kiwi and Rooster faults
(Figure 8-6). The Brunswick Lode lies approximately 600 m northwest of the northern most point of
the Cuffley Lode (Figure 8-5). The lode is subvertical and occurs over a strike length of approximately
450 m, with a down-dip extent of approximately 200 m, and an average true thickness of 1.28 m.
Mineralisation is broken into three zones of mineralisation below the Brunswick Lode – PK domain,
KR domain and Brunswick Deeps. The PK domain is capped by the shallow west-dipping Penguin
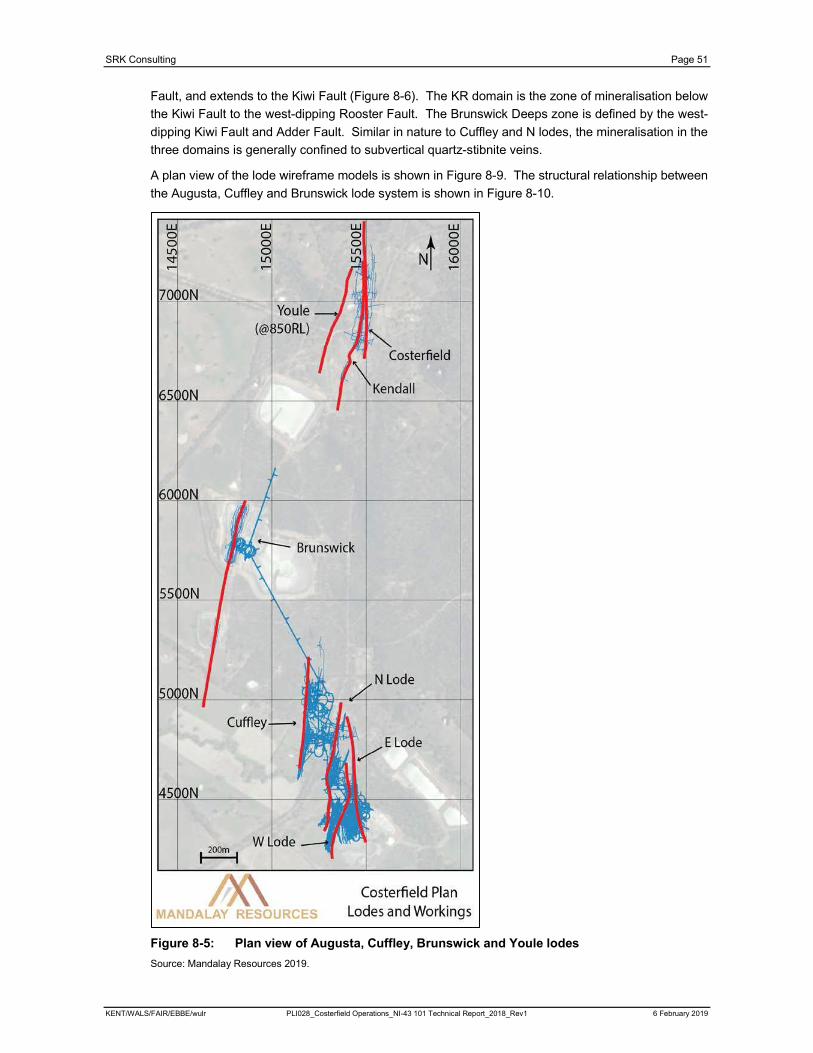
SRK Consulting Page 51
KENT/WALS/FAIR/EBBE/wulr PLI028_Costerfield Operations_NI-43 101 Technical Report_2018_Rev1 6 February 2019
Fault, and extends to the Kiwi Fault (Figure 8-6). The KR domain is the zone of mineralisation below
the Kiwi Fault to the west-dipping Rooster Fault. The Brunswick Deeps zone is defined by the west-
dipping Kiwi Fault and Adder Fault. Similar in nature to Cuffley and N lodes, the mineralisation in the
three domains is generally confined to subvertical quartz-stibnite veins.
A plan view of the lode wireframe models is shown in Figure 8-9. The structural relationship between
the Augusta, Cuffley and Brunswick lode system is shown in Figure 8-10.
Figure 8-5: Plan view of Augusta, Cuffley, Brunswick and Youle lodes
Source: Mandalay Resources 2019.
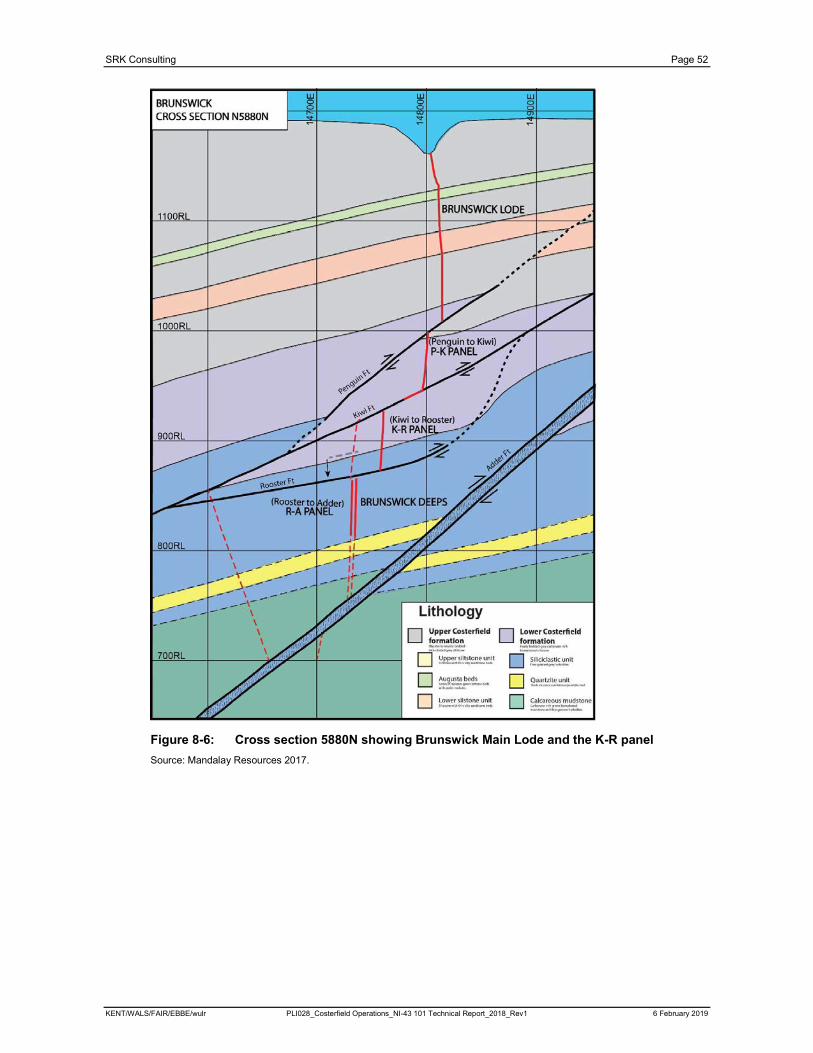
SRK Consulting Page 52
KENT/WALS/FAIR/EBBE/wulr PLI028_Costerfield Operations_NI-43 101 Technical Report_2018_Rev1 6 February 2019
Figure 8-6: Cross section 5880N showing Brunswick Main Lode and the K-R panel
Source: Mandalay Resources 2017.
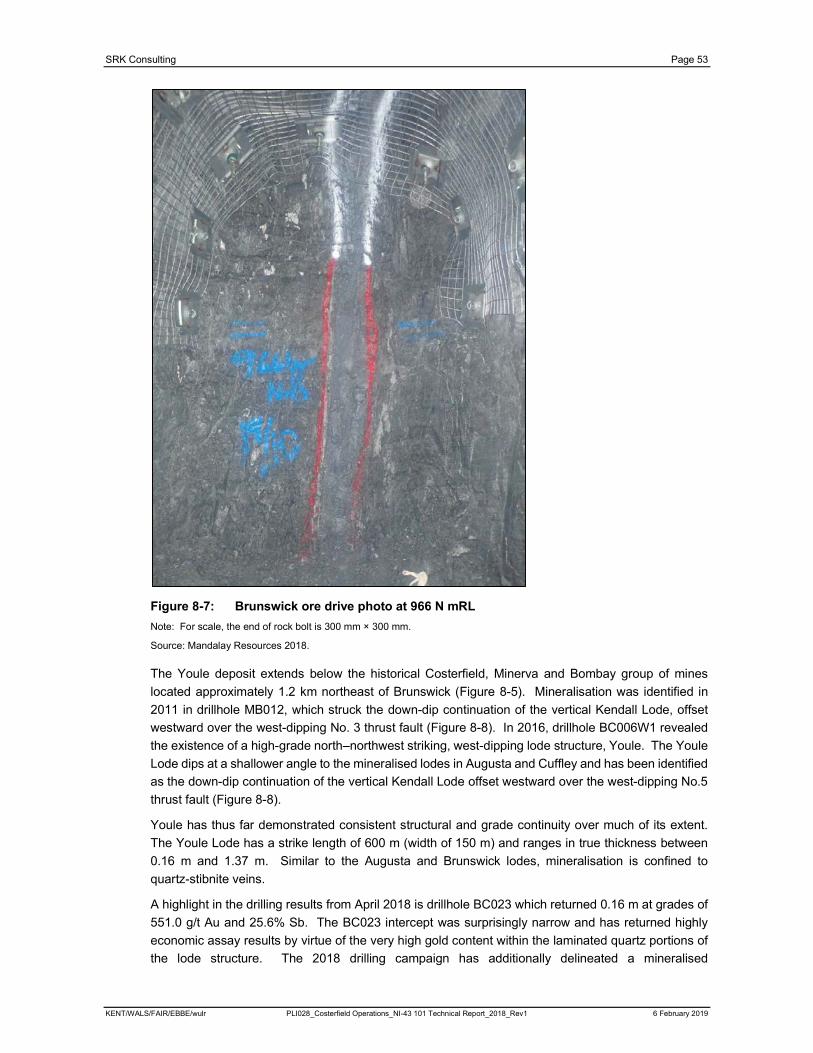
SRK Consulting Page 53
KENT/WALS/FAIR/EBBE/wulr PLI028_Costerfield Operations_NI-43 101 Technical Report_2018_Rev1 6 February 2019
Figure 8-7: Brunswick ore drive photo at 966 N mRL
Note: For scale, the end of rock bolt is 300 mm × 300 mm.
Source: Mandalay Resources 2018.
The Youle deposit extends below the historical Costerfield, Minerva and Bombay group of mines
located approximately 1.2 km northeast of Brunswick (Figure 8-5). Mineralisation was identified in
2011 in drillhole MB012, which struck the down-dip continuation of the vertical Kendall Lode, offset
westward over the west-dipping No. 3 thrust fault (Figure 8-8). In 2016, drillhole BC006W1 revealed
the existence of a high-grade north–northwest striking, west-dipping lode structure, Youle. The Youle
Lode dips at a shallower angle to the mineralised lodes in Augusta and Cuffley and has been identified
as the down-dip continuation of the vertical Kendall Lode offset westward over the west-dipping No.5
thrust fault (Figure 8-8).
Youle has thus far demonstrated consistent structural and grade continuity over much of its extent.
The Youle Lode has a strike length of 600 m (width of 150 m) and ranges in true thickness between
0.16 m and 1.37 m. Similar to the Augusta and Brunswick lodes, mineralisation is confined to
quartz-stibnite veins.
A highlight in the drilling results from April 2018 is drillhole BC023 which returned 0.16 m at grades of
551.0 g/t Au and 25.6% Sb. The BC023 intercept was surprisingly narrow and has returned highly
economic assay results by virtue of the very high gold content within the laminated quartz portions of
the lode structure. The 2018 drilling campaign has additionally delineated a mineralised
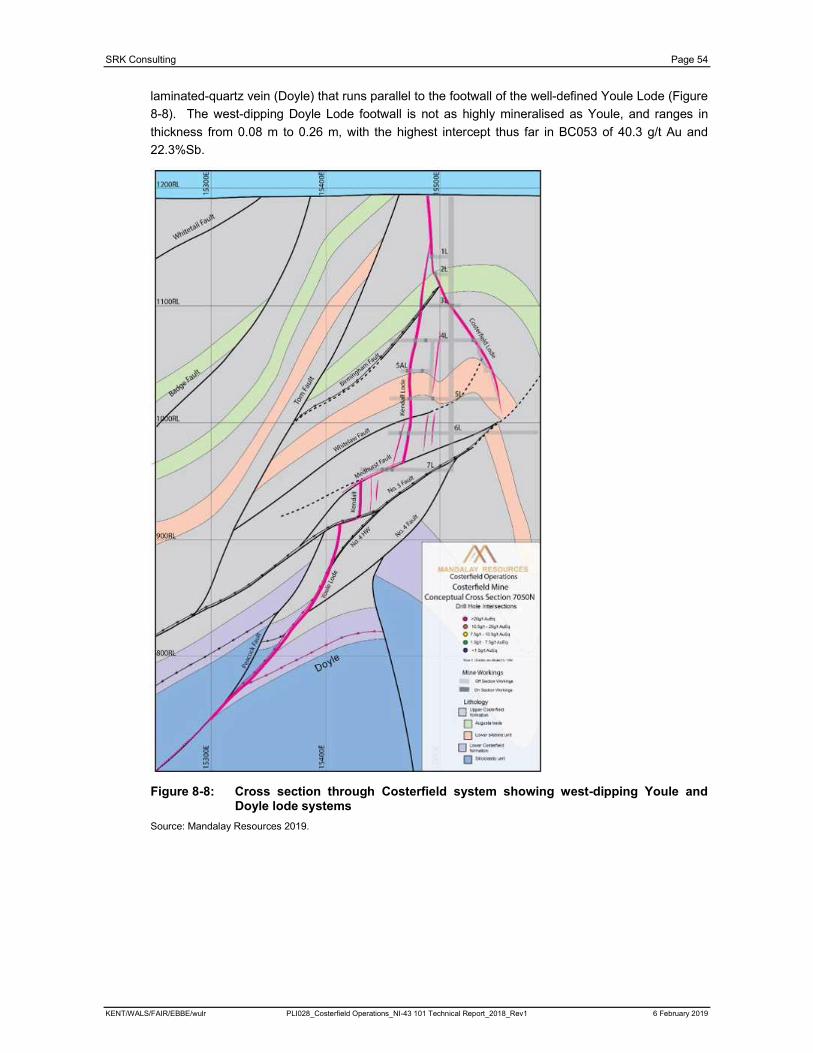
SRK Consulting Page 54
KENT/WALS/FAIR/EBBE/wulr PLI028_Costerfield Operations_NI-43 101 Technical Report_2018_Rev1 6 February 2019
laminated-quartz vein (Doyle) that runs parallel to the footwall of the well-defined Youle Lode (Figure
8-8). The west-dipping Doyle Lode footwall is not as highly mineralised as Youle, and ranges in
thickness from 0.08 m to 0.26 m, with the highest intercept thus far in BC053 of 40.3 g/t Au and
22.3%Sb.
Figure 8-8: Cross section through Costerfield system showing west-dipping Youle and Doyle lode systems
Source: Mandalay Resources 2019.
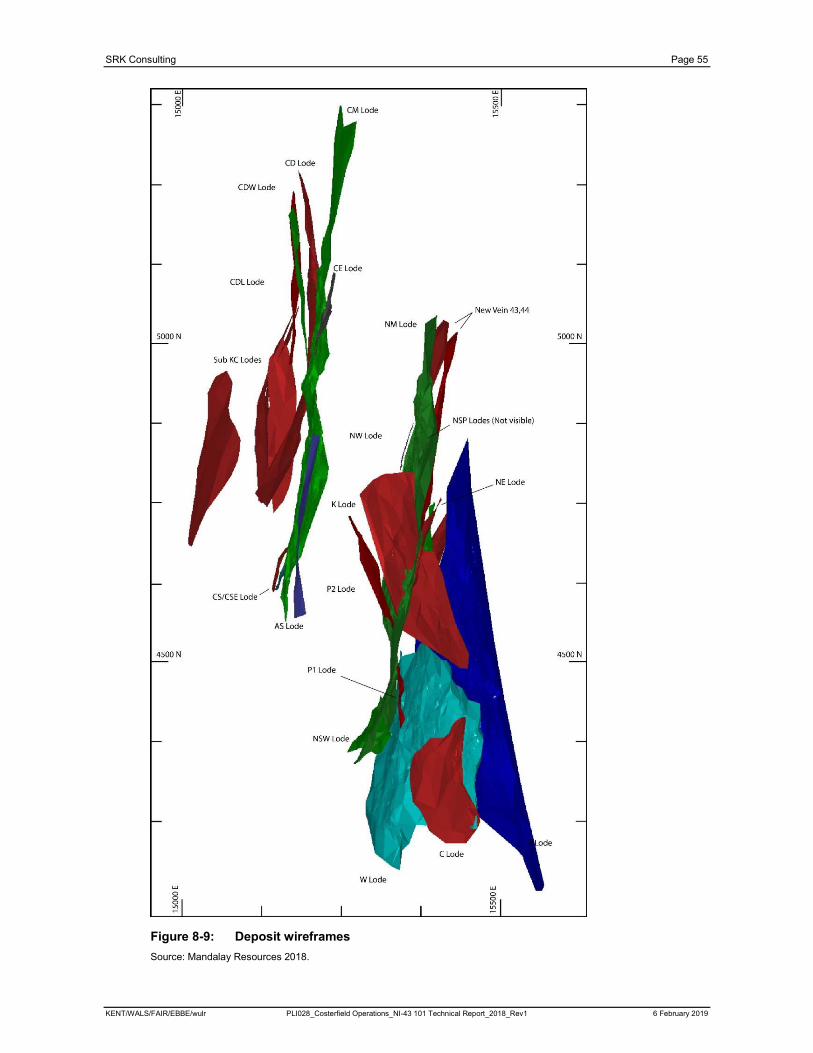
SRK Consulting Page 55
KENT/WALS/FAIR/EBBE/wulr PLI028_Costerfield Operations_NI-43 101 Technical Report_2018_Rev1 6 February 2019
Figure 8-9: Deposit wireframes
Source: Mandalay Resources 2018.
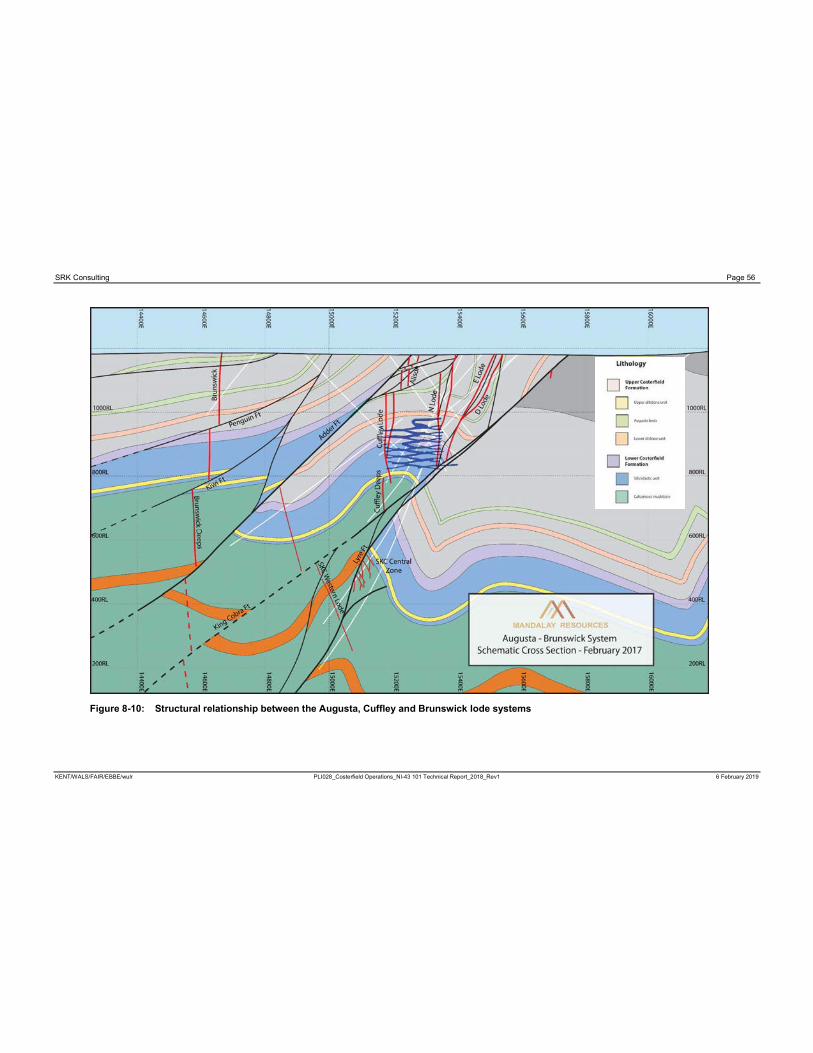
SRK Consulting Page 56
KENT/WALS/FAIR/EBBE/wulr PLI028_Costerfield Operations_NI-43 101 Technical Report_2018_Rev1 6 February 2019
Figure 8-10: Structural relationship between the Augusta, Cuffley and Brunswick lode systems
SRK Consulting Page 57
KENT/WALS/FAIR/EBBE/wulr PLI028_Costerfield Operations_NI-43 101 Technical Report_2018_Rev1 6 February 2019
Exploration work that led to the discovery of the Augusta, Cuffley, Brunswick and Costerfield (Youle)
deposits has consisted of predominantly diamond drill testing of interpreted geological targets, along
with geological mapping, geophysics and geochemistry and trenching. Geochemical methods have
proven to be applicable in detecting gold-antimony mineralisation. Section 10 provides details of
diamond drilling by Mandalay Resources from 2009 to present.
Previous owners have undertaken trenching, but records of these exploration activities are limited.
In 2006, AGD submitted a suite of 22 rock and mineralised samples from all known deposits around
Costerfield for testing by Systems Exploration (NSW) Pty Ltd. The aim was to determine their
petrophysical properties and to identify the most effective geophysical methods that could be used in
the field to detect similar mineralisation.
Of the samples submitted, 13 were mineralised and were sourced from Augusta, Margaret, Antimony
Creek, Costerfield, Bombay, Alison and Brunswick; two were weathered mineralisation and were
sourced from Augusta; seven were waste.
The following petrophysical measurements were made:
Mass properties:
Dry bulk density
Apparent porosity
Grain density
Wet bulk density.
Inductive properties:
Magnetic susceptibility
Diamagnetic susceptibility
Electromagnetic conductivity.
Galvanic properties:
Galvanic resistivity
Chargeability.
Although there are measurable differences in the physical properties of mineralised and non-
mineralised material at Costerfield, the differences are marginal at best, and it is unlikely that the
differences present would result in clear geophysical signatures. The only field techniques
recommended for trialling were ground-based magnetic, gravity and induced polarisation (IP) profiling.
Based on the results of the petrophysical testing program, a limited program of ground magnetic,
gravity and IP profiling, with optimal measurement parameters, was carried out across the Augusta
deposit. None of the techniques were found to be effective at detecting the known mineralisation at
Augusta.
SRK Consulting Page 58
KENT/WALS/FAIR/EBBE/wulr PLI028_Costerfield Operations_NI-43 101 Technical Report_2018_Rev1 6 February 2019
A low-level detailed airborne magnetic and radiometric survey was undertaken in 2008 by AGD over
the AGD tenements, including both Augusta and Cuffley. The airborne survey was conducted on
east–west lines spaced 50 m apart, with a terrain clearance of approximately 50 m. Survey details
are included in a logistics report prepared by UTS (UTS, 2008).
Magnetic data was recorded at 0.1 second intervals and radiometric data was recorded at 1 second
intervals. Additional processing was undertaken by Greenfields Geophysics. Interpretation of the
radiometric and magnetic data resulted in regional lineament trends across the tenements, which
assist in interpreting the local buried structures.
Based on historical geochemical surveys over the Augusta deposit as described by Stock and Zaki in
1972, and informal recommendations by Dr G McArthur of McArthur Ore Deposit Assessments Pty
Ltd (MODA), AGD geologists decided by to trial mobile metal ion (MMI) analytical techniques on
samples collected on traverses across the Augusta lodes in 2005.
Utilising two geophysical traverse lines across the Augusta deposit, 5 m spaced samples were
collected from the soil horizon and submitted to Genalysis Laboratory Services (Genalysis) for MMI
analysis of gold, arsenic, mercury, molybdenum, and antimony via inductively coupled plasma (ICP)
analysis.
While the other elements showed no correlation to the underlying mineralisation, the gold and
antimony results appeared to show a broad anomaly across the mineralisation, indicating that the
technique could be useful for regional exploration.
The effectiveness of bedrock geochemistry was demonstrated by MEM in 1968 to 1970, when a grid
south of the South Costerfield/ Tait’s Shafts was sampled. What is now known as the Augusta gold-
antimony deposit was highlighted by the resultant anomalies. Although MEM drilled three shallow
(22–57 m) diamond drillholes to test the anomalies and intersected stibnite stringers, MEM did not
proceed any further. Both conventional surface soil and bedrock samples were collected to compare
techniques; although the surface samples were anomalous (and cheaper) bedrock samples defined
the lodes more precisely.
A geochemical aircore drilling program was carried out during March 2010 to test the zone between
Augusta South and the Margaret Mine (south of the operating Augusta mine). The three east–west
traverses were across cleared grazing paddocks, south of Tobin’s Lane, Costerfield. A total of 104
holes were drilled for a cumulative total of 547 m and an average hole depth of 5.2 m. The antimony
halo was subdued where the high-grade lode is greater than 50 m below top-of-bedrock. This subdued
bedrock geochemistry anomaly could mean either a low-grade lode exists at shallow depth or a high-
grade lode exists at depth.
From December 2011, Mandalay engaged Starwest Pty Ltd to undertake the Augusta East auger
drilling program. A total of 2,615 auger holes were drilled for 7,295.6 m between December 2011 and
June 2012. The survey revealed three anomalous zones, as shown by Figure 9-.
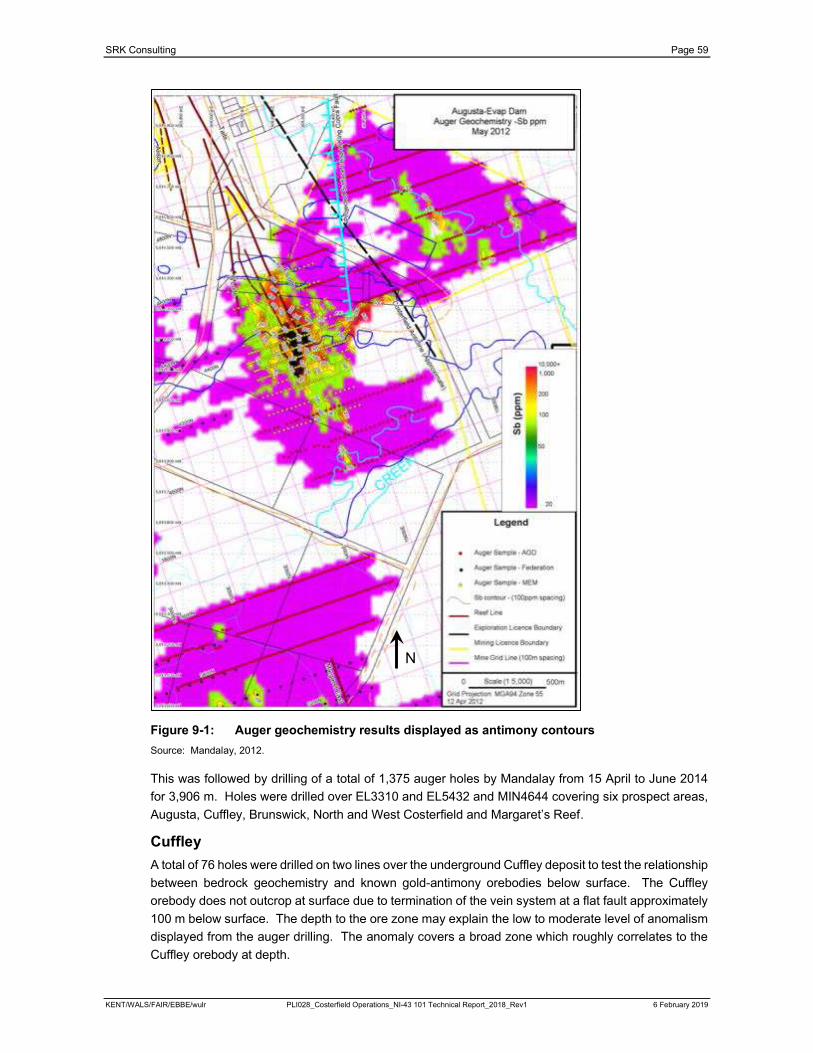
SRK Consulting Page 59
KENT/WALS/FAIR/EBBE/wulr PLI028_Costerfield Operations_NI-43 101 Technical Report_2018_Rev1 6 February 2019
Figure 9-1: Auger geochemistry results displayed as antimony contours
Source: Mandalay, 2012.
This was followed by drilling of a total of 1,375 auger holes by Mandalay from 15 April to June 2014
for 3,906 m. Holes were drilled over EL3310 and EL5432 and MIN4644 covering six prospect areas,
Augusta, Cuffley, Brunswick, North and West Costerfield and Margaret’s Reef.
Cuffley
A total of 76 holes were drilled on two lines over the underground Cuffley deposit to test the relationship
between bedrock geochemistry and known gold-antimony orebodies below surface. The Cuffley
orebody does not outcrop at surface due to termination of the vein system at a flat fault approximately
100 m below surface. The depth to the ore zone may explain the low to moderate level of anomalism
displayed from the auger drilling. The anomaly covers a broad zone which roughly correlates to the
Cuffley orebody at depth.
N
SRK Consulting Page 60
KENT/WALS/FAIR/EBBE/wulr PLI028_Costerfield Operations_NI-43 101 Technical Report_2018_Rev1 6 February 2019
Augusta Mine Extension
To the east, west and south of the existing Augusta mine site, 124 holes were drilled to explore for
extensions of the known underground orebodies. The auger drilling to the east and west did not detect
elevated levels of either gold or antimony and no further work is planned in these areas.
The two lines drilled to the south displayed a narrow zone of high anomalism which correlates directly
to extensions of known orebodies. Diamond drilling between this area and the mine did not intersect
economic mineralisation and this area therefore represents a low priority drilling target.
Brunswick
To the west and south of the Brunswick open cut, 247 holes were drilled to test for extension of the
known orebody. No elevated anomalism was detected to the west, but a narrow high-grade
intersection was returned from drilling 500 m south of the Brunswick pit, suggesting extension of the
orebody.
In 2017, soil sampling was conducted over two lines of bedrock geochemistry to test the
effectiveness of this method. The results of this testing show anomalism broadly
corresponding to the anomalism in the bedrock geochemistry data. Further testing is
required but these initial results indicate this method may be used in place of bedrock
geochemistry in areas that require low impact exploration.
Margaret’s Reef
Margaret’s Reef drilling auger drilling was carried out on private property 1 km south of current Augusta
mining operations with a total of 536 holes. Previous auger drilling in this area was done on a wider
sample spacing of 40 m and was not considered deep enough to provide consistent results, so lines
were re-drilled in this program. Sample spacing of 10 m over the previous anomalous results gave a
clearer indication of vein structures at depth.
Margaret’s Reef appears to be made up of several reef vein systems as suggested from previous RC
and diamond drilling. The veins strike approximately northwest which is a similar orientation to those
seen underground at Augusta and Cuffley, and may represent a fault displaced extension of one of
these systems. The close proximity to the King Cobra Fault to the east appears to have structurally
complicated the vein systems which may explain why the anomalism appears discontinuous in nature.
Wide zones of high anomalism correlate to known historical workings over the reef. The highest result
from auger drilling, not proximal from current mining operations, was received from the northernmost
line at Margaret’s Reef, with 5.42 g/t Au and 3.25% Sb, suggesting the presence of economic
mineralisation at surface.
Several high priority diamond drill targets have been planned, including a target beneath this high
grade result, to give further structural information on this vein system. Recent diamond drilling failed
to follow up on the high grade intersection from hole MM001 drilled in 2001 of 1 m at 33 g/t Au and
14% Sb. Further diamond holes are now planned to consider the bedrock geochemistry to help prove
an economic resource exists in this area. There is a current exploration agreement in place with the
landowner to provide immediate access.
West Costerfield
A total of 336 auger holes were drilled in 2014 at West Costerfield to test areas near historical workings
to the east and test continuity to the south of the previous auger program. The previous geochemistry
program delineated the True Blue anomaly to the west, but only the northern section of the West
Costerfield reef was explored.

SRK Consulting Page 61
KENT/WALS/FAIR/EBBE/wulr PLI028_Costerfield Operations_NI-43 101 Technical Report_2018_Rev1 6 February 2019
A broad anomaly was defined over the West Costerfield reef and continues south with high gold values
and only moderate antimony results. The anomaly runs along the Mountain Creek drainage zone to
the south but widens and slightly changes orientation towards the north near the small historical pits
that define the West Costerfield reef. Though the antimony anomalism is subdued in contrast with the
high gold values, gold-antimony veins below surface similar in style to those intersected in a single
diamond drillhole over True Blue, are interpreted.
In 2015, follow-up 38 RC drillholes were drilled to test the anomaly identified in the 2014 auger drilling
program. The RC drilling has resulted in the identification of mineralisation that warrants follow-up
diamond drilling.
In October 2017, a soil geochemistry program was conducted at Brunswick South to verify historical
sample lines along the southern strike of the Brunswick Lode. A mechanical handheld auger was
used to take 28 samples over two traverse lines at an average depth of 720 mm. This program
successfully verified the historical assay data results showing a correlation of mineralisation with the
new assay data, indicating of possible strike extent to the Brunswick Lode.
AGD commissioned Quarry Survey Solutions of Healesville and United Photo and Graphic Services
Pty Ltd of Melbourne to carry out aerial photogrammetry of the Costerfield tenements and the Augusta
mine site in 2005.
High-level (24,000 ft) photo coverage was carried out in November 2005. This was followed by low-
level (8,000 ft) coverage over the Augusta mine site in January 2006.
A second low-level (4,000 ft) flight was carried out in April 2006, the time of maximum surface
excavation, prior to the commencement of backfilling of the E Lode pit.
The various photosets were subsequently used to generate a digital terrain model (DTM) and a
referenced orthophotographic scan of the Costerfield central mine area. This area essentially
extended from Costerfield south to the Margaret’s Reef area, thereby encompassing most of MIN4644.
As part of Mandalay’s ‘future ore program’, Outlier Geoscience was engaged in March 2018 to assist
in surface geological mapping and with the assembly of a comprehensive regional 3D model of
Mandalay’s tenements. Traverse mapping was undertaken in November 2018 and the 3D modelling
will take place in Q1 2019. A revision of the geological database has taken place to incorporate all
historical and recent mapping from both underground and surface data. Surface mapping and 3D
modelling by Mandalay geologists will be ongoing with the goal to delineate future ore sources and
generate brownfields exploration targets.

SRK Consulting Page 62
KENT/WALS/FAIR/EBBE/wulr PLI028_Costerfield Operations_NI-43 101 Technical Report_2018_Rev1 6 February 2019
On 1 December 2009, Mandalay took over the Costerfield Operation from AGD and continued with
exploration across tenements MIN4644, EL3310 and EL4848. Drilling conducted on the tenements
since then is summarised in Table 10-1.
Table 10-1: Drilling summary
YearMetres
(Diamond)Metres
(Percussion/ Auger)
2009 458.9 547.0
2010 4,032.0 0
2011 13,515.0 0
2012 18,581.4 7,295.6
2013 24,329.0 3,838.0
2014 20,817.0 3,906.0
2015 18,439.0 2,732.0
2016 32,995.0 0
2017 27,827.0 0
2018 34,656.0 0
Total 195,650.3 18,318.0
Drilling from 1 July 2009 to 30 June 2010 mainly comprised drilling along strike and down-dip from the
existing Augusta resource. In total, 458.9 m of diamond coring was undertaken.
In addition, 547 m of bedrock geochemistry aircore drilling was completed within MIN4644 at Augusta
South.
Augusta drilling during from 1 July 2009 to 30 June 2010 concentrated on the definition of the W Lode
resource. Four drillholes tested the depth extent of W Lode. Another six holes were designed as infill
holes to test mineralised shoots and gather geotechnical data. A list of significant intersections for this
period was announced to the market in January 2011 (Mandalay Resources, January 2011).
Exploration from 1 July 2010 to 30 June 2011 was undertaken on two projects – the Augusta Deeps
project and the Brownfields Exploration project. The Augusta Deeps project was undertaken with the
view to extending the current Augusta resource to depth.
Augusta drilling during from 1 July 2010 to 30 June 2011 concentrated on the infill and extension
beneath Augusta to further define the resource below the 1,000 mRL. In total, 10,622.7 m were drilled
beneath the Augusta mine workings and resulted in the definition of further Indicated and Inferred
Mineral Resources. A list of significant intersections for this period was announced to the market in
August 2011 (Mandalay Resources, August 2011).
Exploration from 1 July 2011 to 30 June 2012 – the Augusta Deeps
drilling project (W Lode and N Main Lode), the Alison/ Cuffley drilling project, the Brownfields/ Target
SRK Consulting Page 63
KENT/WALS/FAIR/EBBE/wulr PLI028_Costerfield Operations_NI-43 101 Technical Report_2018_Rev1 6 February 2019
Testing drilling project and the Target Generation/ Bedrock Geochemistry auger drilling project.
The Augusta Deeps project was undertaken with the view to extend the current Augusta resource to
depth and along strike. The N Main Lode was drilled both from underground and surface-based rigs.
The Alison/ Cuffley drilling project was designed to infill drill a portion of the lode to Indicated Mineral
Resource category and to endeavour to ‘bound’ the limits of the lode to Inferred Mineral Resource
category.
In total 18,581.4 m of diamond coring, and 7,295.6 m of auger drilling was undertaken as part of the
four projects. All drilling was carried out by Starwest Pty Ltd using 1 × LM75 diamond drill rig, 2 ×
LM90 diamond rigs, 1 × Kempe underground diamond drill rig and a modified Gemco 210B track-
mounted auger rig.
Drilling of the Augusta deposit from July 2011 to December 2012 was undertaken with the view to
extend the W, E and N Main Lodes Inferred and Indicated Mineral Resource and give confidence in
the structural continuity of W and N Main Lode. A total of 78 holes were drilled from surface and
underground, totalling 16,170.4 m of drilling. A list of significant intersections for this period was
announced to the market in July 2012 (Mandalay Resources, August 2011).
The Cuffley Lode resource drilling program began in July 2011 (AD series of holes), following the
MB007 discovery. As a follow-up program, four holes were drilled (AD001–ADD004). AD004 went
through the fault blank and AD003 appears to have only intersected the Alison Lode above the Adder
Fault in the vicinity of some old stopes.
From hole AD005 onwards, the drilling strategy has involved drilling at least two holes on each mine
grid cross section on an approximate spacing of 80–100 m. Holes have been drilled both from west
to east and east to west, depending on site logistics.
A portion of the drilling in 2011/2012 was infill drilling (100 m below the Alison Shaft 5 Level) at a
spacing of 40 m, to define the lode to Indicated Mineral Resource category where the planned access
decline would first intersect the lode. One deep hole, AD022 (5025N cross section) intersected the
Cuffley Lode (1.04 m at 59.7 g/t Au and 0.37% Sb) at 700 mRL, 490 m below the surface. This
provided confidence in the depth continuity of the lode to Inferred Mineral Resource category initially,
to ‘bound’ the extent of the lode.
In from 1 July 2012 to 30 June 2013, Mandalay drilled 24,329.0 m of diamond drilling, targeting the
Cuffley Lode from surface. These focussed on infill drilling the central, high-grade part of the Cuffley
Lode to convert some of the Inferred Mineral Resources to the Indicated category. Longitudinal
projections of these intersections relative to the Mineral Resource are provided in Section 14.
The Cuffley Lode dips approximately 85° towards 097°. All downhole sample lengths have been
converted to true thicknesses using the dip of the lode and the orientation of the drillhole. MH335 and
MH336 were drilled as wedges and therefore have significantly lower collar elevations and shallower
dips than the other drillholes. Due to the narrow, high-grade nature of the mineralisation, it is not
meaningful to report significantly higher-grade intercepts within lower-grade intercepts, and therefore
they are not reported here.
SRK Consulting Page 64
KENT/WALS/FAIR/EBBE/wulr PLI028_Costerfield Operations_NI-43 101 Technical Report_2018_Rev1 6 February 2019
In 2014, the focus was on finalising the Cuffley and Augusta resource drilling. The goals achieved
included:
Expanding the existing Inferred Mineral Resource of the Cuffley Lode, both along strike and at
depth
Increasing the confidence of the central part of the Cuffley Lode to aid mine development and
stoping the Cuffley Lode
Expanding the existing Inferred Mineral Resource of the Augusta deposit, specifically targeting N
Lode along strike from the existing N Lode development
Infill and extension of the Cuffley resource to the north and south along with ‘Cuffley Shallows’ in
between the Flat Fault and the Adder Fault.
In total, 20,817 m of diamond drilling was undertaken, and 3,906 m of auger drilling was undertaken
on Mandalay’s tenements at Costerfield during 2013/2014. A total of 5,735 m was drilled for the
purposes of target testing, 9,390 m for resource expansion and conversions and 5,692 m for resource
infill drilling. All drilling activity was conducted by Starwest Pty Ltd using 2 × Boart Longyear LM90s,
1 × Boart Longyear LM75, 1 × pneumatic Kempe U2 and a modified Gemco 210B track-mounted
auger.
Exploration in 2015 was focused on extending the Cuffley and Augusta resource both along strike and
at depth. The expansion of the Cuffley resource included the commencement of drilling in the Cuffley
Deeps and Sub King Cobra regions. The goals achieved included:
Expanding the existing Inferred Mineral Resource of the Cuffley Lode, both along strike and define
a resource below the Cuffley Lode at depth
Commence drilling at depth below the Cuffley deposit into the Cuffley Deeps and Sub King Cobra
areas
Increasing the confidence of the central part of the Cuffley Lode to aid mine development and
stoping the Cuffley Lode
Expanding the existing Inferred Mineral Resource of the Augusta deposit, specifically targeting N
Lode along strike from the existing N Lode development
Infill and extension of the Cuffley resource to the north and south along with Cuffley Shallows
between the Flat Fault and the Adder Fault
Follow-up RC drilling at West Costerfield to test the geochemical anomaly identified in 2014 by
the Auger Bedrock drilling program.
In total, 18,439 m of diamond drilling was undertaken, and 2,732 m of RC drilling was undertaken on
Mandalay’s tenements at Costerfield during 2014/2015. All drilling activity was conducted by Starwest
Pty Ltd using 2 × Boart Longyear LM90s, 1 × Boart Longyear LM75 and a pneumatic Kempe U2, with
the exception of the RC drilling which was carried out by Blacklaws Drilling using a Hanjin surface rig.
Exploration from January to December 2016 was focused on extending and upgrading the Cuffley and
Augusta resources to extend the life of mine (LOM) and replace mine depletion along with explore
near-mine targets close to current underground infrastructure. The expansion of the Cuffley resource
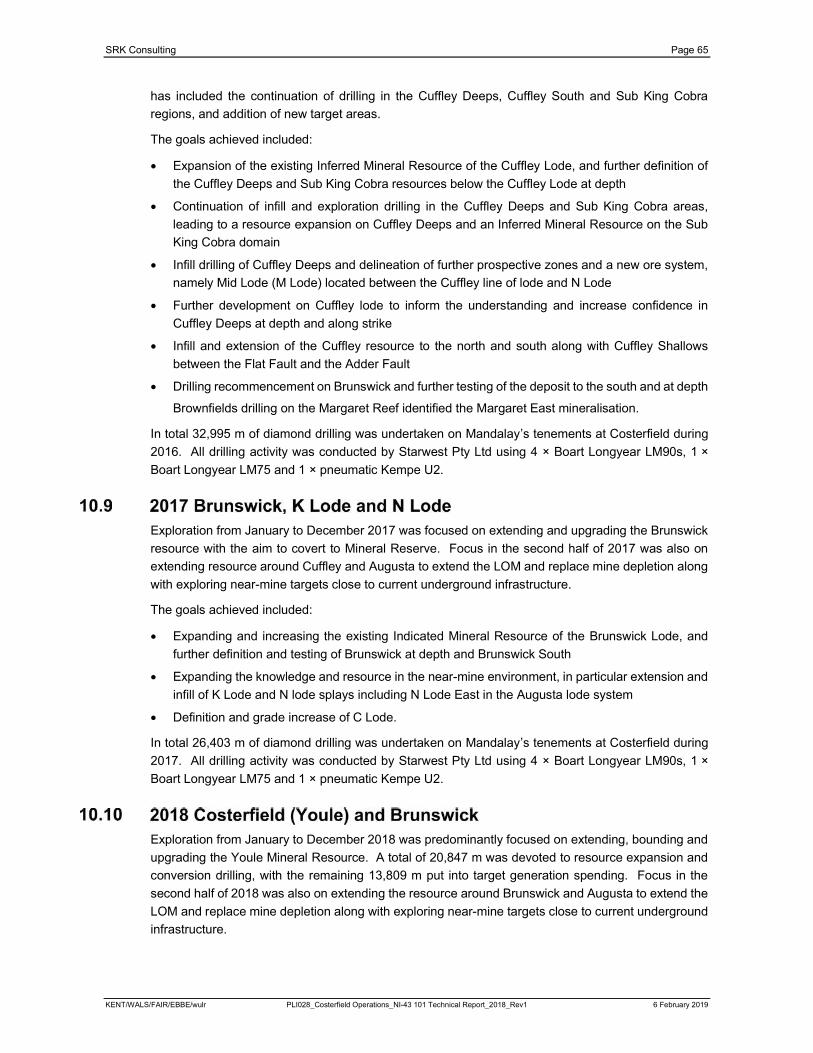
SRK Consulting Page 65
KENT/WALS/FAIR/EBBE/wulr PLI028_Costerfield Operations_NI-43 101 Technical Report_2018_Rev1 6 February 2019
has included the continuation of drilling in the Cuffley Deeps, Cuffley South and Sub King Cobra
regions, and addition of new target areas.
The goals achieved included:
Expansion of the existing Inferred Mineral Resource of the Cuffley Lode, and further definition of
the Cuffley Deeps and Sub King Cobra resources below the Cuffley Lode at depth
Continuation of infill and exploration drilling in the Cuffley Deeps and Sub King Cobra areas,
leading to a resource expansion on Cuffley Deeps and an Inferred Mineral Resource on the Sub
King Cobra domain
Infill drilling of Cuffley Deeps and delineation of further prospective zones and a new ore system,
namely Mid Lode (M Lode) located between the Cuffley line of lode and N Lode
Further development on Cuffley lode to inform the understanding and increase confidence in
Cuffley Deeps at depth and along strike
Infill and extension of the Cuffley resource to the north and south along with Cuffley Shallows
between the Flat Fault and the Adder Fault
Drilling recommencement on Brunswick and further testing of the deposit to the south and at depth
Brownfields drilling on the Margaret Reef identified the Margaret East mineralisation.
In total 32,995 m of diamond drilling was undertaken on Mandalay’s tenements at Costerfield during
2016. All drilling activity was conducted by Starwest Pty Ltd using 4 × Boart Longyear LM90s, 1 ×
Boart Longyear LM75 and 1 × pneumatic Kempe U2.
Exploration from January to December 2017 was focused on extending and upgrading the Brunswick
resource with the aim to covert to Mineral Reserve. Focus in the second half of 2017 was also on
extending resource around Cuffley and Augusta to extend the LOM and replace mine depletion along
with exploring near-mine targets close to current underground infrastructure.
The goals achieved included:
Expanding and increasing the existing Indicated Mineral Resource of the Brunswick Lode, and
further definition and testing of Brunswick at depth and Brunswick South
Expanding the knowledge and resource in the near-mine environment, in particular extension and
infill of K Lode and N lode splays including N Lode East in the Augusta lode system
Definition and grade increase of C Lode.
In total 26,403 m of diamond drilling was undertaken on Mandalay’s tenements at Costerfield during
2017. All drilling activity was conducted by Starwest Pty Ltd using 4 × Boart Longyear LM90s, 1 ×
Boart Longyear LM75 and 1 × pneumatic Kempe U2.
Exploration from January to December 2018 was predominantly focused on extending, bounding and
upgrading the Youle Mineral Resource. A total of 20,847 m was devoted to resource expansion and
conversion drilling, with the remaining 13,809 m put into target generation spending. Focus in the
second half of 2018 was also on extending the resource around Brunswick and Augusta to extend the
LOM and replace mine depletion along with exploring near-mine targets close to current underground
infrastructure.
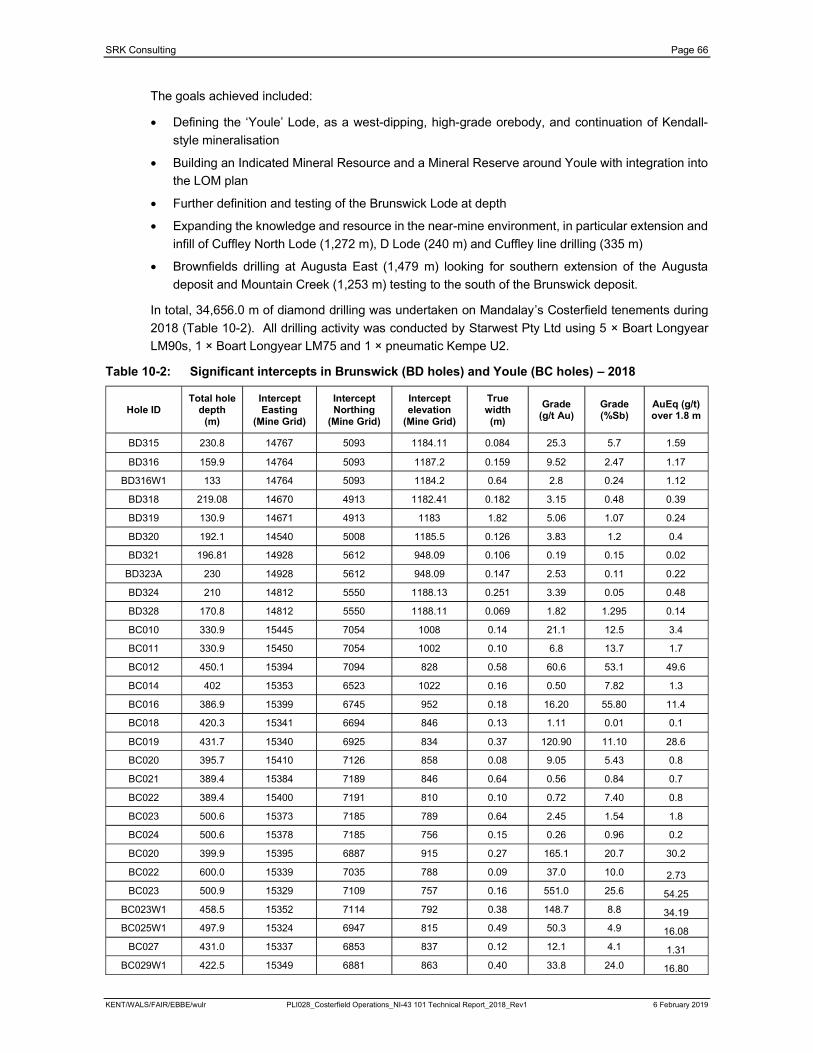
SRK Consulting Page 66
KENT/WALS/FAIR/EBBE/wulr PLI028_Costerfield Operations_NI-43 101 Technical Report_2018_Rev1 6 February 2019
The goals achieved included:
Defining the ‘Youle’ Lode, as a west-dipping, high-grade orebody, and continuation of Kendall-
style mineralisation
Building an Indicated Mineral Resource and a Mineral Reserve around Youle with integration into
the LOM plan
Further definition and testing of the Brunswick Lode at depth
Expanding the knowledge and resource in the near-mine environment, in particular extension and
infill of Cuffley North Lode (1,272 m), D Lode (240 m) and Cuffley line drilling (335 m)
Brownfields drilling at Augusta East (1,479 m) looking for southern extension of the Augusta
deposit and Mountain Creek (1,253 m) testing to the south of the Brunswick deposit.
In total, 34,656.0 m of diamond drilling was undertaken on Mandalay’s Costerfield tenements during
2018 (Table 10-2). All drilling activity was conducted by Starwest Pty Ltd using 5 × Boart Longyear
LM90s, 1 × Boart Longyear LM75 and 1 × pneumatic Kempe U2.
Table 10-2: Significant intercepts in Brunswick (BD holes) and Youle (BC holes) – 2018
Hole IDTotal hole
depth(m)
Intercept Easting
(Mine Grid)
Intercept Northing
(Mine Grid)
Intercept elevation
(Mine Grid)
True width(m)
Grade (g/t Au)
Grade (%Sb)
AuEq (g/t) over 1.8 m
BD315 230.8 14767 5093 1184.11 0.084 25.3 5.7 1.59
BD316 159.9 14764 5093 1187.2 0.159 9.52 2.47 1.17
BD316W1 133 14764 5093 1184.2 0.64 2.8 0.24 1.12
BD318 219.08 14670 4913 1182.41 0.182 3.15 0.48 0.39
BD319 130.9 14671 4913 1183 1.82 5.06 1.07 0.24
BD320 192.1 14540 5008 1185.5 0.126 3.83 1.2 0.4
BD321 196.81 14928 5612 948.09 0.106 0.19 0.15 0.02
BD323A 230 14928 5612 948.09 0.147 2.53 0.11 0.22
BD324 210 14812 5550 1188.13 0.251 3.39 0.05 0.48
BD328 170.8 14812 5550 1188.11 0.069 1.82 1.295 0.14
BC010 330.9 15445 7054 1008 0.14 21.1 12.5 3.4
BC011 330.9 15450 7054 1002 0.10 6.8 13.7 1.7
BC012 450.1 15394 7094 828 0.58 60.6 53.1 49.6
BC014 402 15353 6523 1022 0.16 0.50 7.82 1.3
BC016 386.9 15399 6745 952 0.18 16.20 55.80 11.4
BC018 420.3 15341 6694 846 0.13 1.11 0.01 0.1
BC019 431.7 15340 6925 834 0.37 120.90 11.10 28.6
BC020 395.7 15410 7126 858 0.08 9.05 5.43 0.8
BC021 389.4 15384 7189 846 0.64 0.56 0.84 0.7
BC022 389.4 15400 7191 810 0.10 0.72 7.40 0.8
BC023 500.6 15373 7185 789 0.64 2.45 1.54 1.8
BC024 500.6 15378 7185 756 0.15 0.26 0.96 0.2
BC020 399.9 15395 6887 915 0.27 165.1 20.7 30.2
BC022 600.0 15339 7035 788 0.09 37.0 10.0 2.73
BC023 500.9 15329 7109 757 0.16 551.0 25.6 54.25
BC023W1 458.5 15352 7114 792 0.38 148.7 8.8 34.19
BC025W1 497.9 15324 6947 815 0.49 50.3 4.9 16.08
BC027 431.0 15337 6853 837 0.12 12.1 4.1 1.31
BC029W1 422.5 15349 6881 863 0.40 33.8 24.0 16.80

SRK Consulting Page 67
KENT/WALS/FAIR/EBBE/wulr PLI028_Costerfield Operations_NI-43 101 Technical Report_2018_Rev1 6 February 2019
Hole IDTotal hole
depth(m)
Intercept Easting
(Mine Grid)
Intercept Northing
(Mine Grid)
Intercept elevation
(Mine Grid)
True width(m)
Grade (g/t Au)
Grade (%Sb)
AuEq (g/t) over 1.8 m
BC030 404.4 15370 6885 889 0.13 13.5 9.4 2.19
BC031 441.1 15365 6781 917 0.41 108.1 22.4 33.52
BC032W1 381.0 15368 6962 863 0.33 73.1 16.0 18.64
BC033 440.5 15373 6935 882 0.29 22.3 19.5 9.19
BC028 362.1 15404 6849 946 2.30 1.1 1.5 4.8
BC032 451.3 15364 7019 826 0.66 338.8 14.4 133.1
BC032W2 428.7 15385 7025 850 0.32 73.1 16.0 18.1
BC036 351.0 15398 6787 949 0.41 55.7 40.1 28.9
BC036W1 326.4 15399 6785 952 1.65 93.9 31.1 136.4
BC037 441.0 15302 6874 820 0.24 31.3 17.0 8.2
BC038 447.0 15395 7078 865 0.09 65.4 20.1 4.9
BC039 483.3 15341 7080 780 0.09 31.5 16.2 2.8
BC040 381.9 15362 6694 950 0.29 54.5 1.6 9.1
BC045A 423.9 15353 6910 860 0.86 1.4 2.6 2.8
BC046 459.0 15360 7076 805 0.24 15.2 7.1 3.7
BC047 440.9 15399 7016 880 1.40 152.0 18.1 142.7
BC048 460.6 15325 6990 793 0.88 16.7 2.4 10.2
BC049 443.9 15378 7054 831 0.15 50.7 21.9 7.7
BC050 428.5 15366 6991 837 1.26 2.7 1.8 4.1
BC050W1 419.5 15370 7002 837 1.27 11.4 3.3 12.1
BC051 436.2 15379 6988 862 0.14 39.9 26.9 6.6
BC052 520.2 15307 7119 728 0.58 65.7 8.0 25.7
BC055 489.2 15299 7062 739 0.26 199.7 5.2 30.5
BC056 490.2 15292 7003 752 0.09 51.7 22.1 4.7
BC057 447.0 15404 6932 902 0.35 13.0 8.1 5.3
BC058A 448.1 15325 6881 842 0.60 129.6 10.4 48.9
BC059 437.2 15359 7043 805 0.45 33.6 6.5 11.4
BC061 474.2 15387 7145 826 0.31 61.9 41.5 23.2
BC020 399.9 15395 6887 915 0.27 165.1 20.7 30.2
BC022 600.0 15339 7035 788 0.09 37.0 10.0 2.7
BC023 500.9 15329 7109 757 0.16 551.0 25.6 54.3
BC023W1 458.5 15352 7114 792 0.38 148.7 8.8 34.2
BC025W1 497.9 15324 6947 815 0.49 50.3 4.9 16.1
BC027 431.0 15337 6853 837 0.12 12.1 4.1 1.3
BC029W1 422.5 15349 6881 863 0.40 33.8 24.0 16.8
BC030 404.4 15370 6885 889 0.13 13.5 9.4 2.2
BC031 441.1 15365 6781 917 0.41 108.1 22.4 33.5
BC032W1 381.0 15368 6962 863 0.33 73.1 16.0 18.6
BC033 440.5 15373 6935 882 0.29 22.3 19.5 9.2
SRK Consulting Page 68
KENT/WALS/FAIR/EBBE/wulr PLI028_Costerfield Operations_NI-43 101 Technical Report_2018_Rev1 6 February 2019
Due to the extensive historical drilling conducted throughout the history of the Costerfield area, and
that mining has already depleted much of the Augusta resource above 1,000 mRL, the following
sections mainly relate to drilling completed after 1 January 2010 and below the 1,000 mRL.
The Augusta deposit has been subject to ongoing development and diamond drilling since
commencement of mining operations in 2006. The current Mineral Resource estimates are completed
using all historical drilling and then depleted for areas already mined.
Between 2006 and 2011, several drilling companies were contracted to provide both surface and
underground drilling services at Costerfield. To ensure consistent results and quality of drilling,
Starwest Drilling Pty Ltd was made the preferred drilling services supplier in 2011.
Since 2011, underground diamond drilling has been completed using an LM90, which has drilled
predominantly HQ-sized drillholes with some NQ2-sized drilling completed as necessary to pass
through areas of bad ground. Some underground drilling has been conducted using LTK46-sized
core, but information from these drillholes is used purely for structural information. Surface drilling
conducted to identify depth extensions to N Lode has been completed using HQ-sized core, switching
to HQ3-sized core at 50–100 m from the projected lode intercept.
Prior to 2011, various sized drillholes and methods were used during drilling. These included HQ,
HQ3, NQ, NQ2, LTK60, LTK60, LTK48 and 5”1/8’ to 5”5/8’ RC. Details of these holes were not always
recorded. However, because the majority of this drilling is in areas that are already depleted by mining,
the risk associated with this drilling is perceived to be low. Figure 10-1 illustrates the known drillhole
collar locations for the Augusta and Cuffley deposits.

SRK Consulting Page 69
KENT/WALS/FAIR/EBBE/wulr PLI028_Costerfield Operations_NI-43 101 Technical Report_2018_Rev1 6 February 2019
Figure 10-1: Known drillhole collar locations for Augusta and Cuffley lodes
Source Mandalay 2018
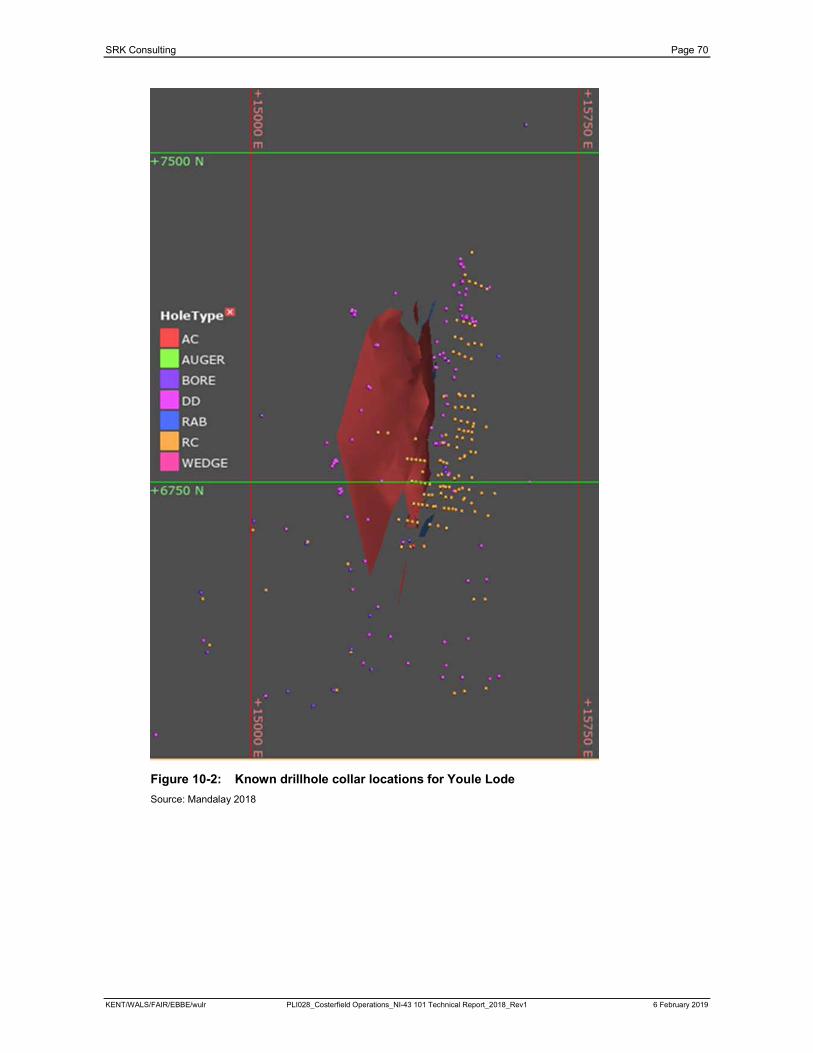
SRK Consulting Page 70
KENT/WALS/FAIR/EBBE/wulr PLI028_Costerfield Operations_NI-43 101 Technical Report_2018_Rev1 6 February 2019
Figure 10-2: Known drillhole collar locations for Youle Lode
Source: Mandalay 2018
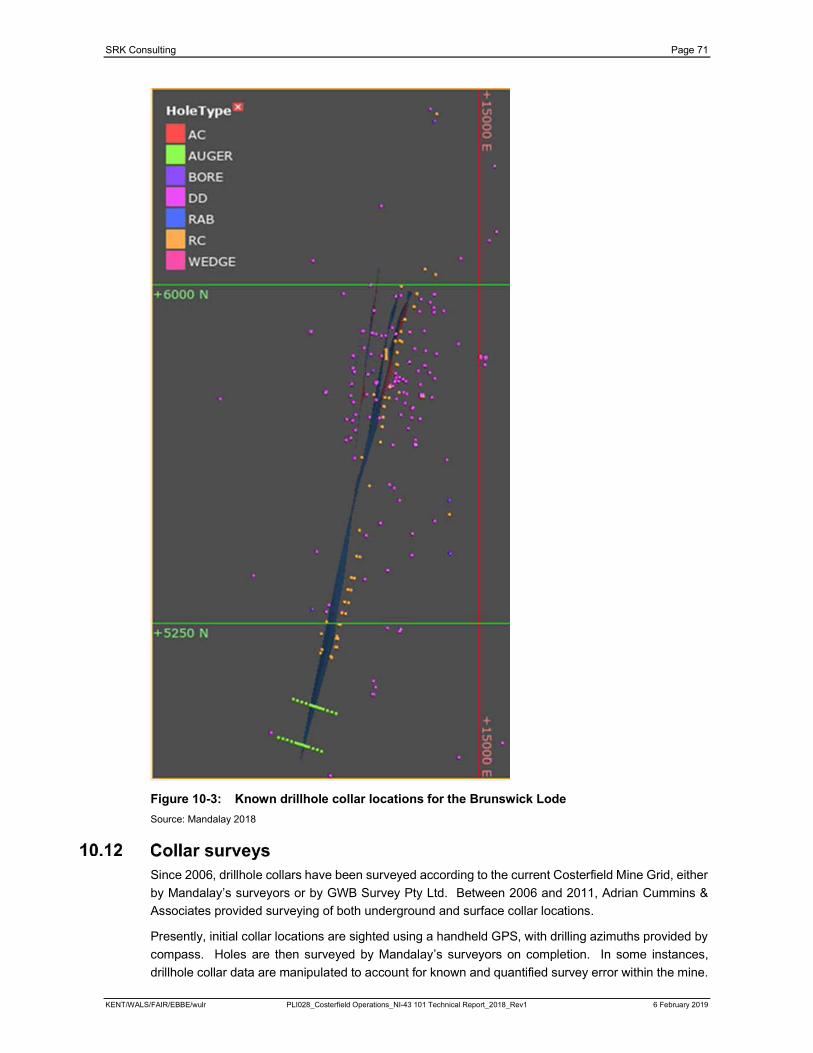
SRK Consulting Page 71
KENT/WALS/FAIR/EBBE/wulr PLI028_Costerfield Operations_NI-43 101 Technical Report_2018_Rev1 6 February 2019
Figure 10-3: Known drillhole collar locations for the Brunswick Lode
Source: Mandalay 2018
Since 2006, drillhole collars have been surveyed according to the current Costerfield Mine Grid, either
by Mandalay’s surveyors or by GWB Survey Pty Ltd. Between 2006 and 2011, Adrian Cummins &
Associates provided surveying of both underground and surface collar locations.
Presently, initial collar locations are sighted using a handheld GPS, with drilling azimuths provided by
compass. Holes are then surveyed by Mandalay’s surveyors on completion. In some instances,
drillhole collar data are manipulated to account for known and quantified survey error within the mine.
SRK Consulting Page 72
KENT/WALS/FAIR/EBBE/wulr PLI028_Costerfield Operations_NI-43 101 Technical Report_2018_Rev1 6 February 2019
The distance from the drillhole collar to a known underground survey station is measured and then the
collar is calculated and used until the collar is surveyed by Mandalay’s surveyors.
Between the late 1990s and 2001, most drillholes appear to have been located using a GPS.
Drillhole collar locations prior to the 1990s were usually sighted via tape and compass.
Where possible, historical drillholes were surveyed in 2005 by Adrian Cummins & Associates, but this
was not always possible.
Collars surveyed after 2001 are recorded in the acQuire drillhole database as being surveyed.
Unsurveyed/ unknown drillholes are recorded as either GPS or unknown and are given an accuracy
of within 1 m.
Since 2011, all holes have been downhole surveyed using an electronic, single-shot survey tool.
An initial check survey is completed at 15 m to ensure that the collar set-up is accurate. Thereafter,
surveys are conducted at 30 m intervals, unless ground conditions are unsuitable to conduct a survey.
In those cases, the survey is completed when suitable ground conditions are subsequently
encountered.
Between 2001 and 2018, all drillholes have been surveyed via either electronic single-shot or film
single-shot survey tools. Prior to 2001, survey information exists for most of the holes, but the method
and records of these surveys are not readily available.
In November 2016, Mandalay purchased the Geoscientific Information Management software,
acQuire. The acquisition of this software package took place as drilling data collection is rapidly
expanding and this new software will improve overall efficiency in data collection and handling costs.
It will improve on overall integrity of data and minimise human error in storing of data. Prior to the
purchase of acquire, Mandalay made use of Microsoft Excel and Access databases.
The following information only relates to drilling completed after 1 January 2010 and below the
1,000 mRL in the Augusta and Cuffley deposits.
Augusta core is geologically logged at the core preparation facility located at the Brunswick Processing
Plant site. Core is initially brought to the facility by either the drill crews at the end of shift or by field
technicians who work in the core preparation facility. Core is generally stored on pallets while waiting
for processing.
Field technicians initially orientate all core to the alignment provided by the drill crews through the use
of an electronic core orientation device. This orientation is transferred along the length of the run, with
each drill run having been orientated. If a discrepancy is found between two adjacent runs, the next
run is orientated, and the two best-matching orientations are used. If no orientation is recorded by the
drill crews, the core is simply rotated to a consistent alignment of bedding or cleavage, with no
orientation mark made on the core.
Depth marks are made on the core at 1 m intervals using a tape measure, and accounting for core
loss and overdrill. If core loss is encountered, a block is placed in the zone of core loss. If problems
are encountered with driller core blocks, the drill shift supervisor is advised and depth marking stops
until the problem is rectified.
Field technicians then collect rock quality designation (RQD) data directly onto a digital tablet device
SRK Consulting Page 73
KENT/WALS/FAIR/EBBE/wulr PLI028_Costerfield Operations_NI-43 101 Technical Report_2018_Rev1 6 February 2019
using acQuire software. RQD data is collected corresponding to drill runs and includes the “from”
depth, “to” depth, run length in metres, the recovered length in metres, the recovery as a percentage,
the length of recovered core greater than or equal to 10 cm, and the number of fractures. From this
data, an RQD value is calculated. This data is logged ‘live’ into the acQuire database via the
Toughbook computer to the company server.
Once depth marks are placed on the core. Site geologists then log lithology, sample intervals,
structural data and geotechnical data (if applicable) directly to the aQuire database.
All measurements of structural features, such as bedding, cleavage, faults, and shears are made using
an orientated core wrap around protractor and protractor for alpha and beta measurements using the
orientation line on the core. If no orientation line is available, only alpha measurements are made.
Measurements are recorded directly into the aQuire database and are also scribed onto the core using
wax pencil. As the logging is ‘live’, data is automatically backed up and stored on the company server.
After geological logging has been completed, all trays are photographed before sampling.
Once sampling is completed, the trays are put on pallets and moved to a permanent core storage
area.
Drilling completed prior to 1 January 2010 informed areas of the resource that have largely been
mined, therefore, the following discussion relates to drilling completed after 1 January 2010 and below
the 1,000 m RL.
Drilling is generally conducted with planned intercepts based on northing at an interval of
approximately 40 m along strike and 30 m in the dip direction. Because most drilling at Augusta is
now conducted from underground and Cuffley Lode is the primary target of the majority of this drilling,
the pattern and density achieved on N Main Lode can vary greatly. Where increased geological
confidence is required, infill holes specifically targeting NE or E Lodes have been drilled at a nominal
40 m spacing. Surface drilling, targeting depth extensions of the Augusta deposit, is generally
conducted on 100 m sections along strike, with intersections spaced 80–100 m in the dip direction.
Initial drilling of the Cuffley Lode was intended to be done in a ‘W’ pattern on an approximate 50 m ×
50 m offset grid. This pattern was started with AD001 through to and including AD004. To aid
interpretation, this pattern was changed to a 100 m grid based on mine grid northings, with 50–80 m
between holes on a given section. This pattern allowed better interpretation to be completed on
sections.
For infill drilling between the 820 mRL and 1020 mRL of the Cuffley Lode the ‘W’ pattern was used to
maximise strike direction information. This is as opposed to depth information, which is gained by
drilling on section. This infill drilling was conducted on a nominal 30 m (RL) × 40 m (N) grid.
Drilling after 2010 has been conducted by bounding and infilling the existing inferred resource based
on fault interpretation. Extension within the Penguin to Kiwi fault panel used an initial ‘W’ pattern,
which was then infilled using wedges.
The Kiwi to Rooster fault panel was also drilled using a ‘W’ pattern with an approximate spacing of
40 m.
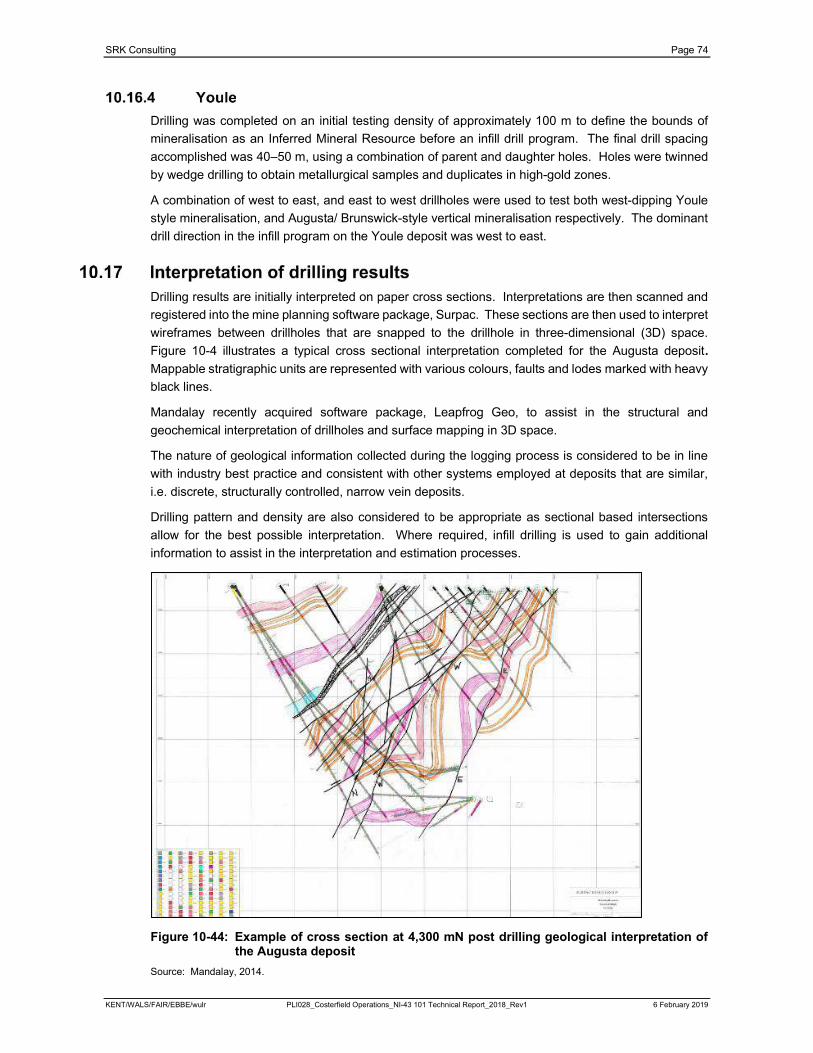
SRK Consulting Page 74
KENT/WALS/FAIR/EBBE/wulr PLI028_Costerfield Operations_NI-43 101 Technical Report_2018_Rev1 6 February 2019
Drilling was completed on an initial testing density of approximately 100 m to define the bounds of
mineralisation as an Inferred Mineral Resource before an infill drill program. The final drill spacing
accomplished was 40–50 m, using a combination of parent and daughter holes. Holes were twinned
by wedge drilling to obtain metallurgical samples and duplicates in high-gold zones.
A combination of west to east, and east to west drillholes were used to test both west-dipping Youle
style mineralisation, and Augusta/ Brunswick-style vertical mineralisation respectively. The dominant
drill direction in the infill program on the Youle deposit was west to east.
Drilling results are initially interpreted on paper cross sections. Interpretations are then scanned and
registered into the mine planning software package, Surpac. These sections are then used to interpret
wireframes between drillholes that are snapped to the drillhole in three-dimensional (3D) space.
Figure 10-4 illustrates a typical cross sectional interpretation completed for the Augusta deposit.
Mappable stratigraphic units are represented with various colours, faults and lodes marked with heavy
black lines.
Mandalay recently acquired software package, Leapfrog Geo, to assist in the structural and
geochemical interpretation of drillholes and surface mapping in 3D space.
The nature of geological information collected during the logging process is considered to be in line
with industry best practice and consistent with other systems employed at deposits that are similar,
i.e. discrete, structurally controlled, narrow vein deposits.
Drilling pattern and density are also considered to be appropriate as sectional based intersections
allow for the best possible interpretation. Where required, infill drilling is used to gain additional
information to assist in the interpretation and estimation processes.
Figure 10-44: Example of cross section at 4,300 mN post drilling geological interpretation of the Augusta deposit
Source: Mandalay, 2014.
SRK Consulting Page 75
KENT/WALS/FAIR/EBBE/wulr PLI028_Costerfield Operations_NI-43 101 Technical Report_2018_Rev1 6 February 2019
Core recovery is the most significant factor having potential to materially impact the accuracy of results.
Historically, this was an issue for all methods of drilling in the Augusta area. Mandalay has employed
methods of drilling and associated procedures to ensure the highest recovery possible. Where
recovery is poor, a repeat hole is drilled via a wedge.
Information gained from historical drilling is still used in resource estimation. However, because much
of the drilled area has already been depleted by mining, the associated risk is reduced significantly.
Surveying of the collar and downhole follows industry best practice1, given the location of drill collars
and the expected deviation encountered during drilling. The potential for significant impact on results
is thus minimised.
Sampling is also of a consistent and repeatable nature, with appropriate QA/QC methodologies
employed. The assay method used is also considered to be appropriate for this style of mineralisation.
1 Survey techniques are consistent with the Canadian Institute of Mining and Metallurgy and Petroleum (CIM)
Exploration Best Practice Guidelines.
SRK Consulting Page 76
KENT/WALS/FAIR/EBBE/wulr PLI028_Costerfield Operations_NI-43 101 Technical Report_2018_Rev1 6 February 2019
Samples used to inform the Augusta, Cuffley, Brunswick and Youle block model estimates are sourced
from both drill core and channel sampling along the ore development drives.
The mineralisation style at Costerfield is discrete; therefore, not all diamond drill core is required to be
sampled. Sample intervals are determined and marked on the core by Mandalay’s geologists.
General rules that are applied in the selection of sample intervals are as follows:
All stibnite-bearing veins are sampled.
A waste sample is taken either side of the mineralised vein (30–100 cm).
Areas of stockwork veining are sampled.
Laminated quartz veins are sampled.
Massive quartz veins are sampled.
Siltstone is sampled where disseminated arsenopyrite is prevalent.
Puggy fault zones are sampled at the discretion of the geologist.
A Mandalay Exploration Field Technician samples the core. To obtain a consistent sample, the
diamond drill core is cut in half with a diamond saw along the top or bottom mark of the orientated
core.
Sampling intervals for drill core used for resource estimation purposes are not shorter than 3 cm and
not longer than 1 m. The average sample length for drill core samples in the Augusta drill program is
40 cm for 2016. Drillholes that were designed and drilled for metallurgical analysis have had sample
intervals up to 2 m in length.
The northern side of the core is sampled to ensure that the same side of the core is sampled
consistently. Where there is a definitive lithological contact that marks the boundary of a sample, the
sample is cut along that contact. If by doing this the sample is less than 5 cm in length, the boundary
of the sample is taken at a perpendicular distance from the centre of the sample, which achieves the
3 cm requirement.
Samples from RC drilling are not used in the estimation of the Augusta Mineral Resource, although
some RC and hammer drilling is used to establish pre-collars for deeper diamond drillholes.
Approximately 80% of all drive faces are sampled. Each development cut is approximately 1.8 m
along strike. Samples are taken at a frequency of between 1.8 m and 5 m along strike. Underground
face samples are collected using the following method:
The face is marked out by the sampler to show the limits of the lode and the bedding angle and
any geological structures which may offset the lode are marked on the face.
Sample locations are marked out so that the sample is taken in a direction that is perpendicular to
the dip of the lode from the footwall to hanging wall.
The face and lengths of the sample are measured.
The face is labelled with the heading, dated and photographed.
SRK Consulting Page 77
KENT/WALS/FAIR/EBBE/wulr PLI028_Costerfield Operations_NI-43 101 Technical Report_2018_Rev1 6 February 2019
Each sample is collected as a channel sample using pick or pneumatic chisel and placed into a
sample bag.
Care is taken to obtain a representative sample.
Where there are two or more lode structures in the face, samples of the intervening siltstone are
also taken.
Sample weights are between 0.5 kg and 2 kg.
Sample length can vary from 5 cm to 1.5 m across the structures.
Each sample bag is assigned a unique sample ID.
A sample book is used to record the sample IDs used. A ticket stub from the sample book is
placed into the sample bag for use by the assay laboratory.
The face is sketched on a face sample sheet and sample details recorded.
The location of the face is derived from survey pickups of the floor and backs of the ore drive.
Face samples are taken at the appropriate orientation to the mineralisation and are representative
of the mine heading being sampled.
Within the Augusta and Cuffley deposits, the distance between drillhole intercepts is approximately
40 m × 30 m. This is reduced to 20 m × 20 m in areas of structural complexity. Face sampling along
drives is done at a frequency between 1.8 m and 5.0 m along strike and 5–10 m down-dip.
Assaying of the drill core and face samples is predominantly completed by Onsite Laboratory Services
(Onsite) in Bendigo. This laboratory is independent of Mandalay and holds a current ISO 9001
accreditation. ALS Global (Brisbane) (ALS) and Bureau Veritas (Perth) (BV) have also been used to
verify the accuracy of Onsite.
After Mandalay dispatches the core or face samples, the assaying laboratory’s personnel undertake
sample preparation and chemical analysis. Results are returned to Mandalay staff, who validate and
input the data into the relevant databases.
The following sample preparation activities are undertaken by Mandalay staff:
Sample material is placed into a calico bag previously marked with a sample number
The sample characteristics are marked on a sample ticket stub and placed in the bag
Calico bags are loaded into plastic bags so that the plastic bags weigh less than 10 kg
An assay request sheet is completed and placed in the sample bag
Plastic bags containing samples are sealed and transported to Onsite in Bendigo via private
courier.
The following sample preparation are undertaken by Onsite staff:
Samples are received and checked against the submission sheet
A job number is assigned and worksheets as well as sample bags prepared
Samples are placed in an oven and dried overnight at 80°C
The entire sample (up to 3 kg) is jaw-crushed to approximately 2 mm; if the sample weight is more than 3 kg, the sample is split and 50% of the sample is used

SRK Consulting Page 78
KENT/WALS/FAIR/EBBE/wulr PLI028_Costerfield Operations_NI-43 101 Technical Report_2018_Rev1 6 February 2019
The entire sample is then milled and pulv
Samples are then split, with 200 g for analysis and the remaining sample returned to its sample bag for storage and eventual return to Mandalay.
Augusta drill core and face samples are assayed for gold, antimony, arsenic, and iron. Gold grades
are determined by fire assay/ AAS.
The following procedure is undertaken by Onsite for gold and antimony:
50 g of pulp is fused with 180 g of flux (silver).
Slag is removed from the lead button and cupellation is used to produce a gold/ silver prill.
0.6 mL of 50% nitric acid is added to a test tube containing prill, and the test tube is placed in a
boiling water bath (100°C) until fumes cease and silver appears to be completely dissolved.
1.4 mL of hydrochloric acid (HCl) is added.
On complete dissolution of gold, 8 mL of water is added once the solution is cooled.
Once the solids have settled, the gold content is determined by flame AAS.
Antimony grades are determined using acid digest/ AAS. Where the sample contains antimony in
excess of 0.6% concentration, the following procedure is undertaken:
0.2 g of sample is added to a flask of distilled water (20 mL).
30 mL of 50% nitric acid is added.
20 mL of tartaric acid is added.
80 mL of 50% HCl acid is added and allowed to stand for 40 minutes.
5 mL of hydrobromic acid (HBr) is added.
The solution is mixed for 1 hour and left to stand overnight until fuming ceases.
Sample is heated until colour changes to light yellow and white precipitate dissolves.
When cool, the sample is diluted to 200 mL with distilled water.
Antimony content is determined by AAS.
Mandalay personnel conduct periodic visits to the Onsite Laboratory in Bendigo and meet regularly
with the laboratory managers. In 2018, visits have been scheduled monthly at the Onsite Laboratory
and quarterly at the Costerfield Operation’s office.
Tours of the laboratory are normally completed in the presence of Onsite’s Laboratory Manager, Mr
Rob Robinson.
Notes and minutes from laboratory visits and meeting with laboratory staff are preserved on the
Mandalay server.
Mandalay conducted check assay programs on July 2018 and October 2018. This process involves
obtaining a pulped sample from Onsite, splitting it, and submitting pulps to three laboratories for
comparison. In 2018, the same samples were sent to Onsite, ALS Global (Orange) and Bureau Veritas
(Perth). The results of the most recent program (October 2018) are outlined in Section 11.7.4.
SRK Consulting Page 79
KENT/WALS/FAIR/EBBE/wulr PLI028_Costerfield Operations_NI-43 101 Technical Report_2018_Rev1 6 February 2019
In total, five standards have been used for quality control in 2018. Three have been made from
material collected from Augusta (MR04/06, MR-C1 and MR-F1), and are routinely submitted to Onsite.
MR04/06, MR-C1 and MR-F1 are Sb and Au only standards. Mandalay also routinely uses a
commercially available, Au-only standard (G310-6) and Sb-Au standard (GSB-02) which Onsite
sources from Geostats Pty Ltd (Geostats). The results are shown in Figure 11-1 to Figure 11-5.
A standard is sent with each batch of exploration samples (on average 1 standard per 25 samples)
and with each batch of the underground face samples (on average 2 different standards per batch).
Results from January 2018 to November 2018 for Au and Sb assays are shown in Figure 11-1 to
Figure 11-9. A standard assay result is considered to be compliant when it falls inside the 3 standard
deviation (SD) limits defined by the standard certification. When a batch fails to comply with the 3 SD
limits defined by the standard certification, all significant assay results from that batch are re-assayed.
Significant assay results are defined as samples that may be used in a future resource estimate. Any
actions or outcomes are recorded as comments on the QA/QC database.
A review of the results shows the following:
Gold (and antimony) standard GSB-02 (CRM assay 23.64 g/t Au) displays good compliance for
the period, with no outliers outside the ±3 SD limits (Figure 11-1). There is a significant drop in
the first third of the period trending to the lower limits of the range and then remains consistent for
the remainder, implying a low bias in the accuracy in the assay results for that period.
Gold standard G310-6 (CRM 0.65 g/t Au) displayed in Figure 11-2 shows good compliance for
2018 with no outliers outside the ±3SD limit. There is a general trend towards the lower limits from
the beginning to the end of the period, indicating a low bias in the accuracy in the assay results
for that period.
Gold (and antimony) standard MR04/06 (CRM assay 7.51 g/t Au) shows excellent compliance for
the period, with no assays outside the ±3SD limits. There is good accuracy in the first half of the
period, but trends towards a high bias, indicating a slight drift in the accuracy in the assay results
for that period (Figure 11-3).
Gold (and antimony) standard MR-C1 (CRM 82.30 g/t Au) displayed in Figure 11-4 shows good
compliance for 2018 with no outliers outside the ±3SD limits. There is also a significant trend from
the lower limits towards the upper limits over the period.
Gold (and antimony) standard MR-F1 (CRM 8.17 g/t Au) displays good compliance for the period,
with four outliers outside the -3SD limits, which is likely to be due to instrument bias (Figure 11-5).
MR-F1 also shows a significant trend from the lower -3SD limit towards the upper +2SD limit.
Antimony standard GSB-02 shown in Figure 11-6 (CRM assay 31.04% Sb) shows excellent
compliance for the period, with no assays outside the ±3SD limits. There is slight high bias over
the period but no significant drift in the accuracy in the assay results and assay values generally
within 1SD limits.
Antimony standard MR04/06 displayed in Figure 11-7(CRM assay 3.50% Sb) shows excellent
compliance for the period, with no assays outside the ±3SD limits. There is no evidence of bias
or but a slight drift in the accuracy in the assay results for the period towards the lower limit, and
assay values generally within 1SD limits.
Antimony standard MR-C1 (CRM assay 53.73% Sb) displayed in Figure 11-8 shows good
compliance for the period, with one assay on the -3SD limit.
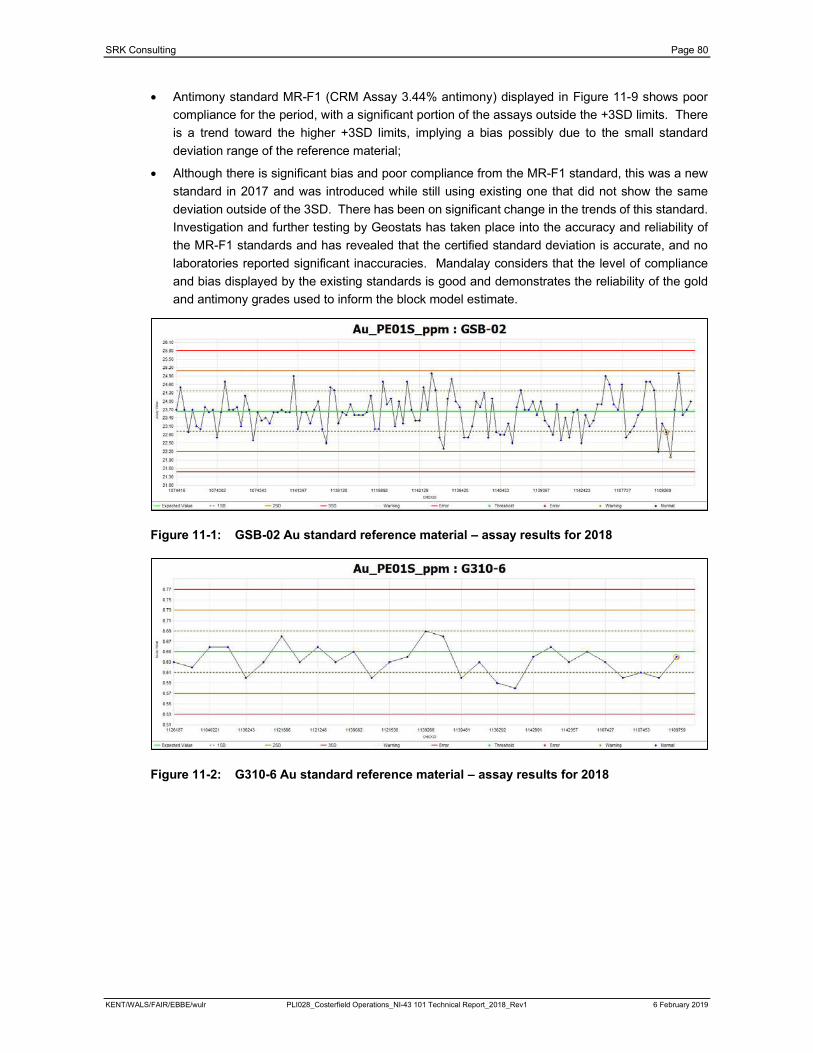
SRK Consulting Page 80
KENT/WALS/FAIR/EBBE/wulr PLI028_Costerfield Operations_NI-43 101 Technical Report_2018_Rev1 6 February 2019
Antimony standard MR-F1 (CRM Assay 3.44% antimony) displayed in Figure 11-9 shows poor
compliance for the period, with a significant portion of the assays outside the +3SD limits. There
is a trend toward the higher +3SD limits, implying a bias possibly due to the small standard
deviation range of the reference material;
Although there is significant bias and poor compliance from the MR-F1 standard, this was a new
standard in 2017 and was introduced while still using existing one that did not show the same
deviation outside of the 3SD. There has been on significant change in the trends of this standard.
Investigation and further testing by Geostats has taken place into the accuracy and reliability of
the MR-F1 standards and has revealed that the certified standard deviation is accurate, and no
laboratories reported significant inaccuracies. Mandalay considers that the level of compliance
and bias displayed by the existing standards is good and demonstrates the reliability of the gold
and antimony grades used to inform the block model estimate.
Figure 11-1: GSB-02 Au standard reference material – assay results for 2018
Figure 11-2: G310-6 Au standard reference material – assay results for 2018
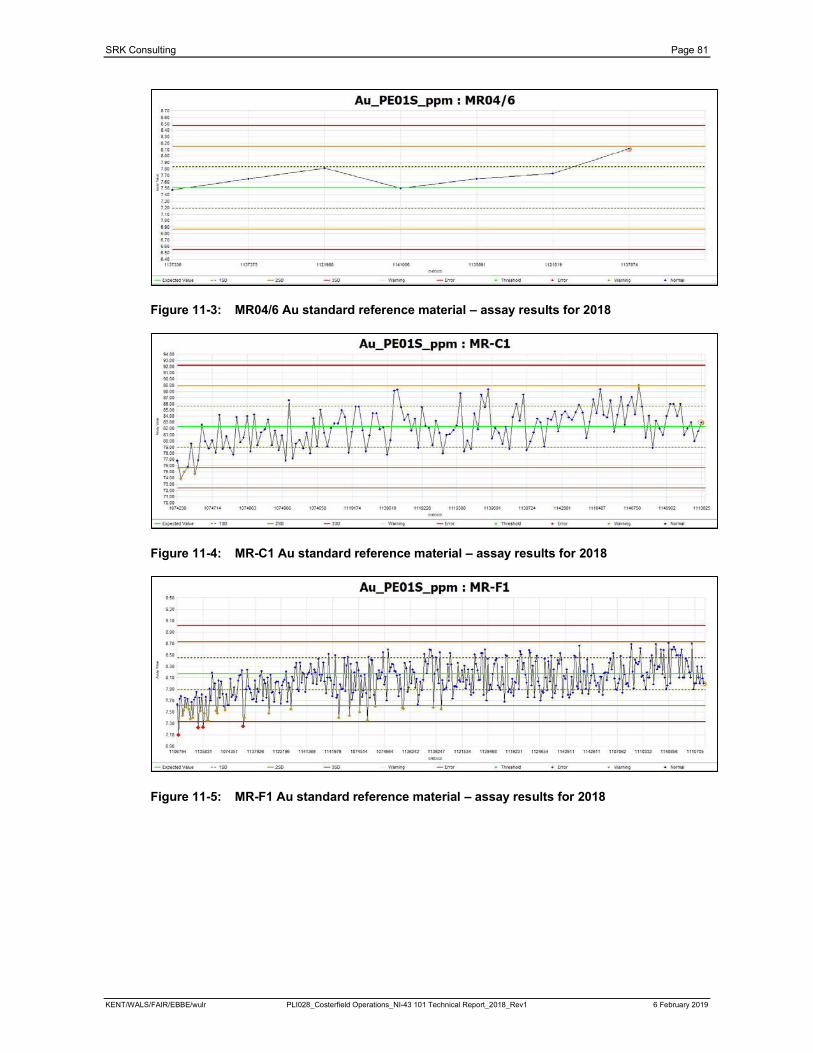
SRK Consulting Page 81
KENT/WALS/FAIR/EBBE/wulr PLI028_Costerfield Operations_NI-43 101 Technical Report_2018_Rev1 6 February 2019
Figure 11-3: MR04/6 Au standard reference material – assay results for 2018
Figure 11-4: MR-C1 Au standard reference material – assay results for 2018
Figure 11-5: MR-F1 Au standard reference material – assay results for 2018
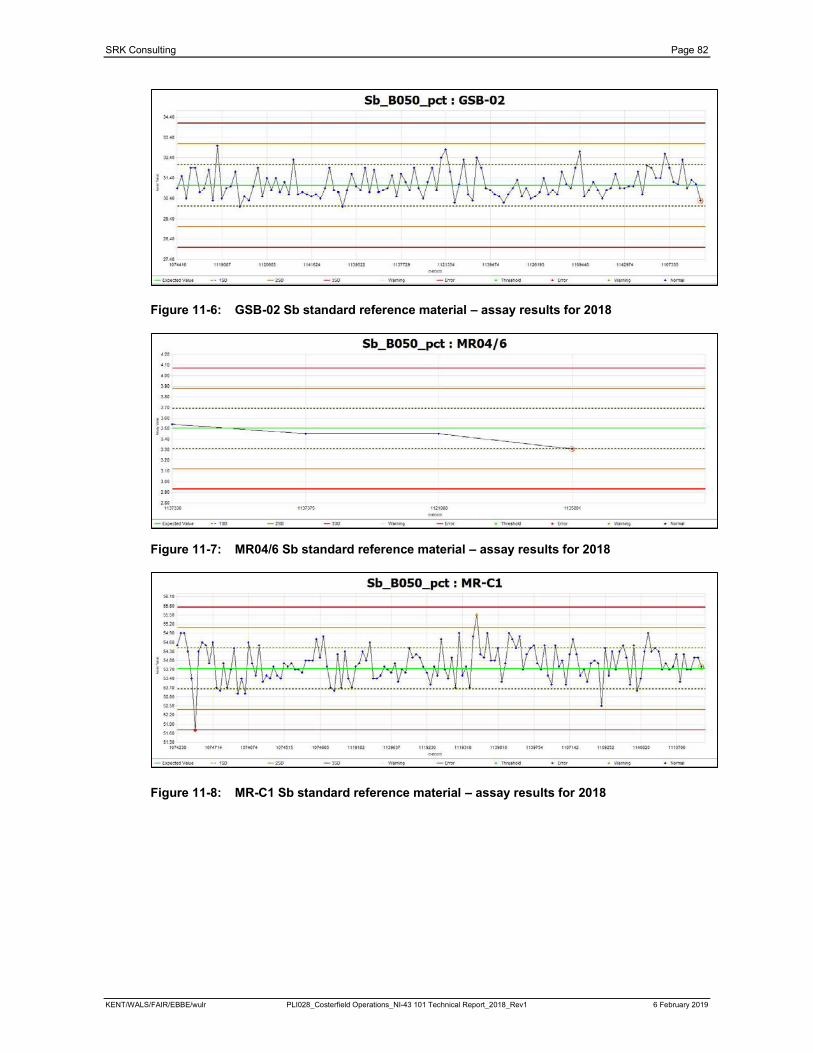
SRK Consulting Page 82
KENT/WALS/FAIR/EBBE/wulr PLI028_Costerfield Operations_NI-43 101 Technical Report_2018_Rev1 6 February 2019
Figure 11-6: GSB-02 Sb standard reference material – assay results for 2018
Figure 11-7: MR04/6 Sb standard reference material – assay results for 2018
Figure 11-8: MR-C1 Sb standard reference material – assay results for 2018
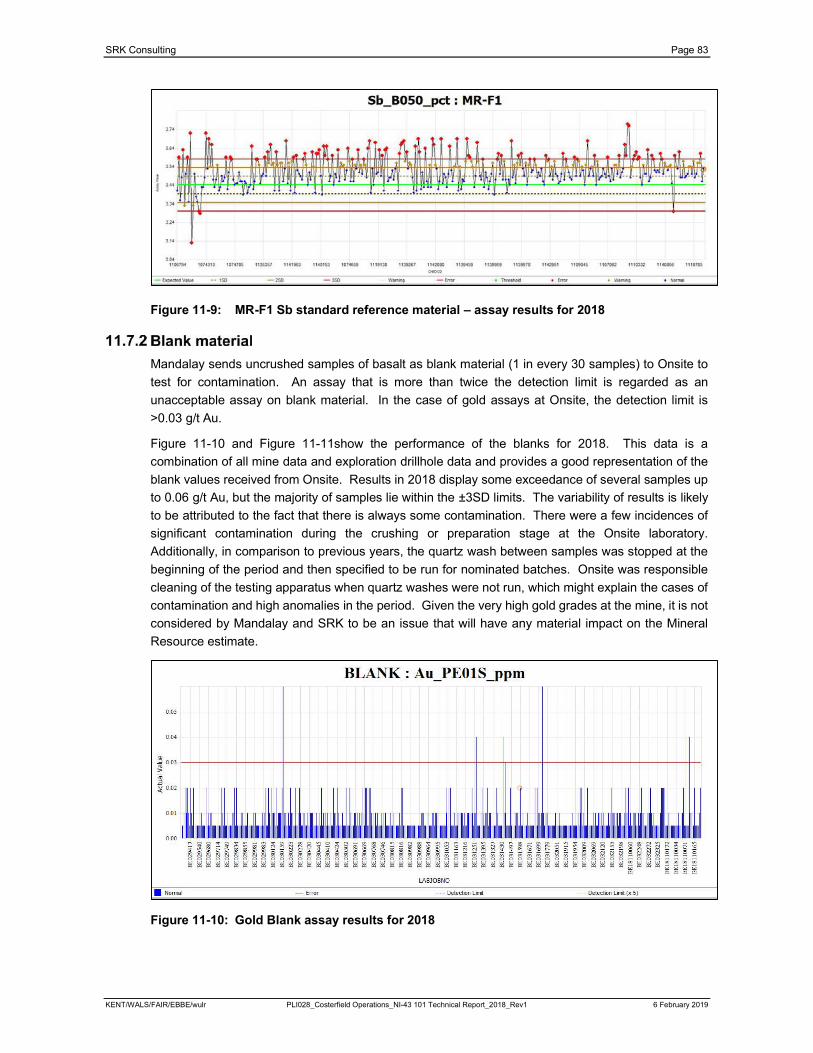
SRK Consulting Page 83
KENT/WALS/FAIR/EBBE/wulr PLI028_Costerfield Operations_NI-43 101 Technical Report_2018_Rev1 6 February 2019
Figure 11-9: MR-F1 Sb standard reference material – assay results for 2018
Mandalay sends uncrushed samples of basalt as blank material (1 in every 30 samples) to Onsite to
test for contamination. An assay that is more than twice the detection limit is regarded as an
unacceptable assay on blank material. In the case of gold assays at Onsite, the detection limit is
>0.03 g/t Au.
Figure 11-10 and Figure 11-11show the performance of the blanks for 2018. This data is a
combination of all mine data and exploration drillhole data and provides a good representation of the
blank values received from Onsite. Results in 2018 display some exceedance of several samples up
to 0.06 g/t Au, but the majority of samples lie within the ±3SD limits. The variability of results is likely
to be attributed to the fact that there is always some contamination. There were a few incidences of
significant contamination during the crushing or preparation stage at the Onsite laboratory.
Additionally, in comparison to previous years, the quartz wash between samples was stopped at the
beginning of the period and then specified to be run for nominated batches. Onsite was responsible
cleaning of the testing apparatus when quartz washes were not run, which might explain the cases of
contamination and high anomalies in the period. Given the very high gold grades at the mine, it is not
considered by Mandalay and SRK to be an issue that will have any material impact on the Mineral
Resource estimate.
Figure 11-10: Gold Blank assay results for 2018
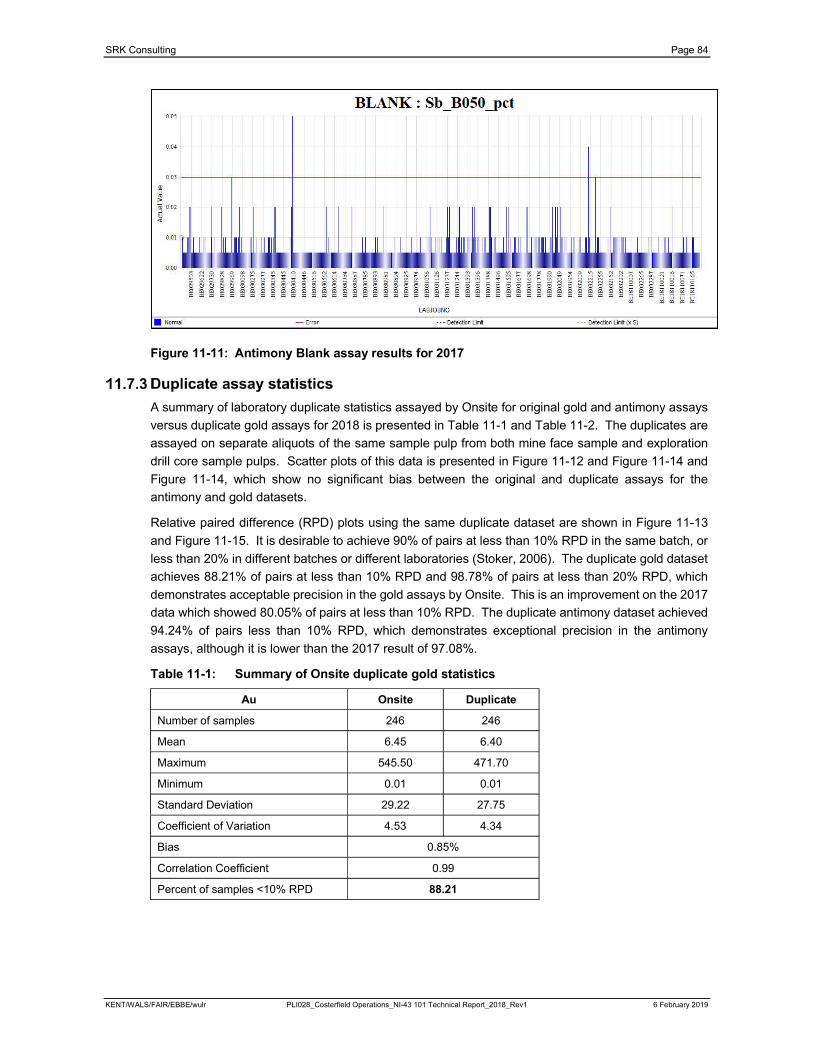
SRK Consulting Page 84
KENT/WALS/FAIR/EBBE/wulr PLI028_Costerfield Operations_NI-43 101 Technical Report_2018_Rev1 6 February 2019
Figure 11-11: Antimony Blank assay results for 2017
A summary of laboratory duplicate statistics assayed by Onsite for original gold and antimony assays
versus duplicate gold assays for 2018 is presented in Table 11-1 and Table 11-2. The duplicates are
assayed on separate aliquots of the same sample pulp from both mine face sample and exploration
drill core sample pulps. Scatter plots of this data is presented in Figure 11-12 and Figure 11-14 and
Figure 11-14, which show no significant bias between the original and duplicate assays for the
antimony and gold datasets.
Relative paired difference (RPD) plots using the same duplicate dataset are shown in Figure 11-13
and Figure 11-15. It is desirable to achieve 90% of pairs at less than 10% RPD in the same batch, or
less than 20% in different batches or different laboratories (Stoker, 2006). The duplicate gold dataset
achieves 88.21% of pairs at less than 10% RPD and 98.78% of pairs at less than 20% RPD, which
demonstrates acceptable precision in the gold assays by Onsite. This is an improvement on the 2017
data which showed 80.05% of pairs at less than 10% RPD. The duplicate antimony dataset achieved
94.24% of pairs less than 10% RPD, which demonstrates exceptional precision in the antimony
assays, although it is lower than the 2017 result of 97.08%.
Table 11-1: Summary of Onsite duplicate gold statistics
Au Onsite Duplicate
Number of samples 246 246
Mean 6.45 6.40
Maximum 545.50 471.70
Minimum 0.01 0.01
Standard Deviation 29.22 27.75
Coefficient of Variation 4.53 4.34
Bias 0.85%
Correlation Coefficient 0.99
Percent of samples <10% RPD 88.21
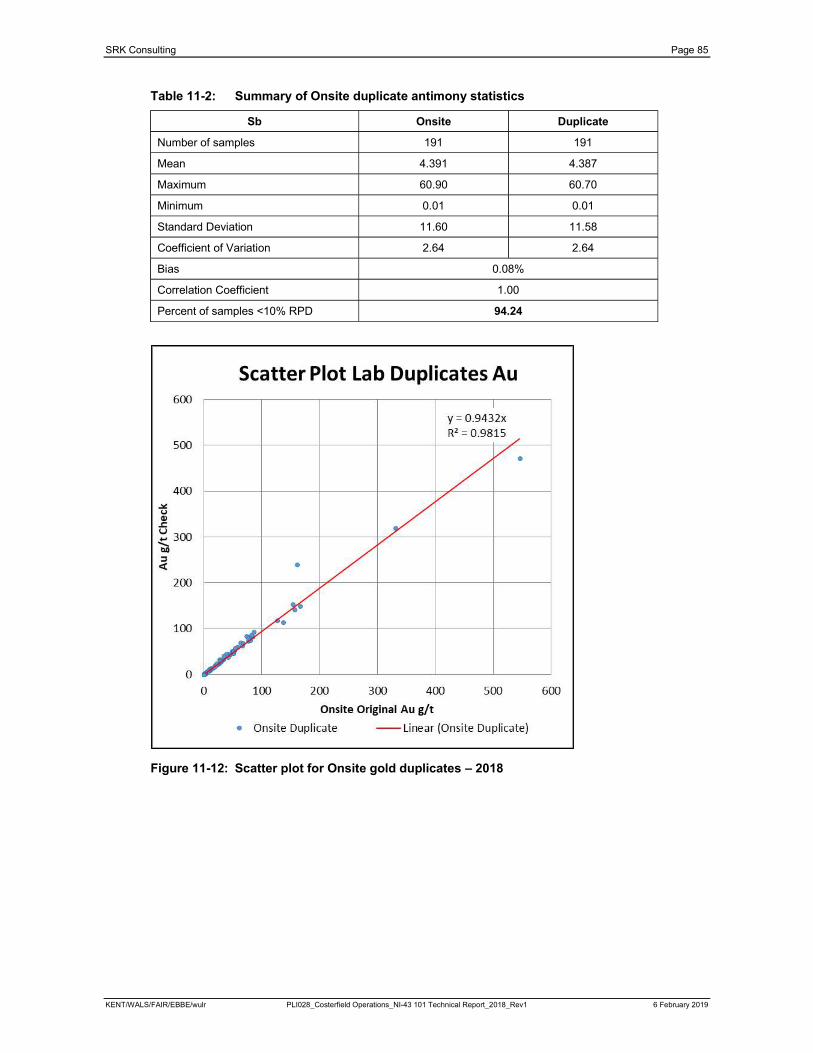
SRK Consulting Page 85
KENT/WALS/FAIR/EBBE/wulr PLI028_Costerfield Operations_NI-43 101 Technical Report_2018_Rev1 6 February 2019
Table 11-2: Summary of Onsite duplicate antimony statistics
Sb Onsite Duplicate
Number of samples 191 191
Mean 4.391 4.387
Maximum 60.90 60.70
Minimum 0.01 0.01
Standard Deviation 11.60 11.58
Coefficient of Variation 2.64 2.64
Bias 0.08%
Correlation Coefficient 1.00
Percent of samples <10% RPD 94.24
Figure 11-12: Scatter plot for Onsite gold duplicates – 2018
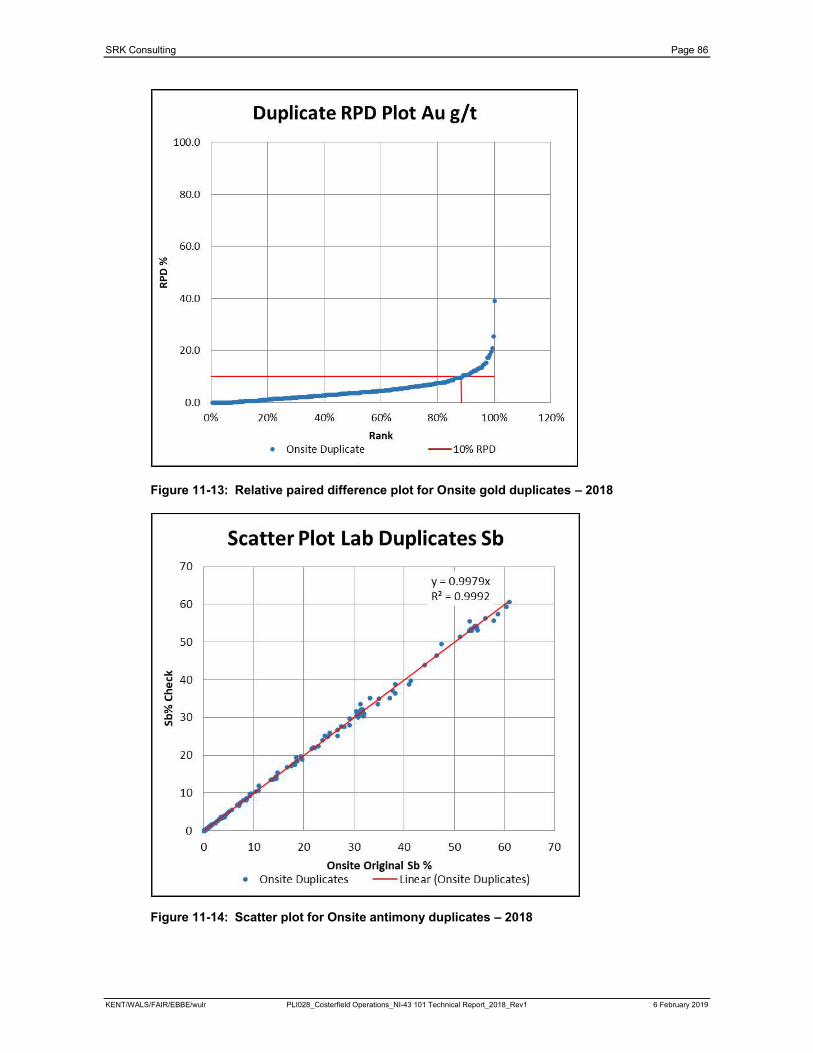
SRK Consulting Page 86
KENT/WALS/FAIR/EBBE/wulr PLI028_Costerfield Operations_NI-43 101 Technical Report_2018_Rev1 6 February 2019
Figure 11-13: Relative paired difference plot for Onsite gold duplicates – 2018
Figure 11-14: Scatter plot for Onsite antimony duplicates – 2018

SRK Consulting Page 87
KENT/WALS/FAIR/EBBE/wulr PLI028_Costerfield Operations_NI-43 101 Technical Report_2018_Rev1 6 February 2019
Figure 11-15: Relative paired difference plot for Onsite antimony duplicates – 2018
Duplicate statistics resulting from a gold and antimony check assay program comparing Onsite, ALS
Minerals (ALS) and Bureau Veritas (BV) assays are presented in Table 11-3 and Table 11-4
respectively. The duplicates are assayed on separate aliquots of the same sample pulp. Two pulp
check assay programs were conducted in 2018, quarter 1 in July 2018 and quarter 2 in October 2018.
Quarter 3 is due to be conducted in December 2018. The results displayed are from the most recent
program, which was undertaken by Mandalay in October 2018.
The gold scatter plot of this data (Figure 11-18) shows a large range of scatter for samples >25 g/t Au,
with the high grades from ALS and BV generally returning lower grades than the Onsite original
sample. The gold RPD plot shows that, on average, 79.33% of duplicate pairs show less than 20%
RPD (Table 11-2) which demonstrates acceptable reproducibility in the gold assays across the
laboratories. The grade comparisons under 25 g/t Au show no significant bias.
ALS and BV both reported lower gold grades than Onsite’s original pulp. This is in contrast with the
November 2017 results where the ALS and BV gold assay results were higher than Onsite and
Onsite’s original. Two standards were included in each check batch, and the gold results are not
indicative of any significant bias between the laboratories. All laboratories reported within the 3SD
range, although ALS and BV both reported slightly lower results than Onsite for gold and antimony in
the two standards.
The antimony statistics show an average bias of -0.5%, with BV reporting slightly higher Sb grades
and ALS reporting slightly lower Sb grades than Onsite for samples >15% Sb. This is also in contrast
with the results from November 2017 where the BV results were lower, and the ALS results were
higher. Onsite’s higher RPD compared to the ALS and BV results can be contributed to greater
experience with antimony samples as ALS and BV have tailored their methods for Costerfield’s
purposes. The antimony RPD plot (from samples from all laboratories) shows that approximately
89.33% of duplicate pairs show less than 20% RPD (Figure 11-17), which demonstrates reasonable
reproducibility across laboratories. This is an improvement from the 2017 average of 85%.
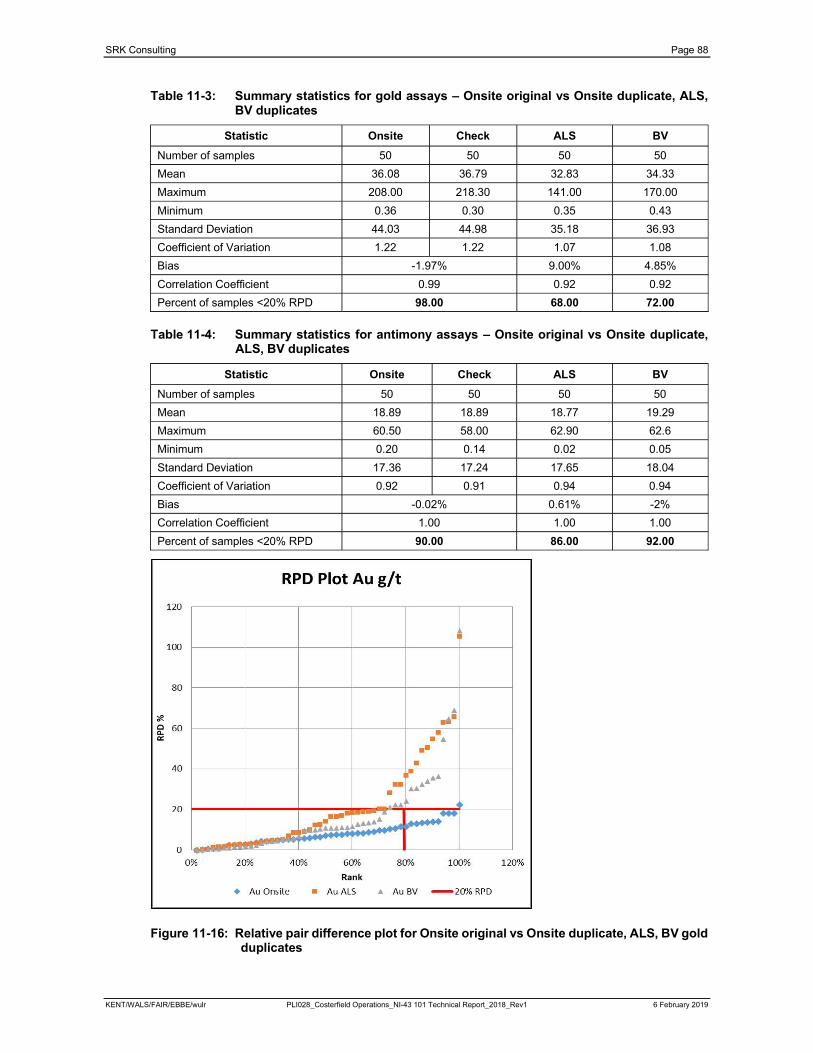
SRK Consulting Page 88
KENT/WALS/FAIR/EBBE/wulr PLI028_Costerfield Operations_NI-43 101 Technical Report_2018_Rev1 6 February 2019
Table 11-3: Summary statistics for gold assays – Onsite original vs Onsite duplicate, ALS, BV duplicates
Statistic Onsite Check ALS BV
Number of samples 50 50 50 50
Mean 36.08 36.79 32.83 34.33
Maximum 208.00 218.30 141.00 170.00
Minimum 0.36 0.30 0.35 0.43
Standard Deviation 44.03 44.98 35.18 36.93
Coefficient of Variation 1.22 1.22 1.07 1.08
Bias -1.97% 9.00% 4.85%
Correlation Coefficient 0.99 0.92 0.92
Percent of samples <20% RPD 98.00 68.00 72.00
Table 11-4: Summary statistics for antimony assays – Onsite original vs Onsite duplicate, ALS, BV duplicates
Statistic Onsite Check ALS BV
Number of samples 50 50 50 50
Mean 18.89 18.89 18.77 19.29
Maximum 60.50 58.00 62.90 62.6
Minimum 0.20 0.14 0.02 0.05
Standard Deviation 17.36 17.24 17.65 18.04
Coefficient of Variation 0.92 0.91 0.94 0.94
Bias -0.02% 0.61% -2%
Correlation Coefficient 1.00 1.00 1.00
Percent of samples <20% RPD 90.00 86.00 92.00
Figure 11-16: Relative pair difference plot for Onsite original vs Onsite duplicate, ALS, BV gold duplicates
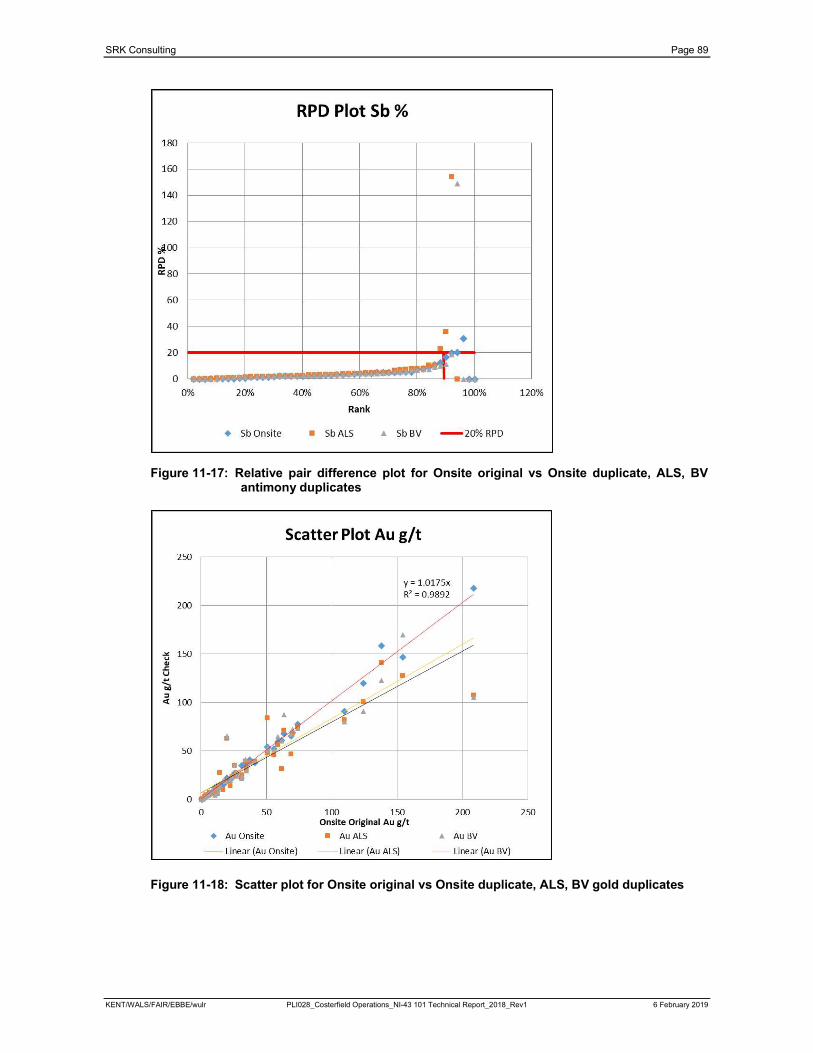
SRK Consulting Page 89
KENT/WALS/FAIR/EBBE/wulr PLI028_Costerfield Operations_NI-43 101 Technical Report_2018_Rev1 6 February 2019
Figure 11-17: Relative pair difference plot for Onsite original vs Onsite duplicate, ALS, BV antimony duplicates
Figure 11-18: Scatter plot for Onsite original vs Onsite duplicate, ALS, BV gold duplicates
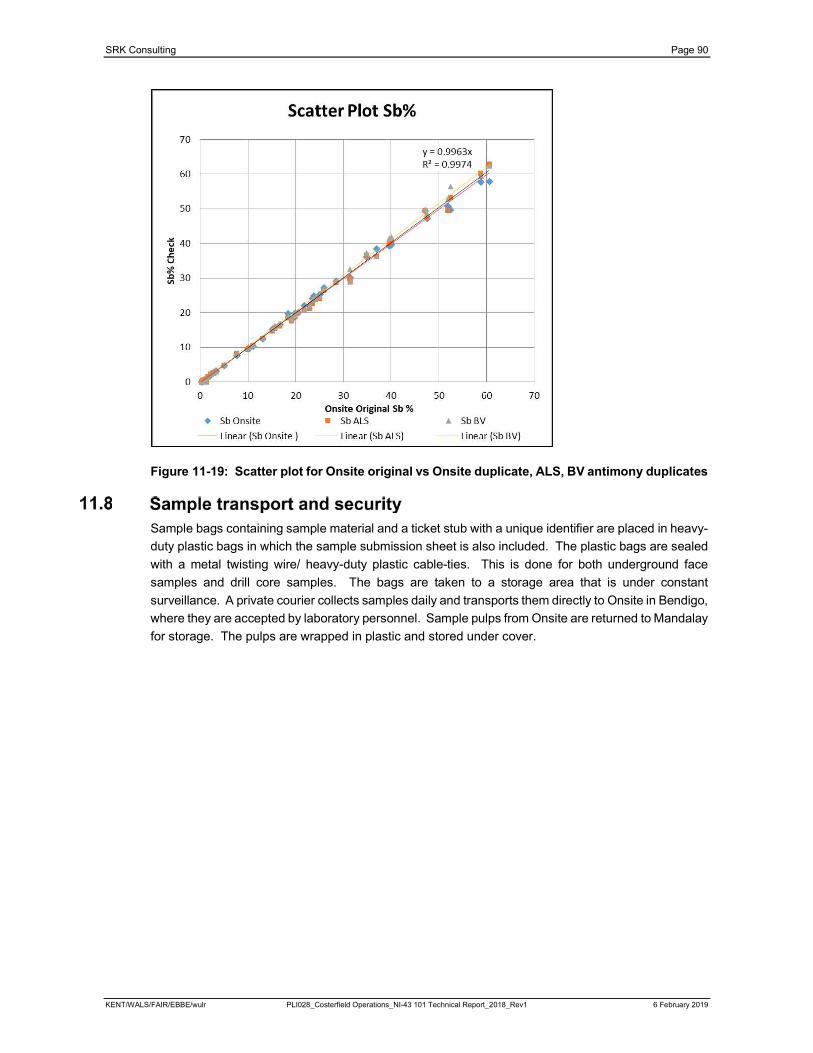
SRK Consulting Page 90
KENT/WALS/FAIR/EBBE/wulr PLI028_Costerfield Operations_NI-43 101 Technical Report_2018_Rev1 6 February 2019
Figure 11-19: Scatter plot for Onsite original vs Onsite duplicate, ALS, BV antimony duplicates
Sample bags containing sample material and a ticket stub with a unique identifier are placed in heavy-
duty plastic bags in which the sample submission sheet is also included. The plastic bags are sealed
with a metal twisting wire/ heavy-duty plastic cable-ties. This is done for both underground face
samples and drill core samples. The bags are taken to a storage area that is under constant
surveillance. A private courier collects samples daily and transports them directly to Onsite in Bendigo,
where they are accepted by laboratory personnel. Sample pulps from Onsite are returned to Mandalay
for storage. The pulps are wrapped in plastic and stored under cover.
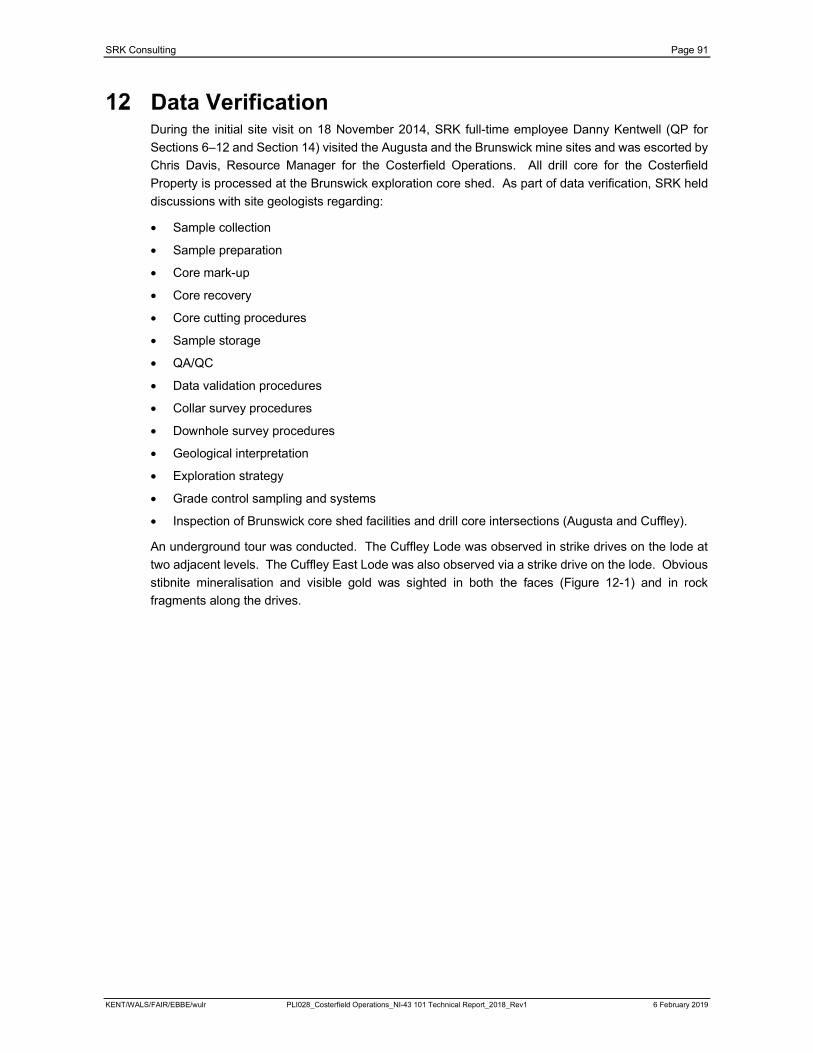
SRK Consulting Page 91
KENT/WALS/FAIR/EBBE/wulr PLI028_Costerfield Operations_NI-43 101 Technical Report_2018_Rev1 6 February 2019
During the initial site visit on 18 November 2014, SRK full-time employee Danny Kentwell (QP for
Sections 6–12 and Section 14) visited the Augusta and the Brunswick mine sites and was escorted by
Chris Davis, Resource Manager for the Costerfield Operations. All drill core for the Costerfield
Property is processed at the Brunswick exploration core shed. As part of data verification, SRK held
discussions with site geologists regarding:
Sample collection
Sample preparation
Core mark-up
Core recovery
Core cutting procedures
Sample storage
QA/QC
Data validation procedures
Collar survey procedures
Downhole survey procedures
Geological interpretation
Exploration strategy
Grade control sampling and systems
Inspection of Brunswick core shed facilities and drill core intersections (Augusta and Cuffley).
An underground tour was conducted. The Cuffley Lode was observed in strike drives on the lode at
two adjacent levels. The Cuffley East Lode was also observed via a strike drive on the lode. Obvious
stibnite mineralisation and visible gold was sighted in both the faces (Figure 12-1) and in rock
fragments along the drives.
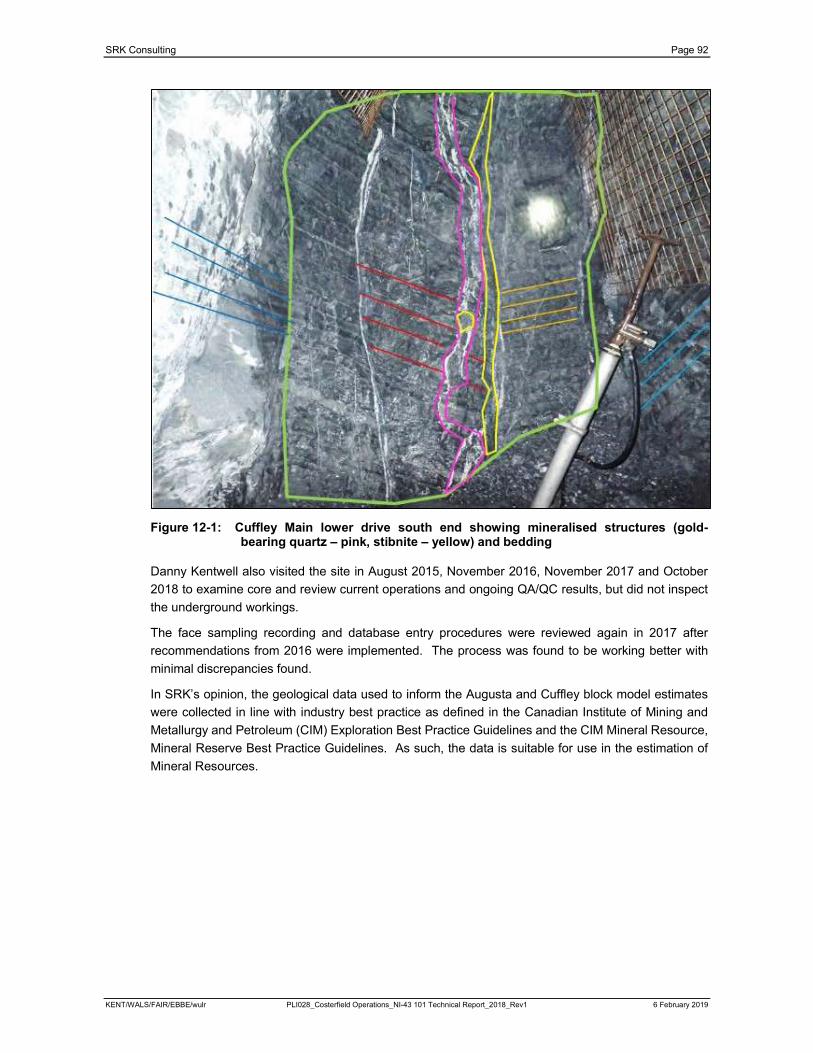
SRK Consulting Page 92
KENT/WALS/FAIR/EBBE/wulr PLI028_Costerfield Operations_NI-43 101 Technical Report_2018_Rev1 6 February 2019
Figure 12-1: Cuffley Main lower drive south end showing mineralised structures (gold-bearing quartz – pink, stibnite – yellow) and bedding
Danny Kentwell also visited the site in August 2015, November 2016, November 2017 and October
2018 to examine core and review current operations and ongoing QA/QC results, but did not inspect
the underground workings.
The face sampling recording and database entry procedures were reviewed again in 2017 after
recommendations from 2016 were implemented. The process was found to be working better with
minimal discrepancies found.
In SRK’s opinion, the geological data used to inform the Augusta and Cuffley block model estimates
were collected in line with industry best practice as defined in the Canadian Institute of Mining and
Metallurgy and Petroleum (CIM) Exploration Best Practice Guidelines and the CIM Mineral Resource,
Mineral Reserve Best Practice Guidelines. As such, the data is suitable for use in the estimation of
Mineral Resources.
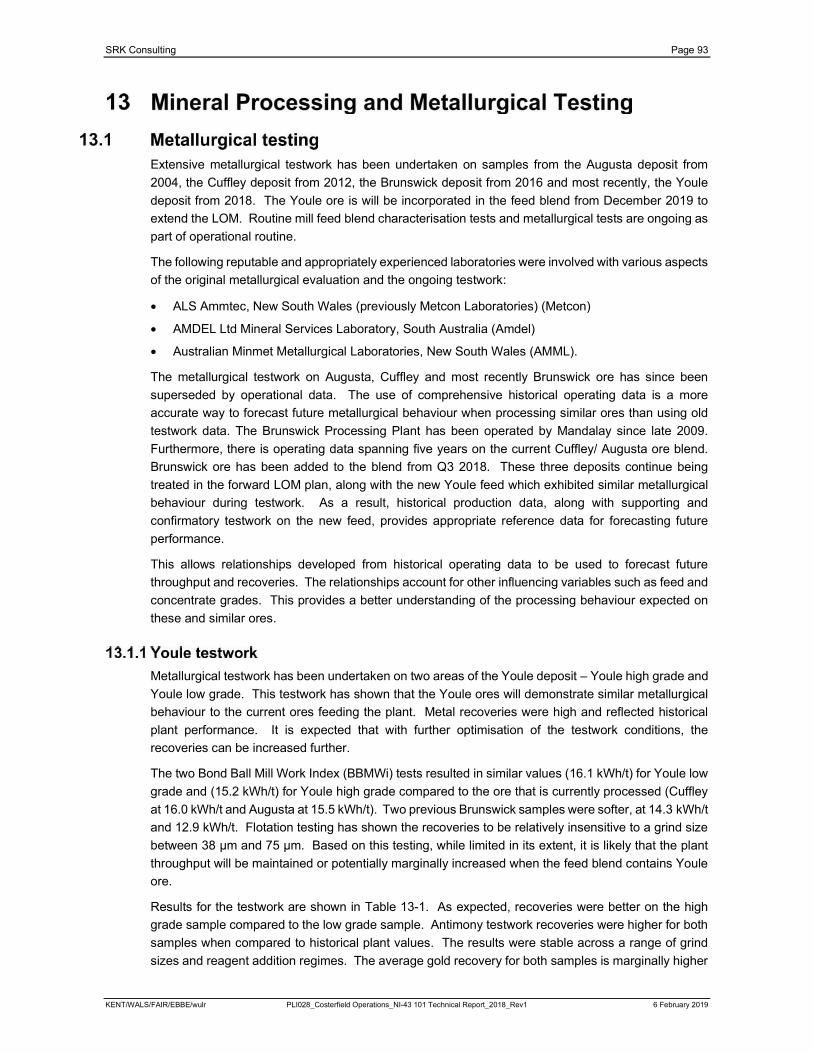
SRK Consulting Page 93
KENT/WALS/FAIR/EBBE/wulr PLI028_Costerfield Operations_NI-43 101 Technical Report_2018_Rev1 6 February 2019
Extensive metallurgical testwork has been undertaken on samples from the Augusta deposit from
2004, the Cuffley deposit from 2012, the Brunswick deposit from 2016 and most recently, the Youle
deposit from 2018. The Youle ore is will be incorporated in the feed blend from December 2019 to
extend the LOM. Routine mill feed blend characterisation tests and metallurgical tests are ongoing as
part of operational routine.
The following reputable and appropriately experienced laboratories were involved with various aspects
of the original metallurgical evaluation and the ongoing testwork:
ALS Ammtec, New South Wales (previously Metcon Laboratories) (Metcon)
AMDEL Ltd Mineral Services Laboratory, South Australia (Amdel)
Australian Minmet Metallurgical Laboratories, New South Wales (AMML).
The metallurgical testwork on Augusta, Cuffley and most recently Brunswick ore has since been
superseded by operational data. The use of comprehensive historical operating data is a more
accurate way to forecast future metallurgical behaviour when processing similar ores than using old
testwork data. The Brunswick Processing Plant has been operated by Mandalay since late 2009.
Furthermore, there is operating data spanning five years on the current Cuffley/ Augusta ore blend.
Brunswick ore has been added to the blend from Q3 2018. These three deposits continue being
treated in the forward LOM plan, along with the new Youle feed which exhibited similar metallurgical
behaviour during testwork. As a result, historical production data, along with supporting and
confirmatory testwork on the new feed, provides appropriate reference data for forecasting future
performance.
This allows relationships developed from historical operating data to be used to forecast future
throughput and recoveries. The relationships account for other influencing variables such as feed and
concentrate grades. This provides a better understanding of the processing behaviour expected on
these and similar ores.
Metallurgical testwork has been undertaken on two areas of the Youle deposit – Youle high grade and
Youle low grade. This testwork has shown that the Youle ores will demonstrate similar metallurgical
behaviour to the current ores feeding the plant. Metal recoveries were high and reflected historical
plant performance. It is expected that with further optimisation of the testwork conditions, the
recoveries can be increased further.
The two Bond Ball Mill Work Index (BBMWi) tests resulted in similar values (16.1 kWh/t) for Youle low
grade and (15.2 kWh/t) for Youle high grade compared to the ore that is currently processed (Cuffley
at 16.0 kWh/t and Augusta at 15.5 kWh/t). Two previous Brunswick samples were softer, at 14.3 kWh/t
and 12.9 kWh/t. Flotation testing has shown the recoveries to be relatively insensitive to a grind size
between 38 µm and 75 µm. Based on this testing, while limited in its extent, it is likely that the plant
throughput will be maintained or potentially marginally increased when the feed blend contains Youle
ore.
Results for the testwork are shown in Table 13-1. As expected, recoveries were better on the high
grade sample compared to the low grade sample. Antimony testwork recoveries were higher for both
samples when compared to historical plant values. The results were stable across a range of grind
sizes and reagent addition regimes. The average gold recovery for both samples is marginally higher

SRK Consulting Page 94
KENT/WALS/FAIR/EBBE/wulr PLI028_Costerfield Operations_NI-43 101 Technical Report_2018_Rev1 6 February 2019
than historical production records. To adopt a more conservative position, these results will be
discounted back to historical plant recovery levels for forecasting purposes. The gravity gold recovery
has been increased slightly in the LOM model to 40% (from 36.5%) to account for the higher blend of
Cuffley and Youle ore. This is discussed in detail in Section 13.4 (Recovery).
Compared to previously tested Brunswick ore, the Youle ore has lower arsenic grades than historical
levels and elevated arsenic grades in the antimony-gold concentrate are not considered to be an issue.
In the current take-off agreement, there are no penalties for arsenic below 0.5% As in the concentrate.
Arsenic grades between 0.5%–2.0% incur a penalty of USD2/t concentrate for each 0.1% above 2.0%.
This increases to USD2.5/t between 2.0% arsenic and 3.0%, but even with higher arsenic grade, the
product remains saleable. As a gold/antimony concentrate, it is not subject to the same arsenic grade
importation limits that are imposed on base metal concentrates. With proper management, the
penalties for deleterious elements can be minimised but are not considered a risk to the overall project.
The LOM plan from 2019 onwards shows the feed split is Augusta 11%, Cuffley 11%, Brunswick 29%
and 50% Youle, and it will be possible to manage the arsenic grade in the concentrate. Blending of
mill feed (ore from different mining areas) will enable arsenic grades to be kept to target levels. The
2018 processing of Brunswick ore has not shown arsenic in concentrate to be an issue. However,
blends of up to 30% Brunswick ore have been processed, mostly from the lower section (Penguin to
Kiwi) which had less arsenic than in the higher levels. Brunswick ore will provide the majority of the
ore for periods of 2019 and early 2020 and this has been accounted for in the LOM plan and financial
model by applying a minor arsenic in concentrate penalty for a worst-case scenario.
Table 13-1: Brunswick samples vs current operational data
VariableCurrent
operationBrunswick
Main
Brunswick Penguin to
Kiwi
Cuffley LG 0358-1
Cuffley HG
M2569
Youle low
grade
Youle high
grade
BBMWi 15.5–16.0 12.9 14.3 16.0 16.0 16.1 15.2
Feed Au g/t 9.2* 8.65 11.9 9.0 17.7 4.89 13
Feed Sb % 3.5* 3.31 3.88 3.00 7.98 2.56 5.1
Feed As % 0.06* 0.50 0.13 0.12 0.07 0.02 0.03
Concentrate As % 0.20 3.20 0.87 0.98 0.002 0.22 0.25
Gravity Au Recovery % 36.8* 22.1–25.5 30.0 41 54 43 57
Recovery Au % 90.0* 87.1 93.7 98 95 96 97
Recovery Sb % 95.4* 98.3 99 99 95 99 99
Note: * 2016–2017 data.
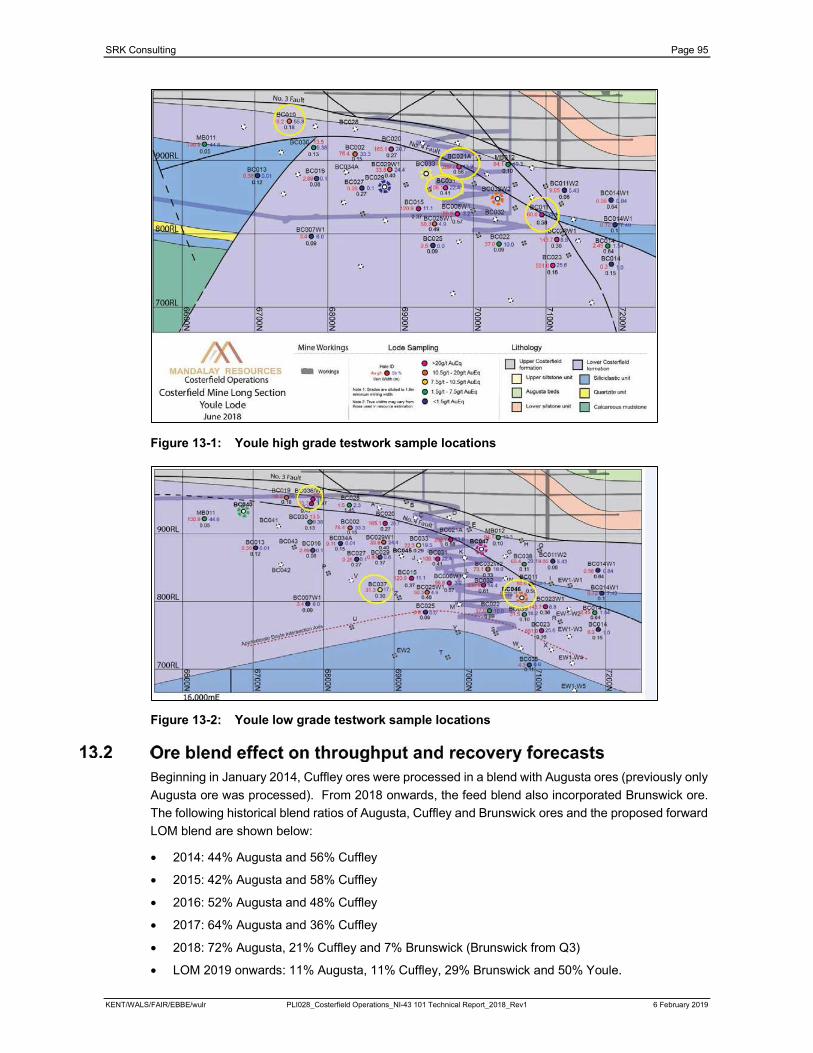
SRK Consulting Page 95
KENT/WALS/FAIR/EBBE/wulr PLI028_Costerfield Operations_NI-43 101 Technical Report_2018_Rev1 6 February 2019
Figure 13-1: Youle high grade testwork sample locations
Figure 13-2: Youle low grade testwork sample locations
Beginning in January 2014, Cuffley ores were processed in a blend with Augusta ores (previously only
Augusta ore was processed). From 2018 onwards, the feed blend also incorporated Brunswick ore.
The following historical blend ratios of Augusta, Cuffley and Brunswick ores and the proposed forward
LOM blend are shown below:
2014: 44% Augusta and 56% Cuffley
2015: 42% Augusta and 58% Cuffley
2016: 52% Augusta and 48% Cuffley
2017: 64% Augusta and 36% Cuffley
2018: 72% Augusta, 21% Cuffley and 7% Brunswick (Brunswick from Q3)
LOM 2019 onwards: 11% Augusta, 11% Cuffley, 29% Brunswick and 50% Youle.

SRK Consulting Page 96
KENT/WALS/FAIR/EBBE/wulr PLI028_Costerfield Operations_NI-43 101 Technical Report_2018_Rev1 6 February 2019
Throughput and recovery data from 2014 to 2018 is reflective of that expected in 2019 onwards, given
the similar (marginally superior) performance of the Youle samples in testwork, and the forecast ore
blend to be processed in the forward LOM plan. This assumes ores of similar lithology and oxidation
state operating under similar processing conditions and feed grades.
Forecast throughput used for future LOM planning is based on historical throughput. This is the best
method of forecasting throughput on a similar or comparable ore blend. More specifically, the
throughput over 2014–2018 has been used to forecast the forward LOM plan.
Several processing plant upgrades have seen production throughput increase from approximately
2,000 t/month in 2007 to approximately 10,000 t/month in 2012. Since then, through ongoing
optimisation and minor, low capital cost debottlenecking projects, the capacity has been increased to
the current 2016–2018 capacity which can consistently exceed 13,000 t/month and regularly
approaches 14,000 t/month. This is shown in Figure 13-3 and Figure 13-4.
Figure 13-3: Historical Brunswick processing plant throughput – Apr 2007 to Dec 2018
Figure 13-4: Historical Brunswick processing plant throughput – Jan 2012 to Dec 2018
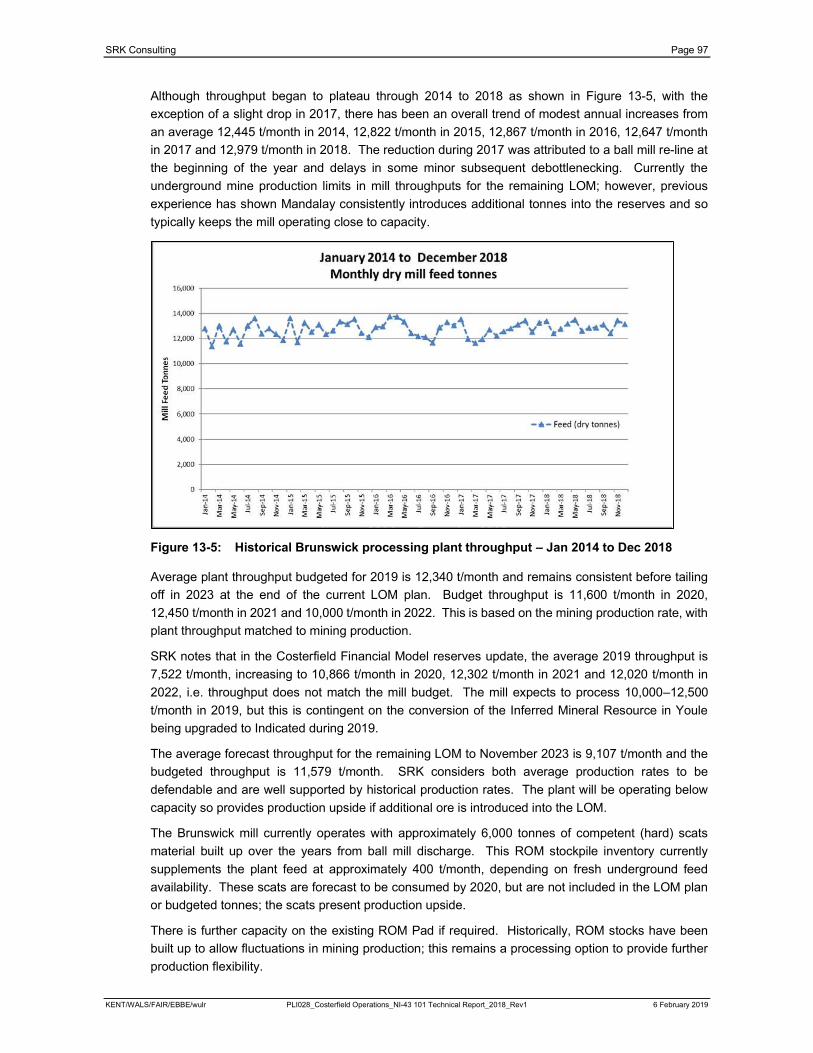
SRK Consulting Page 97
KENT/WALS/FAIR/EBBE/wulr PLI028_Costerfield Operations_NI-43 101 Technical Report_2018_Rev1 6 February 2019
Although throughput began to plateau through 2014 to 2018 as shown in Figure 13-5, with the
exception of a slight drop in 2017, there has been an overall trend of modest annual increases from
an average 12,445 t/month in 2014, 12,822 t/month in 2015, 12,867 t/month in 2016, 12,647 t/month
in 2017 and 12,979 t/month in 2018. The reduction during 2017 was attributed to a ball mill re-line at
the beginning of the year and delays in some minor subsequent debottlenecking. Currently the
underground mine production limits in mill throughputs for the remaining LOM; however, previous
experience has shown Mandalay consistently introduces additional tonnes into the reserves and so
typically keeps the mill operating close to capacity.
Figure 13-5: Historical Brunswick processing plant throughput – Jan 2014 to Dec 2018
Average plant throughput budgeted for 2019 is 12,340 t/month and remains consistent before tailing
off in 2023 at the end of the current LOM plan. Budget throughput is 11,600 t/month in 2020,
12,450 t/month in 2021 and 10,000 t/month in 2022. This is based on the mining production rate, with
plant throughput matched to mining production.
SRK notes that in the Costerfield Financial Model reserves update, the average 2019 throughput is
7,522 t/month, increasing to 10,866 t/month in 2020, 12,302 t/month in 2021 and 12,020 t/month in
2022, i.e. throughput does not match the mill budget. The mill expects to process 10,000–12,500
t/month in 2019, but this is contingent on the conversion of the Inferred Mineral Resource in Youle
being upgraded to Indicated during 2019.
The average forecast throughput for the remaining LOM to November 2023 is 9,107 t/month and the
budgeted throughput is 11,579 t/month. SRK considers both average production rates to be
defendable and are well supported by historical production rates. The plant will be operating below
capacity so provides production upside if additional ore is introduced into the LOM.
The Brunswick mill currently operates with approximately 6,000 tonnes of competent (hard) scats
material built up over the years from ball mill discharge. This ROM stockpile inventory currently
supplements the plant feed at approximately 400 t/month, depending on fresh underground feed
availability. These scats are forecast to be consumed by 2020, but are not included in the LOM plan
or budgeted tonnes; the scats present production upside.
There is further capacity on the existing ROM Pad if required. Historically, ROM stocks have been
built up to allow fluctuations in mining production; this remains a processing option to provide further
production flexibility.

SRK Consulting Page 98
KENT/WALS/FAIR/EBBE/wulr PLI028_Costerfield Operations_NI-43 101 Technical Report_2018_Rev1 6 February 2019
Forecast antimony and gold recoveries used for LOM planning and economic modelling are based on
feed grades, historical recoveries and concentrate grade relationships developed from historical
production data. This is the best method of forecasting throughput on the same ore blend. More
specifically, the historical recoveries over 2014–2018 have been used for forecasting the forward LOM
plan. With the addition of the Youle ores into the LOM plan, additional confirmatory testwork has been
undertaken to ensure the behaviour of the new addition to the feed blend.
The grade versus recovery relationship from January 2014 to December 2018 is shown in Figure 13-6.
There is a relationship between the head grade and the recovery for both gold and antimony. This is
a common phenomenon across flotation type concentrators and is a consequence of a (relatively)
constant tail grade. The 2015–2018 gold grade versus recovery data is stronger than 2014 due to
operational changes. Historical data also shows a general robustness of recovery to a reduction in
feed grade, particularly with respect to the gold recovery where the gold feed grade has been lower
over the last few years.
Figure 13-6: Cuffley/Augusta and Brunswick blend – feed grade vs recoveries: 2014–2018
An antimony recovery relationship was developed based on the interaction between the feed head
grade, concentrate grade and recovery using historical operating data. This was updated in 2018
using the daily 2015 to mid-2018 operating data. The relationship used to develop the Sb recovery
algorithm has a strong correlation coefficient, demonstrating a high degree of confidence in the
forecast recovery. It is supported by the consistently high annual recoveries achieved, even with
varying feed grade, as well as by the latest Youle ore testwork.
The recent historical and forecast Sb mass weighted recoveries for the LOM are listed below:
2015 actual Sb recovery = 95.1% at a 4.0% Sb feed grade
2016 actual Sb recovery = 95.4% at a 3.7% Sb feed grade
2017 actual Sb recovery = 95.3% at a 3.3% Sb feed grade
2018 actual Sb recovery = 93.8% at a 2.3% Sb feed grade
LOM model (2019–2023) = 94.5% Sb recovery at a 3.3% Sb feed grade.
SRK Consulting Page 99
KENT/WALS/FAIR/EBBE/wulr PLI028_Costerfield Operations_NI-43 101 Technical Report_2018_Rev1 6 February 2019
Because of the confidence in this relationship, across a range of feed grades, it provides the best
means of estimating the antimony recovery at variable head grades, assuming a constant final Sb
concentrate grade of 52.5%, the value used in the LOM plan. SRK notes that the average concentrate
Sb grade dropped marginally to 52.4% in 2017 and was maintained at 52.21% in 2018 due to a lower
feed grade, in order to maintain recovery. A marginally lower concentrate grade will be targeted in the
LOM plan for the same reason.
The data for 2018 has been assessed in the same recovery model and supports the ongoing use of
the formula, with a high correlation co-efficient maintained. This formula is used in the LOM model to
predict the Sb recovery for a given head grade for the remaining LOM. SRK notes that the average
Sb head grade is lower for the remaining LOM; however, it is still strongly supported by the model as
well as the 2017 recovery which was higher than that forecast, at the same feed grade. SRK has a
high degree of confidence in the forecast LOM Sb recoveries.
Using the daily 2016–2018 operating data, a similar gold recovery relationship was developed for the
gold reporting to the Sb and Au concentrate based on the interaction between the flotation feed grade,
concentrate grade and recovery. It also has a strong correlation coefficient. However, the flotation
recovery only makes up part of the overall gold recovery as typically 30%–40 % reports to the gravity
gold concentrate. The gravity gold recovery has a relatively high level of variability, which makes
application of the flotation gold recovery relationship to forecast the overall gold recovery a
complicated exercise.
Overall, gold recovery appears to be independent of the gravity recovery, i.e. the flotation circuit is
efficient at recovering what the gravity gold circuit has not recovered. This was well demonstrated in
2015 when a drop in gravity recovery, which corresponded with an increase in feed grade (likely due
to changes in mineralogy and/ or finer gold as well as low grade ore being fed into the blend), was
offset by higher flotation gold recovery.
A number of alternative gold recovery relationships have been assessed. A strong relationship is
evident for the gold feed grade versus tailings grade, particularly in the 2016 and 2018 calendar years.
The tailings grade for 2016–2018 is relatively consistent ranging between 0.55 g/t Au to 1.25 g/t Au
on a monthly basis, depending on the gold feed grade and with a consistent drop in tailings gold grade,
year on year. Based on the relationship between reconciled monthly feed and tails gold grades, a
relationship was formulated to calculate gold recovery for the LOM model, updated to mid-2018, which
was used for the 2019 LOM forecasting:
Gold recovery (%) = ((head grade-(0.0644*head grade+0.3906))/head grade)*100.
A fixed gravity gold component of 40% is then subtracted from the overall recovery to allow the gravity
and flotation gold recoveries to be separated. This value is also based on historical data, 35.7% in
2016 and 37.4% in 2017, 34.4% in 2018 and averaging 37.2% for the last eight months of 2018 due
to improvements in the processing of gravity gold.
The 2015–2018 historical gold recovery data used to forecast the LOM recovery is provided below:
2015 actual – Total gold recovery of 89.8% and gravity recovery of 34.0% on 10.7 g/t Au head
grade (resultant tailings grade of 1.17 g/t Au and flotation recovery of 55.8%)
2016 actual – Total gold recovery of 90.1% and gravity recovery of 35.7% on 10.3 g/t Au head
grade (resultant tailings grade of 1.08 g/t Au and flotation recovery of 54.3%)
2017 actual – Total gold recovery of 89.8% and gravity recovery of 37.4% on 8.2 g/t Au head
grade (resultant tailings grade of 0.90 g/t Au and flotation recovery of 52.4%)
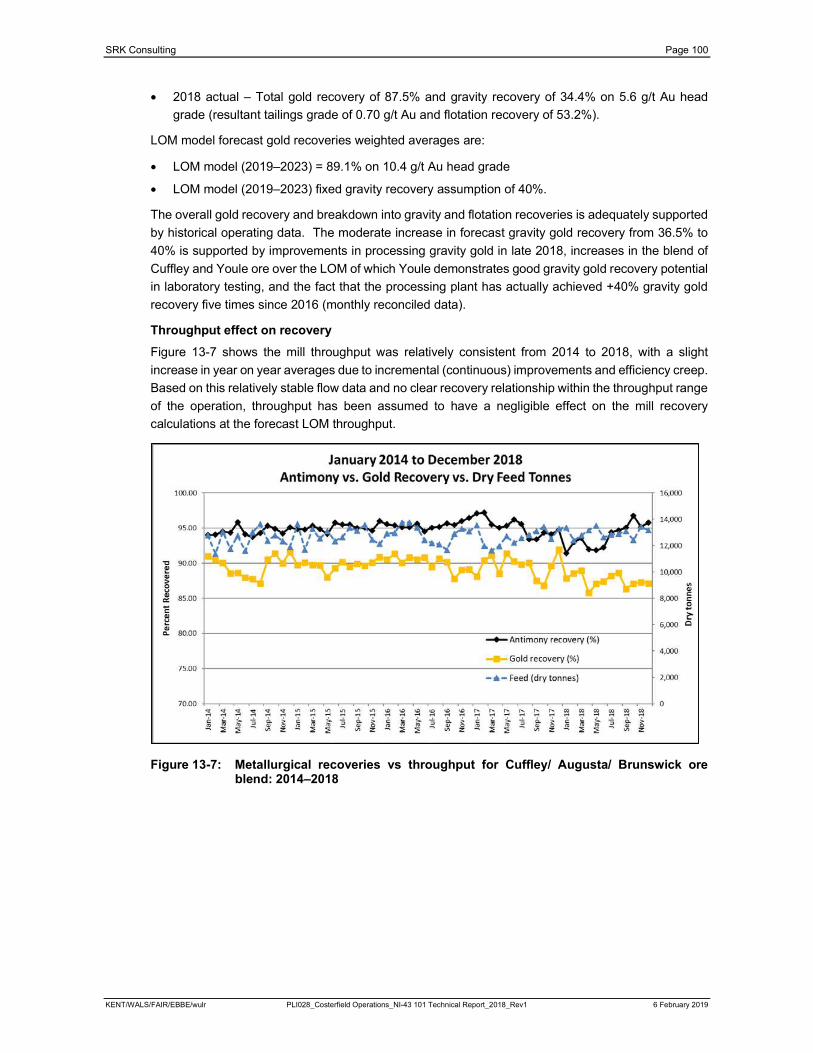
SRK Consulting Page 100
KENT/WALS/FAIR/EBBE/wulr PLI028_Costerfield Operations_NI-43 101 Technical Report_2018_Rev1 6 February 2019
2018 actual – Total gold recovery of 87.5% and gravity recovery of 34.4% on 5.6 g/t Au head
grade (resultant tailings grade of 0.70 g/t Au and flotation recovery of 53.2%).
LOM model forecast gold recoveries weighted averages are:
LOM model (2019–2023) = 89.1% on 10.4 g/t Au head grade
LOM model (2019–2023) fixed gravity recovery assumption of 40%.
The overall gold recovery and breakdown into gravity and flotation recoveries is adequately supported
by historical operating data. The moderate increase in forecast gravity gold recovery from 36.5% to
40% is supported by improvements in processing gravity gold in late 2018, increases in the blend of
Cuffley and Youle ore over the LOM of which Youle demonstrates good gravity gold recovery potential
in laboratory testing, and the fact that the processing plant has actually achieved +40% gravity gold
recovery five times since 2016 (monthly reconciled data).
Throughput effect on recovery
Figure 13-7 shows the mill throughput was relatively consistent from 2014 to 2018, with a slight
increase in year on year averages due to incremental (continuous) improvements and efficiency creep.
Based on this relatively stable flow data and no clear recovery relationship within the throughput range
of the operation, throughput has been assumed to have a negligible effect on the mill recovery
calculations at the forecast LOM throughput.
Figure 13-7: Metallurgical recoveries vs throughput for Cuffley/ Augusta/ Brunswick ore blend: 2014–2018
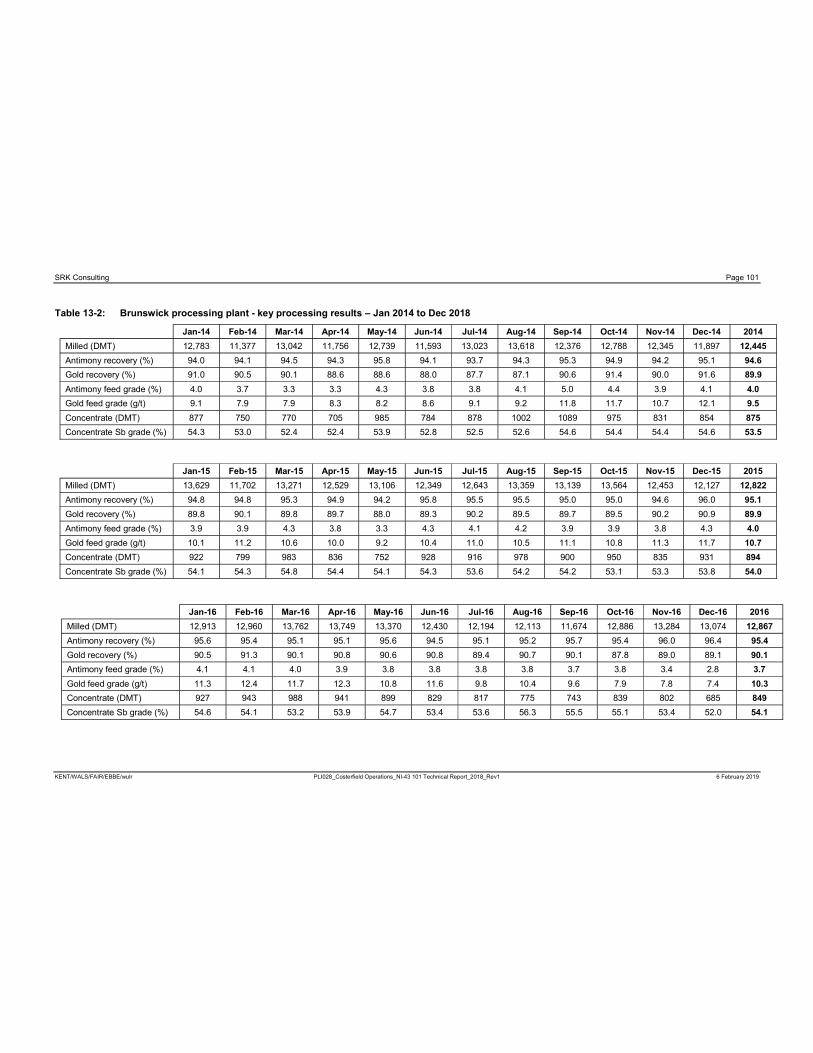
SRK Consulting Page 101
KENT/WALS/FAIR/EBBE/wulr PLI028_Costerfield Operations_NI-43 101 Technical Report_2018_Rev1 6 February 2019
Table 13-2: Brunswick processing plant - key processing results – Jan 2014 to Dec 2018
Jan-14 Feb-14 Mar-14 Apr-14 May-14 Jun-14 Jul-14 Aug-14 Sep-14 Oct-14 Nov-14 Dec-14 2014
Milled (DMT) 12,783 11,377 13,042 11,756 12,739 11,593 13,023 13,618 12,376 12,788 12,345 11,897 12,445
Antimony recovery (%) 94.0 94.1 94.5 94.3 95.8 94.1 93.7 94.3 95.3 94.9 94.2 95.1 94.6
Gold recovery (%) 91.0 90.5 90.1 88.6 88.6 88.0 87.7 87.1 90.6 91.4 90.0 91.6 89.9
Antimony feed grade (%) 4.0 3.7 3.3 3.3 4.3 3.8 3.8 4.1 5.0 4.4 3.9 4.1 4.0
Gold feed grade (g/t) 9.1 7.9 7.9 8.3 8.2 8.6 9.1 9.2 11.8 11.7 10.7 12.1 9.5
Concentrate (DMT) 877 750 770 705 985 784 878 1002 1089 975 831 854 875
Concentrate Sb grade (%) 54.3 53.0 52.4 52.4 53.9 52.8 52.5 52.6 54.6 54.4 54.4 54.6 53.5
Jan-15 Feb-15 Mar-15 Apr-15 May-15 Jun-15 Jul-15 Aug-15 Sep-15 Oct-15 Nov-15 Dec-15 2015
Milled (DMT) 13,629 11,702 13,271 12,529 13,106 12,349 12,643 13,359 13,139 13,564 12,453 12,127 12,822
Antimony recovery (%) 94.8 94.8 95.3 94.9 94.2 95.8 95.5 95.5 95.0 95.0 94.6 96.0 95.1
Gold recovery (%) 89.8 90.1 89.8 89.7 88.0 89.3 90.2 89.5 89.7 89.5 90.2 90.9 89.9
Antimony feed grade (%) 3.9 3.9 4.3 3.8 3.3 4.3 4.1 4.2 3.9 3.9 3.8 4.3 4.0
Gold feed grade (g/t) 10.1 11.2 10.6 10.0 9.2 10.4 11.0 10.5 11.1 10.8 11.3 11.7 10.7
Concentrate (DMT) 922 799 983 836 752 928 916 978 900 950 835 931 894
Concentrate Sb grade (%) 54.1 54.3 54.8 54.4 54.1 54.3 53.6 54.2 54.2 53.1 53.3 53.8 54.0
Jan-16 Feb-16 Mar-16 Apr-16 May-16 Jun-16 Jul-16 Aug-16 Sep-16 Oct-16 Nov-16 Dec-16 2016
Milled (DMT) 12,913 12,960 13,762 13,749 13,370 12,430 12,194 12,113 11,674 12,886 13,284 13,074 12,867
Antimony recovery (%) 95.6 95.4 95.1 95.1 95.6 94.5 95.1 95.2 95.7 95.4 96.0 96.4 95.4
Gold recovery (%) 90.5 91.3 90.1 90.8 90.6 90.8 89.4 90.7 90.1 87.8 89.0 89.1 90.1
Antimony feed grade (%) 4.1 4.1 4.0 3.9 3.8 3.8 3.8 3.8 3.7 3.8 3.4 2.8 3.7
Gold feed grade (g/t) 11.3 12.4 11.7 12.3 10.8 11.6 9.8 10.4 9.6 7.9 7.8 7.4 10.3
Concentrate (DMT) 927 943 988 941 899 829 817 775 743 839 802 685 849
Concentrate Sb grade (%) 54.6 54.1 53.2 53.9 54.7 53.4 53.6 56.3 55.5 55.1 53.4 52.0 54.1
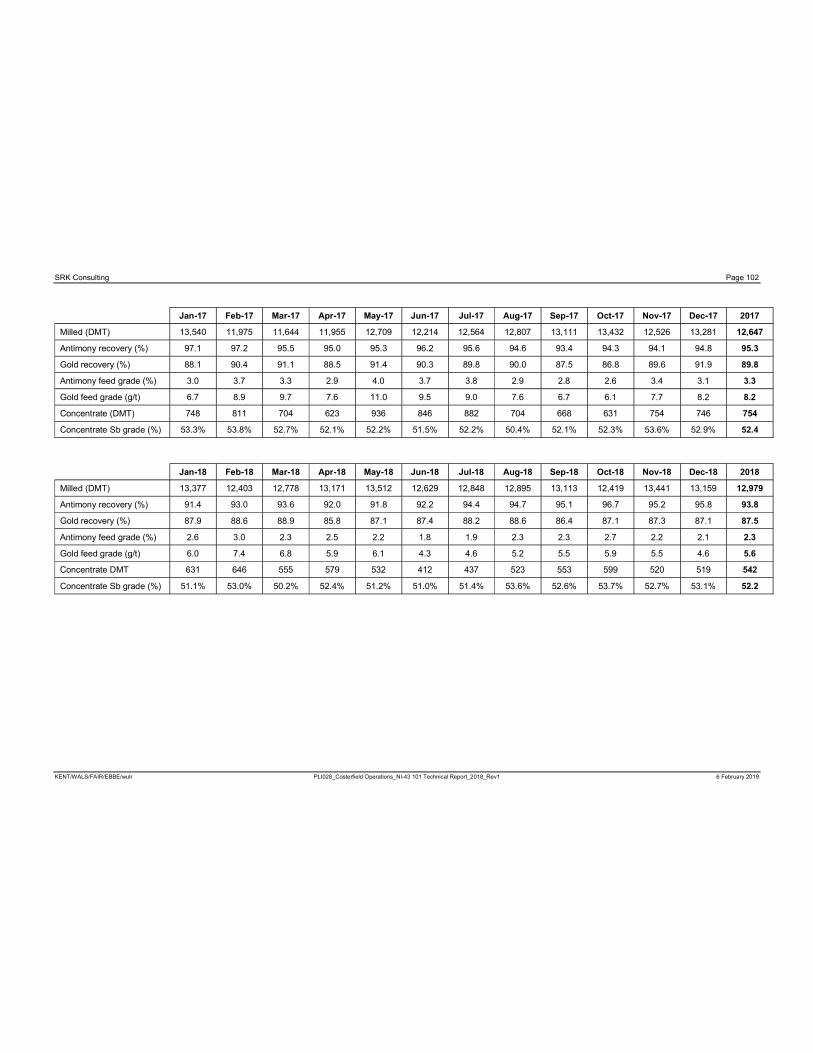
SRK Consulting Page 102
KENT/WALS/FAIR/EBBE/wulr PLI028_Costerfield Operations_NI-43 101 Technical Report_2018_Rev1 6 February 2019
Jan-17 Feb-17 Mar-17 Apr-17 May-17 Jun-17 Jul-17 Aug-17 Sep-17 Oct-17 Nov-17 Dec-17 2017
Milled (DMT) 13,540 11,975 11,644 11,955 12,709 12,214 12,564 12,807 13,111 13,432 12,526 13,281 12,647
Antimony recovery (%) 97.1 97.2 95.5 95.0 95.3 96.2 95.6 94.6 93.4 94.3 94.1 94.8 95.3
Gold recovery (%) 88.1 90.4 91.1 88.5 91.4 90.3 89.8 90.0 87.5 86.8 89.6 91.9 89.8
Antimony feed grade (%) 3.0 3.7 3.3 2.9 4.0 3.7 3.8 2.9 2.8 2.6 3.4 3.1 3.3
Gold feed grade (g/t) 6.7 8.9 9.7 7.6 11.0 9.5 9.0 7.6 6.7 6.1 7.7 8.2 8.2
Concentrate (DMT) 748 811 704 623 936 846 882 704 668 631 754 746 754
Concentrate Sb grade (%) 53.3% 53.8% 52.7% 52.1% 52.2% 51.5% 52.2% 50.4% 52.1% 52.3% 53.6% 52.9% 52.4
Jan-18 Feb-18 Mar-18 Apr-18 May-18 Jun-18 Jul-18 Aug-18 Sep-18 Oct-18 Nov-18 Dec-18 2018
Milled (DMT) 13,377 12,403 12,778 13,171 13,512 12,629 12,848 12,895 13,113 12,419 13,441 13,159 12,979
Antimony recovery (%) 91.4 93.0 93.6 92.0 91.8 92.2 94.4 94.7 95.1 96.7 95.2 95.8 93.8
Gold recovery (%) 87.9 88.6 88.9 85.8 87.1 87.4 88.2 88.6 86.4 87.1 87.3 87.1 87.5
Antimony feed grade (%) 2.6 3.0 2.3 2.5 2.2 1.8 1.9 2.3 2.3 2.7 2.2 2.1 2.3
Gold feed grade (g/t) 6.0 7.4 6.8 5.9 6.1 4.3 4.6 5.2 5.5 5.9 5.5 4.6 5.6
Concentrate DMT 631 646 555 579 532 412 437 523 553 599 520 519 542
Concentrate Sb grade (%) 51.1% 53.0% 50.2% 52.4% 51.2% 51.0% 51.4% 53.6% 52.6% 53.7% 52.7% 53.1% 52.2
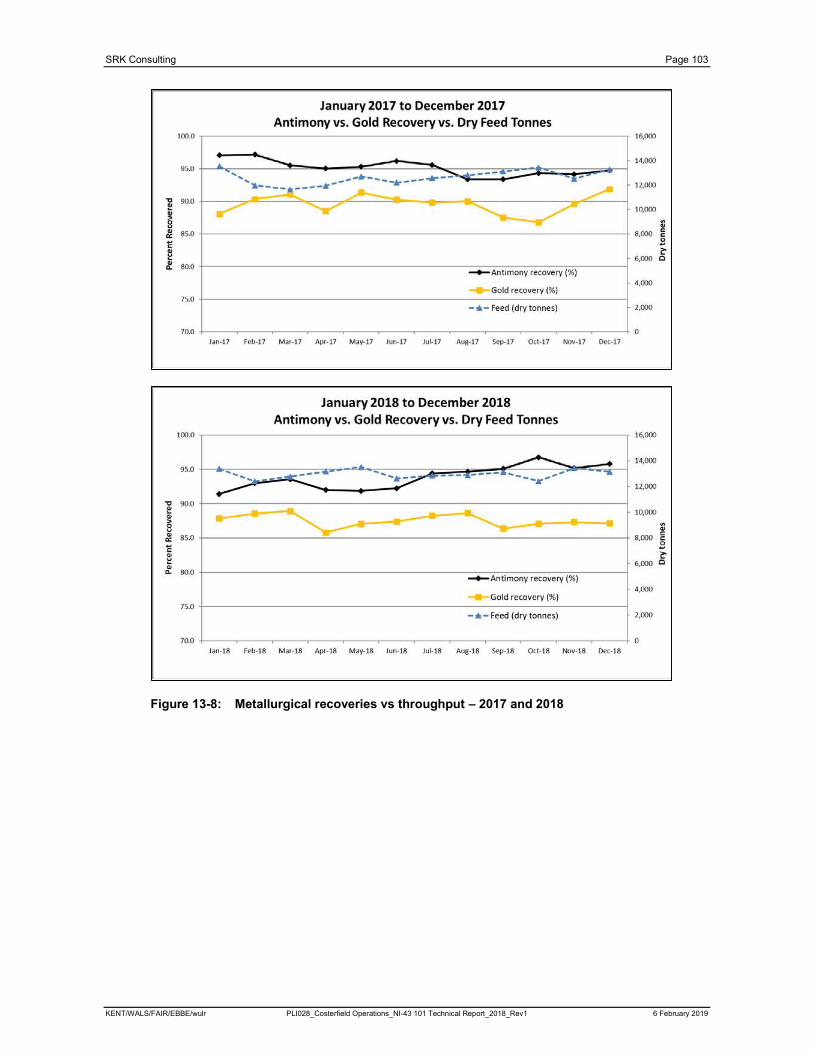
SRK Consulting Page 103
KENT/WALS/FAIR/EBBE/wulr PLI028_Costerfield Operations_NI-43 101 Technical Report_2018_Rev1 6 February 2019
Figure 13-8: Metallurgical recoveries vs throughput – 2017 and 2018
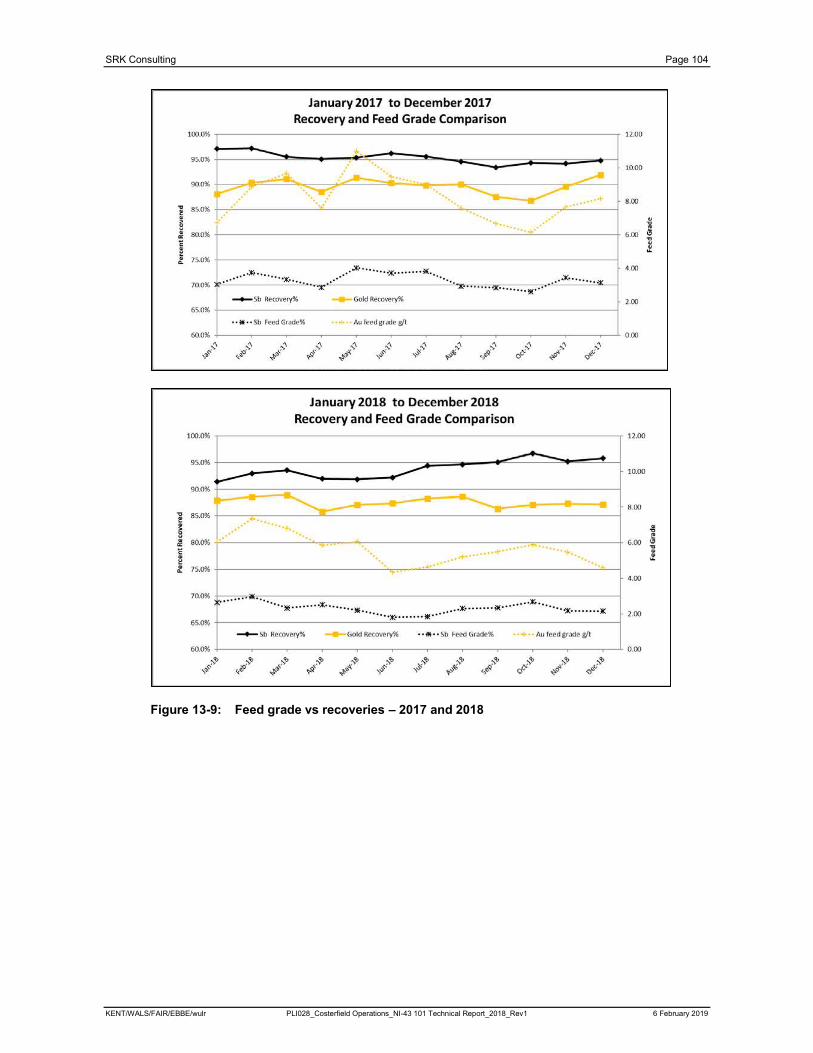
SRK Consulting Page 104
KENT/WALS/FAIR/EBBE/wulr PLI028_Costerfield Operations_NI-43 101 Technical Report_2018_Rev1 6 February 2019
Figure 13-9: Feed grade vs recoveries – 2017 and 2018
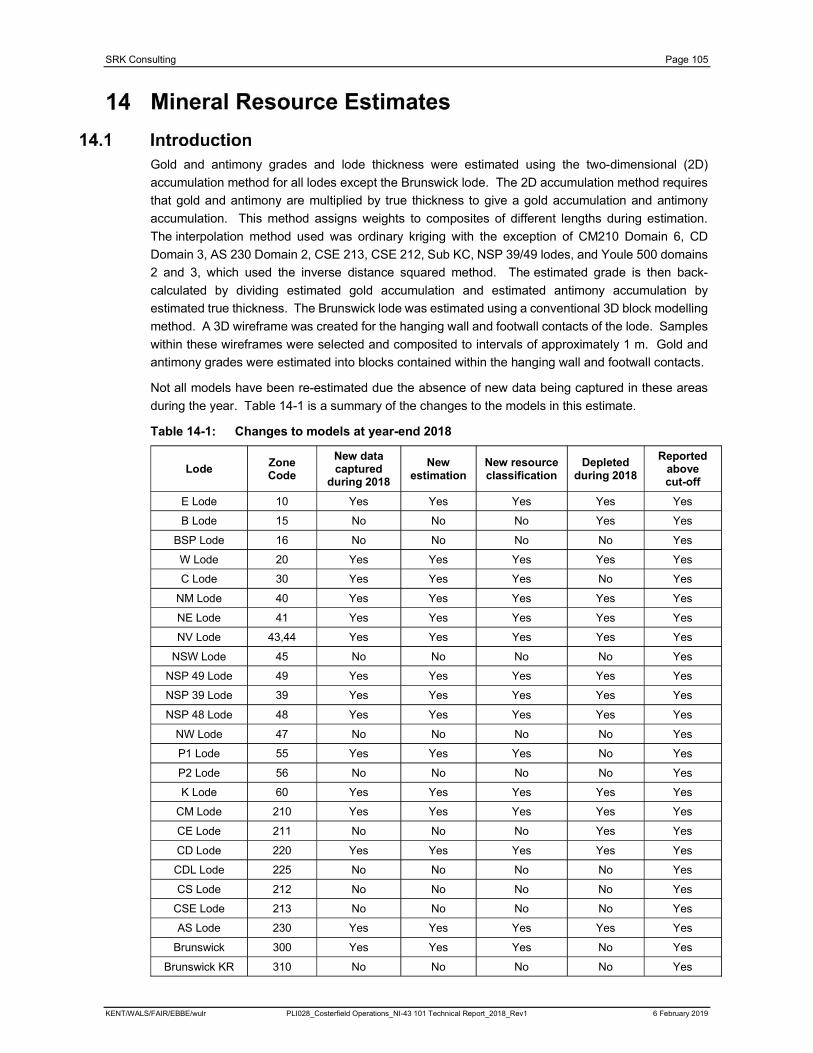
SRK Consulting Page 105
KENT/WALS/FAIR/EBBE/wulr PLI028_Costerfield Operations_NI-43 101 Technical Report_2018_Rev1 6 February 2019
Gold and antimony grades and lode thickness were estimated using the two-dimensional (2D)
accumulation method for all lodes except the Brunswick lode. The 2D accumulation method requires
that gold and antimony are multiplied by true thickness to give a gold accumulation and antimony
accumulation. This method assigns weights to composites of different lengths during estimation.
The interpolation method used was ordinary kriging with the exception of CM210 Domain 6, CD
Domain 3, AS 230 Domain 2, CSE 213, CSE 212, Sub KC, NSP 39/49 lodes, and Youle 500 domains
2 and 3, which used the inverse distance squared method. The estimated grade is then back-
calculated by dividing estimated gold accumulation and estimated antimony accumulation by
estimated true thickness. The Brunswick lode was estimated using a conventional 3D block modelling
method. A 3D wireframe was created for the hanging wall and footwall contacts of the lode. Samples
within these wireframes were selected and composited to intervals of approximately 1 m. Gold and
antimony grades were estimated into blocks contained within the hanging wall and footwall contacts.
Not all models have been re-estimated due the absence of new data being captured in these areas
during the year. Table 14-1 is a summary of the changes to the models in this estimate.
Table 14-1: Changes to models at year-end 2018
LodeZone Code
New data captured
during 2018
New estimation
New resource classification
Depleted during 2018
Reported above cut-off
E Lode 10 Yes Yes Yes Yes Yes
B Lode 15 No No No Yes Yes
BSP Lode 16 No No No No Yes
W Lode 20 Yes Yes Yes Yes Yes
C Lode 30 Yes Yes Yes No Yes
NM Lode 40 Yes Yes Yes Yes Yes
NE Lode 41 Yes Yes Yes Yes Yes
NV Lode 43,44 Yes Yes Yes Yes Yes
NSW Lode 45 No No No No Yes
NSP 49 Lode 49 Yes Yes Yes Yes Yes
NSP 39 Lode 39 Yes Yes Yes Yes Yes
NSP 48 Lode 48 Yes Yes Yes Yes Yes
NW Lode 47 No No No No Yes
P1 Lode 55 Yes Yes Yes No Yes
P2 Lode 56 No No No No Yes
K Lode 60 Yes Yes Yes Yes Yes
CM Lode 210 Yes Yes Yes Yes Yes
CE Lode 211 No No No Yes Yes
CD Lode 220 Yes Yes Yes Yes Yes
CDL Lode 225 No No No No Yes
CS Lode 212 No No No No Yes
CSE Lode 213 No No No No Yes
AS Lode 230 Yes Yes Yes Yes Yes
Brunswick 300 Yes Yes Yes No Yes
Brunswick KR 310 No No No No Yes
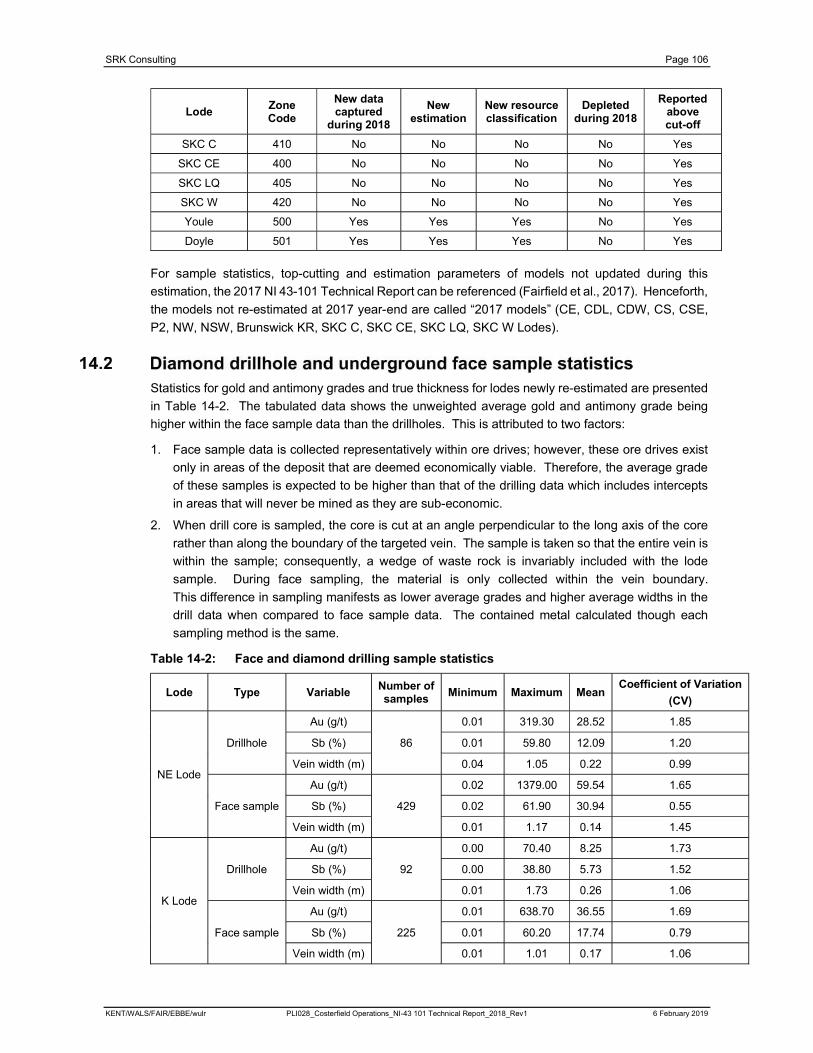
SRK Consulting Page 106
KENT/WALS/FAIR/EBBE/wulr PLI028_Costerfield Operations_NI-43 101 Technical Report_2018_Rev1 6 February 2019
LodeZone Code
New data captured
during 2018
New estimation
New resource classification
Depleted during 2018
Reported above cut-off
SKC C 410 No No No No Yes
SKC CE 400 No No No No Yes
SKC LQ 405 No No No No Yes
SKC W 420 No No No No Yes
Youle 500 Yes Yes Yes No Yes
Doyle 501 Yes Yes Yes No Yes
For sample statistics, top-cutting and estimation parameters of models not updated during this
estimation, the 2017 NI 43-101 Technical Report can be referenced (Fairfield et al., 2017). Henceforth,
the models not re-estimated at 2017 year-end are called “2017 models” (CE, CDL, CDW, CS, CSE,
P2, NW, NSW, Brunswick KR, SKC C, SKC CE, SKC LQ, SKC W Lodes).
Statistics for gold and antimony grades and true thickness for lodes newly re-estimated are presented
in Table 14-2. The tabulated data shows the unweighted average gold and antimony grade being
higher within the face sample data than the drillholes. This is attributed to two factors:
1. Face sample data is collected representatively within ore drives; however, these ore drives exist
only in areas of the deposit that are deemed economically viable. Therefore, the average grade
of these samples is expected to be higher than that of the drilling data which includes intercepts
in areas that will never be mined as they are sub-economic.
2. When drill core is sampled, the core is cut at an angle perpendicular to the long axis of the core
rather than along the boundary of the targeted vein. The sample is taken so that the entire vein is
within the sample; consequently, a wedge of waste rock is invariably included with the lode
sample. During face sampling, the material is only collected within the vein boundary.
This difference in sampling manifests as lower average grades and higher average widths in the
drill data when compared to face sample data. The contained metal calculated though each
sampling method is the same.
Table 14-2: Face and diamond drilling sample statistics
Lode Type VariableNumber of samples
Minimum Maximum MeanCoefficient of Variation
(CV)
NE Lode
Drillhole
Au (g/t)
86
0.01 319.30 28.52 1.85
Sb (%) 0.01 59.80 12.09 1.20
Vein width (m) 0.04 1.05 0.22 0.99
Face sample
Au (g/t)
429
0.02 1379.00 59.54 1.65
Sb (%) 0.02 61.90 30.94 0.55
Vein width (m) 0.01 1.17 0.14 1.45
K Lode
Drillhole
Au (g/t)
92
0.00 70.40 8.25 1.73
Sb (%) 0.00 38.80 5.73 1.52
Vein width (m) 0.01 1.73 0.26 1.06
Face sample
Au (g/t)
225
0.01 638.70 36.55 1.69
Sb (%) 0.01 60.20 17.74 0.79
Vein width (m) 0.01 1.01 0.17 1.06

SRK Consulting Page 107
KENT/WALS/FAIR/EBBE/wulr PLI028_Costerfield Operations_NI-43 101 Technical Report_2018_Rev1 6 February 2019
To show an example of the two factors described above, a study was undertaken on K Lode.
To negate the influence of low grade intercepts on the drilling information, all data was cut to the
boundaries of the face sampling data (Figure 14-1).
Figure 14-1: Long section of data collected for the sample comparison analysis
Notes: Face sample data (red) and drillhole data (green).
This subset of K Lode data shows a higher average grade and a smaller vein width in the face sample
data (Table 14-3). When this data is accumulated, by multiplying the grade by the vein width (SbAcc
and AuAcc), the resulting numbers are representative of each other. Accumulation by vein true
thickness produces similar, but more accurate, statistics compared to simple length weighting.
Table 14-3: Sample statistics of the data selected for analysis in K Lode
Variable TypeNumber of samples
Minimum Maximum Mean
Sb (%)Drillhole 38 0.005 59.8 17.833
Face sample 342 0.09 61.6 31.841
Au (g/t)Drillhole 38 0.005 319.3 40.618
Face sample 342 0.39 1379 62.036
Vein width (m)Drillhole 38 0.060 1.215 0.200
Face sample 342 0.010 1.325 0.176
SbAccDrillhole 38 0.001 23.994 2.793
Face sample 342 0.004 45.090 3.777
AuAccDrillhole 38 0.002 97.106 6.896
Face sample 342 0.008 103.360 6.965
Each lode structure has been modelled separately with a numeric zone code applied to each
(Table 14-1). The identified intervals within both drill data and face sample data are incorporated into
a wireframe of the lode structure. This wireframe is then used to flag the selected data with the
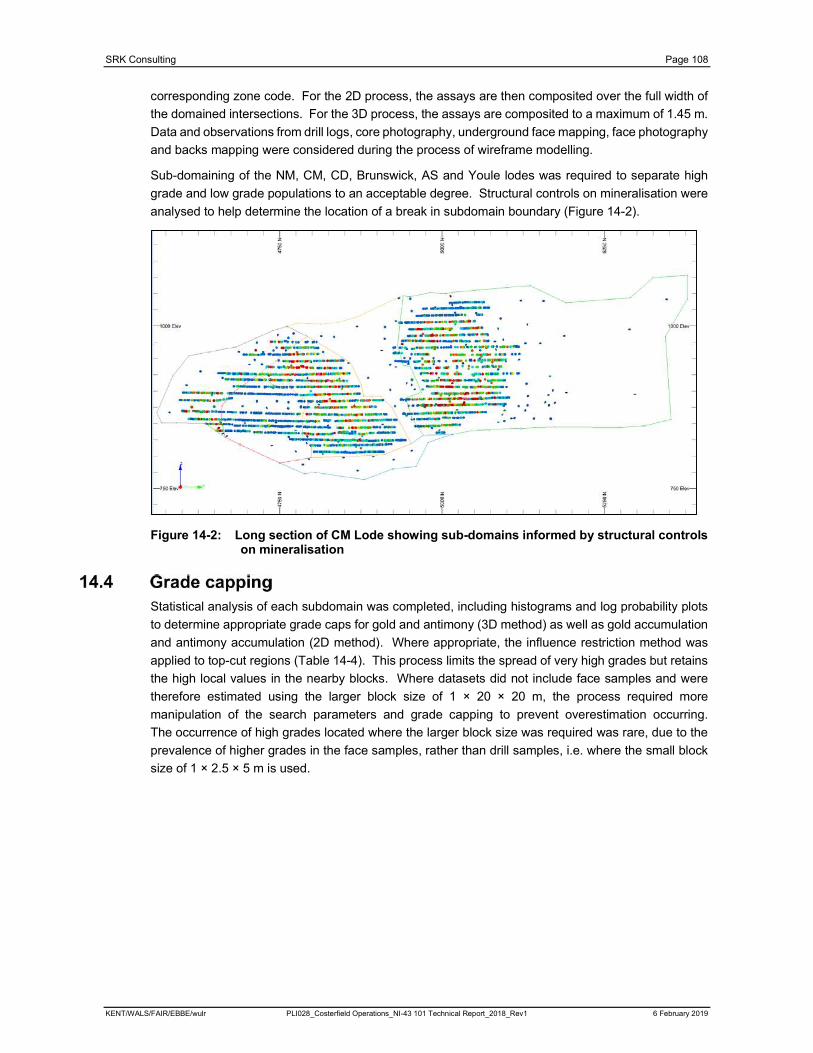
SRK Consulting Page 108
KENT/WALS/FAIR/EBBE/wulr PLI028_Costerfield Operations_NI-43 101 Technical Report_2018_Rev1 6 February 2019
corresponding zone code. For the 2D process, the assays are then composited over the full width of
the domained intersections. For the 3D process, the assays are composited to a maximum of 1.45 m.
Data and observations from drill logs, core photography, underground face mapping, face photography
and backs mapping were considered during the process of wireframe modelling.
Sub-domaining of the NM, CM, CD, Brunswick, AS and Youle lodes was required to separate high
grade and low grade populations to an acceptable degree. Structural controls on mineralisation were
analysed to help determine the location of a break in subdomain boundary (Figure 14-2).
Figure 14-2: Long section of CM Lode showing sub-domains informed by structural controls on mineralisation
Statistical analysis of each subdomain was completed, including histograms and log probability plots
to determine appropriate grade caps for gold and antimony (3D method) as well as gold accumulation
and antimony accumulation (2D method). Where appropriate, the influence restriction method was
applied to top-cut regions (Table 14-4). This process limits the spread of very high grades but retains
the high local values in the nearby blocks. Where datasets did not include face samples and were
therefore estimated using the larger block size of 1 × 20 × 20 m, the process required more
manipulation of the search parameters and grade capping to prevent overestimation occurring.
The occurrence of high grades located where the larger block size was required was rare, due to the
prevalence of higher grades in the face samples, rather than drill samples, i.e. where the small block
size of 1 × 2.5 × 5 m is used.

SRK Consulting Page 109
KENT/WALS/FAIR/EBBE/wulr PLI028_Costerfield Operations_NI-43 101 Technical Report_2018_Rev1 6 February 2019
Table 14-4: Sample statistics before and after application of top-cuts
Variable Lode Domain Top-cutNo. of
samplesNo. of cut samples
Variable Min. Max. Mean CV
Au Acc NM 1 80 164 2Uncut 0.0 197.80 5.8 2.9
Cut 0.0 80 5.09 1.883
Au Acc NM 2 58 138 1Uncut 0.02 171.84 16.28 1.13
Cut 0.02 58 15.41 0.853
Sb Acc NM 2 25 138 5Uncut 0.0 52.55 10.36 0.82
Cut 0.0 25 9.95 0.72
Au Acc NM 3 200 1528 3Uncut 0.0 902.4 14.58 2.02
Cut 0.0 200 14.09 1.34
Sb Acc NM 3 50 1528 5Uncut 0.0 72.55 6.99 1.07
Cut 0.00 50 6.97 1.04
Au Acc NM 4 150 879 4Uncut 0.0 448.48 11.99 1.94
Cut 0.0 150 11.52 1.51
Sb Acc NM 4 60 879 1Uncut 0.0 111.17 5.23 1.37
Cut 0.0 60 5.17 1.25
Au Acc NM 5 100 226 3Uncut 0.008 134.82 12.28 1.64
Cut 0.008 100 12.06 1.58
Sb Acc NM 5 45 226 1Uncut 0.004 46.16 4.19 1.59
Cut 0.003 45 4.19 1.58
Au Acc CD 220 1 75 227 9Uncut 0.003 161.34 14.956 1.61
Cut 0.003 75 13.505 1.329
Sb Acc CD 220 1 40 227 9Uncut 0.0 70.34 5.867 2.049
Cut 0.0 40 5.3 1.818
Au Acc CD 220 2 15 38 2Uncut 0.017 31.151 3.102 2.031
Cut 0.017 15 2.54 1.689
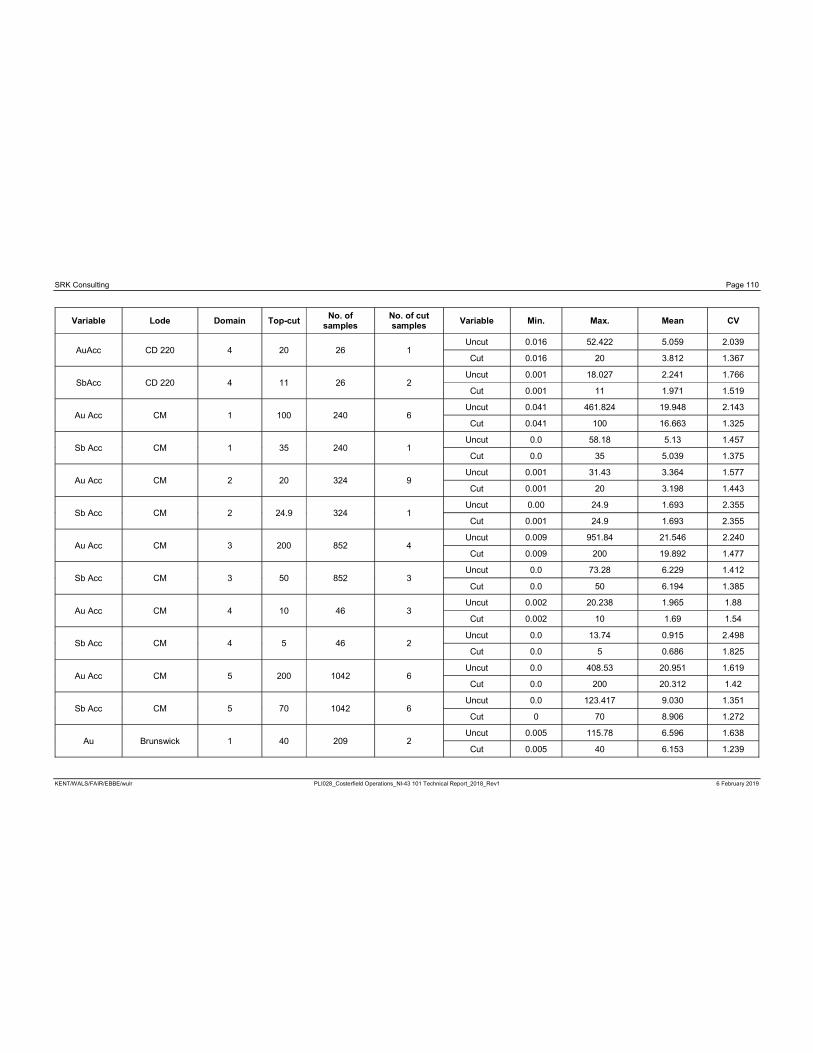
SRK Consulting Page 110
KENT/WALS/FAIR/EBBE/wulr PLI028_Costerfield Operations_NI-43 101 Technical Report_2018_Rev1 6 February 2019
Variable Lode Domain Top-cutNo. of
samplesNo. of cut samples
Variable Min. Max. Mean CV
AuAcc CD 220 4 20 26 1Uncut 0.016 52.422 5.059 2.039
Cut 0.016 20 3.812 1.367
SbAcc CD 220 4 11 26 2Uncut 0.001 18.027 2.241 1.766
Cut 0.001 11 1.971 1.519
Au Acc CM 1 100 240 6Uncut 0.041 461.824 19.948 2.143
Cut 0.041 100 16.663 1.325
Sb Acc CM 1 35 240 1Uncut 0.0 58.18 5.13 1.457
Cut 0.0 35 5.039 1.375
Au Acc CM 2 20 324 9Uncut 0.001 31.43 3.364 1.577
Cut 0.001 20 3.198 1.443
Sb Acc CM 2 24.9 324 1Uncut 0.00 24.9 1.693 2.355
Cut 0.001 24.9 1.693 2.355
Au Acc CM 3 200 852 4Uncut 0.009 951.84 21.546 2.240
Cut 0.009 200 19.892 1.477
Sb Acc CM 3 50 852 3Uncut 0.0 73.28 6.229 1.412
Cut 0.0 50 6.194 1.385
Au Acc CM 4 10 46 3Uncut 0.002 20.238 1.965 1.88
Cut 0.002 10 1.69 1.54
Sb Acc CM 4 5 46 2Uncut 0.0 13.74 0.915 2.498
Cut 0.0 5 0.686 1.825
Au Acc CM 5 200 1042 6Uncut 0.0 408.53 20.951 1.619
Cut 0.0 200 20.312 1.42
Sb Acc CM 5 70 1042 6Uncut 0.0 123.417 9.030 1.351
Cut 0 70 8.906 1.272
Au Brunswick 1 40 209 2Uncut 0.005 115.78 6.596 1.638
Cut 0.005 40 6.153 1.239
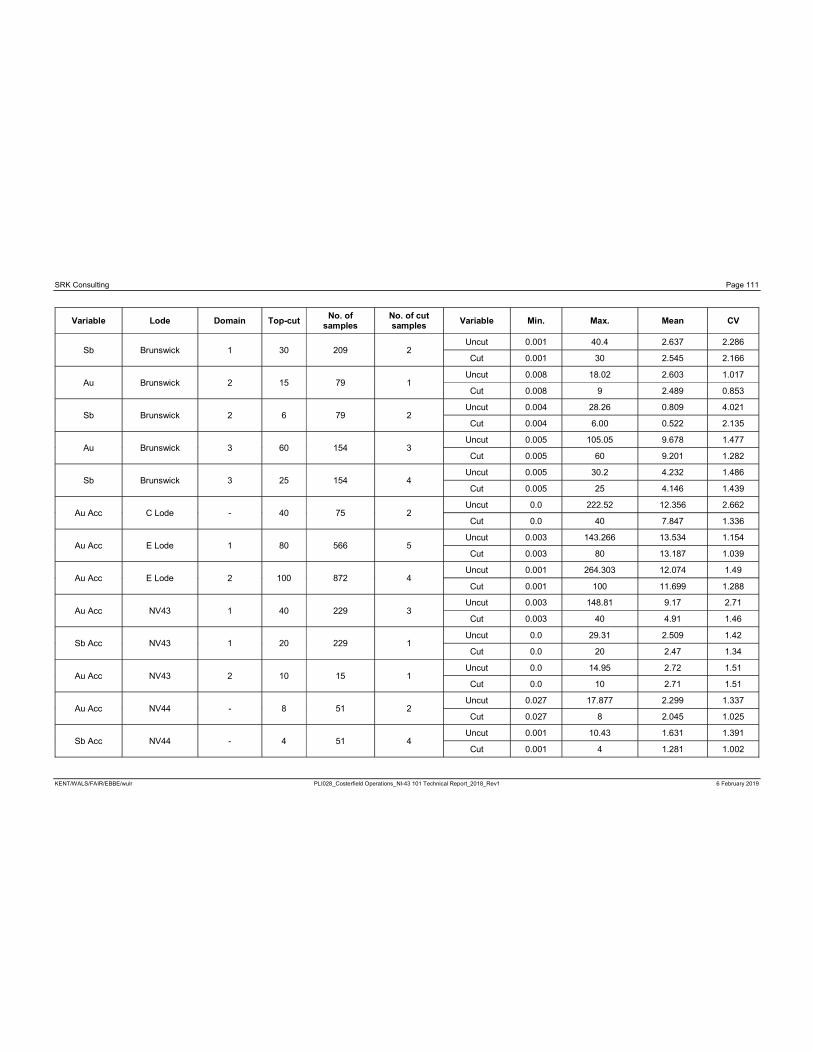
SRK Consulting Page 111
KENT/WALS/FAIR/EBBE/wulr PLI028_Costerfield Operations_NI-43 101 Technical Report_2018_Rev1 6 February 2019
Variable Lode Domain Top-cutNo. of
samplesNo. of cut samples
Variable Min. Max. Mean CV
Sb Brunswick 1 30 209 2Uncut 0.001 40.4 2.637 2.286
Cut 0.001 30 2.545 2.166
Au Brunswick 2 15 79 1Uncut 0.008 18.02 2.603 1.017
Cut 0.008 9 2.489 0.853
Sb Brunswick 2 6 79 2Uncut 0.004 28.26 0.809 4.021
Cut 0.004 6.00 0.522 2.135
Au Brunswick 3 60 154 3Uncut 0.005 105.05 9.678 1.477
Cut 0.005 60 9.201 1.282
Sb Brunswick 3 25 154 4Uncut 0.005 30.2 4.232 1.486
Cut 0.005 25 4.146 1.439
Au Acc C Lode - 40 75 2Uncut 0.0 222.52 12.356 2.662
Cut 0.0 40 7.847 1.336
Au Acc E Lode 1 80 566 5Uncut 0.003 143.266 13.534 1.154
Cut 0.003 80 13.187 1.039
Au Acc E Lode 2 100 872 4Uncut 0.001 264.303 12.074 1.49
Cut 0.001 100 11.699 1.288
Au Acc NV43 1 40 229 3Uncut 0.003 148.81 9.17 2.71
Cut 0.003 40 4.91 1.46
Sb Acc NV43 1 20 229 1Uncut 0.0 29.31 2.509 1.42
Cut 0.0 20 2.47 1.34
Au Acc NV43 2 10 15 1Uncut 0.0 14.95 2.72 1.51
Cut 0.0 10 2.71 1.51
Au Acc NV44 - 8 51 2Uncut 0.027 17.877 2.299 1.337
Cut 0.027 8 2.045 1.025
Sb Acc NV44 - 4 51 4Uncut 0.001 10.43 1.631 1.391
Cut 0.001 4 1.281 1.002

SRK Consulting Page 112
KENT/WALS/FAIR/EBBE/wulr PLI028_Costerfield Operations_NI-43 101 Technical Report_2018_Rev1 6 February 2019
Variable Lode Domain Top-cutNo. of
samplesNo. of cut samples
Variable Min. Max. Mean CV
Au Acc NE Lode 1 30 67 3Uncut 0.016 49.650 7.586 1.323
Cut 0.016 30 6.9 1.11
Sb Acc NE Lode 1 18 67 1Uncut 0.004 25.550 4.103 1.138
Cut 0.004 18 3.99 1.057
Au Acc NE Lode 2 60 345 3Uncut 0.002 103.36 6.41 1.827
Cut 0.002 60 6.074 1.544
Sb Acc NE Lode 2 28 345 4Uncut 0.001 45.090 3.331 1.445
Cut 0.001 28 3.192 1.185
Sb Acc Brunswick KR - 10 23 2Uncut 0.001 16.72 2.27 1.71
Cut 0.001 10 1.95 1.48
Au Acc B Lode - 40 339 8Uncut 0.002 719.04 9.37 4.62
Cut 0.002 40 5.73 1.46
Au Acc K Lode - 70 259 3Uncut 0.000 294.38 5.853 .346
Cut 0.000 70 4.941 2
Sb Acc K Lode - 30 259 2Uncut 0.0 44.77 2.623 1.684
Cut 0.0 30 2.56 1.524
Au Acc NSW Lode - 80 104 1Uncut 0.02 429.90 13.51 3.16
Cut 0.02 80 10.14 1.35
Sb Acc NSW Lode - 30 104 1Uncut 0.0 294.38 7.88 3.88
Cut 0.0 30 5.57 1.15
Au Acc NSP4 Lode - 20 38 2Uncut 0.006 31.825 4.373 1.530
Cut 0.006 20 4.056 1.375
Sb Acc NSP4 Lode - 10 38 1Uncut 0.004 14.923 1.815 1.685
Cut 0.004 10 1.65 1.478
AuAcc NSP5 Lode - 30 74 2Uncut 0.001 49.354 4.187 2.046
Cut 0.001 30 3.791 1.796
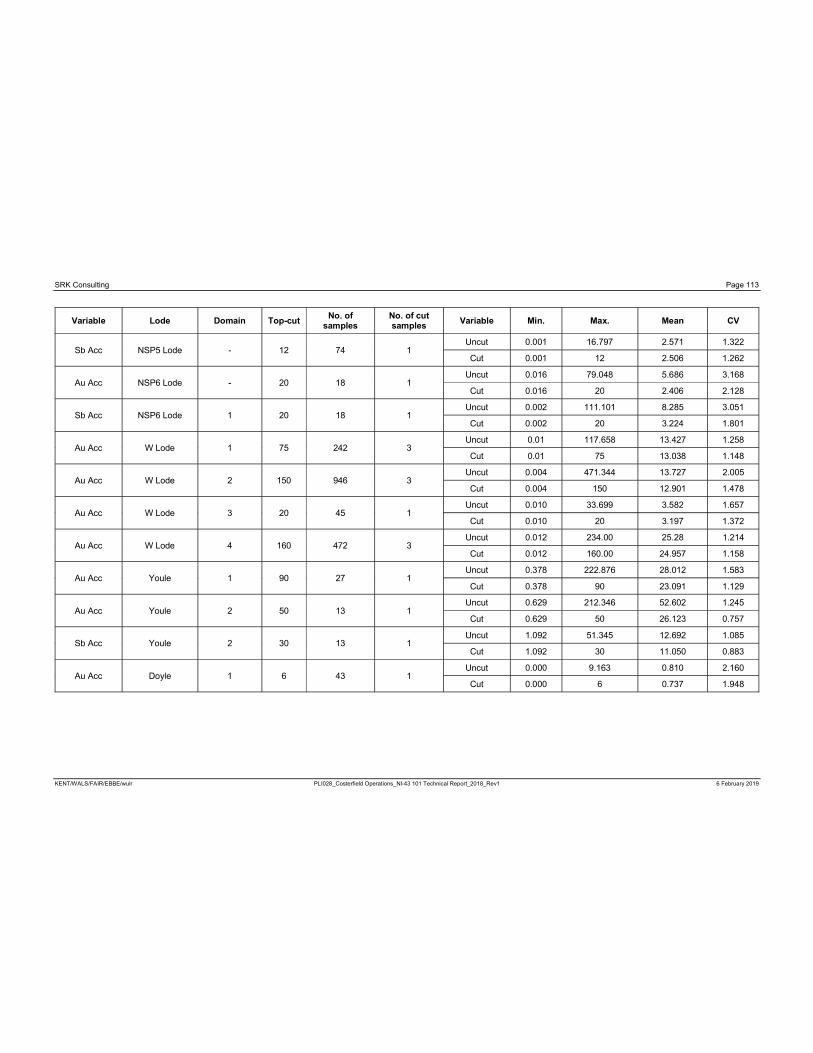
SRK Consulting Page 113
KENT/WALS/FAIR/EBBE/wulr PLI028_Costerfield Operations_NI-43 101 Technical Report_2018_Rev1 6 February 2019
Variable Lode Domain Top-cutNo. of
samplesNo. of cut samples
Variable Min. Max. Mean CV
Sb Acc NSP5 Lode - 12 74 1Uncut 0.001 16.797 2.571 1.322
Cut 0.001 12 2.506 1.262
Au Acc NSP6 Lode - 20 18 1Uncut 0.016 79.048 5.686 3.168
Cut 0.016 20 2.406 2.128
Sb Acc NSP6 Lode 1 20 18 1Uncut 0.002 111.101 8.285 3.051
Cut 0.002 20 3.224 1.801
Au Acc W Lode 1 75 242 3Uncut 0.01 117.658 13.427 1.258
Cut 0.01 75 13.038 1.148
Au Acc W Lode 2 150 946 3Uncut 0.004 471.344 13.727 2.005
Cut 0.004 150 12.901 1.478
Au Acc W Lode 3 20 45 1Uncut 0.010 33.699 3.582 1.657
Cut 0.010 20 3.197 1.372
Au Acc W Lode 4 160 472 3Uncut 0.012 234.00 25.28 1.214
Cut 0.012 160.00 24.957 1.158
Au Acc Youle 1 90 27 1Uncut 0.378 222.876 28.012 1.583
Cut 0.378 90 23.091 1.129
Au Acc Youle 2 50 13 1Uncut 0.629 212.346 52.602 1.245
Cut 0.629 50 26.123 0.757
Sb Acc Youle 2 30 13 1Uncut 1.092 51.345 12.692 1.085
Cut 1.092 30 11.050 0.883
Au Acc Doyle 1 6 43 1Uncut 0.000 9.163 0.810 2.160
Cut 0.000 6 0.737 1.948
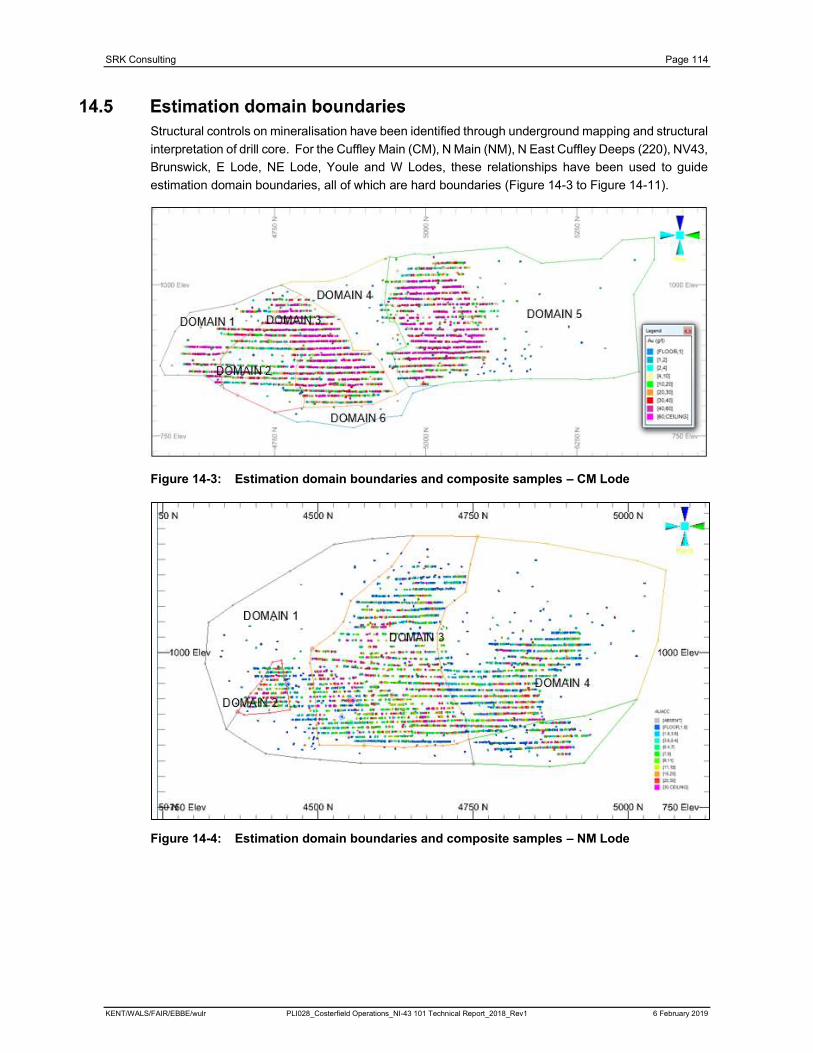
SRK Consulting Page 114
KENT/WALS/FAIR/EBBE/wulr PLI028_Costerfield Operations_NI-43 101 Technical Report_2018_Rev1 6 February 2019
Structural controls on mineralisation have been identified through underground mapping and structural
interpretation of drill core. For the Cuffley Main (CM), N Main (NM), N East Cuffley Deeps (220), NV43,
Brunswick, E Lode, NE Lode, Youle and W Lodes, these relationships have been used to guide
estimation domain boundaries, all of which are hard boundaries (Figure 14-3 to Figure 14-11).
Figure 14-3: Estimation domain boundaries and composite samples – CM Lode
Figure 14-4: Estimation domain boundaries and composite samples – NM Lode
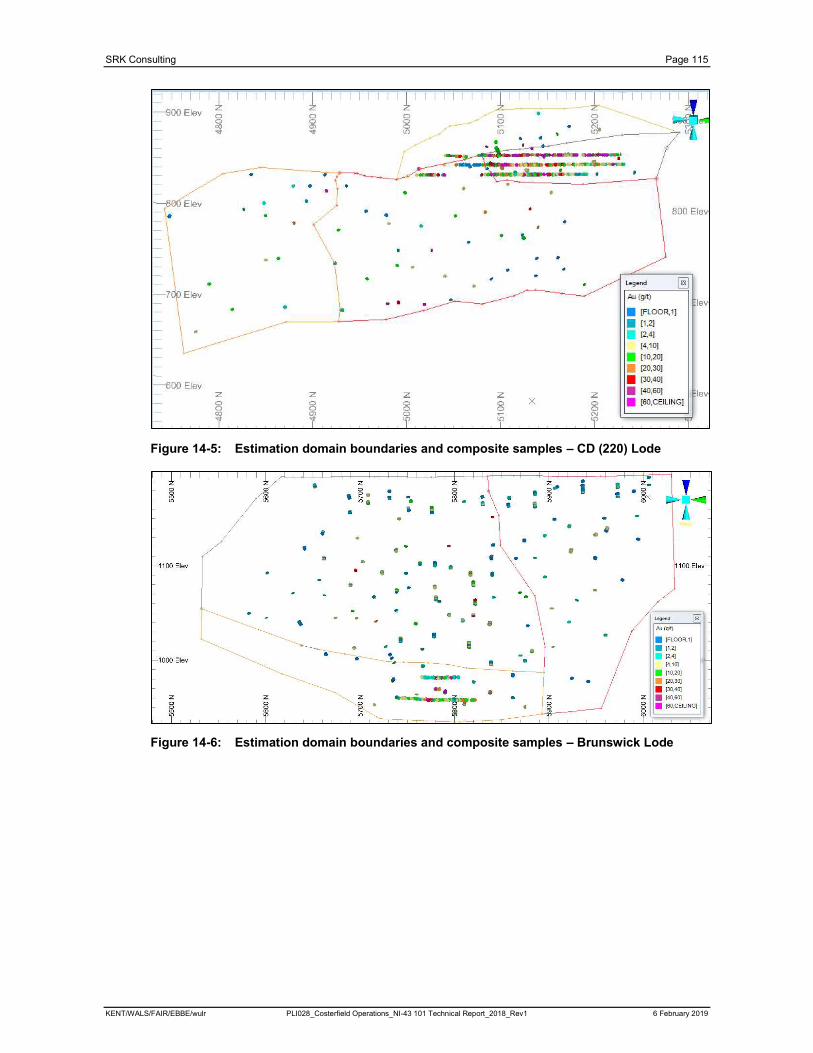
SRK Consulting Page 115
KENT/WALS/FAIR/EBBE/wulr PLI028_Costerfield Operations_NI-43 101 Technical Report_2018_Rev1 6 February 2019
Figure 14-5: Estimation domain boundaries and composite samples – CD (220) Lode
Figure 14-6: Estimation domain boundaries and composite samples – Brunswick Lode
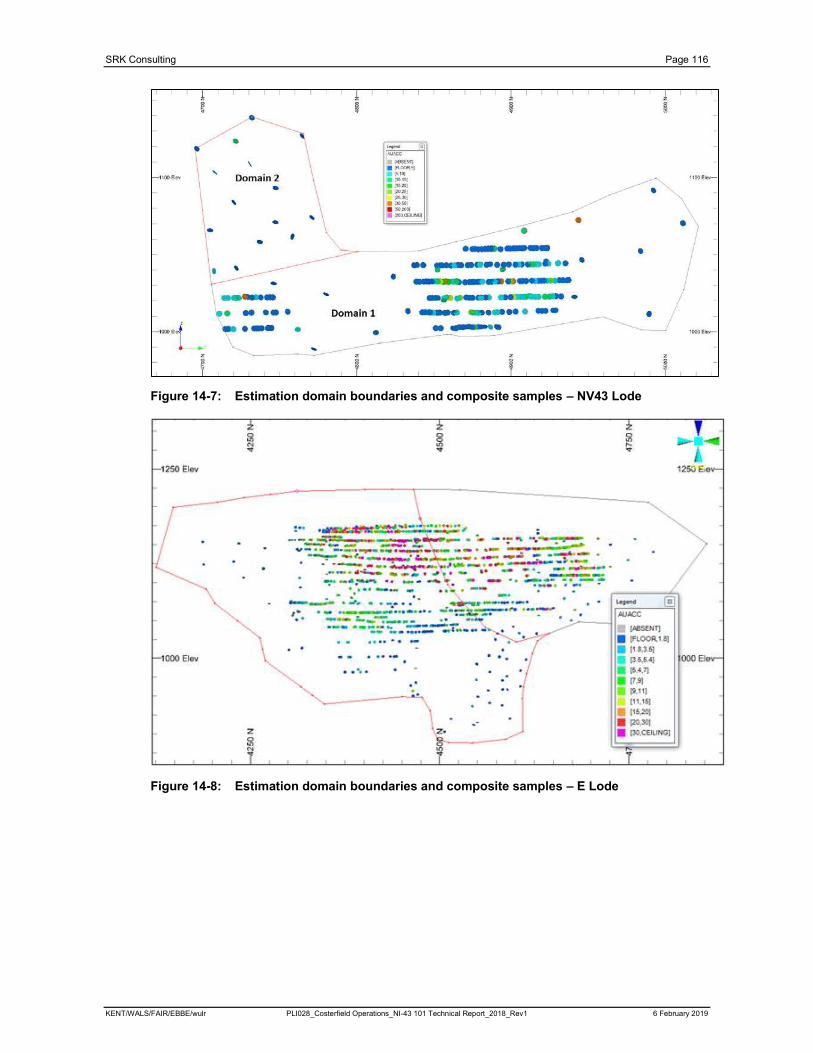
SRK Consulting Page 116
KENT/WALS/FAIR/EBBE/wulr PLI028_Costerfield Operations_NI-43 101 Technical Report_2018_Rev1 6 February 2019
Figure 14-7: Estimation domain boundaries and composite samples – NV43 Lode
Figure 14-8: Estimation domain boundaries and composite samples – E Lode
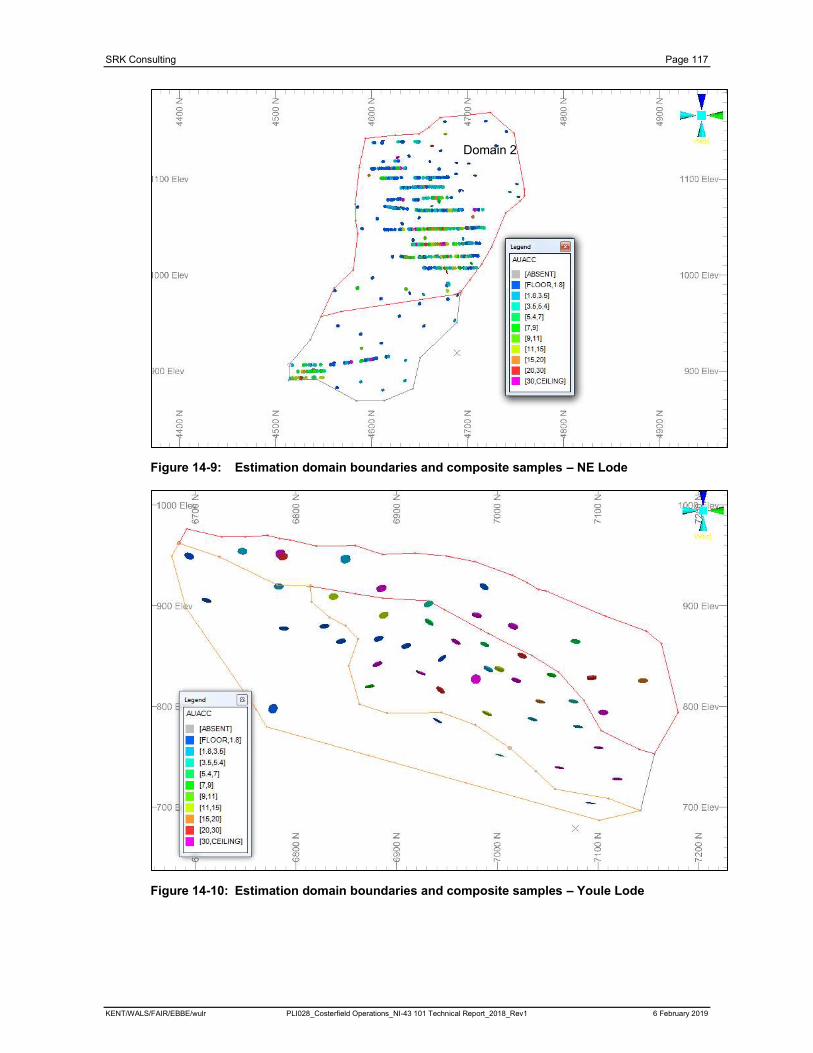
SRK Consulting Page 117
KENT/WALS/FAIR/EBBE/wulr PLI028_Costerfield Operations_NI-43 101 Technical Report_2018_Rev1 6 February 2019
Figure 14-9: Estimation domain boundaries and composite samples – NE Lode
Figure 14-10: Estimation domain boundaries and composite samples – Youle Lode
Domain 2
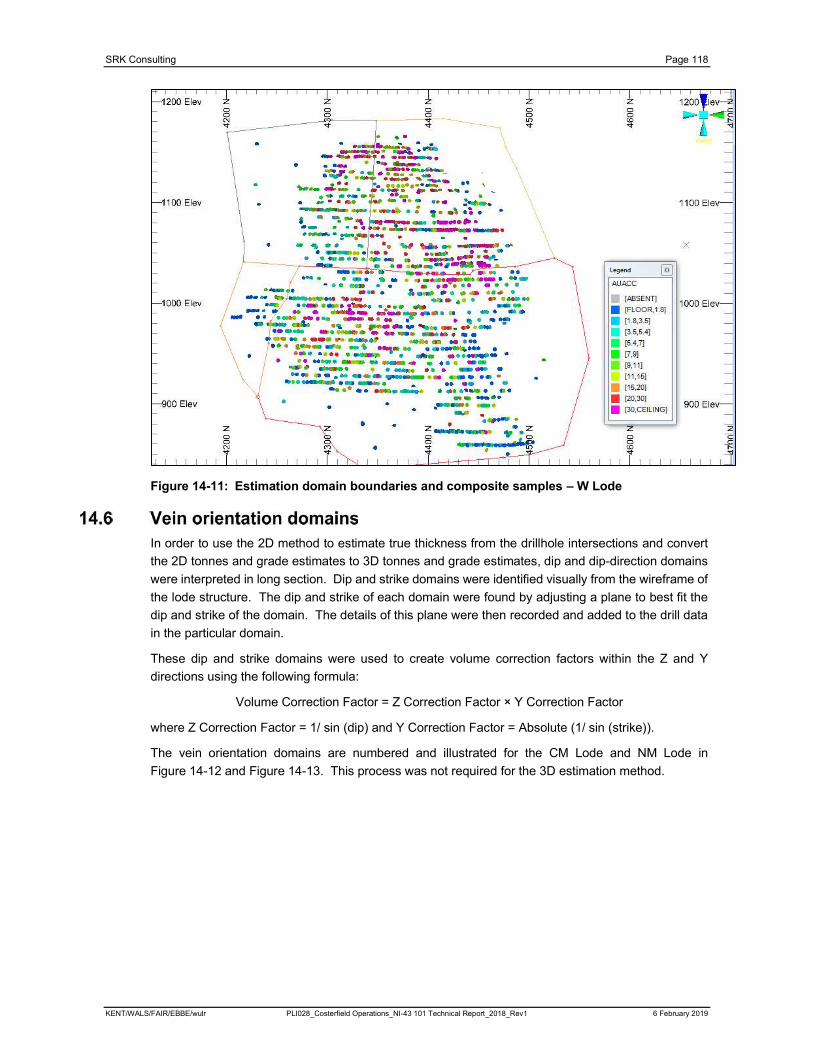
SRK Consulting Page 118
KENT/WALS/FAIR/EBBE/wulr PLI028_Costerfield Operations_NI-43 101 Technical Report_2018_Rev1 6 February 2019
Figure 14-11: Estimation domain boundaries and composite samples – W Lode
In order to use the 2D method to estimate true thickness from the drillhole intersections and convert
the 2D tonnes and grade estimates to 3D tonnes and grade estimates, dip and dip-direction domains
were interpreted in long section. Dip and strike domains were identified visually from the wireframe of
the lode structure. The dip and strike of each domain were found by adjusting a plane to best fit the
dip and strike of the domain. The details of this plane were then recorded and added to the drill data
in the particular domain.
These dip and strike domains were used to create volume correction factors within the Z and Y
directions using the following formula:
Volume Correction Factor = Z Correction Factor × Y Correction Factor
where Z Correction Factor = 1/ sin (dip) and Y Correction Factor = Absolute (1/ sin (strike)).
The vein orientation domains are numbered and illustrated for the CM Lode and NM Lode in
Figure 14-12 and Figure 14-13. This process was not required for the 3D estimation method.
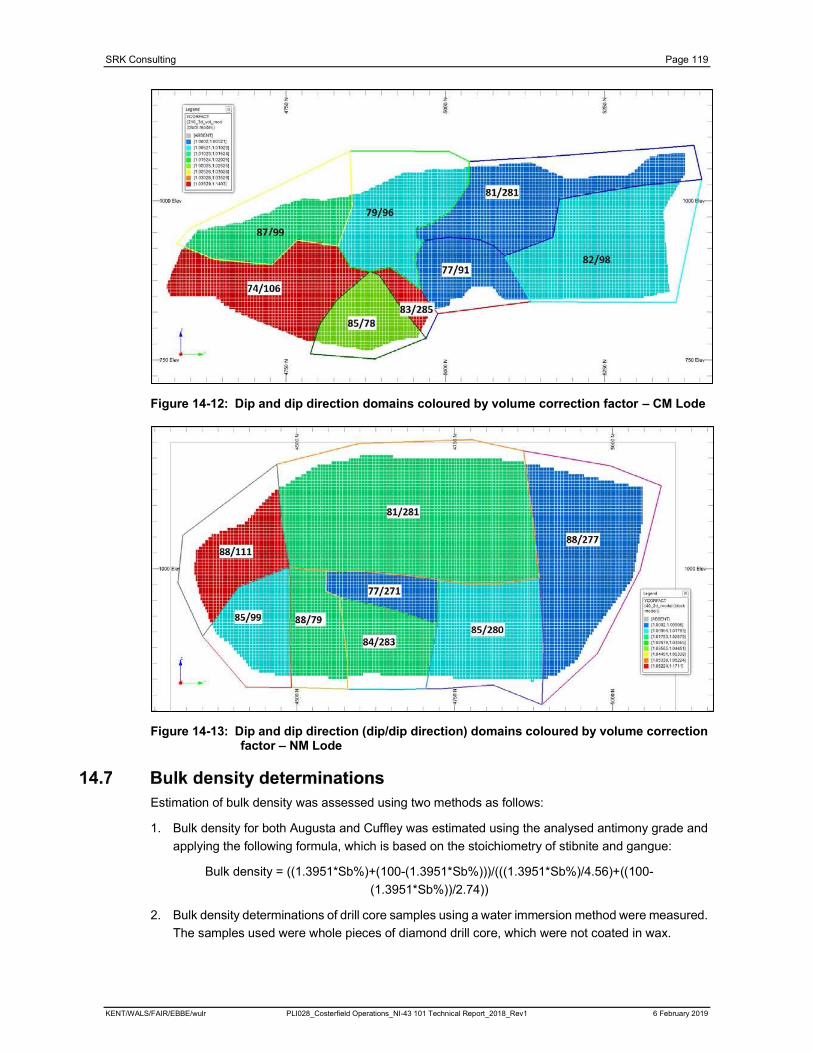
SRK Consulting Page 119
KENT/WALS/FAIR/EBBE/wulr PLI028_Costerfield Operations_NI-43 101 Technical Report_2018_Rev1 6 February 2019
Figure 14-12: Dip and dip direction domains coloured by volume correction factor – CM Lode
Figure 14-13: Dip and dip direction (dip/dip direction) domains coloured by volume correction factor – NM Lode
Estimation of bulk density was assessed using two methods as follows:
1. Bulk density for both Augusta and Cuffley was estimated using the analysed antimony grade and
applying the following formula, which is based on the stoichiometry of stibnite and gangue:
Bulk density = ((1.3951*Sb%)+(100-(1.3951*Sb%)))/(((1.3951*Sb%)/4.56)+((100-
(1.3951*Sb%))/2.74))
2. Bulk density determinations of drill core samples using a water immersion method were measured.
The samples used were whole pieces of diamond drill core, which were not coated in wax.
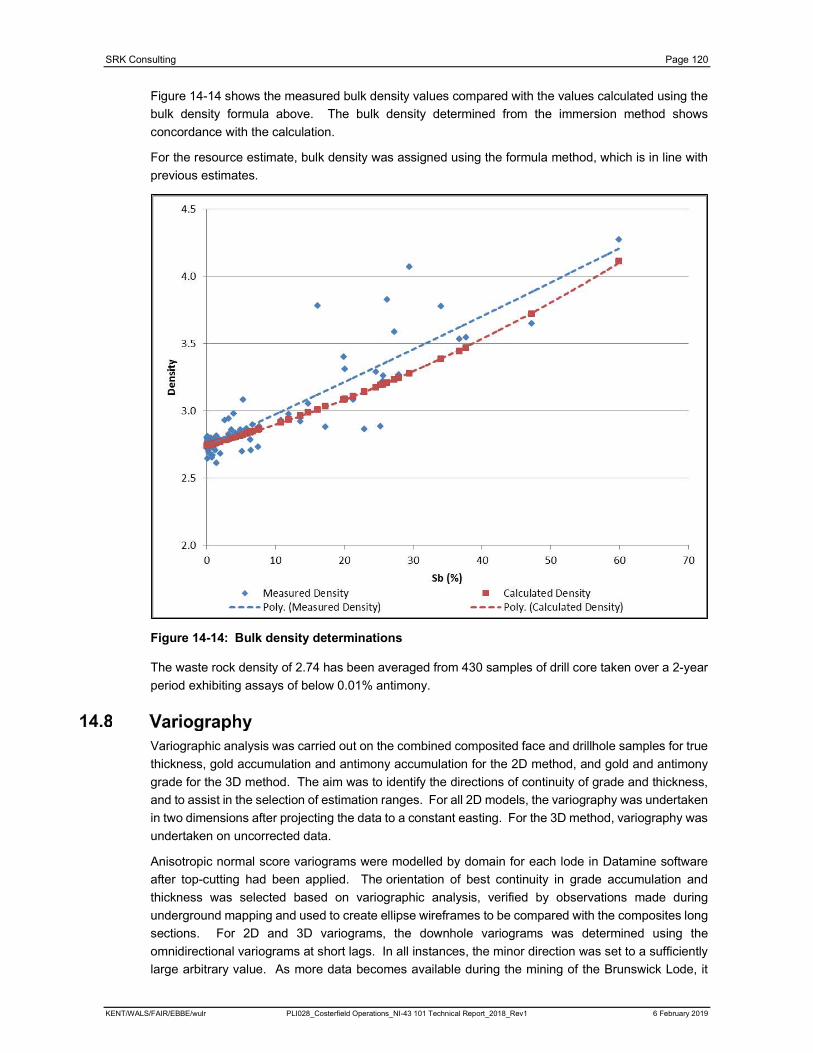
SRK Consulting Page 120
KENT/WALS/FAIR/EBBE/wulr PLI028_Costerfield Operations_NI-43 101 Technical Report_2018_Rev1 6 February 2019
Figure 14-14 shows the measured bulk density values compared with the values calculated using the
bulk density formula above. The bulk density determined from the immersion method shows
concordance with the calculation.
For the resource estimate, bulk density was assigned using the formula method, which is in line with
previous estimates.
Figure 14-14: Bulk density determinations
The waste rock density of 2.74 has been averaged from 430 samples of drill core taken over a 2-year
period exhibiting assays of below 0.01% antimony.
Variographic analysis was carried out on the combined composited face and drillhole samples for true
thickness, gold accumulation and antimony accumulation for the 2D method, and gold and antimony
grade for the 3D method. The aim was to identify the directions of continuity of grade and thickness,
and to assist in the selection of estimation ranges. For all 2D models, the variography was undertaken
in two dimensions after projecting the data to a constant easting. For the 3D method, variography was
undertaken on uncorrected data.
Anisotropic normal score variograms were modelled by domain for each lode in Datamine software
after top-cutting had been applied. The orientation of best continuity in grade accumulation and
thickness was selected based on variographic analysis, verified by observations made during
underground mapping and used to create ellipse wireframes to be compared with the composites long
sections. For 2D and 3D variograms, the downhole variograms was determined using the
omnidirectional variograms at short lags. In all instances, the minor direction was set to a sufficiently
large arbitrary value. As more data becomes available during the mining of the Brunswick Lode, it

SRK Consulting Page 121
KENT/WALS/FAIR/EBBE/wulr PLI028_Costerfield Operations_NI-43 101 Technical Report_2018_Rev1 6 February 2019
may be possible to conduct variographic analysis across the X direction. Examples of experimental,
final back-transformed variograms and variogram ellipses for Domain 1 in the W Lode are illustrated
in Figure 14-5 to Figure 14-23).
Figure 14-15: Major direction experimental variogram for gold accumulation in Domain 1 of W Lode
Figure 14-16: Semi-major experimental variogram for gold accumulation in Domain 1 of W Lode

SRK Consulting Page 122
KENT/WALS/FAIR/EBBE/wulr PLI028_Costerfield Operations_NI-43 101 Technical Report_2018_Rev1 6 February 2019
Figure 14-17: Long section view of W Lode Domain 1 composites coloured by gold accumulated grade and variogram used
Figure 14-18: Major direction experimental variogram for antimony accumulation in Domain 1 of W Lode
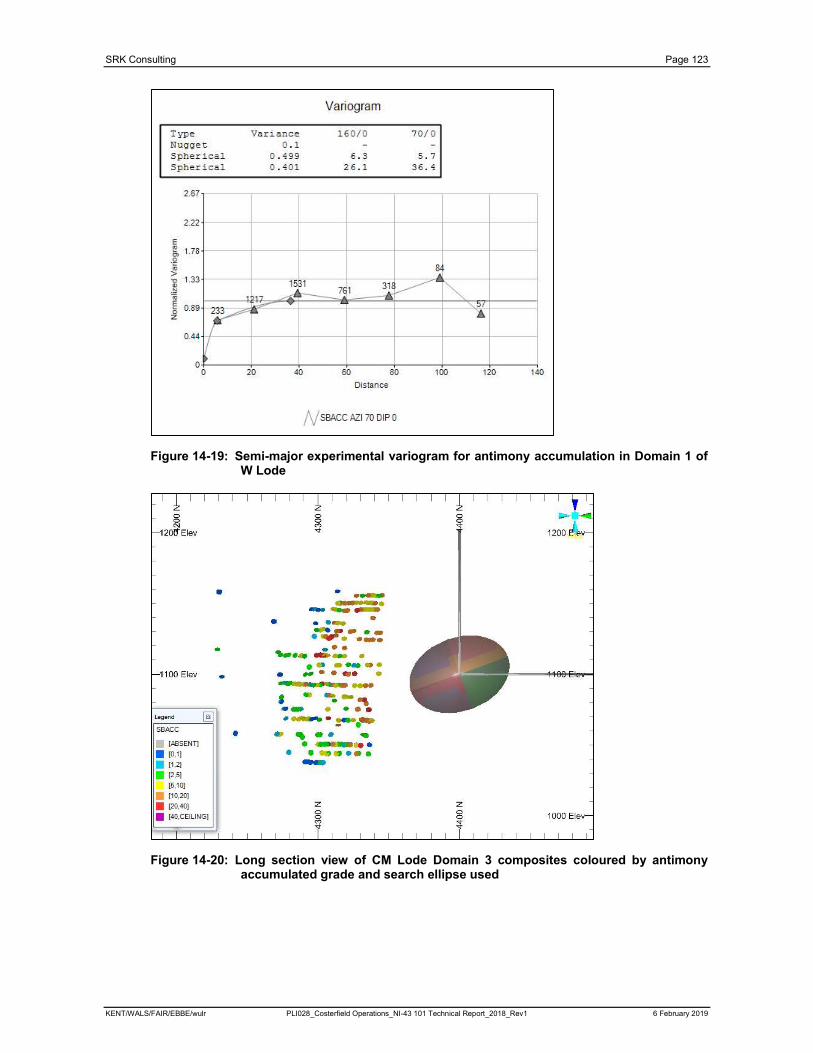
SRK Consulting Page 123
KENT/WALS/FAIR/EBBE/wulr PLI028_Costerfield Operations_NI-43 101 Technical Report_2018_Rev1 6 February 2019
Figure 14-19: Semi-major experimental variogram for antimony accumulation in Domain 1 of W Lode
Figure 14-20: Long section view of CM Lode Domain 3 composites coloured by antimony accumulated grade and search ellipse used
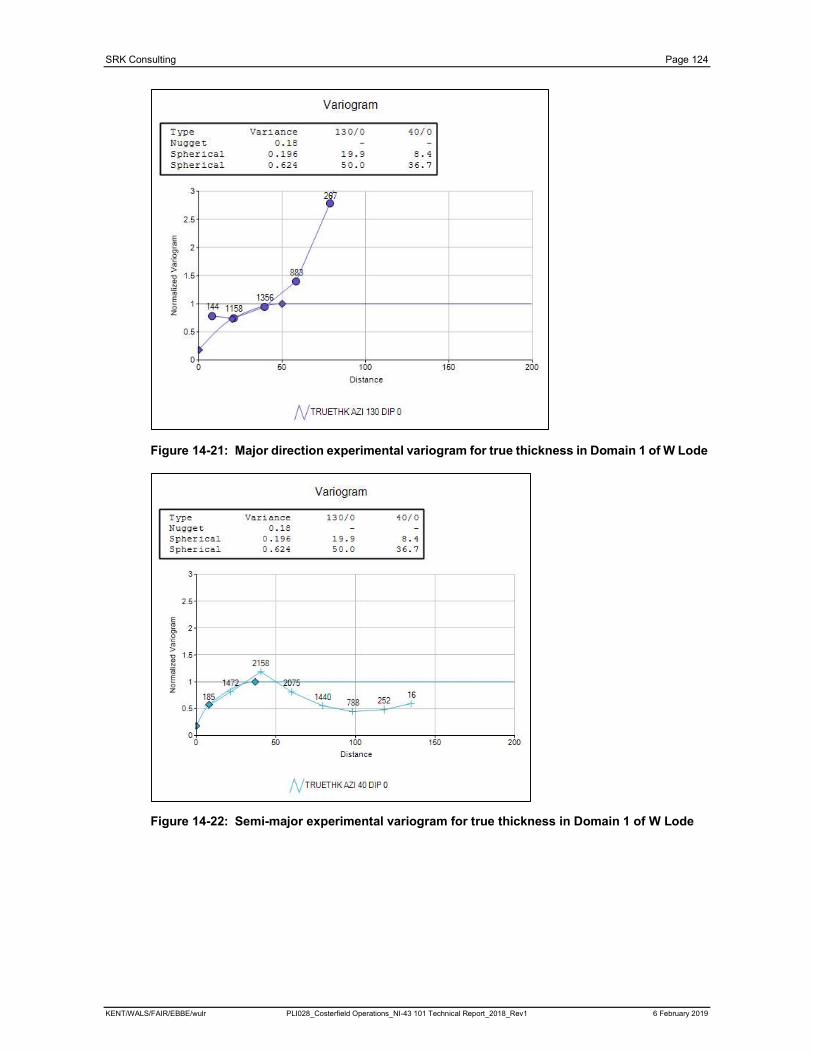
SRK Consulting Page 124
KENT/WALS/FAIR/EBBE/wulr PLI028_Costerfield Operations_NI-43 101 Technical Report_2018_Rev1 6 February 2019
Figure 14-21: Major direction experimental variogram for true thickness in Domain 1 of W Lode
Figure 14-22: Semi-major experimental variogram for true thickness in Domain 1 of W Lode
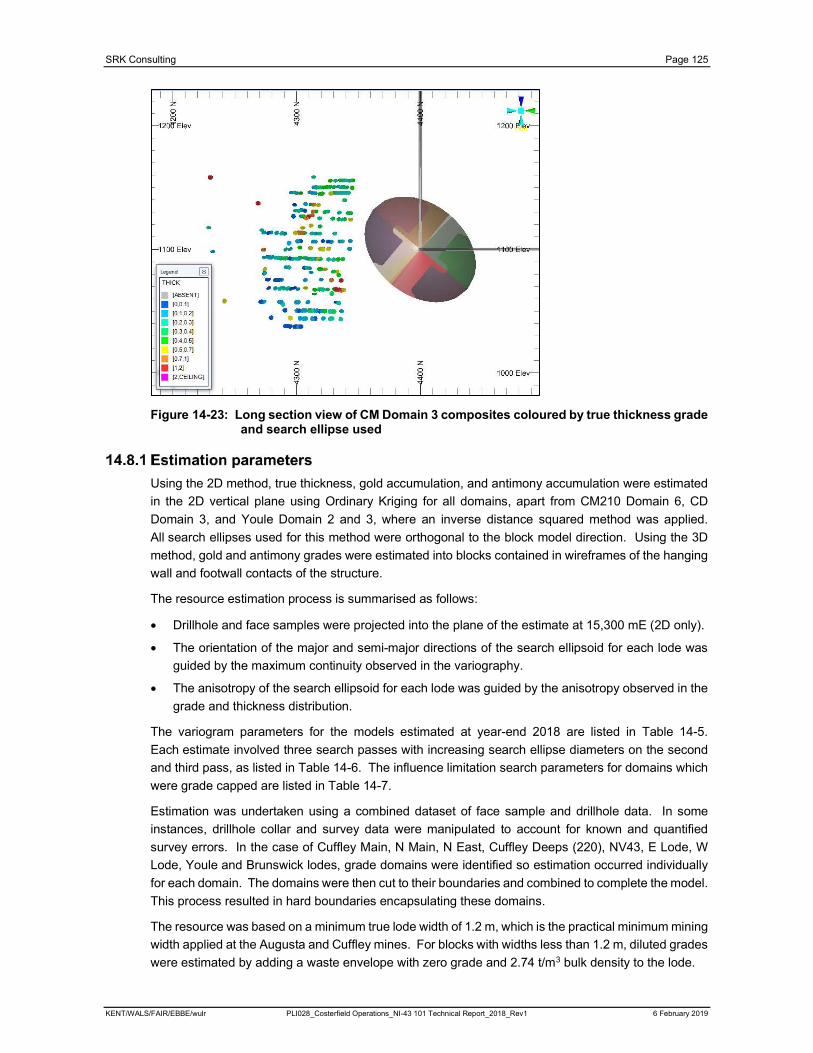
SRK Consulting Page 125
KENT/WALS/FAIR/EBBE/wulr PLI028_Costerfield Operations_NI-43 101 Technical Report_2018_Rev1 6 February 2019
Figure 14-23: Long section view of CM Domain 3 composites coloured by true thickness grade and search ellipse used
Using the 2D method, true thickness, gold accumulation, and antimony accumulation were estimated
in the 2D vertical plane using Ordinary Kriging for all domains, apart from CM210 Domain 6, CD
Domain 3, and Youle Domain 2 and 3, where an inverse distance squared method was applied.
All search ellipses used for this method were orthogonal to the block model direction. Using the 3D
method, gold and antimony grades were estimated into blocks contained in wireframes of the hanging
wall and footwall contacts of the structure.
The resource estimation process is summarised as follows:
Drillhole and face samples were projected into the plane of the estimate at 15,300 mE (2D only).
The orientation of the major and semi-major directions of the search ellipsoid for each lode was
guided by the maximum continuity observed in the variography.
The anisotropy of the search ellipsoid for each lode was guided by the anisotropy observed in the
grade and thickness distribution.
The variogram parameters for the models estimated at year-end 2018 are listed in Table 14-5.
Each estimate involved three search passes with increasing search ellipse diameters on the second
and third pass, as listed in Table 14-6. The influence limitation search parameters for domains which
were grade capped are listed in Table 14-7.
Estimation was undertaken using a combined dataset of face sample and drillhole data. In some
instances, drillhole collar and survey data were manipulated to account for known and quantified
survey errors. In the case of Cuffley Main, N Main, N East, Cuffley Deeps (220), NV43, E Lode, W
Lode, Youle and Brunswick lodes, grade domains were identified so estimation occurred individually
for each domain. The domains were then cut to their boundaries and combined to complete the model.
This process resulted in hard boundaries encapsulating these domains.
The resource was based on a minimum true lode width of 1.2 m, which is the practical minimum mining
width applied at the Augusta and Cuffley mines. For blocks with widths less than 1.2 m, diluted grades
were estimated by adding a waste envelope with zero grade and 2.74 t/m3 bulk density to the lode.

SRK Consulting Page 126
KENT/WALS/FAIR/EBBE/wulr PLI028_Costerfield Operations_NI-43 101 Technical Report_2018_Rev1 6 February 2019
Table 14-5: Variogram model parameters
Variable Lode DomainRotations Nugget First Spherical Structure Second Spherical Structure
Z Y X Major Semi-major Minor Sill Major Semi-major Minor Sill
Au Acc
CM 1
-90 -10 -90 0.35 20 11 30 0.313 39 25 30 0.337
Sb Acc -90 -70 -90 0.19 5 11 30 0.446 8 32 30 0.364
True Thickness -90 -10 -90 0.4 18 12 30 0.348 38 21 30 0.252
Au Acc
CM 2
-90 -10 -90 0.45 6 10 30 0.32 28 20 30 0.23
Sb Acc -90 -10 -90 0.35 8 10 30 0.25 32 12 30 0.4
True Thickness -90 -10 -90 0.4 7 11 30 0.305 60 19 30 0.295
Au Acc
CM 3
-90 -30 -90 0.36 38 21 30 0.467 54 32 30 0.173
Sb Acc -90 -20 -90 0.22 28 10 30 0.597 45 21 30 0.183
True Thickness -90 -30 -90 0.3 24 17 30 0.531 65 38 30 0.169
Au Acc
CM 4
-90 -10 -90 0.2 9 5 30 0.553 20 12 30 0.247
Sb Acc -90 -80 -90 0.33 12 3 30 0.262 19 7 30 0.408
True Thickness -90 -50 -90 0.2 21 9 30 0.508 61 11 30 0.292
Au Acc
CM 5
-90 -70 -90 0.4 15 24 30 0.249 19 35 30 0.351
Sb Acc -90 -70 -90 0.3 15 26 30 0.218 19 37 30 0.482
True Thickness -90 -70 -90 0.4 15 31 30 0.07 20 42 30 0.53
AuAcc
NM 1
-90 -10 -90 0.2 6 6 20 0.033 14 14 20 0.767
SbAcc -90 -20 -90 0.2 6 8 30 0.331 21 19 30 0.469
True Thickness -90 -30 -90 0.1 7 12 70 0.13 15 21 70 0.77
AuAcc
NM 2
-90 -20 -90 0.3 3 11 25 0.1 8 17 25 0.6
SbAcc -90 -20 -90 0.3 12 11 30 0.305 32 18 30 0.395
True Thickness -90 -20 -90 0.1 3 3 25 0.165 16 12 25 0.735
AuAcc
NM 3
-90 -60 -90 0.2 22 28 30 0.706 142 128 30 0.094
SbAcc -90 -60 -90 0.18 18 20 30 0.473 47 64 30 0.347
True Thickness -90 -30 -90 0.05 17 8 83 0.358 54 47 167 0.592
AuAcc
NM 4
-90 -70 -90 0.3 7 10 83 0.174 19 41 167 0.526
SbAcc -90 -40 -90 0.25 7 8 83 0.239 30 34 167 0.511
True Thickness -90 -70 -90 0.31 11 15 30 0.404 20 49 30 0.286
AuAcc
NM 5
-90 -20 -90 0.2 5 4 67 0.435 35 16 133 0.365
SbAcc -90 -50 -90 0.1 5 10 40 0.211 21 24 40 0.689
True Thickness -90 -20 -90 0.1 7 6 33 0.235 25 19 67 0.665
AuBRU 1
90 40 -90 0.32 12 11 9.5 0.044 42 34 16 0.636
Sb 90 80 -90 0.259 46 15 20 0.161 117 30 20 0.58
Au BRU 2 0 -90 0 0.35 7 10 7 0.219 18 33 18 0.431
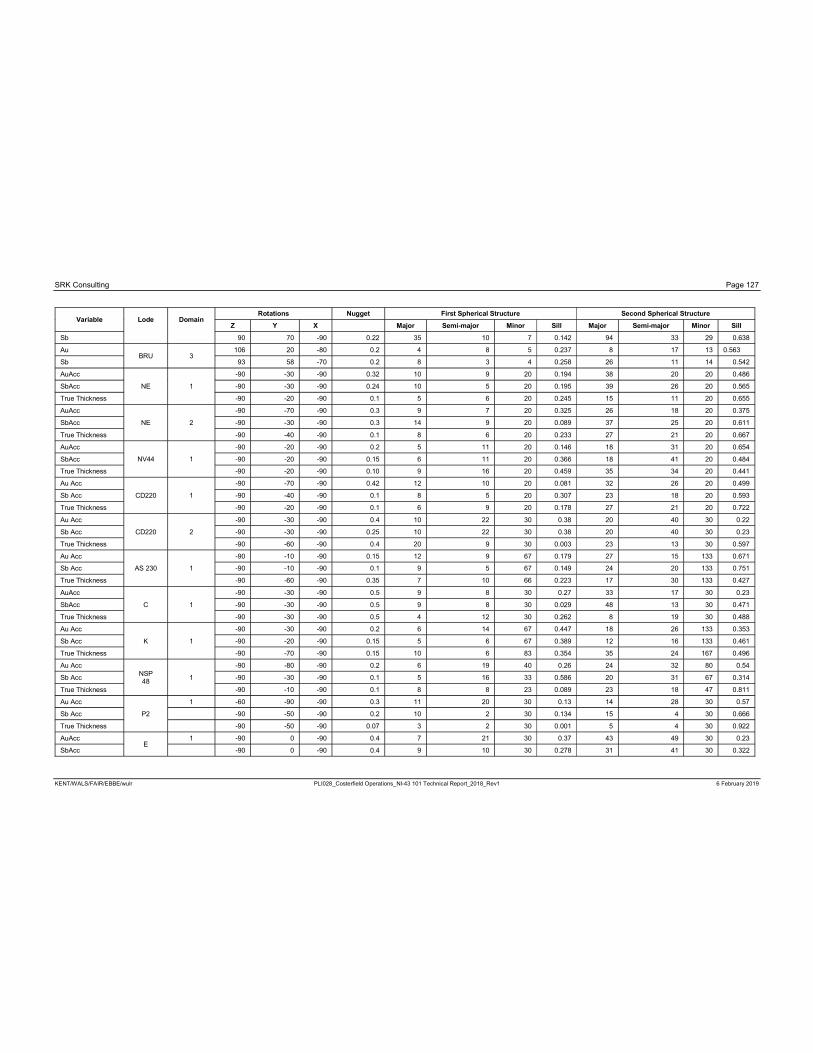
SRK Consulting Page 127
KENT/WALS/FAIR/EBBE/wulr PLI028_Costerfield Operations_NI-43 101 Technical Report_2018_Rev1 6 February 2019
Variable Lode DomainRotations Nugget First Spherical Structure Second Spherical Structure
Z Y X Major Semi-major Minor Sill Major Semi-major Minor Sill
Sb 90 70 -90 0.22 35 10 7 0.142 94 33 29 0.638
AuBRU 3
106 20 -80 0.2 4 8 5 0.237 8 17 13 0.563
Sb 93 58 -70 0.2 8 3 4 0.258 26 11 14 0.542
AuAcc
NE 1
-90 -30 -90 0.32 10 9 20 0.194 38 20 20 0.486
SbAcc -90 -30 -90 0.24 10 5 20 0.195 39 26 20 0.565
True Thickness -90 -20 -90 0.1 5 6 20 0.245 15 11 20 0.655
AuAcc
NE 2
-90 -70 -90 0.3 9 7 20 0.325 26 18 20 0.375
SbAcc -90 -30 -90 0.3 14 9 20 0.089 37 25 20 0.611
True Thickness -90 -40 -90 0.1 8 6 20 0.233 27 21 20 0.667
AuAcc
NV44 1
-90 -20 -90 0.2 5 11 20 0.146 18 31 20 0.654
SbAcc -90 -20 -90 0.15 6 11 20 0.366 18 41 20 0.484
True Thickness -90 -20 -90 0.10 9 16 20 0.459 35 34 20 0.441
Au Acc
CD220 1
-90 -70 -90 0.42 12 10 20 0.081 32 26 20 0.499
Sb Acc -90 -40 -90 0.1 8 5 20 0.307 23 18 20 0.593
True Thickness -90 -20 -90 0.1 6 9 20 0.178 27 21 20 0.722
Au Acc
CD220 2
-90 -30 -90 0.4 10 22 30 0.38 20 40 30 0.22
Sb Acc -90 -30 -90 0.25 10 22 30 0.38 20 40 30 0.23
True Thickness -90 -60 -90 0.4 20 9 30 0.003 23 13 30 0.597
Au Acc
AS 230 1
-90 -10 -90 0.15 12 9 67 0.179 27 15 133 0.671
Sb Acc -90 -10 -90 0.1 9 5 67 0.149 24 20 133 0.751
True Thickness -90 -60 -90 0.35 7 10 66 0.223 17 30 133 0.427
AuAcc
C 1
-90 -30 -90 0.5 9 8 30 0.27 33 17 30 0.23
SbAcc -90 -30 -90 0.5 9 8 30 0.029 48 13 30 0.471
True Thickness -90 -30 -90 0.5 4 12 30 0.262 8 19 30 0.488
Au Acc
K 1
-90 -30 -90 0.2 6 14 67 0.447 18 26 133 0.353
Sb Acc -90 -20 -90 0.15 5 6 67 0.389 12 16 133 0.461
True Thickness -90 -70 -90 0.15 10 6 83 0.354 35 24 167 0.496
Au AccNSP48
1
-90 -80 -90 0.2 6 19 40 0.26 24 32 80 0.54
Sb Acc -90 -30 -90 0.1 5 16 33 0.586 20 31 67 0.314
True Thickness -90 -10 -90 0.1 8 8 23 0.089 23 18 47 0.811
Au Acc
P2
1 -60 -90 -90 0.3 11 20 30 0.13 14 28 30 0.57
Sb Acc -90 -50 -90 0.2 10 2 30 0.134 15 4 30 0.666
True Thickness -90 -50 -90 0.07 3 2 30 0.001 5 4 30 0.922
AuAccE
1 -90 0 -90 0.4 7 21 30 0.37 43 49 30 0.23
SbAcc -90 0 -90 0.4 9 10 30 0.278 31 41 30 0.322
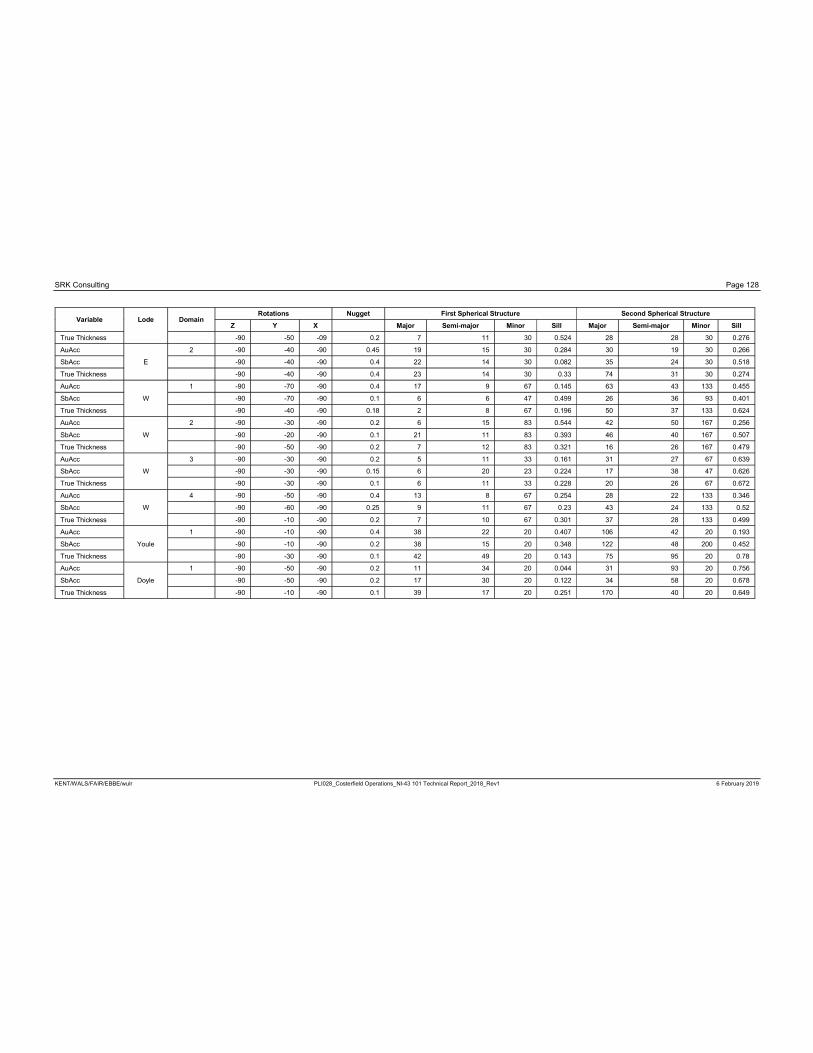
SRK Consulting Page 128
KENT/WALS/FAIR/EBBE/wulr PLI028_Costerfield Operations_NI-43 101 Technical Report_2018_Rev1 6 February 2019
Variable Lode DomainRotations Nugget First Spherical Structure Second Spherical Structure
Z Y X Major Semi-major Minor Sill Major Semi-major Minor Sill
True Thickness -90 -50 -09 0.2 7 11 30 0.524 28 28 30 0.276
AuAcc
E
2 -90 -40 -90 0.45 19 15 30 0.284 30 19 30 0.266
SbAcc -90 -40 -90 0.4 22 14 30 0.082 35 24 30 0.518
True Thickness -90 -40 -90 0.4 23 14 30 0.33 74 31 30 0.274
AuAcc
W
1 -90 -70 -90 0.4 17 9 67 0.145 63 43 133 0.455
SbAcc -90 -70 -90 0.1 6 6 47 0.499 26 36 93 0.401
True Thickness -90 -40 -90 0.18 2 8 67 0.196 50 37 133 0.624
AuAcc
W
2 -90 -30 -90 0.2 6 15 83 0.544 42 50 167 0.256
SbAcc -90 -20 -90 0.1 21 11 83 0.393 46 40 167 0.507
True Thickness -90 -50 -90 0.2 7 12 83 0.321 16 26 167 0.479
AuAcc
W
3 -90 -30 -90 0.2 5 11 33 0.161 31 27 67 0.639
SbAcc -90 -30 -90 0.15 6 20 23 0.224 17 38 47 0.626
True Thickness -90 -30 -90 0.1 6 11 33 0.228 20 26 67 0.672
AuAcc
W
4 -90 -50 -90 0.4 13 8 67 0.254 28 22 133 0.346
SbAcc -90 -60 -90 0.25 9 11 67 0.23 43 24 133 0.52
True Thickness -90 -10 -90 0.2 7 10 67 0.301 37 28 133 0.499
AuAcc
Youle
1 -90 -10 -90 0.4 38 22 20 0.407 106 42 20 0.193
SbAcc -90 -10 -90 0.2 38 15 20 0.348 122 48 200 0.452
True Thickness -90 -30 -90 0.1 42 49 20 0.143 75 95 20 0.78
AuAcc
Doyle
1 -90 -50 -90 0.2 11 34 20 0.044 31 93 20 0.756
SbAcc -90 -50 -90 0.2 17 30 20 0.122 34 58 20 0.678
True Thickness -90 -10 -90 0.1 39 17 20 0.251 170 40 20 0.649
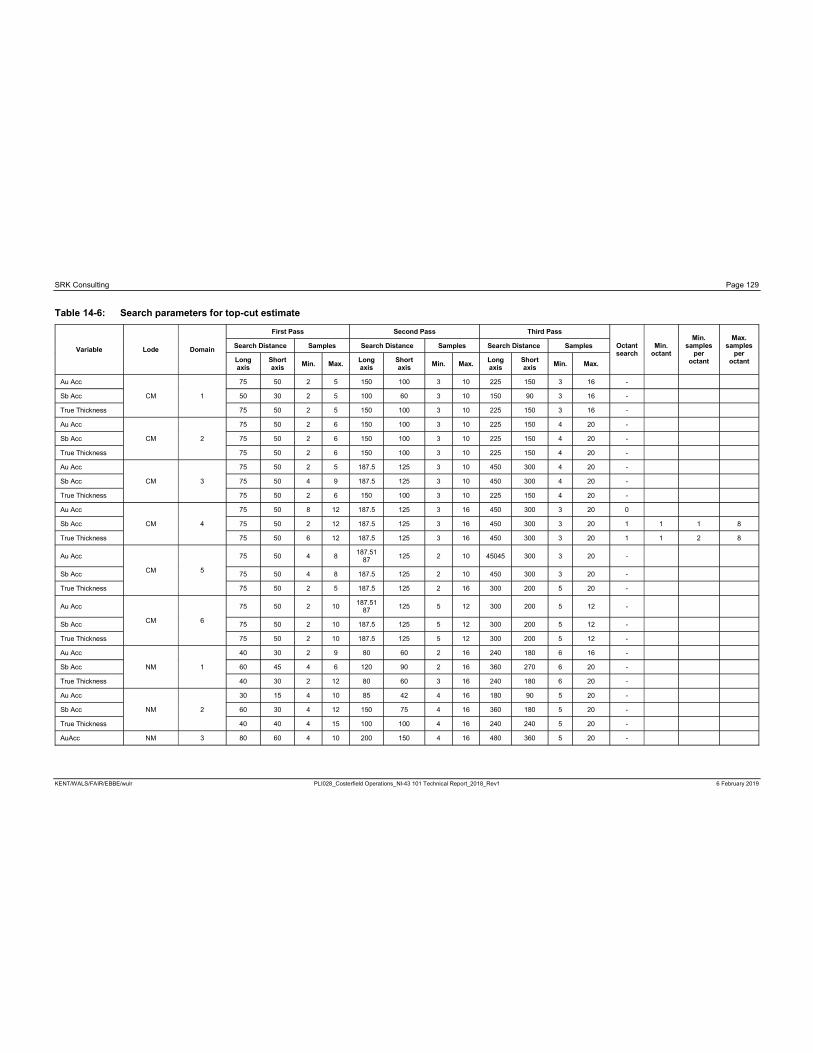
SRK Consulting Page 129
KENT/WALS/FAIR/EBBE/wulr PLI028_Costerfield Operations_NI-43 101 Technical Report_2018_Rev1 6 February 2019
Table 14-6: Search parameters for top-cut estimate
Variable Lode Domain
First Pass Second Pass Third Pass
Octant search
Min.octant
Min.samples
per octant
Max.samples
per octant
Search Distance Samples Search Distance Samples Search Distance Samples
Longaxis
Short axis
Min. Max.Longaxis
Short axis
Min. Max.Longaxis
Short axis
Min. Max.
Au Acc
CM 1
75 50 2 5 150 100 3 10 225 150 3 16 -
Sb Acc 50 30 2 5 100 60 3 10 150 90 3 16 -
True Thickness 75 50 2 5 150 100 3 10 225 150 3 16 -
Au Acc
CM 2
75 50 2 6 150 100 3 10 225 150 4 20 -
Sb Acc 75 50 2 6 150 100 3 10 225 150 4 20 -
True Thickness 75 50 2 6 150 100 3 10 225 150 4 20 -
Au Acc
CM 3
75 50 2 5 187.5 125 3 10 450 300 4 20 -
Sb Acc 75 50 4 9 187.5 125 3 10 450 300 4 20 -
True Thickness 75 50 2 6 150 100 3 10 225 150 4 20 -
Au Acc
CM 4
75 50 8 12 187.5 125 3 16 450 300 3 20 0
Sb Acc 75 50 2 12 187.5 125 3 16 450 300 3 20 1 1 1 8
True Thickness 75 50 6 12 187.5 125 3 16 450 300 3 20 1 1 2 8
Au Acc
CM 5
75 50 4 8187.51
87125 2 10 45045 300 3 20 -
Sb Acc 75 50 4 8 187.5 125 2 10 450 300 3 20 -
True Thickness 75 50 2 5 187.5 125 2 16 300 200 5 20 -
Au Acc
CM 6
75 50 2 10187.51
87125 5 12 300 200 5 12 -
Sb Acc 75 50 2 10 187.5 125 5 12 300 200 5 12 -
True Thickness 75 50 2 10 187.5 125 5 12 300 200 5 12 -
Au Acc
NM 1
40 30 2 9 80 60 2 16 240 180 6 16 -
Sb Acc 60 45 4 6 120 90 2 16 360 270 6 20 -
True Thickness 40 30 2 12 80 60 3 16 240 180 6 20 -
Au Acc
NM 2
30 15 4 10 85 42 4 16 180 90 5 20 -
Sb Acc 60 30 4 12 150 75 4 16 360 180 5 20 -
True Thickness 40 40 4 15 100 100 4 16 240 240 5 20 -
AuAcc NM 3 80 60 4 10 200 150 4 16 480 360 5 20 -

SRK Consulting Page 130
KENT/WALS/FAIR/EBBE/wulr PLI028_Costerfield Operations_NI-43 101 Technical Report_2018_Rev1 6 February 2019
Variable Lode Domain
First Pass Second Pass Third Pass
Octant search
Min.octant
Min.samples
per octant
Max.samples
per octant
Search Distance Samples Search Distance Samples Search Distance Samples
Longaxis
Short axis
Min. Max.Longaxis
Short axis
Min. Max.Longaxis
Short axis
Min. Max.
SbAcc 75 50 2 12 187.5 125 3 16 450 300 4 20 -
True Thickness 75 50 3 12 187.5 125 4 16 450 300 5 20 -
Au Acc
NM 4
60 30 3 9 150 855187 4 12 360 180 6 20 -
Sb Acc 60 40 4 8 180 100 4 12 360 240 6 20 -
True Thickness 100 75 4 12 250 187.5 4 12 600 450 6 20 -
AuAcc
NM 5
60 30 4 8 150 75 2 10 360 180 3 20 -
SbAcc 50 40 6 10 125 100 3 10 300 240 3 20 -
True Thickness 50 40 3 5 125 100 2 10 300 240 3 20 -
AuBRU 1
80 60 6 8 160 120 2 8 240 180 3 16 -
Sb 100 70 4 8 200 140 3 8 300 210 3 16 -
AuBRU 2
100 60 4 5 250 150 2 8 300 180 3 16 -
Sb 100 50 4 5 250 125 3 16 300 150 3 16 -
AuBRU 3
60 40 6 8 120 80 2 8 180 120 3 16 -
Sb 60 20 4 8 120 40 2 8 180 60 3 16 -
AuAcc
BRUKR 1
60 40 2 5 120 80 3 10 180 120 3 16 -
SbAcc 50 30 2 5 100 60 3 10 150 90 3 16 -
True Thickness 80 60 2 5 160 120 3 10 240 180 3 16 -
AuAcc
NE 1
40 20 3 8 80 40 3 8 160 80 3 16 -
SbAcc 40 25 3 8 80 50 3 8 160 100 3 16 -
True Thickness 30 20 3 8 60 40 3 8 120 80 3 16 -
AuAcc
NE 2
30 20 3 8 60 40 2 10 120 80 3 16
SbAcc 40 25 3 8 80 50 2 10 160 100 3 16
True Thickness 30 20 3 8 60 40 2 10 120 80 3 16
AuAcc
NV43 1
25 20 3 5 50 40 2 6 75 60 1 15 -
SbAcc 80 30 2 6 160 60 2 6 240 90 1 15 -
True Thickness 60 40 2 8 120 80 3 8 180 120 1 15 -
AuAccNV43 2
80 40 3 6 160 80 2 6 240 120 1 15 -
SbAcc 60 50 2 6 120 100 2 6 180 150 1 15 -
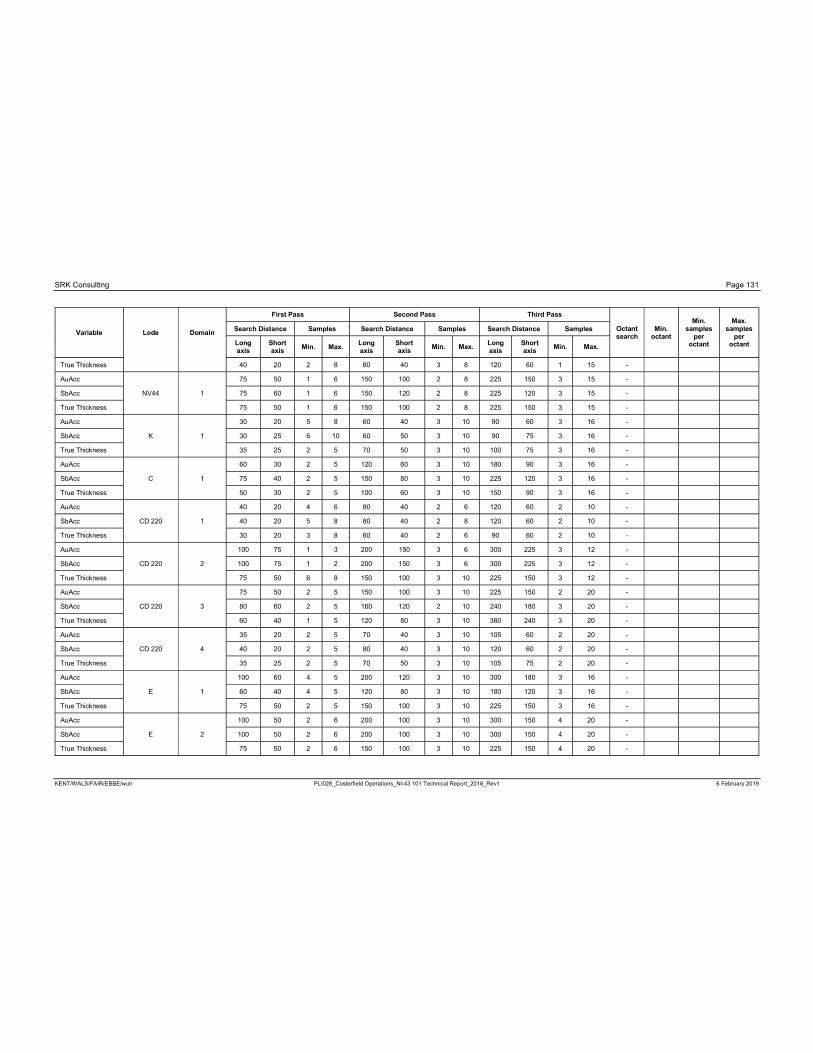
SRK Consulting Page 131
KENT/WALS/FAIR/EBBE/wulr PLI028_Costerfield Operations_NI-43 101 Technical Report_2018_Rev1 6 February 2019
Variable Lode Domain
First Pass Second Pass Third Pass
Octant search
Min.octant
Min.samples
per octant
Max.samples
per octant
Search Distance Samples Search Distance Samples Search Distance Samples
Longaxis
Short axis
Min. Max.Longaxis
Short axis
Min. Max.Longaxis
Short axis
Min. Max.
True Thickness 40 20 2 8 80 40 3 8 120 60 1 15 -
AuAcc
NV44 1
75 50 1 6 150 100 2 8 225 150 3 15 -
SbAcc 75 60 1 6 150 120 2 8 225 120 3 15 -
True Thickness 75 50 1 6 150 100 2 8 225 150 3 15 -
AuAcc
K 1
30 20 5 8 60 40 3 10 90 60 3 16 -
SbAcc 30 25 6 10 60 50 3 10 90 75 3 16 -
True Thickness 35 25 2 5 70 50 3 10 100 75 3 16 -
AuAcc
C 1
60 30 2 5 120 60 3 10 180 90 3 16 -
SbAcc 75 40 2 5 150 80 3 10 225 120 3 16 -
True Thickness 50 30 2 5 100 60 3 10 150 90 3 16 -
AuAcc
CD 220 1
40 20 4 6 80 40 2 6 120 60 2 10 -
SbAcc 40 20 5 8 80 40 2 8 120 60 2 10 -
True Thickness 30 20 3 8 60 40 2 6 90 60 2 10 -
AuAcc
CD 220 2
100 75 1 3 200 150 3 6 300 225 3 12 -
SbAcc 100 75 1 2 200 150 3 6 300 225 3 12 -
True Thickness 75 50 6 8 150 100 3 10 225 150 3 12 -
AuAcc
CD 220 3
75 50 2 5 150 100 3 10 225 150 2 20 -
SbAcc 80 60 2 5 160 120 2 10 240 180 3 20 -
True Thickness 60 40 1 5 120 80 3 10 360 240 3 20 -
AuAcc
CD 220 4
35 20 2 5 70 40 3 10 105 60 2 20 -
SbAcc 40 20 2 5 80 40 3 10 120 60 2 20 -
True Thickness 35 25 2 5 70 50 3 10 105 75 2 20 -
AuAcc
E 1
100 60 4 5 200 120 3 10 300 180 3 16 -
SbAcc 60 40 4 5 120 80 3 10 180 120 3 16 -
True Thickness 75 50 2 5 150 100 3 10 225 150 3 16 -
AuAcc
E 2
100 50 2 6 200 100 3 10 300 150 4 20 -
SbAcc 100 50 2 6 200 100 3 10 300 150 4 20 -
True Thickness 75 50 2 6 150 100 3 10 225 150 4 20 -
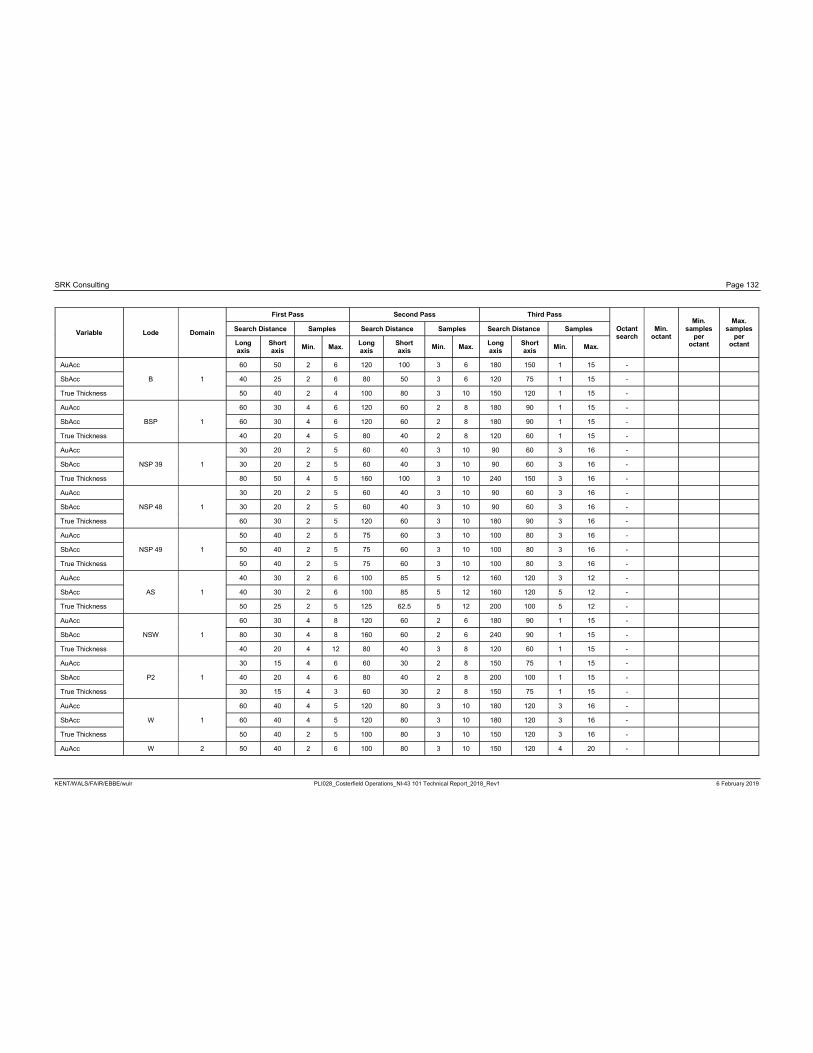
SRK Consulting Page 132
KENT/WALS/FAIR/EBBE/wulr PLI028_Costerfield Operations_NI-43 101 Technical Report_2018_Rev1 6 February 2019
Variable Lode Domain
First Pass Second Pass Third Pass
Octant search
Min.octant
Min.samples
per octant
Max.samples
per octant
Search Distance Samples Search Distance Samples Search Distance Samples
Longaxis
Short axis
Min. Max.Longaxis
Short axis
Min. Max.Longaxis
Short axis
Min. Max.
AuAcc
B 1
60 50 2 6 120 100 3 6 180 150 1 15 -
SbAcc 40 25 2 6 80 50 3 6 120 75 1 15 -
True Thickness 50 40 2 4 100 80 3 10 150 120 1 15 -
AuAcc
BSP 1
60 30 4 6 120 60 2 8 180 90 1 15 -
SbAcc 60 30 4 6 120 60 2 8 180 90 1 15 -
True Thickness 40 20 4 5 80 40 2 8 120 60 1 15 -
AuAcc
NSP 39 1
30 20 2 5 60 40 3 10 90 60 3 16 -
SbAcc 30 20 2 5 60 40 3 10 90 60 3 16 -
True Thickness 80 50 4 5 160 100 3 10 240 150 3 16 -
AuAcc
NSP 48 1
30 20 2 5 60 40 3 10 90 60 3 16 -
SbAcc 30 20 2 5 60 40 3 10 90 60 3 16 -
True Thickness 60 30 2 5 120 60 3 10 180 90 3 16 -
AuAcc
NSP 49 1
50 40 2 5 75 60 3 10 100 80 3 16 -
SbAcc 50 40 2 5 75 60 3 10 100 80 3 16 -
True Thickness 50 40 2 5 75 60 3 10 100 80 3 16 -
AuAcc
AS 1
40 30 2 6 100 85 5 12 160 120 3 12 -
SbAcc 40 30 2 6 100 85 5 12 160 120 5 12 -
True Thickness 50 25 2 5 125 62.5 5 12 200 100 5 12 -
AuAcc
NSW 1
60 30 4 8 120 60 2 6 180 90 1 15 -
SbAcc 80 30 4 8 160 60 2 6 240 90 1 15 -
True Thickness 40 20 4 12 80 40 3 8 120 60 1 15 -
AuAcc
P2 1
30 15 4 6 60 30 2 8 150 75 1 15 -
SbAcc 40 20 4 6 80 40 2 8 200 100 1 15 -
True Thickness 30 15 4 3 60 30 2 8 150 75 1 15 -
AuAcc
W 1
60 40 4 5 120 80 3 10 180 120 3 16 -
SbAcc 60 40 4 5 120 80 3 10 180 120 3 16 -
True Thickness 50 40 2 5 100 80 3 10 150 120 3 16 -
AuAcc W 2 50 40 2 6 100 80 3 10 150 120 4 20 -
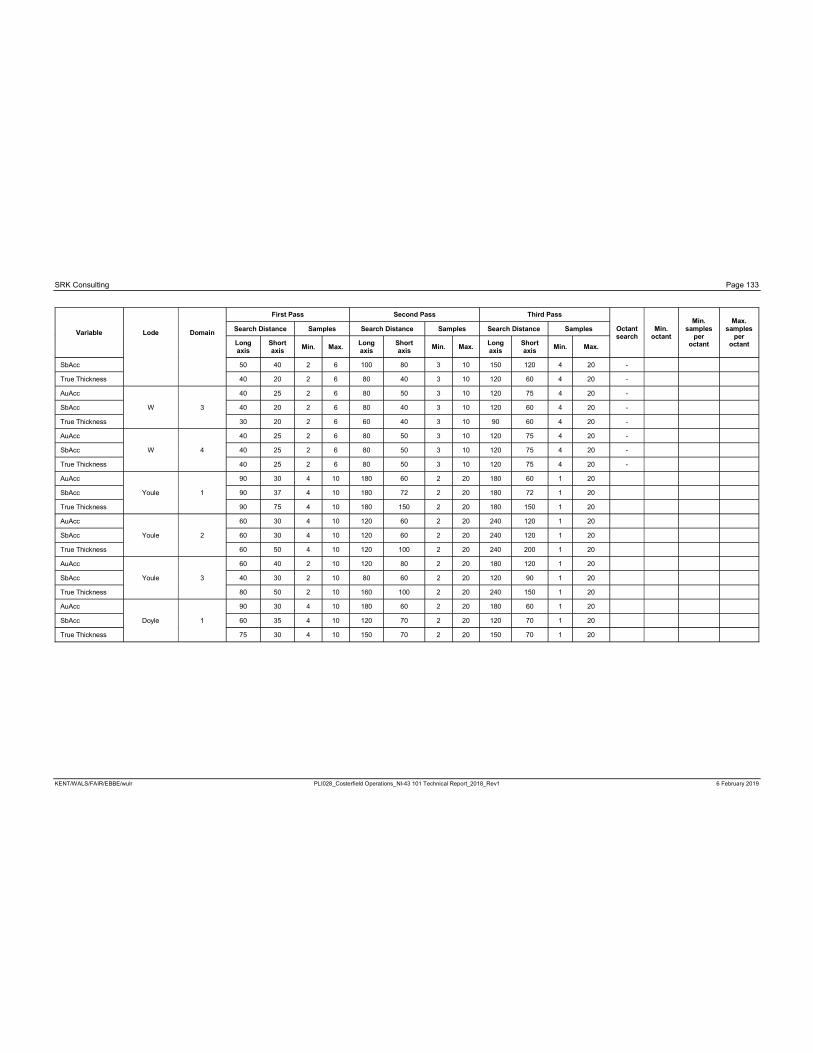
SRK Consulting Page 133
KENT/WALS/FAIR/EBBE/wulr PLI028_Costerfield Operations_NI-43 101 Technical Report_2018_Rev1 6 February 2019
Variable Lode Domain
First Pass Second Pass Third Pass
Octant search
Min.octant
Min.samples
per octant
Max.samples
per octant
Search Distance Samples Search Distance Samples Search Distance Samples
Longaxis
Short axis
Min. Max.Longaxis
Short axis
Min. Max.Longaxis
Short axis
Min. Max.
SbAcc 50 40 2 6 100 80 3 10 150 120 4 20 -
True Thickness 40 20 2 6 80 40 3 10 120 60 4 20 -
AuAcc
W 3
40 25 2 6 80 50 3 10 120 75 4 20 -
SbAcc 40 20 2 6 80 40 3 10 120 60 4 20 -
True Thickness 30 20 2 6 60 40 3 10 90 60 4 20 -
AuAcc
W 4
40 25 2 6 80 50 3 10 120 75 4 20 -
SbAcc 40 25 2 6 80 50 3 10 120 75 4 20 -
True Thickness 40 25 2 6 80 50 3 10 120 75 4 20 -
AuAcc
Youle 1
90 30 4 10 180 60 2 20 180 60 1 20
SbAcc 90 37 4 10 180 72 2 20 180 72 1 20
True Thickness 90 75 4 10 180 150 2 20 180 150 1 20
AuAcc
Youle 2
60 30 4 10 120 60 2 20 240 120 1 20
SbAcc 60 30 4 10 120 60 2 20 240 120 1 20
True Thickness 60 50 4 10 120 100 2 20 240 200 1 20
AuAcc
Youle 3
60 40 2 10 120 80 2 20 180 120 1 20
SbAcc 40 30 2 10 80 60 2 20 120 90 1 20
True Thickness 80 50 2 10 160 100 2 20 240 150 1 20
AuAcc
Doyle 1
90 30 4 10 180 60 2 20 180 60 1 20
SbAcc 60 35 4 10 120 70 2 20 120 70 1 20
True Thickness 75 30 4 10 150 70 2 20 150 70 1 20
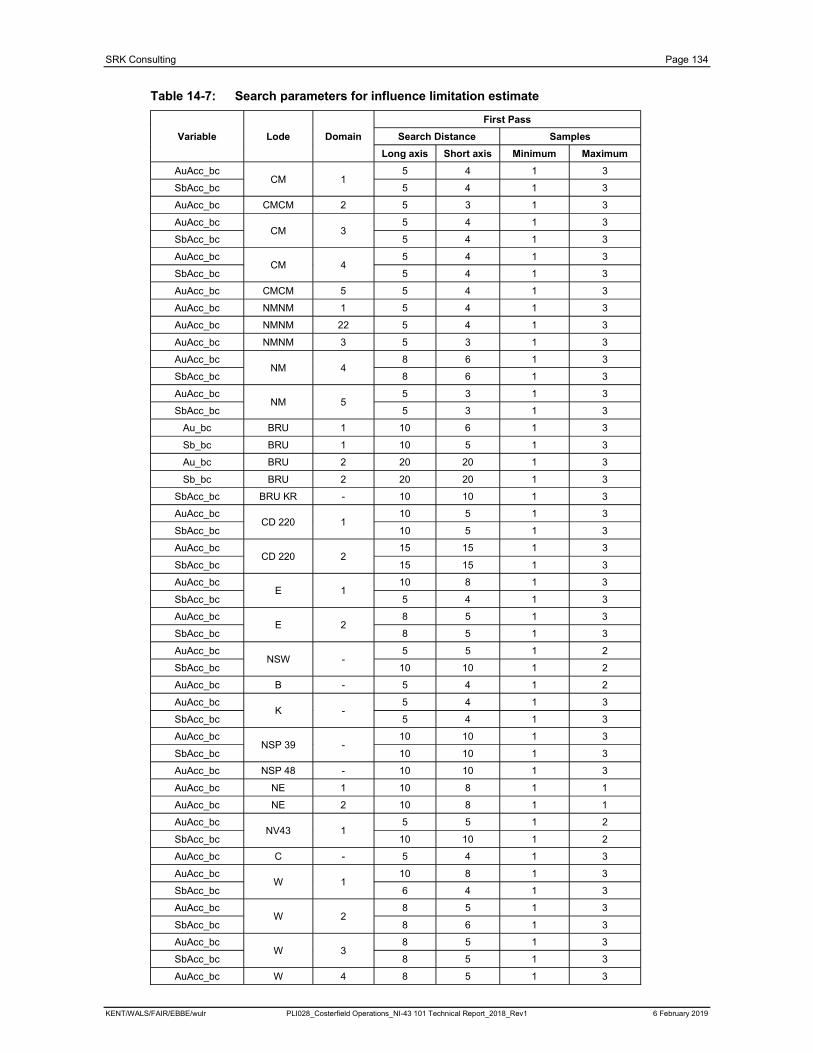
SRK Consulting Page 134
KENT/WALS/FAIR/EBBE/wulr PLI028_Costerfield Operations_NI-43 101 Technical Report_2018_Rev1 6 February 2019
Table 14-7: Search parameters for influence limitation estimate
Variable Lode Domain
First Pass
Search Distance Samples
Long axis Short axis Minimum Maximum
AuAcc_bcCM 1
5 4 1 3
SbAcc_bc 5 4 1 3
AuAcc_bc CMCM 2 5 3 1 3
AuAcc_bcCM 3
5 4 1 3
SbAcc_bc 5 4 1 3
AuAcc_bcCM 4
5 4 1 3
SbAcc_bc 5 4 1 3
AuAcc_bc CMCM 5 5 4 1 3
AuAcc_bc NMNM 1 5 4 1 3
AuAcc_bc NMNM 22 5 4 1 3
AuAcc_bc NMNM 3 5 3 1 3
AuAcc_bcNM 4
8 6 1 3
SbAcc_bc 8 6 1 3
AuAcc_bcNM 5
5 3 1 3
SbAcc_bc 5 3 1 3
Au_bc BRU 1 10 6 1 3
Sb_bc BRU 1 10 5 1 3
Au_bc BRU 2 20 20 1 3
Sb_bc BRU 2 20 20 1 3
SbAcc_bc BRU KR - 10 10 1 3
AuAcc_bcCD 220 1
10 5 1 3
SbAcc_bc 10 5 1 3
AuAcc_bcCD 220 2
15 15 1 3
SbAcc_bc 15 15 1 3
AuAcc_bcE 1
10 8 1 3
SbAcc_bc 5 4 1 3
AuAcc_bcE 2
8 5 1 3
SbAcc_bc 8 5 1 3
AuAcc_bcNSW -
5 5 1 2
SbAcc_bc 10 10 1 2
AuAcc_bc B - 5 4 1 2
AuAcc_bcK -
5 4 1 3
SbAcc_bc 5 4 1 3
AuAcc_bcNSP 39 -
10 10 1 3
SbAcc_bc 10 10 1 3
AuAcc_bc NSP 48 - 10 10 1 3
AuAcc_bc NE 1 10 8 1 1
AuAcc_bc NE 2 10 8 1 1
AuAcc_bcNV43 1
5 5 1 2
SbAcc_bc 10 10 1 2
AuAcc_bc C - 5 4 1 3
AuAcc_bcW 1
10 8 1 3
SbAcc_bc 6 4 1 3
AuAcc_bcW 2
8 5 1 3
SbAcc_bc 8 6 1 3
AuAcc_bcW 3
8 5 1 3
SbAcc_bc 8 5 1 3
AuAcc_bc W 4 8 5 1 3

SRK Consulting Page 135
KENT/WALS/FAIR/EBBE/wulr PLI028_Costerfield Operations_NI-43 101 Technical Report_2018_Rev1 6 February 2019
Using the 2D method, grade accumulation and true thickness were estimated into 2D block models,
the cell centroids of which had an arbitrary easting of 15,300 mE. The 2D estimates were run with all
data, including face samples and diamond drillhole samples, for two different cell sizes resulting in two
models. Where influence limitation top-cutting was applied, the models were run twice for each cell
size. Once domains models were combined (if required), the high sample density face samples were
used as a guide to delineate the Measured Mineral Resource, which retained the smaller block size.
The remaining large block size Indicated and Inferred areas are regularised to the small block size
and the Measured smaller size block model is then added to create the final model. The cell sizes
were selected based on the sample spacing of each area. Areas of high sample density are almost
always face sampling (development) and areas of low sample density are usually from drill intercepts
only.
Using the 3D method, grade was estimated into 3D blocks constrained by hanging wall and footwall
wireframes of the lode. A 2.5 × 10 × 10 m parent cell size was used for the area with drillhole
information only and a 2.5 × 2.5 × 5.0 m parent cell size was used for the area with face sample data.
Sub-cells were used in the Y and Z directions to better define the mining depletion and domain
boundaries. The block model origins and number of cells are specific to the modelled lode.
The common parameters for the models are given in Table 14-8.
Table 14-8: Block Model dimensions
High Sample Data Density Low Sample Data Density
Block Dimensions Discretisation Block Dimensions Discretisation
X 1 1 1 1
Y 2.5 2 20 3
Z 5 3 20 3
Brunswick high sample data density Brunswick low sample data density
Block Dimensions Discretisation Block Dimensions Discretisation
X 2.5 2 2.5 2
Y 2.5 3 10 3
Z 5 3 10 3
After the models have been depleted and resource categories applied, the models were adjusted to
replace the XINC (X cell dimension) with the estimated true thickness.
All statistics presented in this section refer to grades prior to dilution by the minimum mining width of
1.2 m. The resource estimate was validated by:
Visual comparison of the sample thickness and accumulated grades and back calculated grades
with the estimated model grades in long section
Visual comparison of the estimated grades to previous estimates in long section
Comparison of the de-clustered accumulated sample grades with the model grades
Plotting the sample and block estimated true thickness, gold and antimony accumulation grades
on swath plots.
The primary validation is done on accumulated grades and secondary validation on the back-
calculated grades.

SRK Consulting Page 136
KENT/WALS/FAIR/EBBE/wulr PLI028_Costerfield Operations_NI-43 101 Technical Report_2018_Rev1 6 February 2019
There is a correlation when visually comparing the sample thickness and grades with the estimated
grades. As expected, a greater degree of smoothing of the grades was evident where fewer samples
were available. The Slope of Regression (SoR) was analysed for each domain which used Ordinary
Kriging as an estimation technique, to determine whether conditional bias was occurring. Where data
was abundant in each domain, the SoR was close to 1, indicating conditional unbiasedness and
suggesting the estimates are appropriate.
Results from the comparison of the declustered, thickness-weighted, mean composite grades with the
mean model grades are shown in Table 14-9.
Declustering was completed as required for each domain of each lode based on the sample spacing.
Where the sample population is small, but sample spacing is large, differences greater than 10% often
exist between composite and model values and this is considered acceptable. An example of this is
the Youle (500) Lode Domain 2. Differences greater than 10% also exist where the sample population
is small and grade is low (W Lode Domain 3, NSP 49).
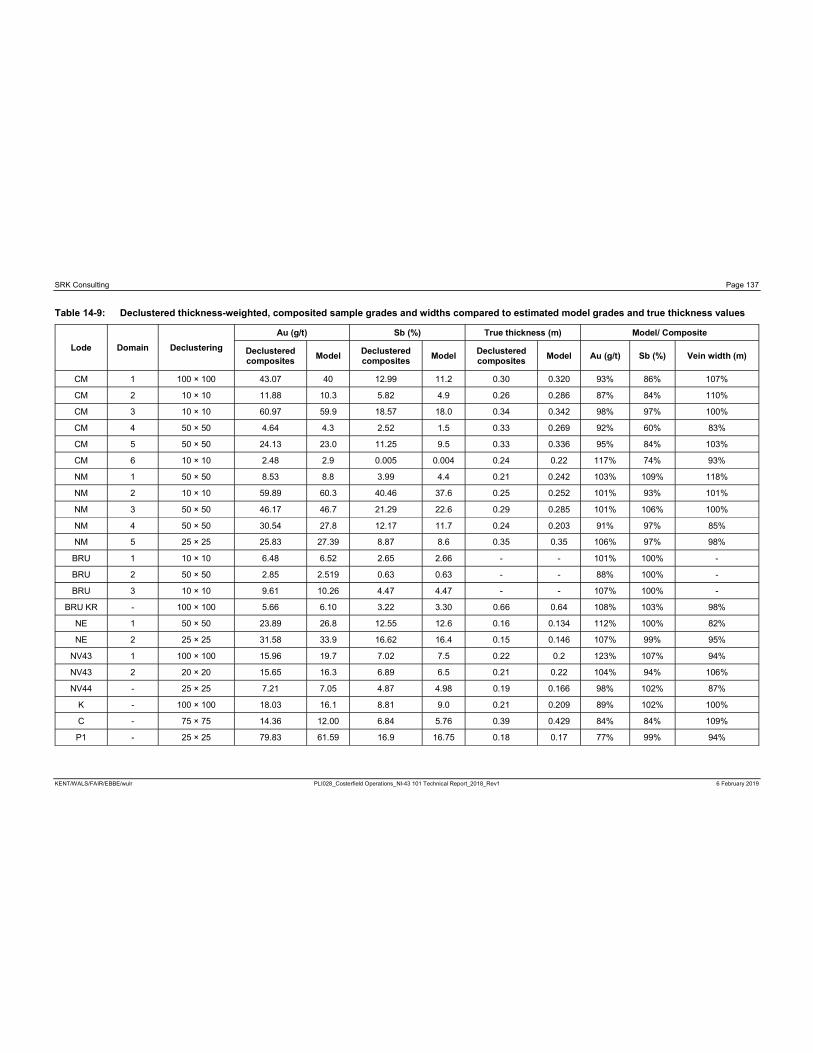
SRK Consulting Page 137
KENT/WALS/FAIR/EBBE/wulr PLI028_Costerfield Operations_NI-43 101 Technical Report_2018_Rev1 6 February 2019
Table 14-9: Declustered thickness-weighted, composited sample grades and widths compared to estimated model grades and true thickness values
Lode Domain Declustering
Au (g/t) Sb (%) True thickness (m) Model/ Composite
Declustered composites
ModelDeclustered composites
ModelDeclustered composites
Model Au (g/t) Sb (%) Vein width (m)
CM 1 100 × 100 43.07 40 12.99 11.2 0.30 0.320 93% 86% 107%
CM 2 10 × 10 11.88 10.3 5.82 4.9 0.26 0.286 87% 84% 110%
CM 3 10 × 10 60.97 59.9 18.57 18.0 0.34 0.342 98% 97% 100%
CM 4 50 × 50 4.64 4.3 2.52 1.5 0.33 0.269 92% 60% 83%
CM 5 50 × 50 24.13 23.0 11.25 9.5 0.33 0.336 95% 84% 103%
CM 6 10 × 10 2.48 2.9 0.005 0.004 0.24 0.22 117% 74% 93%
NM 1 50 × 50 8.53 8.8 3.99 4.4 0.21 0.242 103% 109% 118%
NM 2 10 × 10 59.89 60.3 40.46 37.6 0.25 0.252 101% 93% 101%
NM 3 50 × 50 46.17 46.7 21.29 22.6 0.29 0.285 101% 106% 100%
NM 4 50 × 50 30.54 27.8 12.17 11.7 0.24 0.203 91% 97% 85%
NM 5 25 × 25 25.83 27.39 8.87 8.6 0.35 0.35 106% 97% 98%
BRU 1 10 × 10 6.48 6.52 2.65 2.66 - - 101% 100% -
BRU 2 50 × 50 2.85 2.519 0.63 0.63 - - 88% 100% -
BRU 3 10 × 10 9.61 10.26 4.47 4.47 - - 107% 100% -
BRU KR - 100 × 100 5.66 6.10 3.22 3.30 0.66 0.64 108% 103% 98%
NE 1 50 × 50 23.89 26.8 12.55 12.6 0.16 0.134 112% 100% 82%
NE 2 25 × 25 31.58 33.9 16.62 16.4 0.15 0.146 107% 99% 95%
NV43 1 100 × 100 15.96 19.7 7.02 7.5 0.22 0.2 123% 107% 94%
NV43 2 20 × 20 15.65 16.3 6.89 6.5 0.21 0.22 104% 94% 106%
NV44 - 25 × 25 7.21 7.05 4.87 4.98 0.19 0.166 98% 102% 87%
K - 100 × 100 18.03 16.1 8.81 9.0 0.21 0.209 89% 102% 100%
C - 75 × 75 14.36 12.00 6.84 5.76 0.39 0.429 84% 84% 109%
P1 - 25 × 25 79.83 61.59 16.9 16.75 0.18 0.17 77% 99% 94%

SRK Consulting Page 138
KENT/WALS/FAIR/EBBE/wulr PLI028_Costerfield Operations_NI-43 101 Technical Report_2018_Rev1 6 February 2019
Lode Domain Declustering
Au (g/t) Sb (%) True thickness (m) Model/ Composite
Declustered composites
ModelDeclustered composites
ModelDeclustered composites
Model Au (g/t) Sb (%) Vein width (m)
P2 - 25 × 25 20.92 15.4 6.01 5.4 0.2 0.21 75% 89% 102%
NSW - 25 × 25 25.58 23.1 13.41 12.5 0.40 0.43 90% 93% 108%
AS 230 - 50 × 50 18.68 15.9 3.89 3.8 0.39 0.403 85% 98% 105%
B - 25 × 25 23.94 23.7 6.76 7.9 0.22 0.213 99% 117% 96%
BSP - 25 × 25 17.71 18.6 6.56 7.9 0.17 0.17 105% 121% 103%
E 1 50 × 50 32.81 30.3 17.7 17.1 0.32 0.329 92% 96% 103%
E 2 100 × 100 19.35 17.2 11.28 10.4 0.27 0.266 89% 92% 100%
NSP 39 - 20 × 20 16.55 17.9 7.49 7.9 0.19 0.192 108% 105% 102%
NSP 48 - 25 × 25 18.88 19.2 12.57 12.0 0.18 0.184 101% 96% 102%
NSP 49 - 10 × 10 9.711 5.12 13.627 7.827 0.303 0.464 41% 43% 103%
CD 220 1 25 × 25 24.05 24.2 9.42 8.9 0.55 0.441 101% 94% 80%
CD 220 2 150 × 150 8.82 8.7 2.54 2.7 0.27 0.252 98% 107% 93%
CD 220 3 100 × 100 4.91 4.5 0.97 1.1 0.43 0.441 91% 108% 103%
CD 220 4 25 × 25 14.85 12.5 5.56 5.5 0.37 0.408 84% 99% 109%
W 1 50 × 50 22.26 20.1 12.14 11.1 0.38 0.394 90% 92% 104%
W 2 100 × 100 26.81 24.8 14.34 13.6 0.36 0.367 93% 95% 101%
W 3 100 × 100 6.77 4.3 6.38 3.0 0.61 0.503 63% 47% 82%
W 4 100 × 100 65.52 53.3 33.63 28.1 0.35 0.343 81% 84% 98%
Youle 1 10 × 10 56.79 56.1 7.45 7.3 0.49 0.47 99% 98% 95%
Youle 2 10 × 10 63.16 38.7 16.7 14.9 0.75 0.679 61% 89% 90%
Youle 3 10 × 10 2.40 3.3 1.13 1.5 0.37 0.348 139% 134% 95%
Doyle - 10 × 10 1.5 1.44 1.01 1.01 0.423 0.493 92% 94% 116%

SRK Consulting Page 139
KENT/WALS/FAIR/EBB/wulr PLI028_Costerfield Operations_NI-43 101 Technical Report_2018_Rev1 6 February 2019
Swath plots were created for each domain of each modelled lode (Figure 14-24 to Figure 14-31). They
compare declustered composited grade and accumulated grade with modelled grades and
accumulated grades.
Figure 14-24: Youle Lode Domain 1 gold accumulation swath plot by northing
Figure 14-25: Youle Lode Domain 1 gold accumulation swath plot by elevation
Figure 14-26: Youle Lode Domain 1 antimony accumulation swath plot by northing
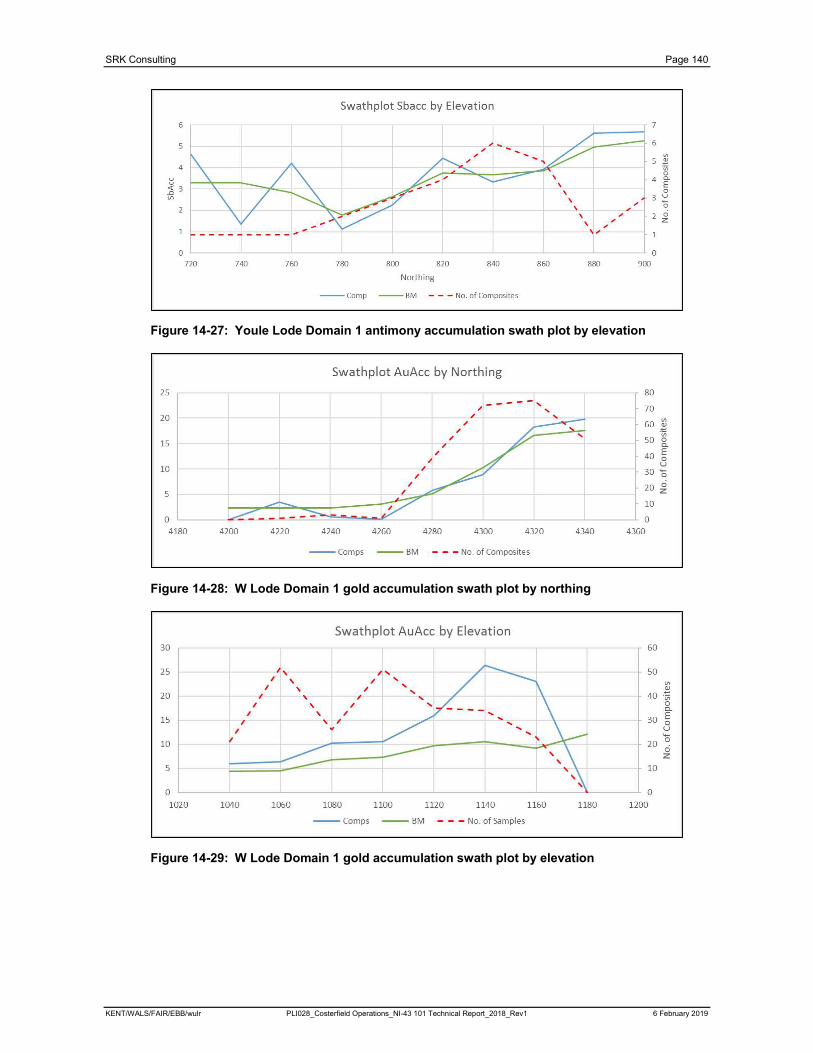
SRK Consulting Page 140
KENT/WALS/FAIR/EBB/wulr PLI028_Costerfield Operations_NI-43 101 Technical Report_2018_Rev1 6 February 2019
Figure 14-27: Youle Lode Domain 1 antimony accumulation swath plot by elevation
Figure 14-28: W Lode Domain 1 gold accumulation swath plot by northing
Figure 14-29: W Lode Domain 1 gold accumulation swath plot by elevation
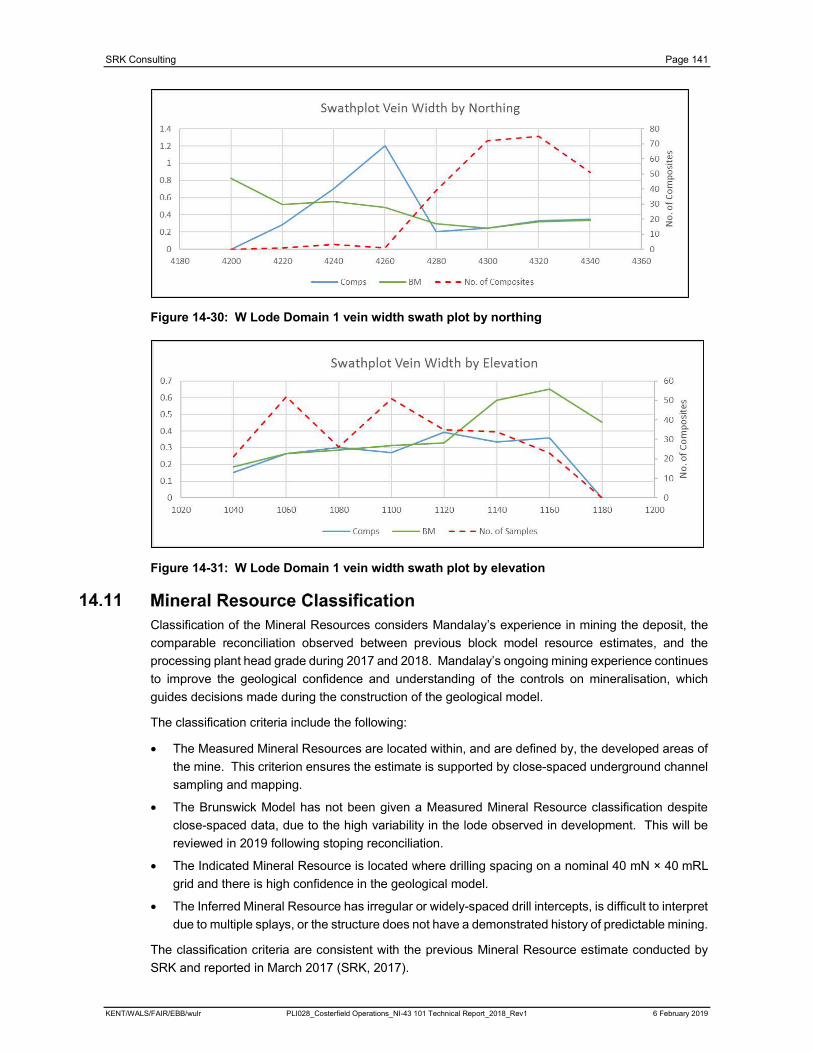
SRK Consulting Page 141
KENT/WALS/FAIR/EBB/wulr PLI028_Costerfield Operations_NI-43 101 Technical Report_2018_Rev1 6 February 2019
Figure 14-30: W Lode Domain 1 vein width swath plot by northing
Figure 14-31: W Lode Domain 1 vein width swath plot by elevation
Classification of the Mineral Resources considers Mandalay’s experience in mining the deposit, the
comparable reconciliation observed between previous block model resource estimates, and the
processing plant head grade during 2017 and 2018. Mandalay’s ongoing mining experience continues
to improve the geological confidence and understanding of the controls on mineralisation, which
guides decisions made during the construction of the geological model.
The classification criteria include the following:
The Measured Mineral Resources are located within, and are defined by, the developed areas of
the mine. This criterion ensures the estimate is supported by close-spaced underground channel
sampling and mapping.
The Brunswick Model has not been given a Measured Mineral Resource classification despite
close-spaced data, due to the high variability in the lode observed in development. This will be
reviewed in 2019 following stoping reconciliation.
The Indicated Mineral Resource is located where drilling spacing on a nominal 40 mN × 40 mRL
grid and there is high confidence in the geological model.
The Inferred Mineral Resource has irregular or widely-spaced drill intercepts, is difficult to interpret
due to multiple splays, or the structure does not have a demonstrated history of predictable mining.
The classification criteria are consistent with the previous Mineral Resource estimate conducted by
SRK and reported in March 2017 (SRK, 2017).
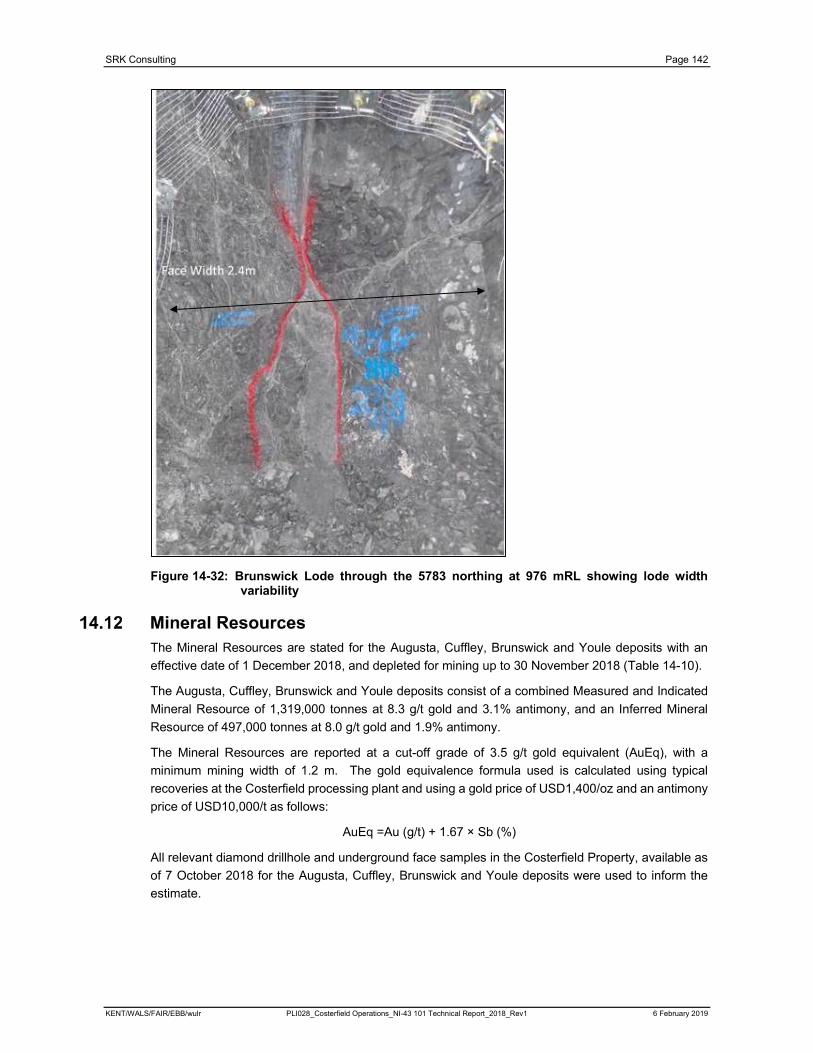
SRK Consulting Page 142
KENT/WALS/FAIR/EBB/wulr PLI028_Costerfield Operations_NI-43 101 Technical Report_2018_Rev1 6 February 2019
Figure 14-32: Brunswick Lode through the 5783 northing at 976 mRL showing lode width variability
The Mineral Resources are stated for the Augusta, Cuffley, Brunswick and Youle deposits with an
effective date of 1 December 2018, and depleted for mining up to 30 November 2018 (Table 14-10).
The Augusta, Cuffley, Brunswick and Youle deposits consist of a combined Measured and Indicated
Mineral Resource of 1,319,000 tonnes at 8.3 g/t gold and 3.1% antimony, and an Inferred Mineral
Resource of 497,000 tonnes at 8.0 g/t gold and 1.9% antimony.
The Mineral Resources are reported at a cut-off grade of 3.5 g/t gold equivalent (AuEq), with a
minimum mining width of 1.2 m. The gold equivalence formula used is calculated using typical
recoveries at the Costerfield processing plant and using a gold price of USD1,400/oz and an antimony
price of USD10,000/t as follows:
AuEq =Au (g/t) + 1.67 × Sb (%)
All relevant diamond drillhole and underground face samples in the Costerfield Property, available as
of 7 October 2018 for the Augusta, Cuffley, Brunswick and Youle deposits were used to inform the
estimate.
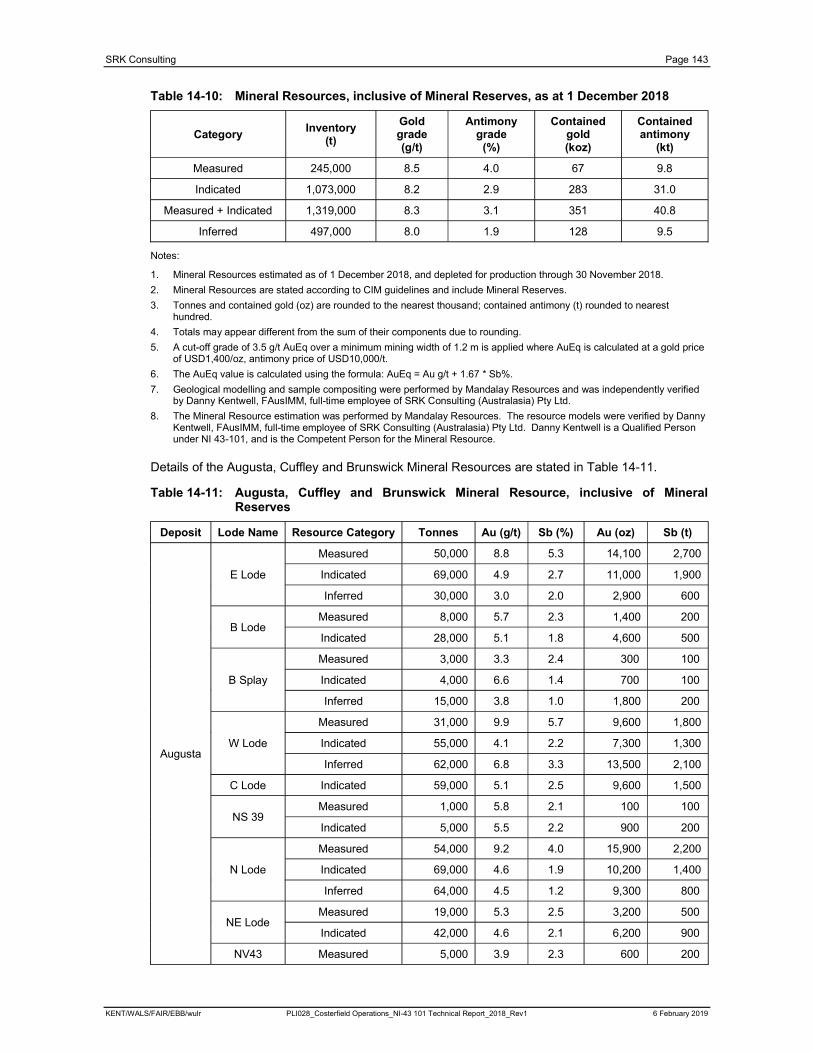
SRK Consulting Page 143
KENT/WALS/FAIR/EBB/wulr PLI028_Costerfield Operations_NI-43 101 Technical Report_2018_Rev1 6 February 2019
Table 14-10: Mineral Resources, inclusive of Mineral Reserves, as at 1 December 2018
CategoryInventory
(t)
Gold grade(g/t)
Antimony grade
(%)
Contained gold (koz)
Contained antimony
(kt)
Measured 245,000 8.5 4.0 67 9.8
Indicated 1,073,000 8.2 2.9 283 31.0
Measured + Indicated 1,319,000 8.3 3.1 351 40.8
Inferred 497,000 8.0 1.9 128 9.5
Notes:
1. Mineral Resources estimated as of 1 December 2018, and depleted for production through 30 November 2018.
2. Mineral Resources are stated according to CIM guidelines and include Mineral Reserves.
3. Tonnes and contained gold (oz) are rounded to the nearest thousand; contained antimony (t) rounded to nearest hundred.
4. Totals may appear different from the sum of their components due to rounding.
5. A cut-off grade of 3.5 g/t AuEq over a minimum mining width of 1.2 m is applied where AuEq is calculated at a gold price of USD1,400/oz, antimony price of USD10,000/t.
6. The AuEq value is calculated using the formula: AuEq = Au g/t + 1.67 * Sb%.
7. Geological modelling and sample compositing were performed by Mandalay Resources and was independently verified by Danny Kentwell, FAusIMM, full-time employee of SRK Consulting (Australasia) Pty Ltd.
8. The Mineral Resource estimation was performed by Mandalay Resources. The resource models were verified by Danny Kentwell, FAusIMM, full-time employee of SRK Consulting (Australasia) Pty Ltd. Danny Kentwell is a Qualified Person under NI 43-101, and is the Competent Person for the Mineral Resource.
Details of the Augusta, Cuffley and Brunswick Mineral Resources are stated in Table 14-11.
Table 14-11: Augusta, Cuffley and Brunswick Mineral Resource, inclusive of Mineral Reserves
Deposit Lode Name Resource Category Tonnes Au (g/t) Sb (%) Au (oz) Sb (t)
Augusta
E Lode
Measured 50,000 8.8 5.3 14,100 2,700
Indicated 69,000 4.9 2.7 11,000 1,900
Inferred 30,000 3.0 2.0 2,900 600
B LodeMeasured 8,000 5.7 2.3 1,400 200
Indicated 28,000 5.1 1.8 4,600 500
B Splay
Measured 3,000 3.3 2.4 300 100
Indicated 4,000 6.6 1.4 700 100
Inferred 15,000 3.8 1.0 1,800 200
W Lode
Measured 31,000 9.9 5.7 9,600 1,800
Indicated 55,000 4.1 2.2 7,300 1,300
Inferred 62,000 6.8 3.3 13,500 2,100
C Lode Indicated 59,000 5.1 2.5 9,600 1,500
NS 39Measured 1,000 5.8 2.1 100 100
Indicated 5,000 5.5 2.2 900 200
N Lode
Measured 54,000 9.2 4.0 15,900 2,200
Indicated 69,000 4.6 1.9 10,200 1,400
Inferred 64,000 4.5 1.2 9,300 800
NE LodeMeasured 19,000 5.3 2.5 3,200 500
Indicated 42,000 4.6 2.1 6,200 900
NV43 Measured 5,000 3.9 2.3 600 200

SRK Consulting Page 144
KENT/WALS/FAIR/EBB/wulr PLI028_Costerfield Operations_NI-43 101 Technical Report_2018_Rev1 6 February 2019
Deposit Lode Name Resource Category Tonnes Au (g/t) Sb (%) Au (oz) Sb (t)
Indicated 22,000 4.6 1.6 3,200 400
Inferred 8,000 6.5 0.8 1,700 100
NV44 Indicated 6,000 3.4 2.1 700 200
NSWMeasured 2,000 10.1 3.7 500 100
Indicated 14,000 5.8 4.1 2,600 600
NWMeasured 1,000 6.3 3.7 200 100
Indicated 3,000 4.7 3.2 400 100
N48Indicated 6,000 4.4 2.7 800 200
Inferred 1,000 4.1 3.0 100 100
N49Indicated 2,000 3.3 4.3 200 100
Inferred 1,000 3.5 6.7 200 100
P1 LodeMeasured 11,000 8.9 2.4 3,100 300
Indicated 9,000 8.7 2.2 2,500 200
P2 Lode
Measured 3,000 4.7 3.4 500 100
Indicated 19,000 5.6 2.0 3,400 400
Inferred 2,000 3.8 0.2 200 100
K Lode
Measured 11,000 5.3 2.5 1,800 300
Indicated 57,000 3.2 1.9 6,000 1,100
Inferred 23,000 3.8 2.0 2,800 500
Cuffley
CM Lode
Measured 43,000 9.0 3.2 12,500 1,400
Indicated 55,000 6.6 2.6 11,600 1,500
Inferred 6,000 5.0 2.0 1,000 200
CE LodeIndicated 10,000 11.6 4.3 3,700 500
Inferred 13,000 6.0 1.9 2,500 300
CS LodeIndicated 11,000 2.2 1.9 800 200
Inferred 2,000 2.1 1.0 200 100
CSE Lode Indicated 1,000 4.8 3.6 200 100
CD Lode
Measured 10,000 12.3 4.8 3,600 500
Indicated 58,000 5.4 1.6 10,100 1,000
Inferred 9,000 4.6 1.2 1,300 200
CDL Lode Inferred 27,000 7.4 0.1 6,200 100
AS Lode
Measured 2,000 18.5 1.6 700 100
Indicated 30,000 5.7 1.6 5,400 500
Inferred 6,000 6.2 1.5 1,100 100
Brunswick Indicated 242,000 6.8 3.0 53,100 7,400
Inferred 8,000 4.9 1.0 1,200 100
Sub King Cobra
SKC CE Inferred 11,000 2.8 0.9 900 100
SKC LQ Inferred 8,000 10.8 0.2 2,700 100
SKC C Inferred 65,000 7.0 1.2 14,700 800
SKC W Inferred 65,000 10.3 0.0 21,300 100
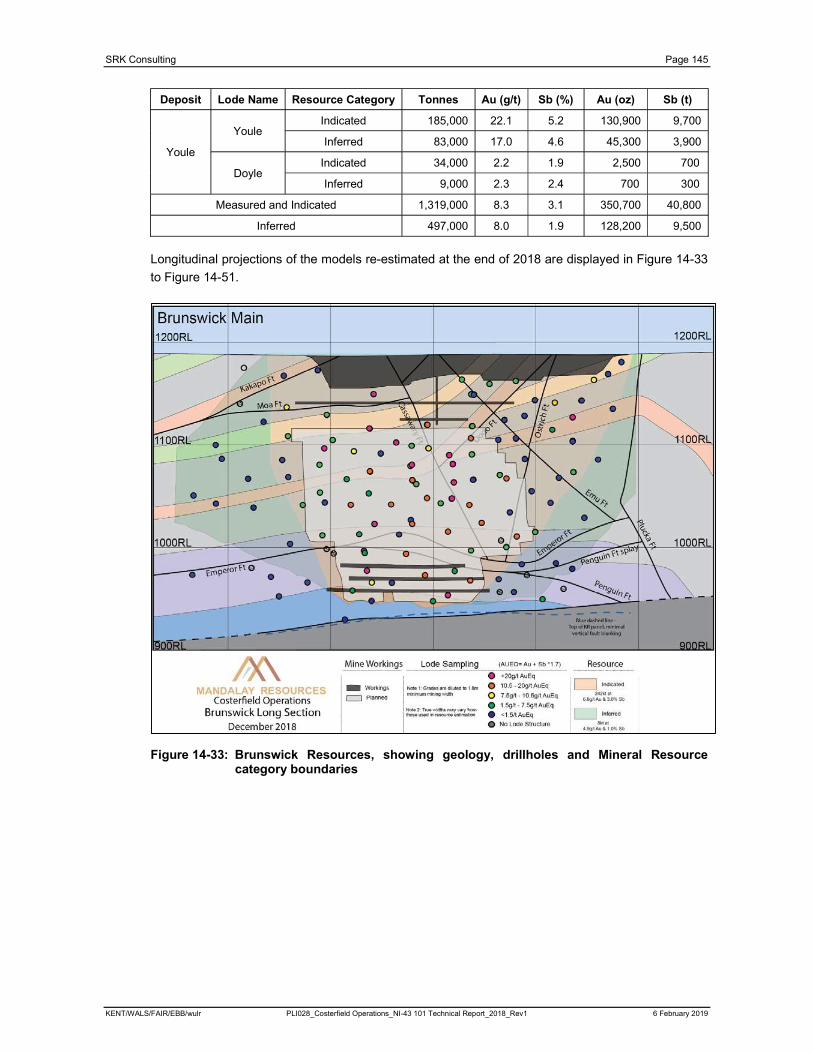
SRK Consulting Page 145
KENT/WALS/FAIR/EBB/wulr PLI028_Costerfield Operations_NI-43 101 Technical Report_2018_Rev1 6 February 2019
Deposit Lode Name Resource Category Tonnes Au (g/t) Sb (%) Au (oz) Sb (t)
Youle
YouleIndicated 185,000 22.1 5.2 130,900 9,700
Inferred 83,000 17.0 4.6 45,300 3,900
DoyleIndicated 34,000 2.2 1.9 2,500 700
Inferred 9,000 2.3 2.4 700 300
Measured and Indicated 1,319,000 8.3 3.1 350,700 40,800
Inferred 497,000 8.0 1.9 128,200 9,500
Longitudinal projections of the models re-estimated at the end of 2018 are displayed in Figure 14-33
to Figure 14-51.
Figure 14-33: Brunswick Resources, showing geology, drillholes and Mineral Resource category boundaries
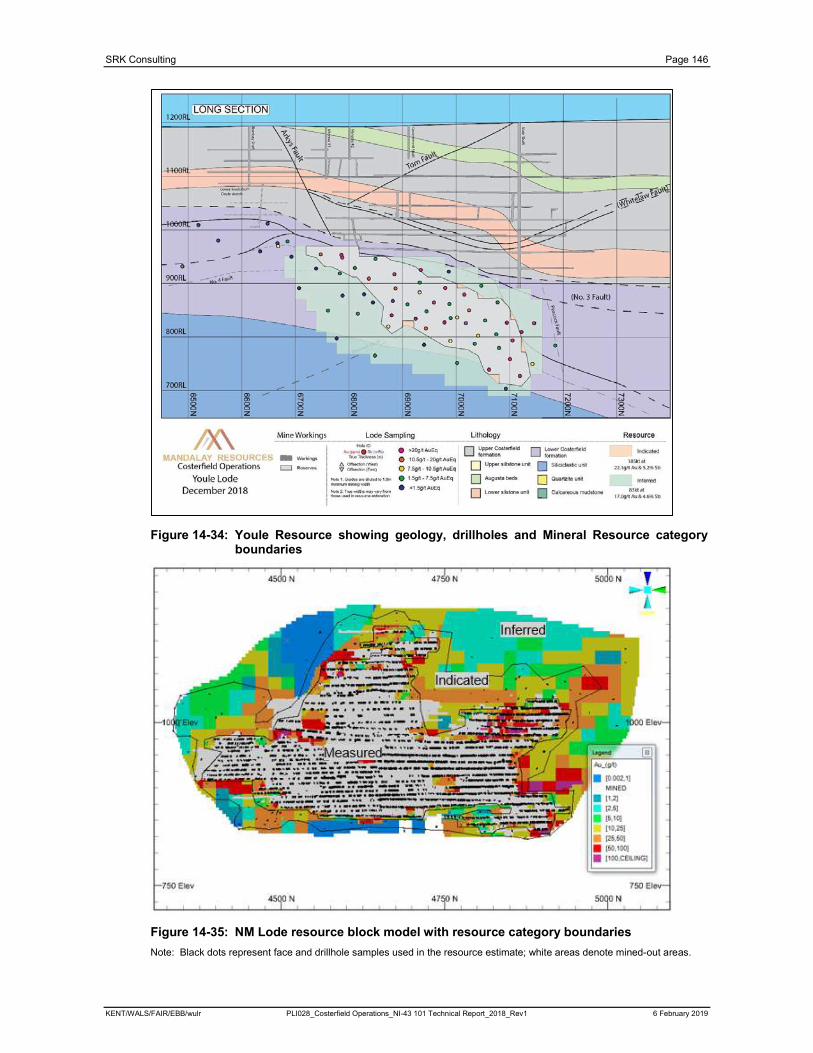
SRK Consulting Page 146
KENT/WALS/FAIR/EBB/wulr PLI028_Costerfield Operations_NI-43 101 Technical Report_2018_Rev1 6 February 2019
Figure 14-34: Youle Resource showing geology, drillholes and Mineral Resource category boundaries
Figure 14-35: NM Lode resource block model with resource category boundaries
Note: Black dots represent face and drillhole samples used in the resource estimate; white areas denote mined-out areas.
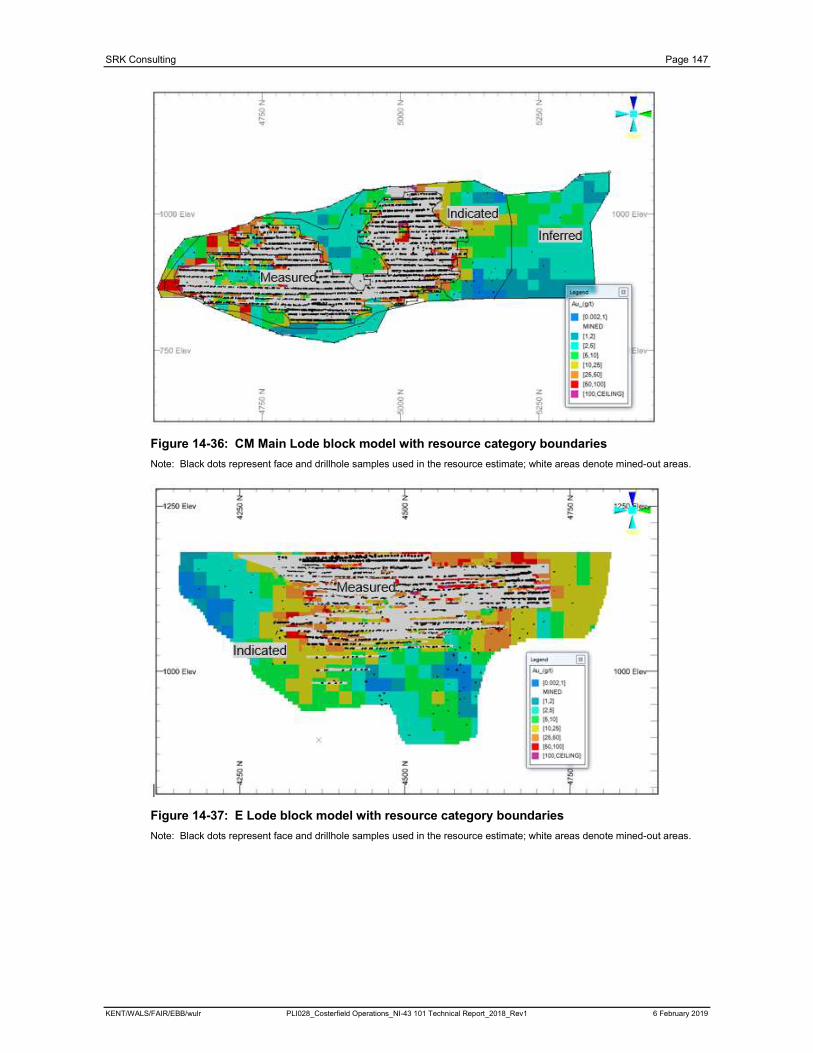
SRK Consulting Page 147
KENT/WALS/FAIR/EBB/wulr PLI028_Costerfield Operations_NI-43 101 Technical Report_2018_Rev1 6 February 2019
Figure 14-36: CM Main Lode block model with resource category boundaries
Note: Black dots represent face and drillhole samples used in the resource estimate; white areas denote mined-out areas.
Figure 14-37: E Lode block model with resource category boundaries
Note: Black dots represent face and drillhole samples used in the resource estimate; white areas denote mined-out areas.
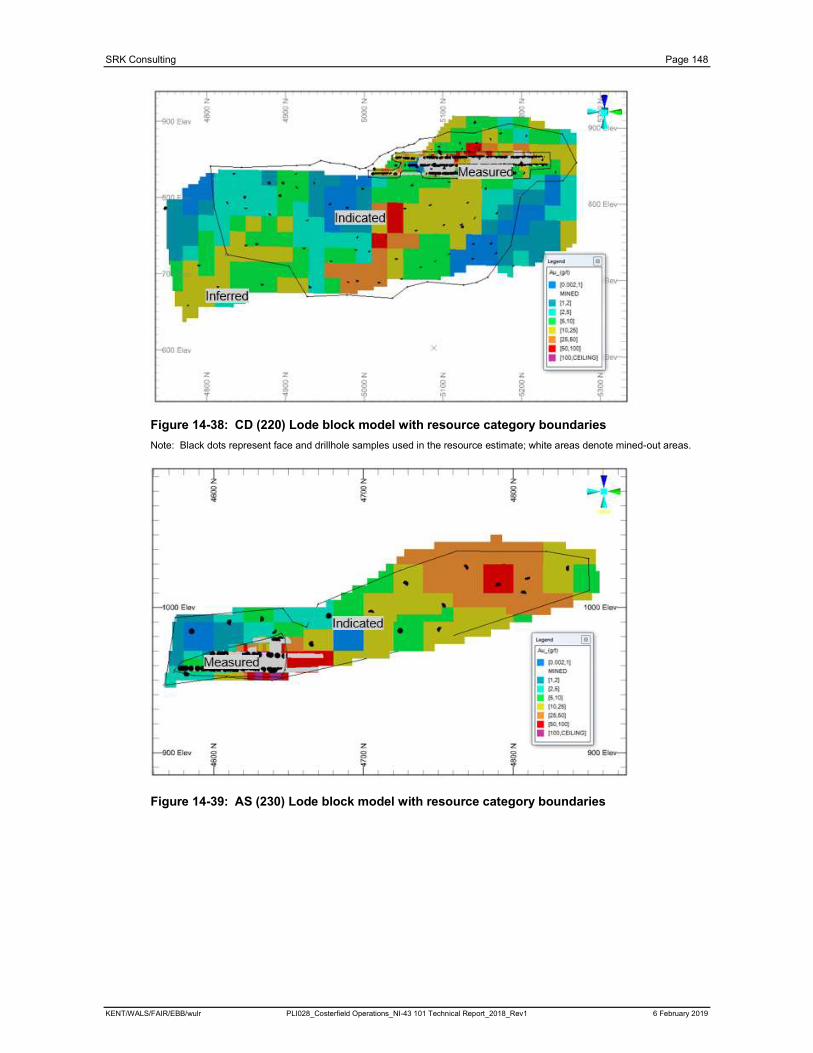
SRK Consulting Page 148
KENT/WALS/FAIR/EBB/wulr PLI028_Costerfield Operations_NI-43 101 Technical Report_2018_Rev1 6 February 2019
Figure 14-38: CD (220) Lode block model with resource category boundaries
Note: Black dots represent face and drillhole samples used in the resource estimate; white areas denote mined-out areas.
Figure 14-39: AS (230) Lode block model with resource category boundaries
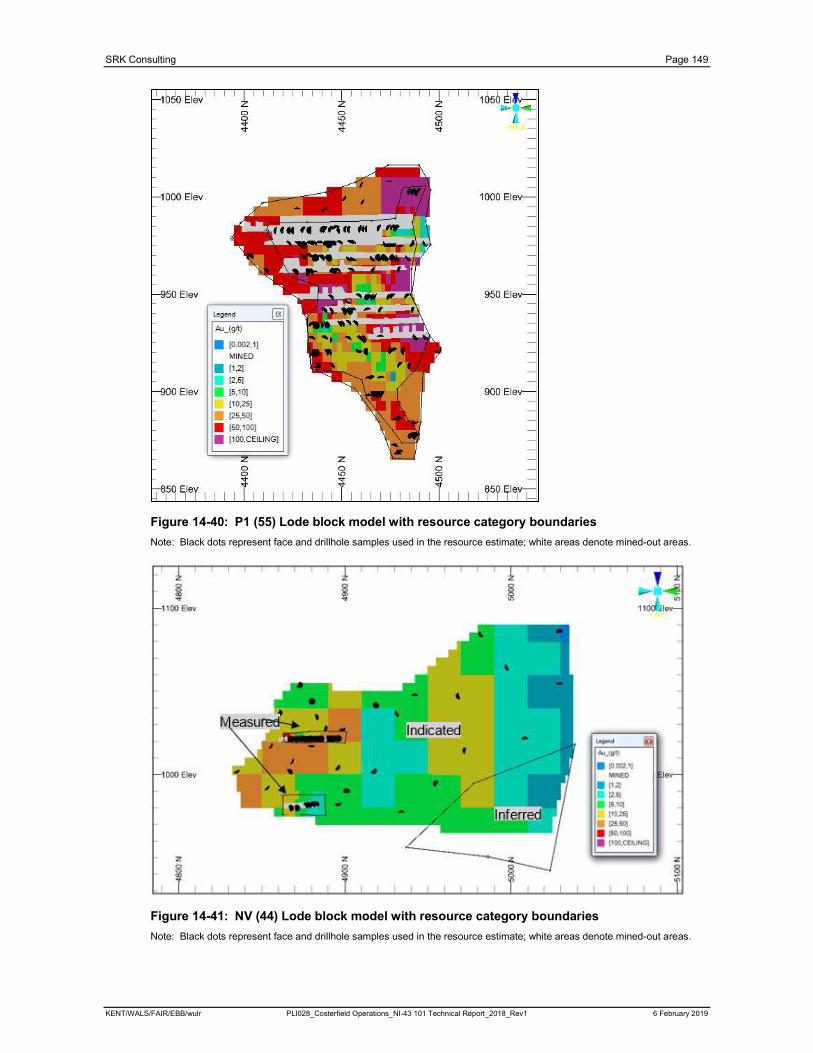
SRK Consulting Page 149
KENT/WALS/FAIR/EBB/wulr PLI028_Costerfield Operations_NI-43 101 Technical Report_2018_Rev1 6 February 2019
Figure 14-40: P1 (55) Lode block model with resource category boundaries
Note: Black dots represent face and drillhole samples used in the resource estimate; white areas denote mined-out areas.
Figure 14-41: NV (44) Lode block model with resource category boundaries
Note: Black dots represent face and drillhole samples used in the resource estimate; white areas denote mined-out areas.
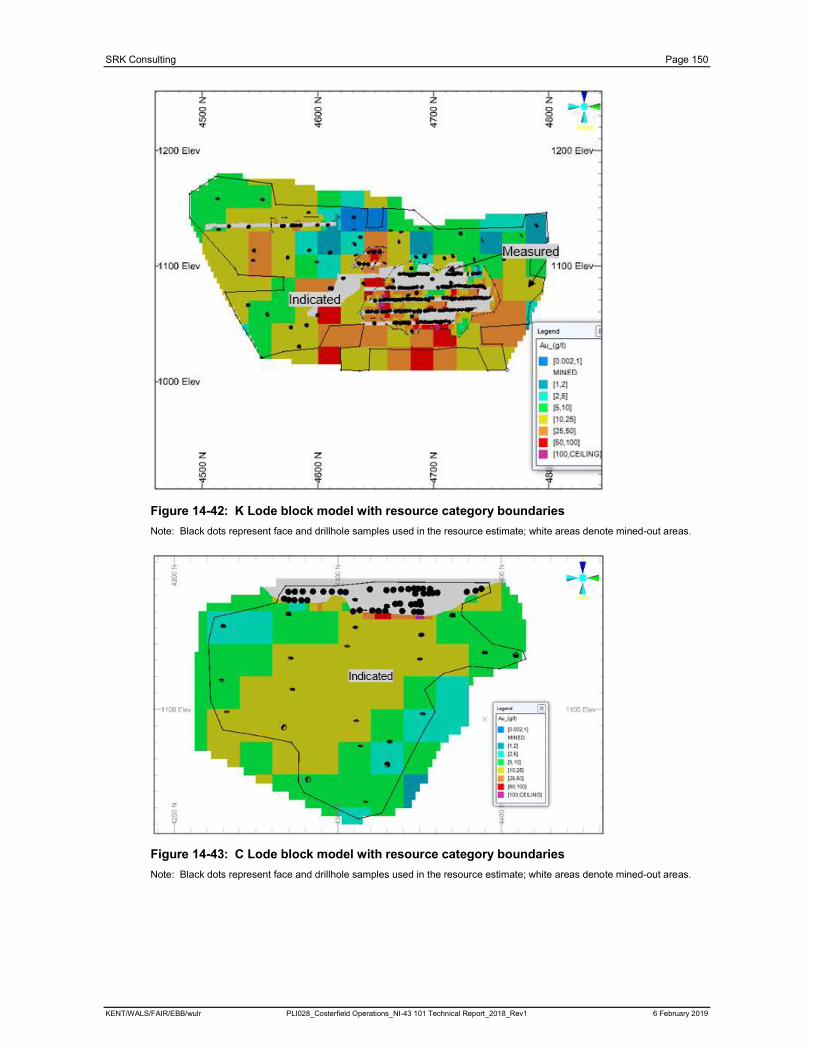
SRK Consulting Page 150
KENT/WALS/FAIR/EBB/wulr PLI028_Costerfield Operations_NI-43 101 Technical Report_2018_Rev1 6 February 2019
Figure 14-42: K Lode block model with resource category boundaries
Note: Black dots represent face and drillhole samples used in the resource estimate; white areas denote mined-out areas.
Figure 14-43: C Lode block model with resource category boundaries
Note: Black dots represent face and drillhole samples used in the resource estimate; white areas denote mined-out areas.
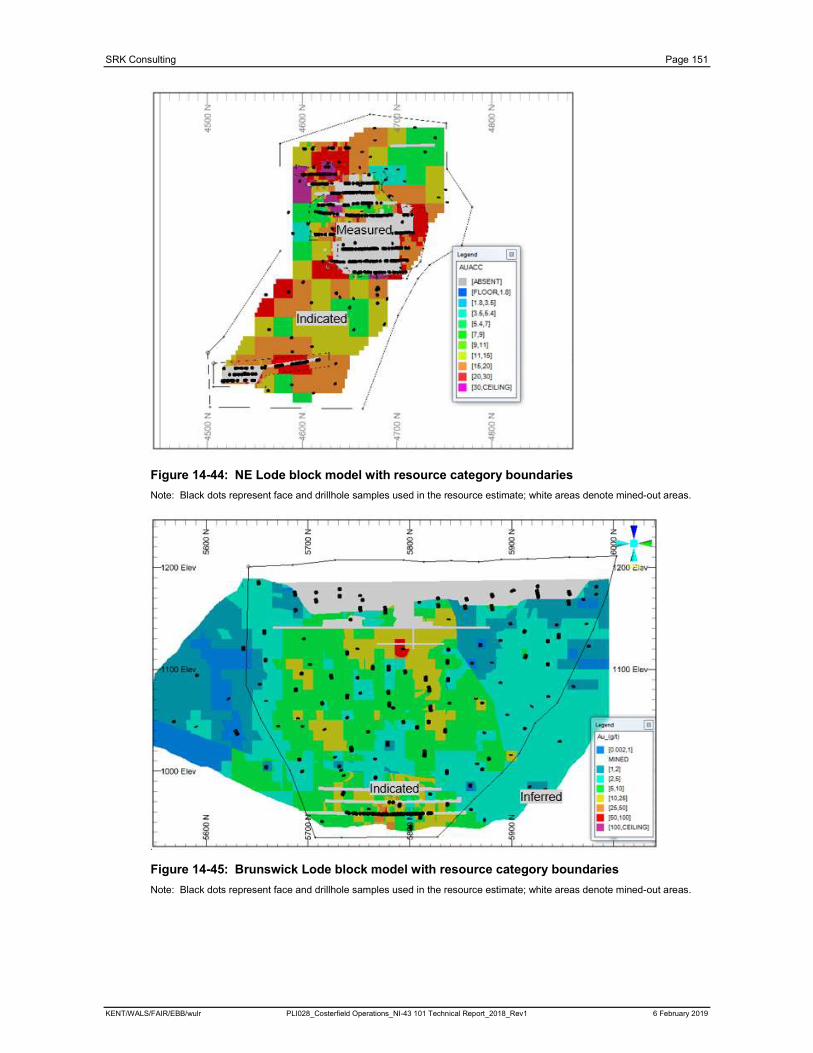
SRK Consulting Page 151
KENT/WALS/FAIR/EBB/wulr PLI028_Costerfield Operations_NI-43 101 Technical Report_2018_Rev1 6 February 2019
Figure 14-44: NE Lode block model with resource category boundaries
Note: Black dots represent face and drillhole samples used in the resource estimate; white areas denote mined-out areas.
Figure 14-45: Brunswick Lode block model with resource category boundaries
Note: Black dots represent face and drillhole samples used in the resource estimate; white areas denote mined-out areas.
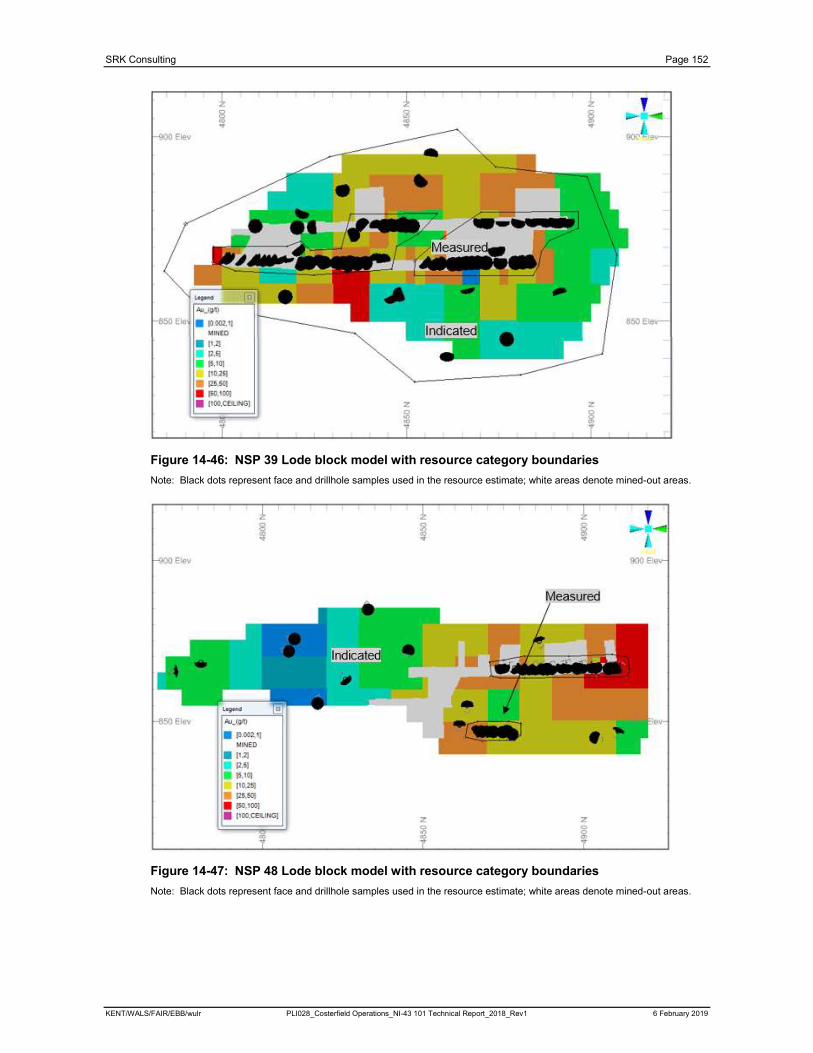
SRK Consulting Page 152
KENT/WALS/FAIR/EBB/wulr PLI028_Costerfield Operations_NI-43 101 Technical Report_2018_Rev1 6 February 2019
Figure 14-46: NSP 39 Lode block model with resource category boundaries
Note: Black dots represent face and drillhole samples used in the resource estimate; white areas denote mined-out areas.
Figure 14-47: NSP 48 Lode block model with resource category boundaries
Note: Black dots represent face and drillhole samples used in the resource estimate; white areas denote mined-out areas.
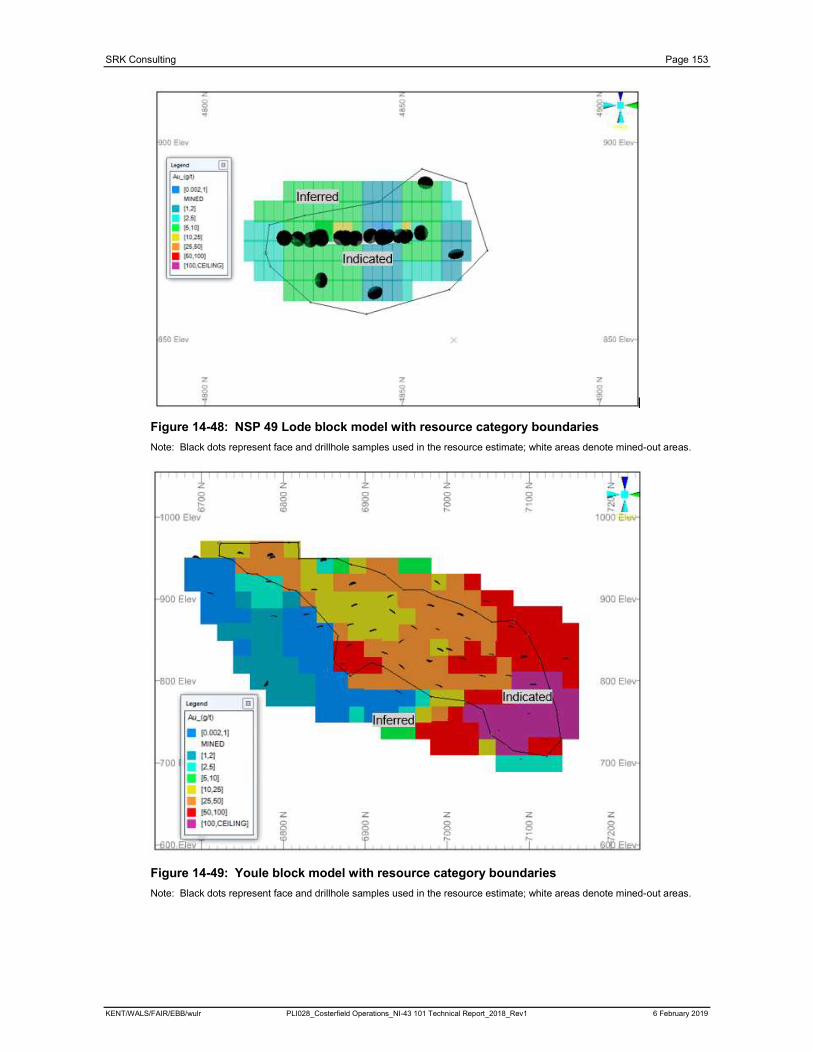
SRK Consulting Page 153
KENT/WALS/FAIR/EBB/wulr PLI028_Costerfield Operations_NI-43 101 Technical Report_2018_Rev1 6 February 2019
Figure 14-48: NSP 49 Lode block model with resource category boundaries
Note: Black dots represent face and drillhole samples used in the resource estimate; white areas denote mined-out areas.
Figure 14-49: Youle block model with resource category boundaries
Note: Black dots represent face and drillhole samples used in the resource estimate; white areas denote mined-out areas.
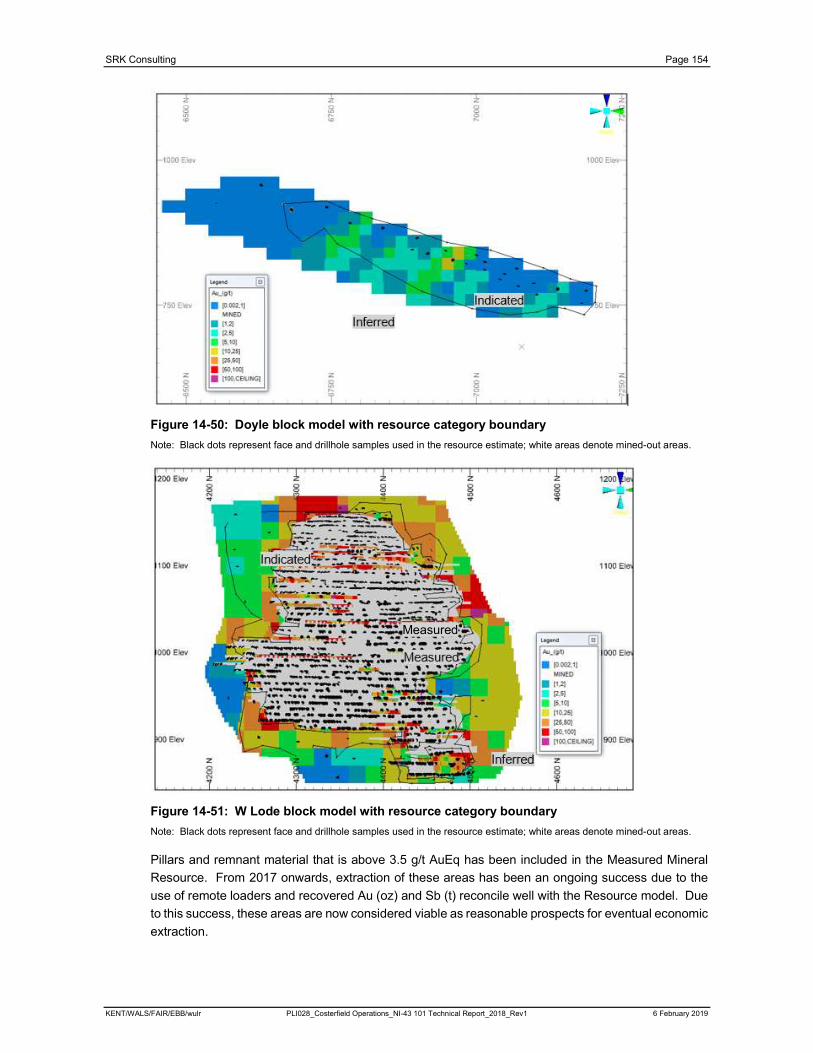
SRK Consulting Page 154
KENT/WALS/FAIR/EBB/wulr PLI028_Costerfield Operations_NI-43 101 Technical Report_2018_Rev1 6 February 2019
Figure 14-50: Doyle block model with resource category boundary
Note: Black dots represent face and drillhole samples used in the resource estimate; white areas denote mined-out areas.
Figure 14-51: W Lode block model with resource category boundary
Note: Black dots represent face and drillhole samples used in the resource estimate; white areas denote mined-out areas.
Pillars and remnant material that is above 3.5 g/t AuEq has been included in the Measured Mineral
Resource. From 2017 onwards, extraction of these areas has been an ongoing success due to the
use of remote loaders and recovered Au (oz) and Sb (t) reconcile well with the Resource model. Due
to this success, these areas are now considered viable as reasonable prospects for eventual economic
extraction.
Measured
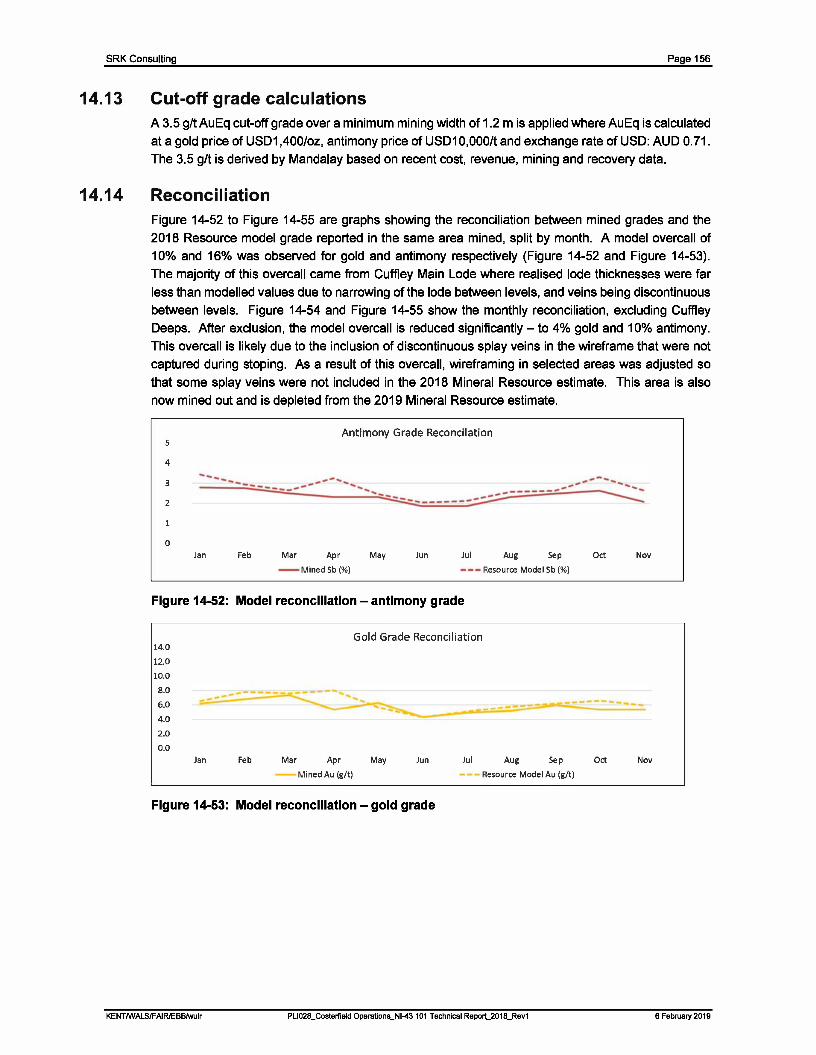
SRK Consulting Page 156
14.13
14.14
Cut-off grade calculations A 3.5 g/t AuEq cut-off grade over a minimum mining width of 1.2 m is applied where AuEq is calculated
at a gold price of USD1 ,400/oz, antimony price of USD1 0,000/t and exchange rate of USD: AUD 0. 71.
The 3.5 g/t is derived by Mandalay based on recent cost, revenue, mining and recovery data.
Reconciliation Figure 14-52 to Figure 14-55 are graphs showing the reconciliation between mined grades and the
2018 Resource model grade reported in the same area mined, split by month. A model overcall of 10% and 16% was observed for gold and antimony respectively (Figure 14-52 and Figure 14-53).
The majority of this overcall came from Cuffley Main Lode where realised lode thicknesses were far
less than modelled values due to narrowing of the lode between levels, and veins being discontinuous
between levels. Figure 14-54 and Figure 14-55 show the monthly reconciliation, excluding Cuffley Deeps. After exclusion, the model overcall is reduced significantly- to 4% gold and 10% antimony.
This overcall is likely due to the inclusion of discontinuous splay veins in the wireframe that were not
captured during stoping. As a result of this overcall, wireframing in selected areas was adjusted so
that some splay veins were not included in the 2018 Mineral Resource estimate. This area is also
now mined out and is depleted from the 2019 Mineral Resource estimate.
Antimony Grade Reconcilation 5
4
3
2
0
Jan Feb Mar Apr May Jun Jul Aug Sep
- Mined Sb (%) --- Resource Model Sb (%)
Figure 14-52: Model reconciliation- antimony grade
14.0
12.0
10.0
Gold Grade Reconciliation
Oct Nov
8 .0
6.0
4 .0
2 .0
0 .0
------- ·---------.-_
Jan Feb Mar Apr May Jun Jul Aug Sep Oct Nov
Mined Au (g/ t) Resource Mode l Au (g/ t)
Figure 14-53: Model reconciliation- gold grade
KENTIWALSIFAIRIEBB/wulr PLI028_Costerfield Operations_NI-43 101 Technical Report_2018_Rev1 6 February 2019
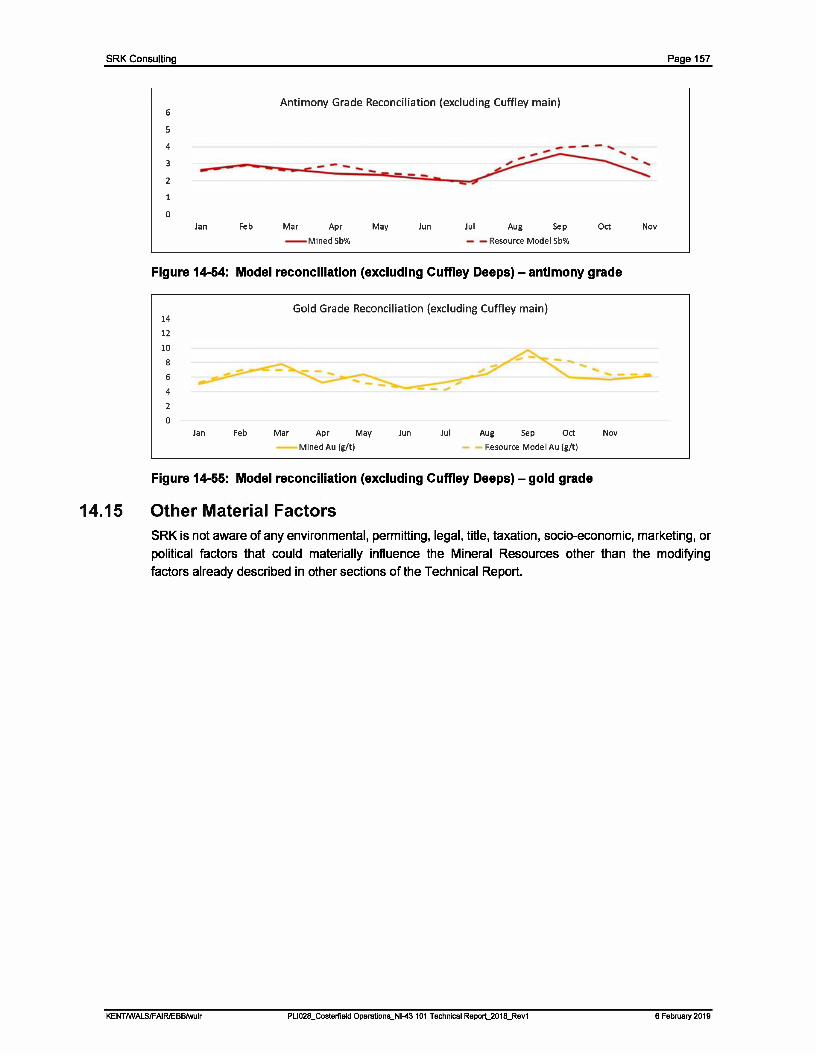
SRK Consulting Page 157
14.15
Antimony Grade Reconciliation (excluding Cuffley main) 6
4
--- .... ---2
0
Jan Feb Mar Apr May Jun Jul Aug Sep Oct
--MinedSb% - - Resource Model Sb%
Figure 14-54: Model reconciliation (excluding Cuffley Deeps)- antimony grade
14
12
10
8
6
4
2
0 Jan Feb
Gold Grade Reconciliation (excluding Cuffley main)
...
Mar Apr May Jun Jul Aug Sep Oct
--Mined Au (g/t) - - Resource Model Au (g/t)
Figure 14-55: Model reconciliation (excluding Cuffley Deeps)- gold grade
Other Material Factors
Nov
Nov
SRK is not aware of any environmental, permitting, legal, title, taxation, socio-economic, marketing, or
political factors that could materially influence the Mineral Resources other than the modifying factors already described in other sections of the Technical Report.
KENTIWALSIFAIRIEBB/wulr PLI028_Costerfield Operations_NI-43 101 Technical Report_2018_Rev1 6 February 2019
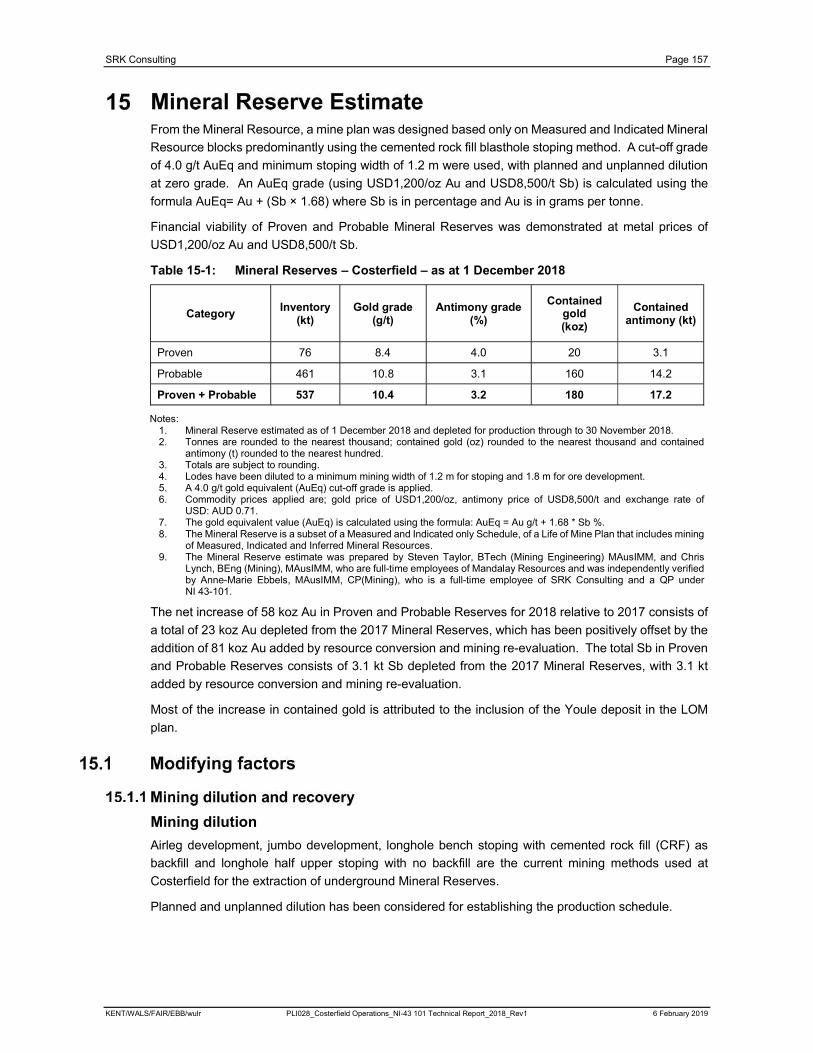
SRK Consulting Page 157
KENT/WALS/FAIR/EBB/wulr PLI028_Costerfield Operations_NI-43 101 Technical Report_2018_Rev1 6 February 2019
From the Mineral Resource, a mine plan was designed based only on Measured and Indicated Mineral
Resource blocks predominantly using the cemented rock fill blasthole stoping method. A cut-off grade
of 4.0 g/t AuEq and minimum stoping width of 1.2 m were used, with planned and unplanned dilution
at zero grade. An AuEq grade (using USD1,200/oz Au and USD8,500/t Sb) is calculated using the
formula AuEq= Au + (Sb × 1.68) where Sb is in percentage and Au is in grams per tonne.
Financial viability of Proven and Probable Mineral Reserves was demonstrated at metal prices of
USD1,200/oz Au and USD8,500/t Sb.
Table 15-1: Mineral Reserves – Costerfield – as at 1 December 2018
Category Inventory
(kt)Gold grade
(g/t)Antimony grade
(%)
Contained gold(koz)
Contained antimony (kt)
Proven 76 8.4 4.0 20 3.1
Probable 461 10.8 3.1 160 14.2
Proven + Probable 537 10.4 3.2 180 17.2
Notes:1. Mineral Reserve estimated as of 1 December 2018 and depleted for production through to 30 November 2018.2. Tonnes are rounded to the nearest thousand; contained gold (oz) rounded to the nearest thousand and contained
antimony (t) rounded to the nearest hundred. 3. Totals are subject to rounding.4. Lodes have been diluted to a minimum mining width of 1.2 m for stoping and 1.8 m for ore development. 5. A 4.0 g/t gold equivalent (AuEq) cut-off grade is applied.6. Commodity prices applied are; gold price of USD1,200/oz, antimony price of USD8,500/t and exchange rate of
USD: AUD 0.71.7. The gold equivalent value (AuEq) is calculated using the formula: AuEq = Au g/t + 1.68 * Sb %.8. The Mineral Reserve is a subset of a Measured and Indicated only Schedule, of a Life of Mine Plan that includes mining
of Measured, Indicated and Inferred Mineral Resources.9. The Mineral Reserve estimate was prepared by Steven Taylor, BTech (Mining Engineering) MAusIMM, and Chris
Lynch, BEng (Mining), MAusIMM, who are full-time employees of Mandalay Resources and was independently verified by Anne-Marie Ebbels, MAusIMM, CP(Mining), who is a full-time employee of SRK Consulting and a QP under NI 43-101.
The net increase of 58 koz Au in Proven and Probable Reserves for 2018 relative to 2017 consists of
a total of 23 koz Au depleted from the 2017 Mineral Reserves, which has been positively offset by the
addition of 81 koz Au added by resource conversion and mining re-evaluation. The total Sb in Proven
and Probable Reserves consists of 3.1 kt Sb depleted from the 2017 Mineral Reserves, with 3.1 kt
added by resource conversion and mining re-evaluation.
Most of the increase in contained gold is attributed to the inclusion of the Youle deposit in the LOM
plan.
Mining dilution
Airleg development, jumbo development, longhole bench stoping with cemented rock fill (CRF) as
backfill and longhole half upper stoping with no backfill are the current mining methods used at
Costerfield for the extraction of underground Mineral Reserves.
Planned and unplanned dilution has been considered for establishing the production schedule.
SRK Consulting Page 158
KENT/WALS/FAIR/EBB/wulr PLI028_Costerfield Operations_NI-43 101 Technical Report_2018_Rev1 6 February 2019
Planned dilution includes waste rock that will be mined and is not segregated from the design.
Sources of planned dilution include:
Waste rock that is drilled and blasted within the drive profile and the overall grade of the blasted
material justifies delivery to the mill
Waste rock within the confines of the stope limits; this includes footwall and/ or hanging wall rock
that has been drilled and blasted to maximise mining recovery and/ or maintain favourable wall
geometry for stability.
Due to the narrow width of mineralisation in the Augusta, Cuffley, Brunswick and Youle lodes, Mineral
Resources include an element of planned mining dilution, as Mineral Resources are reported to
conform to a minimum 1.2 m mining width. Where the lode is wider than 1.2 m, the minimum mining
width is the lode width.
Unplanned dilution includes waste rock (or low grade material) and/ or backfill from outside the planned
production drive profile or stope limits that overbreaks or sloughs into the mining void and is bogged
and delivered to the mill.
Unplanned dilution is the sum of overbreak (from deficient blasting practices) and fall-off (as in wedge
failure). Surveys of mined development drives and stopes to date are consistent with the figures
presented in Table 15-2. The longhole overbreak and dilution factors are considered to be consistent
with operational experience as these measurements are based on stope inspection sheet
measurements as well as stope scans that produce a 3D model of the open void, which is then
interrogated using mine planning software to generate the final void volume.
Operating practices attempt to mine the stope as close to the lode width as possible to limit the amount
of planned and unplanned dilution reporting to the stope drawpoint. All planned and unplanned mining
dilution is assumed to have zero grade.
The percentages of overall, i.e. planned/ unplanned, dilution for development, longhole half upper and
longhole CRF stoping are shown in Table 15-2.
Table 15-2: Costerfield Mine – recovery and dilution assumptions
Mining methodPlanned width
(m)Overall dilution
(%)Tonnage recovery factor
(%)
Airleg development 1.8 10 100
Longhole half upper – N Lode 1.2 35 93
Longhole half upper – All others 1.2–2.4 20–25 93
Remnant half upper 1.2 90 50–70
Longhole CRF – N Lode 1.2 35 95
Longhole CRF – All others 1.2–2.4 20–25 95
The overall dilution assumptions include unplanned dilution such as overbreak and bogging dilution.
This dilution has been based on the experience obtained from current operations and there is a good
reconciliation (Section 14.15) between forecast tonnes and actual tonnes. Development dilution is
based on end of month survey reports which compare actual drive area against the designed area.
The remaining stoping dilution figures are based on actual historical measurements as outlined above.
Dilution for the Remnant stopes is based the results from a trial mining program completed in 2017 on
remnant areas in the E Lode and W Lode. Dilution is more extreme in these areas due to poor ground
conditions. The dilution factor applied is a conservative estimate based on maximum reconciled
dilution to ensure sufficient economic viability of the remnant areas.
SRK Consulting Page 159
KENT/WALS/FAIR/EBB/wulr PLI028_Costerfield Operations_NI-43 101 Technical Report_2018_Rev1 6 February 2019
Mining recovery
Tonnage recovery factors shown in Table 15-2 represents the recovered proportion of planned mining
areas for the different mining methods and include in situ ore plus dilution material.
For stoping areas, visual inspections are carried out to estimate the stope void volume and determine
if any ore is left in the stopes. This information is recorded on stope inspection sheets. Stope scans
are also conducted to confirm the data captured. All data is used to estimate the recovery factor.
Remnant recovery has been estimated on a ‘by area’ basis and ranges from 50% to 70%. Factors
used to estimate this include structure, sill size, access and rehabilitation requirements.
All mine design work has been completed using GEOVIA Surpac, Deswik ASD and Deswik Interactive
Scheduler (IS).
The mining shapes designed were assessed against the block model in Deswik IS to calculate tonnes
and grade. 3D block models of each individual lode were used for the interrogation and mining
depletion process of the designed mining shapes.
The mining schedule included mining areas within the Augusta, Cuffley, Brunswick and Youle Mineral
Resources above the AuEq cut-off grade.
After completing the interrogation and depletion process, dependency rules including schedule
constraints were applied to the designed shapes to link all the mining activities in a logical manner
within in the Deswik IS project. This information was then exported to Excel for further financial
validation.
Deswik IS software was used for life of mine scheduling. The key assumptions such as cut-off grade,
mining dilution and recovery factors, assigning resources and rate of mining were included in
scheduling calculations.
These design and scheduling programs are used for quarterly and monthly planning purposes.
Estimation of the design cut-off grade was based on past mining experience gained in the Augusta
and Cuffley deposits as well as historical performances, both physical and economic, of the mining
and processing methodologies.
The distribution of grade over the measured and indicated Mineral Resources was considered to
enable grade-tonnage curves to be generated and from which cut-off equations were determined.
Based on the historical and 2018 budgeted cost estimates from the current Augusta and Cuffley mine
as well as the planned future capital and operating cost structure for the entire operation, a cut-off
grade of 4.0 g/t AuEq was calculated and applied to the Mineral Resource to determine the mine
design shapes (i.e. stope shapes) which demonstrated sufficiently economic grades to warrant mining.
The mine design shapes enabled a mine plan to be developed, which was independently verified to
be both technically achievable and economically viable once all Modifying Factors were considered.
Each lode was assessed for economic viability on a level by level basis. All low grade material on the
extremities of orebodies that is not economically viable was excluded.
For reporting purposes, a 4.0 g/t AuEq cut-off was applied in determining the Mineral Reserve
estimate.
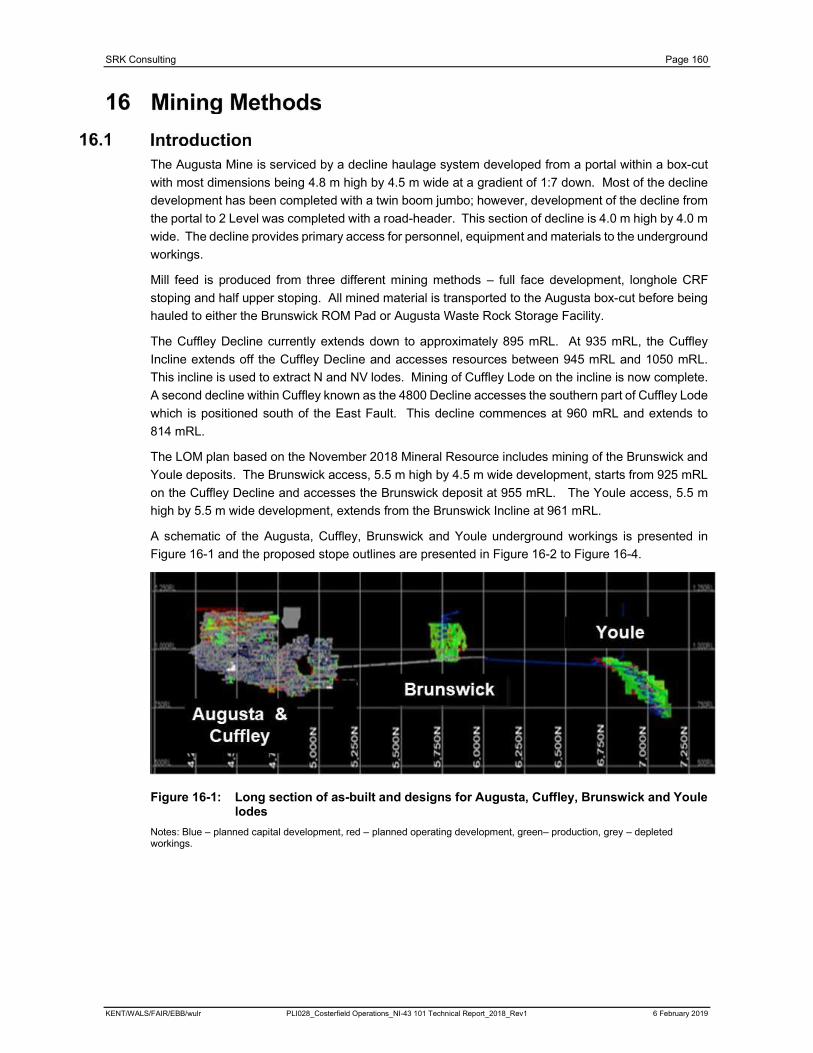
SRK Consulting Page 160
KENT/WALS/FAIR/EBB/wulr PLI028_Costerfield Operations_NI-43 101 Technical Report_2018_Rev1 6 February 2019
The Augusta Mine is serviced by a decline haulage system developed from a portal within a box-cut
with most dimensions being 4.8 m high by 4.5 m wide at a gradient of 1:7 down. Most of the decline
development has been completed with a twin boom jumbo; however, development of the decline from
the portal to 2 Level was completed with a road-header. This section of decline is 4.0 m high by 4.0 m
wide. The decline provides primary access for personnel, equipment and materials to the underground
workings.
Mill feed is produced from three different mining methods – full face development, longhole CRF
stoping and half upper stoping. All mined material is transported to the Augusta box-cut before being
hauled to either the Brunswick ROM Pad or Augusta Waste Rock Storage Facility.
The Cuffley Decline currently extends down to approximately 895 mRL. At 935 mRL, the Cuffley
Incline extends off the Cuffley Decline and accesses resources between 945 mRL and 1050 mRL.
This incline is used to extract N and NV lodes. Mining of Cuffley Lode on the incline is now complete.
A second decline within Cuffley known as the 4800 Decline accesses the southern part of Cuffley Lode
which is positioned south of the East Fault. This decline commences at 960 mRL and extends to
814 mRL.
The LOM plan based on the November 2018 Mineral Resource includes mining of the Brunswick and
Youle deposits. The Brunswick access, 5.5 m high by 4.5 m wide development, starts from 925 mRL
on the Cuffley Decline and accesses the Brunswick deposit at 955 mRL. The Youle access, 5.5 m
high by 5.5 m wide development, extends from the Brunswick Incline at 961 mRL.
A schematic of the Augusta, Cuffley, Brunswick and Youle underground workings is presented in
Figure 16-1 and the proposed stope outlines are presented in Figure 16-2 to Figure 16-4.
Figure 16-1: Long section of as-built and designs for Augusta, Cuffley, Brunswick and Youle lodes
Notes: Blue – planned capital development, red – planned operating development, green– production, grey – depleted workings.
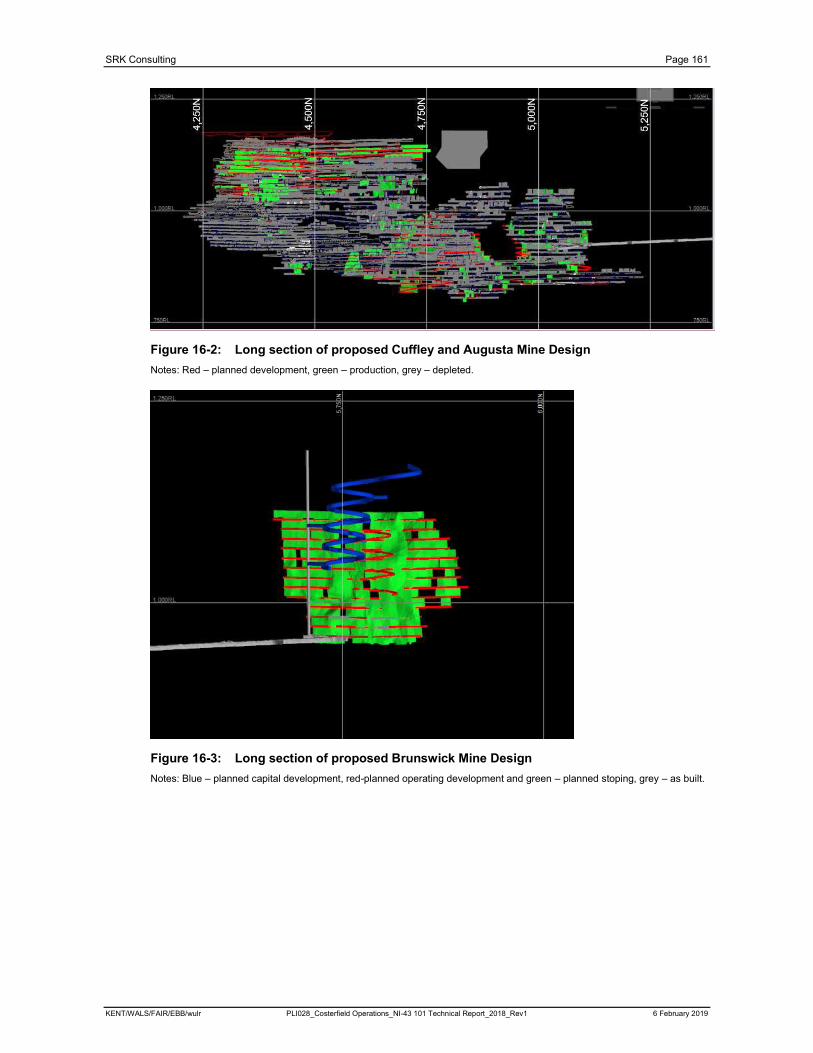
SRK Consulting Page 161
KENT/WALS/FAIR/EBB/wulr PLI028_Costerfield Operations_NI-43 101 Technical Report_2018_Rev1 6 February 2019
Figure 16-2: Long section of proposed Cuffley and Augusta Mine Design
Notes: Red – planned development, green – production, grey – depleted.
Figure 16-3: Long section of proposed Brunswick Mine Design
Notes: Blue – planned capital development, red-planned operating development and green – planned stoping, grey – as built.
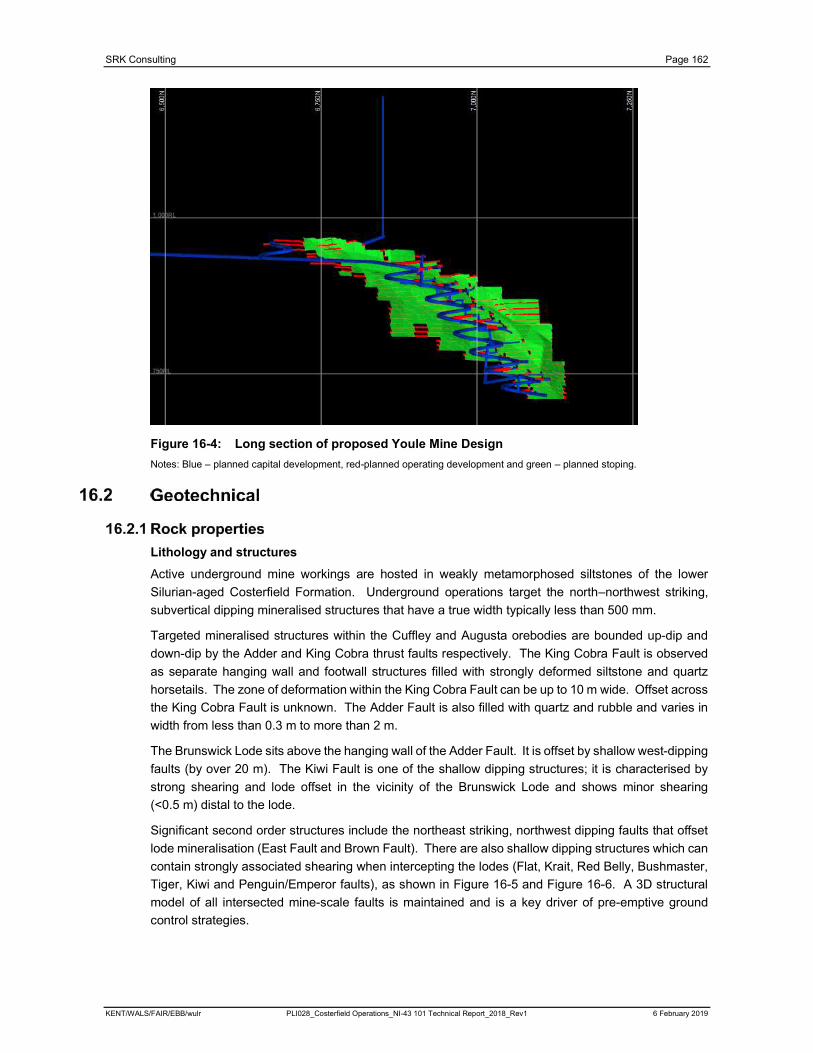
SRK Consulting Page 162
KENT/WALS/FAIR/EBB/wulr PLI028_Costerfield Operations_NI-43 101 Technical Report_2018_Rev1 6 February 2019
Figure 16-4: Long section of proposed Youle Mine Design
Notes: Blue – planned capital development, red-planned operating development and green – planned stoping.
Lithology and structures
Active underground mine workings are hosted in weakly metamorphosed siltstones of the lower
Silurian-aged Costerfield Formation. Underground operations target the north–northwest striking,
subvertical dipping mineralised structures that have a true width typically less than 500 mm.
Targeted mineralised structures within the Cuffley and Augusta orebodies are bounded up-dip and
down-dip by the Adder and King Cobra thrust faults respectively. The King Cobra Fault is observed
as separate hanging wall and footwall structures filled with strongly deformed siltstone and quartz
horsetails. The zone of deformation within the King Cobra Fault can be up to 10 m wide. Offset across
the King Cobra Fault is unknown. The Adder Fault is also filled with quartz and rubble and varies in
width from less than 0.3 m to more than 2 m.
The Brunswick Lode sits above the hanging wall of the Adder Fault. It is offset by shallow west-dipping
faults (by over 20 m). The Kiwi Fault is one of the shallow dipping structures; it is characterised by
strong shearing and lode offset in the vicinity of the Brunswick Lode and shows minor shearing
(<0.5 m) distal to the lode.
Significant second order structures include the northeast striking, northwest dipping faults that offset
lode mineralisation (East Fault and Brown Fault). There are also shallow dipping structures which can
contain strongly associated shearing when intercepting the lodes (Flat, Krait, Red Belly, Bushmaster,
Tiger, Kiwi and Penguin/Emperor faults), as shown in Figure 16-5 and Figure 16-6. A 3D structural
model of all intersected mine-scale faults is maintained and is a key driver of pre-emptive ground
control strategies.
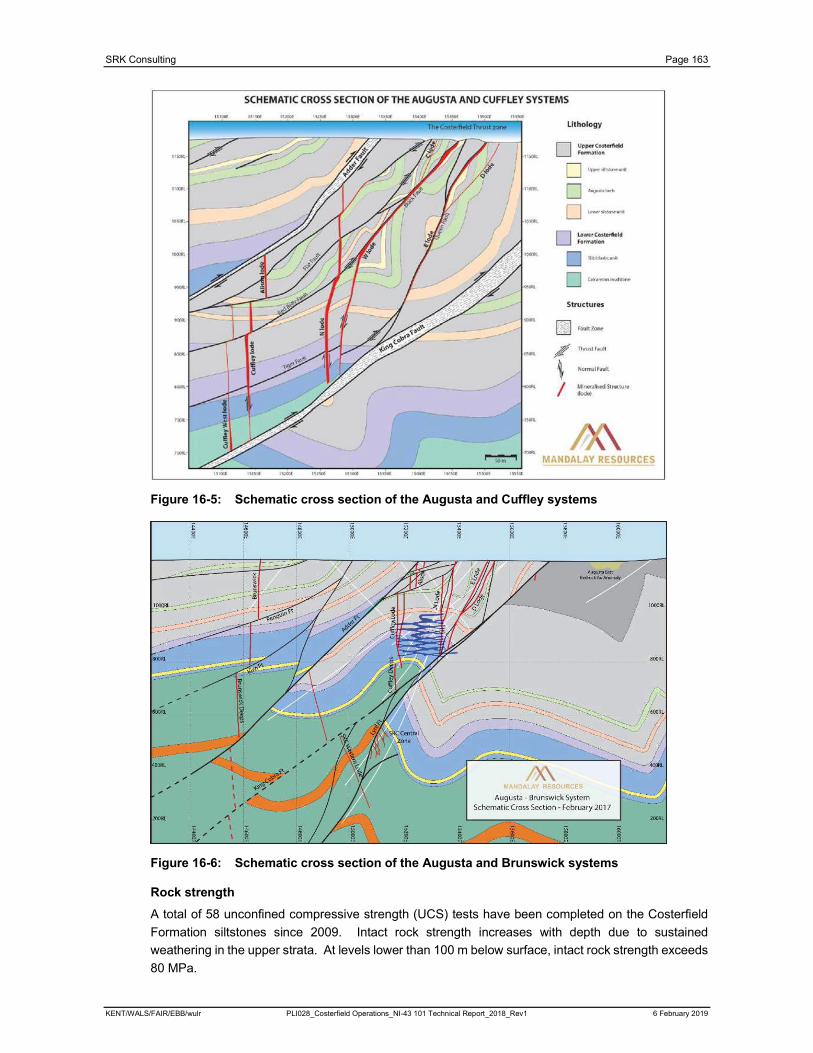
SRK Consulting Page 163
KENT/WALS/FAIR/EBB/wulr PLI028_Costerfield Operations_NI-43 101 Technical Report_2018_Rev1 6 February 2019
Figure 16-5: Schematic cross section of the Augusta and Cuffley systems
Figure 16-6: Schematic cross section of the Augusta and Brunswick systems
Rock strength
A total of 58 unconfined compressive strength (UCS) tests have been completed on the Costerfield
Formation siltstones since 2009. Intact rock strength increases with depth due to sustained
weathering in the upper strata. At levels lower than 100 m below surface, intact rock strength exceeds
80 MPa.
SRK Consulting Page 164
KENT/WALS/FAIR/EBB/wulr PLI028_Costerfield Operations_NI-43 101 Technical Report_2018_Rev1 6 February 2019
Rock stress
In situ stress measurements have not been undertaken at Costerfield. In situ stress is approximated
using the study by Lee et al. (2010) which collates over 1,000 stress measurements taken on the
Australian continental tectonic plate. The Costerfield region (i.e. Augusta mine) lies within the Lachlan
Province where the principal stress orientation is WNW–
other mines in the region suggest a major principal stress magnitude of ~40 MPa at 565–575 m below
surface, with a strong correlation between increased depth and increased in situ stress.
In situ stress in levels below 895 mRL has caused minor convergence (squeezing ground) in isolated
areas around major fault zones. The magnitude of this squeezing is small enough to be contained by
dynamic support.
Rock mass alteration
Rock mass in the vicinity of mineralised structures is heavily fractured with multiple joint orientations,
often with a portion of clay fill and smooth planar joint surfaces. Rock mass in in waste rock, away
from mineralised lodes and discrete structures, improves with lower fracture frequency and rough
tightly healed joint surfaces.
Hydrogeology
The regional hydrogeology comprises of two main aquifers – the Shallow Alluvial Aquifer (SAA) and
the Regional Basement Aquifer (RBA):
The SAA comprises silts, sands and gravels and is a perched groundwater system occurring
across the site and within the confines of the creek and valley floors. There is clear evidence that
this aquifer is perched, laterally discontinuous and is less common in the area.
The RBA comprises Silurian metasediments and forms the basement aquifer, where groundwater
mainly occurs within, and is transmitted through, fracture systems beneath the upper weathered
profile, at depths exceeding 20 m below natural surface.
Dewatering of underground workings in the Augusta and Cuffley deposits is achieved by two
underground pump stations that pump to the Cuffley pump station, via a Siltbuster® water treatment
facility. Dewatering in the Brunswick deposit is achieved by pumping straight to the Cuffley pump
station, via the Siltbuster® water treatment facility. From the Cuffley pump station, water is fed to an
Actiflow water treatment unit located at the Brunswick site, before being distributed to the mine dam,
and Splitters Creek Evaporation Facility. Recently, water inflow has been approximately 2 ML per day
and is expected to increase to 4 ML per day during the drawdown period for the Youle deposit.
Mining methods
The dominant mining method is longitudinal longhole open stoping with CRF. Panels generally
consisting of four operating levels are mined from the bottom up over CRF with longitudinal retreat to
a quasi-central access.
Several other mining methods are applied to access and optimise ore extraction at Costerfield
Operation:
Capital development with twin-boom or single-boom jumbo
Level development with airleg (handheld rock drill)
Overhand cut-and-fill (flat-backing ore level development)
Floor benching of level ore development
SRK Consulting Page 165
KENT/WALS/FAIR/EBB/wulr PLI028_Costerfield Operations_NI-43 101 Technical Report_2018_Rev1 6 February 2019
Blind uphole longitudinal longhole open stoping (‘half uppers’)
Longitudinal longhole open stoping with CRF
Downhole vertical crater retreat (VCR)
Avoca stoping with CRF (‘reverse fill’)
Avoca stoping with rock fill (‘reverse fill’)
Airleg rise mining.
Mining methods are selected to suit ore drive/ lode geometry and maximise ore recovery while
minimising unplanned dilution.
Development geometry
Standard development profiles adopted at the Costerfield Operation include:
1.8 m wide × 2.8 m high ore drives
1.8m wide × 3.0 m high ore drives
2.0 m wide × 2.8 m high access crosscuts
2.0 m wide × 3.0 m high access crosscuts
4.5 m wide × 4.8 m high decline
5.5 m wide × 5.5 m high decline /incline
5.0 m wide × 4.8 m high level access
5.0 m wide × 6.5 m high truck tips
4.5 m wide × 4.8 m high ore stockpiles.
Non-standard development profiles may be mined to allow for major infrastructure (pump stations,
explosives magazines, fan chambers etc.) or to suit applied mining methods (flat backing, floor
benching etc.). Development spans and associated ground support are designed using empirical data
to ensure the stability of mined spans.
Stope geometry
In response to observed ground conditions and production drill capability, inter-level spacing at
Costerfield is variable. Stope strike lengths vary based on the applied mining method, observed
ground conditions, and equipment capability.
Stope geometry parameters include:
Stope height: up to 17 m
Stope strike length: 2.8 m–10.5 m
Stope design width: 1.5 m
Stope dip: 53°-90°.
Non-standard stope geometry may be mined to maximise ore extraction under unique circumstances
(i.e. remnant mining or geological complexity). The empirical stope performance chart is consulted to
ensure that designed stope spans will allow safe efficient extraction of target mineralisation.
SRK Consulting Page 166
KENT/WALS/FAIR/EBB/wulr PLI028_Costerfield Operations_NI-43 101 Technical Report_2018_Rev1 6 February 2019
Pillars and offsets
In mine design and planning, the following pillars and offsets are observed to ensure stability of mined
excavations:
Decline development is designed and mined with a 30 m offset to target mineralised structures.
To date, stope production blasting has not influenced decline stability having applied the 30 m
offset. This distance has been maintained for the Brunswick and Youle lodes.
The minimum inter-level pillar width to height ratio is 1:2 (i.e. for 1.8 m wide ore drives, the
minimum inter-level spacing is 3.6 m).
The minimum horizontal clearance between sub-parallel ore drives is 2 m.
The minimum pillar strike between unfilled blind uphole longitudinal open stopes (‘half uppers’) is
3 m.
Backfill
CRF is the most commonly used backfill at the Costerfield Operation. CRF is exposed vertically in the
longitudinal retreat of CRF filled longhole open stopes, and horizontally in the mining of sill pillars at
the toe of blind uphole longitudinal open stopes (‘half uppers’). Loose rock fill is used where vertical
and horizontal exposures to filled voids are not required (i.e. level close-out stopes and adjacent to
waste pillars). Cemented aggregate fill is used in areas that re-access to the other side of the lode is
required, i.e. N Lode fill for K Lode access.
Development ground support
Ground support elements installed in standard development profiles include:
2.4 m × 25 mm diameter galvanised resin bolts
2.4 m × 20 mm diameter galvanised resin bolts
2.1 m × 20 mm diameter galvanised resin bolts
2.4 m × 47 mm diameter galvanised friction bolts
1.5 m × 33 mm diameter galvanised friction bolts
1.8 m × 33 mm diameter Hydrobolts
2.4 m × 33 mm diameter Hydrobolts
2.4 m × 3.6 m × 5.6 mm diameter gauge galvanised mesh
2.4 m × 4.2 m × 5.6 mm diameter gauge galvanised mesh
2.4 m × 3.0 m × 4.0 mm diameter gauge galvanised mesh
2.4 m × 1.5 m × 4.0 mm diameter gauge galvanised mesh.
When spans exceed 5.5 m in development intersections or in response to deteriorating ground
conditions and discrete structures, cable bolts (single strand, non-galvanised, bulbed,
4.5–6.0 m) are installed to ensure the stability of development profiles.
Additional ground support may be installed to support non-standard development profiles or in
response to particularly poor ground conditions. Fibrecrete, resin injection, spiling, sets and straps
have been installed in the past to support poor ground, development/ stoping interactions and faults/
shear zones. In areas where squeezing ground is expected, 2.4 m and 1.8 m yield Lok-Bolts™ are
installed.
SRK Consulting Page 167
KENT/WALS/FAIR/EBB/wulr PLI028_Costerfield Operations_NI-43 101 Technical Report_2018_Rev1 6 February 2019
Stoping ground support
Additional support for designed stopes is installed on an as required basis in response to compromised
stope geometry, poor rock mass, interactions with faults/ shears or interactions with other stopes and
development. Single strand, non-galvanised, bulbed, 4.5–6 m cable bolts are generally installed as
secondary support for stopes. Other forms of ground support, including resin bolts, friction bolts, mesh,
fibrecrete, resin injection and straps, may also be installed to provide secondary support for designed
stopes.
Longhole CRF stoping has been selected as the preferred mining method for the remaining Augusta
and Cuffley resources. This is based on the orebody geometry as well as favourable experience
gained through the use of this method. (Other mining methods have been trialled). Longhole CRF
stoping has also been selected for the Brunswick land Youle lodes. A bottom-up methodology to be
used at Brunswick will minimise the size of the crown/ sill pillars required to be left in place.
This process necessitates that crown/ sill pillars are left in place on a regular basis to ensure local
mine stability. Recovery of these pillars is planned to be undertaken via the use of half upper
production stoping.
Mining within the Augusta mine targets several individual lodes (including W, NM, NE, P, E and Cuffley
lodes) which vary in width from 0.1 m to 1.5 m and dip between 45° and 85°. This lode geometry is
favourable for longhole CRF stoping using mechanised mining techniques.
The sub-level spacing of 10 m floor to floor (7 m backs to floor), has been established to ensure stable
spans, acceptable drilling accuracies and blasthole lengths. A sub-level spacing of 15 m has been
trialled for one level in the Cuffley South area. This involved drilling up from the lower level to 8 m and
drilling and firing the remainder from the upper level using downholes. While this has been successful,
it is limited to this one area at this point.
The Brunswick orebody has applied a sub-level spacing of 12 m floor to floor (9 m backs to floor).
This has been established due to better drill accuracy, and the wider orebody (average diluted stope
width of 1.65 m vs 1.5 m in Cuffley and Augusta).
The Youle orebody has been designed with a sub-level spacing of 7 m floor to floor (4 m backs to floor
vertically, 7 m backs to floor along the dip of the orebody). This reduced sub-level spacing has been
designed to minimise dilution and improve recovery in the flatter-dipping Youle stopes.
The production cycle for longhole CRF stoping, as illustrated by Figure 16-7, comprises the following:
Develop access to the orebody.
Establish bottom sill drive and upper fill drive.
Drill production blastholes in a zipper or two holes per ring pattern depending on ore width (nominal
stope design width is 1.2 m).
Blast 2.8 m strike length of holes and extract ore.
Place rock bund at brow of stope and place rock-tube in stope; the rock-tube is tightly rolled steel
mesh placed in the leading edge of stope prior to filling and eliminates the need to bore reamer
holes in next stoping panel.
Place CRF into stope.
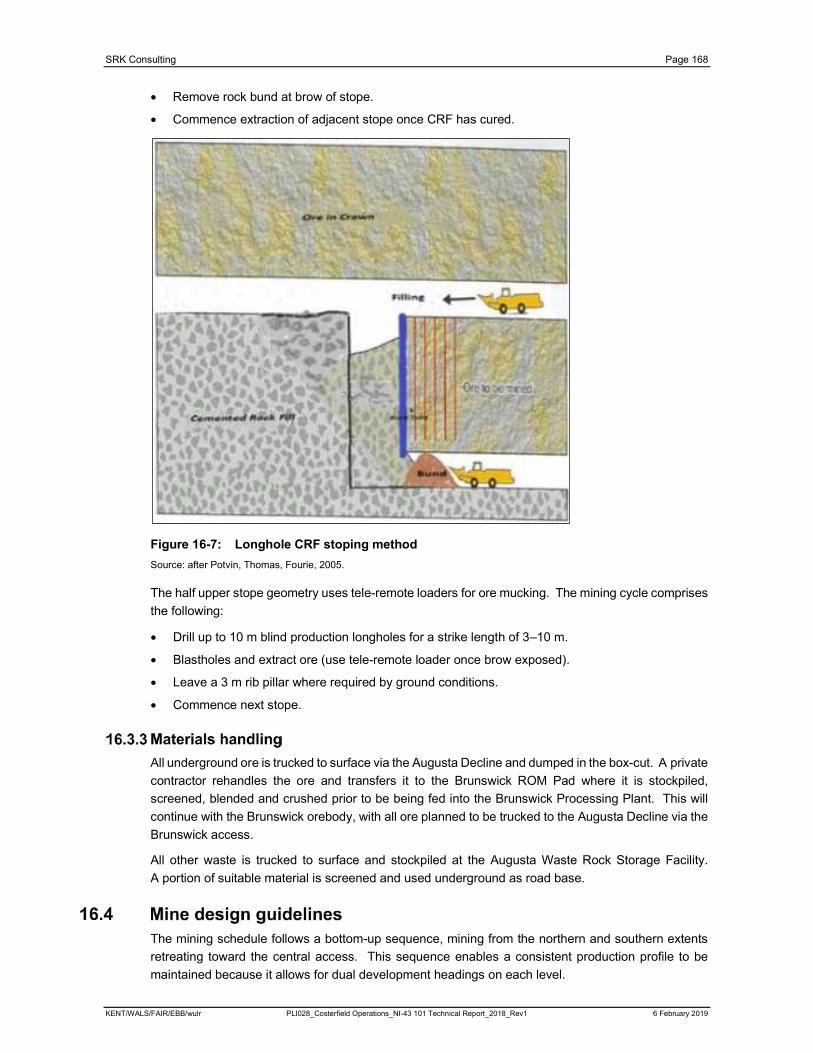
SRK Consulting Page 168
KENT/WALS/FAIR/EBB/wulr PLI028_Costerfield Operations_NI-43 101 Technical Report_2018_Rev1 6 February 2019
Remove rock bund at brow of stope.
Commence extraction of adjacent stope once CRF has cured.
Figure 16-7: Longhole CRF stoping method
Source: after Potvin, Thomas, Fourie, 2005.
The half upper stope geometry uses tele-remote loaders for ore mucking. The mining cycle comprises
the following:
Drill up to 10 m blind production longholes for a strike length of 3–10 m.
Blastholes and extract ore (use tele-remote loader once brow exposed).
Leave a 3 m rib pillar where required by ground conditions.
Commence next stope.
All underground ore is trucked to surface via the Augusta Decline and dumped in the box-cut. A private
contractor rehandles the ore and transfers it to the Brunswick ROM Pad where it is stockpiled,
screened, blended and crushed prior to be being fed into the Brunswick Processing Plant. This will
continue with the Brunswick orebody, with all ore planned to be trucked to the Augusta Decline via the
Brunswick access.
All other waste is trucked to surface and stockpiled at the Augusta Waste Rock Storage Facility.
A portion of suitable material is screened and used underground as road base.
The mining schedule follows a bottom-up sequence, mining from the northern and southern extents
retreating toward the central access. This sequence enables a consistent production profile to be
maintained because it allows for dual development headings on each level.
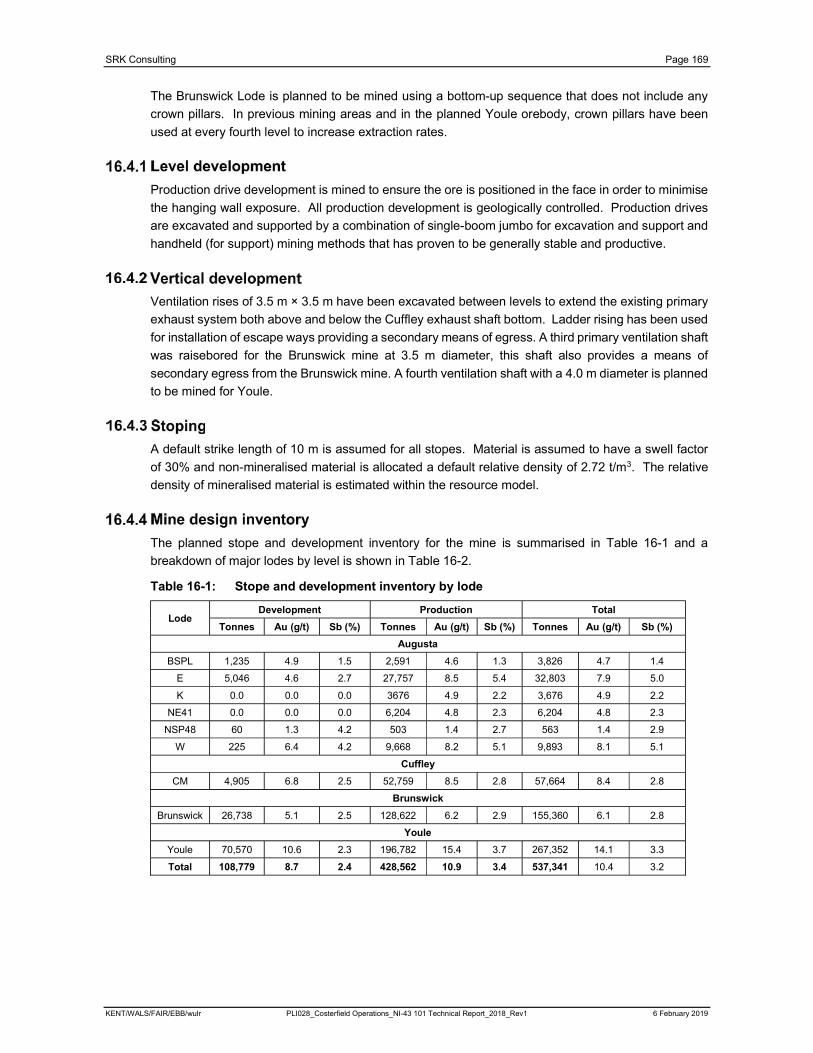
SRK Consulting Page 169
KENT/WALS/FAIR/EBB/wulr PLI028_Costerfield Operations_NI-43 101 Technical Report_2018_Rev1 6 February 2019
The Brunswick Lode is planned to be mined using a bottom-up sequence that does not include any
crown pillars. In previous mining areas and in the planned Youle orebody, crown pillars have been
used at every fourth level to increase extraction rates.
Production drive development is mined to ensure the ore is positioned in the face in order to minimise
the hanging wall exposure. All production development is geologically controlled. Production drives
are excavated and supported by a combination of single-boom jumbo for excavation and support and
handheld (for support) mining methods that has proven to be generally stable and productive.
Ventilation rises of 3.5 m × 3.5 m have been excavated between levels to extend the existing primary
exhaust system both above and below the Cuffley exhaust shaft bottom. Ladder rising has been used
for installation of escape ways providing a secondary means of egress. A third primary ventilation shaft
was raisebored for the Brunswick mine at 3.5 m diameter, this shaft also provides a means of
secondary egress from the Brunswick mine. A fourth ventilation shaft with a 4.0 m diameter is planned
to be mined for Youle.
A default strike length of 10 m is assumed for all stopes. Material is assumed to have a swell factor
of 30% and non-mineralised material is allocated a default relative density of 2.72 t/m3. The relative
density of mineralised material is estimated within the resource model.
The planned stope and development inventory for the mine is summarised in Table 16-1 and a
breakdown of major lodes by level is shown in Table 16-2.
Table 16-1: Stope and development inventory by lode
LodeDevelopment Production Total
Tonnes Au (g/t) Sb (%) Tonnes Au (g/t) Sb (%) Tonnes Au (g/t) Sb (%)
Augusta
BSPL 1,235 4.9 1.5 2,591 4.6 1.3 3,826 4.7 1.4
E 5,046 4.6 2.7 27,757 8.5 5.4 32,803 7.9 5.0
K 0.0 0.0 0.0 3676 4.9 2.2 3,676 4.9 2.2
NE41 0.0 0.0 0.0 6,204 4.8 2.3 6,204 4.8 2.3
NSP48 60 1.3 4.2 503 1.4 2.7 563 1.4 2.9
W 225 6.4 4.2 9,668 8.2 5.1 9,893 8.1 5.1
Cuffley
CM 4,905 6.8 2.5 52,759 8.5 2.8 57,664 8.4 2.8
Brunswick
Brunswick 26,738 5.1 2.5 128,622 6.2 2.9 155,360 6.1 2.8
Youle
Youle 70,570 10.6 2.3 196,782 15.4 3.7 267,352 14.1 3.3
Total 108,779 8.7 2.4 428,562 10.9 3.4 537,341 10.4 3.2
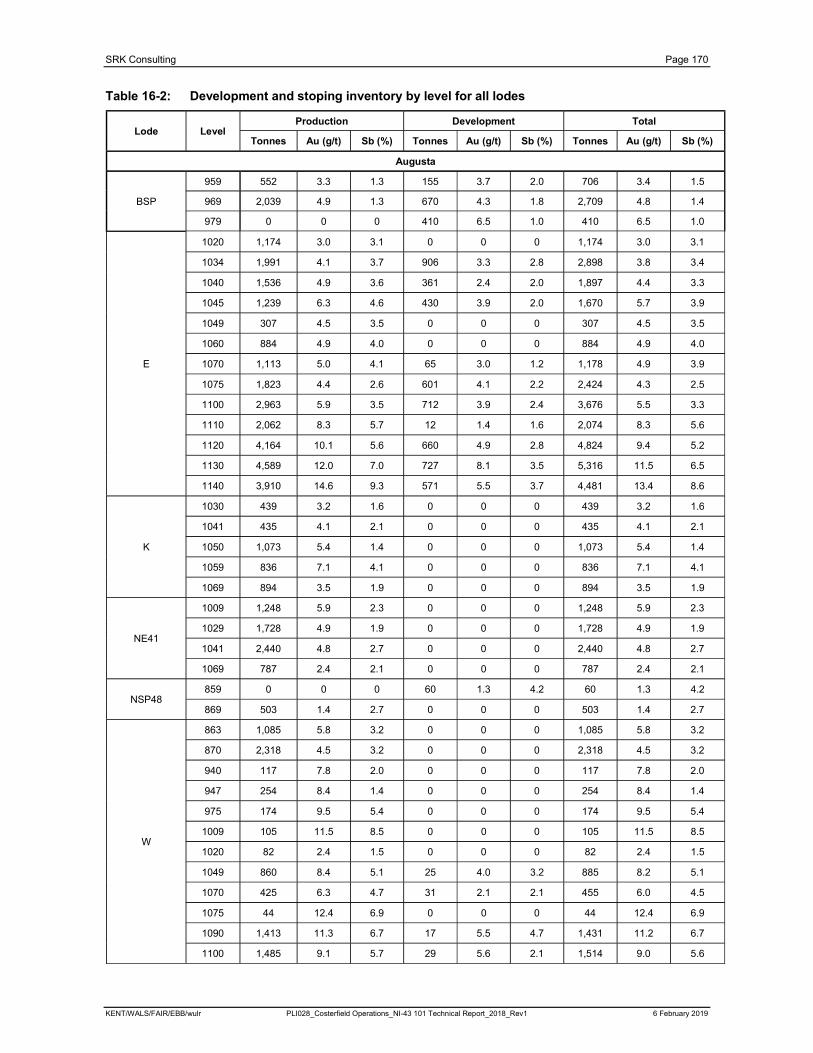
SRK Consulting Page 170
KENT/WALS/FAIR/EBB/wulr PLI028_Costerfield Operations_NI-43 101 Technical Report_2018_Rev1 6 February 2019
Table 16-2: Development and stoping inventory by level for all lodes
Lode LevelProduction Development Total
Tonnes Au (g/t) Sb (%) Tonnes Au (g/t) Sb (%) Tonnes Au (g/t) Sb (%)
Augusta
BSP
959 552 3.3 1.3 155 3.7 2.0 706 3.4 1.5
969 2,039 4.9 1.3 670 4.3 1.8 2,709 4.8 1.4
979 0 0 0 410 6.5 1.0 410 6.5 1.0
E
1020 1,174 3.0 3.1 0 0 0 1,174 3.0 3.1
1034 1,991 4.1 3.7 906 3.3 2.8 2,898 3.8 3.4
1040 1,536 4.9 3.6 361 2.4 2.0 1,897 4.4 3.3
1045 1,239 6.3 4.6 430 3.9 2.0 1,670 5.7 3.9
1049 307 4.5 3.5 0 0 0 307 4.5 3.5
1060 884 4.9 4.0 0 0 0 884 4.9 4.0
1070 1,113 5.0 4.1 65 3.0 1.2 1,178 4.9 3.9
1075 1,823 4.4 2.6 601 4.1 2.2 2,424 4.3 2.5
1100 2,963 5.9 3.5 712 3.9 2.4 3,676 5.5 3.3
1110 2,062 8.3 5.7 12 1.4 1.6 2,074 8.3 5.6
1120 4,164 10.1 5.6 660 4.9 2.8 4,824 9.4 5.2
1130 4,589 12.0 7.0 727 8.1 3.5 5,316 11.5 6.5
1140 3,910 14.6 9.3 571 5.5 3.7 4,481 13.4 8.6
K
1030 439 3.2 1.6 0 0 0 439 3.2 1.6
1041 435 4.1 2.1 0 0 0 435 4.1 2.1
1050 1,073 5.4 1.4 0 0 0 1,073 5.4 1.4
1059 836 7.1 4.1 0 0 0 836 7.1 4.1
1069 894 3.5 1.9 0 0 0 894 3.5 1.9
NE41
1009 1,248 5.9 2.3 0 0 0 1,248 5.9 2.3
1029 1,728 4.9 1.9 0 0 0 1,728 4.9 1.9
1041 2,440 4.8 2.7 0 0 0 2,440 4.8 2.7
1069 787 2.4 2.1 0 0 0 787 2.4 2.1
NSP48859 0 0 0 60 1.3 4.2 60 1.3 4.2
869 503 1.4 2.7 0 0 0 503 1.4 2.7
W
863 1,085 5.8 3.2 0 0 0 1,085 5.8 3.2
870 2,318 4.5 3.2 0 0 0 2,318 4.5 3.2
940 117 7.8 2.0 0 0 0 117 7.8 2.0
947 254 8.4 1.4 0 0 0 254 8.4 1.4
975 174 9.5 5.4 0 0 0 174 9.5 5.4
1009 105 11.5 8.5 0 0 0 105 11.5 8.5
1020 82 2.4 1.5 0 0 0 82 2.4 1.5
1049 860 8.4 5.1 25 4.0 3.2 885 8.2 5.1
1070 425 6.3 4.7 31 2.1 2.1 455 6.0 4.5
1075 44 12.4 6.9 0 0 0 44 12.4 6.9
1090 1,413 11.3 6.7 17 5.5 4.7 1,431 11.2 6.7
1100 1,485 9.1 5.7 29 5.6 2.1 1,514 9.0 5.6
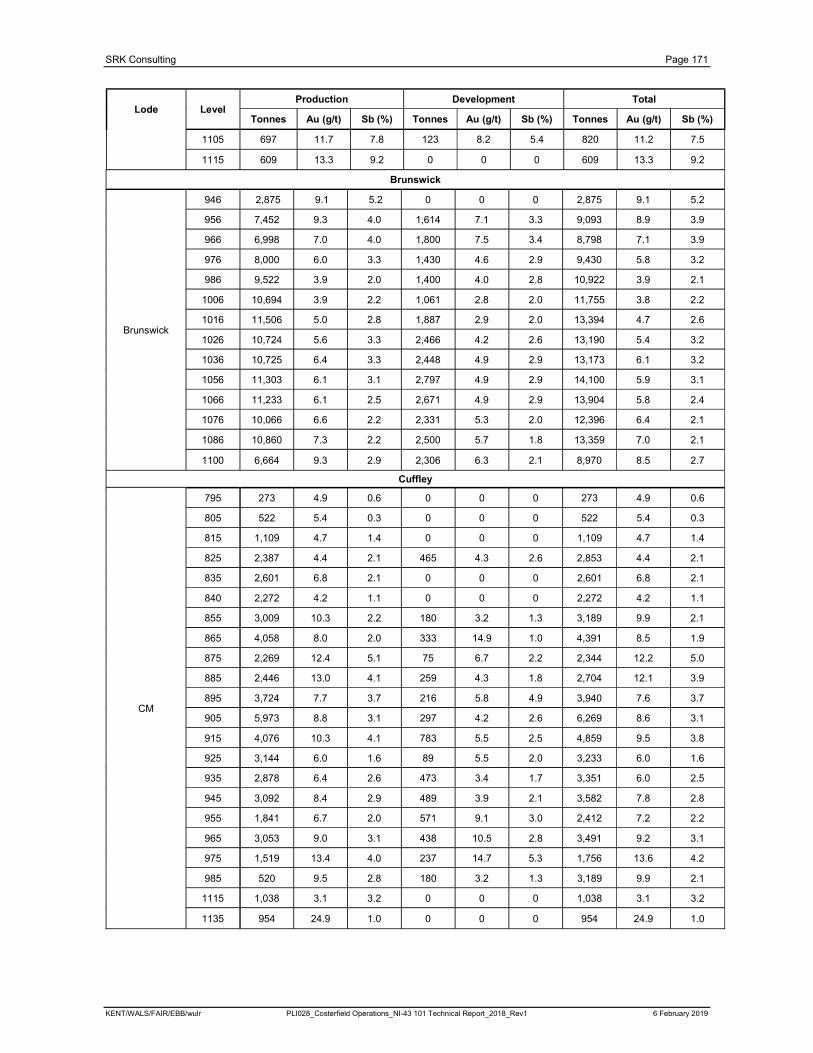
SRK Consulting Page 171
KENT/WALS/FAIR/EBB/wulr PLI028_Costerfield Operations_NI-43 101 Technical Report_2018_Rev1 6 February 2019
Lode LevelProduction Development Total
Tonnes Au (g/t) Sb (%) Tonnes Au (g/t) Sb (%) Tonnes Au (g/t) Sb (%)
1105 697 11.7 7.8 123 8.2 5.4 820 11.2 7.5
1115 609 13.3 9.2 0 0 0 609 13.3 9.2
Brunswick
Brunswick
946 2,875 9.1 5.2 0 0 0 2,875 9.1 5.2
956 7,452 9.3 4.0 1,614 7.1 3.3 9,093 8.9 3.9
966 6,998 7.0 4.0 1,800 7.5 3.4 8,798 7.1 3.9
976 8,000 6.0 3.3 1,430 4.6 2.9 9,430 5.8 3.2
986 9,522 3.9 2.0 1,400 4.0 2.8 10,922 3.9 2.1
1006 10,694 3.9 2.2 1,061 2.8 2.0 11,755 3.8 2.2
1016 11,506 5.0 2.8 1,887 2.9 2.0 13,394 4.7 2.6
1026 10,724 5.6 3.3 2,466 4.2 2.6 13,190 5.4 3.2
1036 10,725 6.4 3.3 2,448 4.9 2.9 13,173 6.1 3.2
1056 11,303 6.1 3.1 2,797 4.9 2.9 14,100 5.9 3.1
1066 11,233 6.1 2.5 2,671 4.9 2.9 13,904 5.8 2.4
1076 10,066 6.6 2.2 2,331 5.3 2.0 12,396 6.4 2.1
1086 10,860 7.3 2.2 2,500 5.7 1.8 13,359 7.0 2.1
1100 6,664 9.3 2.9 2,306 6.3 2.1 8,970 8.5 2.7
Cuffley
CM
795 273 4.9 0.6 0 0 0 273 4.9 0.6
805 522 5.4 0.3 0 0 0 522 5.4 0.3
815 1,109 4.7 1.4 0 0 0 1,109 4.7 1.4
825 2,387 4.4 2.1 465 4.3 2.6 2,853 4.4 2.1
835 2,601 6.8 2.1 0 0 0 2,601 6.8 2.1
840 2,272 4.2 1.1 0 0 0 2,272 4.2 1.1
855 3,009 10.3 2.2 180 3.2 1.3 3,189 9.9 2.1
865 4,058 8.0 2.0 333 14.9 1.0 4,391 8.5 1.9
875 2,269 12.4 5.1 75 6.7 2.2 2,344 12.2 5.0
885 2,446 13.0 4.1 259 4.3 1.8 2,704 12.1 3.9
895 3,724 7.7 3.7 216 5.8 4.9 3,940 7.6 3.7
905 5,973 8.8 3.1 297 4.2 2.6 6,269 8.6 3.1
915 4,076 10.3 4.1 783 5.5 2.5 4,859 9.5 3.8
925 3,144 6.0 1.6 89 5.5 2.0 3,233 6.0 1.6
935 2,878 6.4 2.6 473 3.4 1.7 3,351 6.0 2.5
945 3,092 8.4 2.9 489 3.9 2.1 3,582 7.8 2.8
955 1,841 6.7 2.0 571 9.1 3.0 2,412 7.2 2.2
965 3,053 9.0 3.1 438 10.5 2.8 3,491 9.2 3.1
975 1,519 13.4 4.0 237 14.7 5.3 1,756 13.6 4.2
985 520 9.5 2.8 180 3.2 1.3 3,189 9.9 2.1
1115 1,038 3.1 3.2 0 0 0 1,038 3.1 3.2
1135 954 24.9 1.0 0 0 0 954 24.9 1.0
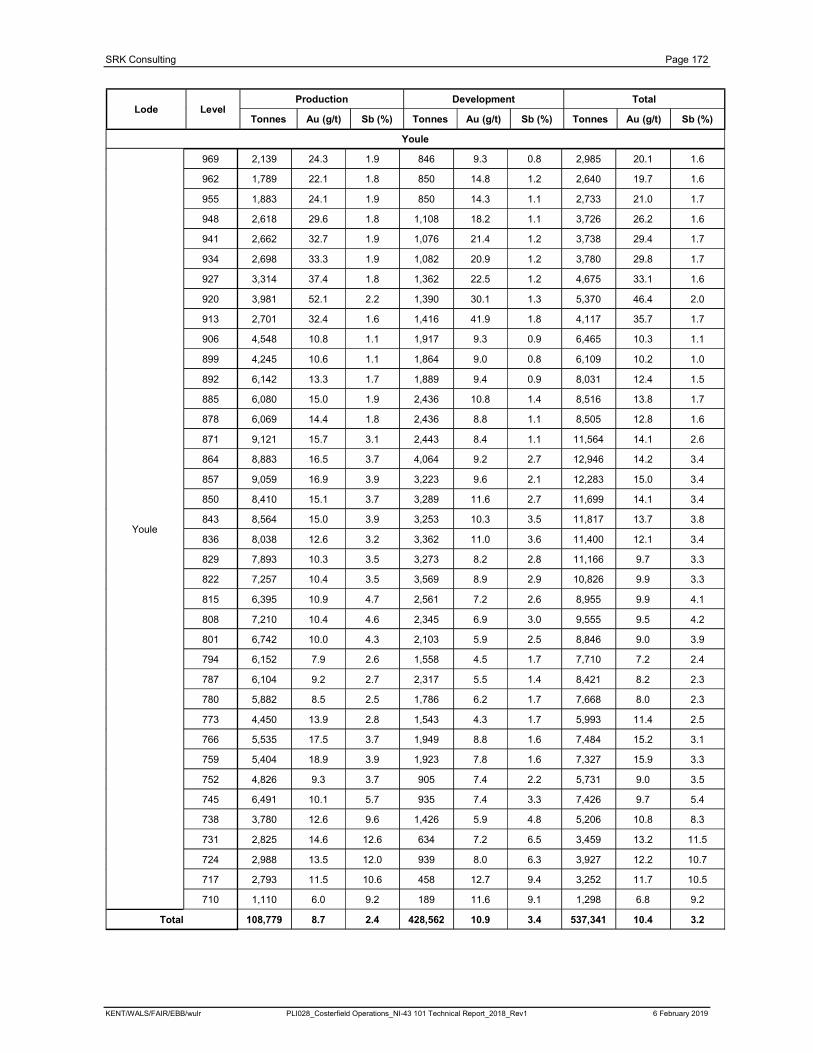
SRK Consulting Page 172
KENT/WALS/FAIR/EBB/wulr PLI028_Costerfield Operations_NI-43 101 Technical Report_2018_Rev1 6 February 2019
Lode LevelProduction Development Total
Tonnes Au (g/t) Sb (%) Tonnes Au (g/t) Sb (%) Tonnes Au (g/t) Sb (%)
Youle
Youle
969 2,139 24.3 1.9 846 9.3 0.8 2,985 20.1 1.6
962 1,789 22.1 1.8 850 14.8 1.2 2,640 19.7 1.6
955 1,883 24.1 1.9 850 14.3 1.1 2,733 21.0 1.7
948 2,618 29.6 1.8 1,108 18.2 1.1 3,726 26.2 1.6
941 2,662 32.7 1.9 1,076 21.4 1.2 3,738 29.4 1.7
934 2,698 33.3 1.9 1,082 20.9 1.2 3,780 29.8 1.7
927 3,314 37.4 1.8 1,362 22.5 1.2 4,675 33.1 1.6
920 3,981 52.1 2.2 1,390 30.1 1.3 5,370 46.4 2.0
913 2,701 32.4 1.6 1,416 41.9 1.8 4,117 35.7 1.7
906 4,548 10.8 1.1 1,917 9.3 0.9 6,465 10.3 1.1
899 4,245 10.6 1.1 1,864 9.0 0.8 6,109 10.2 1.0
892 6,142 13.3 1.7 1,889 9.4 0.9 8,031 12.4 1.5
885 6,080 15.0 1.9 2,436 10.8 1.4 8,516 13.8 1.7
878 6,069 14.4 1.8 2,436 8.8 1.1 8,505 12.8 1.6
871 9,121 15.7 3.1 2,443 8.4 1.1 11,564 14.1 2.6
864 8,883 16.5 3.7 4,064 9.2 2.7 12,946 14.2 3.4
857 9,059 16.9 3.9 3,223 9.6 2.1 12,283 15.0 3.4
850 8,410 15.1 3.7 3,289 11.6 2.7 11,699 14.1 3.4
843 8,564 15.0 3.9 3,253 10.3 3.5 11,817 13.7 3.8
836 8,038 12.6 3.2 3,362 11.0 3.6 11,400 12.1 3.4
829 7,893 10.3 3.5 3,273 8.2 2.8 11,166 9.7 3.3
822 7,257 10.4 3.5 3,569 8.9 2.9 10,826 9.9 3.3
815 6,395 10.9 4.7 2,561 7.2 2.6 8,955 9.9 4.1
808 7,210 10.4 4.6 2,345 6.9 3.0 9,555 9.5 4.2
801 6,742 10.0 4.3 2,103 5.9 2.5 8,846 9.0 3.9
794 6,152 7.9 2.6 1,558 4.5 1.7 7,710 7.2 2.4
787 6,104 9.2 2.7 2,317 5.5 1.4 8,421 8.2 2.3
780 5,882 8.5 2.5 1,786 6.2 1.7 7,668 8.0 2.3
773 4,450 13.9 2.8 1,543 4.3 1.7 5,993 11.4 2.5
766 5,535 17.5 3.7 1,949 8.8 1.6 7,484 15.2 3.1
759 5,404 18.9 3.9 1,923 7.8 1.6 7,327 15.9 3.3
752 4,826 9.3 3.7 905 7.4 2.2 5,731 9.0 3.5
745 6,491 10.1 5.7 935 7.4 3.3 7,426 9.7 5.4
738 3,780 12.6 9.6 1,426 5.9 4.8 5,206 10.8 8.3
731 2,825 14.6 12.6 634 7.2 6.5 3,459 13.2 11.5
724 2,988 13.5 12.0 939 8.0 6.3 3,927 12.2 10.7
717 2,793 11.5 10.6 458 12.7 9.4 3,252 11.7 10.5
710 1,110 6.0 9.2 189 11.6 9.1 1,298 6.8 9.2
Total 108,779 8.7 2.4 428,562 10.9 3.4 537,341 10.4 3.2
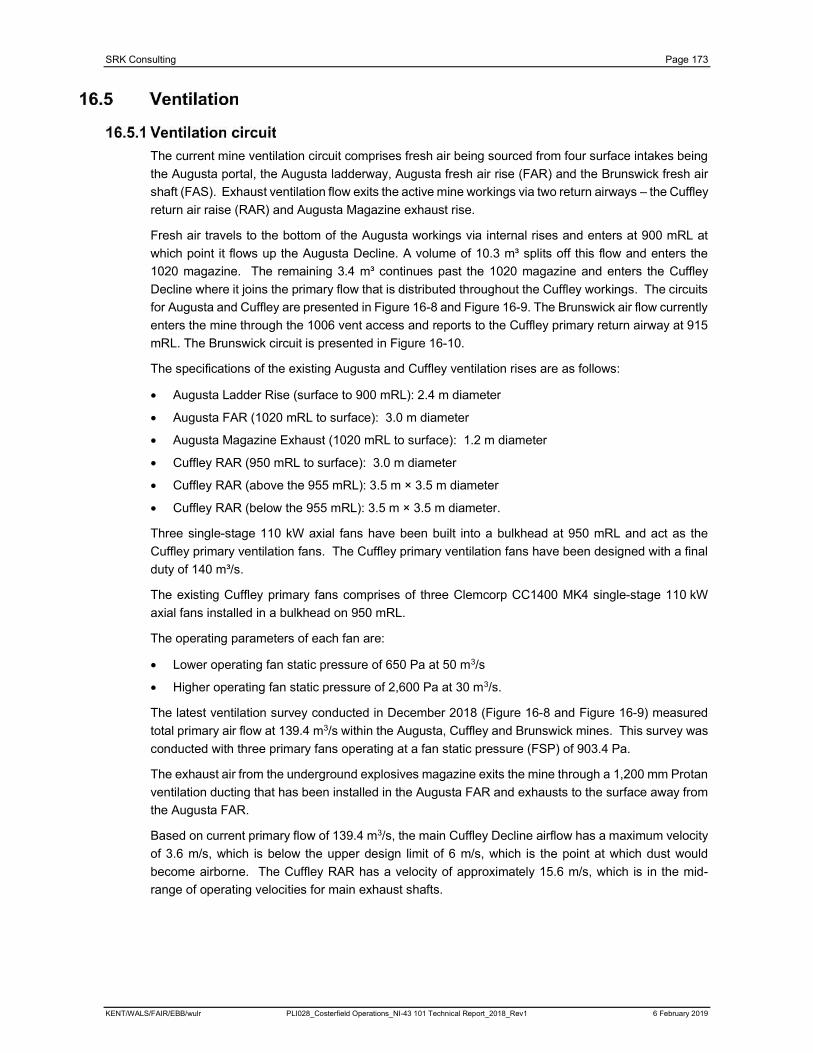
SRK Consulting Page 173
KENT/WALS/FAIR/EBB/wulr PLI028_Costerfield Operations_NI-43 101 Technical Report_2018_Rev1 6 February 2019
The current mine ventilation circuit comprises fresh air being sourced from four surface intakes being
the Augusta portal, the Augusta ladderway, Augusta fresh air rise (FAR) and the Brunswick fresh air
shaft (FAS). Exhaust ventilation flow exits the active mine workings via two return airways – the Cuffley
return air raise (RAR) and Augusta Magazine exhaust rise.
Fresh air travels to the bottom of the Augusta workings via internal rises and enters at 900 mRL at
which point it flows up the Augusta Decline. A volume of 10.3 m³ splits off this flow and enters the
1020 magazine. The remaining 3.4 m³ continues past the 1020 magazine and enters the Cuffley
Decline where it joins the primary flow that is distributed throughout the Cuffley workings. The circuits
for Augusta and Cuffley are presented in Figure 16-8 and Figure 16-9. The Brunswick air flow currently
enters the mine through the 1006 vent access and reports to the Cuffley primary return airway at 915
mRL. The Brunswick circuit is presented in Figure 16-10.
The specifications of the existing Augusta and Cuffley ventilation rises are as follows:
Augusta Ladder Rise (surface to 900 mRL): 2.4 m diameter
Augusta FAR (1020 mRL to surface): 3.0 m diameter
Augusta Magazine Exhaust (1020 mRL to surface): 1.2 m diameter
Cuffley RAR (950 mRL to surface): 3.0 m diameter
Cuffley RAR (above the 955 mRL): 3.5 m × 3.5 m diameter
Cuffley RAR (below the 955 mRL): 3.5 m × 3.5 m diameter.
Three single-stage 110 kW axial fans have been built into a bulkhead at 950 mRL and act as the
Cuffley primary ventilation fans. The Cuffley primary ventilation fans have been designed with a final
duty of 140 m³/s.
The existing Cuffley primary fans comprises of three Clemcorp CC1400 MK4 single-stage 110 kW
axial fans installed in a bulkhead on 950 mRL.
The operating parameters of each fan are:
Lower operating fan static pressure of 650 Pa at 50 m3/s
Higher operating fan static pressure of 2,600 Pa at 30 m3/s.
The latest ventilation survey conducted in December 2018 (Figure 16-8 and Figure 16-9) measured
total primary air flow at 139.4 m3/s within the Augusta, Cuffley and Brunswick mines. This survey was
conducted with three primary fans operating at a fan static pressure (FSP) of 903.4 Pa.
The exhaust air from the underground explosives magazine exits the mine through a 1,200 mm Protan
ventilation ducting that has been installed in the Augusta FAR and exhausts to the surface away from
the Augusta FAR.
Based on current primary flow of 139.4 m3/s, the main Cuffley Decline airflow has a maximum velocity
of 3.6 m/s, which is below the upper design limit of 6 m/s, which is the point at which dust would
become airborne. The Cuffley RAR has a velocity of approximately 15.6 m/s, which is in the mid-
range of operating velocities for main exhaust shafts.
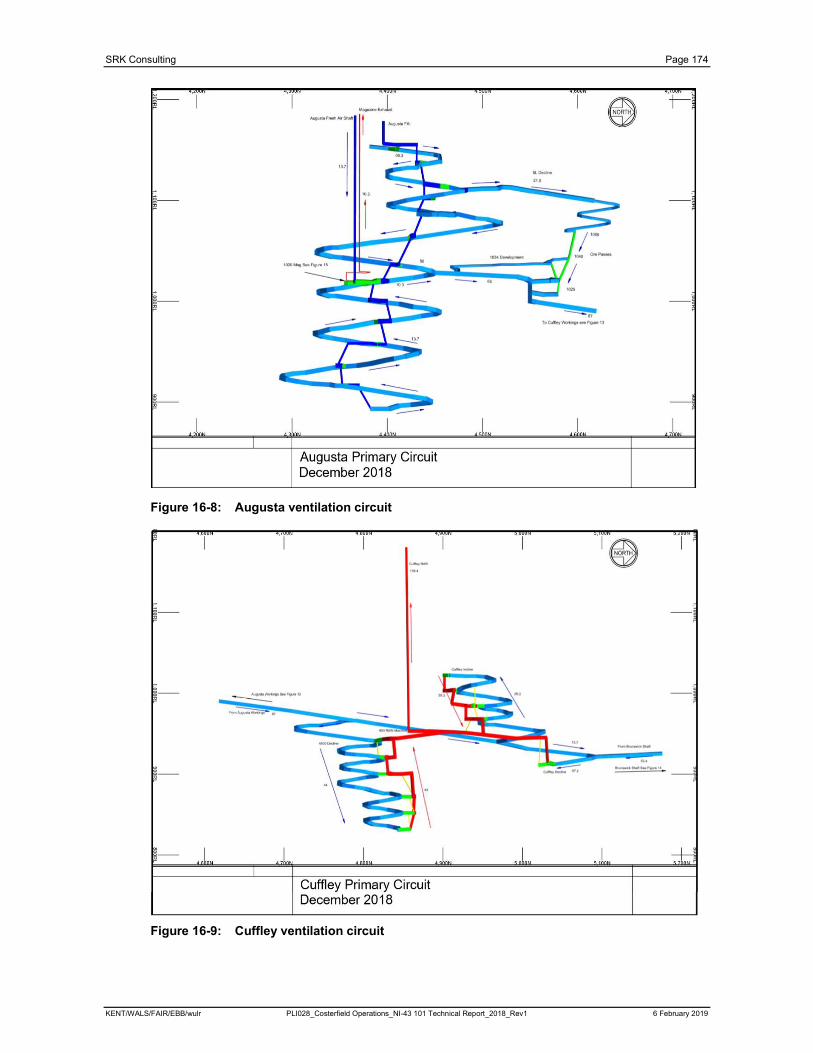
SRK Consulting Page 174
KENT/WALS/FAIR/EBB/wulr PLI028_Costerfield Operations_NI-43 101 Technical Report_2018_Rev1 6 February 2019
Figure 16-8: Augusta ventilation circuit
Figure 16-9: Cuffley ventilation circuit
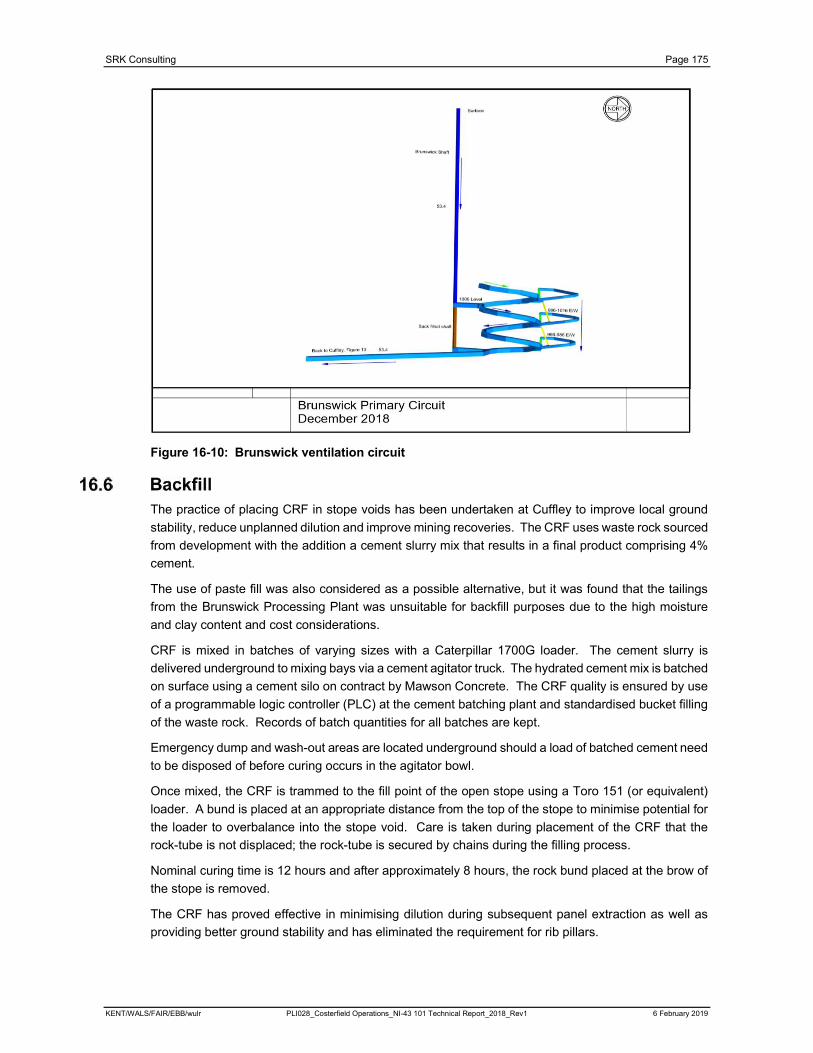
SRK Consulting Page 175
KENT/WALS/FAIR/EBB/wulr PLI028_Costerfield Operations_NI-43 101 Technical Report_2018_Rev1 6 February 2019
Figure 16-10: Brunswick ventilation circuit
The practice of placing CRF in stope voids has been undertaken at Cuffley to improve local ground
stability, reduce unplanned dilution and improve mining recoveries. The CRF uses waste rock sourced
from development with the addition a cement slurry mix that results in a final product comprising 4%
cement.
The use of paste fill was also considered as a possible alternative, but it was found that the tailings
from the Brunswick Processing Plant was unsuitable for backfill purposes due to the high moisture
and clay content and cost considerations.
CRF is mixed in batches of varying sizes with a Caterpillar 1700G loader. The cement slurry is
delivered underground to mixing bays via a cement agitator truck. The hydrated cement mix is batched
on surface using a cement silo on contract by Mawson Concrete. The CRF quality is ensured by use
of a programmable logic controller (PLC) at the cement batching plant and standardised bucket filling
of the waste rock. Records of batch quantities for all batches are kept.
Emergency dump and wash-out areas are located underground should a load of batched cement need
to be disposed of before curing occurs in the agitator bowl.
Once mixed, the CRF is trammed to the fill point of the open stope using a Toro 151 (or equivalent)
loader. A bund is placed at an appropriate distance from the top of the stope to minimise potential for
the loader to overbalance into the stope void. Care is taken during placement of the CRF that the
rock-tube is not displaced; the rock-tube is secured by chains during the filling process.
Nominal curing time is 12 hours and after approximately 8 hours, the rock bund placed at the brow of
the stope is removed.
The CRF has proved effective in minimising dilution during subsequent panel extraction as well as
providing better ground stability and has eliminated the requirement for rib pillars.
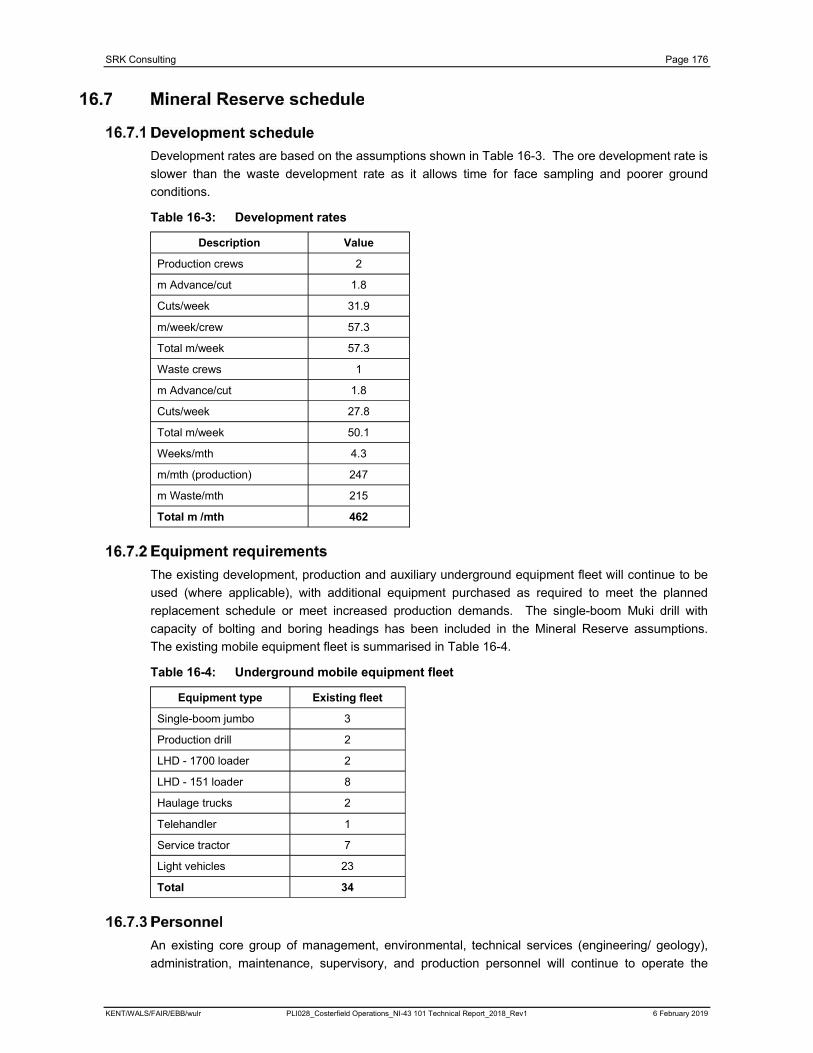
SRK Consulting Page 176
KENT/WALS/FAIR/EBB/wulr PLI028_Costerfield Operations_NI-43 101 Technical Report_2018_Rev1 6 February 2019
Development rates are based on the assumptions shown in Table 16-3. The ore development rate is
slower than the waste development rate as it allows time for face sampling and poorer ground
conditions.
Table 16-3: Development rates
Description Value
Production crews 2
m Advance/cut 1.8
Cuts/week 31.9
m/week/crew 57.3
Total m/week 57.3
Waste crews 1
m Advance/cut 1.8
Cuts/week 27.8
Total m/week 50.1
Weeks/mth 4.3
m/mth (production) 247
m Waste/mth 215
Total m /mth 462
The existing development, production and auxiliary underground equipment fleet will continue to be
used (where applicable), with additional equipment purchased as required to meet the planned
replacement schedule or meet increased production demands. The single-boom Muki drill with
capacity of bolting and boring headings has been included in the Mineral Reserve assumptions.
The existing mobile equipment fleet is summarised in Table 16-4.
Table 16-4: Underground mobile equipment fleet
Equipment type Existing fleet
Single-boom jumbo 3
Production drill 2
LHD - 1700 loader 2
LHD - 151 loader 8
Haulage trucks 2
Telehandler 1
Service tractor 7
Light vehicles 23
Total 34
An existing core group of management, environmental, technical services (engineering/ geology),
administration, maintenance, supervisory, and production personnel will continue to operate the
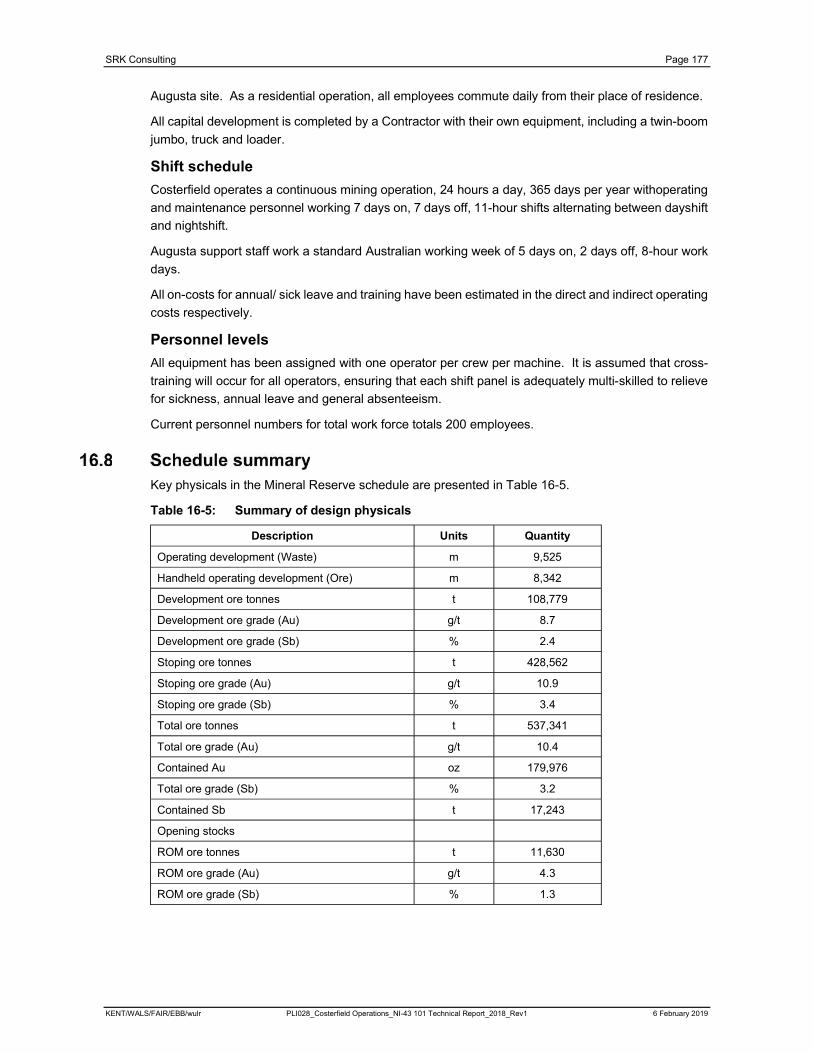
SRK Consulting Page 177
KENT/WALS/FAIR/EBB/wulr PLI028_Costerfield Operations_NI-43 101 Technical Report_2018_Rev1 6 February 2019
Augusta site. As a residential operation, all employees commute daily from their place of residence.
All capital development is completed by a Contractor with their own equipment, including a twin-boom
jumbo, truck and loader.
Shift schedule
Costerfield operates a continuous mining operation, 24 hours a day, 365 days per year withoperating
and maintenance personnel working 7 days on, 7 days off, 11-hour shifts alternating between dayshift
and nightshift.
Augusta support staff work a standard Australian working week of 5 days on, 2 days off, 8-hour work
days.
All on-costs for annual/ sick leave and training have been estimated in the direct and indirect operating
costs respectively.
Personnel levels
All equipment has been assigned with one operator per crew per machine. It is assumed that cross-
training will occur for all operators, ensuring that each shift panel is adequately multi-skilled to relieve
for sickness, annual leave and general absenteeism.
Current personnel numbers for total work force totals 200 employees.
Key physicals in the Mineral Reserve schedule are presented in Table 16-5.
Table 16-5: Summary of design physicals
Description Units Quantity
Operating development (Waste) m 9,525
Handheld operating development (Ore) m 8,342
Development ore tonnes t 108,779
Development ore grade (Au) g/t 8.7
Development ore grade (Sb) % 2.4
Stoping ore tonnes t 428,562
Stoping ore grade (Au) g/t 10.9
Stoping ore grade (Sb) % 3.4
Total ore tonnes t 537,341
Total ore grade (Au) g/t 10.4
Contained Au oz 179,976
Total ore grade (Sb) % 3.2
Contained Sb t 17,243
Opening stocks
ROM ore tonnes t 11,630
ROM ore grade (Au) g/t 4.3
ROM ore grade (Sb) % 1.3
SRK Consulting Page 178
KENT/WALS/FAIR/EBBE/wulr PLI028_Costerfield Operations_NI-43 101 Technical Report_2018_Rev1 6 February 2019
The Brunswick Processing Plant processes a sulphide gold-antimony ore through a conventional
comminution and flotation style concentrator. It has been operating since 2007, and by Mandalay
since late 2009. Since then several processing plant upgrades have seen production increase from
approximately 2,000 t/month to the current average of over 12,600 t/month over the 2015, 2016, 2017
and 2018 calendar years. The concentrator operates 24 hours per day, 7 days per week. Crushing
operates under noise restriction guidelines during extended dayshift hours.
The surface crushing and screening system processes underground feed down to a particle size range
suitable for milling through a two-stage, closed circuit ball milling circuit. Centrifugal-style gravity
concentrators are used on the combined primary milling product and secondary mill discharge to
recover a gold-rich gravity concentrate. This is tabled and sold as a separate gold concentrate product
which is sent to local refineries. Secondary milled products are classified according to size and
processed through a simple flotation circuit comprising a single stage of rougher, scavenger and
cleaning. The concentrate is dewatered through thickening and filtration to produce a final antimony-
gold concentrate product which is bagged, packed into shipping containers and shipped to customers
overseas. The tailings are thickened before being pumped to one of two TSFs – one to the east and
one to the north of the Brunswick Processing Plant.
The flowsheet is simple, conventional and is suited to processing the Costerfield ores in the LOM plan.
With the inclusion of a mobile crushing unit in 2012 and gradual production creep since then, the
capacity of the plant has been successfully upgraded to over 13,000 t/month. A summary processing
flowsheet is provided in Figure 17-1.
The crushing and screening plant consist of a primary crushing circuit in closed circuit with a 12 mm
vibrating screen. It uses a duty and a standby diesel-powered Finlay I-130RS mobile impact crusher
(i.e. incorporates two mobile crushing units). Crushed ore is conveyed to 2 × 120 tonne fine ore bins
in parallel.
The fine ore is reclaimed from the fine ore bins which both discharge onto the primary mill feed
conveyor, as feed to the milling circuit. The milling circuit comprises two ball mills in series, both
operating in closed circuit. The primary mill operates in closed circuit with a Dutch State Mines (DSM)
screen, with screen oversize returning to the primary mill and undersize being fed to a centrifugal-style
gravity concentrator. This recovers a small mass of high grade gold concentrate that is sent to the
gold room for further gravity upgrade using a shaking table. The final gravity concentrate is sent
directly to a refinery as a separate saleable product. Gravity recovery is variable but typically is
between 30%–40% of the gold in the feed. The gravity tailing is pumped to classifying hydrocyclones
(cyclones), the overflow of which becomes the flotation plant feed. The underflow is returned to the
secondary ball mill for further grinding (size reduction). The secondary ball mill discharge is combined
with the DSM screen undersize as feed to the centrifugal gravity concentrator. The current milling
circuit capacity is capable of handling in excess of 13,500 t/month in some months.
The flotation circuit is designed to recover an antimony and gold sulphide concentrate. The flotation
SRK Consulting Page 179
KENT/WALS/FAIR/EBBE/wulr PLI028_Costerfield Operations_NI-43 101 Technical Report_2018_Rev1 6 February 2019
circuit is fed from the secondary ball mill cyclone overflow. The cyclone overflow is fed to a
conditioning tank where lead nitrate, an activator and potassium amyl xanthate (PAX), a collector, are
added. The conditioning tank feeds two primary site fabricated ‘rougher tank’ flotation units in series.
The two rougher tank cell concentrates combine with the final cleaner concentrate in the concentrate
thickener as the final product. The rougher tank cell tailings flow to the Denver rougher flotation cells.
The rest of the flotation circuit consists of 8 × Denver square DR100 cells for the remaining rougher
and scavenging duties and 6 × Denver square DR15 cells are used for cleaning duties.
The concentrate from the rougher flotation cells is pumped to the cleaner flotation cells, while the
tailings becomes feed for the scavenger flotation cells. The concentrate from the scavenger flotation
cells is recycled to the feed of the rougher flotation cells while the tailings is pumped to the tailings
thickener. The concentrate from the cleaner flotation cells is pumped to the concentrate thickener
while the tailings is recycled to the rougher flotation cells.
The flotation circuit effectively recovers gold not collected in the gravity gold circuit, i.e. gold recovery
is robust even with variability in gravity recovery.
The final concentrate is then pumped from the concentrate thickener directly to a plate and frame
pressure filter. The moist filter cake is discharged directly into concentrate bags. The filtrate is
recycled to the concentrate thickener, while the concentrate thickener overflow is recycled through the
plant as process water to maximise water re-use and minimise concentrate losses.
The flotation tailings are settled in a thickener. Overflow is recycled through the plant as process water
and the thickened solids are pumped to a TSF. The tailings discharge to the operational TSF is
managed via a conventional spigot system. Additional water from the tailings is decanted and pumped
back to the plant for use as process water.
The Brunswick Processing Plant capacity is typically between 12,000 dry t/month and 13,500 dry
t/month, on average. The plant has demonstrated ongoing production throughput creep through
continual improvements over the last several years increasing from around 5,000 t/month in January
2012.
Average plant throughput budgeted for 2019 is 12,340 t/month, moderating in subsequent years.
This is driven by the mining production rate. Plant throughput is matched to mining. In 2015,
throughput was 12,822 t/month, 12,867 t/month in 2016, 12,647 t/month in 2017 and 12,979 t/month
in 2018. The historical and forecast LOM plant throughput on the current ore feed blend is discussed
further in Section 13.
SRK notes that in the Costerfield Financial Model reserves update, the average 2019 throughput is
7,522 t/month. The mill expects to process between 10,000– 12,500 t/month in 2019, but this is
contingent on the conversion of the Inferred Mineral Resource in Youle being upgraded to Indicated
during 2019. SRK considers the average production rate to be defendable and is well supported by
historical production. The plant will be operating below capacity, and there is production upside if
additional ore is introduced into the LOM.
The 2018 reconciled plant recoveries were 93.8% Sb and 87.5% Au. The 2017 recoveries were
95.3% Sb and 89.9% Au. The difference in recoveries can be explained by the lower head grades for
SRK Consulting Page 180
KENT/WALS/FAIR/EBBE/wulr PLI028_Costerfield Operations_NI-43 101 Technical Report_2018_Rev1 6 February 2019
2018 compared to 2017 as shown in Section 13. Recoveries have been consistent and predictable
over the last several years of operation and because of this, there is a high degree of confidence in
the future forecast recoveries. The forecast average LOM model recoveries are 94.5% Sb and
89.1% Au for the LOM to 2023. Both are considered to be reasonable recovery estimates given both
are supported by historical recoveries at a similar feed grades and based on grade/ recovery
relationships. Further confidence is provided by the consistent recoveries of both Sb and Au across
a range of feed grades. The historical and forecast plant LOM recoveries on the LOM feed blend are
discussed further in Section 13.
The current concentrate antimony grades have dropped slightly from previous years where grades
were was maintained at approximately 54% Sb; however, grades are still above the target of 50% at
52.4% Sb for 2017 and 52.2% Sb for 2018. SRK has a good degree of confidence in the ability of the
operation to maintain antimony grades above 50% in the concentrate in the future LOM plan in order
to maximise payable metal. Supporting historical plant throughput and recovery data is provided in
Section 13.
The water services at the Brunswick Processing Plant consist of the raw water, process water and
excess water disposal systems. The process water supply consists of concentrate thickener overflow,
tailing thickener overflow and TSF decant return water. Most the raw make-up water is provided by
dewatering of the underground operations (approximately 1.5–2 ML/day). The plant operates with a
positive water balance with excess water being disposed of. Mandalay constructed a 2 ML/day
permeate RO plant at the Brunswick Processing Plant in 2014. The 2 ML/day plant has remained in
operation as per regulatory approvals. A pre-treatment plant to feed the RO plant was installed in
2017, which enhanced the robustness of the RO operation, limiting downtime and reducing
consumables. The Splitters Creek Evaporation Facility has the capacity to treat 104 ML/year net
(evaporation minus rainfall) and treats the bulk of the excess water. Aquifer recharge (AR) as an
additional water disposal method has been trialled successfully during 2017 and 2018 and Mandalay
is currently in the process of permitting a permanent AR scheme with capacity of up to 550 ML per
annum.
The TSF and process water is stored in and distributed from a dedicated tank system. As the site is
in a positive water balance, adequate process water supplies are available to meet the LOM
requirements.
The Brunswick Process Plant requires both low and high pressure air supplies. Currently, three
separate low-pressure blowers supply the rougher, scavenger and cleaner cells, with existing tank
cells running off high-pressure air. The high-pressure air supply was upgraded to a variable speed
compressor in 2017 to increase the capacity and availability of high-pressure air and reduce the shock
load on the power supply on start-up of the fixed speed units. The pressure filter runs off high-pressure
air. The processing facility has adequate air to meet the LOM requirements.
Due to the need for additional power for the development of the Brunswick and Youle orebodies, a
power upgrade will be completed in 2019. This will involve consolidating the current three separate

SRK Consulting Page 181
KENT/WALS/FAIR/EBBE/wulr PLI028_Costerfield Operations_NI-43 101 Technical Report_2018_Rev1 6 February 2019
points of electrical supply into one, and distributing from a single point. This allows for greater
efficiencies from minimising losses from each point and also allows additional local back-up generation
to occur at a single point, starting and stopping depending on demand and also having the ability to
run the mill in the event of power outages. Generation may not be needed at all at times. The mill
and RO plant will be powered from this single point, and there is provision for additional power demand
from the Brunswick Processing Plant.
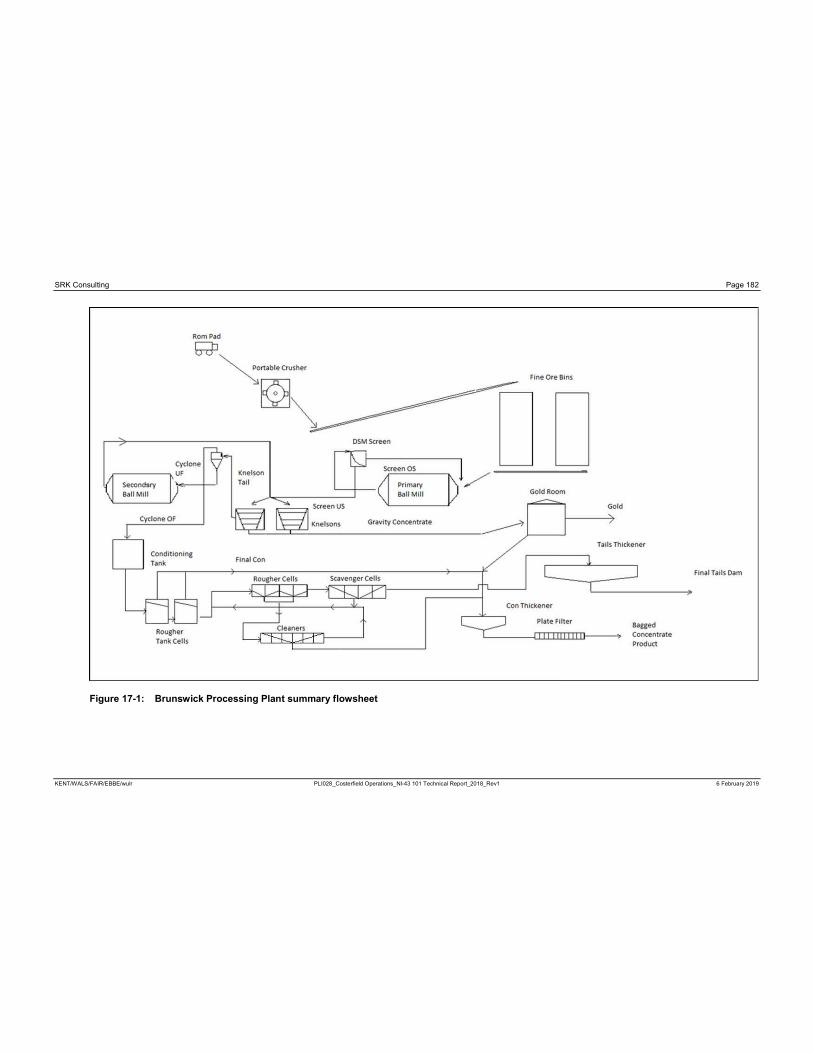
SRK Consulting Page 182
KENT/WALS/FAIR/EBBE/wulr PLI028_Costerfield Operations_NI-43 101 Technical Report_2018_Rev1 6 February 2019
Figure 17-1: Brunswick Processing Plant summary flowsheet
SRK Consulting Page 183
KENT/WALS/FAIR/EBBE/wulr PLI028_Costerfield Operations_NI-43 101 Technical Report_2018_Rev1 6 February 2019
On the basis of current plant performance, no major capital projects are envisaged to achieve the
forecast LOM Brunswick Processing Plant throughput. However, ongoing optimisation and minor, low
capital cost debottlenecking projects should continue to improve operations. This is considered to be
project upside. It is not incorporated into the budgeted throughput or recovery.
No major capital expansion projects are planned. Specific process plant sustaining capital project
costs and a TSF lift have been assigned to the financial model in 2019 and an appropriate allowance
for ongoing sustaining capital for the plant and tailings in the following years of the LOM.
The initial trial in September 2012 of a mobile crusher significantly improved the capacity of the plant.
A larger portable crushing unit is a permanent part of the process flowsheet configuration and enables
an average throughput of over 12,600 t/month. Another mobile crusher was purchased in 2015 to
allow for a duty and standby arrangement to further increase the availability of the crushing circuit.
Using the existing crushing plant conveyors and fine ore bins, the crushed product from the portable
crushing plant can be transferred at a finer feed size into the ore bins twice a shift to provide consistent
feed to the existing milling circuit. This system was simplified in Q4 2016 with installation of a single
conveyor to directly fill the fine ore bins, rendering four old conveyor belts redundant.
The milling circuit remains unchanged. The finer crushed ore feed size allows the target throughput
to be achieved. No further major work is planned at this time.
Ongoing optimisation of this circuit via reagent testing is ongoing. No major upgrade work is currently
planned.
The existing concentrate thickening and filtration circuit is adequate for the target throughput.
No further major work is planned at this time.
The tailings thickener has sufficient capacity to handle the current throughput. The average tails
thickener underflow solids density has been maintained at around 50% (±10%).
Additional TSF storage capacity was provided during 2018 with a lift on the existing Bombay TSF.
The currently raised Bombay TSF will provide sufficient tailings storage capacity until Q1 2020.
An additional upstream lift on the Brunswick TSF is scheduled to start in Q2 2019 and will be completed
by Q4 2019.
Planning approval has been granted for further 2.7 m lift of the Bombay TSF in the future to provide
further storage capacity. The total Brunswick and Bombay approved increase in tailings storage allows
for over two years’ capacity at current milling rates.
Studies are underway to determine the most effective way to further increase tailings capacity to meet
the LOM plan.
SRK Consulting Page 184
KENT/WALS/FAIR/EBBE/wulr PLI028_Costerfield Operations_NI-43 101 Technical Report_2018_Rev1 6 February 2019
No major recovery projects are planned. Ongoing optimisation work will be undertaken as normal
practice. All improvements planned to the existing circuit will be to maintain current levels of recovery
or marginally improve it.
No upgrade work is required for the reagent mixing and storage area.
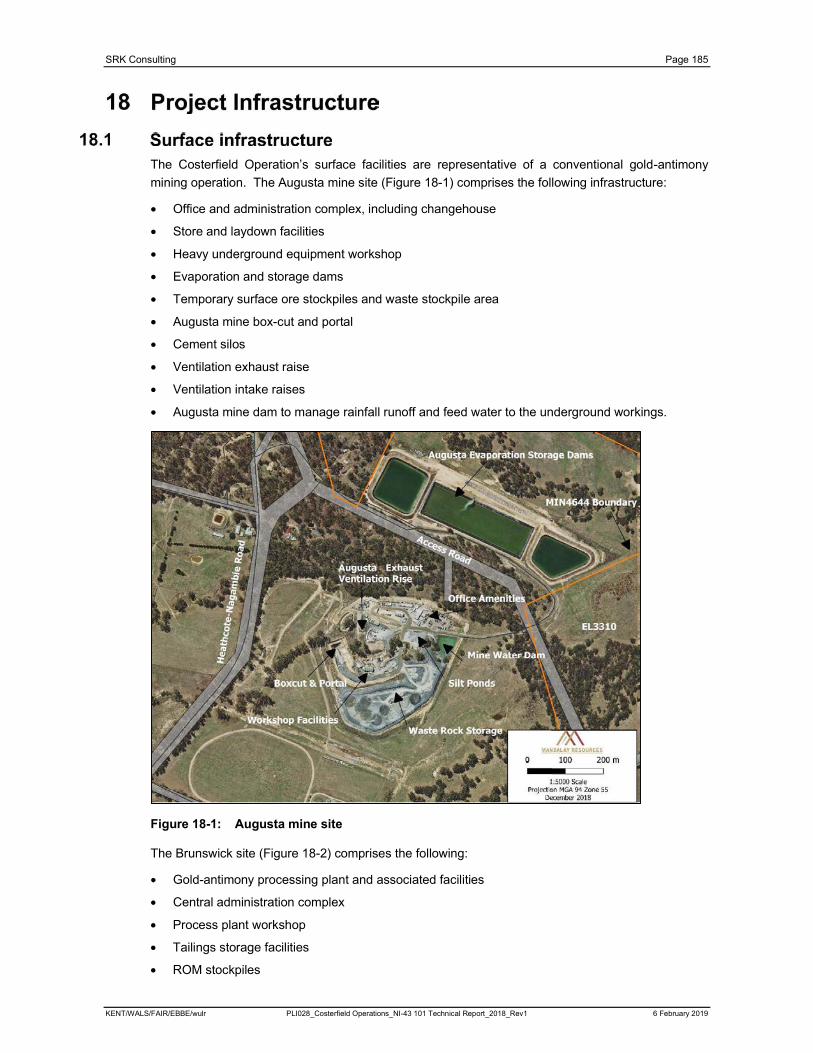
SRK Consulting Page 185
KENT/WALS/FAIR/EBBE/wulr PLI028_Costerfield Operations_NI-43 101 Technical Report_2018_Rev1 6 February 2019
The Costerfield Operation’s surface facilities are representative of a conventional gold-antimony
mining operation. The Augusta mine site (Figure 18-1) comprises the following infrastructure:
Office and administration complex, including changehouse
Store and laydown facilities
Heavy underground equipment workshop
Evaporation and storage dams
Temporary surface ore stockpiles and waste stockpile area
Augusta mine box-cut and portal
Cement silos
Ventilation exhaust raise
Ventilation intake raises
Augusta mine dam to manage rainfall runoff and feed water to the underground workings.
Figure 18-1: Augusta mine site
The Brunswick site (Figure 18-2) comprises the following:
Gold-antimony processing plant and associated facilities
Central administration complex
Process plant workshop
Tailings storage facilities
ROM stockpiles
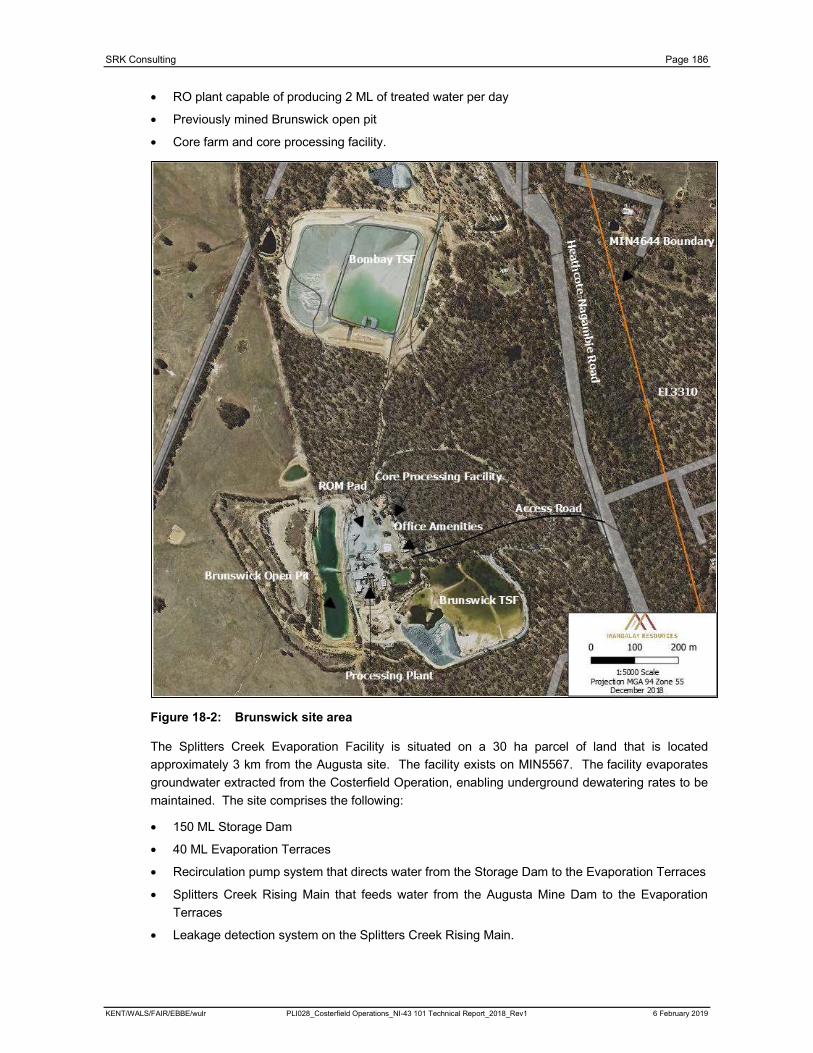
SRK Consulting Page 186
KENT/WALS/FAIR/EBBE/wulr PLI028_Costerfield Operations_NI-43 101 Technical Report_2018_Rev1 6 February 2019
RO plant capable of producing 2 ML of treated water per day
Previously mined Brunswick open pit
Core farm and core processing facility.
Figure 18-2: Brunswick site area
The Splitters Creek Evaporation Facility is situated on a 30 ha parcel of land that is located
approximately 3 km from the Augusta site. The facility exists on MIN5567. The facility evaporates
groundwater extracted from the Costerfield Operation, enabling underground dewatering rates to be
maintained. The site comprises the following:
150 ML Storage Dam
40 ML Evaporation Terraces
Recirculation pump system that directs water from the Storage Dam to the Evaporation Terraces
Splitters Creek Rising Main that feeds water from the Augusta Mine Dam to the Evaporation
Terraces
Leakage detection system on the Splitters Creek Rising Main.
SRK Consulting Page 187
KENT/WALS/FAIR/EBBE/wulr PLI028_Costerfield Operations_NI-43 101 Technical Report_2018_Rev1 6 February 2019
The secondary means of egress consists of a ladderway system that extends from surface to 900 mRL
within the Augusta underground workings and a ladderway system in the Cuffley workings that extends
from the Cuffley Incline, Cuffley Decline and 4800 Decline to 945 mRL. From 945 mRL level,
extraction is performed via an Emergency Gig. The Emergency Gig attaches to a standard crane hook
and hoists personnel in an emergency up and down the Cuffley RAR using a 200 tonne mobile crane
as the hoist. The Emergency Gig is capable of evacuating five persons or 600 kg (120 kg per person)
at a time.
Secondary egress from the Brunswick mine also uses the Emergency Gig, designed to operate in the
Brunswick FAR at varying levels.
Secondary means of egress for the Youle mine will consist of a ladderway system that extends from
720 mRL to the Youle Shaft access level (940 mRL). The Emergency Gig will then operate within
Youle shaft to hoist personnel to surface.
Underground refuge chambers are installed in response to hazards posed by irrespirable
atmospheres. The Augusta workings has fresh air bases located at 3 Level and the 1040 Level (off
the Augusta Decline). There is a 4-man refuge chamber located in 5 Level which is part of the Augusta
workings. This 5 Level refuge chamber is located at 1069 mRL.
The Cuffley workings has a 16-man refuge chamber located at 4750 mRL on the Cuffley Decline, and
a 20-man refuge chamber located at the 845 mRL ramp in the lower Cuffley workings.
The Brunswick workings has a 20-man refuge chamber located at stockpile #4 in the Brunswick
access, and a 16-man refuge chamber at 956 mRL.
The capacity of the refuge chamber required is dictated by the number of personnel planned to be
working in the immediate vicinity serviced by the refuge chamber. The position of the refuge chamber
facilities enables all personnel to be within 750 m of a refuge chamber, as recommended in the
Western Australian ‘Refuge Chambers in Underground Metalliferous Mines’ Guideline (Department of
Consumer and Employer Protection, 2008).
It is not intended for refuge chambers to substitute a secondary means of egress, but to provide refuge
during fire or containment when ladderways may be inoperative or inaccessible.
The existing compressed air plant comprises three 593 cfm compressors. The overall plant capacity
is 840 L/s (1779 cfm).
Compressed air is delivered underground via a 4-inch HDPE poly-pipe. Each level is then supplied
from the decline via 2-inch HDPE poly-piping. Air receivers have been placed at 909 mRL, 1105 mRL,
844 mRL and 1015 mRL to increase the system efficiency. Compressed air is used to power
pneumatic equipment and/ or activities including:
Airleg drills
Kempe exploration drill rig
Pneumatic ammonium nitrate-fuel oil (ANFO) loaders
Blasthole cleaning for development rounds
SRK Consulting Page 188
KENT/WALS/FAIR/EBBE/wulr PLI028_Costerfield Operations_NI-43 101 Technical Report_2018_Rev1 6 February 2019
Diaphragm air pumps
Pneumatic longhole drills
Longhole cleaning.
The primary ventilation infrastructure currently consists of four fresh air intakes and one primary
exhaust shaft. The fresh air intakes consist of:
Augusta Portal – 66.3m³/s entering the portal
Augusta Fresh Air Intake (FAI) which is a series of airleg rises from the surface to 1020 mRL in
the Augusta workings – 16.4 m³/s
The Augusta Fresh Air Shaft (FAS) is a 150 m vertical raisebore shaft from surface to 1020 mRL
in the Augusta workings. Approximately 13.6 m³/s of fresh enters the mine through this shaft.
The shaft is 3.0 m in diameter and contains an internal 1,200 mm diameter flexible duct that
currently acts as an exhaust for the 1020 Magazine. The 1020 Magazine is ventilated by a single-
stage 45 kW fan which forces return air (10.3 m³/s) from the magazine to surface via the ducting
located within the Augusta FAS. The fresh air flow is regulated to the Augusta 900 mRL by
ventilation walls at 1020 mRL and continues down the Augusta rise FAI system to 900 mRL.
Brunswick Fresh Air Shaft is a 230 m long × 3.0 m diameter shaft from the surface to 956 mRL
in the Brunswick workings. Approximately 53.4 m³/s enters the mine through the Brunswick shaft,
which is currently regulated to 45% open. The air flow from the Brunswick underground workings
reports to the Cuffley primary ventilation fans via a connection to the 950 RAW manifold through
the 915 RAW.
This primary ventilation flow is distributed through the mine using secondary fans positioned in the
decline/ incline that force-ventilate the development levels.
Cuffley primary return air way
The Cuffley primary return air way (RAW) shaft is a 230 m long × 3 m diameter shaft from the surface
to the 950 Level (RL). The Cuffley primary ventilation fans consist of three single-stage Clemcorp
CC1400 Mk4 fans driven by 110 kW motors. These three fans are installed in a fan bulkhead in
parallel. The Cuffley RAW is the Costerfield Operations’ primary exhaust system. All air flow in the
mine reports to the RAW via a series of return air way systems from each working area of the mine.
The last primary survey measured an exhaust rate of 139.4 m³/s from the mine.
The process of dewatering in advance of the mining levels is achieved by leaving diamond drillholes
drilled from underground open to drain. Due to the fractured nature of the aquifer, the groundwater
inflows are not predictable. Flow rates have continued to increase as the decline advances and more
drives are developed.
Removal of the groundwater from the Augusta decline is achieved by a staged pump station system
comprising Weartuff WT084 mono pumps located at 890 mRL.
Removal of the groundwater from the Cuffley workings is achieved by a staged pump station system
comprising Weartuff WT084 mono pumps located at 849 mRL.
Removal of groundwater from the Brunswick workings is achieved by a staged pump system
comprising Weartuff WT084 mono pumps located at 925 mRL, along with dewatering holes which are
directly plumbed to the 945 mRL permanent pump station.
SRK Consulting Page 189
KENT/WALS/FAIR/EBBE/wulr PLI028_Costerfield Operations_NI-43 101 Technical Report_2018_Rev1 6 February 2019
The lower working levels utilise electric submersible pumps to direct water to the mono pumps. Both
the 890 mRL and 849 mRL mono pumps lift water to the 945 mRL permanent pump station which
pumps water to surface via the Cuffley Rising Main.
The Rising Main extends to the mine dam, from where it is distributed underground to the Actiflow
water treatment facility or to Splitters Creek Evaporation Facility.
Removal of groundwater from the Youle workings will be achieved by a staged pump system
comprising electrical submersible pumps and Weartuff WT084 mono pumps. Groundwater will be
directed from the Youle mine to the Cuffley 945 pump station or pumped directly to surface via the
planned Youle Rising Main.
An underground crib room exists at the 1085 mRL and the underground magazine exists at the
1020 mRL. In addition to the fixed plant, Mandalay owns, operates and maintains all of the mobile
mining equipment including production drills, loaders, trucks, and ancillary equipment required to
undertake ore development and production operations.
Since operations began in the 1970s, two tailings dams have been constructed and operated, the
Bombay TSF and the Brunswick TSF which is currently operational. Both TSFs were constructed
based on a conventional paddock-style/ turkey’s nest type design with earthen embankments.
Tailings are currently deposited in the Bombay TSF, which currently has capacity to allow tailings to
be deposited until Q4 2019. An additional upstream lift is planned to take place on the Brunswick TSF
facility, this lift will be completed in Q4 2019 and will provide additional tailings storage until 2020.
There is another approval in place for a further lift on the Bombay TSF providing further tailings storage
capacity into the future.
The Power supply at the Costerfield Operations is a current state of change due to short comings in
network availability. In the next coming months, the site will have been upgraded to an embedded
system. There are two power sources that will synchronise to form a total demand availability of 6
mVA. 3mVA is available from the network supplied by City Power/Powercor the other 3 mVA will be
generated on site by up to five diesel generators (Figure 18-3).
The amalgamation will transform from three points of network supply to one. This will enable the site
to peak-lop any load over the 3 mVA of network capacity with the synchronised generators only when
needed. The result will mean islanded generators will be removed off site and generation from diesel
will only be used when needed. This system will also allow the site to have up to 3 mVA of back-up
power isolated from the network if needed. The autonomous system will identify a grid loss and shed
all known essential loads initiating an island mode. Once the City Power/Powercor network is available
again, the system will sync and allow for full operating again. The amalgamation will also enable for
more efficient power factor correction. This is due to the fact the correction can now be used for the
entire site via 750 kVAR of correction on the 11,000 V network. Figure 18-3 shows the planned power
supply reticulation.
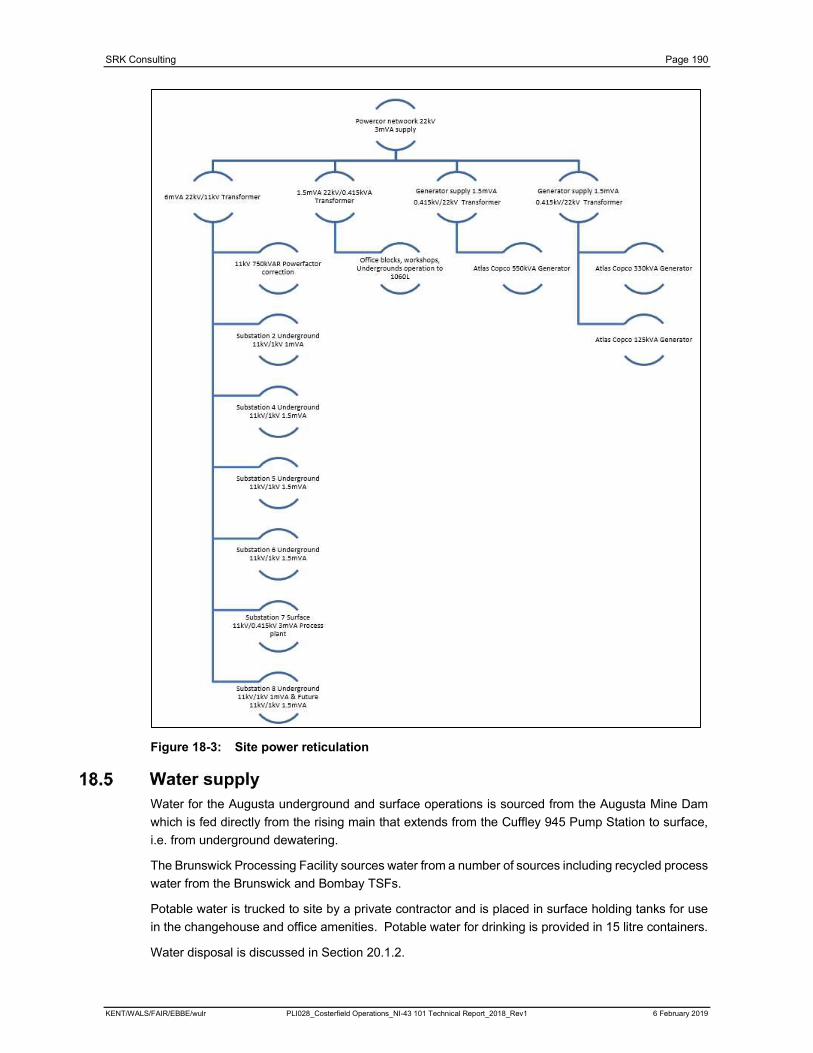
SRK Consulting Page 190
KENT/WALS/FAIR/EBBE/wulr PLI028_Costerfield Operations_NI-43 101 Technical Report_2018_Rev1 6 February 2019
Figure 18-3: Site power reticulation
Water for the Augusta underground and surface operations is sourced from the Augusta Mine Dam
which is fed directly from the rising main that extends from the Cuffley 945 Pump Station to surface,
i.e. from underground dewatering.
The Brunswick Processing Facility sources water from a number of sources including recycled process
water from the Brunswick and Bombay TSFs.
Potable water is trucked to site by a private contractor and is placed in surface holding tanks for use
in the changehouse and office amenities. Potable water for drinking is provided in 15 litre containers.
Water disposal is discussed in Section 20.1.2.
SRK Consulting Page 191
KENT/WALS/FAIR/EBBE/wulr PLI028_Costerfield Operations_NI-43 101 Technical Report_2018_Rev1 6 February 2019
Groundwater is currently pumped from the underground workings to the Mine Dam at a rate of
approximately 2 ML per day. Groundwater inflow is expected to increase to 4 ML per day during the
draw-down period for the Youle deposit. The water is pumped from the Mine Dam to either the Splitters
Creek Evaporation Facility, or a sequence of water treatment facilities (an Actiflow unit in sequence
with a RO plant) located at the Brunswick site. The Brunswick Pit is no longer used for water storage
due to the proximity of active underground Brunswick workings to the bottom of the pit.
The Augusta Evaporation Facility comprises of three dams with a total storage capacity of
150 ML. Total site storage capacity including smaller catchment and operational dams such as the
mine dam (including Splitters Creek, Brunswick and Augusta) is approximately 370 ML.
The water services at the Brunswick Processing Plant consist of the raw water, process water and
excess water disposal systems. The process water supply consists of concentrate thickener overflow,
tailing thickener overflow and Brunswick TSF decant return water. Whilst the process plant utilises
water from a closed circuit, make-up process water is required to supplement water evaporated at the
Brunswick TSF.
Total evaporation/ water disposal capacity including discharge of O treated water and Splitters Creek
Evaporation Facility and is currently estimated at 664 ML per year assuming long term average
Heathcote climatic conditions. Aquifer Recharge trials have been successful and MRCO is currently
in the process of permitting a permanent Aquifer Recharge scheme capable of up to 550 ML per
annum.
Total inflows are currently estimated from water balance data to be approximately 1100 ML per year
plus 223 ML per year of rainfall.
Waste from underground capital development is hauled to the Augusta Waste Rock area. From here
it is stored to be used in projects such as the lifting of Brunswick and Bombay TSF. Waste rock
generated underground from operating development is used to complete underground stope backfill.
A small percentage of waste material hauled to surface is screened, to be used for road base
underground. Further detail is provided in section 20.1.3.
As the Augusta Mine and Brunswick Processing Plant are divided by the Heathcote–Nagambie Road,
all ROM products must be trucked between the two sites by an independent contractor. The road
distance between the two sites is approximately 3 km and trucking is undertaken using a fleet of single
body road trucks, each of 13 t capacity. Correct load weight is achieved via the use of a load cell
system on the contractor’s surface loader.
A self-bunded diesel storage tank of 68,000 L capacity exists at the Augusta Mine site. This diesel
storage caters for all underground and surface diesel needs for Augusta. The Brunswick site is catered
by a self-bunded diesel storage tank of 65,000 L capacity.
All storage, import, transport and use of explosives is conducted in accordance with the WorkSafe
Dangerous Goods (Explosives) Regulations 2011.
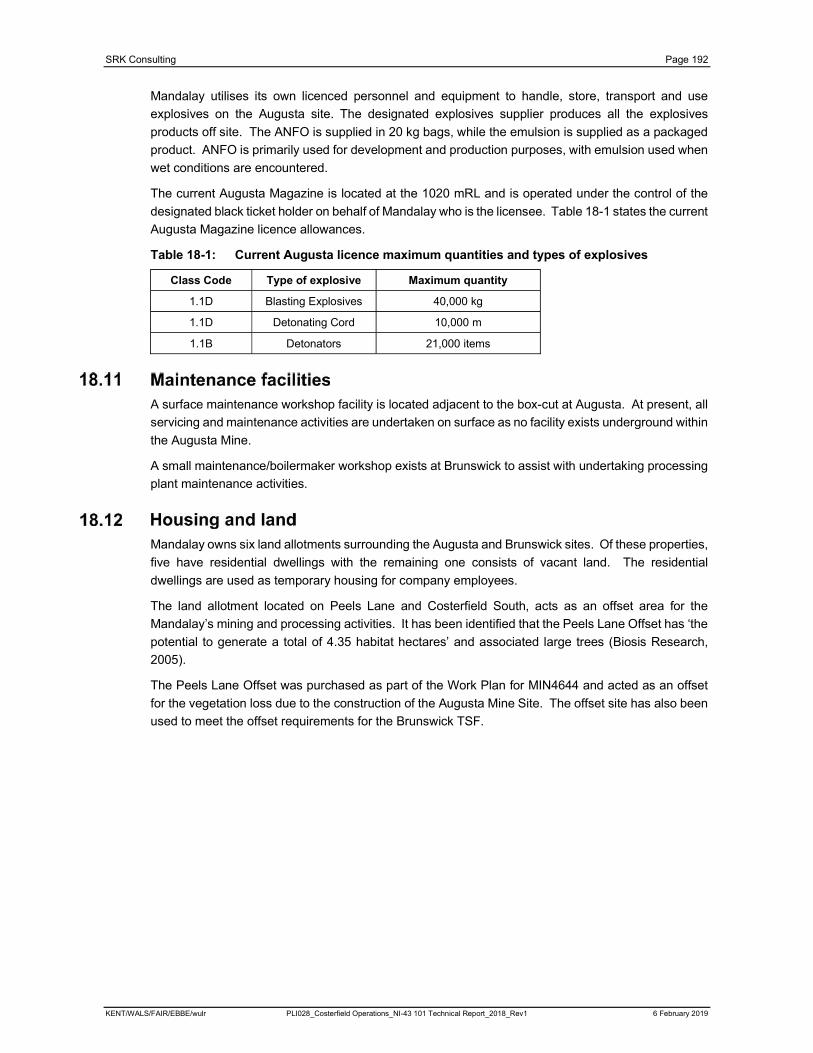
SRK Consulting Page 192
KENT/WALS/FAIR/EBBE/wulr PLI028_Costerfield Operations_NI-43 101 Technical Report_2018_Rev1 6 February 2019
Mandalay utilises its own licenced personnel and equipment to handle, store, transport and use
explosives on the Augusta site. The designated explosives supplier produces all the explosives
products off site. The ANFO is supplied in 20 kg bags, while the emulsion is supplied as a packaged
product. ANFO is primarily used for development and production purposes, with emulsion used when
wet conditions are encountered.
The current Augusta Magazine is located at the 1020 mRL and is operated under the control of the
designated black ticket holder on behalf of Mandalay who is the licensee. Table 18-1 states the current
Augusta Magazine licence allowances.
Table 18-1: Current Augusta licence maximum quantities and types of explosives
Class Code Type of explosive Maximum quantity
1.1D Blasting Explosives 40,000 kg
1.1D Detonating Cord 10,000 m
1.1B Detonators 21,000 items
A surface maintenance workshop facility is located adjacent to the box-cut at Augusta. At present, all
servicing and maintenance activities are undertaken on surface as no facility exists underground within
the Augusta Mine.
A small maintenance/boilermaker workshop exists at Brunswick to assist with undertaking processing
plant maintenance activities.
Mandalay owns six land allotments surrounding the Augusta and Brunswick sites. Of these properties,
five have residential dwellings with the remaining one consists of vacant land. The residential
dwellings are used as temporary housing for company employees.
The land allotment located on Peels Lane and Costerfield South, acts as an offset area for the
Mandalay’s mining and processing activities. It has been identified that the Peels Lane Offset has ‘the
potential to generate a total of 4.35 habitat hectares’ and associated large trees (Biosis Research,
2005).
The Peels Lane Offset was purchased as part of the Work Plan for MIN4644 and acted as an offset
for the vegetation loss due to the construction of the Augusta Mine Site. The offset site has also been
used to meet the offset requirements for the Brunswick TSF.
SRK Consulting Page 193
KENT/WALS/FAIR/EBBE/wulr PLI028_Costerfield Operations_NI-43 101 Technical Report_2018_Rev1 6 February 2019
The concentrate is discharged directly into 1.5 t capacity bulk bags ready for transportation by road-
train to the Port of Melbourne for shipping to overseas markets. The average payload of each B-
double2 road-train is approximately 42 t and sea shipments are normally scheduled at least once per
month on a CIF (Cartage, Insurance, Freight) basis to the destination port.
A third-party trucking company collects the concentrate from the Brunswick site, transports, stores and
loads the concentrate. Logistics and shipping documentation services are provided by Minalysis Pty
Ltd.
Costerfield is a combined gold and antimony mine with the business being sensitive to the price of
both metals and the AUD: USD exchange rate, as the currency of sale is USD. Antimony is not traded
on international metal exchanges, with terms and prices being agreed upon between producer and
consumer. Pricing is dependent on the quality and form of antimony product sold.
The comments in this section are based on review of market reports by Roskill, the United States
Geological Survey and public comments by major consumers such as Campine.
Globally, world antimony mine production in 2016 was estimated to have been 140,000–150,000 t of
contained antimony. China is the world’s largest producer of antimony, accounting for approximately
75%–80% of world mine production3,4. Primary antimony mines with no precious metal credits are
increasingly becoming uneconomic, including those in China, such that global antimony mine output
is now shrinking. Recovery of prices in 2017 have incentivised studies to restart historical mine
production and greenfields exploration globally, but no major new antimony production is expected in
the next one to three years,
Antimony is primarily used as a flame retardant and in the production of lead acid batteries, these
markets together accounting for nearly 90% of antimony consumption worldwide (Figure 19-1).
Antimony consumption began to recover in 2016 following years of weak global economic growth and
substitution of antimony in flame retardant formulations in response to price peaks in the previous
cycle. Prices sharply recovered in 2016 and early 2017 (Figure 19-2) in response to both a positive
demand environment and shrinking availability of primary feedstocks.
2 A B-double road-train consists of a prime mover towing a specialised lead trailer that has a fifth-wheel mounted
on the rear towing another semi-trailer, resulting in two articulation points.3 Antimony: U.S. Geological Survey, Mineral Commodity Summaries, January 2016,
http://minerals.usgs.gov/minerals/pubs/commodity/antimony/mcs-2016-antim.pdf.4 China’s 2016 Nonferrous Industrial Output Production Summary, China Ministry of Industry and Information Technology (MIIT), February 4, 2017, www.miit.gov.cn/n1146290/n1146402/n1146455/c5479645/content.html

SRK Consulting Page 194
KENT/WALS/FAIR/EBBE/wulr PLI028_Costerfield Operations_NI-43 101 Technical Report_2018_Rev1 6 February 2019
Figure 19-1: Estimate of global antimony demand by end-use segment
Source: Roskill5, USGS and industry reports.
Figure 19-2: Antimony metal prices 2010–2017
The emergence of a supply deficit is forecast in the 2018–2022 period, largely due to a further
reduction in mine output in China in response to the lack of new discoveries, a determined effort by
the Chinese Government to limit environmental damage from smaller producers and continued
crackdown on illegal mining and smuggling (Figure 19-3).
Recent closure or downsizing of antimony mines outside China combined with few new antimony
mines being built in the foreseeable future have positioned the market for a significant shortage, going
forward.
The size of the forecast deficit will be primarily dependent on the scale of investment in new mine
production worldwide, the pace of metal stock drawdown and global industrial production growth.
These market dynamics are likely to result in the antimony price remaining in the range between
USD7,000/t and USD10,000/t in the coming year due to growing shortages.
5 https://roskill.com/product/antimony-world-market-for-antimony-to-2025-12th-edition/
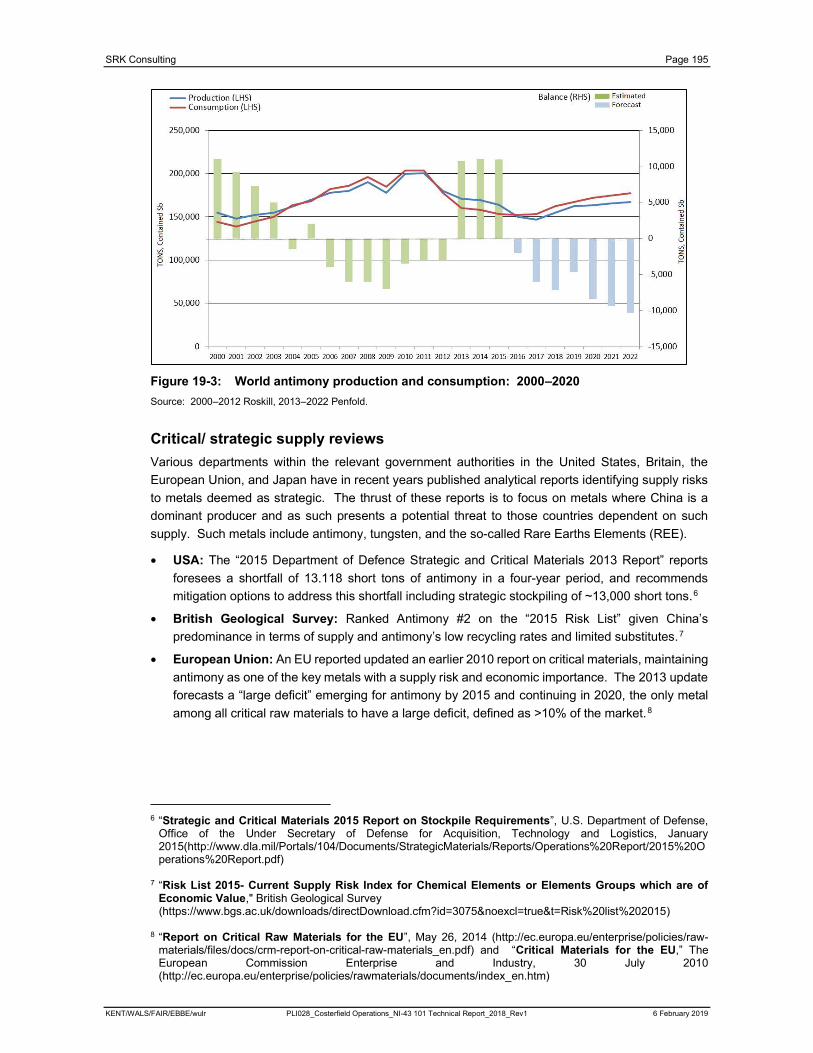
SRK Consulting Page 195
KENT/WALS/FAIR/EBBE/wulr PLI028_Costerfield Operations_NI-43 101 Technical Report_2018_Rev1 6 February 2019
Figure 19-3: World antimony production and consumption: 2000–2020
Source: 2000–2012 Roskill, 2013–2022 Penfold.
Critical/ strategic supply reviews
Various departments within the relevant government authorities in the United States, Britain, the
European Union, and Japan have in recent years published analytical reports identifying supply risks
to metals deemed as strategic. The thrust of these reports is to focus on metals where China is a
dominant producer and as such presents a potential threat to those countries dependent on such
supply. Such metals include antimony, tungsten, and the so-called Rare Earths Elements (REE).
USA: The “2015 Department of Defence Strategic and Critical Materials 2013 Report” reports
foresees a shortfall of 13.118 short tons of antimony in a four-year period, and recommends
mitigation options to address this shortfall including strategic stockpiling of ~13,000 short tons.6
British Geological Survey: Ranked Antimony #2 on the “2015 Risk List” given China’s
predominance in terms of supply and antimony’s low recycling rates and limited substitutes.7
European Union: An EU reported updated an earlier 2010 report on critical materials, maintaining
antimony as one of the key metals with a supply risk and economic importance. The 2013 update
forecasts a “large deficit” emerging for antimony by 2015 and continuing in 2020, the only metal
among all critical raw materials to have a large deficit, defined as >10% of the market.8
6 “Strategic and Critical Materials 2015 Report on Stockpile Requirements”, U.S. Department of Defense,
Office of the Under Secretary of Defense for Acquisition, Technology and Logistics, January 2015(http://www.dla.mil/Portals/104/Documents/StrategicMaterials/Reports/Operations%20Report/2015%20Operations%20Report.pdf)
7 “Risk List 2015- Current Supply Risk Index for Chemical Elements or Elements Groups which are of Economic Value," British Geological Survey (https://www.bgs.ac.uk/downloads/directDownload.cfm?id=3075&noexcl=true&t=Risk%20list%202015)
8 “Report on Critical Raw Materials for the EU”, May 26, 2014 (http://ec.europa.eu/enterprise/policies/raw-materials/files/docs/crm-report-on-critical-raw-materials_en.pdf) and “Critical Materials for the EU,” The European Commission Enterprise and Industry, 30 July 2010 (http://ec.europa.eu/enterprise/policies/rawmaterials/documents/index_en.htm)

SRK Consulting Page 196
KENT/WALS/FAIR/EBBE/wulr PLI028_Costerfield Operations_NI-43 101 Technical Report_2018_Rev1 6 February 2019
The antimony-gold concentrate produced from the Costerfield Operation is sold directly to smelters
capable of recovering both the gold and antimony from the concentrates, such that Mandalay receives
payment based on the concentration of the antimony and gold within the concentrate. The terms and
conditions of commercial sale are not disclosed pursuant to confidentiality requirements.
The marketing of the concentrate is conducted through the agency of West End Mining Pty Ltd.
SRK Consulting Page 197
KENT/WALS/FAIR/EBBE/wulr PLI028_Costerfield Operations_NI-43 101 Technical Report_2018_Rev1 6 February 2019
Ventilation shafts have been installed in Cuffley and Brunswick to maintain suitable air quality and
volumes within the expanded underground mine. The Cuffley ventilation shaft is located on private
land owned by Mandalay Resources and acts as the primary exhaust for the Cuffley area.
The Brunswick ventilation shaft is located on Crown land nearby the Brunswick Processing Plant and
acts as the primary intake for the Brunswick area.
The Youle ventilation shaft has an endorsed WPV with final permitting from the City of Greater Bendigo
pending. Mandalay do not consider that this planning permit will be withheld.
The disposal of groundwater extracted from the mine workings is a critical aspect of the Costerfield
mining operations. The current approved Work Plan does not allow for off-site disposal of groundwater
or surface water.
The climate in Central Victoria enables water to be removed through evaporation. Average pan
evaporation is 1,400 mm per year according to the nearest Bureau of Meteorology monitoring station
at Tatura (65 km northwest of Costerfield).
Mean rainfall in the area is 576 mm per year according to the Bureau of Meteorology monitoring station
at Heathcote, with the highest annual rainfall recorded in 1973 as 1,048 mm. Rainfall recorded in
Heathcote in 2010 and 2011 was higher than average, with 979 mm and 759 mm respectively. Rainfall
in 2013, 2014 and 2015 was below average at 554 mm, 510 mm and 299 mm respectively. Rainfall
for 2016 was above average at 687mm. Rainfall for 2017 was below average at 504 mm.
The Costerfield Operation currently operates a series of water storage and evaporation dams,
including the following major storages facilities:
Splitters Creek Evaporation Facility, 20 terraces and an HDPE-lined storage dam
Three HDPE-lined evaporation and storage dams at the Augusta site.
A RO plant was installed at the Brunswick Processing Plant to treat dewatered groundwater in 2014.
In 2017, an Actiflow unit was also installed as a ‘pre-treatment’ to the RO plant. This is used to
decrease the antimony and dissolved solid levels prior to RO treatment. The treated water is licensed
to be discharged into a neighbouring waterway, to be provided to local community members for stock
watering or gardening or is used for dust suppression purposes on roads around site. The creek
discharge is licensed by the Environmental Protection Authority (EPA), and permits up to 360 ML/year
of RO treated permeate to be discharged into the Mountain Creek South diversion, which feeds into
the Wapentake Creek at a maximum rate of 2.0 ML/day. The waste product from the RO plant, known
as brine, contains concentrated levels of salt, antimony and other elements removed from the
groundwater. The RO plant brine is stored in the HDPE=lined evaporation dams at Augusta, re-used
in the Brunswick Processing Plant or evaporated on the Bombay TSF.
The Splitters Creek Evaporation Facility, completed in 2015, has the capacity to treat 104 ML/year net
(evaporation minus rainfall).
The purpose of the facility is to evaporate groundwater extracted from the Costerfield Operation and
thereby maintain dewatering rates from the underground workings. The facility consists of a series of
SRK Consulting Page 198
KENT/WALS/FAIR/EBBE/wulr PLI028_Costerfield Operations_NI-43 101 Technical Report_2018_Rev1 6 February 2019
shallow evaporation terraces that follow the natural topographic contours. Groundwater is pumped
from the Augusta mine site and discharged at the highest point of the facility and water cascades down
the slope via the evaporation terraces to a deeper storage dam at the lowest point. A water pump
reticulates water from the storage dam to the highest point, to enable the evaporation terraces to be
filled from the storage dam as evaporation rates allow.
Current evaporation, RO plant processing and re-use capacity is calculated to be approximately
equivalent to the current dewatering rates; however, additional complementary treatment options are
being investigated to ensure adequate capacity in the future.
Waste rock that is surplus to underground backfilling requirements is stockpiled on the surface in
various locations. Testing of the waste rock has confirmed that the material is non-acid generating
and therefore does not pose a risk associated with acid mine drainage.
Waste rock is currently stockpiled next to the Augusta mine box-cut, with the maximum height and
shape of the stockpile prescribed in the approved Work Plan. The approved Work Plan requires that
this stockpile will be removed on closure in order to return the land to the prior use as grazing pasture.
The waste rock will ultimately be used to fill the box-cut and cap the TSFs. Waste rock has also been
transported to both the Bombay and Brunswick TSFs to increase the height of the TSFs and was used
for construction of the Splitters Creek Evaporation Facility.
A portion of waste rock is screened then utilised in backfilling of the underground stopes; however,
sufficient waste rock will need to be retained in order to fulfil rehabilitation and TSF expansion
requirements.
In November 2018, Mandalay Resources completed construction of a lift on the Bombay TSF. This lift
will provide an additional volume of 150,000 m3 and is expected to reach capacity by March 2020.
In November 2018, Mandalay Resources completed construction of a lift on the Bombay TSF. This lift
provided an additional 136,000 m3 of volume and is expected to reach capacity in Q1 2020.
The Brunswick TSF reached its approved limit in November 2018, and additional approval will be
sought in mid-2019 for a 4 m increase in dam wall elevation. The additional elevation will be achieved
in two construction periods, each adding up to 2.5 m of height. The planned Q4 2019 Brunswick TSF
lift could add up to 130,000 m3 of tailings storage (pending geotechnical analysis and detailed
design). A 2 m lift for Bombay is planned for Q4 2021, and the remaining lift on Brunswick is planned
for Q1 2022.
The approved Environmental Monitoring Plan for the Augusta mine includes an air quality monitoring
program based on dust deposition gauges at various locations surrounding the Costerfield Operation
and five dust deposition gauges at the Splitters Creek Evaporation Facility. The monitoring data is
provided to the regulatory authorities and Community Representatives through the quarterly
Environmental Review Committee (ERC) meetings. Control measures in place to manage dust
emissions from the operations:
Road watering program with treated groundwater
Proactive monitoring of dust with portable Dust Trak monitors
Moisture control of mill feed during processing
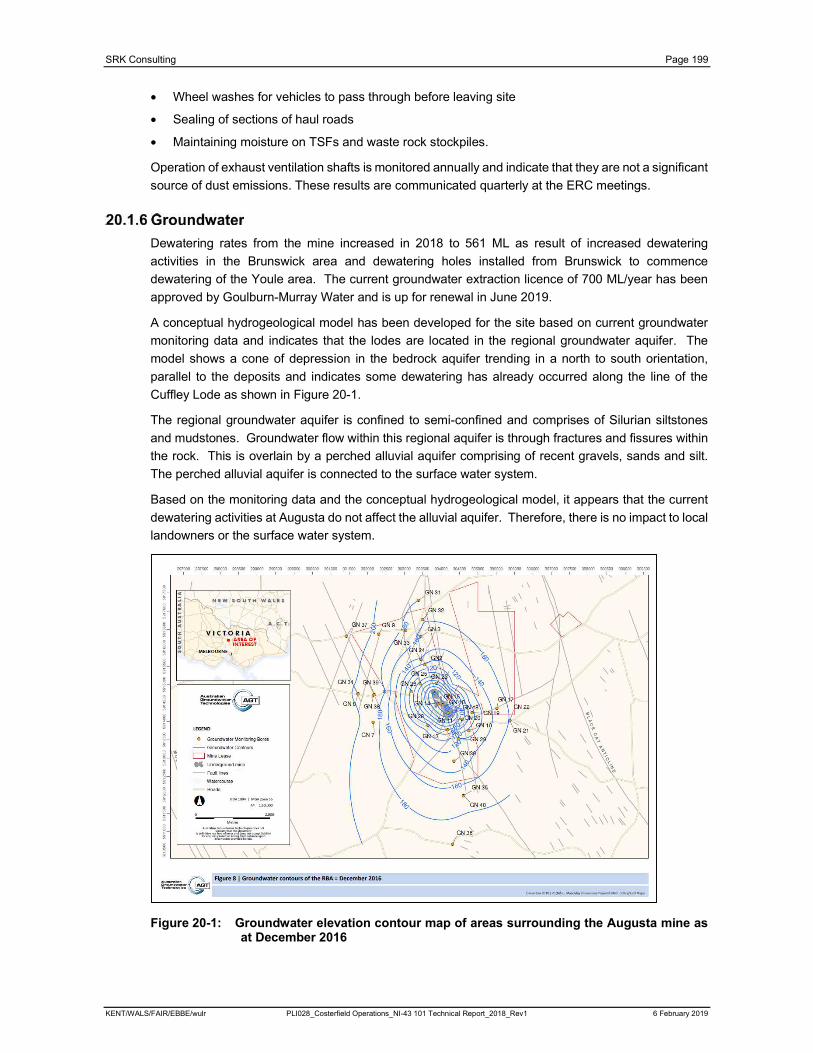
SRK Consulting Page 199
KENT/WALS/FAIR/EBBE/wulr PLI028_Costerfield Operations_NI-43 101 Technical Report_2018_Rev1 6 February 2019
Wheel washes for vehicles to pass through before leaving site
Sealing of sections of haul roads
Maintaining moisture on TSFs and waste rock stockpiles.
Operation of exhaust ventilation shafts is monitored annually and indicate that they are not a significant
source of dust emissions. These results are communicated quarterly at the ERC meetings.
Dewatering rates from the mine increased in 2018 to 561 ML as result of increased dewatering
activities in the Brunswick area and dewatering holes installed from Brunswick to commence
dewatering of the Youle area. The current groundwater extraction licence of 700 ML/year has been
approved by Goulburn-Murray Water and is up for renewal in June 2019.
A conceptual hydrogeological model has been developed for the site based on current groundwater
monitoring data and indicates that the lodes are located in the regional groundwater aquifer. The
model shows a cone of depression in the bedrock aquifer trending in a north to south orientation,
parallel to the deposits and indicates some dewatering has already occurred along the line of the
Cuffley Lode as shown in Figure 20-1.
The regional groundwater aquifer is confined to semi-confined and comprises of Silurian siltstones
and mudstones. Groundwater flow within this regional aquifer is through fractures and fissures within
the rock. This is overlain by a perched alluvial aquifer comprising of recent gravels, sands and silt.
The perched alluvial aquifer is connected to the surface water system.
Based on the monitoring data and the conceptual hydrogeological model, it appears that the current
dewatering activities at Augusta do not affect the alluvial aquifer. Therefore, there is no impact to local
landowners or the surface water system.
Figure 20-1: Groundwater elevation contour map of areas surrounding the Augusta mine as at December 2016

SRK Consulting Page 200
KENT/WALS/FAIR/EBBE/wulr PLI028_Costerfield Operations_NI-43 101 Technical Report_2018_Rev1 6 February 2019
The approved Environmental Monitoring Plan for the Costerfield Operation includes a noise monitoring
program which comprises routine attended and unattended noise monitoring at six locations, and
reactive monitoring at sensitive receptors in the event of complaints or enquiries. Monitoring is carried
out in accordance with EPA Victoria’s SEPP N1 policy.
Noise from the operation is a sensitive issue for near neighbours, and the company operates a
24-hour, 7 days a week complaints line to deal with noise complaints or any other issues from
members of the public. The Company’s Complaints Procedure includes processes to record
complaints, identify and implement immediate and longer-term actions. All complaints are discussed
at the quarterly Environmental Review Committee meetings.
The current Costerfield Operation is not expected to significantly change the nature of noise emissions
from the site. Construction of new waste rock storage, TSF or evaporation facilities may require some
additional noise monitoring which will be identified as part of the WPV approval process. During
construction, an additional 10 dBA of noise is permitted to be generated. Existing resources and
procedures are adequate to accommodate any required modifications to the noise monitoring
program.
DSDBI prescribes blast vibration limits for the protection of buildings and public amenity.
The Company undertakes annual blast vibration monitoring to assess compliance with the prescribed
limits and reports this information to the ERC quarterly.
The Costerfield Operation has been developed and operated with the aim of avoiding and minimising
impacts on native vegetation. Where native vegetation has been impacted, the Company has
obligations to secure native vegetation offsets.
Mandalay purchased approved native vegetation offset at Peels Lane in Costerfield to fulfil obligations
relating to Victoria’s Native Vegetation Management – A Framework for Action associated with the
original clearing of native vegetation at the Augusta Mine site and the Bombay TSF.
The Peels Lane offset site has been assessed as containing 4.35 habitat hectares of various
Ecological Vegetation Classes (EVCs) and associated large trees, in accordance with the framework
guidelines.
Expansion of the Costerfield Operation through construction of the Splitters Creek Evaporation Facility
and Brunswick and Bombay TSFs has had a minimal impact on native vegetation and the Peel Lane
site has sufficient offset credits to meet the site’s foreseeable future needs.
The key aspect of the Costerfield Operation that may affect visual amenity was the recent construction
of the Splitters Creek Evaporation Facility.
Community consultation took place as part of the planning for the facilities, and mitigation measures
were implemented where appropriate. Screening vegetation was planted, in consultation with the
relevant land manager and near neighbours.
A heritage survey of the South Costerfield Shaft, Alison and New Alison surface workings was
completed by LRGM Consultants in the first quarter of 2012. The purpose of this survey was to identify
SRK Consulting Page 201
KENT/WALS/FAIR/EBBE/wulr PLI028_Costerfield Operations_NI-43 101 Technical Report_2018_Rev1 6 February 2019
and record cultural heritage features in these areas of interest that exist within the current Mining
Licence (MIN4644). The Taungurung Clans Aboriginal Corporation is the Registered Aboriginal Party
designated as the traditional owners of the land on which Mining Licence MIN4644 is located.
The survey identified that no features of higher than local cultural heritage significance were identified,
with the following features of local cultural heritage significance being noted:
South Costerfield (Tait’s) Mine Shaft;
Old Alison Mine Shaft; and
New Alison Mine Shaft.
The expansion of the mining operations did not result in any disturbance of historical mine workings
or other heritage features.
The Costerfield Operation is one of the largest employers in the region and is a significant contributor
to the local economy. Mandalay preferentially employs appropriately skilled personnel from the local
community and sources goods and services from local suppliers wherever possible.
Mandalay has developed and implemented the Costerfield Operation Community Engagement Plan,
which has been approved by the DEDJTR in accordance with the requirements of the MRSD Act. This
Plan sets the framework for communication with all of the business’ stakeholders to ensure transparent
and ongoing consultative relationships are developed and maintained.
The Community Engagement Plan includes processes to manage community inquiries and complaints
to ensure timely and effective responses to issues affecting members of the community.
The current Community Engagement Plan is considered an appropriate framework to address the
needs of stakeholders through the planning and implementation of the proposed mine expansion.
In early 2016, Mandalay initiated regular community reference meetings under the auspices of the
ERC. This forum, the Community Reference Sub-Committee, gives community members the
opportunity to find out about current and future issues at the mine, to provide their input and ask
questions.
The MRSD Act requires proponents to identify rehabilitation requirements as part of the Work Plan
approvals process, and ensures that rehabilitation bonds are lodged in the form of a bank guarantee
to cover the full cost of rehabilitation up front, prior to commencing work. Rehabilitation bonds are
also reviewed on a regular basis to ensure that unit cost assumptions and the scope of work is kept
up to date. WPVs also trigger a review of the rehabilitation bond if the work to be carried out affects
final rehabilitation.
Mandalay has developed a Mine Closure Plan, which provides an overview of the various aspects of
closure and rehabilitation that have been included in the rehabilitation bond calculation and reflects
the rehabilitation requirements described in the approved Work Plans and Variations.
The Mine Closure Plan describes how the Augusta site, including the box-cut, waste rock storage,
office area and evaporation dams, will be rehabilitated back to its former land use as grazing pasture.
The mine decline will be blocked, and the portal backfilled with waste rock, with the box-cut being
levelled back to its original surface contours. Topsoil and subsoil have been stored on site to facilitate
the final vegetation.
The rehabilitation plan for the Brunswick site includes removal of all plant and returning the disturbed
SRK Consulting Page 202
KENT/WALS/FAIR/EBBE/wulr PLI028_Costerfield Operations_NI-43 101 Technical Report_2018_Rev1 6 February 2019
area back to native forest to create a safe and stable landform that can be used for passive recreation.
The TSFs will be dried out, capped with waste rock and topsoil and planted with native vegetation.
The plan includes provisions for monitoring the TSFs post closure.
The rehabilitation plan for the Splitters Creek Evaporation Facility includes evaporation of the
remaining stored groundwater and removing the clay lining from the terraces, which is placed back in
to the HDPE-lined storage dam. The liner in the storage dam is folded back over the clay and is
capped with waste rock, clay and topsoil and planted with grasses. Topsoil and subsoil have been
stored on site to enable this final vegetation.
Future changes to mining activities such as potential changes to waste rock storage facilities will
require a risk-based WPV to be approved. The DEDJTR facilitates this approval process and will
engage with relevant referral authorities, as required. The DEDJTR may prescribe certain conditions
on the approval, which may include amendments to the environmental monitoring program. The Work
Plan approval process involves a thorough consultation process with regulatory authorities, and any
conditions or proposed amendments requested to the WPV are generally negotiated to the satisfaction
of both parties. All Onsite and offsite risks must be assessed in the new Work Plan review process
and adequate controls and monitoring programs implemented to mitigate any negative impacts.
In addition to the approval of a WPV, any future expansion of the current Costerfield Operations will
require a number of other potential consents, approvals and permits, as listed in Table 20-1.
Table 20-1: Permit requirements
Stakeholder Instrument
Private LandholdersConsent/ compensation agreement with owner of land on which the mine is located.
City of Greater BendigoPlanning Permit required for new groundwater evaporation facility and modification to existing TSFs.
DEWLPCompliance with Native Vegetation Management Framework for removal of native vegetation associated with the power supply, evaporation facility and expansion of TSF footprints.
EPA EPA consent to discharge reverse osmosis treated water to a local waterway.
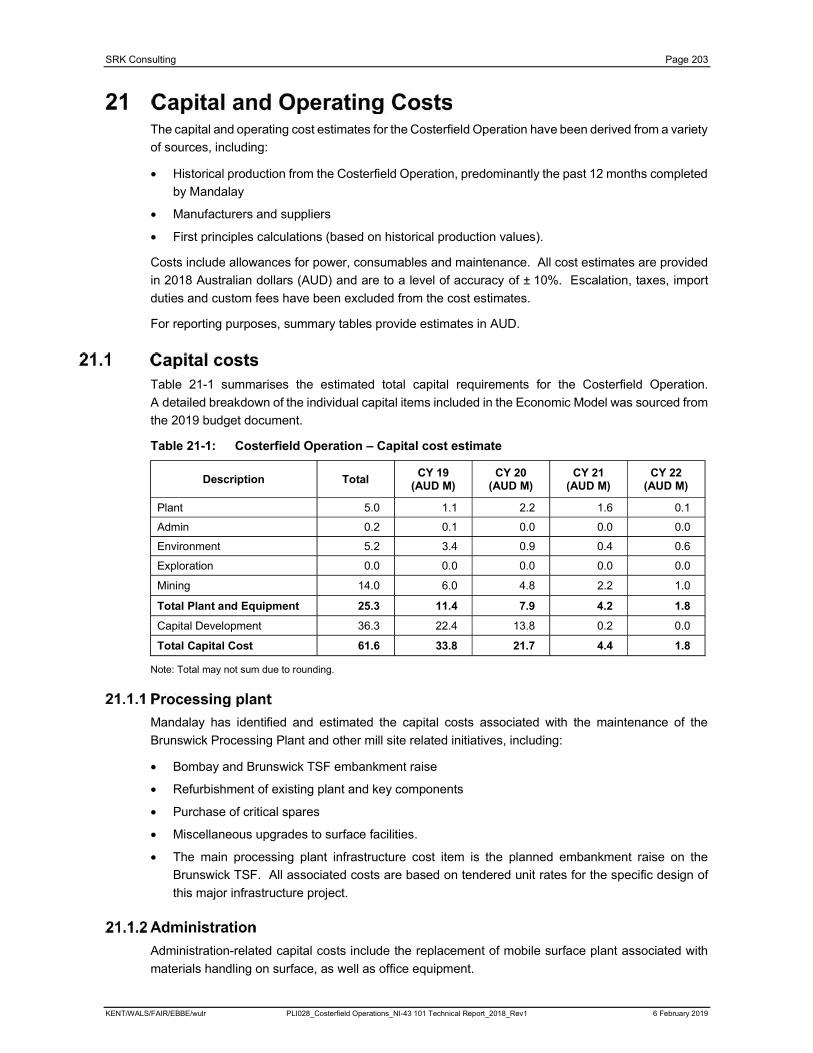
SRK Consulting Page 203
KENT/WALS/FAIR/EBBE/wulr PLI028_Costerfield Operations_NI-43 101 Technical Report_2018_Rev1 6 February 2019
The capital and operating cost estimates for the Costerfield Operation have been derived from a variety
of sources, including:
Historical production from the Costerfield Operation, predominantly the past 12 months completed
by Mandalay
Manufacturers and suppliers
First principles calculations (based on historical production values).
Costs include allowances for power, consumables and maintenance. All cost estimates are provided
in 2018 Australian dollars (AUD) and are to a level of accuracy of ± 10%. Escalation, taxes, import
duties and custom fees have been excluded from the cost estimates.
For reporting purposes, summary tables provide estimates in AUD.
Table 21-1 summarises the estimated total capital requirements for the Costerfield Operation.
A detailed breakdown of the individual capital items included in the Economic Model was sourced from
the 2019 budget document.
Table 21-1: Costerfield Operation – Capital cost estimate
Description TotalCY 19
(AUD M)CY 20
(AUD M)CY 21
(AUD M)CY 22
(AUD M)
Plant 5.0 1.1 2.2 1.6 0.1
Admin 0.2 0.1 0.0 0.0 0.0
Environment 5.2 3.4 0.9 0.4 0.6
Exploration 0.0 0.0 0.0 0.0 0.0
Mining 14.0 6.0 4.8 2.2 1.0
Total Plant and Equipment 25.3 11.4 7.9 4.2 1.8
Capital Development 36.3 22.4 13.8 0.2 0.0
Total Capital Cost 61.6 33.8 21.7 4.4 1.8
Note: Total may not sum due to rounding.
Mandalay has identified and estimated the capital costs associated with the maintenance of the
Brunswick Processing Plant and other mill site related initiatives, including:
Bombay and Brunswick TSF embankment raise
Refurbishment of existing plant and key components
Purchase of critical spares
Miscellaneous upgrades to surface facilities.
The main processing plant infrastructure cost item is the planned embankment raise on the
Brunswick TSF. All associated costs are based on tendered unit rates for the specific design of
this major infrastructure project.
Administration-related capital costs include the replacement of mobile surface plant associated with
materials handling on surface, as well as office equipment.
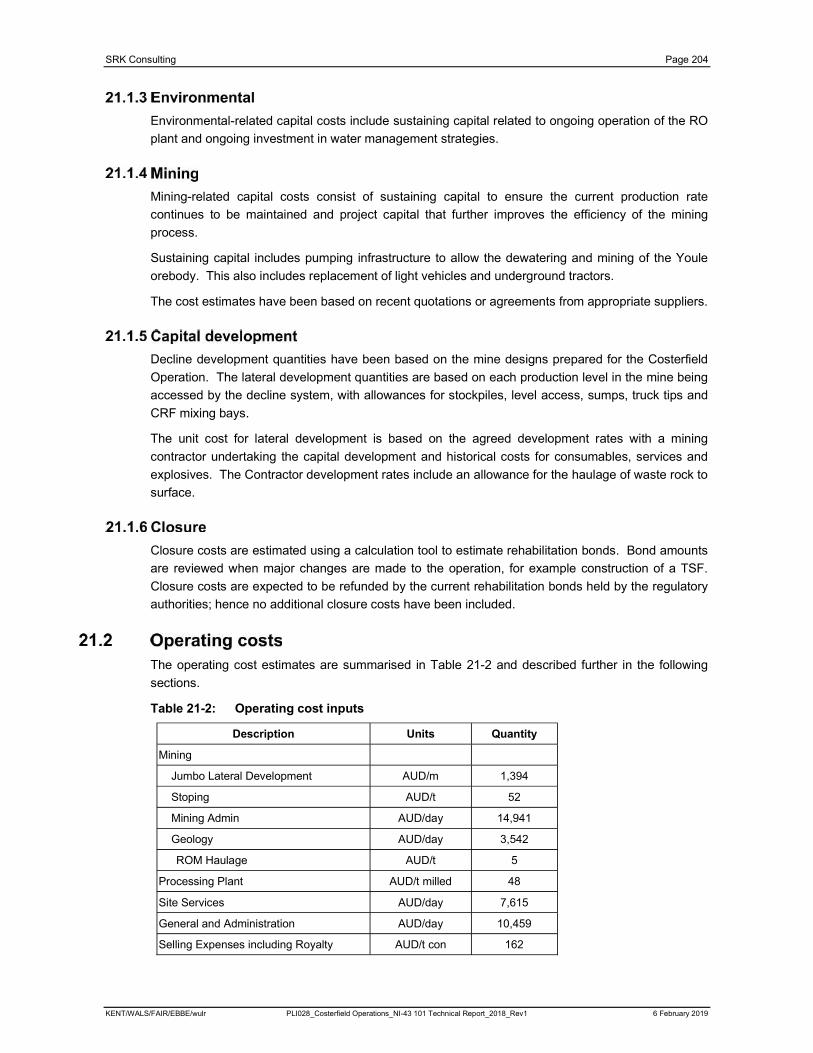
SRK Consulting Page 204
KENT/WALS/FAIR/EBBE/wulr PLI028_Costerfield Operations_NI-43 101 Technical Report_2018_Rev1 6 February 2019
Environmental-related capital costs include sustaining capital related to ongoing operation of the RO
plant and ongoing investment in water management strategies.
Mining-related capital costs consist of sustaining capital to ensure the current production rate
continues to be maintained and project capital that further improves the efficiency of the mining
process.
Sustaining capital includes pumping infrastructure to allow the dewatering and mining of the Youle
orebody. This also includes replacement of light vehicles and underground tractors.
The cost estimates have been based on recent quotations or agreements from appropriate suppliers.
Decline development quantities have been based on the mine designs prepared for the Costerfield
Operation. The lateral development quantities are based on each production level in the mine being
accessed by the decline system, with allowances for stockpiles, level access, sumps, truck tips and
CRF mixing bays.
The unit cost for lateral development is based on the agreed development rates with a mining
contractor undertaking the capital development and historical costs for consumables, services and
explosives. The Contractor development rates include an allowance for the haulage of waste rock to
surface.
Closure costs are estimated using a calculation tool to estimate rehabilitation bonds. Bond amounts
are reviewed when major changes are made to the operation, for example construction of a TSF.
Closure costs are expected to be refunded by the current rehabilitation bonds held by the regulatory
authorities; hence no additional closure costs have been included.
The operating cost estimates are summarised in Table 21-2 and described further in the following
sections.
Table 21-2: Operating cost inputs
Description Units Quantity
Mining
Jumbo Lateral Development AUD/m 1,394
Stoping AUD/t 52
Mining Admin AUD/day 14,941
Geology AUD/day 3,542
ROM Haulage AUD/t 5
Processing Plant AUD/t milled 48
Site Services AUD/day 7,615
General and Administration AUD/day 10,459
Selling Expenses including Royalty AUD/t con 162
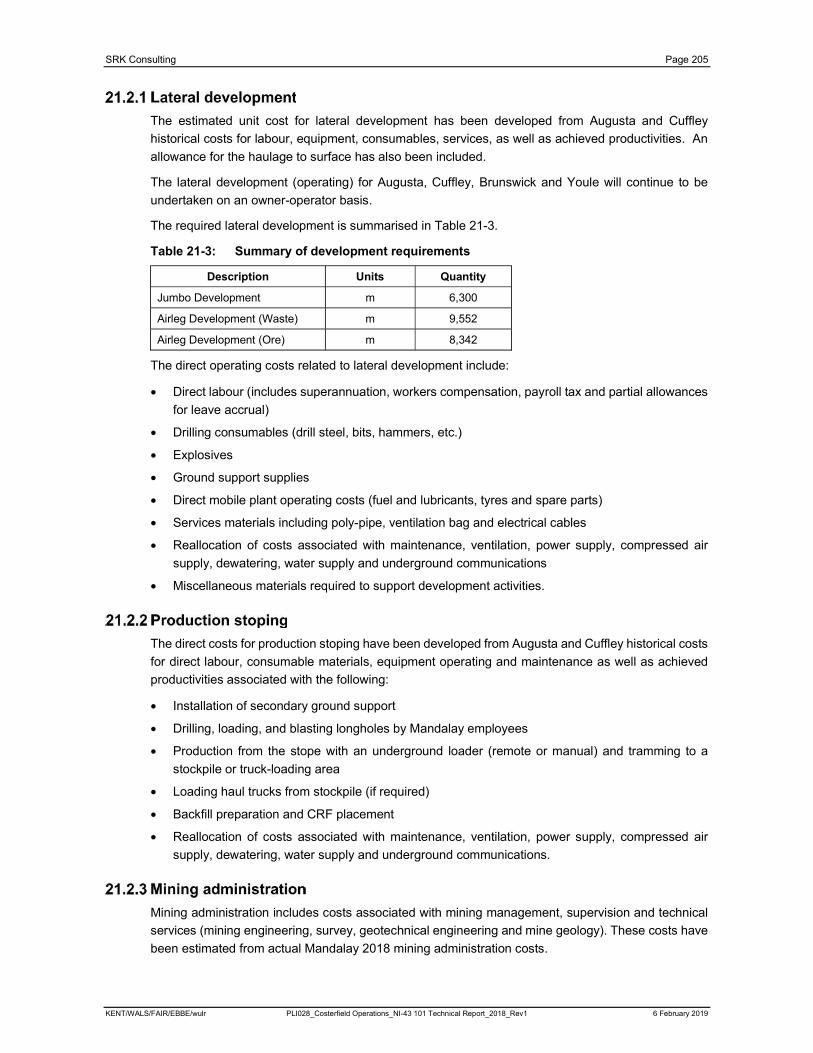
SRK Consulting Page 205
KENT/WALS/FAIR/EBBE/wulr PLI028_Costerfield Operations_NI-43 101 Technical Report_2018_Rev1 6 February 2019
The estimated unit cost for lateral development has been developed from Augusta and Cuffley
historical costs for labour, equipment, consumables, services, as well as achieved productivities. An
allowance for the haulage to surface has also been included.
The lateral development (operating) for Augusta, Cuffley, Brunswick and Youle will continue to be
undertaken on an owner-operator basis.
The required lateral development is summarised in Table 21-3.
Table 21-3: Summary of development requirements
Description Units Quantity
Jumbo Development m 6,300
Airleg Development (Waste) m 9,552
Airleg Development (Ore) m 8,342
The direct operating costs related to lateral development include:
Direct labour (includes superannuation, workers compensation, payroll tax and partial allowances
for leave accrual)
Drilling consumables (drill steel, bits, hammers, etc.)
Explosives
Ground support supplies
Direct mobile plant operating costs (fuel and lubricants, tyres and spare parts)
Services materials including poly-pipe, ventilation bag and electrical cables
Reallocation of costs associated with maintenance, ventilation, power supply, compressed air
supply, dewatering, water supply and underground communications
Miscellaneous materials required to support development activities.
The direct costs for production stoping have been developed from Augusta and Cuffley historical costs
for direct labour, consumable materials, equipment operating and maintenance as well as achieved
productivities associated with the following:
Installation of secondary ground support
Drilling, loading, and blasting longholes by Mandalay employees
Production from the stope with an underground loader (remote or manual) and tramming to a
stockpile or truck-loading area
Loading haul trucks from stockpile (if required)
Backfill preparation and CRF placement
Reallocation of costs associated with maintenance, ventilation, power supply, compressed air
supply, dewatering, water supply and underground communications.
Mining administration includes costs associated with mining management, supervision and technical
services (mining engineering, survey, geotechnical engineering and mine geology). These costs have
been estimated from actual Mandalay 2018 mining administration costs.
SRK Consulting Page 206
KENT/WALS/FAIR/EBBE/wulr PLI028_Costerfield Operations_NI-43 101 Technical Report_2018_Rev1 6 February 2019
Geology includes costs associated with resource estimation, resource definition drilling, sampling,
assaying, laboratory expenses as well as associated management and labour. These costs have
been estimated from actual Mandalay 2018 geology costs.
The cost of trucking from the Augusta box-cut to the Brunswick ROM Pad has been calculated based
on historical Augusta cost information and includes private contractor labour, haul truck operating and
maintenance costs. The ROM haulage cost includes indirect costs and profit.
The average cost of the trucking has been calculated at AUD5.01/t ore delivered to the Brunswick
ROM Pad.
Processing plant costs include tailings disposal, ROM management, ball mill crushing and grinding,
general operating and maintenance, reagent mixing, thickening, flotation, gold room expenses, all
flocculants and reagent chemicals, plant maintenance and reallocated electrical costs associated with
plant operation. Brunswick processing costs have been estimated from actual Mandalay 2018
processing costs.
Site services costs refer to indirect costs related to Health and Safety, Environment and Community
Relations as well as costs related to water treatment plant, water disposal and RO plant.
Compensation expenses are included in this cost item. These costs have been estimated from actual
Mandalay 2018 site services costs.
General and administration (G&A) costs refer to site-wide operational costs rather than costs directly
associated with operational departments and include General Site Management (including all staff
costs), Human Resources, Finance and Administration. These costs have been sourced from actual
Mandalay 2018 G&A costs.
Mandalay uses a third-party company to arrange the sale and transport of concentrate from the
Brunswick Processing Plant to the smelter in China. The Mandalay portion of the selling expenses is
calculated from historical costs and comprises road transport from the Brunswick Processing Plant to
the Port of Melbourne, ship transportation from Melbourne to China, shipment documentation, freight
administration and assay exchange/ returns.

SRK Consulting Page 207
KENT/WALS/FAIR/EBBE/wulr PLI028_Costerfield Operations_NI-43 101 Technical Report_2018_Rev1 6 February 2019
This section is not required as the property is currently in production, Mandalay is a producing issuer
and there is no planned material expansion of the current production. SRK has verified the economic
viability of the Mineral Reserves via cashflow modelling, using the inputs discussed in this report.
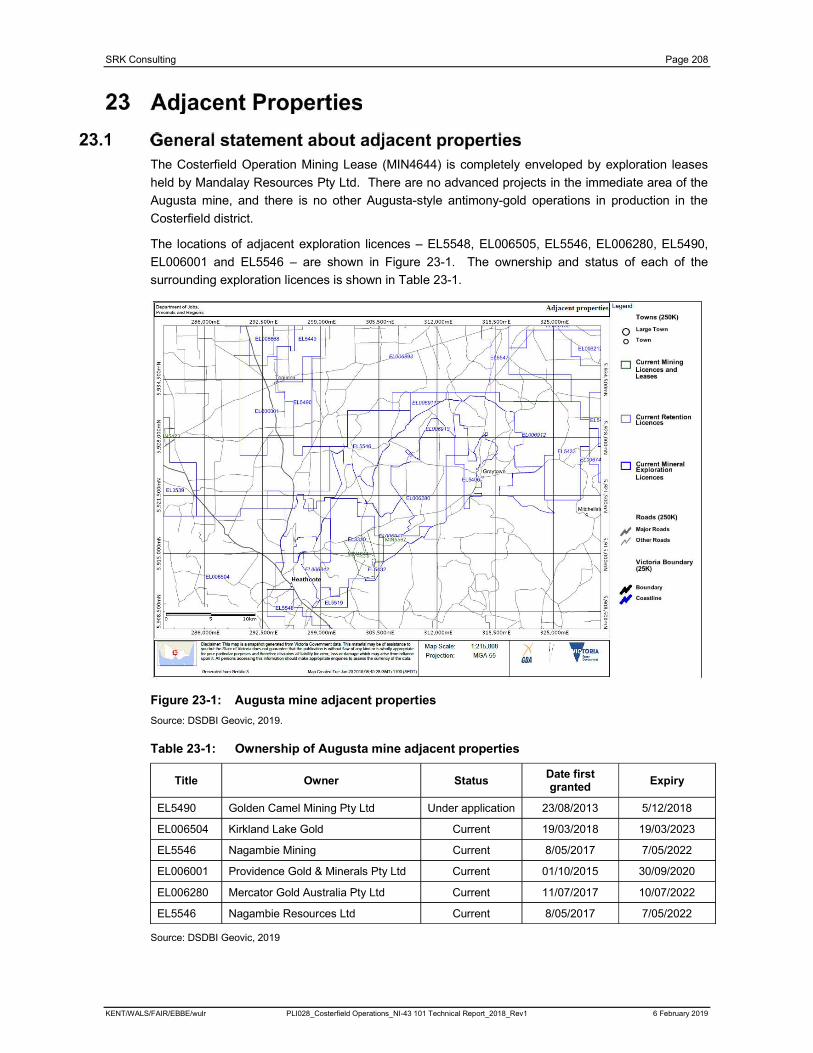
SRK Consulting Page 208
KENT/WALS/FAIR/EBBE/wulr PLI028_Costerfield Operations_NI-43 101 Technical Report_2018_Rev1 6 February 2019
The Costerfield Operation Mining Lease (MIN4644) is completely enveloped by exploration leases
held by Mandalay Resources Pty Ltd. There are no advanced projects in the immediate area of the
Augusta mine, and there is no other Augusta-style antimony-gold operations in production in the
Costerfield district.
The locations of adjacent exploration licences – EL5548, EL006505, EL5546, EL006280, EL5490,
EL006001 and EL5546 – are shown in Figure 23-1. The ownership and status of each of the
surrounding exploration licences is shown in Table 23-1.
Figure 23-1: Augusta mine adjacent properties
Source: DSDBI Geovic, 2019.
Table 23-1: Ownership of Augusta mine adjacent properties
Title Owner StatusDate first granted
Expiry
EL5490 Golden Camel Mining Pty Ltd Under application 23/08/2013 5/12/2018
EL006504 Kirkland Lake Gold Current 19/03/2018 19/03/2023
EL5546 Nagambie Mining Current 8/05/2017 7/05/2022
EL006001 Providence Gold & Minerals Pty Ltd Current 01/10/2015 30/09/2020
EL006280 Mercator Gold Australia Pty Ltd Current 11/07/2017 10/07/2022
EL5546 Nagambie Resources Ltd Current 8/05/2017 7/05/2022
Source: DSDBI Geovic, 2019

SRK Consulting Page 209
KENT/WALS/FAIR/EBBE/wulr PLI028_Costerfield Operations_NI-43 101 Technical Report_2018_Rev1 6 February 2019
The Costerfield Operation is situated 35–51 km from other significant mining operations in central
Victoria. Table 23-2 shows the distance from the Augusta mine site to other mines in central Victoria.
Table 23-2: Distance from Augusta mine site to other mining projects in the region
Mine Owner Distance (km) General direction
Nagambie Mine Nagambie Mining Ltd 40 East-northeast
Fosterville Mine Kirkland Lake Gold 35 Northwest
Kangaroo Flat Mine Unity Mining Limited 51 West-northwest
SRK Consulting Page 210
KENT/WALS/FAIR/EBBE/wulr PLI028_Costerfield Operations_NI-43 101 Technical Report_2018_Rev1 6 February 2019
Additional information that is deemed relevant to ensure this Technical Report is understandable and
not misleading, is discussed in the sections below.
Remnant mineralisation exists throughout the Augusta mine, mainly in the E, W and N lodes.
This remnant mineralisation has remained in situ as pillars to support the local ground stability when
difficult mining conditions were encountered, or the mining shapes did not prove to be economically
viable when mining was conducted.
Remote loaders and longhole drill rigs (drilling from sub-parallel accesses adjacent to the original ore
drive) are now being used to extract ore safely, without personnel entering the remnant mining area.
Areas of remnant ore are individually assessed and those deemed both economically viable and safe
to extract remotely have been included in the LOM schedule.
SRK Consulting Page 211
KENT/WALS/FAIR/EBBE/wulr PLI028_Costerfield Operations_NI-43 101 Technical Report_2018_Rev1 6 February 2019
Reconciliation results show good precision and reasonable accuracy between the resource block
model data and the processing plant data. Unquantified errors such as stockpiling, ore-waste
misallocation, and unplanned dilution influenced the reconciliation data. Over the period, the grade of
gold predicted by the model was 10%higher than realised during mine to plant reconciliation. The
grade of antimony predicted by the model was 16% % higher than realised during mine to plant
reconciliation. The majority of the over estimation occurred in the Cuffley Main area, where realised
lode thicknesses were far less than modelled due to narrowing of the lode between levels, and veins
being discontinuous between levels. After exclusion, the model overcall is reduced significantly – to
4% gold and 10% antimony. This overcall is likely due to the inclusion of discontinuous splay veins in
the wireframe that were not captured during stoping. These areas are now mined out and depleted
from the 2018 Mineral Resource estimate.
The reconciliation results and improvements made, give confidence to the sample collection
procedures, the quality of the assays and the resource estimation methodology.
Overall the measured and indicated resource tonnage has increased in 2018 by 58,000 tonnes with a
contained metal increase of 89,000 oz gold and 4,800 t antimony. These increases equate to an
overall increase in gold grade from 6.5 g/t to 8.3 g/t and anincrease in antimony grade from 2.9% to
3.1%. The gold grade increase in primarily due to the addition of the new Youle lode.
Exploration from January to December 2018 was predominantly focused on extending, bounding and
upgrading the Youle Resource. A total of 20,847 metres was devoted to resource expansion and
conversion drilling, with the remaining 13,809 metres put into target generation spending. Focus in
the second half of 2018 was also on extending the resource around Brunswick and Augusta to build
‘life of mine’ and replace mine depletion along with exploring near mine targets in close proximity to
current underground infrastructure. The goals achieved included:
Defining the ‘Youle’ Lode, west- dipping, high – grade ore body, and continuation of Kendall style
mineralisation.
Building an indicated resource and a reserve around Youle with integration into the ‘life of mine’
plan.
Further definition and testing of Brunswick at depth.
Expanding the knowledge and Resource in the near mine environment, in particular extension and
infill of Cuffley North Lode (1,272 metres), D lode (240 metres) and Cuffley line drilling (335
metres).
Brownfields drilling was also undertaken at Augusta East (1,479 metres) looking for southern
extension of the Augusta deposit and Mountain Creek (1,253 metres) testing to the south of the
Brunswick deposit.
In total 34,656.0 m of diamond drilling was undertaken on Mandalay Resources Costerfield Operations
Pty Ltd tenements at Costerfield during 2018. All drilling activity was conducted by Starwest Pty Ltd
using 5 Boart Longyear LM90s, 1 Boart Longyear LM75 and 1 pneumatic Kempe U2.
SRK Consulting Page 212
KENT/WALS/FAIR/EBBE/wulr PLI028_Costerfield Operations_NI-43 101 Technical Report_2018_Rev1 6 February 2019
SRK makes the following observations regarding the mining operations:
Inferred resources have not been included in the economic evaluation.
There has been a history of conversion of Inferred to Indicated Resources resulting in additional
Resources from outside the Mineral Reserve being included into the life of mine plans that have
the potential to improve the project economics. This has not occurred in the 2018 Reserve
estimate with Measured and Indicated material only included in the LoM schedule.
Mandalay has demonstrated an ability to improve the mining method and productivity based on
continuing to increase and improve the geological information and thus mine designs and
planning.
SRK Consulting Page 213
KENT/WALS/FAIR/EBBE/wulr PLI028_Costerfield Operations_NI-43 101 Technical Report_2018_Rev1 6 February 2019
The Costerfield Property is an advanced property and Mandalay has a history of successful exploration
and mining on the Property. SRK has observed that the degree of technical competency evident in
the work performed by Mandalay geologists is high, particularly in the structural analysis of the local
geology. Therefore, there is no requirement for additional work programmes over and above the
existing operational plans.
SRK recommends that Mandalay continually review the cut-off grade based on changes to the cost
profile and commodity prices.
Application of a variable cut-off grade i.e. for each deposit (Cuffley and Augusta) should continue to
be explored and applied by site operational personnel.
SRK Consulting Page 214
KENT/WALS/FAIR/EBBE/wulr PLI028_Costerfield Operations_NI-43 101 Technical Report_2018_Rev1 6 February 2019
Biosis Research, 2005. Flora, Fauna and habitat hectare values of native vegetation at Peels Lane, Costerfield South, Victoria.
Edwards et al., 1998. Heathcote and Parts of Woodlawn & Echuca 1:100,000 Map Area Geological Report, Geological Survey Report No. 108.
SRK 2017, Mandalay Resources Corporation, Costerfield Operation, Victoria, Australia; NI 43-101 Amended Report, 3 June 2016.
Stock E & Zaki N, 1972; Antimony Dispersion Patterns at Costerfield. Mining and Geological Journal Vol. 7 No. 2 (1972) Geological Survey of Victoria.
Stoker PT, 2006. Newmont Australia Technical Services Sampling Notes. AMC Report. January 2006, 03-05pp.
Systems Exploration Project #40, 2005; Petrophysical Results Mesoscale Laboratory Data, October 2005.
Thomas DE, 1937. Some notes on the Silurian Rocks of the Heathcote Area, Mining and Geological Journal Vol. 1 No. 1 Geological Survey of Victoria.
Thomas DE, 1941. Parish of Costerfield 1:31,680 Geological Map. Mines Department of Victoria.
UTS, 2008. UTS Geophysics Logistics Report for a Detailed Magnetic, Radiometric and Digital Terrain Survey for the Costerfield Project, carried out on behalf of AGD Operations Pty Ltd. (UTS Job #B054).
VandenBerg AHM, Willman CE, Maher S, Simons BA, Cayley RA, Taylor DH, Morand VJ, Moore DH& Radojkovic A, 2000. The Tasman Fold Belt System in Victoria. Geological Survey of Victoria Special Publication.
Weber and Associates, December 2004. Resource Calculations: Brunswick Mine Area (2004) forAGD Operations Pty Limited.
Webster R, 2008. Resource estimate of the Augusta Deposit, Costerfield Victoria Australia. Technical Report prepared for AGD Operations. AMC Consultants Pty Ltd.
Zonge, 2012; Report No. 944, Costerfield Downhole Induced Polarisation and Downhole Self Potential Surveys, Logistics Summary, November 2011 for Mandalay Resources, Compiled by S Mann, March 2012, Zonge Engineering and Research Organisation (Australia) Pty Ltd.
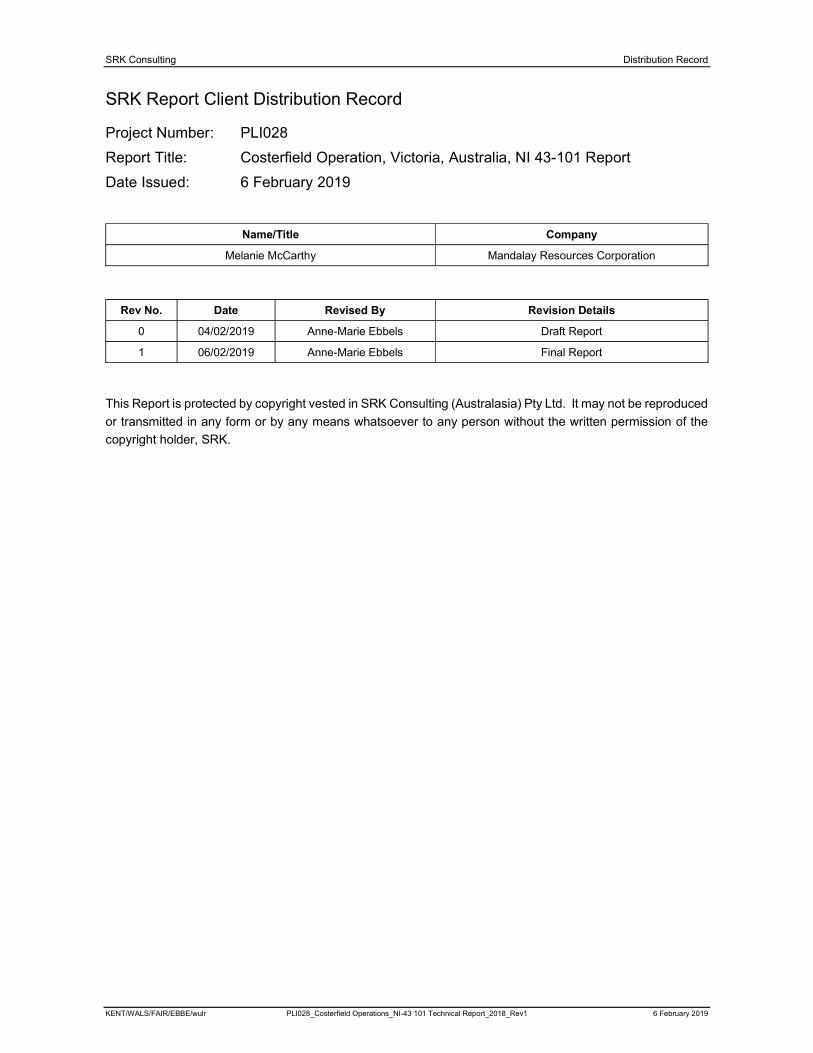
SRK Consulting Distribution Record
KENT/WALS/FAIR/EBBE/wulr PLI028_Costerfield Operations_NI-43 101 Technical Report_2018_Rev1 6 February 2019
SRK Report Client Distribution Record
Project Number: PLI028
Report Title: Costerfield Operation, Victoria, Australia, NI 43-101 Report
Date Issued: 6 February 2019
Name/Title Company
Melanie McCarthy Mandalay Resources Corporation
Rev No. Date Revised By Revision Details
0 04/02/2019 Anne-Marie Ebbels Draft Report
1 06/02/2019 Anne-Marie Ebbels Final Report
This Report is protected by copyright vested in SRK Consulting (Australasia) Pty Ltd. It may not be reproduced
or transmitted in any form or by any means whatsoever to any person without the written permission of the
copyright holder, SRK.