
Network modeling links breast cancer susceptibility and centrosome dysfunction
12
Network modeling links breast cancer susceptibility and centrosome dysfunction Miguel Angel Pujana 1,2,16,17 , Jing-Dong J Han 1,2,16,17 , Lea M Starita 3,16,17 , Kristen N Stevens 4,17 , Muneesh Tewari 1,2,16 , Jin Sook Ahn 1,2 , Gad Rennert 5 , Vı ´ctor Moreno 6,7 , Tomas Kirchhoff 8 , Bert Gold 9 , Volker Assmann 10 , Wael M ElShamy 2 , Jean-Franc ¸ois Rual 1,2 , Douglas Levine 8 , Laura S Rozek 6 , Rebecca S Gelman 11 , Kristin C Gunsalus 12 , Roger A Greenberg 2 , Bijan Sobhian 2 , Nicolas Bertin 1,2 , Kavitha Venkatesan 1,2 , Nono Ayivi-Guedehoussou 1,2,16 , Xavier Sole ´ 7 , Pilar Herna ´ndez 13 , Conxi La ´zaro 13 , Katherine L Nathanson 14 , Barbara L Weber 14 , Michael E Cusick 1,2 , David E Hill 1,2 , Kenneth Offit 8 , David M Livingston 2 , Stephen B Gruber 4,6,15 , Jeffrey D Parvin 3,16 & Marc Vidal 1,2 Many cancer-associated genes remain to be identified to clarify the underlying molecular mechanisms of cancer susceptibility and progression. Better understanding is also required of how mutations in cancer genes affect their products in the context of complex cellular networks. Here we have used a network modeling strategy to identify genes potentially associated with higher risk of breast cancer. Starting with four known genes encoding tumor suppressors of breast cancer, we combined gene expression profiling with functional genomic and proteomic (or ‘omic’) data from various species to generate a network containing 118 genes linked by 866 potential functional associations. This network shows higher connectivity than expected by chance, suggesting that its components function in biologically related pathways. One of the components of the network is HMMR, encoding a centrosome subunit, for which we demonstrate previously unknown functional associations with the breast cancer– associated gene BRCA1. Two case-control studies of incident breast cancer indicate that the HMMR locus is associated with higher risk of breast cancer in humans. Our network modeling strategy should be useful for the discovery of additional cancer- associated genes. Combinations of mutated and/or aberrantly expressed tumor sup- pressor genes and oncogenes, or ‘cancer genes’, are thought to be responsible for most steps of cancer progression. Although funda- mental principles have emerged from the study of known cancer genes and their products, many questions remain unanswered. Notably, most cancer genes remain to be identified 1 . In addition, it is becoming increasingly clear that most genes and their products interact in complex cellular networks, the properties of which might be altered in cancer cells as compared with their unaffected counterparts 2 . Achieving a deeper understanding of cancer molecular mechanisms Received 31 March; accepted 2 August; published online 7 October 2007; doi:10.1038/ng.2007.2 1 Center for Cancer Systems Biology (CCSB) and 2 Department of Cancer Biology, Dana-Farber Cancer Institute and Department of Genetics, Harvard Medical School, 44 Binney St., Boston, Massachusetts 02115, USA. 3 Department of Pathology, Brigham and Women’s Hospital and Harvard Medical School, 77 Louis Pasteur Ave., Boston, Massachusetts 02115, USA. 4 Department of Epidemiology, University of Michigan, 109 Zina Pitcher Pl., Ann Arbor, Michigan 48109, USA. 5 CHS National Cancer Control Center, Department of Community Medicine and Epidemiology, Carmel Medical Center and Bruce Rappaport Faculty of Medicine, Technion, Haifa 34362, Israel. 6 Department of Internal Medicine, University of Michigan, 109 Zina Pitcher Pl., Ann Arbor, Michigan 48109, USA. 7 Department of Epidemiology and Cancer Registry, and Translational Research Laboratory, Catalan Institute of Oncology, IDIBELL, Gran Vı´a km 2.7, L’Hospitalet, Barcelona 08907, Spain. 8 Clinical Genetics Service, Department of Medicine, Memorial Sloan-Kettering Cancer Center, 1275 York Ave., New York, New York 10021, USA. 9 National Cancer Institute, Human Genetics Section, Laboratory of Genomic Diversity, Frederick, Maryland 21702, USA. 10 Center for Experimental Medicine, Institute of Tumor Biology, University Hospital Hamburg–Eppendorf, Martinistrasse 52, Hamburg 20246, Germany. 11 Department of Biostatistics and Computational Biology, Dana-Farber Cancer Institute and Department of Biostatistics, Harvard School of Public Health, 44 Binney St., Boston, Massachusetts 02115, USA. 12 Center for Comparative Functional Genomics, Department of Biology, New York University, 100 Washington Square East, New York, New York 10003, USA. 13 Translational Research Laboratory, Catalan Institute of Oncology, IDIBELL, Gran Vı ´a km 2.7, L’Hospitalet, Barcelona 08907, Spain. 14 Abramson Family Cancer Research Institute, University of Pennsylvania School of Medicine, 421 Curie Blvd., Philadelphia, Pennsylvania 19104, USA. 15 Department of Human Genetics, University of Michigan, 109 Zina Pitcher Pl., Ann Arbor, Michigan 48109, USA. 16 Present addresses: Bioinformatics and Biostatistics Unit, Translational Research Laboratory, Catalan Institute of Oncology, IDIBELL, Gran Vı´a km 2.7, L’Hospitalet, Barcelona 08907, Spain (M.A.P.); Institute of Genetics and Developmental Biology, Chinese Academy of Sciences, Datun Rd., Beijing 100101, China (J.-D.J.H.); Department of Genome Sciences, University of Washington, 1705 NE Pacific St., Seattle, Washington 98195, USA (L.M.S.); Human Biology Division, Fred Hutchinson Cancer Research Center, 1100 Fairview Ave. North, Seattle, Washington 98109, USA (M.T.); Harvard School of Public Health, Boston, Massachusetts 02115, USA (N.A.-G.); Department of Biomedical Informatics, Ohio State University Medical Center, 460 West 12th Ave., Columbus, Ohio 43210, USA (J.D.P.). 17 These authors contributed equally to this work. Correspondence should be addressed to M.V. ([email protected]), J.D.P. ([email protected]) or S.B.G. ([email protected]). 1338 VOLUME 39 [ NUMBER 11 [ NOVEMBER 2007 NATURE GENETICS ARTICLES © 2007 Nature Publishing Group http://www.nature.com/naturegenetics
-
Upload
dana-farber -
Category
Documents
-
view
0 -
download
0
Transcript of Network modeling links breast cancer susceptibility and centrosome dysfunction
Network modeling links breast cancer susceptibility andcentrosome dysfunctionMiguel Angel Pujana1,2,16,17, Jing-Dong J Han1,2,16,17, Lea M Starita3,16,17, Kristen N Stevens4,17,Muneesh Tewari1,2,16, Jin Sook Ahn1,2, Gad Rennert5, Vıctor Moreno6,7, Tomas Kirchhoff 8, Bert Gold9,Volker Assmann10, Wael M ElShamy2, Jean-Francois Rual1,2, Douglas Levine8, Laura S Rozek6,Rebecca S Gelman11, Kristin C Gunsalus12, Roger A Greenberg2, Bijan Sobhian2, Nicolas Bertin1,2,Kavitha Venkatesan1,2, Nono Ayivi-Guedehoussou1,2,16, Xavier Sole7, Pilar Hernandez13, Conxi Lazaro13,Katherine L Nathanson14, Barbara L Weber14, Michael E Cusick1,2, David E Hill1,2, Kenneth Offit8,David M Livingston2, Stephen B Gruber4,6,15, Jeffrey D Parvin3,16 & Marc Vidal1,2
Many cancer-associated genes remain to be identified to clarify the underlying molecular mechanisms of cancer susceptibilityand progression. Better understanding is also required of how mutations in cancer genes affect their products in the context ofcomplex cellular networks. Here we have used a network modeling strategy to identify genes potentially associated with higherrisk of breast cancer. Starting with four known genes encoding tumor suppressors of breast cancer, we combined gene expressionprofiling with functional genomic and proteomic (or ‘omic’) data from various species to generate a network containing 118genes linked by 866 potential functional associations. This network shows higher connectivity than expected by chance,suggesting that its components function in biologically related pathways. One of the components of the network is HMMR,encoding a centrosome subunit, for which we demonstrate previously unknown functional associations with the breast cancer–associated gene BRCA1. Two case-control studies of incident breast cancer indicate that the HMMR locus is associated withhigher risk of breast cancer in humans. Our network modeling strategy should be useful for the discovery of additional cancer-associated genes.
Combinations of mutated and/or aberrantly expressed tumor sup-pressor genes and oncogenes, or ‘cancer genes’, are thought to beresponsible for most steps of cancer progression. Although funda-mental principles have emerged from the study of known cancer genesand their products, many questions remain unanswered. Notably,
most cancer genes remain to be identified1. In addition, it is becomingincreasingly clear that most genes and their products interact incomplex cellular networks, the properties of which might be alteredin cancer cells as compared with their unaffected counterparts2.Achieving a deeper understanding of cancer molecular mechanisms
Received 31 March; accepted 2 August; published online 7 October 2007; doi:10.1038/ng.2007.2
1Center for Cancer Systems Biology (CCSB) and 2Department of Cancer Biology, Dana-Farber Cancer Institute and Department of Genetics, Harvard Medical School,44 Binney St., Boston, Massachusetts 02115, USA. 3Department of Pathology, Brigham and Women’s Hospital and Harvard Medical School, 77 Louis Pasteur Ave.,Boston, Massachusetts 02115, USA. 4Department of Epidemiology, University of Michigan, 109 Zina Pitcher Pl., Ann Arbor, Michigan 48109, USA. 5CHS NationalCancer Control Center, Department of Community Medicine and Epidemiology, Carmel Medical Center and Bruce Rappaport Faculty of Medicine, Technion, Haifa34362, Israel. 6Department of Internal Medicine, University of Michigan, 109 Zina Pitcher Pl., Ann Arbor, Michigan 48109, USA. 7Department of Epidemiology andCancer Registry, and Translational Research Laboratory, Catalan Institute of Oncology, IDIBELL, Gran Vıa km 2.7, L’Hospitalet, Barcelona 08907, Spain. 8ClinicalGenetics Service, Department of Medicine, Memorial Sloan-Kettering Cancer Center, 1275 York Ave., New York, New York 10021, USA. 9National Cancer Institute,Human Genetics Section, Laboratory of Genomic Diversity, Frederick, Maryland 21702, USA. 10Center for Experimental Medicine, Institute of Tumor Biology,University Hospital Hamburg–Eppendorf, Martinistrasse 52, Hamburg 20246, Germany. 11Department of Biostatistics and Computational Biology, Dana-Farber CancerInstitute and Department of Biostatistics, Harvard School of Public Health, 44 Binney St., Boston, Massachusetts 02115, USA. 12Center for Comparative FunctionalGenomics, Department of Biology, New York University, 100 Washington Square East, New York, New York 10003, USA. 13Translational Research Laboratory, CatalanInstitute of Oncology, IDIBELL, Gran Vıa km 2.7, L’Hospitalet, Barcelona 08907, Spain. 14Abramson Family Cancer Research Institute, University of PennsylvaniaSchool of Medicine, 421 Curie Blvd., Philadelphia, Pennsylvania 19104, USA. 15Department of Human Genetics, University of Michigan, 109 Zina Pitcher Pl., AnnArbor, Michigan 48109, USA. 16Present addresses: Bioinformatics and Biostatistics Unit, Translational Research Laboratory, Catalan Institute of Oncology, IDIBELL,Gran Vıa km 2.7, L’Hospitalet, Barcelona 08907, Spain (M.A.P.); Institute of Genetics and Developmental Biology, Chinese Academy of Sciences, Datun Rd., Beijing100101, China (J.-D.J.H.); Department of Genome Sciences, University of Washington, 1705 NE Pacific St., Seattle, Washington 98195, USA (L.M.S.); HumanBiology Division, Fred Hutchinson Cancer Research Center, 1100 Fairview Ave. North, Seattle, Washington 98109, USA (M.T.); Harvard School of Public Health,Boston, Massachusetts 02115, USA (N.A.-G.); Department of Biomedical Informatics, Ohio State University Medical Center, 460 West 12th Ave., Columbus, Ohio43210, USA (J.D.P.). 17These authors contributed equally to this work. Correspondence should be addressed to M.V. ([email protected]), J.D.P.([email protected]) or S.B.G. ([email protected]).
1 33 8 VOLUME 39 [ NUMBER 11 [ NOVEMBER 2007 NATURE GENETICS
ART I C LES©
2007
Nat
ure
Pub
lishi
ng G
roup
ht
tp://
ww
w.n
atur
e.co
m/n
atur
egen
etic
s

may therefore require global strategies aimed at modeling thefunctional interrelationships between genes and/or proteins (genes/proteins) as complex interdependent networks3.
Here we propose a complementary approach to systematicresequencing efforts4–6 for identifying cancer genes and/or proteins.This approach is based on global network modeling of functionalassociations between potential cancer genes and their products.
RESULTSA network modeling strategyMacromolecular networks can be modeled on the basis of both globalcorrelations observed among transcriptional profiling compendia,protein-protein interaction or ‘interactome’ networks, and genome-wide phenotypic profiling data sets7, and comparisons of ‘interolog’data sets from different organisms8. We combined these two strategiesto generate models of macromolecular networks that are possiblyperturbed in human cancer, starting from four known breast cancer–associated genes and their products—BRCA1 and BRCA2 (bothidentified by high-penetrance mutations)9–11 and ATM and CHEK2(both identified by low-penetrance mutations)12,13—referred to here-after as the ‘reference genes/proteins’ (Fig. 1). The strategy first
integrates coexpression profiles in human tissues and then integratesfunctional associations derived from various functional genomic andproteomic, or ‘omic’, data sets obtained in both humans and modelorganisms. This integrated network modeling strategy provides aranking system to classify potential network components from lowto high likelihood; the components are then functionally and geneti-cally tested.
Coexpression profilingTo initiate our search for genes that are likely to be functionallyassociated with the reference genes/proteins, we used a data setcontaining transcript abundance measurements for 9,214 humangenes in 101 samples originating from 43 healthy human tissues ororgans and three cell lines14. We determined Pearson correlationcoefficient (PCC) values between each of the four reference genesand all of the genes tested on the array. To determine the likelihood ofpredicting functional associations by this coexpression approach, wecurated published data from the scientific literature (until 1 October2004) on protein interactions involving any of the four referencehuman proteins. The resulting ‘literature interaction’ (LIT-Int) net-work contains 103 proteins and 129 functional associations (Fig. 2a
and Supplementary Table 1 online). Wedetermined that a PCC value of 4 0.4 cap-tures 36% of the LIT-Int functional associa-tions (Fig. 2b). Beyond this threshold, theLIT-Int pairs are enriched between two- andtenfold (depending on the control set used) incoexpressed pairs as compared with 10,000gene pairs generated randomly from the sameexpression data set.
To identify potential functional associationsinvolving all four reference genes, we focusedon those transcripts found in the ‘expressionintersection’ (XPRSS-Int) of the four coex-pression sets. The XPRSS-Int contains 164genes, of which 15 are also present in theLIT-Int data set (Fig. 2c and SupplementaryTable 2 online). To evaluate the significance ofthe XPRSS-Int set, we generated 200 ran-domly chosen sets of four genes, calculatedtheir transcriptional PCCs with each gene inthe array and measured their coexpressionintersection by using PCC 4 0.4 as the cutoff.This simulation showed that 88% (176/200)of the randomly generated sets do not overlapin coexpression at any level and that, at most,their intersection contains 20 genes (Fig. 2d).These results indicate that the identification of164 genes in the XPRSS-Int set could not beexpected by chance (empirical P o 0.005).
We demonstrated that XPRSS-Int genes arefunctionally related to the four reference genesby examining three types of shared character-istics. First, the XPRSS-Int set showed anenrichment of Gene Ontology (GO) termsalso present in the annotations for the refer-ence genes (Supplementary Table 3 online).Second, evolutionary conservation of coex-pression patterns was observed betweenorthologs of XPRSS-Int and reference genes,corresponding to 52 XPRSS-Int genes
Initial humangene set(9,214)
BRCA XPRSS-Int
(164)
Human tissues
Expressionprofiling
Gen
es Similarprofiles
ATM
BRCA1
CHEK2
BRCA2?
MDC1
Proteins
Proteininteractions
Pro
tein
s
BiochemicalComplex membershipsBinary
Expression changes in breast tumors
Phenotypicprofiling
Similar profiles
Phenotypes
Gen
es
Genes
Genetic interactions
Gen
es
Synthetic lethal
Suppression
Exp
ress
ion
leve
l
Tumor types
Cancer risk
Human and model organismsHuman
Upregulated
Downregulated
Figure 1 Outline for the generation of a BCN model.
NATURE GENETICS VOLUME 39 [ NUMBER 11 [ NOVEMBER 2007 1 33 9
ART I C LES©
2007
Nat
ure
Pub
lishi
ng G
roup
ht
tp://
ww
w.n
atur
e.co
m/n
atur
egen
etic
s

(Supplementary Fig. 1 online). Third, using an expression data set forthe analysis of breast tumor cell lines treated with various agonistsor antagonists of mammary cell growth and differentiation15, weobserved significant coexpression among 33 XPRSS-Int genes(Supplementary Table 2).
Expression changes in breast tumorsTo evaluate further the functional significance of the XPRSS-Int set,we reasoned that many XPRSS-Int genes might show expressionchanges in breast tumors arising from mutations in one of thereference genes. We compared the expression of each XPRSS-Int
gene in breast tumors from individuals with BRCA1 germline muta-tions (BRCA1mut) with that in ‘sporadic’ breast tumors16 (typicallygermline wild type (BRCA1wt)). Of the 132 XPRSS-Int single-probegenes (see Methods), 50 were upregulated and 9 were downregulated,as compared with an average of 18 upregulated and 22 downregulatedgenes in randomly generated sets (P o 0.01; Fig. 3, top right, andSupplementary Table 4 online).
A total of 66 XPRSS-Int genes showing expression changes inBRCA1mut tumors are shown as nodes in a coexpression network inwhich the length of the links, or ‘edges’, is inversely proportional to theexpression correlation (PCC value) for each reference gene (Fig. 3,
C11orf30
BRAPMAP2K3
MYC
PLK3KPNA2
CDC25AMSH2
TERF2MLH1NBS1
RAD50
RBBP8SMC1L1
MDM2
RFC1
BLM
E2F1
ATM
TP53
RAD51
STAT5A
PPARBP
ELK1
CCNB1
RFC2
RFC4
RFC1
CDK2
BARD1
NPM1ATR
CCND1
SMARCA4
JAK1
E2F4
JAK2
JUNB
CHEK1AKT1
CCNE1
LMO4
CLSPN
BRCA1
ABL1
ACACA
ARATF1
AURKA
BACH1
BAP1
BRCA2
CCNA2
CDC2
CHEK2
COBRA1CREBBP
CTBP1
EP300
ESR1
FANCA
FANCD2FHL2
HDAC1
HDAC2
MSH6
NUFIP1
RB1
RBBP4
RBBP7
RELASP1
STAT1
TUBG1
ZNF350
BCCIPBUB1BFANCGFLNA
HMG20B PCAF
PLK1
SHFM1
H2AFXMCM3
NFKBIA
PEX5
PRKDC
RAD9A
RFC2RFC4
RPA2
TERF1
TP53BP1
CDC25CNMI
RPA1
RPA2
RPA3
CDK4
CSNK2A1
MDC1
MADH3
DHX9XRCC5
MRE11A
G22P1
Biochemical interactionBinary protein interactionProtein complex membershipsBinary protein interaction and protein complex membershipsBiochemical interaction and binary protein interactionBiochemical interaction and protein complex membershipsBiochemical interaction, binary protein interaction,and protein complex memberships
103 proteins
129 functional associations
Reference proteinLIT-Int protein
a
AURKABLMCCNA2CDC2CSNK2A1MRE11AMSH2PRKDC
RB1RBBP4RBBP8RFC4RPA1SMC1L1STAT5A
BRCA11,649
ATM1,434
BRCA2423
CHEK2772
317
1,003 249
520
164
LIT-Int genesin the XPRSS-Int
cb
PCC
Pro
babi
lity
dens
ity LIT-Int gene pairs
BRCA2 – random
CHEK2 – random
ATM – random
BRCA1 – random
Random – random
–1.0 –0.8 –0.6 –0.4 –0.2 0.0 0.2 0.4 0.6 0.80.0
0.5
1.0
1.5
2.0
2.5
1.0
3.0
3.5
4.0
Gene set size
Nu
mb
er
of
tria
ls
0 16 32 48 64 80 96 112 128 144 160
0
50
100
150
200
XPRSS-Int
164
d
Figure 2 Generation of the XPRSS-Int data set. (a) LIT-Int network for ATM, BRCA1, BRCA2 and CHEK2. Proteins are represented by nodes and functional
associations by edges, as indicated in the insets (Supplementary Table 1 and Supplementary Methods). Multiple functional associations are indicated by
blended line colors. (b) Probability density distributions of transcriptional PCC values between gene pairs for each of the four reference genes and randomly
selected genes through 10,000 iterations (BRCA gene – random), for randomly selected gene pairs through 10,000 iterations (random – random), and for
gene pairs from the LIT-Int data set. (c) Expression intersection (XPRSS-Int) of the four reference coexpression sets using PCC 4 0.4. LIT-Int genes included
in the XPRSS-Int set are shown. (d) Distribution of the coexpression intersection for randomly chosen sets of four genes and comparison with the XPRSS-Int
set using PCC 4 0.4.
1 34 0 VOLUME 39 [ NUMBER 11 [ NOVEMBER 2007 NATURE GENETICS
ART I C LES©
2007
Nat
ure
Pub
lishi
ng G
roup
ht
tp://
ww
w.n
atur
e.co
m/n
atur
egen
etic
s
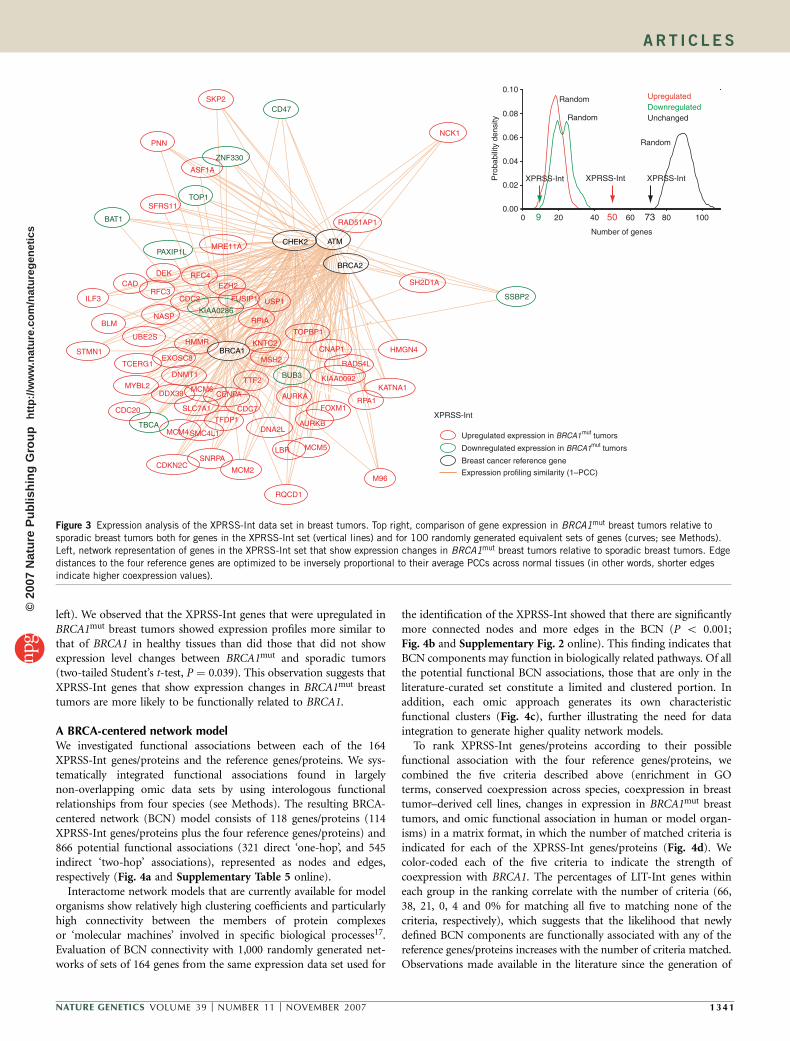
left). We observed that the XPRSS-Int genes that were upregulated inBRCA1mut breast tumors showed expression profiles more similar tothat of BRCA1 in healthy tissues than did those that did not showexpression level changes between BRCA1mut and sporadic tumors(two-tailed Student’s t-test, P ¼ 0.039). This observation suggests thatXPRSS-Int genes that show expression changes in BRCA1mut breasttumors are more likely to be functionally related to BRCA1.
A BRCA-centered network modelWe investigated functional associations between each of the 164XPRSS-Int genes/proteins and the reference genes/proteins. We sys-tematically integrated functional associations found in largelynon-overlapping omic data sets by using interologous functionalrelationships from four species (see Methods). The resulting BRCA-centered network (BCN) model consists of 118 genes/proteins (114XPRSS-Int genes/proteins plus the four reference genes/proteins) and866 potential functional associations (321 direct ‘one-hop’, and 545indirect ‘two-hop’ associations), represented as nodes and edges,respectively (Fig. 4a and Supplementary Table 5 online).
Interactome network models that are currently available for modelorganisms show relatively high clustering coefficients and particularlyhigh connectivity between the members of protein complexesor ‘molecular machines’ involved in specific biological processes17.Evaluation of BCN connectivity with 1,000 randomly generated net-works of sets of 164 genes from the same expression data set used for
the identification of the XPRSS-Int showed that there are significantlymore connected nodes and more edges in the BCN (P o 0.001;Fig. 4b and Supplementary Fig. 2 online). This finding indicates thatBCN components may function in biologically related pathways. Of allthe potential functional BCN associations, those that are only in theliterature-curated set constitute a limited and clustered portion. Inaddition, each omic approach generates its own characteristicfunctional clusters (Fig. 4c), further illustrating the need for dataintegration to generate higher quality network models.
To rank XPRSS-Int genes/proteins according to their possiblefunctional association with the four reference genes/proteins, wecombined the five criteria described above (enrichment in GOterms, conserved coexpression across species, coexpression in breasttumor–derived cell lines, changes in expression in BRCA1mut breasttumors, and omic functional association in human or model organ-isms) in a matrix format, in which the number of matched criteria isindicated for each of the XPRSS-Int genes/proteins (Fig. 4d). Wecolor-coded each of the five criteria to indicate the strength ofcoexpression with BRCA1. The percentages of LIT-Int genes withineach group in the ranking correlate with the number of criteria (66,38, 21, 0, 4 and 0% for matching all five to matching none of thecriteria, respectively), which suggests that the likelihood that newlydefined BCN components are functionally associated with any of thereference genes/proteins increases with the number of criteria matched.Observations made available in the literature since the generation of
RFC4
CENPA
SKP2
FOXM1
NASP
MCM4
MCM5LBR
RAD54L
KIAA0092MCM6
MCM2
CNAP1
DNMT1
RQCD1
TFDP1
SFRS11
TCERG1
CAD
TOPBP1
RFC3SH2D1A
MSH2
MRE11A
ILF3
PNN
AURKA
CDC7
DEK
NCK1
CDC20
DNA2L
UBE2S
RPIA
EZH2
SNRPA
STMN1
MYBL2
CDC2 USP1
EXOSC8
AURKB
CDKN2C
M96
SMC4L1
DDX39
TTF2
RAD51AP1
BLM
HMMR
FUSIP1
BAT1
TOP1
CD47
ZNF330
TBCA
KIAA0286
SSBP2
BUB3
PAXIP1LCHEK2
BRCA2
ATM
BRCA1
ASF1A
KNTC2HMGN4
KATNA1
RPA1SLC7A1
Upregulated expression in BRCA1mut tumors
Downregulated expression in BRCA1mut tumors
Breast cancer reference gene
Expression profiling similarity (1–PCC)
XPRSS-Int
0 20 40 60 80 1000.00
0.02
0.04
0.06
0.08
0.10
Pro
babi
lity
dens
ity
Number of genes
Random
XPRSS-Int
73509
XPRSS-IntXPRSS-Int
Random
Random
UpregulatedDownregulatedUnchanged
Figure 3 Expression analysis of the XPRSS-Int data set in breast tumors. Top right, comparison of gene expression in BRCA1mut breast tumors relative to
sporadic breast tumors both for genes in the XPRSS-Int set (vertical lines) and for 100 randomly generated equivalent sets of genes (curves; see Methods).
Left, network representation of genes in the XPRSS-Int set that show expression changes in BRCA1mut breast tumors relative to sporadic breast tumors. Edge
distances to the four reference genes are optimized to be inversely proportional to their average PCCs across normal tissues (in other words, shorter edges
indicate higher coexpression values).
NATURE GENETICS VOLUME 39 [ NUMBER 11 [ NOVEMBER 2007 1 34 1
ART I C LES©
2007
Nat
ure
Pub
lishi
ng G
roup
ht
tp://
ww
w.n
atur
e.co
m/n
atur
egen
etic
s

Randomly generated networkBCNBRCA reference gene/protein
Gene/protein in randomly generated network
S. cerevisiae Y2H binary protein interactionS. cerevisiae protein interaction (literature curated)S. cerevisiae protein complex membershipsS. cerevisiae orthologous reference gene co-expressionS. cerevisiae genetic interactionS. cerevisiae synthetic lethal interactionS. cerevisiae computational interactionC. elegans orthologous reference gene co-expressionC. elegans Y2H binary protein interaction (WI6)C. elegans gene phenoclusteringD. melanogaster Y2H binary protein interactionH. sapiens literature protein interaction (HPRD database)H. sapiens LIT-Int association
Functional associations
Direct associationIndirect association
CD81
CD63CDC25B
CSRP2
STK23
NFX1PA2G4 RPS20
ARF1
PSMD8
STIP1
FLJ22028
GPX4
CTNNB1DVL1
RAD51L3
XRCC3
PRP19
SKIIP FMNL1
HDGF
ACOT2
CITED1
CHD1L
CENTD2
CDR1CD34
CCNE2
CCL4CCL13
CACNG1
CACNB1
C7orf24
C19or f2
C10orf61
C1orf107
BTF3BCHE
ATXN10
APLP2
ANKRD7
ALS4ALDH3B2
AGTR1
ADD2COL5A1
COX6A1
COQ7
COPS6
CEP350
CRTAM
GUCY1A3
GREB1
GNSGLP1R
GH2GDF8
FXYD1
FOXJ1
FOXD1
FLJ20152
FGF12
FANCA
FAM48A
EPM2A
ELA2A
DSG3DNAJC8
DDX21
CYB561D2
CYB5CUGBP1
CTSZGYPE
CSKHBE1
HLA-DQA1
HLA-DOB
HCG8HCCS
HLA-DQB1
YY1W
NT5A
WHSC1
WDR7
UTYUBXD2
U2AF2
TRIM14
TPD52L2
TNFSF9
TNFRSF7
TMF1TLX2
TLL2TEAD1
TAF15
STK38
SRISNAP91
ZNF35
ZFRSND1
SR140
IFNGNEBL
NCDNMYH2
MT1FMRC1
MGEA5
MATN3
MAPK9
MAP4K5
M6PRBP1
LMO2LMO1
LASS6
KIAA0971
KIAA0284
KCND3
ITPR3
ITGB3BP
INPP5F
INPP5D
ILF3IL10RB
IGF2
IFRD1
NPY2R
LOC63928
MLXIP
LOC157627
MRFAP1L1
NRCAM
SLC9A3
SLC39A7
SLC25A11
SLC17A2
SKILSGK
SERPINF2
SERPINB5
SEMA3C
SEC11L1
SARDH
S100A2
RUNX1T1
RELNPTPRM
PRUNE
PRPS2
POLEPLP2
PFDN1
PEX1PDXK
PARVB
PADI2
SMPD2
SNAP25
OBSL1
SMG1
RP11298P3.3
ACYP1
KIAA0092
ILF3HMGN4
HMGN1
HDCMA18P
GTSE1
FUSIP1
FUBP1
FRG1FOXM1
FLJ14639
EXOSC8
CTCFCENPC1
CENPA
CDKN2C
CD47CD1C
CCNFCBX3
CASP2
BLMHAURKB
ATP11B
KIAA0922
KNTC1
ANP32E
KIAA0101
CEP1
ZWIN
T
ZNF43
ZNF131
WHSC1
USP1UBE2S
STMN1
SPBC25
SH2D1A
SFRS3
RIF1RHOH
PNNPMS2L3
PLK4PAXIP
1L
MPHOSPH9
M96MKI67
MPHOSPH1
RFC3
RFC4
MCM5
MCM6
RAD54L
RAD51C
CDC7L1 MCM2
TOP2A
BLM
CSNK2A1
SMC1L1
SMC2L1
SNRPA
MYBL2
DDX46
PRPF4
TCERG1
TOP1
MCM4
POLE
KIFC1
KNTC2
BRCA2
CDC2
TFDP1
CHEK2
BRCA1
ATM
RB1
CCNA2
PRKDC
NFYB
RAD51AP11
PCNAPOLA
LMNB1
RPA1
RRM1
SMC4L1XPO1
ESPL1FLJ11712
PPP1CC
CNOT3
PRPS1
IDH3B
NCK1
RQCD1
SNRPB
MAT2A
TBCADUT
KATNA1
ZNF330UBE2C
SLC7A1
TCF3
SSBP2
HMGB2
ABCB 7
CAD
DEK
SFRS11
EIF3S3
KIAA0286
DNA2L
POLR2B
AATF
RAD21
MSH2
CSPG6
SEC31L1
ASF1ACDC20
CPSF4
TIMELESS
SNRPA1
NASP
EZH2
H2AFV
RBBP4
MRE11A
KIAA018 6
BUB3
PSIP2
TFDP2
APPBP1
TTF2
UNG
TOPBP1
MAD2L1
AURKA
TMPO
CHAF1A
STAT5A
DNMT1
SKP2
JJAZ1
LBR
RECQL
HMMR
TAF11
PPP2R5C
DCP2
DHFR
METAP1
BAT1
DDX39
PAICS
RPIA
USP49
RBBP8
TRIP3
DNAJC9
FLJ10719
CNAP1
COPS3
XPRSS-Int gene/protein
a b
Number of nodes or edges
Pro
babi
lity
dens
ity
Number of nodes in main component
Number of edges in main component
Randomlygeneratednetworks
227
BCN
0 50 100 150 200
0.00
0.01
0.02
0.03
0.04
86
BCN
HM
GB
2A
NP
32E
HM
GN
1JJ
AZ
1P
AIC
SA
AT
F
SP
BC
25
EIF
3S3
AB
CB
7T
MP
OC
BX
3S
NR
PB
TR
IP3
CP
SF
4B
LMH
ME
TA
P1
PP
P2R
5CA
CY
P1
KIA
A09
22F
LJ14
639
CO
PS
3Z
NF
131
GT
SE
1P
RP
S1
SE
C31
L1
CE
P1
RIF
1T
CF
3F
UB
P1
TA
F1
1C
NO
T3
XP
O1
PM
S2L
3C
TC
FF
RG
1U
SP
49
CE
NP
C1
DD
X46
PO
LR2B
CA
SP
2S
FR
S3
IDH
3BH
DC
MA
18P
DC
P2
CD
1CA
TP
11B
ZN
F43
KIA
A01
01C
EN
PA
RP
IAZ
WIN
TD
NM
T1
EX
OS
C8
KIA
A01
86D
DX
39H
2AF
VS
NR
PA
1S
LC7A
1LM
NB
1U
SP
1A
PP
BP
1F
US
IP1
FLJ
1171
2K
IAA
0092
PA
XIP
1L
LBR
UN
GP
RP
F4
CA
DD
NA
JC9
ILF
3W
HS
C1
CC
NF
BA
T1
MP
HO
SP
H9
RQ
CD
1A
RH
HH
MG
N4
KIF
C1
CS
NK
2A1
TF
DP
2M
96N
FY
BS
H2D
1AF
OX
M1
PN
NP
SIP
1C
D47
ST
AT
5AS
SB
P2
NC
K1
XPRSS-Int genes/proteins (n = 164)
LIT-IntHMMR interactome
0.4 1.0
PCC-BRCA1
Criteria :
GO terms enrichment -Orthologs genes coexpression -
Breast tumor cell lines genes coexpression -BRCA1mut expression level change -
BCN-references functional association -
KN
TC
2T
IME
LES
SD
UT
ES
PL1
MC
M6
CD
C7L
1S
MC
1L1
RB
BP
8E
ZH
2P
CN
AB
UB
3R
AD
51C
TO
PB
P1
MC
M4
CC
NA
2D
EK
RB
BP
4A
UR
KB
CD
C20
RA
D2
1P
RK
DC
RA
D51
AP
1R
AD
54L
ST
MN
1T
OP
1A
SF
1A
KA
TN
A1
RB
1
HM
MR
RR
M1
MS
H2
TO
P2A
SM
C4L
1R
FC
4M
YB
L2
CS
PG
6T
FD
P1
MC
M5
RP
A1
MR
E11
A
BL
M
CD
C2
RF
C3
AU
RK
A
TT
F2
MA
D2L
1K
IAA
028
6
FLJ
1071
9C
HA
F1A
SM
C2L
1N
AS
PD
NA
2LT
CE
RG
1U
BE
2SU
BE
2CC
NA
P1
SN
RP
AK
NT
C1
TB
CA
PP
P1C
CC
DK
N2
CM
CM
2M
KI6
7D
HF
RP
OLA
SF
RS
11
MP
HO
SP
H1
MA
T2A
PLK
4R
EC
QL
ZN
F33
0P
OLE
SK
P2
d
BCN S. cerevisiaesynthetic lethal interactions
BCN D. melanogasterY2H binary protein interactions c
DNA repair DNA transcription
RAD54L
MYBL2
CDC2PCNA
FLJ11712CNOT3
PRPS1
NCK1
RQCD1
SNRPB
MAT2A
KATNA1
ZNF330UBE2C
SLC7A1
TCF3
SSBP2
HMGB2
ABCB 7
CAD
DEK
SFRS11
EIF3S3
KIAA0286
CDC20
PSIP2
USP49
TRIP3
PPP1CC
IDH3B
RFC3
CSNK2A1
LMNB1
TBCADUT
RFC3
RAD54L
CDC7L1
TOP2A
BLM
SNRPA
MYBL2
PRPF4
TOP1
POLE
KIFC1
KNTC2
CDC2 CHEK2
NFYB
PCNAPOLARPA1
RQCD1
DUT
RAD21
MSH2
SEC31L1
ASF1ACDC20
TIMELESS
SNRPA1
MRE11AUNG
MAD2L1
AURKAPPP2R5C
RPIA RECQL
RAD51C
CSNK2A1RFC4
RFC3
MCM5
MCM6
MCM2
TOP2A
SMC2L1
MCM4
CDC2
PCNAPOLA
LMNB1
RPA1
RRM1
SMC4L1XPO1
ESPL1RFC4
POLE
DNA replication
BCN C. elegansgene phenoclustering
F44B9.6LIN-36
C39E9.14dli-1
F56A3.4spd-5
ZK593.5dnc-1
C28H8.12dnc-2
K04C2.4BRD-1
C36A4.8BRC-1
ZK678.1LIN-15A
BRCA1
BARD1
ZK418.4LIN-37
K07A1.12LIN-53
RBBP4
T05C12.6MIG-5
T09A5.2KIF1C
C. elegans tac-1functional associations
F22B5.7zyg-9
Y54E2A.3tac-1/TAC-1
CNAP1
COPS3W07B3.2
Y2H protein-protein interactionGene phenoclustering
Figure 4 Generation of the BCN and ranking of XPRSS-Int genes/proteins. (a) Left, 13 omic data sets were integrated into the XPRSS-Int data set to
generate the BCN. Edges represent direct ‘one-hop’ (unbroken lines) or indirect ‘two-hop’ (corresponding to two XPRSS-Int genes/proteins connected
through a non–XPRSS-Int gene/protein; broken lines) functional associations. Right, example of a network that was randomly generated with the algorithm
in b. Y2H, yeast two-hybrid. (b) Number of nodes (genes/proteins) and edges (functional associations) included in the main giant component of networks
randomly generated through 1,000 iterations (curves) and in the BCN (vertical lanes). To avoid the biases of an a priori selection of references and
subjective data compilation, the four human reference genes/proteins and all edges connecting them in the BCN, in addition to the C. elegans phenotypicprofiling data, were excluded from this analysis. (c) Three left panels, GO terms annotations reveal functional clusters contained in distinct omic data sets
used to generate the BCN. Right panel, functional associations of the C. elegans tac-1 gene and TAC-1 protein with connections to BCN genes/proteins.
(d) Five criteria were integrated to estimate the overall functional significance of XPRSS-Int genes/proteins relative to breast cancer reference genes/proteins.
XPRSS-Int genes are clustered according to the number of criteria they match (from 5 to 0) and then ordered within clusters according to their average
PCC value for BRCA1 (PCC-BRCA1). LIT-Int genes are shown in purple. Genes shown in red encode proteins that are also present in the HMMR-centered
interactome (Fig. 5a).
1 34 2 VOLUME 39 [ NUMBER 11 [ NOVEMBER 2007 NATURE GENETICS
ART I C LES©
2007
Nat
ure
Pub
lishi
ng G
roup
ht
tp://
ww
w.n
atur
e.co
m/n
atur
egen
etic
s

the LIT-Int data set (1 October 2004) support the hypothesis that theBCN points to numerous functional associations with known breastcancer genes/proteins. Since we generated LIT-Int, 20 proteins havebeen newly described to have a functional relationship with at least oneof the reference genes/proteins, and 4 of these proteins (20%; detailedin Supplementary Table 2) are present in the XPRSS-Int (B10-foldincrease relative to chance); this percentage is similar to that deter-mined above for LIT-Int proteins in the XPRSS-Int data set.
To investigate predictions based on the BCN model, we looked fornew potential connections between different biological processes. Thehighest-ranking connection involves a TACC family member18,HMMR, which encodes the hyaluronan-mediated motility receptor19
(HMMR, also known as RHAMM). HMMR has the highest PCCcoexpression value relative to BRCA1 (0.90; Fig. 3). In itself, the highPCC of HMMR with BRCA1 might be a substantial indicator of afunctional association between the two genes or gene products;however, it is the integration of other types of relationships thatpoints to HMMR beyond the possible false-positive discovery rateobtained by profiling similarity analysis. The HMMR gene productconnects BRCA1 and RPPB4 (also known as RBAP48, pRb andBRCA1-interacting protein) by binary physical interactions in theBCN (Fig. 4c, right), and it matches four of the five functionalsignificance criteria (Fig. 4d). A protein-protein physical interactionidentified by yeast two-hybrid screening predicts an associationbetween the TAC-1 and BRD-1 Caenorhabditis elegans proteins,orthologs of TACCs and BARD1, respectively (refs. 20,21). Clues tothe function of TACCs also come from the phenotypic profiling of
C. elegans genes17, which identifies a phenocluster of genes (Fig. 4c,right) whose inactivation is linked to microtubule-instability pheno-types, particularly centrosome dysfunction22–24. Observations inhuman cells also indicate that HMMR may have a potential role incentrosomal functions18,25. Considered together, these observationssuggest that HMMR plays a role in centrosome function in conjunc-tion with BRCA1.
New BRCA functional associationsGeneration of an HMMR-centered interactome map through yeasttwo-hybrid screens identified a network of 31 proteins and inter-actions between them (Fig. 5a). Several of these interactions werevalidated through coaffinity purification of exogenously expressedfusion proteins and coimmunoprecipitation of endogenous proteins(Supplementary Figs. 3–5 online). Notably, among interactors ofHMMR, CSPG6 cohesin and MAD1L1 mitotic spindle-assemblycheckpoint protein are also present in the BCN, further illustratinghow the BCN is a source of testable associations with breast referencegenes/proteins, and the endogenous CSPG6 and BRCA1 proteins forma complex in 293 cells (Fig. 5b). In addition to the direct associationbetween MAD1L1 and HMMR, we also identified MAD1L1-BRCA1endogenous protein complexes (Fig. 5b). The identification of severalinteractors of HMMR as members of BRCA1 protein complexessuggests that HMMR is a genuine component of a BRCA1 functionalmodule involved in centrosomal function.
Consistent with the indirect evidence described above, HMMR andBRCA1 were found to associate in endogenous protein complexes in
Figure 5 HMMR-centered interactome model. (a) Genes/proteins are connected by functional associations, eachrepresented by a differently colored edge as summarized in the inset. Only functional associations between
human genes/proteins are shown. Protein function assignment is based on the literature or on the known
function of constituent protein domains. Protein names in red are BCN components first identified by the
XPRSS-Int, and those in blue correspond to BCN bridging genes/proteins. co-IP, coimmunoprecipitation;
co-AP, coaffinity purification. (b) Top, endogenous coimmunoprecipitation of CSPG6 and BRCA1, and SMC1L1
and BRCA1 in 293 cells. Molecular masses are indicated on the left. The antibodies used for each
coimmunoprecipitation experiment are given in parentheses. IB, immunoblot; Wce, whole-cell extract; IgG,
normal purified immunoglobulin negative controls (G, goat; M, mouse; R, rabbit). Bottom, endogenous coimmunoprecipitation of MAD1L1 and BRCA1 or
BRCA2, and HMMR and BRCA1 or BRCA2 in U2OS cells. (c) Endogenous coimmunoprecipitation of HMMR and BRCA1 in non-synchronized HeLa S3 cells.
(d) Cell cycle synchronization and coimmunoprecipitation assays in HeLa S3 cells.
NATURE GENETICS VOLUME 39 [ NUMBER 11 [ NOVEMBER 2007 1 34 3
ART I C LES©
2007
Nat
ure
Pub
lishi
ng G
roup
ht
tp://
ww
w.n
atur
e.co
m/n
atur
egen
etic
s

several cell lines (293, HeLa (Fig. 5c) and U2OS cell lines) tested.Reciprocal coimmunoprecipitation experiments were hampered byunspecific binding of HMMR to secondary antibodies. Because theHMMR-MAD1L1 protein interaction was detectable most stronglyduring M phase, and because the HMMR-BRCA1 protein complexassociation seemed to be greater during the G2/M and M phases, weexamined whether a MAD1L1-BRCA1 association also occurs inM phase. MAD1L1 and BRCA1 were found together in endogenousprotein complexes as cells entered mitosis (Fig. 5d). Consistent withthe participation of BRCA1 and BRCA2 in the regulation of mitoticprogression26,27, we found that BRCA2 was also present in HMMRand MAD1L1 mitotic complexes (Fig. 5b,c). Notably, HMMR waspreviously identified among other proliferation-associated genes to betightly coexpressed with BRCA2 in breast carcinomas28. We did notobserve such cell cycle–dependent protein associations for CSPG6,which suggests that the HMMR-BRCA1 and CSPG6-BRCA1 com-plexes have different cellular outcomes. In summary, by experimen-tally testing BCN predictions, we identified three previously unknownprotein associations with breast cancer tumor suppressors, therebyderiving a centrosomal interactome model that has several othercandidates, some of which are also found in the BCN (KNTC2 (alsoknown as HEC1), MAD2L1 and SEC31L1).
Because ubiquitination has an important role in the regulationof centrosome duplication29, both BRCA1 and HMMR have beenlocalized to centrosomes and mitotic spindle poles18,26, and HMMR-BRCA1 protein complexes are most prominent during G2/M, weexamined the possibility that HMMR might be a substrate ofthe BRCA1-BARD1 E3 ubiquitin ligase activity30. HMMR wasfound to be efficiently polyubiquitinated by the BRCA1-BARD1heterodimer in vitro (Fig. 6a, left). In vivo ubiquitination of HMMRwas then observed after co-transfection of glutathione S-transferase(GST)-conjugated HMMR and hemagglutinin (HA)-conjugatedubiquitin into 293 cells (Fig. 6a, right). These observations suggestthat HMMR has a role in centrosomal function mediated byBRCA1-BARD1 polyubiquitination.
HMMR-BRCA1 and centrosome dysfunctionTo understand better the functional association between HMMR andBRCA1 in vivo, we examined phenotypes mediated by short interfer-ing RNA (siRNA). In agreement with changes observed in HMMRexpression in BRCA1mut tumors relative to sporadic breast tumors,depletion of BRCA1 resulted in an upregulation of HMMR and itsproduct in immortalized human mammary epithelial cells (HME/TERT cells; Supplementary Fig. 6 online). Centrosome hypertrophyand amplification were observed in cells depleted of either BRCA1 orHMMR (Fig. 6b and Supplementary Figs. 7 and 8 online). Theseeffects on centrosome numbers are similar to those previouslyobserved on functional inhibition or depletion of BRCA1 (ref. 31).The breast tumor–derived cell line Hs578T and the HME/TERT cellsshowed higher levels of centrosome amplification on depletion ofHMMR or BRCA1 than either the HeLa or U2OS cell lines. Notably, agenetic interaction between HMMR and BRCA1 was observed inHME/TERT and Hs578T cells. In these cells, simultaneous depletionof HMMR and BRCA1 suppressed the centrosome abnormalityphenotypes observed on depletion of either single transcript (Fig. 6c).
To investigate further the relationship between HMMR, BRCA1and centrosome dysfunction, we examined the role of aurora-Akinase (AURKA, ranked third in the XPRSS-Int) because, first, itsC. elegans ortholog is required for centrosomal localization of TAC-1(refs. 22–24); second, it associates with BRCA1 in the regulation of theG2/M transition32; and third, when overexpressed in the mammary
epithelium, it induces centrosome amplification and genetic instabilitybefore tumorigenesis33. Consistent with an association in mitosis,endogenous AURKA-HMMR protein complexes were identified ingreater amounts in nocodazole-arrested cells (Fig. 6d). Immunofluor-escence analysis of HMMR in BRCA1mut cells showed mislocalizationrelative to g-tubulin (TUBG1); this mislocalization coincided withthat of AURKA, as revealed by multiple foci, some showing detectableHMMR and others not (Fig. 6e and Supplementary Fig. 9 online).No mislocalization of HMMR or AURKA on depletion of BRCA1 bysiRNA was observed in the cell lines studied, a finding that could bedue to partial BRCA1 depletion or, alternatively, to the fact thatHMMR mislocalization results from an indirect effect mediated byoverexpression of AURKA. As shown above, AURKA and HMMRexpression is upregulated in BRCA1mut breast tumors relative tosporadic breast tumors (Fig. 3) and AURKA and HMMR seem tobe overexpressed and mislocalized in BRCA1mut cell lines (Supple-mentary Fig. 9). Overexpression of AURKA in HME/TERT(BRCA1wt) cells was sufficient to cause the overexpression and mis-localization of HMMR (Fig. 6e). These observations, together with thegenetic interaction identified between HMMR and BRCA1, suggestthat overexpression of HMMR and/or its biochemical modificationresulting in centrosome amplification, which have been previouslyassociated in myeloma25, are early somatic molecular events thatcontribute to breast tumorigenesis.
HMMR and breast cancer riskThe genotyping of three HMMR haplotype-tagging SNPs (htSNPs) in923 individually matched case-control pairs from a population-basedstudy of incident breast cancer in northern Israel identified statisticallysignificant associations for each htSNP (Supplementary Table 6online). All three individual htSNPs were associated with risk ofbreast cancer and were consistent with an additive model showingincreasing risk with each additional risk-tagging allele. For example,each copy of the A allele of rs10515860 was associated with a 32%increase in risk (odds ratio (OR) ¼ 1.32, 95% confidence interval(CI) 1.09–1.60; P ¼ 0.004). Each copy of the A-C-A haplotype(rs7712023-rs299290-rs10515860) estimated by the expectation max-imization method increased a woman’s risk by 33% (unadjustedOR ¼ 1.33 for an additive model, 95% CI 1.08–1.63; P ¼ 0.007).The single intronic htSNP rs10515860 essentially captured all of thevariation associated with risk, which suggests that the A allele ofrs10515860 is likely to be in linkage disequilibrium with a variant thatconfers risk of breast cancer.
Further study of this allele showed that the risk of breast cancerassociated with the HMMR locus was not accounted for by thepresence of BRCA1 or BRCA2 mutations (data not shown). Consistentwith models of inherited susceptibility to breast cancer34, rs10515860A allele carriers of age 40 years and over were 1.22 times as likely todevelop breast cancer than were controls (OR ¼ 1.22, 95% CI1.02–1.46; P ¼ 0.026), whereas carriers younger than 40 years were2.7 times as likely to develop breast cancer (OR ¼ 2.73, 95% CI 1.25–5.97; P ¼ 0.012). Risk was not restricted to Ashkenazi Jews and wassimilar in magnitude and frequency for Sephardi Jews andChristian and Muslim Arabs, in addition to Bedouin, Druze andCherkazi populations.
We investigated this association in an independent AshkenaziJewish cohort, ascertained at Memorial Hospital in New York,comprising 247 individuals with breast cancer and a family historyof three or more cases of breast cancer but no identified BRCA1 orBRCA2 mutation and 298 women with no personal or family historyof breast cancer35. Genotyping SNPs across the complete 5q34 region
1 34 4 VOLUME 39 [ NUMBER 11 [ NOVEMBER 2007 NATURE GENETICS
ART I C LES©
2007
Nat
ure
Pub
lishi
ng G
roup
ht
tp://
ww
w.n
atur
e.co
m/n
atur
egen
etic
s

identified associations with P values lower than 10�3 for the rs1458338and rs12658549 SNPs located proximally to the HMMR locus (Sup-plementary Table 7 online). Association with these SNPs was alsoidentified in the Ashkenazi subgroup of the Israeli case-control study(rs1458338: OR ¼ 2.87, 95% CI 1.06–7.79; rs12658549: OR ¼ 2.73,95% CI 1.09–6.85; P ¼ 0.030 and 0.032, respectively), whichsuggested that these SNPs are in linkage disequilibrium with geneticvariation 5¢ upstream of the HMMR coding region in a‘gene desert’ region spanning B1 Mb proximally. The G-C-A-T-Ghaplotype was also significantly associated with risk of breast
cancer (Supplementary Table 8 online), which suggests that theremay be two discrete risk variants that can be ascertained ondifferent haplotypes.
To confirm the association between genetic variation in HMMRand early-onset breast cancer, we genotyped rs10515860 in a thirdindependent sample of 997 cases and 464 controls (212 controls withage data available) derived from the New York Cancer Project35. Wefound a significant association of a 12-month-earlier age of onset inhomozygous cases as compared with controls in this cohort(OR ¼ 1.56, 95% CI 1.02–1.95; P ¼ 0.009), consistent with the
b
e
30
40
20
10
100
0
HeLa Hs578THME/TERTU20S
Per
cent
cel
ls w
ith c
entr
osom
eam
plifi
catio
n (n
> 2
)
U C- H B H+B U C- H B H+B U C- H B H+B U C- H B H+B
50
c
Negative control siRNA HMMR siRNA
BRCA1 siRNAHMMR siRNA / GFP-Centrin
TUBG1 DAPI mergeHMMR
HME/TERT
HMMR DAPI mergeAURKA
HMMR DAPI mergeGFP-AURKA transfected
f2
0
–2
–4
Nor
mal
ized
exp
ress
ion
(log 10
) 28–35 36–40 41–45 46–51 52–54
Age at diagnosis
NM_012485NM_012484
HMMR siRNA
BRCA1 siRNA
a
+ + + + +
BRCA1
111
71
kDa
HMMR
– + + – –
– – + + + BARD1
– – – + – BRCA1 (AA 1-500)
– – – – + BRCA1 (AA 1-300)
Wce (IMR90)
HMMR-polyUb
111
71
WcekDa
IB: GST
Nonspecific
GST-HMMRHA-Ub
111
71+ +–– + +
GST co-AP
IB: HA
IB: HMMR(aIHABP)
dkDa W
ce
49Ig
G RHM
MR
IgG R
HMM
R
NocodazoleDMSO
IB: AURKA (aIAK1-4)
IP
HCC1937(BRCA1mut)
(BRCA1mut)HCC1937
HME/TERT(BRCA1wt)
(BRCA1wt)
Figure 6 BRCA1-BARD1–mediated polyubiquitination, HMMR-BRCA1 and HMMR-AURKA interactions and centrosome dysfunction. (a) Left, HMMR
in vitro polyubiquitination analysis. Right, detection of polyubiquitinated HMMR by co-transfection of GST-HMMR and HA-ubiquitin into 293 cells.
(b) Immunofluorescence microscopy results for g-tubulin (TUBG1) and GFP-centrin are shown in Hs578T cells transfected with different siRNAs. White
arrowheads indicate normal centrosomes; yellows arrowheads indicate centrosome amplification or hypertrophy. (c) Percentage of cells showing centrosome
amplification in HeLa, U2OS, HME/TERT and Hs578T cells. U, untreated cells; C-, negative control siRNA; H, HMMR siRNA; B, BRCA1 siRNA; H+B,
HMMR plus BRCA1 siRNAs. Immunofluorescence microscopy results and evaluation of siRNA-mediated depletion are provided in Supplementary Figures 7
and 8. (d) Endogenous coimmunoprecipitation of HMMR and AURKA in U2OS cells treated with DMSO or nocodazole. (e) Immunofluorescence microscopy
results for HMMR, TUBG1, AURKA, GFP-AURKA and DAPI counterstaining in HME/TERT (BRCA1wt) and HCC1937 (BRCA1mut) cells. Yellow arrowheads
indicate protein cellular mislocalization. A cell overexpressing GFP-AURKA shows more endogenously expressed HMMR than neighbor cells that do not
express GFP-AURKA, identified by DAPI staining. Normal colocalization of HMMR and AURKA in HME/TERT cells and analysis of additional BRCA1mut
cell lines are shown in Supplementary Figure 9. (f) Early age at diagnosis is associated with higher HMMR expression in primary breast tumors ofindividuals without BRCA1 or BRCA2 mutations, as assessed with a published data set16 (P ¼ 0.02 and 0.07 for microarray probes NM_012484 and
NM_012485, respectively).
NATURE GENETICS VOLUME 39 [ NUMBER 11 [ NOVEMBER 2007 1 34 5
ART I C LES©
2007
Nat
ure
Pub
lishi
ng G
roup
ht
tp://
ww
w.n
atur
e.co
m/n
atur
egen
etic
s
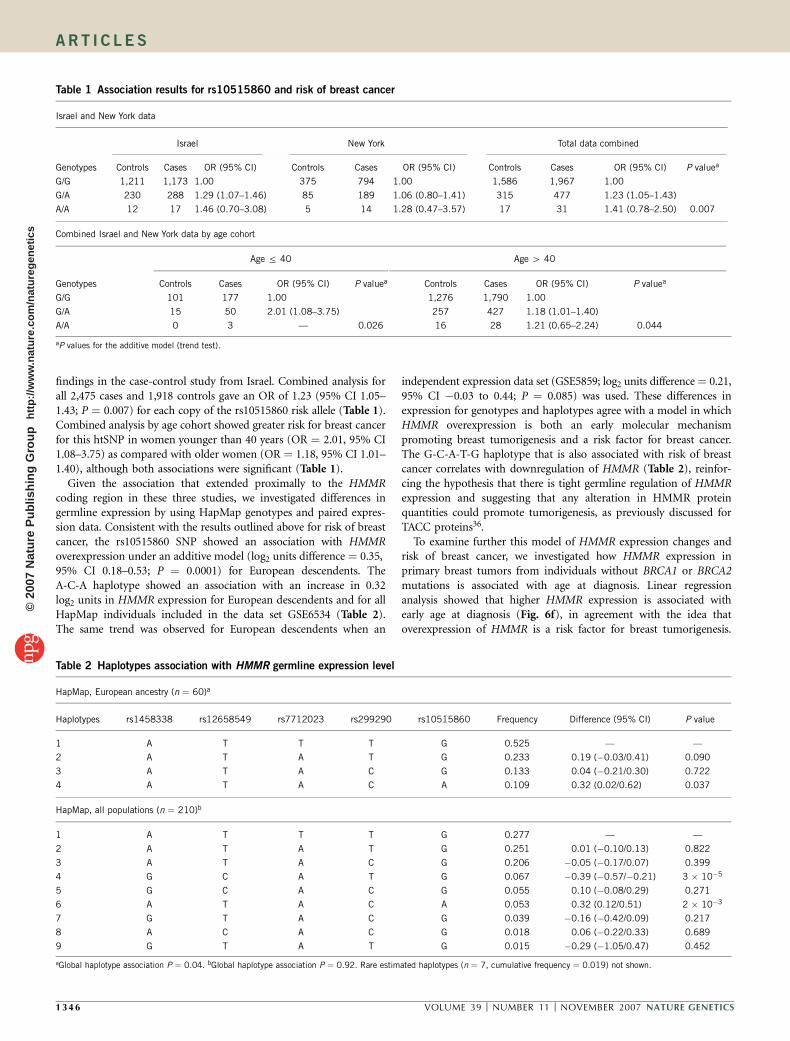
findings in the case-control study from Israel. Combined analysis forall 2,475 cases and 1,918 controls gave an OR of 1.23 (95% CI 1.05–1.43; P ¼ 0.007) for each copy of the rs10515860 risk allele (Table 1).Combined analysis by age cohort showed greater risk for breast cancerfor this htSNP in women younger than 40 years (OR ¼ 2.01, 95% CI1.08–3.75) as compared with older women (OR ¼ 1.18, 95% CI 1.01–1.40), although both associations were significant (Table 1).
Given the association that extended proximally to the HMMRcoding region in these three studies, we investigated differences ingermline expression by using HapMap genotypes and paired expres-sion data. Consistent with the results outlined above for risk of breastcancer, the rs10515860 SNP showed an association with HMMRoverexpression under an additive model (log2 units difference ¼ 0.35,95% CI 0.18–0.53; P ¼ 0.0001) for European descendents. TheA-C-A haplotype showed an association with an increase in 0.32log2 units in HMMR expression for European descendents and for allHapMap individuals included in the data set GSE6534 (Table 2).The same trend was observed for European descendents when an
independent expression data set (GSE5859; log2 units difference ¼ 0.21,95% CI �0.03 to 0.44; P ¼ 0.085) was used. These differences inexpression for genotypes and haplotypes agree with a model in whichHMMR overexpression is both an early molecular mechanismpromoting breast tumorigenesis and a risk factor for breast cancer.The G-C-A-T-G haplotype that is also associated with risk of breastcancer correlates with downregulation of HMMR (Table 2), reinfor-cing the hypothesis that there is tight germline regulation of HMMRexpression and suggesting that any alteration in HMMR proteinquantities could promote tumorigenesis, as previously discussed forTACC proteins36.
To examine further this model of HMMR expression changes andrisk of breast cancer, we investigated how HMMR expression inprimary breast tumors from individuals without BRCA1 or BRCA2mutations is associated with age at diagnosis. Linear regressionanalysis showed that higher HMMR expression is associated withearly age at diagnosis (Fig. 6f), in agreement with the idea thatoverexpression of HMMR is a risk factor for breast tumorigenesis.
Table 2 Haplotypes association with HMMR germline expression level
HapMap, European ancestry (n ¼ 60)a
Haplotypes rs1458338 rs12658549 rs7712023 rs299290 rs10515860 Frequency Difference (95% CI) P value
1 A T T T G 0.525 — —
2 A T A T G 0.233 0.19 (�0.03/0.41) 0.090
3 A T A C G 0.133 0.04 (�0.21/0.30) 0.722
4 A T A C A 0.109 0.32 (0.02/0.62) 0.037
HapMap, all populations (n ¼ 210)b
1 A T T T G 0.277 — —
2 A T A T G 0.251 0.01 (�0.10/0.13) 0.822
3 A T A C G 0.206 �0.05 (�0.17/0.07) 0.399
4 G C A T G 0.067 �0.39 (�0.57/�0.21) 3 � 10�5
5 G C A C G 0.055 0.10 (�0.08/0.29) 0.271
6 A T A C A 0.053 0.32 (0.12/0.51) 2 � 10�3
7 G T A C G 0.039 �0.16 (�0.42/0.09) 0.217
8 A C A C G 0.018 0.06 (�0.22/0.33) 0.689
9 G T A T G 0.015 �0.29 (�1.05/0.47) 0.452
aGlobal haplotype association P ¼ 0.04. bGlobal haplotype association P ¼ 0.92. Rare estimated haplotypes (n ¼ 7, cumulative frequency ¼ 0.019) not shown.
Table 1 Association results for rs10515860 and risk of breast cancer
Israel and New York data
Israel New York Total data combined
Genotypes Controls Cases OR (95% CI) Controls Cases OR (95% CI) Controls Cases OR (95% CI) P valuea
G/G 1,211 1,173 1.00 375 794 1.00 1,586 1,967 1.00
G/A 230 288 1.29 (1.07–1.46) 85 189 1.06 (0.80–1.41) 315 477 1.23 (1.05–1.43)
A/A 12 17 1.46 (0.70–3.08) 5 14 1.28 (0.47–3.57) 17 31 1.41 (0.78–2.50) 0.007
Combined Israel and New York data by age cohort
Age r 40 Age 4 40
Genotypes Controls Cases OR (95% CI) P valuea Controls Cases OR (95% CI) P valuea
G/G 101 177 1.00 1,276 1,790 1.00
G/A 15 50 2.01 (1.08–3.75) 257 427 1.18 (1.01–1.40)
A/A 0 3 — 0.026 16 28 1.21 (0.65–2.24) 0.044
aP values for the additive model (trend test).
1 34 6 VOLUME 39 [ NUMBER 11 [ NOVEMBER 2007 NATURE GENETICS
ART I C LES©
2007
Nat
ure
Pub
lishi
ng G
roup
ht
tp://
ww
w.n
atur
e.co
m/n
atur
egen
etic
s

We cannot exclude the possibility that linkage disequilibrium ofgenetic variation independent of HMMR might potentially explainthe observed associations. However, the strength of the geneticassociations, coupled with the functional associations that we havefound, indicates that HMMR may be a previously unknown suscept-ibility gene for breast cancer within diverse human populations.
DISCUSSIONWe have shown that analysis of gene expression, combined withintegration of omic data sets from various species, can be used togenerate a network of hundreds of potential functional associationswith cancer genes/proteins. Many of the hypotheses provided by theBCN have been tested and validated either here or in the literature.Additional omic data sets can be integrated as they are produced togenerate a larger and more comprehensive BCN.
Among the newly defined associations predicted in the BCN, wefocused on those of HMMR on the basis of a combination of differentfunctional criteria. Network modeling also points to functionalassociations for other genes/proteins with properties similar to thoseof HMMR, such as CSPG6. HMMR and two of its interactors (CSPG6and MAD1L1) associate in protein complexes with BRCA1 andBRCA2. We established that HMMR is an in vitro substrate forBRCA1-BARD1–mediated polyubiquitination and that BRCA1 andHMMR genetically interact to control centrosome number in breasttumor– and mammary epithelium–derived cell lines. In addition, weidentified an association in breast tumorigenesis between BRCA1 andHMMR with AURKA, which is also in the BCN. Collectively, thesefindings describe a role for HMMR together with BRCA1 and AURKAin microtubule-based processes essential for proper chromosomesegregation. Observations made in Xenopus laevis have associatedthe HMMR ortholog XRHAMM with the control of spindle-poleassembly mediated by the BRCA1-BARD1 heterodimer37. This obser-vation further supports the idea that the HMMR-centered interactomenetwork described here has a role in genomic stability andbreast tumorigenesis.
Genetic analysis supports HMMR as a newly defined breast cancersusceptibility gene, thereby delineating a genetic link between risk ofbreast cancer and centrosome dysfunction. Notably, centrosomehypertrophy and amplification are often evident in early stage pro-liferative breast lesions38,39, and loss of mouse Brca1 or Brca2 leads tocentrosome amplification and genomic instability40,41. Our resultssuggest that HMMR can act as a breast cancer susceptibility genewhen expressed in relatively large amounts; such overexpressionprobably leads to centrosome amplification and genomic instability,similar to what has been proposed in studies of an Aurka transgenicmodel33 and in work involving transient Mad2 overexpression42.Our network modeling strategy is applicable to other types ofcancer; it will help to discover more cancer-associated genes andto generate a ‘wiring diagram’ of functional interactions betweentheir products.
METHODSBioinformatic analyses. We obtained GO annotations from NetAffx (Affyme-
trix) and based enrichment calculations on the total number of distinct genes
and their annotations in the U95A platform; P values were then determined by
Fisher’s exact test. Only grade 3 (poorly differentiated) tumors were used to
study gene expression in BRCA1mut tumors relative to sporadic breast tumors;
P values for differential expression were then determined by two-tailed
Student’s t-test (P o 0.10). To avoid probe discrepancies and differences in
the number of data points, only single-probe genes were simulated and
compared with single-probe genes from the XPRSS-Int data set, corresponding
to 132 genes from a total of 164; P values were then calculated empirically by
using 100 random simulations. The BRCA1mut coexpression network was
generated with the Graphviz graph visualization package. Owing to constraints
of the visualization program, the relative network positions of the four
reference genes are not proportional to the PCCs between them. Transcrip-
tional PCCs of XPRSS-Int genes that were upregulated and unchanged in
BRCA1mut tumors were compared by a two-tailed Student’s t-test, taking into
account all U95A probes for each gene. Orthologs were defined by reciprocal
BLASTP best hit (P o 10�6) or from the literature.
For the BCN modeling, we integrated, first, gene expression profiling
similarity above a given threshold, as determined by the PCC, from a
compendium of Saccharomyces cerevisiae43 and C. elegans44 microarray profiles
(6,174 and 18,451 genes, respectively); second, phenotypic similarity for 661
early embryogenesis C. elegans genes above a specific threshold17; third, genetic
interactions for 1,347 S. cerevisiae genes43; and fourth, protein physical
interactions (binary interactions, complex co-memberships and biochemical
interactions (protein modification)) for 3,458 S. cerevisiae43, 4,588 C. elegans
(WI6 data set21), 7,198 Drosophila melanogaster45,46 and 10,305 Homo
sapiens proteins47. To rank XPRSS-Int genes/proteins, PCC average values
for BRCA1 were used and BCN links corresponding to LIT-Int interactions
were not considered. Gene and protein names used throughout the text are
detailed in Supplementary Table 9 online.
Protein and biochemical analyses. Yeast two-hybrid methods were carried out
as described48. We performed BRCA1-BARD1 heterodimer purification and
ubiquitination reactions as described31, using whole-cell extracts of IMR90
human fibroblasts. We used the following antibodies: polyclonal IHABP and
E-19 (Santa Cruz Biotechnologies) for HMMR; monoclonal SD118, MS110
and SG11 for BRCA1; monoclonal Ab-1 (Oncogene) for BRCA2; monoclonal
clone-53 (BD Transduction Laboratories) for NUP62; polyclonal anti-AIK (Cell
Signaling) and monoclonal anti-IAK1 (BD Transduction Laboratories) for
AURKA; and polyclonal 727 and 725 for CSPG6 and SMC1L1, respectively,
polyclonal Dap23 and polyclonal 81d for MAD1L1, anti-PCM1 and anti-CEP2
(see Acknowledgments).
Cell culture and immunofluorescence microscopy. The negative control
siRNA was Silencer Negative Control 1 siRNA (Ambion). The HMMR 1 and
2 siRNAs were Silencer Pre-Designed siRNAs (Ambion; 5¢-GGUGCUUAU
GAUGUUAAAATT-3¢ and 5¢-GGACCAGUAUCCUUUCAGATT-3¢, respec-
tively). The BRCA1-b siRNA has been published31. Centrosome immunofluor-
escence counts correspond to three independent experiments, each scoring 200
cells with 480% protein reduction of HMMR and/or BRCA1.
Association studies. Individuals with breast cancer and control subjects were
recruited through an institutional review board–approved study of breast
cancer in northern Israel and through protocols at the Memorial Sloan-
Kettering Cancer Center in New York. The case-control study in northern
Israel is a population-based study of incident breast cancer identified through
rapid case ascertainment between January 2000 and July 2006. Controls were
identified by randomly selecting women from a comprehensive list of insurees
with Israel’s largest health provider, which covers B70% of women at risk in
northern Israel. For each case, an individually matched control without breast
cancer was identified by randomly sampling all female insurees meeting the
matching criteria of age (within 1 year), ancestry (Jewish versus non-Jewish)
and geographical clinic area. All breast cancers were pathologically confirmed,
and each participant signed written, informed consent. Cases and controls were
classified by religion and ancestry on the basis of self-report.
Genotyping. Genomic DNA derived from blood lymphocytes was used for all
genotyping. All case and control samples were genotyped for BRCA1 and
BRCA2 Jewish-derived founder mutations by using a TaqMan platform
(Applied Biosystems). Genotyping for SNPs in HMMR was performed with
Pyrosequencing (Biotage). Haplotype-tagging SNPs were selected for the
northern Israel study using Haploview49 to determine linkage disequilibrium
blocks by analyzing Centre d’ Etude du Polymorphisme Humain (CEPH) SNP
genotype data downloaded from the HapMap website. To be included in the
analysis, SNPs had to meet the following criteria: the Hardy-Weinberg w2
goodness-of-fit test yielded a P value 4 0.05; at least 75% of subjects were
genotyped for the SNP; and the minor allele frequency of the SNP was at least
NATURE GENETICS VOLUME 39 [ NUMBER 11 [ NOVEMBER 2007 1 34 7
ART I C LES©
2007
Nat
ure
Pub
lishi
ng G
roup
ht
tp://
ww
w.n
atur
e.co
m/n
atur
egen
etic
s

0.001. For the SNPs that met these criteria, Haploview was run in aggressive
tagging mode using two- and three-marker haplotypes. No difference in results
was seen when the pairwise tagging mode was used. For a SNP to be selected, all
alleles to be captured were correlated at a value of r2 4 0.8 with the marker in
that set. Three SNPs were identified as htSNPs, which tagged variation within
three estimated haplotype blocks in HMMR: rs7712023, rs299290 and
rs10515860. We performed duplicate genotyping for all samples in the
population-based study for rs10515860 with 100% concordance. Duplicate
genotyping for rs299290 was done for 1,789 samples, and 1,737 (97.1%) were
in agreement. Duplicate genotyping was not performed in the validation study
in New York.
Statistical analysis. Conditional and unconditional logistic regressions were
used to analyze data from the case-control study, as appropriate for a matched
study. No important differences between matched and unmatched analyses
were noted; therefore, the results are presented for the unmatched analysis to
optimize the sample size for tests of interaction and for ease of presentation.
Haplotypes were estimated with the EM algorithm, as implemented in the R
packages haplo.stats and SNPStats50. Association study between HapMap
genotypes and haplotypes, and HMMR germline expression levels from two
independent data sets (normalized values of Gene Expression Omnibus records
GSE5859 and GSE6536) were performed with the haplo.stats package by fitting
linear equations and P values obtained based on the F-test.
Additional methods. Detailed experimental methods are described in the
Supplementary Methods online.
Note: Supplementary information is available on the Nature Genetics website.
ACKNOWLEDGMENTSWe thank members of our laboratories for discussion and comments on themanuscript; A. Merdes (Wellcome Trust Centre for Cell Biology) for anti-PCM1;B. Koch (Research Institute of Molecular Pathology) for anti-CSPG6 and anti-SMC1L1; K.-T. Jeang (National Institute of Allergy and Infectious Disease) foranti-MAD1L1 (Dap23); D.-Y. Jin (University Hong Kong) for anti-MAD1L1(81d); E.A. Nigg (Max Planck Institute of Biochemistry) for anti-CEP2; D.R.Scoles (University California Los Angeles) for providing constructs; V. Joulov forsharing results before publication; C. McCowan, T. Clingingsmith and C. You foradministrative assistance; and K. Salehi-Ashtiani, D. Szeto, R. Murray and C. Linfor characterizing the genomic structure of HMMR. L.M.S. was supported by aDepartment of Defense Breast Cancer Research Program fellowship and a grantfrom the National Cancer Institute (CA90281to J.D.P.). M.T. was supported by anaward from the National Institutes of Health (NIH; K08-AG21613). K.C.G.received support from the US Army Medical Research Acquisition Activity(W23RYX-3275-N605) and NYSTAR (C040066). This work was supported byan NIH/National Cancer Institute (NCI) R33 grant (to M.V.), an NIH/NCI U01grant (to S. Korsmeyer, S. Orkin, G. Gilliland and M.V.), an NIH/NCI ICBPgrant (to J. Nevins and M.V.), an ‘interactome mapping’ grant from the NIH/National Human Genome Research Institute and the NIH/National Institute ofGeneral Medical Sciences (to F. Roth and M.V.), an NIH/NCI P30 grant(CA046592 to the University of Michigan), a Spanish Ministry of Educationand Science grant (PR2006-0474 to V.M.) and awards from the Breast CancerResearch Foundation (BCRF13740) and the Niehaus, Southworth, WeissenbachFoundation (to K.O.) and the Koodish Foundation (to T.K.).We also acknowledge the role of the New York Cancer Project, supportedby the Academic Medicine Development Company of New York.
AUTHOR CONTRIBUTIONSExperiments and data analyses were coordinated by M.A.P., J.-D.J.H., L.M.S andK.N.S. Computational analyses were performed by J.-D.J.H., K.C.G., N.B. andK.V. Yeast two-hybrid analysis screens were performed by M.A.P., J.S.A., J.-F.R andN.A.-G. Biochemical experiments were performed by M.A.P., L.M.S., W.M.E.,R.A.G. and B.S. Cell culture and immunofluorescence experiments wereperformed by M.A.P. and L.M.S. The case-control study in Israel was conceivedand executed by G.R. Genotyping and statistical analyses of the case-controlstudies were performed by K.N.S., L.S.R., G.R., V.M., T.K., B.G., D.L., K.O. andS.B.G. M.A.P., X.S. and P.H. performed the HapMap genotype-haplotype andgene expression association analysis. V.A. provided biochemical analysis support,R.S.G. provided statistical support and M.T., C.L., K.L.N., B.L.W., M.E.C., D.E.H.and D.M.L. helped with overall interpretation of the data. The manuscript waswritten by M.A.P., J.-D.J.H., L.M.S., D.E.H., M.E.C., S.B.G., J.D.P. and M.V. Theproject was conceived by M.V. and codirected by S.B.G., J.D.P. and M.V.
COMPETING INTERESTS STATEMENTThe authors declare competing financial interests: details accompany the full-textHTML version of the paper at http://www.nature.com/naturegenetics/.
Published online at http://www.nature.com/naturegenetics
Reprints and permissions information is available online at http://npg.nature.com/
reprintsandpermissions
1. Futreal, P.A. et al. A census of human cancer genes. Nat. Rev. Cancer 4, 177–183(2004).
2. Kitano, H. Cancer as a robust system: implications for anticancer therapy. Nat. Rev.Cancer 4, 227–235 (2004).
3. Khalil, I.G. & Hill, C. Systems biology for cancer. Curr. Opin. Oncol. 17, 44–48(2005).
4. Thomas, R.K. et al. High-throughput oncogene mutation profiling in human cancer.Nat. Genet. 39, 347–351 (2007).
5. Sjoblom, T. et al. The consensus coding sequences of human breast and colorectalcancers. Science 314, 268–274 (2006).
6. Greenman, C. et al. Patterns of somatic mutation in human cancer genomes. Nature446, 153–158 (2007).
7. Vidal, M. A biological atlas of functional maps. Cell 104, 333–339 (2001).8. Matthews, L.R. et al. Identification of potential interaction networks using sequence-
based searches for conserved protein-protein interactions or ‘interologs’. Genome Res.11, 2120–2126 (2001).
9. Futreal, P.A. et al. BRCA1 mutations in primary breast and ovarian carcinomas.Science 266, 120–122 (1994).
10. Miki, Y. et al. A strong candidate for the breast and ovarian cancer susceptibility geneBRCA1. Science 266, 66–71 (1994).
11. Wooster, R. et al. Identification of the breast cancer susceptibility gene BRCA2. Nature378, 789–792 (1995).
12. Renwick, A. et al. ATM mutations that cause ataxia-telangiectasia are breast cancersusceptibility alleles. Nat. Genet. 38, 873–875 (2006).
13. Meijers-Heijboer, H. et al. Low-penetrance susceptibility to breast cancer due toCHEK2(*)1100delC in noncarriers of BRCA1 or BRCA2 mutations. Nat. Genet. 31,55–59 (2002).
14. Su, A.I. et al. Large-scale analysis of the human and mouse transcriptomes. Proc. Natl.Acad. Sci. USA 99, 4465–4470 (2002).
15. Cunliffe, H.E. et al. The gene expression response of breast cancer to growthregulators: patterns and correlation with tumor expression profiles. Cancer Res. 63,7158–7166 (2003).
16. van’t Veer, L.J. et al. Gene expression profiling predicts clinical outcome of breastcancer. Nature 415, 530–536 (2002).
17. Gunsalus, K.C. et al. Predictive models of molecular machines involved in Caenor-habditis elegans early embryogenesis. Nature 436, 861–865 (2005).
18. Maxwell, C.A. et al. RHAMM is a centrosomal protein that interacts with dynein andmaintains spindle pole stability. Mol. Biol. Cell 14, 2262–2276 (2003).
19. Entwistle, J., Hall, C.L. & Turley, E.A. HA receptors: regulators of signalling to thecytoskeleton. J. Cell. Biochem. 61, 569–577 (1996).
20. Boulton, S.J. et al. BRCA1/BARD1 orthologs required for DNA repair in Caenorhabditiselegans. Curr. Biol. 14, 33–39 (2004).
21. Li, S. et al. A map of the interactome network of the metazoan C. elegans. Science303, 540–543 (2004).
22. Bellanger, J.M. & Gonczy, P. TAC-1 and ZYG-9 form a complex that promotesmicrotubule assembly in C. elegans embryos. Curr. Biol. 13, 1488–1498 (2003).
23. Le Bot, N., Tsai, M.C., Andrews, R.K. & Ahringer, J. TAC-1, a regulator of microtubulelength in the C. elegans embryo. Curr. Biol. 13, 1499–1505 (2003).
24. Srayko, M., Quintin, S., Schwager, A. & Hyman, A.A. Caenorhabditis elegans TAC-1and ZYG-9 form a complex that is essential for long astral and spindle microtubules.Curr. Biol. 13, 1506–1511 (2003).
25. Maxwell, C.A., Keats, J.J., Belch, A.R., Pilarski, L.M. & Reiman, T. Receptor forhyaluronan-mediated motility correlates with centrosome abnormalities in multiplemyeloma and maintains mitotic integrity. Cancer Res. 65, 850–860 (2005).
26. Hsu, L.C. & White, R.L. BRCA1 is associated with the centrosome during mitosis. Proc.Natl. Acad. Sci. USA 95, 12983–12988 (1998).
27. Marmorstein, L.Y. et al. A human BRCA2 complex containing a structural DNA bindingcomponent influences cell cycle progression. Cell 104, 247–257 (2001).
28. Bieche, I., Tozlu, S., Girault, I. & Lidereau, R. Identification of a three-gene expressionsignature of poor-prognosis breast carcinoma. Mol. Cancer 3, 37 (2004).
29. Freed, E. et al. Components of an SCF ubiquitin ligase localize to the centrosomeand regulate the centrosome duplication cycle. Genes Dev. 13, 2242–2257(1999).
30. Hashizume, R. et al. The RING heterodimer BRCA1-BARD1 is a ubiquitin ligaseinactivated by a breast cancer–derived mutation. J. Biol. Chem. 276, 14537–14540(2001).
31. Starita, L.M. et al. BRCA1-dependent ubiquitination of g-tubulin regulates centrosomenumber. Mol. Cell. Biol. 24, 8457–8466 (2004).
32. Ouchi, M. et al. BRCA1 phosphorylation by aurora-A in the regulation of G2 to Mtransition. J. Biol. Chem. 279, 19643–19648 (2004).
33. Wang, X. et al. Overexpression of aurora kinase A in mouse mammary epitheliuminduces genetic instability preceding mammary tumor formation. Oncogene 25,7148–7158 (2006).
1 34 8 VOLUME 39 [ NUMBER 11 [ NOVEMBER 2007 NATURE GENETICS
ART I C LES©
2007
Nat
ure
Pub
lishi
ng G
roup
ht
tp://
ww
w.n
atur
e.co
m/n
atur
egen
etic
s

34. Claus, E.B., Risch, N.J. & Thompson, W.D. Using age of onset to distinguish betweensubforms of breast cancer. Ann. Hum. Genet. 54, 169–177 (1990).
35. Mitchell, M.K., Gregersen, P.K., Johnson, S., Parsons, R. & Vlahov, D. The New YorkCancer Project: rationale, organization, design, and baseline characteristics. J. UrbanHealth 81, 301–310 (2004).
36. Raff, J.W. Centrosomes and cancer: lessons from a TACC. Trends Cell Biol. 12,222–225 (2002).
37. Joukov, V. et al. The BRCA1/BARD1 heterodimer modulates ran-dependent mitoticspindle assembly. Cell 127, 539–552 (2006).
38. Lingle, W.L. et al. Centrosome amplification drives chromosomal instability in breasttumor development. Proc. Natl. Acad. Sci. USA 99, 1978–1983 (2002).
39. Pihan, G.A., Wallace, J., Zhou, Y. & Doxsey, S.J. Centrosome abnormalities andchromosome instability occur together in pre-invasive carcinomas. Cancer Res. 63,1398–1404 (2003).
40. Tutt, A. et al. Absence of Brca2 causes genome instability by chromosome breakageand loss associated with centrosome amplification. Curr. Biol. 9, 1107–1110 (1999).
41. Xu, X. et al. Centrosome amplification and a defective G2-M cell cycle checkpointinduce genetic instability in BRCA1 exon 11 isoform–deficient cells. Mol. Cell 3,389–395 (1999).
42. Sotillo, R. et al. Mad2 overexpression promotes aneuploidy and tumorigenesis in mice.Cancer Cell 11, 9–23 (2007).
43. Han, J.D. et al. Evidence for dynamically organized modularity in the yeast protein-protein interaction network. Nature 430, 88–93 (2004).
44. Kim, S.K. et al. A gene expression map for Caenorhabditis elegans. Science 293,2087–2092 (2001).
45. Formstecher, E. et al. Protein interaction mapping: a Drosophila case study. GenomeRes. 15, 376–384 (2005).
46. Giot, L. et al. A protein interaction map of Drosophila melanogaster. Science 302,1727–1736 (2003).
47. Peri, S. et al. Human protein reference database as a discovery resource forproteomics. Nucleic Acids Res. 32, D497–D501 (2004).
48. Walhout, A.J. & Vidal, M. High-throughput yeast two-hybrid assays for large-scaleprotein interaction mapping. Methods 24, 297–306 (2001).
49. Barrett, J.C., Fry, B., Maller, J. & Daly, M.J. Haploview: analysis and visualization of LDand haplotype maps. Bioinformatics 21, 263–265 (2005).
50. Sole, X., Guino, E., Valls, J., Iniesta, R. & Moreno, V. SNPStats: a web toolfor the analysis of association studies. Bioinformatics 22, 1928–1929(2006).
NATURE GENETICS VOLUME 39 [ NUMBER 11 [ NOVEMBER 2007 1 34 9
ART I C LES©
2007
Nat
ure
Pub
lishi
ng G
roup
ht
tp://
ww
w.n
atur
e.co
m/n
atur
egen
etic
s