
Accuracy-speed relationships of a robotic filament winding cell
Upload
independentCategory
view
0download
0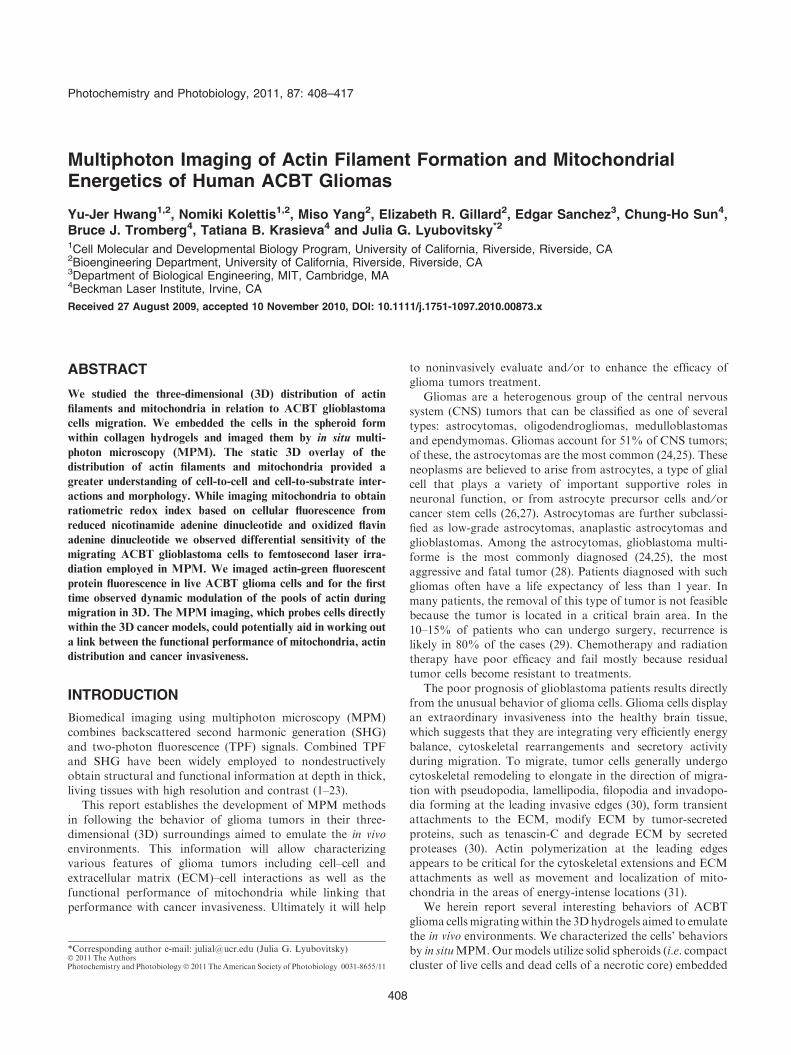
Multiphoton Imaging of Actin Filament Formation and MitochondrialEnergetics of Human ACBT Gliomas
Yu-Jer Hwang1,2, Nomiki Kolettis1,2, Miso Yang2, Elizabeth R. Gillard2, Edgar Sanchez3, Chung-Ho Sun4,Bruce J. Tromberg4, Tatiana B. Krasieva4 and Julia G. Lyubovitsky*2
1Cell Molecular and Developmental Biology Program, University of California, Riverside, Riverside, CA2Bioengineering Department, University of California, Riverside, Riverside, CA3Department of Biological Engineering, MIT, Cambridge, MA4Beckman Laser Institute, Irvine, CA
Received 27 August 2009, accepted 10 November 2010, DOI: 10.1111/j.1751-1097.2010.00873.x
ABSTRACT
We studied the three-dimensional (3D) distribution of actin
filaments and mitochondria in relation to ACBT glioblastoma
cells migration. We embedded the cells in the spheroid form
within collagen hydrogels and imaged them by in situ multi-
photon microscopy (MPM). The static 3D overlay of the
distribution of actin filaments and mitochondria provided a
greater understanding of cell-to-cell and cell-to-substrate inter-
actions and morphology. While imaging mitochondria to obtain
ratiometric redox index based on cellular fluorescence from
reduced nicotinamide adenine dinucleotide and oxidized flavin
adenine dinucleotide we observed differential sensitivity of the
migrating ACBT glioblastoma cells to femtosecond laser irra-
diation employed in MPM. We imaged actin-green fluorescent
protein fluorescence in live ACBT glioma cells and for the first
time observed dynamic modulation of the pools of actin during
migration in 3D. The MPM imaging, which probes cells directly
within the 3D cancer models, could potentially aid in working out
a link between the functional performance of mitochondria, actin
distribution and cancer invasiveness.
INTRODUCTION
Biomedical imaging using multiphoton microscopy (MPM)
combines backscattered second harmonic generation (SHG)and two-photon fluorescence (TPF) signals. Combined TPFand SHG have been widely employed to nondestructively
obtain structural and functional information at depth in thick,living tissues with high resolution and contrast (1–23).
This report establishes the development of MPM methods
in following the behavior of glioma tumors in their three-dimensional (3D) surroundings aimed to emulate the in vivoenvironments. This information will allow characterizingvarious features of glioma tumors including cell–cell and
extracellular matrix (ECM)–cell interactions as well as thefunctional performance of mitochondria while linking thatperformance with cancer invasiveness. Ultimately it will help
to noninvasively evaluate and ⁄ or to enhance the efficacy ofglioma tumors treatment.
Gliomas are a heterogenous group of the central nervoussystem (CNS) tumors that can be classified as one of severaltypes: astrocytomas, oligodendrogliomas, medulloblastomas
and ependymomas. Gliomas account for 51% of CNS tumors;of these, the astrocytomas are the most common (24,25). Theseneoplasms are believed to arise from astrocytes, a type of glialcell that plays a variety of important supportive roles in
neuronal function, or from astrocyte precursor cells and ⁄ orcancer stem cells (26,27). Astrocytomas are further subclassi-fied as low-grade astrocytomas, anaplastic astrocytomas and
glioblastomas. Among the astrocytomas, glioblastoma multi-forme is the most commonly diagnosed (24,25), the mostaggressive and fatal tumor (28). Patients diagnosed with such
gliomas often have a life expectancy of less than 1 year. Inmany patients, the removal of this type of tumor is not feasiblebecause the tumor is located in a critical brain area. In the
10–15% of patients who can undergo surgery, recurrence islikely in 80% of the cases (29). Chemotherapy and radiationtherapy have poor efficacy and fail mostly because residualtumor cells become resistant to treatments.
The poor prognosis of glioblastoma patients results directlyfrom the unusual behavior of glioma cells. Glioma cells displayan extraordinary invasiveness into the healthy brain tissue,
which suggests that they are integrating very efficiently energybalance, cytoskeletal rearrangements and secretory activityduring migration. To migrate, tumor cells generally undergo
cytoskeletal remodeling to elongate in the direction of migra-tion with pseudopodia, lamellipodia, filopodia and invadopo-dia forming at the leading invasive edges (30), form transientattachments to the ECM, modify ECM by tumor-secreted
proteins, such as tenascin-C and degrade ECM by secretedproteases (30). Actin polymerization at the leading edgesappears to be critical for the cytoskeletal extensions and ECM
attachments as well as movement and localization of mito-chondria in the areas of energy-intense locations (31).
We herein report several interesting behaviors of ACBT
glioma cellsmigratingwithin the 3Dhydrogels aimed to emulatethe in vivo environments. We characterized the cells’ behaviorsby in situMPM.Ourmodels utilize solid spheroids (i.e. compact
cluster of live cells and dead cells of a necrotic core) embedded
*Corresponding author e-mail: [email protected] (Julia G. Lyubovitsky)� 2011 The AuthorsPhotochemistry and Photobiology� 2011 The American Society of Photobiology 0031-8655/11
Photochemistry and Photobiology, 2011, 87: 408–417
408

in 3D ECMs. These models have been employed to mimicmicrotumors and metastases (32). Similar to malignant gliomasin vivo (33–35), these in vitromodels contain a large central coreof extensive necrosis surrounded by a dense shell of invasive cells
that migrate into surrounding ECMs (36).We find that the sensitivity of ACBT glioblastoma cells
migrating in 3D to femto-second laser irradiation is not uniform.
In situ multiphoton ratiometric redox imaging based on cellularfluorescence from reduced nicotinamide adenine dinucleotide(NADH) and oxidized flavin adenine dinucleotide (FAD)
detects at least two different populations of migrating ACBTglioblastoma cells. One population of cells maintains originalmorphology after the 3D imaging, as well as retains functional
mitochondria. Disrupted cellular membranes characterizeanother population. An in situ F-actin and mitochondrial stains’fluorescence provides a new insight into the cell-to-cell andcell-to-substrate interactions and morphology in 3D. The actin-
green fluorescent protein (GFP) fluorescence dynamicallyspreads through the cell body into the lamellipodia when wefollow the pattern of the real time reorganization of actin.
Temporary pools or ‘‘globes’’ of actin are observed for the firsttime and are thought to represent G-actin generated to facilitatecellular movement along the collagen fibers of the ECM.
MATERIALS AND METHODS
Three-dimensional glioblastoma model. The human grade IV glioblas-toma cell line (ACBT) was a generous gift of G. Granger (University ofCalifornia at Irvine, CA). The cells were cultured as in Ref. (37).Spheroids were grown according to standard procedures (38). Toprepare our 3D models, ACBT glioma spheroids were visually selectedaccording to size. Unless noted, each spheroid selected for the studiespresented in this report was 500 lm in diameter.
To ensure that the ACBT glioma spheroids properly attached to thePetri dishes, 3 lL of rat tail type I collagen gel (BD Biosciences,2 mg mL)1) was placed in the middle of the dish. Using a sterile whiterubber policeman, the collagen was then evenly distributed. While thecollagen was left to dry for an hour, ACBT glioma spheroids wereselected. Once the collagen dried, one ACBT glioma spheroid wasplaced in each Petri dish along with 2 mL of the growth mediumDulbecco’s Modified Eagle Medium (DMEM; Gibco Cat. No. 12800-058, 1·). One hour of incubation (37�C, 5% CO2) followed to ensurethat the spheroid properly attached to the layer of collagen. Using thisprocedure we could ensure that we were using only the spheroids thatwere able to attach to the collagen layer.
An ice-cold collagen mix was then prepared consisting of 700 lL of4.52 mg mL)1 collagen type I, 100 lL of reconstitution buffer (10·)and 200 lL of DMEM growth medium (Gibco Cat. No. 12800-058,5·). The 10· reconstitution buffer was prepared by combining 2.2 g ofNaHCO3 (tissue culture grade) and 4.77 g HEPES (tissue culturegrade, Gibco Cat. No 845-1344) in a 100 mL medium bottle, adding75 mL of 0.05 N NaOH (5 mL of 1 N NaOH [Fisher, SS266-1] addedto a 95 mL doubly distilled, deionized water) to the sodium bicarbon-ate and HEPES powder, mixing well to dissolve and bringing thesolution to the final volume of 100 mL with 0.05 N NaOH. The bufferwas filter sterilized with 0.22 lm filter into a sterile medium bottle andstored at 4�C.
After visually confirming spheroid attachment, the initial DMEMmedium (1·) was carefully replaced with 200 lL of the ice-coldcollagen mix and incubated (37�C, 5% CO2) for 30 min. Twomilliliters of DMEM growth medium with all the essential supplements(1·) was then added to each sample to cover the spheroid. The sampleswere placed back in the incubator.
Mitochondrial stain: MitoTracker Orange CM-H2TMRos. To pre-pare 1 mMM stock solution, 50 lg of lyophilized CM-H2TMRos(Molecular Probes, M-7511) was dissolved in 130 lL of high-quality,anhydrous dimethyl sulfoxide. The stock solution was diluted withDMEM growth medium to the final 1300 nMM working solution. The
dye uptake was followed by monitoring 580 nm fluorescence of thefluorescent CM-H2TMRos cationic form. After 1 h of incubation, thefluorescence level was low. As judged by morphology, staining for upto 22 h could be performed with no toxicity to the ACBT gliomaspheroids. Photobleaching of fluorescent oxidized dye was low uponprolonged (20 min) two-photon excitation.
F-actin stain: Alexa Flour 488 Phalloidin. The F-actin stain selectedwas the Alexa Flour 488 Phalloidin (A12379, Invitrogen). Thephallotoxin is isolated from the deadly Amanita phalloides mushroomas a bicyclic peptide that competitively binds to F-actin sites (39). Thelabeled phallotoxins have the same affinity for both large and smallfilaments, and inside cells, one phallotoxin molecule binds per actinsubunit. The one-photon excitation maximum of the Alexa Flour 488Phalloidin is at 495 nm and its emission is at 518 nm (39).
After the mitochondrial stain, the cell model was fixed withformaldehyde. The medium was replaced with 3 mL of 4% formal-dehyde and samples were left at 4�C overnight. After fixation, the 3DACBT models were washed three times with PBS (pH 7.4), with 15 minequilibration periods between each rinse, and then permeabilized with0.1% Triton X-100 (in PBS, pH 7.4) for 1 h prior to F-Actin staining.Samples were then rinsed five times with PBS with 15 min equilibra-tion periods.
A stock solution of F-actin stain (Invitrogen) was prepared bytaking 1 vial of 300 units of lyophilized solid compound and dissolvingit in 1.5 mL of methanol to yield a final concentration of200 units mL)1 (6.6 lMM); 50 lL of F-actin stock solution was dilutedinto 2 mL of PBS and added to each sample. The 3D ACBT modelswere then incubated at 4�C for 16–20 h. Upon completion, sampleswere washed for a total of five times with PBS with 1 h equilibrationperiods between each wash. Imaging of 3D ACBT glioma models wasperformed as described in the subsection entitled MPM: Ratiometricimaging and spectra in this section.
F-actin live stain: Transduction with actin-GFP reagent. ACBT cellswere plated and were grown overnight as a monolayer. Transductionsolution was prepared by combining 2 parts of CellularLights actin-GFP reagent (component A, Invitrogen C10126) with 3.5 parts ofDulbecco’s PBS (D-PBS) without calcium and magnesium. After thenext day’s replacement of the growth medium with transductionsolution, the cells were kept at room temperature in the dark for 3 hwith gentle shaking. The transduction solution was then replaced withenhancer solution prepared by combining growth medium with 1·BacMam enhancer (component B) and kept for another 2 h in theculture incubator at 37�C and 7.5% CO2. The enhancer solution wasreplaced with growth medium and cells were subsequently incubatedfor 24 h to allow the expression of actin-GFP. Transduced cells wereharvested and plated in Petri dish at high density (about 1 million cellsper 60 mm dish) at least overnight to allow spheroid formation. The3D glioma models were then formed as described in the subsectionentitled Three-dimensional glioblastoma model in this section.
MPM: Ratiometric imaging and spectra. The inverted muliphotonlaser scanning microscope used in this work is described elsewhere(9,40–42). Briefly, the system consisted of a Kerr-lens mode-lockedTi:sapphire oscillator (Mira 900F; 200 fs pulse width, 76 MHz repe-tition rate; Coherent) pumped by a frequency-doubled 5 W Nd:YVO4
solid-state laser (Verdi, Coherent). Spectra were acquired with aSpectraPro-150 spectrograph equipped with a 300 grooves mm)1
grating blazed at 500 nm (Acton Research Corp.), and a high dynamicrange MicroMax: 512BFT CCD camera (Princeton Instruments)controlled by an ST-133 Controller (Princeton Instruments). Thespectrograph and camera settings were PC-controlled throughcommercially available software (WinSpec ⁄ 32 v. 2.4.6.6, RoperScientific, Inc.). The CCD temperature was maintained at )45�C. Theentrance slit of the spectrograph was set to a width of 0.5 mm.
In all the experiments, the laser excitation was linearly polarized atthe selected excitation wavelength and verified with a b-barium boratenonlinear crystal placed on the microscope stage. Experimental errorin the fluorescence and SHG measurements because of instrumentsetting parameters was established using fluorescein solutions andSHG nonlinear crystals (z-cut quartz and others), respectively.Experimental variability between measurements because of instrumentsetting parameters was found to be less than about 3%. The sampleswere imaged using Zeiss objectives under standard thickness cover-glass. We used 10· air (NA = 0.33) and 40· water (NA = 0.8) forquantitative work and 63· water (NA = 1.2), as well as 100· water
Photochemistry and Photobiology, 2011, 87 409
(NA = 1.0) for high-resolution imaging. Spectral filtering with a500 nm dichroic beamsplitter and a bandpass filter (400AF10 forkex = 800 nm) were used to separate the SHG of the ECM from thatof intrinsic fluorescence. The autofluorescence was further separatedinto blue (using 445 ± 25 nm filter for kex = 770 nm) and red (using580 ± 30 nm filter for kex = 770 nm) components to be detected bythe corresponding PMTs. Binary data was converted to 16-bit TIFFimages using IPLab software (Scanalytics, Inc.). Three-dimensionalreconstructions of 3D ACBT glioblastoma models and all correspond-ing sections were obtained using IPLAB (Scanalytics, Inc.) andVoxBlast software (VayTek, Inc.). Multiphoton ratiometric valueswere calculated using Matlab. The intensity values of all256 · 256 = 65 536 pixels were added for blue and red channelsseparately. Subsequently, ratios were obtained by dividing the totalintensity of all pixel values for the blue channel by that for the redchannel. The background noise in photon counting data collectionmode used was low; therefore, this approach for obtaining multi-photon ratiometric values was acceptable. Additionally, while thefluorescence of NADH and FAD themselves may be affected byinstrument setting parameters, laser instability and possible samplingartifacts, their ratio effectively eliminates the measurement errors andtherefore can provide useful, reliable information regarding the redoxproperties of the cells.
Multiphoton autofluorescence from different cells and samplesprepared on separate days was evaluated. The conditions of samplesand cellular morphology were matched as closely as possible. Onlycells that migrated away from the solid spheroid and had lamellipodiaand shapes similar to the cells in Fig. 1C were evaluated. Prior tomeasurements, the phenol-containing media were removed and 3Dglioblastoma models were washed three times with PBS. In AlexaFlour 488 Phalloidin imaging experiments, 800 nm excitation wave-length was employed and the emission was detected through the 500–550 bandpass filter. In MitoTracker Orange CM-H2TMRos mito-chondrial imaging experiments 800 nm excitation wavelength wasused, and the emission was observed with a 550–610 nm bandpassfilter.
LSM 510 confocal microscopy: Live actin-GFP imaging. The ZeissLSM 510 NLO meta microscopy system is based on an Axiovert200 M inverted microscope equipped with standard illuminationsystems for transmitted light and epi-fluorescence detection and astandard set of visible light lasers, including an Argon laser458 ⁄ 477 ⁄ 488 ⁄ 514 nm ⁄ 30 mW for confocal microscopy. It is equippedwith an NLO interface for a femtosecond Ti:sapphire laser excitationsource (Chameleon-Ultra, Coherent) for multiphoton excitation withthe exceptional tunability range from 690 to 1040 nm. The instrumentis equipped with two single-channel PMT detectors, the METApolychromatic detector and a transmission light channel. The micro-scope platform is equipped with a motorized X–Y scanning stageand long-working distance and high numerical aperture objectives(20, 40 and 100·). Software supports time-lapse sequence automaticacquisition.
RESULTS
Three-dimensional ACBT glioblastoma model
Our models utilize solid spheroids (i.e. compact cluster of livecells and dead cells of a necrotic core) embedded in 3D ECMs
(Figs. 1A,B). A typical spheroid of 500 lm in diameter(Fig. 1A) is surrounded by ECM in the generalized andschematic overview of the model shown in Fig. 1B. This work
focused on live migrating cells (Fig. 1C) that exhibitedlamellipodia while migrating within ECMs. They were mostlydouble-nucleated (Fig. 1C, arrows point to the nuclei),migrated in clusters and visibly interacted with other nearby
cells and ECM.
Multiphoton imaging of mitochondria
We first explored the utility of a multiphoton ratiometric redox
fluorometry approach based on cellular fluorescence fromreduced NADH and oxidized FAD to study mitochondrialenergy metabolism (42) within live migrating populations of
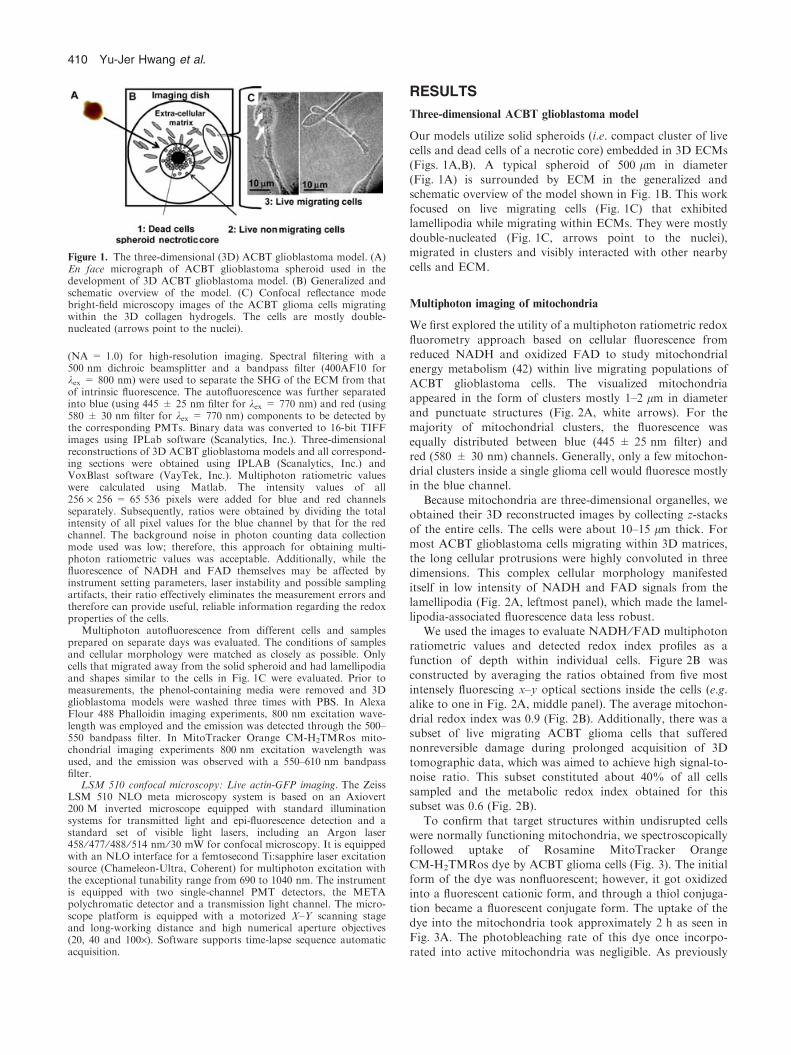
ACBT glioblastoma cells. The visualized mitochondriaappeared in the form of clusters mostly 1–2 lm in diameterand punctuate structures (Fig. 2A, white arrows). For the
majority of mitochondrial clusters, the fluorescence wasequally distributed between blue (445 ± 25 nm filter) andred (580 ± 30 nm) channels. Generally, only a few mitochon-drial clusters inside a single glioma cell would fluoresce mostly
in the blue channel.Because mitochondria are three-dimensional organelles, we
obtained their 3D reconstructed images by collecting z-stacks
of the entire cells. The cells were about 10–15 lm thick. Formost ACBT glioblastoma cells migrating within 3D matrices,the long cellular protrusions were highly convoluted in three
dimensions. This complex cellular morphology manifesteditself in low intensity of NADH and FAD signals from thelamellipodia (Fig. 2A, leftmost panel), which made the lamel-
lipodia-associated fluorescence data less robust.We used the images to evaluate NADH ⁄FAD multiphoton
ratiometric values and detected redox index profiles as afunction of depth within individual cells. Figure 2B was
constructed by averaging the ratios obtained from five mostintensely fluorescing x–y optical sections inside the cells (e.g.alike to one in Fig. 2A, middle panel). The average mitochon-
drial redox index was 0.9 (Fig. 2B). Additionally, there was asubset of live migrating ACBT glioma cells that sufferednonreversible damage during prolonged acquisition of 3D
tomographic data, which was aimed to achieve high signal-to-noise ratio. This subset constituted about 40% of all cellssampled and the metabolic redox index obtained for thissubset was 0.6 (Fig. 2B).
To confirm that target structures within undisrupted cellswere normally functioning mitochondria, we spectroscopicallyfollowed uptake of Rosamine MitoTracker Orange
CM-H2TMRos dye by ACBT glioma cells (Fig. 3). The initialform of the dye was nonfluorescent; however, it got oxidizedinto a fluorescent cationic form, and through a thiol conjuga-
tion became a fluorescent conjugate form. The uptake of thedye into the mitochondria took approximately 2 h as seen inFig. 3A. The photobleaching rate of this dye once incorpo-
rated into active mitochondria was negligible. As previously
Figure 1. The three-dimensional (3D) ACBT glioblastoma model. (A)En face micrograph of ACBT glioblastoma spheroid used in thedevelopment of 3D ACBT glioblastoma model. (B) Generalized andschematic overview of the model. (C) Confocal reflectance modebright-field microscopy images of the ACBT glioma cells migratingwithin the 3D collagen hydrogels. The cells are mostly double-nucleated (arrows point to the nuclei).
410 Yu-Jer Hwang et al.
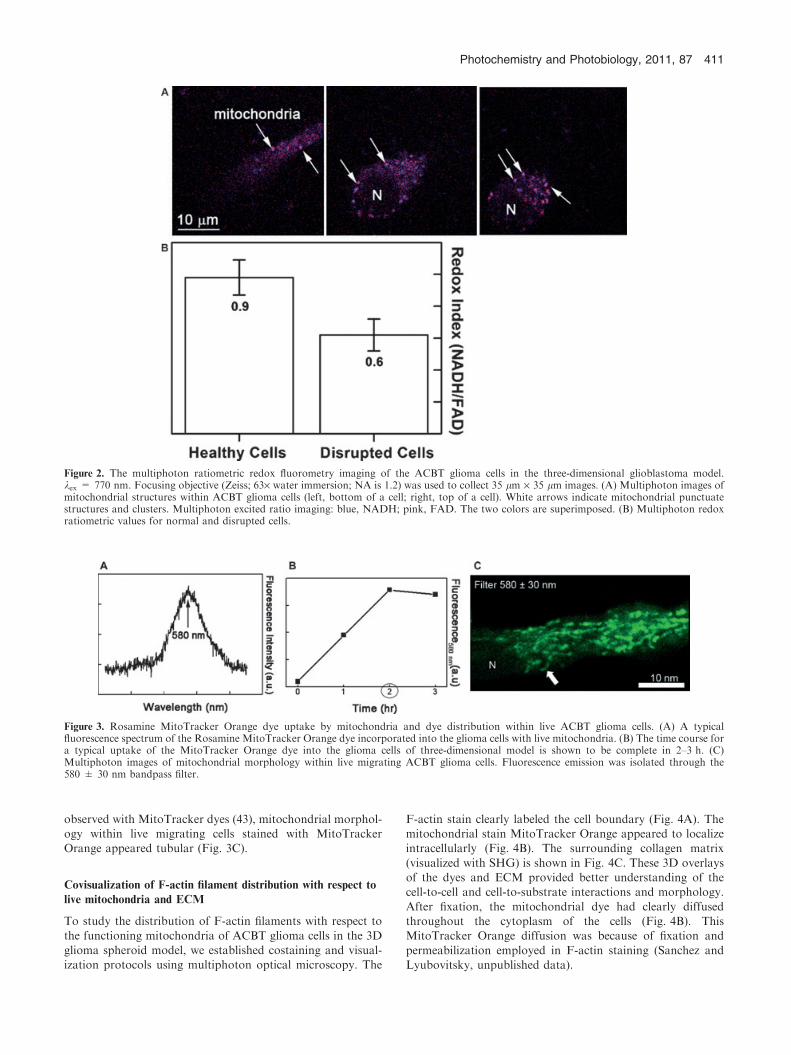
observed with MitoTracker dyes (43), mitochondrial morphol-ogy within live migrating cells stained with MitoTrackerOrange appeared tubular (Fig. 3C).
Covisualization of F-actin filament distribution with respect to
live mitochondria and ECM
To study the distribution of F-actin filaments with respect to
the functioning mitochondria of ACBT glioma cells in the 3Dglioma spheroid model, we established costaining and visual-ization protocols using multiphoton optical microscopy. The
F-actin stain clearly labeled the cell boundary (Fig. 4A). Themitochondrial stain MitoTracker Orange appeared to localizeintracellularly (Fig. 4B). The surrounding collagen matrix
(visualized with SHG) is shown in Fig. 4C. These 3D overlaysof the dyes and ECM provided better understanding of thecell-to-cell and cell-to-substrate interactions and morphology.
After fixation, the mitochondrial dye had clearly diffusedthroughout the cytoplasm of the cells (Fig. 4B). ThisMitoTracker Orange diffusion was because of fixation and
permeabilization employed in F-actin staining (Sanchez andLyubovitsky, unpublished data).
Figure 2. The multiphoton ratiometric redox fluorometry imaging of the ACBT glioma cells in the three-dimensional glioblastoma model.kex = 770 nm. Focusing objective (Zeiss; 63· water immersion; NA is 1.2) was used to collect 35 lm · 35 lm images. (A) Multiphoton images ofmitochondrial structures within ACBT glioma cells (left, bottom of a cell; right, top of a cell). White arrows indicate mitochondrial punctuatestructures and clusters. Multiphoton excited ratio imaging: blue, NADH; pink, FAD. The two colors are superimposed. (B) Multiphoton redoxratiometric values for normal and disrupted cells.
Figure 3. Rosamine MitoTracker Orange dye uptake by mitochondria and dye distribution within live ACBT glioma cells. (A) A typicalfluorescence spectrum of the Rosamine MitoTracker Orange dye incorporated into the glioma cells with live mitochondria. (B) The time course fora typical uptake of the MitoTracker Orange dye into the glioma cells of three-dimensional model is shown to be complete in 2–3 h. (C)Multiphoton images of mitochondrial morphology within live migrating ACBT glioma cells. Fluorescence emission was isolated through the580 ± 30 nm bandpass filter.
Photochemistry and Photobiology, 2011, 87 411
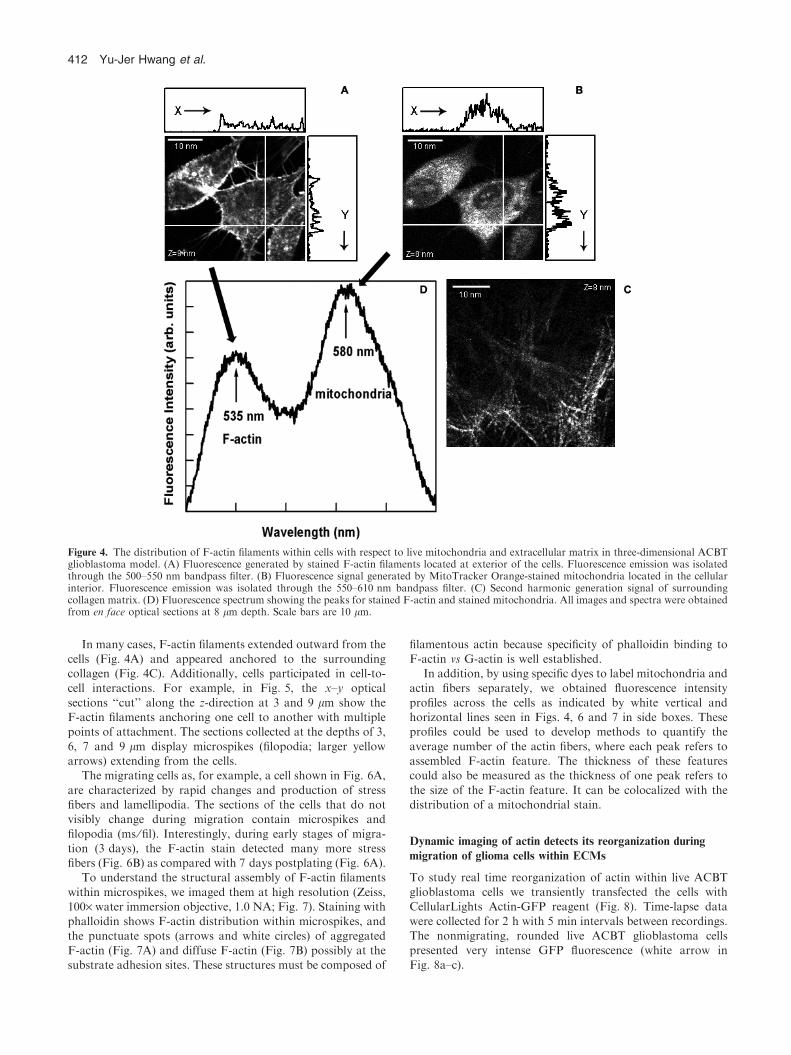
In many cases, F-actin filaments extended outward from thecells (Fig. 4A) and appeared anchored to the surroundingcollagen (Fig. 4C). Additionally, cells participated in cell-to-cell interactions. For example, in Fig. 5, the x–y optical
sections ‘‘cut’’ along the z-direction at 3 and 9 lm show theF-actin filaments anchoring one cell to another with multiplepoints of attachment. The sections collected at the depths of 3,
6, 7 and 9 lm display microspikes (filopodia; larger yellowarrows) extending from the cells.
The migrating cells as, for example, a cell shown in Fig. 6A,
are characterized by rapid changes and production of stressfibers and lamellipodia. The sections of the cells that do notvisibly change during migration contain microspikes and
filopodia (ms ⁄ fil). Interestingly, during early stages of migra-tion (3 days), the F-actin stain detected many more stressfibers (Fig. 6B) as compared with 7 days postplating (Fig. 6A).
To understand the structural assembly of F-actin filaments
within microspikes, we imaged them at high resolution (Zeiss,100· water immersion objective, 1.0 NA; Fig. 7). Staining withphalloidin shows F-actin distribution within microspikes, and
the punctuate spots (arrows and white circles) of aggregatedF-actin (Fig. 7A) and diffuse F-actin (Fig. 7B) possibly at thesubstrate adhesion sites. These structures must be composed of
filamentous actin because specificity of phalloidin binding toF-actin vs G-actin is well established.
In addition, by using specific dyes to label mitochondria andactin fibers separately, we obtained fluorescence intensity
profiles across the cells as indicated by white vertical andhorizontal lines seen in Figs. 4, 6 and 7 in side boxes. Theseprofiles could be used to develop methods to quantify the
average number of the actin fibers, where each peak refers toassembled F-actin feature. The thickness of these featurescould also be measured as the thickness of one peak refers to
the size of the F-actin feature. It can be colocalized with thedistribution of a mitochondrial stain.
Dynamic imaging of actin detects its reorganization during
migration of glioma cells within ECMs
To study real time reorganization of actin within live ACBTglioblastoma cells we transiently transfected the cells withCellularLights Actin-GFP reagent (Fig. 8). Time-lapse data
were collected for 2 h with 5 min intervals between recordings.The nonmigrating, rounded live ACBT glioblastoma cellspresented very intense GFP fluorescence (white arrow in
Fig. 8a–c).
Figure 4. The distribution of F-actin filaments within cells with respect to live mitochondria and extracellular matrix in three-dimensional ACBTglioblastoma model. (A) Fluorescence generated by stained F-actin filaments located at exterior of the cells. Fluorescence emission was isolatedthrough the 500–550 nm bandpass filter. (B) Fluorescence signal generated by MitoTracker Orange-stained mitochondria located in the cellularinterior. Fluorescence emission was isolated through the 550–610 nm bandpass filter. (C) Second harmonic generation signal of surroundingcollagen matrix. (D) Fluorescence spectrum showing the peaks for stained F-actin and stained mitochondria. All images and spectra were obtainedfrom en face optical sections at 8 lm depth. Scale bars are 10 lm.
412 Yu-Jer Hwang et al.

We found ACBT glioblastoma cells to dynamically modu-late their GFP expression as they migrated within the ECM.
The GFP fluorescence appeared to be spreading through thecell body into the lamellipodia (white star next to cell body inFig. 8a–c) in dynamic bursts, creating temporary pools or
‘‘globes.’’ These features possibly represent G-actin generatedto facilitate cellular movement along the collagen fibers of theECM.
DISCUSSION
The leading edge in investigations of human cancers lies in
making use of 3D in vitro models that can mimic the in vivoenvironment (44). These models resemble more accuratelyphysiological tumor settings, allow expedient experimental
manipulations and are more amenable to imaging comparedwith animals.
Figure 6. The multiphoton images of F-actin inside the ABCT glioma cells at different postplating stages of cell migration within the three-dimensional collagen hydrogels. (A) Alexa Fluor 488 Phalloidin labeled F-actin assembly in a semimigrating cell, x–y plane. A variety of F-actintypes of assembly are observed. The migratory section of the cell is characterized by stress fibers and lamellipodia. Nonmigratory section of the cellis composed of microspikes ⁄ filopodia (ms ⁄ fil). The cells were allowed to migrate for 7 days. (B) Alexa Fluor 488 Phalloidin-labeled F-actinassembly in glioma cells allowed to migrate for 3 days. More stress fibers are observed as compared with 7 days postplating.
Figure 5. The distribution of F-actin filaments throughout the glioma cells that prior to F-actin stain had functional mitochondria. A variety of F-actin filaments can be seen in the x–y optical sections that are cut along the z-direction. Scale bar is 8 lm. The z = 3 lm and z = 9 lm opticalsections show F-actin filaments anchoring one cell to another (white arrows). The z = 7 lm, z = 6 lm as well as z = 3 lm and z = 9 lm opticalsections all display microspikes also called filopodia extending from the cells (larger yellow arrows). Fluorescence emission was isolated through the500–550 nm filter. Scales are indicated.
Photochemistry and Photobiology, 2011, 87 413

Our work describes an application of multiphoton opticalmicroscopy to study behaviors of glioma tumors in their 3D
surroundings aimed to emulate the in vivo environments.Specifically, we followed mitochondrial energy metabolismand distribution of actin filaments within the migrating cells
of the 3D ACBT glioblastoma model consisting of solidspheroids embedded in the hydrogel ECMs. For the imagingstudies presented in this work, collagen is employed as asubstrate hydrogel material because it generates a depend-
able, characterized second harmonic signal that does notbleach. During the development of our optical methods, weroutinely use this collagen spectroscopic signature to attain
rapid approximate calibrations of the imaging depth. Thisunique signature is also used to understand the overall 3D
structure of the material surrounding embedded spheroids,cells and spheroids that migrate away from them. A
development of subcellular imaging based on intrinsic fluo-rescence of migrating glioma cells embedded in thick ‘‘tissue-like’’ materials, took precedence over focusing on ‘‘a
biologically correct’’ ECM material that glioma cells couldbe exposed to in vivo.
Gliomas typically consist of a group of proliferative cells inthe tumor mass (often with a necrotic core), surrounded by a
shell of invasive, motile cells. The highly invasive cells outsidethe necrotic core infiltrate diffusely into nearby healthy brainparenchyma and often follow the same anatomical structures
along which neural stem cells migrate during development andafter brain injury (such as white matter tracts and along the
Figure 7. High-resolution images of F-actin distribution inside the microspikes of ABCT glioma cell. Fluorescence of phalloidin AlexaFluor 488conjugate shows F-actin distribution within microspikes. Focusing objective (Zeiss; 100· water immersion; NA is 1.0) was used to collect images.Fluorescence intensity profiles across the cell as indicated by white lines are displayed in the side boxes. (A) Punctuate spots of aggregated F-actin(circles and white arrows). The F-actin spots are 1.4 lm as estimated from the half-width of the peaks in the fluorescence intensity profiles. (B)Diffuse F-actin at the substrate adhesion sites is observed.
Figure 8. LSM510 time-lapse recordings of live ACBT glioblastoma cells migrating off the spheroid. Spheroid was 100 lm. Focusing objective(40· dry) was used to collect the images (264 lm · 264 lm); (a–c) en face confocal fluorescence images show migration of GFP-actin-expressingcells in three-dimensional collagen hydrogels. The cells migrate in all directions; (d–f) true focus en face white light images that correspond to theconfocal fluorescence images in parts (a–c).
414 Yu-Jer Hwang et al.
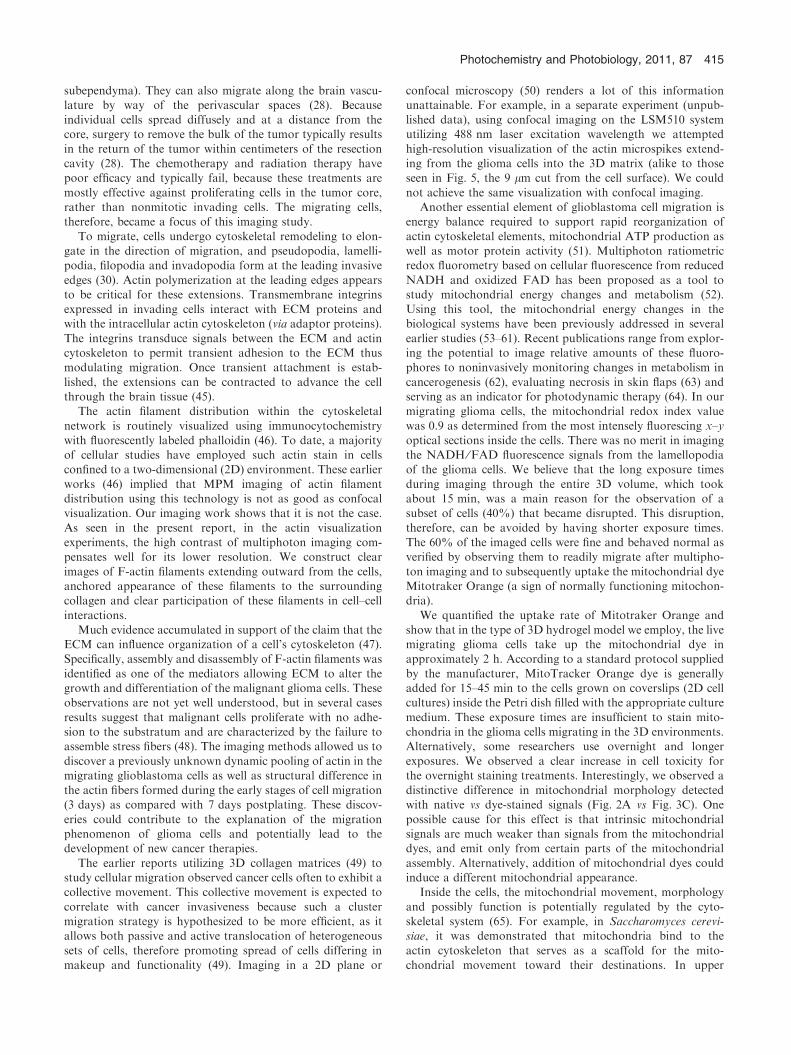
subependyma). They can also migrate along the brain vascu-lature by way of the perivascular spaces (28). Becauseindividual cells spread diffusely and at a distance from thecore, surgery to remove the bulk of the tumor typically results
in the return of the tumor within centimeters of the resectioncavity (28). The chemotherapy and radiation therapy havepoor efficacy and typically fail, because these treatments are
mostly effective against proliferating cells in the tumor core,rather than nonmitotic invading cells. The migrating cells,therefore, became a focus of this imaging study.
To migrate, cells undergo cytoskeletal remodeling to elon-gate in the direction of migration, and pseudopodia, lamelli-podia, filopodia and invadopodia form at the leading invasive
edges (30). Actin polymerization at the leading edges appearsto be critical for these extensions. Transmembrane integrinsexpressed in invading cells interact with ECM proteins andwith the intracellular actin cytoskeleton (via adaptor proteins).
The integrins transduce signals between the ECM and actincytoskeleton to permit transient adhesion to the ECM thusmodulating migration. Once transient attachment is estab-
lished, the extensions can be contracted to advance the cellthrough the brain tissue (45).
The actin filament distribution within the cytoskeletal
network is routinely visualized using immunocytochemistrywith fluorescently labeled phalloidin (46). To date, a majorityof cellular studies have employed such actin stain in cellsconfined to a two-dimensional (2D) environment. These earlier
works (46) implied that MPM imaging of actin filamentdistribution using this technology is not as good as confocalvisualization. Our imaging work shows that it is not the case.
As seen in the present report, in the actin visualizationexperiments, the high contrast of multiphoton imaging com-pensates well for its lower resolution. We construct clear
images of F-actin filaments extending outward from the cells,anchored appearance of these filaments to the surroundingcollagen and clear participation of these filaments in cell–cell
interactions.Much evidence accumulated in support of the claim that the
ECM can influence organization of a cell’s cytoskeleton (47).Specifically, assembly and disassembly of F-actin filaments was
identified as one of the mediators allowing ECM to alter thegrowth and differentiation of the malignant glioma cells. Theseobservations are not yet well understood, but in several cases
results suggest that malignant cells proliferate with no adhe-sion to the substratum and are characterized by the failure toassemble stress fibers (48). The imaging methods allowed us to
discover a previously unknown dynamic pooling of actin in themigrating glioblastoma cells as well as structural difference inthe actin fibers formed during the early stages of cell migration(3 days) as compared with 7 days postplating. These discov-
eries could contribute to the explanation of the migrationphenomenon of glioma cells and potentially lead to thedevelopment of new cancer therapies.
The earlier reports utilizing 3D collagen matrices (49) tostudy cellular migration observed cancer cells often to exhibit acollective movement. This collective movement is expected to
correlate with cancer invasiveness because such a clustermigration strategy is hypothesized to be more efficient, as itallows both passive and active translocation of heterogeneous
sets of cells, therefore promoting spread of cells differing inmakeup and functionality (49). Imaging in a 2D plane or
confocal microscopy (50) renders a lot of this informationunattainable. For example, in a separate experiment (unpub-lished data), using confocal imaging on the LSM510 systemutilizing 488 nm laser excitation wavelength we attempted
high-resolution visualization of the actin microspikes extend-ing from the glioma cells into the 3D matrix (alike to thoseseen in Fig. 5, the 9 lm cut from the cell surface). We could
not achieve the same visualization with confocal imaging.Another essential element of glioblastoma cell migration is
energy balance required to support rapid reorganization of
actin cytoskeletal elements, mitochondrial ATP production aswell as motor protein activity (51). Multiphoton ratiometricredox fluorometry based on cellular fluorescence from reduced
NADH and oxidized FAD has been proposed as a tool tostudy mitochondrial energy changes and metabolism (52).Using this tool, the mitochondrial energy changes in thebiological systems have been previously addressed in several
earlier studies (53–61). Recent publications range from explor-ing the potential to image relative amounts of these fluoro-phores to noninvasively monitoring changes in metabolism in
cancerogenesis (62), evaluating necrosis in skin flaps (63) andserving as an indicator for photodynamic therapy (64). In ourmigrating glioma cells, the mitochondrial redox index value
was 0.9 as determined from the most intensely fluorescing x–yoptical sections inside the cells. There was no merit in imagingthe NADH ⁄FAD fluorescence signals from the lamellopodiaof the glioma cells. We believe that the long exposure times
during imaging through the entire 3D volume, which tookabout 15 min, was a main reason for the observation of asubset of cells (40%) that became disrupted. This disruption,
therefore, can be avoided by having shorter exposure times.The 60% of the imaged cells were fine and behaved normal asverified by observing them to readily migrate after multipho-
ton imaging and to subsequently uptake the mitochondrial dyeMitotraker Orange (a sign of normally functioning mitochon-dria).
We quantified the uptake rate of Mitotraker Orange andshow that in the type of 3D hydrogel model we employ, the livemigrating glioma cells take up the mitochondrial dye inapproximately 2 h. According to a standard protocol supplied
by the manufacturer, MitoTracker Orange dye is generallyadded for 15–45 min to the cells grown on coverslips (2D cellcultures) inside the Petri dish filled with the appropriate culture
medium. These exposure times are insufficient to stain mito-chondria in the glioma cells migrating in the 3D environments.Alternatively, some researchers use overnight and longer
exposures. We observed a clear increase in cell toxicity forthe overnight staining treatments. Interestingly, we observed adistinctive difference in mitochondrial morphology detectedwith native vs dye-stained signals (Fig. 2A vs Fig. 3C). One
possible cause for this effect is that intrinsic mitochondrialsignals are much weaker than signals from the mitochondrialdyes, and emit only from certain parts of the mitochondrial
assembly. Alternatively, addition of mitochondrial dyes couldinduce a different mitochondrial appearance.
Inside the cells, the mitochondrial movement, morphology
and possibly function is potentially regulated by the cyto-skeletal system (65). For example, in Saccharomyces cerevi-siae, it was demonstrated that mitochondria bind to the
actin cytoskeleton that serves as a scaffold for the mito-chondrial movement toward their destinations. In upper
Photochemistry and Photobiology, 2011, 87 415
eukaryotic cells, the movement of mitochondria, its shapeand function is thought to be a result of coordinatedinteractions of actin filaments (microfilaments), microtubulesand intermediate filaments. The imaging methods developed
in this work, for the first time provide high resolution andcontrast spatial 3D maps for the location of actin filamentswith respect to mitochondria within migrating ACBT glio-
blastoma cells.
CONCLUSIONS
In this report we describe several interesting behaviors of liveACBT glioblastoma cells embedded within the 3D collagenhydrogels. This model aimed to emulate the in vivo environ-
ments of ACBT proliferation and migration and was charac-terized by in situ MPM. At least three discernible types of cellsare present in this model although the live migrating ACBT
glioblastoma cells are the focus of this work. We observe thatthe live migrating ACBT glioblastoma cells’ sensitivity tofemtosecond laser irradiation employed in MPM imaging is
not uniform. In situ multiphoton ratiometric redox imagingbased on cellular fluorescence from reduced NADH andoxidized FAD detects at least two different populations ofmigrating ACBT glioblastoma cells. One population of cells
maintains original morphology after the 3D imaging, as well asretains functional mitochondria. Another population is char-acterized by disruption of cellular membranes upon exposure
to the focused laser excitation. Although it is not clear if thisobservation is specific to our in vitro model, it implies thepotential therapeutic properties of focused nonlinear excita-
tion in the treatment of gliomas.To complement the existing knowledge that cell–cell body
contacts occur through actin fibers, we gain new important
details on these interactions in 3D with previously unachiev-able high resolution and contrast suitable for quantification.Monitoring fluorescence because of GFP expression in liveACBT glioma cells allows us to image the pattern for the
dynamic modulation of actin during migration. To ourknowledge, we image for the first time the creation oftemporary pools or ‘‘globes’’ of actin during this important
process in 3D and in real time. The imaging methods developedin this work could allow for more sophisticated analysis ofwhether this property is a general feature of metastatic cells. If
this is a case, it might be possible to develop new cancertherapies that specifically target cells with pooled actin.
Additionally, we can detect the spatial distribution of actinin ACBT glioma cells with respect to mitochondria and believe
it may be possible to work out an unexplored link between thefunctional performance of mitochondria, actin distributionsand glioma invasiveness in 3D. Understanding these processes
can serve as a basis for development of novel cancer diagnosticand treatment tools.
Acknowledgements—This work has been supported in part by George
E. Hewitt Medical Fellowship (J.G.L.), NIH Laser Microbeam and
Medical Program (LAMMP) at the Beckman Laser Institute, UC
Irvine (P41-RR01192), by the Air Force Office of Scientific Research
(AFOSR) under agreement number FA95 50-04-1-0101, by UC
Riverside Graduate Fellowship (Y.-J.H.), UC Riverside startup
research funds (J.G.L.), NSF CAREER Award CBET-0847070
(J.G.L.) and NSF BRIGE Award EEC-0927297 (J.G.L.).
REFERENCES1. Denk, W., J. H. Strickler and W. W. Webb (1990) Two-photon
laser scanning fluorescence microscopy. Science 248, 73–76.2. Xu, C., W. Zipfel, J. B. Shear, R. M. Williams and W. W. Webb
(1996) Multiphoton fluorescence excitation: New spectral windowfor biological nonlinear microscopy. Proc. Natl. Acad. Sci. USA93, 10763–10768.
3. Guo, Y., H. E. Savage, F. Liu, S. P. Schantz, P. P. Ho and R. R.Alfano (1999) Subsurface tumor progression investigated bynoninvasive optical second harmonic tomography. Proc. Natl.Acad. Sci. USA 96, 10854–10856.
4. Campagnola, P. J., M. D. Wei, A. Lewis and L. M. Loew (1999)High-resolution nonlinear optical imaging of live cells by secondharmonic generation. Biophys. J. 77, 3341–3349.
5. So, P. T. C., C. Y. Dong, B. Masters and K. M. Berland (2000)Two-photon excitation fluorescence microscopy. Annu. Rev.Biomed. Eng. 2, 399–429.
6. Moreaux, L., O. Sandre, M. Blanchard-Desce and J. Mertz (2000)Membrane imaging by simultaneous second-harmonic generationand two-photon microscopy. Opt. Lett. 25, 320–322.
7. Gauderon, R., P. B. Lukins and S. J. Sheppard (2001) Optimi-zation of second-harmonic generation microscopy. Micron 32,691–700.
8. Hopt, A. and E. Neher (2001) Highly nonlinear photodamagein two-photon fluorescence microscopy. Biophys. J. 80, 2029–2036.
9. Yeh, A. T., N. Nassif, A. Zoumi and B. J. Tromberg (2002)Selective corneal imaging using combined second-harmonicgeneration and two-photon excited fluorescence. Opt. Lett. 27,2082–2084.
10. Zoumi, A., A. Yeh and B. J. Tromberg (2002) Imaging cells andextracellular matrix in vivo by using second-harmonic generationand two-photon excited fluorescence. Proc. Natl. Acad. Sci. USA99, 11014–11019.
11. Wong, B. J. F., V. Wallace, M. Coleno, H. P. Benton and B. J.Tromberg (2002) Two-photon excitation laser scanning micro-scopy of human, porcine, and rabbit nasal septal cartilage. TissueEng. 7, 599–606.
12. Ragan, T. R., H. Huang and P. T. C. So (2003) In vivo and ex vivotissue applications of two-photon microscopy. Methods Enzymol.361, 481–506.
13. Brown, E., T. McKee, E. DiTomaso, A. Pluen, B. Seed and Y.Boucher (2003) Dynamic imaging of collagen and its modulationin tumors in vivo using second-harmonic generation. Nat. Med. 9,796–801.
14. Zipfel, W. R., R. M. Williams, R. Christie, A. Y. Nikitin, B. T.Hyman and W. W. Webb (2003) Live tissue intrinsic emissionmicroscopy using multiphoton-excited native fluorescence andsecond harmonic generation. Proc. Natl. Acad. Sci. USA 100,7075–7080.
15. Rubart, M. (2004) Two-photon microscopy of cells and tissues.Circ. Res. 95, 1154–1166.
16. Lyubovitsky, J. G., T. B. Krasieva, J. A. Spencer, B. Andersen andB. J. Tromberg (2005) Imaging corneal pathology in a transgenicmouse model using nonlinear microscopy. J. Biomed. Opt. 11,014013.
17. Helmchen, F. and W. Denk (2005) Deep tissue two-photonmicroscopy. Nat. Methods 2, 932–940.
18. Diaspro, A., G. Chirico and M. Collini (2005) Two-photon fluo-rescence excitation and related techniques in biological micros-copy. Q. Rev. Biophys. 38, 97–166.
19. Dunn, K. W. and P. A. Young (2006) Principles of multiphotonmicroscopy. Nephron Exp. Nephrol. 3, e33–e40.
20. Svoboda, K. a. Y. R. (2006) Principles of two-photon excitationmicroscopy and its applications to neuroscience. Neuron 50, 823–839.
21. Leppert, J., J. Krajewski, S. R. Kantelhardt, S. Schlaffer,N. Petkus, E. Reusche, G. Huttmann and A. Giese (2006) Multi-photon excitation of autofluorescence of glioma tissue. Neuro-surgery 58, 759.
22. Benninger, R. K. P., M. Hao and D. W. Piston (2008) Multi-photon excitation imaging of dynamic processes in living cells andtissues. Rev. Physiol. Biochem. Pharmacol. 160, 71–92.
416 Yu-Jer Hwang et al.

23. Hanninen, P., J. Soukka and J. T. Soini (2008) Two-photonexcitation fluorescence bioassays. Ann. N Y Acad. Sci. 1130, 320–326.
24. Hess, K. R., K. R. Broglio and M. L. Bondy (2004) Adult gliomaincidence trends in the United States, 1977–2000. Cancer 101,2293–2299.
25. Larjavaara, S., R. Mantyla, T. Salminen, H. Haapasalo, J.Raitanen, J. Jaaskelainen and A. Auvinen (2007) Incidence ofgliomas by anatomic location. Neuro Oncol. 9, 319–325.
26. Altaner, C. (2008) Glioblastoma and stem cells. Neoplasma 55,369–374.
27. Sontheimer, H. (2008) A role for glutamate in growth and inva-sion of primary brain tumors. J. Neurochem. 105, 287–295.
28. Nakada, M., S. Nakada, T. Demuth, N. L. Tran, D. B. Hoelzingerand M. E. Berens (2007) Molecular targets of glioma invasion.Cell. Mol. Life Sci. 64, 458–478.
29. Wallner, K. E., J. H. Galicich, G. Krol, E. Arbit and M. G.Malkin (1989) Patterns of failure following treatments for glio-blastoma multiform and anaplastic astrocytoma. Int. J. Radiat.Oncol. Biol. Phys. 16, 1405–1409.
30. Lefranc, F., J. Brotchi and R. Kiss (2005) Possible future issues inthe treatment of glioblastomas: Special emphasis on cell migrationand the resistance of migrating glioblastoma cells to apoptosis.J. Clin. Oncol. 23, 2411–2422.
31. Boldogh, I. R. and L. A. Pon (2006) Interactions of mitochondriawith the actin cytoskeleton. Biochim. Biophys. Acta 1763, 450–462.
32. Madsen, S. J., C. H. Sun, B. J. Tromberg, V. Cristini, N.Magalhaes and H. Hirschberg (2006) Multicell tumor spheroids inphotodynamic therapy. Lasers Surg. Med. 38, 555–564.
33. Kleihues, P. and W. K. Cavenee (2000)World Health OrganizationClassification of Tumours of the Nervous System. WHO ⁄ IARC,Lyon.
34. Louis, D. N. (2006) Molecular pathology of malignant gliomas.Annu. Rev. Pathol. Mech. Dis. 1, 97–117.
35. Schoenberg, B. S. (1983) The epidemiology of central nervoussystem tumors. In Oncology of the Nervous System (Edited by M.D. Wsaran), p. 1. Martinus Nijhoff, Boston.
36. Hirschberg, H., C. H. Sun, T. B. Krasieva and S. J. Madsen (2006)Effects of ALA-mediated photodynamic therapy on the invasive-ness of human glioma cells. Lasers Surg. Med. 38, 939–945.
37. Madsen, S. J., C. H. Sun, B. J. Tromberg, V. Wallace and H.Hirschberg (2000) Photodynamic therapy of human gliomaspheroids using 5-aminolevulinic acid. Photochem. Photobiol. 72,128–134.
38. Sutherland, R. M. and R. E. Durand (1976) Radiation response ofmuticell spheroids—An in vitro tumor model. Curr. Top. Radiat.Res. 11, 87–139.
39. Molecular Probes. Phallotoxins. Available at: http://probes.invitrogen.com/media/pis/mp00354.pdf. Accessed on 7 January2011.
40. Dunn, A. K., V. P. Wallace, M. Coleno, M. W. Berns and B. J.Tromberg (2000) Influence of optical properties on two-photonfluorescence imaging in turbid samples. Appl. Opt. 39, 1194–1201.
41. LaMorte, V. J., A. Zoumi and B. J. Tromberg (2003) Spectro-scopic approach for monitoring two-photon excited FRET fromhomodimers at the subcelluar level. J. Biomed. Opt. 8, 357–361.
42. Lyubovitsky, J. G., T. B. Krasieva, J. A. Spencer, B. Andersen andB. J. Tromberg (2005) Corneal damage revealed by endogenouscellular fluorescence and second harmonic signals from collagen.Proc. SPIE 5700, 213–217.
43. Parka, C. Y., Z. Zhua, C. Zhanga, C. S. Moona and R. S.Chuck (2006) Cellular redox state predicts in vitro cornealendothelial cell proliferation capacity. Exp. Eye Res. 83, 903–910.
44. Yamada, K. M. and E. Cukierman (2007) Modeling tissue mor-phogenesis and cancer in 3D. Cell 130, 601–610.
45. Bellail, A. C., S. B. Hunter, D. J. Brat, C. Tan and E. G. Van Meir(2004) Microregional extracellular matrix heterogeneity in brainmodulates glioma cell invasion. Int. J. Biochem. Cell Biol. 36,1046–1069.
46. Small, J. V., K. Rottner, P. Hahne and K. I. Andersen (1999)Visualizing the actin cytoskeleton. Microsc. Res. Tech. 47, 3–17.
47. Nagano, N., M. Aoyagi, K. Hirakawa, M. Yamamoto and K.Yamamoto (1996) Organization of F-actin filaments in humanglioma cell lines cultured on extracellular matrix proteins.J. Neurooncol. 27, 215–224.
48. Volk, T., B. Geiger and A. Raz (1984) Motility and adhesiveproperties of high- and low-metastatic murine neoplastic cells.Cancer Res. 44, 811–824.
49. Hegerfeldt, Y., M. Tusch, E. B. Brocker and P. Friedl (2002)Collective cell movement in primary melanoma explants: Plasticityof cell–cell interactions, beta1-integrin function, and migrationstrategies. Cancer Res. 62, 2125–2130.
50. Caspani, E. M., D. Echevarria, K. Rottner and J. V. Small(2006) Live imaging of glioblastoma cells in brain tissue showsrequirement of actin bundles for migration. Neuron Cell Biol. 2,105–114.
51. de Cavanagh, E. M., M. Ferder, F. Inserra and L. Ferder (2009)Angiotensin II, mitochondria, cytoskeletal, and extracellularmatrix connections: An integrating viewpoint. Am. J. Physiol.Heart Circ. Physiol. 296, H550–H558.
52. Huang, S., A. A. Heikal and W. W. Webb (2002) Two-photonfluorescence spectroscopy and microscopy of NAD(P)H andflavoprotein. Biophys. J. 82, 2811–2825.
53. Chance, B., P. Cohen, F. Jobsis and B. Schoener (1962) Intra-cellular oxidation-reduction states in vivo. Science 137, 499–508.
54. Chance, B. and M. Lieberman (1978) Intrinsic fluorescenceemission from the cornea at low temperatures: Evidence of mito-chondrial signals and their differing redox states in epithelial andendothelial sides. Exp. Eye Res. 26, 111–117.
55. Chance, B., I. A. Salkovitz and A. G. B. Kovach (1972) Kineticsof mitochondrial flavoprotein and pyridine nucleotide in perfusedheart. Am. J. Physiol. 223, 207–218.
56. Croce, A. C., A. Ferrigno, M. Vairetti, R. Bertone, I. Freitas andG. Bottiroli (2004) Autofluorescence properties of isolated rathepatocytes under different metabolic conditions. Photochem.Photobiol. Sci. 3, 920–926.
57. Kunz, W. and W. Kunz (1985) Contribution of different enzymesto flavoprotein fluorescence in isolated rat liver mitochondria.Biochim. Biophys. Acta 841, 237–246.
58. Kuznetsov, A. V., O. Mayboroda, D. Kunz, K. Winkler, W.Schubert and W. S. Kunz (1998) Functional imaging of mito-chondria in saponin-permeabilized mice muscle fibers. J. Cell Biol.140, 1091–1099.
59. Kuznetsov, A. V., Y. Usson, X. Leverve and R. Margreiter (2004)Subcellular heterogeneity of mitochondrial function and dys-function: Evidence obtained by confocal imaging. Mol. Cell.Biochem. 256, 359–365.
60. Masters, B. R., P. T. C. So and E. Gratton (1998) Optical biopsyof in vivo human skin: Multi-photon excitation microscopy.Lasers Med. Sci. 13, 196–203.
61. Romashko, D. N., E. Marban and B. O’Rourke (1998) Subcellularmetabolic transients and mitochondrial redox waves in heart cells.Proc. Natl. Acad. Sci. USA 95, 1618–1623.
62. Skala, M. C., K. M. Riching, A. Gendron-Fitzpatrick, J. Eickhoff,K. W. Eliceiri, J. G. White and N. Ramanujam (2007) In vivomulti-photon microscopy of NADH and FAD redox states,fluorescence lifetimes and cellular morphology in precancerousepithelia. Proc. Natl. Acad. Sci. USA 104, 19494–19499.
63. Mokry, M., P. Gal, M. Harakalova, Z. Hutnanova, J. Kusnir, S.Mozes and J. Sabo (2007) Experimental study on predicting skinflap necrosis by fluorescence in the FAD and NADH bands duringsurgery. Photochem. Photobiol. 83, 1193–1196.
64. Zhang, Z., D. Blessington, H. Li, T. M. Busch, J. Glickson, Q.Luo, B. Chance and G. Zheng (2004) Redox ratio of mitochondriaas an indicator for the response of photodynamic therapy.J. Biomed. Opt. 9, 772–778.
65. Anesti, V. and L. Scorrano (2006) The relationship betweenmitochondrial shape and function and cytoskeleton. Biochim.Biophys. Acta 1757, 692–699.
Photochemistry and Photobiology, 2011, 87 417
Copyright © 2022 FDOKUMEN