
Infrared Multiphoton Dissociation Spectroscopy of Gas-Phase Mass-Selected Hydrocarbon−Fe +...
10
Infrared Multiphoton Dissociation Spectroscopy of Cationized Threonine: Effects of Alkali-Metal Cation Size on Gas-Phase Conformation M. T. Rodgers,* ,² P. B. Armentrout,* ,‡ J. Oomens, § and J. D. Steill § Department of Chemistry, Wayne State UniVersity, Detroit, Michigan 48202, Department of Chemistry, UniVersity of Utah, Salt Lake City, Utah 84112, and FOM Institute for Plasma Physics “Rijnhuizen”, Edisonbaan 14, 3439 MN Nieuwegein, The Netherlands ReceiVed: NoVember 27, 2007; In Final Form: December 19, 2007 The gas-phase structures of alkali-metal cation complexes of threonine (Thr) are examined using infrared multiple photon dissociation (IRMPD) spectroscopy utilizing light generated by a free electron laser in conjunction with quantum chemical calculations. Spectra of Li + (Thr) and Na + (Thr) are similar and relatively simple, whereas K + (Thr), Rb + (Thr), and Cs + (Thr) include distinctive new IR bands. Measured IRMPD spectra are compared to spectra calculated at a B3LYP/6-311+G(d,p) level to identify the structures present in the experimental studies. For the smaller metal cations, the spectra match those predicted for charge-solvated structures in which the ligand exhibits tridentate coordination, M1[N,CO,OH], binding to the amide and carbonyl groups of the amino acid backbone and to the hydroxyl group of the side chain. K + (Thr), Rb + (Thr), and Cs + (Thr) exhibit evidence of the charge-solvated complex, M3[COOH], in which the metal cation binds to the carboxylic acid group. Evidence for a small population of the zwitterionic analogue of this structure, ZW[CO 2 - ], is also present, particularly for the Cs + complex. Calculations indicate that the relative stability of the M3[COOH] structure is very strongly dependent on the size of the metal cation, consistent with the range of conformations observed experimentally. The present results are similar to those obtained previously for the analogous M + (Ser) complexes, although there are subtle distinctions that are discussed. Introduction It is known that sodium cations drive the transport of free serine (Ser) and threonine (Thr) and their peptide forms into an asaccharolytic, Gram-negative bacterium called porphyromonas gingivalis. 1 Therefore, a quantitative assessment of the pairwise interactions between amino acids and peptides with alkali-metal cations is potentially useful in understanding the thermodynam- ics of such processes. In a recent guided ion beam mass spectrometry study of the complexes of the alkali-metal cations, Li + , Na + , and K + , with Ser and Thr, 2 quantitative bond dissociation energies (BDEs) were found to be nearly identical for both ligands, consistent with their very similar structures (differing only by a methyl group). Likewise, a theoretical study of the possible conformations found BDEs in good agreement with experiment for the predicted ground-state conformers, charge-solvated structures involving tridentate binding to the amide and carbonyl groups of the amino acid backbone combined with interaction with the side-chain hydroxyl group, M1[N,CO,OH] (see below for a definition of the nomenclature used). For these three M + (Thr) complexes, the M1[N,CO,OH] ground-state conformation is calculated to lie well below (>8 kJ/mol) any other conformations, such that quantitative bond energy measurements are sufficient to determine the identity of the complexes formed experimentally. 2 However, the energy gaps between the ground-state and excited conformations are calculated to narrow as the size of the metal cation increases such that alternate conformations may appear with the heavier alkali-metal cations. Indeed, our recent infrared multiphoton dissociation (IRMPD) spectroscopy study of the related M + (Ser) complexes, where M + ) Li + , Na + ,K + , Rb + , and Cs + , found evidence for the bidentate M3[COOH] conformation appearing in the potassium and rubidium complexes as well as the zwitterionic ZW[CO 2 - ] for the cesium complex. 3 The additional methyl group in Thr compared to Ser could subtly shift the relative stabilities of these alternate isomers, a process that can be studied spectroscopically. In other similar work, IRMPD spectroscopy studies of M + (Trp) 4 and M + (Lys) 5 find a shift from charge-solvated tridentate to charge-solvated bidentate binding as the metal cation gets heavier, whereas IRMPD spectra of M + (Arg) 6 show a transition between charge- solvated and zwitterionic structures occurring at M + ) Na + . In the present study, we measure the IRMPD action spectra for dissociation of the M + (Thr) complexes, where M + ) Li + , Na + , K + , Rb + , and Cs + , and compare them to our findings for the analogous M + (Ser) complexes. Identification of the conforma- tions present is achieved by comparison to IR spectra derived from quantum chemical calculations of the low-lying structures of the M + (Thr) complexes with optimized structures and vibrational frequencies determined at the B3LYP/6-311+G(d,p) level of theory. Experimental and Computational Section Mass Spectrometry and Photodissociation. A 4.7 T Fourier- transform ion cyclotron resonance (FTICR) mass spectrometer was used in these experiments and has been described in detail elsewhere. 7-9 Tunable radiation for the photodissociation ex- periments is generated by the free electron laser for infrared experiments (FELIX). 10 For the present experiments, spectra were recorded over the wavelength range from 19.4 (520 cm -1 ) * To whom correspondence should be addressed. ² Wayne State University. ‡ University of Utah. § FOM Institute for Plasma Physics “Rijnhuizen”. 2258 J. Phys. Chem. A 2008, 112, 2258-2267 10.1021/jp711237g CCC: $40.75 © 2008 American Chemical Society Published on Web 02/21/2008
-
Upload
independent -
Category
Documents
-
view
1 -
download
0
Transcript of Infrared Multiphoton Dissociation Spectroscopy of Gas-Phase Mass-Selected Hydrocarbon−Fe +...
Infrared Multiphoton Dissociation Spectroscopy of Cationized Threonine:Effects of Alkali-Metal Cation Size on Gas-Phase Conformation
M. T. Rodgers,*,† P. B. Armentrout,* ,‡ J. Oomens,§ and J. D. Steill§
Department of Chemistry, Wayne State UniVersity, Detroit, Michigan 48202, Department of Chemistry,UniVersity of Utah, Salt Lake City, Utah 84112, and FOM Institute for Plasma Physics “Rijnhuizen”,Edisonbaan 14, 3439 MN Nieuwegein, The Netherlands
ReceiVed: NoVember 27, 2007; In Final Form: December 19, 2007
The gas-phase structures of alkali-metal cation complexes of threonine (Thr) are examined using infraredmultiple photon dissociation (IRMPD) spectroscopy utilizing light generated by a free electron laser inconjunction with quantum chemical calculations. Spectra of Li+(Thr) and Na+(Thr) are similar and relativelysimple, whereas K+(Thr), Rb+(Thr), and Cs+(Thr) include distinctive new IR bands. Measured IRMPD spectraare compared to spectra calculated at a B3LYP/6-311+G(d,p) level to identify the structures present in theexperimental studies. For the smaller metal cations, the spectra match those predicted for charge-solvatedstructures in which the ligand exhibits tridentate coordination, M1[N,CO,OH], binding to the amide and carbonylgroups of the amino acid backbone and to the hydroxyl group of the side chain. K+(Thr), Rb+(Thr), andCs+(Thr) exhibit evidence of the charge-solvated complex, M3[COOH], in which the metal cation binds tothe carboxylic acid group. Evidence for a small population of the zwitterionic analogue of this structure,ZW[CO2
-], is also present, particularly for the Cs+ complex. Calculations indicate that the relative stabilityof the M3[COOH] structure is very strongly dependent on the size of the metal cation, consistent with therange of conformations observed experimentally. The present results are similar to those obtained previouslyfor the analogous M+(Ser) complexes, although there are subtle distinctions that are discussed.
Introduction
It is known that sodium cations drive the transport of freeserine (Ser) and threonine (Thr) and their peptide forms into anasaccharolytic, Gram-negative bacterium called porphyromonasgingivalis.1 Therefore, a quantitative assessment of the pairwiseinteractions between amino acids and peptides with alkali-metalcations is potentially useful in understanding the thermodynam-ics of such processes. In a recent guided ion beam massspectrometry study of the complexes of the alkali-metal cations,Li+, Na+, and K+, with Ser and Thr,2 quantitative bonddissociation energies (BDEs) were found to be nearly identicalfor both ligands, consistent with their very similar structures(differing only by a methyl group). Likewise, a theoretical studyof the possible conformations found BDEs in good agreementwith experiment for the predicted ground-state conformers,charge-solvated structures involving tridentate binding to theamide and carbonyl groups of the amino acid backbonecombined with interaction with the side-chain hydroxyl group,M1[N,CO,OH] (see below for a definition of the nomenclatureused). For these three M+(Thr) complexes, the M1[N,CO,OH]ground-state conformation is calculated to lie well below (>8kJ/mol) any other conformations, such that quantitative bondenergy measurements are sufficient to determine the identityof the complexes formed experimentally.2 However, the energygaps between the ground-state and excited conformations arecalculated to narrow as the size of the metal cation increasessuch that alternate conformations may appear with the heavier
alkali-metal cations. Indeed, our recent infrared multiphotondissociation (IRMPD) spectroscopy study of the relatedM+(Ser) complexes, where M+ ) Li+, Na+, K+, Rb+, and Cs+,found evidence for the bidentate M3[COOH] conformationappearing in the potassium and rubidium complexes as well asthe zwitterionic ZW[CO2
-] for the cesium complex.3 Theadditional methyl group in Thr compared to Ser could subtlyshift the relative stabilities of these alternate isomers, a processthat can be studied spectroscopically. In other similar work,IRMPD spectroscopy studies of M+(Trp)4 and M+(Lys)5 finda shift from charge-solvated tridentate to charge-solvatedbidentate binding as the metal cation gets heavier, whereasIRMPD spectra of M+(Arg)6 show a transition between charge-solvated and zwitterionic structures occurring at M+ ) Na+. Inthe present study, we measure the IRMPD action spectra fordissociation of the M+(Thr) complexes, where M+ ) Li+, Na+,K+, Rb+, and Cs+, and compare them to our findings for theanalogous M+(Ser) complexes. Identification of the conforma-tions present is achieved by comparison to IR spectra derivedfrom quantum chemical calculations of the low-lying structuresof the M+(Thr) complexes with optimized structures andvibrational frequencies determined at the B3LYP/6-311+G(d,p)level of theory.
Experimental and Computational Section
Mass Spectrometry and Photodissociation.A 4.7 T Fourier-transform ion cyclotron resonance (FTICR) mass spectrometerwas used in these experiments and has been described in detailelsewhere.7-9 Tunable radiation for the photodissociation ex-periments is generated by the free electron laser for infraredexperiments (FELIX).10 For the present experiments, spectrawere recorded over the wavelength range from 19.4 (520 cm-1)
* To whom correspondence should be addressed.† Wayne State University.‡ University of Utah.§ FOM Institute for Plasma Physics “Rijnhuizen”.
2258 J. Phys. Chem. A2008,112,2258-2267
10.1021/jp711237g CCC: $40.75 © 2008 American Chemical SocietyPublished on Web 02/21/2008
to 5.5µm (1820 cm-1). Pulse energies were around 50 mJ permacropulse of 5µs duration, although they fell off to about 20mJ toward the blue edge of the scan range. The fwhm bandwidthof the laser was typically 0.5% of the central wavelength.Threonine was obtained from Aldrich. Cationized amino acidswere formed by electrospray ionization using a MicromassZ-Spray source and a solution of 3.0 mM amino acid and 0.5-1.0 mM alkali-metal chloride in 70%:30% MeOH/H2O solu-tions. Solution flow rates ranged from 15 to 30µL/min, andthe electrospray needle was generally held at a voltage of∼3.2kV. Ions were accumulated in a hexapole trap for about 4 sprior to being injected into the ICR cell via a radiofrequency(rf) octopole ion guide. Electrostatic switching of the dc biasof the octopole allows ions to be captured in the ICR cell withoutthe use of a gas pulse, thus avoiding collisional heating of theions.8 Ions were irradiated for 3 s, which corresponds tointeraction with 15 macropulses.
Computational Details. In previous work,2 Ye and Armen-trout examined all likely conformers of threonine and itscomplexes with Li+, Na+, and K+ using a simulated annealingprocedure that combines annealing cycles and quantum chemicalcalculations.11 Briefly, the AMBER program and AMBER forcefield based on molecular mechanics12 were used to search forpossible stable structures in each system’s conformational space.All possible structures identified in this way were furtheroptimized using NWChem13 at the HF/3-21G level.14,15Uniquestructures for each system within 50 kJ/mol of the lowest energystructure (∼30 for each complex) were further optimized usingGaussian 0316 at the B3LYP/6-31G(d) level17,18 with “loose”optimization (maximum step size of 0.01 au and a rms force of0.0017 au) to facilitate convergence. Because threonine has2S,3R chirality, this property is constrained throughout theannealing simulations. The 10-15 lowest energy structuresobtained from this procedure were then chosen for higher levelgeometry optimizations and frequency calculations using densityfunctional theory (DFT) at the B3LYP/6-311+G(d,p) level.19,20
This level of theory has been shown to provide reasonablyaccurate structural descriptions of comparable metal-ligandsystems.11,21 Single-point energy calculations were carried outfor the 6-15 most stable structures at the B3LYP, B3P86, andMP2(full) levels using the 6-311+G(2d,2p) basis set.19 Zero-point vibrational energy (ZPE) corrections were determinedusing vibrational frequencies calculated at the B3LYP/6-311+G-(d,p) level scaled by a factor of 0.9804.22
For the Rb+ and Cs+ complexes studied here, all conforma-tions considered previously for K+(Thr) were used as startingpoints for geometry and vibrational frequency calculationsoptimized at the B3LYP/HW*/6-311+G(d,p) level, where HW*indicates that Rb and Cs were described using the effective corepotentials (ECPs) and valence basis sets of Hay and Wadt23
with a single d polarization function (exponents of 0.24 and0.19, respectively) included.24 Relative energies were determinedusing single-point energies at the B3LYP, B3P86, and MP2-(full) levels using the HW*/6-311+G(2d,2p) basis set. In ourprevious work on serine complexes,3 we performed similar HW*calculations for the K+(Ser) complexes (with an exponent of0.48 for the d polarization function on K) in order to assess theaccuracy of the Hay-Wadt ECP/valence basis sets. It was foundthat vibrational frequencies calculated using the all-electron vsHW* basis sets on K yield results that differ by an average ofless than 0.03%. Hence, we did not perform HW* calculationson the K+(Thr) complex and conclude that use of the HW*basis sets for the Rb and Cs systems should yield equivalentresults to the all-electron basis sets used for the smaller cations.
Vibrational frequencies and intensities were calculated usingthe harmonic oscillator approximation and analytical derivativesof the energy-minimized Hessian calculated at the B3LYP/6-311+G(d,p) or B3LYP/HW*/6-311+G(d,p) level of theory.Frequencies were scaled by 0.9804 to eliminate known sys-tematic errors.22 For comparison to experiment, calculatedvibrational frequencies are broadened using a 20 cm-1 fwhmGaussian line shape. A detailed list of the theoretically predictedfrequencies and IR intensities for the three main conformers ofM+(Thr) are provided as Tables S1-S3 in the SupportingInformation. Table S4 provides this information for the remain-ing conformers of Li+(Thr).
Results and Discussion
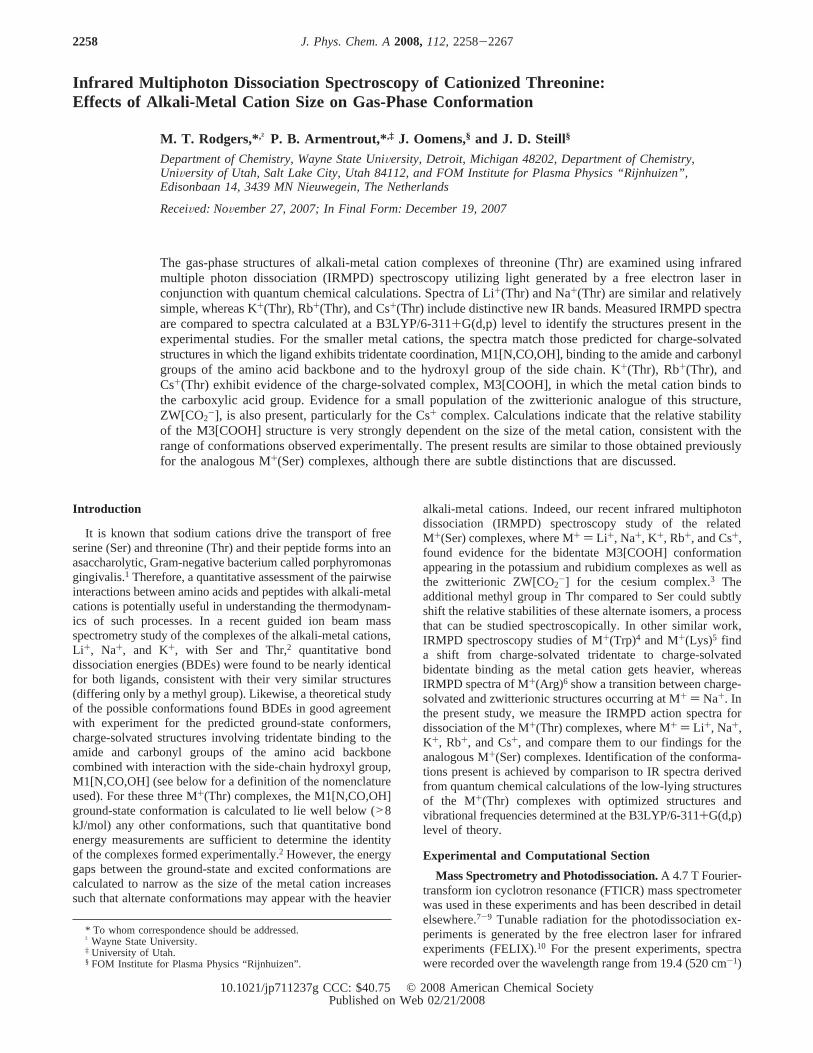
IRMPD Action Spectroscopy. Photodissociation ofM+(Thr), where M+ ) K+, Rb+, and Cs+, results in the loss ofthe intact ligand to form the atomic metal cation. This isconsistent with collision-induced dissociation (CID) results forthe potassiated complexes2 and with results for IRMPD on theanalogous M+(Ser) complexes.3 In these systems, IRMPD actionspectra are taken from the relative intensity of the M+ production as a function of laser wavelength and are shown in Figure1. No corrections for laser power were applied but wouldprimarily enhance the intensities observed at the highest laserfrequencies.
For the Na+(Thr) complex, formation of the atomic metalcation is the dominant product observed, but product ionscorresponding to losses of H2O and CH3CHO are also observed.The latter were not observed in the CID spectra,2 suggestingthat these channels are relatively low in energy but entropicallydisfavored, such that their production is enhanced by the slowheating afforded by IRMPD. The sum of the Na+, Na+(Thr-H2O), and Na+(Thr-CH3CHO) channels is shown as theIRMPD action spectrum in Figure 1. To a first approximation,the relative magnitudes are 60:30:10, respectively, but there are
Figure 1. Infrared multiphoton dissociation action spectra of M+(Thr)complexes, where M+ ) Li +, Na+, K+, Rb+, and Cs+.
Dissociation Spectroscopy of Cationized Threonine J. Phys. Chem. A, Vol. 112, No. 11, 20082259
considerable variations in the relative intensities in differentbands, as shown in Figure S1 in the Supporting Information.Chief among these is that formation of H2O loss becomesrelatively more important as the frequency decreases, such thatthe Na+ and H2O loss product channels have nearly equivalentintensities in the band at 640 cm-1. In addition, there is a slightred shift in the band at 1750 cm-1 for loss of Na+ compared toH2O loss. In IRMPD spectroscopy, a slight red shift inabsorption bands is often observed for higher energy dissociationchannels as a result of an increased influence of vibrationalanharmonicity.25,26
In the case of Li+(Thr), atomic Li+ has a mass too low to beobserved easily in the FTICR; however, the CID spectra exhibittwo low-energy channels: loss of H2O and loss of the isobaricCH3CHO or CO2.2 At somewhat higher energies, loss of twoH2O and CH3CHO/CO2 + H2O from the complex as well asformation of Li+(H2O) and Li+(CH3CHO) are also observed.2
Upon photodissociation, loss of H2O and CH3CHO are observedwith the high resolution of the FTICR finding no loss of carbondioxide. The sum of these two channels is shown as the IRMPDaction spectrum in Figure 1. Loss of CH3CHO exhibits anintensity about twice that of H2O loss throughout the observedspectrum, Figure S1, although there is a slight red shift in the1730 cm-1 band for loss of H2O compared to CH3CHO loss.As noted above, this can be attributed to the influence ofvibrational anharmonicity.
Comparison of the five spectra in Figure 1 shows that thefeatures observed in the Li+(Thr) spectrum are retained for allof the metal cation complexes but that new spectral featuresbegin to appear for K+(Thr) and become pronounced forCs+(Thr). The band at 1730 cm-1 shifts to the blue as the metalcation becomes heavier, as do the minor bands at 1100 and 1230cm-1. In contrast, those at 700, 970, and 1420 cm-1 shift to thered, and the bands at 640, 1150, and 1600 cm-1 shift very little.The band at 1160 cm-1 in the Li+(Thr) spectrum shifts to thered for Na+(Thr) but then remains relatively constant forcomplexes of the heavier metal cations.
Theoretical Results.A detailed discussion of the structuresof threonine and its metal cation complexes with Li+, Na+, andK+ can be found elsewhere.2 As described above, complexeswith Rb+ and Cs+ were calculated here at the B3LYP/HW*/6-311+G(d,p) level starting with the structures of all low-lyingpotassiated complexes located previously, a total of sevenconformations. The nomenclature used to identify these differentstructural isomers is taken from that established previously forNa+(Gly).11,27,28Briefly, neutral threonine is designated as Nx,wherex indicates one of three main types of structural isomers
with different modes of intramolecular hydrogen bonding. Thisis followed by a notation that indicates the relative position(either trans) t or gauche) g) of the -OH group to thecarbonyl carbon and its position relative to the amino nitrogen.Conformations of M+(Thr) are identified as My (wherey refersto a specific structure as first designated by Jensen for glycinecomplexes29) augmented by a notation in brackets that describesthe metal binding sites for each isomer. The zwitterionicconformer is designated as ZW[CO2
-].
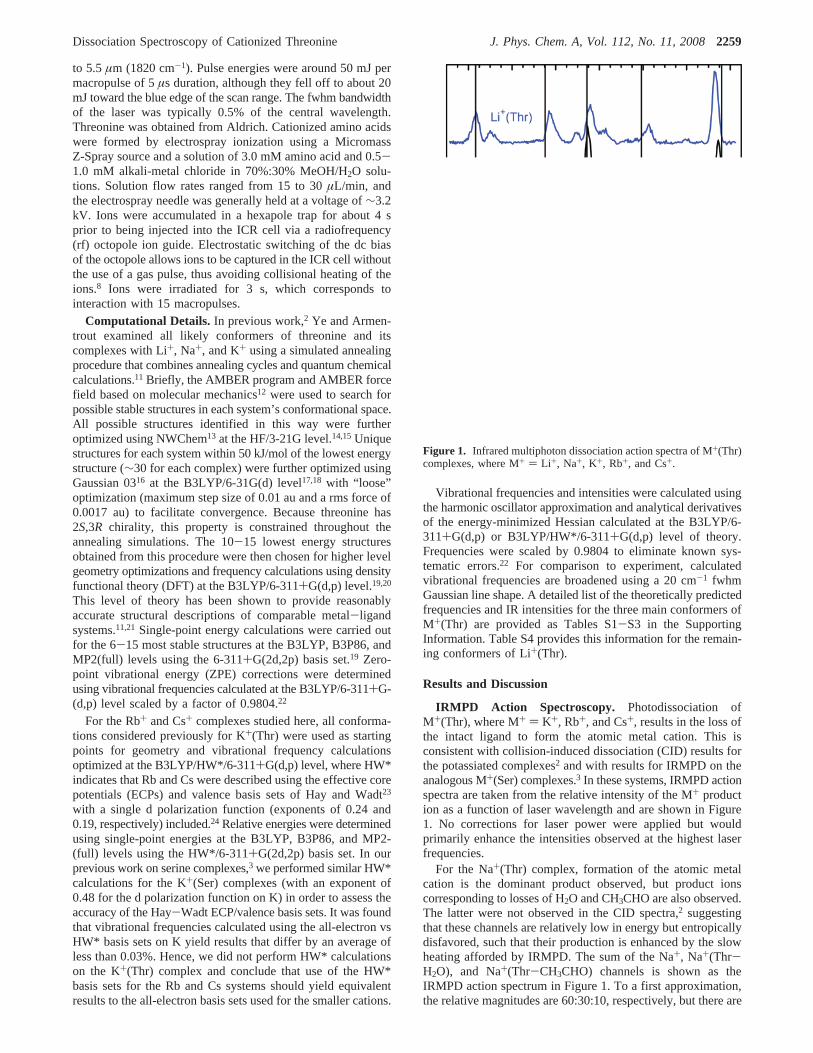
Single-point energies including zero-point energy (ZPE)corrections calculated at three different levels of theory, relativeto the lowest energy isomer, are given in Table 1 for M+(Thr).Because the relative Gibbs free energies at 298 K may be morerelevant in the determination of the experimental distribution,these values are also listed in Table 1. Figure 2 shows the overalltrends in the relative∆298G values (B3LYP results), which arevery similar to those of the relative∆0H values. The maindifferences arise because the tridentate binding conformers,M1[N,CO,OH] and M5[N,OH,OH], have smaller entropiccontributions compared to the bidentate binding conformers,such that they become 2-4 kJ/mol less stable. The other levelsof theory show similar trends as those in Figure 2, although
Figure 2. Gibbs free energies (kJ/mol) calculated at the B3LYP levelof theory (Table 1) of five conformations of M+(Thr) complexes as afunction of the alkali-metal cation identity relative to the energy of theM1[N,CO,OH]-cis-OH conformer.
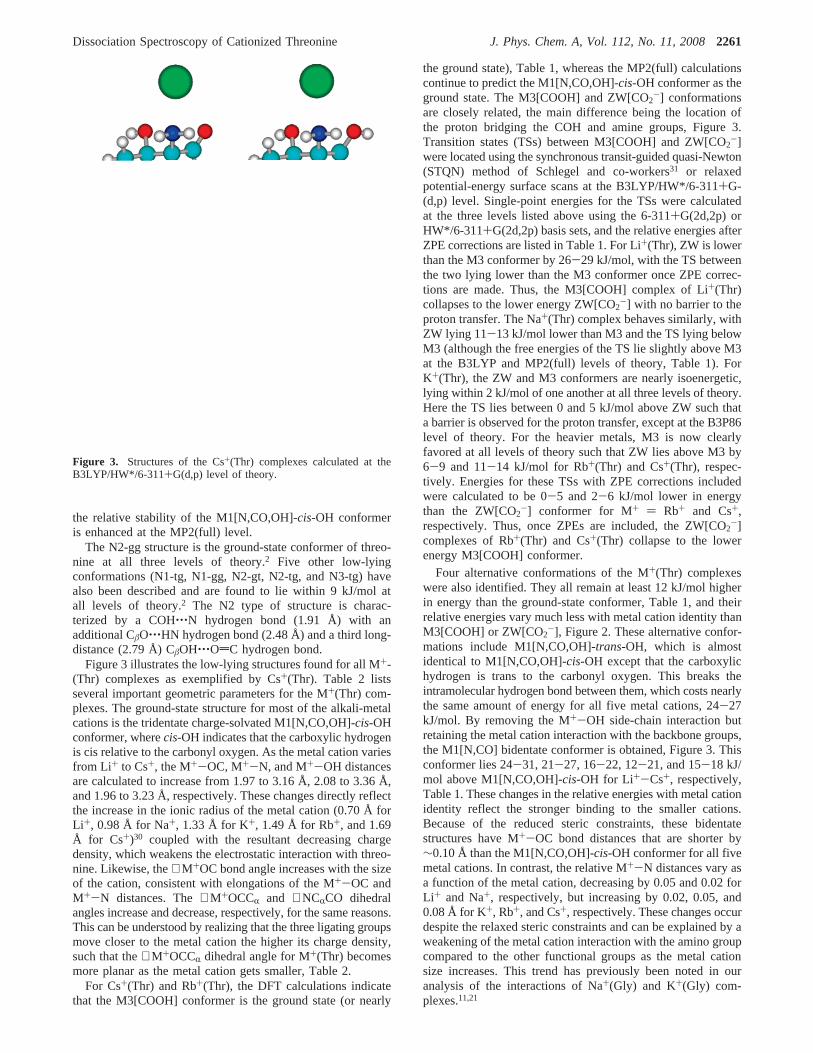
TABLE 1: Relative Energies at 0 K and Free Energies at298 K (kJ/mol) of Low-Lying Conformers of M +(Thr) a
complex structure B3LYP B3P86 MP2(full)
Li +(Thr) M1[N,CO,OH]- cis-OH 0.0 (0.0) 0.0 (0.0) 0.0 (0.0)M1[N,CO] 25.5 (23.4) 24.6 (22.4) 30.9 (28.8)M1[N,CO,OH]-trans-OH 26.1 (26.0) 25.6 (25.5) 26.8 (26.7)M8[CO,OH] 26.2 (25.1) 25.1 (24.0) 35.0 (33.9)M5[N,OH,OH] 28.8 (28.5) 30.3 (30.0) 25.1 (24.8)ZW[CO2
-] 33.1 (30.5) 29.6 (27.0) 37.1 (34.4)TS(M3-ZW) 57.4 (55.6) 48.6 (46.7) 61.7 (59.9)M3[COOH] 61.8 (58.3) 56.3 (52.8) 66.4 (62.9)
Na+(Thr) M1[N,CO,OH]- cis-OH 0.0 (0.0) 0.0 (0.0) 0.0 (0.0)ZW[CO2
-] 18.8 (16.6) 14.9 (12.8) 23.2 (21.1)M1[N,CO] 22.8 (20.0) 21.5 (18.7) 26.9 (24.2)M1[N,CO,OH]-trans-OH 26.2 (26.0) 25.7 (25.5) 26.8 (26.6)M8[CO,OH] 26.5 (24.7) 24.0 (22.2) 32.3 (30.6)M5[N,OH,OH] 29.0 (28.9) 28.7 (28.6) 24.4 (24.3)TS(M3-ZW) 30.9 (29.5) 21.4 (20.0) 34.4 (33.0)M3[COOH] 31.7 (28.4) 26.5 (23.1) 34.8 (32.4)
K+(Thr) M1[N,CO,OH]- cis-OH 0.0 (0.0) 0.0 (0.0) 0.0 (0.0)ZW[CO2
-] 10.1 (8.4) 6.3 (4.7) 17.8 (16.1)M3[COOH] 11.1 (7.8) 7.8 (4.5) 17.4 (14.1)TS(M3-ZW) 14.6 (13.2) 6.3 (4.8) 21.3 (19.8)M1[N,CO] 17.6 (15.1) 16.2 (13.6) 22.1 (19.6)M8[CO,OH] 18.9 (16.6) 16.6 (14.4) 25.7 (23.4)M1[N,CO,OH]-trans-OH 24.8 (24.3) 24.7 (24.4) 25.8 (25.4)M5[N,OH,OH] 25.5 (25.0) 26.9 (26.4) 23.2 (22.8)
Rb+(Thr) M1[N,CO,OH]- cis-OH 0.0 (2.4) 2.3 (5.5) 0.0 (0.0)M3[COOH] 0.9 (0.0) 0.0 (0.0) 10.2 (6.9)ZW[CO2
-] 8.1 (8.9) 6.5 (8.2) 19.3 (17.8)TS(M3-ZW) 8.2 (8.9) 2.1 (3.7) 18.0 (16.3)M1[N,CO] 12.6 (11.9) 14.6 (14.8) 20.6 (17.6)M8[CO,OH] 14.2 (13.6) 15.0 (15.3) 23.2 (20.3)M5[N,OH,OH] 24.3 (26.0) 27.4 (30.1) 21.4 (20.8)M1[N,CO,OH]-trans-OH 24.6 (26.7) 26.6 (29.5) 25.3 (25.0)
Cs+(Thr) M3[COOH] 0.0 (0.0) 0.0 (0.0) 4.3 (0.7)M1[N,CO,OH]- cis-OH 5.7 (9.3) 8.4 (11.9) 0.0 (0.0)TS (M3-ZW) 10.2 (11.8) 4.8 (6.5) 15.2 (12.5)ZW[CO2
-] 12.1 (13.9) 10.8 (12.7) 18.1 (16.3)M1[N,CO] 15.2 (15.7) 17.9 (18.4) 17.3 (14.2)M8[CO,OH] 16.9 (17.0) 18.3 (18.5) 20.3 (16.8)M5[N,OH,OH] 29.0 (31.4) 32.4 (34.8) 21.4 (20.2)M1[N,CO,OH]-trans-OH 29.8 (32.7) 32.2 (35.1) 24.7 (24.0)
a Free energies are in parentheses. All values calculated at the levelof theory indicated using the 6-311+G(2d,2p) basis set with structuresand zero-point energies calculated at the B3LYP/6-311+G(d,p) levelof theory. Values for Rb and Cs use the HW* basis set on the metal.The ground-state conformer is indicated in bold face.
2260 J. Phys. Chem. A, Vol. 112, No. 11, 2008 Rodgers et al.
the relative stability of the M1[N,CO,OH]-cis-OH conformeris enhanced at the MP2(full) level.
The N2-gg structure is the ground-state conformer of threo-nine at all three levels of theory.2 Five other low-lyingconformations (N1-tg, N1-gg, N2-gt, N2-tg, and N3-tg) havealso been described and are found to lie within 9 kJ/mol atall levels of theory.2 The N2 type of structure is charac-terized by a COH‚‚‚N hydrogen bond (1.91 Å) with anadditional CâO‚‚‚HN hydrogen bond (2.48 Å) and a third long-distance (2.79 Å) CâOH‚‚‚OdC hydrogen bond.
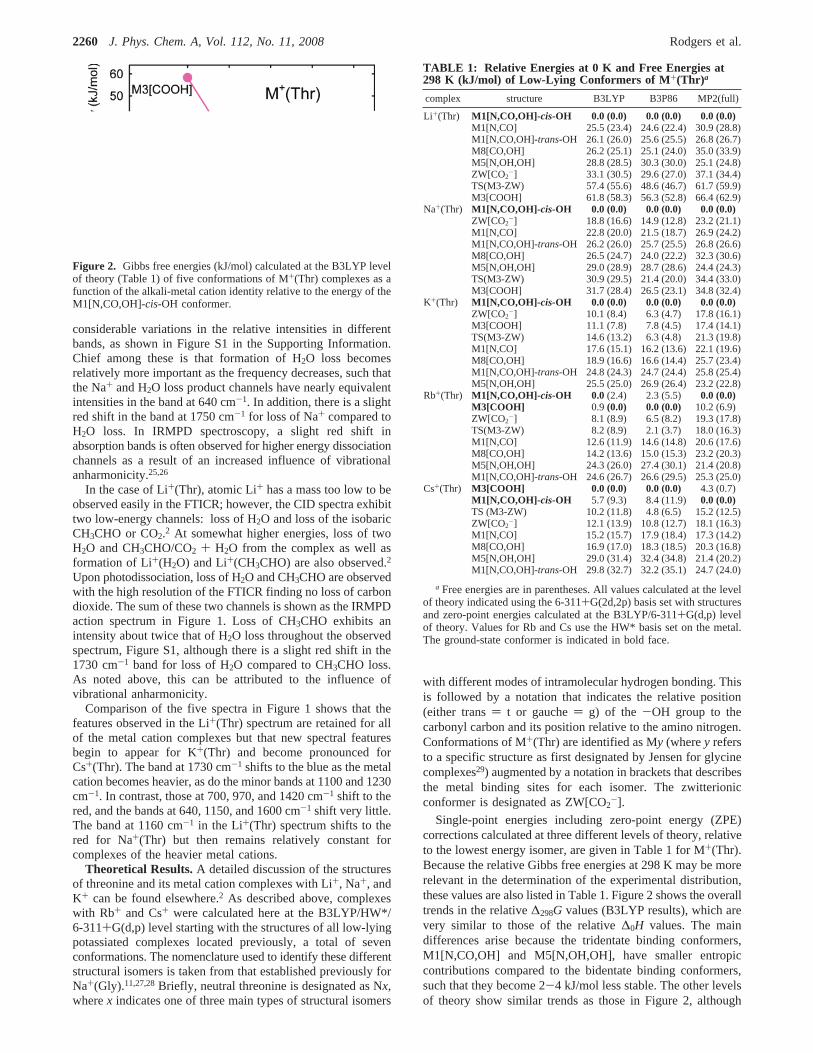
Figure 3 illustrates the low-lying structures found for all M+-(Thr) complexes as exemplified by Cs+(Thr). Table 2 listsseveral important geometric parameters for the M+(Thr) com-plexes. The ground-state structure for most of the alkali-metalcations is the tridentate charge-solvated M1[N,CO,OH]-cis-OHconformer, wherecis-OH indicates that the carboxylic hydrogenis cis relative to the carbonyl oxygen. As the metal cation variesfrom Li+ to Cs+, the M+-OC, M+-N, and M+-OH distancesare calculated to increase from 1.97 to 3.16 Å, 2.08 to 3.36 Å,and 1.96 to 3.23 Å, respectively. These changes directly reflectthe increase in the ionic radius of the metal cation (0.70 Å forLi+, 0.98 Å for Na+, 1.33 Å for K+, 1.49 Å for Rb+, and 1.69Å for Cs+)30 coupled with the resultant decreasing chargedensity, which weakens the electrostatic interaction with threo-nine. Likewise, the∠M+OC bond angle increases with the sizeof the cation, consistent with elongations of the M+-OC andM+-N distances. The∠M+OCCR and ∠NCRCO dihedralangles increase and decrease, respectively, for the same reasons.This can be understood by realizing that the three ligating groupsmove closer to the metal cation the higher its charge density,such that the∠M+OCCR dihedral angle for M+(Thr) becomesmore planar as the metal cation gets smaller, Table 2.
For Cs+(Thr) and Rb+(Thr), the DFT calculations indicatethat the M3[COOH] conformer is the ground state (or nearly
the ground state), Table 1, whereas the MP2(full) calculationscontinue to predict the M1[N,CO,OH]-cis-OH conformer as theground state. The M3[COOH] and ZW[CO2
-] conformationsare closely related, the main difference being the location ofthe proton bridging the COH and amine groups, Figure 3.Transition states (TSs) between M3[COOH] and ZW[CO2
-]were located using the synchronous transit-guided quasi-Newton(STQN) method of Schlegel and co-workers31 or relaxedpotential-energy surface scans at the B3LYP/HW*/6-311+G-(d,p) level. Single-point energies for the TSs were calculatedat the three levels listed above using the 6-311+G(2d,2p) orHW*/6-311+G(2d,2p) basis sets, and the relative energies afterZPE corrections are listed in Table 1. For Li+(Thr), ZW is lowerthan the M3 conformer by 26-29 kJ/mol, with the TS betweenthe two lying lower than the M3 conformer once ZPE correc-tions are made. Thus, the M3[COOH] complex of Li+(Thr)collapses to the lower energy ZW[CO2
-] with no barrier to theproton transfer. The Na+(Thr) complex behaves similarly, withZW lying 11-13 kJ/mol lower than M3 and the TS lying belowM3 (although the free energies of the TS lie slightly above M3at the B3LYP and MP2(full) levels of theory, Table 1). ForK+(Thr), the ZW and M3 conformers are nearly isoenergetic,lying within 2 kJ/mol of one another at all three levels of theory.Here the TS lies between 0 and 5 kJ/mol above ZW such thata barrier is observed for the proton transfer, except at the B3P86level of theory. For the heavier metals, M3 is now clearlyfavored at all levels of theory such that ZW lies above M3 by6-9 and 11-14 kJ/mol for Rb+(Thr) and Cs+(Thr), respec-tively. Energies for these TSs with ZPE corrections includedwere calculated to be 0-5 and 2-6 kJ/mol lower in energythan the ZW[CO2
-] conformer for M+ ) Rb+ and Cs+,respectively. Thus, once ZPEs are included, the ZW[CO2
-]complexes of Rb+(Thr) and Cs+(Thr) collapse to the lowerenergy M3[COOH] conformer.
Four alternative conformations of the M+(Thr) complexeswere also identified. They all remain at least 12 kJ/mol higherin energy than the ground-state conformer, Table 1, and theirrelative energies vary much less with metal cation identity thanM3[COOH] or ZW[CO2
-], Figure 2. These alternative confor-mations include M1[N,CO,OH]-trans-OH, which is almostidentical to M1[N,CO,OH]-cis-OH except that the carboxylichydrogen is trans to the carbonyl oxygen. This breaks theintramolecular hydrogen bond between them, which costs nearlythe same amount of energy for all five metal cations, 24-27kJ/mol. By removing the M+-OH side-chain interaction butretaining the metal cation interaction with the backbone groups,the M1[N,CO] bidentate conformer is obtained, Figure 3. Thisconformer lies 24-31, 21-27, 16-22, 12-21, and 15-18 kJ/mol above M1[N,CO,OH]-cis-OH for Li+-Cs+, respectively,Table 1. These changes in the relative energies with metal cationidentity reflect the stronger binding to the smaller cations.Because of the reduced steric constraints, these bidentatestructures have M+-OC bond distances that are shorter by∼0.10 Å than the M1[N,CO,OH]-cis-OH conformer for all fivemetal cations. In contrast, the relative M+-N distances vary asa function of the metal cation, decreasing by 0.05 and 0.02 forLi+ and Na+, respectively, but increasing by 0.02, 0.05, and0.08 Å for K+, Rb+, and Cs+, respectively. These changes occurdespite the relaxed steric constraints and can be explained by aweakening of the metal cation interaction with the amino groupcompared to the other functional groups as the metal cationsize increases. This trend has previously been noted in ouranalysis of the interactions of Na+(Gly) and K+(Gly) com-plexes.11,21
Figure 3. Structures of the Cs+(Thr) complexes calculated at theB3LYP/HW*/6-311+G(d,p) level of theory.
Dissociation Spectroscopy of Cationized Threonine J. Phys. Chem. A, Vol. 112, No. 11, 20082261
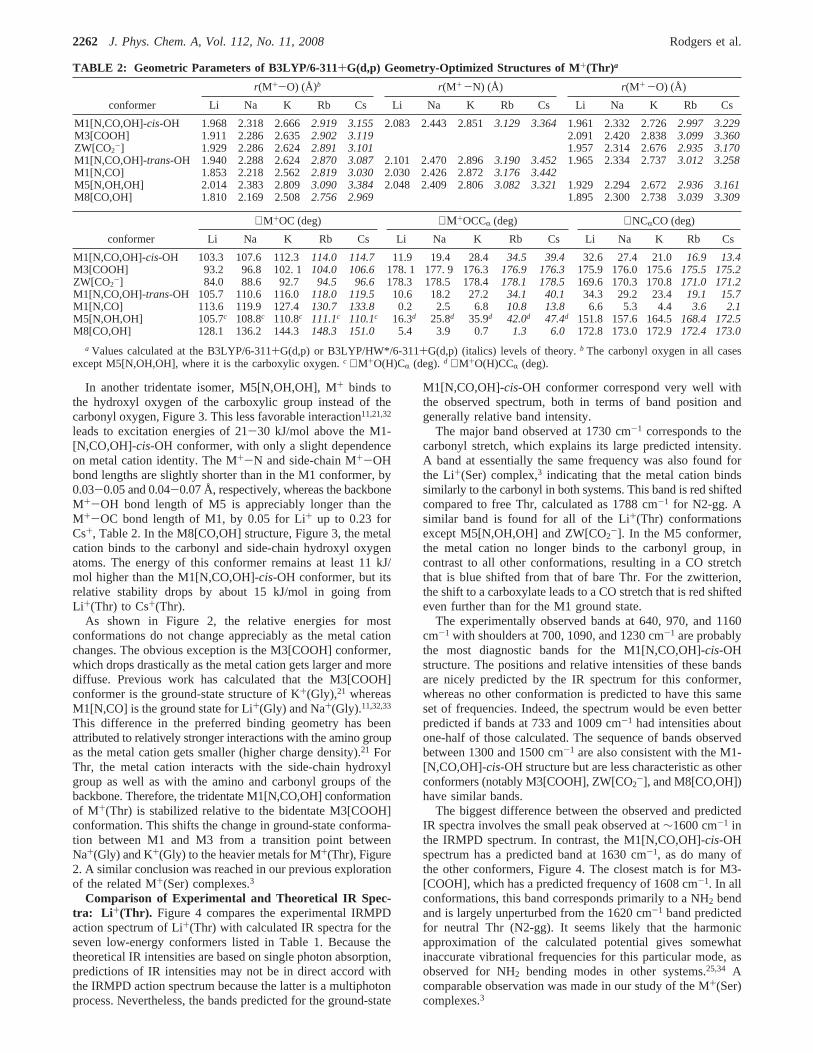
In another tridentate isomer, M5[N,OH,OH], M+ binds tothe hydroxyl oxygen of the carboxylic group instead of thecarbonyl oxygen, Figure 3. This less favorable interaction11,21,32
leads to excitation energies of 21-30 kJ/mol above the M1-[N,CO,OH]-cis-OH conformer, with only a slight dependenceon metal cation identity. The M+-N and side-chain M+-OHbond lengths are slightly shorter than in the M1 conformer, by0.03-0.05 and 0.04-0.07 Å, respectively, whereas the backboneM+-OH bond length of M5 is appreciably longer than theM+-OC bond length of M1, by 0.05 for Li+ up to 0.23 forCs+, Table 2. In the M8[CO,OH] structure, Figure 3, the metalcation binds to the carbonyl and side-chain hydroxyl oxygenatoms. The energy of this conformer remains at least 11 kJ/mol higher than the M1[N,CO,OH]-cis-OH conformer, but itsrelative stability drops by about 15 kJ/mol in going fromLi+(Thr) to Cs+(Thr).
As shown in Figure 2, the relative energies for mostconformations do not change appreciably as the metal cationchanges. The obvious exception is the M3[COOH] conformer,which drops drastically as the metal cation gets larger and morediffuse. Previous work has calculated that the M3[COOH]conformer is the ground-state structure of K+(Gly),21 whereasM1[N,CO] is the ground state for Li+(Gly) and Na+(Gly).11,32,33
This difference in the preferred binding geometry has beenattributed to relatively stronger interactions with the amino groupas the metal cation gets smaller (higher charge density).21 ForThr, the metal cation interacts with the side-chain hydroxylgroup as well as with the amino and carbonyl groups of thebackbone. Therefore, the tridentate M1[N,CO,OH] conformationof M+(Thr) is stabilized relative to the bidentate M3[COOH]conformation. This shifts the change in ground-state conforma-tion between M1 and M3 from a transition point betweenNa+(Gly) and K+(Gly) to the heavier metals for M+(Thr), Figure2. A similar conclusion was reached in our previous explorationof the related M+(Ser) complexes.3
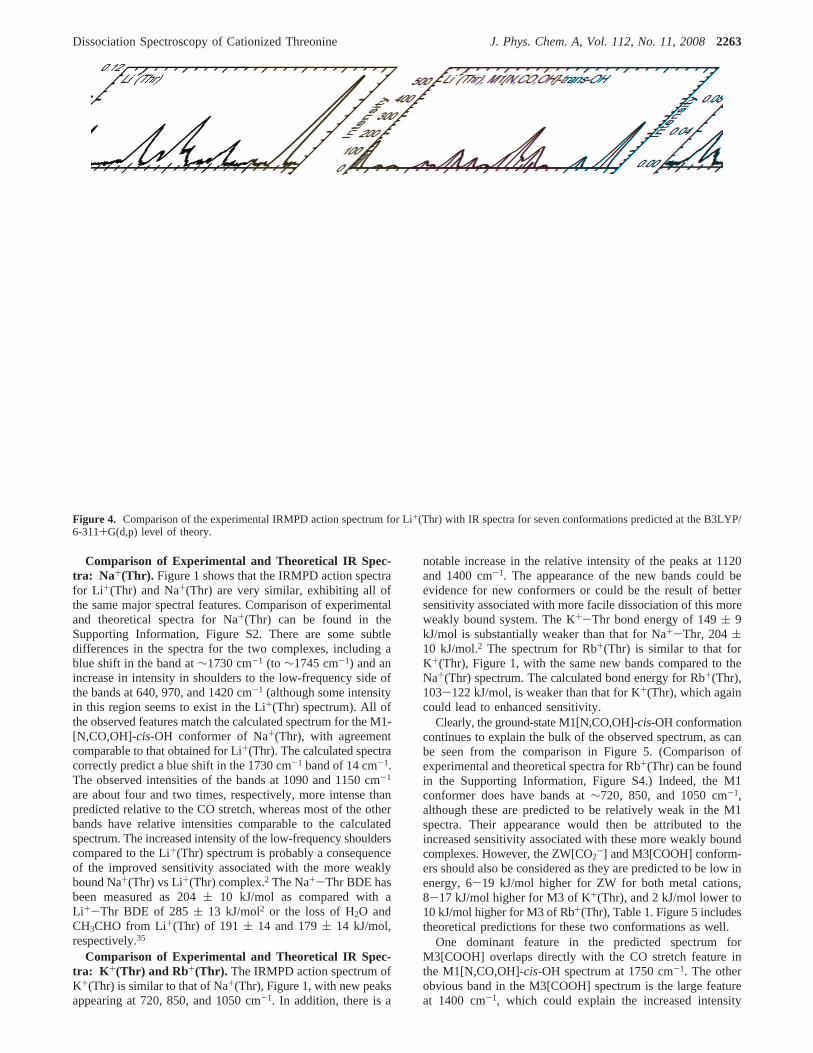
Comparison of Experimental and Theoretical IR Spec-tra: Li +(Thr). Figure 4 compares the experimental IRMPDaction spectrum of Li+(Thr) with calculated IR spectra for theseven low-energy conformers listed in Table 1. Because thetheoretical IR intensities are based on single photon absorption,predictions of IR intensities may not be in direct accord withthe IRMPD action spectrum because the latter is a multiphotonprocess. Nevertheless, the bands predicted for the ground-state
M1[N,CO,OH]-cis-OH conformer correspond very well withthe observed spectrum, both in terms of band position andgenerally relative band intensity.
The major band observed at 1730 cm-1 corresponds to thecarbonyl stretch, which explains its large predicted intensity.A band at essentially the same frequency was also found forthe Li+(Ser) complex,3 indicating that the metal cation bindssimilarly to the carbonyl in both systems. This band is red shiftedcompared to free Thr, calculated as 1788 cm-1 for N2-gg. Asimilar band is found for all of the Li+(Thr) conformationsexcept M5[N,OH,OH] and ZW[CO2-]. In the M5 conformer,the metal cation no longer binds to the carbonyl group, incontrast to all other conformations, resulting in a CO stretchthat is blue shifted from that of bare Thr. For the zwitterion,the shift to a carboxylate leads to a CO stretch that is red shiftedeven further than for the M1 ground state.
The experimentally observed bands at 640, 970, and 1160cm-1 with shoulders at 700, 1090, and 1230 cm-1 are probablythe most diagnostic bands for the M1[N,CO,OH]-cis-OHstructure. The positions and relative intensities of these bandsare nicely predicted by the IR spectrum for this conformer,whereas no other conformation is predicted to have this sameset of frequencies. Indeed, the spectrum would be even betterpredicted if bands at 733 and 1009 cm-1 had intensities aboutone-half of those calculated. The sequence of bands observedbetween 1300 and 1500 cm-1 are also consistent with the M1-[N,CO,OH]-cis-OH structure but are less characteristic as otherconformers (notably M3[COOH], ZW[CO2-], and M8[CO,OH])have similar bands.
The biggest difference between the observed and predictedIR spectra involves the small peak observed at∼1600 cm-1 inthe IRMPD spectrum. In contrast, the M1[N,CO,OH]-cis-OHspectrum has a predicted band at 1630 cm-1, as do many ofthe other conformers, Figure 4. The closest match is for M3-[COOH], which has a predicted frequency of 1608 cm-1. In allconformations, this band corresponds primarily to a NH2 bendand is largely unperturbed from the 1620 cm-1 band predictedfor neutral Thr (N2-gg). It seems likely that the harmonicapproximation of the calculated potential gives somewhatinaccurate vibrational frequencies for this particular mode, asobserved for NH2 bending modes in other systems.25,34 Acomparable observation was made in our study of the M+(Ser)complexes.3
TABLE 2: Geometric Parameters of B3LYP/6-311+G(d,p) Geometry-Optimized Structures of M+(Thr) a
r(M+-O) (Å)b r(M+ -N) (Å) r(M+ -O) (Å)
conformer Li Na K Rb Cs Li Na K Rb Cs Li Na K Rb Cs
M1[N,CO,OH]-cis-OH 1.968 2.318 2.666 2.919 3.155 2.083 2.443 2.851 3.129 3.364 1.961 2.332 2.726 2.997 3.229M3[COOH] 1.911 2.286 2.635 2.902 3.119 2.091 2.420 2.838 3.099 3.360ZW[CO2
-] 1.929 2.286 2.624 2.891 3.101 1.957 2.314 2.676 2.935 3.170M1[N,CO,OH]-trans-OH 1.940 2.288 2.624 2.870 3.087 2.101 2.470 2.896 3.190 3.452 1.965 2.334 2.737 3.012 3.258M1[N,CO] 1.853 2.218 2.562 2.819 3.030 2.030 2.426 2.872 3.176 3.442M5[N,OH,OH] 2.014 2.383 2.809 3.090 3.384 2.048 2.409 2.806 3.082 3.321 1.929 2.294 2.672 2.936 3.161M8[CO,OH] 1.810 2.169 2.508 2.756 2.969 1.895 2.300 2.738 3.039 3.309
∠M+OC (deg) ∠Μ+OCCR (deg) ∠NCRCO (deg)
conformer Li Na K Rb Cs Li Na K Rb Cs Li Na K Rb Cs
M1[N,CO,OH]-cis-OH 103.3 107.6 112.3 114.0 114.7 11.9 19.4 28.4 34.5 39.4 32.6 27.4 21.0 16.9 13.4M3[COOH] 93.2 96.8 102. 1 104.0 106.6 178. 1 177. 9 176.3 176.9 176.3 175.9 176.0 175.6175.5 175.2ZW[CO2
-] 84.0 88.6 92.7 94.5 96.6 178.3 178.5 178.4 178.1 178.5 169.6 170.3 170.8171.0 171.2M1[N,CO,OH]-trans-OH 105.7 110.6 116.0 118.0 119.5 10.6 18.2 27.2 34.1 40.1 34.3 29.2 23.4 19.1 15.7M1[N,CO] 113.6 119.9 127.4 130.7 133.8 0.2 2.5 6.8 10.8 13.8 6.6 5.3 4.4 3.6 2.1M5[N,OH,OH] 105.7c 108.8c 110.8c 111.1c 110.1c 16.3d 25.8d 35.9d 42.0d 47.4d 151.8 157.6 164.5168.4 172.5M8[CO,OH] 128.1 136.2 144.3 148.3 151.0 5.4 3.9 0.7 1.3 6.0 172.8 173.0 172.9172.4 173.0
a Values calculated at the B3LYP/6-311+G(d,p) or B3LYP/HW*/6-311+G(d,p) (italics) levels of theory.b The carbonyl oxygen in all casesexcept M5[N,OH,OH], where it is the carboxylic oxygen.c ∠M+O(H)CR (deg).d ∠M+O(H)CCR (deg).
2262 J. Phys. Chem. A, Vol. 112, No. 11, 2008 Rodgers et al.
Comparison of Experimental and Theoretical IR Spec-tra: Na+(Thr). Figure 1 shows that the IRMPD action spectrafor Li+(Thr) and Na+(Thr) are very similar, exhibiting all ofthe same major spectral features. Comparison of experimentaland theoretical spectra for Na+(Thr) can be found in theSupporting Information, Figure S2. There are some subtledifferences in the spectra for the two complexes, including ablue shift in the band at∼1730 cm-1 (to ∼1745 cm-1) and anincrease in intensity in shoulders to the low-frequency side ofthe bands at 640, 970, and 1420 cm-1 (although some intensityin this region seems to exist in the Li+(Thr) spectrum). All ofthe observed features match the calculated spectrum for the M1-[N,CO,OH]-cis-OH conformer of Na+(Thr), with agreementcomparable to that obtained for Li+(Thr). The calculated spectracorrectly predict a blue shift in the 1730 cm-1 band of 14 cm-1.The observed intensities of the bands at 1090 and 1150 cm-1
are about four and two times, respectively, more intense thanpredicted relative to the CO stretch, whereas most of the otherbands have relative intensities comparable to the calculatedspectrum. The increased intensity of the low-frequency shoulderscompared to the Li+(Thr) spectrum is probably a consequenceof the improved sensitivity associated with the more weaklybound Na+(Thr) vs Li+(Thr) complex.2 The Na+-Thr BDE hasbeen measured as 204( 10 kJ/mol as compared with aLi+-Thr BDE of 285( 13 kJ/mol2 or the loss of H2O andCH3CHO from Li+(Thr) of 191 ( 14 and 179( 14 kJ/mol,respectively.35
Comparison of Experimental and Theoretical IR Spec-tra: K +(Thr) and Rb+(Thr). The IRMPD action spectrum ofK+(Thr) is similar to that of Na+(Thr), Figure 1, with new peaksappearing at 720, 850, and 1050 cm-1. In addition, there is a
notable increase in the relative intensity of the peaks at 1120and 1400 cm-1. The appearance of the new bands could beevidence for new conformers or could be the result of bettersensitivity associated with more facile dissociation of this moreweakly bound system. The K+-Thr bond energy of 149( 9kJ/mol is substantially weaker than that for Na+-Thr, 204(10 kJ/mol.2 The spectrum for Rb+(Thr) is similar to that forK+(Thr), Figure 1, with the same new bands compared to theNa+(Thr) spectrum. The calculated bond energy for Rb+(Thr),103-122 kJ/mol, is weaker than that for K+(Thr), which againcould lead to enhanced sensitivity.
Clearly, the ground-state M1[N,CO,OH]-cis-OH conformationcontinues to explain the bulk of the observed spectrum, as canbe seen from the comparison in Figure 5. (Comparison ofexperimental and theoretical spectra for Rb+(Thr) can be foundin the Supporting Information, Figure S4.) Indeed, the M1conformer does have bands at∼720, 850, and 1050 cm-1,although these are predicted to be relatively weak in the M1spectra. Their appearance would then be attributed to theincreased sensitivity associated with these more weakly boundcomplexes. However, the ZW[CO2-] and M3[COOH] conform-ers should also be considered as they are predicted to be low inenergy, 6-19 kJ/mol higher for ZW for both metal cations,8-17 kJ/mol higher for M3 of K+(Thr), and 2 kJ/mol lower to10 kJ/mol higher for M3 of Rb+(Thr), Table 1. Figure 5 includestheoretical predictions for these two conformations as well.
One dominant feature in the predicted spectrum forM3[COOH] overlaps directly with the CO stretch feature inthe M1[N,CO,OH]-cis-OH spectrum at 1750 cm-1. The otherobvious band in the M3[COOH] spectrum is the large featureat 1400 cm-1, which could explain the increased intensity
Figure 4. Comparison of the experimental IRMPD action spectrum for Li+(Thr) with IR spectra for seven conformations predicted at the B3LYP/6-311+G(d,p) level of theory.
Dissociation Spectroscopy of Cationized Threonine J. Phys. Chem. A, Vol. 112, No. 11, 20082263
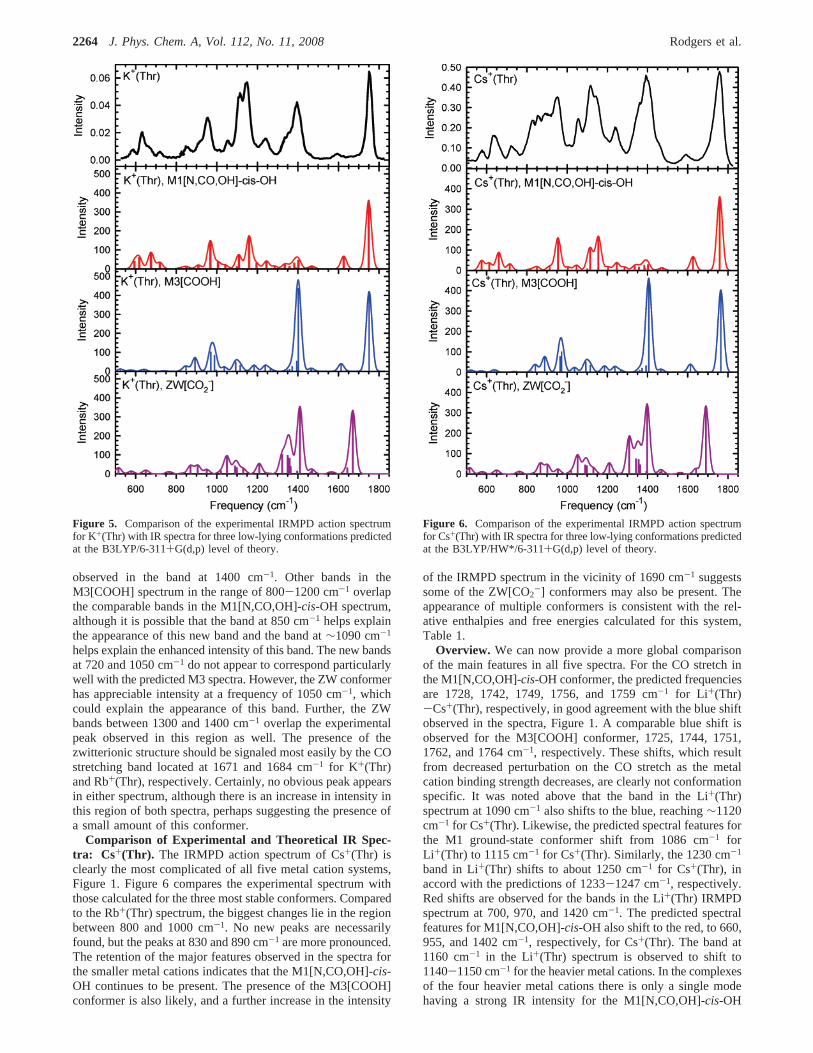
observed in the band at 1400 cm-1. Other bands in theM3[COOH] spectrum in the range of 800-1200 cm-1 overlapthe comparable bands in the M1[N,CO,OH]-cis-OH spectrum,although it is possible that the band at 850 cm-1 helps explainthe appearance of this new band and the band at∼1090 cm-1
helps explain the enhanced intensity of this band. The new bandsat 720 and 1050 cm-1 do not appear to correspond particularlywell with the predicted M3 spectra. However, the ZW conformerhas appreciable intensity at a frequency of 1050 cm-1, whichcould explain the appearance of this band. Further, the ZWbands between 1300 and 1400 cm-1 overlap the experimentalpeak observed in this region as well. The presence of thezwitterionic structure should be signaled most easily by the COstretching band located at 1671 and 1684 cm-1 for K+(Thr)and Rb+(Thr), respectively. Certainly, no obvious peak appearsin either spectrum, although there is an increase in intensity inthis region of both spectra, perhaps suggesting the presence ofa small amount of this conformer.
Comparison of Experimental and Theoretical IR Spec-tra: Cs+(Thr). The IRMPD action spectrum of Cs+(Thr) isclearly the most complicated of all five metal cation systems,Figure 1. Figure 6 compares the experimental spectrum withthose calculated for the three most stable conformers. Comparedto the Rb+(Thr) spectrum, the biggest changes lie in the regionbetween 800 and 1000 cm-1. No new peaks are necessarilyfound, but the peaks at 830 and 890 cm-1 are more pronounced.The retention of the major features observed in the spectra forthe smaller metal cations indicates that the M1[N,CO,OH]-cis-OH continues to be present. The presence of the M3[COOH]conformer is also likely, and a further increase in the intensity
of the IRMPD spectrum in the vicinity of 1690 cm-1 suggestssome of the ZW[CO2-] conformers may also be present. Theappearance of multiple conformers is consistent with the rel-ative enthalpies and free energies calculated for this system,Table 1.
Overview. We can now provide a more global comparisonof the main features in all five spectra. For the CO stretch inthe M1[N,CO,OH]-cis-OH conformer, the predicted frequenciesare 1728, 1742, 1749, 1756, and 1759 cm-1 for Li+(Thr)-Cs+(Thr), respectively, in good agreement with the blue shiftobserved in the spectra, Figure 1. A comparable blue shift isobserved for the M3[COOH] conformer, 1725, 1744, 1751,1762, and 1764 cm-1, respectively. These shifts, which resultfrom decreased perturbation on the CO stretch as the metalcation binding strength decreases, are clearly not conformationspecific. It was noted above that the band in the Li+(Thr)spectrum at 1090 cm-1 also shifts to the blue, reaching∼1120cm-1 for Cs+(Thr). Likewise, the predicted spectral features forthe M1 ground-state conformer shift from 1086 cm-1 forLi+(Thr) to 1115 cm-1 for Cs+(Thr). Similarly, the 1230 cm-1
band in Li+(Thr) shifts to about 1250 cm-1 for Cs+(Thr), inaccord with the predictions of 1233-1247 cm-1, respectively.Red shifts are observed for the bands in the Li+(Thr) IRMPDspectrum at 700, 970, and 1420 cm-1. The predicted spectralfeatures for M1[N,CO,OH]-cis-OH also shift to the red, to 660,955, and 1402 cm-1, respectively, for Cs+(Thr). The band at1160 cm-1 in the Li+(Thr) spectrum is observed to shift to1140-1150 cm-1 for the heavier metal cations. In the complexesof the four heavier metal cations there is only a single modehaving a strong IR intensity for the M1[N,CO,OH]-cis-OH
Figure 5. Comparison of the experimental IRMPD action spectrumfor K+(Thr) with IR spectra for three low-lying conformations predictedat the B3LYP/6-311+G(d,p) level of theory.
Figure 6. Comparison of the experimental IRMPD action spectrumfor Cs+(Thr) with IR spectra for three low-lying conformations predictedat the B3LYP/HW*/6-311+G(d,p) level of theory.
2264 J. Phys. Chem. A, Vol. 112, No. 11, 2008 Rodgers et al.
conformer near this frequency, whereas for Li+(Thr), there aretwo modes with comparable IR intensities (Figure 4), leadingto the apparent blue shift in this band. Overall, the predictedtrends are in remarkably good agreement with the observedspectra, suggesting that the assignment of these features to theM1 ground-state conformation is appropriate.
In contrast, the experimental spectra show that the feature at∼640 cm-1 changes little with metal cation identity, whereasthe predicted spectral features for the M1[N,CO,OH]-cis-OHconformer shift by 24 cm-1: 637, 624, 618, 616, and 613 cm-1
for Li+(Thr)-Cs+(Thr), respectively. This could be because theheavier metal cation complexes include intensity from the M3-[COOH] conformer, which has a band at 640( 2 cm-1 for allfive metal cations. The minor band at about 1600 cm-1 is alsoobserved to shift little with metal cation identity. As noted above,the position of this spectral feature is not predicted well bytheory, probably because of the anharmonicity in this mode,but the mismatch is consistent for all metal cations, withpredicted frequencies of 1630, 1629, 1626, 1630, and 1626 cm-1
for Li+(Thr)-Cs+(Thr), respectively.For the M3[COOH] conformer of M+(Thr), M+ ) K+, Rb+,
and Cs+, the most diagnostic band appears at 1402, 1406, and1407 cm-1, respectively, with predicted intensities comparableto those of the band for the CO stretch at∼1760 cm-1. In theexperimental spectra, this band shifts little between these threemetal complexes, Figure 1, and the predicted relative intensitiesof this band and the CO stretch are observed for the Cs+(Thr)complex. The M3[COOH] conformer is also predicted to ex-hibit less intense bands at 893, 971, 988, and 1093 cm-1 forK+(Thr), shifting to 891, 969, 979, and 1093 cm-1 forRb+(Thr) and 889, 965, 973, and 1093 cm-1 for Cs+(Thr). Thelack of a shift in these bands is consistent with experiment, butbecause the middle two bands are fairly close in frequency, theslight red shift in the 988-973 cm-1 band would be difficultto observe experimentally. In addition, these bands coincide withsimilar bands in the M1[N,CO,OH]-cis-OH spectrum, whichshift similarly with metal cation identity. The bands observedat ∼730,∼850, and∼1050 cm-1, which do not appear in theLi+(Thr) and Na+(Thr) spectra, may be more diagnostic. Thesebands are observed to shift very little for K+(Thr), Rb+(Thr),and Cs+(Thr). For the first two bands, this is in agreement withthe predictions of bands for the M1[N,CO,OH]-cis-OH andM3[COOH] conformations, with M1 having a higher predictedintensity for the 730 cm-1 band and M3 a higher predictedintensity for the 850 cm-1 band, Tables S1 and S2. Likewise,shifts of only 5 and 2 cm-1 are predicted for bands near 1050cm-1 for the M1 and ZW conformations, with the latter havinga much higher predicted intensity, Table S3.
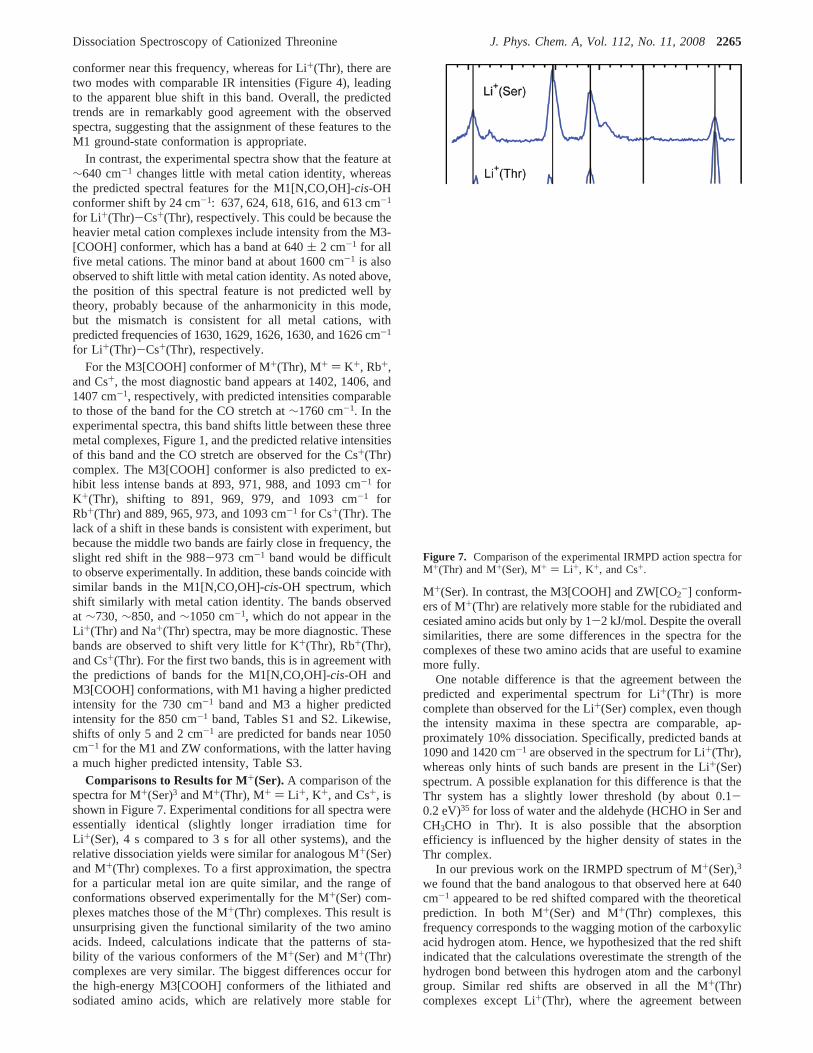
Comparisons to Results for M+(Ser).A comparison of thespectra for M+(Ser)3 and M+(Thr), M+ ) Li+, K+, and Cs+, isshown in Figure 7. Experimental conditions for all spectra wereessentially identical (slightly longer irradiation time forLi+(Ser), 4 s compared to 3 s for all other systems), and therelative dissociation yields were similar for analogous M+(Ser)and M+(Thr) complexes. To a first approximation, the spectrafor a particular metal ion are quite similar, and the range ofconformations observed experimentally for the M+(Ser) com-plexes matches those of the M+(Thr) complexes. This result isunsurprising given the functional similarity of the two aminoacids. Indeed, calculations indicate that the patterns of sta-bility of the various conformers of the M+(Ser) and M+(Thr)complexes are very similar. The biggest differences occur forthe high-energy M3[COOH] conformers of the lithiated andsodiated amino acids, which are relatively more stable for
M+(Ser). In contrast, the M3[COOH] and ZW[CO2-] conform-
ers of M+(Thr) are relatively more stable for the rubidiated andcesiated amino acids but only by 1-2 kJ/mol. Despite the overallsimilarities, there are some differences in the spectra for thecomplexes of these two amino acids that are useful to examinemore fully.
One notable difference is that the agreement between thepredicted and experimental spectrum for Li+(Thr) is morecomplete than observed for the Li+(Ser) complex, even thoughthe intensity maxima in these spectra are comparable, ap-proximately 10% dissociation. Specifically, predicted bands at1090 and 1420 cm-1 are observed in the spectrum for Li+(Thr),whereas only hints of such bands are present in the Li+(Ser)spectrum. A possible explanation for this difference is that theThr system has a slightly lower threshold (by about 0.1-0.2 eV)35 for loss of water and the aldehyde (HCHO in Ser andCH3CHO in Thr). It is also possible that the absorptionefficiency is influenced by the higher density of states in theThr complex.
In our previous work on the IRMPD spectrum of M+(Ser),3
we found that the band analogous to that observed here at 640cm-1 appeared to be red shifted compared with the theoreticalprediction. In both M+(Ser) and M+(Thr) complexes, thisfrequency corresponds to the wagging motion of the carboxylicacid hydrogen atom. Hence, we hypothesized that the red shiftindicated that the calculations overestimate the strength of thehydrogen bond between this hydrogen atom and the carbonylgroup. Similar red shifts are observed in all the M+(Thr)complexes except Li+(Thr), where the agreement between
Figure 7. Comparison of the experimental IRMPD action spectra forM+(Thr) and M+(Ser), M+ ) Li +, K+, and Cs+.
Dissociation Spectroscopy of Cationized Threonine J. Phys. Chem. A, Vol. 112, No. 11, 20082265
experiment and theory is excellent. Some of these variationsamong the various systems may be associated with how thesystems respond to nearby bands, whose intensities varysubstantially as a function of the metal cation identity.
Other bands are observed to shift slightly between theM+(Thr) and M+(Ser) complexes. For example, the bands at950-970 cm-1 in the M+(Thr) spectra are shifted to the bluein M+(Ser) by 10-20 cm-1. The theoretical calculations predicta systematic shift of 10 cm-1, with the motion correspondinglargely to the NH2 umbrella-like motion. The observed shiftsare consistent with slightly stronger bonding in the M+(Thr)system. The new bands at 1050 cm-1 appearing in theM+(Thr) spectra for the heavier metal cations, K+, Rb+, andCs+ are red shifted by∼20 cm-1 in the M+(Ser) spectra andappear to be more intense. The shifts and changes in intensityare most consistent with the ZW[CO2
-] structure, where themotion corresponds largely to a bend in the NH‚‚‚O(side chain)hydrogen bond. If the M1[N,CO,OH]-cis-OH structure isconsidered, a similar shift can be located, but the motions changefrom M+(Thr) to M+(Ser), and the predicted intensities are thesame.
For Li+(Thr), the bands at 1090 and 1420 cm-1 have noanalogues in the Li+(Ser) IRMPD spectrum (although hints ofabsorption at these frequencies exist). The theoretical calcula-tions for M1[N,CO,OH]-cis-OH predict bands at these frequen-cies in both complexes but a higher IR intensity (by factors of2 and 1.5, respectively) in Li+(Thr). At 1090 cm-1, the motioninvolved is essentially a CN stretch in both complexes, but inThr, this mixes in the CH3 wagging motion. Theory then predictsthat this band gets more intense as the metal cation gets heavier(by a factor of about 2.5) and blue shifts. These predictions areconsistent with both the M+(Thr) and M+(Ser) spectra. For the1420 cm-1 band, the motion is an OCO bend and the intensitiesare predicted to get weaker as the metal cation gets heavier, incontrast to the experimental observations. This is evidence thatcontributions from other conformers, notably M3[COOH], areprobably the reason for the increase in intensity of this band inboth the M+(Thr) and M+(Ser) IRMPD spectra.
The band at∼1230 cm-1 is distinct in the Li+(Ser),Li+(Thr), K+(Thr), and Cs+(Thr) spectra and if present appearsto be red shifted and less intense in the K+(Ser) and Cs+(Ser)spectra. The motion involved in the M1[N,CO,OH]-cis-OHconformer is largely a side-chain HOC bend with contributionsfrom HNH rock. The observations are consistent with theory,which predicts comparable intensities for the Li+(Ser) andLi+(Thr) complexes but higher intensity (by∼1.7) for Cs+(Thr)compared to Cs+(Ser), in part because the intensity shifts to alower frequency band for Cs+(Ser) (at 1190 cm-1).
One of the key differences between the IRMPD spectra ofM+(Thr) and M+(Ser) is the peak at 1680 cm-1 in Cs+(Ser),although the Cs+(Thr) does show weak intensity in this spectralregion. As noted in our previous work,3 this peak is characteristicof the ZW[CO2
-] conformer. Theory predicts that the COstretches of the ZW conformer in both Cs+(Ser) and Cs+(Thr)have nearly identical frequencies and IR intensities and that thezwitterion structure has a comparable stability compared to theM3[COOH] ground state, 10-14 kJ/mol higher. Furthermore,the transition states between the M3 and ZW structures arecalculated to have similar energies, 5-11 kJ/mol above M3.However, all three levels of theory find that the energies ofZW and the transition state compared to M3 are systematicallyhigher in the Cs+(Ser) system than in Cs+(Thr) (by ∼1 kJ/molfor ∆H0 and ∼ 2 kJ/mol for ∆G298). Thus, the differenceobserved in the spectra could be a consequence of this or other
subtle distinctions in the potential-energy landscape separatingthese two conformers or perhaps between the experimentalconditions for generation of the complexes.
It may seem contradictory that evidence for the ZW con-former is found even though the calculations find no energeticbarrier between the ZW and M3 conformers in either theCs+(Ser) and Cs+(Thr) complexes once zero-point energies areincluded. In thinking about this observation, it can be realizedthat there must still be a phase space limit (lower density ofstates) between the conformers because of the barrier along theelectronic surface. This plausibly allows the system to exist inthe ZW conformation for long enough times to allow IRMPD.A different way of thinking of this same dynamic issue is toappreciate that the hydrogen stretching motion that convertsbetween the ZW and M3 conformers is high frequency,calculated to be 3133 cm-1 (ZPE ) 18.7 kJ/mol) for M3 ofCs+(Thr) and 2818 cm-1 (ZPE ) 16.9 kJ/mol) for ZW ofCs+(Thr). Thus, the former ZPE lies above or close to the heightof the barrier, 18.7, 13.9, and 19.3 kJ/mol above the M3conformer without ZPE correction at the B3LYP, B3P86, andMP2(full) levels of theory, respectively. Viewed from the ZWpotential well, the barrier heights without ZPE correction are8.0, 3.9, and 7.0 kJ/mol, well below the 16.9 kJ/mol ZPE ofthe reaction coordinate for M3-ZW interconversion. Clearly,the potential surface along this coordinate is no longer harmonic,such that the calculated frequencies are unlikely to be accurate;however, it seems plausible that the ground-state wavefunctionfor this vibration includes components in both the M3 and ZWpotential-energy wells, thereby allowing IR absorption in theorthogonal degrees of freedom probed in these experiments forboth conformers.
Conclusions
IRMPD action spectra of the alkali-metal cationized aminoacid threonine in the region of 550-1800 cm-1 have beenobtained for five alkali-metal cations, M+ ) Li+, Na+, K+, Rb+,and Cs+. Comparison with IR spectra calculated at the B3LYP/6-311+G(d,p) (M+ ) Li+, Na+, and K+) and B3LYP/HW*/6-311+G(d,p) (M+ ) Rb+ and Cs+) levels of theory allow theconformations present in the experiment to be identified. Theexperimental results suggest that only the tridentate M1[N,CO,-OH]-cis-OH conformation is present for the Li+(Thr) andNa+(Thr) complexes, in agreement with the predicted groundstates of these complexes. For the K+(Thr), Rb+(Thr), andCs+(Thr) complexes, the presence of the M3[COOH] conformeralong with the M1[N,CO,OH]-cis-OH conformer is indicated,and there are hints that the zwitterionic conformer, ZW[CO2
-],may also be present. Theory finds that the M3[COOH]conformer becomes the ground state for the heavier metalsystems, consistent with its observation in their spectra. Thelarge change in the relative stabilities of the M1[N,CO,OH]-cis-OH and M3[COOH] conformers can be rationalized on thebasis of the strength of the M+-amine interaction as a functionof the metal cation.11,21The smaller metal cations bind relativelymore strongly to the amine, favoring the M1 structure, whereasthe heavier more diffuse metal cations prefer binding to thecarboxylic acid site. These results parallel those observed forthe analogous M+(Ser) complexes.3 Other more subtle differ-ences in the IRMPD spectra for M+(Ser) and M+(Thr) are alsowell described by theory in most cases.
Acknowledgment. This work is part of the research programof FOM, which is financially supported by the NederlandseOrganisatie voor Wetenschappeklijk Onderzoek (NWO). Ad-
2266 J. Phys. Chem. A, Vol. 112, No. 11, 2008 Rodgers et al.
ditional financial support was provided by the National ScienceFoundation, Grants PIRE-0730072, CHE-0451477 and CHE-0748790 (P.B.A.), and CHE-0528262 (M.T.R.). The skillfulassistance of the FELIX staff is gratefully acknowledged.
Supporting Information Available: Five figures showingthe breakdown of the experimental spectra for Li+(Thr) andNa+(Thr) into individual product ions (Figure S1) and acomparison between the experimental IRMPD spectrum andtheoretically predicted IR spectra of seven low-lying conforma-tions of Na+(Thr), K+(Thr), and Rb+(Thr), and Cs+(Thr) (FiguresS2-S5); three tables (S1-S3) provide the vibrational frequen-cies and IR intensities for the M1[N,CO,OH]-cis-OH, M3-[COOH], and ZW[CO2
-] conformations for M+(Thr) calculatedat the B3LYP/6-311+G(d,p) (M+ ) Li+, Na+, and K+) orB3LYP/HW*/6-311+G(d,p) (M+ ) Rb+ and Cs+) levels oftheory; one table (S4) provides vibrational frequencies and IRintensities for the M1[N,CO,OH]-trans-OH, M8[CO,OH], M1-[N,CO], and M5[N,OH,OH] conformations for Li+(Thr) cal-culated at the B3LYP/6-311+G(d,p) level of theory. Thismaterial is available free of charge via the Internet at http://pubs.acs.org.
References and Notes
(1) Dashper, S. G.; Brownfield, L.; Slakeski, N.; Zilm, P. S.; Rogers,A. H.; Reynolds, E. C.J. Bacteriol.2001, 183, 4142-4148.
(2) Ye, S. J.; Clark, A. A.; Armentrout, P. B.J. Phys. Chem. B,submitted for publication.
(3) Armentrout, P. B.; Rodgers, M. T.; Oomens, J.; Steill, J. D.J. Phys.Chem. A2008, 112, 2248-2257.
(4) Polfer, N. C.; Oomens, J.; Dunbar, R. C.Phys. Chem. Chem. Phys.2006, 8, 2744-2751.
(5) Bush, M. F.; Forbes, M. W.; Jockusch, R. A.; Oomens, J.; Polfer,N. C.; Saykally, R. J.; Williams, E. R.J. Phys. Chem. A2007, 111, 7753-7760.
(6) Forbes, M. W.; Bush, M. F.; Polfer, N. C.; Oomens, J.; Dunbar, R.C.; Williams, E. R.; Jockusch, R. A.J. Phys. Chem. A2007, 111, 11759-11770.
(7) Valle, J. J.; Eyler, J. R.; Oomens, J.; Moore, D. T.; van der Meer,A. F. G.; von Heldon, G.; Meijer, G.; Hendrickson, C. L.; Marshall, A. G.;Blakney, G. T.ReV. Sci. Instrum.2005, 76, 023103.
(8) Polfer, N. C.; Oomens, J.; Moore, D. T.; von Helden, G.; Meijer,G.; Dunbar, R. C.J. Am. Chem. Soc.2006, 128, 517-525.
(9) Polfer, N. C.; Oomens, J.Phys. Chem. Chem. Phys.2007, 9, 3804-3817.
(10) Oepts, D.; van der Meer, A. F. G.; van Amersfoort, P. W.InfraredPhys. Technol.1995, 36, 297-308.
(11) Moision, R. M.; Armentrout, P. B.J. Phys. Chem. A2002, 106,10350-10362.
(12) Pearlman, D. A.; Case, D. A.; Caldwell, J. W.; Ross, W. R.;Cheatham, T. E.; DeBolt, S.; Ferguson, D.; Seibel, G.; Kollman, P.Comp.Phys. Commun.1995, 91, 1-41.
(13) Bylaska, E. J.; de Jong, W. A.; Kowalski, K.; Straatsma, T. P.;Valiev, M.; Wang, D.; Apra`, E.; Windus, T. L.; Hirata, S.; Hackler, M. T.;Zhao, Y.; Fan, P.-D.; Harrison, R. J.; Dupuis, M.; Smith, D. M. A.;Nieplocha, J.; Tipparaju, V.; Krishnan, M.; Auer, A. A.; Nooijen, M.;
Brown, E.; Cisneros, G.; Fann, G. I.; Fru¨chtl, H.; Garza, J.; Hirao, K.;Kendall, R.; Nichols, J. A.; Tsemekhman, K.; Wolinski, K.; Anchell, J.;Bernholdt, D.; Borowski, P.; Clark, T.; Clerc, D.; Dachsel, H.; Deegan,M.; Dyall, K.; Elwood, D.; Glendening, E.; Gutowski, M.; Hess, A.; Jaffe,J.; Johnson, B.; Ju, J.; Kobayashi, R.; Kutteh, R.; Lin, Z.; Littlefield, R.;Long, X.; Meng, B.; Nakajima, T.; Niu, S.; Pollack, L.; Rosing, M.;Sandrone, G.; Stave, M.; Taylor, H.; Thomas, G.; Lenthe, J. v.; Wong, A.;Zhang, Z.,NWChem, A Computational Chemistry Package for ParallelComputers, Version 4.5; Pacific Northwest National Laboratory: Richland,WA, 2003.
(14) Roothaan, C. C.ReV. Mod. Phys.1951, 23, 69-89.(15) Binkley, J. S.; Pople, J. A.; Hehre, W. J.J. Am. Chem. Soc.1980,
102, 939-947.(16) Frisch, M. J.; Trucks, G. W.; Schlegel, H. B.; Scuseria, G. E.; Robb,
M. A.; Cheeseman, J. R.; Montgomery, J., J. A.; Vreven, T.; Kudin, K. N.;Burant, J. C.; Millam, J. M.; Iyengar, S. S.; Tomasi, J.; Barone, V.;Mennucci, B.; Cossi, M.; Scalmani, G.; Rega, N.; Petersson, G. A.;Nakatsuji, H.; Hada, M.; Ehara, M.; Toyota, K.; Fukuda, R.; Hasegawa, J.;Ishida, M.; Nakajima, T.; Honda, Y.; Kitao, O.; Nakai, H.; Klene, M.; Li,X.; Knox, J. E.; Hratchian, H. P.; Cross, J. B.; Bakken, V.; Adamo, C.;Jaramillo, J.; Gomperts, R.; Stratmann, R. E.; Yazyev, O.; Austin, A. J.;Cammi, R.; Pomelli, C.; Ochterski, J. W.; Ayala, P. Y.; Morokuma, K.;Voth, G. A.; Salvador, P.; Dannenberg, J. J.; Zakrzewski, V. G.; Dapprich,S.; Daniels, A. D.; Strain, M. C.; Farkas, O.; Malick, D. K.; Rabuck, A.D.; Raghavachari, K.; Foresman, J. B.; Ortiz, J. V.; Cui, Q.; Baboul, A.G.; Clifford, S.; Cioslowski, J.; Stefanov, B. B.; Liu, G.; Liashenko, A.;Piskorz, P.; Komaromi, I.; Martin, R. L.; Fox, D. J.; Keith, T.; Al-Laham,M. A.; Peng, C. Y.; Nanayakkara, A.; Challacombe, M.; Gill, P. M. W.;Johnson, B.; Chen, W.; Wong, M. W.; Gonzalez, C.; Pople, J. A.,Gaussian03, Revision D.01; Gaussian, Inc.: Pittsburgh, PA, 2005.
(17) Becke, A. D.J. Chem. Phys.1993, 98, 5648-5652.(18) Ditchfield, R.; Hehre, W. J.; Pople, J. A.J. Chem. Phys.1971, 54,
724-728.(19) McLean, A. D.; Chandler, G. S.J. Chem. Phys.1980, 72, 5639-
5648.(20) Krishnan, R.; Binkley, J. S.; Seeger, R.; Pople, J. A.J. Chem. Phys.
1980, 72, 650-654.(21) Moision, R. M.; Armentrout, P. B.Phys. Chem. Chem. Phys.2004,
6, 2588-2599.(22) Foresman, J. B.; Frisch, A. E.Exploring Chemistry with Electronic
Structure Methods, 2nd ed.; Gaussian, Inc.: Pittsburgh, PA, 1996.(23) Hay, P. J.; Wadt, W. R.J. Chem. Phys.1985, 82, 299-310.(24) Glendening, E. D.; Feller, D.; Thompson, M. A.J. Am. Chem. Soc.
1994, 116, 10657-10669.(25) Oomens, J.; Moore, D. T.; Meijer, G.; von Helden, G.Phys. Chem.
Chem. Phys.2004, 6, 710-718.(26) Oomens, J.; Sartakov, B. G.; Meijer, G.; von Helden, G.Int. J.
Mass Spectrom.2006, 254, 1-19.(27) Rodriguez-Santiago, L.; Sodupe, M.; Tortajada, J.J. Phys. Chem.
A 2001, 105, 5340-5347.(28) Pulkkinen, S.; Noguera, M.; Rodriguez-Santiago, L.; Sodupe, M.;
Bertran, J.Chem. Eur. J.2000, 6, 4393-4399.(29) Jensen, F.J. Am. Chem. Soc.1992, 114, 9533-9537.(30) Wilson, R. G.; Brewer, G. R.Ion Beams with Applications to Ion
Implantation; Wiley: New York, 1973.(31) Peng, C. Y.; Schlegel, H. B.Israel J. Chem.1994, 33, 449.(32) Moision, R. M.; Armentrout, P. B. Manuscript in preparation.(33) Kapota, C.; Lemaire, J.; Maitre, P.; Ohanessian, G.J. Am. Chem.
Soc.2004, 126, 1836-1842.(34) Sinclair, W. E.; Pratt, D. W.J. Chem. Phys.1996, 105, 7942-
7956.(35) Ye, S. J.; Armentrout, P. B.J. Phys. Chem. B, submitted for
publication.
Dissociation Spectroscopy of Cationized Threonine J. Phys. Chem. A, Vol. 112, No. 11, 20082267